Effects of physiotherapy treatment on knee osteoarthritis gait data using principal component...
8
Effects of physiotherapy treatment on knee osteoarthritis gait data using principal component analysis Nathaly Gaudreault a,b, ⁎, Neila Mezghani a,c , Katia Turcot a , Nicola Hagemeister a,c , Karine Boivin a,d , Jacques A. de Guise a,c a Laboratoire de recherche en imagerie et orthopédie (LIO), Centre de recherche du Centre hospitalier de l'Université de Montréal, Quebec City, Canada b École de réadaptation, Faculté de médecine et des sciences de la santé de l'Université de Sherbrooke, Sherbrooke, Quebec, Canada c Département de génie de la production automatisée, École de technologie supérieure, Montreal, Québec, Canada d Département des sciences de l'activité physique de l'Université du Québec à Trois-Rivières, Canada abstract article info Article history: Received 5 May 2010 Accepted 20 October 2010 Keywords: Knee osteoarthritis Physiotherapy Gait Principal component analysis Background: Interpreting gait data is challenging due to intersubject variability observed in the gait pattern of both normal and pathological populations. The objective of this study was to investigate the impact of using principal component analysis for grouping knee osteoarthritis (OA) patients' gait data in more homogeneous groups when studying the effect of a physiotherapy treatment. Methods: Three-dimensional (3D) knee kinematic and kinetic data were recorded during the gait of 29 participants diagnosed with knee OA before and after they received 12 weeks of physiotherapy treatment. Principal component analysis was applied to extract groups of knee flexion/extension, adduction/abduction and internal/external rotation angle and moment data. The treatment's effect on parameters of interest was assessed using paired t-tests performed before and after grouping the knee kinematic data. Findings: Increased quadriceps and hamstring strength was observed following treatment (P b 0.05). Except for the knee flexion/extension angle, two different groups (G 1 and G 2 ) were extracted from the angle and moment data. When pre- and post-treatment analyses were performed considering the groups, participants exhibiting a G 2 knee moment pattern demonstrated a greater first peak flexion moment, lower adduction moment impulse and smaller rotation angle range post-treatment (P b 0.05). When pre- and post-treatment comparisons were performed without grouping, the data showed no treatment effect. Interpretation: The results of the present study suggest that the effect of physiotherapy on gait mechanics of knee osteoarthritis patients may be masked or underestimated if kinematic data are not separated into more homogeneous groups when performing pre- and post-treatment comparisons. © 2010 Elsevier Ltd. All rights reserved. 1. Introduction According to recent clinical guideline recommendations, regular physical activity and lower limb strengthening exercises are key components of knee osteoarthritis (OA) management (Zhang et al., 2007). Exercise has shown to have beneficial effects on decreasing symptoms of pain and improving physical function in knee OA patients. However, its effects on knee biomechanics are still unclear. Although changes in knee biomechanics during gait have been recently reported following a physiotherapy treatment (Turcot et al., 2009), other studies were not conclusive (Lim et al., 2008; Thor- stensson et al., 2007). Possible reasons for this discordance may be related to gait outcomes as well as to intersubject variability observed in both gait patterns and responses to the treatment of patients evaluated. In most gait studies, dynamic joint angles and moment data as a function of the gait cycle are presented in the form of curves (Astephen et al., 2008; Baliunas et al., 2002; Winter, 1988). Specific kinematic or kinetic gait parameters, such as the mean of peak values, are extracted at particular periods of the gait cycle and used for group comparison. However, limitations can be encountered using this technique. Although human gait is a cyclic and repeatable activity, every person has a fairly unique gait pattern, leading to intersubject variability in curve profiles (Winter, 1988). For example, temporal appearance of the parameter of interest can be different among persons being compared. Also, averaging can collapse information to the point of removing important intersubject variability within a given group, whether before or after physiotherapy. To recover the relevant intersubject variability in the gait data before and after physiotherapy Clinical Biomechanics 26 (2011) 284–291 ⁎ Corresponding author. École de réadaptation, Faculté de médecine et des sciences de la santé de l'Université de Sherbrooke, Sherbrooke, Quebec, Canada. E-mail addresses: [email protected] (N. Gaudreault), [email protected] (N. Mezghani), [email protected] (K. Turcot), [email protected] (N. Hagemeister), [email protected] (K. Boivin), [email protected] (J.A. de Guise). 0268-0033/$ – see front matter © 2010 Elsevier Ltd. All rights reserved. doi:10.1016/j.clinbiomech.2010.10.004 Contents lists available at ScienceDirect Clinical Biomechanics journal homepage: www.elsevier.com/locate/clinbiomech
Transcript of Effects of physiotherapy treatment on knee osteoarthritis gait data using principal component...

Clinical Biomechanics 26 (2011) 284–291
Contents lists available at ScienceDirect
Clinical Biomechanics
j ourna l homepage: www.e lsev ie r.com/ locate /c l inb iomech
Effects of physiotherapy treatment on knee osteoarthritis gait data usingprincipal component analysis
Nathaly Gaudreault a,b,⁎, Neila Mezghani a,c, Katia Turcot a, Nicola Hagemeister a,c,Karine Boivin a,d, Jacques A. de Guise a,c
a Laboratoire de recherche en imagerie et orthopédie (LIO), Centre de recherche du Centre hospitalier de l'Université de Montréal, Quebec City, Canadab École de réadaptation, Faculté de médecine et des sciences de la santé de l'Université de Sherbrooke, Sherbrooke, Quebec, Canadac Département de génie de la production automatisée, École de technologie supérieure, Montreal, Québec, Canadad Département des sciences de l'activité physique de l'Université du Québec à Trois-Rivières, Canada
⁎ Corresponding author. École de réadaptation, Faculde la santé de l'Université de Sherbrooke, Sherbrooke, Q
E-mail addresses: [email protected]@etsmtl.ca (N. Mezghani), [email protected]@etsmtl.ca (N. Hagemeister), [email protected] (J.A. de Guise).
0268-0033/$ – see front matter © 2010 Elsevier Ltd. Aldoi:10.1016/j.clinbiomech.2010.10.004
a b s t r a c t
a r t i c l e i n f oArticle history:
Received 5 May 2010Accepted 20 October 2010Keywords:Knee osteoarthritisPhysiotherapyGaitPrincipal component analysis
Background: Interpreting gait data is challenging due to intersubject variability observed in the gait pattern ofboth normal and pathological populations. The objective of this study was to investigate the impact of usingprincipal component analysis for grouping knee osteoarthritis (OA) patients' gait data in more homogeneousgroups when studying the effect of a physiotherapy treatment.Methods: Three-dimensional (3D) knee kinematic and kinetic data were recorded during the gait of 29participants diagnosed with knee OA before and after they received 12 weeks of physiotherapy treatment.Principal component analysis was applied to extract groups of knee flexion/extension, adduction/abductionand internal/external rotation angle and moment data. The treatment's effect on parameters of interest was
assessed using paired t-tests performed before and after grouping the knee kinematic data.Findings: Increased quadriceps and hamstring strength was observed following treatment (Pb0.05). Exceptfor the knee flexion/extension angle, two different groups (G1 and G2) were extracted from the angle andmoment data. When pre- and post-treatment analyses were performed considering the groups, participantsexhibiting a G2 knee moment pattern demonstrated a greater first peak flexion moment, lower adductionmoment impulse and smaller rotation angle range post-treatment (Pb0.05). When pre- and post-treatmentcomparisons were performed without grouping, the data showed no treatment effect.Interpretation: The results of the present study suggest that the effect of physiotherapy on gait mechanics ofknee osteoarthritis patients may be masked or underestimated if kinematic data are not separated into morehomogeneous groups when performing pre- and post-treatment comparisons.© 2010 Elsevier Ltd. All rights reserved.
1. Introduction
According to recent clinical guideline recommendations, regularphysical activity and lower limb strengthening exercises are keycomponents of knee osteoarthritis (OA) management (Zhang et al.,2007). Exercise has shown to have beneficial effects on decreasingsymptoms of pain and improving physical function in knee OApatients. However, its effects on knee biomechanics are still unclear.Although changes in knee biomechanics during gait have beenrecently reported following a physiotherapy treatment (Turcot et al.,2009), other studies were not conclusive (Lim et al., 2008; Thor-
té de médecine et des sciencesuebec, Canada.a (N. Gaudreault),il.com (K. Turcot),[email protected] (K. Boivin),
l rights reserved.
stensson et al., 2007). Possible reasons for this discordance may berelated to gait outcomes as well as to intersubject variability observedin both gait patterns and responses to the treatment of patientsevaluated.
In most gait studies, dynamic joint angles and moment data as afunction of the gait cycle are presented in the formof curves (Astephenet al., 2008; Baliunas et al., 2002; Winter, 1988). Specific kinematic orkinetic gait parameters, such as themean of peak values, are extractedat particular periods of the gait cycle and used for group comparison.However, limitations can be encountered using this technique.Although human gait is a cyclic and repeatable activity, every personhas a fairly unique gait pattern, leading to intersubject variability incurve profiles (Winter, 1988). For example, temporal appearance ofthe parameter of interest can be different among persons beingcompared. Also, averaging can collapse information to the point ofremoving important intersubject variability within a given group,whether before or after physiotherapy. To recover the relevantintersubject variability in the gait data before and after physiotherapy

285N. Gaudreault et al. / Clinical Biomechanics 26 (2011) 284–291
interventions, principal component analysis (PCA) can be used as aprecursor for separating gait data into groups (Carriero et al., 2009). Bydoing so, homogeneous groups of curve profiles can be extracted fromthe entire gait data sample and gait features characterizing each groupcan be identified.
PCA is a modeling technique that can be employed to reduce thedimensionality and evaluate the variability of a high-dimensional dataset. Dimensionality reduction is accomplished by projecting theoriginal data into a new lower dimension data set of uncorrelatedvariables called the principal component scores. The clinical relevanceof using PCA for gait data interpretation of knee OA patients has beenreported in Deluzio and Astephen (2007). These authors foundagreement between the components of the gait signal pattern and theclinical status of knee OA patients. In another study, Carriero et al.(2009) demonstrated that PCA can be used as a preliminary step forclustering cerebral palsy children gait parameters into homogeneousgroups. The purpose of this study is to perform dimensionalityreduction of complete gait cycle data of knee OA patients using PCAfor classifying curve profiles into homogeneous groups and examinethe effect of a physiotherapy treatment on three-dimensional (3D)knee OA kinematics. From a technical standpoint, grouping gait datawill result in a set of meaningful exemplar curves that accuratelyrepresent a group of patient gait data. Gait parameters of interest willbe extracted from these exemplar curves and used for pre- and post-treatment comparisons. It is hypothesized that conducting pre- andpost-physiotherapy treatment comparisons using the mean of a givenparameter extracted from an homogeneous group will be moremeaningful than using themean of a parameter estimated from all thedata combined.
2. Methods
2.1. Participants
To participate, patients had to be over 50 years of age and they hadto be diagnosed with tibiofemoral knee OA according to the clinicalcriteria proposed by the American College of Rheumatology (Altmanet al., 1986). For this project, the clinical and radiological criteria werepain for at least 3 months and a pain level higher than 3 on a verbalnumerical scale of 0 (no pain) to 10 (unbearable) during gait, crepituson joint mobilization and morning stiffness lasting 30 min or less. Forthe radiographic criteria, the conventional radiographic gradingsystem developed for knee OA by Kellgren and Lawrence (KL) wasused to classify patients according to knee OA severity (grades I, II, III
Table 1Synthesis of manual therapy interventions and strengthening exercises.
Exercises Goal
Manual therapy1. Knee massage Relax medial and lateral ligaments of the
knee muscular compartment and ligamen
2. Patella mobilization Promote mobility of the patella in relation
3. Passive stretching of the iliotibial band andof the posterior muscle chain of the leg
Reduce or prevent biceps femoris, iliotibigastrocnemius contractures. Improve elasperi-articular tissues.
4. Passive stretching of the muscularposterior chain of the leg
Reduce or prevent biceps femoris and gastcontractures. Improve elasticity of peri-arti
Strengthening exercises1. Isometric quadriceps contraction Strengthen quadriceps
2. Half squat with a ball against a wall Strengthen quadriceps
or IV). Patients were required to have grades I to IV knee OA primarilyaffecting the medial compartment. Patients were excluded if thelateral compartment was primarily affected with knee OA, if theypresented vestibular, neurological or any other musculoskeletaldisorders other than knee OA, if they had a lower extremity injury,any conditions affecting their ability to walk on a treadmill or if theyhad participated in a physiotherapy program. Twenty-nine patients(22 women and 7 men) were included in the study. In terms ofradiographic knee OA severity, the distribution of the patient samplewas as follows: grade I=10 patients, grade II=5 patients, gradeIII=5 patients and grade IV=9 patients. Medial tibiofemoral OAchanges were present in 29 patients, whereas in three patients,appearance of OA degeneration was also observed in the lateralcompartment but to a lesser extent. Mean and standard deviation ofage, weight, height and body mass index (BMI) were 63.3 (8.4) years,80.5 (18.3) kg, 1.60 (0.1) m and 31 (5) kg/m2 respectively.Institutional ethics approvals were obtained and all patients signedthe informed consent.
2.2. Physiotherapy treatment
The physiotherapy treatment was standardized in terms oftreatment modalities, which meant that the program was mainlyoriented towards muscle strengthening and stretching exercises, pro-prioceptive exercises and aerobic training. Pain and anti-inflammatorymodalities were used as adjuvant therapy if needed. The choice ofproposing a program focusing on exercises was based on therecommendations of O'Grady et al. (2000). The strengthening andstretching exercises are synthesized in Table 1, the proprioceptive andbalance exercises are summarized in Table 2 and the aerobic training isdescribed briefly in Table 3. A global description of the treatment'sprogression is outlined in Table 4. An attempt was made to standardizethe treatment progression but due to ethical reasons, the progressionwas adjusted based on the clinical status of each patient, reflectingwhathappens in a real clinical context: patientswere not asked to advance toamore difficult exercise if they could not do so or if they did not respondwell to pain management modalities. The treatment was adminis-tered twice a week for a period of 12 weeks and each session lastedapproximately 1 h.
All patients had two 3D gait and clinical evaluations. The firstevaluation was performed prior to enrolment into the physiotherapytreatment. The second evaluation took place a maximum of twoweeks after the end of the treatment.
Description
patella. Relaxt structures.
While the patient is sitting, the physiotherapist performstranslation movements around patella with her fingers andpetrissage (kneading) of soft tissues surrounding the knee.
to the femur. While the patient is sitting, the physiotherapist performslateral and medial movements of the patella with her fingers.
al band andticity of
While the patient lies on the unaffected side, the physiotherapistgently stretches the ankle into dorsiflexion (affected side),keeping the knee in extension and controlling hip adduction.
rocnemiuscular tissues.
While the patient lies in a supine position with the pelvis inanteversion, the physiotherapist maintains the legs at roughly60° of hip flexion from the mat. The knees are kept in extension.The physiotherapist also applies gentle force to stretch theankle in dorsiflexion.
In a sitting position, the patient performs 10 quadriceps contractionswhile keeping the knee in extension and knuckles away from the mat.Standing with a ball pressed between the patient's back and thewall, the patient performs half squats.
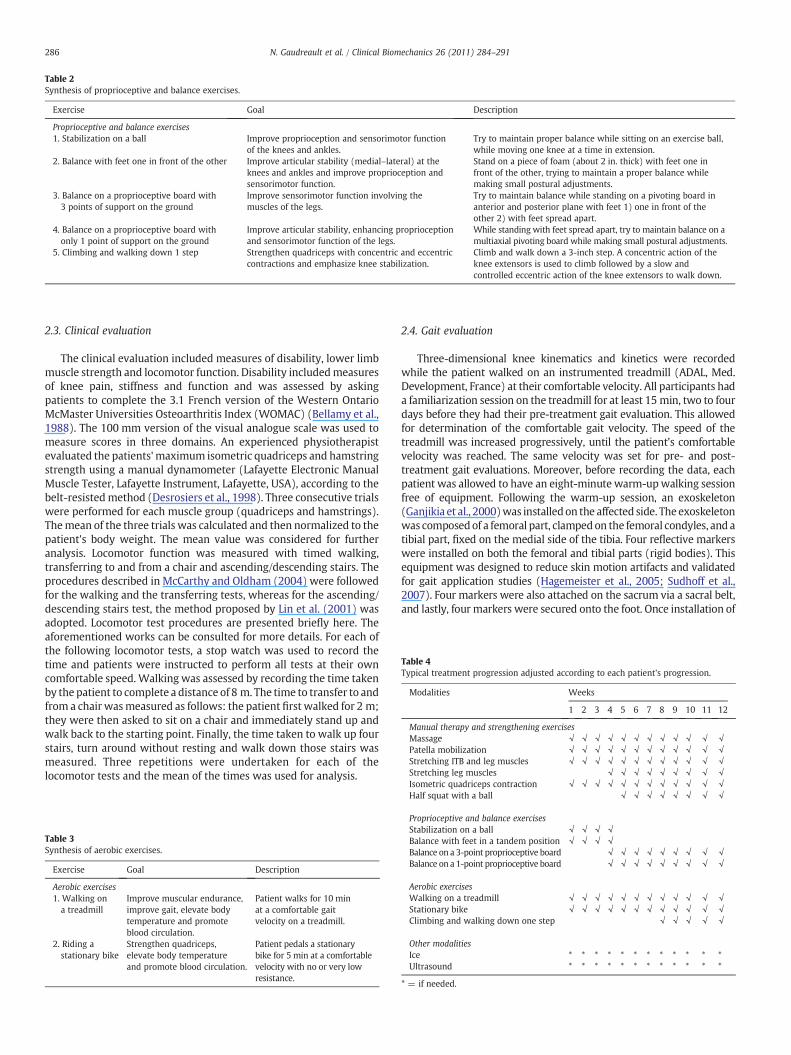
Table 4Typical treatment progression adjusted according to each patient's progression.
Modalities Weeks
1 2 3 4 5 6 7 8 9 10 11 12
Manual therapy and strengthening exercisesMassage √ √ √ √ √ √ √ √ √ √ √ √Patella mobilization √ √ √ √ √ √ √ √ √ √ √ √Stretching ITB and leg muscles √ √ √ √ √ √ √ √ √ √ √ √Stretching leg muscles √ √ √ √ √ √ √ √ √
Table 2Synthesis of proprioceptive and balance exercises.
Exercise Goal Description
Proprioceptive and balance exercises1. Stabilization on a ball Improve proprioception and sensorimotor function
of the knees and ankles.Try to maintain proper balance while sitting on an exercise ball,while moving one knee at a time in extension.
2. Balance with feet one in front of the other Improve articular stability (medial–lateral) at theknees and ankles and improve proprioception andsensorimotor function.
Stand on a piece of foam (about 2 in. thick) with feet one infront of the other, trying to maintain a proper balance whilemaking small postural adjustments.
3. Balance on a proprioceptive board with3 points of support on the ground
Improve sensorimotor function involving themuscles of the legs.
Try to maintain balance while standing on a pivoting board inanterior and posterior plane with feet 1) one in front of theother 2) with feet spread apart.
4. Balance on a proprioceptive board withonly 1 point of support on the ground
Improve articular stability, enhancing proprioceptionand sensorimotor function of the legs.
While standing with feet spread apart, try to maintain balance on amultiaxial pivoting board while making small postural adjustments.
5. Climbing and walking down 1 step Strengthen quadriceps with concentric and eccentriccontractions and emphasize knee stabilization.
Climb and walk down a 3-inch step. A concentric action of theknee extensors is used to climb followed by a slow andcontrolled eccentric action of the knee extensors to walk down.
286 N. Gaudreault et al. / Clinical Biomechanics 26 (2011) 284–291
2.3. Clinical evaluation
The clinical evaluation included measures of disability, lower limbmuscle strength and locomotor function. Disability includedmeasuresof knee pain, stiffness and function and was assessed by askingpatients to complete the 3.1 French version of the Western OntarioMcMaster Universities Osteoarthritis Index (WOMAC) (Bellamy et al.,1988). The 100 mm version of the visual analogue scale was used tomeasure scores in three domains. An experienced physiotherapistevaluated the patients' maximum isometric quadriceps and hamstringstrength using a manual dynamometer (Lafayette Electronic ManualMuscle Tester, Lafayette Instrument, Lafayette, USA), according to thebelt-resistedmethod (Desrosiers et al., 1998). Three consecutive trialswere performed for each muscle group (quadriceps and hamstrings).Themean of the three trials was calculated and then normalized to thepatient's body weight. The mean value was considered for furtheranalysis. Locomotor function was measured with timed walking,transferring to and from a chair and ascending/descending stairs. Theprocedures described in McCarthy and Oldham (2004) were followedfor the walking and the transferring tests, whereas for the ascending/descending stairs test, the method proposed by Lin et al. (2001) wasadopted. Locomotor test procedures are presented briefly here. Theaforementioned works can be consulted for more details. For each ofthe following locomotor tests, a stop watch was used to record thetime and patients were instructed to perform all tests at their owncomfortable speed. Walking was assessed by recording the time takenby the patient to complete a distance of 8 m. The time to transfer to andfrom a chair wasmeasured as follows: the patient first walked for 2 m;they were then asked to sit on a chair and immediately stand up andwalk back to the starting point. Finally, the time taken to walk up fourstairs, turn around without resting and walk down those stairs wasmeasured. Three repetitions were undertaken for each of thelocomotor tests and the mean of the times was used for analysis.
Table 3Synthesis of aerobic exercises.
Exercise Goal Description
Aerobic exercises1. Walking ona treadmill
Improve muscular endurance,improve gait, elevate bodytemperature and promoteblood circulation.
Patient walks for 10 minat a comfortable gaitvelocity on a treadmill.
2. Riding astationary bike
Strengthen quadriceps,elevate body temperatureand promote blood circulation.
Patient pedals a stationarybike for 5 min at a comfortablevelocity with no or very lowresistance.
2.4. Gait evaluation
Three-dimensional knee kinematics and kinetics were recordedwhile the patient walked on an instrumented treadmill (ADAL, Med.Development, France) at their comfortable velocity. All participants hada familiarization session on the treadmill for at least 15 min, two to fourdays before they had their pre-treatment gait evaluation. This allowedfor determination of the comfortable gait velocity. The speed of thetreadmill was increased progressively, until the patient's comfortablevelocity was reached. The same velocity was set for pre- and post-treatment gait evaluations. Moreover, before recording the data, eachpatient was allowed to have an eight-minute warm-upwalking sessionfree of equipment. Following the warm-up session, an exoskeleton(Ganjikia et al., 2000)was installedon the affected side. Theexoskeletonwas composedof a femoral part, clampedon the femoral condyles, and atibial part, fixed on the medial side of the tibia. Four reflective markerswere installed on both the femoral and tibial parts (rigid bodies). Thisequipment was designed to reduce skin motion artifacts and validatedfor gait application studies (Hagemeister et al., 2005; Sudhoff et al.,2007). Four markers were also attached on the sacrum via a sacral belt,and lastly, four markers were secured onto the foot. Once installation of
Isometric quadriceps contraction √ √ √ √ √ √ √ √ √ √ √ √Half squat with a ball √ √ √ √ √ √ √ √
Proprioceptive and balance exercisesStabilization on a ball √ √ √ √Balance with feet in a tandem position √ √ √ √Balance on a 3-point proprioceptive board √ √ √ √ √ √ √ √ √Balance on a 1-point proprioceptive board √ √ √ √ √ √ √ √ √
Aerobic exercisesWalking on a treadmill √ √ √ √ √ √ √ √ √ √ √ √Stationary bike √ √ √ √ √ √ √ √ √ √ √ √Climbing and walking down one step √ √ √ √ √
Other modalitiesIce * * * * * * * * * * * *Ultrasound * * * * * * * * * * * *
* = if needed.
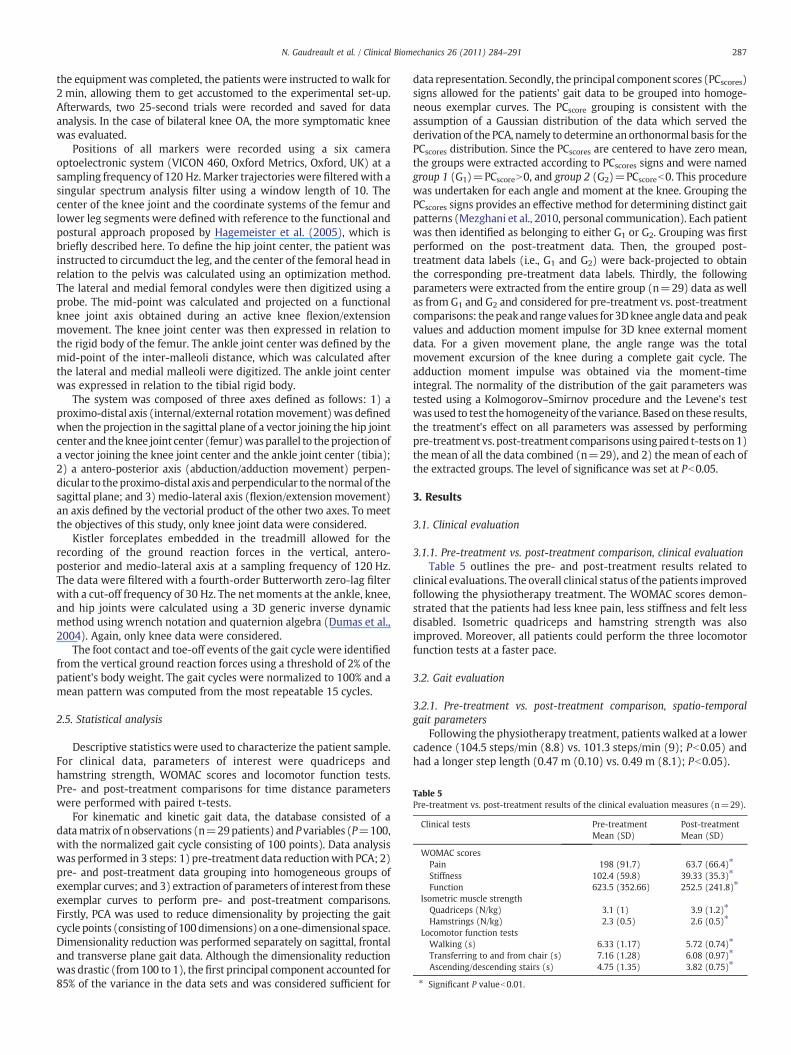
Table 5Pre-treatment vs. post-treatment results of the clinical evaluation measures (n=29).
Clinical tests Pre-treatmentMean (SD)
Post-treatmentMean (SD)
WOMAC scoresPain 198 (91.7) 63.7 (66.4)⁎
Stiffness 102.4 (59.8) 39.33 (35.3)⁎
Function 623.5 (352.66) 252.5 (241.8)⁎
Isometric muscle strengthQuadriceps (N/kg) 3.1 (1) 3.9 (1.2)⁎
Hamstrings (N/kg) 2.3 (0.5) 2.6 (0.5)⁎
Locomotor function testsWalking (s) 6.33 (1.17) 5.72 (0.74)⁎
Transferring to and from chair (s) 7.16 (1.28) 6.08 (0.97)⁎
Ascending/descending stairs (s) 4.75 (1.35) 3.82 (0.75)⁎
⁎ Significant P valueb0.01.
287N. Gaudreault et al. / Clinical Biomechanics 26 (2011) 284–291
the equipment was completed, the patients were instructed to walk for2 min, allowing them to get accustomed to the experimental set-up.Afterwards, two 25-second trials were recorded and saved for dataanalysis. In the case of bilateral knee OA, the more symptomatic kneewas evaluated.
Positions of all markers were recorded using a six cameraoptoelectronic system (VICON 460, Oxford Metrics, Oxford, UK) at asampling frequency of 120 Hz. Marker trajectories were filteredwith asingular spectrum analysis filter using a window length of 10. Thecenter of the knee joint and the coordinate systems of the femur andlower leg segments were defined with reference to the functional andpostural approach proposed by Hagemeister et al. (2005), which isbriefly described here. To define the hip joint center, the patient wasinstructed to circumduct the leg, and the center of the femoral head inrelation to the pelvis was calculated using an optimization method.The lateral and medial femoral condyles were then digitized using aprobe. The mid-point was calculated and projected on a functionalknee joint axis obtained during an active knee flexion/extensionmovement. The knee joint center was then expressed in relation tothe rigid body of the femur. The ankle joint center was defined by themid-point of the inter-malleoli distance, which was calculated afterthe lateral and medial malleoli were digitized. The ankle joint centerwas expressed in relation to the tibial rigid body.
The system was composed of three axes defined as follows: 1) aproximo-distal axis (internal/external rotationmovement)was definedwhen the projection in the sagittal plane of a vector joining the hip jointcenter and theknee joint center (femur)wasparallel to theprojection ofa vector joining the knee joint center and the ankle joint center (tibia);2) a antero-posterior axis (abduction/adduction movement) perpen-dicular to theproximo-distal axis andperpendicular to thenormal of thesagittal plane; and 3) medio-lateral axis (flexion/extensionmovement)an axis defined by the vectorial product of the other two axes. To meetthe objectives of this study, only knee joint data were considered.
Kistler forceplates embedded in the treadmill allowed for therecording of the ground reaction forces in the vertical, antero-posterior and medio-lateral axis at a sampling frequency of 120 Hz.The data were filtered with a fourth-order Butterworth zero-lag filterwith a cut-off frequency of 30 Hz. The net moments at the ankle, knee,and hip joints were calculated using a 3D generic inverse dynamicmethod using wrench notation and quaternion algebra (Dumas et al.,2004). Again, only knee data were considered.
The foot contact and toe-off events of the gait cycle were identifiedfrom the vertical ground reaction forces using a threshold of 2% of thepatient's body weight. The gait cycles were normalized to 100% and amean pattern was computed from the most repeatable 15 cycles.
2.5. Statistical analysis
Descriptive statistics were used to characterize the patient sample.For clinical data, parameters of interest were quadriceps andhamstring strength, WOMAC scores and locomotor function tests.Pre- and post-treatment comparisons for time distance parameterswere performed with paired t-tests.
For kinematic and kinetic gait data, the database consisted of adatamatrix of n observations (n=29patients) and P variables (P=100,with the normalized gait cycle consisting of 100 points). Data analysiswas performed in 3 steps: 1) pre-treatment data reductionwith PCA; 2)pre- and post-treatment data grouping into homogeneous groups ofexemplar curves; and 3) extraction of parameters of interest from theseexemplar curves to perform pre- and post-treatment comparisons.Firstly, PCA was used to reduce dimensionality by projecting the gaitcycle points (consisting of 100dimensions) on a one-dimensional space.Dimensionality reduction was performed separately on sagittal, frontaland transverse plane gait data. Although the dimensionality reductionwas drastic (from100 to 1), the first principal component accounted for85% of the variance in the data sets and was considered sufficient for
data representation. Secondly, the principal component scores (PCscores)signs allowed for the patients' gait data to be grouped into homoge-neous exemplar curves. The PCscore grouping is consistent with theassumption of a Gaussian distribution of the data which served thederivation of the PCA, namely to determine anorthonormal basis for thePCscores distribution. Since the PCscores are centered to have zero mean,the groups were extracted according to PCscores signs and were namedgroup 1 (G1)=PCscoreN0, and group 2 (G2)=PCscoreb0. This procedurewas undertaken for each angle and moment at the knee. Grouping thePCscores signs provides an effective method for determining distinct gaitpatterns (Mezghani et al., 2010, personal communication). Each patientwas then identified as belonging to either G1 or G2. Grouping was firstperformed on the post-treatment data. Then, the grouped post-treatment data labels (i.e., G1 and G2) were back-projected to obtainthe corresponding pre-treatment data labels. Thirdly, the followingparameters were extracted from the entire group (n=29) data as wellas from G1 and G2 and considered for pre-treatment vs. post-treatmentcomparisons: thepeakand range values for 3Dknee angle data andpeakvalues and adduction moment impulse for 3D knee external momentdata. For a given movement plane, the angle range was the totalmovement excursion of the knee during a complete gait cycle. Theadduction moment impulse was obtained via the moment-timeintegral. The normality of the distribution of the gait parameters wastested using a Kolmogorov–Smirnov procedure and the Levene's testwasused to test thehomogeneity of thevariance. Basedon these results,the treatment's effect on all parameters was assessed by performingpre-treatment vs. post-treatment comparisonsusingpaired t-tests on1)the mean of all the data combined (n=29), and 2) the mean of each ofthe extracted groups. The level of significance was set at Pb0.05.
3. Results
3.1. Clinical evaluation
3.1.1. Pre-treatment vs. post-treatment comparison, clinical evaluationTable 5 outlines the pre- and post-treatment results related to
clinical evaluations. The overall clinical status of the patients improvedfollowing the physiotherapy treatment. The WOMAC scores demon-strated that the patients had less knee pain, less stiffness and felt lessdisabled. Isometric quadriceps and hamstring strength was alsoimproved. Moreover, all patients could perform the three locomotorfunction tests at a faster pace.
3.2. Gait evaluation
3.2.1. Pre-treatment vs. post-treatment comparison, spatio-temporalgait parameters
Following the physiotherapy treatment, patients walked at a lowercadence (104.5 steps/min (8.8) vs. 101.3 steps/min (9); Pb0.05) andhad a longer step length (0.47 m (0.10) vs. 0.49 m (8.1); Pb0.05).

288 N. Gaudreault et al. / Clinical Biomechanics 26 (2011) 284–291
3.2.2. Pre-treatment vs. post-treatment comparison, angles andmoments, all the data combined (n=29)
Mean values and standard deviations of the parameters of interestare presented in Table 6. The results show that the physiotherapytreatment had no significant effect on gait kinematic and kineticparameters when all patients were included in the group for the pre-treatment vs. post-treatment comparison.
3.2.3. Pre-treatment vs. post-treatment comparison, angles andmoments,groups of data
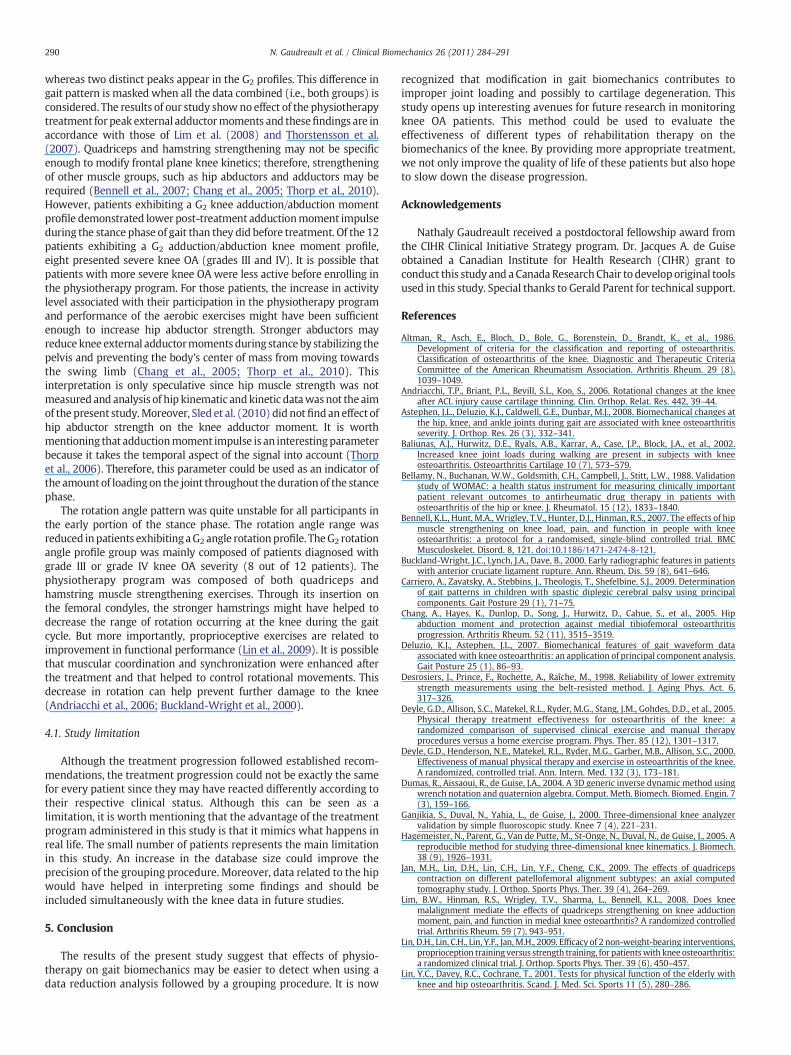
Except for the knee flexion/extension angle curve profiles, twodifferent groups (G1 and G2) were extracted from the angle andmoment data. Therefore, for each movement plane (sagittal, frontaland transverse), patients were identified as exhibiting either a G1 or aG2 exemplar curve pattern. The knee moment (sagittal and frontalplanes) and angle (transverse plane) curve profiles for all the datacombined (n=29) and for the groups are depicted in Fig. 1. Meanvalues and standard deviations of the chosen parameters for G1 and G2
are presented in Table 6.When pre- and post-treatment analyseswereperformed on the groups, a greater first peak flexion moment, a loweradduction moment impulse and a smaller rotation angle range werefound following the physiotherapy treatment (Pb0.05) for patientsexhibiting G2 patterns. For the above-mentioned parameters, thenumber of patients belonging to each group and the knee OA severityof the patients are specified in Fig. 1. For clarity and to facilitateinterpretation of the results, patients with grades I and II OA severitywere considered as having mild/moderate knee OA and those withgrades III and IV were considered as having severe knee OA. Notreatment effect was observed for patients exhibiting G1 patterns forangle or moment curve profiles in the sagittal, frontal and transverseplanes.
4. Discussion
In this study, the gait of knee OA patients was assessed before andafter they completed a 12-week physiotherapy treatment program.The objectivewas to investigate the impact of using PCA to classify thedata into more homogeneous groups when studying the effect of aphysiotherapy treatment on knee OA patient gait data. Followingthe physiotherapy treatment, the results obtained from the clinical
Table 6Pre-treatment vs. post-treatment results for knee kinematic and kinetic parameters.
Knee kinematic and kinetic parameters All data combined
Pre tx Post tx
Mean (SD) Mean (SD
Sagittal planePeak flexion angle early stance (°) 18.1 (6.8) 18.6 (7Peak flexion angle swing (°) 65.1 (4.5) 66.0 (4Angle range (°) 58.0 (8.5) 59.5 (8Peak flexion moment (M1) (% BWH) −1.96 (1.27) −2.2 (1Peak extension moment (% BWH) 0.66 (1.5) 0.49 (1Peak flexion moment (M2) (% BWH) −1.1 (0.6) −1.2 (0
Frontal planePeak adduction angle (°) 6.5 (5) 6 (5Peak abduction angle (°) −2.3 (5.6) −3.1 (6Angle range (°) 8.8 (3.6) 9.0 (3Peak adduction moment 1 (M1) (% BWH) −2.35 (1.19) −2.45 (1Peak adduction moment 2 (M2, G2 only) (% BWH) – –
Adduction moment impulse (time integral) 94.1 (11.3) 88.2 (1Transverse plane
Peak internal rotation angle (°) −3.2 (2.9) −3.7 (2Peak external rotation angle (°) 5.2 (4.1) 4.9 (3Angle range (°) 8.3 (2.8) 8.5 (3Peak internal rotation moment (% BWH) 0.66 (0.28) 0.61 (0Peak external rotation moment (% BWH) −0.27 (0.28) −0.25 (0
⁎ Significant P valueb0.05.
evaluation showed that the clinical status of the patients improvedsignificantly. The patients felt less pain and stiffness, had betterfunction and could perform locomotor tasks faster. These findingscoincide with many other studies reporting the beneficial effects ofphysiotherapy modalities on pain and function (Deyle et al., 2000,2005; Jan et al., 2009; Weng et al., 2009). As reported by Deyle et al.(2000), the self-perception of pain relief and reduced knee stiffnessmay be attributed to the stimulation of muscular and peri-articularconnective tissues induced by the multi-modal physiotherapy treat-ment administered. Knowing that a gain in muscle strength is closelyrelated to improvement in knee function (O'Reilly et al., 1999), theincrease in the patients' quadriceps and hamstring strength observedfollowing the treatment may explain why their performance inlocomotor tasks was better following treatment.
Although the benefit of quadriceps strengthening exercises on kneefunction is now well recognized, their effect on gait biomechanics andjoint structure is not well established. Our findings demonstrate thatwhen the patients' data were not separated into groups, no differencewas observed in pre-treatment vs. post-treatment comparisons. Therehave been only a few studies that have investigated whether or notstrengthening exercises canmodify gait biomechanics (Lim et al., 2008;Thorstensson et al., 2007; Turcot et al., 2009). Lim et al. (2008) andThorstensson et al. (2007) used peak knee external adductor momentsas the biomechanical outcome to measure the effect of strengtheningexercises. These authors concluded that knee adductor momentsremained unchanged following completion of a quadriceps strength-ening exercise program. Although the external knee adductor momentis widely accepted as a biomechanical determinant of knee OAprogression, this does not necessarily imply that strengtheningexercises are ineffective; the gain in strength may act on other gaitparameters as demonstrated in the study conducted by Turcot et al.(2009). These authors used an accelerometric-based method to detectchanges in gait biomechanics following a physiotherapy treatment thatincluded quadriceps and hamstring strengthening exercises. Theyreported that anterior posterior (AP) knee acceleration was reducedpost-treatment, meaning that AP knee instability can possibly beimproved following treatment. Moreover, given that every person has aspecific clinical status and gait pattern, every person may responddifferently to a treatment approach. If intersubject variability is not takeninto account, the effect of the strengthening exercises can be masked.
Group 1 (G1) Group 2 (G2)
Pre tx Post tx Pre tx Post tx
) Mean (SD) Mean (SD) Mean (SD) Mean (SD)
.3) 18.0 (6.8) 18.6 (5.8) – –
.7) 65.2 (4.5) 66 (4.6) – –
.3) 58.9 (8.5) 59.5 (8.3) – –
.34) −1.77 (1.54) −1.82 (1.69) −2.05 (1.16) 2.54 (1.10)⁎
.35) 0.48 (1.63) 0.54 (1.53) 0.85 (1.38) 0.43 (1.16)
.6) −0.91 (0.50) −0.95 (0.61) −1.30 (0.57) −1.47 (0.48)
) 7 (5.3) 6.6 (6) 6.1 (4.9) 5.5 (4.3).6) −4 (4.2) −5.8 (4.5) −1.1 (3.4) 0.9 (3.3).4) 11 (3.2) 12.4 (1.9) 7.2 (3.2) 6.4 (1.9).03) −2.34 (1.41) −2.46 (1.19) −2.57 (0.41) −2.65 (0.36)
– – −2.13 (1.38) −2.25 (1.16)1.7) 93.2 (6.4) 87.4 (9.1) 99.6 (8.2) 89.8 (8.9)⁎
.7) −3.1 (2.5) −3.9 (2.6) −5 (3.3) −4.4 (3)
.9) 6.7 (3.1) 7.1 (3.5) 4.8 (1.3) 3.4 (1.3)
.3) 9.9 (2.9) 11 (2.3) 9.8 (2.4) 7.9 (2.5)⁎
.3) 0.69 (0.32) 0.76 (0.23) 0.46 (0.37) 0.53 (0.30)
.32) −0.31 (0.12) −0.2 (0.16) −0.15 (0.17) −0.13 (0.15)
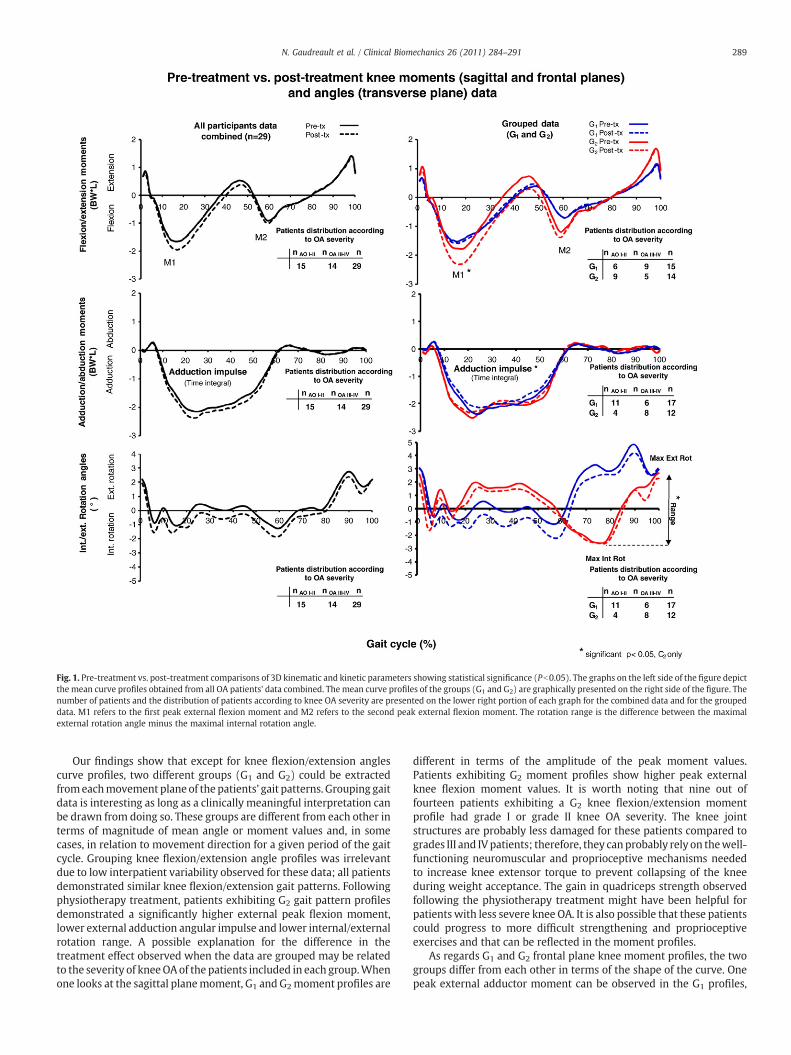
Fig. 1. Pre-treatment vs. post-treatment comparisons of 3D kinematic and kinetic parameters showing statistical significance (Pb0.05). The graphs on the left side of the figure depictthe mean curve profiles obtained from all OA patients' data combined. The mean curve profiles of the groups (G1 and G2) are graphically presented on the right side of the figure. Thenumber of patients and the distribution of patients according to knee OA severity are presented on the lower right portion of each graph for the combined data and for the groupeddata. M1 refers to the first peak external flexion moment and M2 refers to the second peak external flexion moment. The rotation range is the difference between the maximalexternal rotation angle minus the maximal internal rotation angle.
289N. Gaudreault et al. / Clinical Biomechanics 26 (2011) 284–291
Our findings show that except for knee flexion/extension anglescurve profiles, two different groups (G1 and G2) could be extractedfromeachmovement plane of the patients' gait patterns. Grouping gaitdata is interesting as long as a clinically meaningful interpretation canbe drawn from doing so. These groups are different from each other interms of magnitude of mean angle or moment values and, in somecases, in relation to movement direction for a given period of the gaitcycle. Grouping knee flexion/extension angle profiles was irrelevantdue to low interpatient variability observed for these data; all patientsdemonstrated similar knee flexion/extension gait patterns. Followingphysiotherapy treatment, patients exhibiting G2 gait pattern profilesdemonstrated a significantly higher external peak flexion moment,lower external adduction angular impulse and lower internal/externalrotation range. A possible explanation for the difference in thetreatment effect observed when the data are grouped may be relatedto the severity of kneeOAof the patients included in each group.Whenone looks at the sagittal planemoment, G1 and G2moment profiles are
different in terms of the amplitude of the peak moment values.Patients exhibiting G2 moment profiles show higher peak externalknee flexion moment values. It is worth noting that nine out offourteen patients exhibiting a G2 knee flexion/extension momentprofile had grade I or grade II knee OA severity. The knee jointstructures are probably less damaged for these patients compared togrades III and IVpatients; therefore, they canprobably rely on thewell-functioning neuromuscular and proprioceptive mechanisms neededto increase knee extensor torque to prevent collapsing of the kneeduring weight acceptance. The gain in quadriceps strength observedfollowing the physiotherapy treatment might have been helpful forpatients with less severe knee OA. It is also possible that these patientscould progress to more difficult strengthening and proprioceptiveexercises and that can be reflected in the moment profiles.
As regards G1 and G2 frontal plane knee moment profiles, the twogroups differ from each other in terms of the shape of the curve. Onepeak external adductor moment can be observed in the G1 profiles,
290 N. Gaudreault et al. / Clinical Biomechanics 26 (2011) 284–291
whereas two distinct peaks appear in the G2 profiles. This difference ingait pattern is masked when all the data combined (i.e., both groups) isconsidered. The results of our study showno effect of the physiotherapytreatment for peak external adductormoments and thesefindings are inaccordance with those of Lim et al. (2008) and Thorstensson et al.(2007). Quadriceps and hamstring strengthening may not be specificenough to modify frontal plane knee kinetics; therefore, strengtheningof other muscle groups, such as hip abductors and adductors may berequired (Bennell et al., 2007; Chang et al., 2005; Thorp et al., 2010).However, patients exhibiting a G2 knee adduction/abduction momentprofile demonstrated lower post-treatment adductionmoment impulseduring the stance phase of gait than they did before treatment. Of the 12patients exhibiting a G2 adduction/abduction knee moment profile,eight presented severe knee OA (grades III and IV). It is possible thatpatients with more severe knee OA were less active before enrolling inthe physiotherapy program. For those patients, the increase in activitylevel associated with their participation in the physiotherapy programand performance of the aerobic exercises might have been sufficientenough to increase hip abductor strength. Stronger abductors mayreduce knee external adductormoments during stance by stabilizing thepelvis and preventing the body's center of mass from moving towardsthe swing limb (Chang et al., 2005; Thorp et al., 2010). Thisinterpretation is only speculative since hip muscle strength was notmeasured and analysis of hip kinematic andkinetic datawasnot the aimof the present study.Moreover, Sled et al. (2010) did notfindaneffect ofhip abductor strength on the knee adductor moment. It is worthmentioning that adductionmoment impulse is an interestingparameterbecause it takes the temporal aspect of the signal into account (Thorpet al., 2006). Therefore, this parameter could be used as an indicator ofthe amount of loading on the joint throughout the durationof the stancephase.
The rotation angle pattern was quite unstable for all participants inthe early portion of the stance phase. The rotation angle range wasreduced inpatients exhibitingaG2 angle rotationprofile. TheG2 rotationangle profile group was mainly composed of patients diagnosed withgrade III or grade IV knee OA severity (8 out of 12 patients). Thephysiotherapy program was composed of both quadriceps andhamstring muscle strengthening exercises. Through its insertion onthe femoral condyles, the stronger hamstrings might have helped todecrease the range of rotation occurring at the knee during the gaitcycle. But more importantly, proprioceptive exercises are related toimprovement in functional performance (Lin et al., 2009). It is possiblethat muscular coordination and synchronization were enhanced afterthe treatment and that helped to control rotational movements. Thisdecrease in rotation can help prevent further damage to the knee(Andriacchi et al., 2006; Buckland-Wright et al., 2000).
4.1. Study limitation
Although the treatment progression followed established recom-mendations, the treatment progression could not be exactly the samefor every patient since they may have reacted differently according totheir respective clinical status. Although this can be seen as alimitation, it is worth mentioning that the advantage of the treatmentprogram administered in this study is that it mimics what happens inreal life. The small number of patients represents the main limitationin this study. An increase in the database size could improve theprecision of the grouping procedure. Moreover, data related to the hipwould have helped in interpreting some findings and should beincluded simultaneously with the knee data in future studies.
5. Conclusion
The results of the present study suggest that effects of physio-therapy on gait biomechanics may be easier to detect when using adata reduction analysis followed by a grouping procedure. It is now
recognized that modification in gait biomechanics contributes toimproper joint loading and possibly to cartilage degeneration. Thisstudy opens up interesting avenues for future research in monitoringknee OA patients. This method could be used to evaluate theeffectiveness of different types of rehabilitation therapy on thebiomechanics of the knee. By providing more appropriate treatment,we not only improve the quality of life of these patients but also hopeto slow down the disease progression.
Acknowledgements
Nathaly Gaudreault received a postdoctoral fellowship award fromthe CIHR Clinical Initiative Strategy program. Dr. Jacques A. de Guiseobtained a Canadian Institute for Health Research (CIHR) grant toconduct this study and a Canada ResearchChair to develop original toolsused in this study. Special thanks to Gerald Parent for technical support.
References
Altman, R., Asch, E., Bloch, D., Bole, G., Borenstein, D., Brandt, K., et al., 1986.Development of criteria for the classification and reporting of osteoarthritis.Classification of osteoarthritis of the knee. Diagnostic and Therapeutic CriteriaCommittee of the American Rheumatism Association. Arthritis Rheum. 29 (8),1039–1049.
Andriacchi, T.P., Briant, P.L., Bevill, S.L., Koo, S., 2006. Rotational changes at the kneeafter ACL injury cause cartilage thinning. Clin. Orthop. Relat. Res. 442, 39–44.
Astephen, J.L., Deluzio, K.J., Caldwell, G.E., Dunbar, M.J., 2008. Biomechanical changes atthe hip, knee, and ankle joints during gait are associated with knee osteoarthritisseverity. J. Orthop. Res. 26 (3), 332–341.
Baliunas, A.J., Hurwitz, D.E., Ryals, A.B., Karrar, A., Case, J.P., Block, J.A., et al., 2002.Increased knee joint loads during walking are present in subjects with kneeosteoarthritis. Osteoarthritis Cartilage 10 (7), 573–579.
Bellamy, N., Buchanan, W.W., Goldsmith, C.H., Campbell, J., Stitt, L.W., 1988. Validationstudy of WOMAC: a health status instrument for measuring clinically importantpatient relevant outcomes to antirheumatic drug therapy in patients withosteoarthritis of the hip or knee. J. Rheumatol. 15 (12), 1833–1840.
Bennell, K.L., Hunt, M.A., Wrigley, T.V., Hunter, D.J., Hinman, R.S., 2007. The effects of hipmuscle strengthening on knee load, pain, and function in people with kneeosteoarthritis: a protocol for a randomised, single-blind controlled trial. BMCMusculoskelet. Disord. 8, 121. doi:10.1186/1471-2474-8-121.
Buckland-Wright, J.C., Lynch, J.A., Dave, B., 2000. Early radiographic features in patientswith anterior cruciate ligament rupture. Ann. Rheum. Dis. 59 (8), 641–646.
Carriero, A., Zavatsky, A., Stebbins, J., Theologis, T., Shefelbine, S.J., 2009. Determinationof gait patterns in children with spastic diplegic cerebral palsy using principalcomponents. Gait Posture 29 (1), 71–75.
Chang, A., Hayes, K., Dunlop, D., Song, J., Hurwitz, D., Cahue, S., et al., 2005. Hipabduction moment and protection against medial tibiofemoral osteoarthritisprogression. Arthritis Rheum. 52 (11), 3515–3519.
Deluzio, K.J., Astephen, J.L., 2007. Biomechanical features of gait waveform dataassociated with knee osteoarthritis: an application of principal component analysis.Gait Posture 25 (1), 86–93.
Desrosiers, J., Prince, F., Rochette, A., Raîche, M., 1998. Reliability of lower extremitystrength measurements using the belt-resisted method. J. Aging Phys. Act. 6,317–326.
Deyle, G.D., Allison, S.C., Matekel, R.L., Ryder, M.G., Stang, J.M., Gohdes, D.D., et al., 2005.Physical therapy treatment effectiveness for osteoarthritis of the knee: arandomized comparison of supervised clinical exercise and manual therapyprocedures versus a home exercise program. Phys. Ther. 85 (12), 1301–1317.
Deyle, G.D., Henderson, N.E., Matekel, R.L., Ryder, M.G., Garber, M.B., Allison, S.C., 2000.Effectiveness of manual physical therapy and exercise in osteoarthritis of the knee.A randomized, controlled trial. Ann. Intern. Med. 132 (3), 173–181.
Dumas, R., Aissaoui, R., de Guise, J.A., 2004. A 3D generic inverse dynamic method usingwrench notation and quaternion algebra. Comput. Meth. Biomech. Biomed. Engin. 7(3), 159–166.
Ganjikia, S., Duval, N., Yahia, L., de Guise, J., 2000. Three-dimensional knee analyzervalidation by simple fluoroscopic study. Knee 7 (4), 221–231.
Hagemeister, N., Parent, G., Van de Putte, M., St-Onge, N., Duval, N., de Guise, J., 2005. Areproducible method for studying three-dimensional knee kinematics. J. Biomech.38 (9), 1926–1931.
Jan, M.H., Lin, D.H., Lin, C.H., Lin, Y.F., Cheng, C.K., 2009. The effects of quadricepscontraction on different patellofemoral alignment subtypes: an axial computedtomography study. J. Orthop. Sports Phys. Ther. 39 (4), 264–269.
Lim, B.W., Hinman, R.S., Wrigley, T.V., Sharma, L., Bennell, K.L., 2008. Does kneemalalignment mediate the effects of quadriceps strengthening on knee adductionmoment, pain, and function in medial knee osteoarthritis? A randomized controlledtrial. Arthritis Rheum. 59 (7), 943–951.
Lin, D.H., Lin, C.H., Lin, Y.F., Jan,M.H., 2009. Efficacy of 2 non-weight-bearing interventions,proprioception training versus strength training, for patientswith knee osteoarthritis:a randomized clinical trial. J. Orthop. Sports Phys. Ther. 39 (6), 450–457.
Lin, Y.C., Davey, R.C., Cochrane, T., 2001. Tests for physical function of the elderly withknee and hip osteoarthritis. Scand. J. Med. Sci. Sports 11 (5), 280–286.

291N. Gaudreault et al. / Clinical Biomechanics 26 (2011) 284–291
McCarthy, C.J., Oldham, J.A., 2004. The reliability, validity and responsiveness of anaggregated locomotor function (ALF) score in patients with osteoarthritis of theknee. Rheumatol. Oxf. 43 (4), 514–517.
Mezghani, N., Fuentes, A., Gaudreault, N., Hagemeister, N., Aissaoui, R., de Guise, J., 2010.Identification of gait patterns by principal component clustering of knee abduction/adduction angles. IEEE Trans. Biomed. Eng. (article under revision).
O'Grady, M., Fletcher, J., Ortiz, S., 2000. Therapeutic and physical fitness exerciseprescription for older adults with joint disease: an evidence-based approach.Rheum. Dis. Clin. North Am. 26 (3), 617–646.
O'Reilly, S.C., Muir, K.R., Doherty, M., 1999. Effectiveness of home exercise on pain anddisability from osteoarthritis of the knee: a randomised controlled trial. Ann. Rheum.Dis. 58 (1), 15–19.
Sled, E.A., Khoja, L., Deluzio, K.J., Olney, S.J., Culham, E.G., 2010. Effect of a home programof hip abductor exercises on knee joint loading, strength, function, and pain inpeople with knee osteoarthritis: a clinical trial. Phys. Ther. 90 (6), 895–904.
Sudhoff, I., Van Driessche, S., Laporte, S., de Guise, J.A., Skalli, W., 2007. Comparing threeattachment systems used to determine knee kinematics during gait. Gait Posture25 (4), 533–543.
Thorp, L.E., Sumner, D.R., Block, J.A., Moisio, K.C., Shott, S., Wimmer, M.A., 2006. Kneejoint loading differs in individuals with mild compared with moderate medial kneeosteoarthritis. Arthritis Rheum. 54 (12), 3842–3849.
Thorp, L.E., Wimmer, M.A., Foucher, K.C., Sumner, D.R., Shakoor, N., Block, J.A., 2010. Thebiomechanical effects of focused muscle training on medial knee loads in OA of theknee: a pilot, proof of concept study. J. Musculoskelet. Neuronal Interact. 10 (2),166–173.
Thorstensson, C.A., Henriksson, M., von Porat, A., Sjodahl, C., Roos, E.M., 2007. The effectof eight weeks of exercise on knee adduction moment in early knee osteoarthritis—a pilot study. Osteoarthritis Cartilage 15 (10), 1163–1170.
Turcot, K., Aissaoui, R., Boivin, K., Pelletier, M., Hagemeister, N., de Guise, J.A., 2009. Theresponsiveness of three-dimensional knee accelerations used as an estimation ofknee instability and loading transmission during gait in osteoarthritis patient'sfollow-up. Osteoarthritis Cartilage 17 (2), 213–219.
Weng, M.C., Lee, C.L., Chen, C.H., Hsu, J.J., Lee, W.D., Huang, M.H., et al., 2009. Effects ofdifferent stretching techniques on the outcomes of isokinetic exercise in patientswith knee osteoarthritis. Kaohsiung J. Med. Sci. 25 (6), 306–315.
Winter, D.A., 1988. The Biomechanics and Motor Control of Human Gait. University ofWaterloo Press, Waterloo, ON.
Zhang, W., Moskowitz, R.W., Nuki, G., Abramson, S., Altman, R.D., Arden, N., et al., 2007.OARSI recommendations for the management of hip and knee osteoarthritis, part I:critical appraisal of existing treatment guidelines and systematic review of currentresearch evidence. Osteoarthritis Cartilage 15 (9), 981–1000.