Journal of Exercise Science and Physiotherapy (JESP)
71
Editor’s Page Journal of Exercise Science and Physiotherapy (JESP) An official Peer Reviewed Journal of Exercise Fitness & Health Alliance, EFHA (Published biannually in June & December) Volume 10, No. 2: 2014 Contents EDITOR’S PAGE ii Original Papers 1. Efficacy of Muscle Energy Technique on Functional Ability of Shoulder in Adhesive Capsulitis Narayan, Anupama & Jagga, Vinay 72 2. Musculoskeletal Disorders amongMedical Laboratory Professionals-A Prevalence Study. Agrawal, Parul, R., Maiya, Arun, G., Kamath, Veena , Kamath, Asha 77 3. A Comparison of Nerve Conduction Properties in Male and Female of 20 to 30 Years of Age Group Gakhar, M., Verma, S.K. and Lehri, A. 16 4. A Study of Speed, Power & Fatigue Index of Cricket Players Kumar, Ashok and Kathayat, Lokendra Bahadur. 21 5. Comparision of Ankle Joint Range of Motion on Balance Score in Healthy Young and Adult Individuals Gaur K. Davinder, Ashutosh 25 6. Knowledge of Effect of Exercise on HIV-Infected Persons among Health Care Professionals in North Eastern Nigeria Maduagwu SM; Gashau, W, Abdulazeez K, Oyeyemi, AY, Kaidal, A, Aremu, BJ, Akanbi, OA, Jaiyeola, OA, Jajere, AM 31 7. Mechanical Power of Leg Extensor Muscles in Male Boxing Players Singh, Baljinder, Kumar, Ashok & Ranga M. D. 41 8. Review Study on the Effect Surface Spinal Stimulation on Autonomic Nervous System in Spinal Cord Injury Patient Kaur, Bhavkiran, Narkeesh , A. 46 9. Effect of Cardiac Rehabilitation on Blood Pressure in Stable Angina Patients Mazumdar, Soma, Kumar, Ashok, Verma, S.K. 54 10. C.V.A and Calcanium Eversion with Hamstring Tightness –A Correlative Study Bhatnagar, Shubha, Sen, Siddhartha, Arfath, Umar 60 11. Comparison of Vertical Jump Performance of Male Handball & Basketball Players Singh, Baljinder, Kumar, Ashok and Ranga, M. D. 64 12. Surgical Management of Periapical Lesion in the Maxillary Anterior Region Caused By Trauma in an Atheletic Child-A Case Report Verma, Leena 69 Instructions to Contributors a National Poisons Information Centre Information c
-
Upload
khangminh22 -
Category
Documents
-
view
0 -
download
0
Transcript of Journal of Exercise Science and Physiotherapy (JESP)
Editor’s Page
Journal of Exercise Science and Physiotherapy (JESP) An official Peer Reviewed Journal of Exercise Fitness & Health Alliance, EFHA
(Published biannually in June & December)
Volume 10, No. 2: 2014
Contents
EDITOR’S PAGE ii
Original Papers
1. Efficacy of Muscle Energy Technique on Functional Ability of Shoulder in Adhesive Capsulitis
Narayan, Anupama & Jagga, Vinay 72
2. Musculoskeletal Disorders amongMedical Laboratory Professionals-A Prevalence Study. Agrawal, Parul, R., Maiya, Arun, G., Kamath, Veena , Kamath, Asha 77
3. A Comparison of Nerve Conduction Properties in Male and Female of 20 to 30 Years of Age
Group
Gakhar, M., Verma, S.K. and Lehri, A.
16
4. A Study of Speed, Power & Fatigue Index of Cricket Players
Kumar, Ashok and Kathayat, Lokendra Bahadur. 21
5. Comparision of Ankle Joint Range of Motion on Balance Score in Healthy Young and Adult
Individuals
Gaur K. Davinder, Ashutosh
25
6. Knowledge of Effect of Exercise on HIV-Infected Persons among Health Care Professionals
in North Eastern Nigeria
Maduagwu SM; Gashau, W, Abdulazeez K, Oyeyemi, AY, Kaidal, A, Aremu, BJ, Akanbi,
OA, Jaiyeola, OA, Jajere, AM
31
7. Mechanical Power of Leg Extensor Muscles in Male Boxing Players
Singh, Baljinder, Kumar, Ashok & Ranga M. D. 41
8. Review Study on the Effect Surface Spinal Stimulation on Autonomic Nervous System in
Spinal Cord Injury Patient
Kaur, Bhavkiran, Narkeesh , A.
46
9. Effect of Cardiac Rehabilitation on Blood Pressure in Stable Angina Patients
Mazumdar, Soma, Kumar, Ashok, Verma, S.K. 54
10. C.V.A and Calcanium Eversion with Hamstring Tightness –A Correlative Study
Bhatnagar, Shubha, Sen, Siddhartha, Arfath, Umar
60
11. Comparison of Vertical Jump Performance of Male Handball & Basketball Players
Singh, Baljinder, Kumar, Ashok and Ranga, M. D. 64
12. Surgical Management of Periapical Lesion in the Maxillary Anterior Region Caused By
Trauma in
an Atheletic Child-A Case Report
Verma, Leena
69
Instructions to Contributors a
National Poisons Information Centre Information c

Editor’s Page
Exercise Fitness and Health Alliance
(Indexed with IndMed/MedINDIA a portal of Indian Medical journals, sciencecentral.com, InnoSpace - Scientific
Journal Master List database, Research Bible, Global
impact factor, hinari, ICMJE, Cite Factor ) www.efha.in
Journal of Exercise Science and Physiotherapy
VOLUME 10, NO.2: 2014 (India’s first peer reviewed biannual Journal of Exercise
Science), Indexed in Indmed/MedIND- a portal of Indian Medical
Journals, sciencecentral.com, InnoSpace - Scientific Journal Master
List database
Impact Factor for Journal of Exercise Science & Physiotherapy, JESP
Year Impact Factor
2011 2.035
2012 3.217
2013 4.652
I am glad that the Volume 10, No. 1 issue of Journal of Exercise Science and Physiotherapy (JESP) is
ready for circulation. An important milestone has been achieved during the year 2013 with the indexing of the JESP
in the sciencecentral.com, InnoSpace - Scientific Journal Master List database beside Indmed. InnoSpace has
announced that JESP was positively evaluated in the SJIF Journals Master List evaluation process, which resulted
in a score given SJIF 2013 = 4.652 (Scientific Journal Impact Factor Value for 2013). The organization has reported
steady improvement in the SJIF scores calculated for 2011 (2.035) & 2012 (3.217). More and more commonly used
rating is the criteria of citation which has also a great impact on gaining the Impact Factor rating. Building citation
rating is long-lasting processes which require strict strategy which is consistently inculcated. All the contributors,
reviewers and editorial board members deserve congratulations for their efforts in maintaining the quality of there
publications and rigorous review processes and dealing with all this efficiently and in a timebound manner for
maintaining the timely release of the journal. The improvement in the SJIF impact factor will help to gain better
scores in different kind of evaluations and especially in gaining better citation results. The editorial committee
members are busy with their effort to get the journal indexed in more and more databases to further improve the
citation of the research published in the JESP. This issue of JESP contains ten original research articles and two
case reports on the different aspects of exercise science from different countries of the world. I am sure you will
enjoy the same and strengthen our hands to futher improve the position of the journal in the international market.
S.K. Verma
Editor-in-Chief: Prof. (Dr.) S.K. Verma


Journal of Exercise Science and Physiotherapy, Vol. 10, No. 2: 72-76, 2014
Efficacy of Muscle Energy Technique on Functional Ability of
Shoulder in Adhesive Capsulitis Narayan, Anupama1, Jagga, Vinay2.
1Prem Physiotherapy & Rehabilitation College, Panipat, Haryana, India. E-mail:
[email protected] 2Associate Professor and Head, Prem Physiotherapy & Rehabilitation College, Panipat, Haryana, India.
Email: [email protected]
*Correspondence: Narayan, Anupama, M.P.T Student, Prem Physiotherapy & Rehabilitation College,
Panipat, Haryana, India. E-mail: [email protected]
Introduction
Adhesive capsulitis is a condition of
the shoulder of unknown etiology. It is
characterized by pain and restriction of
both passive and active range of motion
(ROM). Duplay referred to Adhesive
capsulitis in 1872 as "Scapulohumeral
Periarthritis," a disorder he believed
resulted from subacromial bursitis (Post,
1978; Neviaser, 1980; Bruckner & Nye,
1981; Jayson, 1981; Kessel et al, 1981; Rizk & Pinals, 1982; Loyd & Loyd, 1983;
Griggs et al, 2000; Patil et al, 2010, Day
& Nitz, 2012). In 1934, Codman coined the
term "frozen shoulder" but used it in
association with tendinitis of the rotator
cuff (Kessel et al, 1981).
Neviaser (1983) introduced the
concept of adhesive capsulitis when he
discovered that the capsule was tight,
thickened, and stuck to the humerus in
such a manner that it could be peeled off
like "adhesive plaster from the skin (Post,
1978; Jayson, 1981; Loyd & Loyd, 1983;
Rizk et al, 1983; Schenk et al, 1997;
Sandy et al, 2006; Steples et al, 2010;
Stephanie et al, 2011; Srikanth et al,
2013). Loyd and Loyd (1983) suggested
that secondary frozen shoulder develops
when painful spasm limits activity and
creates dependency of the arm.
Adhesive capsulitis is a commonly
recognized but poorly understood cause of
a painful and stiff shoulder. Although most
orthopaedic literature supports treatment
Abstract
Adhesive Capsulitis is a very painful condition of the shoulder characterized by pain, severe
stiffness and movement restriction usually present in the sixth decade of life. Onset before age
40yr is uncommon. The non dominant shoulder is slightly more likely to be affected. Muscle energy
(MET) technique is very much beneficial in this condition. Muscle energy techniques are class of
soft tissue osteopathic manipulation consisting of isometric contraction design to improve
musculoskeletal function and reduce pain. Method:-30 patients of Adhesive Capsulitis were
included in the study using convenient random sampling divided into 2 groups, Group A
(Experimental) and Group B (Control). Each group was divided into 15 patients. 40 - 60 year old
patients of both genders were included in the study. Control group was treated with conventional
physiotherapy treatment. The Experimental group was treated with MET for shoulder Flexion,
Abduction, and External rotation along with Conventional treatment. Result: Both Groups showed
significant difference and improvement after treatment. There is significant difference in Post test
scoring of both the groups; with lower SPADI scoring
Group A of experimental group shows better results then Group B of control group. Conclusion:
Muscle energy technique is very much effective on functional ability of shoulder in adhesive
Capsulitis.
Key Words: Frozen Shoulder, Codmen Exercise, Hot Packs.

Efficacy of Muscle Energy Technique on Functional Ability of Shoulder in Adhesive Capsulitis – Narayan,
Anupama & Jagga, Vinay
Date of Communication: Jul. 15, 2014
Date of Acceptance:Aug. 6, 2014 SJIF IMPACT FACTOR 2013=4.65
73
with physical therapy and stretching
exercises, some studies have demonstrated
late pain and functional deficits. The
purpose of these studies was to evaluate
the outcome of patients with adhesive
capsulitis who were treated with a
stretching-exercise program as reported by
Griggs et al, (2000). Staples et al (2010)
concluded that the shoulder pain and
disability index (SPADI) is superior
responsiveness when compared to the
Disability arm, shoulder, hand (DASH) in
patient with adhesive capsulitis.
Muscle energy techniques (MET) are a
class of soft tissue osteopathic
manipulation methods that incorporate
precisely directed and controlled patient
initiated, isometric contractions, designed
to improve musculoskeletal function and
reduce pain. Schenk et al, (1997) modelled
this study found that lumbar extension was
significantly increased after treatment,
supporting MET as an appropriate therapy
for restoring lumbar extension ROM. The
authors recommended further MET
efficacy studies be undertaken focussing
on the thoracic and sacroiliac regions.
Stephanie et al (2011) conducted a study to
compare the muscle energy technique for
the glenohumral joint external rotators to
improve glenohumeral joint range of
motion in baseball players. Their result
showed that single application of and
Muscle energy technique (MET) for the
Glenohumeral joint horizontal abductors
provided immediate improvement in both
GHJ horizontal adduction and internal
rotation ROM in asymptomatic collegiate
baseball players. Srikanth et al (2013) did
a study to compare the effectiveness of
anterior versus posterior glide
mobilization techniques and improving
functional activity of the shoulder in
patient with adhesive capsulitis. Patel et al
(2010); conducted the study to compare the
effectiveness of MET on quadratus
lumborum in acute low back using a
randomized control trial. They studied a
total number of 40 subjects (21 male and
19 female) and the result of the study
concluded that MET on quadrates
lumborum combined with interferential
therapy is more effective in reduction of
disability and increasing spinal range of
motion than interferential therapy alone in
patients with acute low back pain. The aim
of the present study was to study the
effectivity of MET on functional ability of
shoulder in Adhesive Capsulitis.
Materials and Methods
30 patients of Adhesive Capsulitis
were included in the study using
convenient random sampling from Delhi
NCR and further divided into 2 groups,
Group A (Experimental) and Group B
(Control). Each group was divided into 15
patients. 40 - 60 year old patients of both
genders were included in the study.
Patients with Rotator cuff tear, any
systemic disorder any neurological
disorder or fracture in and around shoulder
were excluded. Control group was treated
with conventional physiotherapy treatment
which consisted of Ultrasound Therapy,
Hot pack, Codman’s exercises, Pulley
exercises and active assisted exercises. The
Experimental group was treated with MET
for shoulder Flexion, Abduction, and
External rotation along with Conventional
treatment. The protocol for MET to
shoulder joint included 3 repetitions per
set, 1 session per day and thrice a week for
5 weeks.
Results & Discussion

Journal of Exercise Science and Physiotherapy, Vol. 10, No. 2: 72-76, 2014
Date of Communication: Jul. 15, 2014
Date of Acceptance: Aug. 6, 2014 SJIF IMPACT FACTOR 2013=4.65
74
Statistical comparison of the two
groups, Experimental (group A) and
Control (group B) reveal no significant
differences in the mean age of both groups. Statistics were performed by using
SPSS 13. Results were calculated by
using 0.05 level of significance.
Table 1: Statistical comparison of mean scores of
Shoulder pain and disability index before and after the
treatment in the experimental group
Experimental
Group MEAN ±SD T P
Pre 56.53 15.96 9.22 < 0.05
Post 37.53 11.74
Table 2: Statistical comparison of mean scores of
Shoulder pain and disability index before and after the
treatment in the control group
Control
Group MEAN ±SD T P
Pre 63.07 10.60 11.82 < 0.05
Post 46.87 10.46
Group A was given MET with
Conventional treatment. The Pre treatment
scoring of SPADI is 56.53 ± 15.96 and
Post 37.53± 11.74. Group B was given
Conventional treatment. The Pre treatment
scoring of SPADI is 63.07± 10.60 and Post
was 46.87±10.46.
Both the groups showed
significant difference and improvement
after treatment. However, greater
magnitude of % improvement was
observed in the Group A i.e. the
experimental group than the Group B of
control group.
Discussion- The purpose of this study was to see
the Efficacy of Muscle energy technique
on Functional ability of Shoulder in
Adhesive Capsulitis. In this study age
distribution showed no significant
difference in both groups. The comparison
of mean value of age in Group A is
50.80±6.48yrs and Group B is
51.13±5.77yrs. Group A showed
significant changes may be due to the
application of MET that relaxes and
improve biomechanics and thus results in
improved functional ability. Group B also
showed mild changes due to the relaxation
effect of conventional treatment. It was
evident from the mean score that both the
groups showed improvement in SPADI
score because of treatments. Between
groups analysis revealed that percentage of
improvement in SPADI score was more in
shoulder MET group which further
showed more improvement than the
conventional treatment Group.
The data analysis and statistic
inference have brought to check the
effectiveness of MET and conventional
treatment on the variables of the study
which are pain, functional ability and
ROM . The MET has an effect in reducing
pain, increase ROM and functional ability
in patient with adhesive Capsulitis. This is
also supported by the study of Patil et al
(2010). They took 40 subjects (21 males
and 19 females) diagnosed with acute low
back pain. Subjects were randomly
assigned to two groups of 20 each. The
control group received interferential
therapy while interventional group
received MET on quadratus lumborum
combined with interferential therapy. MET
on quadratus lumborum combined with
IFT demonstrated a statistically significant
difference (p<0.001) showing decrease in
disability and increase in spinal range of
motion than IFT alone. In the present study
Muscle energy technique along with
conventional treatment is found to be
relatively more effective on pain, disability
and ROM than the conventional treatment
alone. The study of Day et al (2012) also
supports the results of the present study.

Efficacy of Muscle Energy Technique on Functional Ability of Shoulder in Adhesive Capsulitis – Narayan,
Anupama & Jagga, Vinay
Date of Communication: Jul. 15, 2014
Date of Acceptance:Aug. 6, 2014 SJIF IMPACT FACTOR 2013=4.65
75
Low back pain is the most common type of
pain reported by adults in the United
States. A variety of manual therapy
techniques are being used in the
management of low back pain to reduce
pain, improve function, and reduce
disability. Muscle energy techniques have
been increasingly used in clinics to treat
low back pain Day et al (2012).
Akbari et al (2012) reported a study
in which thirty patients with trigger points
in the upper trapezius and levator scapula
were randomly assigned to one of the three
groups in equal number. In the laser group
a low level Ga- As laser was applied with
pulse duration of 200 ns and 60 j/cm2
dosages by contrast in the muscle energy
group, in the present study used stretching
following Post isometric relaxation and in
the placebo group used low level laser
without an output. The result showed that
low level laser and muscle energy
technique are both equally effective in
decreasing the neck and shoulder pain and
disability in patients with myofascial
trigger points in trapezius and levator
scapula muscle (Akbari et al, 2012). There
effect was reported to be beneficial
because these exercises spread synovial
fluid stimulate tonically depressed joint
mechanoreceptors, alleviate pain
secondary to muscle ischemia or prevent
collagen cross bridging. These results of
study are also supported by the study
Schenk et al (1997) in their study on
physical therapy management of the
shoulder. Subject in the present study have
similar baseline values of all dependent
variables suggesting that both groups had
similar distribution of patients. Statistical
analysis reveals that there are significant
changes in all the base values. These
include decrease in pain, improvement in
the Disability score, increase in ROM.
Group A demonstrated significant changes
that may be ascribed to the usage of the
MET that relaxes and improve
biomechanics and thus may result in
increase in ROM, decrease in pain and
improvement in the functional ability.
Group B also showed some significant
changes may be due to the relaxation effect
of conventional treatment that may have
caused improvement in ROM, SPADI and
VAS. Between the groups analysis
revealed that percentage of improvement
in pain in Group A was greater than Group
B.
Our data supported alternate
hypothesis that shoulder Muscle energy
technique along with conventional
treatment for functional ability in adhesive
capsulitis was more effective than the
shoulder conventional treatment for
functional ability in Adhesive capsulitis.
Conclusion: Muscle energy technique is
very much effective on functional ability
of shoulder in adhesive Capsulitis.
References Akbari, A., Naroii, S.H., Eshgi, M., Farahani, A.
2012. A Comparision between Muscle energy
technique with lower level Laser in Reducing
neck and shoulder pain and disability in subject
with Trapezius` and Levator scapula
Myofascial Trigger Points, 20(79): 69-82.
Bruckner, F.E., Nye, C.J. 1981. A prospective study
of adhesive capsulitis of the shoulder ("frozen
shoulder") in a high risk population. Q. J. Med.,
50: 191-204,
Day, J.M., Nitz, A.J. 2012. The effect
of muscle energy techniques on disability and
pain scores in individuals with low back pain. J
Sport Rehabil., 21(2): 194-8
Griggs, S.M., Ahn, A., Green, A. 2000. A
prospective functional outcome study of
nonoperative treatment. J. Bone Joint Surg Am.
82A(10): 1398- 407.

Journal of Exercise Science and Physiotherapy, Vol. 10, No. 2: 72-76, 2014
Date of Communication: Jul. 15, 2014
Date of Acceptance: Aug. 6, 2014 SJIF IMPACT FACTOR 2013=4.65
76
Jayson, M.l. 1981. Frozen shoulder: Adhesive
capsulitis. Br. Med. J. [Clin Res], 283:1005-
1006,
Kessel, L., Bayley, I., Young, A. 1981. The upper
limb: The frozen shoulder. Br. J. Hosp. Med,
25: 334
Loyd, J.A., Loyd, H.M. 1983. Adhesive capsulitis of
the shoulder: Arthrographic diagnosis and
treatment. South Med. J., 76: 879-883.
Loyd, J.A., Loyd, H.M. 1981. Adhesive capsulitis of
the shoulder: Arthrographic diagnosis and
treatment. South Med. J., 336-337.
Neviaser, J.S. 1980. Adhesive capsulitis and the stiff
and painful shoulder. Orthop. Clin. North Am.,
11: 327-333.
Patil, Prachi N.; Basavaraj, Chandu;
Metgud, Santosh, Khatri, Subhash. 2010. Effectiveness of muscle energy technique on
quadratus lumborum in acute low back pain-
randomized controlled trial. Indian journal of
Physiotherapy and Occupational Therapy; 4:
58.
Post, M (ed): 1978. The Shoulder: Surgical and
Nonsurgical Management. Philadelphia, PA,
Lea & Febiger,
Rizk, T.E., Pinals, R.S. 1982. Frozen shoulder.
Semin. Arthritis Rheum., 11: 440-452,
Rizk, T. E., Christopher, R. P., Pinals, R. S.,
Higgins, A. C., Frix, R. 1983. Adhesive
capsulitis (frozen shoulder): A new approach
to its management. Arch. Phys. Med. Rehabil.,
64: 29–33 Steples. M.P., Forbes, A.,Green, S., Buchbinder, R.
2010. Shoulder.Specific disability measures
showed aceeptable construct validity and
responsiveness J. Clin. Epidemiol, 63: 163.170.
Schenk, R., MacDiarmid, A., Rousselle, J. 1997.
The Effects of Muscle Energy Technique on
Lumbar Range of Motion. Journal of Manual
and Manipulative Therapy. 5(4): 179 - 183.
Sandy, Fritz, Gary, Fryer, Ken, Crenshaw, Craig,
Liebenson et al. 2006. Leon Chaitow Muscle
Energy Techniques; 3rd Edition; Churchill
living stone publications; p.341.
Stephanie, D., Moore, M.S., ATC1 • Kevin G.
Laudner, Todd, A. Mcloda, Michael, A.
Shaffer, P.T. 2011. The Immediate Effects of
Muscle Energy Technique on Posterior
Shoulder Tightness: A Randomized Controlled
Trial. J. Orthop. & Sports Physical Therapy,
41: 407.
Srikanth, Babu V., Srinivas M., Ravindra Kumar B.
and Jalaja Prakash. 2013. The effects of
Anterior versus Posterior Glide joint
Mobilization in Improving Functional Activity
of the shoulder in Patients with adhesive
capsulitis; Int. Res. J. Biological Sci. 2(1): 15-
21.
.
Confl ict of Interest: None declared. Conflict of Interest: None declared.

Musculoskeletal Disorders among Medical Laboratory Professionals-A Prevalence Study - Agrawal, Parul,, et al
Date of Communication: Jul. 15, 2014
Date of Acceptance:Aug. 6, 2014 SJIF IMPACT FACTOR 2013=4.65
77
Musculoskeletal Disorders among Medical Laboratory
Professionals-A Prevalence Study
Agrawal, Parul, R1., Maiya, Arun, G2., Kamath, Veena3 , Kamath, Asha4 1Assistant professor (selection grade), Dept. of physiotherapy, School Of allied Health Sciences,
Manipal University, Manipal-576104, India. Email [email protected] 2 Professor, Dept. Of Physiotherapy, School Of allied Health Sciences, Manipal University Manipal-
576104, India. [email protected] 3Professor and head, Department Of Community medicine, KMC, Manipal, India. Email-
[email protected] 4Associate Professor (statistics), Dept. Of Community Medicine, KMC, Manipal, India. Email-
Introduction
Musculoskeletal disorders (MSDs)
are an increasing health problem in
workplaces. These disorders are a major
cause of concern for several reasons: the
health problem leading to workers’
disability and the lost time from work
(WHO, 2003). Work-related
Musculoskeletal Disorders (WMSDs) are
the musculoskeletal disorders to which the
work environment and the performance of
work contribute significantly (Wolf et al,
2006).
Hospitals are large, organizationally
complex, system driven institutions
employing large numbers of workers from
different professional streams. They are
also potentially hazardous workplace and
Abstract
Background: Work –related musculoskeletal disorders (WRMSD) have been reported very often in
various occupations. Laboratory personnel are also exposed to many ergonomic risk factors due to
the nature of their work. As their work demands awkward and static postures, high repetition,
excessive force, excessive reaching, compression or contact stress, forceful or static exertions,
lifting and pinch grip lifting, and repetitive motions, they may be at increased risk for work related
musculoskeletal disorder which is often ignored. So the study was aimed at estimating the
prevalence of work related musculoskeletal disorders among laboratory professionals. Methods: It
was a cross sectional study done on 250 laboratory professionals (lab technicians, pathologists,
microbiologists, biochemistry technologist) in Udupi district of Karnataka state and validated
questionnaire was used to screen for the symptoms. Data were analyzed using descriptive statistics.
Results: Prevalence of musculoskeletal symptoms among laboratory professionals was found to be
21.2%. The neck and lower back are observed to be the most affected with symptoms of pain and
discomfort with prevalence of 8% and 6.8% respectively. Conclusion: Medical laboratory
professionals are at high risk for the development of MSDs related to cumulative trauma. Thus,
laboratory professionals are strongly encouraged to adopt preventive measures before symptoms
develop.
Keywords: Work related musculoskeletal disorders; Occupational; Health Risk; Cumulative
trauma, Laboratory professional

Journal of Exercise Science and Physiotherapy, Vol. 10, No. 2: 77-81, 2014
Date of Communication: Jul. 15, 2014
Date of Acceptance: Aug. 6, 2014 SJIF IMPACT FACTOR 2013=4.65
78
expose their workers to a wide range of
physical, chemical, biological,
ergonomical and psychological hazards.
Oftentimes, healthcare workers experience
musculoskeletal disorders (MSDs) as well
as respiratory symptoms at a rate
exceeding the rate of workers involved in
construction, mining, and manufacturing
sectors (Howells & Knight, 1981).
Stricoff, and Walters, (1995) reported
that healthcare workers, including
pathologists, microbiologists, and
technicians are exposed to a number of risk
factors in the workplace for
musculoskeletal disorders such as back and
shoulder injuries and even other joints and
muscles exertion, which are aggravated or
prolonged by their work conditions. The
primary functions of the hospital
laboratory in the hospital are to perform
analytic tests and procedures on body
fluids and tissues taken from patients and
to provide the results of these tests to
physicians in order to confirm diagnosis
determine prognosis or ascertain or assess
the patient’s treatment. The laboratory
medical staff functions in an atmosphere of
continual pressure from the responsibility
of providing accurate and precise
information with vitually no margin of
error. Results must be carefully checked
and rechecked by them since the
responsibility for treatment of the patient
depends on the reports issued from the
laboratory (Stricoff and Walters, 1995)
Along with the risk of working daily
with hazardous substances, laboratory
personnel are also exposed to many
ergonomic risk factors due to the nature of
their work and the research they conduct
(Thomas, 2011). Ergonomic risk factors
for laboratory staff causing MSD consist of
awkward and static postures, high
repetition, excessive force, excessive
reaching, compression or contact stress,
Forceful or static exertions, lifting and
pinch grip lifting, and repetitive motions
affecting the comfort and productivity
(Wahlstro¨m, 2005).
The laboratory workers are considered
to be sedentary workers and often a time
the stress involved with this job that can
affect their musculoskeletal system
causing its function to decline if ignored.
The literature on medical laboratory
hazards has largely centered on infections,
this is partly because laboratory acquired
infections tends to be more easily
remembered than the hazardous events
(Skinhoj, 1974; Harrington, 1982), its
impact on musculoskeletal system are
often ignored.
So, the aim of the study was to estimate
the prevalence of work related
musculoskeletal disorders among
laboratory professionals.
Materials & Methods
The Manipal University ethical
committee clearance was obtained before
the study. The study conducted is a cross
sectional survey of laboratory
professionals (lab technicians,
pathologists, microbiologists,
biochemistry technologist) belonging to
the Udupi district. The target sample size
was the whole community of laboratory
professionals in the selected district.
Participants that were in the age group
ranging in age from 19 to 60 years and
having minimum experience of one year
were included in the study. The subjects
having history of unhealed fractures,
recent dislocations, inflammatory arthritis,
tumors, diagnosed psychiatric illness,
recent traumatic soft tissue injuries,

Musculoskeletal Disorders among Medical Laboratory Professionals-A Prevalence Study - Agrawal, Parul,, et al
Date of Communication: Jul. 15, 2014
Date of Acceptance:Aug. 6, 2014 SJIF IMPACT FACTOR 2013=4.65
79
diagnosed disc lesion were excluded from
the study.
A validated questionnaire pertaining to
symptoms related to different body parts
(neck, upper back, lower back, shoulder,
elbow, wrist /hand, hip/thigh, knees,
ankle/feet), demographic data and
Occupational history was used to screen
for symptoms.
Procedure: After identification of the
subjects, informed consent was obtained
following which, interviews were carried
out using validated questionnaire to screen
for the musculoskeletal symptoms during
the previous 12 months in nine body
regions (head/neck, shoulders, elbows,
wrists/hands, upper back, low back, hips,
knees and ankles/feet). Demographic data,
occupational case history like years of
experience, number of hours at work etc.
were also taken. All the data collected were
analyzed by SPSS version 16 software and
descriptive statistics was used to
summarize the data. Results & Discussion:
260 subjects were screened of which
10 were excluded (6- due to less than one
year experience, 4- due to the diagnosed
disc lesion).
Table 1: Demographic characteristic of the participants
Variables Mean (SD)
Age, years 30.64 ± 9.89
No. of hours in a day at
work
6 (median) 9
(interquartile range)
Duration of experience,
yrs
8.13 ± 1.88 (mean±SD)
Gender Female 73.6%
Male 26.4 %
Involvement in Physical
activity
No-78.4%
Yes-21.6%
Perception of their
general health
Good-85.2%
Fair-13.6%
Poor-1.2%
A total of 250 subjects participated in
the study. Table 1 shows the details of
demographic characteristics of the
participants.
Looking at the prevalence among 250
subjects, it was found that 21.2%
participants were observed to suffer from
musculoskeletal symptoms in various
regions of the body. Further analysis
revealed that 8% of the subjects reported
neck pain and 6.8% of the subjects suffered
from lower back complain indicating
relatively greater prevalence of symptoms
in neck and upper back region. Tables 2
and 3 enlist the prevalence rates of
symptoms in various body regions as well
as distribution based on type of laboratory
profession. Table 2:
Laboratory profession Number of subjects
with musculoskeletal
complaints
Laboratory technician 44
pathologist 6
Microbiologist 1
Biochemistry profession 2
62.2% of the subjects reported, work to
be the prime reason for their complaint as
they had to use the microscope as well
computer to document the report for
maximum number of time in their working
hours. Regarding the nature of complain
45.2% of the subjects labelled their
discomfort as stiffness around the
respective body region. 98% of subjects
had been on sick leave during the previous
year for a median of 4 (mean = 6) days. The
change in their ability to work because of
specific musculoskeletal complaint graded
on 0-10 point scale, where 0 is no change

Journal of Exercise Science and Physiotherapy, Vol. 10, No. 2: 77-81, 2014
Date of Communication: Jul. 15, 2014
Date of Acceptance: Aug. 6, 2014 SJIF IMPACT FACTOR 2013=4.65
80
and 10 is the extreme change, 66% of
subjects with musculoskeletal complain
graded their ability to work between 1 to 3
which is indicative of minimal change in
the ability.
In the present study although
maximum subjects (85.2%) perceived their
general health to be good, 21.2% of the
participants had reported musculoskeletal
symptoms. The mean age of the
participants in the present study was
30.64±9.8 yrs which show that this
problem is being experienced by many
young technicians. This observation is
similar to the findings of Florian et al
(2012) who argued against a mere aging
effect of this disorder, and also underlines
the importance of addressing this problem
not only on middle aged to older
employees but in the younger ones, at an
early stage in their career. Similar to the
study reported by Florian et al (2012),
female gender was predominant in our
study, 83% of the subjects with
musculoskeletal complaint were observed
to be females. It was further observed that,
average number of hours they were
involved in their work were 8.13±1.8
which itself could be a major contributing
factor in getting musculoskeletal
symptoms in this population. More so
78.4% of the participants were not
involved in any kind of physical activity.
Lack of physical activity may have had an
impact on their fitness level which might
have contributed to the cause of complaints
among this population.
In the present investigation prevalence
of neck complaint was found to be 8%. The
main reason for neck symptoms could be
the static posture adopted by neck during
laboratory work which is support the view
expressed by George (2010) in a study
stating strong evidence that high levels of
static contraction, prolonged static loads,
and awkward postures involving the neck
and shoulder muscles were associated with
an increased risk for MSDs. Many studies
linking static postures/static loads with
“tension-neck syndrome” were cited by
him (odds ratios were greater than 3.0 and
statistically significant). Emphasis
therefore must be placed on the term static
because most of us do not intuitively
associate sitting in a chair for prolonged
intervals with tissue injury.
Lower back complaint also found with
6.8% prevalence in the present study. The
neck and back muscles truly are involved
while sitting down and viewing slides at
the microscope or staring at a computer;
this has been confirmed by surface
electromyography (Falla, 2004). This
could be the reason for observing higher
percentage of symptoms in neck and lower
back in the present study. Further 83.01%
subjects were laboratory technicians who
reported musculoskeletal complaints. This
can be explained by the fact that they are
mainly involved in clinical work and most
of the clinical load is borne by them unlike
the pathologist or microbiologist who are
involved in teaching also. 66% of subjects
with musculoskeletal symptoms in our
study graded their ability to work between
1 and 3 which is indicative of minimal
change in their ability. As this study was
questionare interview based, during
interview many subjects might have
perceived these symptoms as part of their
daily work pattern and were trying to
ignore it, the reason could be lack of
awareness about serious impact of these
musculoskeletal symptoms on their health.
Strength and Limitation of the study: As
the study adopted face to face interview

Musculoskeletal Disorders among Medical Laboratory Professionals-A Prevalence Study - Agrawal, Parul,, et al
Date of Communication: Jul. 15, 2014
Date of Acceptance:Aug. 6, 2014 SJIF IMPACT FACTOR 2013=4.65
81
method for collecting data so it is more
reliable which can be considered as the
strength of the study. As analysis of the
perceived load and stress based on the
various tasks and time spent in various
tasks during work that might have thrown
light on to the specific posture or activity
predisposing to symptoms so further detail
evaluation of these components are
indicated in future research.
Conclusion; This study noted that
prevalence of work related
musculoskeletal disorder among medical
laboratory professionals is 21.2%. The
results suggest that practicing medical
laboratory professionals are at high risk for
the development of MSDs related to
cumulative trauma. Thus, it is
recommended that there exist the need for
evaluation of laboratory professionals.
Also, laboratory professionals are strongly
encouraged to adopt preventive measures
before symptoms develop as well as
physical activity promotion.
Acknowledgement
We acknowledge the support provided
by the university of Alabama at
Birmingham-international training and
research in environmental and
occupational health .The contents is solely
the responsibility of the authors and do not
necessarily represent the official views of
the NIH-FIC.
References Falla, D. 2004. Unravelling the complexity of
muscle impairment in chronic neck pain. Man.
Ther., 9: 125-133.
Fritzsche, Florian, Rudolf; Ramach, Constanze;
Soldini, Davide; Caduff, Rosmarie; Tinguely,
Marianne; Cassoly, Estelle; Moch, Holger and
Stewart, Antony. 2012. Occupational health
risks of pathologists - results from a nationwide
online questionnaire in Switzerland. BMC
Public Health, 12: 1054
George. Evan. 2010. Occupational Hazard for
Pathologists Microscope Use and
Musculoskeletal Disorders. Am. J. Clin.
Pathol., 133: 543-548
Harrington, J.M. 1982. Health and safety in medical
laboratories. Bulletin of World Health
Organization, 60(1): 9-16.
Howells, R.A., Knight, J.L. 1981. Safety
considerations for hospital populations,
Handbook of Hospital Safety. Boca Raton,
Florida: CRC Press; 13-42
Skinhoj. P. 1974. Occupational Risks in Danish
Clinical Chemical Laboratories II. Infections,
33(1): 27-29
Stricoff, R.S., and Walters. D.B. 1995. Handbook of
Laboratory Health and Safety, 2nd edition.
John Wiley and Sons, Inc., NY.
Thomas, Walters. 2011. Naval Facilities
Engineering Command, Ergonomic Risk
Assessment for Naval Hospital Laboratory- a
report. DOD environment, safety and
occupational health network and information
exchange. Website : www.denix.osd.mil
Wahlstro¨m, J. 2005. Ergonomics, musculoskeletal
disorders and computer work. Occup. Med.
(Lond), 55: 168–176.
Wolf, Li, Evanoff, W.; Fragala, N. & Menzel. 2006.
NIOSH efforts to prevent MSD in health care
industry orthopaedic nursing, 25(6): 380-389.
World Health Organization. 2003. The Burden of
Musculoskeletal Conditions at the Start of the
New Millennium: Report of a WHO Scientific
Group. Geneva, Switzerland: World Health
Organization. Technical Report Series, 919.
Source of Support: University of Alabama at Birmingham-international training and research in environmental
and occupational health. Conflict of Interest: None declared.

Journal of Exercise Science and Physiotherapy, Vol. 10, No. 2: 82-86, 2014
Date of Communication: July, 29, 2014
Date of Acceptance: Aug. 09, 2014 SJIF IMPACT FACTOR 2013=4.65
82
Effect of Fatigue on Kinesthetic Acuity of Healthy Ankle
Tomar, Akansha1, Jagga, V2.
1 Department of Physiotherapy, Prem Physiotherapy & Rehabilitation College, Panipat, Haryana India. Email:
[email protected] 2 Head, Department of Physiotherapy, Prem Physiotherapy & Rehabilitation College, Panipat, Haryana) India.
Email: [email protected]
Introduction
Kinesthetic acuity is defined as
ability of perception of one’s own body
part, weight and movement or the ability of
a person to sense by which position, weight
and movement are perceived (Mosby,
2009). Proprioception is defined as the
awareness of posture, movement, and
changes in equilibrium and the knowledge
of position, weight and resistance of
objects in relation to the body. It is derived
from a complex array of information
arriving at the brain from several different
sources including the muscle spindle, joint
capsule, joint ligaments, skin, fat pads, and
possibly the joint cartilage and/or
subchondral bone. The individual
contributions of the various components of
proprioception are not well understood,
although historically the joint capsule and
ligaments were thought to be the major
contributors. If indeed the joint capsule
and ligaments are the principle
contributors to proprioceptive input, it
might be expected that persons with
damage to their joint capsules or ligaments
might have proprioceptive deficits. Joint
position sense is a vital component of
proprioception. Joint position sense is the
body’s conscious awareness of joint
position and movement resulting from the
proprioceptive input to the central nervous
system (Docherty et al, 1999). Joint
position sense is determined by muscle
spindles and skin receptors (Forestier et al,
2002). There have been numerous studies
Abstract
The purpose of this study was to determine the effect of fatigue on kinesthetic acuity of (Ankle) the
gastrocnemius through a dynamic fatiguing protocol in dorsiflexion and plantar flexion of the ankle.
Participants: 100 healthy college students volunteered for the study. Subjects meeting any of the
following exclusion criteria were excluded from the study: (1) prior history of multiple ankle
sprains, (2) an ankle sprain or ankle injury within the last six months, (3) any knee or ankle surgery
within the past year, (4) any neurological or central nervous system deficits (5) taking any
medication which might affect the nervous system. Main Outcome Measures: The researchers
expected that there would be a significant difference in absolute error between the non-fatigued and
fatigued condition at both 10º of dorsiflexion and 20º of plantar flexion. Results: There was
significant main effect of fatigue on kinesthetic of healthy ankle. Conclusion: The results of this
study indicated that there was significant difference between the non-fatigued and fatigued
conditions at 10º of dorsiflexion and 20º of plantar flexion measurements.
Key Words: Kinesthetic Acuity; Fatigue; Ankle; Dorsiflexion; Planter flexion
Proprioception.

Effect of Fatigue on Kinesthetic Acuity of Healthy Ankle - Tomar, Akansha & Jagga, V.
Date of Communication: July, 29, 2014
Date of Acceptance: Aug. 09, 2014 SJIF IMPACT FACTOR 2013=4.65
83
measuring joint position sense in the lower
(Hertel et al, 1996; Bernier & Perrin,
1998; Forestier et al, 2002) and upper
extremity (Johnston et al, 1998; Hertel,
2000) using a dynamometer. These studies
have indicated that joint position sense
may be affected by anesthetic injection
(Bernier & Perrin, 1998) and muscle
fatigue in the lower (Forestier et al, 2002)
and upper (Myers et al, 1999) extremities.
Fatigue can be defined as undergoing both
a metabolic and a neuromotor process. The
neuromuscular component of fatigue is
dependent on many factors, including
stimulation parameters such as frequency,
duty cycle, and activation pattern (Ding et
al, 2002). There are two types of
neuromotor fatigue, central fatigue and
peripheral fatigue (Bernier & Perrin,
1998. Ding et al, 2002). Central fatigue is
associated with reduced recruitment of
new motor units or decreased firing
frequency of the active units, or both
(Bernier & Perrin, 1998. Ding et al, 2002).
Peripheral fatigue results from a decrease
in the efficiency of the contractile units of
the muscle Neuromuscular fatigue may
involve a decrease in motoneuron output or
desensitization of type III and type IV
muscular afferents (Yaggie & McGregor,
2002).
Materials & Methods
A convenient sample was taken from
Prem Institute of Medical Sciences,
Panipat. 100 subjects were taken which
were equally divided into two groups with
50 males and 50 females in each group
which were young group of non sports
activity. The subjects were explained about
the procedure (fatigue protocol) and then
allowed a practice for time of 5 minutes.
Both groups followed the same procedure.
During the practice time, as in the test time,
subjects removed their shoes and socks.
The dominant leg was determined by
asking the subject which leg they preferred
to kick a soccer ball as done in many earlier
studies (Ochsendorf et al, 2000; Sekizawa
et al, 2001; Forestier et al, 2002). The
subjects were then tested for degrees of
movement using Baseline Electric
goniometer at 20° of plantar flexion and
10° of dorsiflexion in the non-fatigued
state. Intermediate range of motion for
plantar flexion and dorsiflexion were
selected rather than the end range of
motion. For our study Golgi Tendon
Organs and muscle mechanoreceptors,
which are activated at the intermediate
range of motion, are of more concern
rather than the articular receptors which
are activated at the end ranges of motion.
Subjects were then allowed a five-minute
break prior to starting the fatiguing
protocol in which the subjects were
allowed to stretch their gastrocnemius if
they so desired. The subjects were then
asked to stand on their tiptoes until they
could no longer hold such a position. When
fatigue was reached the subjects
underwent a fatigued state kinesthetic
acuity test using the same test angles in the
same order. The amount of time from the
end of the fatigue protocol to the beginning
of joint position sense measurement was
not greater than 60 seconds. Each test
angle was tested only once in the fatigued
and non-fatigued state.
Results & Discussion
The results demonstrate that there is
significant effect of fatigue on kinesthetic
acuity of healthy ankle. There is a
significant effect of fatigue on kinesthetic
acuity of healthy ankle in the Female group

Journal of Exercise Science and Physiotherapy, Vol. 10, No. 2: 82-86, 2014
Date of Communication: July, 29, 2014
Date of Acceptance: Aug. 09, 2014 SJIF IMPACT FACTOR 2013=4.65
84
which demonstrated a change in
dorsiflexion and plantar flexion range of
motion after fatigue protocol i.e. non
fatigue ankle dorsiflexion range of motion
was 9.26 and fatigue ankle dorsiflexion
range of motion was 9.28 whereas Non
fatigue ankle plantar-flexion range of
motion was observed to be 20.00 and
fatigue ankle plantar flexion range of
motion was 20.00. There was also a
significant effect of fatigue on kinesthetic
acuity of healthy ankle in the Male group
which demonstrated a change in
dorsiflexion and plantar flexion range of
motion after fatigue protocol i.e. non
fatigue ankle dorsiflexion range of motion
was found to be 9.86 and fatigue ankle
dorsiflexion range of motion was 9.88
whereas Non fatigue ankle plantar-flexion
range of motion was 20.00 and fatigue
ankle plantar flexion range of motion was
20.00. It was further found that there was
greater magnitude of significant effect of
fatigue on kinesthetic acuity in males as
compared to females i.e. fatigue
dorsiflexion range of motion of ankle of
males is 9.88 and fatigue dorsiflexion
range of motion of ankle of females is 9.28.
Groups Mean +_ SD t-value P value Non Fatigue
Ankle DF 9.26+-1.07
-1.00
<0.05
Fatigue
Ankle DF
9.28+_0.83
Non Fatigue
Ankle DF 9.86+-0.34
-1.00
<0.05
Fatigue
Ankle DF 9.88+-0.34
Yaggie & McGregor (2002) used a
Cybex dynamometer in their protocol and
fatigued the ankle in all four directions,
inversion, eversion, plantar flexion and
dorsiflexion. They were observing the
effects of isokinetic ankle fatigue on the
maintenance of balance and postural
limits. The speed was set at 60° per second
and fatigue was achieved when three
consecutive repetitions fell below 50% of
maximum joint torque (Wilkerson & Nitz,
1994). It was concluded that isokinetic
fatigue of ankle plantar flexors and dorsi
flexors significantly influences sway
parameters and ranges of postural control
in healthy young men. These perturbations
are transient, and recovery occurs within
20 minutes (Wilkerson & Nitz, 1994).
Forestier, et al (2002) used a
dynamometer and subjects hold at least
70% of their maximum voluntary
contraction for 40 seconds followed by 40
seconds rest. Subjects were considered
fatigued when they could no longer
produce 70% of their maximum voluntary
contraction for 15 seconds or more. In this
study the results indicated that the acuity of
the position sense at the ankle is reduced
subsequent to a fatigue protocol. With
fatigue, subjects produced ankle
movements characterized by greater
absolute errors for movements of large
amplitude in dorsiflexion and for
movements of small amplitude in
plantarflexion.
Groups Mean +_ SD t-value P value
Non Fatigue
Ankle PF 20.00+-000
0.00
<0.05
Fatigue
Ankle PF
20.00+-000
Non Fatigue
Ankle PF 20.00+-000
0.00
<0.05
Fatigue
Ankle PF
20.00+-000
However, in our study fatigue was
determined by the subjects. Therefore, a
perceived fatigue may have occurred and
not an actual fatigue. The technique, when
performed correctly, was reliable in
inducing a real state of fatigue. In previous

Effect of Fatigue on Kinesthetic Acuity of Healthy Ankle - Tomar, Akansha & Jagga, V.
Date of Communication: July, 29, 2014
Date of Acceptance: Aug. 09, 2014 SJIF IMPACT FACTOR 2013=4.65
85
studies using this protocol it was stated that
in order to ensure a real fatigued state the
testing protocol must begin within one
minute of fatigue (Vuillerme et al, 2001;
2002). In the protocol actually took place
in under 40 seconds of fatigue. However,
not all subjects may have been
experiencing a real state of fatigue. Some
may have perceived that they were
fatigued, when in fact they might have only
been experiencing minor discomfort.
Previous studies have indicated the use of
repeated bouts of this protocol due to
multiple trials of their testing procedure
(Vuillerme et al, 2001; 2002). The subjects
in this study only performed one trial of
this fatiguing protocol based on our
procedures perhaps the protocol did induce
a real state of fatigue, but since subjects
were healthy one can only speculate that
the muscle mechanoreceptors were not
affected. The angles that were tested may
play an important role in determining
significance. The angles of 10º of
dorsiflexion and 20º of plantar flexion
were near the midpoint of the normal
physiological ranges of motion for the
ankle. Using angles that are at the mid-
range or just past the mid-range may yield
significant results. The mechanoreceptors
that are located in the muscles and tendons
have shown to be most effective at
determining conscious awareness of joint
position sense at the mid-range of motion
(Wilkerson & Nitz, 1994; Luttgens &
Hamilton, 1997; Vuillerme et al, 2002). It
has been reported that there is no evidence
that articulator (joint) receptors of any joint
are important in the conscious awareness
of joint position sense (Wilkerson & Nitz,
1994). Muscle spindles are believed to be
the best suited for conveying conscious
awareness of joint position sense.
Therefore, if the angles selected were
closer to the mid ranges of motion it may
be assumed that significant results may
have been found. The failure of anesthesia
of the joint and cutaneous afferents
disrupting conscious kinesthesia and joint
position sense provides further support for
the importance of muscle receptors in
conscious proprioception ((Wilkerson &
Nitz, 1994). In this study the mid ranges of
motion were tested to eliminate the
cutaneous receptors that are activated at
the beginning ranges of motion. Through
testing the intermediate range of motion
proprioceptive input from type III and IV
joint receptors, that detect joint movement
and joint position sense at the end range of
motion, was eliminated (Luttgens &
Hamilton, 1997). We further eliminated
cutaneous receptor activity by covering the
foot with an elastic foam strap (Docherty
et al, 1999).
Conclusion: The study was on the effect of
fatigue on kinesthetic acuity on the healthy
ankle the results of our study conclude that
there is significant change in absolute error
in an active angle reproduction test at 10º
of dorsiflexion a non-fatigued and fatigued
condition but there is no significant change
in absolute error in an angle reproduction
test at 20° of plantar flexion. There are
many other variables that can affect joint
position sense in the lower extremity.
Those subjects with chronic ankle
instability have impaired joint position
sense due to the disruption of joint
mechanoreceptors while healthy subjects
have no such impairment. In our study only
the mid-range of the physiological range of
motion was tested. This is the range of
motion in which joint position sense is
detected by muscle mechanoreceptors.
Refrences:

Journal of Exercise Science and Physiotherapy, Vol. 10, No. 2: 82-86, 2014
Date of Communication: July, 29, 2014
Date of Acceptance: Aug. 09, 2014 SJIF IMPACT FACTOR 2013=4.65
86
Bernier J, Perrin D. 1998. Effect of coordination
training on proprioception of the functionally
unstable ankle. J. Orthop. Sports Phys.Ther.,
27(4): 264-275.
Ding, J., Wexler, A.S., Binder-Macleod, S. 2002. A
predictive model of fatigue in human skeletal
muscles. J. Appl. Physiol., 89(4): 1322-1332.
Docherty, C., Moore, J., Arnold, B. 1999. Effects of
strength training on strength development and
joint position sense in functionally unstable
ankles. J. Athl. Train., 33(4): 310-314.
Forestier, N, Teasdale, N., Nougier. V. 2002.
Alteration of the position sense at the ankle
induced by muscular fatigue in humans. Med.
Sci. Sports Exerc., 34(1): 117-122.
Hertel, J., Guskiewicz, K., Kahler, D., Perrin, D.
1996. Effect of lateral ankle and joint anesthesia
on center of balance, postural sway, and joint
position sense. J. Sport Rehabil., 5: 111-119.
Hertel, J. 2000. Functional instability following
lateral ankle sprain. Sports Med., 29(5): 361-
71.
Johnston, H., Howard, M., Cawley, P., Losse, G.
1998. Effect of lower extremity muscular
fatigue on motor control performance. Med.
Sci. Sports Exerc., 30(12): 1703
Chu, J.C., Kane, E.J., Arnold, B.L., Gansneder,
B.M. 2002. The effect of a neoprene shoulder
stabilizer on active joint-reposition sense in
subjects with stable and unstable shoulders. J.
Athl. Train., 37(2): 141-145.
Luttgens, K., Hamilton, N. 1997. Kinesiology
scientific basis of human motion. 9th ed.
Boston MA: WCB McGraw-Hill.
Myers, J.B., Guskiewicz, K.M., Schneider, R.A.,
Prentice, W.E. 1999. Proprioception and
neuromuscular control of the shoulder after
muscle fatigue. J. Athl. Train., 34(4): 362-367.
Mosbey Medical dictionary, 8th edition 2009
Elsevier in corp.
Ochsendorf, D.T., Mattacola, C.G., Arnold, B.L.
2000. Effect of orthotics on postural sway after
fatigue of the plantar flexors and dorsiflexors.
J. Athl. Train., 35(1): 26-30.
Patikas, D., Michailidis, C., Kotzamanidis, C.,
Alexiou, S. 2002. Elecetromyographic changes
of agonist and antagonist calf muscles during
maximum isometric induced fatigue. Int. J.
Sports Med., 23: 285-289.
Sekizawa, K., Sandrey, M., Ingersoll, C.. Cordova,
M. 2001. Effects of shoe sole thickness on joint
position sense. Gait Posture, 13: 221-228.
Vuillerme, N., Nougier, V. J., Prieur, J. 2001. Can
vision compensate for a lower limbs muscular
fatigue for controlling posture in humans?
Neuroscience Letters. 308: 103-106.
Vuillerme, N., Forestier, N., Nougier, V. 2002.
Attentional demands and postural sway: the
effect of the calf muscles fatigue. Med. Sci.
Sport Exerc., 37(12): 1907-1912.
Wilkerson, G., Nitz, A. 1994. Dynamic ankle
stability: mechanical and neuromuscular
Interrelationships. J. Sport Rehabil., 3: 43-57.
Yaggie, J., McGregor, S. 2002. Effects of Isokinetic
ankle fatigue on the maintenance of balance and
postural limits. Arch. Phys. Med. Rehabil.,
83(2): 224-228.
Conflict of Interest: None declared.

The Impact of Open Patella Knee Cap and Designed Off-Loader Valgus Knee Brace on Muscle Activity Patterns and
Joint Loading during Walk In Normal Adult – A Pilot Study – Singh et al
Date of Communication: Aug. 07, 2014
Date of Acceptance: Aug. 18, 2014 SJIF IMPACT FACTOR 2013=4.65
87
The Impact of Open Patella Knee Cap and Designed Off-Loader
Valgus Knee Brace on Muscle Activity Patterns and Joint Loading
during Walk In Normal Adult – A Pilot Study
Singh1, O.P.; Saraf2, S.K.; Sigh3, Gaurav; Gambhir4, I.S. and Mathew5, A.S. 1Senior Occupational Therapist, Department of Orthopaedics, I.M.S, Banaras Hindu University, India Email:
[email protected] 2Prof. of Orthopedics, Department of Orthopaedics, I.M.S., Banaras Hindu University, India. Email:
[email protected] 3Senior Occupational Therapist, St. Patrick Centre for Community Health Centre, Birmingham, United Kingdom
Email: [email protected] 4Prof. of Medicine, of Medicine, Institute of Medical Sciences, Banaras Hindu University, Varanasi, India, Email:
[email protected] 5School of Biomedical Engineering. Indian Institute of Technology, Banaras Hindu University, Varanasi, India.
Email: [email protected]
Introduction
The concept of unloading the affected
compartment by bracing aims to correct
the mechanical axis deviation. American
Academy of Orthopaedic Surgeons (1999)
classified knee braces into prophylactic,
functional and rehabilitative categories.
According to Burger (1995) the
prophylactic knee braces protect or reduce
severity of knee injuries from valgus stress
to protect medial collateral ligaments.
Wojtys (1996) identified that functional
knee brace provide stability for
ligamentous knees instability and control
some degree of external knee rotation &
AP joint translation. Rehabilitative braces
allow protected & controlled movements
in injured knees. Patello-femoral braces
improve patellar tracking moderately and
thereby relieve anterior knee pain (Maurer
et al, 1995; Paluska & McKeag, 2000).
They also found that unloader / offloader
braces provide pain relief in osteoarthritis
(OA) knees.
Harrington (1983) study indicated that
varum deformity knees had a predictable
loading pattern or location of centre of
pressure than valgum deformity knees and
hence is easily compensated. The study
also found that valgus braces reduce
medial compartmental loading, pain and
improve the performance in subjects. The
Abstract
Objective: To assess the biomechanical impacts of open patella knee cap/sleeve and designed polycentric
off-loader knee brace on knee joint movement during gait in normal adult. Method: Quantitative
assessment for the pressure changes of strain gauges of muscles around the knee joint during normal gait
with & without knee cap & brace are recorded in MATLAB and further analyzed. Results: The
application of open patella knee cap reduces co-contractions in magnitude of lateral hamstring pair and
increases those of medial hamstring pair. Contrary to it when exposed to offloader valgus knee brace
same subjects had significantly vastus lateralis -lateral hamstring co-contractions greater in magnitude
than those of vastus Medialis-medial hamstring. Conclusion: The application of open patella knee
cap/sleeve without hinge joint and designed offloader knee brace attempt to redistribute the load laterally
or medially respectively as needed in context to demand in normal adult.
Key words: Offloader brace, Knee Sleeve, Strain gauge sensor, Muscular loading, Gait

Journal of Exercise Science and Physiotherapy, Vol. 10, No. 2: 87-96, 2014
Date of Communication: Aug. 07, 2014
Date of Acceptance: Aug. 18, 2014 SJIF IMPACT FACTOR 2013=4.65
88
little change in alignment shortens the
moment arm and hence lowers the external
adduction and varus moment. The
compressive load is shifted away from
medial compartment and thus redistributes
compressive load over joint surfaces. This
assists to alleviate mechanical stress on the
medial compartment of knee joint (Cole &
Harner, 1999).
In off loader/unloader brace, additional
valgus forces were generated by the
subjects’ muscles through the helical straps
of the brace from one anatomical plane to
another. This reaction forces on subjects
leg create a resistance in flexion plane and
significantly prevents full extension. The
restriction in flexion motion, unload
subjects’ medial compartment. Davidson
et al (1997) study showed that the dynamic
forces of the hinges in the brace contribute
to internal rotation of shank of tibia during
extension and external rotation during knee
flexion. In a similar study, it was observed
that dynamic straps of an unloader brace
shares the load at the knee joint. Pollo et al
(2002) study calculated using a
mathematical/computer model and
reported the decreased stress in the medial
knee compartment with an unloader brace.
The unloader brace improves knee
stability, decreases co-contraction of thigh
and leg muscles and relieves pain. It
reduces compressive forces across the joint
rather than direct compartment off-loading
(Ramsey et al, 2007). The off-load shelf
prophylactic knee braces provide 20-30%
greater knee ligament protection (Mortaza,
2012).
In the normal structural abnormalities
of genu varum or genu valgum, quadriceps
femoris muscle especially vastus medialis
oblique function is affected that limit
ability to provide dynamic postural
stability. According to Nyland (2002)
study patello-femoral pain is common in
those with extreme patellar tilt and lateral
shift &; Moller et al (1987) stated that
activation of vastus medialis obliqus is
delayed compare with other quadriceps
muscles and this reduces the lateral force
by 25% in patellar pain syndrome patient.
The muscle response in gastrocnemius,
hamstrings and quadriceps femoris are
slowed significantly after fatigue. In
physically demanding sports the muscle
fatigue is commonly seen to alter the
neuromuscular response to anterior tibial
translation. The average increase of 32.5%
in anterior tibial translation is seen after
fatigue (Wosjys et al 1996) & this affects
the dynamic stability of the knee. Thus,
fatigue plays important role in knee
injuries and its patho-mechanism.
Mediation of muscles for even
distribution of load across the joint is
needed for normal gait biomechanics
(Shakoor & Moisio, 2004). So, the
measurement of the muscle activation
pattern and dynamic joint loading patterns
helps to evaluate the extent of abnormal
joint loading and alterations in the
neuromuscular system in OA knee subjects
(Childs et al, 2004).
The neuromuscular system is not
effectively challenged in static positions
compared to dynamic condition during the
activities of daily living and sports.
Majority of dynamic sport activities
precisely assess single limb activities as
landing force movement. The different
studies (Colby et al, 1999; Webster &
Gibble, 2010 &; Yayaei-Rad et al, 2013)
showed that during dynamic task the genu-
varum increases dynamic postural stability
index and decreases the dynamic balance.
Moreover strength, stability and balance

The Impact of Open Patella Knee Cap and Designed Off-Loader Valgus Knee Brace on Muscle Activity Patterns and
Joint Loading during Walk In Normal Adult – A Pilot Study – Singh et al
Date of Communication: Aug. 07, 2014
Date of Acceptance: Aug. 18, 2014 SJIF IMPACT FACTOR 2013=4.65
89
are essential for protection and prevention
of joint health.
During normal ambulation the force
transmitted on the medial and lateral
compartments of the knee is different.
Kuroyangi et al (2007) study indicates that
the loads on the medial compartment are
2.5 times more than the lateral
compartment of the knee. There are more
other studies indicating the similar
concept. Also, the study found that the
healthy subjects transmit 71% to 91% of
total knee force through tibio-femoral
compartment compared to 100% in OA.
Thus, force augmentation may be a
contributing factor in the development of
knee OA (Esrafilian et al, 2012).
Published studies on the use of knee
braces in OA, report biomechanical
outcomes relating changes in the joint
movement and posture, however a few
reporting patient-derived outcomes. In
summary, unloading braces may be a valid
option for selected patients.
Materials & Method
The subjects were asked to walk on a
level surface with and without open patella
knee cap and offloader valgus knee brace
to investigate the influence of orthosis on
the knee alignment. Ethical approval was
taken from Institute Ethical Committee,
Banaras Hindu University before starting
the data collection. The subjects were
asked to sign a consent form and were
familiarized with the study procedure.
Thirty active normal adult males
participated in the pilot study. Normal
male Subjects demographics are provided
as (Age‚ 24.73±1.85 yrs; Height‚
169.66±3.97 cm; Weight‚ 66.07±2.89 kg
and BMI, 23.08±0.74) based on their
grouped knee alignment‚ normal knee
(n=14) ‚ genu varum (n=10) and genu
valgum (n=6). The knee angle was
measured using a goniometry.
Exclusion criteria of study were sport
injury/traumatic knee, inflammatory
arthritis and metabolic disorders; along
with any vestibular, proprioceptive or
visual impairment.
Each subject was exposed to two
interventions: (1st) Open patella knee cap
and (2nd) Designed polycentric knee brace.
Assessment variables have been six
muscles around the knee joint (see data
collection procedure below).
Our designed polycentric unloader
knee brace had a modular structure to
change the alignment based on the
patient’s need and could reduce the
pressure at knee joint, which could be
corrected to 100 valgus and more according
to the need. Steel alloy was used instead of
regular aluminum material, so that if
molding is needed subject can correct
according to abduction/ adduction pressure
changes. This helped to have subject
franchise custom made orthosis as tailor
made one and does not have to wait for an
orthotic’s to rectify it.
Data collection procedure:
The muscular loading was assessed
using strain guage sensor; with and without
knee sleeve and offloader valgus knee
brace of specific muscles viz. vastus-
medialis (VM), vastus-lateralis (VL),
semi-membranosus/ tendinosus (SS/ST),
bicep femoris (BF), gastro-soleus (GS) and
tibialis anterior (TA) muscles in a three
minutes level walk.
Mechanical design incorporated a
spring steel strip of length 10cm x 1cm to
which strain gauges were fixed and the tip
of strip acted as a mechanical pressure
transducer to transfer the muscular loading
to the system. The pressure changes of

Journal of Exercise Science and Physiotherapy, Vol. 10, No. 2: 87-96, 2014
Date of Communication: Aug. 07, 2014
Date of Acceptance: Aug. 18, 2014 SJIF IMPACT FACTOR 2013=4.65
90
strain gauges in volts were captured by the
differential amplifiers, which were then
fed to the ADC (Analogue digital
convertor) of the PIC 18F4550
microcontroller. It was finally transferred
to the system via USB interface of
PIC18F4550. These digital values from
ADC’s were received by MATLAB. The
final signal processing was finally done in
MATLAB. These values were recorded
further and analyzed. (Data of Tables 1 &
2 shown as graph in Matlab (Figs.1 & 2) of
same patient respectively).
Table 1: Comparative data of specific muscles of an individual subject with and without knee sleeve Muscle variables With knee sleeve (mean in volts) Without knee sleeve (mean in volts)
Gasrocnemius-Soleus(GS) 11.06 9.81
Lateral Hamstrings (LH) 7.28 7.48
Medial Hamstrings (MH) 7.63 7.48
Vastus Laterals (VL) 4.38 4.50
Vastus Medialis (VM) 4.70 4.50
Tibialis Anterior (TA ) 1.30 1.31
Figure 1: Comparative picture of specific muscles of an individual subject with and without knee sleeve
Table 2: Comparative data of specific muscles of same subject with and without off-loader knee brace Muscle variables With knee Brace (mean in volts) Without knee brace (mean in volts)
Gasrocnemius-Soleus (GS) 11.63 10.42
Lateral Hamstrings (LH) 7.16 7.50
Medial Hamstrings (MH) 7.86 7.51

The Impact of Open Patella Knee Cap and Designed Off-Loader Valgus Knee Brace on Muscle Activity Patterns and
Joint Loading during Walk In Normal Adult – A Pilot Study – Singh et al
Date of Communication: Aug. 07, 2014
Date of Acceptance: Aug. 18, 2014 SJIF IMPACT FACTOR 2013=4.65
91
Vastus Laterals (VL) 4.27 4.50
Vastus Medialis (VM) 4.71 4.50
Tibialis Anterior (TA ) 1.04 1.06
Figure 2: Comparative picture of specific muscles of same subject with and without off-loader knee brace
Table 3: Comparative efficacy of knee sleeve and valgus knee brace among loading muscles around the knee joint of
normal adults (in volts)
Loading Muscles With open
patella
knee cap
(A)
(mean±SD)
Without knee
cap (A1)
(mean±SD)
Paired T-
test (A-
A1)
With
valgus
knee Brace
(B)
(mean±SD)
Without
Brace (B1)
(mean±SD)
Paired T-
test (B-
B1)
Gasrocnemius (GS) 11.02 ±0.45 9.98 ±0.14 *15.76 11.30±0.25 10.04 ±0.09 *35.21
Lateral Hamstrings,
(LH)
7.23 ±0.10 7.50 ±0.03 -*16.26 7.50±0.01 7.12 ±0.06 *40.69
Medial Hamstrings
(MH)
7.78±0.05 7.51±0.03 *26.85 7.50±0.02 7.90 ±0.06 -*41.11
Vastus Laterals (VL) 4.37±0.04 4.50±0.01 -*16.39 4.50±0.01 4.27 ±0.02 *58.98
Vastus Medialis (VM) 4.65±0.05 4.50±0.01 *16.52 4.50±0.01 4.73 ±0.02 -*52.50
Tibialis Anterior (TA ) 1.10±0.10 1.12±0.10 -*8.59 1.25±0.28 1.28 ±0.29 -*9.06
Note: Significance (2 tailed): *P<0.005
Table 4: Independent T-test of muscle variables with and without knee sleeve and valgus knee brace
Variables Group Mean ± SD T- test Significance
GSNB Knee sleeve 9.98±0.14
1.835 0.072 Knee valgus brace 10.04±0.09

Journal of Exercise Science and Physiotherapy, Vol. 10, No. 2: 87-96, 2014
Date of Communication: Aug. 07, 2014
Date of Acceptance: Aug. 18, 2014 SJIF IMPACT FACTOR 2013=4.65
92
GSB Knee sleeve 11.02±0.45 3.027 0.004
Knee valgus brace 11.30±0.25
LHNB Knee sleeve 7.50±0.03 34.135 0.000
Knee valgus brace 7.12±0.06
LHB Knee sleeve 7.23±0.10 15.369 0.000
Knee valgus brace 7.50±0.01
MHNB Knee sleeve 7.51±0.03 34.656 0.000
Knee valgus brace 7.90±0.06
MHB Knee sleeve 7.78±0.05 26.430 0.000
Knee valgus brace 7.50±0.02
VLNB Knee sleeve 4.50±0.01 60.685 0.000
Knee valgus brace 4.27±0.02
VLB Knee sleeve 4.37±0.04 18.205 0.000
Knee valgus brace 4.50±0.01
VMNB Knee sleeve 4.50±0.01 50.238 0.000
Knee valgus brace 4.73±0.02
VMB Knee sleeve 4.65±0.05 15.968 0.000
Knee valgus brace 4.50±0.01
TANB Knee sleeve 1.12±0.10 2.798 0.007
Knee valgus brace 1.28±0.29
TAB Knee sleeve 1.10±0.10 2.763 0.008
Knee valgus brace 1.25±0.28
Note: NB (no brace); B (brace)
Data decoding and Statistical analysis:
MATLAB (ver. 6.1, Math Works Inc.) was
used to process data. Data was organized
in Excel sheet (2002, Microsoft Corp.) and
the statistics were conducted using SPSS
(ver. 16.0, SPSS Inc.). A paired T-test was
done to examine the difference between
the mean values of muscular loading
between without and with bracing in
normal adults. A significance level of <
0.05 was considered for this analysis.
Independent T- test was also done to
examine the efficacy of open patella knee
cap and offloader valgus knee brace.
Comparative efficacy of knee sleeve and
valgus knee brace among loading muscles
around the knee joint of normal adults (in
volts) is presented in Table-3. The
application of knee sleeve in the study
revealed GS, MH and VM increased while
LH, VL and TA decreased. Thus, VL-
lateral hamstring co-contractions were
lesser in magnitude than those of VM-
medial hamstring pair. This represents an
attempt to redistribute the load medially (A
& A1). On the contrary the application of
offloader knee brace revealed that GS, LH
and VL increased while MH, VM and TA
decreased. Thus, the study indicates that
vastus medialis-medial hamstring co-
contraction was found to be of lesser in
magnitude than those of vastus lateralis-
lateral hamstring pair. It improvises
loading on medial compartment of knee (B
& B1). A paired t test indicates 2 tailed
significance of each 6 variables with and
without knee brace/ cap at P<0.005 level.
Independent t-test of different
variables between two interventions i.e.
knee sleeve and offloader valgus knee
brace (with and without) was found to be
highly significant except values of
Gastrocnemius without knee sleeve and
brace which have been insignificant (Table
4).
Discussion
A few researchers have assessed the
effect of brace on muscle activity. The
evidence suggested that off-loading braces
may influence antagonist muscle co-

The Impact of Open Patella Knee Cap and Designed Off-Loader Valgus Knee Brace on Muscle Activity Patterns and
Joint Loading during Walk In Normal Adult – A Pilot Study – Singh et al
Date of Communication: Aug. 07, 2014
Date of Acceptance: Aug. 18, 2014 SJIF IMPACT FACTOR 2013=4.65
93
contractions. In the study by Ramsey et al
(2007), sixteen subjects with radiographic
evidence of knee malalignment and medial
compartment OA were recruited and fitted
with a custom Generation II unloader
brace, found that VL-lateral hamstring co-
contractions were greater in magnitude
than those of VM-medial hamstring. Also,
Andriacchi (1994) & Schipplein et al
(1991) studies stated that the VL greater
contraction attempt to redistribute the load
laterally. In Ramsey et al (2007) study,
during neutral and valgus brace settings the
co-contraction of VL-lateral hamstrings
was reported to be significantly reduced
from baseline in both the neutral (p =
0.014) and valgus conditions (p = 0.023);
which resulted in decreased joint
compression. In the present study, the
subjects being non impaired adults, VL-
lateral hamstring co-contractions were
lesser in magnitude than those of VM-
medial hamstring. Though the difference
of both pairing being meager; the
application of open patella knee sleeve
may represent an attempt to redistribute the
load medially and reflective of more
stability and strength. This is in
consistency with the findings of Maurer et
al (1995). In the present study, the same
subjects when exposed to offloader valgus
knee brace had VL-lateral hamstring co-
contractions greater in magnitude than
those of VM-medial hamstring. This
expresses an effort to re-distribute loading
on the medial compartment of the knee. It
will help to protect genu varum aligned
normal adults as prophylactic measure and
can be advocated for medial compartment
OA knee persons. This study is an attempt
to investigate clinical application of knee
braces as indicated in a study by Hinmann
et al (2007) which reveals that knee braces
that realign knee joint in varus (our result
of open patella knee brace) are opposed to
those that realign in valgus direction
(offloader knee brace). This is the main
consistent to this study.
Polycentric offloader knee brace
designed by us is 50-100 valgus and hence
influence moment applied on the knee joint
i.e. the magnitude of the medio-lateral
force and moment arm. The resultant
adduction moment applied on the knee
joint decreases significantly, as that in the
study by Esrafiliaan et al (2012). Few
researchers (Beynnon, 1992; Ott & Clancy,
1993; Wojtys, 1996) observed that
unloader brace compensate a portion of
external load and AP joint rendition.
Improvement in the medio-lateral force
and the knee joint alignment decreased
following use of the knee orthosis is
important finding of this study. Divine &
Hewett (2005) also informed that orthosis
improve the knee stability in knee OA
patient. However, Niyousha et al (2013) &
Singer (2008) studies found that the
examined functional knee brace/ sleeves
had no significant effect on the knee
muscle performance. Beaudreui et al
(2009) study revealed that flexion and
extension torques of knee and other joints
of the lower limb were not significantly
different between brace and non-braced
conditions. In addition to this, there were
no statistically significant differences
between the brace and sleeve. They also,
reported that knee sleeves decreases pain
but can’t be effective for knee disability.
Pollo et al (2002) using strain gauges
and buckle transducers affixed on the
custom braces in 4-80 valgus setting on
eleven patients using three-dimensional
gait analysis & reported the compressive
load reduction in the medial compartment

Journal of Exercise Science and Physiotherapy, Vol. 10, No. 2: 87-96, 2014
Date of Communication: Aug. 07, 2014
Date of Acceptance: Aug. 18, 2014 SJIF IMPACT FACTOR 2013=4.65
94
significantly by as much as 20% at 80
adjusting valgus angulation from normal 40
to 80. Even normal 4° valgus alignment via
the adjustable hinge reduces medial
compartment load than increasing tension
of straps. Measurement of medial
compartment load reduction has been
estimated indirectly. The net varus
moments were reduced using valgus brace
by 11% (7.1 N-m) and load reduction was
17% on the medial side during stance
phase of the gait in normal 40 valgus
setting. The mean maximum value of the
orthotic valgus moment was 0.053 Nm/kg,
which represents approximately 10% of
the external genu varus moment without
the brace. This outcome may explain the
pain relief reported by patients using such
braces in clinical studies.
Anderson et al (2003) study using
pressure transducer inserted on the medial
compartment of OA knee of 11 subjects
measured unloading during walk using
valgus unloader knee brace but could not
found unloading although there were large
variations in force output, as a
consequence of transducer shifted
position.
Studies on the knee brace suggest full
benefits are achieved between 1-2 months
and doubtful beyond 6months. Matsuno et
al (1997) recommended knee bracing up to
12months for subjects awaiting knee
surgery and those with pharmacological
risks.
Conclusion: The results of this study,
suggest that knee sleeve may redistribute
the load medially while polycentric
offloader knee brace laterally thus, provide
unloading knee in frontal plane and may
decrease or increase respectively dynamic
balance during sport activity as needed in
context to demand in normal adult. The
subjects without it might be at risk of
injury during sport activity due to the
reduced balance deficit.
The offloader valgus knee brace will
help to protect genu varum aligned normal
adults while knee sleeve will provide
support to genu valgum and sport persons.
The selected prophylactic brace in this
study significantly inhibit athletic
performance which might verify that their
structure and design have caused limitation
in the normal function of the knee joint but
for a trance phase and enhance capability
for better sports. The biomechanical
indication and limitation of the off loader
knee brace should be confirmed by a larger
study as prophylactic measure and can be
advocated for medial compartment OA
knee persons.
Limitation of this study was that we
have only assessed the effects of knee
sleeve and offloader valgus brace on the
knee joint load bearing function in normal
adults. Further studies with off loader
brace may be helpful to investigate the
interaction and compensation of the knee
joint during aging process and age related
compensation in larger study group.
Better insights into normal and
abnormal joint mechanics will continue to
play a critical role in improved orthotic
therapy and conservative treatment
modalities more effective in the near future
for prolonging the life of the natural knee
joint.
Acknowledgement: We acknowledge for
contribution of Mr. Pradeep Kumar (Prosthetist
and Orthotist ALIMCO, Kanpur) for designing
polycentric off-loader knee brace; Banaras
Hindu University faculties Dr. Neeraj Sharma
(Associate Professor, School of Biomedical
Engineering, IIT) for guiding selection of
sensor, Dr. P K Mukherjee (Associate
Professor, Dept. of Electronics Engg) for

The Impact of Open Patella Knee Cap and Designed Off-Loader Valgus Knee Brace on Muscle Activity Patterns and
Joint Loading during Walk In Normal Adult – A Pilot Study – Singh et al
Date of Communication: Aug. 07, 2014
Date of Acceptance: Aug. 18, 2014 SJIF IMPACT FACTOR 2013=4.65
95
designing electronic equipment for qualitative
assessment and Prof. T.B. Singh (Dept. of
Preventive and Social Medicine) for statistic
support in the study.
References Anderson, I.A., MacDiarmid, A.A, Lance Harris,
M., Gillies R. M., Phelps, R.and Walsh, W.R.
2003. A novel method for measuring medial
compartment pressures within the knee joint in-
vivo. Journal of Biomechanics, 36(9): 1391-
1395.
Andriacchi, T.P. 1994. Dynamics of knee
malalignment. Orthopedics Clinic North
America, 25(3): 395-403.
Beaudreuil, J., Bendaya, S., Faucher, M., Coudeyre,
E., Ribinik, P., Revel, M. and Rannou, F. 2009.
Clinical practice guidelines for rest orthosis,
knee sleeves, and unloading knee braces in knee
osteoarthritis. Joint Bone Spine. 76(6): 629-
636.
Beynnon, B.D., Johnson, R.J., Fleming, B.C. and
Peura, G.D. 1997. The effect of functional knee
bracing on the anterior cruciate ligament in the
weight bearing and non weight bearing knee:
The American Journal of Sport Medicine,
25(3): 353-357.
Burger, R.R., Baker, C.L., Flandry, F. and
Henderson, J.M. 1995. Knee braces: The
Hughston Clinic sports medicine. Baltimore:
Williams & Wilkins press. pp. 551-558.
Chester, R., Smith, S. and Wood D. 2008. The
relative timing of VMO and VL in the aetiology
of anterior knee pain: a systematic review and
meta-analysis. BMC Musculoskeletal
Disorders. 9: 64-66.
Childs, J.D., Sparto, P.J., Fitzgerald, G.K., Bizzini,
M. and Irrgang, J.J. 2004. Alterations in lower
extremity movement and muscle activation
patterns in individuals with knee osteoarthritis.
Clinical Biomechanics, 19: 44–49.
Cole, B.J. and Harner, C.D.1999. Degenerative
arthritis of the knee in active patients:
evaluation and management. Journal of
American Academy of Orthopedic Surgery,
7(6): 389-402.
Colby‚ S.M.‚ Hintermeister‚ R.A.‚ Torry‚ M.R. and
Steadman‚ J.R. 1999. Lower limb stability
with ACL impairment. Journal of Orthopedic
Sports and Physical Therapy‚ 29(8): 444-454.
Davidson, P.L., Sanderson, D.J. and Loomer, R.L.
1998. Kinematics of valgus bracing for medial
gonoarthrosis: technical report. Clinical
Biomechanics, 13: 414-419.
Divine, J.G. and Hewett, T.E. 2005 Valgus bracing
for degenerative knee osteoarthritis: relieving
pain, improving gait, and increasing activity.
Physician and SportsmedicineYear, 33:240-
245.
Esrafilian, A., Karimi, M.T, and Eshraghi, A. 2012.
Design and evaluation of a new type of knee
orthosis to align the mediolateral angle of the
knee joint with osteoarthritis: open-access.
Advance in orthopedics Article ID 104927.
Cited from: www.hindawi.com/journals/aorth/2012/104927
Harrington, I. J. 1983. Static and dynamic loading
patterns in knee joint with deformities. The
Journal of Bone and Surgery, 65(2A): 259-274.
Hinman, R. S. and Crossley, K. M. 2007.
Patellofemoral joint osteoarthritis: an important
subgroup of knee osteoarthritis. Rheumatology.
46:1057–1062.
Kraus‚ B. V.‚ Vail‚ T.P. and Mc Daiel, G. 2005. A
comparative assessment of alignment angle of
the knee by radiographic and physical
examination methods. Arthritis and
Rheumatism‚ 52(6):1730-1735.
Kuroyanagi, Y., Nagura, T., Matsumoto, H., Otani,
T., Suda, Y., Nakamura, T. and Toyama, Y.
2007. The lateral wedged insole with subtalar
strapping significantly reduces dynamic knee
load in the medial compartment: Gait analysis
on patients with medial knee osteoarthritis,
Osteoarthritis and Cartilage, 15 (8): 932–936.
Levine, H.B. and Bosco, J.A. 2007. Sagittal and
coronal biomechanics of the knee. Bulletin of
the NYU Hospital for Joint Diseases, 65(1): 87-
95.
Matsuno, H., Kadowaki, K.M. and Tsuji, H. 1997.
Generation II knee bracing for severe medial
compartment osteoarthritis of the knee.
Archives of Physical Medicine and
Rehabilitation, 78(7): 745-749.
Maurer, S.S., Carlin, G., Butters, R. and Scuderi, G.
1995. Rehabilitation of the patellofemoral joint.
In: ScuderiGR, ed. The patella. New York:
Springer-Verlag, pp: 156–159.
Moller, B.N., Jurik, A.G., Tidemand-Dal, C., Krebs,
B. and Aaris, K. 1987. The quadriceps function
in patellofemoral disorders. A radiographic and
electro-myographic study. Archive for
Orthopaeidic Trauma Surgery. 106(3): 195-
198.
Journal of Exercise Science and Physiotherapy, Vol. 10, No. 2: 87-96, 2014
Date of Communication: Aug. 07, 2014
Date of Acceptance: Aug. 18, 2014 SJIF IMPACT FACTOR 2013=4.65
96
Mortaza, N., Ebrahimi, I., Jamshidi, A.A., Abdollah,
V., Kamali, M., Abas, W.A.B.W. and Osman,
N.A.A. 2012. The Effects of a Prophylactic
Knee Brace and Two Neoprene Knee Sleeves
on the Performance of Healthy Athletes: A
Crossover Randomized Controlled Trial .Open
Access .PLOS/ one, 2012
Niyousha Mortaza ,Noor Azuan Abu Osman, Ali
Ashraf Jamshidi, Javad Razjouyan : Influence
of Functional Knee Bracing on the Isokinetic
and Functional Tests of Anterior Cruciate
Ligament Deficient Patients. Open Access
Peer-Reviewed. Cited from http://www.plosone.org/article/fetchObject.action?ur
i=info%3Adoi%2F10.1371%2Fjournal.pone.006430
8&representation=PDF on 28/03/14.
Nyland‚ J., Smith‚ S.‚ Beickman‚ K. and Armsey‚
T. 2002. Frontal plane knee angle affects
dynamic postural control strategy during
unilateral stance. Medicine and Science in
sport and Exercise‚ 34(7): 1150-1157.
Ott, j. and Clancy, W. 1993. Functional knee braces.
Orthopaedics. 16:171-176.
Paluska, S. A. and Mckeag, D. B. 2000. Knee
Braces: Current Evidence and Clinical
Recommendations for Their Use. American
Family Physician. 61(2): 411-418.
Pollo, F.E., Otis, J.C., Backus, S.I., Warren, R.F. and
Wickiewicz, T.L. 2002. Reduction of medial
compartment loads with valgus bracing of the
osteoarthritic knee. American Journal of Sports
Medicine. 30(3):414-421.
Ramsey, D.K., Briem, K., Axe, M.J., Snyder-
Mackler, L. 2007. A mechanical theory for the
effectiveness of bracing for medial
compartment osteoarthritis of the knee. Journal
of Bone Joint Surgery America. 89(11): 2398-
2407.
Ramsey, D. K., and. Russell, M. E. 2009. Unloader
Braces for Medial Compartment Knee
Osteoarthritis Implications on Mediating
Progression. Sports Health, 1(5): 416–426.
Reilly, D.T. and Martens, M.1972. Experimental
analysis of the quadriceps muscle force and
patellofemoral joint reaction forces for various
activities. Acta Orthopaedic, 43: 126-137.
Schipplein, O.D. and Andriacchi, TP.
1991. Interaction between active and passive
knee stabilizers during level walking. Journal
of Orthopaedic Research, 9(1): 113-119.
Shakoor, N. and Moisio, K. 2004. A biomechanical
approach to musculoskeletal disease. Best
Practical Research for Clinical Rheumatology,
18(2): 173-186.
Sharma, L., Song, J., Felson, D.T., Cahue,
S., Shamiyeh, E. and Dunlop, D.D. 2001. The
role of knee alignment in disease progression
and functional decline in knee osteoarthritis.
Journal of American Medical Association,
286(2): 188-195.
Singer, J.C., Lamontagne, M. 2008. The effect of
functional knee brace design and hinge
misalignment on lower limb joint mechanics.
Clinical Biomechanics, 23: 52–59.
The use of knee braces (1999) American Academy of
Orthopaedic Surgeons. (Document number
1124)Retrieved November 24 cited from: www.AAOS.org/ wordhtml/ papers/ position/ kneebr.htm.
Vincent, .K.R., Conrad, B,P., Fregly, B.J. and
Vincent, H.K. 2012. The Pathophysiology of
Osteoarthritis. A Mechanical Perspective on the
Knee Joint, 4(50): S3–S9.
Webster‚ K., and Gribble‚ P.A 2010. Time to
stabilization of anterior cruciate ligament
reconstructed versus healthy knees in
national colligate athletic association division
I female athletes. Journal of Athletics Training‚
45(6): 580-585.
Wojtys, E.M., Wylie, B.B. and Huston, L.J. 1996.
The Effects of Muscle Fatigue on
Neuromuscular Function and Anterior Tibial
Translation in Healthy Knees. American
Journal of Sports Medicine.24(5):615-621.
Yayaei-Rad, M., Norasteh, A. A., Shamsi, A. and
Sanjari, M.A. 2013. The comparison of postural
stability in different knee alignment. Journal of
Basic Applied Science, 3(7): 322-326.
Conflict of Interest: None declared.

A Study of Anaerobic Power and Capacity of Football Players – Kumar, Ashok & Singh, Gurwinder
Date of Communication: Aug. 13, 2014
Date of Acceptance: Aug. 22, 2014 SJIF IMPACT FACTOR 2013=4.65
97
A Study of Anaerobic Power and Capacity of Football Players
Kumar1, Ashok and Singh2, Gurwinder 1Assistant Professor, Department of Sports Science, Punjabi University Patiala-147001, (Punjab), India.
Email: [email protected]. 2PG Student, Department of Sports Science, Punjabi University Patiala-147001, (Punjab), India
Introduction
However, often we think of football as
a chiefly aerobic sport but in reality, it is
the contrary (Derek Arsenault, 2007).
When the sport of football activity is
critically analysed, it can be understood
that the game is played by the players
performing at varying speeds and
intensities; jogging, walking and sprinting.
The greater part of play is in intervals and
the motion does not last for long periods of
time (e.g. chasing a lose ball, making a run
into space etc.). This is the most significant
factor to consider when doing football
conditioning. There certainly is a need for
aerobic conditioning as well, due to the
fact that the intervals mentioned are
repeated at various intensities and
durations over the course of a ninety
minute match. On the other hand, because
of the nature of the sport, anaerobic
conditioning should take up the majority of
the cardiovascular conditioning (Derek
Arsenault, 2007). The high level of the
anaerobic capacities in football players
enable them to carry out high-speed runs,
which in the end may have a very
important impact on match results
(Luhtanen, 1994). Elite football players are
capable of performing more high-intensity
running than moderate professional
football players. The players spend 1–11%
of the game sprinting (Bangsbo et al.,
1991; Bangsbo 1992), which represents
0.5–3.0% of effective time with ball in
Abstract
The purpose of this study was to observe and report anaerobic power and capacity of football
players. The design of this study required participants to perform six sprints each of 35 meter. Thirty
six (N=36) male football players between the ages of 17 and 28 years volunteered for this study.
The mean age, height and weight of football players was 21±2year, 172±6.81cm and 67.50±9.94Kg
respectively. The mean sprint time of 1st,2nd,3rd,4th,5th and 6th sprint of football players was
5.50±0.39 seconds, 5.50±0.55 seconds, 5.57±0.56 seconds, 5.78±0.55 seconds, 5.83±0.59 seconds
and 5.88±0.62 seconds respectively. The mean power generated during the 1st,2nd,3rd,4th,5th and 6th
sprints by football players was 506.94±119.65 watts, 522.58±165.63 watts, 490.64±134.88 watts,
443.72±137.38 watts, 438.17±132.76 watts and 422.22±130.16 watts respectively. The maximum
power, minimum power, average power and fatigue index of football players was
579.94±147.78watts, 376.00±111.66watts, 470.78±114.76watts and 6.00±3.45 respectively. It was
concluded from the results of this study that sprint time increased, power declined with a high fatigue
index, the football players may need to focus on improving lactate tolerance and this could be a
focus of their training programme.
Key Words: Sprint time, Power, Anaerobic, Fatigue index

Journal of Exercise Science and Physiotherapy, Vol. 10. 2:97-102, 2014
Date of Communication: Aug. 13, 2014
Date of Acceptance: Aug. 22, 2014 SJIF IMPACT FACTOR 2013=4.65
98
play (Bangsbo, 1992; O’Donoghue, 2001).
For this reason, it is very important to
incorporate anaerobic training into overall
conditioning training protocols. Because
the repeated sprint ability field tests show
high reliability and validity (Metaxas et al.,
2005; Psotta et al., 2005), high
reproducibility, and sensitivity (Krustrup
et al., 2003), they may represent a valid
measure of anaerobic football
performance. Sprint running times have
been shown to be well correlated to peak
and mean power output (Patton &
Duggan, 1987; Tharp et al., 1985). The
purpose of this study was to report the
anaerobic power and capacity (i.e. speed,
power and fatigue index) of Punjabi
football players.
Materials and Methods:
Thirty six (N=36) male Punjabi
football players between the age of 17 and
28 years volunteered for this study and
each participant was required to perform
six sprints each of 35 meter. A rest of 10
second was given to the participants
between each sprint. Draper and Whyte
(1997) developed the Running-based
Anaerobic Sprint Test (RAST) to test a
runner's anaerobic performance. RAST
provides researchers/coaches with
measurements on peak power, average
power and minimum power along with a
fatigue index. Participants were refrained
from participating in any heavy physical
activity (except activity of daily living)
within 24 hours of the testing day. Little
effort has been made in the literature to
evaluate the effects of the training of sprint
style in male football players. Hence, due
to the lack of referring literature, this study
utilized only male football players as
participants. Table 1 shows the number
and percent distribution of football players
according to their playing positions in the
present study. As per the playing positions
of the football players, 44.4% (N=16) were
back, 27.8% (N=10) forward, 25% (N=9)
center and 2.8% (N=1) goalkeeper.
Table 1: Sample composition with respect to the
playing position of footballers
Playing Position N Percentage
Forward 10 27.8
Centre 9 25.0
Back 16 44.4
Goalkeeper 1 2.8
Total 36 100.0
Statistical Analysis: Statistical analysis
was performed with SPSS version 16.0
(free trial, SPSS Inc, Chicago). Results are
shown as Mean and Standard Deviation.
The alpha level for the data analysis was
determined at p<0.05.
Results & Discussion
Thirty six healthy male football
players (mean age 21± 2year) from Mata
Gujri College, Sri Fatehgarh Sahib
(Punjab) participated in the study. The
mean height and weight of thirty six
football players was 172.00±6.81 cm and
67.50±9.94Kg respectively (Table 2). The
mean values of the time of -1st, 2nd, 3rd, 4th,
5th & 6th sprints of football players was
5.50±0.39 seconds, 5.50±0.55 seconds,
5.57±0.56 seconds, 5.78±0.55 seconds,
5.83±0.59 seconds and 5.88 ±0.62 seconds
respectively (Table 2). From the six sprint
times of 35 m sprint each, the power for
each sprint run was calculated and then
maximum power (highest value),
minimum power (lowest value) and
average power (sum of all six values ÷ 6)
were determined The power was
calculated using the equation: Power =
Weight × Distance² ÷ Time³ (Draper and
Whyte, 1997). The mean values of power
of the -1st, 2nd, 3rd, 4th, 5th & 6th sprints in
case of football players was
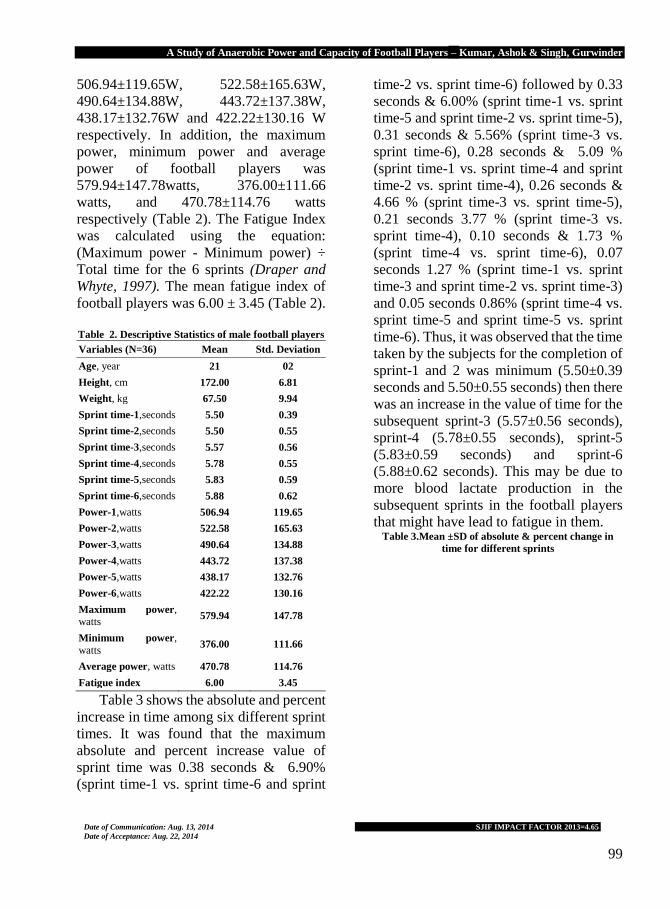
A Study of Anaerobic Power and Capacity of Football Players – Kumar, Ashok & Singh, Gurwinder
Date of Communication: Aug. 13, 2014
Date of Acceptance: Aug. 22, 2014 SJIF IMPACT FACTOR 2013=4.65
99
506.94±119.65W, 522.58±165.63W,
490.64±134.88W, 443.72±137.38W,
438.17±132.76W and 422.22±130.16 W
respectively. In addition, the maximum
power, minimum power and average
power of football players was
579.94±147.78watts, 376.00±111.66
watts, and 470.78±114.76 watts
respectively (Table 2). The Fatigue Index
was calculated using the equation:
(Maximum power - Minimum power) ÷
Total time for the 6 sprints (Draper and
Whyte, 1997). The mean fatigue index of
football players was 6.00 ± 3.45 (Table 2).
Table 2. Descriptive Statistics of male football players
Variables (N=36) Mean Std. Deviation
Age, year 21 02
Height, cm 172.00 6.81
Weight, kg 67.50 9.94
Sprint time-1,seconds 5.50 0.39
Sprint time-2,seconds 5.50 0.55
Sprint time-3,seconds 5.57 0.56
Sprint time-4,seconds 5.78 0.55
Sprint time-5,seconds 5.83 0.59
Sprint time-6,seconds 5.88 0.62
Power-1,watts 506.94 119.65
Power-2,watts 522.58 165.63
Power-3,watts 490.64 134.88
Power-4,watts 443.72 137.38
Power-5,watts 438.17 132.76
Power-6,watts 422.22 130.16
Maximum power, watts
579.94 147.78
Minimum power,
watts 376.00 111.66
Average power, watts 470.78 114.76
Fatigue index 6.00 3.45
Table 3 shows the absolute and percent
increase in time among six different sprint
times. It was found that the maximum
absolute and percent increase value of
sprint time was 0.38 seconds & 6.90%
(sprint time-1 vs. sprint time-6 and sprint
time-2 vs. sprint time-6) followed by 0.33
seconds & 6.00% (sprint time-1 vs. sprint
time-5 and sprint time-2 vs. sprint time-5),
0.31 seconds & 5.56% (sprint time-3 vs.
sprint time-6), 0.28 seconds & 5.09 %
(sprint time-1 vs. sprint time-4 and sprint
time-2 vs. sprint time-4), 0.26 seconds &
4.66 % (sprint time-3 vs. sprint time-5),
0.21 seconds 3.77 % (sprint time-3 vs.
sprint time-4), 0.10 seconds & 1.73 %
(sprint time-4 vs. sprint time-6), 0.07
seconds 1.27 % (sprint time-1 vs. sprint
time-3 and sprint time-2 vs. sprint time-3)
and 0.05 seconds 0.86% (sprint time-4 vs.
sprint time-5 and sprint time-5 vs. sprint
time-6). Thus, it was observed that the time
taken by the subjects for the completion of
sprint-1 and 2 was minimum (5.50±0.39
seconds and 5.50±0.55 seconds) then there
was an increase in the value of time for the
subsequent sprint-3 (5.57±0.56 seconds),
sprint-4 (5.78±0.55 seconds), sprint-5
(5.83±0.59 seconds) and sprint-6
(5.88±0.62 seconds). This may be due to
more blood lactate production in the
subsequent sprints in the football players
that might have lead to fatigue in them. Table 3.Mean ±SD of absolute & percent change in
time for different sprints

Journal of Exercise Science and Physiotherapy, Vol. 10. 2:97-102, 2014
Date of Communication: Aug. 13, 2014
Date of Acceptance: Aug. 22, 2014 SJIF IMPACT FACTOR 2013=4.65
100
Variables Mean±SD Absolute %percent
Sprint time-1
vs. time-2
5.50±0.39 vs.
5.50±0.55 0.00
0.00
Sprint time-1
vs. time-3 5.57±0.56
0.07 1.27
Sprint time-1
vs. time-4 5.78±0.55
0.28 5.09
Sprint time-1
vs. time-5 5.83±0.59
0.33 6.00
Sprint time-1 vs. time-6
5.88±0.62 0.38
6.90
Sprint time-2
vs. time-3
5.50±0.55 vs.
5.57±0.56 0.07
1.27
Sprint time-2 vs. time-4
5.78±0.55 0.28
5.09
Sprint time-2
vs. time-5 5.83±0.59
0.33 6.00
Sprint time-2
vs. time-6 5.88±0.62 0.38
6.90
Sprint time-3
vs. time-4
5.57±0.56
5.78±0.55 0.21
3.77
Sprint time-3
vs. time-5 5.83±0.59
0.26 4.66
Sprint time-3 vs. time-6
5.88±0.62 0.31
5.56
Sprint time-4
vs. time-5
5.78±0.55
5.83±0.59 0.05
0.86
Sprint time-4
vs. time-6 5.88±0.62 0.10
1.73
Sprint time-5
vs. time-6
5.83±0.59
5.88±0.62 0.05
0.85
Table 4. Mean ±SD of absolute & percent change in
Power for different sprints
Variables Mean±SD Absolute %percent
Power-1 vs.
Power-2
506.94±119.65 vs.
522.58±165.63 15.64
3.08
vs.
Power-3
490.64±134.88 -16.3
-3.21
vs.
Power-4
443.72±137.38 -63.22
-12.47
vs.
Power-5
438.17±132.76 -68.77
-13.56
vs.
Power-6
422.22±130.16 -84.72
-16.71
Power-2 vs.
Power-3
522.58±165.63 vs.
490.64±134.88 -31.94
-6.11
vs.
Power-4 vs.
443.72±137.38 -78.86
-15.09
vs.
Power-5 vs.
438.17±132.76 -84.41
-16.15
vs. Power-6
vs.
422.22±130.16 -100.36
-19.20
Power-3 vs.
Power-4
490.64±134.88 vs.
443.72±137.38 -46.92
-9.56
vs.
Power-5 vs.
438.17±132.76 -52.47
-10.69
vs. Power-6
vs.
422.22±130.16 -68.42
-13.94
Power-4 vs.
Power-5
443.72±137.38 vs.
438.17±132.76 -5.55
-1.25
vs.
Power-6 vs.
422.22±130.16 -21.5
-4.84
Power-5 vs.
Power-6
438.17±132.76 vs.
422.22±130.16 -15.95
-3.64
Table 4 shows absolute and percent
change in power for six different sprints of
football players. It was found that the
maximum absolute and percent increase
value of power was 15.64 watts & 3.08%
(Power-1 vs. Power-2). But it was found
that the maximum absolute and percent
decrease value of power was -100.36 watts
& -19.20% (Power-2 vs. Power-6)
followed by -84.72 watts & -16.71%
(Power-1 vs. Power-6), -84.41 watts & -
16.15% (Power-2 vs. Power-5), -78.86
watts & -15.09% (Power-2 vs. Power-4), -
68.77watts -13.56% (Power-1 vs. Power-
5), -68.42 watts & -13.94% (Power-3 vs.
Power-6), -52.47 watts & -10.69% (Power-
3 vs. Power-5), -46.92 watts & -9.56%

A Study of Anaerobic Power and Capacity of Football Players – Kumar, Ashok & Singh, Gurwinder
Date of Communication: Aug. 13, 2014
Date of Acceptance: Aug. 22, 2014 SJIF IMPACT FACTOR 2013=4.65
101
(Power-3 vs. Power-4), -31.94watts & -
6.11% (Power-2 vs. Power-4) -21.05watts
& -4.84% (Power-4 vs. Power-6), -
16.3watts & -3.21% (Power-1 vs. Power-
3), -15.95watts & -3.64% (Power-5 vs.
Power-6) and -5.55watts & -1.25%
(Power-4 vs. Power-5). Thus, it was
observed that the maximum value of power
was 522.58±165.63watts for power-2 (i.e.
during sprint-2) then there was a decrease
in the value of power for the sprints i.e.
power-1 (506.94±119.65watts), power-
3(490.64±134.88watts), power-4
(443.72±137.38 watts), power-
5(438.17±132.76 watts) and power-
6(422.22±130.16watts). This may be due
to more blood lactate production in the
subsequent sprints in the football players
that might have lead to fatigue in them.
The different repeated sprint ability
(RSA) tests which have been performed in
earlier studies involved 6x40 m sprints
departing every 30 s (Dawson et al., 1993).
These studies recorded mean performance
decrements of 5.6% and 5.3%,
respectively. The present study also
provides a comparable mean performance
decrement (i.e. sprint time) of 1.27%,
5.09%, 6.00% and 6.90% respectively. A
greater depletion of creatine phosphate
(CP) stores will be observed during a 40 m
sprint as compared with a 20 m sprint
(Hirvonen et al., 1987). During 6x40 m
sprints departing every 30 s, approximately
2-3s of additional sprinting is performed
for each sprint. This would be anticipated
to deplete the creatine phosphate stores
during each sprint to a greater extent than
the protocol used in the present study.
However, these previous repeated sprint
ability test protocols also provide an
additional 7- 8s of recovery. These longer
recovery periods may counteract the
additional 2-3s of sprinting and allow for
similar proportions of phosphagen
depletion and resynthesis when compared
with the sprint protocol used in this study.
For single high intensity efforts, of less
than 5-10s duration, the largest
contribution to the energy demands is
made by the phosphagen energy system
(Hirvonen et al., 1987; Tesch et al., 1989;
Gaitanos et al., 1993). Hirvonen et al.,
(1987) found runners of higher sprinting
ability were able to deplete a greater
proportion of creatine phosphate stores
when compared with runners of lower
sprinting ability. Other studies that have
used a repeated sprint protocol have also
revealed similar findings as observed in the
present study. Holmyard et al., (1988)
found individuals producing the highest
peak power output during repeated 6s
sprinting efforts on a non-motorized
treadmill had the greatest decreases in
mean power output. Consequently,
subjects who could produce higher peak
power outputs and better sprint times are
most likely able to do so due to their ability
to utilize a greater proportion of their
creatine phosphate stores. With short
recovery periods, these subjects would
have lower creatine phosphate stores prior
to the next sprint and are therefore likely to
fatigue more over a series of repeated
sprints. Balsom et al., (1992) have
observed no significant increase in plasma
hypoxanthine or uric acid concentrations
during a repeated sprint ability test
involving 40x 15 m sprints with 30 s
recovery. Sprinting time was also not
observed to vary much during these 40
sprints. An increase in these purines during
exercise would be indicative of a net
degradation of adenosine 5'-triphosphate
(ATP) in the muscle. Their finding

Journal of Exercise Science and Physiotherapy, Vol. 10. 2:97-102, 2014
Date of Communication: Aug. 13, 2014
Date of Acceptance: Aug. 22, 2014 SJIF IMPACT FACTOR 2013=4.65
102
suggests that the phosphagen system coped
with these energy demands and was
adequately resynthesised during the
recovery periods. The repeated sprint
ability protocol in the present study is
similar in sprint length and therefore likely
to rely predominantly on the phosphagen
system. The present study also involves
shorter recovery periods which are less
than the half life of creatine phosphate
resynthesis (Harris et al., 1976). The
creatine phosphate stores will not be
adequately replenished during the repeated
sprint ability test and a progressive decline
in creatine phosphate stores and a slowing
of the 35 m sprint times have ensued. Even
though anaerobic glycolysis provides a
significant contribution to the initial stages
of the sprint test, its contribution appears to
diminish over the latter stages of a repeated
sprint test. Gaitanos et al., (1993)
measured the change in muscle creatine
phosphate, ATP, lactate and pyruvate
during 10×6 s maximal sprints on a cycle
ergometer. They estimated that during the
first sprint, anaerobic glycolysis was
contributing approximately 50% to
anaerobic ATP production. However, by
the last sprint, anaerobic glycolysis was
only contributing approximately 20 % to
anaerobic ATP production. Based on these
findings, Gaitanos et al., (1993) also
suggested that it was likely aerobic
metabolism increased its contribution
during these last sprints. These studies
suggest that the phosphagen system is the
major anaerobic energy system during 3-5s
of maximal sprinting and its importance
appears to increase over the latter stages of
a series of repeated sprinting efforts.
Conclusion; It was concluded from the
results of this study that sprint time
increased, power declined with a high
fatigue index, the football players may
need to focus on improving lactate
tolerance and this could be a focus of their
training programme.
Acknowledgment: The authors thank all the
subjects who voluntarily participated in this study.
References Balsom, P., Seger, J., Sjodin, B. & Ekblom, B. 1992.
Physiological responses to maximal
intensity intermittent exercise. European
Journal of Applied Physiology 65: 144.
Bangsbo J., Graham T.E., Kiens B. and Saltin B.
1992. Elevated muscle glycogen and
anaerobic energy production during
exhaustive exercise in man. J. Physiol.,
451: 205–27.
Bangsbo, J., Nørregaard, L. and Thørøe, F. 1991.
Active profile of competition soccer.
Canad. J. Sport Sci., 16: 110–16.
Dawson, B., Fitzsimons, M. & Ward, D. 1993. The
relationship of repeated sprint ability to
aerobic power and performance measures
of anaerobic work capacity and power.
Australian Journal of Science and
Medicine in Sport, 25(4): 88-93.
Derek Arsenault. 2007. Soccer fitness training.
www.pponline.co.uk
Draper, N. and Whyte, G. 1997. Here's a new
running based test of anaerobic
performance for which you need only a
stopwatch and a calculator. Peak
Performance, 96, p. 3-5.
Gaitanos, G., Williams, C., Boobis, L. & Brooks, S.
1993. Human muscle metabolism during
intermittent maximal exercise. Journal of
Applied Physiology, 75(2): 712-719.
Harris, R., Edwards, R., Hultman, E., Nordesjo, L.
& Sahlin, K. 1976. The time course of
phosphorylcreatine resynthesis during
recovery of the quadriceps muscle in man.
Pflugers Archives, 367: 137-142.
Hirvonen, J., Rehunen, S., Rusko, H. & Harkonen,
M. 1987. Breakdown of high – energy
phosphate compounds and lactate
accumulation during short supramaximal
exercise. European Journal of Applied
Physiology and Occupational Physiology,
56: 253-259.
Holmyard, D., Cheetham, M., Lakomy, H. &
Williams, C. 1988. Effect of recovery

A Study of Anaerobic Power and Capacity of Football Players – Kumar, Ashok & Singh, Gurwinder
Date of Communication: Aug. 13, 2014
Date of Acceptance: Aug. 22, 2014 SJIF IMPACT FACTOR 2013=4.65
103
duration on performance during multiple
treadmill sprints. In: T. ReiUy, A. Lees, K.
Davids, and W.J, Murphy (eds.). Science
and Football, London/New York: E. &
F.N. Spon, 134-142.
Krustrup, P., Mohr, M., Amstrup, T., Rysgaard, T.,
Johansen, J., Steensberg, A., Pedersen,
P.K., and Bangsbo, J. 2003.The yo-yo
intermittent recovery test: physiological
response, reliability, and validity. Med.
Sci. Sports Exerc., 35: 697–705.
Luhtanen, P. 1994. Biomechanical aspects. In:
Football (soccer). Ekblom B. ed. Oxford:
Blackwell Scientific Publications pp. 59–
77.
Metaxas, T.I., Koutlianos, N.A., Kouidi, E.J., and
Deligiannis, A.P. 2005. Comparative
study of field and laboratory tests for the
evaluation of aerobic capacity in soccer
players. J. Strength Cond. Res., 19: 79–84.
O’Donoghue, P. 2001. Time-motion analysis of
work rate in elite soccer. In: Notation
analysis of sport IV. TavaresMF, ed.
Porto, PT: Centre for team Sport Studies
Faculty of Sport Science and Physical
Education pp. 65–67.
Patton J.F. and Duggan A. 1987. An evaluation of
tests of anaerobic power. Aviat. Space
Envir. Med,, 58: 237-42.
Psotta, R., Blahus, P., Cochrane, D.J. and Martin,
A.J. 2005. The assessment of an
intermittent high intensity running test. J.
Sports Med. Phys. Fitness, 45: 246–256.
Tesch, P., Thorsson, A. & Fujitsuka, N. 1989.
Creatine phosphate in fiber types of
skeletal muscle before and after
exhaustive exercise. J. Appl, Physiol.,
66(4): 1756- 1759.
Tharp, G.D., Newhouse R.K., Uffelman L.,
Thorland W.G.and Johnson G.O. 1985.
Comparison of sprint and run times with
performance on the Wingate Anaerobic
Test. Res. Q. Exercise Sport, 56(1): 73-6.
Conflict of Interest: None declared.

Journal of Exercise Science and Physiotherapy, Vol. 10, No. 2: 104-110, 2014
Date of Communication: Aug. 19, 2014
Date of Acceptance: Aug. 28, 2014 SJIF IMPACT FACTOR 2013=4.65
104
Minimum Muscular Fitness and Ventilatory Function in
South Indian School Children
Rawat1, Vikas; Rajesh2, S.K., and Nagarathna3, Raghuram 1PhD Scholar, Swami Vivekananda Yoga Anusandhana Samsthana, Bangalore, India. Pin: 560019.
([email protected]). 2Assistant Professor, Deputy Coordinator PhD Program, Swami Vivekananda Yoga Anusandhana
Samsthana, Bangalore, India. Pin: 560019. (Email: [email protected])
3Swami Vivekananda Yoga Anusandhana Samsthana, Bangalore, India. Pin: 560019.
Corresponding author: Vikas Rawat., PhD Scholar, Swami Vivekananda Yoga Anusandhana Samsthana,
Bangalore, India. Pin: 560019, E-mail: [email protected]
Introduction
Emerging society has considered
physical fitness as one of the important
indicators of health. Physical fitness is the
ability to perform physical activity, and
makes reference to a full range of
physiological and psychological qualities
(Ortega et al, 2008). Being physically fit
has been defined as "the ability to carry out
daily tasks with vigor and alertness,
without undue fatigue and with ample
energy to enjoy leisure-time pursuits and to
meet unforeseen emergencies" (PCPFS,
1952). Physical fitness during adolescence
is related to a healthy cardiovascular
disease risk profile in adults (Twisk et al,
2002). Fitness refers to the maximum
capacity that people have or achieve while
they perform physical activity that can be
measured as the level of strength and
flexibility of the muscular groups in
different body parts. After two decades of
clinical experience, Kraus and Hirschland
prepared six tests of minimum muscular
fitness for children called Kraus-Weber
test (KW). The battery evaluates strength
and flexibility of trunk and leg muscles.
Abstract Emerging society has considered physical fitness as one of the important indicators of health.
Muscular fitness and ventilatory functions are the important domains of physical fitness. The
present study was designed to evaluate minimum muscular fitness and ventilatory functions in
South Indian Children. Three hundred and fifty two healthy school children of both genders in age
range of 10- 16 years who attended Yoga based Personality Development Camp were recruited
for the study. Sample consisted of 203 boys and 149 females with a mean age of 12.90 years
(SD=1.55). Anthropometric measurements, Kraus-Weber (KW) minimum muscular fitness test
and PEFR were recorded. Out of 352 subjects tested 251 (71.31%) subjects failed in completing
the test successfully. The overall failure rate in boys was 71.9% while in girls it was 70.5% with
non significant differences between the two genders. The observation that the group of students
who succeeded on minimum muscular fitness had significantly higher PEFR, points to a positive
relationship between muscle fitness and lung functions. A failure rate of 71% on KW test in urban
children (10-16years) of both genders points to an urgent need of physical fitness training
programs for the enhancement of the strength in areas that shape their physical fitness.
KEY WORDS: physical fitness, muscular fitness, ventilatory function, Kraus-Weber, PEFR

Minimum Muscular Fitness and Ventilatory Function in South Indian School Children – Rawat, Vikas et al
Date of Communication: Aug. 19, 2014
Date of Acceptance: Aug. 28, 2014 SJIF IMPACT FACTOR 2013=4.65
105
Studies have shown that this test represents
minimum muscular fitness, and that falling
below the normative level in this test
predisposes to orthopedic and emotional
difficulties (Kraus & Hirschland, 1953).
Studies show wide variations in the
children fitness levels as measured on KW
test. Initial studies on American and
European children from comparable urban
and suburban communities showed that
57.9% of the 4264 American students
while only 8.7% of the 2870 European
students failed to pass the test (Kraus &
Hirschland, 1954). In the first Indian
survey in the year 1975 on minimum
muscular fitness in 375 school children in
Lonavla, Maharashtra, the failures
reported was 40.3% with multiple failures
to the extent of 63.9 per cent (Gharote &
Ganguly, 1975). Further, a recent study in
year 2000 by the same group revealed that
20.8 per cent boys failed in the tests
(Gharote, 2000) and this improved
performance was attributed to better
training through sports and physical
activities promotions in the school.
Multiple failures were 4.8 percent while
flexibility failures alone were 11.6 percent.
Measurement of ventilatory functions
is another useful measure to assess
physical fitness in children and adults
(Petty, 2006). Peak expiratory flow rate
(PEFR) which is the maximum flow
achieved during rapid exhalation
delivered with maximal force starting from
the level of maximal lung inflation is an
essential measure of ventilatory function
(Pedersen, 1997). PEFR is a simple
quantitative and reproducible measure of
resistance and severity of airflow
obstruction (Holcroft et al, 2003). The
purpose of this study was to evaluate the
present status of muscular fitness and
ventilatory function using Kraus-Weber
Test and mini peak expiratory flow meter
in healthy South Indian Children.
Methods Participants: Three hundred and fifty two
healthy school children of both genders in
age range of 10- 16 years who attended
yoga based Personality Development
Camp in summer holidays in the serene
campus of SVYASA University,
Bengaluru, were randomly selected from a
pool of 540 children. Children with a
history of asthma, a recent history of
respiratory infection with or without
persistent cough within the past two weeks
and those with any major disability or
illness were excluded from the study.
Consent and ethical clearance: Signed
informed consent was obtained from the
parent or guardian of the child at the time
of registration after they had read the
proposal of the study. All procedures were
reviewed and accepted by the institutional
ethical committee. The children were
explained in detail about the nature of the
study and the voluntary nature of
participation and were not provided with
any incentives for their participation.
Methods: All the children were the
participants of a ten day residential yoga
based personality development camp
organized during summer holidays in the
month of April. The testing was performed
in a spacious room during the morning
hours between 9 to 11 AM on 2nd day of the
camp after the child had acclimatized to
the camp life. The children were taken in
batches of five to the room situated
adjacent to the hall. After documenting the
demographic data, PEFR followed by
Kraus Weber test was recorded.
Measurements

Journal of Exercise Science and Physiotherapy, Vol. 10, No. 2: 104-110, 2014
Date of Communication: Aug. 19, 2014
Date of Acceptance: Aug. 28, 2014 SJIF IMPACT FACTOR 2013=4.65
106
Kraus-Weber test: The Kraus-Weber
test is composed of five strength items and
one flexibility item (Kraus & Hirschland,
1953). Failure of any one of the six items
means a failure of the total test.
1. The first test item measured the
strength in abdominal and psoas (hip
flexor) muscles. The subject was instructed
to lie supine with the hands behind the
neck. The feet were held by the examiner.
On command the subject rolled up into a
sitting position.
2. In the second test item the subject
was asked to lie supine, hands behind neck
and knees bent. The feet were held. On
command the subject tried to roll up into a
sitting position. This is a test of abdominal
muscles without using the psoas muscle.
3. This is a test item for the strength
of lower abdominal muscles. During this
test, the subject lies flat on his back with
his hands behind his neck. He was then
instructed to lift the legs straight off the
floor about 10 inches and to hold the
position for 10 seconds.
4. The upper back muscles were
tested during the 4th test item. The subject
was asked to lie prone with a pillow under
the abdomen but far enough down to give
a seesaw effect. While lying on the
stomach, the subject was asked to lift the
head, shoulders, and chest off the floor and
hold for 10 seconds.
5. In the fifth test, the position was
the same as in the 4th test. The subject was
instructed to lie prone over the pillow and
place his hands in front and rest his head
on them. The examiner held the chest
down and asked the subject to lift his legs
up without bending the knees and maintain
this position for 10 seconds. The lower
back muscles were tested with this.
6. In the sixth test item, the subject
was tested for the flexibility of back and
ability to stretch the hamstring muscle. The
subject was asked to stand erect with his
hands at sides and feet together. On
command he was instructed to lean down
slowly to touch the floor with his
fingertips. The knees were kept straight
and the leaning down position was asked
to be maintained for 10 seconds. No
bouncing was allowed to touch the floor.
PEFR Measurement: A mini PEFR meter
(Clement Clarke) was used to check the
PEFR of the children. The purpose and
technique of performing PEFR was
explained along with a demonstration of
the correct manner of performing the test.
When subjects had understood the method
and were able to perform correctly, they
were made to give the test in the standing
position. They were closely observed to
ensure that they maintained an airtight seal
between their lips and the mouthpiece of
the instrument (Holcroft et al, 2003). The
highest value of the three readings was
recorded as the final PEFR value.
Physical characteristics:
The weight (Kg) was recorded using a
standard electronic weighing scale. The
participants were asked to remove as much
outerwear as possible. Further they were
asked to remove the shoes and step up onto
the weighing scale and stand still over the
center of the scale with body weight evenly
distributed between both the feet. Standing
height (cm) was measured without shoes
and without traction using a standard scale.
Data analysis: All the statistical analyses
were performed using the Statistical
Package for Social Sciences (version
16.0). Descriptive statistics was used to
examine the frequency and percentage to
compare successes and failures in Kraus-

Minimum Muscular Fitness and Ventilatory Function in South Indian School Children – Rawat, Vikas et al
Date of Communication: Aug. 19, 2014
Date of Acceptance: Aug. 28, 2014 SJIF IMPACT FACTOR 2013=4.65
107
Weber Test items based on age and gender.
Independent-samples t-tests were
performed to determine the significance of
the observed differences in physical
characteristics of the subjects according to
success and failure.
Results & Discussion
A total of 352 students (203-boys, 149-
girls) were enrolled in the study.
Participants’ age ranged from 9 to 16 years
with a mean age of 12.90 years (SD=1.55).
Table I shows physical characteristics and
frequency distribution of children’s
performance on the two tests i.e. PEFR &
Kraus Weber tests.
Table I: Frequency distribution of children on KW test and PEFR
age
groups Gender N
Weight Height PEFR KW test
Mean SD Mean SD Mean SD Success N
(%)
Failure
N(%)
10
Girls 13 32.52 6.54 135.04 10.47 226.92 64.47 1(7.7) 12(92.3)
Boys 14 37.89 7.26 138.14 6.68 239.29 37.31 2(14.3) 12(85.7)
Total 27 35.3 7.32 136.64 8.68 233.33 51.52 3(11) 24(89)
11
Girls 16 33.6 5.94 141.69 6.38 250.63 39.58 4(25) (75)
Boys 26 36.66 7.17 140.84 6.99 266.54 52.07 9(34.6) 17(65.4)
Total 42 35.5 6.82 141.16 6.7 260.48 47.83 13(29.8) 29(70.2)
12
Girls 26 37.93 8.53 143.35 10.34 238.85 48.36 4(15.4) 22(84.6)
Boys 42 40.86 9.04 146.88 8.86 285.76 45.37 11(26.2) 31(73.8)
Total 68 39.74 8.9 145.53 9.53 267.82 51.58 15(20.8) 53(79.2)
13
Girls 33 45.11 7.19 152.17 7.32 297.88 52.78 13(39.4) 20(60.6)
Boys 56 46.83 12.07 151.93 9.78 293.39 52.23 15(26.8) 41(73.2)
Total 89 46.19 10.52 152.02 8.9 295.06 52.18 28(33.1) 61(66.9)
14
Girls 29 49.02 9.2 155.83 6.92 304.14 42.8 12(41.4) 17(58.6)
Boys 39 46.08 9.84 156.96 8.39 324.87 57.35 8(20.5) 31(79.5)
Total 68 47.33 9.62 156.48 7.76 316.03 52.32 20(30.9) 48(69.1)
15
Girls 27 49.81 6.84 156.1 7.09 312.22 47.9 8(29.6) 19(70.4)
Boys 18 54.72 6.39 170.21 7.78 381.67 62.43 9(50) 9(50)
Total 45 51.77 7.03 161.74 10.1 340 63.6 17(39.8) 28(60.2)
16
Girls 5 48.22 10.8 155.4 5.04 308 50.7 2(40) 3(60)
Boys 8 49.59 7.95 161.75 2.83 336.25 63.23 3(37.5) 5(62.5)
Total 13 49.06 8.73 159.31 4.85 325.38 58.25 5(38.8) 8(61.3)
10-16
Girls 149 43.24 9.95 149.54 10.56 280.47 57.89 44(29.5) 105(70.5)
Boys 203 44.34 10.76 151.49 11.92 300.21 62.38 57(28.1) 146(71.9)
Total 352 43.87 10.43 150.66 11.39 291.85 61.22 101(28.7) 151(71.3)
PEFR= Peak expiratory flow rate.
Note: Total failure percentage is 71.31
KW test: Out of 352 subjects tested a total
of 251 (71.31%) subjects failed to
complete the test successfully. The overall
failure rate in boys was 71.9 while in girls
it was 70.5 with non significant difference
between the two genders. Further 25.85%
of students failed in one of the items of the
test. It is observed that the failure rates that
ranged from 89% dropped to 50% as the
age advanced in both girls and boys; the
maximum failure rate of 89% was
observed in the age group of 10 years and
the dropped to 60.2% in the boys of 15
years of age. Table 2 presents the analysis
of success and failures in the number of
items of the Kraus-Weber test. Table 3
presents the success and failures in
Individual items of the Kraus-Weber test.
The maximum number of students failed in
the test item meant for Strength of Upper
Back muscles where the failure rate was
observed to be 93.8%. Physical

Journal of Exercise Science and Physiotherapy, Vol. 10, No. 2: 104-110, 2014
Date of Communication: Aug. 19, 2014
Date of Acceptance: Aug. 28, 2014 SJIF IMPACT FACTOR 2013=4.65
108
characteristics of the subjects who were
successful or failed in the KW test items
are summarized in Table 4. Successful
group of subjects have shown significantly
higher PEFR as compared to the failure
group. Table 2:–Analysis of Failure rates in the different Items
in the Kraus-Weber Test (N-356)
Number of items failed
Total KW
test 5 4 3 2 1
N 8 28 48 76 91 251
% 2.27 7.95 13.64 21.59 25.85 71.31
Table 3: Performance On Individual Items Of KW Test
Success Failures
Items N % N %
Abdominals
Plus Psoas 44 12.5 308 87.5
Abdominals
Minus Psoas 86 24.4 266 75.6
Psoas &
Lower
abdominals
99 28.1 253 71.9
Upper Back
muscles 22 6.3 330 93.8
Lower Back
muscles. 167 47.4 185 52.6
flexibility
and strength
back and
hamstrings
121 34.4 231 65.6
Table 4: Comparison Of Physical Characteristics and KW
Test
Physical
parameters
KW
result N Mean SD t p
Weight Successes 101 43.6 10.686
-0.36 0.716 Failures 251 44.0 10.34
Height Successes 101 151.8 11.96
1.19 0.235 Failures 251 150.2 11.14
PEFR Successes 101 309.6 64.12
3.51 0.001 Failures 251 284.7 58.64
In the current study, overall 71.3%
failure rate was observed in any one of the
six test items in Kraus-Weber test. The
failure percentage observed in this study
has been second highest reported so far in
India. This seems to be in line with a recent
study in India which has concluded that
basic levels of health-related fitness are
low among school children and reasons
attributed to this trend were increasing
affluence, and academic competitiveness,
which forces the child to devote very little
time to physical activity (Gupta et al,
2014). In the current decade the television
and video game use has become the most
popular leisure activity. As ‘couch potato’
hypothesis states time spent with these
media activities result in deleterious
affects on the physical activity and the diet
(Vandewater et al, 2004). Although in the
current study their basic physical activity
level, hours of television viewing and
video game activity were not measured,
this may be responsible for the increased
failure rate in minimum physical fitness.
Maximum failure percentage was seen in
test item 4 that measures the upper back
muscles (93.8%) and test item 1 (Strength
of abdominal plus psoas muscles) (87.5%).
This result is in contrast to a previous study
which has shown that the test item number
6 that measures the flexibility of Back and
Hamstrings as the weak areas (Gharote &
Ganguly, 1975). The overall failure rate in
boys was 71.9 % while in girls it was
70.5% with no significant difference
between the two genders. This result is in
contrast to a previous study from India
which reported higher failure rates in
females than males (Gharote, 2000). The
observation that the group of students who
succeeded on minimum muscular fitness
had significantly higher PEFR, points to a
positive relationship between muscle
fitness and lung functions.
Limitations: Potential limitations of this
research must also be considered. The
sample included was healthy young
children in a yoga camp environment
which may be difficult to generalize for all
children and adults. Secondly, we have
used only PEFR using a mini PEFR
instrument; it would have been ideal to
compare all measures of lung function

Minimum Muscular Fitness and Ventilatory Function in South Indian School Children – Rawat, Vikas et al
Date of Communication: Aug. 19, 2014
Date of Acceptance: Aug. 28, 2014 SJIF IMPACT FACTOR 2013=4.65
109
using a spirometer. To our knowledge, this
is the first study that has looked at both
minimum muscular fitness and PEFR in
south Indian children. The benefits of
physical fitness are widely acknowledged
and extend across many domains of
wellness and health. Previous findings
have shown a positive relationship
between physical fitness, during
adolescence and arterial properties later in
life (Twisk et al, 2002). Further reports
have shown consistent positive
relationship between physical fitness and
academic achievement (Chomitz et al.,
2009). Furthermore, results support the
possible link between physical fitness and
improved emotionality (Folkins, 1981).
Physical fitness can be enhanced by
training. One of the effective strategies for
enhancement of physical fitness is yoga
practice. Many earlier studies have shown
positive effects of Yoga training in
reducing the failure rate in K-W tests
(Gharote, 1975). Studies have also shown
that yoga based breathing practices can
increase pulmonary function (Vedala et al,
2014).
Conclusion: A failure rate of 71% on KW
test in urban children (10-16years) of both
genders points to an urgent need of
physical fitness training programs for the
enhancement of the strength in areas that
shape their physical fitness.
Acknowledgements: Our thanks are due to
Dr. Balaram Pradhan, of SVYASA Yoga
University for financial support and for his
valuable suggestions.
Reference
Chomitz, V. R., Slining, M. M., McGowan, R. J.,
Mitchell, S. E., Dawson, G. F., & Hacker, K. A.
2009. Is there a relationship between physical
fitness and academic achievement? Positive
results from public school children in the
northeastern United States. The Journal of
School Health, 79(1): 30-37.
Folkins, C. H., & Sime, W. E. 1981. Physical fitness
training and mental health. The American
Psychologist, 36(4): 373-389.
Gharote, M. L., & Ganguly, S. K. 1975. A survey of
minimum muscular fitness on school
children. The Indian Journal of Medical
Research, 63(9): 1242-1250.
Gharote, M. M. 2000. Minimum muscular fitness in
school children. Indian Journal of Physiology
and Pharmacology, 44(4): 479-484.
Gharote, M. L. 1976. Physical fitness in relation to
the practice of selected yogic exercises. Yoga
Mimamsa, XVIII(1): 14-23.
Holcroft, C. A., Eisen, E. A., Sama, S. R., &
Wegman, D. H. 2003. Measurement
characteristics of peak expiratory flow. Chest,
124: 501-510.
Kraus H., & Hirschland, R.P. (1953). Muscular
fitness and health. JOHPER, 24(10): 17-19.
Kraus H., & Hirschland, R.P. 1954. Minimum
muscular fitness tests in school children.
Research Quarterly, 25(2): 178-188.
Moorthy, A. M. 1982. Influence of selected yogic
exercises on minimum muscular fitness of the
elementary school children. SNIPES
Journal, 5(3): 21.
Ortega, F. B., Ruiz, J. R., Castillo, M. J., & Sjöström,
M. 2008. Physical fitness in childhood and
adolescence: a powerful marker of
health. International Journal Obesity 32(1): 1-
11.
Pedersen, O. F. 1997. The Peak Flow Working
Group: physiological determinants of peak
expiratory flow. The European Respiratory
Journal. Supplement, 24: 11S-16S.
Petty, T. L. 2006. The history of COPD Early
historical landmarks. International Journal of
COPD, 1(1): 3-14.
President's Council on Physical Fitness and Sports.
Exercise programs for adults. Washington, DC:
US Government Printing Office, 1965
Raja K., Gupta S., Bodhke S., & Girish, N. 2014.
Fitness levels in school going children of 8-14
years from Udupi. International Journal health
Health Allied Science, 3(2): 95-99.
Twisk, J. W. R., Kemper, H. C. G., & Mechelen, W.
Van. 2002. The relationship between physical
fitness and physical activity during adolescence
and cardiovascular disease risk factors at adult
age. The Amsterdam Growth and Health

Journal of Exercise Science and Physiotherapy, Vol. 10, No. 2: 104-110, 2014
Date of Communication: Aug. 19, 2014
Date of Acceptance: Aug. 28, 2014 SJIF IMPACT FACTOR 2013=4.65
110
Longitudinal Study. International Journal of
Sports Medicine, 23 Suppl 1: S8-S14.
Vedala, S.R.; Mane, A.B.; & Paul, C.N. 2014.
Pulmonary functions in yogic and sedentary
population. International Journal of Yoga,
7:155-9.
Vandewater, E.A., Shim, M.S., & Caplovitz, A.G.
2004. Linking obesity and activity level with
childrenʼs television and video game
use. Journal of Adolescence, 27(1): 71-85.
Conflict of Interest: None declared.

The Relationship between Creatine Kinase and Cortisol Level of Young Indian Male Athletes-Singh et al
Date of Communication: Aug, 25, 2014
Date of Acceptance: Aug. 29, 2014 SJIF IMPACT FACTOR 2013=4.65
111
The Relationship between Creatine Kinase and Cortisol Level of
Young Indian Male Athletes Singh1, Gobind, Soodan2, J.S. & Kumar3, Sandeep.
1Principal, Akal College of Physical Education, Mastuana Sahib, Sangrur (Punjab), India. E-mail:
[email protected] 2Assistant Professor, Akal College of Physical Education, Mastuana Sahib, Sangrur (Punjab), India, Email:
[email protected] 3Sports Scientist, Department of Biochemistry, Faculty of Sport Science, SAI NSNIS, Patiala-147001, (Punjab).
India. Email: [email protected]
Introduction
Competitive sports impose
substantial energy, mechanical, mental and
emotional burdens on the athletes. This
reflects, among other things, on a number
of biochemical and hematological
properties in blood sample collected at rest
(Lang & Wurzburg, 1982; Clarkson et al,
1992; Malczewska et al, 2000; Mayr et al,
2006). Creatine kinase is an enzyme and
present in almost all tissues but is highest
in the muscle and in the brain. Creatine
kinase exists in three different isoenzymes.
Each Isoenzyme is a dimer composed of
two protomer ‘M’ for muscle and ‘B’ for
brain (Nanji, 1983; Noakes, 1987;
Nikolaidis et al, 2003). The serum
concentration of creatine kinase is used
widely as an index of skeletal muscle fibre
damage in sport and exercise. The serum
Creatine Kinase concentration rises when
an organ that contains the enzyme is
damaged. The serum Creatine Kinase
concentration is probably the best
biochemical marker of muscle fibre
damage. Creatine Kinase involved in
muscle metabolism and it is believed to
leak into the plasma from skeletal muscle
fibers when these are damaged because of
repeated and intense contraction of
muscles (Wevers et al, 1977; Tolfrey et al,
2000). The serum concentration of
Creatine Kinase peaks 1–4 days after
exercise and remains elevated for several
days. Thus, athletes participating in daily
training have higher resting values than
non-athletes, although this response to
training is mitigated by the so-called
repeated-bout effect. That is, the repetition
of an exercise after several days or even
weeks causes less muscle fibre damage
than that caused by the previous exercise.
Cortisol is a steroid hormone, often called
the “stress hormone” because its level rises
following emotional and physical stress.
Its primary functions are to increase blood
sugar through gluconeogenesis, suppress
Abstract
Serum concentration of creatine kinase is used widely as an index of skeletal muscle fibre
damage in athletes. Cortisol is a steroid hormone, often called the “stress hormone” because its level
rises following emotional and physical stress. Forty five (45) male athletes of three different sports
disciplines namely Hockey, Wushu and Fencing having age between 14 to 17 yrs, were divided
equally into three groups. The results show that no correlation exists between the creatine kinase and
cortisol level of male Indian athletes of three different sports discipline.
Key words: Creatine kinase, Cortisol, Muscle fibre damage, Stress hormone

Journal of Exercise Science and Physiotherapy, Vol. 10 No. 2: 111-113, 2014
Date of Communication: Aug, 25, 2014
Date of Acceptance: Aug. 29, 2014 SJIF IMPACT FACTOR 2013=4.65
112
the immune system, and aid in fat, protein,
and carbohydrate metabolism. It also
decreases bone formation. High level of
cortisol can change the body from an
anabolic (muscle building) to a catabolic
(muscle losing) state. Cortisol release in
response to exercise appears to be altered
depending on the time of day that exercise
takes place (10).
The aim of the present study is to
evaluate the level of serum Creatine
Kinase and cortisol and find out the
correlation between serum Creatine Kinase
and cortisol level in Indian male athletes.
Materials & Methods
A total of forty five (N=45) male
athletes, fifteen (15), each from Hockey,
Wushu and Fencing sports disciplines
having age between 14 to 17 years of
Sports Authority of India training centre,
Netaji Subhas National Institute of Sports,
Patiala were the subjects of the present
study. Fasting (Twelve hours) 3ml blood
sample was collected from antecubital vein
between 07.00am to 09.00am. Creatine
kinase catalyzes the reaction between
creatine phosphate and ADP to form
creatine and ATP. The ATP formed along
with glucose is catalysed by hexokinase to
form glucose 6 phosphate. The glucose 6
phosphate reduces NADP to NADPH in
the presence of glucose 6 phosphate
dehydrogenase. The rate of reduction of
NADP to NADPH is measured as an
increase in absorbance which is
proportional to the Creatine kinase activity
in the sample.
Creatine kinase
𝐂𝐫𝐞𝐚𝐭𝐢𝐧𝐞 𝐏𝐡𝐨𝐬𝐩𝐡𝐚𝐭𝐞 + 𝐀𝐃𝐏𝒄𝒓𝒆𝒂𝒕𝒊𝒏𝒆 𝒌𝒊𝒏𝒂𝒔𝒆→ 𝒄𝒓𝒆𝒂𝒕𝒊𝒏𝒆 +ATP
𝐆𝐥𝐮𝐜𝐨𝐬𝐞+ 𝐀𝐓𝐏𝑯𝒆𝒙𝒐𝒌𝒊𝒏𝒂𝒔𝒆→ 𝑮𝒍𝒖𝒄𝒐𝒔𝒆 𝟔 𝑷𝒉𝒐𝒔𝒑𝒉𝒂𝒕𝒆 +ADP
𝑮𝒍𝒖𝒄𝒐𝒔𝒆 𝟔 𝑷𝒉𝒐𝒔𝒑𝒉𝒂𝒕𝒆 + 𝐍𝐀𝐃𝐏
𝑮 𝟔𝑷 𝒅𝒆𝒉𝒚𝒅𝒓𝒐𝒈𝒆𝒏𝒂𝒔𝒆→ 𝑮𝒍𝒖𝒄𝒐𝒏𝒂𝒕𝒆 𝟔 𝑷𝒉𝒐𝒔𝒑𝒉𝒂𝒕𝒆 +
NADPH+H
Cortisol (antigen) in the sample
competes with horseradish peroxidase-
Cortisol (enzyme-labelled antigen) for
binding onto the limited number of
anticortisol (antibody) sites on the micro
plates (solid phase). After incubation, the
bound/free separation was performed by a
simple solid-phase washing. The enzyme
substrate (H2O2) and the TMB-substrate
(TMB) were added. After an appropriate
time had elapsed for maximum colour
development, the enzyme reaction was
stopped and the absorbencies were
determined. The colour intensity was taken
as inversely proportional to the Cortisol
concentration in the sample.
Results & Discussion
Table 1: Mean standard deviation and r- value of creatine kinase and cortisol level of young Indian male
athletes of three different sports disciplines
Groups
(Sports
Disciplines
)
Creatine
kinase
(U/L),
Mean±SD
Cortisol
(ng/ml),
Mean±SD
r-
Valu
e
Hockey
(N=15)
200.3±97.2
9
169.00±24.2
2 0.129
Fencing
(N=15)
138.3±69.7
2
162.00±20.9
4 0.098
Wushu
(N=15)
159.1±56.6
2
162.67±34.3
2 0.281
As shown in the table no. 1 the mean
value of creatine kinase (200.3 ± 97.29) &
cortisol (169.00±24.22) level was
observed to be highest in the athletes of
Hockey group and the lowest in the
Fencing group. No significant correlation
was found between the two variables in the
three different sports disciplines (groups).
The serum creatine kinase and cortisol
activity observed can serve to verify if the
training protocol is adequate. Higher
serum creatine kinase and cortisol activity
is believed to be associated with other
clinical signals and symptoms suggestive
of excessive training load and skeletal

The Relationship between Creatine Kinase and Cortisol Level of Young Indian Male Athletes-Singh et al
Date of Communication: Aug, 25, 2014
Date of Acceptance: Aug. 29, 2014 SJIF IMPACT FACTOR 2013=4.65
113
muscle lesion. Conversely, lower values
may point inadequate training load not
promoting the adaptations. In the present
study, the mean values of creatine kinase
and cortisol level of all the three groups are
in the desirable range. But we have found
that some athletes in each sports discipline
have higher level of creatine kinase while
the level of cortisol of all the athletes is
found to be within a reference range. The
serum creatine kinase and cortisol
concentration serves as an index of both
overexertion and adaptation of the
muscular system to repeated bouts of
exercise. As such, creatine kinase and
cortisol is one of the top choices of athletes
and coaches when requesting a
biochemical profile, although the
interpretation of these parameter’s values
is not always straightforward. A
particularly important consideration
relating to the use and the interpretation of
creatine kinase and cortisol values in the
sports sector is the dependence of this
parameter on nature of the stress. Physical
training is a form of stress that is applied
onto the body. Chronic stress
(overtraining) results in an excess of
cortisol and creatine kinase, which will
cause higher baseline levels.
This is for the first time that the
study was carried out to find out the
relationship between creatine kinase and
cortisol level of athletes. Three groups of
young Indian male athletes belong to
Hockey, Fencing and Wushu were
analyzed for creatine kinase and cortisol
level. As mentioned that both the variables
are good markers of physical and mental
stress on athletes. In order to find out the
relationship between the two variables,
Karl Pearson’s coefficient of correlation
method was used. After applying
correlation between the two variables of
the three groups of athletes, we found that
there is no correlation exists between
creatine kinase and cortisol level of Indian
male athletes.
References Clarkson, P.M., Nosaka, K. & Braun, B. 1992.
Muscle function after exercise-induced muscle
damage and rapid adaptation. Medical and
Science in Sports and Exercise, 24: 512–20.
Lang, H. & Wurzburg, U. 1982. Creatine kinase, an
enzyme of many forms. Clinical Chemistry, 28:
1439-1447.
Malczewska, J., Raczynski, G. & Stupnicki, R.
2000. Iron status in female endurance athletes
and in non-athletes. Int. J. Sport Nutr. Exerc.
Metab.,10: 260–76.
Mayr, A., Kuipers, H. & Falk, M.. Comparison of
hematologic data in world elite junior speed
skaters and in non-athletic juniors. Int. Journal
of Applied Medicine and Science in Sport and
Exercise, 27: 283
Mougios, V. 2006. Exercise biochemistry.
Champaign, Illinois, USA: Human Kinetics,
296 & 300, 2006.–288, 2006.
Nanji AA. Serum creatine kinase isoenzymes: a
review. Muscle and Nerve 6: 83-90, 1983.
Nikolaidis, M.G., Protosygellou, M.D. & Petridou,
A. 2003. Hematologic and biochemical profile
of juvenile and adult athletes of both sexes:
implications for clinical evaluation. Int. J.
Sports Medicine, 24: 506–11.
Noakes, T.D. 1987. Effect of exercise on serum
enzyme activities in humans. Sports Medicine,
4: 245–67, 1987.
Tolfrey, K., Jones, A.M. & Campbell, I.G. 2000.
The effect of aerobic exercise training on the
lipid-lipoprotein profile of children and
adolescents. Sports Medicine, 29: 99–112.
Wevers, R.A., Olthuis, H.P., Vanniel, J.C.C., Van
Wilgenburg, M.G.M. & Soons, J.B.J. 1977. A
study of the dimeric structure of creatine kinase.
Clinica Chimica Acta, 75: 377-385.
Conflict of Interest: None declared.

Journal of Exercise Science and Physiotherapy, Vol. 10 No. 2: 114-121, 2014
Date of Communication: Sep.09, 2014
Date of Acceptance: Sep. 13, 2014 SJIF IMPACT FACTOR 2013=4.65
114
Efficacy of progressive core strengthening exercise on functional
endurance tests and hypertrophy of multifidus, transverses
abdominis in healthy female subjects with low core endurance Kulandaivelan1, S.; Chaturvedi2, R.; Moolchandani3, H. 1Assistant Professor, Dept. of Physiotherapy, Guru Jambheshwar University, Hisar-125001, Haryana, India. Email:
2Assistant Professor, Dept. of Physiotherapy, Guru Jambheshwar University, Hisar-125001, Haryana,, India.
Email: 3Radiologist, CMC Hospital, Hisar-125001, Haryana, India
Introduction
Rapid growth in technology in the
last couple of decades has lead to constant
reduction in physical activity and
increased sedentariness in lifestyle. This
in turn has reduced the work of certain
muscles that were once strong and were
responsible for good posture &
prevented injuries. This is especially
true to the trunk and hip muscles that
helped to maintain erect posture against
the gravity. Balance between anterior
and posterior group trunk and hip
muscles is essential for normal postural
alignment. However, habitual wearing
of high heels by young women results in
definite biomechanical and
musculoskeletal changes that are
manifested by reduced base of support,
increased anterior pelvic tilt, increased
lumbar lordosis, short hip flexor and
trunk extensor, weak abdominals and
gluteal muscles. The resulting decreased
core stability has been suggested to
contribute to the etiology of lower
extremity injuries in females (Leeton et al.,
2004).
A specific type of exercises
called as core stability exercise are
Abstract Objective: Aim of the present study was to find out the efficacy of core strengthening training on hypertrophy
of core group of muscles (i.e) transverses abdominis (TA) and multifidus (MF) and on trunk flexor as well as
extensor endurance tests in normal healthy low core endurance females. Methodology: Study Design: Single
blind randomized control trail. Sample size: Convenient sample of 20 female college students with low core
endurance. They divided into two groups. Intervention: Experimental group received six weeks progressive
core stabilization exercise while control group received no treatment. Out come measurement: Pre and post
reading of right and left side cross sectional area (CSA) of MF at L4 and L5 level and TA using ultra sound
image. Flexor and extensor trunk isometric tests were too taken for functional improvement. Statistics:
Related t- test were used to compare means within the group and unrelated t-tests were used to compare means
between two unrelated groups. The significance level was set at p≤0.05. Results: Prior to the intervention
there was no significant difference in CSA between the groups. After 6 weeks there was no significant
improvement in control group. In experimental group, after six weeks on and average 35.41% improvement
in CSA with MF L4 left being most improved site (53.50%) and TA left being least improved site (9.01%).
All improvements are statistically highly significant with p<0.001. When the experimental group post values
were compared with control group post values all MF CSA values were statistically highly significant
(p<0.001) but TA CSA were not. Conclusion: The present study results supports that 6 weeks progressive
core stabilization can be used as prehabilitation to prevent LBP in normal healthy female students.
Key Words: Stabilization exercise; Core training; Lumbar stabilization; Low back pain; Core
endurance

Efficacy of progressive core strengthening exercise on functional endurance tests and hypertrophy of multifidus,
transverses abdominis in healthy female subjects with low core endurance – Kulandaivelan, S. et al
Date of Communication: Sep.09, 2014
Date of Acceptance: Sept. 13, 2014 SJIF IMPACT FACTOR 2013=4.65
115
gaining rapid popularity among the
clinical therapists (McGill, 2001). These
exercises are used to target specific
muscle groups (i.e) transverse
abdominis (TA), internal oblique (IO),
multifidus (MF), quadrates lumborum,
pelvic floor muscles in the trunk so as to
prevent not only the low back pain, but
other injuries in lower extremity (Heidt
et al., 1999; Hewett et al., 2000; Nadler
et al., 2002; Cowan et al., 2004;
Ferreira et al., 2004; Akuthota and
Nadler, 2004; Zazulak et al., 2007;
Muthukrishnan et al., 2010; Hides et al.,
2011). Studies support the activation of
TA and MF prior to the movement of
shoulder and hip in order to stabilize low
back (Hodges and Richardson, 1996 and
1999). Above mentioned muscles are
attached directly to the lumbar vertebrae
and are the parts of motion segment in
lumbar region. So they are beleved to be
responsible for providing segmental
stability by controlling the lumbar
segments during movement. When all
these local muscles contract together they
keep the spine in its most stable position
(the neutral zone), so called local stability
system, and aid in preventing injury
(Fredericson and Moore, 2005; Zazulak et
al., 2008). Apart from injury prevention,
core stability also improve the sports
performance in certain sports (Hedrick,
2000; McGill, 2001; Nadler et al., 2002;
Myer et al., 2005; Kibler et al., 2006;
Marczinka, 2007). It is also important for
normal day to day physical activities such
as throwing, jumping, lifting, walking and
running etc.
Hicks et al., (2005) & Akuthota et
al., (2008) advise the core stability
exercise program to younger age
population (25 to 45 years) with greater
general flexibility which young women
population has. Further female population
with weak core is more susceptible to ACL
injury and other lower limb injuries thus
incorporation of core strengthening
program in their life style is essential
(Leeton et al., 2004; Hewett et al., 2000).
The current literature supports the
importance of core strengthening, in fact
the endurance, in the injury rehabilitation
(Hides et al., 1996; Daneels et al., 2001)
and sports performance (Hedrick, 2000
McGill, 2001; Kibler et al., 2006;
Marczinka, 2007). However, there is no
study that deals with normal young women
population who might have subclinical
level muscular imbalance in trunk due to
relative high heel foot wear usage and
wider pelvis. More over, current literature
lacks in consensus regarding what
constitute a core strengthening program,
how it differs from normal strengthening
exercises, how it has to be progressively
increased over the period of time, its effect
on muscular cross sectional area in normal
population. Thus, aim of the present study
was to find out the efficacy of core
strengthening training on hypertrophy of
core group of muscles (i.e) TA and MF and
on functional trunk endurance tests in
normal healthy low core endurance
females.
Materials & Methods
Study design: Present study was a single
blind randomized control trial with
convenient sampling technique. 20 healthy
female collegiate students aged between
18-26 years were recruited after passing
inclusion and exclusion criteria.
Inclusion and exclusion criteria: The
inclusion criterion was female students
without any regular training atleast one
year before the time of intervention. They
should possess low static trunk extensor

Journal of Exercise Science and Physiotherapy, Vol. 10, No. 2: 114-121, 2014
Date of Communication: Sep.1t, 2013
Date of Acceptance: Dec. 28, 2013 SJIF IMPACT FACTOR 2013=4.65
116
endurance (endurance tests less than 100
sec), whereas main exclusion criteria were
LBP in the last 3 months before the study
and LBP that resulted medical intervention
in the past, Contraindication to abdominal
muscle strengthening like-glaucoma,
pregnancy, hypertension, osteoporosis,
spinal tumors, inflammatory diseases.
Sample characteristics: Mean (SD) of age,
height and weight of the sample were 22.2
(2.21) yrs, 162.5(6.00) cm and 55.1(3.01)
kg respectively.
Procedure: The sample was randomly
divided into two groups, experimental &
control & consisted of 10 persons each.
Experimental group received 6 weeks of
progressive core stabilization exercise
whereas the control group received no
treatment during the period of the study.
Cross sectional area (CSA) of Multi Fidus
(MF) and Transverse Abdominis (TA) as
well as functional endurance test for both
lumbar flexor and extensor groups were
the out come measurements of the present
study. These were measured two times
with six weeks duration apart.
Ultra sound measurement- Technique:
Ultrasound images were used to measure
CSA of MF and TA muscles bilaterally by
an independent radiologist blind to the
content of the study. Ultrasound imaging
assessment was conducted using Xario
ultrasound imaging apparatus equipped
with a 10- MHz curvilinear transducer
(Toshiba, Japan).
For MF muscle thickness the subject
was positioned in prone lying, with a
pillow placed under the abdomen to
minimize the lumbar lordosis. The MF
muscle was imaged in para saggital
section, as per (Hides et al. (1992) and
(1995); Stokes et al., (2005)) allowing
visualization of the zygpophyseal joints,
muscle bulk, and thoracolumbar fascia.
The left and right MF muscle was
separately imaged at the L4-5 vertebral
level, then the images were saved and
measurement of cross sectional area was
taken.
Assessment of TA was done as per
Ferreira et al., (2004); Teyhen et al.,
(2005); Rankin et al., (2006); Hides et al.,
(2006) and Teyhen et al., (2008). The
subject was positioned in supine lying
position, and was asked to maintain
relaxed position while images were taken.
The center of the transducer was placed in
a transverse plane just superior to the iliac
crest, in line with the mid-axillary line. To
standardize the location of the transducer,
the hyperechoic interface between the TA
and the thoracolumbar fascia was
positioned in the right side of the
ultrasound image, and the image was taken
at the end of expiration. Images of both left
and right sides were saved and
measurement of thickness of TA was taken
later.
Static endurance tests- measurement: To
test flexor endurance test the subject was
positioned in supine with the knees and
hips flexed at 90° so that their torso could
be flexed to 60°. The feet was secured
under foot straps or held by the examiner.
Subjects were asked to hold this position,
60º flexion, for as long as possible. Failure
occurs when the subject’s torso falls below
60°, the duration for holding the position
was noted using digital stop watch
(McGill, 2002; Evans et al., 2007).
To test the torso extensors subjects
were positioned in a prone position with
trunk outside the table. The pelvis hips,
and knees were secured on a table. The
upper body was held out straight over the
end of the table. The subjects were asked
to extend their back and maintain this
position for as long as they could. Failure

Efficacy of progressive core strengthening exercise on functional endurance tests and hypertrophy of multifidus,
transverses abdominis in healthy female subjects with low core endurance – Kulandaivelan, S. et al
Date of Communication: Sep.09, 2014
Date of Acceptance: Sept. 13, 2014 SJIF IMPACT FACTOR 2013=4.65
117
occurs when the upper body falls from
horizontal into a flexed position, then the
measurement of duration for how long they
could hold this position was noted
(Moreau et al., 2001; McGill, 2002).
Progressive core endurance exercise-
procedure: A total of 6 weeks duration was
divided into 3 stages with each stage
lasting for 2 weeks. The segmental
approach we have devised develops
through three stages of segmental control,
with each stage exposing the individual
patient to increasing challenges to her joint
protection mechanisms (Myer et al., 2005;
Richardson et al., 2005; Norris, 2008;
Luque-Suárez et al., 2012). Table 1 shows
the type of exercises performed at each
stage of the progression. Justifications for
selection of exercises were given in our
previous publication (Kulandaivelan and
Chaturvedi, 2014). Before starting each
exercise session warm up session of about
5 min in the form of jogging was given.
Duration of each session was around 45-60
min in a day. Frequency of exercise was 5
times a week for 6 weeks. Subjects were
allowed 2 days rest period after completion
of 5 sessions of exercise in order to provide
adequate rest from exercise. The
abdominal drawing-in maneuver was
performed in conjunction with each of the
dynamic exercises because of its ability to
facilitate coactivation of the TA and MF
muscles when stabilizing the trunk and its
clinical use as a foundational basis for
lumbar stabilization exercises. In dynamic
exercises each exercise was of 10
repetitions (2 sec concentric contraction
with expiration, 8 sec hold with normal
breathing, 3 sec eccentric contraction with
inspiration with 5 sec rest) per set and 3
sets per session (total 30 repetitions).
Whereas static exercises were on 10 sec
hold (30-40 % of maximal voluntary
contraction as intensity) followed by 5 sec
rest for 10 repetitions per set and 3 sets per
session (total 30 repetitions) (Koumantakis
et al., 2005). There was a 60 sec interval
between sets and 3 min rest between each
exercise (Hicks et al., 2005; Willardson,
2006; Akuthota et al., 2008; ACSM, 2009;
De Salles et al. 2009). Table 1: Exercise Programme
Stage Name Static Dynamic
Sta
ge
I
Co
re C
on
tro
l
1. Abdominal ‘tuck in’
in crook lying position 2. Abdominal ‘tuck in’
in sitting position with
tactile cue on back 3. Abdominal ‘tuck in’
in quadruped position
1. Bridging
on the floor without leg
extension
2. Bird dog exercise in
quadruped
position 3.
Abdominal
crunches on floor (hands
behind head)
Sta
ge
II
Co
re s
tab
iliz
ati
on
Abdominal ‘tuck in’ in
sitting position
1. Back bridging
onswiss ball
without leg rise
2. Wall squat
with swiss ball
3.
Abdominal crunches on
swiss ball
(hands over chest)
Sta
ge
III
Co
re s
tren
gth
enin
g
Abdominal ‘tuck in’ in
standing against the
wall
1. Back
bridging onswiss ball
with leg rise
2. Bird dog
exercise on
swiss ball
3. Abdominal
crunches on
swiss ball (hands
behind head)
Statistics: Data were analyzed using
SPSS version 11.5. Data is presented by
mean ± Standard deviation (SD). Related
t- test were used to compare means within

Journal of Exercise Science and Physiotherapy, Vol. 10, No. 2: 114-121, 2014
Date of Communication: Sep.1t, 2013
Date of Acceptance: Dec. 28, 2013 SJIF IMPACT FACTOR 2013=4.65
118
the group and unrelated t-tests were used
to compare means between two unrelated
groups.The significance level was set at p
≤ 0.05.
Results & Discussion
Table 2 compares experimental group
and control group, pre and post exercise
period readings in CSA of muscle groups
at different sites. There was no significant
difference in pre and post readings in
control group. There was a significant
improvement in CSA of muscle groups at
all sites in experimental group’s post
exercise period (p<0.001 in all but TA left
which was p<0.01). However, when the
post values of experimental group was
compared with control group, significant
difference was observed only at multifidus
muscle not in TA muscles. Table 2: Comparison of control and experimental groups’ pre and post exercise period readings in CSA of muscle
groups at different sites.
Sno Side & Site Control Experimental ‘T’A(SIG) ‘T’B(SIG)
Pre Post Pre Post
1. L4 MF Left 1.210 ± 0.175 1.314 ± 0.300 1.099 ± 0.327 1.687 ± 0.313 2.718* 4.524***
2. L4MF Right 1.212 ± 0.209 1.212 ± 0.209 1.120 ± 0.305 1.676 ± 0.255 4.452*** 5.553***
3. L5 MF Left 1.347 ± 0.180 1.349 ± 0.179 1.237 ± 0.328 1.818 ± 0.233 5.044*** 5.577***
4. L5MF Right 1.421 ± 0.160 1.422 ± 0.166 1.300 ± 0.327 1.856 ± 0.277 4.424*** 5.117***
5. TA Left 0.317 ± 0.075 0.319 ± 0.075 0.333 ± 0.061 0.363 ± 0.057 1.468NS 4.616**
6. TA Right 0.321 ± 0.066 0.324 ± 0.064 0.322 ± 0.061 0.356 ± 0.056 1.185NS 7.519***
tA, tBare post control-experimental, pre control-experimental, ‘t’ values respectively. *, **, *** means ‘p’ values less than 0.05,
0.01, 0.001 respectively. NS means non-significant.
Table 3: Comparison of control and experimental groups pre and post exercise period readings of flexor and extensor
endurance test.
S.No Tests Control Experimental ‘T’A(SIG) ‘T’B(SIG)
Pre Post Pre Post
1. Flexor endurance test (in
sec)
41.9±17 48.4±15 57.8±23 129.2±42 6.66*** 5.72***
2. Extensor endurance test
(in sec)
58.7± 25 68.6 ± 15 49.2±29 108.9±39 7.93*** 3.03**
tA, tB are post experimental-control, experimental pre-post ‘t’ values respectively. *, **, *** are ‘p’ values less than 0.05, 0.01,
0.001 respectively. NS means non-significant.
Table 3 compares control and
experimental group’s pre and post exercise
period values in flexor and extensor
endurance test. There was no significant
difference in pre and post values of control
groups in both tests. But experimental
group showed significant improvement in
trunk endurance in both tests. The same
trend continued when post exercise values
of control and experimental group values
were compared (all values were P<0.001).
In the present study, transverse
abdominis thickness pre intervention
values are observed to be significantly
lower than the reference value reported by
Teyhen et al., 2008 but comparable to them
only in post intervention experimental
group. McGill et al., (1999) reported
higher values for both flexor as well as
extensor endurance tests. The normative
values reported in their study achieved
only in the experimental group after
intervention. This indicates that present

Efficacy of progressive core strengthening exercise on functional endurance tests and hypertrophy of multifidus,
transverses abdominis in healthy female subjects with low core endurance – Kulandaivelan, S. et al
Date of Communication: Sep.09, 2014
Date of Acceptance: Sept. 13, 2014 SJIF IMPACT FACTOR 2013=4.65
119
study population possessed low core
endurance at the beginning of the study.
The results of our study are in accordance
with the previous work by Daneels et al.
(2001), who suggested that core
strengthening programs of 10 weeks
duration with a frequency of 3 times a
week was enough to induce hypertrophy,
core strengthening program of 6 weeks as
used in the present study however has also
been found to induce hypertrophy to the
same extent. The reason for greater
improvement of hypertrophy in MF
compared to TA may be explained by
Grenier and McGill (2007) study. They
found lesser hypertrophy in TA using
abdominal hollowing as compared to
abdominal bracing and advised others to
emphasis for the later. In contrast in the
present study, more emphasis for
abdominal hollowing over bracing was
followed, which may be the cause of poor
hypertrophy of TA. Hides et al., (1996)
demonstrated that specific exercise
training involving co-contraction of
transverses abdominis and lumbar
multifidus over a 4 week period
demonstrated an increase in cross sectional
area of the atrophied multifidus due to
pain.
Abdominal hollowing is performed by
transverses abdominis activation;
abdominal bracing is performed by co-
contraction of many muscles including the
transverses abdominis, external obliques,
and internal obliques (Akuthota and
Nadler, 2004). Urquhart et al., (2005)
reported that inward movement of the
lower abdominal wall result in greater TA
activation than drawing in maneuver
(activation of both upper and lower
abdominal wall). A recent study has
demonstrated that as much as 70% MVC is
needed to promote strength gains in
abdominal muscle (Stevens et al., 2008).
The novice patient is more likely to
contract wide groups of abdominal
muscles (Urquhart et al., 2005). All the
above points may explain lack of or lesser
improvement observed in TA muscle CSA
in experimental group.
Conclusions: The results of the present
study show greater hypertrophy in
multifidus than transverses abdominis
after 6 weeks of progressive core
strengthening program along with both
flexor and extensor musculature endurance
improvement. The results may help
clinicians, physiotherapists to prescribe
core strengthening exercises as
prehabilitation for prevention of injuries in
normal young women population with low
trunk endurance.
References:
ACSM (American College of Sports Medicine).
2009. Progression models in resistance training
for healthy adults: ACSM position stand. Med
Sci Sports Exerc., 41(3): 687-708.
Akuthota, V., Ferreiro, A., Moore, T., Fredericson,
M. 2008. Core stability exercise principles.
Curr Sports Med Rep., 7(1): 39-44.
Akuthota, V., Nadler, S.F. 2004. Core strengthening.
Arch. Phys. Med. Rehabil., 85(3 Suppl): S86-
92.
Cowan, S.M.; Schache, A.G.; Brukner, P.; Kim L.;
Bennell1, K.L.; Hodges, P.W.; Coburn, P., and
Crossley, K.M. 2004. Delayed onset of
transverses abdominus in longstanding groin
pain. Med. Sci. Sports Exerc., 36(12): 2040–45.
Danneels, L.; Vanderstraeten, G.; Cambier, D. 2001.
Effects of three different training modalities on
the cross sectional area of the lumbar multifidus
in patients with chronic low back pain. Br. J.
Sports Med., 35: 186–91.
De Salles, B.F.; Simao, R.; Miranda, F.; Novaesda,
J.S.; Lemos, A.; Willardson, J.M. 2009. Rest
interval between sets in strength training.
Sports Med.,39(9): 765-77.
Evans, K.; Refshauge, K.M.; Adams, R. 2007.
Trunk muscle endurance tests: reliability and
gender differences in athletes. J. Sci. Med.
Sport., 10(6): 447-55.

Journal of Exercise Science and Physiotherapy, Vol. 10, No. 2: 114-121, 2014
Date of Communication: Sep.1t, 2013
Date of Acceptance: Dec. 28, 2013 SJIF IMPACT FACTOR 2013=4.65
120
Ferreira, P.H.; Ferreira, M.L.; Hodges, P.W. 2004.
Changes in recruitment of the abdominal
muscles in people with low back pain:
ultrasound measurement of muscle activity.
Spine., 29(22): 2560-66.
Fredericson, M.; Moore, T. 2005. Muscular balance,
core stability, and injury prevention for middle-
and long-distance runners. Phys. Med. Rehabil.
Clin. N. Am.,16: 669-89.
Grenier, S.G.; McGill, S.M. 2007. Quantification of
lumbar stability by using two different
abdominal activation strategies. Arch. Phys.
Med. Rehabil., 88: 54-62.
Hedrick, A. 2000. Training the trunk for improved
athletic performance. Strength and
Conditioning Journal., 22: 50-61.
Heidt, R.S.Jr; Sweeterman, L.M.; Carlonas, R.L.
1999. Avoidance of soccer injuries with pre-
season conditioning. Am. J. Sports Med., 27:
699-706.
Hewett, T.E.; Myer, G.D.; Ford, K.R. 2000.
Reducing knee and anterio cruciate ligament
injuries among female athletes: a systematic
review of neuromuscular training interventions.
J. Knee Surg., 18: 82-88.
Hicks, G.E.; Fritz, J.M.; Delitto, A.; McGill, S.M.
2005. Preliminary development of a clinical
prediction rule for determining which patients
with low back pain will respond to a
stabilization exercise program. Arch. Phy. Med.
Rehabil., 86(9): 1753-62.
Hides, J.; Wilson, S.; Stanton, W.; McMahon S.;
Keto, H.; McMahon, K.; Bryant, M.,
Richardson, C. 2006. An MRI investigation
into the function of the transverses abdominis
muscle during “drawing-in” of the abdominal
wall. Spine., 31: E175-178.
Hides, J.A., Richardson, C.A.; Jull, G.A. 1995.
Magnetic resonance imaging and
ultrasonography of the lumbar multifidus
muscle: Comparison of two different
modalities. Spine., 20: 54-8.
Hides, J.A.; Brown, C.T.; Penfold, L.; Stanton,
W.R. 2011. Screening the Lumbo--‐pelvic
Muscles for a Relationship to Injury of the
Quadriceps, Hamstrings, and Adductor
Muscles among Elite Australian Football
League Players. J. Orthop. Sports Phys. Ther.,
41(10): 767-75.
Hides, J.A.; Cooper, D.H.; Stokes, M.J. 1992.
Diagnostic ultrasound imaging for
measurement of the lumbar multifidus muscle
in normal young adults. Physiother. Theory
Pract., 8: 19-26.
Hides, J.A.; Richardson, C.A.; Jull, G.A. 1996.
Multifidus muscle recovery is not automatic
after resolution of acute, first-episode low back
pain. Spine., 21: 2763-9.
Hodges, P.W.; Richardson, C.A. 1996. Inefficient
muscular stabilization of the lumbar spine
associated with low back pain: A motor control
evaluation of the transverses abdominis. Spine.,
21: 2640-50.
Hodges, P.W.; Richardson, C.A. 1999. Altered trunk
muscle recruitment in people with low back
pain with upper limb movement at different
speeds. Arch. Phy. Med. Rehabil., 80: 1005-12.
Kibler, W.B.; Press, J.; Sciascia, A. 2006. The role
of core stability in athletic function. Sports
Med., 36: 189-98.
Koumantakis, G.A.; Watson, P.J.; Oldham, J.A.
2005. Trunk muscle stabilization training plus
general exercise versus general exercise only:
randomized controlled trail of patients with
recurrent low back pain. Phys. Ther., 85: 209-
25.
Kulandaivelan, S.; Chaturvedi, R. 2014. Evidence
based progressive core stabilization exercise
formation for low core endurance individuals.
Int. J. Physiother Res., 2(3): 584-87.
Leeton, D.T.; Ireland, M.L.; Willson, J.D. 2004.
Core stability measures as risk factors for lower
extremity injury in athletes. Med. Sci. Sports
Exerc., 36: 926-34.
Luque-Suárez, A.; Díaz-Mohedo, E.; Medina-
Porqueres, I.; Ponce-García, T. 2012.
Stabilization exercise for the management of
low back pain, In: Low Back Pain, Norasteh AA
(Ed.), 261-92.
Marczinka, Z. 2007. Core Stability Activating,
Stabilising And Strenghtening The Core
Muscles In Handball Training. Medicine.,
36(3): 189–98.
McGill, M.S. 2001. Low back stability: from formal
description to issues for performance and
rehabilitation. Exercise and Sport Sciences
Reviews., 29: 26-31.
McGill, S.M. 2002. Low back disorders: Evidence
based prevention and rehabilitation.
Champaign il: Human kinetics.
McGill, S.M.; Childs, A.; Liebenson, C. 1999.
Endurance times for low back stabilization
exercises: clinical targets for testing and
training from normal database. Arch. Phys.
Med. Rehabil., 80: 941-4.
Moreau, C.; Green, B.; Johnson, C.; Moreau, S.
2001. Isometric back extension endurance tests:

Efficacy of progressive core strengthening exercise on functional endurance tests and hypertrophy of multifidus,
transverses abdominis in healthy female subjects with low core endurance – Kulandaivelan, S. et al
Date of Communication: Sep.09, 2014
Date of Acceptance: Sept. 13, 2014 SJIF IMPACT FACTOR 2013=4.65
121
a review of the literature. J. Manipulative
Physiol. Ther., 24(2): 110-22.
Muthukrishnan, R.; Shenoy, S.D.; Jaspal, S.S.;
Nellikunja, S.; Fernandes, S. 2010. The
differential effects of core stabilization exercise
regime and conventional physiotherapy regime
on postural control parameters during
perturbation in patients with movement and
control impairment chronic low back pain.
Sports Med. Arthrosc. Rehabil. Ther. Technol.,
2: 13.
Myer, G.D.; Ford, K.R.; Palumbo, J.P.; Hewett, T.E.
2005. Neuromuscular training improves
performance and lower-extremity
biomechanics in female athletes. J. Strength
Cond. Res., 19(1): 51–60.
Nadler, S.F.; Malanga, G.A.; Bartoli, L.A.;
Feinberg, J.H.; Prybicien, M.; Deprince, M.
2002. Hip muscle imbalance and low back pain
in athletes: influence of core strengthening.
Med. Sci. Sports Exer., 34: 9-16.
Norris, CM. 2008. Back Stability. Champaign, IL:
Human Kinetics.
Rankin, G.; Stokes, M.; Newham, D.J. 2006.
Abdominal muscle size and symmetry in
normal subjects. Muscle Nerve., 34: 320-6.
Richardson, C.; Hodges, P.; Hides, J. 2005.
Therapeutic exercise for lumbopelvic
stabilization. A motor control approach for the
treatment and prevention of low back pain. 2nd
ed. Edinburgh (UK): Churchill Livingston;
185–219.
Stevens, V.K.; Parlevliet, T.G.; Coorrevits, P.L.;
Mahieu NN, Bouche KG, Vanderstraeten GG,
Danneels LA. 2008. The effect of increasing
resistance on trunk muscle activity during
extension and flexion exercises on training
devices. J. Electromyogr. Kinesiol.. 18(3): 434-
445.
Stokes, M.; Rankin, G.; Newham, D.J. 2005.
Ultrasound imaging of lumbar multifidus
muscle: normal reference ranges for
measurements and practical guidance on the
technique. Man. Ther., 10: 116-26.
Teyhen, D.S.; Miltenberger, C.E.; Deiters, H.M.;
Del Toro, Y.M.; Pulliam, J.N.; Childs, J.D.;
Boyles, R.E.; Flynn, T.W. 2005. The use of
ultrasound imaging of the abdominal drawing-
in maneuver in subjects with low back pain. J.
Orthop. Sports Phys. Ther., 35: 346-55.
Teyhen, D.S.; Rieger, J.L.; Westrick, R.B.; Miller,
A.C.; Molloy, J.M.; Childs, J.D. 2008. Changes
in deep abdominal muscle thickness during
common trunk-strengthening exercises using
ultrasound imaging. J. Orthop. Sports Phys.
Ther., 38(10): 596-605.
Urquhart, D.M.; Hodges, P.W.; Allen, T.J.; Story,
I.H. 2005. Abdominal muscle recruitment
during a range of voluntary exercises. Manual
Ther., 10: 144-53.
Willardson, J.M. 2006. A brief review: Factors
affecting the length of the rest interval between
resistance exercise sets. Journal of Strength and
Conditioning Research., 20(4): 978–84.
Zazulak, B.; Cholewicki, J.; Reeves, N.P. 2008.
Neuromuscular control of trunk stability:
clinical implications for sports injury
prevention. J. Am. Acad. Orthop. Surg., 16(9):
497-505.
Zazulak, B.T., Hewett, T.E., Reeves, N.P.,
Goldberg, B.; Cholewicki, J. 2007. Deficits in
neuromuscular control of the trunk predict knee
injury risk: A prospective biomechanical-
epidemiologic study. Am. J. Sports Med., 35(7):
1123–30.
Conflict of Interest: None declared.

Journal of Exercise Science and Physiotherapy, Vol. 10, No. 2: 122-130, 2014
Date of Communication: Sep.12, 2014
Date of Acceptance: Sep. 16, 2014 SJIF IMPACT FACTOR 2013=4.65
122
Role of footwear alteration along with conventional physiotherapy
in Osteoarthritis knee
Kanimozhi, D.1*, Multani, N.K.2, Pragya3
1Clinical Physiotherapist, Department of Physiotherapy, Punjabi University, Patiala-147001, Punjab. India. Email:
[email protected] 2Professor, Department of Physiotherapy, Punjabi University Patiala-147001, Punjab. India. Email:
[email protected] 3Clinical Physiotherapist, Department of Physiotherapy, Punjabi University, Patiala-147001, Punjab. India. Email:
Introduction
Osteoarthritis of the knee is a common
painful chronic disease whose prevalence
is increasing and for which there are few
efficacious treatment options (Felson et al,
2000). The increase in rates of knee
replacement for osteoarthritis has made the
identification of effective nonsurgical
treatments a high priority. Medial
osteoarthritis is one of the most common
subtypes of knee osteoarthritis (Parkes et
al, 2013). It was directly linked with a
varus deformity causing a change in the
axial alignment on the knee and with the
static load bearing axis transmitting
through the medial side rather than the
center of the knee. This change in
alignment and load bearing axis of the
knee will increase the loading transmitted
through the medial compartment and
accelerate the degeneration of the
cartilage, which is believed to be one of the
main causes of medial knee OA (Mehta
and Mulgaonkar, 2004). In the light of
these cross-sectional studies, the present
study was carried out in a longitudinal
design with an aim to not only provide
symptomatic relief to OA knee patients but
also address the biomechanical alterations.
Lateral wedge insoles are used for
conservative treatment of OA when there
is medial compartment narrowing.
Although knee OA is not a foot condition,
foot orthosis can alter the ground reaction
forces affecting the more proximal joints,
Abstract
Inspite of vast array of conservative treatment interventions for medial knee osteoarthritis, their
effectiveness in its management is still contentious. Numerous researchers have suggested the role
of footwear modification in reducing medial knee joint space load and hence reducing pain and
improving functional status. However, most of the studies were cross-sectional in nature and have
not seen the alteration in compendium of factors like radiographic changes, static alignment,
kinesiological factors, gait parameters and most importantly plantar pressure distribution following
6 months of footwear modification along with conservative physiotherapy. The results of the
present study suggested that footwear alteration along with conventional physiotherapy was
effective not only in improving clinical outcomes but also increasing medial knee joint space width,
changing static alignment, improving kinesiological factors, gait parameters and plantar pressure
distribution in patients of osteoarthritis knee.
Key Words: Footwear alteration; Knee; Osteoarthritis; Joint Space Width; Static
alignment; Kinesiology; Gait; Plantar pressure; Pain; Functional status

Role of footwear alteration along with conventional physiotherapy in Osteoarthritis knee – Kanimozhi, D. et al
Date of Communication: Sep.12, 2014
Date of Acceptance: Sep. 16, 2014 SJIF IMPACT FACTOR 2013=4.65
123
such as knee and therefore could be
effective in treatment of knee OA
(Hennessey, 2007). The wedge is placed
under the sole of the foot and angulated so
that it is thicker over lateral than medial
edge transferring loading during weight
bearing from medial to the lateral knee
compartment. Studies have documented a
modest 5% to 6% reduction in the external
knee adduction moment, a measure of
medial vs lateral loading (Keating et al,
1993; Kakihana et al, 2005; Butler et al,
2007; Hinman et al, 2008). In a study
conducted by Hinman and colleagues
(2009), twenty people with medial
compartment OA underwent gait analysis
in their own shoes wearing i) no insoles
and; ii) insoles wedged laterally 5 degrees,
in random order. They concluded that
effects of laterally wedged insoles on the
adduction moment do not appear to decline
after one month of continuous use,
suggesting that significant wedge
degradation does not occur over the short
term. In an another study (Barrios et al,
2013), 3- dimensional gait data were
captured in an intervention group of 19
patients with symptomatic medial knee
osteoarthritis wearing their prescribed
laterally wedged foot orthoses at 0 and 12
months. Wedge amounts were prescribed
based on symptom response to a step down
test. It was observed that mechanical
effectiveness of lateral wedging did not
decrease over 12 months' time period.
Thus both short term and long term
biomechanical effectiveness of lateral
wedge has been reported in the
management of medial osteoarthritis knee.
Materials & Methods
This was an experimental,
interventional study that was conducted at
the Research Lab, Department of
Physiotherapy, Punjabi University,
Patiala. The data was also collected from
Knee Clinic, Rotary Club (Mid Town),
SST Nagar, Patiala, Physiotherapy OPD,
Geriatric Centre, Patiala and Out Patient
Department (OPD), Bhai Khanaiya Health
Centre, Punjabi University, Patiala.
Approval to conduct the research study
was obtained from Institutional Ethical
Committee, Punjabi University, Patiala.
Thirty patients (mean age 58.33 ± 6.31
years; mean BMI 27.89 ± 3.89; 05 Males
& 25 Females) with medial compartment
OA (Grade – II & - III) were included in
the study. 13 patients had right side
involvement of medial knee OA and 17
patients had left sided involvement. The
exclusion criteria were history of fracture
in the area of knee joint under study or
secondary OA knee; severe osteoporosis;
any major lower limb surgery in the past;
locomotion with assistive device; lower
extremity injuries (not older than one
year); Neurological disorders such as
polyneuropathy, hemiplegia, parkinson
disease, stroke; Grade- 4 Osteoarthritis
(Osteoarthritis grading system - Kellgren
and Lawrence, (1957); Orthostatic
Hypotension and patients suffering from
acute illness, systemic /infectious diseases
or disorders. Informed consent was
obtained from each subject before starting
the assessment.
As per the study protocol, the
intervention group (n=30) received
conventional physiotherapy that consisted
of administration of hot packs and
interferential therapy followed by exercise
regime along with footwear modification.
Footwear modifications included
application of 5 degrees of lateral wedge in
their shoes and were instructed to wear
them while doing activities of daily living.
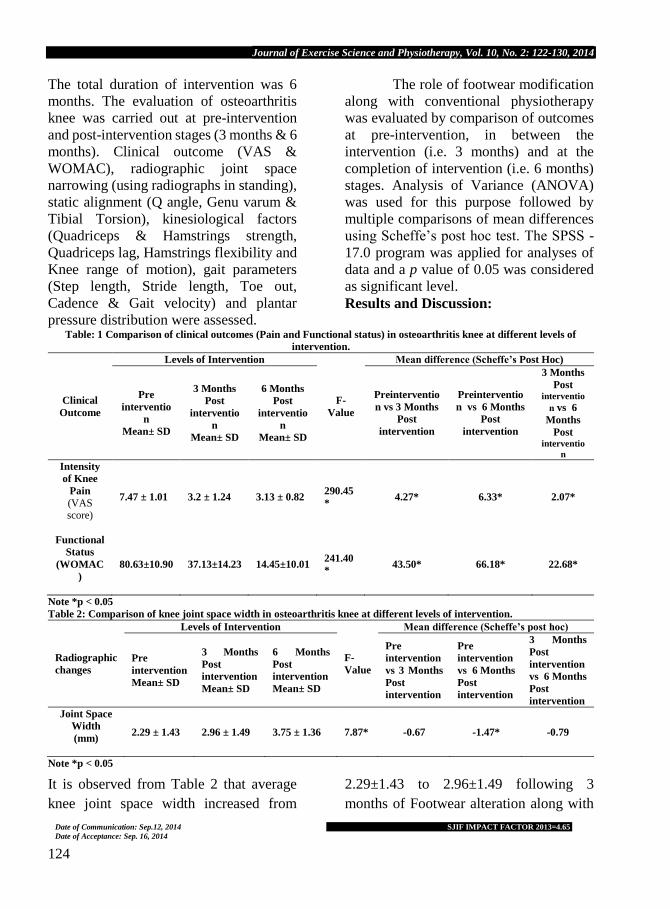
Journal of Exercise Science and Physiotherapy, Vol. 10, No. 2: 122-130, 2014
Date of Communication: Sep.12, 2014
Date of Acceptance: Sep. 16, 2014 SJIF IMPACT FACTOR 2013=4.65
124
The total duration of intervention was 6
months. The evaluation of osteoarthritis
knee was carried out at pre-intervention
and post-intervention stages (3 months & 6
months). Clinical outcome (VAS &
WOMAC), radiographic joint space
narrowing (using radiographs in standing),
static alignment (Q angle, Genu varum &
Tibial Torsion), kinesiological factors
(Quadriceps & Hamstrings strength,
Quadriceps lag, Hamstrings flexibility and
Knee range of motion), gait parameters
(Step length, Stride length, Toe out,
Cadence & Gait velocity) and plantar
pressure distribution were assessed.
The role of footwear modification
along with conventional physiotherapy
was evaluated by comparison of outcomes
at pre-intervention, in between the
intervention (i.e. 3 months) and at the
completion of intervention (i.e. 6 months)
stages. Analysis of Variance (ANOVA)
was used for this purpose followed by
multiple comparisons of mean differences
using Scheffe’s post hoc test. The SPSS -
17.0 program was applied for analyses of
data and a p value of 0.05 was considered
as significant level.
Results and Discussion:
Table: 1 Comparison of clinical outcomes (Pain and Functional status) in osteoarthritis knee at different levels of
intervention.
Clinical
Outcome
Levels of Intervention
F-
Value
Mean difference (Scheffe’s Post Hoc)
Pre
interventio
n
Mean± SD
3 Months
Post
interventio
n
Mean± SD
6 Months
Post
interventio
n
Mean± SD
Preinterventio
n vs 3 Months
Post
intervention
Preinterventio
n vs 6 Months
Post
intervention
3 Months
Post interventio
n vs 6
Months
Post interventio
n
Intensity
of Knee
Pain
(VAS score)
7.47 ± 1.01 3.2 ± 1.24 3.13 ± 0.82 290.45
* 4.27* 6.33* 2.07*
Functional
Status
(WOMAC
)
80.63±10.90 37.13±14.23 14.45±10.01 241.40
* 43.50* 66.18* 22.68*
Note *p < 0.05
Table 2: Comparison of knee joint space width in osteoarthritis knee at different levels of intervention.
Radiographic
changes
Levels of Intervention
F-
Value
Mean difference (Scheffe’s post hoc)
Pre
intervention
Mean± SD
3 Months
Post
intervention
Mean± SD
6 Months
Post
intervention
Mean± SD
Pre
intervention
vs 3 Months
Post
intervention
Pre
intervention
vs 6 Months
Post
intervention
3 Months
Post
intervention
vs 6 Months
Post
intervention
Joint Space
Width
(mm)
2.29 ± 1.43 2.96 ± 1.49 3.75 ± 1.36 7.87* -0.67 -1.47* -0.79
Note *p < 0.05
It is observed from Table 2 that average
knee joint space width increased from
2.29±1.43 to 2.96±1.49 following 3
months of Footwear alteration along with

Role of footwear alteration along with conventional physiotherapy in Osteoarthritis knee – Kanimozhi, D. et al
Date of Communication: Sep.12, 2014
Date of Acceptance: Sep. 16, 2014 SJIF IMPACT FACTOR 2013=4.65
125
conventional physiotherapy. It was
observed further to increase to 3.75±1.36
on the completion of six months of
intervention. This increase in knee joint
space width was statistically significant (F
= 7.87, table 3). The mean difference
between preintervention and 6 months
postintervention was statistically
significant whereas difference between
other levels of interventions was found to
be statistically nonsignificant. Thus the
osteoarthritic patients who receive
footwear alteration along with
conventional physiotherapy have
statistically significant improvement in the
knee joint space width after the
administration of six months of
intervention.
Table: 3 Comparison of static alignment in osteoarthritis knee at different levels of intervention
Static
alignment
Levels of Intervention
F-
Value
Mean difference (Scheffe’s post hoc)
Pre-
intervention
Mean± SD
3-Months
Post-
intervention
Mean± SD
6-Months
Post-
intervention
Mean± SD
Pre-
intervention
vs 3 Months
Post-
intervention
Pre-
intervention
vs 6 Months
Post-
intervention
3-Months
Post-
intervention
vs 6 Months
Post-
intervention
Q-Angle 10.67 ± 2.01
12.57 ± 1.74 14.13 ± 1.48 29.40* -1.90* -3.47* -1.57*
Genu
Varum
- 4.82 ± 2.77
- 2.33 ± 2.28 - 1.37 ± 2.11 16.46* 2.48* 3.45* 0.97
Tibial
Torsion
19.43 ± 4.55
17.05 ± 4.90 15.85 ± 4.96 4.32* 2.38 3.58 1.20
Note *p < 0.05
Table: 4. Comparison of kinesiological factors in osteoarthritis knee at different levels of intervention
Kinesiological
factors
Levels of Intervention
F-
Value
Mean difference (Scheffe’s post hoc)
Pre-
intervention
Mean± SD
3-Months
Post-
intervention
Mean± SD
6-Months
Post-
intervention
Mean± SD
Pre-
intervention
vs 3 Months
Post-
intervention
Pre-
intervention
vs 6 Months
Post-
intervention
3-Months
Post-
intervention
vs 6-Months
Post-
intervention
Quadriceps
Strength
(Kgs)
16.19 ± 3.13 18.02 ± 3.17 19.47 ± 3.35 7.84* -1.83 -3.28* -1.45
Hamstring
Strength
(Kgs)
11.97 ± 2.04 13.82 ± 2.16 15.04 ± 1.01 15.23* -1.84* -3.06* -1.22
Hamstring
Flexibility
(cms)
13.43 ± 2.91 12.20 ± 2.37 11.93 ± 2.56 2.79 - - -
Quadriceps
Lag (degrees) 2.70 ± 2.94 1.20 ± 1.79 0.67 ± 1.58 6.98* 1.50* 2.03* 0.53
Knee Range
Of Motion
(degrees)
109.93 ±
5.60
113.93 ±
4.46
116.40 ±
3.95 14.32* -4.00* -6.47* -2.47
Note *p < 0.05

Journal of Exercise Science and Physiotherapy, Vol. 10, No. 2: 122-130, 2014
Date of Communication: Sep.12, 2014
Date of Acceptance: Sep. 16, 2014 SJIF IMPACT FACTOR 2013=4.65
126
Table 3, presents the mean of Q-angle
(degree), Genu varum (degree) and Tibial
torsion (degree) within in the group at
preintervention, 3 months postintervention
and 6 months postinterventions. The
calculated F values for all the
biomechanical factors [Q angle (29.40),
Genu varum (16.46) and Tibial torsion
(4.32)] were found to be statistically
significant. The multiple comparisons of
mean difference of static alignment by
using Scheffe’s post hoc showed that for Q
angle mean difference is statistically
significant at all levels of interventions
whereas for tibial torsion, it was significant
only between preintervention and 6
months postintervention stages.
Additionally for genu varum mean
difference is statistically significant
between pre intervention and 3 months
postintervention as well as preintervention
and 6 months post intervention stages.
The calculated F value for Quadriceps
strength (7.84), Hamstring strength
(15.23), Quadriceps lag (6.98) and Knee
range of motion (14.32) was found to be
statistically highly significant where as the
F value for Hamstring Flexibility (2.79)
was found to be statistically non
significant as shown in Table 4. The mean
difference between pre-intervention and 6
months post-intervention was found to be
statistically significant for all the
kinesiological parameters. However the
mean difference between pre and 3 months
post-intervention as well as 6 months post-
intervention stages was statistically
significant only for hamstring strength,
quadriceps lag and knee range of motion.
Table: 5 Comparison of gait parameters in osteoarthritis knee at different levels of intervention
Gait
parameters
Levels of Intervention
F-
Value
Mean difference (Scheffe’s post hoc)
Pre-
intervention
Mean± SD
3-Months
Post-
intervention
Mean± SD
6-Months
Post-
intervention
Mean± SD
Pre-
intervention
vs 3 Months
Post-
intervention
Pre-
intervention
vs 6 Months
Post-
intervention
3-Months
Post-
intervention
vs 6 Months
Post-
intervention
Step
Length
(cm)
43.63 ± 6.08 46.63 ± 5.22 48.88 ± 4.84 7.12 -3.00 -5.25* -2.25
Stride
Length
(cm)
87.33
±12.22 93.08 ± 10.60 97.70 ± 9.75 6.81 -5.75 -10.37* -4.62
Toe-Out
(degrees) 12.26 ± 1.79 10.63 ± 1.30 9.63 ± 0.81 28.50 1.63* 2.63* 1.00*
Cadence 91.43 ± 8.05 99.70 ± 8.98 106.40 ± 7.73 24.64 -8.27* -14.97* 6.70*
Velocity
(cm/sec) 75.27 ± 5.50 81.59 ± 5.38 85.95 ± 5.75 28.09 -6.32* -10.67* -4.35*
Note *p < 0.05
Table 5 presents the average step
length, stride length, toe out, cadence and
gait velocity at different levels of
interventions in the Experimental group –
I. The calculated F value for all of these
parameters [step length (7.12), stride
length (6.81), toe out (28.50), cadence
(24.64) and gait velocity (28.09)] was
found to be significant at p<0.05. the
multiple comparisons carried out by using
Scheffe’s post hoc indicated that the mean
difference of gait parameters namely toe
out cadence and velocity was statistically
significant at all the levels of interventions.
On the other hand this difference was
significant only between pre and 6 months

Role of footwear alteration along with conventional physiotherapy in Osteoarthritis knee – Kanimozhi, D. et al
Date of Communication: Sep.12, 2014
Date of Acceptance: Sep. 16, 2014 SJIF IMPACT FACTOR 2013=4.65
127
post-intervention for step length and stride
length.
Table 6: Comparison of plantar pressure distribution mask in Osteoarthritis knee at different levels of intervention
Plantar
Pressure
Distribution
Levels of Intervention
F-
Value
Mean difference (Scheffe’s post hoc)
Pre-
interventio
n
Mean± SD
3-Months
Post-
interventio
n
Mean± SD
6-Months
Post-
interventio
n
Mean± SD
Pre-
interventio
n vs 3
Months
Post-
interventio
n
Pre-
interventio
n vs 6
Months
Post-
interventio
n
3-Months
Post-
interventio
n vs 6
Months
Post-
interventio
n
Anterior Mask
(UM+UL+MM
)
41.64 ± 8.26 45.63 ± 7.78 46.41 ± 8.22 3.01 - - -
Posterior Mask
(ML + LM +
LL)
58.92 ± 7.94 53.78 ± 8.12 53.35 ± 7.97 4.48* 5.13 5.57* 0.44
Medial Mask
(UM + MM +
LM)
46.73 ± 5.04 55.31 ± 6.04 58.81 ± 6.53 33.25
* -8.58* -12.08* -3.49
Lateral Mask
(UL + ML +
LL)
53.83 ± 5.18 44.11 ± 5.75 40.95 ± 6.22 41.15
* 9.72* 12.87* 3.16
Note *p < 0.05
The mean values of anterior mask,
posterior mask, medial mask and lateral
masks of plantar pressure distribution at
different levels of interventions have been
illustrated in Table 6. The results of one
way ANOVA suggested that the changes
in plantar pressure distribution were
statistically significant for posterior mask
(4.48), medial mask (33.25) and lateral
mask (41.15) but not for the anterior mask
(3.01). The mean difference of plantar
pressure distribution was found to be
statistically significant from base value to
3 months post intervention as well as base
value to 6 months post-intervention for
both medial mask and lateral mask while it
was significant only after 6 months of
intervention for posterior mask.
Discussion and Conclusions
Knee Osteoarthritis is a
musculoskeletal condition prevalent in
adults that causes considerable pain,
immobility and disability and imposes a
significant economic burden on those
afflicted by it (Raja and Dewan, 2011).
Keeping this in mind, the present study
was designed to decrease the
biomechanical load on medial
compartment of knee and thereby reduce
clinical symptoms and the risk of further
development of medial OA knee.
The mean varus alignment was
significantly reduced by 3.4 degrees in the
patients receiving footwear modification
along with conservative physiotherapy.
These findings are contrary to the
observations of Van Raaij et al (2010) who
demonstrated that neither the lateral wedge
nor the valgus brace achieved the
correction of knee varus malalignment in

Journal of Exercise Science and Physiotherapy, Vol. 10, No. 2: 122-130, 2014
Date of Communication: Sep.12, 2014
Date of Acceptance: Sep. 16, 2014 SJIF IMPACT FACTOR 2013=4.65
128
the frontal plane. In their study, the authors
showed that the mean varus alignment for
the insole group (6.9 degrees; SD, 3.6
degrees) was similar (p = 0.8) at baseline
compared with when wearing the wedge
(6.9 degrees; SD, 4.1 degrees).
Conversely, the present findings are well
in line with the results of the study
conducted by Zhang et al (2012) who
suggested that valgus knee bracing showed
a significant smaller knee varus degree
with a 2.90° reduction compared with
control condition, meanwhile a 2.81°
reduction compared with lateral wedge
condition (p < 0.05).
It has been observed that after 6
months of intervention, hamstring and
quadriceps strength has shown significant
improvement. These findings can be
attributed to biomechanical effectiveness
that was achieved by the application of
lateral wedge, as it has been reported that
the muscles at the medial compartment of
knee (vastus medialis, medial
gastrocnemius and medial hamstrings)
present with a pathological protective
patterns which increase the compressive
forces and moments acting on the affected
compartment (Lawek et al, 2005). Thus
only muscle strengthening without
biomechanical correction in the control
group was not sufficient to improve the
quadriceps strength (p = 0.09) and hence
quadriceps lag (p = 0.53). On the other
hand quadriceps lag was significantly
improved. Knee range of motion was
another kinesiological parameter studied in
the present investigation which has
significantly improved. Several studies
have demonstrated the effect of hot pack,
interferential therapy and exercise therapy
in reducing pain and stiffness and hence
improving joint range of motion.
All the gait parameters namely
Step length, stride length, toe out, cadence
and velocity were improved significantly.
These results differ from the previous
studies that have been unable to show
improvements in gait parameters either
with exercise program (Thorstensson et al,
2007), or lateral wedge (Hinman et al,
2009; Zhang et al, 2012). The difference
between these previous studies and present
study is that: i) there was average reduction
in knee adduction moment in the study
conducted by Thorstensson et al (2007)
and ii) studies conducted by Hinman et al
(2009) and Zhang et al (2012) were very
short term studies. Six months
administration of intervention resulted into
a statistically significant improvement in
pain. Similar findings have been reported
by Sattari and Ashraf (2011) and this could
be attributed to the unloading of medial
compartment (Miyazaki et al, 2002; Zhang
et al, 2012), decrease in the knee adduction
moment (Baliunas et al, 2002; Zhang et al,
2012) and an increase in the medial joint
space (Richard et al, 2005; Raja and
Dewan, 2011). This reduction in pain and
improvement in walking ability is believed
to be naturally translated into enhanced
functional scores (WOMAC) of the
participants (p = 0.00). Additionally pain
and functional outcome has improved even
after 3 months of intervention. These
results are consistent with the many of the
previous studies reported.
Hinman et al (2008) conducted a study
on 40 people with medial compartment OA
and demonstrated that laterally wedge
insoles resulted in an immediate reduction
in walking pain and knee adduction
moment. The improvement in pain and
physical function were reported by the
cohort after 3 months of treatment with
insoles. This study provides an objective

Role of footwear alteration along with conventional physiotherapy in Osteoarthritis knee – Kanimozhi, D. et al
Date of Communication: Sep.12, 2014
Date of Acceptance: Sep. 16, 2014 SJIF IMPACT FACTOR 2013=4.65
129
measurement of function by analysis of
gait symmetry. This was measured in 30
patients on four separate occasions:
immediately before and after initial fitting
and then again at three months with the
brace on and off. All patients reported
immediate symptomatic improvement
with less pain on walking. Hence, footwear
alteration along with conventional
physiotherapy is found to be effective in
improving clinical outcomes, radiographic
joint space width, static alignment,
kinesiological factors, gait parameters and
plantar pressure distribution in patients of
osteoarthritis knee. Thus, the results of the
present study may help clinicians to find a
novel way of use of lateral wedge along
with conventional physiotherapy, to help
patients with early medial OA knee in
future.
References: Baliunass, A.J.; Hurwitz, D.E.; Ryals, A.B.; Karrar,
A.; Case, J.P.; Block, J.A.; Andriacchi, T.P. 2002. Increased knee joint loads during walking
are present in subjects with knee osteoarthritis.
Osteoarthririts and Cartilage., 10(7): 573-579
Barrios, J.A.; Butler, R.J.; Crenshaw, J.R.; Royer,
T.D.; Davis, I.S. 2013. Mechanical
effectiveness of lateral foot wedging in medial
knee osteoarthritis after one year of wear. J.
Orthop. Res., 31(5): 659-664. doi:
10.1002/jor.22252.
Butler, R.J.; Marchesi, S.; Royer, T.; Davis, I.S.
2007. The effect of a subject-specific amount of
lateral wedge on knee mechanics in patients
with medial knee osteoarthritis. J. Orthop. Res.,
25(9): 1121-1127.
Felson, D.T.; Lawrence, R.C.; Dieppe, P.A.; Hirsch,
R.; Helmick, C.G. 2000. Osteoarthritis: new
insights, part 1: the disease and its risk factors.
Ann. Intern. Med., 133(8): 635-646.
Hennessay, W.J. 2007. Lower limb orthoses,
Braddom, R.L., Physical Medicine and
Rehabilitation. 3rd ed, Elsevier Inc., p. 347-
348.T
Hinman, R.S.; Bowles, K.A.; Bennell, K.L. 2009.
Laterally wedged insoles in knee osteoarthritis:
do biomechanical effects decline after one
month of wear? BMC Musculoskeletal
Disorders., 10: 146.
Hinman, R.S.; Payne, C.; Metcalf, B.R.; Wrigley,
T.V.; Bennell, K.L. 2008. Lateral wedges in
knee osteoarthritis: what are their immediate
clinical and biomechanical effects and can these
predict a three month clinical outcome?
Arhtritis Rheum., 59(3): 408-415.
Kakihana, W.; Akai, M.; Nakazawa, K.; Takashima,
T.; Naito, K.; Torri, S. 2005. Effects of laterally
wedged insoles on knee and subtalar joint
moments. Arch. Phys. Med. Rehabil., 86(7):
1465-1471.
Keatings, E.M.; Faris, P.M.; Ritter, M.A.; Kane, J.
1993. Use of lateral heel and sole wedges in the
treatment of medial osteoarthritis of the knee.
Orhtop Rev., 22(8): 921-924.
Kellgren, J.H.; and Lawrence, J.S. 1957.
Radiological Assessment of Osteo-Arthrosis.
Ann. Rheum. Dis., 16: 494.
Lawek, M.D.; Ramsey, D.K.; Synder-Mackfer, L.;
Rudolph, K.S. 2005. Knee stabilization in
patients with medial compartment knee
osteoarthritis. Arthritis & Rheumatism., 52(9):
2845-2853.
Mehta, J. and Mulugaonkar, K.P. 2004. Effect of
laterally raised footwear on bilateral medial
compartment knee osteoarthritis and its
biomechanical analysis: A comparative study.
The Indian Journal of Occupational Therapy.,
36(3): 51-56.
Miyazaki, T.; Wada, M.; Kawahara, H.; Sato, M.;
Baba, H.; Shimada, S. 2002. Dynamic load at
baseline can predict radiographic disease
progression in medial compartment knee
osteoarthritis. Annals of the Rheumatic
Diseases., 61(7): 617-622.
Parks, M.J.; Maricar, N.; Lunt, M.; LaValley, M.P.;
Jones, R.K.; Segal, N.A.;Takahashi-Narita, K.;
Felson, D.T. 2013. Lateral wedge insoles as a
conservative treatment for pain in patients with
medial knee osteoarthritis. A meta-analysis.
JAMA., 310(7): 722-730.
Raja, K.; and Dewan, N. 2011. Efficacy of knee
braces and foot orthoses in conservative
management of knee osteoarthritis: A
Systematic Review. Am. J. Phys. Med.
Rehabil., 90(3): 247-262.
Richards, J.D.; Ballester, J.S.; and Jones, R.K. 2005.
A comparison of knee braces during walking
for the treatment of osteoarthritis of the medial
compartment of the knee. J Bone Joint Surg
[Br]., 87-B (7): 937-9.

Journal of Exercise Science and Physiotherapy, Vol. 10, No. 2: 122-130, 2014
Date of Communication: Sep.12, 2014
Date of Acceptance: Sep. 16, 2014 SJIF IMPACT FACTOR 2013=4.65
130
Sattari, S.; and Ashraf, A.R. 2011. Comparison the
effect of 3 point valgus stress knee support and
lateral wedge insoles in medial compartment
knee osteoarthritis. Iranian Red Crescent
Medical Journal., 13(9): 624-628.
Sharma, B.; and Chandrasekar, L. 2012. Efficacy of
lateral wedged insole with subtalar strapping on
the functional status of medial compartment 3rd
grade osteoarthritis of the knee. Indian Journal
of Physiotherapy & Occupational Therapy.,
6(2): 28-31.
Thorstensson, C.A.; Henriksson, M.; von Porat, A.;
Sjodahl, C.; Roos, E.M. 2007.) The effect of
eight weeks of exercise on knee adduction
moment in early knee osteoarhtritis - a pilot
study. Osteoarthritis Cartilae., 15(10): 1163 –
1170
Van Raaij, T. M.; Brouwer, W.; Bierma-Zeinstra, S.;
and Verhaar, A. N. 2010. Medial Knee
Osteo-arthritis Treated by Insoles or Braces: A
Randomized Trial. Clinical Orthop Relat Res.,
468: 1926-1932
Zhang, M.; Qu, P.; Feng, M.; Jiang, L.; Shen, X.;
Ma, Y.; Bai, Y. 2012. Effectiveness of different
orthoses on joint moments in patients with early
knee osteoarthritis: lateral wedge versus valgus
knee bracing. J. Shanghai Jiaotong Univ. (Sci).,
17(4): 505-510.
Conflict of Interest: None declared.

A Study of Haemodynamic and Aerobic Fitness Profile of Football Players – Kumar, Ashok & Singh, M.
Date of Communication: Sep.12, 2014
Date of Acceptance: Sep. 17, 2014 131
A Study of Haemodynamic and Aerobic Fitness Profile of Football
Players
Kumar1, Ashok & Singh2, Mandeep. 1Assistant Professor, Department of Sports Science, Punjabi University Patiala-147001, (Punjab), India.
Email: [email protected]. 2PG Student, Department of Sports Science, Punjabi University Patiala-147001, (Punjab), India.
Introduction
The performance of the football
players depend on different kinds of
physiological characteristics. Exceptional
endurance performance capacity has long
been known as important prerequisite for
on-field performance of football players
(Ekblom, 1986; Reilly, 1997; Bangsbo et
al., 2006). For instance, a player’s aerobic
endurance capacity facilitates performance
continuity, which is limited by endurance,
throughout a 90-120 minute game. In
addition, it influences the recuperation
capabilities following high-intensity
games and training units and the recovery
following concise high-intensity exercise
spurts throughout the games or training
units (Ekblom, 1986; Reilly, 1997; Reilly et
al., 2008). There is significant agreement
that the maximum value for uptake,
transport, and use of oxygen is a good sign
of the working of the respiratory,
cardiovascular and musculoskeletal
systems. This is one of the reasons why
research has shown great interest in the
determination of haemodynamic and
aerobic fitness variables, in a direct or
indirect way, facilitating the understanding
of physiological aspects related to
performance of football players during
matches and training programme.
Therefore, the purpose of this study was to
observe selected haemodynamic and
aerobic fitness variables of college football
players so that players and coaches could
know the status of the physiological
adaptations of football training
programme.
Materials & Methods
Thirty male college football players of
state and inter-university level of
participation from Mastuana College of
Physical Education, Sangrur (Punjab)
Abstract
The purpose of this study was to observe haemodynamic and aerobic fitness profile of football
players. Thirty (N=30) male college football players between the age of 17 and 28 years volunteered
for this study. The mean age, height and weight of football players was 21±3years, 172.63±8.64cm
and 71.56±10.75Kg respectively.The mean resting pulse rate, systolic blood pressure, diastolic
blood pressure, pulse pressure, mean arterial pressure, rate pressure product, stroke volume, cardiac
output and VO2 max was 69±4beats/minute, 120±3mmHg, 78±3mmHg, 42.07±4.71mmHg,
91.67±2.94 mmHg, 83.06±5.05beats.min-1.mmHg, 57.38±5.65ml/beat, 3.97±0.28 L/minute and
42.60±2.26 ml.kg-1.min-1 respectively. It was concluded from the results of this study that college
level football players have less values of haemodynamic and aerobic fitness variables than elite level
football players and athletes of other countries. Thus, they may need to focus on improving
haemodynamic and aerobic fitness variables and this could be a focus of their training programme.
Key Words: Mean Arterial Pressure, Stroke Volume, Cardiac Output, VO2max

Journal of Exercise Science and Physiotherapy, Vol. 10, No. 2: 131-135, 2014
Date of Communication: Sep.12, 2014
Date of Acceptance: Sep. 17, 2014 SJIF IMPACT FACTOR 2013=4.65
132
India volunteered to participate in this
study and their age ranged between 17 to
28 years. Selected anthropometric
measurements on the subjects were
recorded by using standardized procedure
as described by Weiner & Lourie (1969).
The aerobic fitness (i.e.VO2max) was
predicted by using resting pulse rate for 20
seconds and enter the number of beats that
counted, along with subject’s age, into the
following equation (Uth et al., 2004 and
Tanaka et al., 2001).
VO2max (ml/kg/min) = 15.3 x (MHR/RHR)
where, MHR = Maximum heart rate (beats/minute) =
208 - (0.7 x Age)
RHR = Resting heart rate (beats/minute) = 20 second
heart rate x 3
The haemodynamic variables like
Pulse Pressure (PP = SBP- DBP), Mean
Arterial Pressure (MAP = Diastolic
pressure + 1/3 (Systolic - Diastolic
pressure)) (Andy et al., 1985), Rate
pressure product (RPP = HR x SBP /100)
(Nagpal et al., 2007 & Balogun et al.,
1990) was estimated by using various
equations.
Statistical Analysis
Statistical analysis was performed with
SPSS version 16.0 (free trial, SPSS Inc,
Chicago). Results are shown as Mean and
Standard Deviation. The alpha level for the
data analysis was determined at p<0.05.
Results & Discussion
Table 1 shows the number and percent
distribution of football players according
to their playing positions in the present
study. As per their playing positions of the
football players 43.3% (N=13) were back,
33.3% (N=10) forward, 16.7% (N=5)
center and 6.7% (N=2) goalkeeper.
Table 1: Number of Football Players according to
their playing positions
Playing position↓ Number Percent
1-forward 10 33.3
2-center 5 16.7
3-back 13 43.3
4-goalkeeper 2 6.7
Total 30 100.0
Table 2: Mean ±SD of Haemodynamic & Aerobic
Fitness variables of football players
Variables Mean± Std.
Deviation
Age, year 21±3
Height, cms 172.63±8.64
Weight, Kg 71.56±10.75
VO2 max, ml.kg-1.min-1 42.60±2.26
Pulse Rate, beats/minute 69±4
Systolic Blood Pressure, mmHg 120±3
Diastolic Blood Pressure, mmHg 78±3
Pulse Pressure, mmHg 42.07±4.71
Mean Arterial Pressure, mmHg 91.67±2.94
Rate Pressure Product, beats.min-
1.mmHg 83.06±5.05
Stroke Volume, ml/beat 57.38±5.65
Cardiac Output, L/minute 3.97±0.28
The mean age, height and weight of
male football players were 21±3 years,
172.63±8.64 cms and 71.56±10.75Kg
respectively. The mean Systolic Blood
Pressure, Diastolic Blood Pressure, Pulse
Pressure, Mean Arterial Pressure, Rate
Pressure Product, Stroke Volume and
Cardiac Output of football players at rest
was 120±3 mmHg, 78±3 mmHg,
42.07±4.71 mmHg, 91.67±2.94 mmHg,
83.06±5.05 beats.min-1.mmHg,
57.38±5.65 ml/beat and 3.97±0.28
L/minute respectively. The mean VO2 max
and Pulse Rate of football players at rest
was 42.60±2.26 ml.kg-1.min-1 and 69±4
beats/minute respectively (Table 2).
Testing of the haemodynamic and
aerobic fitness variables can provide an
insight to the football player's current
physical capability. Also, assessment of

A Study of Haemodynamic and Aerobic Fitness Profile of Football Players – Kumar, Ashok & Singh, M
Date of Communication: Sep.12, 2014
Date of Acceptance: Sep. 17, 2014 SJIF IMPACT FACTOR 2013=4.65
133
the football player's current level of
aerobic fitness reveals strengths and
relative weaknesses that can become the
basis for the development of an optimal
training program (Mirzaei et al., 2009).
The results of the measurements in this
study were relatively comparable to the
values reported in the literature for
example McMillian (2005) reported that
the mean VO2max of elite soccer players
was between 55 and 68 ml/kg/min but in
the present it was 42.60±2.26 ml/kg/min .
This value was similar to that reported for
in other team sport but was much lower
than that of elite endurance athletes
(90ml/kg/min). However, players from
different positions might have different
level of cardiorespiratory level. Reilly et al.
(2000) reported that among the elite
Danish players, full-backs and midfield
players possessed the highest values for
VO2max, whereas goalkeepers and central
defenders had the lowest but in the present
study no such trend related to playing
position was observed and this may be due
to less number of players, their training or
level of participation. It is important to
note that the results of aerobic fitness
components vary depending upon the
relationship of the athletes training
schedule and competitive schedule
(Roemmich et al. 1997). Maximum oxygen
uptake is considered to be a valid indicator
of the function of respiratory,
cardiovascular and muscular systems
working together (Impellizzeri & Marcora,
2007). Studies performed on untrained
(UT) males have shown that a good
VO2max is above 40 ml/kg/min; a measure
reported above 50 ml/kg/min is considered
excellent. In relationship to sport,
endurance specific athletes such as cyclists
have been shown to have a VO2max values
of the order of 75 ml/kg/min (Saltin &
Astrand, 1967). Martial art athletes
generally exhibit greater cardiorespiratory
endurance than untrained individuals, but
not as great as athletes who focus on
cardiorespiratory endurance as their
primary fitness component for success in
their sport, such as cyclists. In regard to
martial art disciplines, a study of highly
trained competitive black belt karate
practitioners were found to have a VO2max
of 57.5 ml/kg/min while the lesser skilled
competitive white belt karate practitioners
were found to have a VO2max of 57.2
ml/kg/min (Imamura et al., 1998). By
contrast, VO2max values of 63.8
ml/kg/min were found in 60 England
International boxers (Smith, 2006).
Wrestlers have been reported to have
values for VO2max of 60.2 ml/kg/min
(Yoon, 2002). Crisafulli et al. (2009)
reported that maximum oxygen uptake for
martial art athletes may be as low as 48.5
ml/kg/min and as high as 63.2 ml/kg/min
depending upon the specific type of
training discipline. Heart rate increases
sharply during the first 1–2 minute of
exercise, with the magnitude of the
increase depending on the intensity of
exercise. The increase in heart rate is
brought about by parasympathetic
withdrawal and activation of the
sympathetic nervous system. After
approximately 30 min of heavy exercise
heart rate begins to drift upward. The
increase in heart rate is proportional to the
decrease in stroke volume, so cardiac
output is maintained during exercise.
Stroke volume exhibits a pattern of initial
increase, plateaus, and then displays a
negative (downward) drift. Stroke volume
increases rapidly during the first minutes
of exercise and plateaus at a maximal level

Journal of Exercise Science and Physiotherapy, Vol. 10, No. 2: 131-135, 2014
Date of Communication: Sep.12, 2014
Date of Acceptance: Sep. 17, 2014 SJIF IMPACT FACTOR 2013=4.65
134
after a workload of approximately 40–50%
of VO2max has been achieved (Åstrand, et
al., 1964). As for light to moderate
exercise, the increase in stroke volume
results from an increased venous return,
leading to the Frank-Starling mechanism,
and increased contractility owing to
sympathetic nerve stimulation. Thus,
changes in stroke volume occur because
left ventricular end–diastolic volume
increases and left ventricular end–systolic
volume decreases (Poliner, et al., 1980).
Left ventricular end–diastolic volume
increases because of the return of blood to
the heart by the active muscle pump,
increased venoconstriction (which
decreases venous pooling, thereby
increasing venous return), and increased
cardiac output. Left ventricular end–
systolic volume decreases owing to
augmented contractility of the heart, which
effectively ejects more blood from the
ventricle, leaving a smaller residual
volume. The downward shift in stroke
volume after exercise is most likely due to
thermoregulatory stress; plasma loss and a
redirection of blood to the cutaneous
vessels in an attempt to dissipate heat
(Rowell, 1986). This effectively reduces
venous return and thus causes the
reduction in stroke volume. Diastolic
blood pressure remains relatively constant
because of peripheral vasodilatation,
which facilitates blood flow to the working
muscles. The rise in systolic blood
pressure and the lack of a significant
change in diastolic blood pressure cause
the mean arterial pressure (MAP) to rise
only slightly, following the pattern of
systolic blood pressure. The increase in
mean arterial pressure is determined by the
relative changes in cardiac output and total
peripheral resistance. Since cardiac output
increases more than resistance decreases,
mean arterial pressure increases slightly
during dynamic exercise. However, the
increase in mean arterial pressure would be
much greater if resistance did not decrease.
Conclusion: It was concluded from the
results of this study that college level
football players of this study have lower
values of haemodynamic and aerobic
fitness variables than elite level football
players and athletes of other countries.
Thus, they may need to focus on improving
haemodynamic and aerobic fitness
variables and this could be a focus of their
training programme.
Acknowledgment: The authors thank all
the subjects who voluntarily participated in
this study.
References
Andy J. J., G. O. A. Ladipo and S. P. Owolabi. 1985.
Blood pressure distribution of Nigerians in the
first two decades of life. Annals of Tropical
Paediatrics, 5(3): 113–118.
Åstrand, P.; Cuddy, T. E.; Saltin, B.; and Stenberg,
J. 1964. Cardiac output during submaximal and
maximal work. Journal of Applied
Physiology.19(2): 268–274.
Balogun J. A.; Obajuluwa, V. A.; and Abereoje. O.
K. 1990. Anthropometric determinants of
resting blood pressure and heart rate of Nigerian
school children,” Annals of Tropical
Paediatrics, 10(4): 425–431.
Bangsbo J.; Mohr, M.; and Krustrup, P. 2006.
Physical and metabolic demands of training and
match-play in the elite football player. J Sports
Sci. 24(7): 665-674.
Crisafulli, A.; Vitelli, S.; Cappai, I.; Milia, R.;
Tocco, F.; Melis, F.; and Conco. 2009.
Physiological respones and energy cost during
a simulation of muay thai boxing match.
Applied Physiology, Nutrition, and
Metabolism. 34: 143-150.
Ekblom, B. 1986. Applied physiology of soccer.
Sports Med., 3: 50–60.
Imamura H.; Yoshimura, Y.; Kazuhiro, K.;
Nishimura, S.; and Nakazawa, A.T. 1998.
Maximal oxygen uptake, body composition and
strength of highly competitive and novice
karate practitioners. Appl. Human Sci.; 17: 215-
218.

A Study of Haemodynamic and Aerobic Fitness Profile of Football Players – Kumar, Ashok & Singh, M
Date of Communication: Sep.12, 2014
Date of Acceptance: Sep. 17, 2014 SJIF IMPACT FACTOR 2013=4.65
135
Impellizzeri, F., and Marcora, S. 2007. The
physiology of mountain biking. Sports
Medicine, 37(1): 59-71.
McMillan, K.; Helgerud, J.; Grant, S. J.; Newell,
J.; Wilson, J.; Macdonald, R.; Hoff, J. 2005.
Lactate threshold responses to a season of
professional British youth soccer. Br. J. Sports
Med., 39(7): 432-436.
Mirzaei, B., Curby, G., Rahmani-Nia, F. and
Moghadasi, M. 2009. Physiological profile of
elite Iranian junior freestyle wrestlers. Journal
of Strength and Conditioning Research 25(8):
2339-2344.
Nagpal, S., Walia, L., Hemlata; Sood, N.; and Ahuja,
G.K. 2007. Effect of exercise on Rate Pressure
Product in Premenopausal and Postmenopausal
women with coronary artery disease. Indian J.
Physiol. Pharmacol., 51(3): 279-283.
Poliner, L. R.; Dehmer, G. J.; Lewis, S. E.; Parkey,
R. W.; Blomqvist, C. G.; and Willerson, J. T.
1980. Left ventricular performance in normal
subjects: A comparison of the responses to
exercise in the upright supine positions.
Circulation. 62: 528–534.
Reilly, T., Bangsbo, J., and Franks, A. 2000.
Anthropometric and physiological
predisposition for elite soccer. Journal of
Sports Science, 18: 669-683.
Reilly, T.; Drust, B.; and Clarke, N. (2008. Muscle
fatigue during football match-play. Sports
Med., 38(5): 357-367.
Reilly T. 1997. Energetics of high-intensity exercise
(soccer) with particular reference to fatigue. J.
Sports Sci., 15(3): 257-263.
Roemmich, J.; and Sinning, W. 1997. Weight loss
and wrestling training: effects on nutrition,
growth, maturation, body composition, and
strength. Journal of Applied Physiology, 82:
1751-1759.
Rowell, L. B. 1986. Human Circulation: Regulation
during Physical Stress. New York: Oxford
University Press.
Smith M.S. (2006).Physiological profile of senior
and junior England international amateur
boxers. J Sports Sci Med., CSSI:74-89.
Tanaka, H.; Monhan, K.D.; and Seals, D.G. 2001.
Age-predicted maximal heart rate revisited.
Am. Coll. Cardiol., 37: 153-156.
Uth, N., Sørensen, H., Overgaard, K.; and Pedersen,
P.K. 2004. Estimation of VO2max from the
ratio between HRmax and HRrest-the Heart
Rate Ratio Method. Eur. J. Appl. Physiol.,
91(1): 111-5.
Weiner J.S. and Lourie J.A.(1969). Human Biology:
A Guide to Field Method. IBP no.9, Blackwell,
London.
Yoon, J. 2002. Physiological profiles of elite senior
wrestlers. Sports Medicine, 32(4): 225-233.
Conflict of Interest: None declared.

Instructions to contributors—Journal of Exercise Science & Physiotherapy
SJIF IMPACT FACTOR 2013=4.65
a
Instructions to Contributors
Journal of Exercise Science and Physiotherapy
(JESP) is a scientific peer reviewed journal, publishing research studies and review articles in the field of sports
injuries, physiotherapy, exercise physiology, sports
rehabilitation, diseases and exercise, sports psychology, nutrition, physical education, sports biomechanics,
kinesiology and sports education.
JESP is published annually in June but is planned to be published biannually in the near future.
Articles written in English should be sent to the editor of JESP. The research paper for publication in the journal
could be sent not only in typed manuscript form but also
through the Internet using email attachment. Keeping in view the postal delays, authors, therefore, are encouraged
to submit their research material/articles as email directly
Mission
JESP aims to present easy access to the scientific knowledge for health & sport conscious
individuals. The purpose is to minimise the problems like
the delays in publishing process of the articles by drawing advantage from electronic medium.
Instructions to Authors
The articles may be submitted to the Editor,
JESP (email: [email protected] OR
[email protected]). Manuscripts are considered if they
are submitted only to JESP and therefore should not be under consideration for publication elsewhere, either in
part or in whole. Authors are responsible for the scientific
context and legal aspects of the articles. Editors may make necessary changes to articles in accordance with
“Instructions to Authors”. Normally the complete research
paper should not exceed 15 typed pages including tables and figures; however under exceptional circumstances this
limit can be relaxed. There is no page and reference
limitation for the review articles. All files related to manuscripts should be submitted electronically. Internet
transmission and e-mail attachments are preferred; CD-
ROM is acceptable for large files. Text files should be in Microsoft Word 6.O and later versions. Each figure, table,
photograph or other image should be submitted
electronically. The manuscripts should be submitted in Times New Roman font, 12-point type, double-spaced with
3 cm margins on all sides. The reference style used by the
Journal is the Harvard System of referencing.
Format for Research Article
Include the following sections in research
articles without page space:
Title: Capital letters.
Authors: Surname followed by initials and institution(s)
where the study was conducted.
Abstract Include an abstract of not more than 150 words
that includes objectives, methods, results and conclusions.
KEY WORDS: To assist in indexing the journal, list up to
6 key words (not from title), which your article could be indexed.
INTRODUCTION
METHODS
RESULTS
DISCUSSION
CONCLUSION
ACKNOWLEDGMENTS: Provide information
sufficient to identify sources of support, technical
assistance, and intellectual contributions not associated with authorship.
REFERENCES: Each citation in the text must be noted
by surname and year in parentheses and must appear in the reference section as an alphabetic order. Example for
citation in the text; a) for single author (Gür, 1999), b) for
two authors (Gür and Akova, 2001), c) more than two authors (Gür et al., 2000).
Journal Article:
Akova, B., Sürmen-Gür, E., Gür, H., Dirican,
M., Sarandöl, E. and Kücükoglu, S. 2001. Exercise-
induced oxidative stress and muscular performance in
healthy women: role of vitamin E supplementation and endogenous estradiol. European Journal of Applied
Physiology, 84: 141-147.
Journal Article, Article not in English:
Seker-Aygül, Z., Akova, B. and Gür, H. 2001.
The relationship of stress and stress management factors
with injury in soccer players. Turkish Journal of Sports Medicine, 36: 71-80. (In Turkish: English abstract).
Journal Article in press:
Gür, H., Cakin, N., Akova, B., Okay, E. and
Kücükoglu, S 2002. Concentric versus combined
concentric- eccentric isokinetic training: Effects on functional capacity and symptoms in patients with
osteoarthrosis of the knee. Archives of Physical Medicine
and Rehabilitation, in press.
Journal Article in electronic format:
Weigand, D.A., Carr, S., Petherick, C. and
Taylor, A. 2001. Motivational climate in Sport and Physical Education: The role of significant others.
European Journal of Sports Science (serial online) 1(4),
(13 screens/inclusive page), October. Available from URL: http://www.humankinetics.com/ejss
Book:

Instructions to contributors—Journal of Exercise Science & Physiotherapy
SJIF IMPACT FACTOR 2013=4.65
b
Guyton, A.C. and Hall, J.E. 1996. Textbook of medical physiology. 9th edition. W. B. Saunders Company,
London.
Chapter in edited book:
Wilson, C.H. 1984. Exercise for arthritis. In:
Therapeutic exercise. Ed: Basmajian, J.V. 4th edition.
Baltimore: Williams and Wilkins. 529-545.
Thesis:
Özyener, F. 2000. Effects of work intensity on
dynamics of pulmonary gas exchange during exercise in humans. Doctoral thesis, University of London, London.
79.
Thesis not in English:
Özer, Ö. 2001. The effect of muscle exercise to
oxygen kinetics in chronic smokers. Doctoral thesis, University of Uludag, Bursa. 1-54. (In Turkish: English
abstract).
LEGENDS
AUTHOR BIOGRAPHY: Please include a
brief biography, approximately 50 words per author, for each author including (1) academic title/degrees, (2)
institution affiliation, (3) research focus, (4) post and e-
mail addresses.
TABLES, FIGURES, etc.: The location
within the article where e.g. figures and tables appear
should be indicated in the text. These materials (e.g. table, figure) should be submitted separately from the text
document. Each item should be produced in Microsoft
Office (Word, Excel, or PowerPoint), GIF or JPEG format. Submit each item separately and number sequentially as
(main author) Figure 1.jpg, (main author) Figure2.jpg, and
so on, for example, GurFigure1.jpg and GurTable1.doc.
FORMAT FOR REVIEW ARTICLE
Include the following sections in research articles without
page space:
TITLE: Capital letters.
AUTHORS: Surname followed by initials and
institution(s) where the study was conducted.
ABSTRACT Include an abstract of not more than 300
words.
KEY WORDS: To assist in indexing the journal, list up to 6 key words (not from title), which your article could be
indexed
MAIN TEXT
CONCLUSION
ACKNOWLEDGMENT
REFERENCES: Each citation in the text must be noted by surname and year in parentheses and must appear in the
reference section as an alphabetic order. Example for
citation in the text; a) for single author (Gür, 1999), b) for two authors (Gür and Akova, 2001), c) more than two
authors (Gür et al., 2000). See the reference section of
research article for detail.
LEGENDS
AUTHOR BIOGRAPHY: For detail see the author
biography section of research article.
TABLES, FIGURES, etc.: For details see the tables, figures, section of research article.
REVIEW AND PUBLISHING POLICY
Upon receipt of a manuscript the editor will
notify the main author that the submission has been
received. The manuscript will undergo a blinded review process. Under this process the editor will forward
(electronically) the manuscript to two independent
reviewers. Normally the review process will take approximately 4 weeks. After the review process has been
completed the main author will be notified via E-mail
either of acceptance, revision or rejection of the
manuscript. If the main author has not been informed of the
results of the review process after 8 weeks from the date of confirmation of receipt of the manuscript (by the editor),
the author should notify the editor-in-chief directly. If
revision was recommended, this should be completed and returned to the editor within 4 weeks; failure to return the
revised manuscript within the allotted time span will lead
to rejection of the manuscript. When a manuscript has been accepted for publication it will be forwarded to the editor-
in-chief for final approval. The editor-in-chief will work
with the main author to make necessary revisions in order for the manuscript to appear in the Journal of Exercise
Science and Physiotherapy. The final proof of the
manuscript will be sent to the main author as an E-mail
attachment. If the main author requires any minor changes
to the finished work, these should be submitted
electronically to the editor-in-chief within one week. Manuscript accepted in the first half of the year will be
published not later than the second half of the year.
Checklist for Authors
Double-space manuscript text and use 3cm
margins on all sides, and Times New Roman, 12-point type, English and SI units.
Include with text a title, abstract, key words,
figure and table lists, figure and table legends.
Submit all materials electronically.
Include complete author names, addresses, e-mail, phone and fax numbers.
Include a short (~50 words) author biography for each author.
Editor-in-Chief,
JESP

National Poisons Information Centre INFORMATION—Journal of Exercise Science & Physiotherapy
SJIF IMPACT FACTOR 2013=4.65
c
National Poisons Information Centre, Department of Pharmacology, All India
Institute of Medical Sciences, New Delhi
The National Poisons Information Centre (NPIC) is running in the Department of Pharmacology, All India Institute of Medical Sciences, New Delhi. The Centre works 24x7 and provides on the spot information on management of various poisonings to
health care professionals, Government and Private hospitals,all over the country.
The NPIC provides information on: the likely diagnosis possible signs & symptoms management guidelines
possible antidote and availability
What the information seeker should provide :
Information about himself
- name,relationship,contact no.,address, the patient
- age, sex, time since exposure, substance ingested, amount, mode, signs & symptoms, treatment provided What is not provided by NPIC
Active treatment of the patient Supply of antidotes
In case of poisoning, call the NPIC Toll Free: 1800 116 117 Tel. No.: 011-26589391 Fax No.: 011-26589691
E mail :[email protected]
Pl. note that the information provided cannot be used for any legal purpose
Incharge: Dr.Y.K.Gupta
Chief, NPIC
Prof.& Head
Department of Pharmacology
Coordinator: Dr. Sharda Shah Peshin
(NPIC) Scientist
Department of Pharmacology