Effects of nitrogen addition on nitrogen metabolism and carbon reserves in the temperate seagrass...
18
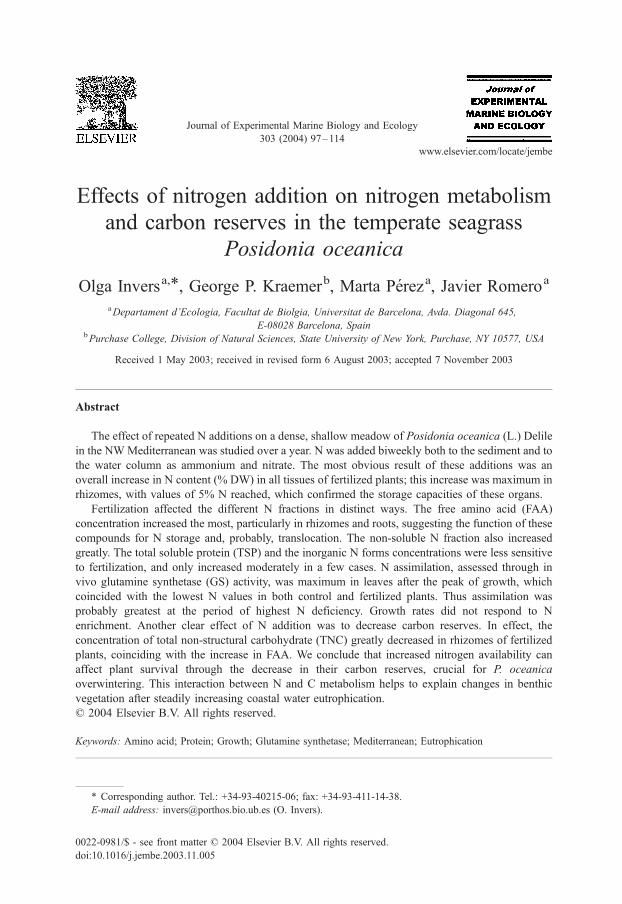
Effects of nitrogen addition on nitrogen metabolism and carbon reserves in the temperate seagrass Posidonia oceanica Olga Invers a, * , George P. Kraemer b , Marta Pe ´rez a , Javier Romero a a Departament d’Ecologia, Facultat de Biolgia, Universitat de Barcelona, Avda. Diagonal 645, E-08028 Barcelona, Spain b Purchase College, Division of Natural Sciences, State University of New York, Purchase, NY 10577, USA Received 1 May 2003; received in revised form 6 August 2003; accepted 7 November 2003 Abstract The effect of repeated N additions on a dense, shallow meadow of Posidonia oceanica (L.) Delile in the NW Mediterranean was studied over a year. N was added biweekly both to the sediment and to the water column as ammonium and nitrate. The most obvious result of these additions was an overall increase in N content (% DW) in all tissues of fertilized plants; this increase was maximum in rhizomes, with values of 5% N reached, which confirmed the storage capacities of these organs. Fertilization affected the different N fractions in distinct ways. The free amino acid (FAA) concentration increased the most, particularly in rhizomes and roots, suggesting the function of these compounds for N storage and, probably, translocation. The non-soluble N fraction also increased greatly. The total soluble protein (TSP) and the inorganic N forms concentrations were less sensitive to fertilization, and only increased moderately in a few cases. N assimilation, assessed through in vivo glutamine synthetase (GS) activity, was maximum in leaves after the peak of growth, which coincided with the lowest N values in both control and fertilized plants. Thus assimilation was probably greatest at the period of highest N deficiency. Growth rates did not respond to N enrichment. Another clear effect of N addition was to decrease carbon reserves. In effect, the concentration of total non-structural carbohydrate (TNC) greatly decreased in rhizomes of fertilized plants, coinciding with the increase in FAA. We conclude that increased nitrogen availability can affect plant survival through the decrease in their carbon reserves, crucial for P. oceanica overwintering. This interaction between N and C metabolism helps to explain changes in benthic vegetation after steadily increasing coastal water eutrophication. D 2004 Elsevier B.V. All rights reserved. Keywords: Amino acid; Protein; Growth; Glutamine synthetase; Mediterranean; Eutrophication 0022-0981/$ - see front matter D 2004 Elsevier B.V. All rights reserved. doi:10.1016/j.jembe.2003.11.005 * Corresponding author. Tel.: +34-93-40215-06; fax: +34-93-411-14-38. E-mail address: [email protected] (O. Invers). www.elsevier.com/locate/jembe Journal of Experimental Marine Biology and Ecology 303 (2004) 97 – 114
-
Upload
independent -
Category
Documents
-
view
0 -
download
0
Transcript of Effects of nitrogen addition on nitrogen metabolism and carbon reserves in the temperate seagrass...
www.elsevier.com/locate/jembe
Journal of Experimental Marine Biology and Ecology
303 (2004) 97–114
Effects of nitrogen addition on nitrogen metabolism
and carbon reserves in the temperate seagrass
Posidonia oceanica
Olga Inversa,*, George P. Kraemerb, Marta Pereza, Javier Romeroa
aDepartament d’Ecologia, Facultat de Biolgia, Universitat de Barcelona, Avda. Diagonal 645,
E-08028 Barcelona, SpainbPurchase College, Division of Natural Sciences, State University of New York, Purchase, NY 10577, USA
Received 1 May 2003; received in revised form 6 August 2003; accepted 7 November 2003
Abstract
The effect of repeated N additions on a dense, shallow meadow of Posidonia oceanica (L.) Delile
in the NWMediterranean was studied over a year. N was added biweekly both to the sediment and to
the water column as ammonium and nitrate. The most obvious result of these additions was an
overall increase in N content (% DW) in all tissues of fertilized plants; this increase was maximum in
rhizomes, with values of 5% N reached, which confirmed the storage capacities of these organs.
Fertilization affected the different N fractions in distinct ways. The free amino acid (FAA)
concentration increased the most, particularly in rhizomes and roots, suggesting the function of these
compounds for N storage and, probably, translocation. The non-soluble N fraction also increased
greatly. The total soluble protein (TSP) and the inorganic N forms concentrations were less sensitive
to fertilization, and only increased moderately in a few cases. N assimilation, assessed through in
vivo glutamine synthetase (GS) activity, was maximum in leaves after the peak of growth, which
coincided with the lowest N values in both control and fertilized plants. Thus assimilation was
probably greatest at the period of highest N deficiency. Growth rates did not respond to N
enrichment. Another clear effect of N addition was to decrease carbon reserves. In effect, the
concentration of total non-structural carbohydrate (TNC) greatly decreased in rhizomes of fertilized
plants, coinciding with the increase in FAA. We conclude that increased nitrogen availability can
affect plant survival through the decrease in their carbon reserves, crucial for P. oceanica
overwintering. This interaction between N and C metabolism helps to explain changes in benthic
vegetation after steadily increasing coastal water eutrophication.
D 2004 Elsevier B.V. All rights reserved.
Keywords: Amino acid; Protein; Growth; Glutamine synthetase; Mediterranean; Eutrophication
0022-0981/$ - see front matter D 2004 Elsevier B.V. All rights reserved.
doi:10.1016/j.jembe.2003.11.005
* Corresponding author. Tel.: +34-93-40215-06; fax: +34-93-411-14-38.
E-mail address: [email protected] (O. Invers).
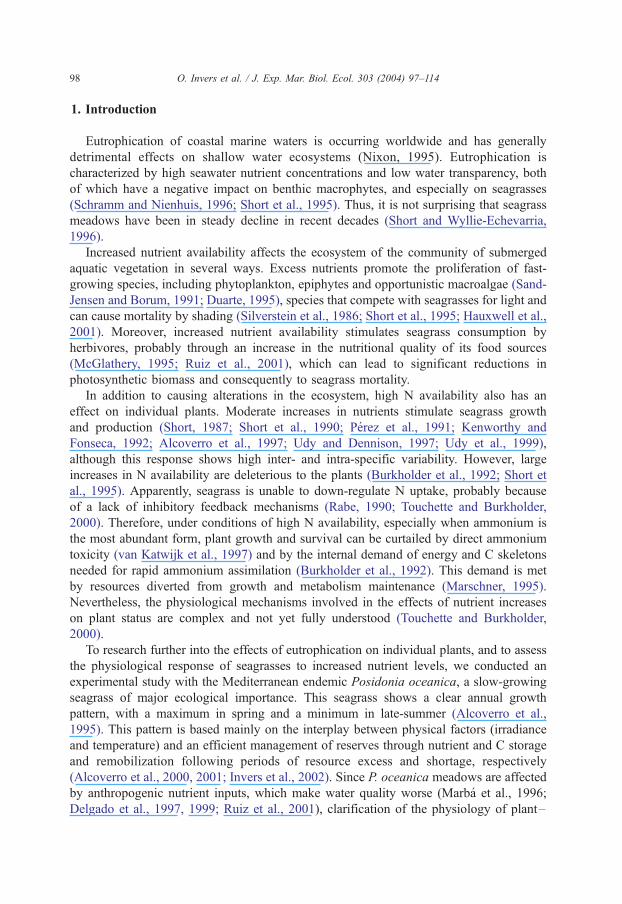
O. Invers et al. / J. Exp. Mar. Biol. Ecol. 303 (2004) 97–11498
1. Introduction
Eutrophication of coastal marine waters is occurring worldwide and has generally
detrimental effects on shallow water ecosystems (Nixon, 1995). Eutrophication is
characterized by high seawater nutrient concentrations and low water transparency, both
of which have a negative impact on benthic macrophytes, and especially on seagrasses
(Schramm and Nienhuis, 1996; Short et al., 1995). Thus, it is not surprising that seagrass
meadows have been in steady decline in recent decades (Short and Wyllie-Echevarria,
1996).
Increased nutrient availability affects the ecosystem of the community of submerged
aquatic vegetation in several ways. Excess nutrients promote the proliferation of fast-
growing species, including phytoplankton, epiphytes and opportunistic macroalgae (Sand-
Jensen and Borum, 1991; Duarte, 1995), species that compete with seagrasses for light and
can cause mortality by shading (Silverstein et al., 1986; Short et al., 1995; Hauxwell et al.,
2001). Moreover, increased nutrient availability stimulates seagrass consumption by
herbivores, probably through an increase in the nutritional quality of its food sources
(McGlathery, 1995; Ruiz et al., 2001), which can lead to significant reductions in
photosynthetic biomass and consequently to seagrass mortality.
In addition to causing alterations in the ecosystem, high N availability also has an
effect on individual plants. Moderate increases in nutrients stimulate seagrass growth
and production (Short, 1987; Short et al., 1990; Perez et al., 1991; Kenworthy and
Fonseca, 1992; Alcoverro et al., 1997; Udy and Dennison, 1997; Udy et al., 1999),
although this response shows high inter- and intra-specific variability. However, large
increases in N availability are deleterious to the plants (Burkholder et al., 1992; Short et
al., 1995). Apparently, seagrass is unable to down-regulate N uptake, probably because
of a lack of inhibitory feedback mechanisms (Rabe, 1990; Touchette and Burkholder,
2000). Therefore, under conditions of high N availability, especially when ammonium is
the most abundant form, plant growth and survival can be curtailed by direct ammonium
toxicity (van Katwijk et al., 1997) and by the internal demand of energy and C skeletons
needed for rapid ammonium assimilation (Burkholder et al., 1992). This demand is met
by resources diverted from growth and metabolism maintenance (Marschner, 1995).
Nevertheless, the physiological mechanisms involved in the effects of nutrient increases
on plant status are complex and not yet fully understood (Touchette and Burkholder,
2000).
To research further into the effects of eutrophication on individual plants, and to assess
the physiological response of seagrasses to increased nutrient levels, we conducted an
experimental study with the Mediterranean endemic Posidonia oceanica, a slow-growing
seagrass of major ecological importance. This seagrass shows a clear annual growth
pattern, with a maximum in spring and a minimum in late-summer (Alcoverro et al.,
1995). This pattern is based mainly on the interplay between physical factors (irradiance
and temperature) and an efficient management of reserves through nutrient and C storage
and remobilization following periods of resource excess and shortage, respectively
(Alcoverro et al., 2000, 2001; Invers et al., 2002). Since P. oceanica meadows are affected
by anthropogenic nutrient inputs, which make water quality worse (Marba et al., 1996;
Delgado et al., 1997, 1999; Ruiz et al., 2001), clarification of the physiology of plant–
O. Invers et al. / J. Exp. Mar. Biol. Ecol. 303 (2004) 97–114 99
nutrient interactions is not only relevant in research terms, as indicated above. It can also
assist management and conservation.
We studied the effect of experimental N additions over a year on the main descriptors of
N metabolism, as well as on the C reserves in the different plant organs.
We aimed to:
(i) identify the N pools, as inorganic N, free amino acids (FAA) and total soluble protein
(TSP) at the different organs (i.e. leaves, roots, rhizomes), and in which of those
organs the excess N accumulates;
(ii) determine whether the general annual patterns of growth and nutrient storage are
modified by N addition, and
(iii) evaluate the effects of N addition on carbohydrate storage by testing the hypothesis
that excess leads to a decrease in carbohydrate pools.
2. Material and methods
2.1. Study site and field work
The study was conducted in a dense (ca. 600 shoots m� 2) and shallow (5 m deep) stand
of P. oceanica situated close to the Medes Islands (Girona, NE Spain). Six randomly
selected plots, 50� 50 cm, ca. 20 m apart were permanently marked: three were enriched
with N every 15 days, while three remained as controls. N was added to the sediment using
slow-release commercial fertilizers which contained nitrate and ammonium (molar ratio
1:1; manufactured by AMOSA, Spain). Water surrounding shoots was N-enriched by
placing plaster balls made of an ammonium-nitrate solution and covered by perforated
wax inside the canopy. These balls were prepared to decay completely in about 15 days.
Nutrient loading amounted to 60–100 g N m� 2 month� 1 in the sediment and 10 g N m� 2
month� 1 in the water.
The experiment started in April 1996 and ended in March 1997. Every 2 months, 10
shoots from each plot were punched to measure shoot growth, following a modified
Zieman method (Zieman, 1974; Romero, 1989). One month after marking, these plants
were collected and transported to the laboratory in aerated plastic containers, where they
were kept overnight in aerated seawater collected at the same sampling site and at the
same temperature as in the field. Plants were processed (growth, N analysis, enzymatic
activity, etc.) the following day. This resulted in a total of six tissue samples and growth
measurements (May, July, September and November 1996 and January and March
1997).
2.2. Plant processing
Shoot growth was determined by measuring the distance between the ligula and the
position of the holes of each leaf (see details in Alcoverro et al., 1995) and expressed in
cm2 shoot� 1 day� 1. Shoots were then used to measure inorganic N, FAA and TSP
concentration, in vivo glutamine synthetase (GS) activity, and total N and total non-
structural carbohydrate (TNC) content. For each analysis, several shoots from each plot
O. Invers et al. / J. Exp. Mar. Biol. Ecol. 303 (2004) 97–114100
were pooled, resulting in three independent estimates (one per plot) for each variable.
Before the analysis, epiphytes were removed carefully with a razor blade and the shoots
were then sorted into the following parts: young leaf tissue (0–50 days old), intermediate
leaf tissue (50–100 days old), old leaf tissue (100–150 days old), rhizomes (the
uppermost 1 cm), and roots (avoiding the most lignified). Leaf age was determined
following Alcoverro et al. (2000).
Shoots selected for in vivo GS activity measurements were kept in fresh seawater for
immediate assay, while tissues for total N content and TNC determinations were dried at
70 jC until constant weight. The rest of the plant material was frozen in liquid N until
processing.
2.3. Analytical procedures
GS activity was evaluated following the method developed by Kraemer and Mazzella
(1996), based on the in vivo nitrate reductase assay described by Gao et al. (1992), and
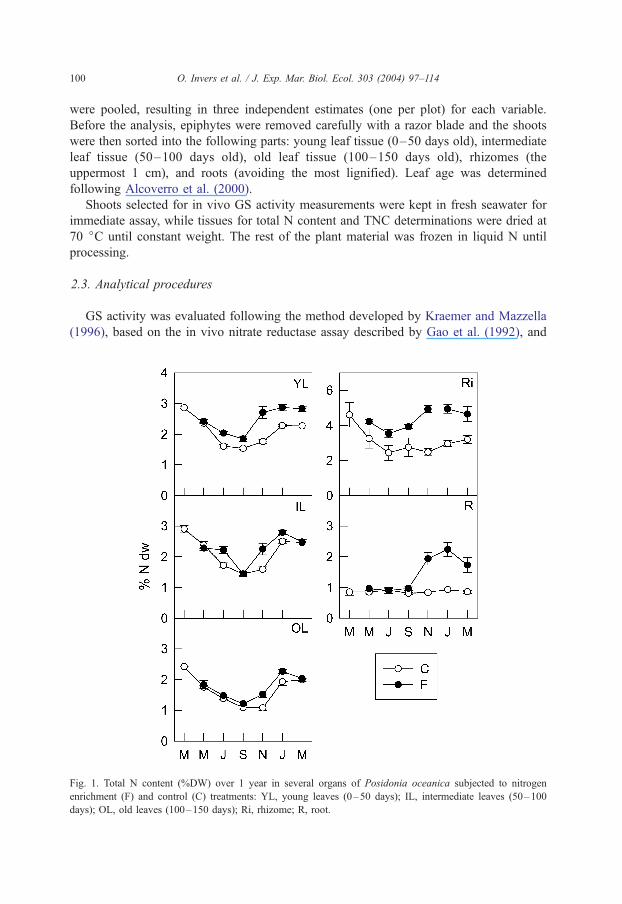
Fig. 1. Total N content (%DW) over 1 year in several organs of Posidonia oceanica subjected to nitrogen
enrichment (F) and control (C) treatments: YL, young leaves (0–50 days); IL, intermediate leaves (50–100
days); OL, old leaves (100–150 days); Ri, rhizome; R, root.
O. Invers et al. / J. Exp. Mar. Biol. Ecol. 303 (2004) 97–114 101
following the in vitro GS assay used by Pregnall et al. (1987). To show seasonal shifts
in GS activity (combination of enzyme quantity and activation), pieces of fresh tissue
were incubated for one hour at 20 jC in 14 ml of incubation medium for all sampling
events. The incubation medium was prepared with seawater with additions of hydrox-
ylamine and glutamine as substrates to reach final concentrations of 150 and 50 mM,
respectively. To facilitate the influx of substrates and the efflux of the product, 1-
propanol (3% v/v) was also added to permeabilize tissues. The product (g-glutamyl
hydroxamate) was quantified spectrophotometrically at 540 nm. In vivo GS activity was
expressed as Amol g-glutamyl hydroxamate g� 1DW h� 1, which is equivalent to Amol N
g� 1DW h� 1.
Inorganic N (ammonium, nitrite and nitrate) and TSP were extracted by grinding
frozen tissues in 20 ml deionized water. The extract was then centrifuged for 15
min at 11,600 rpm (Lapointe and Duke, 1984). The concentrations of inorganic N
and TSP were measured in the supernatant, previously diluted for the ammonium
and nitrate and nitrite (1:2 and 1:5, respectively). Ammonium concentration was
measured using a Technicon II Autoanalyzer (Koroleff method; Grasshoff et al.,
1983). Nitrate and nitrite concentrations were established by Ionic Chromatography,
following EPA 9056 procedures, with a KONIK KNK 500-A liquid chromatograph
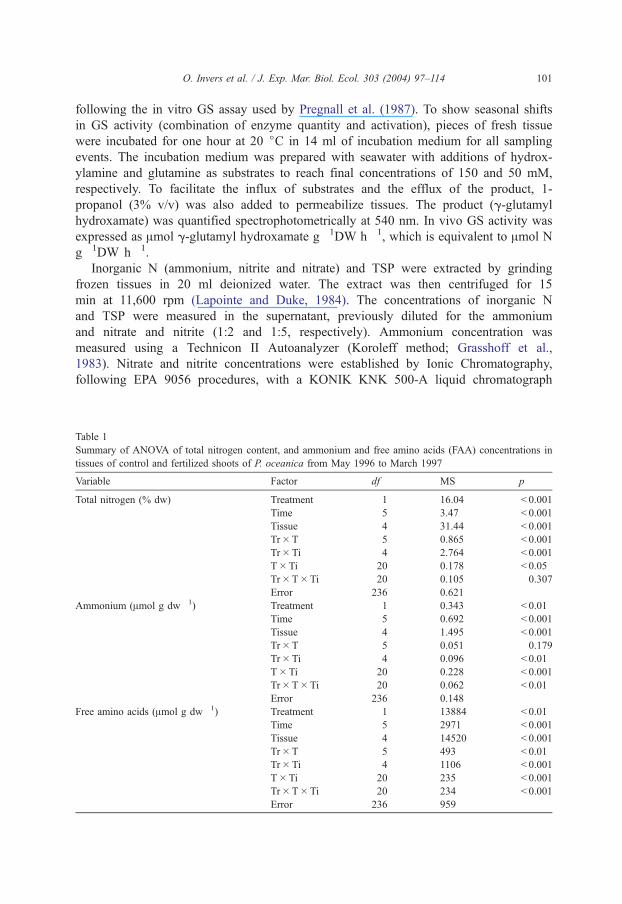
Table 1
Summary of ANOVA of total nitrogen content, and ammonium and free amino acids (FAA) concentrations in
tissues of control and fertilized shoots of P. oceanica from May 1996 to March 1997
Variable Factor df MS p
Total nitrogen (% dw) Treatment 1 16.04 < 0.001
Time 5 3.47 < 0.001
Tissue 4 31.44 < 0.001
Tr�T 5 0.865 < 0.001
Tr�Ti 4 2.764 < 0.001
T�Ti 20 0.178 < 0.05
Tr�T�Ti 20 0.105 0.307
Error 236 0.621
Ammonium (Amol g dw� 1) Treatment 1 0.343 < 0.01
Time 5 0.692 < 0.001
Tissue 4 1.495 < 0.001
Tr�T 5 0.051 0.179
Tr�Ti 4 0.096 < 0.01
T�Ti 20 0.228 < 0.001
Tr�T�Ti 20 0.062 < 0.01
Error 236 0.148
Free amino acids (Amol g dw� 1) Treatment 1 13884 < 0.01
Time 5 2971 < 0.001
Tissue 4 14520 < 0.001
Tr�T 5 493 < 0.01
Tr�Ti 4 1106 < 0.001
T�Ti 20 235 < 0.001
Tr�T�Ti 20 234 < 0.001
Error 236 959
O. Invers et al. / J. Exp. Mar. Biol. Ecol. 303 (2004) 97–114102
and a WATERS IC-PAK ANIONS column. TSP was determined using the
bicinchoninic acid assay described by Smith et al. (1985) and Brown et al. (1989).
For calculations of N content in soluble proteins, we assumed that TSP averaged 6.25%
N by mass.
For FAA determination, frozen tissues were ground in 20 ml of 0.05 N HCl, and
then centrifuged for 5 min at 10,000 rpm. The supernatant was filtered in a microfuge
using low-binding regenerated cellulose Millipore ultra-free filters to exclude peptides
with molecular weights higher than 10,000 D. The FAA content was measured using
an amino acid autoanalyzer via ionic exchange chromatography, following the method
of Spackman et al. (1958). For simplicity, we considered here only the total FAA
concentration. Total N content (% DW) was determined using a Carlo-Erba CNH
elemental autoanalyzer. TNC was measured according to the method described in
Alcoverro et al. (1999), based on Yemm and Williams (1954). Sugars (sucrose and
hexoses) were solubilized from dry and ground tissues by four sequential extractions in
95% (v/v) ethanol at 80 jC for 15 min. The ethanol extracts were evaporated under a
stream of room temperature air and the residues dissolved in deionized water for
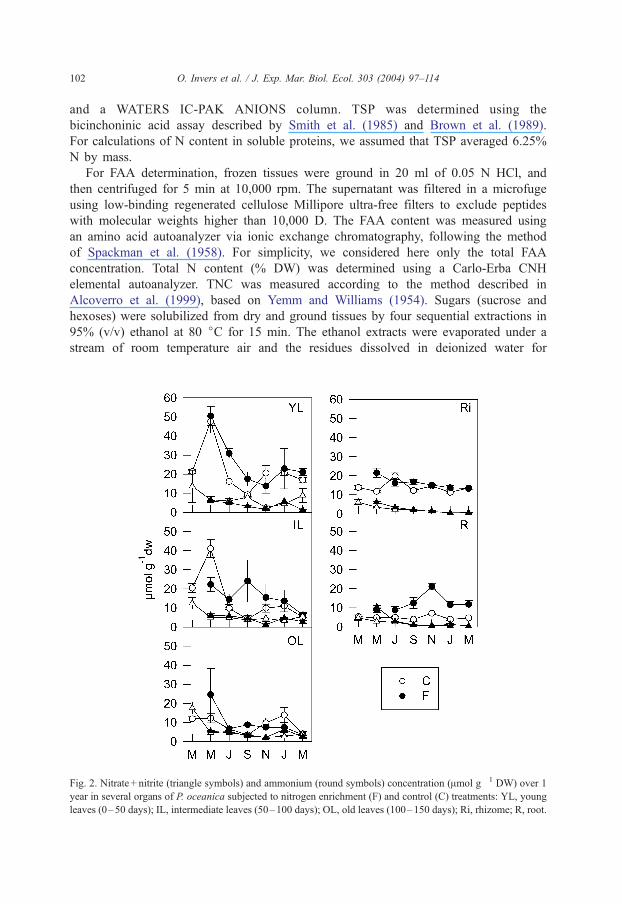
Fig. 2. Nitrate + nitrite (triangle symbols) and ammonium (round symbols) concentration (Amol g� 1 DW) over 1
year in several organs of P. oceanica subjected to nitrogen enrichment (F) and control (C) treatments: YL, young
leaves (0–50 days); IL, intermediate leaves (50–100 days); OL, old leaves (100–150 days); Ri, rhizome; R, root.
O. Invers et al. / J. Exp. Mar. Biol. Ecol. 303 (2004) 97–114 103
analysis. Starch was extracted from the ethanol-insoluble residue by keeping it for 24
h in 1 N NaOH. Sugar and starch contents of extracts were determined spectropho-
tometrically using a resorcinol and anthrone assay, respectively, with sucrose as
standard.
2.4. Statistics
The statistical significance of variability found between sampling events (factor ‘time’),
between plant parts (factor ‘tissue’), and between treated and untreated plots (factor
‘treatment’) of the distinct dependent variables (GS activity, inorganic N, FAA and TSP
concentration, total N and TNC content) was tested using three-way, repeated ANOVA,
with two within-subject factors (‘time’ and ‘tissue’) and one between-subject factor
(‘treatment’). Statistical significance of changes in growth was tested by two-way repeated
ANOVA, ‘time’ being the within-subject factor and ‘treatment’ the between-subject factor.
When necessary, significance of differences between experimental conditions was
assessed by the Tukey post-hoc test.
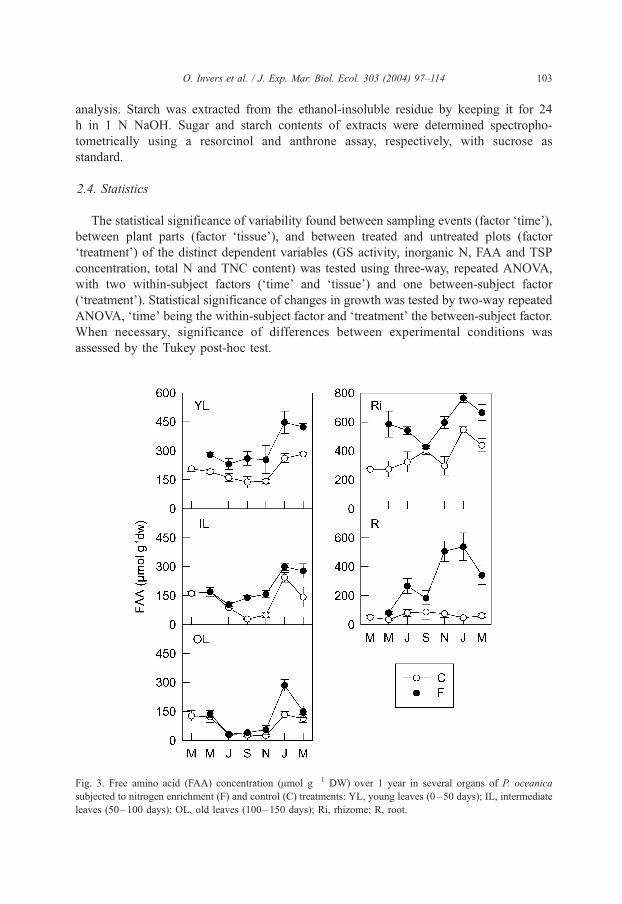
Fig. 3. Free amino acid (FAA) concentration (Amol g� 1 DW) over 1 year in several organs of P. oceanica
subjected to nitrogen enrichment (F) and control (C) treatments: YL, young leaves (0–50 days); IL, intermediate
leaves (50–100 days); OL, old leaves (100–150 days); Ri, rhizome; R, root.
O. Invers et al. / J. Exp. Mar. Biol. Ecol. 303 (2004) 97–114104
3. Results
3.1. Total N content
N addition increased total N content significantly in all the parts of P. oceanica
studied (Fig. 1; Table 1, p < 0.001). The precise effect depended on the tissue and
the time of the year (Table 1, significant interactions, p < 0.01 and p < 0.001,
respectively). In leaves, the increase (yearly averaged) ranged from ca. 13% to
26% (old leaves and young leaves, respectively) above the values of control
plants. Rhizomes showed the highest N content and also the greatest response to
N addition, 55% above control plants (annual average). Roots had the lowest N
content and only responded to treatment from November onwards (eight months
after start of fertilization), when a considerable increase in N content (ca. 43%)
was observed (significant time� treatment interaction, Table 1; p < 0.001). The N
content of leaves and rhizomes showed a similar annual trend under both control
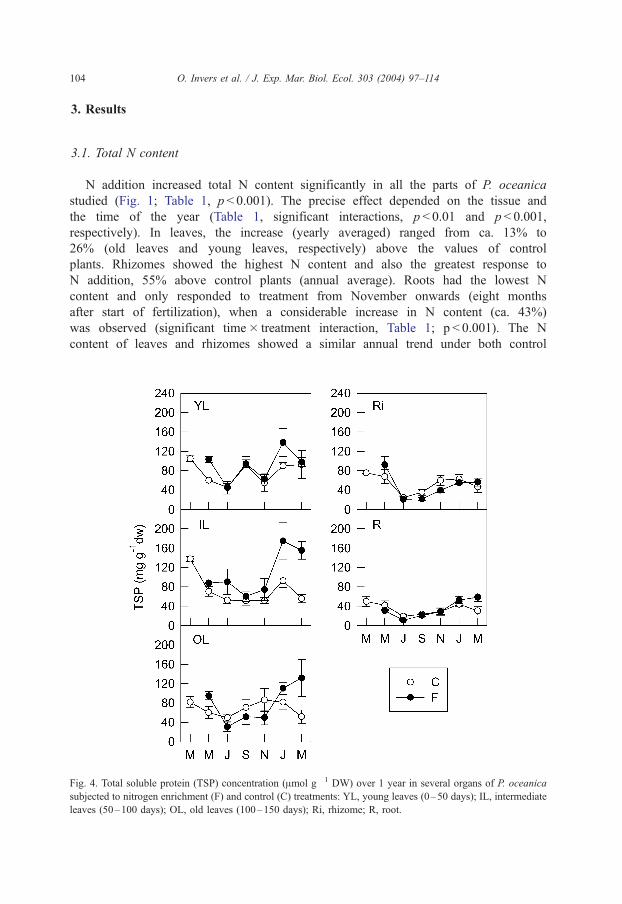
Fig. 4. Total soluble protein (TSP) concentration (Amol g� 1 DW) over 1 year in several organs of P. oceanica
subjected to nitrogen enrichment (F) and control (C) treatments: YL, young leaves (0–50 days); IL, intermediate
leaves (50–100 days); OL, old leaves (100–150 days); Ri, rhizome; R, root.
O. Invers et al. / J. Exp. Mar. Biol. Ecol. 303 (2004) 97–114 105
and fertilized conditions, with a decrease from spring to summer and an increase
in winter.
3.2. Soluble N compounds
All inorganic N forms remained in low concentrations in both control and treated
plants, accounting for a small part of the soluble nitrogen measured, from less than
1% to 5% dw. Ammonium was the main form of inorganic nitrogen, accounting for
50–90% of this pool. It increased significantly in plants from fertilized plots,
throughout the year in roots and only in spring–summer in rhizomes and in young
and intermediate leaves (Fig. 2, Table 1). Nitrate and nitrite accounted for only a small
fraction of total inorganic N compounds, and their concentrations did not change due
to N addition.
FAA concentration in tissues of fertilized plants increased significantly (Fig.
3; Table 1, p < 0.001). Leaf response differed depending on the age class:
young leaves showed a moderate but constant increase (1.6-fold) throughout the
Table 2
Summary of ANOVA of total soluble protein concentration in all tissues of control and fertilized shoots of P.
oceanica from May 1996 to March 1997, and in vivo GS activity in leaves and roots (May 1996 to March 1997)
and of in vivo GS activity in all tissues (from July 1996 to March 1997)
Variable Factor df MS p
Total soluble protein
(mg g dw� 1)
Treatment 1 11407 < 0.01
Time 5 12525 < 0.001
Tissue 4 20751 < 0.001
Tr�T 5 4998 < 0.001
Tr�Ti 4 4012 < 0.001
T�Ti 20 1570 < 0.001
Tr�T�Ti 20 1007 < 0.01
Error 236 2415
In vivo GS activity:
leaves and roots (Amol N g� 1dw h� 1)
Treatment 1 2.0 0.863
Time 5 1027.5 < 0.001
Tissue 3 4946.26 < 0.001
Tr�T 5 218.68 < 0.05
Tr�Ti 3 16.46 0.249
T�Ti 15 130.80 < 0.001
Tr�T�Ti 15 83.19 < 0.01
Error 188 238.7
In vivo GS activity:
all tissues (Amol N g� 1dw h� 1)
Treatment 1 0.7 0.898
Time 4 290.6 < 0.01
Tissue 4 5437.50 < 0.001
Tr�T 4 214.66 < 0.05
Tr�Ti 4 7.27 0.766
T�Ti 16 73.30 < 0.01
Tr�T�Ti 16 83.92 < 0.001
Error 196 244.3
O. Invers et al. / J. Exp. Mar. Biol. Ecol. 303 (2004) 97–114106
year, intermediate leaves only showed this increase in late summer and autumn
(4.7- and 3.2-fold, respectively), while old leaves were only moderately enriched
in winter (2.2-fold in January). FAA concentration in rhizomes was also
moderately higher in fertilized than in control plants (1.6-fold, annual average),
whereas the response in roots was the sharpest and strongly seasonal (ca. 11-fold in
winter).
Fertilization also raised significantly the concentration of TSP in leaves of P. oceanica
from the fertilized plots (Fig. 4; Table 2, p < 0.01), mainly in winter and spring. TSP in
rhizomes and roots did not show any response to treatment.
3.3. In vivo GS activity
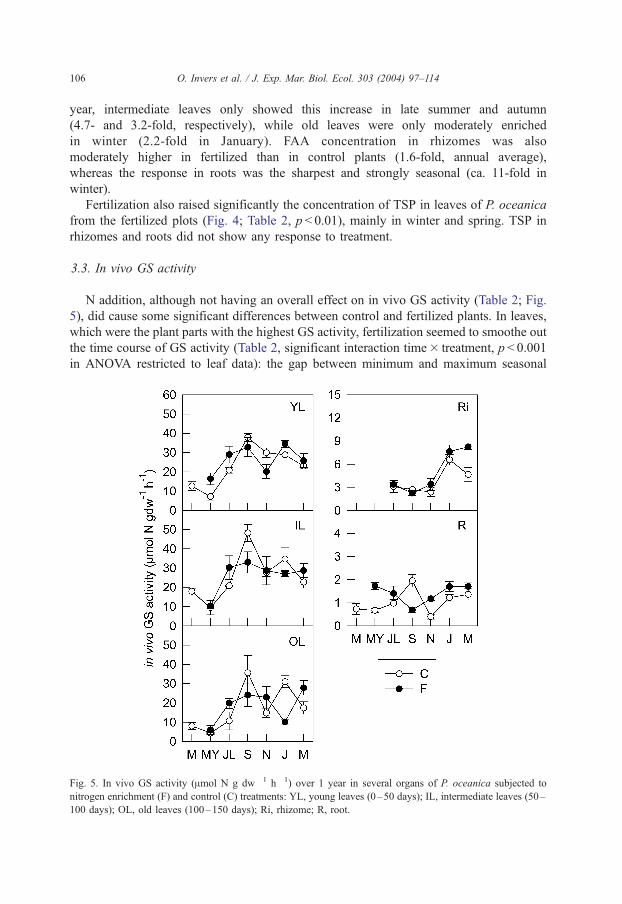
N addition, although not having an overall effect on in vivo GS activity (Table 2; Fig.
5), did cause some significant differences between control and fertilized plants. In leaves,
which were the plant parts with the highest GS activity, fertilization seemed to smoothe out
the time course of GS activity (Table 2, significant interaction time� treatment, p < 0.001
in ANOVA restricted to leaf data): the gap between minimum and maximum seasonal
Fig. 5. In vivo GS activity (Amol N g dw� 1 h� 1) over 1 year in several organs of P. oceanica subjected to
nitrogen enrichment (F) and control (C) treatments: YL, young leaves (0–50 days); IL, intermediate leaves (50–
100 days); OL, old leaves (100–150 days); Ri, rhizome; R, root.
O. Invers et al. / J. Exp. Mar. Biol. Ecol. 303 (2004) 97–114 107
values was lower in fertilized than in control plants. N addition also modified the seasonal
pattern of GS activity in roots, inducing maximum values in May, while maximum values
in control plants were found in September. There was also a seasonal increase in this
activity in fertilized plants in spring (in March for rhizomes and in May for young leaves
and roots).
3.4. TNC
N addition significantly reduced the TNC content of P. oceanica tissues (Table 3,
p < 0.01), which was especially sharp in rhizomes, the organs with the highest TNC
content in unmanipulated conditions (Fig. 6). This decrease occurred throughout the
year, though not uniformly (significant interaction treatment� time of two-way
ANOVA restricted to rhizome data, p < 0.005). In spring–summer (from March to
July) the TNC content of rhizomes of fertilized plants was 22% lower than in
controls, while from autumn to winter this decrease was almost 50%. The time
course of TNC content of leaves and roots (of control and fertilized plants) showed
maximum values in summer and low values in autumn–winter, as did the rhizomes
of fertilized plants. However, the rhizomes of controls showed a distinct seasonal
trend, with high values in summer that were maintained up to the end of the annual
cycle.
3.5. Shoot growth
Leaf growth rates were lower in fertilized than in control plants ( p < 0.01, Table 3)
during most of the study period (Fig. 7). However, when these rates were expressed
as specific growth rates (day� 1), differences disappeared because of the smaller size
of fertilized shoots from the very beginning of the experiment (two-way ANOVA,
p < 0.01). Therefore, the differences in growth rates cannot be attributed to fertiliza-
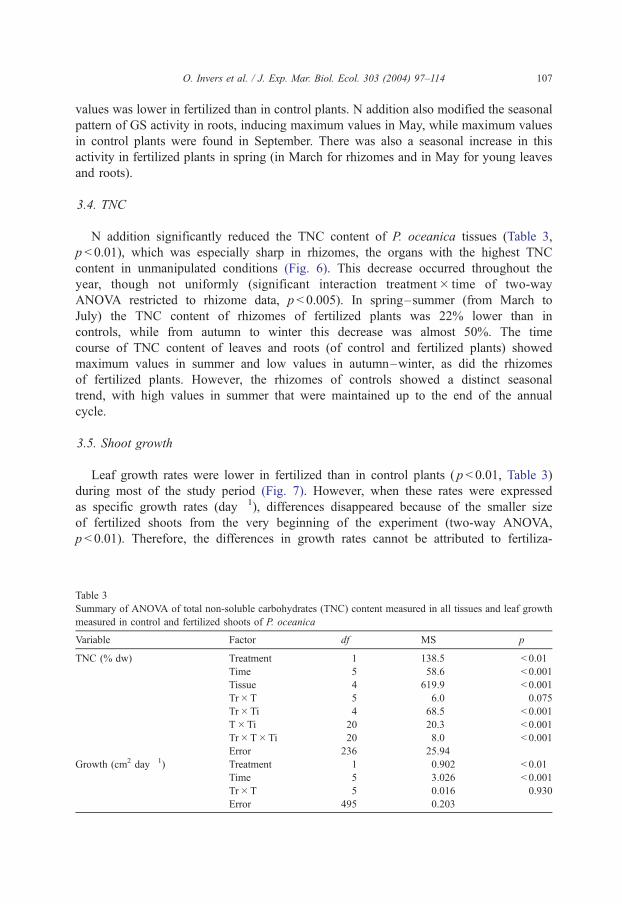
Table 3
Summary of ANOVA of total non-soluble carbohydrates (TNC) content measured in all tissues and leaf growth
measured in control and fertilized shoots of P. oceanica
Variable Factor df MS p
TNC (% dw) Treatment 1 138.5 < 0.01
Time 5 58.6 < 0.001
Tissue 4 619.9 < 0.001
Tr�T 5 6.0 0.075
Tr�Ti 4 68.5 < 0.001
T�Ti 20 20.3 < 0.001
Tr�T�Ti 20 8.0 < 0.001
Error 236 25.94
Growth (cm2 day� 1) Treatment 1 0.902 < 0.01
Time 5 3.026 < 0.001
Tr�T 5 0.016 0.930
Error 495 0.203
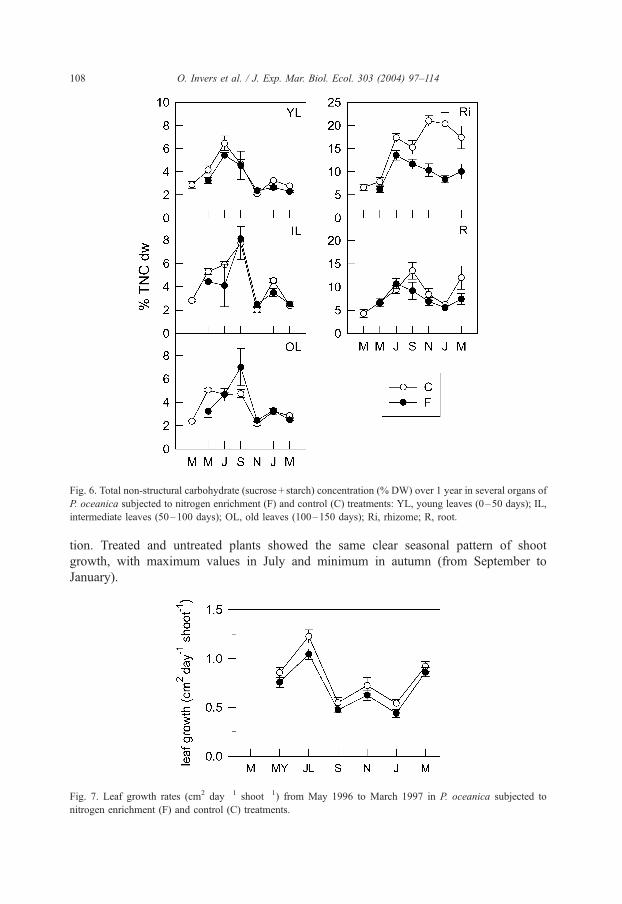
Fig. 6. Total non-structural carbohydrate (sucrose + starch) concentration (% DW) over 1 year in several organs of
P. oceanica subjected to nitrogen enrichment (F) and control (C) treatments: YL, young leaves (0–50 days); IL,
intermediate leaves (50–100 days); OL, old leaves (100–150 days); Ri, rhizome; R, root.
O. Invers et al. / J. Exp. Mar. Biol. Ecol. 303 (2004) 97–114108
tion. Treated and untreated plants showed the same clear seasonal pattern of shoot
growth, with maximum values in July and minimum in autumn (from September to
January).
Fig. 7. Leaf growth rates (cm2 day� 1 shoot� 1) from May 1996 to March 1997 in P. oceanica subjected to
nitrogen enrichment (F) and control (C) treatments.
O. Invers et al. / J. Exp. Mar. Biol. Ecol. 303 (2004) 97–114 109
4. Discussion
The increase observed here in total N content has been repeatedly reported in this and
another species as the main response of seagrass to nitrogen additions, whether experi-
mental or not (Duarte, 1990; Perez et al., 1991; Erftemeijer et al., 1994; Udy and
Dennison, 1997; Udy et al., 1999). However, this increase differentially altered the distinct
N pools: TSP and inorganic N compounds were little affected, while the excess of N
incorporated by fertilized plants appeared mostly as FAA. In addition, there was a fraction
of the total N increase in rhizomes unexplained by soluble N compounds. This should
correspond to non-soluble compounds, similar to what occurs in some terrestrial plants
(Nordin and Nasholm, 1997). The response in FAA and non-soluble N pools was more
evident at the period of maximum N content (January, for control plants). At this time of
the year, both categories of N compounds showed their maximum increase with
fertilization (Table 4): FAA increased by from 1.4 to 10-fold (depending on tissue) and
non-soluble N by 2.5-fold (only in rhizomes), suggesting a possible storage role for these
compounds.
In contrast, it seems clear that P. oceanica does not store N in inorganic form. Nitrate
concentration in tissues is very low throughout the year and was not affected by
fertilization, which is consistent with the generally limited capacity of seagrasses to store
nitrate, even under high availability (Touchette and Burkholder, 2000). This limited
capacity contrasts with that of many terrestrial plants and macroalgae to store N as
nitrate (Bidwell, 1974; Vergara, 1993; Lapointe and Duke, 1984). Ammonium concen-
tration was higher and did react to fertilization, although its increase was only a minor
part of total N increase (see Table 4). Ammonium is toxic to seagrasses (van Katwijk et
al., 1997; Touchette and Burkholder, 2000). Given the lack of inhibitory feedback on its
uptake, it is reasonable to assume that the increase of intracellular ammonium caused by
fertilization will be closely followed by an increase in its assimilation into organic
forms. This explains the very small response of ammonium pools to fertilization, which
was effectively reflected in higher FAA concentrations. The first step in assimilation is
the combination of ammonium with glutamate to produce glutamine, which was the
most abundant FAA in roots of fertilized plants. The assimilation process, which is
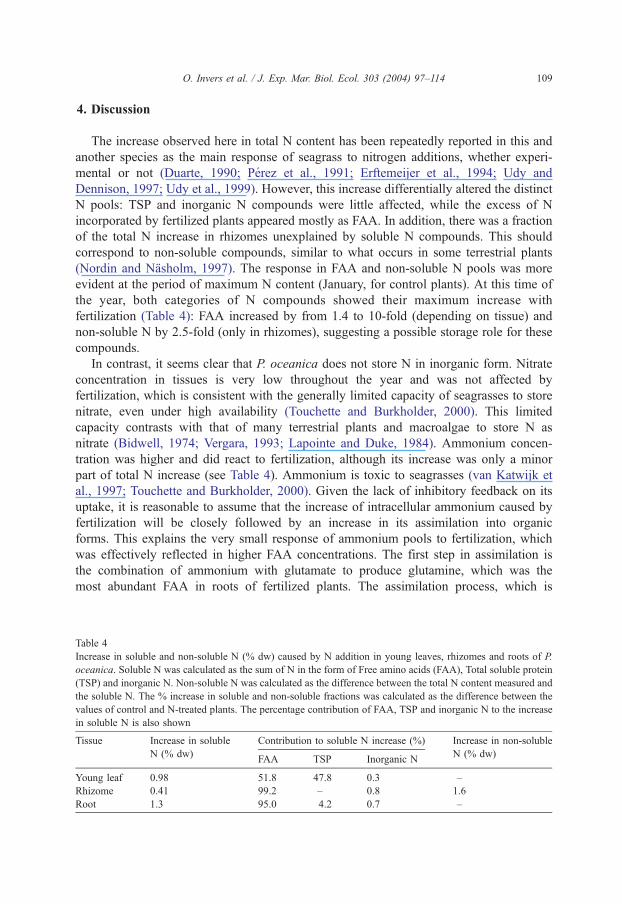
Table 4
Increase in soluble and non-soluble N (% dw) caused by N addition in young leaves, rhizomes and roots of P.
oceanica. Soluble N was calculated as the sum of N in the form of Free amino acids (FAA), Total soluble protein
(TSP) and inorganic N. Non-soluble N was calculated as the difference between the total N content measured and
the soluble N. The % increase in soluble and non-soluble fractions was calculated as the difference between the
values of control and N-treated plants. The percentage contribution of FAA, TSP and inorganic N to the increase
in soluble N is also shown
Tissue Increase in soluble Contribution to soluble N increase (%) Increase in non-soluble
N (% dw)FAA TSP Inorganic N
N (% dw)
Young leaf 0.98 51.8 47.8 0.3 –
Rhizome 0.41 99.2 – 0.8 1.6
Root 1.3 95.0 4.2 0.7 –
O. Invers et al. / J. Exp. Mar. Biol. Ecol. 303 (2004) 97–114110
energy-dependent, is catalyzed by GS and uses ATP derived from photosynthesis
(Kraemer et al., 1997). Some studies showed that GS activity correlates positively with
N availability (Pregnall et al., 1987; Kraemer et al., 1997), but others reported that GS
enzyme activity does not follow external N availability conditions, and is mostly
controlled by internal requirements (Finneman and Schjoerring, 1998; Thompson and
Valiela, 1999). In our experiment, a significant overall increase in the GS activity of
fertilized plants was not detected, although we found some increase in spring, the period
of maximum leaf elongation, and, consequently, the period of maximum N demand. This
weak relationship between GS activity and N conditions suggests a similar potential N
assimilation in plants, independently of their N environment, as indicated by our
determinations performed with saturating concentrations of substrates. Under natural
conditions, however, GS activities should show differences responding to different
substrate concentrations, given the differences in N content between control and
fertilized plants.
N does not seem to be the growth-limiting factor in the meadow studied, as indicated by
the absence of response of leaf elongation to fertilization. This lack of N limitation may be
due to efficient seasonal nutrient use by the plant, which has an annual cycle characterized
by one period (autumn and winter) in which N supply exceeds the demand for growth,
with the surplus being stored in plant tissues, and one period (spring–summer) in which
the demand for growth exceeds the external supply and the reserves are mobilized
(Alcoverro et al., 2000; Invers et al., 2002). Under conditions of high nitrogen availability,
such as those in the treated plots, internal nutrient imbalances can be induced (or
aggravated), leading to, for instance, C or P limitation (Burkholder et al., 1992; Udy
and Dennison, 1997). In fact, the main effect of fertilization was to enhance the build-up of
N reserves, as shown by the maximum differences in total N content between treated and
untreated plants in autumn and winter. These differences were especially high in rhizomes,
confirming their role as main sites for N storage. The maximum N content found in our
study was 5% DW (rhizomes of fertilized plants in winter), the maximum ever reported for
this species as far as we are aware (see Delgado et al., 1997; Ruiz et al., 2001). It is
probably the upper limit for N storage.
The increase in N availability interfered with carbon metabolism, with a decrease in
TNC content in rhizomes. This decrease in carbon reserves was greatest from autumn to
early spring, coinciding with the maximum N increase caused by fertilization. N
assimilation requires energy and C skeletons; these resources are diverted from carbohy-
drate metabolism, thus explaining the decrease in carbohydrate content when N assim-
ilation is stimulated (see, for Zostera marina, Burkholder et al., 1992; van Katwijk et al.,
1997; and for terrestrial plants, Marschner, 1995). In our study, the diversion of C to
support increased synthesis of FAA as inorganic N is taken up (see above) may largely
explain the decrease observed in TNC in shoots. In fact, there was significant correlation
between the increase in C bound to FAA and the decrease in TNC, indicating the
reduction of rhizome C reserves to support the formation of N stores in all plant tissues
(Fig. 8).
Carbohydrate reserves in temperate seagrasses are crucial for survival during episodes
of low light availability, especially during winter, in which the C balance can be negative
(Pirc, 1985; Burke et al., 1996; Alcoverro et al., 2001). Specifically, the use of internal C
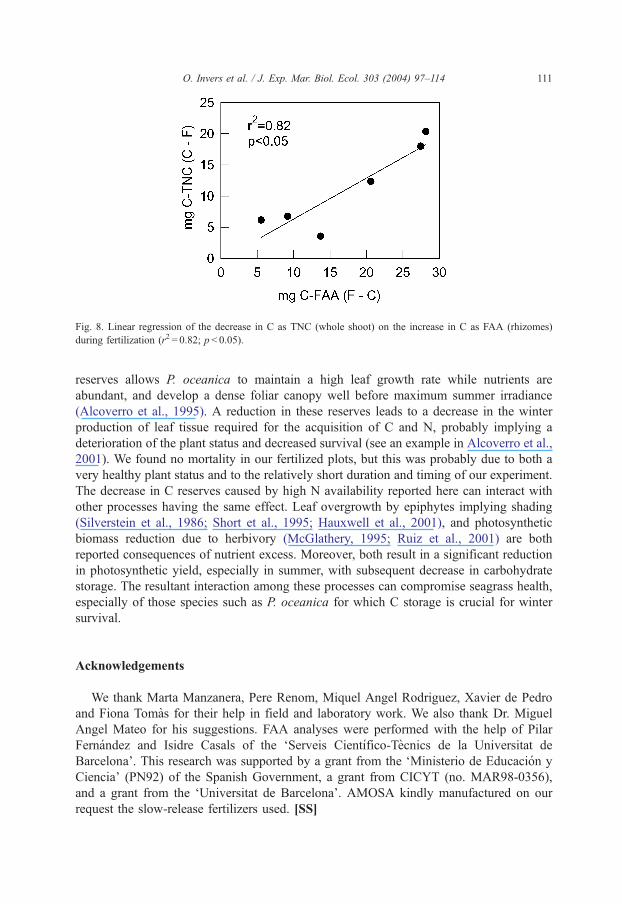
Fig. 8. Linear regression of the decrease in C as TNC (whole shoot) on the increase in C as FAA (rhizomes)
during fertilization (r2 = 0.82; p< 0.05).
O. Invers et al. / J. Exp. Mar. Biol. Ecol. 303 (2004) 97–114 111
reserves allows P. oceanica to maintain a high leaf growth rate while nutrients are
abundant, and develop a dense foliar canopy well before maximum summer irradiance
(Alcoverro et al., 1995). A reduction in these reserves leads to a decrease in the winter
production of leaf tissue required for the acquisition of C and N, probably implying a
deterioration of the plant status and decreased survival (see an example in Alcoverro et al.,
2001). We found no mortality in our fertilized plots, but this was probably due to both a
very healthy plant status and to the relatively short duration and timing of our experiment.
The decrease in C reserves caused by high N availability reported here can interact with
other processes having the same effect. Leaf overgrowth by epiphytes implying shading
(Silverstein et al., 1986; Short et al., 1995; Hauxwell et al., 2001), and photosynthetic
biomass reduction due to herbivory (McGlathery, 1995; Ruiz et al., 2001) are both
reported consequences of nutrient excess. Moreover, both result in a significant reduction
in photosynthetic yield, especially in summer, with subsequent decrease in carbohydrate
storage. The resultant interaction among these processes can compromise seagrass health,
especially of those species such as P. oceanica for which C storage is crucial for winter
survival.
Acknowledgements
We thank Marta Manzanera, Pere Renom, Miquel Angel Rodriguez, Xavier de Pedro
and Fiona Tomas for their help in field and laboratory work. We also thank Dr. Miguel
Angel Mateo for his suggestions. FAA analyses were performed with the help of Pilar
Fernandez and Isidre Casals of the ‘Serveis Cientıfico-Tecnics de la Universitat de
Barcelona’. This research was supported by a grant from the ‘Ministerio de Educacion y
Ciencia’ (PN92) of the Spanish Government, a grant from CICYT (no. MAR98-0356),
and a grant from the ‘Universitat de Barcelona’. AMOSA kindly manufactured on our
request the slow-release fertilizers used. [SS]
O. Invers et al. / J. Exp. Mar. Biol. Ecol. 303 (2004) 97–114112
References
Alcoverro, T., Duarte, C.M., Romero, J., 1995. Annual growth dynamics of Posidonia oceanica: contribution of
large-scale versus local factors to seasonality. Mar. Ecol. Prog. Ser. 120, 203–210.
Alcoverro, T., Romero, J., Duarte, C., Lopez, N.I., 1997. Spatial and temporal variations in nutrient limitation of
seagrass Posidonia oceanica growth in the NW Mediterranean. Mar. Ecol. Prog. Ser. 146, 155–161.
Alcoverro, T., Zimmerman, R.C., Kohrs, D.G., Alberte, R.S., 1999. Resource allocation and sucrose mobilization
in light-limited eelgrass Zostera marina. Mar. Ecol. Prog. Ser. 187, 121–131.
Alcoverro, T., Manzanera, M., Romero, J., 2000. Nutrient mass balance of the seagrass Posidonia oceanica (L.)
Delile: the importance of nutrient retranslocation. Mar. Ecol. Prog. Ser. 194, 13–21.
Alcoverro, T., Manzanera, M., Romero, J., 2001. Annual metabolic carbon balance of the seagrass Posidonia
oceanica (L.) Delile: the importance of carbohydrate reserves. Mar. Ecol. Prog. Ser. 211, 105–116.
Bidwell, R.G.S., 1974. Nitrogen metabolism. In: Giles, N.H., Torrey, J.G. (Eds.), Plant Physiology. Macmillan,
New York, pp. 173–200.
Brown, R.E., Jarvis, K.L., Hyland, K.J., 1989. Protein measurement using Bicinchoninic acid: elimination of
interfering substances. Anal. Biochem. 180, 136–139.
Burke, M.K., Dennison, W.C., Moore, K.A., 1996. Non-structural carbohydrate reserves of eelgrass Zostera
marina. Mar. Ecol. Prog. Ser. 137, 195–201.
Burkholder, J.M., Mason, K.M., Glasgow Jr., H.B. 1992. Water-column nitrate enrichment promotes decline
of eelgrass Zostera marina: evidence from seasonal mesocosm experiments. Mar. Ecol. Prog. Ser. 81,
163–178.
Delgado, O., Grau, A., Pou, S., Riera, F., Massuti, C., Zabala, M., Ballesteros, E., 1997. Seagrass
regression caused by fish cultures in Fornells Bay (Menorca, Western Mediterranean). Oceanol. Acta
20, 557–563.
Delgado, O., Ruiz, J.M., Perez, M., Romero, J., Ballesteros, E., 1999. Effects of fish farming on seagrass
(Posidonia oceanica) in a Mediterranean bay: seagrass decline after organic loading cessation. Oceanol. Acta
22, 109–117.
Duarte, C.M., 1990. Seagrass nutrient content. Mar. Ecol. Prog. Ser. 67, 201–207.
Duarte, C.M., 1995. Submerged aquatic vegetation in relation to different nutrient regimes. Ophelia 41,
87–112.
Erftemeijer, P.L.A., Stapel, J., Smekens, M.J.E., Drossaert, W.M.E., 1994. The limited effect of in situ phospho-
rus and nitrogen addition to seagrass beds on carbonate and terrigenous sediments in South Sulawesi,
Indonesia. J. Exp. Mar. Biol. Ecol. 182, 123–140.
Finneman, J., Schjoerring, J.K., 1998. Ammonium and soluble amide-bound nitrogen in leaves of Brassica
napus as related to glutamine synthetase activity and external N supply. Plant Physiol. Biochem. 36,
339–346.
Gao, Y., Smith, G.J., Alberte, R.S., 1992. Light regulation of nitrate reductase in Ulva fenestrata (Chlorophy-
ceae): I. Influence of light regimes on nitrate reductase activity. Mar. Biol. 112, 691–696.
Grasshoff, K., Ehrhardt, M., Kremling, K., 1983. Methods of Seawater Analysis Verlag Chemie, Weinheim.
Hauxwell, J., Cebrian, J., Furlong, C., Valiela, I., 2001. Macroalgal canopies contribute to eelgrass (Zostera
marina) decline in temperate estuarine ecosystems. Ecol. Washington, D.C. 82 (4), 1007–1022.
Invers, O., Perez, M., Romero, J., 2002. Seasonal nitrogen speciation in temperate seagrass Posidonia oceanica
(L.) Delile. J. Exp. Mar. Biol. Ecol. 273, 219–240.
Kenworthy, W.J., Fonseca, M.S., 1992. The use of fertilizer to enhance growth of trasplanted seagrasses Zostera
marina L. and Halodule wrightii Aschers. J. Exp. Mar. Biol. Ecol. 163, 141–161.
Kraemer, G.P., Mazzella, L., 1996. Nitrogen assimilation and growth dynamics of the mediterranean seagrasses
Posidonia oceanica, Cymodocea nodosa, and Zostera noltii. In: Kuo, J., Phillips, R.C., Walker, D.I., Kirk-
man, H. (Eds.), Seagrass Biology: Proceedings of an International Workshop. Faculty of Science, UWA,
Rottnest Island, Western Australia, pp. 181–190.
Kraemer, G.P., Mazzella, L., Alberte, R.S., 1997. Nitrogen assimilation and partitioning in the Mediterranean
seagrass Posidonia oceanica. P.S.Z.N.I. Mar. Ecol. 18, 175–788.
Lapointe, B.E., Duke, C.S., 1984. Biochemical strategies for growth of Gracilaria tikvahiae (Rhodophyta) in
relation to light intensity and nitrogen availability. J. Phycol. 20, 488–495.
O. Invers et al. / J. Exp. Mar. Biol. Ecol. 303 (2004) 97–114 113
Marba, N., Duarte, C.M., Cebrian, J., Gallegos, M.E., Olsen, B., Sand-Jensen, K., 1996. Growth and population
dynamics of Posidonia oceanica on the Spanish Mediterranean coast: elucidating seagrass decline. Mar. Ecol.
Prog. Ser. 137, 203–213.
Marschner, H., 1995. Mineral Nutrition of Higher Plants Academic Press, London.
McGlathery, K.J., 1995. Nutrient and grazing influences on a tropical seagrass community. Mar. Ecol. Prog. Ser.
122, 239–252.
Nixon, S.W., 1995. Coastal marine eutrophication: a definition, social causes, and future concerns. Ophelia 41,
199–219.
Nordin, A., Nasholm, T., 1997. Nitrogen storage forms in nine boreal understorey plant species. Oecologia 110,
487–492.
Perez, M., Romero, J., Duarte, C., Sand-Jensen, K., 1991. Phosphorus limitation of Cymodocea nodosa growth.
Mar. Biol. 109, 129–133.
Pirc, H., 1985. Growth dynamics in Posidonia oceanica (L.) Delile. I. Seasonal changes of soluble carbohydrates,
starch, free amino acids, nitrogen and organic anions in different parts of the plant. P.S.Z.N.I. Mar. Ecol. 6,
141–165.
Pregnall, A.M., Smith, R.D., Alberte, R.S., 1987. Glutamine synthetase activity and free amino acid pools of
eelgrass (Zostera marina L.) roots anoxia. J. Exp. Mar. Biol. Ecol. 106, 211–228.
Rabe, E., 1990. Stress physiology: the functional significance of the accumulation of N-containing compounds. J.
Hortic. Sci. 65, 231–243.
Romero, J., 1989. Primary production of Posidonia oceanica beds in the Medes Islands (Girona, NE Spain). In:
Boudouresque, C.F., Meinesz, A., Fresi, E., Gravez, V. (Eds.), International Workshop on Posidonia Beds,
vol. 2. GIS Posidonie, Marseille, pp. 85–91.
Ruiz, J.M., Perez, M., Romero, J., 2001. Effects of fish farm loadings on seagrass (Posidonia oceanica) dis-
tribution, growth and photosynthesis. Mar. Pollut. Bull. 42, 749–760.
Sand-Jensen, K., Borum, J., 1991. Interactions among phytoplankton, periphyton, and macrophytes in temperate
freshwaters and estuaries. Aquat. Bot. 41, 137–175.
Schramm, W., Nienhuis, P.H., 1996. Marine Benthic Vegetation. Recent Changes and the Effects of Eutrophi-
cation. Springer, Berlin.
Short, F.T., 1987. Effects of sediment nutrients on seagrasses: literature review and mesocosm experiment. Aquat.
Bot. 27, 41–57.
Short, F.T., Wyllie-Echevarria, S., 1996. Natural and human-induced disturbance of seagrasses. Environ. Con-
serv. 23, 17–27.
Short, F.T., Dennison, W.C., Capone, D.G., 1990. Phosphorus-limited growth of the tropical seagrass Syringo-
dium filiforme in carbonate sediments. Mar. Ecol. Prog. Ser. 62, 169–174.
Short, F.T., Burdick, D.M., Kaldy III, J.E., 1995. Mesocosm experiments quantify the effects of eutrophication on
eelgrass, Zostera marina. Limnol. Oceanogr. 40, 740–749.
Silverstein, K., Chiffings, A.W., McComb, A.J., 1986. The loss of seagrass in Cockburn Sound, Western Australia.
III. The effect of epiphytes on productivity of Posidonia australis Hook F. Aquat. Bot. 24, 355–371.
Smith, P.K., Krohn, R.I., Hermanson, G.T., Mallia, A.K., Gartner, F.H., Provenzano, M.D., Fujimoto, E.K.,
Goeke, N.M., Olson, B.J., Klenk, D.C., 1985. Measurement of protein using bicinchoninic acid. Anal.
Biochem. 150, 76–85.
Spackman, D.H., Stein, W.H., Moore, S., 1958. Automatic recording apparatus for use in the chromatography of
amino acids. Anal. Chem. 30, 1190–1206.
Thompson, S.M., Valiela, I., 1999. Effect of nitrogen loading on enzyme activity of macroalgae in estuaries in
Waquoit Bay. Bot. Mar. 42, 519–529.
Touchette, B.W., Burkholder, J.M., 2000. Review of nitrogen and phosphorus metabolism in seagrasses. J. Exp.
Mar. Biol. Ecol. 250, 133–167.
Udy, J.M., Dennison, W.C., 1997. Growth and physiological responses of three seagrass species to elevated
sediment nutrients in Moreton Bay, Australia. J. Exp. Mar. Biol. Ecol. 217, 253–277.
Udy, J.W., Dennison, W.C., Lee Long, W.J., McKenzie, L.J., 1999. Responses of seagrass to nutrients in the
Great Barrier Reef, Australia. Mar. Ecol. Prog. Ser. 185, 257–271.
van Katwijk, M.M., Vergeer, L.H.T., Schmitz, G.H.W., Roelofs, J.G.M., 1997. Ammonium toxicity in eelgrass
Zostera marina. Mar. Ecol. Prog. Ser. 157, 159–173.

O. Invers et al. / J. Exp. Mar. Biol. Ecol. 303 (2004) 97–114114
Vergara, J.J., 1993. Modelado del metabolismo de carbono y nitrogeno en rodofıceas. PhD, Malaga.
Yemm, E.W., Williams, A.J., 1954. The estimation of carbohydrates in plant extracts by anthrone. Biochem. J.
57, 508–514.
Zieman, J.C., 1974. Methods for the study of the growth and production of turtle grass, Thalassia testudinum
Konig. Aquaculture 4, 139–143.