The Nitrogen Cascade - Oxford Academic
16
April 2003 / Vol. 53 No. 4 • BioScience 341 Articles T he chemical elements nitrogen (N), carbon (C), phosphorus (P), oxygen (O), and sulfur (S) are all nec- essary for life. With one exception, they are generally available in global reservoirs to sustain life forms ranging from single- cell organisms to vertebrates. Of these elements, N has the greatest total abundance in Earth’s atmosphere, hydrosphere, and biosphere; it is ironic that N is the element least readily available to sustain life. The total amount of N in the at- mosphere, soils, and waters of Earth is approximately 4 × 10 21 grams (g)—more than the mass of all four of these other el- ements combined (Mackenzie 1998). However, more than 99% of this N is not available to more than 99% of living or- ganisms. The reason for this seeming contradiction is that while there is an abundance of N in nature, it is almost en- tirely in the form of molecular nitrogen, a chemical form that is not usable by most organisms. Breaking the triple bond holding the two N atoms together requires a significant amount of energy—energy that can be mustered only in high-temperature processes or by a small number of spe- cialized N-fixing microbes. We divide the N compounds in nature into two groups: nonreactive and reactive. Nonreactive N is N 2 ; reactive N (Nr) includes all biologically, photochemically, and radia- tively active N compounds in Earth’s atmosphere and bio- sphere. Thus, Nr includes inorganic reduced forms of N (e.g., ammonia [NH 3 ] and ammonium [NH 4 + ]), inorganic oxidized forms (e.g., nitrogen oxide [NO x ], nitric acid [HNO 3 ], nitrous oxide [N 2 O], and nitrate [NO 3 – ]), and organic com- pounds (e.g., urea, amines, proteins, and nucleic acids). In the prehuman world, creation of Nr from N 2 occurred primarily through two processes, lightning and biological nitrogen fixation (BNF). Reactive N did not accumulate in en- vironmental reservoirs because microbial N fixation and denitrification processes were approximately equal (Ayres et al. 1994). This is no longer the case. Reactive N is now accumulat- ing in the environment on all spatial scales—local, regional, and global (Galloway et al. 1995). During the last few decades, production of Nr by humans has been greater than produc- tion from all natural terrestrial systems. The global increase in Nr production has three main causes: (1) widespread cul- tivation of legumes, rice, and other crops that promote con- version of N 2 to organic N through BNF; (2) combustion of fossil fuels, which converts both atmospheric N 2 and fossil N to reactive NO x ; and (3) the Haber-Bosch process, which converts nonreactive N 2 to reactive NH 3 to sustain food pro- duction and some industrial activities. The global rate of increase in Nr creation by humans was relatively slow from 1860 to 1960. Since 1960, however, the rate of increase has accelerated sharply (figure 1a). Cultivation- induced Nr creation increased from approximately 15 tera- grams (Tg) N per year in 1860 to approximately 33 Tg N per year in 2000. Reactive N creation through fossil fuel com- bustion increased from less than 1 Tg N per year in 1860 to approximately 25 Tg N per year in 2000. Reactive N creation from the Haber-Bosch process went from 0 before 1910 to James N. Galloway (e-mail: [email protected]) and B. Jack Cosby are professors in the Department of Environmental Sciences at the University of Virginia, Charlottesville, VA 22904. John D. Aber is a professor at the Institute for the Study of Earth, Oceans, and Space, University of New Hampshire, Durham, NH 03824. Jan Willem Erisman is head of the Department of Integrated Assessment at the Energy Research Center of the Netherlands, PO Box 1, 1755 ZG Petten, The Netherlands. Sybil P. Seitzinger is a professor at the In- stitute of Marine and Coastal Sciences, Rutgers University, 71 Dudley Road, New Brunswick, NJ 08901. Robert W. Howarth is a professor in the Depart- ment of Ecology and Evolutionary Biology, Cornell University, Ithaca, NY 14853. Ellis B. Cowling is a professor in the College of Natural Resources, North Carolina State University, 1509 Varsity Drive, Raleigh, NC 27606. © 2003 American Institute of Biological Sciences. The Nitrogen Cascade JAMES N. GALLOWAY, JOHN D. ABER, JAN WILLEM ERISMAN, SYBIL P. SEITZINGER, ROBERT W. HOWARTH, ELLIS B. COWLING, AND B. JACK COSBY Human production of food and energy is the dominant continental process that breaks the triple bond in molecular nitrogen (N 2 ) and creates reac- tive nitrogen (Nr) species. Circulation of anthropogenic Nr in Earth’s atmosphere, hydrosphere, and biosphere has a wide variety of consequences, which are magnified with time as Nr moves along its biogeochemical pathway. The same atom of Nr can cause multiple effects in the atmosphere, in terrestrial ecosystems, in freshwater and marine systems, and on human health. We call this sequence of effects the nitrogen cascade. As the cas- cade progresses, the origin of Nr becomes unimportant. Reactive nitrogen does not cascade at the same rate through all environmental systems; some systems have the ability to accumulate Nr, which leads to lag times in the continuation of the cascade. These lags slow the cascade and result in Nr accumulation in certain reservoirs, which in turn can enhance the effects of Nr on that environment. The only way to eliminate Nr accumu- lation and stop the cascade is to convert Nr back to nonreactive N 2 . Keywords: nitrogen cascade, fertilizer, forest dieback, eutrophication, ozone, denitrification Downloaded from https://academic.oup.com/bioscience/article/53/4/341/250178 by guest on 28 March 2022
-
Upload
khangminh22 -
Category
Documents
-
view
1 -
download
0
Transcript of The Nitrogen Cascade - Oxford Academic

April 2003 / Vol. 53 No. 4 • BioScience 341
Articles
The chemical elements nitrogen (N), carbon (C),phosphorus (P), oxygen (O), and sulfur (S) are all nec-
essary for life. With one exception, they are generally availablein global reservoirs to sustain life forms ranging from single-cell organisms to vertebrates. Of these elements, N has thegreatest total abundance in Earth’s atmosphere, hydrosphere,and biosphere; it is ironic that N is the element least readilyavailable to sustain life. The total amount of N in the at-mosphere, soils, and waters of Earth is approximately 4 × 10²¹
grams (g)—more than the mass of all four of these other el-ements combined (Mackenzie 1998). However, more than99% of this N is not available to more than 99% of living or-ganisms. The reason for this seeming contradiction is thatwhile there is an abundance of N in nature, it is almost en-tirely in the form of molecular nitrogen, a chemical form thatis not usable by most organisms. Breaking the triple bondholding the two N atoms together requires a significantamount of energy—energy that can be mustered only inhigh-temperature processes or by a small number of spe-cialized N-fixing microbes.
We divide the N compounds in nature into two groups:nonreactive and reactive. Nonreactive N is N2; reactive N(Nr) includes all biologically, photochemically, and radia-tively active N compounds in Earth’s atmosphere and bio-sphere. Thus, Nr includes inorganic reduced forms of N(e.g., ammonia [NH3] and ammonium [NH4
+]), inorganicoxidized forms (e.g., nitrogen oxide [NOx], nitric acid [HNO3],nitrous oxide [N2O], and nitrate [NO3
–]), and organic com-pounds (e.g., urea, amines, proteins, and nucleic acids).
In the prehuman world, creation of Nr from N2 occurredprimarily through two processes, lightning and biologicalnitrogen fixation (BNF). Reactive N did not accumulate in en-vironmental reservoirs because microbial N fixation anddenitrification processes were approximately equal (Ayres et al. 1994).
This is no longer the case. Reactive N is now accumulat-ing in the environment on all spatial scales—local, regional,and global (Galloway et al. 1995). During the last few decades,production of Nr by humans has been greater than produc-tion from all natural terrestrial systems. The global increasein Nr production has three main causes: (1) widespread cul-tivation of legumes, rice, and other crops that promote con-version of N2 to organic N through BNF; (2) combustion offossil fuels, which converts both atmospheric N2 and fossil Nto reactive NOx; and (3) the Haber-Bosch process, whichconverts nonreactive N2 to reactive NH3 to sustain food pro-duction and some industrial activities.
The global rate of increase in Nr creation by humans wasrelatively slow from 1860 to 1960. Since 1960, however, the rateof increase has accelerated sharply (figure 1a). Cultivation-induced Nr creation increased from approximately 15 tera-grams (Tg) N per year in 1860 to approximately 33 Tg N peryear in 2000. Reactive N creation through fossil fuel com-bustion increased from less than 1 Tg N per year in 1860 toapproximately 25 Tg N per year in 2000. Reactive N creationfrom the Haber-Bosch process went from 0 before 1910 to
James N. Galloway (e-mail: [email protected]) and B. Jack Cosby are professors
in the Department of Environmental Sciences at the University of Virginia,
Charlottesville, VA 22904. John D. Aber is a professor at the Institute for the
Study of Earth, Oceans, and Space, University of New Hampshire, Durham,
NH 03824. Jan Willem Erisman is head of the Department of Integrated
Assessment at the Energy Research Center of the Netherlands, PO Box 1,
1755 ZG Petten, The Netherlands. Sybil P. Seitzinger is a professor at the In-
stitute of Marine and Coastal Sciences, Rutgers University, 71 Dudley Road,
New Brunswick, NJ 08901. Robert W. Howarth is a professor in the Depart-
ment of Ecology and Evolutionary Biology, Cornell University, Ithaca, NY
14853. Ellis B. Cowling is a professor in the College of Natural Resources, North
Carolina State University, 1509 Varsity Drive, Raleigh, NC 27606. © 2003
American Institute of Biological Sciences.
The Nitrogen Cascade
JAMES N. GALLOWAY, JOHN D. ABER, JAN WILLEM ERISMAN, SYBIL P. SEITZINGER, ROBERT W. HOWARTH,ELLIS B. COWLING, AND B. JACK COSBY
Human production of food and energy is the dominant continental process that breaks the triple bond in molecular nitrogen (N2) and creates reac-tive nitrogen (Nr) species. Circulation of anthropogenic Nr in Earth’s atmosphere, hydrosphere, and biosphere has a wide variety of consequences,which are magnified with time as Nr moves along its biogeochemical pathway. The same atom of Nr can cause multiple effects in the atmosphere,in terrestrial ecosystems, in freshwater and marine systems, and on human health. We call this sequence of effects the nitrogen cascade. As the cas-cade progresses, the origin of Nr becomes unimportant. Reactive nitrogen does not cascade at the same rate through all environmental systems;some systems have the ability to accumulate Nr, which leads to lag times in the continuation of the cascade. These lags slow the cascade and resultin Nr accumulation in certain reservoirs, which in turn can enhance the effects of Nr on that environment. The only way to eliminate Nr accumu-lation and stop the cascade is to convert Nr back to nonreactive N2.
Keywords: nitrogen cascade, fertilizer, forest dieback, eutrophication, ozone, denitrification
Dow
nloaded from https://academ
ic.oup.com/bioscience/article/53/4/341/250178 by guest on 28 M
arch 2022
Used Mac Distiller 5.0.x Job Options
This report was created automatically with help of the Adobe Acrobat Distiller addition "Distiller Secrets v1.0.5" from IMPRESSED GmbH. You can download this startup file for Distiller versions 4.0.5 and 5.0.x for free from http://www.impressed.de. GENERAL ---------------------------------------- File Options: Compatibility: PDF 1.2 Optimize For Fast Web View: Yes Embed Thumbnails: No Auto-Rotate Pages: No Distill From Page: 1 Distill To Page: All Pages Binding: Left Resolution: [ 600 600 ] dpi Paper Size: [ 585 783 ] Point COMPRESSION ---------------------------------------- Color Images: Downsampling: Yes Downsample Type: Bicubic Downsampling Downsample Resolution: 151 dpi Downsampling For Images Above: 227 dpi Compression: Yes Automatic Selection of Compression Type: Yes JPEG Quality: Medium Bits Per Pixel: As Original Bit Grayscale Images: Downsampling: Yes Downsample Type: Bicubic Downsampling Downsample Resolution: 300 dpi Downsampling For Images Above: 450 dpi Compression: Yes Automatic Selection of Compression Type: Yes JPEG Quality: Medium Bits Per Pixel: As Original Bit Monochrome Images: Downsampling: Yes Downsample Type: Bicubic Downsampling Downsample Resolution: 600 dpi Downsampling For Images Above: 900 dpi Compression: Yes Compression Type: CCITT CCITT Group: 4 Anti-Alias To Gray: No Compress Text and Line Art: Yes FONTS ---------------------------------------- Embed All Fonts: Yes Subset Embedded Fonts: Yes Subset When Percent Of Characters Used is Less: 100 % When Embedding Fails: Cancel Job Embedding: Always Embed: [ ] Never Embed: [ ] COLOR ---------------------------------------- Color Management Policies: Color Conversion Strategy: Leave Color Unchanged Intent: Default Device-Dependent Data: Preserve Overprint Settings: No Preserve Under Color Removal and Black Generation: No Transfer Functions: Preserve Preserve Halftone Information: No ADVANCED ---------------------------------------- Options: Use Prologue.ps and Epilogue.ps: No Allow PostScript File To Override Job Options: No Preserve Level 2 copypage Semantics: No Save Portable Job Ticket Inside PDF File: No Illustrator Overprint Mode: No Convert Gradients To Smooth Shades: Yes ASCII Format: No Document Structuring Conventions (DSC): Process DSC Comments: No OTHERS ---------------------------------------- Distiller Core Version: 5000 Use ZIP Compression: Yes Deactivate Optimization: No Image Memory: 524288 Byte Anti-Alias Color Images: No Anti-Alias Grayscale Images: No Convert Images (< 257 Colors) To Indexed Color Space: Yes sRGB ICC Profile: sRGB IEC61966-2.1 END OF REPORT ---------------------------------------- IMPRESSED GmbH Bahrenfelder Chaussee 49 22761 Hamburg, Germany Tel. +49 40 897189-0 Fax +49 40 897189-71 Email: [email protected] Web: www.impressed.de
Adobe Acrobat Distiller 5.0.x Job Option File
<< /ColorSettingsFile () /LockDistillerParams true /DetectBlends true /DoThumbnails false /AntiAliasMonoImages false /MonoImageDownsampleType /Bicubic /GrayImageDownsampleType /Bicubic /MaxSubsetPct 100 /MonoImageFilter /CCITTFaxEncode /ColorImageDownsampleThreshold 1.5 /GrayImageFilter /DCTEncode /ColorConversionStrategy /LeaveColorUnchanged /CalGrayProfile (Gray Gamma 2.2) /ColorImageResolution 151 /UsePrologue false /MonoImageResolution 600 /ColorImageDepth -1 /sRGBProfile (sRGB IEC61966-2.1) /PreserveOverprintSettings false /CompatibilityLevel 1.2 /UCRandBGInfo /Remove /EmitDSCWarnings false /CreateJobTicket false /DownsampleMonoImages true /DownsampleColorImages true /MonoImageDict << /K -1 >> /ColorImageDownsampleType /Bicubic /GrayImageDict << /HSamples [ 2 1 1 2 ] /VSamples [ 2 1 1 2 ] /Blend 1 /QFactor 0.9 >> /CalCMYKProfile (U.S. Web Coated (SWOP) v2) /ParseDSCComments false /PreserveEPSInfo false /MonoImageDepth -1 /AutoFilterGrayImages true /SubsetFonts true /GrayACSImageDict << /VSamples [ 2 1 1 2 ] /HSamples [ 2 1 1 2 ] /Blend 1 /QFactor 0.76 /ColorTransform 1 >> /ColorImageFilter /DCTEncode /AutoRotatePages /None /PreserveCopyPage false /EncodeMonoImages true /ASCII85EncodePages false /PreserveOPIComments false /NeverEmbed [ ] /ColorImageDict << /HSamples [ 2 1 1 2 ] /VSamples [ 2 1 1 2 ] /Blend 1 /QFactor 0.9 >> /AntiAliasGrayImages false /GrayImageDepth -1 /CannotEmbedFontPolicy /Error /EndPage -1 /TransferFunctionInfo /Preserve /CalRGBProfile (sRGB IEC61966-2.1) /EncodeColorImages true /EncodeGrayImages true /ColorACSImageDict << /VSamples [ 2 1 1 2 ] /HSamples [ 2 1 1 2 ] /Blend 1 /QFactor 0.76 /ColorTransform 1 >> /Optimize true /ParseDSCCommentsForDocInfo true /GrayImageDownsampleThreshold 1.5 /MonoImageDownsampleThreshold 1.5 /AutoPositionEPSFiles false /GrayImageResolution 300 /AutoFilterColorImages true /AlwaysEmbed [ ] /ImageMemory 524288 /OPM 0 /DefaultRenderingIntent /Default /EmbedAllFonts true /StartPage 1 /DownsampleGrayImages true /AntiAliasColorImages false /ConvertImagesToIndexed true /PreserveHalftoneInfo false /CompressPages true /Binding /Left >> setdistillerparams << /PageSize [ 576.0 792.0 ] /HWResolution [ 600 600 ] >> setpagedevice

more than 100 Tg N per year in 2000,with about 85% used in the produc-tion of fertilizers. Thus, between 1860and 2000, the anthropogenic Nr cre-ation rate increased from approxi-mately 15 Tg N per year to approxi-mately 165 Tg N per year, with aboutfive times more Nr coming from foodproduction than from energy pro-duction (Galloway et al. 2002).
As in the global system, the Nrcreation rate in the United States hasincreased over the last few decades. In1961, the United States created Nrat a rate of approximately 8 Tg N peryear (figure 1b). By 1997, the Nr cre-ation rate was approximately 25 Tg Nper year. Companion papers in thisissue (Aber et al. 2003, Driscoll et al.2003, Fenn et al. 2003a, 2003b) dis-cuss Nr biogeochemistry in theUnited States, with a focus on theNortheast and the West.
The remarkable changes in the Ncycle have resulted in a wide varietyof changes, both beneficial and detri-mental, to the health and welfare ofpeople and ecosystems. A large por-tion of the human population of theworld is sustained today because Nris provided as synthetic fertilizers andcultivation-induced BNF (Smil2000). But there are also some sig-nificant worrisome consequences.First, Nr is widely dispersed by hy-drologic and atmospheric transportprocesses. Second, Nr is accumulat-ing in the environment because Nrcreation rates are greater than rates of
342 BioScience • April 2003 / Vol. 53 No. 4
Articles
Figure 1. (a) Global population trends from 1860 to 2000 (billions, left axis) and reactive nitrogen (Nr) creation (teragramsnitrogen [Tg N] per year, right axis). “Haber-Bosch” represents Nr creation through the Haber-Bosch process, including production of ammonia for nonfertilizer purposes. For 1920, 1930, and 1940, we assumed that global total Nr productionthrough the Haber-Bosch process was equivalent to global anthropogenic fertilizer production (Smil 2001). For 1950 onward,data on Nr creation through the Haber-Bosch process were obtained from USGS Minerals (Kramer 1999). “C-BNF”(cultivation-induced biological nitrogen fixation) represents Nr creation from cultivation of legumes, rice, and sugarcane.The C-BNF rate for 1900 is estimated to be approximately 15 Tg N per year (Vaclav Smil, University of Manitoba, Winnipeg,Canada, personal communication, January 2002). The C-BNF rates for 1860, 1870, 1880, and 1890 were estimated from pop-ulation, using the 1900 data on population and Nr creation. For 1961–1999, Nr creation rates were calculated from crop-spe-cific data on harvested areas (FAOSTAT 2000) and fixation rates (Smil 1999). Decadal data from 1910 to 1950 were interpo-lated between 1900 and 1961. “Fossil fuel” represents Nr created from fossil fuel combustion. The data from 1860 to 1990 arefrom a compilation from Elisabeth Holland, based on Müller (1992), Keeling (1993), and Holland and Lamarque (1997).These data agree well with those recently published by van Aardenne and colleagues (2001) for decadal time steps from 1890to 1990. The data for 1991 to 2000 were estimated by scaling emissions of nitrogen oxides to increases in fossil fuel combus-tion over the same period. “Total Nr” represents the sum created by these three processes. (b) US population trends from 1961to 1997 (billions, left axis; FAO 2000) and Nr creation (Tg N per year, right axis; Howarth et al. 2002a).
a
b
Haber-Bosch Fossil fuel
Fossil fuel
Dow
nloaded from https://academ
ic.oup.com/bioscience/article/53/4/341/250178 by guest on 28 M
arch 2022
Nr removal through denitrification to nonreactive N2. Third,Nr creation and accumulation is projected to continue to in-crease in the future as human populations and per capita re-source use increase. Fourth, Nr accumulation contributes tomany contemporary environmental problems. For example:
• Increases in Nr lead to production of troposphericozone and aerosols that induce serious respiratory illness, cancer, and cardiac disease in humans (Pope etal. 1995, Follett and Follett 2001, Wolfe and Patz 2002).
• Forest and grassland productivity increase and thendecrease wherever atmospheric Nr deposition increasessignificantly and critical thresholds are exceeded; Nradditions probably also decrease biodiversity in manynatural habitats (Aber et al. 1995).
• Reactive N is responsible (together with S) for acidifi-cation and loss of biodiversity in lakes and streams inmany regions of the world (Vitousek et al. 1997).
• Reactive N is responsible for eutrophication, hypoxia,loss of biodiversity, and habitat degradation in coastalecosystems. It is now considered the biggest pollutionproblem in coastal waters (e.g., Howarth et al. 2000,NRC 2000, Rabalais 2002).
• Reactive N contributes to global climate change andstratospheric ozone depletion, both of which haveimpacts on human and ecosystem health (e.g., Cowlinget al. 1998).
This article focuses on the mul-tiple linkages among the ecolog-ical and human health effects ofNr molecules as they move fromone environmental system to an-other. This phenomenon is calledthe N cascade (Galloway 1998),which we define as the sequen-tial transfer of Nr through envi-ronmental systems and which results in environmental changesas Nr moves through or is temp-orarily stored within each system.
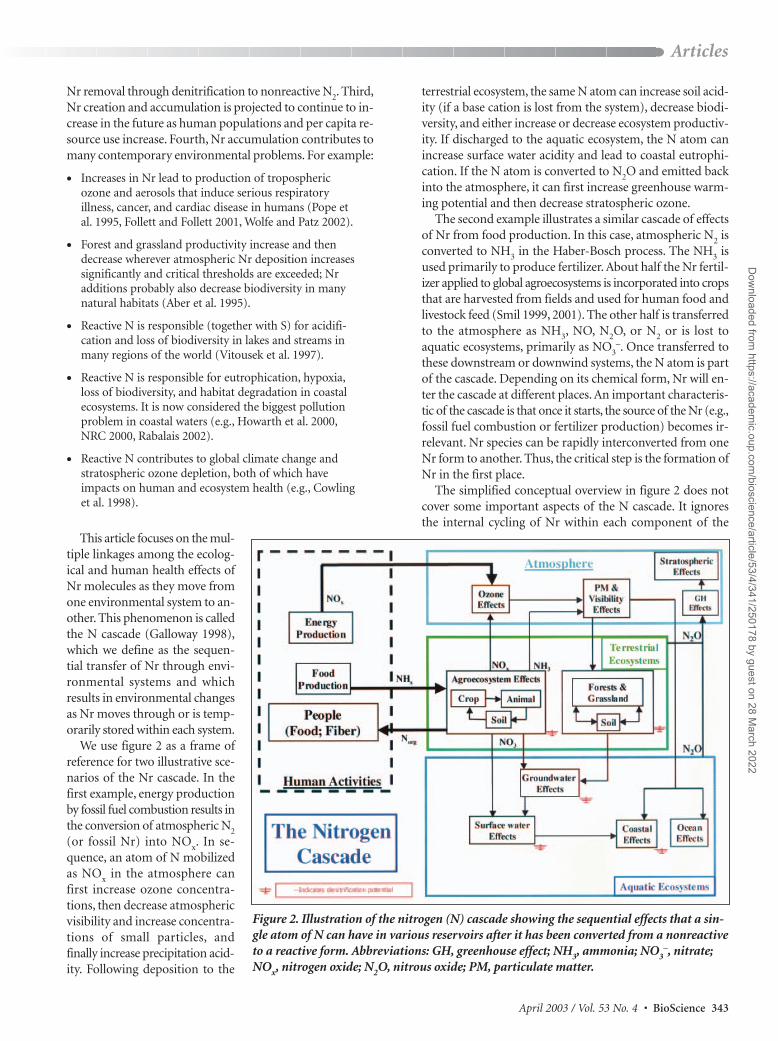
We use figure 2 as a frame ofreference for two illustrative sce-narios of the Nr cascade. In thefirst example, energy productionby fossil fuel combustion results inthe conversion of atmospheric N2(or fossil Nr) into NOx. In se-quence, an atom of N mobilizedas NOx in the atmosphere canfirst increase ozone concentra-tions, then decrease atmosphericvisibility and increase concentra-tions of small particles, and finally increase precipitation acid-ity. Following deposition to the
terrestrial ecosystem, the same N atom can increase soil acid-ity (if a base cation is lost from the system), decrease biodi-versity, and either increase or decrease ecosystem productiv-ity. If discharged to the aquatic ecosystem, the N atom canincrease surface water acidity and lead to coastal eutrophi-cation. If the N atom is converted to N2O and emitted backinto the atmosphere, it can first increase greenhouse warm-ing potential and then decrease stratospheric ozone.
The second example illustrates a similar cascade of effectsof Nr from food production. In this case, atmospheric N2 isconverted to NH3 in the Haber-Bosch process. The NH3 isused primarily to produce fertilizer. About half the Nr fertil-izer applied to global agroecosystems is incorporated into cropsthat are harvested from fields and used for human food andlivestock feed (Smil 1999, 2001). The other half is transferredto the atmosphere as NH3, NO, N2O, or N2 or is lost toaquatic ecosystems, primarily as NO3
–. Once transferred tothese downstream or downwind systems, the N atom is partof the cascade. Depending on its chemical form, Nr will en-ter the cascade at different places. An important characteris-tic of the cascade is that once it starts, the source of the Nr (e.g.,fossil fuel combustion or fertilizer production) becomes ir-relevant. Nr species can be rapidly interconverted from oneNr form to another. Thus, the critical step is the formation ofNr in the first place.
The simplified conceptual overview in figure 2 does notcover some important aspects of the N cascade. It ignores the internal cycling of Nr within each component of the
April 2003 / Vol. 53 No. 4 • BioScience 343
Articles
Figure 2. Illustration of the nitrogen (N) cascade showing the sequential effects that a sin-gle atom of N can have in various reservoirs after it has been converted from a nonreactiveto a reactive form. Abbreviations: GH, greenhouse effect; NH3, ammonia; NO3
–, nitrate;NOx, nitrogen oxide; N2O, nitrous oxide; PM, particulate matter.
Dow
nloaded from https://academ
ic.oup.com/bioscience/article/53/4/341/250178 by guest on 28 M
arch 2022

ecosystem; it does not account for long-term Nr storage; andit does not account for all the pathways that Nr follows as itflows from one “box” or effect to another. The following sec-tions describe these characteristics in greater detail, first forthe atmosphere (troposphere and stratosphere), next for ter-restrial ecosystems (agroecosystems, forests, and grasslands),and finally for aquatic ecosystems (groundwater, wetlands,streams, lakes, rivers, and marine coastal regions). The cov-erage for these systems is not meant to be exhaustive butrather to give an overview of how each system behaves andinteracts with other systems within the cascade.We do not con-sider the N cycle of the open ocean, because little of the Nrcreated by human activities on land reaches the open ocean(Nixon et al. 1996, Seitzinger and Giblin 1996, Chen andWang 1999).
The cascade of Nr from one system to another is enhancedif there is limited potential for Nr accumulation or loss of N2through denitrification within a given system and thus in-creased potential for transfer to the next system. There is a lagin the cascade if there is a large potential for accumulationwithin a system. The cascade decreases if there is a large po-tential for denitrification to N2 within a system (table 1).Thus, at each stage of the N cascade, we evaluate the poten-tial for
• accumulation and cycling of Nr within the system;
• loss of Nr through conversion to N2 by denitrification;
• transfer of Nr to other systems; and
• effects of Nr within the system.
AtmosphereThe atmosphere receives Nr mainly as air emissions of NOx,NH3, and N2O from aquatic and terrestrial ecosystems andof NOx from combustion of biomass or fossil fuels. NOx and
NHx (NH3 and NH4+) can accumulate in the troposphere on
a regional scale. But because NOx and NHx have a short res-idence time in the atmosphere and lack potential to form N2by denitrification, almost all Nr emitted as NOx and NHx istransferred back to Earth’s surface within hours to days.There is some internal cycling of Nr within the atmosphere.Together with volatile organic C compounds, increased con-centrations of NOx can lead to increased concentrations ofozone and other photochemical oxidants in the atmosphere.Ultimately much of the NOx is converted to HNO3, which iseither converted to an aerosol (e.g., ammonium nitrate) or de-posited on land, surface waters, or other surfaces. NH3 emit-ted to the atmosphere is either deposited or transformedinto an ammonium aerosol (e.g., ammonium bisulfate orammonium sulfate). Before deposition, ammonium aerosolscontribute to fine particulate matter and regional haze con-centrations in the atmosphere.
Six major atmospheric effects are associated with increasedNOx and NH3 emissions: (1) Fine particulate matter de-creases atmospheric visibility; (2) elevated ozone concentra-tions enhance the greenhouse potential of the atmosphere; (3)ozone and fine particulate matter have serious impacts on human health (Pope et al. 1995); (4) ammonia plays an im-portant role in the direct and indirect effects of aerosols onradiative forcing and thus on global climate change (Seinfeldand Pandis 1998, Penner et al. 2001; Russell Dickerson, Uni-versity of Maryland, College Park, MD 20742, personal com-munication, March 2003); (5) ozone deposition can decreaseproductivity of crops, forests, and natural ecosystems; and (6)atmospheric deposition of NHx, NOy (all oxidized forms of nitrogen other than N2O), and organic forms of Nr can contribute to ecosystem acidification, fertilization, and eutrophication.
N2O and NOx are produced during both nitrification anddenitrification. Addition of Nr to agroecosystems leads to increased N2O and NOx emissions. Nitrous oxide has a
344 BioScience • April 2003 / Vol. 53 No. 4
Articles
Table 1. Characteristics of different systems relevant for the nitrogen cascade.
Links toAccumulation Transfer N2 production systems down Effects
System potential potential potential the cascade potential
Atmosphere Low Very high None All but groundwater Human and ecosystem health,climate change
Agroecosystems Low to Very high Low to All Human and ecosystem health,moderate moderate climate change
Forests High Moderate, Low All Biodiversity, net primary high in places productivity, mortality, groundwater
Grasslands High Moderate, Low All Biodiversity, net primary high in places productivity, groundwater
Groundwater Moderate Moderate Moderate Surface water, Human and ecosystem health,atmosphere climate change
Wetlands, streams, Low Very high Moderate to Atmosphere, marine Biodiversity, ecologicallakes, rivers high coastal systems structure, fish
Marine coastal regions Low to Moderate High Atmosphere Biodiversity, ecological structure, fish,moderate harmful algal blooms
Dow
nloaded from https://academ
ic.oup.com/bioscience/article/53/4/341/250178 by guest on 28 M
arch 2022
tropospheric residence time of approximately 100 years andis increasing in the troposphere at a rate of approximately0.25% per year (Prather et al. 2001). Nitrous oxide is a green-house gas in the troposphere and, when transferred to thestratosphere, decreases the concentration of stratosphericozone. As discussed above, NOx can contribute to increasedtropospheric ozone and decreased atmospheric visibility.
In summary, the residence time for most Nr species in theatmosphere is short. There is an internal cascade of effects:NOx increases the potential first for ozone and then foraerosol formation. Except for N2O, there is very limited po-tential for long-term storage of Nr (and thus limited lagtime), but there are significant effects from Nr while it remainsin the atmosphere. There is no potential for denitrificationback to N2 within the troposphere, and there is a large potentialfor Nr transfer to the next receptor—terrestrial and aquaticecosystems (table 1).
Terrestrial ecosystemsThis section discusses the nitrogen cascade in three typesof terrestrial ecosystems—agroecosystems, forests, andgrasslands.
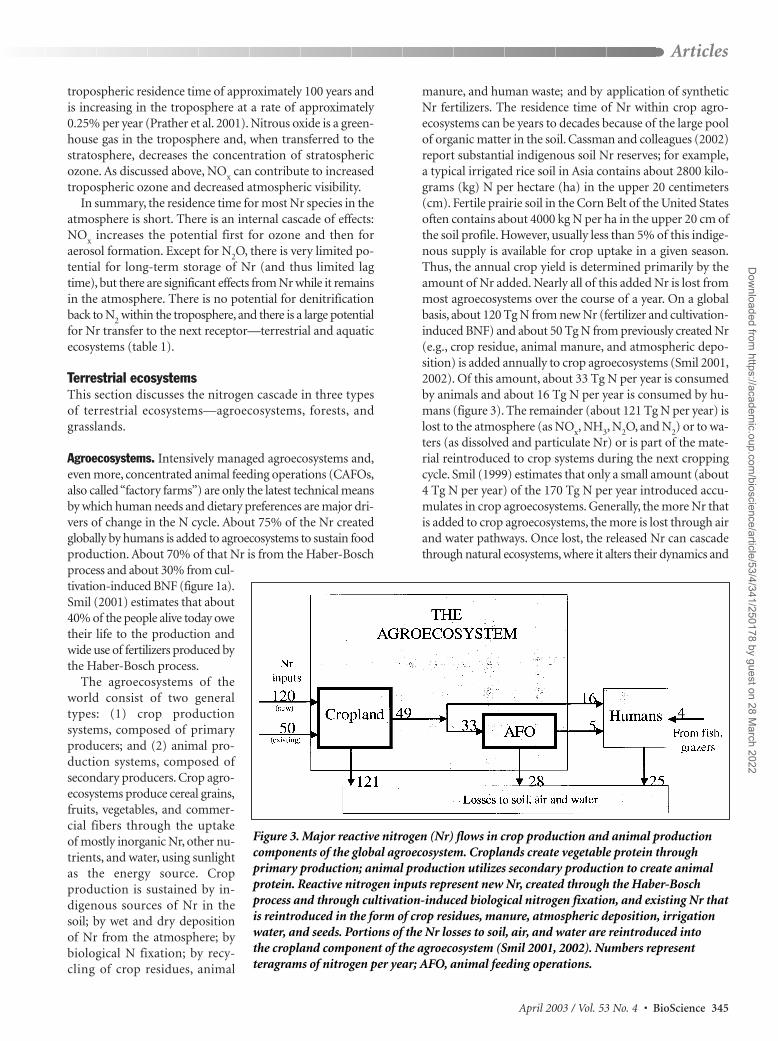
Agroecosystems. Intensively managed agroecosystems and,even more, concentrated animal feeding operations (CAFOs,also called “factory farms”) are only the latest technical meansby which human needs and dietary preferences are major dri-vers of change in the N cycle. About 75% of the Nr createdglobally by humans is added to agroecosystems to sustain foodproduction. About 70% of that Nr is from the Haber-Boschprocess and about 30% from cul-tivation-induced BNF (figure 1a).Smil (2001) estimates that about40% of the people alive today owetheir life to the production andwide use of fertilizers produced bythe Haber-Bosch process.
The agroecosystems of theworld consist of two generaltypes: (1) crop production systems, composed of primary producers; and (2) animal pro-duction systems, composed ofsecondary producers. Crop agro-ecosystems produce cereal grains,fruits, vegetables, and commer-cial fibers through the uptake of mostly inorganic Nr, other nu-trients, and water, using sunlightas the energy source. Crop production is sustained by in-digenous sources of Nr in the soil; by wet and dry depositionof Nr from the atmosphere; bybiological N fixation; by recy-cling of crop residues, animal
manure, and human waste; and by application of syntheticNr fertilizers. The residence time of Nr within crop agro-ecosystems can be years to decades because of the large poolof organic matter in the soil. Cassman and colleagues (2002)report substantial indigenous soil Nr reserves; for example,a typical irrigated rice soil in Asia contains about 2800 kilo-grams (kg) N per hectare (ha) in the upper 20 centimeters(cm). Fertile prairie soil in the Corn Belt of the United Statesoften contains about 4000 kg N per ha in the upper 20 cm ofthe soil profile. However, usually less than 5% of this indige-nous supply is available for crop uptake in a given season.Thus, the annual crop yield is determined primarily by theamount of Nr added. Nearly all of this added Nr is lost frommost agroecosystems over the course of a year. On a globalbasis, about 120 Tg N from new Nr (fertilizer and cultivation-induced BNF) and about 50 Tg N from previously created Nr(e.g., crop residue, animal manure, and atmospheric depo-sition) is added annually to crop agroecosystems (Smil 2001,2002). Of this amount, about 33 Tg N per year is consumedby animals and about 16 Tg N per year is consumed by hu-mans (figure 3). The remainder (about 121 Tg N per year) islost to the atmosphere (as NOx, NH3, N2O, and N2) or to wa-ters (as dissolved and particulate Nr) or is part of the mate-rial reintroduced to crop systems during the next croppingcycle. Smil (1999) estimates that only a small amount (about4 Tg N per year) of the 170 Tg N per year introduced accu-mulates in crop agroecosystems. Generally, the more Nr thatis added to crop agroecosystems, the more is lost through airand water pathways. Once lost, the released Nr can cascadethrough natural ecosystems, where it alters their dynamics and
April 2003 / Vol. 53 No. 4 • BioScience 345
Articles
Figure 3. Major reactive nitrogen (Nr) flows in crop production and animal productioncomponents of the global agroecosystem. Croplands create vegetable protein through primary production; animal production utilizes secondary production to create animalprotein. Reactive nitrogen inputs represent new Nr, created through the Haber-Boschprocess and through cultivation-induced biological nitrogen fixation, and existing Nr thatis reintroduced in the form of crop residues, manure, atmospheric deposition, irrigationwater, and seeds. Portions of the Nr losses to soil, air, and water are reintroduced into the cropland component of the agroecosystem (Smil 2001, 2002). Numbers represent teragrams of nitrogen per year; AFO, animal feeding operations.
Dow
nloaded from https://academ
ic.oup.com/bioscience/article/53/4/341/250178 by guest on 28 M
arch 2022

in many cases decreases their ability to provide ecosystem ser-vices (table 1).
Animal agroecosystems produce dietary protein (milk,eggs, and edible meat) from the consumption of proteins produced by crop agroecosystems. Just as in crop agro-ecosystems, most of the Nr that enters the animal agro-ecosystem is lost to the environment over the course of a year.Animals receive Nr primarily through the consumption ofamino acids in grains and other vegetation. The efficiency withwhich food animals use N from forage and grain variesgreatly. Typical rates of N-use efficiency for production ofhuman-digestible protein from feed grains and forages onfarms are about 50% to 60% for fish, about 40% to 50% forpoultry, about 35% to 40% for dairy, and about 15% to 30%for beef. On a global basis, 33 Tg N per year of grain producedby the crop agroecosystem is fed to animals (figure 3). Of thisamount, about 15% is consumed by humans. The remainingNr is lost as manure and waste (Smil 2001, 2002). The manure can be reused as fertilizer, but the Nr is often lostthrough air emissions (e.g., NH3, N2O, NO, and N2) andthrough leaching of NO3
– to ground or surface waters.Humans consume about 25 Tg N per year, mostly as dietary
protein. Of this amount, 64% comes from grain, 20% fromCAFOs, and about 16% from fish and pasture grazing animals(figure 3).
A portion of the Nr added to agroecosystems is denitrifiedback to nonreactive N2 in systems that have high NO3
– orNH4
+ concentrations, high organic matter, and low O2 con-centrations, such as agricultural fields with high water con-tent (e.g., wetland rice), those that receive large amounts ofprecipitation over a short time period (e.g., spring rains), andanaerobic manure storage systems. Unfortunately, the amountof N2 lost through denitrification in agroecosystems is poorlyknown. Oenema and colleagues (2001) reviewed NOx, N2O,and N2 emissions from pastures; from animal housing systems;from manure slurry in tanks, silos, and lagoons; from manureheaps; and from slurry and manure applied to the soil. Theyconcluded that our knowledge of gaseous losses from animalmanure is greatest for NH3 and successively less for N2O,NO, and N2. Smil (1999) estimates that on a global basis 6%to 12% of the Nr added to agroecosystems is denitrified to N2.In an analysis of agroecosystems in the Great Plains region ofthe United States, Del Grosso and colleagues (2001) usedthe DAYCENT model to show that N2 fluxes were small com-pared with NO and N2O fluxes, primarily because of thesemiarid characteristics of the region. They estimate that lessthan 5% of the applied Nr is lost as N2. For large watershedsof the eastern United States, van Breemen and colleagues(2002) estimate by difference that up to 49% of the Nr inputto agroecosystems is denitrified. In the Netherlands, withhigh levels of Nr production, 30% to 40% of the Nr appliedis either stored or denitrified (Erisman et al. 2001). These largedifferences reflect in part regional variability in the conditionsthat promote denitrification (e.g., soil moisture) and thegeneral uncertainty of the magnitude of denitrification.
In summary, global crop agroecosystems receive about75% of the Nr created by human activity (Galloway andCowling 2002). Most of this Nr is transferred to other systemsalong the N cascade; a much smaller portion globally is denitrified to N2 (table 1). Improving the efficiency of N usein major grain and animal production systems will require col-laboration among ecologists, agronomists, soil scientists,agricultural economists, and politicians. A great need existsfor accurate measurements of actual fertilizer N-use effi-ciency, N losses, and loss pathways in major crop and animalsystems. Only in this way can we (a) identify opportunities forincreased efficiency of N use through improved crop andsoil management; (b) quantify N-loss pathways in majorfood crops, including CAFOs; and (c) improve human un-derstanding of local, regional, and global N balances and Nlosses from major crop and animal systems.
Forests. Forests can be a major reservoir and a short- tolong-term sink within the N cascade. Total Nr stocks in soilsand biomass can range as high as 500 g N per square meter(m2). Inputs of Nr in unpolluted regions are 0.1 to 0.2 g N perm2 per year but can reach 5 or, very rarely, 10 g N per m2 peryear (Dise and Wright 1995). Outputs as dissolved organic Nin steamwater are low and relatively constant across sites(e.g., Goodale et al. 2000), while dissolved inorganic N (DIN)loss is quite variable and can be as low as zero or equal to deposition, depending on forest history and condition (Diseet al. 1998, Gundersen et al. 1998, Fenn et al. 2003a). In gen-eral, this means that Nr residence time within a forest is mea-sured in hundreds to thousands of years, and thus there is asubstantial opportunity for lags in the N cascade. However,human activity can shorten this residence time either by in-creasing inputs or by removing Nr through harvests, fires, orconversion to agriculture. Large reservoir size and relativelylow turnover rates mean that human-induced changes inthe Nr status of forests can have long-term effects, and pre-vious land use history can play a large role in conditioning for-est response to Nr additions (Goodale et al. 2000, Aber et al.2003).
Our understanding of the responses of historically Nr-limited forests to increases in Nr deposition have been pre-sented in summary diagrams of the process known as N sat-uration (figure 4; Aber et al. 1998). Four general stages alongthis continuum have been discussed. In highly Nr-limited(stage 0) systems, low Nr availability is reflected in low foliarN content and low net primary productivity. Plants and rootsymbionts compete effectively for mineralized NH4
+, andnet nitrification and NO3
– leaching are minimal, while N2Oefflux is low to undetectable. In stage 1, increased Nr depo-sition gradually relieves Nr limitations on biological functions.Either through plant uptake or through direct incorpora-tion into soil organic matter, added Nr enters into the N cycle of the forest and increases mineralization and cyclingrates. Foliar Nr increases, as does productivity.
There are two critical thresholds in the N saturation process.The first is induction of net nitrification (stage 2). Thus, the
346 BioScience • April 2003 / Vol. 53 No. 4
Articles
Dow
nloaded from https://academ
ic.oup.com/bioscience/article/53/4/341/250178 by guest on 28 M
arch 2022

presence of net nitrification and extractable soil NO3– are key
indicators of ecosystem Nr status. Field experiments haveshown that there can be a significant delay between the initiation of Nr additions and the induction of detectable ratesof net nitrification (Magill et al. 2000). Both NO3
– leachingand N2O effluxes are low but detectable during this period.
The second critical threshold occurs when Nr becomes anonlimiting element for plant growth (stage 3). At this point,biological retention processes become less effective, and NO3
–
leaching losses increase substantially. Effluxes of NO andN2O also may increase because of nitrification or denitrifi-cation processes (Davidson et al. 2000), which may becomesignificant if soils are imperfectly or variably drained soils. Instage 3, experimental additions of Nr may decrease treegrowth (e.g., Magill et al. 2000), while decreases in Nr depo-sition may increase tree growth (Beier et al. 1998, Boxman etal. 1998). Excess Nr may damage forests by causing nutrientimbalances and by increasing sensitivity to factors such as frostand attacks by fungi (Erisman and de Vries 2000).
There is substantial field documentation that N saturationdoes occur and that it is related to increases in atmosphericinputs. In a companion article in this issue of BioScience, Aberand colleagues (2003) analyze foliar, soil, and surface waterchemistry from a large number of sites to test for patterns thatcoincide with strong Nr deposition gradients across thenortheastern United States. Surface waters yield the clearestpatterns because they integrate over large areas; the surfacewater data show increasing Nr leaching in response to in-creasing Nr deposition (Aber et al. 2003). These results arevery similar to patterns observed in European forests. In an
analysis of 139 forests, Dise and colleagues (1998) foundthat inorganic Nr leaching increased with Nr deposition aswell as with changes in humus composition and soil acidity (figure 5).
How quickly Nr status or degree of N saturation canchange is poorly known. Very Nr-poor sites receiving con-centrated doses of DIN can retain over 100 g N per m2 beforenitrification and NO3
– leaching are induced (Magill et al.2000). Richer sites receiving more dilute solutions can showan increase in NO3
– loss immediately (Kahl et al. 1993). LessN appears to be required to move needle-leaved evergreensfrom stage 1 to stage 3 than is required for broad-leaved de-ciduous forests (Aber et al. 1995, 1998). Nitrogen saturationmay occur quickly near large point sources of Nr (Erismanand de Vries 2000).
It is clear that most Nr retained in forests is held in soils(Nadelhoffer et al. 1999, Magill et al. 2000). Recent worksuggests that either abiotic reactions between DIN and soil or-ganic matter or assimilation and conversion by mycorrhizaemay be important (Aber et al. 1998, Johnson et al. 2000, Dailet al. 2001). Understanding the kinetics and capacity of theseor other retention mechanisms is key to predicting Nr re-tention rates and the role of forests in the N cascade.
To summarize the role of forests in the N cascade: (a) Theresidence times and lag times of Nr in forests can be years tocenturies depending on forest history, type, and Nr inputs; (b)the effects of Nr accumulation in forests are numerous,mostly relating to changes in forest and microbial productivityand function; (c) there is significant potential for Nr to betransferred to the atmosphere as NO and N2O, and especially
to surface waters as NO3–, once Nr additions or avail-
ability exceed biotic requirements; and (d) relative to in-puts in areas with high Nr deposition, there is a limitedpotential for Nr to be removed from the cascade bymeans of N2 formation.
Grasslands. Unmanaged grasslands receive most oftheir Nr from BNF and atmospheric deposition; thelatter source is much more important where deposi-tion rates are large. As with forests, temperate grass-lands have the potential to be a major storage reser-voir and a short- to long-term sink within the Ncascade. At the Konza Prairie (tallgrass) site, for ex-ample, Nr stocks in soils and in biomass are on the or-der of 625 g per m2 and 6 to 25 g per m2, respectively(Blair et al. 1998). Inputs of Nr in unpolluted regionsare less than 1 g N per m2 per year but can reach 5 gN per m2 per year (Galloway and Cowling 2002). Theresidence times of Nr in grasslands can be decades tocenturies, because most biomass is subsurface anddecomposition rates are slow (Blair et al. 1998, Epsteinet al. 2001). Given the N-limited nature of most grass-lands and the long residence times, there is a large po-tential for significant internal cycling (including re-distribution by grazing animals) and for Nraccumulation.
April 2003 / Vol. 53 No. 4 • BioScience 347
Articles
Figure 4. Changes in several ecosystem functions with increasing Nravailability or degree of N saturation (modified from Aber et al.1998). Abbreviations: C, carbon; N, nitrogen; N2O, nitrous oxide;NPP, net primary productivity.
Dow
nloaded from https://academ
ic.oup.com/bioscience/article/53/4/341/250178 by guest on 28 M
arch 2022

Nr losses from grasslands can occur through hydrologiclosses and atmospheric emission. Because precipitationrates and thus runoff rates in grasslands are low, atmosphericemissions are important, especially if fire is frequent; fire-induced Nr losses can be approximately equal to input byatmospheric deposition. For example, in ungrazed regions ofthe Konza Prairie, Nr losses from fire can approximate or ex-ceed atmospheric Nr deposition inputs (Blair et al. 1998).However, some of these losses are in the form of N2 (Crutzenand Andreae 1990). For biomass burning in general,Kuhlbusch and colleagues (1991) estimate that N2 consti-tutes the largest flux of N gases emitted. Thus, if fire is frequent, some atmospheric Nr deposition resulting fromhuman action may be returned to the atmosphere, partly asNr and partly as N2.
In addition to denitrification through fire, Nr can also beconverted to N2 and lost from the grassland through micro-bial denitrification. However, because most grassland soils arewell aerated, conversion of Nr to N2 through microbial denitrification is probably not an important process (DelGrosso et al. 2001). If retained in the grassland, accumulatedNr can lead to increases in productivity and loss of biodiversity(Tartowski and Howarth 2000).
Grasslands managed for animal production (e.g., cattle) aremuch more “leaky” with respect to loss of added Nr. The ad-dition of fertilizer or grazing animals increases the amountof Nr that is available for loss, especially through the atmos-phere (e.g., NH3 [Sommer and Hutchings 1997] and N2O[Fowler et al. 1997]). Thus, in managed ecosystems the effectiveresidence times have the potential to be less than for un-managed systems.
Aquatic ecosystemsThis section discusses the N cascade in three types ofaquatic ecosystems: (1) groundwater; (2) wetlands,streams, lakes, and rivers; and (3) coastal systems.
Groundwater. The primary anthropogenic Nr source forgroundwater on a global basis is leaching from agro-ecosystems, although in some regions human waste dis-posal can also be important (Puckett et al. 1999, Refs-gaard et al. 1999, Hudak 2000, Nolan and Stoner 2000,Nolan 2001, van Egmond et al. 2002). Nitrate is the mostcommon Nr species (Burkart and Stoner 2001). As inother systems considered in this article, there are threefates of Nr in groundwater: accumulation, conversionto N2, and distribution to other systems through hy-drologic pathways (e.g., as NO3
–) or atmospheric path-ways (e.g., as N2O or NO). Although pollution can re-sult in high levels of NO3
– in some groundwateraquifers, the accumulation of N in groundwater is nota major sink for the N mobilized by human activity ateither global or regional scales. In regions of intense agri-cultural activity in Europe and the United States, the av-erage rate of accumulation of NO3
– in groundwateramounts to at most a few percent of the N inputs fromfertilizer and other sources (Howarth et al. 1996).
Nitrogen is lost from groundwater both through de-nitrification to N2 and through losses of Nr to surface waters and the atmosphere, but the relative mix of these fatesis site dependent, as is the residence time of Nr in ground-water reservoirs. For example, in an intensive agricultural areain west-central Minnesota, about 40% of the Nr that enteredthe groundwater was denitrified, and the rest accumulatedin the aquifer with little discharge to surface waters (Puck-ett et al. 1999, Puckett and Cowdery 2002). In the south-eastern United States, some systems have high losses ofNO3
– and concomitant low NO3– concentrations, while
other systems have low losses of NO3– and high NO3
– con-centrations (Nolan 1999). A review of several studies ofdenitrification in groundwater by Groffman and colleagues(1998) found similar degrees of variability.
Although the accumulation of Nr in groundwater is not aregionally or globally important sink relative to the amountof Nr created, the effects of elevated Nr in groundwater do posea significant human health risk, because drinking water canbecome contaminated. In the human body, NO3
– is con-verted to nitrite, which can cause methemoglobinemia by in-terfering with the ability of hemoglobin to take up O2. Mostcases of methemoglobinemia occur after consuming waterwith high concentrations of NO3
–; infants are particularly sus-ceptible, as are people who receive kidney dialysis treatment(Follett and Follett 2001). For this reason, the World HealthOrganization recommends that NO3
– concentrations indrinking water should be less than 10 milligrams (mg) N perliter. In the United States, NO3
– concentrations exceed this levelin more than 15% of groundwater samples from 4 of the 33major regional aquifers most commonly used as sources of
348 BioScience • April 2003 / Vol. 53 No. 4
Articles
Figure 5. Dissolved inorganic nitrogen (DIN, in kilograms per hectareper year) lost in runoff and seepage. Sites with throughfall DIN domi-nated by nitrogen from ammonium (NH4
+–N) are shown in open tri-angles (Dise et al. 1998). Nin represents N throughfall inputs.
Nin < 65% NH4+ –N
Nin > 65% NH4+ –N
Throughfall DIN flux (kg N per ha per year)
DIN
leac
hing
loss
(kg
N p
er h
a pe
r ye
ar)
Dow
nloaded from https://academ
ic.oup.com/bioscience/article/53/4/341/250178 by guest on 28 M
arch 2022

drinking water (Nolan and Stoner 2000). Other effects asso-ciated with elevated concentrations of NO3
– in drinking water include respiratory infection, alteration of thyroid me-tabolism, and cancers induced by conversion of NO3
– to N-nitroso compounds in the body (Follett and Follett 2001).
In summary, groundwater systems are accumulating Nr atlow rates compared with rates of human mobilization of Nrin the landscape, but the effects of contaminated ground-water can nonetheless be significant. Nr is lost from ground-water through denitrification, through advection of NO3
– tosurface waters, and through conversion to gaseous Nr formsthat diffuse or flow to the atmosphere. Just as there is a lag inNr release in forests because of N saturation phenomena(figure 4), there is also a lag for Nr release from ground-water to surface water, although this is highly variable amongsites (Groffman et al. 1998, Puckett and Cowdery 2002). Atsome time, the Nr introduced into groundwater will be trans-ferred to surface water if the Nr is not permanently stored ingroundwater or denitrified to N2. If the inputs of Nr togroundwater systems decrease, then the decrease of thegroundwater NO3
– burden can be delayed for a significantamount of time because of the significant residence time ofNr in groundwater reservoirs.
Wetlands, streams, lakes, and rivers. Surface freshwaterecosystems consist of wetlands (e.g., bogs, fens, marshes,swamps, and prairie potholes), streams, lakes (including ar-tificial reservoirs), and rivers. Surface freshwater ecosystemsreceive most of their Nr from their associated watersheds, fromatmospheric deposition, and from BNF within the system. Ni-trogen fixation is generally more important in eutrophiclakes and in some wetlands, where the process has beenfound to contribute between 5% and 80% of total Nr inputs(Howarth et al. 1988). There is limited potential for Nr ac-cumulation within surface water ecosystems because the res-idence time of Nr within surface waters, like the water itself,is very brief. Residence times may be relatively longer in thesediments associated with wetlands and some larger lakes, butthey are still short when compared with the residence timesin terrestrial ecosystems.
Despite a short residence time, Nr cycling in surface freshwater can be very complex. In addition to dissolved N2, in-organic oxidized and reduced forms of Nr can occur, as canorganic forms of Nr. In most headwater systems, the inorganicforms of Nr (NO3
– and NH4+) are present in low concentra-
tions unless the waters are associated with N-saturated forests,grasslands, agroecosystems, or suburban landscapes. This isprimarily because the intense cycling of Nr in the terrestrialportions of the watershed results in little runoff of Nr tostreams. The little inorganic Nr that does reach the streamsin pristine regions is usually denitrified or quickly incorpo-rated into biomass by aquatic plants and then recycled throughthe hierarchy of consumers and decomposers unless Nr con-centrations are high (Peterson et al. 2001). However, manyheadwater streams and lakes are now in highly disturbed
landscapes and thus have high NO3– concentrations, which
can lead to eutrophication problems locally or farther down-stream. In addition, for headwater streams and lakes drainingpoorly buffered soils, increased NO3
– concentrations can re-sult in stream acidification, with resultant impacts on biota.
In undisturbed areas in the temperate zone, the majorterrestrial flux of Nr into surface waters may be organic Nrin the form of detritus or dissolved organic matter washed intolakes and streams (Lewis 2002, Perakis and Hedin 2002).Undisturbed tropical regions can have significant losses ofNO3
– (Lewis et al. 1999). In the presence of increased at-mospheric deposition of inorganic Nr or significant land-useperturbations (e.g., urbanization or agriculture) in the ter-restrial watershed, the amount of Nr delivered to streams andlakes may easily exceed the retention capacity of the aquaticsystem. There will then be little delay in the transport of Ndown the cascade unless the Nr is denitrified back to N2. Asdiscussed below, the potential for denitrification in wetlands,streams, lakes, and rivers is large.
Wetlands can generally be considered aggrading ecosystemswhere the additional Nr can come from adjacent waters and,in some cases, from BNF and atmospheric deposition. Wet-lands are so efficient at removing Nr through denitrification(see below) that they are frequently constructed to remove Nrfrom effluent waters from a number of human activities.However, humans are also accelerating wetland removal. Inmany areas of the world, wetlands are being drained; nearlyhalf the wetlands in the United States have been destroyedsince 1780 (Gleick 1993). While wetlands can be efficient Nrsinks, their areal extent is limited (and becoming more lim-ited) compared with that of terrestrial and oceanic sinks.
In summary, the potential for Nr accumulation in streams,lakes, rivers, and associated wetlands is small (table 1). Whilechanges in Nr inputs to surface waters may significantly al-ter the internal cycles in these systems, from a global per-spective such changes are merely extremely efficient avenuesfor propagating the effects of the N cascade from higher tolower components. Even though wetlands may delay or prevent this transfer locally, and denitrification may short-circuit some of the Nr transport along the way, surface fresh-water ecosystems essentially move Nr from the mountains tothe sea, ensuring that perturbations at one point in the cascade quickly lead to changes elsewhere.
Coastal systems. Coastal ecosystems (e.g., estuaries) receivemost of their Nr from riverine and groundwater inputs;direct atmospheric deposition is an important source insome systems, and inputs from the ocean are important in others. These inputs have increased several-fold as a conse-quence of human activities (Howarth et al. 1996, Seitzingerand Kroeze 1998, NRC 2000, Howarth et al. 2002b). Becauseof the dynamic nature of coastal ecosystems, there is limitedpotential for Nr accumulation. In addition, although the po-tential for Nr transfer to continental shelf regions is large, thereis limited transport to the shelf because of the high rates of
April 2003 / Vol. 53 No. 4 • BioScience 349
Articles
Dow
nloaded from https://academ
ic.oup.com/bioscience/article/53/4/341/250178 by guest on 28 M
arch 2022

denitrification (mostly as N2), and the Nr that is transferredis mostly converted to N2 before its transport to the openocean. With coastal systems acting as Nr sinks, atmospheric deposition becomes a potentially important source of Nr forthe open ocean, especially in oligotrophic midocean gyres (figure 2).
Although Nr has a short residence time in coastal ecosys-tems compared with terrestrial ecosystems, the time it doesspend there can have a profound impact on the coastal ecosys-tem. Primary production in most coastal rivers, bays, and seasof the temperate zone is limited by Nr supplies (Vitousek andHowarth 1991, Nixon et al. 1996, NRC 2000). As a conse-quence, greater Nr inputs lead to increased growth of algae.In moderation, this can be viewed as beneficial, as it can leadto increased production of harvestable fish (Nixon 1988, Jor-gensen and Richardson 1996). However, high Nr inputs canalso lead to excessive algal growth, or eutrophication. In theUnited States, the increased Nr flux is now viewed as themost serious pollution problem in coastal waters (Howarthet al. 2000, Rabalais et al. 2002). One-third of the nation’scoastal rivers and bays are severely degraded, and another thirdhave been moderately degraded from nutrient overenrichment(Bricker et al. 1999). The situation is probably equally severein other regions of the globe where human activity is leadingto high Nr inputs to the coast (e.g., the North Sea and the BalticSea).
In the tropics, P rather than N often limits relatively pris-tine coastal ecosystems. However, increased nutrient loadingcan shift these systems toward Nr limitation (McGlathery etal. 1994, Howarth et al. 1995) and, as in temperate-zone sys-tems, Nr is a major contributor to coastal eutrophication intropical coastal systems (Corredor et al. 1999, NRC 2000,Rabalais 2002).
One of the most obvious consequences of increasing Nr in-puts to coastal waters over the past few decades has been anincrease in the size of water masses that are anoxic (completelydevoid of O2) or hypoxic (with concentrations of O2 lessthan 2 to 3 mg per liter). These so-called dead zones now oc-cur in the Gulf of Mexico, the Chesapeake Bay, Long IslandSound, Florida Bay, the Baltic Sea, the Adriatic Sea, and manyother coastal areas (Diaz and Rosenberg 1995, NRC 2000). Thehypoxic water mass in the northern Gulf of Mexico hasgrown in size in recent summers to about 20,000 square kilo-meters and is clearly attributable to Nr pollution runningdown the Mississippi River (Goolsby et al. 1999, Rabalais etal. 1999, 2002, NRC 2000).
Other major effects of increasing Nr in coastal regions in-clude loss of seagrass beds, macroalgal beds, and changes incoral reefs (Lapointe and O’Connell 1989,Valiela et al. 1997,Howarth et al. 2000, NRC 2000). Reactive N additions can in-crease the incidence and duration of harmful algal blooms(NRC 2000). Anoxic or hypoxic events and harmful algalblooms can lead to fish kills. Reactive N pollution can also leadto more subtle effects, with alterations of marine food websthat lead to decreased fish production (NRC 2000). Reactive
N pollution is a leading cause of loss of biotic diversity in marine ecosystems (NRC 1996, 2000).
In summary, Nr inputs to coastal ecosystems have in-creased significantly over the last few decades. Although mostNr is eventually denitrified to N2 within the coastal ecosys-tems and associated shelf, Nr pollution has significant andwidespread impacts on various ecosystem components andon human health (table 1).
Denitrification potential in the wetland–stream–river–estuary–shelf continuum. Along the entire aquatic continuum,from wetlands to headwater streams to the continental shelfand eventually to the open ocean, not only is Nr rapidly cycled among the various forms (e.g., NH4
+, NO3–, and par-
ticulate and dissolved organic N), there is great potential forloss of Nr from the biosphere through the conversion ofNO3
– to N2 (denitrification). In this section we aim to iden-tify places along the N cascade where Nr can be converted backinto N2 or N2O.
Conditions required for this conversion include (a) the pres-ence of NO3
– or nitrite (referred to collectively in this sectionas nitrate), (b) the presence of labile organic matter, and (c)the absence or low concentration of dissolved O2. The mostactive sites for denitrification in aquatic systems are benthicsediments, which are often anoxic below the first few mil-limeters, even though the overlying water is well oxygenated.Even when nitrate concentrations are low in sediments, de-nitrification rates could be high if other conditions are fa-vorable, because of the close spatial and temporal couplingof nitrification and denitrification. Denitrification also can oc-cur in anoxic zones within the water column, with the primarysource of nitrate coming from outside the zone of anoxia.
Increased inputs of Nr from anthropogenic sources can in-crease rates of denitrification along the entire aquatic con-tinuum. As Nr inputs increase, they can increase the nitrateconcentration in the water column and thus increase the dif-fusive supply of nitrate to the sediments. Increased inputs ofNr can also enhance primary production, particularly in Nr-limited estuarine and continental shelf waters, thus increas-ing organic matter deposition to the sediments and subsequentsediment nitrification and denitrification. However, if Nrinputs result in the water column becoming anoxic, sedi-ment nitrification and consequently denitrification canmarkedly decrease. For example, in the Chesapeake Bay, de-nitrification in sediments underlying anoxic waters was lowcompared with periods of well-oxygenated bottom waters(Kemp et al. 1990). However, the net effect of persistentanoxic water in estuarine and continental shelf systems, wherenitrate concentrations and rates of water advection are low,on total denitrification rates (in sediment plus water) is notwell documented. On the other hand, in rivers such as theSeine and Scheldt, with high inputs of nitrate from upstreamagricultural sources, more Nr was removed in the river by de-nitrification when the water was severely depleted in O2,compared with times after improvements in sewage treatment
350 BioScience • April 2003 / Vol. 53 No. 4
Articles
Dow
nloaded from https://academ
ic.oup.com/bioscience/article/53/4/341/250178 by guest on 28 M
arch 2022

when the O2 concentrations in the river increased (Billen1990).
The proportion of Nr inputs removed through denitrifi-cation has a similar range for lakes, rivers, and estuaries (generally from less than 10% to more than 80%). Is there anoverall ecosystem property that can account for the widevariability in the proportion of the Nr inputs removed throughdenitrification? The residence time of water is an importantfactor controlling removal of Nr through denitrification instreams, lakes, rivers, and estuaries. The effect of water resi-dence time is probably related to the time that Nr has to re-act in the ecosystem before it is transported to the adjacentdownstream system. The relationship between the proportionof Nr inputs that are denitrified and the water residence timein an aquatic environment was originally shown for well-oxy-genated and well-mixed shallow lakes (Kelly et al. 1987).This relationship was extended to river reaches and reservoirsand indicated that a smaller proportion of the Nr inputswere retained in a river reach (often 5% to 20%) comparedwith many lakes and reservoirs (from about 10% to more than90%; Howarth et al. 1996). Recently, this relationship forstream and river reaches was incorporated into a stream andriver network watershed model that was applied to 15 rivernetworks in the northeastern United States (Seitzinger et al.2002). The model results indicate that the Nr removal effi-ciency varies throughout a network of rivers and streams.Reaches in smaller streams remove a greater proportion of theNr inputs to those reaches than reaches in larger rivers per se.However, the total amount of Nr removed by denitrificationis greater in downstream reaches, because the total Nr inputs,primarily from the upstream watershed, are larger.At the scaleof a whole wetland–stream–river network, the cumulative ef-fect of continued Nr removal along the entireflow path from wetlands to small streams tolarger rivers downstream can result in denitrifi-cation of as much as 30% to 70% of the totalexternal Nr inputs to the river, although theproportion of Nr inputs removed by denitrifi-cation in a particular reach is generally quitesmall (often 1% to 20%).
Physical alterations to rivers, such as chan-nelization, can decrease water residence timeand thus decrease denitrification within a river.Channelization of rivers also destroys riparianwetlands, which have a considerable capacityfor Nr removal (Billen and Garnier 2000).Wetland restoration and the construction ofnew wetlands have been considered as optionsfor decreasing Nr loading at local and regionalscales. While individual wetlands are clearlyactive sites for denitrification, the overall con-tribution of wetlands to Nr removal at thewhole-watershed scale generally is not welldocumented and warrants further analysis.
Reactive N not removed within the wetland–river network is transported to
estuaries or discharged by large rivers directly onto the con-tinental shelf. In estuaries, water residence time again is an im-portant factor controlling the proportion of Nr inputs thatare removed by denitrification. A similar functional rela-tionship to the ones demonstrated for lakes and rivers appliesto estuaries. In estuaries with a water residence time rangingfrom 0.1 month to over a year, the total Nr inputs removedby denitrification ranged from less than 10% to approxi-mately 75% (Nixon et al. 1996).
Nr that has not been removed by denitrification in riversor estuaries is subject to removal on the continental shelf (e.g.,Devol and Christensen 1993, Laursen and Seitzinger 2001).In fact, Nr removed by denitrification in shelf sedimentsprobably exceeds Nr exported to coastal areas by rivers. De-tailed Nr budgets for continental shelf regions throughout theNorth Atlantic basin suggest that denitrification in conti-nental shelf sediments is equal to or greater than inputs of Nrfrom land-based sources (Seitzinger and Giblin 1996). The ad-ditional Nr required to support the estimated denitrificationrates in shelf sediments probably comes from the transportof Nr from oceanic regions across the slope–shelf boundary.Confirming this observation in another region, Chen andWang (1999) found that the net denitrification rate in the EastChina Sea shelf is greater than the total riverine supply to theregion. Additional measurements of denitrification and Nrinputs for other continental shelf regions throughout theworld’s oceans are needed to better understand the Nr bal-ance and final fate of land-based Nr inputs.
In summary, nearly all of the Nr that is injected into sur-face waters is denitrified along the stream–river–estuary–shelfcontinuum (figure 6). While most of this Nr is converted toN2, a fraction is converted to N2O and NO. Model estimates
April 2003 / Vol. 53 No. 4 • BioScience 351
Articles
Figure 6. The transport of reactive nitrogen from terrestrial to oceanic systemsdecreases at each step along the river–estuarine–continental shelf system.
Denitrification reduces the downstream transport of N
10–80% entering estuaries denitrified
30–70% enteringrivers denitrified
> 80% entering shelves denitrified
Dow
nloaded from https://academ
ic.oup.com/bioscience/article/53/4/341/250178 by guest on 28 M
arch 2022

of global N2O emissions suggest that rivers, estuaries, and con-tinental shelves account for approximately 30% of the totalglobal anthropogenic N2O emissions (Seitzinger et al. 2000).As injections of Nr to rivers increase, so will the rates ofcreation of NO and N2O (Seitzinger and Kroeze 1998).
The nitrogen cascade: Linkages with other elementsElevated atmospheric Nr can increase ozone, increase at-mospheric fine particulate loadings, and enhance the im-pacts of aerosol sulfate on the atmospheric radiation bal-ance. These are not the only important linkages. Becausemany natural ecosystems are N limited (e.g., temperate andboreal forests, grasslands, and temperate coastal waters), theincreased abundance of Nr leads to increases in productivity,which in turn lead to increases in uptake of all other elementstied to productivity (e.g., calcium [Ca], C, P, potassium, andmagnesium). Eventually, another element may replace N asthe limiting element. For example, when temperate forestedecosystems reach stage 3 of N saturation, N becomes a non-limiting element for plant growth (figure 4). At that point,something else becomes limiting, and the basic biogeo-chemical nature of the forest changes. Other possible limit-ing materials are base cations, P, light, and water (e.g., Schulze1989, DeHayes et al. 1999).
Matson and colleagues (2002) discuss how the globaliza-tion of Nr deposition raises questions concerning conse-quences of anthropogenic Nr for ecosystems in tropical re-gions, where P or Ca most likely limits production in humidtropical forest and savanna ecosystems with highly weatheredsoils. In many of these systems, Nr may already be a nutrientin excess, so many tropical humid forests may be naturally Nsaturated (Hall and Matson 1999).
The nitrogen cascade: Possibilities for interventionNr accumulation in environmental reservoirs enhances theN cascade and its consequences on people and ecosystems.However, just as anthropogenic activities have substantiallyincreased the rate of Nr formation, it is possible to interveneat critical points along the N cascade and make Nr less abun-dant. There are two ways to decrease total Nr: (1) decrease therate of Nr creation during energy and food production or (2)convert Nr back to N2 following Nr creation and use.
Decreasing the rate of reactive nitrogen creation. There is nobenefit to the Nr created during fossil fuel combustion. Ni-trogen oxides are formed inadvertently during combustioneither through oxidation of fossil-organic Nr in the fuel orthrough oxidation of atmospheric N2. In both cases, the op-tions for significantly decreasing NOx emissions are numer-ous, either by using an alternative method to provide energy(e.g., hydrocarbon-based fuel cells) or by eliminating NOx andother Nr species from the combustion products (Bradleyand Jones 2002, Moomaw 2002). It is now technically feasi-ble to decrease Nr creation from fossil fuel combustion to apoint where it becomes just a minor disturbance to the global
cycle (Cowling et al. 2002). If that occurs, NOy deposition toglobal ecosystems will decrease by about half, and the re-maining major NOx sources will be emissions from biomassburning and agricultural soils. Nr deposition to regional systems will also decrease. In the northeastern United States,if fossil fuel combustion were no longer a source of NOx, Nrdeposition to the research sites in the study by Aber and colleagues (2003) would decrease by more than 50% (Ollingeret al. 1993). Kroeze and colleagues (2001) examined the ef-fect of instituting the maximum technical potential to decreaseNOx emissions in Europe on DIN export by European riversin the year 2050. This scenario assumed that all countries ap-ply maximum emission control in electricity generation,transport, and industry. This resulted in a decrease of ap-proximately 80% in NOy deposition to European watershedsrelative to a business-as-usual scenario.
In food production, there is a benefit to Nr creation throughthe Haber-Bosch process and through cultivation-inducedBNF. However, there is also inefficiency. Of about 170 Tg Nof Nr added to global crop agroecosystems in 1995, onlyabout 12% entered human mouths (figure 3; Smil 1999,2002). Most of the rest was distributed to the environmentwithout serving the purpose for which it was created.
There is ample opportunity to increase the efficiency of Nruse in food production and thus decrease the Nr creation rate.There are many ways of achieving this goal: (a) increase theefficiency of N use in crop and animal agriculture (Cassmanet al. 2002), (b) increase Nr recycling within agroecosystems(i.e., if Nr is not incorporated into food the first time around,send it around again; Smil 2002), (c) increase use of cultiva-tion-induced BNF (Roy et al. 2002), (d) provide incentives toreduce overfertilization (Howarth et al. 2002b), and (e) re-distribute Nr from areas with high Nr production to areaswhere there is a need for Nr for food production (Erisman etal. 2001).
CAFOs offer large opportunities for improvement of N-useefficiency. In recent decades, livestock and meat processing industries have been transformed in many countries. Both ver-tical and horizontal integration have great potential to max-imize N-use efficiency with integrated economic and advisory-service linkages among farmers, feed suppliers, animal-rearingadvisers, and food-processing companies. These changes often lead to largely unforeseen Nr-induced environmentalproblems, mainly on local and regional scales. Thus, em-phasis on economic efficiency without attention to Nr-inducedhealth and environmental risks leads to externalization ratherthan internalization of these real costs.
If societies decreased their consumption of meat, therewould be less demand for Nr created to produce food (Bleken1997, Kroeze et al. 2001, Smil 2002). Howarth and colleagues(2002a) project that if the US population adopted a Mediter-ranean diet of approximately 6.3 kg meat per capita per year(about one-seventh of the supply in the United States), totalinorganic N fertilizer consumption would decrease to about6.9 Tg N per year by 2030—a 65% decrease. Kroeze and
352 BioScience • April 2003 / Vol. 53 No. 4
Articles
Dow
nloaded from https://academ
ic.oup.com/bioscience/article/53/4/341/250178 by guest on 28 M
arch 2022

colleagues (2001) report similar findings for the United Statesand Europe.
The projections for future Nr creation through the Haber-Bosch process depend to a large extent on the degree of in-tervention and on assumptions and preferences regarding human diets. A study of future fertilizer requirements up tothe year 2030 projects that annual increases in fertilizer usewill range from 0.7% to 1.3%, depending on assumptionsabout N-use efficiency (FAO 2000, Fixen and West 2002). Inabsolute terms, this means that N fertilizer use in 2030 willrange from about 96 Tg N per year to 118 Tg N per year, com-pared with about 78 Tg N per year for the base period1995–1997. Tilman and colleagues (2001) project that N fer-tilizer use will increase from 87 Tg N per year in 2000 to 135Tg N per year in 2020. While the actual production of Nr inthe future for fertilizer use is uncertain, it is clear that N de-mands for food production will increase.
Increasing the conversion of reactive nitrogen to N2. In mostenvironmental reservoirs, N2 formation is very limited (e.g.,atmosphere, grasslands, and forested ecosystems) or counter-productive to the purpose of the system (e.g., agroecosystems).The wetland–stream–river–estuary–shelf continuum is theonly system that provides this service naturally, at rates thatare large relative to Nr inputs. However, before Nr is convertedto N2 in the continuum, a number of detrimental effects oc-cur in forests, grasslands, and surface water ecosystems. Forthis reason, the next opportunity for intervention is imme-diately after Nr is used as a resource but before it is distrib-uted to the environment. While there are probably othersuitable points for intervention, we choose two: (1) Nr lossesfrom animal and human waste and (2) Nr transfer fromagroecosystems to surface waters.
Globally, animals and humans excrete about 75 Tg N peryear and about 23 Tg N per year, respectively (Smil 1999).While this is about 80% of the Nr created for food produc-tion, some of it is reused, and not all of the remainder is eas-ily collectible. For animals, of about 75 Tg N per year, about28 Tg N per year are produced in CAFOs, and of that about18 Tg N per year are recycled to agroecosystems, leavingabout 10 Tg N per year as easily collectible waste Nr. For hu-mans, in 2000, 47% of the world’s population lived in an ur-ban environment; of this 47%, 84% had their waste collectedby a sewage system (6 March 2003; www.worldbank.org/data/dataquery.html). So, of about 23 Tg N per year contained inhuman waste that is generated annually, municipal sewage op-erations collect about 9 Tg N per year. Thus, of about 100 TgN per year produced as Nr-containing waste by animals andhumans, about 21 Tg N per year is not reused and is easily col-lectible, which increases the potential for a “denitrification in-tervention” unless other value-added products can be madeusing this N-rich resource (Cassman et al. 2002, Oenemaand Pietrzak 2002).
The second intervention point is between agroecosystemsand streams or rivers. Accepting that Nr leakages will occurfrom most agroecosystems and some forests, there is an
opportunity to take advantage of the fact that denitrificationdoes occur in wetland and riparian areas (Hill 1996, Hill etal. 2000, Steinhart et al. 2000, Mitsch et al. 2001), and specificmanagement activities can be used to create an environmentthat will increase this rate (e.g., Schipper and Vojvodic-Vukovic 2001). However, it is not enough to increase de-nitrification; the production of N2 must also be optimized rel-ative to N2O formation.
SummaryThe atmosphere directly receives about 15% of the Nr createdby human activities as a consequence of energy production;all of it is deposited as Nr. Agroecosystems receive 75%,most of which is either transferred directly into the atmos-phere or hydrosphere or lost to the environment during theprocess of food production and consumption. The remain-ing 10% of the Nr is used in industrial processes. The primarybeneficial effect of Nr introduced into agroecosystems is human nutrition; other effects occur as the Nr from agro-ecosystems cascades through other environmental systems.
In the atmosphere, increased Nr concentrations have di-rect and indirect impacts on human and ecosystem health ona regional and global basis. Most of the Nr emitted to the at-mosphere is deposited back to Earth’s surface after hours todays. Increased Nr deposition to grasslands and forests has aresidence time of years to centuries, introducing the poten-tial for a large lag time in the cascade. Because the productionof N2 is small relative to Nr inputs, N accumulates in a reac-tive form, resulting in initially increased productivity andsome loss of biodiversity, and ultimately some loss of pro-ductivity. Several regions of the world have already reachedthe point where accumulation has slowed and loss of Nr tothe atmosphere and hydrosphere has increased.
Transfer of Nr from the atmosphere, agroecosystems,forests, and grasslands into the wetland–stream–river–estuary hydrosphere continuum is increasing and has re-sulted in numerous effects, including acidification, eutroph-ication, and human health problems. However, throughoutthe continuum there is a large potential for conversion of Nrto N2, especially in wetlands, large rivers, estuaries, and the con-tinental shelf. Thus, while the N cascade begins at the pointof Nr creation, and while Nr will accumulate in and cycleamong, most terrestrial systems, the cascade reaches an endat the continental margins, where its primary continuationis N2O production during nitrification.
AcknowledgmentsA topic of this scale requires expertise from a diverse collec-tion of disciplines. In that regard, we are grateful for the ad-vice and counsel of Beth Boyer, Eric Davidson, Linda Deegan,Steve Del Grosso, Russell Dickerson, Nancy Dise, Howard Ep-stein, Christy Goodale, Peter Groffman, Bill Keene, TomNolan, and Jeff Stoner. We also appreciate the constructivecomments of Ton Bresser, Paul Fixen, Rick Haeuber, KathleenLohse, Jerry Melillo, Bill Moomaw, Oene Oenema, NancyRabalais, Rabindra Roy,Vaclav Smil, Rob Socolow, Klaas van
April 2003 / Vol. 53 No. 4 • BioScience 353
Articles
Dow
nloaded from https://academ
ic.oup.com/bioscience/article/53/4/341/250178 by guest on 28 M
arch 2022

Egmond, Dan Walters, Ford West, and Xunhua Zheng, whoprovided comments about the N cascade during the PlenarySpeaker Workshop held in April 2001 before the Second In-ternational Nitrogen Conference held the following October.We thank Mary Ann Seifert for putting the paper into the correct format and Sue Donovan for assistance in figurepreparation. James N. Galloway is grateful to the EcosystemsCenter of the Marine Biological Laboratory and the WoodsHole Oceanographic Institution for providing a sabbaticalhome to write this paper and to the University of Virginia forthe Sesquicentennial Fellowship.
References citedAber JD, Magill A, McNulty SG, Boone RD, Nadelhoffer KJ, Downs M, Hal-
lett R. 1995. Forest biogeochemistry and primary production altered bynitrogen saturation. Water, Air and Soil Pollution 85: 1665–1670.
Aber JD, McDowell WH, Nadelhoffer KJ, Magill A, Berntson G, Kamakea M,McNulty SG, Currie W, Rustad L, Fernandez I. 1998. Nitrogen saturationin temperate forest ecosystems: Hypotheses revisited. BioScience 48:921–934.
Aber JD, Goodale CL, Ollinger SV, Smith M-L, Magill AH, Martin ME, Hal-lett RA, Stoddard JL. 2003. Is nitrogen deposition altering the nitrogenstatus of northeastern forests? BioScience 53: 375–389.
Ayres RU, Schlesinger WH, Socolow RH. 1994. Human impacts on the car-bon and nitrogen cycles. Pages 121–155 in Socolow RH,Andrews C, Berk-hout R, Thomas V, eds. Industrial Ecology and Global Change. Cambridge(MA): Cambridge University Press.
Beier C, Blanck K, Bredemeier M, Lamersdorf N, Rasmussen L, Xu Y-J.1998. Field-scale “clean” rain treatments to two Norway spruce standswithin the EXMAN project—effects on soil solution chemistry, foliar nu-trition and tree growth. Forest Ecology and Management 101: 111–124.
Billen G. 1990. N-budget of the major rivers discharging into the continen-tal coastal zone of the North Sea: The nitrogen paradox. Pages 153–172in Lancelot C, Billen G, Barth H, eds. Eutrophication and Algal Bloomin North Sea Zones, the Baltic and Adjacent Areas: Prediction and As-sessment of Prevention Actions. Brussels (Belgium): Commission ofthe European Communities. Water Pollution Research Report 12.
Billen G, Garnier J. 2000. Nitrogen transfers through the Seine drainagenetwork: A budget based on the application of the “Riverstrahler”model.Hydrobiologia 410: 139–150.
Blair JM, Nellis MD, Turner CL, Henebry GM, Su Haiping. 1998. Terrestrialnutrient cycling in tallgrass prairie. Pages 222–243 in Knapp AK, BriggsJM, Hartnett DC, Collins SL, eds. Grassland Dynamics: Long-Term Eco-logical Research in Tallgrass Prairie. New York: Oxford University Press.
Bleken MA. 1997. Food consumption and nitrogen losses from agriculture.Pages 19–31 in Lag J, ed. Some Geomedical Consequences of NitrogenCirculation Processes. Oslo (Norway): Norwegian Academy of Scienceand Letters.
Boxman AW, Blanck K, Brandrud T-E, Emmett BA, Gundersen P, HogervorstRF, Kjonaas OJ, Persson H, Timmermann V. 1998. Vegetation and soilbiota response to experimentally-changed nitrogen inputs in coniferousforest ecosystems of the NITREX project. Forest Ecology and Manage-ment 101: 65–80.
Bradley MJ, Jones BM. 2002. Reducing global NOx emissions: Promoting thedevelopment of advanced energy and transportation technologies.Ambio 31: 141–149.
Bricker SB, Clement CG, Pirhalla DE, Orland SP, Farrow DGG. 1999. NationalEstuarine Eutrophication Assessment: A Summary of Conditions, His-torical Trends, and Future Outlook. Silver Spring (MD): National Oceanicand Atmospheric Administration, National Ocean Service.
Burkart MR, Stoner JD. 2001. Nitrogen in groundwater associated withagricultural systems. Pages 123–145 in Follett RF, Hatfield JL, eds. Nitrogenin the Environment: Sources, Problems and Management. Amsterdam(Netherlands): Elsevier Science.
Cassman KG, Dobermann AD, Walters D. 2002. Agroecosystems, nitrogen-use efficiency, and nitrogen management. Ambio 31: 132–140.
Chen AC-T, Wang S-L. 1999. Carbon, alkalinity and nutrient budgets on theEast China Sea continental shelf. Journal of Geophysical Research 104:20,675–20,686.
Corredor JE, Howarth RW, Twilley RR, Morell JM. 1999. Nitrogen cyclingand anthropogenic impact in the tropical interamerican seas. Biogeo-chemistry 46: 163–178.
Cowling E, Erisman JW, Smeulders SM, Holman SC, Nicholson BM. 1998.Optimizing air quality management in Europe and North America: Jus-tification for integrated management of both oxidized and reducedforms of nitrogen. Environmental Pollution 102: 599–608.
Cowling EB, et al. 2002. Optimizing nitrogen management in food and en-ergy production and environmental protection: Summary statementfrom the Second International Nitrogen Conference. In Galloway JN,Cowling EB, Erisman JW, Wisniewski J, Jordan C, eds. Optimizing Nitrogen Management in Food and Energy Production and Environ-mental Protection: Contributed Papers from the Second InternationalNitrogen Conference, 14–18 October 2001, Potomac, Maryland. Lisse(Netherlands): A. A. Balkema.
Crutzen PJ, Andreae MO. 1990. Biomass burning in the tropics: Impact onatmospheric chemistry and biogeochemical cycles. Science 250:1669–1678.
Dail DB, Davidson EA, Chorover J. 2001. Rapid abiotic transformation of ni-trate in an acid forest soil. Biogeochemistry 54: 131–146.
Davidson EA, Keller M, Erickson HE, Verchot LV, Veldkemp E. 2000. Test-ing a conceptual model of soil emissions of nitrous and nitric oxides. Bio-Science 50: 667–680.
DeHayes DH, Schaberg PG, Hawley GJ, Strimbeck GR. 1999. Acid rain im-pact on calcium nutrition and forest health. BioScience 49: 789–800.
Del Grosso SJ, Parton, WJ, Mosier AR, Hartman MD, Keough CA, PetersonGA, Ojima DS, Schimel DS. 2001. Simulated effects of land use, soil tex-ture and precipitation on N gas emissions using DAYCENT. Pages413–432 in Follett RF, Hatfield JL, eds. Nitrogen in the Environment:Sources, Problems and Management. Amsterdam (Netherlands):Elsevier Science.
Devol AH, Christensen JP. 1993. Benthic fluxes and nitrogen cycling in sed-iments of the continental margin of the eastern North Pacific. Journalof Marine Research 51: 345–372.
Diaz R, Rosenberg R. 1995. Marine benthic hypoxia: A review of its ecolog-ical effects and the behavioral responses of benthic macrofauna. Oceanog-raphy and Marine Biology Annual Review 33: 245–303.
Dise NB, Wright RF. 1995. Nitrogen leaching in European forests in relationto nitrogen deposition. Forest Ecology and Management 71: 153–162.
Dise NB, Matzner E, Gundersen P. 1998. Synthesis of nitrogen pools and fluxesfrom European forest ecosystems. Water, Air and Soil Pollution 105:143–154.
Driscoll C, et al. 2003. Nitrogen pollution in the northeastern United States:Sources, effects, and management options. BioScience 53: 357–374.
Epstein HE, Burke IC, Mosier AR. 2001. Plant effects on nitrogen retentionin shortgrass steppe 2 years after 15N addition. Oecologia 128: 422–430.
Erisman JW, de Vries W. 2000. Nitrogen deposition and effects in Europeanforests. Environmental Reviews 8: 65–93.
Erisman JW, de Vries W, Kros H, Oenema O, van der Eerden L, SmeuldersS. 2001. An outlook for a national integrated nitrogen policy. Environ-mental Science and Policy 4: 87–95.
[FAO] Food and Agriculture Organization of the United Nations. 2000.Fertilizer Requirements in 2015 and 2030. Rome: FAO.
[FAOSTAT] FAO statistical databases. 2000. (4 March 2003; http://apps.fao.org)Fenn ME, et al. 2003a. Ecological effects of nitrogen deposition in the west-
ern United States. BioScience 53: 404–420.Fenn ME, et al. 2003b. Nitrogen emissions, deposition, and monitoring in
the western United States. BioScience 53: 391–403.Fixen PE, West FB. 2002. Nitrogen fertilizers: Meeting the challenge. Ambio
31: 169–176.Follett JR, Follett RF. 2001. Utilization and metabolism of nitrogen by
humans. Pages 65–92 in Follett R, Hatfield JL, eds. Nitrogen in the
354 BioScience • April 2003 / Vol. 53 No. 4
Articles
Dow
nloaded from https://academ
ic.oup.com/bioscience/article/53/4/341/250178 by guest on 28 M
arch 2022

Environment: Sources, Problems and Management.Amsterdam (Nether-lands): Elsevier Science.
Fowler D, Skiba U, Hargreaves KJ. 1997. Emissions of nitrous oxide from grass-lands. Pages 147–164 in Jarvis SC, Pain BF, eds. Gaseous Nitrogen Emis-sions from Grasslands. North Wyke (United Kingdom): Institute ofGrassland and Environmental Research.
Galloway JN. 1998. The global nitrogen cycle: Changes and consequences.Environmental Pollution 102 (S1): 15–24.
Galloway JN, Cowling EB. 2002. Reactive nitrogen and the world: Two hun-dred years of change. Ambio 31: 64–71.
Galloway JN, Schlesinger WH, Levy H II, Michaels A, Schnoor JL. 1995. Ni-trogen fixation: Anthropogenic enhancement—environmental response.Global Biogeochemical Cycles 9: 235–252.
Galloway JN, Cowling EB, Seitzinger SJ, Socolow R. 2002. Reactive nitrogen:Too much of a good thing? Ambio 31: 60–63.
Gleick PH, ed. 1993. Water in Crisis: A Guide to the World’s Fresh Water Re-sources. New York: Oxford University Press.
Goodale CL,Aber JD, McDowell WH. 2000. Long-term effects of disturbanceon organic and inorganic nitrogen export in the White Mountains, NewHampshire. Ecosystems 3: 433–450.
Goolsby DA, Battaglin WA, Lawrence GB, Artz RS, Aulenbach BT, HooperRP, Keeney DR, Stensland GJ. 1999. Flux and sources of nutrients in theMississippi-Atchafalaya River Basin: Topic 3 Report for the IntegratedAssessment on Hypoxia in the Gulf of Mexico. Silver Spring (MD): Na-tional Oceanic and Atmospheric Administration. NOAA Coastal OceanProgram Decision Analysis Series no. 17.
Groffman PM, Gold AJ, Jacinthe PA. 1998. Nitrous oxide production in ri-parian zones and groundwater. Nutrient Cycling in Agroecosystems 52:179–186.
Gundersen P, Emmett BA, Kjonaas OJ, Koopmans CJ, Tietema A. 1998. Im-pact of nitrogen deposition on nitrogen cycling in forests: A synthesis ofNITREX data. Forest Ecology and Management 101: 37–56.
Hall SJ, Matson PA. 1999. Nitrogen oxide emissions after nitrogen additionsin tropical forests. Nature 400: 152–155.
Hill AR. 1996. Nitrate removal in stream riparian zones. Journal of Envi-ronmental Quality 25: 743–755.
Hill AR, Devito KJ, Campagnolo S, Sanmugadas K. 2000. Subsurface deni-trification in a forest riparian zone: Interactions between hydrologyand supplies of nitrate and organic carbon. Biogeochemistry 51: 193–223.
Holland EA, Lamarque J-F. 1997. Bio-atmospheric coupling of the nitrogencycle through NOx emissions and NOy deposition. Nutrient Cycling inAgroecosystems 48: 7–24.
Howarth RW, Marino R, Lane J, Cole JJ. 1988. Nitrogen fixation in freshwater,estuarine, and marine ecosystems, 1: Rates and importance. Limnologyand Oceanography 33: 669–687.
Howarth RW, Jensen H, Marino R, Postma H. 1995. Transport to and pro-cessing of phosphorus in near-shore and oceanic waters. Pages 323–345in Tiessen H, ed. Phosphorus in the Global Environment, SCOPE 54.Chichester (United Kingdom): Wiley and Sons.
Howarth RW, et al. 1996. Regional nitrogen budgets and riverine N and Pfluxes for the drainages to the North Atlantic Ocean: Natural and humaninfluences. Biogeochemistry 35: 75–139.
———. 2000. Nutrient pollution of coastal rivers, bays, and seas. Issues inEcology 7: 1–15.
Howarth RW, Boyer E, Pabich W, Galloway JN. 2002a. Nitrogen use in theUnited States from 1961–2000 and potential future trends. Ambio 31:88–96.
Howarth RW, Sharpley AW, Walker D. 2002b. Sources of nutrient pollutionto coastal waters in the United States: Implications for achieving coastalwater quality goals. Estuaries 25: 656–676.
Hudak PF. 2000. Regional trends in nitrate content of Texas groundwater.Journal of Hydrology 228: 37–47.
Johnson DW, Cheng W, Burke IC. 2000. Biotic and abiotic nitrogen reten-tion in a variety of forest soils. Soil Science Society of America Journal64: 1503–1514.
Jorgensen BB, Richardson K. 1996. Eutrophication in Coastal Marine Sys-tems. Washington (DC): American Geophysical Union.
Kahl JS, Norton SA, Fernandez IJ, Nadelhoffer KJ, Driscoll CT, Aber JD. 1993.Experimental inducement of nitrogen saturation at the watershed scale.Environmental Science and Technology 27: 565–568.
Keeling CD. 1993. Global historical CO2 emissions. Pages 501–504 in BodenTA, Kaiser DP, Sepanski RJ, Stoss FW, eds. Trends ’93: A Compendiumof Data on Global Change. Oak Ridge (TN): Carbon Dioxide Informa-tion Analysis Center, Oak Ridge National Laboratory. ORNL/CDIAC-65.
Kelly CA, Rudd JWM, Hesslein RH, Schindler DW, Dillon PJ, Driscoll CT,Gherini SA, Hecky RE. 1987. Prediction of biological acid neutralizationin acid-sensitive lakes. Biogeochemistry 3: 129–140.
Kemp WM, Sampou PA, Caffrey JM, Mayer M, Henriksen K, Boynton WR.1990.Ammonium recycling versus denitrification in Chesapeake Bay sed-iments. Limnology and Oceanography 35: 1545–1563.
Kramer DA. 1999. US Geological Survey Minerals information: Nitrogen statistics and information. (4 March 2003; http://minerals.usgs.gov/minerals/pubs/commodity/nitrogen)
Kroeze C, Seitzinger KP, Domingues R. 2001. Future trends in worldwide rivernitrogen transport and related nitrous oxide emissions: A scenarioanalysis. Scientific World 1: 328–335.
Kuhlbusch TA, Lobert JM, Crutzen PJ, Warneck P. 1991. Molecular nitrogenemissions from denitrification during biomass burning. Nature 351:135–137.
Lapointe BE, O’Connell JD. 1989. Nutrient-enhanced productivity ofCladophroa prolifera in Harrington Sounds, Bermuda: Eutrophicationof a confined, phosphorus-limited marine ecosystem. Estuarine, Coastaland Shelf Science 28: 347–360.
Laursen AE, Seitzinger SP. 2001. The role of denitrification in nitrogen re-moval and carbon mineralization in mid-Atlantic bight sediments. Con-tinental Shelf Research 22: 1397–1416.
Lewis WM. 2002. Estimation of background nitrogen yields for NorthAmerica by use of benchmark watersheds. Biogeochemistry 57–58:375–385.
Lewis WM, Melack JM, McDowell WH, McClaine M, Richey JE. 1999. Ni-trogen yields from undisturbed watersheds in the Americas. Biogeo-chemistry 46: 149–162.
Mackenzie FT. 1998. Our Changing Planet: An Introduction to Earth Sys-tem Science and Global Environmental Change. 2nd ed. Upper SaddleRiver (NJ): Prentice-Hall.
Magill A, Aber J, Berntson G, McDowell W, Nadelhoffer K, Melillo J, SteudlerP. 2000. Long-term nitrogen additions and nitrogen saturation in two tem-perate forests. Ecosystems 3: 238–253.
Matson P, Lohse K, Hall S. 2002. The globalization of nitrogen: Conse-quences for terrestrial ecosystems. Ambio 31: 113–119.
McGlathery KJ, Marino R, Howarth RW. 1994. Variable rates of phosphateuptake by shallow marine sediments: Mechanisms and ecological sig-nificance. Biogeochemistry 25: 127–146.
Mitsch WJ, Day JW, Gilliam W, Groffman PM, Hey DL, Randall GW, WangN. 2001. Reducing nitrogen loading to the Gulf of Mexico from the Mis-sissippi River Basin: Strategies to counter a persistent ecological prob-lem. BioScience 51: 373–388.
Moomaw WR. 2002. Energy, industry and nitrogen: Strategies for reducingreactive nitrogen emissions. Ambio 31: 184–189.
Müller J. 1992. Geographical distribution and seasonal variation of surfaceemissions and deposition velocities of atmospheric trace gases. Journalof Geophysical Research 97: 3787–3804.
Nadelhoffer KJ, Downs MR, Fry B. 1999. Sinks for 15N-enriched additionsto an oak forest and a red pine plantation. Ecological Applications 9:72–86.
Nixon SW. 1988. Physical energy inputs and the comparative ecology of lakeand marine ecosystems. Limnology and Oceanography 33: 1005–1025.
Nixon SW, et al. 1996. The fate of nitrogen and phosphorus at the land–seamargin of the North Atlantic Ocean. Biogeochemistry 35: 141–180.
Nolan BT. 1999. Nitrate behavior in ground waters of the SoutheasternUSA. Journal of Environmental Quality 28: 1518–1527.
———. 2001. Relating nitrogen sources and aquifer susceptibility to nitratein shallow ground waters of the United States. Ground Water 39: 290–299.
April 2003 / Vol. 53 No. 4 • BioScience 355
Articles
Dow
nloaded from https://academ
ic.oup.com/bioscience/article/53/4/341/250178 by guest on 28 M
arch 2022

Nolan BT, Stoner JD. 2000. Nutrients in groundwaters of the conterminousUnited States, 1992–1995. Environmental Science and Technology 34:1156–1165.
[NRC] National Research Council. 1996. Understanding Marine Biodiver-sity. Washington (DC): National Academy Press.
———. 2000. Clean Coastal Waters: Understanding and Reducing the Ef-fects of Nutrient Pollution. Washington (DC): National Academy Press.
Oenema O, Pietrzak S. 2002. Nutrient management in food production:Achieving agronomic and environmental targets. Ambio 31: 159–168.
Oenema O, Bannink A, Sommer SG,Velthof GL. 2001. Gaseous nitrogen emis-sions from livestock farming systems. Pages 255–290 in Follett RF, Hat-field JL, eds. Nitrogen in the Environment: Sources, Problems and Man-agement. Amsterdam (Netherlands): Elsevier Science.
Ollinger SV, Aber JD, Lovett GM, Millham SE, Lathrop RG. 1993. A spatialmodel of atmospheric deposition for the northeastern U.S. Ecological Ap-plications 3: 459–472.
Penner JE, et al. 2001. Aerosols, their direct and indirect effects. Pages289–348 in Houghton JT, Griggs DJ, Noguer M, van der Linden PJ, DaiX, Maskell K, Johnson CA, eds. Climate Change 2001: The Scientific Ba-sis. Contributions of Working Group I to the Third Assessment Reportof the Intergovernmental Panel on Climate Change. New York: CambridgeUniversity Press.
Perakis SS, Hedin LO. 2002. Nitrogen loss from unpolluted South Americanforests mainly via dissolved organic compounds. Nature 415: 416–419.
Peterson BJ, et al. 2001. Control of nitrogen export from watersheds ofheadwater streams. Science 292: 86–90.
Pope CA III, Thun MJ, Namboodiri MM, Dockery DW, Evans JS, Speizer FE,Heath CW Jr. 1995. Particulate air pollution as a predictor of mortalityin a prospective study of U.S. adults.American Journal of Respiratory Crit-ical Care Medicine 151: 669–674.
Prather M, et al. 2001. Atmospheric chemistry and greenhouse gases. Pages239–287 in Houghton JT, Griggs DJ, Noguer M, van der Linden PJ, DaiX, Maskell K, Johnson CA, eds. Climate Change 2001: The Scientific Ba-sis. Contributions of Working Group I to the Third Assessment Reportof the Intergovernmental Panel on Climate Change. New York: CambridgeUniversity Press.
Puckett LJ, Cowdery TK. 2002. Transport and fate of nitrate in a glacialoutwash aquifer in relation to ground-water age, land use practices andredox processes. Journal of Environmental Quality 31: 782–796.
Puckett LJ, Cowdery TK, Lorenz DL, Stoner JD. 1999. Estimation of nitratecontamination of an agro-ecosystem outwash aquifer using a nitrogenmass-balance budget. Journal of Environmental Quality 28: 2015–2025.
Rabalais N. 2002. Nitrogen in aquatic ecosystems. Ambio 31: 102–112.Rabalais NN, Turner RE, Justic D, Dortch Q, Wiseman WJ Jr. 1999. Char-
acterization of Hypoxia: Topic 1. Report for the Integrated Assessmentof Hypoxia in the Gulf of Mexico. Silver Spring (MD): National Oceanicand Atmospheric Administration. NOAA Coastal Ocean Program Decision Analysis Series Report no. 15.
Rabalais NN, Turner RE, Scavia D. 2002. Beyond science into policy: Gulf ofMexico hypoxia and the Mississippi River. BioScience 52: 129–142.
Refsgaard JC, Thorsen M, Jensen JB, Kleeschulte S, Hansen S. 1999. Large scalemodelling of groundwater contamination from nitrate leaching. Jour-nal of Hydrology 221: 117–140.
Roy RN, Misra RV, Montanez A. 2002. Decreasing reliance on mineral ni-trogen, yet more food. Ambio 31: 177–183.
Schipper LA, Vojvodic-Vukovic M. 2001. Five years of nitrate removal, de-nitrification and carbon dynamics in a denitrification wall.Water Research35: 3473–3477.
Schulze ED. 1989. Air pollution and forest decline in a spruce (Picea abies)forest. Science 244: 776–783.
Seinfeld JH, Pandis SN. 1998. Atmospheric Chemistry and Physics: From AirPollution to Climate Change. New York: John Wiley and Sons.
Seitzinger SP, Giblin AE. 1996. Estimating denitrification in North Atlanticcontinental shelf sediments. Biogeochemistry 35: 235–260.
Seitzinger SP, Kroeze C. 1998. Global distribution of nitrous oxide produc-tion and N inputs in freshwater and coastal marine ecosystems. GlobalBiogeochemical Cycles 12: 93–113.
Seitzinger SP, Kroeze C, Styles RV. 2000. Global distribution of N2O emis-sions from aquatic systems: Natural emissions and anthropogenic effects.Chemosphere: Global Change Science 2: 267–279.
Seitzinger SP, Styles RV, Boyer E, Alexander RB, Billen G, Howarth R, MayerB, van Breemen N. 2002. Nitrogen retention in rivers: Model develop-ment and application to watersheds in the eastern U.S. Biogeochemistry57–58: 199–237.
Smil V. 1999. Nitrogen in crop production: An account of global flows.Global Biogeochemical Cycles 13: 647–662.
———. 2001. Enriching the Earth: Fritz Haber, Carl Bosch, and the Trans-formation of Food Production. Cambridge (MA): MIT Press.
———. 2002. Nitrogen and food production: Proteins for human diets.Ambio 31: 126–131.
Sommer SG, Hutchings NJ. 1997. Components of ammonia volatilizationfrom cattle and sheep production. Pages 79–93 in Jarvis SC, Pain BF, eds.Gaseous Nitrogen Emissions from Grasslands. North Wyke (UnitedKingdom): Institute of Grassland and Environmental Research.
Steinhart GS, Likens GE, Groffman PM. 2000. Denitrification in streamsediments of five northeastern (USA) streams. Verhandlungen der In-ternationalen Vereinigung für Theoretische und Angewandte Limnolo-gie 27: 1331–1336.
Tartowski S, Howarth RW. 2000. Nitrogen, nitrogen cycling. Encyclopediaof Biodiversity 4: 377–388.
Tilman D, Fargione J,Wolff B, D’Antonio C, Dobson A, Howarth R, SchindlerD, Schlesinger WH, Simberloff D, Swackhamer D. 2001. Forecastingagriculturally driven global change. Science 292: 281–284.
Valiela I, McClelland J, Hauxwell J, Behr PJ, Hersh D, Foreman K. 1997.Macroalgal blooms in shallow estuaries: Controls and ecophysiologicaland ecosystem consequences. Limnology and Oceanography 42:1105–1118.
van Aardenne JA, Dentener FJ, Klijn Goldewijk CGM, Lelieveld J, Olivier JGJ.2001. A 1° × 1° resolution dataset of historical anthropogenic trace gasemissions for the period 1890–1990. Global Biogeochemical Cycles 15:909–928.
van Breemen N, et al. 2002. Where did all the nitrogen go? Fate of nitrogeninputs to large watersheds in the northeastern USA. Biogeochemistry57–58: 267–293.
van Egmond ND, Bresser AHM, Bouwman AF. 2002. The European nitro-gen case. Ambio 31: 72–78.
Vitousek PM, Howarth RW. 1991. Nitrogen limitation on land and in the sea:How can it occur? Biogeochemistry 13: 87–115.
Vitousek PM, Howarth RW, Likens GE, Matson PA, Schindler D, SchlesingerWH, Tilman GD. 1997. Human alteration of the global nitrogen cycle:Causes and consequences. Issues in Ecology 1: 1–17.
Wolfe A, Patz JA. 2002. Nitrogen and human health: Direct and indirect im-pacts. Ambio 31: 120–125.
356 BioScience • April 2003 / Vol. 53 No. 4
Articles
Dow
nloaded from https://academ
ic.oup.com/bioscience/article/53/4/341/250178 by guest on 28 M
arch 2022