An Ecosystem-Based Approach to Assess the Status of a Mediterranean Ecosystem, the Posidonia...
17
An Ecosystem-Based Approach to Assess the Status of a Mediterranean Ecosystem, the Posidonia oceanica Seagrass Meadow Se ´ bastien Personnic 1 *, Charles F. Boudouresque 1 , Patrick Astruch 2 , Enric Ballesteros 3 , Sylvain Blouet 4 , Denise Bellan-Santini 5 , Patrick Bonhomme 2 , Delphine Thibault-Botha 1 , Eric Feunteun 6 , Mireille Harmelin-Vivien 1 , Ge ´ rard Pergent 7 , Christine Pergent-Martini 7 , Je ´re ´ my Pastor 8 , Jean-Christophe Poggiale 1 , Florent Renaud 5 , Thierry Thibaut 1 , Sandrine Ruitton 1 1 Aix-Marseille University, Mediterranean Institute of Oceanography (MIO), Universite ´ de Toulon, CNRS/INSU, IRD, UM 110, Marseille, France, 2 GIS Posidonie, Pytheas Institute, Aix-Marseille University, Marseille, France, 3 Centre d’Estudis Avanc ¸ats de Blanes - CSIC, Blanes, Spain, 4 Aire marine prote ´ge ´e de la co ˆ te Agathoise, site natura 2000, Agde, France, 5 Aix-Marseille University, Institut Me ´ diterrane ´en de Biodiversite ´ et d’Ecologie (IMBE), UMR 7263, Station Marine d’Endoume, Marseille, France, 6 Museum National d’Histoire Naturelle, UMR 7208, Station Marine de Dinard, France, 7 Equipe Ecosyste `mes Littoraux, FRES 3041, University of Corsica, Corte, France, 8 Universite ´ de Perpignan, Via Domitia, Centre de Formation et de Recherche sur les Environnements Me ´ diterrane ´ens, UMR 5110, Perpignan, France Abstract Biotic indices, which reflect the quality of the environment, are widely used in the marine realm. Sometimes, key species or ecosystem engineers are selected for this purpose. This is the case of the Mediterranean seagrass Posidonia oceanica, widely used as a biological quality element in the context of the European Union Water Framework Directive (WFD). The good quality of a water body and the apparent health of a species, whether or not an ecosystem engineer such as P. oceanica, is not always indicative of the good structure and functioning of the whole ecosystem. A key point of the recent Marine Strategy Framework Directive (MSFD) is the ecosystem-based approach. Here, on the basis of a simplified conceptual model of the P. oceanica ecosystem, we have proposed an ecosystem-based index of the quality of its functioning, compliant with the MSFD requirements. This index (EBQI) is based upon a set of representative functional compartments, the weighting of these compartments and the assessment of the quality of each compartment by comparison of a supposed baseline. The index well discriminated 17 sites in the north-western Mediterranean (French Riviera, Provence, Corsica, Catalonia and Balearic Islands) covering a wide range of human pressure levels. The strong points of the EBQI are that it is easy to implement, non-destructive, relatively robust, according to the selection of the compartments and to their weighting, and associated with confidence indices that indicate possible weakness and biases and therefore the need for further field data acquisition. Citation: Personnic S, Boudouresque CF, Astruch P, Ballesteros E, Blouet S, et al. (2014) An Ecosystem-Based Approach to Assess the Status of a Mediterranean Ecosystem, the Posidonia oceanica Seagrass Meadow. PLoS ONE 9(6): e98994. doi:10.1371/journal.pone.0098994 Editor: Arga Chandrashekar Anil, CSIR- National institute of oceanography, India Received December 16, 2013; Accepted May 9, 2014; Published June 16, 2014 Copyright: ß 2014 Personnic et al. This is an open-access article distributed under the terms of the Creative Commons Attribution License, which permits unrestricted use, distribution, and reproduction in any medium, provided the original author and source are credited. Funding: This study has been funded by the French Centre National de la Recherche Scientifique (CNRS), the French Re ´ seau des Stations et Observatoires Marins (RESOMAR), the Muse ´um National d’Histoire Naturelle (MNHN, Paris), the French Agence de l’eau Rho ˆne Me ´diterrane ´e Corse through the French part of the European MSFD project (in French: Directive Cadre Strate ´gie pour le Milieu Marin, DCSMM). The funders had no role in study design, data collection and analysis, decision to publish, or preparation of the manuscript. Competing Interests: The authors have declared that no competing interests exist. * E-mail: [email protected] Introduction Human activities can deeply alter the environment, species composition and functioning of ecosystems. These alterations can be tracked by the use of biotic indices, i.e. species or groups of species whose function, population, or status reflect the environ- mental quality. Thus, biotic indices are monitored for changes in presence and abundance. The occurrence of an organism in a specific environment indicates that overall, its biological require- ments are satisfied, whereas its disappearance suggests a change in the environment. Species are also monitored for changes in biochemistry, physiology or behaviour induced by environmental conditions. Biotic indices are used in terrestrial, freshwater and marine habitats, because they enable the quality of an environ- ment to be characterized in an integrated way [1–7]. Biotic indices are widely used in the marine realm to (i) assess the quality of a water body, (ii) assess processes such as currents, sedimentation and climate under natural and anthropogenic forcing, and (iii) monitor the status of species or communities of interest, either emblematic species, indicators of some ecosystemic processes or indicators of pollution. Sometimes, key species and ecosystem engineers [8–10] are selected for this purpose. This is the case of the seagrass Posidonia oceanica [11–17]. In the European Union (EU), the so called Habitats Directive of 1992 (92/43/ECC) listed habitats and species that are used to designate areas (‘Natura 2000 sites’), where they are strictly protected. While the Habitats Directive also considered the marine realm, more recently, the EU Marine Strategy Framework Directive (MSFD: 2008/56/EC) established a framework for conservation in the field of marine environmental policy. The PLOS ONE | www.plosone.org 1 June 2014 | Volume 9 | Issue 6 | e98994
-
Upload
univ-corse -
Category
Documents
-
view
3 -
download
0
Transcript of An Ecosystem-Based Approach to Assess the Status of a Mediterranean Ecosystem, the Posidonia...

An Ecosystem-Based Approach to Assess the Status of aMediterranean Ecosystem, the Posidonia oceanicaSeagrass MeadowSebastien Personnic1*, Charles F. Boudouresque1, Patrick Astruch2, Enric Ballesteros3, Sylvain Blouet4,
Denise Bellan-Santini5, Patrick Bonhomme2, Delphine Thibault-Botha1, Eric Feunteun6,
Mireille Harmelin-Vivien1, Gerard Pergent7, Christine Pergent-Martini7, Jeremy Pastor8,
Jean-Christophe Poggiale1, Florent Renaud5, Thierry Thibaut1, Sandrine Ruitton1
1 Aix-Marseille University, Mediterranean Institute of Oceanography (MIO), Universite de Toulon, CNRS/INSU, IRD, UM 110, Marseille, France, 2 GIS Posidonie, Pytheas
Institute, Aix-Marseille University, Marseille, France, 3 Centre d’Estudis Avancats de Blanes - CSIC, Blanes, Spain, 4 Aire marine protegee de la cote Agathoise, site natura
2000, Agde, France, 5 Aix-Marseille University, Institut Mediterraneen de Biodiversite et d’Ecologie (IMBE), UMR 7263, Station Marine d’Endoume, Marseille, France,
6 Museum National d’Histoire Naturelle, UMR 7208, Station Marine de Dinard, France, 7 Equipe Ecosystemes Littoraux, FRES 3041, University of Corsica, Corte, France,
8 Universite de Perpignan, Via Domitia, Centre de Formation et de Recherche sur les Environnements Mediterraneens, UMR 5110, Perpignan, France
Abstract
Biotic indices, which reflect the quality of the environment, are widely used in the marine realm. Sometimes, key species orecosystem engineers are selected for this purpose. This is the case of the Mediterranean seagrass Posidonia oceanica, widelyused as a biological quality element in the context of the European Union Water Framework Directive (WFD). The goodquality of a water body and the apparent health of a species, whether or not an ecosystem engineer such as P. oceanica, isnot always indicative of the good structure and functioning of the whole ecosystem. A key point of the recent MarineStrategy Framework Directive (MSFD) is the ecosystem-based approach. Here, on the basis of a simplified conceptual modelof the P. oceanica ecosystem, we have proposed an ecosystem-based index of the quality of its functioning, compliant withthe MSFD requirements. This index (EBQI) is based upon a set of representative functional compartments, the weighting ofthese compartments and the assessment of the quality of each compartment by comparison of a supposed baseline. Theindex well discriminated 17 sites in the north-western Mediterranean (French Riviera, Provence, Corsica, Catalonia andBalearic Islands) covering a wide range of human pressure levels. The strong points of the EBQI are that it is easy toimplement, non-destructive, relatively robust, according to the selection of the compartments and to their weighting, andassociated with confidence indices that indicate possible weakness and biases and therefore the need for further field dataacquisition.
Citation: Personnic S, Boudouresque CF, Astruch P, Ballesteros E, Blouet S, et al. (2014) An Ecosystem-Based Approach to Assess the Status of a MediterraneanEcosystem, the Posidonia oceanica Seagrass Meadow. PLoS ONE 9(6): e98994. doi:10.1371/journal.pone.0098994
Editor: Arga Chandrashekar Anil, CSIR- National institute of oceanography, India
Received December 16, 2013; Accepted May 9, 2014; Published June 16, 2014
Copyright: � 2014 Personnic et al. This is an open-access article distributed under the terms of the Creative Commons Attribution License, which permitsunrestricted use, distribution, and reproduction in any medium, provided the original author and source are credited.
Funding: This study has been funded by the French Centre National de la Recherche Scientifique (CNRS), the French Reseau des Stations et Observatoires Marins(RESOMAR), the Museum National d’Histoire Naturelle (MNHN, Paris), the French Agence de l’eau Rhone Mediterranee Corse through the French part of theEuropean MSFD project (in French: Directive Cadre Strategie pour le Milieu Marin, DCSMM). The funders had no role in study design, data collection and analysis,decision to publish, or preparation of the manuscript.
Competing Interests: The authors have declared that no competing interests exist.
* E-mail: [email protected]
Introduction
Human activities can deeply alter the environment, species
composition and functioning of ecosystems. These alterations can
be tracked by the use of biotic indices, i.e. species or groups of
species whose function, population, or status reflect the environ-
mental quality. Thus, biotic indices are monitored for changes in
presence and abundance. The occurrence of an organism in a
specific environment indicates that overall, its biological require-
ments are satisfied, whereas its disappearance suggests a change in
the environment. Species are also monitored for changes in
biochemistry, physiology or behaviour induced by environmental
conditions. Biotic indices are used in terrestrial, freshwater and
marine habitats, because they enable the quality of an environ-
ment to be characterized in an integrated way [1–7].
Biotic indices are widely used in the marine realm to (i) assess
the quality of a water body, (ii) assess processes such as currents,
sedimentation and climate under natural and anthropogenic
forcing, and (iii) monitor the status of species or communities of
interest, either emblematic species, indicators of some ecosystemic
processes or indicators of pollution. Sometimes, key species and
ecosystem engineers [8–10] are selected for this purpose. This is
the case of the seagrass Posidonia oceanica [11–17].
In the European Union (EU), the so called Habitats Directive of
1992 (92/43/ECC) listed habitats and species that are used to
designate areas (‘Natura 2000 sites’), where they are strictly
protected. While the Habitats Directive also considered the marine
realm, more recently, the EU Marine Strategy Framework
Directive (MSFD: 2008/56/EC) established a framework for
conservation in the field of marine environmental policy. The
PLOS ONE | www.plosone.org 1 June 2014 | Volume 9 | Issue 6 | e98994

MSFD is considered to be the environmental pillar of the
Integrated Maritime Policy adopted in 2010 by the European
Commission (2010/477/EU). This directive established eleven
criteria, based on the descriptors set out in the MSFD, to
determine ‘good environmental status’: (i) Biological diversity is
maintained, (ii) Introduced species are at levels that do not
adversely alter the ecosystems, (iii) Populations of all exploited
fish and shellfish are within safely biological limits, (iv) All
elements of the food webs occur at levels capable of ensuring the
long-term abundance of the species, (v) Human-induced eutro-
phication is at a minimum, (vi) Sea-floor integrity is at a level that
ensures that the structure and functions of the ecosystems are
safeguarded, (vii) Permanent alteration of hydrographical condi-
tions does not adversely affect marine ecosystems, (viii) Concen-
tration of contaminants are at levels not giving rise to pollution
effects, (ix) Contaminants in fish and other seafood do not exceed
levels established by Community legislation, (x) Properties and
quantities of marine litter do not cause harm to the coastal and
marine environment, and (xi) Introduction of energy is at levels
that do not adversely affect the marine environment. The EU
MSFD established a framework within which Member States
agreed to take the appropriate measures to achieve or maintain
good environmental status in the marine realm by the year 2020 at
the latest.
A key point of the MSFD is the ecosystem-based approach.
Most previous strategies only dealing with Biological Quality
Elements (BQE: species and/or communities) used in the
European Union Water Framework Directive (WFD) were not
indicative of ecosystem status, but merely indicative of the
environmental status of water bodies [18–22,17,23] for a review
of the approaches for classifying and assessing quality of benthic
habitats. As an example of the possible shortcomings that may
arise from the WFD descriptors, a seagrass meadow characterized
by normal leaf growth, shoot density and the absence of
mechanical injuries would be ranked as ‘good’, even if deprived
of some basic compartments of the ecosystem.
According to the MSFD, ‘good environmental status’ means
that the marine environment is at a level that allows uses and
activities by current and future generations, i.e. the structure,
functions and processes of the constituent marine ecosystems,
together with the associated physiographic, geographic, geological
and climatic factors, allow those ecosystems to function fully and to
maintain their resilience to human induced environmental change.
Overall, marine species and marine habitats are protected,
human-induced decline of biodiversity is prevented and diverse
biological components function in balance.
While the ecosystem-based approach constitutes the back-
ground and the guidelines of the MSFD, the pristine state of an
ecosystem is not clearly defined. Obviously, such a notion is very
complex and prone to anthropocentrism; reference conditions, as
observed in areas distant from known human impact, may
constitute a more realistic notion. Here we try to define: (i) how
the status of an ecosystem can be measured and how much its
current status differs from ‘reference conditions’, and (ii) which
parameters we need to monitor to ascertain these targets. The
Posidonia oceanica seagrass meadow was chosen for this attempt
because: (i) it is widely present in almost the whole of the
European Mediterranean; (ii) it is the only marine ecosystem
considered as ‘priority habitat’ by the EU Habitats Directive; (iii)its functioning is relatively well known [11,24–30]; and (iv) like
many seagrass ecosystems in the world ocean, P. oceanica meadows
have been impacted or lost under the influence of direct and
indirect effects of human activities and are therefore regarded as
threatened [31–33]. Similar ecosystem-based approaches have
been attempted for fisheries (e.g. [34–38,40,41]) and for the
management and conservation of ecosystem services (e.g.
[34,41,42]).
Materials and Methods
The conceptual modelPosidonia oceanica (L.) Delile is a seagrass species (Magnoliophyta,
kingdom Archaeplastida) endemic to the Mediterranean Sea [43],
which dwells in the sublittoral zone, from mean sea level down to
30 to 40 m depth, depending upon water transparency [27,28,32].
Due to the length, up to 120 cm, and density of the leaves, the
seagrass canopy decreases water movement and traps sediments
[44–47]. Rhizomes resist burial by vertical growth, so that the sea
bottom slowly rises. Within the sediment, the deeper parts of the
rhizomes, attached leaf sheaths and roots die, but their decay is
extremely slow, so that they can persist for millennia [24,27]. The
terrace constituted by live and dead intertwined rhizomes,
together with the sediment, which fills the interstices, is named
‘matte’ [27,48,49]. When P. oceanica dies, the matte persists
(hereafter ‘dead matte’), since the decay of the rhizomes proceeds
extremely slowly [44,50]. P. oceanica is the engineer of an ecosystem
of major importance in the Mediterranean Sea [27,28]. A
conceptual model of the functioning of the P. oceanica ecosystem
has been proposed [11,27,28]. Here, we use an updated version of
this conceptual model (Fig. 1; C.F. Boudouresque, unpublished).
The simplified conceptual model of the functioning of the P.
oceanica ecosystem in the north-western Mediterranean Sea used in
the present study (Fig. 1) encompasses the following compartments
(boxes); these compartments are listed hereafter and detailed later
on:
– Posidonia oceanica roots and rhizomes (box 1).
– Multicellular Photosynthetic Organisms (MPOs) epibiotic on P.
oceanica rhizomes.
– P. oceanica leaves (box 2).
– MPO leaf epibiota (box 3).
– Dissolved Organic Carbon (DOC).
– Pelagic microbial loop.
– Filter- and suspension-feeder leaf epibiota (box 4).
– Filter- and suspension-feeder benthic epibiota on P. oceanica
rhizomes: the bivalve Pinna nobilis (box 5) and other species, e.g.
bryozoans and ascidians (box 6).
– The litter detritus (essentially dead P. oceanica leaves and some
broken rhizomes) (box 7).
– Detritus feeders 1, e.g. Amphipoda, Isopoda (crustaceans) and
Psammechinus microtuberculatus (sea urchin).
– Detritus feeders 2 and 3, e.g. Amphipoda, Isopoda (crusta-
ceans) and Holothuria spp. (sea cucumber) (box 8).
– Decomposers, namely Bacteria, Archaea, Fungi and heterotro-
phic stramenopiles (BAFHS) such as Labyrinthulomycota and
Oomycota.
– The benthic microbial loop.
– The matte endofauna, e.g. annelids and mollusks.
– Herbivores 1, e.g. Sarpa salpa (teleost), Paracentrotus lividus (sea
urchin), Idotea spp. and Pisa spp. (crustaceans) (box 9).
– Herbivores 2, e.g. Amphipoda (crustaceans), Jujubinus spp. and
Rissoa spp. (gastropods).
– Predatory teleosts (e.g. Diplodus spp., Sparus aurata, Labrus spp.
and Symphodus spp.), cephalopods and seastars (e.g. Marthasterias
glacialis) (box 10).
Ecosystem-Based Approach of Posidonia oceanica Meadow Status
PLOS ONE | www.plosone.org 2 June 2014 | Volume 9 | Issue 6 | e98994

– Piscivorous teleosts, e.g. Conger conger, Scorpaena spp. and Serranus
spp. (box 11).
– Planktivorous teleosts of the water column, e.g. Spicara spp. and
Chromis chromis (box 12).
– Sea birds, e.g. Phalacrocorax aristotelis ssp. desmarestii and Pandion
haliaetus (box 13).
– Plankton (photosynthetic plankton and zooplankton) and non-
living Particulate Organic Matter (POM).
Considered functional compartments (boxes)Whenever possible, non-destructive methods were chosen to
measure the parameters of the status of the functional compart-
ments, as suggested by [51]. In the absence of further indications,
measures are performed at a depth of ca. 15 meters (10 to 20 m),
which is then considered as representative of the whole depth
range [14,52]. The season of the sampling is indicated only for
compartments which present seasonal variability. In the ranking of
the status of the selected compartments (boxes), two cases were
encountered; (i) a steady trend of the parameter, from very good
to a low quality state; (ii) an upward/downward slope parameter,
when the very good state corresponds to intermediate values.
Posidonia roots and rhizomes. (box 1, Fig. 1). This
compartment was estimated by the growth rate of vertical
(orthotropic) rhizomes. The matte compartment results in carbon
sequestration within the matte, which acts as a carbon sink
[27,44,53,54] and was measured by means of lepidochronology
[55,56]. Lepidochronology describes the annual cycle of leaf
formation. A cycle includes a suite of dead leaf bases (called dead
sheaths or scales) of increasing then decreasing thickness. An
average of 7.5 leaves (generally between 6 and 9) are produced
every year [57–60]. We considered that high and low rhizome
growth rates are indicative of over sediment input or of deficit in
sediment, respectively (Table 1). The highest growth rate of an
orthotropic rhizome is 7 cm year21; higher sedimentation rates
result in the death of the buried leaf bundle [44,61]. In contrast,
deficit in sediment results in bare, non-sediment protected
rhizomes, which are hence very vulnerable to storms, anchoring
and trawling [27]. The nature of the substratum, namely meadows
settled on rock, sand or matte, only slightly influences the growth
rate of rhizomes [62] and no major differences were found at the
community level [63] so that it was not necessary to adapt the
scale. Thirty random in situ measures (growth of the rhizome
corresponding to the last 8 dead leaf bases) are recommended. The
obtained value was multiplied by 1.5 in order to take into account
Figure 1. Conceptual model of the functioning of Posidonia oceanica seagrass ecosystem. For functional compartments and box numbers,see text. Primary producers are in green; filter-feeders, suspension-feeders, litter, detritus feeders, Dissolved Organic Carbon (DOC) and microbialloops are in orange; predators (including herbivores) are in yellow. The width of the arrows roughly represents the importance of the carbon flow.The proper P. oceanica ecosystem is included within the red rectangle. MPO: Multicellular Photosynthetic Organisms. POM: Particulate OrganicMatter. From C.F. Boudouresque, unpublished.doi:10.1371/journal.pone.0098994.g001
Ecosystem-Based Approach of Posidonia oceanica Meadow Status
PLOS ONE | www.plosone.org 3 June 2014 | Volume 9 | Issue 6 | e98994

Ta
ble
1.
Re
lati
vew
eig
hti
ng
of
eac
hfu
nct
ion
alco
mp
artm
en
t(b
oxe
s;se
eFi
g.
1fo
rb
ox
nu
mb
er)
and
ran
ge
so
fe
ach
par
ame
ter
de
fin
ed
for
eac
hg
rad
eo
fe
cosy
ste
mst
atu
s.
Bo
xn
um
be
rF
un
ctio
na
lco
mp
art
me
nt
We
igh
tin
g(W
)P
ara
me
ter
43
21
0
1R
oo
tsan
drh
izo
me
s(‘r
hiz
om
es’
)3
Gro
wth
of
ort
ho
tro
pic
rhiz
om
es
(mm
a21)
9to
19
20
to4
03
to8
.4
0,
3
2P
osi
do
nia
oce
an
ica
leav
es
(‘le
ave
s’)
5-
De
nsi
ty(s
ho
ots
m2
2)
$4
90
48
9to
37
03
69
to2
50
24
9to
13
0,
13
0
-C
ove
r(%
).
80
80
to6
16
0to
41
40
to2
0,
20
3–
4M
PO
s,fi
lte
r-an
dsu
spe
nsi
on
-fe
ed
ers
leaf
ep
ibio
ta(‘l
eaf
ep
ibio
ta’)
4B
iom
ass
(gD
Msh
oo
t21)
(on
lyth
e2
old
est
-e
xte
rnal
-le
ave
s)0
.3to
0.7
0.1
to0
.20
.8to
1.5
,0
.1.
1.5
5B
en
thic
filt
er-
fee
de
r:P
inn
an
ob
ilis
(biv
alve
)(‘P
inn
a’)
2D
en
sity
(in
div
idu
als
10
0m
22)
.3
.03
.0to
1.1
1.0
to0
.60
.5to
0.1
,0
.1
6O
the
rb
en
thic
filt
er-
and
susp
en
sio
n-f
ee
de
rs(‘H
OM
LOM
’)2
-H
OM
-D
en
sity
(m2
2)
,0
.10
.1to
0.9
1.0
to1
.92
.0to
5.0
.5
.0
-LO
M-
De
nsi
ty(m
22)
.1
0.0
10
.0to
5.1
5.0
to1
.11
.0to
0.1
,0
.1
7Li
tte
rd
etr
itu
s:d
ead
leav
es
and
bro
ken
rhiz
om
es
(‘lit
ter’
)2
gD
Mm
22
.3
50
35
0-2
51
25
0-1
51
15
0-5
1#
50
8D
etr
itu
s-fe
ed
ers
2an
d3
(Ho
loth
uri
asp
p.)
(‘Ho
loth
uri
a’)
2In
div
idu
als
10
m2
21
.0to
4.9
0.2
to0
.95
.0to
24
.9,
0.2
$2
5.0
9H
erb
ivo
res
1(‘h
erb
ivo
res’
)5
-D
en
sity
of
Pa
race
ntr
otu
sliv
idu
s(i
nd
ivid
ual
sm
22)
1.0
to4
.90
.1to
0.9
5.0
to9
.9,
0.1
$1
0
-G
razi
ng
ind
ex
(%le
ave
s)3
0to
59
%5
to2
9%
60
to9
5%
,5
%.
95
%
10
Pre
dat
ory
tele
ost
s,ce
ph
alo
po
ds
and
seas
tars
(‘pre
dat
ors
’)5
kgte
leo
sts
WM
10
0m
22
.1
.51
.5to
1.1
1.0
to0
.60
.5to
0.3
,0
.3
11
Pis
civo
rou
ste
leo
sts
(‘pis
civo
res’
)5
kgte
leo
sts
WM
10
0m
22
.1
.01
.0to
0.6
0.5
to0
.30
.2to
0.1
,0
.1
12
Pla
nkt
ivo
rou
ste
leo
sts
(‘pla
nkt
ivo
res’
)3
-Z
oo
pla
nkt
on
fee
de
rs-
kgte
leo
sts
WM
10
0m
22
.3
.03
.0to
1.6
1.5
to0
.80
.7to
0.3
,0
.3
-O
mn
ivo
res
-kg
tele
ost
sW
M1
00
m2
2.
3.0
3.0
to1
.61
.5to
0.8
0.7
to0
.3,
0.3
9–
12
All
tele
ost
s(‘S
RD
I’)3
Spe
cifi
cR
ela
tive
Div
ers
ity
Ind
ex
(SR
DI)
.1
01
0to
87
to5
4to
3,
3
13
Sea
bir
ds
1
-P
ha
lacr
oco
rax
spp
.-
Dis
tan
ceto
the
ne
are
stn
est
ing
site
(km
),
44
to7
8to
12
13
to1
7.
17
-P
an
dio
nh
alia
etu
s-
Dis
tan
ceto
the
ne
are
stn
est
ing
site
(km
),
44
to7
8to
12
13
to1
7.
17
Be
twe
en
inve
rte
dco
mm
as:a
bb
revi
ate
dn
ame
of
the
fun
ctio
nal
com
par
tme
nt
inta
ble
s4
and
7.D
M:d
rym
ass,
incl
ud
ing
calc
ium
carb
on
ate
.H
OM
:in
dic
ato
rso
fh
igh
leve
lo
fo
rgan
icm
atte
r.LO
M:
ind
icat
ors
of
low
leve
lo
fo
rgan
icm
atte
r.M
PO
:M
ult
ice
llula
rP
ho
tosy
nth
eti
cO
rgan
ism
s.P
OM
:P
arti
cula
teO
rgan
icM
atte
r.W
M:
we
tm
ass.
Stat
us:
4(v
ery
go
od
)th
rou
gh
0(v
ery
low
).d
oi:1
0.1
37
1/j
ou
rnal
.po
ne
.00
98
99
4.t
00
1
Ecosystem-Based Approach of Posidonia oceanica Meadow Status
PLOS ONE | www.plosone.org 4 June 2014 | Volume 9 | Issue 6 | e98994

the fact that the rhizome continues to grow slowly during the
following two years (Gerard Pergent, unpublished data).
Posidonia leaves. (box 2, Fig. 1). A shoot is a rhizome tip
with a bundle of living leaves. Shoot density is correlated with
annual leaf primary production at local scale (patch) [64,65].
Primary production is a basic parameter for the functioning of the
P. oceanica ecosystem. It was estimated by the number of shoots per
square meter, measured within a small square frame (0.16 m2
[66,67]) with at least 20 random replicates [5]. At a less local scale,
the cover rate of the meadow is rarely 100%: it is broken by more
or less extensive patches of either sand or dead matte, which
reduce the overall cover. Cover rate was estimated by visual
observation via a see-through plastic slide [68,69] or via vertical
photographs [67,70]. Thirty random measures are recommended.
Low cover rate is believed to characterize a poor condition of the
meadow [5]. Some types of P. oceanica meadow, e.g. the hill
meadow and the striped meadow, exhibit a low cover rate while in
pristine state; these types of meadows do not, however, occur in
the study area [27]. The final P. oceanica leaf index, for a given site,
was the arithmetical mean between the density index, and the
cover index.
MPOs, filter- and suspension-feeder leaf
epibiota. (boxes 3 and 4, Fig. 1). P. oceanica leaf epibiota, both
primary producers (MPOs and diatoms) and animals, share the
same habitat (the leaf surface) and are usually co-consumed by the
same species. In addition, some consumers eat simultaneously
epibiota and the supporting leaf [68,71]. For these reasons,
epibiota will be considered here as a single compartment. The
colonisation of leaves by epibiota is a function of leaf age, the
youngest leaves, in the center of the shoot, being less colonized,
while the oldest, external leaves are the most colonized; in
addition, leaf tips are more colonized than the lower parts of the
leaves [72]. Leaf epibiota cover is believed to provide information
on water quality, especially nutrient concentration in seawater
[5,73,74]; however, it also reflects the herbivore pressure, epibiota
biomass decreasing when macrograzer abundance increases [26].
By convention, the epibiota biomass was estimated on the two
oldest (external) leaves, in July, on 30 randomly localized shoots
(Table 1).
Filter- and suspension-feeder epibiota on P. oceanica
rhizomes. (boxes 5 and 6, Fig. 1). A number of benthic filter-
and suspension-feeders dwell on P. oceanica rhizomes, sometimes
within the matte. They belong to bryozoans, hydroids, sponges,
annelids (e.g. Sabella spallanzani), ascidians (e.g. Halocynthia papillosa,
Phallusia mammillata, P. fumigata), gastropods and bivalves (such as
the fan mussel Pinna nobilis) [75–79]. Pinna nobilis (box 5) density
was estimated along 20 transects 10-m long and 1-m wide. Filter-
and suspension-feeders other than P. nobilis (box 6) are indicators
either of: (i) high level of organic matter in the water (hereafter
HOM; e.g. Sabella spallanzani, Phallusia mammillata, P. fumigata,
Didemnidae [80]); or (ii) low level of organic matter (hereafter
LOM; e.g. bryozoans, sponges, Halocynthia papillosa, Antedon
mediterranea [80]). HOM and LOM indicators are assessed within
the same quadrats as the sea urchin P. lividus (see below, box 9).
For colonial species, the number of colonies was taken into
account, as suggested by [81]. For non-colonial species, the
number of individuals was counted. Only individuals and colonies
over 5 cm in diameter and/or height were considered. The final
filter- and suspension-feeder epibiota (other than P. nobilis; box 6)
on rhizomes index, for a given site, was estimated as the
arithmetical mean between HOM and LOM indices.
Litter detritus. (box 7, Fig. 1). The litter detritus mass
corresponds essentially to shed dead P. oceanica leaf blades and the
epibiota they harbour, and some broken rhizomes. It therefore
represents a kind of necromass [82]. Drift MPOs, exported from
sublittoral reef habitats, can also occur within the litter. The litter
detritus mass was estimated in July, within 5 randomly localized
0.1 m2 quadrats; the litter was sucked up by an underwater
vacuum cleaner. Litter detritus were dried at 50uC in an oven to
constant weight.
Detritus-feeders 2 and 3. (box 8, Fig. 1). Detritus-feeders
constitute a complex set of compartments. Here, the macro-
detritus feeders Holothuria spp. were used as a proxy of detritus-
feeders 2 and 3, as they are easy to count. Several species can be
present, e.g. H. polii and H. tubulosa [83]. The abundance of
Holothuria spp. was measured within the same quadrats as the sea
urchin P. lividus (see below, box 9).
Herbivores 1. (box 9, Fig. 1). Macro-herbivores considered
in this compartment were the sea urchin Paracentrotus lividus and the
teleost Sarpa salpa, at 5 meters depth or, if the meadow is not
present at this depth, at the upper limit of the meadow. They
consume P. oceanica leaves, together with their epibiota, if present
[68,71,84]. Other herbivores graze P. oceanica leaves, such as the
spider crabs Pisa spp. and the isopod Idotea hectica [27,84], but their
reduced size and habit make them more difficult to quantify and
they were not considered. The abundance of P. lividus was assessed
within 1-m2 quadrats, with 30 replicates randomly localized. The
census only considered individuals .3 cm (test diameter without
spines), because small individuals can be hidden within the matte,
generating bias in the census. A second proxy of the macro-
herbivore pressure was the grazing index, i.e. the percentage of
intermediate and adult leaves (sensu [85,86]) exhibiting bite scars
due to S. salpa (all the intermediate and adult leaves of 30 shoots
randomly localized). Bite scars were carefully distinguished from
broken leaves, the latter being related to hydrodynamism. Most
bite scars are due to the S. salpa browsing, and they are easy to
distinguish from those due to other macro-herbivores [26,49]. The
final macro-herbivore index was, for a given site, the arithmetical
mean between the Paracentrotus index and the grazing index.
Predatory teleosts and cephalopods, piscivorous teleosts,
planktivorous teleosts. (boxes 9 in part, 10, 11 and 12, Fig. 1).
Teleost fishes associated with seagrass beds occupy different
positions in and above the canopy during the day and at night,
spend more or less time in this habitat depending on their life
cycle, and naturally fluctuate in abundance and biomass with
depth, season and years [87–90]. They participate actively in the
functioning of the P. oceanica ecosystem (Fig. 1), but the perception
of the composition and trophic structure of their assemblages
largely depends on the methodology used [91]. Moreover, species
richness, abundance and biomass of teleosts are favoured by the
ecotones induced by the presence of rocky or sandy substrates in
the middle of Posidonia beds. So these variations and methodolog-
ical biases have to be taken into account to when measuring these
compartments in order to assess the ‘environmental status’ of a
site. These compartments were estimated via visual censuses at a
standardized day time (10:00 to 16:00 UT) during the warm
season (summer-autumn), preferentially in uniform beds (at least a
long way from rocky substrates). All teleosts were counted within
ten linear and 5-m wide transects, each census lasting 5 minutes.
Around 50 m were covered so that each transect represents a
surface area of nearly 250 m2. Total length (at the nearest 2 cm) of
individuals and the number of individual per species were noted.
The Specific Relative Diversity Index (SRDI) is the mean number
of species met with per transect. These data enable calculation of
(i) predator biomass (predatory teleosts other than piscivorous and
planktivorous; box 10), (ii) top predator biomass (piscivorous
teleosts; box 11), (iii) planktivorous teleost biomass (box 12)
and (iv) the Specific Relative Diversity Index (SRDI). The
Ecosystem-Based Approach of Posidonia oceanica Meadow Status
PLOS ONE | www.plosone.org 5 June 2014 | Volume 9 | Issue 6 | e98994

planktivorous teleost biomass is divided into 2 categories: the
exclusive zooplankton feeders (Chromis chromis, Spicara smaris, S.
maena, Atherina spp.) and the omnivorous feeders, which consume
both zooplankton and POM (Boops boops, Oblada melanura). Some
top predators (e.g. Conger conger, Scorpaena spp.) are active only
during night time while Serranus spp. are active by day and thus
more present in our visual counts. Some predators (e.g. Symphodus
rostratus), though diurnal, are often hidden within the P. oceanica leaf
canopy. As a result, their counts were underestimated to a greater
or lesser extent. The parameter ranges within the status scale
(Table 1) took into account these biases.
Sea birds. (box 13, Fig. 1). Most sea birds do not directly
interact with the P. oceanica ecosystem, as they feed on offshore
pelagic species, such as Larus spp. and Puffinus spp. The only
exceptions are shags Phalacrocorax spp. and the osprey Pandion
haliaetus. Shags can dive down to the benthic seagrass meadow;
they mainly feed on pelagic planktivorous teleosts (e.g. Spicara
smaris, Chromis chromis), but benthic teleosts (e.g. Diplodus spp.,
Lithognathus mormyrus, Scorpaena notata, Serranus scriba and Symphodus
mediterraneus) account for 35% of the diet [92–94]. Osprey is an
opportunistic fish-eating bird of prey. In Corsica, which harbours
the only population within the study area, it mainly consumes
mugilids (73% of the captures), together with Diplodus spp. (13%)
and Sarpa salpa (11%) [95–97]. The sea bird compartment was
estimated via the distance of the nearest Phalacrocorax spp. and
Pandion haliaetus, respectively, nesting sites from the study site. As
far as shags are concerned, the mean maximum foraging range is
16 km [95–97] (Table 1).
Some of the above-mentioned compartments correspond to
inputs into the P. oceanica ecosystem from the pelagic habitat:
plankton, POM and planktivorous teleosts. Outputs are also to be
considered: (i) ca. 15–30% of the net primary production (NPP)
corresponds to roots, rhizomes and dead sheaths buried and
sequestrated within the matte [24,28,98,99]; (ii) ca. 6 to 50% of
the NPP represents dead leaves that are exported as detritus
towards beaches and adjacent habitats [28,31,98,100,101]; and
(iii) a number of organisms (e.g. teleosts, crustaceans) leave the
meadow, either temporarily, to feed in adjacent habitats, or
permanently, to reach their adult quarters [87,102–104].
The Ecosystem-Based Quality Index (EBQI)The rationale governing our ecosystem-based approach is trying
to quantify and assess each compartment (box) of the conceptual
model by means of a set of parameters, to balance their relative
weighting and by using a simple algorithm to calculate a rank for
the ecosystem status within a given area, matching the five
Ecological Statuses of the Water Framework Directive (WFD),
from bad to high. A great variety of parameters are available for
the assessment of each compartment (box). Many of them are
redundant. Others have been poorly used so that data are not
available for most areas. For this reason a limited set of relevant
parameters was selected for a restricted set of compartments.
Each parameter was assessed by means of a semi-quantitative
scale (4 through 0), from very good (4) to very low (0). Calibration
of the scale was based upon the available literature (e.g. [105]),
including grey literature and expert judgment (the personal
knowledge of the authors) based upon a Delphi process [106].
The highest grade (4) corresponds to the ecosystem status in the
best-protected areas of well implemented MPAs, e.g. the Medes
Islands reserve (Catalonia, Spain), the Port-Cros National Park
(continental France), the Scandola reserve and the Bouches de
Bonifacio reserve (Corsica, France).
Boxes were balanced, according to their relative weighting (W)
in the ecosystem functioning, from 5 (highest weighting) to 1
(lowest weighting). The general principle in the ranking of the
weighting of a box was that the boxes localized at the very base
(bottom up control by primary producers), the herbivores (box 9)
and the boxes localized at the very top (top down control via
cascade effect) of the model were regarded as of major importance
(with the exception of box 13), while intermediate ones were less
weighted. Wasp-waist control has not been evidenced in that
ecosystem [11,107]. The grade of each considered box was given
by multiplying its status S (0 through 4) and weighting W
(1 through 5), and therefore they are graded from 0 through 20.
The grades of all considered boxes were added up, which gave the
final grade of the ecosystem status (Ecosystem Based Quality
Index, hereafter EBQI) at a given site. For practical purposes, the
EBQI was converted to a scale from 0 to 10:
EBQI~X13
i~1
(Wi|Si)=X13
i~1
(Wi|Smax)
" #|10
Where: Wi is the weighting of the box i, Si the status of the box i,
Smax the highest possible grade ( = 4) for a box and i is the number
of the box (1 through 13).
Five ecological status classes, from high to bad, according to
the practice of the WFD, were delineated: bad (EBQI,3.5),
poor (3.5$EBQI,4.5), moderate (4.5$EBQI,6), good
(6.0$EBQI,7.5) and high (EBQI$7.5).
Since the box weightings were supported by partly subjective
arguments (see above), we aimed to analyse the effect of the
weighting choice on the EBQI and the ranking of the sites. In
order to achieve our aim, we perturbed each weighting value and
determined the new ranking obtained with the perturbed
weightings. The perturbation on each weighting was obtained as
follows. We first defined the maximum amplitude of the
perturbation for all weightings and we then defined, for each
weighting, a random perturbation, according to a uniform law
between 0 and the maximum amplitude of perturbations. We then
added or subtracted this perturbation term to or from the
corresponding weighting. If the new weighting was less than 1, it
was then set as equal to 1. If the new weighting was greater than 5,
it was then set as equal to 5. We ended up with weightings between
1 and 5, close to the original ones if the maximum perturbation
amplitude was low, and randomly selected otherwise. This has
been calculated as follows: the perturbation method described
previously was repeated 1,000 times and, for each site, we
determined whether the rank of the site was the same as the initial
one or if it had changed. An index of similarity was produced for
each site, which was equal to 100% when the rank of the site was
always unchanged after perturbation and 0% if it always changed.
For each compartment (box) status at each site, a Confidence
Index (CI) was proposed (Table 2). The reason for the CI is (i) that
data for one or several compartments may be missing or of poor
quality in some sites, (ii) the reliability of available data may be
different between compartments and sites, and (iii) it is worth
drawing the attention of managers and scientists to those
compartments that are poorly known and which merit further
field studies. The grade of each considered compartment was
given by its CI (0 through 4) and by its weighting (1 through 5),
and therefore they are graded from 0 through 20. The grades of all
considered compartments were added up, which gave the final
mark of the CI at a given site. For practical purposes, the CI was
converted to a scale from 0 to 4:
Ecosystem-Based Approach of Posidonia oceanica Meadow Status
PLOS ONE | www.plosone.org 6 June 2014 | Volume 9 | Issue 6 | e98994

CIEBQI~X13
i~1
(Wi|CIi)=X13
i~1
(Wi|CImax)
" #|4
Where Wi is the weighting of the box i, CIi the Confidence Index
of the box i, CImax the highest possible Confidence Index ( = 4) for
a compartment (box) and i is the number of the box (1 through
13).
In order to test the efficiency of the proposed method, it was
applied to seventeen sites (Table 3) with a variety of available data
(published, unpublished, expert judgment). A site is defined as a P.
oceanica meadow, from its upper limit down to the lower limit,
covering in the order of a dozen to several hundred hectares. The
sites are localized in the north-western Mediterranean Sea,
including continental France (French Riviera, Provence, French
Catalonia), Corsica, Balearic Islands and Spanish Catalonia. This
area is considered as homogenous and is consistent with the
marine subregions, as defined in the MSFD. These sites also cover
of a wide range of human pressures, from lesser impact, within
well implemented Marine Protected Areas (MPAs), such as the
Port-Cros National Park, to highly impacted areas due to different
disturbance and/or stress sources (pollution, overfishing, fish
farms, port facilities, anchoring and mooring; see table 3).
Results
EBQI assessmentThe results of the EBQI application for assessing the status of
the P. oceanica ecosystem functioning in the sites across the NW
Mediterranean area (Table 3) are presented in Table 4. An
example of calculation of the EBQI is given (Table 5). The content
of Table 4 is based upon unpublished observations from the
authors of the present article, together with some published data
[108–111] and whenever necessary (CI,4) on expert judgment;
when several co-authors of the present work were involved in the
assessment of a site, the Delphi method [106] was used for
assessing the status of each compartment (box). According to the
EBQI, the 17 study sites were placed within five Ecological Status
classes, from Bad to High:
– Bad (EBQI,3.5): Sitges.
– Poor (3.5$EBQI,4.5): Niolon, Gulf of Giens and Porquerolles
Island northern coast.
– Moderate (4.5$EBQI,6): Villefranche Bay, Saint-Cyr Bay,
Plateau des Chevres (Marseilles), Prado Bay (Marseilles),
Valincu Gulf, Tossa de Mar, Scandola (Elbu Bay) and Peyrefite
Bay.
Table 2. Criteria to assess the Confidence Index (CI) of thestatus of a compartment (box).
CI Criteria
4 Field data available, recent and suitable with the recommended methods
3 Field data recent, partially completed with expert judgment
2 No quantitative field data but recent expert judgment
1 No quantitative field data, but ancient expert judgment
0 No quantitative field data and no suitable expert judgment
doi:10.1371/journal.pone.0098994.t002
Table 3. Sites used to test the proposed ecosystem-based approach to assess the status of the P. oceanica ecosystem. MPA:Marine Protected Area. NTZ: No Take Zone.
Site Region Protection status Pressure
Espardell Balearic Islands (Spain) MPA, Natura 2000 Artisanal fishery
Sitges Spanish Catalonia Natura 2000 Pollution, artisanal and recreational fishery, sedimentation
Tossa de Mar Spanish Catalonia Natura 2000 Artisanal and recreational fishery
Medes Islands Spanish Catalonia MPA, NTZ, Natura 2000 River mouth
Peyrefite Bay French Catalonia MPAa Artisanal fishery, anchoringb
Niolon (Cote Bleue) Provence (France) MPA, Natura 2000 River mouth, artisanal fishery, trawling
Prado Bay, Marseilles Provence (France) Coastal development, artisanal fishery, nutrients
Plateau des chevres, Marseilles Provence (France) MPAc, Natura 2000 Artisanal fishery, sewage outfall,
Saint Cyr Bay Provence (France) Coastal development, artisanal fishery, sewage outfall
Gulf of Giens Provence (France) Sewage outfall, artisanal fishery, trawling
Porquerolles Island, northern coast Provence (France) MPA, Natura 2000 Trawling, artisanal fishery, anchoring
Porquerolles Island, southern coast Provence (France) MPA, Natura 2000 Trawling, artisanal fishery
Bagaud Pass, Port-Cros Island Provence (France) National Park, MPA, Natura 2000 Artisanal fishery, anchoring
Port-Cros Island, southern coast Provence (France) National Park, MPA, Natura 2000 Artisanal fishery
Villefranche-sur-Mer Bay French Riviera Coastal development, sewage outfall artisanal fishery,anchoring
Scandola, Elbu Bay West Corsica (France) MPA, Natura 2000 Artisanal fishery
Valincu Gulf West Corsica (France) Artisanal fishery
aThis area is close to the Natural Marine Reserve of Cerbere-Banyuls. Since October 2011, this area has been included within a natural marine park (‘Parc naturel marin dugolfe du Lion’).bSince 2010, anchoring is banned.cSince May, 2012, this area has been included within a National Park (‘Parc national des Calanques’). However, it is unlikely that this new status would have alreadyresulted in a perceptible effect.doi:10.1371/journal.pone.0098994.t003
Ecosystem-Based Approach of Posidonia oceanica Meadow Status
PLOS ONE | www.plosone.org 7 June 2014 | Volume 9 | Issue 6 | e98994

Ta
ble
4.
Eco
syst
em
stat
us
(EB
QI)
and
Co
nfi
de
nce
Ind
ex
(CI)
for
eac
hsa
mp
ling
site
,an
dsc
ale
valu
ean
dC
Io
fe
ach
par
ame
ter
use
dto
ob
tain
the
m.
Bo
x1
Rh
izo
me
s2
Le
av
es
3–
4L
ea
fe
pib
iota
5P
inn
a6
HO
ML
OM
7L
itte
r8
Ho
loth
uri
a9
He
rbiv
ore
s1
0P
red
ato
rs1
1P
isci
vo
res
12
Pla
nk
tiv
ore
s9
–1
2(S
RD
I)1
3S
ea
bir
ds
EB
QI
an
d(C
I)
Esp
ard
ell
4(0
)4
(4)
3(3
)3
(4)
3(0
)3
(0)
3(0
)3
(3)
1(4
)1
(4)
1(4
)3
(4)
2(3
)6
.4(2
.9)
Sitg
es
2(0
)0
(4)
0(3
)0
(3)
2(0
)2
(0)
2(3
)3
.5(3
.5)
0(3
)0
(3)
1(3
)0
(3)
0(3
)2
.3(2
.7)
To
ssa
de
Mar
2(3
)3
(4)
4(4
)0
(3)
2(0
)2
(0)
4(2
)3
(2.5
)2
(4)
0(4
)2
(4)
3(4
)1
(2)
5.6
(3.2
)
Me
de
sIs
lan
ds
2(3
)3
.5(4
)4
(4)
3(3
)2
(0)
2(0
)2
(0)
2.5
(3)
4(2
)4
(2)
3(2
)4
(2)
2(2
)7
.9(2
.4)
Pe
yre
fite
Bay
2(0
)3
.5(4
)2
(0)
4(4
)2
(0)
2(0
)2
(0)
2(4
)3
(3)
1(3
)1
.5(3
)4
(3)
0(2
)5
.8(2
.3)
Nio
lon
2(2
)2
.5(4
)2
(2)
0(2
)1
.5(2
)1
(0)
3(0
)2
(1.5
)1
(2)
0(0
)2
(0)
2(2
)1
(4)
3.9
(1.7
)
Pra
do
Bay
2(4
)2
.5(3
)2
(2)
0(2
)2
.5(2
)2
(2)
3(2
)2
.5(1
.5)
3(2
)1
(2)
1.5
(2)
3(2
)2
(4)
5.3
(2.3
)
Pla
teau
de
sC
he
vre
s2
(4)
2.5
(4)
4(3
)0
(2)
1.5
(2)
2(2
)3
(2)
2.5
(1.5
)2
(4)
1(4
)0
.5(2
)2
(4)
2(2
)5
.0(3
.1)
Sain
t-C
yrB
ay1
(2)
3(3
)2
(0)
1(0
)2
(0)
2(2
)2
(0)
2(0
)2
(0)
2(0
)2
(0)
2(0
)0
.5(4
)4
.9(0
.7)
Gu
lfo
fG
ien
s3
(4)
4(4
)2
(1)
2(0
)2
(0)
1(0
)3
(2)
1.5
(2)
1(4
)0
(2)
1(2
)1
(3)
0.5
(4)
4.3
(2.4
)
Po
rqu
ero
lles
Isla
nd
no
rth
ern
coas
t3
(3)
2(4
)3
(3)
2(3
)2
(3)
0(2
)1
(2)
1.5
(1)
1(2
)1
(2)
2(2
)2
(2)
1(4
)4
.3(2
.4)
Po
rqu
ero
lles
Isla
nd
sou
the
rnco
ast
3(3
)4
(5)
4(3
)3
(3)
3(3
)3
(2)
2(2
)2
(1)
2(2
)2
(2)
3(2
)3
(2)
1(4
)6
.9(2
.6)
Bag
aud
Pas
s,P
ort
-Cro
sIs
lan
d4
(2)
3(4
)2
(4)
4(4
)3
(2)
4(2
)4
(2)
3(2
.5)
3(2
)2
(2)
3(2
)4
(2)
1(4
)7
.6(2
.6)
Po
rt-C
ros
Isla
nd
sou
the
rnco
ast
4(0
)4
(4)
4(3
)4
(2)
3(2
)4
(0)
3(0
)3
.5(0
)4
(2)
4(0
)3
(2)
4(2
)1
.5(4
)9
.3(1
.6)
Vill
efr
anch
e-s
ur-
Me
rB
ay2
(1)
1.5
(4)
2(1
)1
(2)
3(2
)0
(0)
0(2
)2
(1)
3(0
)2
(1)
1.5
(1)
4(0
)0
(4)
4.8
(1.3
)
Scan
do
la,
Elb
uB
ay4
(4)
3(4
)1
(3)
4(4
)3
(2)
2(2
)2
(2)
2(1
.5)
2(2
)1
(2)
1.5
(2)
3(3
)4
(4)
5.7
(2.6
)
Val
incu
Gu
lf(4
.4)
3(4
)2
(3)
2(2
)2
(0)
2(2
)3
(2)
2(0
)2
(0)
2(0
)2
(0)
2(0
)1
(0)
5.4
(1.4
)
Bo
xes
1th
rou
gh
13
and
SRD
I.T
he
stat
us
and
the
Co
nfi
de
nce
Ind
ex
(in
bra
cke
ts;
CI)
isin
dic
ate
dfo
re
ach
bo
x.EB
QI
ran
ge
sfr
om
0to
10
,w
hile
the
CI
isg
rad
ed
fro
m0
to4
).d
oi:1
0.1
37
1/j
ou
rnal
.po
ne
.00
98
99
4.t
00
4
Ecosystem-Based Approach of Posidonia oceanica Meadow Status
PLOS ONE | www.plosone.org 8 June 2014 | Volume 9 | Issue 6 | e98994

– Good (6.0$EBQI,7.5): Espardell and Porquerolles Island
southern coast.
– High (EBQI$7.5): Bagaud Pass (Port-Cros Island), Medes
Islands and Port-Cros Island (southern coast).
Redundancy of EBQI with already existing indicesIs the EBQI superfluous, i.e. redundant with already existing
indices? A number of indices (EQR, Ecological Quality Ratio)
based upon P. oceanica (the species itself, sometimes leaf epibiota,
Table 5. Example of calculation of the EBQI at the site Espardell (Balearic Islands).
Boxnumber Functional compartment
Weighting(W) Parameter
Status and meanstatus when 2parameters (S) CI
Statusgrade:W6S
CI grade:W6CI
1 Roots and rhizomes (‘rhizomes’) 3 Growth of orthotropicrhizomes (mm a21)
4 0 12 0
2 Posidonia oceanica leaves (‘leaves’) 5 - Density (shoots m22) (4) (4) (20) (20)
- Cover (%) (4) (4) (20) (20)
4 4 20 20
3–4 MPOs, filter- and suspension-feedersleaf epibiota (‘leaf epibiota’)
4 Biomass (g DM shoot21) 3 3 12 12
5 Benthic filter-feeder: Pinna nobilis(bivalve) (‘Pinna’)
2 Density(individuals 100 m22)
3 4 6 8
6 Other benthic filter- andsuspension-feeders (‘HOM LOM’)
2
- HOM - Density (m22) (3) (0) (6) (0)
- LOM - Density (m22) (3) (0) (6) (0)
3 0 6 0
7 Litter detritus: dead leaves andbroken rhizomes (‘litter’)
2 g DM m22 3 0 6 0
8 Detritus-feeders 2 and 3(Holothuria spp.) (‘Holothuria’)
2 Individuals 10 m22 3 0 6 0
9 Herbivores 1 (‘herbivores’) 5 - Density of Paracentrotuslividus (individuals m22)
(3) (3) (15) (15)
- Grazing index (% leaves) (3) (3) (15) (15)
3 3 15 15
10 Predatory teleosts, cephalopodsand seastars (‘predators’)
5 kg teleosts WM 100 m22 1 4 5 20
11 Piscivorous teleosts (‘piscivores’) 5 kg teleosts WM 100 m22 1 4 5 20
12 Planktivorous teleosts(‘planktivores’)
3
- Zooplankton feeders - kg teleosts WM 100 m22 (1) (4) (3) (12)
- Omnivores - kg teleosts WM 100 m22 (1) (4) (3) (12)
1 4 3 12
9–12 All teleosts (‘SRDI’) 3 Specific Relative DiversityIndex (SRDI)
3 4 9 12
13 Sea birds 1
- Phalacrocorax spp. - Distance to the nearestnesting site (km)
(4) (3) (4) (3)
- Pandion haliaetus - Distance to the nearestnesting site (km)
0 (3) 0 (3)
2 3 2 3
Sum of the weightedstatus grades (left) andof the weighted CI grades(right) of the 13 boxesa
107 122
EBQIb (left) and CIc
(right) of the site6.4 2.9
aThe maximum value of the sum is 168 (see text).bMaximum value: 10 (see text).cMaximum value: 4 (see text).CI: Confidence Index. DM: dry mass, including calcium carbonate. HOM: indicators of high level of organic matter. LOM: indicators of low level of organic matter. MPO:Multicellular Photosynthetic Organisms. POM: Particulate Organic Matter. WM: wet mass.doi:10.1371/journal.pone.0098994.t005
Ecosystem-Based Approach of Posidonia oceanica Meadow Status
PLOS ONE | www.plosone.org 9 June 2014 | Volume 9 | Issue 6 | e98994
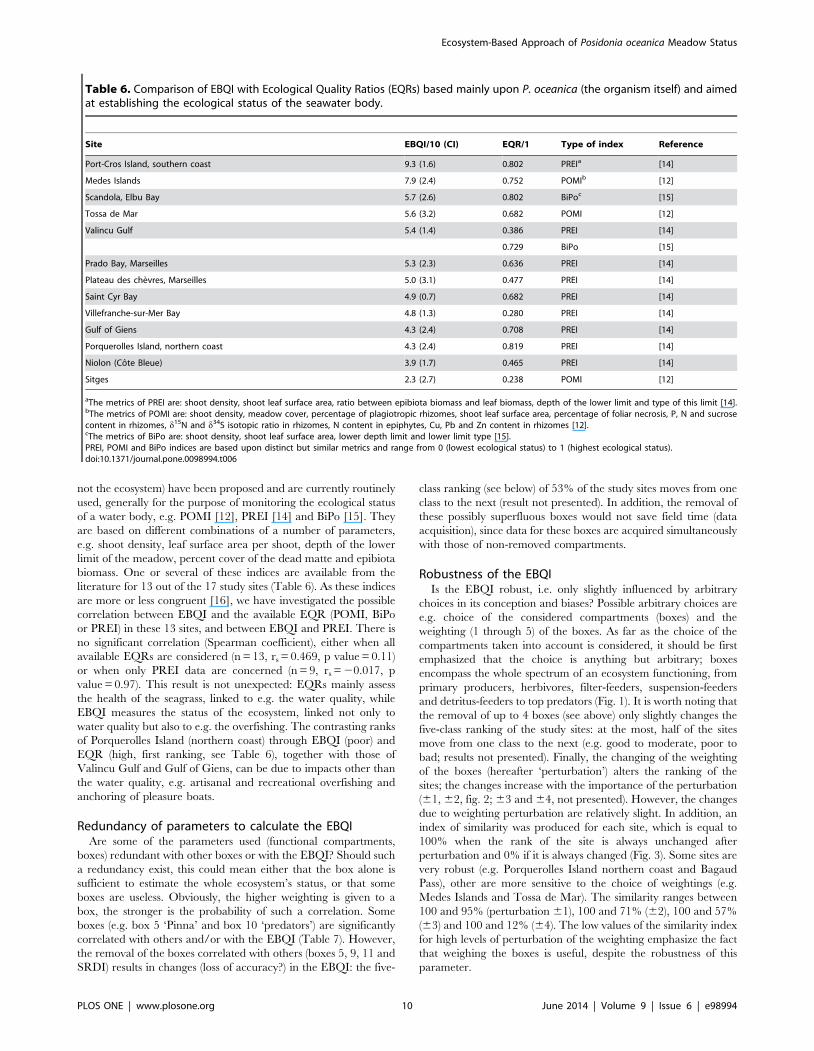
not the ecosystem) have been proposed and are currently routinely
used, generally for the purpose of monitoring the ecological status
of a water body, e.g. POMI [12], PREI [14] and BiPo [15]. They
are based on different combinations of a number of parameters,
e.g. shoot density, leaf surface area per shoot, depth of the lower
limit of the meadow, percent cover of the dead matte and epibiota
biomass. One or several of these indices are available from the
literature for 13 out of the 17 study sites (Table 6). As these indices
are more or less congruent [16], we have investigated the possible
correlation between EBQI and the available EQR (POMI, BiPo
or PREI) in these 13 sites, and between EBQI and PREI. There is
no significant correlation (Spearman coefficient), either when all
available EQRs are considered (n = 13, rs = 0.469, p value = 0.11)
or when only PREI data are concerned (n = 9, rs = 20.017, p
value = 0.97). This result is not unexpected: EQRs mainly assess
the health of the seagrass, linked to e.g. the water quality, while
EBQI measures the status of the ecosystem, linked not only to
water quality but also to e.g. the overfishing. The contrasting ranks
of Porquerolles Island (northern coast) through EBQI (poor) and
EQR (high, first ranking, see Table 6), together with those of
Valincu Gulf and Gulf of Giens, can be due to impacts other than
the water quality, e.g. artisanal and recreational overfishing and
anchoring of pleasure boats.
Redundancy of parameters to calculate the EBQIAre some of the parameters used (functional compartments,
boxes) redundant with other boxes or with the EBQI? Should such
a redundancy exist, this could mean either that the box alone is
sufficient to estimate the whole ecosystem’s status, or that some
boxes are useless. Obviously, the higher weighting is given to a
box, the stronger is the probability of such a correlation. Some
boxes (e.g. box 5 ‘Pinna’ and box 10 ‘predators’) are significantly
correlated with others and/or with the EBQI (Table 7). However,
the removal of the boxes correlated with others (boxes 5, 9, 11 and
SRDI) results in changes (loss of accuracy?) in the EBQI: the five-
class ranking (see below) of 53% of the study sites moves from one
class to the next (result not presented). In addition, the removal of
these possibly superfluous boxes would not save field time (data
acquisition), since data for these boxes are acquired simultaneously
with those of non-removed compartments.
Robustness of the EBQIIs the EBQI robust, i.e. only slightly influenced by arbitrary
choices in its conception and biases? Possible arbitrary choices are
e.g. choice of the considered compartments (boxes) and the
weighting (1 through 5) of the boxes. As far as the choice of the
compartments taken into account is considered, it should be first
emphasized that the choice is anything but arbitrary; boxes
encompass the whole spectrum of an ecosystem functioning, from
primary producers, herbivores, filter-feeders, suspension-feeders
and detritus-feeders to top predators (Fig. 1). It is worth noting that
the removal of up to 4 boxes (see above) only slightly changes the
five-class ranking of the study sites: at the most, half of the sites
move from one class to the next (e.g. good to moderate, poor to
bad; results not presented). Finally, the changing of the weighting
of the boxes (hereafter ‘perturbation’) alters the ranking of the
sites; the changes increase with the importance of the perturbation
(61, 62, fig. 2; 63 and 64, not presented). However, the changes
due to weighting perturbation are relatively slight. In addition, an
index of similarity was produced for each site, which is equal to
100% when the rank of the site is always unchanged after
perturbation and 0% if it is always changed (Fig. 3). Some sites are
very robust (e.g. Porquerolles Island northern coast and Bagaud
Pass), other are more sensitive to the choice of weightings (e.g.
Medes Islands and Tossa de Mar). The similarity ranges between
100 and 95% (perturbation 61), 100 and 71% (62), 100 and 57%
(63) and 100 and 12% (64). The low values of the similarity index
for high levels of perturbation of the weighting emphasize the fact
that weighing the boxes is useful, despite the robustness of this
parameter.
Table 6. Comparison of EBQI with Ecological Quality Ratios (EQRs) based mainly upon P. oceanica (the organism itself) and aimedat establishing the ecological status of the seawater body.
Site EBQI/10 (CI) EQR/1 Type of index Reference
Port-Cros Island, southern coast 9.3 (1.6) 0.802 PREIa [14]
Medes Islands 7.9 (2.4) 0.752 POMIb [12]
Scandola, Elbu Bay 5.7 (2.6) 0.802 BiPoc [15]
Tossa de Mar 5.6 (3.2) 0.682 POMI [12]
Valincu Gulf 5.4 (1.4) 0.386 PREI [14]
0.729 BiPo [15]
Prado Bay, Marseilles 5.3 (2.3) 0.636 PREI [14]
Plateau des chevres, Marseilles 5.0 (3.1) 0.477 PREI [14]
Saint Cyr Bay 4.9 (0.7) 0.682 PREI [14]
Villefranche-sur-Mer Bay 4.8 (1.3) 0.280 PREI [14]
Gulf of Giens 4.3 (2.4) 0.708 PREI [14]
Porquerolles Island, northern coast 4.3 (2.4) 0.819 PREI [14]
Niolon (Cote Bleue) 3.9 (1.7) 0.465 PREI [14]
Sitges 2.3 (2.7) 0.238 POMI [12]
aThe metrics of PREI are: shoot density, shoot leaf surface area, ratio between epibiota biomass and leaf biomass, depth of the lower limit and type of this limit [14].bThe metrics of POMI are: shoot density, meadow cover, percentage of plagiotropic rhizomes, shoot leaf surface area, percentage of foliar necrosis, P, N and sucrosecontent in rhizomes, d15N and d34S isotopic ratio in rhizomes, N content in epiphytes, Cu, Pb and Zn content in rhizomes [12].cThe metrics of BiPo are: shoot density, shoot leaf surface area, lower depth limit and lower limit type [15].PREI, POMI and BiPo indices are based upon distinct but similar metrics and range from 0 (lowest ecological status) to 1 (highest ecological status).doi:10.1371/journal.pone.0098994.t006
Ecosystem-Based Approach of Posidonia oceanica Meadow Status
PLOS ONE | www.plosone.org 10 June 2014 | Volume 9 | Issue 6 | e98994

Ta
ble
7.
Spe
arm
an’s
ran
kco
rre
lati
on
sb
etw
ee
nth
est
atu
so
fe
ach
com
par
tme
nt
(bo
xes
1th
rou
gh
13
and
SRD
I),
the
oth
er
com
par
tme
nts
(bo
xes)
and
the
EBQ
I(s
ee
Tab
le5
).
1.R
hiz
om
es
2.
Le
av
es
3–
4.
Le
af
ep
ibio
ta5
.P
inn
a6
.H
OM
LO
M7
.L
itte
r8
.H
olo
thu
ria
9.
He
rbiv
ore
s1
0.
Pre
da
tors
11
.P
isci
vo
res
9–
12
(SR
DI)
12
.P
lan
kti
vo
res
13
.S
ea
bir
ds
1.
Rh
izo
me
s-
2.
Leav
es
0.4
4-
3–
4.
Leaf
ep
ibio
ta0
.03
0.4
1-
5.
Pin
na
0.7
10
.64
0.0
2-
6.
HO
M-L
OM
0.5
70
.33
20
.02
0.6
3-
7.
Litt
er
0.4
40
.55
0.2
90
.48
0.5
1-
8.
Ho
loth
uri
a0
.27
0.2
70
.20
20
.09
20
.08
0.4
4-
9.
He
rbiv
ore
s0
.07
0.0
30
.20
20
.08
0.2
30
.67
0.4
6-
10
.P
red
ato
rs2
0.0
20
.23
0.2
90
.37
0.3
60
.34
0.0
20
.24
-
11
.P
isci
vore
s0
.22
0.3
00
.33
0.5
10
.46
0.4
22
0.2
20
.10
0.7
3-
12
.P
lan
ktiv
ore
s0
.18
0.2
80
.38
0.3
40
.24
0.3
40
.05
0.0
60
.48
0.6
2-
9–
12
(SR
DI)
0.1
60
.32
0.3
00
.56
0.5
90
.41
20
.02
0.2
90
.85
0.6
00
.46
-
13
.Se
ab
ird
s0
.37
0.2
20
.37
0.1
20
.19
0.3
60
.30
0.2
60
.20
0.1
80
.08
0.1
9-
EBQ
I0
.45
0.6
90
.50
0.7
20
.55
0.7
80
.24
0.4
00
.69
0.6
50
.54
0.7
70
.47
Bo
ldit
alic
char
acte
rs:
sig
nif
ican
t(p
,0
.01
).d
oi:1
0.1
37
1/j
ou
rnal
.po
ne
.00
98
99
4.t
00
7
Ecosystem-Based Approach of Posidonia oceanica Meadow Status
PLOS ONE | www.plosone.org 11 June 2014 | Volume 9 | Issue 6 | e98994

EBQI implementationIs the EBQI excessively time-consuming or easy and rapid to
implement? The acquisition of the parameters requires SCUBA
diving field work. Considering that it is possible to work for around
1 hour at 15 m depth, we estimate that 6 dives involving 2
scientific divers are necessary to acquire all of the data for the
assessment of one site (Table 8). For safety reasons, a diver can
perform a maximum of two dives per day, so this will require 3
days of field work for a two man diving team. This field work
requires expertise in seagrass and fish visual censuses. In addition,
for a rapid and provisional assessment of the EBQI, already
available data and expert judgment can be used (provided that the
CI is specified).
Within the northern Mediterranean, the study sites are spread
within three eco-regions, namely Corsica, Provence and French
Riviera and Languedoc-Catalonia. Is the EBQI biased by regional
environmental conditions, e.g. a higher mean temperature in
Corsica and more water turbidity in Languedoc-Catalonia? The
present study cannot answer this question as the sites were not
randomly selected but chosen according to data availability.
However, the EBQI range within each one of the three eco-
regions does not exhibit obvious differences (Table 4), as far as
the EBQI mean is concerned (,5.6 within each one of the three
eco-regions).
Discussion
In the context of European Directives (Habitats Directive and
WFD) and national regulations, a number of species and indices,
based upon one or several species, have been designated to assess
the quality of water bodies, the health status of emblematic
species and habitats and to establish Marine Protected Areas (e.g.
PMN [112], CI [113], EEI [2,3], SI [114], POMI [12], PREI
[14], BiPo [15], PoSte [15], ZoNI [22] for European seagrasses
Figure 2. Robustness of the quality index (EBQI) with regard to the weighting of compartments (boxes). The 17 sites are arranged fromleft to right according to their growing EBQI (see Table 4) and ecological status (bad through high). Deep red = bad, orange = poor, green = moderate,light blue = good, deep blue = high. In order to test the effect of the weighting of the compartments (boxes) on the EBQI (robustness), weightingvalues have been randomly perturbed (above, 61; below, 62). 1000 iterations were performed. The change of the ecological status (bad throughhigh) of a site, for a given iteration, is shown by the color of the new class within which it falls.doi:10.1371/journal.pone.0098994.g002
Ecosystem-Based Approach of Posidonia oceanica Meadow Status
PLOS ONE | www.plosone.org 12 June 2014 | Volume 9 | Issue 6 | e98994

([17,51,115,116] for comprehensive reviews). These indices
provide a valuable body of tools and information to coastal waters
managers and make it possible to assess the status of a water body.
However, the good quality of a water body and the apparent
health of a species, whether emblematic or not, such as the
seagrass P. oceanica, is not always indicative of the good structure
and functioning of the whole ecosystem, a network of compart-
ments, fluxes, functions, inputs and exportations. The most
original contribution of the new MSFD European Directive is to
provide an ecosystem-based approach to assess the ecological
Figure 3. Robustness (index of similarity) of the quality index (EBQI) to the weighting of compartments (boxes). Percentage of timesthe ecological status of each site was unaltered by random perturbation of the weighting of the boxes (1,000 iterations) by 61 through 64. Thesimilarity is equal to 100% when the class of the site is never changed after perturbation and 0% if it is always changed.doi:10.1371/journal.pone.0098994.g003
Table 8. Estimation of time and diving effort needed for data acquisition within each box used in the EBQI.
Box Proxy Time Dive organization
1 – P. oceanica roots and rhizomes 30 random in situ measures(growth of the rhizome corresponding to the last 8 leaf bases)
30 min 1 dive for 2 scientific divers
2 - P. oceanica leaves 20 random measures of shoot density in a square frame (0.16 m2) 60 min
30 random measures of cover 10 min
3 - MPO leaf epibiota Sampling of the two oldest external leaves on 30 shoot randomlylocalized to estimate the epibiota biomass
10 min
4 - Filter- and suspension-feederleaf epibiota
Sampling of the two oldest external leaves on 30 shoot randomlylocalized to estimate the epibiota biomass
Same as box 3
5 – Filter feeder benthic epibiota Density of Pinna nobilis along 20 transects 10-m long and 1-m wide 120 min 1 dive for 2 scientists divers
7 - Litter detritus Litter detritus mass collected in July, within 5 randomlylocalized 0.1-m2 quadrats
90 min 1 dive for 2 scientist divers
6 – Other filter- andsuspension-feeder benthic epibiota
Abundance of filter- and suspension-feeder benthic epibiota other thanPinna nobilis within 1-m2 quadrats, with 30 replicates randomly localized
120 min 1 dive for 2 scientist divers
8 - Detritus feeders Abundance of Holothuria spp. within 1-m2 quadrats, with 30replicates randomly localized
Same as box 6
9 - Herbivores 1 Abundance of Paracentrotus lividus within 1-m2 quadrats,with 30 replicates randomly localized at 5 m depth
60 min 1 dive for 2 scientist divers
Percentage of intermediate and adult leaves exhibiting bitescars due to S. salpa (all the intermediate and adult leavesof 30 shoots randomly localized) at 5 m depth
30 min
10 - Predatory teleosts All teleosts counted within ten linear 50-m longand 5-m wide transects, each census lasting 5 minutes.
60 min 1 dive for 2 scientist divers
11 - Piscivorous teleosts All teleosts counted within ten linear 50-m longand 5-m wide transects, each census lasting 5 minutes
Same asboxes 10 and 12
12 - Planktivorous teleostsof the water column
All teleosts counted within ten linear 50-m longand 5-m wide transects, each census lasting 5 minutes
Same asboxes 10 and 11
9–12 - SRDI All teleosts counted within ten linear 50-m longand 5-m wide transects, each census lasting 5 minutes
Same asboxes 10, 11 and 12
doi:10.1371/journal.pone.0098994.t008
Ecosystem-Based Approach of Posidonia oceanica Meadow Status
PLOS ONE | www.plosone.org 13 June 2014 | Volume 9 | Issue 6 | e98994

status of marine regions. The present approach constitutes a
contribution towards this goal, and focuses on the P. oceanica
seagrass meadow.
Here, we have developed, applied and tested an ecosystem-
based index of the structure and functioning of the most
emblematic and best-known Mediterranean coastal ecosystem,
the P. oceanica meadow. This index (EBQI) is based upon a set of
representative functional compartments, the weighting of these
compartments and the assessment of each compartment quality by
comparison of a supposed baseline based upon the available
literature. The strong points of the EBQI are: (i) It is easy to
implement, not too time-consuming and therefore relatively
cheap; (ii) It is non-destructive, which is particularly important,
dealing with protected species (e.g. P. oceanica and Pinna nobilis);
sampling only concerns old leaves (not the shoot) and the litter, i.e.
shed dead leaves; (iii) It is relatively robust, according to the
selection of the compartments and to their weighting; (iv) It is
associated with confidence indices CI (each compartment, and the
overall mark) which indicate possible weakness and biases and
therefore the need for further field data acquisition; (v) It can draw
the attention of managers to sites whose CI is high and where
routine monitoring can therefore be implemented, and conversely
those with a low CI indicating a lack of knowledge.
The Integrated Coastal Zone Management (ICZM) contributes
towards maximizing the benefits provided by the coastal zone and
minimizing conflicts and the harmful effects of activities upon each
other (e.g. [117]). ICZM, together with Ecosystem-Based Man-
agement (EBM; e.g. [118]) and, more generally, the implemen-
tation of European Directives, are in need of indices to assess
ecological quality, either based upon a single or a few species, or
ecosystem-based. The sites corresponding to well implemented
MPAs, such as the Port-Cros National Park (Port-Cros Island
southern coast, Bagaud Pass) and the Medes Islands marine
reserve, not unexpectedly get the best marks, which is congruent
with the overall excellent status of their habitats [108]. In contrast,
sites localized in areas highly impacted by most human activities
and waste, such as Sitges (South of Barcelona) and Niolon (close to
the port of Marseilles and outfall of wastewater), obtain a very low
mark. Though sites with obviously good or bad ecosystem status
naturally obtain a good and bad, EBQI mark, respectively, some
sites (e.g. Saint-Cyr Bay and Villefranche-sur-Mer Bay) do not
obtain the mark they would seemingly have deserved through the
apparent health of the seagrass itself. This confirms the usefulness
of an index, EBQI, based upon the whole ecosystem rather than
only upon the seagrass (sometimes also epibiota and other
parameters). It is worth noting that the Confidence Index (CI) is
overall relatively low. This is especially the case of Saint-Cyr Bay
(CI = 0.7; table 4) and Villefranche-sur-Mer Bay (CI = 1.3), which
could also account for the surprisingly low and not so low, EBQI,
respectively, of these sites, according to literature data [119,120].
The weak points of the EBQI are: (i) The baselines used to
assess the compartments, which may prove to be biased either by
the poor knowledge or availability of totally non-human impacted
areas, or by climate change which renders the supposed baseline
obsolete; (ii) The probable need for testing and/or adapting the
EBQI in areas distant from the study area -the north-western
Mediterranean- and more generally to other seagrass ecosystems;
(iii) The conceptual model which constitutes the basis for the
present ecosystem-based approach is obviously oversimplified. For
example, small-sized predatory ‘invertebrates’ were not taken into
consideration. Some of them belong to the matte endofauna box,
which encompasses detritus feeders, suspension-feeders and
predators. Other are creeping or clinging organisms on the P.
oceanica leaves. However, considering them would have made the
model more complex and weighed down the assessment of
ecosystem status. Moreover, other compartments are likely to
provide redundant information, so that no improvement in
accuracy is to be expected.
A number of attempts to review and compare the biotic indices
using benthic (e.g. macrophytes) and pelagic marine, lagoon and
estuarine organisms, have been performed [16,39,51,116,121].
For example, [116] analysed the strengths and weaknesses of 90
published indices. They identified several weaknesses: (i) problems
of applicability due to practical and conceptual difficulties,
affecting most of the indices related to ecosystem function, (ii)the failure of many indices using e.g. the taxonomic composition of
the community to connect its condition with the stressors, and
(iii), as far as indices based upon the sub-individual level are
concerned (e.g. multi-biomarkers), their poor strength to assess the
ecological integrity of the habitat. They concluded that the most
promising approach would be to aggregate indices with comple-
mentary strengths. In a sense, the EBQI could be considered as
such an aggregative index. Although the goal of the EBQI is not to
compete with the already available biotic indices utilizing the P.
oceanica seagrass meadow for assessing the quality of a water body,
but to assess the status of the proper seagrass ecosystem, the
comparison of the EBQI with some other biotic indices will be of
relevance. An attempt has been made here, using some published
data; a more accurate comparison would require data acquisition
at the same sites as those used for the EBQI, and is therefore
beyond the scope of the present work. In addition, the correlation
between the EBQI and anthropogenic gradients, including
overfishing, will be useful, in order to assess which human impacts
are of major relevance for the status of the ecosystem. This will
constitute the next step.
Conclusions
Overall, the Ecosystem Based Quality Index (EBQI) is easy to
implement, relatively robust and does not seem to be redundant
with existing indices based upon the seagrass itself. In addition, the
non-congruence of the EBQI, i.e. the quality of the ecosystem
functioning, with the empirical idea one may have of the P. oceanica
ecosystem at a given site, due e.g. to the health of the seagrass, the
clearness of the water (and even the beauty of the landscape and
the seascape) confirms the usefulness of the EBQI index, based
upon the whole ecosystem rather than upon only the seagrass.
Other anthropogenic impacts, e.g. overfishing, are putatively more
important than the above mentioned parameters for the structure
and functioning of the ecosystem. Finally, the EBQI that is
proposed here for the P. oceanica ecosystem could constitute a
model for similar indices designed for other ecosystems, such as
coralligenous outcrops, underwater caves, soft bottoms and
sublittoral reefs.
Acknowledgments
The authors are indebted to Fabien Morat for data concerning Phalacrocorax
aristotelis, Philippe Lenfant, Boris Daniel (AAMP) and Pierre Boissery
(AERMC) for contributions and valuable comments, Michael Paul for
improvement of the English text and two anonymous reviewers for their
highly valuable suggestions and improvement of the manuscript.
Author Contributions
Conceived and designed the experiments: CFB CPM DTB EB FR GP
MHV SP SR. Performed the experiments: CPM EB GP JP PA PB SB SR
TT. Analyzed the data: CFB JCP SP SR. Wrote the paper: DBS EB EF
CFB JCP MHV SP SR.
Ecosystem-Based Approach of Posidonia oceanica Meadow Status
PLOS ONE | www.plosone.org 14 June 2014 | Volume 9 | Issue 6 | e98994

References
1. Karr JR (1981) Assessment of biotic integrity using fish communities. Fisheries
6: 21–27.
2. Orfanidis S, Panayotidis P, Stamatis N (2001) Ecological evaluation of
transitional and coastal waters: a marine benthic macrophytes-based model.
Medit Mar Sci 2: 45–65.
3. Orfanidis S, Panayotidis P, Stamatis N (2003) An insight to the ecological
evaluation index (EEI). Ecol Indic 3: 27–33.
4. White J, Irvine K (2003) The use of littoral mesohabitats and their
macroinvertebrates in the assemblages of lakes. Aquat Conserv 13: 331–351.
5. Pergent-Martini C, Leoni V, Pasqualini V, Ardizzone GD, Balestri E, et al.
(2005) Descriptors of Posidonia oceanica meadows: Use and application. Ecol
Indic 5: 213–230.
6. Orfanidis S, Panayotidis P, Ugland KI (2011) Ecological Evaluation Index
continuous formula (EEI-c) application: a step forward for functional groups,
the formula and reference condition values. Medit Mar Sci 12: 199–231.
7. Hoare JM, Monks A, O’Donnel CFJ (2013) Do population indicators work?
Investigating correlated responses of bird populations in relation to predator
management. Ecol Indic 25: 23–34.
8. Jones CG, Lawton JH, Shachak M (1994) Organisms as ecosystem engineers.
Oikos 69: 373–386.
9. Lawton JH (1994) What do species do in ecosystems? Oikos 71: 367–374.
10. Bond W (2001) Keystone species – Hunting the snark? Science 292: 63–64.
11. Boudouresque CF, Mayot N, Pergent G (2006) The outstanding traits of the
functioning of the Posidonia oceanica seagrass ecosystem. Biol Mar Medit 13(4):
109–113.
12. Romero J, Martınez-Crego B, Alcoverro T, Perez M (2007) A multivariate
index based on the seagrass Posidonia oceanica (POMI) to assess ecological status
of coastal waters under the water framework directive (WFD). Mar Poll Bull 55:
196–204.
13. Fernandez-Torquemada Y, Dıaz-Valdes M, Colilla F, Luna B, Sanchez-Lizaso
JL, et al. (2008) Descriptors from Posidonia oceanica (L.) Delile meadows in
coastal waters of Valencia, Spain, in the context of the EU Water Framework
Directive. ICES J Mar Sci 65: 1492–1497.
14. Gobert S, Sartoretto S, Rico-Raimondino V, Andral B, Chery A, et al. (2009)
Assessment of the ecological status of Mediterranean French coastal waters as
required by the Water Framework Directive using the Posidonia oceanica Rapid
Easy Index: PREI. Mar Poll Bull 58: 1727–1733.
15. Lopez y Royo C, Casazza G, Pergent-Martini C, Pergent G (2010) A biotic
index using the seagrass Posidonia oceanica (BiPo), to evaluate ecological status of
coastal waters. Ecol Indic 10: 380–389.
16. Lopez y Royo C, Pergent G, Alcoverro T, Buia MC, Casazza G, et al. (2011)
The seagrass Posidonia oceanica as indicator of coastal water quality: experimental
intercalibration of classification systems. Ecol Indic 11: 557–563.
17. Marba N, Krause-Jensen D, Alcoverro T, Birk S, Pedersen A (2012) Diversity
of European seagrass indicators: patterns within and accross regions.
Hydrobiologia 704: 265–278.
18. Panayotidis P, Feretopoulos J, Montesanto B (1999) Benthic vegetation as an
ecological quality descriptor in an Eastern Mediterranean coastal area (Kalloni
Bay, Aegean Sea, Greece). Estuar Coast Shelf Sci 48: 205–214.
19. Ballesteros E, Torras X, Pinedo S, Garcia M, Mangialajo L, et al. (2007) A new
methodology based on littoral community cartography by macroalgae for the
implementation of the European Water Framework Directive. Mar Poll Bull
55: 172–180.
20. Guinda X, Juanes JA, Puente A, Revilla JA (2008) Comparison of two methods
for quality assessment of macroalgae assemblages, under pollution types. Ecol
Indic 8: 743–753.
21. Oliva S, Mascaro O, Llagostera I, Perez M, Romero J (2012) Selection of
metrics based on the seagrass Cymodocea nodosa and development of a biotic
index (CYMOX) for assessing ecological status of coastal and transitional
waters. Estuar Coast Shelf Sci 114: 7–17.
22. Garcıa-Marın P, Cabaco S, Hernandez I, Vergara JJ, Silva J (2013) Multi-
metric index based on the seagrass Zostera noltii (ZoNI) for ecological quality
assessment of coastal and estuarine systems in SW Iberian Peninsula. Mar Poll
Bull 68: 46–54.
23. Diaz R, Solan M, Valente R (2004) A review of approaches for classifying
benthic habitats and evaluating habitat quality. J Environ Manage 73: 165–
181.
24. Mateo MA, Romero J, Perez M, Littler M, Littler D (1997) Dynamics of
millenary organic deposits resulting from the growth of the Mediterranean
seagrass Posidonia oceanica. Estuar Coast Shelf Sci 44: 103–110.
25. Alcoverro T, Manzanera M, Romero J (2001) Annual metabolic carbon
balance of the seagrass Posidonia oceanica: the importance of carbohydrate
reserves. Mar Ecol Prog Ser 211: 105–116.
26. Prado P, Tomas F, Alcoverro T, Romero J (2007) Extensive direct
measurements of Posidonia oceanica defoliation confirm the importance of
herbivory in temperate seagrass meadows. Mar Ecol Prog Ser 340: 63–71.
27. Boudouresque CF, Bernard G, Bonhomme P, Charbonnel E, Diviacco G, et al.
(2012) Protection and conservation of Posidonia oceanica meadows. Marseilles:
RAMOGE, RAC/SPA and Gis Posidonie publ. pp. 202 p.
28. Pergent G, Bazairi H, Bianchi CN, Boudouresque CF, Buia MC, et al. (2012)
Mediterranean seagrass meadows: resilience and contribution to climate
change mitigation. A short summary. Gland, Malaga: IUCN. 40 p.
29. Mazzuca S, Bjork M, Beer S, Felisberto P, Gobert S, et al. (2013) Establishing
research strategies, methodologies and technologies to link genomics and
proteomics to seagrass productivity, community metabolism, and ecosystem
carbon fluxes. Front Plant Sci 4(38): 1–19.
30. Sala E (2004) The past and present topology and structure of Mediterranean
subtidal rocky-shore food webs. Ecosystems 7: 333–340.
31. Bellan-Santini D, Picard J (1984) Consequences de la regression des herbiers de
Posidonies pour le benthos animal des milieux mediterraneens. In: Boudour-
esque CF, Jeudy de Grissac A, Olivier J, editors. International Workshop on
Posidonia oceanica beds. Marseilles: GIS Posidonie publ. pp. 423–429.
32. Boudouresque CF, Bernard G, Pergent G, Shili A, Verlaque M (2009)
Regression of Mediterranean seagrasses caused by natural processes and
anthropogenic disturbances and stress: a critical review. Botanica Marina 52:
395–418.
33. Coles R, Grech A, McKenzie L (2013) Seagrass under pressure. Seagrass-
Watch 47: 2–6.
34. Ward T, Hegerl E (2003) Marine protected areas in ecosystem-based
management of fisheries. Canberra: Commonweath of Australia publ. 66 p.
35. Pikitch EK, Santora C, Babcock EA, Bakun A, Bonfil R, et al. (2004)
Ecosystem-based fishery management. Science 305: 346–347.
36. Turrell B (2004) The policy basis of the ‘‘Ecosystem Approach’’ to fisheries
management. Norrkoping, Sweden: EuroGOOS publ. 21: 1–28.
37. Rice JC (2005) Implementation of the Ecosystem Approach to Fishery
Management – asynchronous co-evolution at the interface between science and
policy. Mar Ecol Prog Ser 300: 265–270.
38. Tudela S, Short K (2005) Paradigm shifts, gaps, inertia, and political agendas in
ecosystem-based fisheries management. Mar Ecol Prog Ser 300: 281–286.
39. Martınez-Crego B, Verges A, Alcoverro T, Romero J (2008) Selection of
multiple seagrass indicators for environmental biomonitoring. Mar Ecol Progr
Ser 361: 93–109.
40. Christensen V, Maclean J (eds) (2011) Ecosystem approach to fisheries. A
global perpective. Cambridge University Press. 342 p.
41. Kenchington E, Heino M, Nielsen EE (2003) Managing marine genetic
diversity: time for action? ICES J Mar Sci 60: 1172–1176.
42. Rosenberg AA, McLeod KL (2005) Implementing ecosystem-based approaches
to management for the conservation of ecosystem services. Mar Ecol Prog Ser
300: 270–274.
43. Ruız JM, Boudouresque CF, Enrıquez S (2009) Mediterranean seagrasses.
Botanica Marina 52: 369–382.
44. Boudouresque CF, Jeudy de Grissac A (1983) L’herbier a Posidonia oceanica en
Mediterranee: les interactions entre la plante et le sediment. J Rech Oceanogr
8: 99–122.
45. Gacia E, Granata TC, Duarte CM (1999) An approach to measurement of
particule flux and sed-iment retention within seagrass (Posidonia oceanica)
meadows. Aquat Bot 65: 255–268.
46. Sanchez-Gonzalez JF, Sanchez-Rojas V, Memos CD (2011) Wave attenuation
due to Posidonia oceanica meadows. J Hydraul Res 49: 503–514.
47. Infantes E, Orfila A, Simarro G, Terrados J, Luhar M, et al. (2012) Effect of a
seagrass (Posidonia oceanica) meadow on wave propagation. Mar Ecol Prog Ser
456: 63–72.
48. Molinier R, Picard J (1952) Recherches sur les herbiers de Phanerogames
marines du littoral mediterraneen francais. Ann Inst Oceanogr 27: 157–234.
49. Boudouresque CF, Meinesz A (1982) Decouverte de l’herbier de posidonie.
Hyeres: Parc National de Port-Cros publ. iii + 79 p.
50. Lopez-Saez JA, Lopez-Merino L, Mateo MA, Serrano O, Perez-Dıaz S, et al.
(2009) Paleoecological potential of marine organic deposits of Posidonia oceanica:
a case study in the NE Iberian Peninsula. Palaeogeogr Palaeoclimatol
Palaeoecol 271: 215–224.
51. Montefalcone M (2009) Ecosystem health assessment using the seagrass
Posidonia oceanica: a review. Ecological Indicators 9: 595–604.
52. Sartoretto S, Beaucour C (2011) Habitats particuliers de l’infralittoral : Herbier
a Posidonia oceanica de la sous-region marine Mediterranee occidentale
DCSMM/EI/MO. Ministere de l’Ecologie, du Developpement Durable, des
Transports et du Logement DCSMM/EI/EE/MO/2.2.4.c. 14p.
53. Pergent-Martini C, Pergent G (1994) Lepidochronological analysis in the
Mediterranean seagrass Posidonia oceanica: state of the art and future
development. Oceanol Acta 17: 673–681.
54. Fourqurean JW, Duarte CM, Kennedy H, Marba N, Holmer M, et al. (2012)
Seagrass ecosystems as a globally significant carbon stock. Nat Geosci 5:505–
509.
55. Boudouresque CF, Crouzet A, Pergent G (1983) Un nouvel outil au service de
l’etude des herbiers a Posidonia oceanica: la lepidochronologie. Rapp PV Reun
Commiss Internatl Explor Sci Medit 28(3): 111–112.
56. Pergent G, Boudouresque CF, Crouzet A, Meinesz A (1989) Cyclic changes
along Posidonia oceanica rhizomes (lepidochronology): present state and
perspectives. PSZN I Mar Ecol 10: 221–230.
Ecosystem-Based Approach of Posidonia oceanica Meadow Status
PLOS ONE | www.plosone.org 15 June 2014 | Volume 9 | Issue 6 | e98994

57. Thelin I, Mosse A, Boudouresque CF, Lion R (1985) Le benthos littoral d’El
Dabaa (Mediterranee, Egypte). II. L’herbier a Posidonia oceanica. Rapp PV Reun
Commiss Internatl Explor Sci Medit 29(5): 247–248.
58. Pergent G, Pergent-Martini C (1991) Leaf renewal cycle and primary
production of Posidonia oceanica in the bay of Lacco Ameno (Ischia, Italy) using
lepidochronological analysis. Aquat Bot 42: 49–66.
59. Pergent G, Pergent-Martini C, Boudouresque CF (1995) Utilisation de l’herbier
a Posidonia oceanica comme indicateur biologique de la qualite du milieu littoral
en Mediterranee: etat des connaissances. Mesogee 54: 3–27.
60. Martın MA, Sanchez Povedo M, Marhuenda E, Martınez JM, Sanchez Lizaso
JL (1994) Estudio del estrato hipogeo de la pradera de Posidonia oceanica (L.)
Delile de la reserva marina de Tabarca. In: Ramos Espla A, editor. Trabajos de
campo en la reserva marina de Tabarca (Alicante). Alicante: Universidad de
Alicante publ. pp. 25–31.
61. Boudouresque CF, Jeudy de Grissac A, Meinesz A (1984) Relations entre la
sedimentation et l’allongement des rhizomes orthotropes de Posidonia oceanica
dans la baie d’Elbu (Corse). In: Boudouresque CF, Jeudy de Grissac A, Olivier
J, editors. International Workshop on Posidonia oceanica Beds. Marseilles: GIS
Posidonie publ. pp. 185–191.
62. Di Maida G, Tomasello A, Sciandra M, Pirrotta M, Milazzo M, et al. (2013)
Effect of different substrata on rhizome growth, leaf biometry and shoot density
of Posidonia oceanica. Mar Environ Res 87–88: 96–102.
63. Giovannetti E, Lasagna R, Montefalcone M, Bianchi CN, Albertelli G, et al.
(2008) Inconsistent responses to substratum nature in Posidonia oceanica
meadows: an integration through complexity levels? Chemistry and Ecology
24 (S1): 145–153.
64. Bay D (1984) A field study of the growth dynamics and productivity of Posidonia
oceanica (L.) Delile in Calvi Bay, Corsica. Aquat Bot 20: 43–64.
65. Pergent-Martini C, Rico-Raimondino V, Pergent G (1994) Primary production
of Posidonia oceanica in the Mediterranean basin. Mar Biol 120: 9–15.
66. Panayotidis P, Boudouresque CF, Marcot-Coqueugniot J (1981) Microstruc-
ture de l’herbier de Posidonia oceanica (Linnaeus) Delile. Botanica Marina: 115–
124.
67. UNEP-MAP-RAC/SPA (2011) Draft guidelines for the standardization of
mapping and monitoring methods of marine magnoliophyta in the Mediter-
ranean. Working document, prepared by C Pergent-Martini for the tenth
meeting of Focal Points for SPAs, Marseilles, France, 17–20 May 2011,
UNEP(DEPI)/MED WG 359/9. Tunis: RAC/SPA Publ. 59 p.
68. Boudouresque CF, Verlaque M (2007) Ecology of Paracentrotus lividus. In:
Lawrence J, editor. Edible sea urchins: biology and ecology, Second edition.
Amsterdam: Elsevier. pp. 243–285.
69. Boudouresque CF, Bernard G, Bonhomme P, Charbonnel E, Le Direach L, et
al. (2007) Monitoring methods for Posidonia oceanica seagrass meadows in
Provence and the French Riviera. Sci Rep Port-Cros Natl Park 22: 17–38.
70. Short FT, McKenzie LJ, Coles RG, Vidler KP (2002) SeagrassNet manual for
scientific monitoring of seagrass habitat. Cairns: QDPI, QFS. 56 p.
71. Boudouresque CF, Verlaque M (2013) Paracentrotus lividus. In: Lawrence JM,
editor. Sea urchins: Biology and ecology, Third Edition. Amsterdam: Elsevier.
pp. 297–327.
72. van der Ben D (1971) Les epiphytes des feuilles de Posidonia oceanica Delile sur les
cotes francaises de la Mediterranee. Mem Inst R Sci Nat Belg 168 : 1–101 + 6
tables.
73. Giovannetti E, Montefalcone M, Morri C, Bianchi CN, Albertelli G (2010)
Early warning response of Posidonia oceanica epiphyte community to environ-
mental alterations (Ligurian Sea, NW Mediterranean). Mar Poll Bull 60 (7):
1031–1039.
74. Mabrouk L, Hamza A, Ben Brahim M, Bradai MN (2013) Variability in the
structure of epiphyte assemblages on leaves and rhizomes of Posidonia oceanica in
relation to human disturbances in a seagrass meadow of Tunisia. Aquat Bot
108: 33–40.
75. Peres JM, Picard J (1964) Nouveau manuel de bionomie benthique de la Mer
Mediterranee. Rec Trav Stat Mar Endoume 31(47): 3–137.
76. Vicente N, De Gaulejac B (1993) Pinna nobilis L. (Mollusque Bivalve), indicateur
biologique du littoral mediterraneen. In : Boudouresque CF, Avon M, Pergent-
Martini C, editors. Qualite de milieu marin. Indicateurs biologiques et physico-
chimiques. Marseilles: GIS Posidonie publ. pp. 141–150.
77. Garcıa-March JR, Garcıa-Carrascosa AM, Pena Cantero AL, Wang YG (2007)
Population structure, mortality and growth of Pinna nobilis Linnaeus, 1758
(Mollusca, Bivalvia) at different depths in Moraira Bay (Alicante, Western
Mediterranean). Mar Biol 150: 861–871.
78. Garcıa-March JR, Vicente N (2011) Pinna nobilis (Mollusca, Bivalvia) indicateur
biologique de la qualite du littoral mediterraneen: densite des populations. In:
Francour P, Bodilis P, Arceo H, editors. Actes du Congres 2011 de la Societe
Zoologique de France. Nice: Universite de Nice publ. pp. 80–81.
79. Urra J, Ramirez AM, Marina P, Salas C, Gofas S, et al. (2013) Highly diverse
molluscan assemblages of Posidonia oceanica meadows in northwestern Alboran
Sea (W Mediterranean): seasonal dynamics and environmental drivers. Estuar
Coast Shelf Sci 117: 136–147.
80. Naranjo SA, Carball JL, Garcia-Gomez JC (1996) Effects of environmental
stress on ascidian populations in Algeciras Bay (southern Spain). Possible
marine bioindicators? Mar Ecol Progr Ser 144: 119–131.
81. Bianchi CN, Bedulli D, Morri C, Occhipinti Ambrogi A (1989) L’herbier de
Posidonies: ecosysteme ou carrefour eco-ethologique? In: International
Workshop on Posidonia Beds (CF . Boudouresque, A . Meinesz, E . Fresi &
V . Gravez, eds). GIS Posidonie, Marseille 2: 257–272.
82. Romero J, Pergent G, Pergent-Martini C, Mateo M.A, Regnier C (1992). The
detritic compartment in a Posidonia oceanica meadow: litter features, decompo-
sition rates and mineral stocks. Mar Ecol PSZNI 13(1): 69–83.
83. Mezali K, Chekaba B, Zupo V, Asslah B (2003) Comportement alimentaire de
cinq especes d’holothuries aspidochirotes (Holothuria: Echinodermata) de la
presqu’ıle de Sidi-Fredj (Algerie). Bull Soc Zool Fr 128: 49–62.
84. Verlaque M (1981) Preliminary data on some Posidonia feeders. Rapp PV Reun
Commiss Internatl Explor Sci Mediterr 27(2): 201–202.
85. Giraud G (1979) Sur une methode de mesure et de comptage des structures
foliaires de Posidonia oceanica (Linnaeus) Delile. Bull Mus Hist Nat Marseille 39:
33–39.
86. Peirano A, Niccolai I, Mauro R, Bianchi CN (2001) Seasonal grazing and food
preference of herbivores in a Posidonia oceanica meadow. Scientia Marina 65 (4):
367–374.
87. Francour P (1997) Fish assemblages of Posidonia oceanica beds at Port-Cros
(France, NW Mediterranean): assessment of composition and long term
fluctuations by visual census. PSZN I Mar Ecol 18: 157–173.
88. Bell JD, Harmelin-Vivien ML (1982) Fish fauna of French Mediterranean
Posidonia oceanica seagrass meadows. 1. Community structure. Tethys 10: 337–
347.
89. Harmelin-Vivien M (1982) Ichtyofaune des herbiers de posidonies du Parc
national de Port-Cros: I. Composition et variations spatio-temporelles. Trav Sci
Parc Natl Port-Cros 8: 69–92.
90. Francour P, Harmelin-Vivien M, Harmelin JG, Duclerc J (1995) Impact of
Caulerpa taxifolia colonization on the littoral ichthyofauna of north-western
Mediterranean Sea: preliminary results. Hydrobiologia 300/301: 345–353.
91. Harmelin-Vivien M, Francour P (1992) Trawling or visual censuses?
Methodological bias in the assessment of fish populations in seagrass beds.
PSZN I Mar Ecol 13: 41–51.
92. Guyot I (1990) Le cormoran huppe de Corse: biologie et interactions avec la
peche professionnelle. Trav Sci Parc Nat Reg Res Nat Corse 28: 1–40.
93. Morat F (2007) Regime alimentaire de la population de cormoran huppe de
Mediterranee (Phalacrocorax aristotelis desmarestii) de Riou. Marseilles: CEEP and
Centre d’Oceanologie de Marseille. 23 + 6 p.
94. Morat F, Mante A, Drunat E, Dabat J, Bonhomme P, et al. (2011) Diet of the
Mediterranean European shag, Phalacrocorax aristotelis desmaretii, its ecological
significance and interaction with local fisheries in the Riou Archipelago
(Marseilles, France). Vie Milieu 61: 77–86.
95. Francour P, Thibault JC (1995) Le regime alimentaire du balbuzard pecheur
(Pandion haliaetus) dans la Reserve naturelle de Scandola. Trav Sci Parc Nat reg
Res Nat. Corse 53: 11–27.
96. Francour P, Thibault JC (1996) The diet of breeding osprey Pandion haliaetus on
Corsica: exploitation of a coastal marine environment. Bird Study 43: 129–133.
97. Thibault JC, Bretagnolle V, Dominici JM (2001) Le balbuzard pecheur en
Corse. Ajaccio: Alain Piazzola. 184 p.
98. Pergent G, Romero J, Pergent-Martini C, Mateo MA, Boudouresque CF
(1994) Primary production, stocks and fluxes in the Mediterranean seagrass
Posidonia oceanica. Mar Ecol Prog Ser 106: 139–146.
99. Mateo MA, Romero J (1997) Detritus dynamics in the seagrass Posidonia
oceanica: elements for an ecosystem carbon and nutrient budget. Mar Ecol Prog
Ser 151: 43–53.
100. Pergent G, Rico-Raimondino V, Pergent-Martini C (1997) Fate of primary
production in Posidonia oceanica meadows of the Mediterranean. Aquat Bot 59:
307–321.
101. Mateo MA, Sanchez-Lizaso JL, Romero J (2002) Posidonia oceanica ‘banquettes’:
a preliminary assessment of the relevance for meadow carbon and nutrient
budget. Estuar Coast Shelf Sci 56: 85–90.
102. Macquart-Moulin C (1968) Les amphipodes bentho-planctoniques du golfe de
Marseille. Analyse des captures faites au cours de peches planctoniques
nocturnes regulieres (annees 1963–1964). Rec Trav Stat Mar Endoume 43(59):
311–332.
103. Harmelin-Vivien ML, Harmelin JG, Leboulleux V (1995) Microhabitat
requirements for settlement of juvenile sparid fishes on Mediterranean rocky
shores. Hydrobiologia 300–301: 309–320.
104. Jimenez S, Cano R, Bayle J, Ramos A, Sanchez Lizaso JL (1996) Las praderas
de Posidonia oceanica (L.) Delile como zona de proteccion de juveniles de especies
de interes comercial. Real Soc Esp Hist Nat, tomo extraordinario: 375–378.
105. UNEP-MAP-RAC/SPA (2011) Proposal of standard methods for inventorying
and monitoring coralligenous and rhodoliths populations. Working document,
prepared by G Pergent for the tenth meeting of Focal Points for SPAs,
Marseilles, France, 17–20 May 2011, UNEP(DEPI)/MED WG 359/10. Tunis:
RAC/SPA Publ. 23 p.
106. Dalkey N, Helmer O (1963) An experimental application of the Delphi method
to the use of experts. Manage Sci 9: 458–467.
107. Ferrari B, Raventos N, Planes S (2008) Assessing effects of fishing prohibition
on Posidonia oceanica seagrass meadows in the Marine Natural Reserve of
Cerbere-Banyuls. Aquatic Botany 88: 295–302.
108. Astruch P, Boudouresque CF, Bonhomme D, Goujard A, Antonioli PA, et al.
(2012) Mapping and state of conservation of benthic marine habitats and
assemblages of Port-Cros national Park (Provence, France, northwestern
Mediterranean Sea). Sci Rep Port-Cros Natl Park 26: 45–90.
Ecosystem-Based Approach of Posidonia oceanica Meadow Status
PLOS ONE | www.plosone.org 16 June 2014 | Volume 9 | Issue 6 | e98994

109. Bazin N, Imbert M (2012) Le cormoran huppe de Mediterranee Phalacrocorax
aristotelis desmarestii. Etat des connaissances et de la conservation actualise despopulations nicheuses des petites ıles de Mediterranee. Marseilles: Initiative
PIM. 18 p.
110. Romero J, Perez M, Alcoverro T (2012) L’alguer de Posidonia oceanica de les illesMedes: mes de trenta anys d’estudi. In: Quintana X, Hereu B, editors. El fons
marı de les illes Medes i el Montgrı: quatre decades de recerca per laconservatio. Toroella de Montrgrı: Catedra d’Ecosistems Marins Mediterranis.
pp. 81–100.
111. Rouanet E, Astruch P, Bonhomme D, Bonhomme P, Rogeau E, et al. (2012)Suivi de l’herbier de posidonie de la passe de Bagaud, impact de l’ancrage (Parc
national de Port-Cros, Var, France). Marseilles: GIS Posidonie publ. 82 p.112. Boudouresque CF, Charbonnel E, Meinesz A, Pergent G, Pergent-Martini C,
et al. (2000) A monitoring network based on the seagrass Posidonia oceanica in thenortwestern Mediterranean Sea. Biol mar medit 7 (2): 328–331.
113. Moreno D, Aguilera PA, Castro H (2001) Assessment of the conservation status
of seagrass (Posidonia oceanica) meadows: implications for monitoring strategyand the decision-making process. Biol Conservation 102: 325–332.
114. Montefalcone M, Albertelli G, Morri C, Bianchi CN (2007) Urban seagrass:status of Posidonia oceanica facing Genoa city waterfront (Italy) and implications
for management. Mar Poll Bull 54: 206–213.
115. Van Hoey G, Borja A, Birchenough S, Buhl-Mortensen L, Degraer S, et al.(2010) The use of benthic indicators in Europe: from the Water Framework
Directive to the Marine Strategy Framework Directive. Mar Poll Bull 60:
2187–2196.
116. Martınez-Crego B, Alcoverro T, Romero J (2010) Biotic indices for assessing
the status of coastal waters: a review of strengths and weaknesses. J Environm
Monit 12 (5): 1013–1028.
117. Pergent-Martini C, Pasqualini V, Ferrat L, Pergent G (2006) Ecological data in
Integrated Coastal Zone Management: case study of Posidonia oceanica meadows
along the Corsican coastline (Mediterranean Sea). Environ Manage 38: 889–
895.
118. Parravicini V, Rovere A, Vassallo P, Micheli F, Montefalcone M, et al. (2012)
Understanding relationships between conflicting human uses and coastal
ecosystem status: a geospatial modelling approach. Ecol Indic 19: 253–263.
119. Meinesz A, Lefevre JR, Astier JM (1991) Impact of coastal development on the
infralittoral zone along the southern Mediterranean shore of continental
France. Mar Poll Bull 23: 343–347.
120. Leriche A, Pasqualini V, Boudouresque CF, Bernard G, Bonhomme P, et al.
(2006) Spatial, temporal and structural variations of a Posidonia oceanica seagrass
meadow facing human activities. Aquat Bot 84: 287–293.
121. Mascaro O, Alcoverro T, Dencheva K, Dıez I, Gorostiaga JM, et al. (2013)
Exploring the robustness of macrophyte-based classification methods to assess
the ecological status of coastal and transitional ecosystems under the Water
Framework Directive. Hydrobiologia 704: 279–291.
Ecosystem-Based Approach of Posidonia oceanica Meadow Status
PLOS ONE | www.plosone.org 17 June 2014 | Volume 9 | Issue 6 | e98994