Ecosystem Conservation and Management: The Concept of Large Marine Ecosystem
122
Journal of Coastal Environment COES ISSN 2229-7839 Volume 2, Number 1, 2011 JCE JCE JCE
Transcript of Ecosystem Conservation and Management: The Concept of Large Marine Ecosystem

Journal of Coastal Environment
COES
ISSN 2229-7839Volume 2, Number 1, 2011
JCEJCEJCE

Journal of Coastal EnvironmentJournal of Coastal Environment (JCE) is published by the Centre for Ocean and Environmental Studies, New Delhi twice a year. The Journal promotes the study and analyses of scientific, economic and policy issues related to ecology of the oceans and coasts, as well as its impact on the land and the atmosphere. The emphasis is to involve a large community of scientists and scholars from India and abroad in developing a framework of discussion and debate on conservation and sustainable development.
Frequency : Biannual
Editor-in-Chief : S.Z. Qasim, Chairman, Centre for Ocean and Environmental Studies, New Delhi
Editor : Kishore Kumar, Secretary & ConsultantCentre for Ocean and Environmental Studies, New Delhi
© Journal of Coastal Environment (JCE). All rights reserved. No portion of material can be
reproduced in part or full without the prior permission of the Editor.
Note : The views expressed herein are the opinions of contributors and the Editor, and do not
reflect the stated policies of the Centre for Ocean and Environmental Studies.
Correspondence: All enquiries, editorial, business and any other, may be addressed to:
The Editor, Journal of Coastal Environment (JCE), A-2, East of Kailash (Basement),
New Delhi 110 065; Tel /Fax: 91-11-46078340; E-mail : zqasim@hotmail .com;
[email protected]; Website: www.coes-india.orgISSN : 2229-7839
K. KathiresanProfessor, Centre of Advanced Study in Marine
Biology, Annamalai University, Tamil Nadu
M.C. VermaIAS (Retd.) and former Member, Forest
Advisory Committee (MoEF), New Delhi
B. MeenakumariDeputy Director-General, Indian Council of
Agricultural Research, New Delhi
Satish R. ShetyeDirector
National Institute of Oceanography, Goa
Malti GoelFormer Adviser, Ministry of Science &
Technology, New Delhi
Amalesh ChoudhuryFounder & former Head, Department of Marine
Science, University of Calcutta, Kolkata
Rasik RavindraDirector, National Centre for Antarctic &
Ocean Research, Goa
Anil ChatterjeeInstitute of Tropical Aquaculture
University Malaysia Terengganu, Malaysia
Sudhir K. ChopraFellow, University of Cambridge at Rue de
Neufchateau, Arlon, Belgium
Baishnab Charan TripathyProfessor, School of Life Sciences
Jawaharlal Nehru University, New Delhi
Vijay SakhujaDirector (Research), Indian Council of World
Affairs, New Delhi
Dinabandhu SahooAssociate Professor, Department of Botany,
University of Delhi, Delhi
Editorial Board

Journal of Coastal Environment
JCE
Volume 2, Number 1, 2011
Centre for Ocean and Environmental StudiesA-2, East of Kailash (Basement), New Delhi 110 065; Tel/Fax: 91-11-46078340
E-mail: [email protected]; [email protected];
Website: www.coes-india.org


The two issues of the first volume pertaining to the year 2010 of the
Journal of Coastal Environment (JCE) have been received well, both
within the country and abroad. We have received papers from scientists
and scholars from the coastal centres in India as well as from the Centre
for Ocean Studies and Marine Biology in Port Blair. It is heartening to
note the variety of research being carried out in the universities and
research institutes in various coastal and island centres of the country
which are providing papers for the JCE in a continued manner.
The first number of the Volume 2 of the Journal gives an excellent
coverage of a wide variety of subjects. The first paper deals with the
fauna and flora which constitute the biodiversity of coastal
environment. The various threats which affect the decline in
biodiversity include habitat destruction largely because of human
activities such as trawling for food fishes which in turn seriously affect
the different components of the environment. The next factor is over-
exploitation of animals because of their increasing demand as human
food. Once the natural population of animals and plants (i.e.
biodiversity) decreases, non-native (invasive) species replace the native
ones. Lastly, pollution threats of different types, and particularly oil
spills from tankers, create a lot of environmental problems affecting the
biodiversity. Several instances of oil spills by oil tankers have been cited
as examples. Climate change as a result of carbon dioxide emission from
human activities leads to an increase in the temperature of coastal
waters which results into a geographical shift in the composition of
biodiversity.
The next paper on the Lakshadweep ecosystem provides an overview to
the fragility of the Lakshadweep environment in which the livelihood of
islanders depends largely on coconut and fish. It reinforces the need for
a science-based conservation effort. It has been suggested that the
fragility of the island ecosystem requires special attention to coral reef
research and a management approach to preserve the different aspects of
the ecology of Lakshadweep Islands. The next paper on Oil Pollution
and its Impact on Fisheries indicates that economic liberalisation has
increased the export and import of different commodities of the
countries of the world, particularly of India and China which are
emerging as two important economies, resulting in an increase of oil
Editorial

consumption and its transport. These activities have also resulted in
increased oil spills which in turn affect the fish population. The paper
points to the danger of contamination of fish products with oil. The next
paper on the impact of mining on land and water of Goa describes
mining as an important activity in the land and water areas of Goa. This
adds up to a considerable amount of revenue to the Government, nearly
60 per cent of the total iron export of the country. There are several
environmental problems connected with mining operations which have
been indicated.
The paper on Deepwater Horizon accident in the Gulf of Mexico, USA
describes the rights of British Petroleum for drilling in the area, and
indicates the possible consequences due to poor risk management. The
next paper discusses the concept of large marine ecosystems (LMEs),
developed by the US National Oceanic and Atmospheric Administration
(NOAA). The LME-based conservation focuses on the degradation of
coastal and marine ecosystems, and recognises its various consequences.
It demands a coordinated approach by different regions, for example in
the Bay of Bengal which has been designated as a region of tropical
climate. The next paper gives an account of the growth of juvenile
Epinephelus fuscoguttatus which was used as a dietary supplement of
probiotics for a limited period, indicating the possible use of this diet in
aquaculture. The last paper on environmental control in Kuantan
Mangrove Ecosystem, Malaysia gives an account of the distribution of
foraminiferan assemblage in relation to several environmental factors.
He concludes that the main environmental parameter influencing the
distribution and density of foraminifera (a unicellular marine organism)
at the Kuantan mangrove ecosystem is the sediment characteristics, such
as sand, silt, clay and total organic carbon (TOC).
S.Z. Qasim
This publication has been supported by the Ministry of
Earth Sciences (MoES), Government of India.
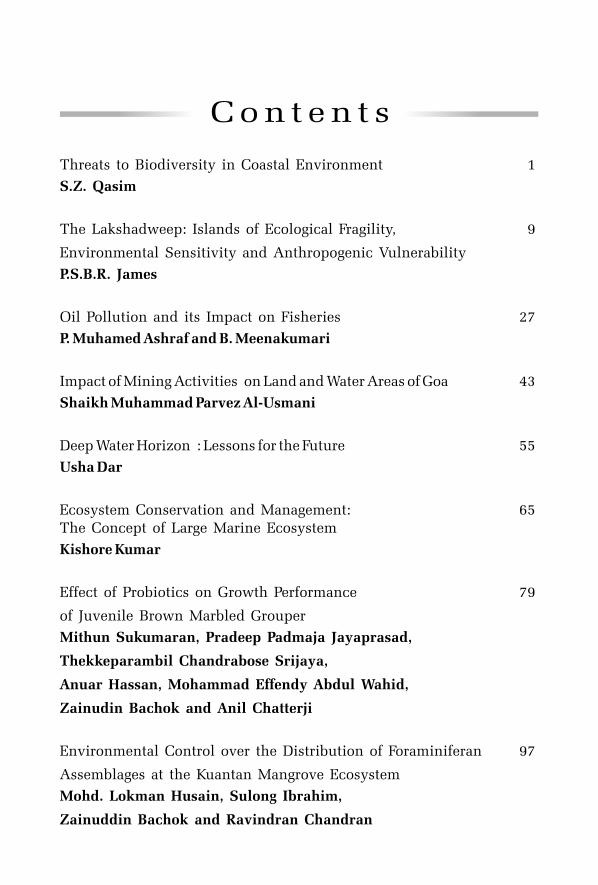
Threats to Biodiversity in Coastal Environment 1
S.Z. Qasim
The Lakshadweep: Islands of Ecological Fragility, 9
Environmental Sensitivity and Anthropogenic Vulnerability
P.S.B.R. James
Oil Pollution and its Impact on Fisheries 27
P. Muhamed Ashraf and B. Meenakumari
Impact of Mining Activities on Land and Water Areas of Goa 43
Shaikh Muhammad Parvez Al-Usmani
Deep Water Horizon : Lessons for the Future 55
Usha Dar
65
Kishore Kumar
Effect of Probiotics on Growth Performance 79
of Juvenile Brown Marbled Grouper
Mithun Sukumaran, Pradeep Padmaja Jayaprasad,
Thekkeparambil Chandrabose Srijaya,
Anuar Hassan, Mohammad Effendy Abdul Wahid,
Zainudin Bachok and Anil Chatterji
Environmental Control over the Distribution of Foraminiferan 97
Assemblages at the Kuantan Mangrove Ecosystem
Mohd. Lokman Husain, Sulong Ibrahim,
Zainuddin Bachok and Ravindran Chandran
Ecosystem Conservation and Management: The Concept of Large Marine Ecosystem
C o n t e n t s


Threats to Biodiversity in Coastal Environment
S.Z. Qasim*
Biodiversity of coastal environment, like any other environment, indicates the
inherent richness of fauna and flora of an ecosystem. The year 2010 has been
declared as the year of biodiversity to make people aware and to promote the need
for conservation of the biological wealth of an environment. Major threats of
biodiversity are (1) Habitat destruction largely because of human activities, (2)
Overexploitation because of increasing demand of animals as human food, (3)
Invasion of non-native species. Once the natural population decreases, it begins to
be replaced by invasive species which affects the fauna of other natural population,
(4) Pollution threats of different types particularly of oil-spills. These are generally
caused by accidents to oil tankers. Examples such as the oil spill of TANSHURON in
1974 created a lot of problems on Kiltan an atoll of Lakshadweep. Other examples
are of TORRY CANYON, ARGO MERCHANT, IXTOC I, BURMAH AGATE, JUPITER,
CHITRA etc. All these resulted in oil spills. (5) The climate change, because of CO2
emission from human activities leading to temperature increase of coastal waters.
It has resulted into geographical shift in distribution of several species.
IntroductionThe year 2010 has been designated as the International year of
Biodiversity. Therefore, it is still important and relevant to write
something on this topic. The basic idea behind earmarking one year to
biodiversity is to create an awareness of diversity of both marine
animals and plants and thus to encourage the conservation of species
in their natural environments.
Main ThreatsAccording to Handerson (2010), some of the main threats currently
challenging biodiversity are:
* Former Secretary, Govt. of India and former Member (Science), Planning Commission, Govt. of India.
Jour. Coast. Env., Vol. 2, No. 1, 2011
Abstract

1. Habitat destruction
2. Overexploitation
3. Invasion of non-native species
4. Pollution of the environment in general and oil spills in particular
5. Climate Change
1. Habitat DestructionMany species of both animals and plants have either disappeared
or are on the verge of extinction because of the destruction of
their natural habitat by human interference. For example, several
sessile forms living at the seabed such as clams, oysters and snails
including seaweeds of economic importance have become rare or
absent in many well-established seabed areas because of the
destruction of their habitat as a result of fishing activities using
trawls or several other types of dredging gears.
2. OverexploitationThe demand of food-fishes is increasing every day and hence
these are being exploited in increasing quantities. The result is
that several fish populations are overfished and their catches
require greater efforts to obtain the desired quantities. This is
more evident in fisheries of higher latitudes as compared to
tropical waters. For example, hake populations are overfished and
similar is the case with cod and several species of clupeiods
which are long-lived fishes which mature in their second or third
year of life. Thus their number in the population, because of
natural and fishing mortality, decreases year after year. The result
is that their stocks get easily overfished. Unlike the temperate
species, the fishes of tropical waters are short-lived and generally
attain maturity during the first year of their life itself and as a
result their population gets replenished every year. Thus,
symptoms of overfishing do not become very obvious in their
populations. The only group, where overfishing has often been
suspected, are the prawns. Their yield has been diminishing and
an increase in effort is required year after year to obtain a desired
quantity.
Journal of Coastal Environment2

3. Invasion of non-native species
Invasion of species such as fouling organisms transported by the
ships or ballast water pose threats to local biodiversity. Studies on
shores of shallow water have indicated the effects of invasive
molluscs in intertidal areas off several coasts being inhabited by
non-native species, particularly the shelled animals like the
bivalves and gastropods. Fouling organisms form another category,
the dispersal of these in coastal areas is affecting the native
species.
4. Pollution of the environment in general and from oil spills in
particularEnvironmental pollutions of all kinds such as sewage discharge,
domestic or industrial wastes or by oil spills create deleterious
effect on the coastal environment. Urgent attention is required to
be given to protect the different inshore habitats from human
interference to preserve species biodiversity. Oil spills generally
occur by accident either by collision of an oil tanker with another
vessel stationary or moving or the oil tanker running aground
along an indifferent pathway or by hitting submerged rock or
coral reef. In such circumstances the oil from the tanker gets
spilled into the marine environment causing damage to the
environment and killing large variety of fauna and flora. The
casualty includes all types of fishes, crustaceans molluscs etc.
including birds. Planktonic organisms are the first to be severely
affected. Depending upon the magnitude of pollution, the
environment gets non-functional for quite some time. Examples of
some well-known tanker-accidents seem important to draw
inferences and conclusion.
On the evening of 26 September 1974, an American oil tanker
TANSHURAN owned by Hudson Waterway Corporation and
chartered by U.S. Navy ran aground on the coral reef of Kiltan,
one of the islands of the Lakshadweep (Laccadive) Archipelago.
(Fig. 1)
3Threats to Biodiversity in Coastal Environment

It is reported that the disaster tool place because of some fire hazard
in the boiler room, because of which the ship lost control, began to
drift and finally hit the island. Several of its storage tanks got ruptured
and oil began to flow in the surrounding sea (see Qasim et. al. 1974,
for details). The ship was carrying furnace oil. It had sailed from
Bahrain and was bound for the Philippines. Kiltan is one of the 20
atolls of the Lakshadweep. (Fig. 2)
4 Journal of Coastal Environment
Fig. 2
Kiltan Atoll showing the relative position of the island, coral reef and lagoon.
The site where TRANSHURON ran aground has been indicated.
Fig. 1
Damaged oil tanker TRANSHURON lying
abandoned on the northern tip of Kiltan Atoll.

5
Fig. 3
A portion of the lagoon beach showing intense deposition of tar-like substance.
The volatile elements of the oil was evaporating and the thick tar like substance had seeped into the coarse white sand up to about 3-10 cm forming slicks. The south-western side of the atoll was also heavily contaminated with oil and the rock pools had thick layers of floating oil. Mortality of animals was fairly large and widespread. Dead fishes, crabs and holothurians were recorded several days after the spill. In the lagoon, dead plankton organisms and seaweeds were found floating at the surface in thick layers. The naval authorities made several aerial surveys to track the shoreward movement of the spilled oil and rescued the crew of TRANSHURON. The oil tanker was abandoned and it remained on the Kiltan site for more than one year when it was towed away.
On March 18, 1967, owing to a navigational error, the super-tanker
The oil tanker was carrying about 18,500 tonnes of furnace oil. Of
this, about 3,325 tonnes was spilled all over the atoll. The beautiful
beach along the lagoon had thick deposits of tar-like substance. (Fig.
Threats to Biodiversity in Coastal Environment

Torrey Canyon struck Pollard's Rock on Seven Stones reef between the Cornish mainland and the Sicily Isles causing disaster. The tanker was ill-equipped with navigational charts and used only the LORAN system instead of the more accurate DECCA Navigator. At that time, the tanker was the largest vessel ever to be wrecked. In an attempt to disperse the oil, the Royal Navy vessel used a detergent which was used for the first time and its toxicity was unproven with the result that it created further problems with the environment. The U.K. Prime Minister Harold Wilson and his cabinet decided to set fire to the remaining oil to avoid the oil disaster getting worse, but the efforts proved in vain. However, some 80 km of French and 190 km of Cornish coast of U.K. were seriously contaminated with 120,000 tonnes of dispersed crude oil and 10,000 tonnes of the toxic dispersants used. About 15,000 sea birds were killed, along with huge numbers of marine organisms including all fish within 1200 km radius. Much damage was caused by the intensive use of the so-called detergents.
The next oil spill worth mentioning was by the Liberian tanker Argo
Merchant which ran aground on December 15, 1976 on Fishing Rip,
29 nautical miles southwest coast of Nantucket Island, Massachusetts stin adverse weather conditions. On 21 December, the vessel broke into
two and thus spilling the entire cargo of 7.7 million gallon of No 6
fuel oil into the sea. Another vessel Amoco Cadiz ran aground in
stormy weather off the coast of Brittany, France on March 16, 1978,
spilling the entire cargo of 68.7 million gallons of oil into the sea and
thus polluting about 200 miles of Brittany coastline. Similarly, the 2-
mile-deep exploratory well, IXTOC I blew out on June 3, 1979 in the
Bay of Campeche, off Cindad el Carmen, Mexico. By the time the well
was brought under control, an estimated 140 million gallons of oil was
spilled into the bay. This is the largest spill of all time. On November
1, 1979, the vessel Burmah Agate collided with the freighter, Mimosa,
of Galveston Entrance in the Gulf of Mexico. The collision caused an
explosion and a fire that burned until January 8, 1980. An estimated
2.6 million gallons of oil were released into the environment and
another 7.8 million gallons were consumed by the fire. On March 24,
1989, the Exxon Valdez ran aground on Bligh Reef of Alaska. It spilled
10.8 million gallons of oil into the marine environment. The impact of
oil spill was felt up to 1,100 miles, which was the largest oil spill in
6 Journal of Coastal Environment

U.S. history. On September 16, 1990, the tanker JUPITER, while
offloading gasoline at a refinery caught fire and exploded. On
September 2009, the offshore drilling rig, Deepwater Horizon, capable
of drilling at a vertical depth of 10,683 metres, about 400 kilometres,
southeast of Houston, a blowout occurred, which caused fire, the
vessel sank, leaving the well gushing at the sea floor and causing the
largest offshore oil spill in U.S. history.
On August 2010, a catastrophic collision of MSC Chitra with another
merchant ship occurred at Mumbai Port, which resulted in spilling of
800 tonnes of bunker oil. Beside oil, its cargo contained hazardous
chemicals in 293 containers which fell from Chitra into the near shore
fishing areas around Mumbai harbour. Fishing was totally suspended
for several days until the effect of oil and toxic chemicals remained in
the environment.
The account given above gives a summary of the major oil spills
which occurred in the past in the inshore areas of the coastline of
India and elsewhere and which were dealt with different agencies.
The primary responsibility of dealing with oil spills in India has been
entrusted to the Indian Coast Guard Organisation which interacts with
the Indian Navy and several other institutions in close vicinity of the
inshore areas of oil spills as the situation demands.
Biodiversity and Climate Change (Global Warming)The global climate is changing at a rate unprecedented during the last
millennium due to atmospheric emissions from human activities. Its
ecological impacts are likely to result in massive alterations to marine
ecosystems. Changes in the climate, induced by human activities such
as carbon dioxide emissions, are unlikely to stop in the next few
decades. The coastal waters of North Atlantic from where some
reliable information is available have shown a warming trend.
Analyses of historical and survey data have shown some dramatic
distributional changes in Britain. Since global warming began to
accelerate in the mid 1980s, warm water species from the southern
regions from a wide range of taxonomic groups have extended their
northern limits pole wards. The southern limits of cold water northern
species have also, but not at the same rate, led to an increase in
biodiversity. Within the next 50-80 years, however, biodiversity is
7Threats to Biodiversity in Coastal Environment
likely to decline as the loss of species continues. At the moment,
biodiversity has shown mixed responses to climate change: some
species have responded negatively by reducing their geographical
range, declining in population size and changing their life history
attributes, while others have responded in the opposite way, and few
species have not shown any reaction at all to climatic variations
(Handerson, 2007).
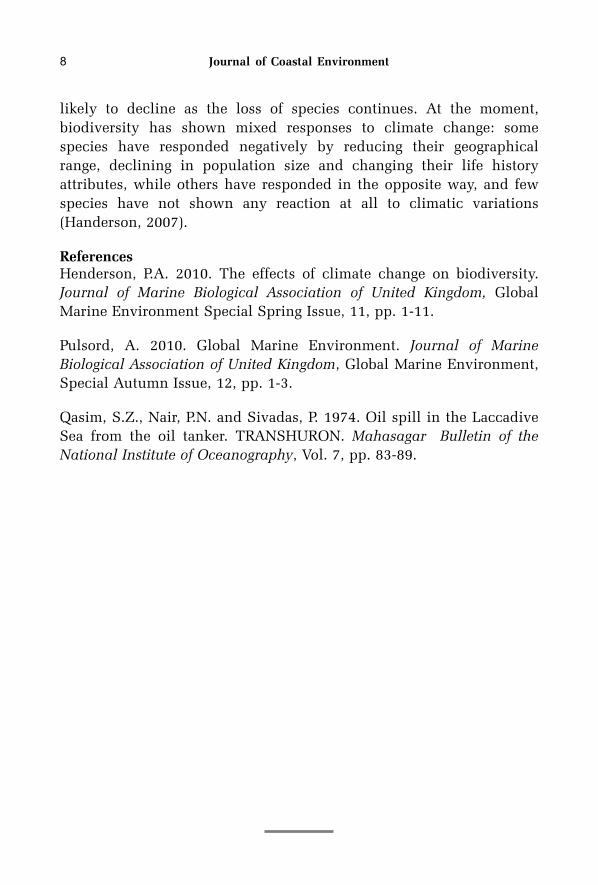
ReferencesHenderson, P.A. 2010. The effects of climate change on biodiversity.
Journal of Marine Biological Association of United Kingdom, Global
Marine Environment Special Spring Issue, 11, pp. 1-11.
Pulsord, A. 2010. Global Marine Environment. Journal of Marine
Biological Association of United Kingdom, Global Marine Environment,
Special Autumn Issue, 12, pp. 1-3.
Qasim, S.Z., Nair, P.N. and Sivadas, P. 1974. Oil spill in the Laccadive
Sea from the oil tanker. TRANSHURON. Mahasagar Bulletin of the
National Institute of Oceanography, Vol. 7, pp. 83-89.
8 Journal of Coastal Environment

The Lakshadweep : Islands of Ecological Fragility, Environmental Sensitivity
and Anthropogenic Vulnerability
P.S.B.R. James*
The delicate balance between the environment and development in Lakshadweep
islands is greatly hinged on to the complex fragile ecosystems with the livelihoods of
the islanders being dependent on coconut, fish and the coral reefs which are the
lifelines of the islands. The perceived environmental threats to the islands,
development and population growth might tend to weaken the symbiotic
relationship between the society and the environment, necessitating effective
implementation of the Environment Impact Assessment (EIA) Notification 2006.
The islands of Lakshadweep need an enlightened and science-based conservation
effort. The present widely disparate and incoherent approaches at coral reef
research in the country need to be coordinated and brought under an umbrella of
an exclusive Institute for Coral Reef Research and Management, with the ultimate
goal to ensure the preservation of the delicate ecology and the dependent
livelihoods of people of the island territories of the country.
IntroductionThe Union Territory of Lakshadweep, a group of 11 inhabited and 25
uninhabited tiny islands, is geographically isolated and segregated at
200-400 km. from the Malabar Coast along the west coast of India. The
only atolls in the Indian Union, they attracted the attention of
naturalists for centuries. In view of the vast marine resources of the
region, the Central Marine Fisheries Research Institute (CMFRI)
Cochin established a centre for research at the Minicoy Island in 1958.
* Former Director, Central Marine Fisheries Research Institute, Cochin.
Jour. Coast. Env., Vol. 2, No. 1, 2011
Abstract

Jones and Kumaran (1980) published a monumental treatise on fishes
of the Laccadive archipelago. The marine fisheries research conducted
in the Archipelago up to 1986 was briefly reviewed in a series of
articles incorporated in a special issue on Lakshadweep (Anon, 1986).
Fisheries and marine biological features and the pole and line tuna
fishery in Lakshadweep were described by James, et.al. (1987 a and b).
History of marine research in Lakshadweep was reviewed by James
(1989). The CMFRI carried out a comprehensive survey of the fishery
potential of the islands from January to March 1987 and published the
results in a bulletin (Anon, 1989) I n the following years and till date,
the institute and several other institutions, organization and
individuals have contributed significantly to the scientific knowledge
of terrestrial and aquatic resources and development of the islands.
Taking into consideration these recent observations as well as the
earlier background and personal knowledge and experience of the
author, the present paper attempts to highlight some important
ecological, environmental and human impacts on the islands.
Ecological FragilityThe archipelago consists of 12 atolls, three reefs and five submerged
banks. There are 36 islands, covering an area of 32 sq.km., which are 0 ' geographically isolated and segregated from the mainland (08 00 N
0 0 0and 12 30' N lat. and 71 00' E and 74 00'E long), about 200-400 km
from the Malabar Coast, the coral formations rising from depths
ranging from 1500-4000m. The islands scarcely rise 2m above the
surface of water.
Except Androth, which is the biggest island, all the islands have a
lagoon. Bitra is the smallest island with a large and magnificent
lagoon. Among the uninhabited islands, Suheli is a coconut growing
and fishing centre. Pitti or the bird island is a small reef with a sand
bank visited by thousands of birds for nesting, is designated a bird
sanctuary. The islands range in area from one ha. to nearly 440 ha.
The oceanic islands have a continental shelf of about 4336 sq.km, the
lagoon area of about 4200 sq.km, territorial area of 20,000 sq.km and
the EEZ of 4,00,000 sq.km accounting for 20% of the Indian EEZ.
Lakshadweep is one of the world's most spectacular tropical island
ecosystems. The marine ecosystem is extremely diverse, attributed to
10 Journal of Coastal Environment

geomorphologic and climatic variations along the coast. The precious
heritage of ecology and culture is supported by the extremely fragile
ecosystems. The major components are the coral reefs, logoons,
seagrasses, seaweeds, algae and mangroves. These delicate ecosystems
are inhabited by a wide variety of fishes, tunas, live-bait, octopus,
crabs, molluscs, sponges, echinoderms, other invertebrates, reptiles,
dolphins and whales. From the terrestrial side, the coconut
plantations, rodents and the birds play their roles. Brief notes on a few
important ecosystems are given below:
Coral reefs: Pillai and Jasmine (1989) identified a total of 103 species
of corals fewer than 37 genera from Lakshadweep; and Pillai (1996)
dealt with the coral reefs of India, their conservation and
management. Hoon Vineeta (1997) reviewed the extent, conditions,
research and management status of the coral reefs of India.
An extensive study from 1987 to 2005 on coral reefs of Mombasa
(Kenya) by the Wildlife Conservation Society and the University of
California at Santacruz, made a comparison of overfished reef systems
and fishery closed reef. In the former, sea urchins were the dominant
grazers where their predators, trigger fish and wrasses, were largely
absent. The grazing sea urchins reduced the abundance of crustose
coralline algae, a species of algae that produce calcium carbonate.
Coralline algae contribute to reef growth. By contrast, reef systems
closed to fishing have fewer sea urchins- the result of predatory fish
keeping urchins under control. Reefs with more sea urchins grew
significantly slower, than ones with more complete fish communities.
Herbivorous fish like the surgeonfish and parrotfish did impact the
growth rates of coralline algae in reef systems. They also remove
fleshy algae that compete with coralline algae. According to the study
(published in Ecology, Dec.2010), the grazing effect was found to be
stronger and more persistent than the strong El Nino that devastated
coral reefs throughout the tropics in 1998.
Management of coral reefs is included in the National Biodiversity
Strategy Action Plan 2004. The Wildlife Act of 1972 and 2002 prohibit
collection of corals and coral reef associated fauna. A few other Acts
also deal with conservation and management of coral reefs. The
management of coral reef ecosystems has also been affirmed in India's
11The Lakshadweep : Islands of Ecological Fragility, Environmental Sensitivity and Anthropogenic Vulnerability

National Conservation Strategy and Environment Action Plan (UNDP,
1997). The Indian Coral Reef Monitoring Network and the Indian
Coral Reef Initiative established in the 1990s also cover coral reef
management.
Lagoons: All the islands have lagoons, except Androth. The lagoon
ecosystem supports a wide variety of animals and plants that support
the livelihoods of people. They provide access to the islands through
navigation, which requires constant dredging to maintain the depth of
navigating channels. While it is an essential activity, it caused
irreparable damage to corals and other fauna and flora by
accumulation of silt and resultant sedimentation leading to chocking
of corals and ultimate mortality. The live-baits, important for tuna
pole and line fishing in the islands, abound in the lagoons and are
collected by fishermen. Reports indicated the live-bait resources
declined over the years, but attributed the damage to lagoon ecology
through human activities and pollution of the lagoon waters. High
human population pressure is said to have a direct effect on lagoon
resources. Hydrobiology of the lagoons indicated surface water 0
temperature ranged between 32 and 38 C, salinity 36 and 39.39% and
dissolved oxygen 2 and 6ml per litre. In most of the lagoons,
secondary production was very poor but biomass of zooplankton from
the seaward side of the lagoons was slightly higher, suggesting that the
oceanic zooplankton might be nourished by coral reef community.
Seagrasses: Seagrass zones are conspicuous in the lagoons of all atolls
except Bitra and Kiltan, forming dense beds alongside the islands in
calm zones (0.50-3.00 m depth). Six species of seagrasses, namely
Cymodocea rotundata, C.serrulata, Halodula uninervis, Halophyla
ovate, Syringdium isoetifolium and Thalassia hemprichii, the last
species being the most dominant (Vijay Anand, 1994) and Vijay
Anand and Pillai (2005; 2007).
Several associated marine plants and animals utilise seagrass habitat
for food, shelter and nursery grounds. According to Vijay Anand and
Pillai (2007), the most dominant fishes that occurred on seagrass beds
in juvenile stages belong to Acanthuridae, Apogonidae, Carangidae,
Chaetodontidae, Holocentridae, Labridae, Lutianidae, Mullidae,
Scaridae and Siganidae. Seagrasses act as safe habitats for young
12 Journal of Coastal Environment

fishes and they generally occur in shallow waters in Lakshadweep,
with large predators normally keeping away from shallow waters. In
the transitional stage, juveniles migrate from seagrass beds to adult
habitats (rubble, live and massive corals) after they have transformed
enough. Seagrass bed nurseries are susceptible for disturbance by the
operation of fishing nets and this may result in decline in the steady
supply of sub adults on to the adult-reef-habitats after transforming
from their juvenile stages (Vijay Anand & Pillai (2007). The structure
of major seagrass beds from three coral reef atolls (Agatti, Kavaratti
and Kalpeni) was studied by Jagtap (1998).
Seagrass beds harbour producers (seagrasses, gastropods, rays, sharks)
and grazers (urchins), suspension feeders (clams and tube worms)
detritus feeders (clams, worms), carnivores, (gastropods, rays, sharks),
other fish, turtles and dugongs. They also contribute to transportation
of organic materials to adjacent regions which form food for other
communities.
Seagrasses are threatened by several human and environmental
impacts. Seagrass beds constitute coastal ecosystems of great value but
are seldom given the attention or protection they deserve. Adequate
public awareness has to be created for conservation and management
of seagrass beds.
Seaweeds: Altogether 114 species under 62 genera of seaweeds were
recorded from Lakshadweep (Kaliaperumal et.al. 1989). The CMFRI
demonstrated seaweeds can be cultured at Minicoy Island. Siltation,
sedimentation, erosion, accretion, dredging, construction, effluent
discharge, sewage, grazing by fish and overexploitation are known to
cause damage to seaweeds.
Mangroves: These are limited to Minicoy Island only, on the
southeastern and southwestern sides of the island. Two species,
Bruguiera cylindri and Ceriops tagal occur. One site is land locked and
the other inundated by seawater (Nasser et.al.1999). In Lakshadweep,
the terrestrial activities are likely to impact the coastal ecosystems.
Reduction of these inimical impacts would depend on development of
suitable land use patterns. Transplantation of mangroves to Kalpeni,
Kavaratti, Bangaram and Suheli was suggested for their beneficial
attributes.
13The Lakshadweep : Islands of Ecological Fragility, Environmental Sensitivity and Anthropogenic Vulnerability

Marine ornamental fishes: Extensive observations were made on
these fishes by Vijay Anand (1994) and Murty (2002).He described the
distribution in space and time and determined stock sizes and catch
quotas of 165 species of fishes with the possibility of fishing a total of
8.6 million fishes per year. The lagoons are very shallow and easily
accessible. Therefore there are chances of overexploitation of
ornamental fishes within a short period and also cause damage to
corals and the environment. Only non-destructive methods like trap
fishing and hand net fishing by diving for capture of ornamental
fishes are suggested (Murty, 2002).
Birds: The birds of Lakshadweep play an important role in the
functioning of ecosystems. The common birds include the terns, grey
heron, curlew, golden plower and others. In an ornithological
expedition to the archipelago, various islands, sand flats and reefs
were surveyed in March 2006 by Satish Pande et.al. (2007). According
to them, Pitti and Cherbaniani islands attract local residents for guano
collection, during which time, eggs and nestlings of pelagic birds are
poached. Because of extensive coconut plantations on Bitra, Parli 1
and 2, Tinnakara, Suheli Veliakara and Cheriakara, the nesting sites on
these islands were abandoned. Due to the growing human population
and increased pressure on available land, uninhabited islands are
being opened for human activities to the detriment of bird
populations.
Ecosystem functioning: There are several components of the island
ecosystem which maintain the food chain. Particularly off the Minicoy
Island, upwelling takes place during the south-west monsoon period
(July-Sept), bringing up nutrient rich waters from the deep to the
surface which supports abundant life near the surface. A zone of
sinking causes loss of nutrients found in the open ocean. Runoff from
the land also enriches coastal waters. Excreta of oceanic birds,
especially the terns, form an important source of nutrients in the
euphotic zone of the sea increasing primary production through
photosynthesis. Euphasids form the staple food of small fishes, such
as sprats which in turn become the prey of tunas. The highly
productive and diverse coral formation of the islands help in land
building and providing ideal habitats for complex communities of the
sea, corals themselves living symbiotically with the unicellular
14 Journal of Coastal Environment

zooxanthellae. Crab populations, including the hermit crabs,
abundantly found in coastal areas and the shores play key role in
scavenging on the discarded and decomposing bodies of animals,
recycle the nutrients, thus forming a vital link in the food chain. They
also form prey of eels and other animals.
According to an ecological survey of the lagoons by Rodrigues (1996)
corals on reef flats and lagoons of uninhabited island were diverse and
dense. Most of the inhabited islands can be classified as endangered.
Environmental sensitivitiesBeing oceanic, small and far removed from the mainland;
geographically isolated and exposed, environment could be cruel to
the islands at times. Since they are surrounded by the vast open
ocean, they are subjected directly to storms, cyclones and heavy rains.
Their low level makes them vulnerable to sea level rise (even by about
two meters and the consequent impact) as an effect of the potential
global warming and climate change. The islands also face the risk of
inundation of sea water due to storm surges as well as tsunami waves.
Kalpeni and Androth were devastated, several people died and
coconut trees were destroyed during the great cyclonic storm of April
1847 (Mannadiar, 1997).
According to a national task force appointed by the Government of
India in 2005 for a special study of Lakshadweep to assess
vulnerability to various hazards and suggest mitigation / prevention
measures. In 1891 a violent storm struck Kavaratti, Agatti and its
attached islets and the Amindivi group of islands. Other major storms
were recorded in 1922 (Kalpeni), 1941 (Kavaratti), 1963 and 1965
(Androth), and 1977 (Kalpeni). The cyclone from 5-7 May 2004
affected Kavaratti, Amini, Kiltan, Agatti and Kadamat. Low lying areas
of some of these islands were inundated. On the east coast, breaches
10-30m in width and 1-1.5m depth were reported. They also impacted
the physical and social infrastructure and became a set back to the
pace of development of the islands. It was stated, within 115 years, 27
storms and depressions affected Lakshadweep during the Apr-Dec.
period. The tsunami of 2004 which affected several countries across
the globe had also caused minor impacts in Minicoy and Androth
indicating the vulnerability of Lakshadweep also to such phenomena.
15The Lakshadweep : Islands of Ecological Fragility, Environmental Sensitivity and Anthropogenic Vulnerability
Though earthquakes have not been reported from Lakshadweep,
information indicates the islands have moderate seismic activity.
Coastal erosion is one of the serious natural problems being faced by
Lakshadweep. About 200 running km of sea shore is stated to be
subjected to severe erosion according to the Centre for Earth Sciences
Studies (CESS), Thiruvananthapuram. The Space Application Centre
(SAC) mapped coral reefs and atolls of the entire Union Territory.
Lakshadweep is influenced by south-west monsoon winds. During
southwest monsoon, the maximum height of waves is 5m and in non-
monsoon time 1.4 m (CESS study). Data of the India Meteorology
Department indicate mean wind speed in Lakshadweep in May-Sept.
ranges between 6.10-9.25 knots in Minicoy and 7.35-12.54 knots in
Amini. Average annual rain fall is about 1640 mm (Minicoy) and 1504
mm (Amini).
Lakshadweep is on the trade route between Africa, Arabia and west
coast of India (Malabar). There has been a drastic increase in
passenger and cargo traffic across the seas when untreated wastes and
waste oil are discharged from oil tankers and ships into the sea. These
cause heavy pollution, resulting in damage to the coral reefs. Toxic
ocean pollutants, marine garbage, non-point pollutants like runoff
from land also add to environmental damage. According to a study by
the National Geophysical Research Institute (NGRI), Hyderabad,
around 25% decrease in growth rate (calcification rate) of hard corals
(Porites sp.) was observed between 1993 and 2003 attributed to global
warming caused by high levels of carbon dioxide.
In a study by the James Cook University, Australia (Ph.D. thesis), the
EL Nino southern oscillation of 1998 caused mass mortality of corals
in Lakshadweep due to anomalies in sea surface temperature (SST).
The observations indicated mixed pattern of recovery amongst corals
depending on the degree of exposure of sites to seasonal monsoonal
storms. Relatively low level of fishing despite high human population
densities has significant but completely unintended positive
consequences for the resilience of the reef. In a study by Rohan Arthur
(2005), four years after an EI Nino induced coral mass mortality in
Lakshadweep atolls, an event of unprecedented severity in 1998, in
six atolls to check if there were geographic trends in recovery patterns
16 Journal of Coastal Environment

across the archipelago. It was found live coral cover was relatively low
on most atolls and thin algal turfs dominated the benthos. Clear
benthic differences were apparent between eastern and western
aspects of reefs, pointing to the importance of local hydrodynamic
conditions in determining recovery rates. Where recovery was the
most apparent, it was dominated by fast growing and bleaching-
resistant coral genera. High herbivorous fish abundance was likely
responsible in controlling macrophyte levels and may be crucial for
further benthic recovery in these reefs.
Rucha Karkarey (2010) conducted a study to understand the effects of
loss of structure of reefs after the 2010 mass bleaching event on the
diversity and distribution of apex predators (groupers) in
Lakshadweep. In Lakshadweep, the mainstay of commercial fishing is
skipjack which has caused a great reduction in fishing pressure on
coral reefs. Due to low fishing pressure ambush predators like the
groupers (usually not targeted by fishers) are the dominant apex
predators on these reefs. Bleaching related loss of habitat may
negatively affect abundance and distribution of apex predators such as
groupers that use ambush for capturing their prey and thus rely
heavily on structure of reefs.
Coral bleaching or loss of colour from corals which are under stress
due to environmental conditions, especially the high water
temperature, probably due to global warming, was studied by the
Cochin University of Science and Technology (CUSAT) in
Lakshadweep. Corals live in symbiotic relationship with zooxanthellae
which give them a peculiar colour but expel them under stress. The
corals get a lighter colour or become completely white. They continue
to bleach even if the stresser is removed, taking weeks or months to
revive. They may be recolonised by the same species or others. Large
massive coral (Porties lobata) withstand extreme temperatures while
branching corals (Acropora) are far more susceptible to thermal stress
following bleaching event. Bleach resistance, coral tolerance, reef
recovery, patchy bleach shade are factors that protect corals against
mass bleaching. A stream of cold water can reduce risk of bleaching
and also health and genetics of coral and zooxanthellae can influence
risk of bleaching. Bleaching stress was also found in soft corals,
Tridacna (giant clam) and some sponges. Other ecological causes
17The Lakshadweep : Islands of Ecological Fragility, Environmental Sensitivity and Anthropogenic Vulnerability

triggering bleaching in corals according to the study include seawater
temperature drops or increase, seasonal cold air outbreaks, solar
irradiance, subaerial exposure, low tides, sea level drops, freshwater
dilution, inorganic nutrients, diseases, chemical contaminants, etc.
Heavy metal partitioning in five species of massive, ramose and
foliaceous corals was studied by Anu et.al. (2007). Highest
concentrations of all the trace metals (except Zn) were reported for
ramose corals in their skeletons. In tissues, all the metals showed
highest concentrations in the same corals. Results also showed
significant differences between metals and between species leading to
high skeleton / tissue- species interaction as well as skeleton / tissue
metal interaction.
Climatic conditions biofouling and bioerosion by boring sponges,
mollusks and sea-cucumbers cause extensive damage to corals.
Environmental damage sets in motion a chain of actions and reactions,
leading to depletion of coral and coral associated organisms and
proliferation of algae and other animals that thrive on dead and
decaying corals which also form a base for borers and bioerosion. The
resultant calcium sediments fill up the lagoons. Destruction of corals
impacts availability of live bait on which the pole and ling tuna
fishery depends. Fortunately, no large scale grazing by urchins on
calcareous algae was so far reported from Lakshadweep because there
has been no intense fishing on the reefs except for sustenance fishing
during monsoon. Amongst the predators of corals, the crown of thorns
starfish, Acanthaster plancii, although reported from Lakshadweep, as
well as from the Andamans, their populations have so far not been
reported to explode, as in some other countries.
Recolonisation and ecosystem improvement depends on several
factors like water currents, availability of planulae larvae, modification
of habitat and scale of destruction of corals etc. In Lakshadweep, in
order to rejuvenate and recolonise corals, there should be no further
interference with the reefs, dredging should be abandoned, erosion
should be effectively controlled and destruction of live corals should
be avoided.
The large scale mortalities of corals caused by El Nino in 1998 and
2010 across the globe, including Lakshadweep, call for rejuvenation,
18 Journal of Coastal Environment

recolonisation and restoration of coral habitats on similar lines as
done by the U.S in the Gulf of Mexico to re-establish the oyster beds
devastated by oil pollution in April 2010 since livelihoods of people of
the islands are hinged on to the resources of the atolls. Steps are
required to restore lost grounds by well known methods already
demonstrated by the Japanese for artificial propagation of corals.
Taking into consideration, the carrying capacity of the islands, the rich
biodiversity and the geologically unstable zones, certain Environment
Impact Assessment (EIA) norms were prescribed in the Ninth Five
Year Plan period (1997-2002) for Lakshadweep. Development and
population growth on the islands tend to weaken the symbiotic
relationship between the society and the environment. The islands
need enlightened and science based conservation efforts. Clean
environment in the islands can be maintained by adhering to the EIA
norms and implementation of the Provisions of Environment Impact
Assessment (EIA) Notification of 2006.
Anthropogenic VulnerabilityThe islands and the reefs support the livelihoods of people, providing
food, income, employment, shelter and protection. However, the
economic development of the islands over the years brought in its
wake, several anthropogenic vulnerabilities to the islands. Thus, the
delicate ecosystems and the unpolluted environment were brought
face to face with developmental activities. Land is very scarce but the
seas surrounding the islands are expansive. It would therefore be
imperative to carefully deal with land and land resources, develop
water resources sustainably. In the Lakshadweep, the inland and
coastal ecosystems are intimately connected. Terrestrial activities like
agriculture, deforestation, raising domestic animals, construction, road
laying and runoff from land lead to degradation of coastal ecosystems.
Thus, development of land use practices has a strong bearing on
ecosystem health.
The major economic activity is oceanic tuna fishing around the
islands. Pole and line tuna fishing is dependent on live bait collection
from the reefs and lagoons which are common property resources to
be shared by all. The reef fisheries were diverted for tuna fishing with
certain incentives and training. This indirectly helped the
19The Lakshadweep : Islands of Ecological Fragility, Environmental Sensitivity and Anthropogenic Vulnerability
conservation of reefs and their animal communities. The short term
goal should be to protect the reefs, fauna and flora and the long term
objective is to rebuild and extend the reefs for their sustainability.
However, quantitative studies on various aspects of corals and coral
reef communities are still lacking in Lakshadweep (Bakus, 1994).
These and other lacunae justify the establishment of an exclusive
institute for coral reef research and management in Lakshadweep as
proposed by the author about two decades ago to the Central
government. Hopefully, the crucial role such an institute could play
for the development of island territories would be realized someday.
While diverting away intense fishing activities from the reefs in
Lakshadweep helped to protect and preserve them, the fisheries
resources of the islands are grossly underexploited, mainly due to the
operation of only pole and line for tunas. The total fish production in
the year 2009-10 (CMFRI Annual Report) in Lakshadweep was 10,189t
of which tunas accounted for 8,254t and other fishes 1,925t., whereas
the total potential yield was estimated to be 1,00,000 t (tunas 50,000t
and other fishes 50,000t) according to the document on integrated
perspective plan for fisheries development of Lakshadweep (CMFRI,
CIFT, ICAR and Department of Fisheries, Lakshadweep). The
document also indicated average annual fish landings to be 11,000t of
which tunas formed an average of 6,000t (1995-2004). About 50% of
total tuna landing is used for masmin production, a boiled, smoked
and sun-direct product. The rest is consumed fresh.
Although pole and line fishing for tuna is internationally
acknowledged to be environment-friendly, it is constrained by
inadequate and inconsistent supply of live-bait fish, which is crucial
for its success. Therefore, for making full use of the national
resources, fishing in oceanic areas around Lakshadweep as well as in
international waters needs to be diversified and intensified, especially
by operating longlines, troll lines and gill nets to increase the tuna
catch (skipjack, yellowfin, frigate tuna and little tunny) and also of
other related fishes, sharks, perches, halfbeaks, fullbeaks, seerfish,
carangids, barracudas, red mullets, flying fish, cephalopods and
others. For harvesting these resources, necessary fishing vessels,
processing facilities and other modern infrastructure are required to be
developed.
20 Journal of Coastal Environment

Blasting and dredging the lagoons for deepening the navigational
channels damage the reefs and cause coral mortality. Removal of
corals from the shore and shingle extracted from the reefs and lagoons
endangered the reefs. Disturbing the surface soil, and mining of sand
stone were done for human needs. On the land, construction activity,
removal of vegetation, introduction of exotic plants, introduction of
cattle and goats, excessive application of pesticides on land and their
washing into the lagoons impacted the coastal waters. Throwing of
fish processing wastes and other organic matter into the lagoons and
on the shore upsets the pH of the water (turning acidic), thus affecting
the flora and fauna in lagoons. The isolated island economy is affected
by population pressure estimated to be around 1616/ sq.km. The
discharge from toilets entering the lagoons and open sea creates
unhygienic conditions for people and upsets the balance in nutrients
in the lagoons causing algal growth to compete with reef growth.
Dumping of garbage, plastic, batteries, electric glass bulbs, bottles,
cigarette cartons, cans etc. is prevalent on bird nesting islands of Pitti
and Cherbaniani. Lagoons tend to concentrate toxic wastes as they are
cut off from the sea.
Coconut production is the life-line of Lakshadweep. The industry tops
in productivity and output of copra and coconut oil, with highest
copra and coconut oil production in the world. The sector provides
livelihood and food security to over 61,000 people and protection to
coastal ecosystems. About 68% of cultivable land in the islands is
under coconut cultivation. The growth of the industry is reported to
be stunted mainly due to lack of allied manufacturing units, marketing
and value addition. Although rodent attack on the palms is rampant,
excessive use of rodenticides, (zinc compounds) was found ineffective
on the ground and when leached out into the soil and water, was
found to be toxic. It was suggested that coconut plantations should
not be permitted on uninhabited islands, especially the Pitti and
Cherbaniani islands which are important for bird nesting. Extensive
coconut plantations on Bitra, Parli1 and 2, Tinnakara, Suheli Veliakara
and Cheriyakara resulted in their being abandoned as nesting sites by
the birds (Satish Pande, et.al., 2007). Frequent visits by tourists and
fishermen to Suheli Pitti Island drove away nesting pelagic birds.
Poaching of eggs of marine turtles is also known. Turtles are killed by
21The Lakshadweep : Islands of Ecological Fragility, Environmental Sensitivity and Anthropogenic Vulnerability
fishermen for oil used for painting fishing boats. Cutting of indigenous
vegetation decreases the availability of sandy beaches for turtle
nesting. It was recommended to declare some of the uninhabited
islands as sanctuaries, conduct monitoring and surveillance of bird
populations, disallow habitat modifications, ensure effective
monitoring by Coast Guard and their exposure to ecology of the
islands ban the use of rodenticides, control pollution of land and
water through waste disposal and create public awareness of the
importance of ecology of the islands (Satish Pande, et.al., 2007).
Tourism development offers immense potential in the islands. The
islands are endowed with the beauty of the coral reefs, sandy beaches,
lagoons and unpolluted clear water. The reefs teem with colourful
organisms of various kinds providing opportunities for recreation,
sport, fishing, rowing, diving, snorkeling and other waterborne
activities. However, only tourism that is consistent with the ecology
and fragile nature of the surroundings can be promoted. Since the
island ecology is very sensitive, monitoring of environmental impact
of coastal tourism is essential. The perceptions of coral reefs differ
according to the priorities of the people in contact with the reef.
Navigators, tourists, industrialist and others view the reefs differently
and use them accordingly. These common property resources can
generate conflicts and hence require monitoring and management
(Hoon Vineeta, 1997).
The interactions between the community and the coral reef eco-
system raise questions as to who are the main stakeholders and
whether conflicts are arising due to different priorities of the users
(Hoon Vineeta, 1997). Declaration of sanctuaries, biospheres and
marine protected areas (MPAs) could conflict with the interest of the
communities. Participation of the reef stakeholder's in planning and
implementation of MPAs is essential for their long term success. The
poor are often excluded from programmes on coastal resource
management and conservation although they depend on these
resources in complex ways. Coastal Regulation Zone (CRZ)
notification 1991 is the only legal protection to the reefs. Under the
CRZ-IV, there are restrictions on materials to be used for construction,
dredging and blasting, beach resorts / hotels etc. However, there are
22 Journal of Coastal Environment

implementation problems of the regulations, lack of trained man
power and difficulties in monitoring reefs underwater. The marine
protected areas are under the forest department who have very little
knowledge of coral reef ecology. Corals are not yet covered under the
Wildlife Protection Act 1972. There is a recent move to exclude the
Andaman and Nicobar Islands and Lakshadweep from the CRZ
notification 1991 and bring them under a separate Island Protection
Zone notification with no specific regulatory provisions for tourism.
Tourism should come under strict control of the law to protect the
fragile ecosystems in Lakshadweep (Hoon Vineeta, 1997). The present
author is also of the opinion, even if some safeguards have been put in
place by the administration, careful monitoring of all human
activities, including those of tourists and strict implementation of
rules and regulations are essential for the prosperity of Lakshadweep.
ReferencesAnon, 1986. Marine Fisheries Information Service, Technical and
Extension Series, CMFRI, Special issue on Lakshadweep, No.68, 66 pp.
Anon, 1989. Marine living resources of the Union Territory of
Lakshadweep an indicative survey with suggestions for development.
CMFRI Bulletin, Vol.43, 256 pp.
Anu, G., Kumar, N.C., Jayalaxmi, K.V. and Nair, S.M., 2007.
Monitoring heavy metal portioning in reef corals of Lakshadweep
Archipelago, Indian Ocean. Environmental monitoring assessment.
Vol.128, Nos.1-3, pp: 195-208.
Bakus, G.J., 1994 (Ed). Coral reef ecosystems. Oxford and IBH
Publishing Co. Pvt. Ltd., New Delhi, India, 232 pp.
Hoon, Vineeta. 1997. Coral reefs of India: review of their extent,
condition, research and management status. Proceedings of FAO
Regional Workshop on the conservation and sustainable management of
coral reefs. M.S. Swaminathan Research Foundation, Chennai, India,
Bay of Bengal Programme (FAO), Chennai, India.
Jagtap, T.G. 1998. Structure of major seagrassbeds from three coral reef
atolls of Lakshadweep, Arabian Sea, India. Aquatic Botany, Vol.60, pp:
397-408.
23The Lakshadweep : Islands of Ecological Fragility, Environmental Sensitivity and Anthropogenic Vulnerability

James. P.S.B.R., Pillai, P.P. and Jayaprakash, A.A., 1987a. Impressions
of a recent visit to Lakshadweep from the fisheries and marine
biological perspectives. Marine Fisheries Information Service, Technical
and Extension Series, CMFRI 72, pp: 1-11.
James, P.S.B.R., Gopakumar, G. and Pillai, P.P., 1987b. Small-scale pole
and line tuna fishery in Lakshadweep-present trend, constraints and
strategies for future development. CMFRI 77, pp: 1-10.
James, P.S.B.R., 1989. History of marine research in Lakshadweep.
CMFRI Bulletin, 43, pp: 9-25.
Jones, S. and Kumaran, M., 1980. Fishes of the Laccadive Archipelago.
Nature Conservation and Aquatic Sciences Service, Trivandrum, 760
pp.
Kaliaperumal, N., Kaladharan, P. and Kalimauthu, S., 1989. Seaweed
and seagrass resources. CMFRI Bulletin, 43, pp: 162-175.
Mannadiar, N.S (Ed.) 1977. Lakshadweep: Gazetteer of India.
Administration of Union Territory of Lakshadweep, Kavaratti, 375 pp.
Murty, V.S., 2002. Marine ornamental fish resources of Lakshadweep.
CMFRI, Spl. Pub, 72, 134 pp.
Nasser, A.K.V., Kunhikoya, A. and Aboobaker, P.M., 1999. Mangrove
ecosystems of Minicoy island, Lakshadweep. Marine Fisheries
Information Service, Technical and Extension Series, CMFRI, No.159,
pp: 8-10.
Pillai, C.S. Gopinadha and Jasmine, S., 1989. The coral fauna of
Lakshadweep. CMFRI Bulletin 43, pp: 179-195.
Pillai, C.S. Gopinadha. 1996. Coral reefs of India: their conservation
and management. In (Menon, N.G. and Pillai, C.S.G. (Eds). Marine
Biodiversity, Conservation and Management, CMFRI, Cochin, India, pp:
16-31.Qasim, S.Z. and Bhattathiri, P.M.A., 1971. Primary productivity of a
seagrass bed on Kavaratti Atoll (Laccadives). Hydrobiology, 38, pp: 29-
38.
24 Journal of Coastal Environment

Qasim, S.Z., Nair, P.N.R. and Sivadas, P., 1974. Oil spill in the
Laccadives from the oil tanker “Transhuron”. Mahasagar, 7, Nos.1 & 2,
pp: 83-91.
Rodrigues, C.L., 1996. Taxonomic and ecological survey of the
Lakshadweep for Perumal Marine Park. Project completion report,
Department of Marine Sciences and Marine Biotechnology, Goa
University, 46 pp.
Arthur, Rohan, 2005. Benthic recovery four years after an EL Nino-
induced coral mass mortality in the Lakshadweep atolls, Current
Science, Vol. 89, No.4, pp: 694-699.
Karkarey, Rucha, 2010. Assessing the effects of mass coral bleaching on
an apex predator guild (groupers) of the Lakshadweep Islands. A
project report.
Pande, Satish, Sant, Niranjan R., Ranade, Satish D., Pednekar,
Shivkumar N., Mestry, Premsagar G., Kharat, Sanjay S. and Deshmukh,
Vaibhav, 2007. An ornithological expedition to the Lakshadweep
Archipelago. Indian Birds, Vol.3, No.1.
Vijay Anand, P.E., 1994. Studies on some aspects of biology of coral reef
fishes of Lakshadweep with observations on other coral reef ecosystems
in the seas around India. Ph.D. Thesis, Cochin University of Science
and Technology, 454 pp.
Vijay Anand, P.E. and Pillai, N.G.K. 2005. Occurrence of juvenile
fishes on the seagrass beds of Kavaratti atoll, Lakshadweep, India.
Indian Journal of Fisheries, Vol.52, No.4, pp: 459-468.
Vijay Anand, P.E. and Pillai, N.G.K. 2007. Coral reef fish abundance
and diversity of seagrass beds in Kavaratti atoll, Lakshadweep, India.
Ibid, Vol.54, No.1, pp: 11-20.
25The Lakshadweep : Islands of Ecological Fragility, Environmental Sensitivity and Anthropogenic Vulnerability

26 Journal of Coastal Environment

Oil Pollution and its Impact on Fisheries*
P. 1 2Muhamed Ashraf and B. Meenakumari
Economic liberalisation has increased the export and import business between the
countries. India and china emerged as two important growing economies and this
has increased oil consumption, its transport through the sea and oil exploration.
This has led to higher risk of oil pollution in the oceanic waters through accidental
spill, ballast water discharges, bilge oils by fishing fleets and river water runoff. 12
oil spill incidents were reported during 2005-2010. Oil spills can affect fisheries
resources in many different ways. There can be direct effects on fish populations
and fisheries, interference with fishing activity and indirect effects through
perturbations in the ecosystem such as impacts on trophic chains. Oil-tainted
seafood is unpalatable even at very low levels of contamination which provides a
safety margin in terms of public health. Fishery closures can be imposed after an oil
spill in order to prevent or minimize fishing gear contamination and to protect and
reassure seafood consumers, which can continue until visible sheen test and
sensory tests for oil induced taint turn negative. The paper highlights impact of oil
spill on fisheries and its management measures.
IntroductionOil pollution has been receiving increasing attention since the middle
of the 19th century with the increase in tanker operations and oil use
and frequent marine tanker collisions and accidents resulting in oil
spills. Oil pollution is a major concern nationally and internationally.
India and China assumed to be the major emerging economy in Asia
* Paper presented in the National Seminar on “Coastal Pollution: Mitigating Threats from Oil Spills”, New Delhi, Centre for Ocean and Environmental Studies, May 6-7, 2011.
1 Scientist, Central Institute of Fisheries Technology, Cochin. 2 Deputy Director General, Indian Council of Agricultural Research, New Delhi.
Jour. Coast. Env., Vol. 2, No. 1, 2011
Abstract

and increasing consumption of oil has influenced number of oil
tankers along the Arabian Sea. The oil consumption during 2005 was
84 b/day and it will become 116b/day by 2030 [1].Human-mediated
sources of petroleum hydrocarbons include offshore oil production,
marine transportation, atmospheric or aerial depositions from
combustion of coal and gas flaring, direct ocean dumping, coastal,
municipal and industrial wastes, and runoff [2].Several major oil and
gas companies operating in India for oil exploration and some of them
are Oil and Natural Gas Corporation, Oil India Ltd, Canoro Resource
Ltd, Geoenpro Petroleum Ltd, Jubilant Energy, Geopetrol International
Inc. and Premier Oil. The Ministry of Environment and Forests
(MoEF), Government of India has accorded environmental clearance
(EC) for drilling over 400 exploratory wells to ONGC and about 100
exploratory wells to the Oil India Limited [3].
The west coast of India (Arabian Sea) has a coastline of 3700 KM and
is exposed to the risks of oil pollution on account of the heavy
transportation of crude oil by Tankers, exploration of offshore oil wells
and movement oils within the country. With ca. 5000 ships berthing
annually, the Mumbai Port is among the busy ones. These ships were
exchanging ca. 50 million tons ballast water within the premises of
Mumbai port. Sources of oil pollutions are accidental oil spills,
refinery operation, offshore production, normal operation of oil-
carrying tankers, merchant and naval vessels, the disposal of oil waste
materials, natural seepage of oil from underwater oil reservoir and
evaporation of oil to the atmosphere and its precipitation on the sea
surface. Both the east and west coast of India are reported to show
pollution due to oil spillage.
About 2 million barrels of oil are spilled annually from the routine
discharge of dirty ballast waters and tank washing, partly due to the
lack of shore reception facilities. Toxicity and physical damage from
clean-up operations, remains a problem, though responsible and
appropriate use of dispersants and sorbents can result in substantial
benefits [4]. Oil pollution accounts for 0.51.51% total organic carbon
(TOC) compared to the 0.5 natural background levels. Data by Al-
28 Journal of Coastal Environment

Ghadban, et. al. [5] showed an increase in TOC to 2.8%, which results
in shifts in planktonic populations from diatoms to flagellates
dinoflagellates and benthic algae. Besides increasing primary
production, benthic algae may out-compete corals and other reef
building organisms [6]. Spilled deposits may persist for many decades
[7]. The enormous volume of ballast water from tankers may have
introduced exotic biota; for example there has been an increase in
recorded dinoflagellate species from <40 in 1931 to ~200 species in
1996 [8]. Detailed investigation about this subject is initiated by
international and national agencies [9].
Apart from accidental spills, oil pollution occurs during routine
operations such as loading, discharging and bunkering, which are
normally carried out in ports or at oil terminals. Concerns have arisen
recently about the number of illegal discharges from the large volume
of shipping within the region. After evaporation of the lighter fractions
of oil and photo-oxidation, the heavier fraction gradually forms into
tar balls. Driven by wind and current, these tar balls are deposited on
the beaches. Periodic tar ball and raw oil pollution is observed at all
the major beaches, mainly during the onset of monsoon and
sometimes throughout the year. The life of tar balls in the sea varies
from 33 to 58 days, while the same is not yet known for the beaches.
However, due to the half yearly changes in surface circulation, these
tar balls are deposited along the beaches of India [10].
Oil spill in the world
An oil rig Deep water Horizon owned by BP in the Gulf of Mexico was
undergone explosion during April 2010 and it took more than 3
months to contain the oil flow. It was the biggest oil spill ever the
world faced and 1600 to 2400tons per day of oil spilled to the sea
(official claim was 800tons). This oil spill was considered to be one of
the worst environmental disasters in the American history. Another
similar incident was happened during 1979 due to the blow out of
Ixtoc I platform in the Bay of Campeche. The containment of spill was
taken 9 months and close to half million tons of oil were released to
the sea [28, 29].
29Oil Pollution and its Impact on Fisheries

The oil spill incident was very common during 1970s and the average
oil spilled in the ocean was about 0.3 million tons per year, with no
single year below 0.13 million tons. In the first decade third
millennium it was reduced significantly to 0.02 million tons per year
with no single year above 0.06 million tons (Oil Tanker Spill Statistics
2009, http: / /www.itopf.com/information-services/data-and-
statistics/statistics/documents/Statspack 2009 -FINAL.pdf.). During the
year of 2009 oil spilled to the ocean was only 100 tons and it was
significantly low. This was mainly because of introduction double
hulled tankers, sectioning of cargo hold, establishment of sea lanes
especially in the Malacca straits, narrow channels, English Channels
and strict monitoring of ship movement through satellites and other
new technologies. Strict monitoring of near shore areas and territorial
waters of developed countries have successfully reduced the other
types of discharges like ballast water, bilge water discharge etc. The oil
30 Journal of Coastal Environment
Fig. 1
The Gulf of Mexico in 3D perspective indicating
the location of the two marine blowouts.Source: NOAA
(http://oceanexplorer.noaa.gov/technology/tools/mapping/media/gis_gulf.html)

pipeline ruptures and leakage incidents were increased during the last
four decade and it was 47 incidents during 70s and now it was more
than 350 per year (U.S. Minerals Management Services 2010). This
was mainly attributed to the ageing of pipelines, poor maintenance,
increased length of pipelines etc. There is not much marine blow out
after 1980s and major blow out was happened during 2009 and 2010.
Montara oil well, Australia spilled 20000 tons of oil in 2009 and the
recent deep horizon incident as described earlier. The recent
advancement in drilling technologies has kept the blow out number to
a minimum. After the Torrey Canyon spill there was no quantification
with regard to the damage done on populations of fishes, crustaceans,
and molluscs, but the overall effect on fisheries was seen as mild [30].
Oil spill in Indian scenarioIndian waters experienced 21 numbers of oil spill from 2000 to 2010
and the data from 2005 is given table 1.One of the recent oil spill
occurred in Gopalpur district of Orissa by an Essar owned Vessel M V th
Malavika collided with barge on 12 April 2010 and fuel oil was
spread in wider area ranging from Arjipalli to Rushikulya river mouth
about 20km from port. The Rushikulya rookery is known mass nesting
site of Olive ridley turtles Lepidochelysolivacea (F. Cheloniidae)
[11].Oil rapidly spread to a stretch of 2030 km towards the river
mouth and over a 7 sq. km area off the beach, 200 m away from the
river mouth where the olive ridleys had laid eggs in March 2009.
Some of the oil also reached the sands of the nesting grounds at
Gokharkuda and Kantigada beaches. This stretch is one of the three
mass nesting sites of olive ridleys. The spill also led to death of fishes
and may have affected the fish breeding sites, which is likely to affect
the turtles feeding on live fish. According to the report about 155000
Olive ridley turtles were nested along the coastline of Rushikulya
rookery and contrary to the fears of the effect oil spill risk, thousands
of hatchlings were found entering into the sea during the month May
2010. It was feared that there occurred mortality of hatchlings but
there was little impact due to the oil spill probably due to the nature
of spilled oil was non persistent.
On 30 May 2006, a bulk carrier, MV Ocean Seraya ran aground along
the Karwar coast spilling 650 tonnes of oil. Due to the rough SW
31Oil Pollution and its Impact on Fisheries

monsoon, the spill spread to some beaches in south Goa. Intertidal
sampling was carried out on 10 June 2006. Organic carbon (1%) and 1
petroleum hydrocarbon (13 ìg g ) were highest at Polem, as it was
closest to the spill site. Twenty macrobenthic taxa which included
crustaceans and bivalves were identified. A review of the oil spill data
indicates that accidental spills have shown a decline globally, in
contrast to increase in maritime transport. However, a reverse trend
was observed along the Indian coast for the Arabian Sea. Further,
majority of the spills occurred during the SW monsoon period, which
coincided with the recruitment period of most commercial and non-
commercial species. Therefore, although the spills occurring along the
west coast are of small volume, frequent occurrence, particularly
during the critical stages of the life cycle of organism, may have a
long-term impact on the marine biota [10]. Due to the monsoon winds,
the impact of the slick was also visible more than 20 km away in
south Goa at Palolem and Canacona.
Year Quantity (t) and position Vessel/ others
Mar 2005 110 Off Aguada Lighthouse, Goa MV Maritime Wisdom
Jun 2005 49,537/cargo and 640/FO MV Jinan VRWD-5Vishakhapatnam Port
Jul 2005 350 m3 base lube oil Mumbai Harbour Dumb barge Rajgiri
Jul 2005 33/FO NE of Paget Island (N. Andaman) MV Edna Maria
Jul 2005 80 Off Prongs Lighthouse, Off Mumbai OSV Samudra Suraksha
Aug 2005 9 n mile off Tuticorin MV IIDA
Sep 2005 100 Off Visakhapatnam MV Royal Ocean 2
May 2006 650/FO Oyster rocks, Karwar MV Ocean Seraya
Aug 2006 4500 Great Nicobar Island Bright Artemis
Oct 2007 137 Jakhau MV Star Leikanger
Aug 2009 200 S Gujarat and N Maharashrta Unknown
April 2010 08 Gopalpur Orissa MV Malavika
Oil spill incidents in Indian coastal waters during the period of 2005- 2010Source: 1) “Blue waters” Indian coast guard Newsletter; 2) Sivadas et al. 2008 [10]
32 Journal of Coastal Environment
Table 1

Hydrocarbon concentration in Indian waters and fishesOil pollution in coastal waters has higher impact on recreational and
commercial fisheries. Large oil spills risk the sustainability of coastal
fishery resources. Juvenile and adult fish are generally able to avoid
oil slicks in open seas. However, the rapid advection of large volumes
of oil into estuary and embayment can trap fish populations,
culminating in substantial fish mortality [12].Studies on oil pollution
in the aquatic environment exhibited that aquatic organisms can bio
accumulate petroleum hydrocarbon fractions[13].
According to the studies [Ref Nos. 12 & 14], the adult fish can tolerate
much higher concentrations of hydrocarbons than egg and larvae.
Toxic signs of oils manifested in adult fish are, heart beat rates,
respiratory rate, gill hyper plasmia, enlarged liver, reduced growth and
impaired endocrine system, behavioral changes and alterations in
feeding, migration, reproduction and schooling. Penetration of oil into
the fish is mainly through the gill or skin. Tar balls and other
contaminants ingress through the intestine by water gulped in the
physiological process of desalination. Although human health had not
been considered to be at risk from concentrations of petroleum
hydrocarbons in fish, the possible consequences of bioaccumulation
cannot be ignored especially in communities consuming large
quantities of fish [15].Studies of the accidental and intentional
releases of petroleum-based products to the aquatic environment
indicate that aquatic organisms are able to bioaccumulate some total
petroleum hydrocarbon (TPH) fractions, particularly polycyclic
aromatic hydrocarbons [16, 17].
Petroleum hydrocarbons are among the most common contaminants
bound to estuarine sediments [17, 18].Some heavier petroleum
fractions are capable of accumulating in environmental substrates.
This can lead to stress on bentho-pelagic organisms [19]. The effects
of hydrocarbon laden sediments on flatfish tissue and the fish itself,
particularly the juvenile stage have been reported by Moles and
Norcoss [20].
Sengupta, et. al. [21] studied the hydrocarbon concentration in the
Arabian Sea and it was ranged from 1.8 to 11.1 mg/l in water, 1.84 to
5.81 mg/g dry weight in sediments and 0.33 to 3.67 mg/g wet wt in
33Oil Pollution and its Impact on Fisheries

fish [21]. Qasim and Sengupta [23] had detailed study on dissolved
and dispersed hydrocarbons in the upper 20m of Bay of Bengal and
Arabian Sea and the concentration of hydrocarbon in different years
was given in Table 2.
Veerasingam, et. al. [23] studied the concentration of petroleum
hydrocarbons in important fish species of Tamilnadu reported that the
hydrocarbon levels were lower than the prescribed limit. Petroleum
hydrocarbons (PHC) residues in ten fish species along Tamilnadu
coast varied between 0.52 and 2.05 ìg/g (wet wt). Among the ten fish
species, S. longiceps has a high PHC concentration from all locations.
This study suggests that S. longiceps can be used as a good biological
indicator for petroleum hydrocarbon pollution in water.
34 Journal of Coastal Environment
Hydrocarbon concentration in the Arabian Sea and Bay of Bengal [23]
Table 2
Arabian Sea. Concentration Range (µg/Kg)
1978 0.9 - 42.5 24.31 0 - 28.2 17.14
1979 10.4 - 41.6 24.48
1980 2.4 - 9.0 5.28 1.2 - 27.4 12.47
1981 0 - 2.8 1.40
1983 0 - 17.7 5.02
1984 0 - 3.4 1.70
1985 0.65 - 31.0 7.64
1986 1.0 - 23.5 7.5
Year
Range RangeMean Mean
Bay of Bengal. Concentration Range (µg/Kg)
Oil spill and its impact in Indian fisheriesThe marine fish landing was about 3million tonnes during 2010 and
fish catch was increased recent years. This was attributed to advanced
gears, mechanized trawlers and improved forecasting techniques [24].
Contrary to the above statement, landing in the Indian Ocean region
and worldwide decreased significantly recent years. It is difficult to
pin point a single pollutant and oil pollution may be one of the reason
for fluctuation in fish catch, as hydrocarbons can greatly reduce the
individual organisms chances of survival [25]. Studies of Garcia et al

[26] showed that the landings of some of the species were increased
where as some decreased after Prestige oil spill in Galicia. It is clear
that the landings were decreased by 17.1% after the accident.
However, no homogeneous patterns in landing behaviours have been
identified. Some species clearly diminished while others increased.
This second pattern might be mainly the response to the harvesting of
mature individuals present at the moment of the accident, to the
exploitation of new species or to a possible increase in the fishing
effort. It was observed that a disruption in the cycle of landings after
the oil spill, after modeling a scenario in the absence of the accident.
Fishing and aquaculture industries are mainly affected if any oil spill
occurs in the marine environment. Commercially important fishes and
other animals will be damaged due to oil smothering and toxicity of
oil. A variety of factors influence the impact of oil spill and it is very
difficult to pin point specific characteristics to draw final conclusion.
In general, toxic effects of oil on marine life depend on the duration of
exposure and oil concentration. Fishes from oil spilled or
contaminated areas will acquire an oil derived taste called tainting or
it becomes physically contaminated. Adult free-swimming fish, squid,
shrimp and wild stocks of other commercially important marine
animals and plants seldom suffer long-term damage from oil spill
exposure. This is because oil concentrations in the water will only
rarely reach sufficient levels to cause harm. Huge economic loss are
also due to contamination of fishing gears, fouling of boat hulls with
oil, affect tourism, loss of confidence in the market and halting of
commercial fishing and thereby livelihood of fishers. Shoreline
cultivation like oyster racks, shell fishes, cages etc are more
vulnerable due to oil pollution. Fishes in the captive environments
like tuna fattening, fishes grown bigger cages in the ocean etc. will be
exposed to more stress. The cultivation of seaweed, fish, crustaceans,
molluscs, echinoderms and sea squirts frequently involves the use of
onshore tanks to rear the young to marketable size, or to a size and
age suitable for transfer to the sea. These facilities require pumping
sea water frequently and these intakes occasionally may be under
threat from sunken oil or dispersed oil droplets. This will contaminate
pipes, tanks and the loss of cultivated stock.
Filter feeders and fatty fishes has higher tendency to absorb
hydrocarbons and their flesh becomes oily in taste. This will decrease
35Oil Pollution and its Impact on Fisheries

the public confidence on seafood. It is very difficult to evaluate the
concentration of tainting agents since many are unknown and there
are no threshold values. Properly conducted sensory tests can judge
whether the seafood is fit for human consumption. The aromatic
fractions of oil contain the most toxic compounds, and amongst these
it is the 3- to 7-ring polycyclic aromatic hydrocarbons (PAH) that
command particular attention. Some of the PAH fraction is
carcinogenic and not much has been done on the risk evaluation,
frequency and duration of the PAH exposure. Generally it is
concluded that oil spill derived PAH contamination of seafood is not a
significant threat to the public health, even for subsistence consumers.
The major impact due to oil spill was smothering in the shoreline
animals since the tidal rise and fall exposes more to the edible
seaweeds and sea urchins. Apart from mortality oil may cause more
subtle long term damage to behavior, feeding, growth or reproductive
functions. Oil spill damage may more aggravated by indiscriminate
use of dispersants, which will expose animals and plants more with
oil droplets. Physical barriers like booms are employed to protect fixed
fishing gear aquaculture facilities. The entry of oil to the aquaculture
cages, gears and floats were mainly prevented by spreading plastic
sheets around the perimeter of the cages. Sorbent booms also used for
removal of oil sheens from water and tank surfaces. However, oil-
saturated sorbents should be replaced regularly to avoid them from
becoming a source of secondary pollution. Utmost care must be taken
when considering remedial methods in the vicinity of fishery
resources since most of the clean up procedures will cause additional
damage.
Management in aquaculture areas during oil spill
1. Shifting the floating cages away from oil slick.
2. Suspend sea water pumping to the shore tanks and hatcheries
temporarily and increase recirculation in the tanks. Also suspend
feeding since there is a chance contamination by floating oil.
3. If feared oil contamination, early harvesting of stock is advised. At
least the farmer will fetch some value to make up his loss.
36 Journal of Coastal Environment

Management of Fishing and Harvesting BansA variety of management strategies are available to prevent or
minimise oil pollution impact on the fisheries sector. The simplest
involves no intervention beyond monitoring the evolution of an oil
spill and any threat to seafood quality. Low-key intervention can take
the form of advisory information or the issuing of guidelines to the
seafood industry. Fishing and harvesting bans can be imposed after an
oil spill in order to prevent or minimise fishing gear contamination
and to protect or reassure seafood consumers. This can be done with
voluntary suspension by fishermen or by closure of the market. The
fishermen can be suitably compensated by way of sufficient free
ration and food items during the ban period.
Fishing ban is withdrawn once there was no visible oil or sheen, and
there is no problem with sunken oil. Credible decision-making with
respect to fishing and harvesting bans should be based on sound
scientific principles and common sense. Knowledge of fishery
resource management is essential, as is in understanding of oil
pollutants, their physical and chemical characteristics, and
background levels of contamination, both locally and nationally.
Seafood consumption patterns and seasonal variations in availability
will further help define a public health risk profile and allow
regulators to form a considered opinion on risk management. It is vital
to determine the criteria which will be applied for reopening a fishery
before a ban is put in place, and they need to be realistic in terms of
the normal seafood quality in the area. It is unrealistic to set criteria
which are unachievable, such as open ocean background PAH
concentrations. Seafood quality managers need to strike a balance
between the need to inform and protect the public and the risk of
raising unnecessary fears. Preferred strategies will reflect cultural and
administrative traits in different countries. The media can play a
valuable role in promoting a rational reaction to temporary
disruptions. Remote sensing techniques can be employed for
monitoring the oil spill [27].
Clean up of oilThe three fundamental strategies for addressing spilled oil were
adopted i.e. contain it on the surface, away from the most sensitive
areas, to dilute and disperse it in less sensitive areas, and to remove it
37Oil Pollution and its Impact on Fisheries

from the water. The Deepwater response employed all three strategies,
using a variety of techniques. The response included deploying many
miles of containment boom, whose purpose is to either corral the oil,
or to block it from a marsh, mangrove, shrimp/crab/oyster ranch or
other sensitive area. Booms extend 1848 inches (0.461.2 m) above and
below the water surface and are effective only in relatively calm and
slow-moving waters. The government of India has given prime
importance regarding the threat of oil spill, hence they acquired
variety of equipments to contain oil spill. Some of the management
measures of oil spill taken by Indian coast guard are shown below.
Indian coast guard acquired facilities to contain oil spill like recovery
of low and high viscosity of oils, jet water system, skimmer and
inflatable primary arm system.
Conclusion
lEconomic liberalization led to the import of oil and movement
of tankers in the east and west coast of India.
lOil spill, ballast water discharge and pipeline ruptures are the
major threats to the marine environments.
lIndia also experiences frequent oil spill incidents and recent
years its numbers were less.
lCommercial and recreational fishery has affected mainly by oil
pollution. Oil spill also risks sustainability of coastal fishery
resources, egg and larvae and fish mortality
lOil pollution will reduce the catches and also fish health will
be affected due to tainting and smothering. Heavy economic
loss due to contamination fishing implements and loss of
public confidence.
lPAHs are toxic contaminant among that high molecular weight
fractions are carcinogenic. Not much risk analysis was done on
the subject.
lManagement strategies during oil pollution include ban or
fishing, harvesting, selling, compensation to fishers continuous
monitoring for lifting the ban at the earliest.lSteps to be taken to make awareness to the public regarding the
unwanted fears.
38 Journal of Coastal Environment

References
1. Anon. The world energy outlook. International Agency,
France. DEW: Complete Energy J., 16, 13.
2. NRC, 2000. Oil in the Sea: Inputs, Fates and Effects, National
Academy Press, National Research Council, Washington DC. 806.
3. Prasad, M. N. V. and Katiyar, S. C. 2010. Current Science 98. 1566-
1568
4. Kirby, M.F., Law, R.J., 2008. Oil spill treatment products approval:
the UK approach and potential application to the Gulf region.
Marine Pollution Bulletin, 56. 1243-1247.
5. Al-Ghadban, A.N., Jacob, P.G. and Abdali, F. 1994. Total organic
carbon in the sediments of the Arabian Gulf and need for
biological productivity investigations. Marine Pollution Bulletin,
28. 356-362.
6. Pastorok, R.A., Bilyard, G.R., 1985. Effects of sewage pollution on
coral-reef communities. Marine Ecology Progress Series, 21. 175-
189.
7. Owens, E.H., Taylor, E., Humphrey, B. 2008. The persistence and
character of stranded oil on coarse-sediment beaches. Marine
Pollution Bulletin, 56. 1426.
8. Subba Rao, D.V. and Al-Yamani, F. 2000. The Arabian Gulf. In:
Sheppard, C. (Ed.), Seas at the Millennium: An Environmental
Evaluation. Elsevier Science Ltd., pp. 116 (Chapter 53).
9. Clarke, C., Hayes, T., Hilliard, R., Kayvanrad, N., Parhizi, A.,
Taymourtash, H., Yavari, V. and Raaymakers, V., 2003. Ballast
Water Risk Assessment: Port of Khark Island Islamic Republic of
Iran. Final Report. Globallast Monograph Series No. 8. Global
Environment Facility, United Nations Development Programme
and International Maritime Organization, p. 113.
10. Sivadas, S., Gregory A. and Ingole, B. 2008. Current science 95:
504-512.
11. Reddy, M.V. 2010. Current Science. 99. 267-268.
12. Kennish, M.J. 1997. Practical handbook of estuarine and marine
pollution. CRC Press, Boca Raton.
2006.
39Oil Pollution and its Impact on Fisheries

13. Benson, N.U., Essien, J.P., Ebong, G.A. and Williams, A.B. 2008.
Total petroleum hydrocarbons in Macurareptantia, Procambarus
clarkia and benthic sediments from the Qua Iboe, Estuary Nigeria.
Environmentalist 28. 275-282.
14. Kennish, M.J. 1992. Ecology of estuaries: anthropogenic effects.
Press Raton, Boca CRC.
15. Shriadah, M.A. 2001. Petroleum hydrocarbon concentrations in
Arabian Gulf tissues. Bull Environ ContamToxicol 67. 560-567.
16. Farrington, J. W., Tripp, B. W. and Teal, J. M. 1982.
Biogeochemistry of aromatic hydrocarbons in the benthos of
microcosms. Toxicol. Environ. Chem., 5. 331-346.
17. Benson, N. U., Essien, J. P., Ebong, G. A. and Williams, A. B.,
2008. Total petroleum hydrocarbons in Macurareptantia,
Procambarus clarkia and benthic sediments from the Qua Iboe,
Estuary Nigeria. Environmentalist , 28 . 275-282, DOI:
10.1007/s10669-007- 9140-6.
18. Chapman, P. M. and Wong, F. 2001. Assessing sediment
contamination in estuaries. Environ. Toxicol. Chem., 20. 322.
19. ATSDR, 1999. Toxicological profile for Total petroleum
hydrocarbons (TPH). Agency for Toxic Substances and Disease
Registry, Public Health Service, US Department of Health and
Human Services, Atlanta, GA.
20. Moles, A. and Norcoss, B. L. 1998. Effects of oil-laden sediments
on growth and health of juvenile flatfishes. Can. J. Fish. Aquat.
Sci., 55. 605-610.
21. Sengupta, R., Fondekar, S.P. and Alagarsamy, R. 1993. State of oil
pollution in the northern Arabian Sea after the 1991 Gulf oil spill.
Mar. Pollut. Bull. 27. 85-91.
22. Qasim S. Z. and Gupta, R. Sen. 1988. Some Problems of Coastal
Pollution in India. Marine Pollution Bulletin, 19. 100-106.
23. Veerasingam, S., Venkatachalapathy, R., Raja, P., Sudhakar, S.,
Rajeswari, V., Mohamed Asanulla, R., Mohan, R. and Sutharsan, P.
2011. Environ Sci Pollut Res DOI 10.1007/s11356-011-0466-8.
40 Journal of Coastal Environment

24. Ansari, Z. A., Achuthankutty, C. T. and Dalal, S. G.
Overexploitation of fishery resources, with particular reference to
Goa. In : Multiple Dimension of Global Environmental Change (ed.
Sonak, S.), TERI Press, New Delhi. 285-299.
25. Rosenthal, H. and Alderdice, D. F. 1976. Sub lethal effects of
environmental stressors, natural and pollution, on marine fish
eggs and larvae. J. Fish. Res. Board Can., 33. 2047-2065.
26. Garcý´aNegro, M.C., Villasante, S., CarballoPenela, A. and
Rodrý´guezRodrý´guez, G., 2009. Marine Policy, 33. 823.
27. Desai, P. S., HonneGowda, H. and Kasturirangan, K., 2000.
Current Science. 78. 268-278.
28. Jernelo¨v, A., and Linde´n, O., 1981a. Ixtoc I: A case study of the
world's largest oil spill. Ambio 10. 299-306.
29. Jernelo¨v, A., and Linde´n, O., 1981b. The effects of oil pollution
on mangroves and fisheries in Ecuador-Colombia. IVL Publ. B610.
30. Simpson, A.C. 1968. The Torrey Canyon Disaster and fisheries.
Laboratory Leaflet No 18. 43 pp. Essex, UK: Fisheries Laboratory,
Burnham on Crouch.
2006.
41Oil Pollution and its Impact on Fisheries

42 Journal of Coastal Environment

Impact of Mining Activities on Land and Water Areas of Goa
Shaikh Mohammad Parvez Al-Usmani*
Mining has played a significant role in the development of many countries. It is an
important contributor to the regional economy of Goa. The mining of iron ore
started in Goa during the Portuguese regime in 1950s. The government of Goa
collected revenue of Rs. 966.11 crores from the ore exports of 51 to 52 million tonnes
from Mormugao port during the financial year 2010-11. According to the
directorate of mines, Goa Government, over 60% of the country's iron ore export is
from Goa. The iron ore mining in Goa uses open cast technology. The unwanted by-
products generated through open cast mining pose a serious environmental
problem in the mining areas. The nature of mining operations creates a potential
negative impact on the environment both during the mining operations and for
years after the mine is closed. Water pollution from the mine rejects is a major
intractable problem. It has been observed that the fine material present in the mine-
dumps flows with the rain water and assume light brown to rust-red colour during
the season. It drains into the nearby rivers, rivulet, nullah, ponds and other water
bodies thereby increasing the water suspended load, depletion of dissolved oxygen
of water, deposition of silt, and depletion of the overall index of water in the water
bodies. Deposition of silt affects water retaining capacity of these water bodies
giving rise to occurrence of flood and frequent water logging during the excessive
rainfall. Hence, immediate remedial measures are required to reduce the
discharge of silt into the water bodies. Adopting a cost-effective local environmental
technology will help in filtering the residual suspended matter and colour at non-
source points.
IntroductionMining is the extraction of valuable minerals or other geological
materials from the earth, usually from an ore body, vein or (coal)
seam. Materials recovered by mining include base metals, precious
* D.M.'s College of Arts, Science and Commerce, Assagao, Goa.
Jour. Coast. Env., Vol. 2, No. 1, 2011
Abstract

metals, iron, uranium, coal, diamonds, limestone, oil, rock salt and
potash. Any material that cannot be grown through agricultural
processes, or created artificially in a laboratory or factory, is usually
mined.
Mining in a wider sense comprises extraction of stone and metals. It
has been going on since pre-historic times. Modern mining processes
involve prospecting for ore bodies, analysis of the profit potential of a
proposed mine, extraction of desired materials and finally reclamation
of the land to prepare it for other uses once the mine gets closed. The
nature of mining processes creates a potential negative impact on the
environment both during the mining operations and for years after the
mine is closed. This impact has led to most of the world's nations to
adopt regulations to moderate the negative effects of mining
operations. Safety has long been a concern as well, though modern
practices have improved safety in mines significantly. Mining today is
able to profitably and safely recover minerals with less negative
impact on the environment.
Impact of mining of iron ore in GoaThe state of Goa is endowed with rich mineral resources namely
manganese, iron, ferro-manganese, bauxite and small quantities of
industrial clay, lime stones and quartzes. Mining has been the main
industry in the history of modern Goa and a significant foreign
exchange earner besides providing employment. It provides
employment for about 25,000 persons directly and many more are
actively involved indirectly. A major contribution to the economy of
Goa is from the export of over 50 million metric tonnes per year of
iron and manganese ore from Mormugoa port.
The mining of iron ore started in Goa during the Portuguese regime in
1950s. In the beginning of the first 10 years of mining in Goa, it was
manual and production was mainly manganese and ferromanganese.
With increasing demand for steel industry in Japan, the thrust
changed to mining of iron ore. By 1970s, it witnessed a substantial
growth in the ore production. From 1958-1959, the production of iron
ore picked up and within a period of about 3 years, the iron ore
mining was no longer the pick and shovel exercise as it was a few
years ago. At one time a total number of 868 leases/concessions,
44 Journal of Coastal Environment

covering an area of 65,400 out of the total surface area of 365,563
hectare existed. Out of 581 mining concessions/leases which were in
force, only 211 were reported working during the year 1980. A large
number of concessions have since been terminated by the government
of India for their failure to operate. At present, around 400 leases are
in force covering an area of approximately 14% of the total area. The
government of Goa collected revenue of Rs.966.11 crore from the ore
exports of 51 to 52 million tonnes from Mormugao port during the
financial year 2010-11 (Directorate of Mines, Goa Govt., 2011).
On an average, Goa exports about 60% of the total iron ore exported
from India. The area has the advantage of having a natural harbour at
Marmugoa. It is being on the water shade zone of western ghat having
Mandovi, Zuari and Tiracol rivers flowing into the Arabian Sea. Rivers
like Mandovi, Zuari and their tributaries flow through the mining
areas. The mining belt of Goa covers about 700 sq. km. and mostly
concentrates in the four talukas viz. Bicholim, Salcete, Sanguem, and
Quepem.
According to Ripley et al (1996) mining activities takes place in the
following sequential stages:
I. Exploration, which may involve geochemical or geophysical
technique followed by the drilling of promising targets and the
delineation of ore bodies;
II. Development, preparing the mine site for production by shaft
sinking or pit excavation, building of access road, and
construction of surface facilities;
III. Extraction, ore removal activities that take place at the mine
site itself, namely extraction and primary combination;
IV. Beneficiation, which takes place at a mill usually not far from
the mine site where a large fraction of waste material is
removed from the ore.
The exploration and extraction of ore depends on other factors as well.
Iron ore mining in Goa is undertaken under mining leases granted to
the private companies by the state government. The practice followed
in Goa is called surface mining open pit. Mining operations are carried
45Impact of Mining Activity on Land and Water Areas of Goa
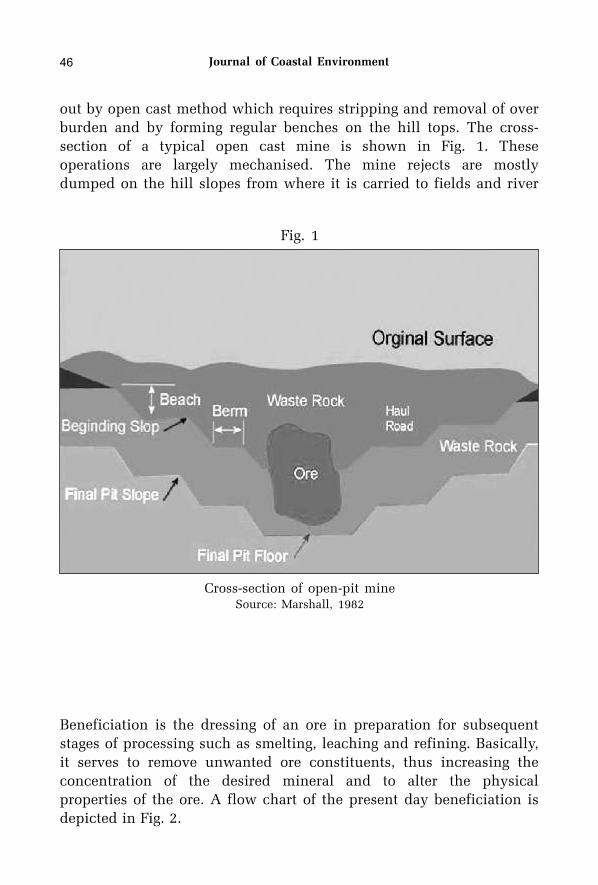
out by open cast method which requires stripping and removal of over
burden and by forming regular benches on the hill tops. The cross-
section of a typical open cast mine is shown in Fig. 1. These
operations are largely mechanised. The mine rejects are mostly
dumped on the hill slopes from where it is carried to fields and river
Beneficiation is the dressing of an ore in preparation for subsequent
stages of processing such as smelting, leaching and refining. Basically,
it serves to remove unwanted ore constituents, thus increasing the
concentration of the desired mineral and to alter the physical
properties of the ore. A flow chart of the present day beneficiation is
depicted in Fig. 2.
46 Journal of Coastal Environment
Fig. 1
Cross-section of open-pit mineSource: Marshall, 1982

rivers and other water courses. About 11% of the mining rejects settle in
sediment at 0-5PSU salinity. About 21% of them are deposited at 15-20
PSU salinity regime (Anonymous, 1981). The remaining is washed
downwards by strong currents and gets settled at the bottom in the
polyhaline (18-30 PSU) zone. Thus, a substantial part of these rejects
settle in the estuarine benthic environment.
The rejects so generated are dumped in the form of heaps near to mining
areas within the leased areas or are transported to the land acquired
specifically for the disposal at some distance from the mining area. The
mining areas of Goa are dotted with such dumps. The dumps may be
classified as 'dead dumps' and 'active dumps'. Dead dumps are old dumps
where no further dumping is done and active dumps are those where
dumping of wastes is continuing. These dumps mainly consist of
overburden material, rejects ore, sub-grade ore, clay, or mix of all
materials and originate from the beneficiation plants. The dumps of the
course material always have some percentage of fine material.
47
Fig. 2
Flow chart of beneficiation stage of mining
Impact of Mining Activity on Land and Water Areas of Goa

The damage to the environment is most evident during the rainy season.
These dumps do not provide suitable substrate vegetation and are usually
susceptible to slumps, slide down during the rainy season especially at
the event of heavy rains. Several constituents of dump material flows with
rain water to the lower valleys and plains either as suspended material or
in solution. The rain water assumes red or brown colour and flow into
nearby rivers, rivulets, nullah, ponds and other water bodies. Studies
have shown that due to this, there is an increase in the suspended load of
water, depletion of dissolved oxygen in water, deposition of silt, depletion
of overall index of water in these water bodies. Consequently,
hydrological regime of these water bodies is disturbed. A clean shift in the
water quality is reported.
The silting of water in the water bodies lowers the water-retaining
capacity of these water bodies, thereby giving rise to occurrence of flood
and frequent water logging during the excessive rains given to the fact that
Goa receives on an average, about 120 inches of rain annually, mainly
from the south-west monsoon during the months June to September. This
also leads to changing of natural water course of the rivulets which results
in water logging on the roads and surrounding fields. It also hampers the
agriculture productivity, besides giving apprehension to rise in
waterborne diseases. Water logging at various places in Bicholim, Pale,
Velguem, Harvolem, Sanguem and Quepem and floods in Sanquelim
during the monsoon season of 2007 and 2010 confirm the above fact.
Hence, there is an urgent need of developing a proper strategic planning
during the operation of new mines on the part of the mining companies.
The local municipalities and village panchayats with the help of other
government departments like the Public Works Department, Water
Resources Department, etc. can play an important role in implementing
the cost-effective local technology in cases of dead and abandoned mine
rejects.
While the iron ore mining industry contributes 10.14% of State's Gross
domestic products, it also causes environmental degradation to the tune
Rs.548 crore per annum (Herald Reported, 31 December 2010). According
to the National council of Applied Economic Research (NCAER), major
portion of environmental degradation comprises of deforestation which is
valued at Rs.467.3 crore annually. According to a report prepared by Govt.
48 Journal of Coastal Environment

49
of Goa, the benefits of iron ore extraction in Goa are much more than the
environmental loss associated with it. The report further says that Goa
will lose Rs.1842.20 crore every year if it bans the iron ore mining. It also
provides an employment of about 75,000 persons, which is next to the
tourism sector.
It is important to assess in detail, the various kinds of damage caused to
the environment and to the quality of human life due to mining in Goa.
Mining inevitably causes damage to land and to the soil and plants.
Mining implies selection, which in turn implies the rejection of waste and
the very process of selection will cause an impact on the environment.
Some of the impacts of mining activities on the environment are as
follows:
DeforestationIn Goa, deforestation has become inevitable as 70% of the mining activity
is carried out in forest areas. Deforestation of more than 350 sq.km of
mining concessions and leases is within the forest areas of the Western
Ghats. Damage to the forest land caused by the opening of pits and by
dumping of reject and waste was observed during the present study in
Bicholim taluka. However, in the thickest forest areas, mining activities
have resulted in the depletion of forest wealth. Several economically
important plants like cashew, coconut and banana have disappeared from
the slopes of mining hills. This has also reflected from the poor
biodiversity area.
a) Land Degradation and Damage to Agriculture:Land degradation due to mining can be categorized into three as follows:
i) Land excavation to obtain the oreii) Land used for dumpingiii) Land degraded due to mining activity in agriculture and
horticulture areas, siltation of drains, lakes and other water
bodies, etc.
All these activities cause extensive and widespread land damage. Each
year, some 30 million tonnes of rejects are generated and stacked in large
dumps. In this process, a good amount of these rejects are strewn along the
roads and they finally settle down in agricultural land, paddy fields and
coconut groves. In addition, there are certain areas where damage has
Impact of Mining Activity on Land and Water Areas of Goa

50 Journal of Coastal Environment
taken place from a polluted mine but no single mine owner can be held
responsible because a large number of mines are polluting the river. In
addition, there is a considerable damage to mangrove forest from the
mining activities. The siltation from the washing of mine rejects causes
mortality of the young plants in the area.
b) Mining and Dust Pollution:
Ore is transported from the mines-sites to iron ore jetties on the river
banks by trucks, mostly on public roads. These roads are used by mine
owners/contractors to carry ore to barge-loading bunkers. They are the
main source of dust pollution affecting the vegetation and local
communities. During the process, large quantities of dust enter the houses
situated on the wayside and add considerably to the misery of the
inhabitants. Villagers complain that their houses have to be washed and /
or cleaned several times a day to get rid of the film of red dust and that
inhabitants suffer from dust-related diseases, especially the young and
old-aged ones. No compensation is made available from the mine owners
in such cases. Inhabitants of these areas have protested time and again and
even blocked the mining trucks from plying to draw the attention of the
government and the mining companies.
The two twin-towns of Curchorem and Sanvordem in south Goa and
Velguem in north Goa bear the major brunt of mining dust pollution. In
some villages the situation is so grim that many citizens have left the place
in search of ash-free locations. It is difficult to imagine the hidden costs to
economy of the region due to such relocation of inhabitants.
c) Ground Water Depletion:In some of the mines, the mining operations have led the water table going
down as pumping out water from the mining pits is needed regularly. This
In the process of large-scale earthwork, dust emissions are inevitably a
problem. The dust particles originate from the following potential
sources: ore crushing, conveyance of crushed ore, loading bins, blasting,
mine and motor vehicle traffic, use of hauling roads, waste rock piles,
windblown tailings, and disturbed areas. Dust can contain toxic heavy
metals such as arsenic, lead etc. These toxic heavy metals, when
incorporated with the dust can contaminate the air. Dust can also get
deposited at the surface water causing sedimentation and turbidity
problems.

51
has resulted in the depletion of the water in the vicinity, and thus
depriving the neighbouring villages of well water supply which becomes
essential during the summer month. This eventually affects the
biodiversity in the forests and rivers due to shortage of water. In some
cases, due to accumulation of water in pits, the water in the wells located
in the lower contours becomes turbid. De-vegetation also increases the
evaporation of water from the soil which results in a reduction in the
quantum of water which normally percolates to the substrata, thus
affecting the ground water supply.
DiscussionThe mine-reject-dumps including the old and abandoned sites leave a scar
on the environment even after the mining operations cease to continue. It
is thus clear that not only the on-going dumps of the mine-rejects, but also
the old and abandoned mine-reject-dumps pose a danger to the water in
the water-bodies of the adjoining areas. Different views on this subject
have been expressed during the discussions of the Federation of Indian
Mineral Industries, New Delhi, 1989 and these are given in volumes I and
II of its reports. It has been observed that the fine materials present in the
mine dumps flow with the rain water which assumes light-brown to rust-
red colour during the rainy season. It passes though the water drainage
into the nearby rivers, rivulet, nullah, ponds and other water bodies
thereby increasing the suspended load of water, depletion of dissolved
oxygen of water, deposition of silt, depletion of overall index of water in
these water bodies (Parulekar, et. al., 1986).
Water pollution from the mine reject is a major intractable problem.
However, this problem can be tackled by planting trees at the site of the
rejected dumps around the periphery of the dumps or by constructing a
laterite wall compound of about 1 to 1.5 metre broad and about 1.5 metres
high at the base of such dumps. Planting of trees, especially fruit-bearing
trees will also help in increasing the horticultural productivity and/ or
planting of the ornamental trees will help to add the esthetic value of the
surroundings. The boulders of the laterite required for the construction of
the compound wall can be obtained from the rejects by segregating the
boulders of laterite stones from the rest. This is a cost-effective local
environmental protection technology which can be used in abating water
pollution. Such a method will act as an initial step in filtering the residual
suspended matter and the colour of water in abating pollution at the
Impact of Mining Activity on Land and Water Areas of Goa

52 Journal of Coastal Environment
unused sources. Subsequently, the water can be treated by adopting the
various suitable methods. Periodic de-silting of the water-ways at least
once a year will also help in avoiding water logging and floods during the
heavy rains. Therefore, immediate measures are required to reduce the silt discharged
into the water bodies. Adopting a cost-effective environmental
technology as discussed above will help in filtering the residual
suspended matter and colour of water at different points. It is thus
suggested that a proper environmental management is an important issue
for the sustainable mining activities in Goa.
Impact of mining on coastal marine environmentThe real impact of mining activity seems to affect both the terrestrial and
aquatic food chains (Modassir, 1994). This impact is clearly seen in the
talukas of Bicholim, Sattari and Sanguem and also in the estuarine zones.
Its principal features are:
Turbidity increase with high concentrations of suspended load which
reduces the amount of light penetration to planktonic life, therefore
affecting the productivity.
lThe suspended matter and soluble Iron affects the quality and the
quantity of phytoplankton in the water bodies.
lMine tailings deposited in the estuarine zone probably
depletes the benthic fauna.
lMetals like Fe, Mn, Cr, Ni, Co, Zn, Pb which are carried from
mines and get settled within the estuary.
lVarious organisms are known to bio-accumulate heavy metals.
lHigh turbidity also creates siltation problem.
Sustainable development and environmental considerationAs there is an inherent conflict between mining and environment, it
would be unrealistic to expect that the mining of minerals could be
accomplished without affecting the environment. The approach is to
strive to minimize both on-site and off-site problems of mining by
controlling sediments and the pollution of land, water and air (Tata, 1997).
In open cast mines, as practiced in Goa, the extra substance is removed

53
and mostly dumped nearby. The trees that grow over the area under
mining operations are lost as also the agricultural land nearby.
It is generally perceived that the environmental conservation is a
stumbling block in the development of mining and other industry. It is
argued that the cost of environmental conservation and pollution control
are so prohibitive that development activity will not survive the high cost.
In reality, the objective of sustained development with minimum
environmental degradation at a sensible and affordable cost is not such a
farfetched idea. It is possible to prevent long-term side effects to the
environment by incorporating some of the mitigating measures noted
above.
References
Anonymous, 1981. Eco-development plan for Goa (report of task force on
coastal area planning). p. 42 (Mimeo).
Federation of Indian Mineral Industries, New Delhi, 1989. Papers of
National Seminar on Protection of Environment and Ecology. Vol. I, by
Mining Industries, New Delhi at Kala Academy, Goa.
Federation of Indian Mineral Industries, New Delhi, 1989. Papers of
National Seminar on Protection of Environment and Ecology Vol. II. by
Mining Industries, New Delhi at Kala Academy, Goa.
Iwugo, K.O., and Mahendra, S., 1992. Evaluation Study of Commonwealth
Fund for Technical Assistance for the control of pollution from mining
Industry in Goa, India.
Marshall, I.B., 1982. Mining, Land use and the Environment: Part I. A
Canadian overview. Land use in Canada series, No. 22. Ottawa, ON: Land
directorate, Environment Canada.
Modassir, M., 1994. Impact of current Iron ore mining activities on the
environment of Goa and proposed measures to minimize long term
environmental and economic changes, Dissertation, University of Hull,
U.K.
Parulekar A.H., Ansari, Z.A. and Ingole B.S. 1986. Effect of mining
activities on the clam fisheries and bottom fauna of Goa estuaries. Proc.
Indian Acad. Sci. (Anim. Sci.) 95. 325-339.
Impact of Mining Activity on Land and Water Areas of Goa

54 Journal of Coastal Environment
Ripley, E.A., Redman, R.E. and Crowder, A.A. 1995. Environmental effects
of mining. St. Lucei Press, Florida.
Tata Energy Research Institute, New Delhi and Goa, 1997. Areawide
Environmental Quality Management (AEQM) Plan for the Mining Belt of
Goa.

Deep Water Horizon: Lessons for the Future*
1Usha Dar
The paper gives the definition of 'Deep Water” and then go on to British Petroleum's right to drill in the Gulf of Mexico. It will then examine the reasons for the Deep Water Horizon Oil Spill on April 20, 2010, such as institutional failures and poor risk management. The paper will also focus on the economic as well as the ecological impact of the oil spill, and briefly give the findings and recommendations of the DEEP WATER Report.
British Petroleum and oil explorationIn the 1990's the global company which made the biggest news in the
Gulf of Mexico was BP. This company was founded in 1908 and in
1954 it was named British Petroleum. It had for decades built its
business around crude oil in Iran and the neighbouring Middle
Eastern countries. In the 1960s and 1970s BP achieved great success
in discovering and developing oil reserves in the North Sea and in
Alaska's Prudhoe Bay. However by the early 1990's BP had been
exiled from the Middle East and Nigeria. Proudhon and North Sea
were in decline. Billions of dollars had been invested in unprofitable
non-petroleum ventures and an ambitious exploration programme had
yet to bear fruit. The company tottered on the brink of bankruptcy.
Sir John Brown, as Executive Vice President of Sohio BP's American
subsidiary, reigned in spending and cut staff to place the company on
a better footing. Returning to London in 1989 he reorganized BP's
exploration arm. Upon becoming Chief Executive in 1995 he directed
a major part of BP's upstream focus to the deepwater Gulf. In the deals
* Paper presented in the National Seminar on “Coastal Pollution: Mitigating Threats from Oil Spills”, New Delhi, Centre for Ocean and Environmental Studies, May 6-7, 2011.
1 Director (Research), World Environment Foundation, New Delhi.
Jour. Coast. Env., Vol. 2, No. 1, 2011
Abstract

he negotiated to acquire Amoco, Arco, BP emerged with a greatly
expanded portfolio of Gulf leases and assets.
In the late 1990's BP's Gulf exploration team made a series of
remarkable deep water discoveries. Once the fields came on line, they
vaulted BP ahead of Shell as Gulf's largest producer. BP joined with
Exxon in developing deep water discoveries in Hoover and Diana
fields in the Western Gulf. Shell shifted to managing production from
its large number of deep water developments. BP sprang faster than
anyone else to confront the Gulf's nagging exploration challenge-the
salt.
In a costly and complex undertaking BP combined new advances in
computer processing for 3D seismic imaging with new methods of
acquiring seismic data from multiple directions to gather a better
understanding of the salt history, stratigraphy, and the sources and
migration pathways of oil in deep water. BP scientists and engineers
found geographically promising areas just as large as those discovered
in the shallower Continental Shelf. However, it is important to
remember what Dave Rainey BP's deep water exploration manager
said.” One of the lessons we have learned about the Gulf is never to
take it for granted.” Way back in 1970 one of the consultants had
observed “Each oil well has its own personality, is completely
different from the next and has its own problems.” Too often on
drilling structures he complained, one found inexperienced
supervisors and employees who overlooked rules and regulations the
purpose of which they did not understand, and perhaps most
troubling, even orders from bosses to cut corners, all of which create
conditions for an 'explosive situation.'
By 2010 after numerous acquisitions BP had become the world's
fourth largest corporation (based on revenue) producing more than 4
million barrels of oil per day from 30 countries. 10 % of BP's output
came from the Gulf of Mexico where BP America (headquartered in
Houston) was the largest producer. But “BP had a tarnished reputation
for safety. Among other BP accidents 15 workers died in a 2005
explosion at its Texas city, Texas Refinery. In 2006 there was a major
oil spill from a badly corroded BP pipeline in Alaska.
56 Journal of Coastal Environment

57Deep Water Horizon : Lessons for the Future
In September 2009 Transoceans Deepwater Horizon semi-submersible
made a historic discovery for BP at the Company's Tiber project. In the
Keathley Canyon, drilling in 4,000 feet of water and to a world record
total depth of 35,055 feet Deepwater Horizon tapped in a pool of 4-6
billion barrels of oil equivalent, one of the largest US discoveries.
Drilling in extreme water depths poses special challenges to risers
connecting a drilling vessel to the blow out prevention on the sea floor
have to be greatly lengthened, and they are exposed to strong ocean
current encountered in the Central Gulf. Managing higher volumes of
mud and drilling fluid in these long risers makes drillers jobs more
demanding. Connecting and maintaining blow out preventers
thousands of feet beneath the surface can only be performed by
remote operating vehicles. . Knowledge which is required about
localized geography, types of hydro carbons and pressure profiles in
ultra deep water wells is not thoroughly developed. Each well indeed
has its own personality that requires maintaining an extremely
delicate balance between the counteracting pressures of the sub
surface formation and drilling operation. Beneath the salt, pressures in
the pores of the sediment are extremely hard to predict. Reservoirs in
lower tertiary are thicker and with greater viscosity than the fluid
found in other rocks. Finally ultra deep water developments are far
removed from shore and thus from established infrastructure. As a BP
technical paper prepared for May 2010 Offshore Technical Conference
noted “the trend of deep water discoveries in the Gulf of Mexico is
shifting towards one with greater challenges across many disciplines
separated by the conditions of Lower Tertiary discoveries.”
Nevertheless the challenges seemed manageable and the rewards
appeared worth the perceived risk.
Lease and permitsOn March 19, 2008 BP acquired the lease to Mississippi Canyon Block
252 in the Central Gulf of Mexico at Minerals, Management Services
(MMS) lease sale. The 10 year lease started on June 1, 2008. The
ownership of the lease was shared as BP 65%, Anadarka Petroleum
25%, and MOEX Offshore 10% with BP as the lease operator.
Drilling the Mocando wellBP actually used two Transocean rigs to drill the Mocando well and
two BP well site leaders were required to be on the well at all times.

58 Journal of Coastal Environment
The Marianas began work in October 2009 and drilled for 34 days
reaching a depth of 9090 feet before it had to stop drilling and move
off site to avoid hurricane Ida. The storm damaged the rig badly and
BP called in the Deepwater Horizon to take over.
While Marianas had been anchored in place with huge mooring
chains the Deepwater Horizon was a dynamically positioned mobile
offshore drilling unit (MODU).It relied on thrusters and satellite
positioning to stay in place. The rig arrived on January 31, 2010 and
began drilling operations Transoceans Offshore Installation Manager
Jimmy Harrel took over the responsibility as the top Transocean
employee on the rig.
After continuous drilling the engineers concluded that they had “run
out of drilling margin and would have to stop short of the original
objective of 20,200 ft. After cautiously drilling to a total depth of 18,
360 feet BP informed its lease partners Anadorko and MOEX that
“well integrity and safety “ issues required the rig to stop drilling
further. At that point Macando was stable.
After surmounting a number of difficulties at 5.45 A.M a Haliburton
Company engineer sent an email from the rig Deepwater Horizon to
his colleague in Houston. He had good news. “We have completed the
job and it went well.” Yet the same day the tragedy occurred. The rig
exploded. The National Commission on BP Deep Water Horizon Oil Spill was
announced on May 22, 2010 consequent on the on the BP Deep Water
Horizon Oil Spill and Offshore Drilling on April 20, 2010.
The mandate of the Commission was to determine the causes of the
disaster and to improve the country's ability to make offshore energy
production safe.
The Foreword to the Report by Bob Graham (co-chair) and William K.
Reilly(c0-Chair) states that “ The explosion that tore through the Deep
Water Horizon drilling rig last April 20, as the rigs crew completed
drilling exploratory Mocando well deep under the waters of the Gulf
of Mexico began a human, economic, and environmental disaster…
the costs from this one industrial accident are not yet fully counted,

59
but it is already clear that the impacts on the regions natural systems
and people were enormous and the economic losses total tens of
billions of dollars.”
The Report observed that “The scientific understanding of
environmental conditions in sensitive environments in deep Gulf
waters and in areas proposed for drilling such as the Artic is
inadequate. The same is true of natural and human impacts of oil
spills… As we know from other oil spills their environmental
consequences play out in long and unexpected ways.”
The National Commission on BP Deep Water Horizon Oil Spill was
announced on May 22, 2010 consequent on the on the BP Deep Water
Horizon Oil Spill and Offshore Drilling on April 20, 2010.
The mandate of the Commission was to determine the causes of the
disaster and to improve the country's ability to make offshore energy
production safe.
The Foreword to the Report by Bob Graham (co-chair) and William K.
Reilly (co-chair) states that “ The explosion that tore through the Deep
Water Horizon drilling rig last April 20, as the rigs crew completed
drilling exploratory Mocando well deep under the waters of the Gulf
of Mexico began a human, economic, and environmental
disaster….the costs from this one industrial accident are not yet fully
counted, but it is already clear that the impacts on the regions natural
systems and people were enormous and the economic losses total tens
of billions of dollars.”
The Report observed that “The scientific understanding of
environmental conditions in sensitive environments in deep Gulf
waters and in areas proposed for drilling such as the Artic is
inadequate. The same is true of natural and human impacts of oil
spills….As we know from other oil spills their environmental
consequences play out in long and unexpected ways.”
The Report points out that the lessons learned from the Deep Water
Horizon are not confined to our own government but are relevant to
the rest of the world.
Deep Water Horizon : Lessons for the Future

60 Journal of Coastal Environment
Policy and legislationThe foundations for the Federal Regulation of offshore oil and gas
development were laid on the Outer Continental Shelf Lands Act
1953. In 1970 starting with the National Environment Policy Act 1970
Congress enacted new environmental protection and resource
conservation laws. It required Federal Agencies to prepare
'Environmental Impact Statements for all proposed Federal actions.
In 1978 the Outer Continental Shelf Lands Act was passed. It was the
last major resource management law Congress passed in the 70's.
Institutional arrangementsThe Office of Offshore Energy and Minerals Management and the
Revenue Management Program (MMS) were the Federal Agency for
leasing, safety, environmental compliance and collection of royalty for
offshore drilling.
Overtime MMS increasingly fell short in its ability to oversee the
offshore oil industry. The Agency's resources did not keep pace with
the industry's expansion into deeper waters and industry's related
reliance on more demanding technologies. The senior officials focus
on safety gave way to efforts to maximize revenue from leasing and
production.
MMS realized that a command and control prescriptive method did
not adequately address the risks generated by the offshore industry's
new technologies and production activities including industrial
expansion into deeper waters.
In 1989 the Agency commissioned The Marine Board of National
Research Council to make recommendations for overhauling MMS's
regulatory programme to best fulfill its safety mission at current levels
of staffing and budget. The Marine Board's Report delivered in 1990
concluded that MMS's emphasis on a list of “potential incidents of
non-compliance” could lead to an attitude on the part of an operator
that compliance with the list equals safety, thereby diminishing
“recognition of the operator's primary responsibility for safety.” The
Report recommended that MMS. “…Place its primary emphasis on the
detection of potential accident producing situations particularly those
involving human factors, operational procedures and modifications of

61
equipment, rather than scattered instances of non compliance with
hardware specifications”.
Despite the recommendations no action was taken. At the time of the
Mocando blow out the MMS had still not published a rule mandating
that all operators have plans to manage safety and environmental
risks. The Agency's efforts were repeatedly revised, refined, delayed
and blocked alternatively by industry or 'skeptical agency political
employees.' MMS thus never achieved the reform of its regulatory
oversight of drilling safety consonant with practices that most other
countries had embarked decades earlier
It was clear that MMS needed to be reorganized. The Secretary of
State for the Interior announced (nineteen days after the rig sank) that
MMS would be reorganized into three separate entities with distinct
missions:
1. A Bureau of Ocean Energy Management2. A Bureau of Safety and Environment Enforcement3. An Office of Natural Resource Revenue
Impact on natureThe Deepwater Horizon oil spill immediately threatened a rich
productive marine ecosystem. To mitigate both direct and indirect
adverse environmental impacts, BP and the Federal Government took
proactive measures in response to the unprecedented magnitude of the
spill. Scientific knowledge of deepwater marine communities is
limited and a significant volume of oil was dispensed so the scientists
do not yet know how to predict the ecological consequences and effect
on key species that might result from the oil exposure in the water
column both from below and near the earth surface.
Economic impactsThe Deepwater Horizon Water Oil spill put at risk two major
industries namely tourism and fishing. Both these industries are
highly sensitive to direct eco system harm and public perception and
fears of tainted seafood and sea beaches. It may be mentioned here
that Gulf coast economy depends heavily on commercial fisheries and
tourism.
Deep Water Horizon : Lessons for the Future

62 Journal of Coastal Environment
Impact on human healthThe Deepwater Horizon crew bore the immediate devastating effects of
the rigs destruction. Eleven deaths and seventeen injuries and the
unquestioned trauma of losing colleagues, the terror of explosions and
fires, the sense of involvement in wider damages that ensued; the
rigors of the investigations and the recovery effects and the disruption
of the families. The Report observes: “Assessing the environmental,
economic and human health damages from the Deepwater Horizon oil
spill is of course the threshold challenge. The even larger challenge
now facing the Gulf is how to achieve its restoration not withstanding
years of failed efforts to recover from past destruction”
Results of investigations and recommendations by the Deepwater
Report
- The explosive loss of the Mocando well could have been
prevented
- The immediate cause of the Mocando well blow out can be traced
to a series of identifiable mistakes made by BP, Haliburton and
Transocean that reveal such systemic failure in risk management
that they place in doubt the safety culture of the entire industry.
- Deep water exploration and production, particularly at the
frontiers of experience involve risks for which neither industry
nor government was prepared, but for which they can and must
be prepared for the future.
- To ensure human safety and environmental protection regulatory
oversight of leasing, energy exploration and production require
reforms even beyond those significant reforms already initiated
since the Deepwater Horizon Disaster. Fundamental reform will be
needed in both the structure of those in charge of regulatory
oversight and their internal decision making process to ensure
that care is taken of political autonomy, technical expertise, and
full consideration of environmental protection concerns.
- Because regulatory oversight will not be sufficient to ensure
adequate safety the oil and gas industry will need to take its own
unilateral steps to increase dramatically safety throughout,
including mechanisms that supplement government enforcement
63
- The technology laws and regulations and practices for continuing,
responding to and cleaning up spills lag behind the real risks
associated with deep water drilling into large high pressure
reservoirs of oil and gas located far off shore and thousands of
feet below the ocean surface. Government must close the existing
gap and industry must support rather than resist efforts.
- Scientific understanding of environmental conditions in sensitive
environments in deep Gulf waters along the regional coastal
habitats and in areas proposed for drilling such as the Arctic is
inadequate. The same is true of the natural and human impacts of
oil spills.
To these recommendations may be added another one. It is not enough
to consider the balance sheet or the rank of a company in giving rights
for oil exploration. A careful assessment needs to be made of the risk
management efforts of the company concerned.
Deep Water Horizon : Lessons for the Future

64 Journal of Coastal Environment

Ecosystem Conservation and Management: The Concept of Large Marine Ecosystem
Kishore Kumar*
The Large Marine Ecosystem (LME) concept is used as a tool for enabling ecosystem
based management, as well as providing a collaborative approach to resource
management in a transnational mode. The concept has been developed by the US
National Oceanic and Atmospheric Administration (NOAA), consistent with the
1982 UN Convention on the Law of the Sea (UNCLOS III, 1982). The LME-based
conservation is based on the recognition of coastal and marine degradation by
unsustainable resource exploitation, pollution, emerging diseases, and so a
positive action to mitigate them requires coordinated efforts by nations.
The Bay of Bengal LME is characterised by tropical climate and is situated in the
monsoon belt. The primary driving force in marine ecosystem is the threat from
both natural (climatic) and anthropogenic sources — be it monsoons, storm surges
or cyclones on the one hand, and rampant fishery activity and industrial and other
pollutants on the other. The concerns of ecosystem health are common throughout
the region — stress due to expanding coastal population, degradation of
mangroves, corals and other habitats that support fisheries, use of unsustainable
fishery gears, pollutants from agricultural pesticides and industrial wastes, and
heavy oil tanker traffic and resultant oil spills. The countries of the Bay of Bengal
region house over a quarter of the world population, calling for an urgent need for
conservation and ecosystem management which, in turn, requires coordinated
effort on the part of the countries, participation of local community and other
stakeholders, apart from those of the various international, regional and sub-
regional institutions operating in the region.
The Large marine ecosystems (LMEs) have been defined as the
entire expanse of ocean and coastal space that extend out to the
seaward boundary of continental shelves and the seaward
margins of coastal current systems. The large regions encompass
* Consultant, Centre for Ocean and Environmental Studies, New Delhi.
Jour. Coast. Env., Vol. 2, No. 1, 2011
Abstract

66 Journal of Coastal Environment
river basins and estuaries (wetlands) and other coastal habitat
(mangroves, coral reefs, sea grasses, etc.) that provide food and
shelter to myriad of organisms besides providing protection
against erosions and disasters. LMEs are extensive areas of ocean
space on the order of 2,00,000 sq. kms., or more, characterised
by distinct bathymetry (depth), hydrographic regimes (surveying
and charting of water bodies), submarine topography,
productivity and trophically (nutritionally) dependent 1populations. They are perhaps richest area in terms of
biodiversity and source of services provided to the humankind:
major resource base is fishery/aquaculture; hydrocarbons and
minerals; services like marine transport, including oil tankers;
coastal tourism (especially in islands); evolution of coastal mega
cities; and challenges like pollution, natural disasters and
pressure on existing resources. In other words, as an
organisational unit, the LME facilitates management and
governance strategies that recognise the ecosystem's numerous
biological and physical elements, and the complex dynamics
that exist amongst them.
Evolution of LME managementEcosystem management may have been subject to different
interpretations, but the underlying concept is similar to that of
the long-standing ethic of conservation. The most important
direct drivers of change in the marine ecosystem over the last 50
years have been fishing and related activities that have affected 2the structure, functions and biodiversity of the oceans.
However, the initial negotiations on environment and
sustainable development did not appreciate this factor, and
concentrated instead on shipping related pollutants as this
particular sector had been the major source of revenue for
developed nations.
rdThe 3 UN Conference on the Law of the Sea accorded
substantial attention to protection of marine environment. The

67Ecosystem Conservation and Management: The Concept of Large Marine Ecosystem
effects of the Stockholm Conference on the Human Environment
(1972) were clearly discernible, as also the attempt to implement
At the Caracas session of UNCLOS III, Maurice Strong, then Executive
Director of the UN Environment Programme (UNEP), urged the
Conference to adopt standards and principles for the protection of
marine environment through competent international organisations
like the Intergovernmental Maritime Consultative Organisation
(IMCO), now the International Maritime Organisation (IMO). But a
number of countries, India, Egypt, Iran, Nigeria, etc., contended that
the coastal States, not the flag States, should have the primary
responsibility for protection against vessel source pollution of their 3marine environment. In other words, it would have to be
'environment self protection' wherein there would be national
standards for environment protection, not the one determined by the
IMO. This was again enforced in the EEZ doctrine wherein the littoral
countries had the responsibility of protecting their ocean and coastal
Fig. 1
UN Atlas of the OceansSource: www.oceansatlas.org

68
Fig. 2
The Bay of Bengal Large Marine EcosystemSource: www.worldatlas.com/webimage/countrys/as.htm
This brought the focus on to land-based sources of pollution of the
coastal zone and the heightened concern on the part of coastal States.
Thus, mitigating the negative impacts of threats to the coastal/marine
areas and adopting management practices that sustain ecosystem
function and health became an international priority. On the
imploration on the part of coastal States to halt and reverse the
deteriorating condition of coastal areas, the International Union for
Conservation of Nature (IUCN) and the US National Oceanic and
Atmospheric Administration (NOAA) joined in an action programme
on planning and implementing an ecosystem based strategy, focused
on LMEs as the principal assessment and management units. In a
complementary exercise, the Intergovernmental Oceanographic
Commission (IOC) of UNESCO and its partners, the World Maritime
Organisation (WMO), the UN Environment Programme (UNEP) worked
Ecosystem Conservation and Management: The Concept of Large Marine Ecosystem

through the coastal modules of the global ocean observing system
(GOOS) to develop ecosystem monitoring and forecasting methods to
be applied by coastal States.
Around the same time, developing coastal nations approached the
Global Environmental Facility (GEF) and its implementing agencies
UNDP, UNEP and the World Bank, and executing agencies like the UN
Industrial Development Organisation (UNIDO), for assistance to
restore and protect their coastal and marine ecosystems. The GEF
provided assistance within the framework of sustainable development,
with recommendation to use the LMEs and their contributing
freshwater basins for integrating changes in sectoral economic
activities. The two principal processes to engage the scientific
community of participating nations were: (a) Trans-boundary
Diagnostic Analysis (TDA) for establishing ecosystem based priorities
across national boundaries, and (b) Strategic Action Plan (SAP) to
jointly determine policy, legal and institutional reforms, and
investments needed to address the TDA priorities, as also adoption of
management regimes based on the concept of adaptive management 4for the ecosystem as a whole, not sectoral issues in isolation.
All this has been a result of the follow-up action to the UNCED
declarations (1992) on the declining state of global coastal ocean areas.
With the initiation of the Benguella Current, Yellow Sea, Baltic Sea
and the Guinea Current LME projects, 30 countries in Asia, Africa and
Eastern Europe made ministerial level commitments to ecosystem
based assessment and management practices. It was in support of the
objectives of Chapter 17 of Agenda 21 of the Earth Summit (UNCED,
1992), in order to assist 120 countries in operationalising the
ecosystem approach. The project includes several regions, from the
Caribbean and Gulf of Mexico, through the Red Sea and Gulf of Aden, 5to the Bay of Bengal and South China Sea.
Bay of Bengal LMEEcologists have studied and discussed the concept of ecosystem for
several decades, but applying the same to world's costs and oceans
required a proper definition of coastal zone, their characteristics,
resources therein, as well as their sustainability factor. As mentioned
earlier, the most important direct driver of change in the marine
69Ecosystem Conservation and Management: The Concept of Large Marine Ecosystem

70 Journal of Coastal Environment
ecosystem has been fishing activity, which affects the structure,
function and biodiversity of the oceans, especially the coastal zone.
The increasing interest in marine ecosystem management, thus,
stemmed from overexploitation of world fisheries and the perceived
need for broader perspectives in fisheries management in a holistic
manner which included its linkages with other aspects of
oceanography, e.g. sustainable yield, maintenance of biodiversity, and 6protection from the effects of pollution and habitat degradation.
In the mid-1980s, Kenneth Sherman of NOAA's Marine Fisheries
Service and Lewis Alexander of the University of Rhode Island
pioneered the LME concept. They recognised that large areas of ocean
work as ecosystem, and that overexploitation of marine resources,
together with pollution from air, land and water, influence their 7
productivity. Sherman and Alexander put the issue in perspective :
“The LME approach brings multidisciplinary marine
studies to bear on regional-scale concepts of resource
sustainability by examining the causes of variability in
the productivity of those regions around the margins of
the world's oceans from which 95% of the annual yields
of usable fisheries biomass is harvested. Emphasis is
placed on identification of the primary, secondary and
tertiary driving forces controlling the large scale
variability of biomass yields within and among LMEs”.
Earlier, ecosystem management approaches had failed to look beyond
individual sectors and political boundaries, and decisions were taken
in isolation. For instance, fish harvest decisions were made on a single
species basis, not recognising interactions among species, and
predator-prey or competitive relationships. Though some policy
makers/scientists would characterise individual ecosystems like the
Baltic Sea or the Gulf of Mexico, they stopped short of applying a
fully interdisciplinary approach to ocean ecosystems throughout the
world. On the other hand, they took up the challenge scale across
national boundaries, thus providing the basis of cooperation among
countries that shared the boundaries.
71
Sherman, Alexander and other scientists published a number of
scientific volumes, containing LME description and case studies. The
concrete programme started when Angola, Namibia and South Africa 8agreed to jointly study and manage the Benguela Current LME .
Thereafter, authorities responsible for coastal and marine resources
across Africa, Asia and the Pacific, Latin America and the Caribbean,
and Eastern Europe understood the implications of declining trends in
their natural resources and the marine ecosystem. The objective was
to implement strategies for reversing the decline in their marine
ecosystem, restoring the depleted biomass and conserving the
ecosystem for future generations. A number of countries prepared
proposals to improve their coastal health and restore depleted biomass
yields West Africa (Canary Current LME), east Africa (Somali and
Agulhas Current LMEs), Latin America (Gulf of Mexico, Humboldt
Current and Pacific Central American LMEs) and Asia (BOB LME).
The management methodology centered on productivity, fisheries,
pollution and ecosystem health, socio-economic and governance.
thThe Bay of Bengal (BOB) LME was the 34 out of the 64 LMEs
identified by the NOAA, UNEP, IOC and other international bodies.
The bay forms the northeastern part of the Indian Ocean, resembling a
triangle, and bordered by India and Sri Lanka to the West, Bangladesh
and India's West Bengal to the north, and Myanmar, southern part of
Thailand and the Andaman & Nicobar Islands to the east. The
southern boundary extends as an imaginary line from Dondra Head at 9the southern end of Sri Lanka to the northern tip of Sumatra . The
area covered by the BOB is 2,172,000 sq. km., with 2,090 km length,
1,610 km width and an average depth of 2,600 metres (maximum
4,694 km).
The LME has certain characteristic features:
i) Tropical climate with severe monsoon and cyclones.
ii) Ecosystems like wetlands, marshes, mangroves, etc. play an
important role in overall productivity.
iii) Coastal areas serving as nursery grounds for commercially
viable species.
Ecosystem Conservation and Management: The Concept of Large Marine Ecosystem

72 Journal of Coastal Environment
iv) Changing environment conditions influence currents,
productivity and coastal pollution.
v) A large part of population in the eight countries of BOB LME
depends on coastal resources for food and livelihood security
(over 400 million people living in the LME catchment area,
and many subsist at or below the poverty level).
vi) Many international, regional and sub-regional institutions
operate in the BOB, with similar and overlapping mandates.
Coastal ecosystemSince the coastal zone constitutes some of the world's most dynamic
and productive habitat, there have always been hectic human
activities in the area. The establishment of industries, ports, harbours,
tourism facilities, etc., has led to exponential growth of human
settlements along the coast. In addition, natural calamities, pollution
and devastation of natural habitat, have led to mounting ecological
pressure being put on the coastal environment. Some Critical factors
are:
i) Human population or manpower, which is our biggest strength,
has turned out, in the context of urbanisation, one of the biggest
threats to the environment, in conjunction with consumption
and pollution. By the year 2020, it is estimated that some of the
biggest cities will be in the BOB area Kolkata, Dhaka, Bangkok
and Jakarta. Added to that, land reclamation has further
aggravated the situation the Salt Lake City in Kolkata is the
prime example of low swamps and marshlands having been
dredged and filled, often at the detriment of civic amenities and 10coastal ecology.
ii) Coastal erosion takes largely during the months of June to
September when heavy surf and strong wave action takes away
part of the coast. A study by the Land Reclamation Project (LRP)
in Bangladesh has revealed that more than a thousand sq. km.
coastal land has been eroded in the Lower Meghna estuary. In Sri
Lanka, the most severe areas affected is the western and
southwestern coast of the 685 km of coastline, about 1,75,000 to
2,85,000 sq. metres of land is lost each year. The principal causes
of erosion are monsoon generated wave attacks, extraction of

73
sand and corals, and improperly sited buildings and maritime 11
structures.
iii) The growth of commercial activities, including infrastructure
development, in the coastal areas is due to transport advantages
(import/export) and the need for large quantities of water. The
resultant waste disposals, including discharge of highly toxic
material in the aquatic ecosystem and also oil spills, have
detrimental impacts on the coastal ecology. Toxic substances like
lead, mercury and cadmium enter the food chain of adjoining
population. On the other hand, shipping requires dredging of
channel and soil disposal, which affect the physical and
biological system in the area. Moreover, release of garbage and
ballast water from ships, along with pollution, anti-fouling paints 12and emissions, has severe impact on the marine ecosystem. The
IMO has adopted clear-cut guidelines against such pollution, but
each LME has to make its own institutional arrangements.
iv) The fishery sector is perhaps the strongest factor in the tropical
region of BOB that is well reflected in the catch composition.
Despite a steady rise in total landings, there are signs that the
harvest level may not be sustainable, especially with regard to
tuna fishing in the Maldives, Malaysia, Thailand's Andaman
coast and Sri Lanka. Heavy fishing through open access and
unauthorised incursion of foreign trawlers, conflicts between
artisanal and large scale fishermen, cyanide fishing in the LMEs
coral reefs, and pollution of mangroves, estuaries, coral reefs
(fish spawning and nursery areas) as well as coastal aquaculture
are major areas of concern. Most of the countries in the BOB
LME do not have adequate and appropriate policies, strategies
and measures for the sustainable management of fishery
resources. The Bay of Bengal Programme (BOBP) is a regional
fisheries project executed by the UN's Food and Agricultural
Organisation (FAO) to promote, facilitate and secure long-term
development and utilisation of coastal fisheries, based on
responsible fishing practices and environmentally sound
management programmes. The ultimate aim of the programme is
to connect member countries, exchange their resources and
knowledge, to help the fisher folk in livelihood opportunities and 13
improve their quality of life.
Ecosystem Conservation and Management: The Concept of Large Marine Ecosystem

v) For coastal biodiversity, the difficulty is that the river flow
towards the Bay of Bengal carry large amount of silts during the
monsoons not allowing the growth of corals, but mangroves grow
well. Not only these, even estuaries, lagoons, marshes, sandy
beaches and mudflats are severely threatened, in some areas
facing extinction, by logging operations, reclamation of swamps,
salt production and aquaculture. The waters off the Surabaya
coast in Indonesia show the existence of large volumes of
domestic and industrial waste, making it the second most
polluted coast after Jakarta Bay. A relatively weak control in the
eastern part of the archipelago makes it difficult to deal with
frequent violations like disposal of toxic/hazardous wastes and
trespassing in the catchment's zone almost 70% of coral reefs are
in degraded condition apart from fast depletion of mangrove
forests. Malaysia has also faced ecological problems like resource
depletion, destruction of natural habitat, beach erosion and
environmental degradation in Sabah, Sarawak and Pulau Pinang 14coastal areas.
vi) The destruction by tropical cyclones and storm surges in the Bay
of Bengal is ranked one of the foremost natural disasters,
surpassing even earthquakes. India's neighbouring countries like
Bangladesh, Sri Lanka and the Arakan coast of Myanmar are
severely affected devastating storm surges in Bangladesh in
November 1970 and April 1991 left hundreds of thousands of
people dead, apart from destroying livestock and property. A
group of scientists in IIT (Delhi) has implemented a storm surge
model at the India Meteorological Department (IMD) to predict 15
direction and track of the storm. Continuous radio broadcasts,
network of weather radar and high resolution images from
satellites help predict the location of the next strike, thus helping
to take advance steps in suspending fishing activities, closing
ports and harbours, provision of shelter, stocking food and water,
and finally evacuation of population.
Institutional arrangementsThe ocean space is used more intensively today than a few decades
ago which has created new and significant source of pollution and
coastal degradation. The interplay of variety of elements, such as
74 Journal of Coastal Environment

75
geography, depth, temperature, water currents, coastal habitats,
nutrient influx and food chain, create the natural system which in
turn are affected by human interference. The world community took
cognisance of the deteriorating condition when the 1972 Stockholm
Conference on Human Environment referred to the menace of
pollution. The 1982 UN Convention on the Law of the Sea (UNCLOS
III) indicates, in Part XII, the protection and preservation of the marine
environment, and measures to be taken to protect and preserve rare
and fragile ecosystems, as well as the habitats of depleted, threatened 16and endangered species, and other form of marine life.
By the time, the UN Conference on Environment and Development
(UNCED, 1992) met in Rio; the need was felt for a more holistic
approach to ocean use management. The Chapter 17 of Agenda 21 of
UNCED was entitled, “Protection of Oceans, all kinds of Seas and the 17Protection, Rational Use and Development of their Living Resources.
The burden of proof shifted from those who seek to protect the
environment to those who maintain that some ocean use is not
harmful (hence, not to rest on the assimilative capacity of coastal
waters). Those Conventions and legislations, along with subject
specific conventions under the IMO, UNEP, etc., underlined the fact
that despite the pattern of national enclosure of the ocean space, the
need for international cooperation would be the imperative need.
Even before the Earth Summit (1992), countries in the BOB region
initiated a number of programmes to protect their marine and coastal
environment, along with passage of domestic legislations on the
subject. India released the Ocean Policy Statement (1981), Maritime
Regulation Zone (MRZ, 1976), Coastal Regulation Zone (CRZ, 1991),
establishment of Central and State Pollution Control Boards (CPCB
and SPCB) to identify land based pollutants, as well as initiation of
scientific projects like Integrated Coastal and Marine Area
Management (ICMAM, 1997-98) and Coastal Ocean Monitoring and
Prediction System (COMPAS) for monitoring critical habitats and
effects of anthropogenic activities. Even other countries like Indonesia,
Sri Lanka and Bangladesh have developed their own coastal zone
management programmes, with assistance from international bodies
like the UNEP, World Bank, ASEAN USAID, WWF, Danish
International Development Agency (DANIDA), and so on.
Ecosystem Conservation and Management: The Concept of Large Marine Ecosystem

76 Journal of Coastal Environment
The need for regional and sub-regional cooperation arises mainly
because individual States face limitations in managing marine
resources on their own, as well as protecting their coastal/marine
environment. The UNEP had already taken the initiative with its
Regional Seas Programme, encompassing 18 marine regions and
participation by over 140 coastal States and territories, with Protocols
signed and ratified on pollution from land based sources, ocean 18
dumping and oil spill response. In the Bay of Bengal region, there
a l ready ex i s t in te rna t iona l , r eg iona l and sub- reg iona l
programmes/institutions like the Indian Ocean Fisheries Commission
(IOFC), Indian Ocean Tuna Commission (IOTC), the Bay of Bengal
Programme (BOBP IGO), Bangladesh-India-Myanmar-Sri Lanka-
Thailand Economic Cooperation (BIMST-EC), the UN Economic and
Social Commission for Asia and the Pacific (ESCAP), South Asian
Cooperative Environment Programme (SACEP), Indian Ocean Marine
Affairs Cooperation (IOMAC), and so on. But the most interesting and
productive development has been a recent partnership between the
Regional Seas Programme and the LME Project funded by the GEF to
bring about a more focused ecosystem based approach for the coastal
and marine environment.
ConclusionsThe ecosystem management for the coastal and marine areas adopts
an integrated and holistic approach covering both environmental and
socio-economic dimensions. The scale of operation and level of
management may vary with respect to geographical scale, but the
objective is basically similar, i.e. addressing crosscutting
environmental and sustainable development issues worldwide.
Although, to date, the BOB LME projects have tended to be at the
level of studies and projects, focusing on exploration and planning,
the real task is to move them to actual implementation. Also, the
initiatives focusing on pilot projects on estuaries and small areas of
the coast should be scaled up to national efforts on integrated coastal
zone management.
References
1. Sherman, Kenneth, 1991. The Large Marine Ecosystem Concept:
Research and Management Strategy for Living Marine Resources,
Ecological Applications, Vol. 1, No. 4, November. 349.

2. UNESCO, The Global Forum on Oceans, Coasts and Islands,
Reports from the Third Global Conference on Oceans, Coasts and
Islands, Paris, January. 23-28.
3. Jude, Lawrence, 1996. International Law and Ocean Use
Management, Routledge. 33.
4. See, http://www.edc.uri.edu/lme/intro.htm
5. UNESCO, n.2; see also, http://www.oceansatlas.org
6. See, http://www.springerlink.com…t820u5w66t8v.3853
7. Sherman, Kenneth and L.M. Alexander, 1993. Large Marine
Ecosystems: Stress, Mitigation and Sustainability, Washington
D.C., American Association for the Advancement of Science
(AAAS) Press. 301-19.
8. See, http://noaa.gov/ecosystem.html
9. See, “LME 34: Bay of Bengal”, http://na.nefsc.noaa/lme34.htm
10. Ravichandran, V., “Land Use and Land Cover Changes in the
Coastal Region: Need for an Integrated Approach”, in
http://csdngo.igc.org/agriculture
11. Qasim, S.Z., 1999. Coastal Erosion and Its Protection, Journal of
Indian Ocean Studies, Vol. 7, No. 1, November. 69-73; on
Bangladesh : Integrated Coastal Zone Management in
Bangladesh. A Policy Review, http://www.leeds.ac.uk /
cwpd/pdf/Biczmweb.pdf; on Sri Lanka, Seneviratne, Chandana,
“Coastal Zone Management in Sri Lanka: Current Issues and
Management Strategies”, in http://servesrilanka.blogspot.com /
coastal-zone-management-in-Sri-Lanka.htm
12. Kelkar, Captain Ravi, 2001. Protection of Environment at Sea.
Seagull (Pune), Vol. 6, No. 24, February-April. 33-34.
13. See, http://www.bobpigo.org/aboutbobp.htm; see also “LME 34: Bay
of Bengal”, n.9.
14. On Indonesia : Indonesia ICM Country Profile, http://www.
globaloceans/org/country; on Malaysia : ibid, “Malaysia ICM
Country Profile.
2006.
77Ecosystem Conservation and Management: The Concept of Large Marine Ecosystem

15. Rao, A.D. and Dube, S.K. Marine Hazards: Impact on
Coastal Inhabitants, SIOS Occasional Paper 3, New Delhi. 24-25.
16. World Commission on Environment and Development (WCED),
1987. Our Common Future, Oxford University Press. 62-65.
17. For Indian programme on coastal management, see Department of
Ocean Development, Annual Report, New Delhi, 2006-07; for
other countries, see n. 11, 14.
18. UNESCO, n.2, p.3; see also “LME 34: Bay of Bengal”, n.9.
2001.
78 Journal of Coastal Environment

Effect of Probiotics on Growth Performance of Juvenile Brown Marbled Grouper
1 1Mithun Sukumaran , Pradeep Padmaja Jayaprasad , 1 1Thekkeparambil Chandrabose Srijaya , Anuar Hassan , Mohammad
2 3 1Effendy Abdul Wahid , Zainudin Bachok and Anil Chatterji
Growth performance of the juvenile Epinephelus fuscoguttatus (Forsskal, 1775) upon dietary supplementation of probiotics for 90 days was successfully done. Different feeds incorporated at a ratio of 106 CFU/g feed with Brevibacterium sp. (BS) in Feed-B; Photobacterium damselae (PD) in Feed-C; Staphylococcus sp. (SS) in Feed-D; Feed-E with all three microbes (BS+PD+SS) and Control Feed-A without probiotics were tested. The growth performance including SGR, RGR and FCR were significantly different (P<0.05) with the probiotic fed fishes. The maximum percentage increments in body weight compared to control treatment were; 13.03, 21.01 and 30.05 and 34.04% with Feed-B, C, D and E, respectively. Nutritional evaluation of the microbes showed saturated fatty acid (FA) highest in PD (57.0%), branched FA with 10.6% and monounsaturated FA with 34.5% highest in BS, while polyunsaturated FA with 22.6% and other FA with 27.2% were highest in SP, showing their promising applications in the field of aquaculture.
IntroductionAquaculture activity requires better quality feeds with higher protein
contents, which would contain not only necessary nutrients but also
complementary additives to keep the organism healthy with better
growth. Some of the most utilised growth-promoting additives in
artificial feed include hormones, antibiotics, ionophores and different
salts Fuller, 1992; Klaenhammer and Kullen, 1999). Though these
1 Institute of Tropical Aquaculture, University Malaysia Terengganu.2 Institute of Marine Biotechnology, University Malaysia Terengganu.3 Institute of Oceanography, University Malaysia Terengganu.
Jour. Coast. Env., Vol. 2, No. 1, 2011
Abstract
Keywords: probiotics, Epinephelus fuscoguttatus, growth performance, Blood glucose, Fatty acid

additives do promote growth, their improper use can sometimes result
in adverse effects in the fish and the final consumer (Lara-Flores et al.
2003).
Alternatives for the antibiotics have evolved in different forms of
microorganisms in the live and particulate form, and they are known
as 'Probiotics'. Considering the performance of probiotics, the
application of such micro-organisms in aquaculture as the
environmentally friendly technology has been increasing rapidly
(Gatesoupe, 1999, 2002, 2007; Suzer, et. al. 2008; Merrifield, et. al.
2009). Few studies clearly demonstrated that the application of
probiotic helped in improving the intestinal microbial balance that led
to improved food absorption (Lara-Flores, et. al. 2003; Venkat et al.
2004; Carnevali, et. al. 2006; El-Haroun, et. al. 2006; Yanbo, 2007;
Merrifield et al. 2009; Saenz de Rodriganez, et. al. 2009), digestive
enzymes activities (Tovar-Ramirez et al. 2004) and reduction in
pathogenic problems associated with gastro-intestinal tract (Cole and
Fuller 1984; Goren et al. 1984).
Brown marbled grouper (BMG), Epinephelus fuscoguttatus (Forsskal,
1775) besides their acceptability as an expensive food fish, their
commercial production could not meet its growing market demands
due to their poor survival rate of the larvae under the hatchery
conditions (Fukuda, et. al. 1999), slow growth rate and several disease
problems (Subramaniam, 1999; Seng, 2001; Pomeroy, et. al. 2002).
According to Marte (1999), development of a commercial diet for
grouper was a requisite for the challenges raised to the matter of
sustainability of the species. In the present research an effort was
made with a prime aim to improve growth rate and shortening the
culture period of BMG by using biological active agents (probiotics)
incorporated with the commercial feed.
Materials and methodsIsolation and identification of bacteriaMicrobiota associated with the gut of the brown marbled grouper
(BMG) collected from wild (12 fishes) was isolated as per the methods
described by Carnevali, et. al. (2004). These microbes were stocked in
the Disease Laboratory of the Institute of Tropical Aquaculture,
University Malaysia Terengganu. Among the different microbes
80 Journal of Coastal Environment

associated with gut, Brevibacterium sp. (BS), Photobacterium damselae
(PD) and Staphylococcus sp. (SS) were identified using 16S rDNA
method and selected for the current study.
Feed preparationThe broth with three strains of microbes was incubated in 200 ml
disposable centrifuge tubes for 48-72 hours in an incubating shaker omaintaining a temperature of 37 C and speed 120 rpm. The broth was
othen dispensed by centrifugation at 3000 rpm for 25 minutes at 4 C.
At first the commercial pellets (Asean, Taiwan) were powdered and 6
mixed with three different strains of microbes (approximately 10
CFU/g) as described by Carnevali, et. al. (2006). The pellets with
required size were made using a pelletiser that was fitted with a size
adjustable eluter. Four feeds namely; Feed-B (BP); Feed-C (PD); Feed-D
(SP) and Feed-E with a mixture three selected probionts such BP, PD
and SP (BPS) and a control without any probiont as Feed-A were
prepared. The protein, fat, ash, moisture and fibre contents of the
different feeds were approximately 43, 6, 16, 3 and 11% respectively.
The pellets incorporated with different microbes were stored oseparately in a refrigerator at 4 C for further use.
Experiment fishesFishes for the present experiment was obtained from a Marine Fin Fish
Research Institute (MFFRI), Tanjung Demong, Kuala Besut, Malaysia.
The juveniles of the fish ranging in size from 2.5-3 cm with average
weight of 1.09+0.2 g were taken for the experiment. Weighed
juveniles were introduced into the experimental tanks and kept for
acclimatization for 7 days before the commencement of the
experiment. Control diet without any probiotics was fed to fishes
during the acclimatization period.
Experimental setupTriplicate of five groups with 12 fish in each tank (100 l) were
maintained for 90 days in the present experiment. The fishes were fed
with 3% of their body weight with an increase of 1% feed every 30 st th
days (fed till satiation) to reach 5% of the ration from 61 till 90 day
of the experiment. This process of feeding schedule was followed to
avoid cannibalism among the fishes. The weighed feeds were given
three times a day at 0800, 1300 and 1900 hrs. Unfed feed was
81Effect of Probiotics on Growth Performance of Juvenile Brown Marbled Grouper

collected everyday (1 hr after each feeding time) by siphoning the ounfed feed on a filter paper. The unfed feed was dried at 60 C in an
oven and weighed. Partial flow through with UV treated water for 3
hrs per day was given to the experimental tanks. However, a full time
recirculation of water at the rate of ~3000 l/hr was maintained after
filtering the water through a cotton filter. The cotton filters were
frequently cleaned and sun dried prior to use to avoid the
proliferation of opportunistic microbes. Water quality assessment was
monitored regularly to maintain uniformity in environmental o parameters. Dissolved oxygen (mg/l), salinity (ppt), temperature ( C)
and pH were measured by YSI 556 MPS (Yellow springs, Ohio 45387,
USA).
Growth performanceThe growth of fishes was checked at the interval of every 30 days.
thTotal weight of the juveniles per tank was recorded at first on the 30
day. Thereafter fishes were weighed individually (absolute weight) to th thassess the wet weights on 60 and 90 days of the experiment. The
growth performance with respect to weight gain, feeding rate, relative
growth rate (RGR), specific growth rate (SGR), food conversion ratio
(FCR) and percent increment were calculated as per the reports of
Chatterji, 1976, Palanivelu, et. al. 2005 and Zhou, et. al. 2008.
Weight gain (g) = Final weight (g) - Initial weight (g), Feeding rate =
Total food consumed (g) / (Number of days x initial weight of fish),
Relative growth rate, RGR (%) = (Weight gain / Final weight of the
fish) x 100, Specific growth rate, SGR (%) = [ln (final weight in g) ln
(Initial weight in g) / (T T )] x 100, where, T and T are the time of 2 1 1 2
observations. Food Conversion Ratio, FCR = [Total food consumed
(Total feed casting Total feed residue)] / Total weight gain of the fish
(g). Percentage increment (growth) with respect to control, %
increment = [(Difference of body weight of control and Experiment
fishes) / Body weight of Control fishes] x 100.
Blood Glucose levelthAt the 90 day, a sterile surgical blade was used to make a small
incision at the caudal vein to collect a drop of blood onto a glucose
check strip (Accutrend Glucose). The blood glucose level (mg/dl) was
checked by a hand held glucometer (Accutrend GCT Roche, Germany).
82 Journal of Coastal Environment

Triplicate samples were taken from each group for the measurement of
blood glucose level.
Nutritional composition of probiontsThe protein content of the three probionts was estimated following the
standard methods of Bradford (1976), as per the prescriptions of
commercial kit (Bio-Rad Protein Assay Dye Reagent concentrate, 500-
00006). The absorbance was measured at 595 nm on plate reader
(Thermo Electron Corporation, Multi scan Ascent) and the percentage
protein content was expressed in AM+SD. One step method as
described by Abdulkadir and Tsuchiya (2008) combining the
extraction and esterification processes were used for the estimation of
fatty acid. Briefly, nonadecanoic acid (19:0) was used as the internal
standard. Fatty acid methyl esters (FAMEs) were separated and
quantified using a gas chromatograph (GC Flame Ionization Detector,
Agilent Technologies, 680N) with FFAP-polar capillary column (30 x
0.25 m; 0.15 µm internal diameter) and helium as carrier gas.
Quantitative (expressed as percentage) and composition of individual
fatty acids were calculated by comparing the peak area of each fatty
acid with the total peak area of all fatty acids in the sample. Data were
presented as concentration (mg/g) and percentage of individual fatty
acids.
Growth performance and feed utilization efficiency parameters were
statistically compared using one-way ANOVA (P<0.05), and
differences among means were identified using 'tuckey's test' for
comparison. Analysis was carried out with OriginPro 7.0 version
computer statistical analysis software.
ResultsWater quality did not show any significant difference between and
within the different groups of fishes fed with different probiotics
incorporated diets. The dissolved oxygen, water temperature, pH and osalinity were in the range of 6.26+0.41 mg/ml; 27.92+0.52 C,
7.78+0.15 and 32.77+0.63 ppt, respectively.
Growth performanceIn all the sets of experiment, the survival of fishes was 100%. The
increase in average body weights in fishes for all groups for 90 days
(at 30 days interval) experiment is presented in Figure 1. The
83Effect of Probiotics on Growth Performance of Juvenile Brown Marbled Grouper

84 Journal of Coastal Enviornment
maximum weight attained by the juveniles was with Feed-E
(11.42+0.22 g), however, the control Feed-A showed only 8.52+0.21 g that 90 day. Similarly, maximum average increase in weight gain
th(34.04%) was recorded with the combined feed (Feed-E) after 90 day
as compared to the control feed (Feed-A). The increase in growth was
13.03, 21.01 and 30.05% with Feed-B, Feed-C and Feed-D, respectively.
Feeding rate, SGR, RGR and FCR showed significant differences
(P<0.05) after 90 days experiment (Table 1). Compared to the control
group, the feed incorporated with probiotics showed better FCR
whereas, the minimum value was obtained for Feed-D.
Growth performance of the juveniles of BMG using different probiotic incorporated diets. (The data is presented in arithmetic mean+standard
a, bdeviation; significantly different from the control at P<0.05 and 0.005, respectively.
0 1.03+0.02 - - - -
30 3.26+0.10 2.23+0.11 16.87+1.49 68.38+1.45 3.84+0.15
A 60 6.70+0.13 3.43+0.08 33.39+1.66 51.31+0.89 2.40+0.06 1.77+0.03
90 8.52+0.21 1.83+0.24 47.00+0.22 21.43+2.40 0.80+0.10
0 1.10+0.02 - - - -
30 3.52+0.10 2.42+0.08 17.55+0.92 68.75+0.52 3.88+0.05
aB 60 7.37+0.14 3.85+0.04 33.03+0.31 52.26+0.55 2.46+0.04 1.67+0.14
a90 9.63+0.62 2.25+0.72 46.22+0.54 23.15+6.19 0.88+0.26
0 1.03+0.04 - - - -
a a a30 3.72+0.11 2.69+0.12 16.45+1.01 72.28+1.38 4.28+0.17
aC 60 7.97+0.11 3.85+0.04 33.96+1.98 53.30+1.01 2.54+0.07 1.66+0.13
b90 10.31+0.23 2.25+0.72 46.48+1.45 22.70+2.60 0.86+0.11
0 1.05+0.04 - - - -
a b a30 3.94+0.17 2.89+0.14 15.91+1.21 73.34+0.93 4.41+0.12
a aD 60 8.37+0.20 4.43+0.04 33.08+0.86 52.91+0.90 2.51+0.06 1.59+0.05
b90 11.09+0.25 2.73+0.36 46.03+0.94 24.56+2.82 0.94+0.12
0 1.10+0.00 - - - -
a b a30 4.04+0.07 2.94+0.07 17.10+0.68 72.77+0.50 4.34+0.06
a b bE 60 8.60+0.20 4.56+0.27 34.39+0.97 53.02+1.87 2.52+0.13 1.66+0.02
b a90 11.42+0.22 2.81+0.05 47.98+0.24 24.65+0.43 0.94+0.02
Table 1
Feed Days Absolute weight
(g)
Weight gain(g)
Feeding rate-1(mg fish
-1day )
Relative growth rate (RGR) (%)
Specific growth rate (SGR) (%)
FCR

85
Fig. 1
A comparison of feeds incorporated with different probionts during 90 days of experiment. (a: P<0.05; b: P<0.005)
Blood glucoseThere was no significant change (P>0.05) with the blood glucose level
in fishes fed with probiotics and the control group. The mean blood
glucose levels were; 4.53+0.3, 4.54+0.5, 4.55+0.5 and 4.55+0.4 mg/dl
for Feed-B, Feed-C, Feed-D and Feed-E, respectively. However, the
control group (Feed-C) showed values of 4.55+0.2 mg/dl which was
not significantly different than the other feeds used with probionts.
Nutritional composition of probiontsThe probionts showed 0.037, 0.132 and 0.05 % protein content with
the BS, PD and SS, respectively. Individual fatty acid concentrations
of the three selected probionts obtained by one-step method are
presented in Table 2. As many as 18 fatty acids (FA) were identified
from the three probionts, where the predominant ones were saturated -1
fatty acids (SFA). The presence of C15:0 (15.14+3.64 mg g ) and C17:1 -1
(13.89+2.99 mg g ) in large quantities was observed in BS, while 17:1 -1 -1
(13.895+2.99 mg g ) and 15:0 (15.14+ 3.64 mg g ) with PD and 12:0 -1
(0.645+0.35 mg g ) with SS, respectively.
Effect of Probiotics on Growth Performance of Juvenile Brown Marbled Grouper

86 Journal of Coastal Environment
Table 2
BSFatty Acids
PD SS
-1Fatty acid in Bacteria (mg g )
Fatty acid composition (mg g-1) of probionts (dry weight)
Saturated
8:0 0.18+0.01 0.89+0.67 0.28+0.26
10:0 0.10+0.06 0.15+0.17 0.04+0.03
11:0 0.12+0.02 - -
12:0 0.31+0.14 1.26+1.52 0.65+0.35
14:0 - 1.93+1.29 -
15:0 15.14+3.64 - -
17:0 - 9.18+7.15 1.57+0.42
18:0 - 4.19+3.43 -
21:0 0.160 - -
Branched
15:0 iso - 0.58+0.29 0.05+0.01
15:0 anteiso - 0.51+0.49 0.09+0.02
16:0 iso 2.36+0.43 - -
16:0 anteiso 2.08+0.32 - -
Monounsaturated
14:1 0.57+0.18 - 0.42+0.11
17:1 13.90+2.99 - -
Polyunsaturated
18:3n3 - 4.46+3.51 1.15+0.06
18:3n6 0.49 - -
20:5n3 - 0.69+0.37 0.24
Unidentified 6.52 7.08 0.88
Twelve different types of fatty acids were identified from BS, while 11
and 10 types from PD and SS, respectively. Fatty acids such as 11:0
(undecanoic acid), 21:0 (heneeicosanoic acid), 16:0 iso, 16:0 anteiso,

87
17:1 (heptadecenoic acid) and 18:3n6 (gammalinolenic acid) were
present in BS. Octanoic acid (8:0), 10:0 (decanoic acid) and 12:0
(dodecanoic acid) were present in all the three probionts. While, 14:0
(tetradecanoic acid) and 18:0 (octadecanoic acid) were present only in
PD. 17:0 (heptadecanoic acid), 15:0 iso, 15:0 anteiso, 18:3n3
(alphalinolenic acid, ALA) and 20:5n3 (eicosapentaenoic acid, EPA)
were present in PD.
Fatty acid class concentration (%) is shown in Figure 2. High
concentration of SFA was reported in all the three probionts.
Monounsaturated fatty acid (MUFA) was not detected in PD. The
method also categorised unidentified fatty acids as other fatty acids
(OFA). Among all the fatty acids, SFA was the highest in PD (56.92%).
Branched fatty acid (BRFA) with 10.59% and MUFA with 34.49% were
highest in BS while, polyunsaturated fatty acid (PUFA) and OFA in SS
with 22.63 and 27.20 %, respectively.
Fig. 2
Fatty acid class composition (expressed as % of total FA content) in three different probionts. SFA: Saturated fatty acids, BRFA: Branched fatty acid, MUFA: Monounsaturated fatty acid, PUFA: Polyunsaturated fatty acid and OFA: Other fatty acid).
Effect of Probiotics on Growth Performance of Juvenile Brown Marbled Grouper

88 Journal of Coastal Envrionment
DiscussionFood utilization is an important factor governing the growth and
reproduction of animals which is affected by various environmental
and biological factors (Arunachalam, et al. 1985; Palanichamy, et al.
1985 a and b; Palanivelu, et al. 2005). In the present study food
utilization parameter in E. fuscoguttatus has been studied in detail
with reference to the effect of probiotics incorporated in control diets
for a period of 90 days. The results of this present study indicated that
the incorporation of probiotics in commercial feed had improved the
growth performances of BMG. It has also been supported by the
reports of Irianto and Austin (2002) that showed the presence of gut
associated probionts in the wild fishes when incorporated in feed
helping better growth performance. Better growth performance by the
probiotic supplementation through diets was shown by many species
(Yanbo and Zirong, 2006; Daud and Alimon, 2007; Yanbo, 2007;
Merrifield, et. al. 2009; Saenz de Rodriganez, et. al. 2009).
The pathogenic effect is a prime concern while selecting a 'probiotic'
(FAO 2002). The species related to the selected probionts of the
current study has been reported for their pathogenic effects in some
fishes (Grin'ko, et. al. 2009; Jiin-Ju, et. al. 2009; Knox et al. 2005).
Though they are treated as pathogens, reports are also available on the
usage of similar strains as probiotics such as Brevibacterium sp.
(Reddy, et. al. 2003; Shkoporov et al. 2008). Hitherto, there is no
report available on the probiotic applications of Photobacterium
damselae and Staphylococcus spp. Since no mortality and symptoms
of disease was recorded during the experimental duration, it has
proven the safety of the microbes on the host's health.
In the present study the difference in feed intake with different feeds
could be related with the food selection as it has been observed by
Heath (1987). Our results clearly indicated that the performance of
growth in E. fuscoguttatus which was directly related with different
species of probionts as observed in common carps by Yanbo and
Zirong (2006). The best FCR values were observed with feed
incorporated with probiotics which suggested that the addition of
probiotics has improved feed consumption (Lara-Flores, et. al. 2003;
Yanbo and Zirong, 2006). Our studies clearly showed that though the
intake of feed incorporated with probiotic was not different than the

89
control diet, however, the growth performance of fishes were better in
all probiotic fed groups. A low requirement of such feeds necessary
for fish growth will certainly help in reducing the production cost. A
similar observation has been done by Ringo and Gatesoupe (1998)
where a significant improvement in the biological value of the diets
supplemented with probiotics was reported. Yanbo and Zirong (2006)
concluded that the feed incorporated with probiotics showed a high
increase in growth performance and a significant decrease in FCR
which supports the current results.
Several equations have been evolved in order to describe the growth
of the fish since many species of fishes have been found to follow
different growth patterns. In the present study RGR and SGR values
were the maximum with Feed-D followed by Feed-E. Yanbo and Zirong
(2006) also observed that the feed containing mixed probiotics showed
better RGR and SGR as compared to the control group in common
carp.
The biochemical studies accompanying probiotic applications is a
requisite to prove the health of the fish and also to compare the health
of the control fed fishes with this group of fishes. The current
experiment showed no significant difference in blood glucose level
between the treated and control group of fishes. According to El-
Rhman, et. al. (2009) an increase in blood glucose level with probiotic
exposure is an indication of the stress and could be a chance of
pathogenecity of the microbe administered to the fish. The usage of
microbes selected in the present experiment could be thus considered
as potential probionts in aquaculture, especially for E. fuscoguttatus.
From a nutritional point of view and in agreement with the data of
Shelby, et. al. (2006), the present results revealed that the use of the
probiotic microbes as a feed additive for BMG is strongly
recommended to stimulate productive growth performance and
nutrient utilization. The nutritional composition of the microbes
especially with high presence of fatty acid and protein content was an
additional remark to be considered as probiotics. The effect of highly
unsaturated fatty acids (HUFA) on the growth performance of the
fishes has been reported earlier (Schauer, et. al. 1980; Wilson, 1991;
Watanabe and Kiron, 1994; Izquierdo, 1996; Sargent, et. al. 1999;
Effect of Probiotics on Growth Performance of Juvenile Brown Marbled Grouper
Izquierdo, et. al. 2000; Huynh and Kitts 2009). The presence of
heptadecanoic (17:0), branched (15:0) iso and anteiso, EPA, ALA with
PD and SS is an additional remark as a probiotic and could have been
the reason for the better growth performance of the fishes fed with
incorporated microbes (Kastel, et. al. 2007). The influence of PUFAs
on teleost physiology has been reported by Sorbera, et. al. 1998, 2001;
Bruce et al. 1999.
Feed utilization was the highest in BMG fed with mixture of
probiotics-supplemented diets that showed the nutrients were more
efficiently used for growth performance. The addition of probiotics
will certainly be reduced the culture cost as evident from the present
study where it has been clearly demonstrated that the probiotics
incorporated feeds enhances the growth performance and better feed
utilization in fishes. Further researches should be required to detect
the mode of action of probiotics, their genetic expression on growth
and immune response.
AcknowledgementsThe authors are grateful to Prof. Faizah Shaharom, Director, Institute
of Tropical Aquaculture, University Malaysia Terengganu, for
providing necessary laboratory facilities. The authors (MS, STC and
PPJ) would also like to thank Ministry of Higher Education, Malaysia
for providing graduate research fellowships. One of the authors (AC) is
grateful to UMT for providing Principal Research Fellowship. The
study is a part of a project supported by the Fundamental Research
Grant Scheme of Ministry of Science and Technology (MOSTI),
Government of Malaysia (Vote No: 59120).
References
Abdulkadir, S. and Tsuchiya, M. 2008. One-step method for
quantitative and qualitative analysis of fatty acids in marine animal
samples. Journal of Experimental Marine Biology and Ecology. 354, 1-8.
Arunachalam, S., Palanichamy, S. and Balasubramanian, M.P. 1985.
Sub-lethal effects of carbaryl on food utilization and oxygen
consumption in the air breathing fish Channa punctatus (Bloch).
Journal of Environmental Biology. 6. 279-286.
Journal of Coastal Environment90

Bradford, M.M. 1976. A rapid and sensitive method for the
quantification of microgram quantities of protein. Analytical
Biochemistry. 72. 248.
Bruce, M., Oyen, F., Bell, G., Asturiano, J.F., Farndale, B., Ramos, J.,
Bromage, N., Carrillo, M. and Zanuy, S. 1999. Development of
broodstock diets for the European sea bass Dicentrarchus labrax with
special emphasis on the importance of ny3 and ny6 HUFA to
reproductive performance. Aquaculture. 177. 85-97.
Carnevali, O., Maria, C.Z., Roberto, S., Arianna, R., Miria, N., Carla,
O., Stefania, S., Massimi, C., Alberta, M.P. and Alberto, C. 2004.
Administration of probiotic strain to improve sea bream wellness
during development. Aquaculture International. 12. 377-386.
Carnevali, O., de Vivo, L., Sulpizio, R., Gioacchini, G., Olivotto, I.,
Silvi, S. and Cresci, A. 2006. Growth improvement by probiotic in
European sea bass juveniles (Dicentrarchus labrax, L.) with particular
attention to IGF-1, myostatin and cortisol gene expression.
Aquaculture. 258. 430-438.
Chatterji, A. 1976. Studies on the biology of some carps. Ph.D. thesis,
Aligarh Muslim University, Aligarh. pp. 122.
Chatterji, A., Ansari, Z.A., Ingole, B.S. and Parulekar, A.H. 1984.
Growth of the green mussel, Perna viridis L., in a sea water circulating
system. Aquaculture. 40. 47-55.
Cloern, J.E. and Nichols, F.H. 1978. A von Bertalanffy growth model
with a seasonally varying coefficient. Journal of the Fisheries Research
Board of Canada. 35. 1479-1482.
Cole, C.B. and Fuller, R. 1984. A note on the effect of host specific
fermented milk on the coliform population of the neonatal rat gut.
Journal of Applied Bacteriology. 56. 495-498.
Daud, H.M. and Alimon, A.R. 2007. Effect of Bacillus subtilis on
growth development and survival of larvae Macrobrachium rosenbergii
(de Man). Aquaculture Nutrition. 13. 131-136.
El-haroun, E.R., Goda, A.M.A.S. and Chowdhury, M.A.K. 2006. Effect
of dietary probiotic Biogen supplementation as a growth promoter on
growth performance and feed utilization of Nile tilapia, Oreochromis
niloticus (L.). Aquaculture Research. 37. 1473-1480.
91Effect of Probiotics on Growth Performance of Juvenile Brown Marbled Grouper

El-Rhman, A.M.A., Khattab, Y.A.E. and Shalaby, A.M.E. 2009.
Micrococcus luteus and Pseudomonas species as probiotics for
promoting the growth performance and health of Nile tilapia,
Oreochromis niloticus. Fish and Shellfish Immunology. 27. 175-180.
FAO. 2002. Guidelines for the evaluation of probiotics in food. Joint
FAO/WHO working group on drafting guidelines for the evaluation of th st
probiotics in food. London, Ontario, Canada, April 30 and May 1 .
pp. 11.
Fukuda, Y., Nguyem, H.D., Furuhashi, M. and Nakai, T. 1999. Mass
mortality of cultured seven band grouper, Epinephelus septemfasiatus,
associated with viral nervous necrosis. Fish Pathology. 31. 167-170.
Fuller, R. 1992. History and development of probiotics. In: Fuller, R.
(Ed.), Probiotics: the Scientific Basis, vol. 232. Chapman and Hall,
London. 1-18.
Gatesoupe, F.J. 1999. The use of probiotics in aquaculture.
Aquaculture. 180. 147-165.
Gatesoupe, F.J. 2002. Probiotic and formaldehyde treatments of
Artemia nauplii as food for larval pollack, Pollachius pollachius.
Aquaculture. 212. 347-360.
Gatesoupe, F.J. 2007. Live yeasts in the gut: Natural occurence, dietary
introduction, and their effects on fish health and development.
Aquaculture. 267. 20-30.
Goren, E., De Jong, W.A., Doornenbal, P., Koopman, J.P. and Kennis,
H.M. 1984. Protection of chicks against Salmonella infection induced
by spray application of intestinal microflora in the hatchery.
Veterinary Quarterly. 6. 73-79.
Grin'ko, O.M., Zverev, W., Kaloshin, A.A., Mikhailova, N.A. and
Arzumanian, V.G. 2009. Isolation and study of perspective probiotic
strain of spore-forming bacteria from Bacillus genus. Zhurnal
Mikrobiologii Epidemiologii Immunobiologii. 3. 85-89.
Heath, A.G. 1987. Water pollution and fish physiology. In:
Physiological Energetic. CRC Press, Florida, 131-163.
Holland, K.N., Brill, R.W., Chang, R.K.C., Sibert, J.R. and Fournier,
D.A. 1992. Physiological and behavioural thermoregulation in bigeye
tuna (Thunnus obesus). Nature (London). 358. 2518-2532.
92 Journal of Coastal Environment

Huynh, M.D. and Kitts, D.D. 2009. Evaluating nutritional quality of
pacific fish species from fatty acid signatures. Food Chemistry. 114.
912-918.
Irianto, A. and Austin, B. 2002 Probiotics in aquaculture. Journal of
Fish Disease. 25. 633-642.
Izquierdo, M.S. 1996. Essential fatty acid requirements of cultured
marine fish larvae. Aquaculture Nutrition. 2. 183-191.
Izquierdo, M.S., Socorro, J., Arantzamendi, L. and Hernández-Cruz,
C.M. 2000. Recent advances in lipid nutrition in fish larvae. Fish
Physiology and Biochemistry. 22. 97-107.
Jiin-Ju, G., Kuan-Fu, L., Shin-Hong, C., Chin-I, C., Jiunn-Jyi, L., Yueh-
O, H., Jan-Yen, Y. and Tzyy-Ing, C. 2009. Selection of probiotic bacteria
for use in shrimp larviculture. Aquaculture Research. 40. 609-618.
Kastel, R., Bomba, A., Vasko, L., Trebunova, A. and Mach, P. 2007. The
effect of probiotics potentiated with polyunsaturated fatty acids on the
digestive tract of germ-free piglets. Veterinary Medicine-US. 52. 63-68.
Klaenhammer, T.D. and Kullen, M.J. (1999) Selection and design of
probiotics. International Journal of Food Microbiology. 50. 45-57.
Knox, A.M., Viljoen, B.C. and Lourens-Hattingh, A. 2005. Inhibition of
Brevibacterium linens by probiotics from dairy products. Food
Technology and Biotechnology. 43. 393-396.
Lara-Flores, M., Olvera-Novoa, M.A., Guzman-Mendez, B.E. and
Lopez-Madrid, W. 2003. Use of the bacteria Streptococcus faesium and
Lactobacillus acidophilus, and the yeast Saccharomyces cerevisiae as
growth promoters in Nile tilapia (Oreochromis niloticus). Aquaculture.
216. 193-201.
Marte, C. 1999. Grouper research at the Southeast Asian Fisheries
Development Center Aquaculture Department. www.enaca.org /
grouper/research/hatchery/.
Merrifield, D.l., Bradley, G., Bakers, R.T.M. and Davies, S.J. 2009.
Probiotic applications for rainbow trout (Oncorhynchus mykiss
Walbaum) II. Effects on growth performance, fee utilization, intestinal
microbiota and related health criteria postantibiotic treatment.
Aquaculture Nutrition. 16, pp. 504-510.
93Effect of Probiotics on Growth Performance of Juvenile Brown Marbled Grouper

Palanichamy, S., Arunachalam, S. and Balasubramanian, M.P. 1985a.
Toxic and subeffects of ammonium chloride on food consumption and
growth in the air breathing fish Channa striatus. Warm Water
Aquaculture Hawaii. 465-480.
Palanichamy, S., Arunachalam, S. and Balasubramanian, M.P. 1985b.
Food consumption of Sarotherodon mossambicus (Trewaves) exposed
to sublethal concentration of diammonium phosphate. Hydrobiologia.
128. 233-237.
Palanivelu, V., Vijayavel, K., Ezhilarasibalasubramanian, S. and
Balasubramanian, M.P. 2005. Impact of fertilizer (Urea) on oxygen
consumption and feeding energetic in the freshwater fish Oreochromis
mossambicus. Environmental Toxicology and Pharmacology. 19. 351-
355.
Pomeroy, R., Agbayani, R., Toledo, J., Sugama, K., Slamet, B. and
Tridjoko. 2002. The Status of Grouper Culture in Southeast Asia. SPC
Live reef Fish Information Bulletin. 10. 22-26.
Reddy, L., Odhav, B. and Bhoola, K.D. 2003. Natural products for
cancer prevention: A global perspective. Pharmacology and
Therapeutics. 99. 1-13.
Ringo, E. and Gatesoupe, F.J. 1998. Lactic acid bacteria in fish: A
review. Aquaculture. 160. 177-203.
Saenz de Rodriganez, M.A., Diaz-Rosales, P., Chabrillon, M., Smidt, H.,
Arijo, S., Leon-Rubio, J.M., Alarcon, F.J., Balebona, M.C., Morinigo,
M.A., Cara, J.B. and Moyano, F.J. 2009. Effect of dietary administration
of probiuotics on growth and intestine functionality of juvenile
Senegalese sole (Solea senegalensis, Kaup 1858). Aquaculture
Nutrition. 15. 177-185.
Sargent, J., McEvoy, L., Estevez, A., Bell, G., Bell, M., Henderson, J.
and Tocher, D. 1999. Lipid nutrition of marine fish during early
development: Current status and future directions. Aquaculture. 179.
217-230.
Schauer, P.S., Johns, D.M., Olney, C.E. and Simpson, K.L. 1980. Lipid
level, energy content, and fatty acid composition of Artemia strains.
In: Persoone G, Sorgeloos P, Roels O, Jaspers E, editors. The Brine
94 Journal of Coastal Environment

Shrimp: Artemia, vol. 3. Wetteren, Belgium: Universa Press, pp. 365-
73.
Seng, L.T. 2001. Diseases of cultured marine fish. Aquaculture Asia. 3.
24-27.
Shelby, R.A., Lim, C.E., Aksoy, M. and Delaney, M.A. 2006. Effects of
probiotic feed supplement on disease resistance and immune response
of young Nile tilapias (Oreochromis niloticus). Journal of Applied
Aquaculture. 18. 23-34.
Shkoporov, A.N., Efimov, B.A., Khokhlova, E.V., Steele, J.L., Lyudmila,
L.K. and Smeianov, V.V. 2008. Characterization of plasmids from
human infant Bifidobacterium strains: Seqeuence analysis and
construction of E. Coli-Bifidobacterium shuttle vectors. Plasmid. 60.
136-148.
Sorbera, L.A., Zanuy, S. and Carrillo, M. 1998. A role for
polyunsaturated fatty acids and prostaglandins in oocyte maturation
in the sea bass Dicentrarchus labrax.. In: Vandry, H., Tonon, M-C.,
Roubos, E.W., de Loof, A. Eds.., Annals of the New York Academy of
Sciences. From Molecular to Integrative Biology, Trends in
Comparative Endocrinology and Neurobiology. 839. 535-537.
Sorbera, L.A., Asturiano, J.F., Zanuy, S. and Carrillo, M. 2001.
Mechanisms of action of polyunsaturated fatty acids and
prostaglandins on oocyte maturation in a marine teleost, the European
sea bass Dicentrarchus Labrax. Biology of Reproduction. 64. 382-389.
Subramaniam, K. 1999. Grouper aquaculture development in
Malaysia. www.enaca.org/grouper/research/hatchery/.
Suzer, C., Coban, D., Kamaci, H.O., Saka, S., Firat, K., Otgucuoglu, O.
and Kucuksari, H. 2008. Lactobacillus spp. bacteria as probiotic in
gilthead sea bream (Sparus aurata, L.) larvae: Effects on growth
performance and digestive enzyme activities. Aquaculture. 280. 140-
145.
Tovar-Ramirez, D., Zambonino, J., Cahu, C., Gatesoupe, F.J. and
Vazquez-Juarez, R. 2004. Influence of dietary live yeast on European
sea bass (Dicentrarchus labrax) larvae development. Aquaculture. 234.
415-427.
95Effect of Probiotics on Growth Performance of Juvenile Brown Marbled Grouper

Venkat, H.K., Sahu, N.P. and Jain, K.K. 2004. Effect of feeding
Lactobacillus-based probiotics on the gut microflora, growth and
survival of post-larvae of Macrobrachium rosenbergii (de Man).
Aquaculture Research. 35. 501-507.
Watanabe, T. and Kiron, V. 1994. Prospects in larval fish dietetics. Aquaculture. 124. 223-251.
Wilson, R.P. 1991. Handbook of Nutrient Requirements of Finfish.
C.R.C. Press, Bocaraton, pp. 196.
Yanbo, W. and Zirong, X. 2006. Effect of probiotics for common carp
(Cyprinus carpio) based on growth performance and digestive enzyme
activities. Animal Feed Science and Technology. 127. 283-292.
Yanbo, W. 2007. Effect of probiotics on growth performance and
digestive enzyme activity of the shrimp Penaeus vannamei.
Aquaculture. 269. 259-264.
Zhou, X., Yanbo, W. and Li, W. 2008. Effect of apiodacein on common
carp (Cyprinus carpio) growth performances and immune function.
Aquaculture. 279. 108-112.
96 Journal of Coastal Environment

Environmental Control over the Distribution of Foraminiferan Assemblages
at the Kuantan Mangrove Ecosystem
Mohd-Lokman Husain*, Sulong Ibrahim, Zainuddin Bachok and Ravindran Chandran
A study was conducted at Kuantan mangrove areas in Pahang in Malaysia to determine the distribution of foraminiferan assemblage with relation to environmental parameters such as sediment texture, elevation, salinity, pH and total organic carbon. The distribution of benthic foraminifera was evaluated by analysing the surface sediment samples collected along 3 transects. In addition, core sediments were also collected to determine the changes in foraminiferan distribution with depth using univariate and multivariate data analysis performed by using Canoco 4.5 and PRIMER v.6 statistical packages. Overall there were 25 foraminiferan species in the surface sediments. Most of the foraminiferan species were agglutinated type. Arenoparella mexicana and Miliammina fusca were the most dominant species at Kuantan mangrove sites. Further analysis using cluster analysis, multidimensional scaling and Canonical Correspondence Analysis (CCA) showed that there were 2 main similar based associations and 2 sub-associations. The two main associations were Arenoparella mexicana / Miliammina fusca/ Haplophragmoides wilberti in Kuantan mangrove. The 2 sub-associations were Haplophragmoides wilberti/ Miliammina fusca / Trochammina hadai sub-association and Arenoparella Mexicana / Miliammina fusca sub-association in Kuantan mangrove. All associations those were found in Kuantan mangrove areas are new record for the east coast of Peninsular Malaysia mangrove ecosystem. The correlation between the environmental parameters with the foraminiferan distribution showed that total organic carbon content, vegetation, sediment texture, and elevation were the most influential factors in this study area. However, pH and salinity exerted less influence on the distribution of foraminifera comparatively.
IntroductionForaminifera are unicellular testate marine organism with a long
stratigraphic history (Loeblich and Tappan, 1964; Scott and Medioli,
* Professor, Institute of Oceanography, University Malaysia Terengganu.
Jour. Coast. Env., Vol. 2, No. 1, 2011
Abstract
98 Journal of Coastal Environment
1986). Generally, foraminifera are marine animals with few brackish or
even fresh water species. Foraminifera are single-celled animals which
belong to the protozoa group. A number of foraminiferans developed
shell made of calcareous material secreted by the animal itself,
agglutinated foreign material or chitin (Cushman, 1948). Even though
foraminifera exclusively unicellular but it can function as
multicellular animals. Foraminifera can eat, defecate, grow, move,
reproduce and respond to variety of stimuli. This is because
foraminifera and other protists occupy sub-cellular components as
organelles to perform these various function. There are two broad
morphological features which distinguished the foraminifera from
other protists which is granulo-reticulopodia and the test (Sen Gupta,
1999). Foraminifera have planktonic and benthonic modes of life.
Studies on meiofauna in mangrove ecosystem started in the early 70's
focusing on the description of new species (Gerlach, 1957) and
changes of macroepifauna species composition with tidal height
(Macnae and Kalk, 1962). These studies have not specifically focused
on benthic foraminifera. The same situation occurred in Malaysia
where the information on the foraminifera or researcher who involves
on foraminifera studies especially in mangrove area are very limited
(Alongi and Sasekumar, 1992; Lokman, et. al., 2008). Therefore, the
present paper aimed addressing the distribution of foraminifera in
Kuantan on the east coast of Peninsular Malaysia. In addition,
relationship between foraminifer's species and environment (sediment)
was also studied to identify the factors controlling their diversity and
distribution.
MethodologyStudy areaThe Kuantan mangrove forest situated on the east coast of Peninsular
Malaysia is facing the South China Sea. The area falls in the
administrative districts of Pahang (Lat: 3º46'-3º48'N and Long:103º17'-
103º20'E) as shown in Figure 1. The Kuantan mangrove habitat is
dominated by Avicennia alba, Rhizophara apiculata and Bruguiera
gymnorrhiza. The other species with low abundance are namely;
Xylocarpus granatum, Eucalyptus apiculata, Sonneratia caseolaris,
Bruguiera sexangula, and Bruguiera parviflora.

Sediment sample collection and analysisAt each transect, the surface sediment sample (10 cm² areas and 1 cm thickness) (in triplicates) was collected at 10 m intervals during low tide with the help of hand shovel. The samples were transferred in polythene sample bags and labelled. The samples were then washed within 36 hours of its collection. The sieving of the sediment sample was done by a set of sieves (63-600 µm mesh size). The residues from the small sieve were kept in a liquid suspension of formalin/Rose Bengal mixture for staining and preservation of foraminifera. The samples were then poured into Petri dish in the laboratory and the specimens (living and empty tests) were identified and counted (total count) separately under a binocular microscope under wet medium. Those samples with high number of specimens were split using a plankton splitter (Scott et al., 1996) and counted separately. The core sediment samples were collected from one place along each transect either at marsh edge, middle or back mangrove zone. The D-section corer was used to collect the core sediment (1 m length x 2 cm diameter). The samples then wrapped in plastic bags, labelled and brought to laboratory for species identification and down-core variation. At each sampling site, the elevation (MSL) was measured by a TOPCON theodolite surveying instrument. The elevation was
Study area of Kuantan Mangrove Ecosystem on the East Coast of Peninsular Malaysia (Round Label Indicates the Sampling Location)
99Environmental Control over the Distribution of Foraminiferan Assemblages at the Kuantan Mangrove Ecosystem
Fig. 1

100 Journal of Coastal Environment
measured along each transect with 10 m intervals at the sediments sample collection point. A separate portion of sediments (~250 g) was collected from each sampling for sand, clay and silt ratio in order to determine the sediment texture. The sediment was analyzed by applying initial (wet) sieving methods (Mesh No.240, British Standard) and followed by pipette analysis as described by Krumbein and Pettijohn (1938). To determine the percentages of total organic carbon (TOC) in sediment sample, the oxidation dichromate acid technique were used (Holme and McIntyre, 1971).
Multivariate analysisMultivariate analysis consisted of cluster analysis (CA),
multidimensional scaling analysis (MDS) and correspondence analysis
(CA). The cluster analysis was used as a matrix of similarity
coefficients computed between every pair of samples to construct a
dendrogram. This method was suitable to use in samples which were
expected to fall into natural groups. The ordination was more
appropriate for the faunal pattern that was related to a more
continuous environmental gradient (Clarke and Warwick, 1994).
Species richness (d') (Margalef, 1958), species diversity (H') (Shannon
and Weaver, 1949) and evenness (J') (Pielou, 1977) were the indices
used for species diversity. These indices were calculated using
standard protocols. Multidimensional scaling plot showed the samples
on a two-dimensional 'map' with the distances between samples
matching the rank of similarities from the similarity matrix. ''Stress
coefficient'' that was a measure of the extent to which the two sets of
ranks did not agree which determined the success of the plot. Ideally
stress showed <0.1 for a good ordination (Clarke and Warwick, 1994).
Cluster analysis and MDS often showed similar groupings whereas
Canonical Correspondence Analysis (CCA) was used to determine the
correlation between environmental variables and faunal community
(CANOCO for windows v.4.5) (ter Braak and Smilauer, 2002).
Results and Discussion
Species Abundance and DistributionA total number of 25 species of foraminifer were encountered from 99
sediment samples collected at Kuantan. Miliammina fusca (2232-6416 3individuals/10 cm ), and Arenoparella mexicana (2720-8272
3individuals/10 cm ) were the dominate species at the Kuantan

101
mangrove habitat (Table 1). The subdominant species were; 3
Haplophragmoides wilberti (408-1448 individuals/10 cm ) and 3Trochammina hadai (40-2984 individuals/10 cm ). The density of
foraminifera in Kuantan mangrove was low compared to Kapar and
Matang which are the largest mangrove forest in Peninsular Malaysia
in West Coast of Peninsular Malaysia. The sampling location was the
main reason for the lower density of foraminifera in this mangrove
sites as compared to Kapar and matang as reported by Lokman, et. al.
(2008). The Matang mangrove alone covers 40,000 hectares (about 154
square miles). It is also a best example of a sustainably managed
mangrove forest. The diverse vegetation presence may influence
foraminiferal production by helping in maintaining the moisture levels
and mitigating the environmental variability experienced by
specimens during tidal fluctuations (Steinker and Butcher, 1981;
Duchemin, et. al., 2005; Berkley, et. al., 2007). The low abundance of
the foraminifera within Kuantan mangrove might be due to high
sedimentation rate of the environment and its effect in concentrating
foraminifera. According Carricker (1967), muddier sediment tends to
contain higher density of microfauna than sandier sediments. This is
because muddy sediment contains higher organic content (Hayward et
al., 1999). Comparatively among transects at Kuantan mangrove area,
transect 3 (5880 individuals) have lower abundance of foraminifera as
compared to transect 1 (18728 individuals) and 2 (18024 individuals).
Flooding frequency might be the reason as transect 3 falls in lower
estuary while transect 1 and 2 in upper estuarine areas. The runoff
and discharge of water might be inundated daily the transect 3
washing away surface benthic foraminifera.
Foraminifera species abundance and diversity indices at Kuantan
Diversity Index Transect-1 Transect-2 Transect-3
No. of species 4-14 4-13 3-8
Numerical abundance 408-2944 464-3136 424-696-3(ind 10 cm )
Margalef (d') 0.493-1.709 0.485-1.491 0.331-1.088
Shannon-Weaver (H') 1.241-1.893 0.8301-1.614 0.755-1.369
Evenness (J') 0.647-0.895 0.380-0.752 0.521-0.851
Table 1
Environmental Control over the Distribution of Foraminiferan Assemblages at the Kuantan Mangrove Ecosystem

Sediment CharacteristicsOverall the sediment texture in Kuantan mangrove could be classified
as silt loam as shown in Table 2. This is because the mean particle
size at Kuantan (Table 2) indicated that the sediments are
predominantly of silt loam in nature (silt: 70%, sand: 20%, clay: 10%)
However pH, salinity and total organic carbon did not vary much at
all sampling station. The pH was ranged between 5 and 8 where the
marsh edge or front mangrove showed high value of pH as compared
to back mangrove zone. There was less crab mound and burrows in
back mangrove as compared to front mangrove. Moreover, the low pH
was also due to high bacterial activity, poor quality of inorganic matter
and translocation of oxygen by mangrove trees (Alongi and Sasekumar,
1992; Lokman, et. al., 2008).
The salinity of the soil was fluctuated within the range of 21 to 30
between the marsh edge and back mangrove zone. The high salinity
(25-30 psu) persisted at the front mangrove zone which was due to
strong tidal influence while low salinity (21-24 psu) could be found at
back mangrove zone due to seepage.
Based on the faunal abundance (root-transformed data), the Kuantan
samples could be grouped into 16 associations at 50% similarity (Fig
2). The main association was Arenoparella mexicana / Miliammina
fusca / Haplophragmoides wilberti / Trochammina hadai. However, the
initial groupings of foraminifera based on the Bray-Curtis similarity
showed that Group I (Arenoparella mexicana, Miliammina fusca,
Haplophragmoides wilberti, Trochammina hadai) was the dominant
102 Journal of Coastal Environment
Sediment characteristics (Range) at Kuantan mangrove
Sampling pH Salinity Sand Silt Clay Total zones (psµ) (%) (%) (%) (%) Organic
carbon
Transect 1 8-Jun 21-30 2.87-32.45 58.59-75.38 0.48-36.54 19-21
Transect 2 8-May 25-30 8.24-18.67 63.19-74.76 12.35-22.92 19.5-21
Transect 3 8-Jun 22-30 10.19-26.87 49.25-72.76 2.94-40.32 19.92-21
Table 2
Species-Sample Association (=Groupings)

group in Kuantan mangrove (Fig. 2.) The species and sample
groupings were the same for this study area. The occurence of
Miliammina fusca in mangrove sediment was common and widely
distributed in low saline zone (Murray,1991).The Miliammina fusca
was the most widespread foraminiferan species in brackish
environments both in New Zealand and around the rest of the world
(Murray, 1991; Hayward & Hollis, 1994; Scott et al., 1996).However
the dominance of Arenoparella mexicana and Haplophragmoides
wilberti indicated that the sampling zone was highest in the mangrove
area (de Rijk, 1995). Arenoparella Mexicana, Haplophragmoides spp
also generally inhabited the vegetated marsh (Williams, 1994; Collins
et al., 1995; Goldstein et al., 1995; de Rijk and Troelstra, 1997; Ozarko
et al., 1997; Hayward et al., 1999; Hippensteel et al., 2002; Edwards et
al., 2004; Barbosa et al., 2005; Horton et al., 2005; Woodroffe et al.,
2005). However, the occurence of Trochammina hadai was common in
Japanese estuaries. It was introduced into in the 1980s into San
Francisco Bay, California, where the occurrence of this species is now
in abundance.
Species groupings based on the Bray-Curtis similarity at Kuantan mangrove
Fig. 2
103Environmental Control over the Distribution of Foraminiferan Assemblages at the Kuantan Mangrove Ecosystem

104 Journal of Coastal Environment
Canonical Correspondence Analysis (Species- Environmental Biplot) showing the Correlation between Environmental Variables (AA: Avicennia alba; RA: Rhizophora apiculata; BG: Bruguiera gymnorrhiza; BP: Bruguiera
parviflora; SC: Sonneratia caseolaris; EA: Eucalyptus apiculata; XG: Xylocarpus granatum; BS: Bruguiera sexangula ) and Foraminiferal Species in Kuantan Sediments (Genus names: Q: Quinqueloculina; T: Trochammina;
Tro: Trochammina; A: Ammotium; Am: Arenoparella mexicana; S: Siphotrochammina; Tip: Tiphotrocha; Mcf: Miliammina cf; Tex: Textularia;
As: Ammoastuta; Tri: Triloculina; H: Haplophragmoides)
Fig. 3
Canonical Correspondence Analysis (Fig. 3) was conducted in order to
determine the variability in the environmental parameters (i.e.,
sediment texture- sand, silt and clay, total organic carbon-TOC, pH,
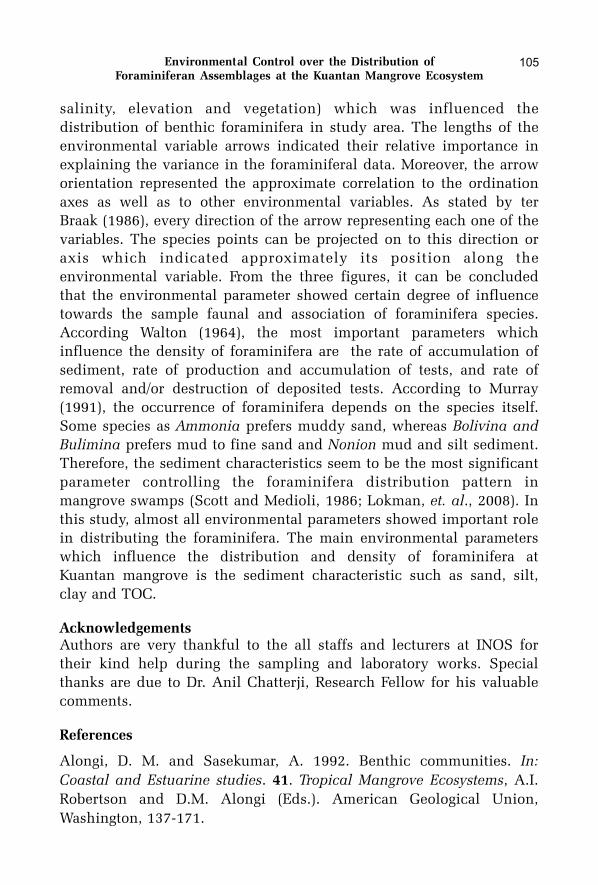
salinity, elevation and vegetation) which was influenced the
distribution of benthic foraminifera in study area. The lengths of the
environmental variable arrows indicated their relative importance in
explaining the variance in the foraminiferal data. Moreover, the arrow
orientation represented the approximate correlation to the ordination
axes as well as to other environmental variables. As stated by ter
Braak (1986), every direction of the arrow representing each one of the
variables. The species points can be projected on to this direction or
axis which indicated approximately its position along the
environmental variable. From the three figures, it can be concluded
that the environmental parameter showed certain degree of influence
towards the sample faunal and association of foraminifera species.
According Walton (1964), the most important parameters which
influence the density of foraminifera are the rate of accumulation of
sediment, rate of production and accumulation of tests, and rate of
removal and/or destruction of deposited tests. According to Murray
(1991), the occurrence of foraminifera depends on the species itself.
Some species as Ammonia prefers muddy sand, whereas Bolivina and
Bulimina prefers mud to fine sand and Nonion mud and silt sediment.
Therefore, the sediment characteristics seem to be the most significant
parameter controlling the foraminifera distribution pattern in
mangrove swamps (Scott and Medioli, 1986; Lokman, et. al., 2008). In
this study, almost all environmental parameters showed important role
in distributing the foraminifera. The main environmental parameters
which influence the distribution and density of foraminifera at
Kuantan mangrove is the sediment characteristic such as sand, silt,
clay and TOC.
AcknowledgementsAuthors are very thankful to the all staffs and lecturers at INOS for
their kind help during the sampling and laboratory works. Special
thanks are due to Dr. Anil Chatterji, Research Fellow for his valuable
comments.
References
Alongi, D. M. and Sasekumar, A. 1992. Benthic communities. In:
Coastal and Estuarine studies. 41. Tropical Mangrove Ecosystems, A.I.
Robertson and D.M. Alongi (Eds.). American Geological Union,
Washington, 137-171.
105Environmental Control over the Distribution of Foraminiferan Assemblages at the Kuantan Mangrove Ecosystem

106 Journal of Coastal Environment
Barbosa, C. F., Scott, D. B., Seoane, J. C. S. and Tureq, B. J. 2005.
Foraminiferal zonations as baselines for Quaternary sea-level
fluctuations in South-Southeast Brazilian mangroves and marshes.
Journal of Foraminiferal Research, 35(1). 22-43.
Berkeley, A., Perry, C. T., Smithers, S. G.,Horton, B. P. and Taylor, K. G.
2007. A review of the ecological and taphonomic controls on
foraminiferal assemblage development in intertidal environment.
Journal of Earth-Science Reviews, 83. 205-230.
Carricker, M. R. 1967 Ecology of estuarine benthic invertebrates: a
perspective. In : Estuaries, AAAS. 442-487.
Clarke, K. R. and Warwick. 1994. Change in Marine Communities: An
approach to Statistical analysis and Interpretation, Plymouth Marine
Laboratory, UK. pp. 144.
Collins, E. S., Scott, D. B., Gayes, P. T. and Medioli, F. S. 1995.
Foraminifera in Winyah Bay and North inletmarshes, South Carolina:
relationship to local pollution sources. Journal of Foraminiferal
Research, 25. 212-223.
Cushman, J. A. 1948. Foraminifera: Their Classification and Economic
Use, 4th Ed., Harvard University Press, Cambridge.
De Rijk, S., Troelstra, S. 1997. Saltmarsh foraminifera from the Great
Marshes, Massachusetts: environmental controls. Palaeogeography,
Palaeoclimatology, Palaeoecology, 130. 811-12.
De Rijk, S. 1995. Salinity control on the distribution of salt marsh
foraminifera (Great Marshes, Massachusetts). Journal of Foraminiferal
Research, 25. 156-166.
Duchemin, G., Jorissen, F. J., Redois, F., Debenay, J. P. 2005.
Foraminiferal microhabitats in a high marsh: consequences for
reconstructing past sea levels. Palaeogeography, Palaeoclimatology,
Palaeoecology, 226. 167185.
Edwards, R.J., Wright, A.J., van de Plassche, O., 2004. Surface
distribution of salt-marsh foraminifera from Connecticut, USA:
modern analogues for high-resolution sea level studies. Marine
Micropaleontology, 51. pp. 121.

Geralch, S. A.1957. Marine nematoden aus dem Mangrove gebeit von
Cananeia.III. Brasilianische Meeresnematoden. Abhandlugen der
Mathematisch Naturivessenschaftlichen in Mainz, 5. 3-48.
Goldstein, S. T., Watkins, G.T., Kuhn, R.M., 1995. Microhabitats of salt marsh foraminifera: St. Catherines Island, Georgia, USA. Marine Micropaleontology, 26. 17-29.
Hayward, B. W and Hollis, C.1994. Brackish foraminifera (Protozoa) in New Zealand : a taxanomic and ecological review. Micropaleontology ,40. 185-222.
Hayward, B. W., Grenfell, H. R. and Scott, D. B. 1999. Tidal range of marsh foraminifera for determining former sea-level heights in NewZealand. New Zealand Journal of Geology and Geophysics, 42. 395-413.
Hippensteel, S. P.,Martin, R. E.,Nikitina, D. and Pizzuto, J. E. 2002. Interannual variation of marsh foraminiferal assemblages (Bombay Hook National Wildlife Refuge, Smyrna, DE): DO foraminiferal assemblages have a memory? Journal of Foraminiferal Research, 32. 97-109.
Holme, N. A. and Mc Intyre, A.D.1971. Method for study marine benthos. In IDP-Handbook. 62-63.
Horton, B. P. and Edwards, R. J. 2005. The application of local and regional transfer functions to the reconstruction of Holocene sealevels, north Norfolk, England. The Holocene, 15. 216-228.
Krumbein, W. C. and Pettijohn, F. J. 1938. Manual of sedimentary petrography. Appleton-Century-Crofts Inc., New York. 166-168.
Loeblich, A. R. Jr. and Tappan, H.1964. Sacordina chiefly 'Thecamoebians' and Foraminiferida. In : Treaties on Invertebrate Paleontology, ed. R.C. Moore, part C, 1 and 2, Kansas University Press.
Lokman, M. H., Behara, S., Razaruddin, I. and Sulong, I. 2008. Environmental control over the distribution of salt marsh foraminiferan assemblages at Kapar mangrove ecosystem, West Peninsular Malaysia, 4. 27-33.
Macnae, W. and Kalk, M.1962. The ecology of mangrove swamps at Inhaca Island, Mozambique. Journal of Ecology, 50. 19-34.
Margalef, R. 1958. Information theory in ecology. General Systems, 3. 36-71.
107Environmental Control over the Distribution of Foraminiferan Assemblages at the Kuantan Mangrove Ecosystem

Murray, J. W. 1991. Ecology and Paleoecology of benthic foraminifera. Longman Scientific and Technical Publishers, UK, pp. 397.
Ozarko, D. L., Patterson, R.T. and Williams, H. F. L. 1997. Marsh foraminifera from Nanaimo, British Columbia: infaunal habitat and taphonomic implications. Journal of Foraminiferal Research, 27. 51-68.
Pielou, E. C. 1977. Mathematical Ecology, Wiley & Sons Ltd., New York, pp. 385.
Scott, D. B. and Medioli, F. S., 1986. Foraminifera as sea-level indicators. ed. Orson van de Plassche. Sea Level Research 15. 435-456.
Scott, D. B., Duggan, E. S., Asioli, J., Saito, T. and Hasegawa, S.1996. Pacific rim marsh foraminiferal distributions: implications for sea-level studies. Journal of Coastal Research, 11. 850-861.
Sen Gupta, B. K. 1999. Modern Foraminifera. Kluwer Academic Publishers, Printed in Great Britain, pp. 37-55.
Shannon, C. E. and Weaver, W. 1949. The Mathematical Theory of Communications. University of Illinosis Press, Urbana.
Steinker, D. C. and Butcher, W. A.1981, Foraminifera from mangrove shores, Bermuda. Micron, 12. 223-224.
ter Braak, C. J. F. 1986. Canonical Correspondence Analysis: a new eigenvector technique for multivariate direct gradient analysis, Ecology, 67. 1167-1179.
ter Braak, C. F. and Smilauer, P. 2002. CANOCO Reference Manual and Cano Draw for windows User's guide: Software for Canonical Community Ordination (Version, 4.5). Microcomputer Power, Ithaca, New York, USA, pp. 500.
Walton, W.R. (1964). Recent foraminiferal ecology and paleoecology, in Approaches to Paleoecology, (eds J. Imbrie abd N.D.Newell), John Wiley, New York, pp.151-237.
Williams, H. F. L. 1994. Intertidal benthic foraminiferal biofacies on the central Gulf Coast of Texas; modern distribution and application to sea level construction. Micropaleontology, 40. 169-183.
Woodroffe, S. A., Horton, B. P., Larcombe, P. and Whittaker, J. E. 2005. Intertidal mangrove foraminifera from the central Great Barrier Reef shelf, Australia: implications for sea-level reconstruction. Journal of Foraminiferal Research, 35. 259-270.
108 Journal of Coastal Environment

Guidelines to Authors
Journal of Coastal Environment (JCE) is published by the Centre for Ocean
and Environmental Studies, New Delhi twice a year. The Journal
promotes the study and analyses of scientific, economic and policy issues
related to the ecology of the oceans and coasts, with far reaching impacts
on the land and the atmosphere. The emphasis is to involve a large
community of scientists and scholars from India and abroad in developing
a framework of discussion and debate on conservation and sustainable
development. Book reviews, interviews, communication and news items
related to the subject are also accepted for publication.
All manuscripts are to be submitted in English in duplicate, typed double-
spaced throughout the text and should preferably be 4,000 to 5,000 words.
It is requested that manuscripts be sent by e-mail or on a CD, accompanied
with a hard copy.
The paper should be in the following order: Title; Author(s); Address(es);
Abstract; Introduction; Materials and methods (if any); Results;
Discussions (if any); Acknowledgements and References.
Tables to be included should have a heading, giving the substance, and
should be typed double-spaced on separate sheets. They should also be
numbered in serial order. Figures either drawn manually or by computer
should be in black ink and the lettering on them should be large enough to
stand reduction. Photographs in colour should have sharp contrast.
Legends for figures and plates should be typed in numerical order on
separate sheets, one for figures and one for plates.
References to the literature cited should list the author's name, year of
publication, title of the paper, and the Journal titles which should be cited
in full (no abbreviation) with volume, number and page number, as
indicated below:
For articles in a Journal
Walsh, J.E. 2008. Climate of the Arctic Marine Environment. Ecological
Applications. 18. pp. 3-22.

For two or more authors
Bejder, L., Dawson, S.M. and Harraway, J.A. 1999. Responses by Hectors's
dolphins to boats and swimmers in Porpoise Bay, New Zealand. Marine
Mammal Science. 15. pp. 738-750.
For Books
Ward, D.R. 2002. Water Wars: drought, floods, folly and politics of thirst:
Riverhead Books. New York. p. 12.
Chapter in a book:Andrews, T.J., Clough, B.F. and Muller, G.J. 1984. Photosynthetic gas exchange properties and carbon isotope ratios of some mangroves in North Queensland. In: H.J. Teas (Ed.), Physiology and Management of Mangroves. W. Junk. The Hague. pp. 15-23.
From websiteNational Oceans and Atmospheric Administration (NOAA). 1995. Regional Perspectives: IndianOcean.www.ncdc.noaa.gov / paleo.outreach/coral/ sor/sor_indian.html , accessed on July 13, 2008.
While giving reference of more than two authors in the text, after, the name of the first author, et al. should be used, followed by the year of publication.
Articles are to be referred before publication. Proofs are edited in-house and may be sent back to the authors for only major changes, addition or deletion.
Copies of the Journal will be sent to the authors after publication.

Journal of Coastal Environment(Bi-Annual Journal)
SUBSCRIPTION ORDER FORM
Name:
Address:
Pin
Tel: Fax:
E-mail:
Payment Enclosed DD/Cheque No.____________dated________
drawn in favour of the Centre for Ocean and Environmental
Studies for Rs. / US$ payable at New Delhi.
Signature Date
(Please add Rs. 50/- for Outstation Cheques and allow 4 weeks
for delivery of first issue)
New Renewal
Published by
Centre for Ocean and Environmental StudiesA-2, East of Kailash, New Delhi 110 065, India
Telefax: 91-11-46078340Website: www.coes-india.org
E-mail: [email protected]; [email protected]

SUBSCRIPTION RATES
INDIVIDUAL COPY
Inland ForeignRs. 200/- US$ 40
ANNUAL SUBSCRIPTION(2 Issues Per Year)
Individuals ForeignRs. 400/- US$ 100
InstitutionsRs. 600/-
ADVERTISEMENT RATES
Full Page
Colour : Rs. 30,000.00Black/White : Rs. 20,000.00
Half Page
Colour : Rs. 15,000.00Black/White : Rs. 10,000.00
(Four weeks to be allowed after submission of advertising material)


Edited and Published by S.Z. Qasim for the Centre for Ocean and Environmental Studies, New Delhi
Typeset and Printed by DezineHut : [email protected] • 98112 38475
Journal of Coastal EnvironmentVol. 2, No. 1, 2011
C o n t e n t s
Cover page - Coral reefs as the richest marine ecosystem.Source : 070905123839-large.jpg; sciencedaily.com
Threats to Biodiversity in Coastal Environment 1S.Z. Qasim
The Lakshadweep: Islands of Ecological Fragility, 9Environmental Sensitivity and Anthropogenic VulnerabilityP.S.B.R. James
Oil Pollution and its Impact on Fisheries 27P. Muhamed Ashraf and B. Meenakumari
Impact of Mining Activities on Land and Water Areas of Goa 43Shaikh Muhammad Parvez Al-Usmani
Deep Water Horizon : Lessons for the Future 55Usha Dar
Ecosystem Conservation and Management: 65The Concept of Large Marine EcosystemKishore Kumar
Effect of Probiotics on Growth Performance 79of Juvenile Brown Marbled GrouperMithun Sukumaran, Pradeep Padmaja Jayaprasad, Thekkeparambil Chandrabose Srijaya, Anuar Hassan, Mohammad Effendy Abdul Wahid, Zainudin Bachok and Anil Chatterji
Environmental Control over the Distribution of Foraminiferan 97
Assemblages at the Kuantan Mangrove Ecosystem
Mohd. Lokman Husain, Sulong Ibrahim,
Zainuddin Bachok and Ravindran Chandran