Effects of High Pressure on Texture and Microstructure of Sea Bass (Dicentrarchus labrax L.) Fillets
24
eb site at this is an author-produced PDF of an article accepted for publication following peer review. The definitive publisher-authenticated version is available on the publisher W Journal of Food Science OCTOBER 2005; 70(8) : E477-E483 http://dx.doi.org/0002329036-0020 © 2003-4, Institute of Food Technologists Archimer http://www.ifremer.fr/docelec/ Archive Institutionnelle de l’Ifremer Effects of high pressure on texture and microstructure of sea bass (Dicentrarchus labrax L.) fillets Romuald Chéret 1-2 , Nicolas Chapleau 1 , Christine Delbarre-Ladrat 2 , Véronique Verrez-Bagnis 2 , Marie de Lamballerie 1 * 1 UMR CNRS 6144 GEPEA, ENITIAA, BP 82225, 44322, Nantes Cedex 3, France 2 IFREMER, BP 21105, 44311 Nantes Cedex 3, France *: Corresponding author : Phone: 33.2.51.78.54.65 Fax: 33.2.51.78.54.67 [email protected] Abstract: High-pressure is an innovative non-thermal food preservation technology. We studied the effect of high-pressure treatment up to 500 MPa-5min on physical characteristics of sea bass fillets after 0, 7 and 14 days of refrigerated storage. Color results exhibited an increase of lightness and a slight change of hue, which might be imperceptible in cooked fish. High-pressure treatment induced a decrease of exudation and water-holding capacity. Pressure treatment above 300 MPa provoked fish hardness higher after storage than untreated sample, proving the ability of high-pressure to improve textural quality of chilled stored fish fillet. These assessments were corroborated with microstructure observations. We showed that high-pressure treatment at 500 MPa allowed, after 7 days of storage, a total aerobic count equivalent to that of untreated fresh fish fillet to be obtained. Thus, high-pressure might be considered to be a technology able to improve safety and textural quality of fresh fish fillets. Keywords: Fish; High-pressure; Texture Profile Analysis; Microstructure; Preservation Please note th 1
-
Upload
independent -
Category
Documents
-
view
0 -
download
0
Transcript of Effects of High Pressure on Texture and Microstructure of Sea Bass (Dicentrarchus labrax L.) Fillets

eb s
ite
at th
is is
an
auth
or-p
rodu
ced
PD
F of
an
artic
le a
ccep
ted
for p
ublic
atio
n fo
llow
ing
peer
revi
ew. T
he d
efin
itive
pub
lishe
r-aut
hent
icat
ed v
ersi
on is
ava
ilabl
e on
the
publ
ishe
r W Journal of Food Science OCTOBER 2005; 70(8) : E477-E483 http://dx.doi.org/0002329036-0020© 2003-4, Institute of Food Technologists
Archimer http://www.ifremer.fr/docelec/Archive Institutionnelle de l’Ifremer
Effects of high pressure on texture and microstructure of sea bass
(Dicentrarchus labrax L.) fillets
Romuald Chéret1-2, Nicolas Chapleau1, Christine Delbarre-Ladrat2, Véronique Verrez-Bagnis2, Marie de Lamballerie1*
1UMR CNRS 6144 GEPEA, ENITIAA, BP 82225, 44322, Nantes Cedex 3, France 2IFREMER, BP 21105, 44311 Nantes Cedex 3, France *: Corresponding author : Phone: 33.2.51.78.54.65 Fax: 33.2.51.78.54.67 [email protected]
Abstract: High-pressure is an innovative non-thermal food preservation technology. We studied the effect of high-pressure treatment up to 500 MPa-5min on physical characteristics of sea bass fillets after 0, 7 and 14 days of refrigerated storage. Color results exhibited an increase of lightness and a slight change of hue, which might be imperceptible in cooked fish. High-pressure treatment induced a decrease of exudation and water-holding capacity. Pressure treatment above 300 MPa provoked fish hardness higher after storage than untreated sample, proving the ability of high-pressure to improve textural quality of chilled stored fish fillet. These assessments were corroborated with microstructure observations. We showed that high-pressure treatment at 500 MPa allowed, after 7 days of storage, a total aerobic count equivalent to that of untreated fresh fish fillet to be obtained. Thus, high-pressure might be considered to be a technology able to improve safety and textural quality of fresh fish fillets. Keywords: Fish; High-pressure; Texture Profile Analysis; Microstructure; Preservation
Ple
ase
note
th
1

1. Introduction 32
33
34
35
36
37
38
39
40
41
42
43
44
45
46
47
48
49
50
51
52
53
54
55
56
Among the various aspects that contribute to defining the quality of raw fish, freshness is
one of the most important. Freshness of fish can be assessed thanks to organoleptic features.
Generally, the muscle of fish is known to soften quickly during the post mortem storage in
refrigerated conditions. One of the main features in appreciating fish is the texture. The
appearance and the odour are also very important for consumers.
The muscle of fish has a very particular organization compared to meat, because it is
constituted of the alternation of muscular sheets called myotomes separated and maintained
by the connective tissue. Moreover, myotomes are composed by a large number of individual
muscle fibres in a collagen matrix.
Post mortem softening of fish muscle is caused by the combination of two reactions:
biochemical-induced by enzymatic degradation of myofibrils and collagen, and physical due
to the separation of myotomes called “gaping”.
After the fish dies, the period of rigor-mortis starts. The final quality of fish depends on
this phase. Initially, the phenomenon of “gaping” proceeds and is characterised by the
separation of the myotomes. This mechanical phenomenon is associated to the contraction of
muscle fibres. The skeleton and the connective tissue support this contraction and keep
muscle structure. The connective tissue resists until a certain pressure beyond which it
weakens itself letting place to “gaping”. “Gaping” is a consequence of the failure of fibres and
tissue to connect the muscle blocks along the filet. (Lavety and others 1988; Bremner and
Hallet 1985; Bremner 1992; Hallett and Bremner 1988). Then, for the period post mortem,
many biochemical mechanisms will initiate the degradation of the muscle. These
modifications lead to a reduction in hardness (Dunajsky 1979). Protein hydrolysis does not
play a significant part. It was observed that the collagen fibres in the pericellular connective
tissue were disintegrated. It has been shown in sea bass, that the changes occurring during
Page 3
post mortem degradation result in the weakening and disorganisation of the Z line structure,
the deterioration of costamers, and a separation between filaments and I bands (Astier and
others 1991; Papa and others 1996; Papa and others 1997). Several studies suggest that the
gradual disintegration of the extracellular matrix structure in mainly responsible for
tenderisation (Ando 1997; Bremner 1992; Montero 1997). The structural links and bonds of
proteins are changed during the degradation. These changes are caused by enzymes: in most
cases, a result of enzymatic reactions has been determinated, but not activities of the enzymes
themselves (Rehbein 1997).
57
58
59
60
61
62
63
64
65
66
67
68
69
70
71
72
73
74
75
76
77
78
79
80
81
When the post mortem degenerative process takes place, the degradation of proteins
creates ideal conditions for the growth of micro-organisms. In living fish, some micro-
organisms remain present on their skin and in the digestive system. After death, they are
likely to contaminate the muscle of fish. The compounds formed by different degradations
due to the micro-organisms release unpleasant odours. This phenomenon of degradation is
dependent on storage temperature. Also, during storage, the color of flesh changes from a
bluish translucent color to an opaque and cooked appearance.
Among the non-thermal processing techniques, high-pressure processing is of growing
interest in food processing. Some products are already available in markets in Japan (fruits
juices, jam, rice, seaweed), in the USA (avocado spread and oysters) and in Europe (orange
juice in France and ham in Spain). Today, this technology is gaining popularity in the food
industry.
Generally, products are subjected to high-pressure in the range of 100-1000 MPa. The
main advantage of high-pressure is to inactivate pathogenic micro-organisms: so food shelf-
life can be prolonged. High-pressure processing for microbial decontamination has been
extensively reviewed, but complete microbial inactivation is currently not possible (Knorr
1999; Smelt 1998). The advantage of high-pressure treatment over traditional thermal
Page 4
82
83
84
85
86
87
88
89
90
91
92
93
94
95
96
97
98
99
100
101
102
103
104
105
processing is the result in an almost complete retention of nutritional and organoleptic
characteristics. However, chemical bonds of molecules are affected and that may induce
modifications of water, proteins, polysaccharides and lipids. The main effect of high-pressure
is to provoke changes in hydrophobic and electrostatic interactions with important
consequences for the secondary, tertiary and quaternary structures in proteins. In muscle food,
high-pressure treatment causes three main kinds of changes in muscle food: enzymatic,
protein (mainly on myofibrils) and structural modifications. Pressure treatment of proteins can
lead to significant conformational changes which influence functionality (Cheftel and Dumay
1997; Chapleau and de Lamballerie-Anton 2003). The mechanisms of these effects are not yet
fully understood.
Recent studies showed that the high-pressure treatment could allow controlling or
deactivating some enzymes involved in the degradation of fish muscle to modify the texture
and to stabilise the color and the oxidation of the lipids (Angsupanich and Ledward 1998;
Ashie and Simpson 1996; Oshima and others 1993).
The objective of this present study was to evaluate and understand the effect of the high-
pressure treatment on the different features that characterise the freshness of fish.
2. Materials and methods
2.1. Preparation of the fish samples
Fresh sea bass (Dicentrarchus labrax L.), 4 years old, average weight 325 g and length 300
mm, were collected from a local aquaculture farm (Les Viviers du Gois, Beauvoir-sur-Mer,
France) and brought back alive to the laboratory. The fish were slaughtered by decapitation,
skinned and filleted in pre-rigor conditions. Only white muscles of the dorsal part of the fillet
were collected to carry out experiments, measuring 50 x 150 mm with a thickness of about 13
Page 5

106
107
108
109
110
111
112
113
114
115
116
117
118
119
120
121
122
123
124
125
126
127
128
129
130
mm. To take in account the fish variation, we used twelve fillets for each level of pressure: 0,
100, 200, 300, 400 and 500 MPa.
2.2. High-Pressure Processing
High-pressure processing was carried out in a 3.5 L reactor unit (ACB Pressure Systems,
Nantes, France) equipped with temperature and pressure regulator device. Prior to pressure
processing, previously prepared sea bass fillets were vacuum packed individually in
polyethylene bag (La Bovida, France). The level of pressure (100, 200, 300, 400 and 500
MPa) was reached at 3 MPa/s, kept constant 5 min, and then released quickly (< 1.5 s).
Temperature of transmitting medium in the vessel was settled at 10°C (± 5°C) during pressure
treatment. Temperature of the cooling jacket which surrounded the pressure vessel was
controlled at 10 °C during pressure treatment. One thermocouple K-type (0.3 mm diameter,
Omega, Stamford, CT, USA) positioned close to the sample, allowed the variation of
temperature during treatment to be followed. After pressure treatment, samples were stored on
ice (maximum 4 h) until analysis.
2.3. Storage of fillet
Among 12 control or high-pressure treated fillets, four were analysed the very same day.
The eight other were stored at 4°C, four were analysed 7 days later and four 14 days later.
Four fillets were used for all tests: color, exudation, WHC, texture and microstructure.
2.4. Color measurements
Color measurements were performed on intact fillets after pressure processing and/or
storage, using a Minolta CM-3500d (Minolta, Carrières-sur-Seine, France). Measures were
achieved in the referential CIE 1976 L*a*b*, L* denotes lightness on a 0 to 100 scale from
Page 6
131
132
133
134
135
136
137
138
139
140
141
142
143
144
145
146
147
148
149
150
151
152
153
154
155
black to white; a*, corresponds to the indication of red when its value is positive and to green
when it is negative; b* corresponds to the indication of yellow when its value is positive and
to blue when it is negative. Measurements were repeated ten times on different positions of
four fish fillets.
2.5. Exudation
Exudation of fillet was determined by weighing samples prior to and after pressure
processing. The bags were unwrapped, surface drip was removed using filter paper, and fillets
were weighed. Each experimental value represented the mean of four determinations.
2.6. Water-Holding Capacity
The Water-Holding Capacity (WHC) was measured individually on coarsely chopped
filleted muscle. The samples (10 g) were transferred to centrifugation tubes and centrifuged at
10 000 g for 15 min at 20°C (GR 20.22, Jouan, France). The WHC was determined as liquid
loss, and expressed by the percentage of weight of liquid that was retained in the fillets. Mean
values were calculated from four replicates.
2.7. Texture profile analysis
Texture measurements (according to Texture Profile Analysis defined by Bourne 1978)
were performed at room temperature with a texture testing machine (Lloyd Instruments
LR5K, United Kingdom) equipped with a sensor of 50 N. Twelve cylindrical samples of 20
mm in diameter were cut on the 4 dorsal muscles: 3 cylinders of a height of 11 to 14 mm were
sampled in the same way of the longitudinal orientation of the muscular fibres. Prior to
analysis, samples were allowed to reach room temperature (20°C, 1 h). Each sample was
compressed between stainless steel plates (diameter 40 mm) as shown on figure 1. The texture
Page 7
156
157
158
159
160
161
162
163
164
165
166
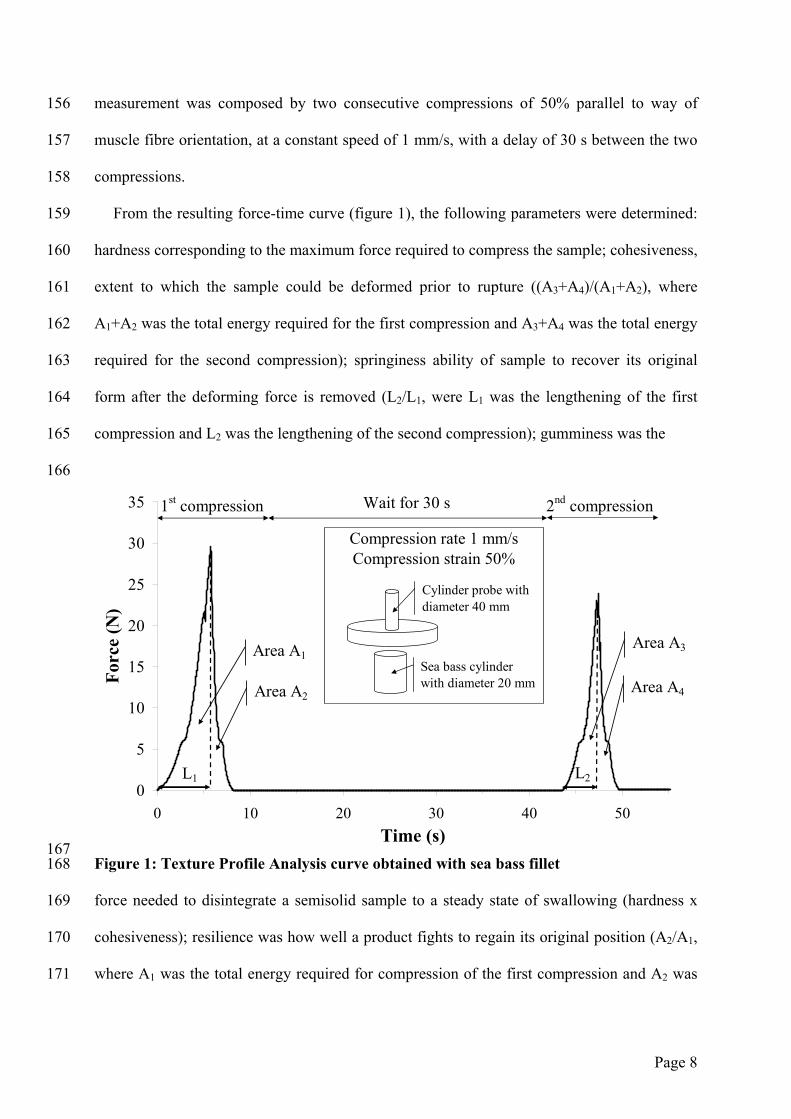
measurement was composed by two consecutive compressions of 50% parallel to way of
muscle fibre orientation, at a constant speed of 1 mm/s, with a delay of 30 s between the two
compressions.
From the resulting force-time curve (figure 1), the following parameters were determined:
hardness corresponding to the maximum force required to compress the sample; cohesiveness,
extent to which the sample could be deformed prior to rupture ((A3+A4)/(A1+A2), where
A1+A2 was the total energy required for the first compression and A3+A4 was the total energy
required for the second compression); springiness ability of sample to recover its original
form after the deforming force is removed (L2/L1, were L1 was the lengthening of the first
compression and L2 was the lengthening of the second compression); gumminess was the
0
5
10
15
20
25
30
35
0 10 20 30 40 50Time (s)
Forc
e (N
)
1st compression 2nd compressionWait for 30 s
Area A2
Area A1Area A3
Area A4
Compression rate 1 mm/sCompression strain 50%
L1 L2
Sea bass cylinder with diameter 20 mm
Cylinder probe with diameter 40 mm
167 168
169
170
171
Figure 1: Texture Profile Analysis curve obtained with sea bass fillet
force needed to disintegrate a semisolid sample to a steady state of swallowing (hardness x
cohesiveness); resilience was how well a product fights to regain its original position (A2/A1,
where A1 was the total energy required for compression of the first compression and A2 was
Page 8
172
173
174
175
176
177
178
179
180
181
182
183
184
185
186
187
188
189
190
191
192
193
194
195
196
the total energy required for decompression of the first compression); chewiness, the work
needed to chew a solid sample to a steady state of swallowing (springiness x gumminess).
2.8. Microstructure analysis
For each fillet analysed, two samples of 10x5x5 mm were cut transversally to the muscles
fibres from the core of the fillet in the fleshiest part using a blade, then fixed in Carnoy’s
solutions (60% absolute ethanol, 30% chloroform and 10% glacial acetic acid, v/v) at 4°C.
After 24 h, the samples were brought to room temperature and dehydrated with several
alcohol solutions, first in absolute ethanol for 2 h and then in 1-butanol for 2 h (repeated three
times). Dehydrated samples were then cleared with toluene for 30 min (repeated three times)
and embedded in paraffin at 56 – 58°C. Samples were cut with a microtome Leica SM2000
(Leica, Germany) in 10 µm thick slices. The sections were stained for 5 min in Orange G (0.5
g of Orange G, 1ml acetic acid dissolved in 99 ml distilled water and filtered at 0.45 µm). The
sections were washed with distilled water and stained for 5 min in Aniline blue (0.01 g of
Aniline blue, 1ml acetic acid dissolved in 99 ml distilled water and filtered at 0.45 µm). The
stained samples were washed with distilled water before mounting with Eukitt (Labonord,
France). This staining method stained the muscle proteins orange and collagen blue. The
samples were examined in a microscope (Leica DML,Germany) fitted with a CCD RGB
camera (MACC-C71, Sony, Japan) at 400× magnification.
2.9. Microbiological analyses
Aliquots (10 g) of fillets were prepared under sterile conditions and homogenised with a
Stomacher for 30 s in 90 ml sterile peptone water (BK 018, Biokar Diagnostics, Beauvais,
France). Subsequently, a decimal dilution series of the homogenate was made, from which
each 3 replicates were inoculated in depth plate (1 ml) on plate count agar (BK 043, Biokar
Page 9
197
198
199
200
201
202
203
204
205
206
207
208
209
210
211
212
213
214
215
216
217
218
219
220
221
Diagnostics, Beauvais, France). The CFU formed after incubation at 30°C for 72 h was
counted for dilutions setting 25 to 300 CFU. Results were expressed as the decimal logarithm
of CFU per g of fillet sample.
2.10. Statistical analysis
Statistical analysis was performed using a one-way analysis of variance according to the
general linear model procedure with least-square means effects to determine significant
differences between treatments. Multiple range tests were applied to determine which means
were significantly different according to Fisher’s Least Significant Differences (LSD).
Significant differences were determined with 5% level of significance (p<0.05) by Student’s
test. The vertical bars represent the standard deviation. Statistical analysis was carried out
using Statgraphics plus version 5.0 software (Statistical Graphics Corp., Princeton NJ, USA).
3. Results and discussion
3.1. Color
Table 1 shows the evolution of lightness (L*), red-green indice (a*) and yellow-blue indice
(b*) according to the pressure and to the time of storage. Before the treatment, the day the
fish dies, the muscle has a shiny, smooth, whitish and translucent appearance characterised
by a moderate value of L* (34.19±1.51) and weak value of a* (-2.48±0.46) and
b*(0.39±0.92). The muscle of sea bass studied is a white muscle whose pigmentation is
bound to the presence of heme proteins, carotenoids and melanins. According to our results,
the storage of non-pressurised fillets led to an increase of L* value (47.71±0.60) for storage
time of 7 days, then L* decreased (42.56±1.90) for 14 days of storage. The indices of red-
green and yellow-blue remained almost constant during refrigerated storage. During storage,
the appearance of fish fillets became whiter and less grey.
Page 10

Table 1. L*a*b* color parameters of sea bass fillets treated by high-pressure processing after 0, 7 and 14 days at 4°C. 222
223 Pressure processing during 5 min
Color parameter
Storage time (day)
Control 100 MPa 200 MPa 300 MPa 400 MPa 500 MPa
L* 0 7 14
34.19±1.51 aα 47.71±0.60 aβ 42.56±1.90 aγ
37.45±1.52 bα 48.94±1.70 aβ 45.12±1.31 bγ
46.42±3.32 cα 54.32±1.94 bβ 51.63±3.35 cγ
61.54±1.61 dα 63.51±1.26 cβ 60.83±1.65 dα
66.39±1.20 eα 72.04±1.50 dβ 65.55±1.95 eα
71.30±1.49 fα 70.24±1.59 eα 70.25±2.10 fα
a* 0 7 14
-2.48±0.46 aα -2.23±0.21 aα -3.33±0.28 aβ
-3.75±0.38 bα -2.89±0.15 bβ -3.48±0.21 aγ
-5.23±0.60 cα -4.05±0.28 cβ -4.56±0.21 bγ
-5.88±0.57 dα -5.04±0.40 dβ -5.76±0.43 cα
-5.41±0.36 cα -4.85±0.40 dβ -5.07±0.31 dβ
-4.79±0.38 eα -4.17±0.41 cβ -4.41±0.44 bβ
b* 0 7 14
0.39±0.92 aα -0.93±0.57 aβ 0.78±1.14 abα
-0.67±1.03 aα -1.67±0.52 abβ -0.43±0.79 acα
-2.25±1.00 bα -2.65±1.01 bcα -0.71±1.06 cβ
0.16±1.64 aα -2.92±1.25 cβ -1.33±1.37 cγ
2.58±1.51 cα 0.58±1.48 dβ 1.51±2.01 bαβ
4.74±1.66 dα 2.99±1.37 eβ 4.75±1.81 dα
h 0 7 14
171.45±21.50 aα 201.66±12.96 aβ 168.25±16.14 aα
190.65±15.85 bcα 209.63±8.18 aβ 187.08±12.51 bα
203.19±10.65 cα 212.47±11.83 aα 188.63±12.85 bβ
177.98±15.53 abα 209.71±10.85 aβ 192.07±12.35 bα
155.62±12.88 dα 175.85±18.32 bβ 164.96±18.61 aαβ
136.60±9.30 eα 145.93±12.82 cα 134.58±12.30 cβ
C* 0 7 14
2.68±0.47 aα 2.48±0.13 aα 3.55±0.47 aβ
3.94±0.21 bα
3.37±0.23 bβ 3.58±2.11 aγ
5.78±0.51 cα 4.93±0.36 cβ 4.72±0.22 bβ
6.08±0.57 cα
5.90±0.76 dα 6.03±0.61 cdα
6.13±0.72 cα 5.08±0.37 cβ 5.58±0.75 cαβ
6.82±1.25 dαβ 5.24±0.84 cβ 6.61±0.84 dα
All values were means ± standard deviation of ten values Same letters (a, b, c, d) in the same row indicate no significant differences between means (p≤0.05) Same symbol (α, β, γ) in the same column indicate no significant differences between means (p≤0.05)
Page 11
224
225
226
227
228
229
230
231
232
233
234
235
236
237
238
239
240
241
242
243
244
245
246
247
248
Whatever pressure level, application of pressure on fillet induces an increase of L* value.
From 300 MPa, L* is almost two times higher than the untreated sample: the fish looks like it
is cooked. For the untreated sample and 100 MPa and 200 MPa samples, L* value changes in
a significant way with the time of storage: it is higher on day 7 and decreases between days 7
and 14, but final day 14 value is higher than for the untreated sample. However, from 300
MPa, pressure-induced modifications of L* value change very slightly during storage. Thus
lightness of sea bass fillet raises under high-pressure treatment and from 300 MPa, the
increase is particularly important but does not change with time storage.
Table 1 shows a* changes with high-pressure level, from -2.48 for untreated sample to -4.79
for 500 MPa, and b* changes in diverse ways around its initial value 0.39. Changes of hue are
better described considering λ value in CIE Yxy system. We noticed in table 1 that main
wavelength increases in a significant way to greenish and almost yellowish at 400 MPa: hue
changes from bluish to greenish and almost yellowish at 500 MPa. Of course fish appearances
is neither blue nor green but these color terms indicate the trend of white translucent color.
Changes of hue characteristics are not modified during storage. These results are in
accordance with Ashie and Simpson (1996), who put in evidence an increase of L* from 0 to
300 MPa in bluefish, and with Oshima and others 1992).
The fish fillet color is linked with heme based pigment, physical structure of muscle and
amount of unbound water which influences light scattering. As sea bass is a white fish, we
can suppose that changes of pigments under high-pressure treatment are of minor importance,
so we can attribute these changes to modifications of protein matrix. In the same way,
evolution of color during storage can be associated with enzymatic and non enzymatic
reactions resulting in degradation of myofibrillar proteins and disorganisation of myofibrils
(Haard, 1992; Jiang, 2000).
Page 12

3. 2. Exudation during storage 249
250
251
252
253
254
255
256
257
258
259
260
261
262
Figure 2 shows the evolution of fish fillet natural exudation with pressure treatment for the 3
storage times. Whatever pressure level, high-pressure treatment does not induce any variation
of exudation first day. However considering results of exudation after storage, we can
consider two groups. For samples treated at 100 MPa and 200 MPa exudation increases two
times the seventh day and four times the fourteenth day. For samples treated at 300 MPa, 400
MPa and 500 MPa, exudation changes very few during storage. Then from 300 MPa yield is
improved the seventh and the fourteenth day storage. The increase of exudation with storage
time for control, 100 MPa and 200 MPa can be related with enzymatic and microbiological
degradation of muscle which modifies muscle structure and leads to an important water
release. High-pressure treatment above 200 MPa induces an irreversible denaturation of
proteins than can reach a gelation. This phenomenon allows better natural water retention.
High-pressure treatment above 200 MPa also induces modifications of proteases activity then
causing indirectly an increase of water retention.
0
2
4
6
8
10
Control 100 MPa 200 MPa 300 MPa 400 MPa 500 MPa
Exu
datio
n (%
)
263
Page 13

Fig. 2. Evolution of sea bass fillet exudation treated by high-pressure (5 min) after
storage at 4°C during 0 ( ), 7 ( ) and 14 ( ) days.
264
265
266
267
268
269
270
271
272
273
274
275
276
277
278
3.3. Water-Holding Capacity (WHC)
The evolution of WHC with pressure applied is presented figure 3. WHC evaluation requires
a grinding and a centrifugation producing a forced water release. For untreated sample,
storage induced a significant increase of WHC. As we previously underscored the increase of
natural exudation with time of storage, it might appear an opposite result. In fact, WHC
evaluate the ability of proteins to bind water after grinding. This particular property increases
with storage. Figure 4 also shows that WHC decreases when pressure level increases, and that
time of storage has no more a significant effect when sample is pressurized. Bremmer (2002)
put in evidence this decrease of WHC in sole and Pollack, so our results are accordance
because sea bass can also be considered as a non fat fish. Grinding before WHC evaluation
destroys previously cited protein gel due to high-pressure treatment, and denatured proteins
are no more able to bind intrinsic water.
70
75
80
85
90
95
100
Control 100 MPa 200 MPa 300 MPa 400 MPa 500 MPa
WH
C (%
)
279
Page 14

Fig. 3. Effect of storage at 4°C during 0 ( ), 7 ( ) and 14 ( ) days, on water-holding
capacity of sea bass fillets treated by high-pressure (5 min).
280
281
282
283
284
285
286
287
288
289
290
291
292
293
294
295
296
297
298
299
300
301
302
Denaturation of myofibrillar proteins, which are mainly involved in WHC, increases with
increasing pressure. Thus, it is normal to observe a decrease of WHC with increasing
pressure.
3.4. Modification of texture induced by high-pressure and ageing
Texture Profile Analysis (TPA) was carried out to determinate the effect of pressure
treatment and storage for 0, 7 and 14 days on the texture of fish muscle. The results of textural
measurements are summarized in table 2: hardness, cohesiveness, springiness, gumminess,
resilience and chewiness.
For untreated sample, all six texture criteria decrease in a significant way between the first
and the seventh day of storage, showing that muscle becomes softer. During storage at 4°C,
enzymatic degradation induces many physical mechanisms, among them the gaping, which
contribute to muscle tenderization (Dunajsky, 1979). Proteases implied are mainly calpains,
cathepsins and collagenases. Calpains and cathepsins act on the myofibrillar proteins and
promote myofibril fragility, and collagenases act on the connective tissue and contribute to
gaping (Montero, 1997).
Page 15

Table 2. Texture Profile Analysis (TPA) parameters of sea bass fillets treated by high-pressure processing after 0, 7 and 14 days at 4 °C. 303
304 Pressure processing during 5 min TPA parameter
Storage time (day) Control 100 MPa 200 MPa 300 MPa 400 MPa 500 MPa
Hardness 0 7 14
29.82±2.13 aα 25.53±4.32 aβ 25.25±3.50 aβ
24.17±3.99 bcα 27.50±3.49 aα 24.55±4.49 aα
22.78±2.86 bα 20.44±2.72 bα
23.26±3.85 abα
26.04±3.89 cα 26.39±2.22 aα 21.09±1.51 bβ
31.24±2.24 aα 38.04±2.76 cβ 35.01±2.94 cγ
32.70±4.70 aαβ 33.14±4.00 dβ 28.93±3.38 cα
Cohesiveness 0 7 14
0.52±0.04 aα 0.25±0.04 aβ 0.30±0.04 aγ
0.53±0.06 aα 0.42±0.05 bcdβ
0.36±0.04 bγ
0.55±0.03 abα 0.41±0.04 bcβ 0.40±0.04 bcβ
0.56±0.03 abα 0.40±0.05 bβ 0.43±0.06 cβ
0.55±0.08 abα 0.45±0.07 cdβ 0.50±0.06 dαβ
0.58±0.04 bα 0.46±0.05 dβ 0.56±0.03 eα
Springiness 0 7 14
0.69±0.04 aα 0.51±0.03 aβ 0.47±0.04 aγ
0.63±0.05 bcα 0.55±0.06 abβ 0.51±0.05 bβ
0.61±0.04 bα 0.59±0.05 bcα 0.57±0.05 cdα
0.65±0.04 cdα 0.54±0.05 abβ 0.54±0.05 bcβ
0.69±0.04 adα 0.57±0.06 bβ 0.60±0.03 dβ
0.74±0.06 eα 0.62±0.03 cβ 0.66±0.04 eβ
Gumminess 0 7 14
15.32±1.22 abα 6.35±1.47 aβ 7.51±1.53 aβ
12.67±1.99 cdα 11.39±1.23 bα 8.91±2.10 abβ
12.60±1.52 cα 8.40±1.25 cβ 9.36±2.00 bβ
14.49±1.92 adα 10.46±1.34 bβ 9.13±1.42 abβ
17.19±3.05 beα 17.07±2.31 dα 17.44±2.06 cα
18.97±2.33 eα 15.21±2.35 eβ 16.24±1.16 cβ
Resilience 0 7 14
0.34±0.04 abα 0.13±0.02 aβ 0.14±0.02 aβ
0.35±0.04 bα 0.23±0.04 bβ 0.19±0.03 bγ
0.32±0.04 abcα 0.18±0.02 cβ 0.17±0.03 bβ
0.31±0.02 bcα 0.18±0.03 cβ 0.18±0.03 bβ
0.30±0.06 cα 0.22±0.04 bdβ 0.23±0.03 cβ
0.32±0.03 abcα 0.20±0.03 cdβ 0.25±0.02 cγ
Chewiness 0 7 14
10.62±1.12 abα 3.27±0.92 aβ 3.49±0.69 aβ
8.04±1.58 cdα 6.24±1.06 bβ 4.57±1.24 bγ
7.68±1.15 cα 4.97±1.00 bβ 5.23±0.94 bβ
9.45±1.31 bdα 5.70±0.91 bβ 4.92±1.02 bβ
11.92±2.46 bα 9.84±1.93 cβ
10.52±1.50 cαβ
14.11±2.12 eα 9.50±1.53 cβ
10.63±0.31 cβ For each criterion, all values were means ± standard deviation of ten values Same letter (a, b, c, d, e) in the same row indicate no significant differences between means (p≤0.05) Same greek letter (α, β, γ) in the same column indicate no significant differences between means (p≤0.05)
Page 16
305
306
307
308
309
310
311
312
313
314
315
316
317
318
319
320
321
322
323
324
325
326
327
328
Application of high-pressure processing induces modifications of TPA criteria, as
summarized in table 2. For samples at day 0, hardness decreases significantly from 100 MPa
to 300 MPa and remains constant after 400 MPa and 500 MPa treatment; cohesiveness,
springiness and resilience are almost constant, and gumminess and chewiness decreases from
100 to 300 MPa and increase after 400 MPa and 500 MPa treatment. Globally, TPA criteria
are diversely affected by high-pressure, and effect of high-pressure changes markedly around
300 MPa, in accordance with exudation and WHC results.
At day 0 decrease of hardness for samples treated at 100, 200 or 300 MPa, is in accordance
with results of Ashie and Simpson (1996) on bluefish, and differ from results of Anguspanish
and Ledward (1998) who observed an increase of cod fillet hardness for 400 MPa -20 min. In
regard to evolution of texture during storage, hardness does not change for 100 and 200 MPa
treated samples, it decreases the fourteenth day for 300 MPa, and it changes slightly for 400
and 500 MPa. Finally, we can assess than pressure treatment above 300 MPa – 5 min is
necessary to obtain after 7 or 14 days a hardness equivalent to the untreated sample at day 0,
and that samples treated at 100 or 200 MPa do not evolve during storage.
Post mortem changes of fish texture are mainly caused by modifications of myofibrillar
proteins, due both to proteases action and to variation of physical and chemical conditions.
High-pressure treatment induces a reversible pH fall (Hayert and others 1999) and a
modification of hydrogen and hydrophobic bonds which brings about changes in protein
structure. Effect of high-pressure on fish texture ensues from these modifications of water
bond, protease activity, aggregation or gelation of myosin and sarcoplasmic proteins
(Anguspanish and Ledward 1998; Heremans 1982).
3.3. Effect of pressurisation on the microstructure
Page 17
329
330
331
332
333
334
335
336
337
338
339
340
341
342
343
344
345
346
347
348
349
350
351
The histological images of muscular fibres section are shown on the figure 4. Control
fibres at day 0 appear as shrunken cells, with a great extracellular space: this space is not the
result of gaping since preparation of sample is realized quickly after slaughtering. This
phenomenon is ascribed to the fixing and dehydration methods which could weaken links
between fibres and myocommata. Storage of fish fillets induces numerous cracks inside the
fibres, and a deterioration of pericellular connective tissue is visible after 14 days of storage.
This evolution of myofibrils structure is the result of natural degradation from proteases and
microorganisms. This observation is linked with evaluated hardness decrease during storage,
due to the action of proteases on collagen and myofibrillar proteins.
The fibres appearance is not changed when samples has been pressurized at 100 MPa.
From 200 MPa, the more the pressure treatment is high, the more the fibres look tightened
and round. The extracellular space decreases when pressure increases, in relation to the
compaction of muscle and the possible protein gel network formation. Moreover, the sample
preparation has less effect on extracellular spaces when the proteins began to form a gel.
Cheftel and Culioli (1997) reported that pressure above 200 MPa often causes protein
gelation, whenever pressure and protein concentration are high enough. These observations
corroborate the increase of hardness observed at 400 and 500 MPa: denser structure muscle
presents higher hardness values. Globally, the structure is not modified in comparison with
works of Gudmundsson and Hafsteinsson quoted by Bremner, 2002. From 200 MPa, we do
not observe any crack apparition during storage, and muscle remains more compact that for
control sample. Connective tissue presents an irregular distribution. Indeed the probable
proteases inactivation and the gelation of actomyosin above 200 MPa lead to a good
myofibrils structure preservation.
Page 18

352 353
Storage time at 4°C Pressure processing 0 day 7 days 14 days
Control
100 MPa
200 MPa
300 MPa
400 MPa
500 MPa
100 µm
354 355 356 357
Fig. 4. Transverse sections of sea bass muscle treated by high-pressure processing and stored during 0, 7 and 14 days at 4°C. Muscle protein stains orange and collagen blue.
Page 19
358 359
360
361
362
363
364
365
366
367
368
369
370
371
372
373
374
375
376
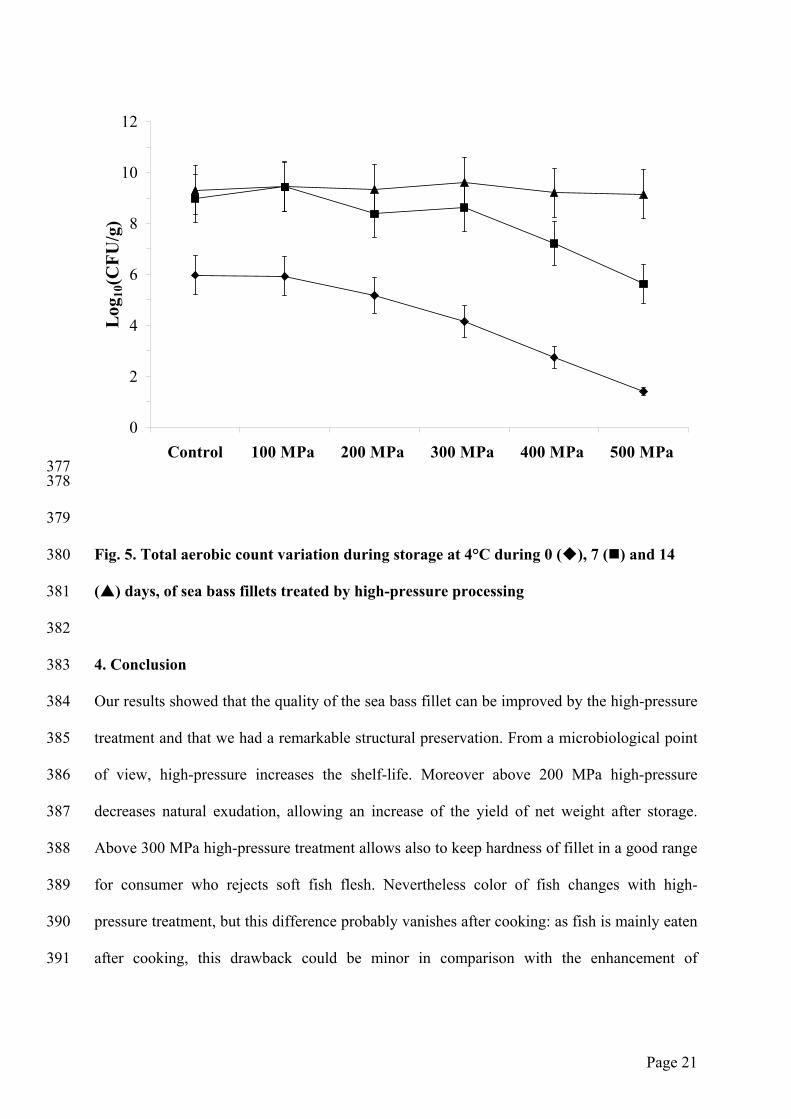
3.4. Impact of pressure processing on microbiological quality of fish muscle
The microbial flora is present on the skin and in the digestive system of the living fish.
These micro-organisms contaminate the muscle after the fish dies. Thus in spite of hygiene
precautions, total aerobic count of untreated sample reached 106 CFU/g at day 0, and around
109 CFU/g after 7 and 14 days of storage at 4°C. These results are in accordance with data
from Food and Agriculture Organisation of the United Nations (Huss, 1995) reporting 108 to
109 CFU/g of fish flesh.
Figure 5 shows a significant decrease of total aerobic count when pressure increases from 200
MPa, reaching only 30 CFU/g for 500 MPa treatment. These results confirm the effect of
high-pressure on the reduction of microbial growth (Cheftel, 1995), proving that high-
pressure treatment is a powerful tool to improve microbiological quality of fresh food. When
sample has been treated at 500 MPa, its total aerobic count after 7 days of storage is the same
that the one of control sample at day 0: the shelf life has been extended for one week.
However, whatever pressure treatment, at day 14, the total aerobic count reaches 109 CFU/g,
which is probably the maximal contamination. Then, we underscored that high-pressure
treatment above 300 MPa improved microbiological quality of fish fillet for at least seven
days.
Page 20
0
2
4
6
8
10
12
Control 100 MPa 200 MPa 300 MPa 400 MPa 500 MPa
Log
10(C
FU/g
)
377 378
379
380
381
382
383
384
385
386
387
388
389
390
391
Fig. 5. Total aerobic count variation during storage at 4°C during 0 ( ), 7 ( ) and 14
( ) days, of sea bass fillets treated by high-pressure processing
4. Conclusion
Our results showed that the quality of the sea bass fillet can be improved by the high-pressure
treatment and that we had a remarkable structural preservation. From a microbiological point
of view, high-pressure increases the shelf-life. Moreover above 200 MPa high-pressure
decreases natural exudation, allowing an increase of the yield of net weight after storage.
Above 300 MPa high-pressure treatment allows also to keep hardness of fillet in a good range
for consumer who rejects soft fish flesh. Nevertheless color of fish changes with high-
pressure treatment, but this difference probably vanishes after cooking: as fish is mainly eaten
after cooking, this drawback could be minor in comparison with the enhancement of
Page 21
392
393
394
395
396
397
398
399
microbiological and textural quality. Further studies on proteases and their behaviour under
pressure are necessary to understand the ageing of fish fillets after high-pressure treatment.
Acknowledgements
The authors are grateful to Sylviane Delépine for her technical assistance.
This work was supported by a grant from Ministère de l’Agriculture, de la Pêche, de
l’Alimentation et des Affaires Rurales (France).
Page 22

References
Ando M. 1997. The softening mechanisms of fish meat during refrigeration after death. Recent Res Devel
In Agricultural and Food Chem 1: 49-59.
Angsupanich K, Ledward DA. 1998. High-pressure treatment effects of cod (Gadus morhua) muscle.
Food Chemistry 63: 39–50.
Ashie INA, Simpson BK. 1996. Application of high hydrostatic pressure to control enzyme related fresh
seafood texture deterioration. Food Research International. 29 (5–6): 569–575.
Ashie INA, Lanier TC, MacDonald GA. 1999 Pressure-induced denaturation of muscle proteins and its
prevention by sugars and polyols. J. Food Sci. 64: 818-822.
Astier C, Labbe J-P, Roustan C, Benyamin Y. 1991. Sarcomeric disorganisation in post mortem fish
muscle. Comparative Biochemistry and Physiology. 100 B: 459-465.
Bourne MC. 1978. Texture profile analysis. Food Technology 32: 62-66.
Bremner AH, Hallett CI. 1985. Muscle fibre connective tissue junctions in the fish blue grenadier
(Macruronus novaezelandae): a scanning electron microscope study. J. Food Sci. 50: 975-980.
Bremner HA. 1992. Fish flesh structure and the role of collagen: its post mortem aspects and implications
for fish processing. In: Quality Assurance in the Fish Industry. Huss H.H., Jakobsen M. and Liston J.
Elsevier Sci. Pub. 39-62.
Bremner HA. 2002. Safety and quality issues in fish processing. Cambridge Woodhead Publishing
Limited 507p.
Chapleau N, de Lamballerie-Anton M. 2003. Changes in myofibrillar proteins interactions and
rheological properties induced by high-pressure processing. Eur. Food Res. Technol. 216:470-476.
Cheftel JC. 1995 Review : high-pressure, microbial inactivation and food preservation. Food Science and
Technology International. 1: 75-90.
Cheftel JC, Dumay E. 1997. Les hautes pressions : principes et potentialités, Agoral, Tech. et Doc.
Lavoisier Paris 197-213.
Cheftel JC, Culioli J. 1997. Effects of high-pressure on meat: A review. Meat Science. 46 (3) 211-236.
Dunajsky E. 1979. Texture of fish. Journal of Texture Studies 10: 301-318.
Page 24
Page 25
Haard NF. 1992. Biochemistry and chemistry color and color changes in seafoods. In Advances in
Seafood Biochemistry (eds, Flick, G.J. and Martin, R.E.) Technomic Publishing Co. Lancaster 305-360.
Hallett IC, Bremner HA. 1988. Fine structure of the myocommata-muscle fibre junction in hoki
(Macruronus novaezelandiae). Journal of the Science of Food and Agriculture 44: 245–261.
Hayert M, Perrier-Cornet JM, Gervais P. 1999. A simple method for measuring the pH of acid solution
under high-pressure. The Journal of Physical Chemistry. A, Molecules, Spectroscopy, Kinetics,
Environment and General Theory 103: 1785-1789.
Heremans K. 1982. High pressure effects on the proteins and other biomolecules. Ann Rev Biophys
Bioeng. 11: 1-21.
Huss HH. 1995. Quality and quality changes in fresh fish. FAO Fisheries Technical Paper, 348. Rome,
FAO, 195p.
Jiang ST. 2000 Effect of proteinases on the meat and seafood quality. Food Science and Agricultural
Chemistry 2(2): 55-74.
Knorr D. 1999. Novel approaches in food-processing technology: new technologies for preserving foods
and modifying function. Current Opinion in Biotechnology. 10(5): 485-491.
Lavety J, Afolabi OA, Love RM. 1988. The connective tissues of fish. IX. Gaping in farmed species.
International Journal of Food and Technology. 23: 23-30.
Montero P. 1997. Involvement of collagen and connective tissue in postmortem changes in seafoods.
Evaluation of Fish Freshness. 12-14: 190-197.
Oshima T, Nakawa T, Kiozumi C. 1992. Effect of high pressure on the enzymatic degradation of
phospholipids in fish during storage. In Blight EG. Seafood Science and Technology, Oxford, Fishing
News Books, 64-75.
Oshima T, Ushio H, Koizumi C. 1993. High-pressure processing of fish and fish products. Trends in
Food Science and Technology.4: 370–375.
Papa I, Alvarez C, Verrez-Bagnis V, Fleurence J, Benayamin Y. 1996. Post mortem release of fish white
muscle α-actinin as a marker of disorganisation. Journal of Science and Food Agriculture 72: 63-70.
Page 26
Papa I, Taylor RG, Astier C, Ventre F, Lebart MC, Roustan C, Ouali A, Benyamin Y. 1997. Dystrophin
cleavage and sarcolemma detachement are early post mortem changes on sea bass (Dicentrachus labrax)
white muscle. Journal of Food Science. 62: 917-921.
Rehbein H. 1997. Post mortem changes of sarcoplasmic proteins of flesh fish. Evaluation of Fish
Freshness. 238-240.
Smelt JPPM 1998. Recent advances in the microbiology of high pressure processing. Trends in Food
Science and Technology. 9: 152–158.