Cellular and molecular immune responses of the sea bass (Dicentrarchus labrax) experimentally...
9
Cellular and molecular immune responses of the sea bass (Dicentrarchus labrax) experimentally infected with betanodavirus G. Scapigliati a, * , F. Buonocore a , E. Randelli a , D. Casani a , S. Meloni a , G. Zarletti a , M. Tiberi a , D. Pietretti a , I. Boschi a , M. Manchado b , B. Martin-Antonio b , R. Jimenez-Cantizano b , G. Bovo c , F. Borghesan c , N. Lorenzen d , K. Einer-Jensen d , S. Adams e , K. Thompson e , C. Alonso f , J. Bejar f , I. Cano f , J.J. Borrego f , M.C. Alvarez f a Dipartimento di Scienze Ambientali, Largo dell'Università, Università degli Studi della Tuscia, Viterbo 01100, Italy b Centro IFAPA, Junta de Andalucia, El Toruño, Cádiz, Spain c Istituto Zooprofilattico Sperimentale delle Venezie, Legnaro, Italy d Danish Institute for Food and Veterinary Research, Aarhus, Denmark e Aquatic Diagnostics Ltd., Stirling, UK f University of Malaga, Malaga, Spain article info Article history: Received 28 August 2009 Received in revised form 3 November 2009 Accepted 7 November 2009 Available online 17 November 2009 Keywords: Sea bass Dicentrarchus labrax Betanodavirus VER PCR array Lymphocytes Antibody Anti-viral immune defence abstract Naïve sea bass juveniles (38.4 4.5 g) were intramuscularly infected with a sublethal dose of betano- davirus isolate 378/I03, followed after 43 days by a similar boosting. This infection resulted in an overall mortality of 7.6%. At various intervals, sampling of fish tissues was performed to investigate: i) B and T lymphocyte content in organs and tissues; ii), proliferation of leucocytes re-stimulated in vitro with inactivated virus; iii) presence of serum antibody specific for betanodavirus; iv) expression of genes coding for the following immunoregulatory molecules involved in innate and acquired responses: type I IFN, Mx, IL-1, Cox-2; IL-10, TGF-b, TCRb, CD4, CD8a, IgM, by using a quantitative PCR array system developed for sea bass. The obtained results showed a detectable increase of T cells and B cells in PBL during betanodavirus infection. Furthermore, leucocytes obtained from blood, head kidney, and gills showed a detectable “in vitro” increase in viability upon addition of inactivated viral particles, as determined by measuring intracellular ATP concentration. ELISA analysis of sera showed that exposure to nodavirus induced a low, but specific antibody titer measured 43 days after infection, despite the presence of measurable levels of natural antibody. Finally, a strong upregulation of genes coding for type I IFN, Mx, and IgM was identified after both infection and boosting. Interestingly, an upregulation of Cox-2 until boosting, and of TGF-b and IL-10 after boosting was also observed, while the other tested genes did not show any significant vari- ations with respect to mock-treated fish. Overall, our work represents a first comprehensive analysis of cellular and molecular immune parameters in a fish species exposed to a pathogenic virus. Ó 2009 Elsevier Ltd. All rights reserved. 1. Introduction The knowledge of immune defence mechanisms against viral infection in teleost fish species is a matter of intense investigation and interesting results have been obtained through the study of protective mechanisms in vivo, by evaluating the gene expression of immunoregulatory peptides, as well as by analysing anti-virus specific antibody levels [1,2]. Antiviral activities of fish species include the activation of innate and acquired immune responses [3e5], with the promising possibilities offered by genetic vaccina- tion to control the spreading of virosis induced by VHSV and IHNV in salmonid species [6,7]. The Mediterranean sea bass is a marine species quite sensitive to viral encephalopathy and retinopathy (VER), otherwise known as viral nervous necrosis (VNN), a serious disease induced by different viral agents belonging to the Nodaviridae family, genus Betanodavi- rus, [8,9]. Available pathological data can be obtained from fish farms about this type of infection, where the virus may cause massive mortalities [10]. Previous studies have shown that the virus affects preferentially fish at larval and young stages [11], but despite the massive diffusion of VER in farmed sea bass, the knowledge on the immune responses of this species against the virus is meager. * Corresponding author. Tel./fax: þ39 0761357029. E-mail address: [email protected] (G. Scapigliati). Contents lists available at ScienceDirect Fish & Shellfish Immunology journal homepage: www.elsevier.com/locate/fsi 1050-4648/$ e see front matter Ó 2009 Elsevier Ltd. All rights reserved. doi:10.1016/j.fsi.2009.11.008 Fish & Shellfish Immunology 28 (2010) 303e311
-
Upload
juntadeandalucia -
Category
Documents
-
view
0 -
download
0
Transcript of Cellular and molecular immune responses of the sea bass (Dicentrarchus labrax) experimentally...
lable at ScienceDirect
Fish & Shellfish Immunology 28 (2010) 303e311
Contents lists avai
Fish & Shellfish Immunology
journal homepage: www.elsevier .com/locate / fs i
Cellular and molecular immune responses of the sea bass (Dicentrarchus labrax)experimentally infected with betanodavirus
G. Scapigliati a,*, F. Buonocore a, E. Randelli a, D. Casani a, S. Meloni a, G. Zarletti a, M. Tiberi a,D. Pietretti a, I. Boschi a, M. Manchado b, B. Martin-Antonio b, R. Jimenez-Cantizano b,G. Bovo c, F. Borghesan c, N. Lorenzen d, K. Einer-Jensen d, S. Adams e,K. Thompson e, C. Alonso f, J. Bejar f, I. Cano f, J.J. Borrego f, M.C. Alvarez f
aDipartimento di Scienze Ambientali, Largo dell'Università, Università degli Studi della Tuscia, Viterbo 01100, ItalybCentro IFAPA, Junta de Andalucia, El Toruño, Cádiz, Spainc Istituto Zooprofilattico Sperimentale delle Venezie, Legnaro, ItalydDanish Institute for Food and Veterinary Research, Aarhus, DenmarkeAquatic Diagnostics Ltd., Stirling, UKfUniversity of Malaga, Malaga, Spain
a r t i c l e i n f o
Article history:Received 28 August 2009Received in revised form3 November 2009Accepted 7 November 2009Available online 17 November 2009
Keywords:Sea bass Dicentrarchus labraxBetanodavirus VERPCR arrayLymphocytesAntibodyAnti-viral immune defence
* Corresponding author. Tel./fax: þ39 0761357029.E-mail address: [email protected] (G. Scapigliati).
1050-4648/$ e see front matter � 2009 Elsevier Ltd.doi:10.1016/j.fsi.2009.11.008
a b s t r a c t
Naïve sea bass juveniles (38.4 � 4.5 g) were intramuscularly infected with a sublethal dose of betano-davirus isolate 378/I03, followed after 43 days by a similar boosting. This infection resulted in an overallmortality of 7.6%. At various intervals, sampling of fish tissues was performed to investigate: i) B and Tlymphocyte content in organs and tissues; ii), proliferation of leucocytes re-stimulated in vitro withinactivated virus; iii) presence of serum antibody specific for betanodavirus; iv) expression of genescoding for the following immunoregulatory molecules involved in innate and acquired responses: type IIFN, Mx, IL-1, Cox-2; IL-10, TGF-b, TCRb, CD4, CD8a, IgM, by using a quantitative PCR array systemdeveloped for sea bass.
The obtained results showed a detectable increase of T cells and B cells in PBL during betanodavirusinfection. Furthermore, leucocytes obtained from blood, head kidney, and gills showed a detectable “invitro” increase in viability upon addition of inactivated viral particles, as determined by measuringintracellular ATP concentration. ELISA analysis of sera showed that exposure to nodavirus induced a low,but specific antibody titer measured 43 days after infection, despite the presence of measurable levels ofnatural antibody. Finally, a strong upregulation of genes coding for type I IFN, Mx, and IgM was identifiedafter both infection and boosting. Interestingly, an upregulation of Cox-2 until boosting, and of TGF-b andIL-10 after boosting was also observed, while the other tested genes did not show any significant vari-ations with respect to mock-treated fish. Overall, our work represents a first comprehensive analysis ofcellular and molecular immune parameters in a fish species exposed to a pathogenic virus.
� 2009 Elsevier Ltd. All rights reserved.
1. Introduction
The knowledge of immune defence mechanisms against viralinfection in teleost fish species is a matter of intense investigationand interesting results have been obtained through the study ofprotective mechanisms in vivo, by evaluating the gene expression ofimmunoregulatory peptides, as well as by analysing anti-virusspecific antibody levels [1,2]. Antiviral activities of fish speciesinclude the activation of innate and acquired immune responses
All rights reserved.
[3e5], with the promising possibilities offered by genetic vaccina-tion to control the spreading of virosis induced by VHSV and IHNVin salmonid species [6,7].
The Mediterranean sea bass is a marine species quite sensitiveto viral encephalopathy and retinopathy (VER), otherwise known asviral nervous necrosis (VNN), a serious disease induced by differentviral agents belonging to the Nodaviridae family, genus Betanodavi-rus, [8,9]. Available pathological data canbeobtained fromfish farmsabout this type of infection, where the virus may cause massivemortalities [10]. Previous studies have shown that the virus affectspreferentially fish at larval and young stages [11], but despite themassive diffusion of VER in farmed sea bass, the knowledge on theimmune responses of this species against the virus is meager.

G. Scapigliati et al. / Fish & Shellfish Immunology 28 (2010) 303e311304
The main innate defence mechanisms of antiviral responsepresent in all vertebrate classes include the production of theinterferon type I (IFN) peptides and Mx protein. Both the genescoding for these molecules have been cloned in some fish species[12,13] and in sea bass [14e16]. Recently, a paper describing animmune gene profiling of sea bass after an experimental treatmentwith VER virus (VERv), payed particular attention to some genesinvolved in innate responses like hepcidin, transferrin, cxcr4, andapolipoprotein [17].
Vaccination is the preferredway to fight the spreading of virusesin farmed species, and recently an inactivated VER preparation hasbeen employed as vaccine in the Asian sea bass Lates calcarifer [18].However, at present no vaccine formulations are available to fightVER in the Mediterranean sea bass. Consequently, much effort isrequired to investigate immune response of sea bass against VERantigens. The main viral antigen employed to induce specific anti-bodies and activate a protective immune memory is the capsidprotein, largely shown to be immunogenic in fish [1,2,19,20].Moreover, immunisation of sea basswith synthetic peptides derivedfrom the VERv capsid may induce antibody titers [20] and triggersthe B cell immune responses [21]. Accordingly, the recombinantlyproduced capsid protein from VERv, which is capable of self-assembly to form virus-like particles, has been shown to be immu-nogenic and induce a protective immune response in sea bass [22].
With these premises, studies on cellular and molecular immuneresponses to VER may have a value for both the understanding ofantiviral defence mechanisms in teleost fish species in general, andfor theapplicationof results to seabass vaccination [23] inparticular.
To achieve more insights into the fish immune response againstviral infection, in this work we describe some cellular and molec-ular responses induced in sea bass juveniles by the administrationof a sublethal dose of VERv. More in details, we have determined ininfected animals the lymphocyte number, the in vitro proliferationof leucocytes, the production of specific serum antibodies and thequantitative expression by a PCR array system of genes coding forinterferon type I (IFN), Mx protein, interleukin-1 (IL-1), cyclo-oxygenase-2 (Cox-2), immunoglobulin (IgM), TGF-b, T cell receptorbeta chain (TCRb), and TCR co-receptors CD4 and CD8a.
2. Materials and methods
2.1. Virus and cell culture conditions
The VERv, previously isolated from sea bass showing encepha-lopathy symptoms, was propagated on the SSN-1 cell line cultured at20 �C in 2% FBS enriched Leibovitz (L-15) medium (Gibco). Prior tovirus inoculation, SSN-1 cells were maintained at 25 �C in L-15 sup-plemented with 2% L-glutamine (Sigma), 1% penicillinestreptomycin(Gibco) and 10% foetal bovine serum (FBS) (Cambrex). Virus inocu-lation was performed at 60% semi-confluence of cell cultures. Virusyield was determined by titration on 96-well plates by the TCID50method, as previously described [24].
2.2. Sea bass infection and boosting
For infection experiments a total of 900 sea bass individuals(30e40 g) kept in the IFAPA Center El Toruño, Cádiz (Spain) wereused. Two weeks prior infection, fish were transferred to the quar-antine facilities for adaptation and distributed into three (4.000 L)tanks. Under these conditions, they were fed daily with dry feed(Skretting; 0.5% of weight mass). Temperature (20e22 �C) andsalinity (37&) conditions were maintained stable over theexperiment.
Fish (n� ¼ 200) in the control tank were injected intramuscu-larly (i.m.) with PBS, whereas all fish from other two tanks
(n�200 þ 200) were injected i.m. with VERv (104 TCID50 ml�1). Thisvirus dose was tested to induce low mortality in sea bass byprevious in vivo tests. A similar booster VERv dose was adminis-tered at 43 days after infection, and time course sampling wasperformed as indicated below. Moribund fish showing VER symp-toms were removed, and overall mortality was determined at 30days after boosting by considering the number of employed controland treated samples.
For gene expression analyses, 7 fish/group/time point weresampled. From each individual fish the head kidney was removedafter infection and boosting at hours: 0, 6, 24; and at days: 3, 10,12,and 30. The tissue was immersed in 1 ml of Trizol, labelled,immediately frozen in liquid nitrogen and stored at �80 �C untilfurther use. Of these 7 fish/group/time point samples, 4 fish wereused for quantitative PCR assays, namely those giving a sufficientamount of cDNA.
Sera from 10 fish per group were obtained from clotted blood atday 43, and thereafter until day 43 þ 60 at 10-day intervals.
2.3. Leucocytes and cell proliferation
Fish were lethally anaesthetised with phenoxyethanol(100 ppm) and organs removed and placed in cold HBSS. All buffersand solutions used in handling fish tissues and cells were broughtto 355 mOsm kg�1 with 2 M NaCl. Leucocytes were obtained at 43days, 43 þ 30 days and 43 þ 60 days from head kidney, spleen,intestine, and gills by pushing organs in cold HBSS througha 100 mm nylon mesh. Obtained cells were washed by centrifuga-tion, resuspended in HBSS and loaded over 1.04 and 1.07 g cm3
Percoll gradients as previously described [25]. Whole blood fromindividual fish (1 ml) was collected from the caudal vein usingHBSS-heparin, washed twice in HBSS-heparin, resuspended in 8 mlof the same solution and loaded over Percoll as above. Aftercentrifugation (30 min at 840 � g) at 4 �C, cells at the interfacebetween the two densities were collected, washed with HBSS(10 min at 680 � g) at 4 �C, used immediately or resuspended inflasks at 2 � 106 cells ml�1 in 5 ml of L15 medium (Gibco) con-taining 5% heat-inactivated FCS (Gibco), antibiotics, and incubatedat 18 �C. Cell viability of leucocytes was determined by counting ina haemocytometer with Trypan blue.
Cell proliferation was determined by assaying intracellular ATPlevels of leucocyte cultures using a luminometric assay (ATP-lite,Perkin Elmer) as previously described [26,27]. Briefly, 100 ml ofculture medium containing 5 � 105 leucocytes from control andVERv-treated fish were incubated for 48 h in L15 medium con-taining 5% FCS, antibiotics, and where required with 5 ml of thesame VERv preparation obtained as above described, but inacti-vated by heat treatment (65 �C, 20min). After 48 h, leucocytes weretransferred into each well of a 96-well luminometric plate (IsoplateTC PerkinElmer), the cells were lysed with 50 ml of the solutioncontained in the kit following the manufacturer's instructions. ATPwas readwith a luminometer (Victor II, Perkin Elmer) bymeasuringthe light emitted when adding the kit reagent.
2.4. Immunofluorescence and flow cytometry
Indirect immunofluorescence (IIF) was carried out as previouslydescribed [25] at 4 �C in solutions containing 0.1% sodium azide.Briefly, cells were washed by centrifugation with phosphate buff-ered saline (PBS) and incubated with 250 ml of DLT15 (specific forsea bass thymocytes and Tcells, IgG3 subclass) or DLIg3 (specific forIg and Ig-bearing cells, IgG1 subclass) mAbs as undiluted culturesupernatants for 45 min. These mAb have been previouslydescribed and characterized [28,29]. Control staining was per-formed by incubating cells with myeloma culture supernatant.
Table 1Lymphocyte content in indicated tissues, and at indicated sampling time. Indirectimmunofluorescence and flow cytometry data obtained with mAb DLT15 for T cellsand mAb DLIg3 for B cells. Numbers indicate at sampling days the mean � S.D.percent of immunoreactive leucocytes in indicated tissues from 5 individual fish.Asterisks indicate a p value< 0.05 (ANOVA) of VERv-treated samplewhen comparedwith PBS-treated control.
Day 43 Day 43 � 30 Day 43 � 60
T cellsPBL PBS 6.82 � 2.29 3.17 � 1.74 6.72 � 1.8
VERv 10.95* � 4.3 6.73* � 2.66 10.04* � 1.74HK PBS 11.75 � 1.2 6.1 � 2.66 5.09 � 0.8
VERv 14.95 � 3.2 9.42 � 2.58 16.56* � 3.06SPL PBS 12.37 � 2 6.05 � 2.4 10.4 � 1.6
VERv 9.92 � 3.3 7.1 � 2.65 9.4 � 2.06GUT PBS 14.15 � 2.6 18.04 � 7.9 8.97 � 3.9
VERv 22.48* � 5.3 20.81 � 7.1 9.37 � 2.55GILL PBS 9.5 � 2.7 11.53 � 8.72 11.45 � 2.1
VERv 8.21 � 3 1189 � 1.72 9.63 � 1.82
B cellsPBL PBS 6.71 � 3.7 4.14 � 2.86 9.97 � 3.1
VERv 13.59* � 5 8.96* � 3.25 12.47 � 5HK PBS 10.65 � 2.3 7.65 � 3.65 8.64 � 3.11
VERv 12.99 � 3.3 9.23 � 3.12 13.27 � 2.47SPL PBS 13.54 � 2 7.47 � 2.82 13.35 � 3.4
VERv 12.38 � 3.71 16.15 � 10.1 12.22 � 5.27GUT PBS 7.7 � 2.42 12.13 � 10.83 7.37 � 3.04
VERv 6.33 � 1.83 18.02 � 7.18 6.8 � 0.67GILL PBS 4.77 � 3.8 5.5 � 4.61 10.45 � 1.9
VERv 2.79 � 0.88 6.37 � 1.72 9.03 � 2.64
Abbreviations: PBL ¼ peripheral blood leucocytes; HK ¼ head kidney; SPL ¼ spleen;GUT ¼ gut-associated lymphoid tissue; GILL ¼ gills.
G. Scapigliati et al. / Fish & Shellfish Immunology 28 (2010) 303e311 305
After washing with PBS, a 1:250 dilution of fluorescein-labelledgoat anti-mouse Ig serum (Sigma) was added for 30 min. The cellswere then washed and monitored for their morphology and fluo-rescence with a FACScalibur (Beckton-Dikinson, USA). Analysis wasdone using the Cellquest program on 10,000 events acquiredwithout gating.
2.5. ELISA
Indirect ELISA was essentially performed as previouslydescribed [29]. Briefly, 100 ml of inactivated VERv preparationdiluted 1:2 with 0.1 M carbonateebicarbonate buffer pH 9.4 wereemployed to coat polystyrene plates (Maxisorp, Nunc, Roskilde, DK)overnight at 4 �C. The wells were then washed three times withTriseHCl 50 mM pH 7.4 containing 0.05% Tween-20 and 0.15 MNaCl (TTN). After blocking remaining sites with 3% BSA in TTN(TBT), 100 ml of serial dilutions (1:100e1:6400) of sera diluted inTBT were incubated overnight at 4 �C. Sera from 10 fish at eachsampling time were analysed in triplicate wells. The wells werecarefully washed with TTN and then incubated for 90 min with100 ml of anti-sea bass IgM antiserum conjugated with peroxidase(C1-HRP, Aquatic Diagnostics, Stirling, UK) employed followingmanifacturer's instructions. The wells were then carefully washedtwicewith TTN and twicewith 50mMphosphate-citrate buffer (pH5.0). The reaction was visualised with 100 ml well�1 of 0.04%o-phenylenediamine in 50 mM phosphate-citrate buffer (pH 5.0)containing 0.001% H2O2. The reaction was allowed to proceed for20 min at 22 �C, stopped with 50 ml of 3 N sulphuric acid, andabsorbance read at 492 nm with an automatic plate reader (Lab-systems Multiskan MS).
2.6. Quantitative PCR arrays on head kidney leucocytes
Total RNA was isolated from head kidney with Tripure (Roche)following the manufacturer's instructions. RNA was suspended inDEPC treated water and used for quantitative PCR (qPCR). Controlsfor the presence of DNA contamination were performed using seabass b-actin primers that bracketed an intron. For reverse tran-scription, the BioScript RNase H minus (Bioline) enzyme was usedwith the following protocol: 2 mg of total RNAwasmixedwith 1 ml ofrandom hexamer (0.2 mg ml�1; Amersham Pharmacia) and nucleasefree water was added to a final volume of 12 ml. This mixture wasincubated at 70 �C for 5 min and then cooled on ice. Later, 0.4 ml ofa reaction mix containing 100 mM dNTPs (25 mM each; Promega),4 ml of 5 � reaction buffer, nuclease free water to a final volume of19.75 ml and 0.25 ml of BioScript at 200 U ml�1 were added and thesolution incubated at 25 �C for 10 min and then at 37 �C for 60 min.Finally, the reaction was stopped by heating at 70 �C for 10 min.
The transcription levels of the genes IFN type I, Mx protein, IL-1,COX-2, TGF-beta, IL-10, TCRb, and CD4 and CD8a were determinedwith an M�3000P real-time PCR system (Stratagene) equippedwith version 2.02 software and using the Brilliant SYBR GreenQ-PCR Master Mix (Stratagene) following the manufacturer'sinstructions. ROXwas used as internal passive reference dye since itis not reactive during real-time PCR and therefore can be used tonormalize slight differences in the volume of the added real-timePCR reaction, transparency of the plastic caps and other sources ofwell-to-well differences.
Specific PCR primers (Table 2) were designed for the amplifi-cation of products (w200 bp) from the constant region of all genesanalysed and ribosomal 18S RNA as housekeeping gene. One ml of10 mM forward and reverse primers was dispensed into each 200-mlpolyethylene tubes plate for quantitative PCR and each plate waslyophilised in a heated vacuum centrifuge. Approximately 10 ng ofcDNA template was used in each PCR reaction. The PCR conditions
were as follows: 95 �C for 10 min, followed by 35 cycles of 95 �C for45 s, 52 �C for 45 s and 72 �C for 45 s. Reactions were performed intriplicate for each template cDNA, which was replaced with waterin all blank control reactions. Each run was terminated witha melting curve analysis which resulted in a melting peak profilespecific to the amplified target DNA. The analysis was carried outusing the endpoints method option of the M�3000P software thatallows the fluorescence data at the end of each extension stage ofamplification to be collected.
A relative quantification was performed comparing the levels ofthe target transcript to a reference transcript and the sample control(injected with PBS) was used as calibrator and defined as 1.0 value.The samenormalizer target (ribosomal 18SRNA)was included in theanalysis to correct for differences in total cDNA input among thedifferent samples. Quantitative assessment was based on determi-nation of threshold cycle (Ct), defined as the cycle at which a statis-tically significant increase in fluorescence above the backgroundsignal was detected. The specificity and size of the real-time PCRproducts were checked by agarose gel electrophoresis.
Four individual fish were analysed at each sampling point, andresults are expressed as the mean � SD.
2.7. RT-PCR
The presence of VERv in samples was investigated by RT-PCRusing the virus-specific primers VERv-F1 (50-TCGGCTGATACT-CCTGTGTG-30) and VERv-R1 (50-GTCATGATGGGAGCG GTAGT-30).The PCR conditions were as follows: 94 �C for 5 min, followed by 25cycles of 94 �C for 45 s, 57 �C for 45 s and 72 �C for 45 s, and finalextension of 72 �C for 10 min.
2.8. Statistical analysis
Numerical results are expressed in the text as the mean �standard deviation of the mean of four individual fish. One-way

G. Scapigliati et al. / Fish & Shellfish Immunology 28 (2010) 303e311306
ANOVA followed by Bonferroni's multiple comparison test wereused to determine differences among groups. Data analysis wasperformed using the GraphPad Prism 3.0 software statisticalpackage. The level for accepted statistical significance was p < 0.05.
3. Results
3.1. Cell proliferation
The results obtainedbymeasuring cell proliferationof leucocytesfrom blood, head kidney and gills are shown in Fig. 1. Cell prolifer-ation was measured by the quantitative determination of intracel-lular ATP, already shown to be related to cell viability and cellnumber in sea bass [27]. The bars show the content of intracellularATP measured in cultures of leucocytes coming from samplesinoculated with PBS (black bars), and from samples inoculated withVERv (grey bars). To all leucocyte cultures was added heat-inacti-vated VERv preparation. In PBL at day 43 the ATP values in HK cellshad a fourfold increase in fish injected with virus, as well as at day43 þ 30, although in this last sample the intracellular ATP valuesweremuch lower than in the previous sampling. In leucocytes fromHK a modest ATP increase was detected in VERv-treated fish at day43, with a more marked ATP increase at day 43 þ 30. In leucocytesfrom gills a significant ATP increase (about 4 times) was detected inVERv-treatedfish at day 43, and a less consistent ATP increase at day43 þ 30. Where indicated by asterisks, in VERv-treated fish therelative mean luminescence values (RLU) were significantlydifferent (ANOVA, p < 0.05) with respect to mock-treated fish.
3.2. Lymphocyte content
Leucocytes from PBL, HK, gills, spleen, and intestine wereemployed to evaluate by IIF and flowcytometry the percentages of Tcells and B cells using the mAb DLT15 and DLIg3, respectively, andobtained results are shown in Table 1. In PBL cells deriving fromVERv-treated fish, a clear measurable increase in T cell number
Leucocyte prol
0
500
1000
1500
2000
2500
3000
3500
4000
4500
5000
C43 VERv43 C43+30 VERv43+30 C43 VERv4
)y
ra
rt
ib
ra
(U
LR
VERv43 = 14700±7200
PBL H
*
*
Fig. 1. Intracellular ATP content of leucocytes The bars show the content of intracellular ATP(black bars), and from samples inoculated with VERv (grey bars). To all leucocyte cultures wmean luminescence values (RLU) in triplicate readings from 5 individual fish at each samplinVERv-treated fish the RLU were significantly different (ANOVA, p < 0.05) with respect to P
(around 3.5%) was observed at all three sampling dates. With theexclusion of two scattered points for HK (day 43þ 60), and gut (day43), no statistically significant difference was detected in the T cellcontent between control and VERv-treated leucocytes in othertissues. The VERv treatment also induced in PBL a robust increase inB cell number at day 43 (7%), and a minor increase (4.5%) at day43þ30. In all other tissues, no statistically significant differencewasdetected in the B cell content between control and VERv-treatedleucocytes.
3.3. ELISA assay
Sera from PBS-treated and VERv-treated fish were tested byELISA, and the results are shown in Fig. 2 at dilutions of sera of1:200 (Fig. 2a) and 1:3200 (Fig. 2b). The presence of measurablelevels of anti-VERv specific antibody was detectable at all samplingdates, being more evident at 1:3200 dilution of sera. The boostingtreatment with virus at day 43 slightly increased the amount ofspecific antibody, as can be observed from day 43 þ 10 onwards,and the increase was maintained until the last sampling at day43 þ 60. Statistical analysis of data showed a significance ofp < 0.05 (ANOVA) for all points at dilution of 1:3200.
3.4. Quantitative PCR
The presence of VERv transcripts in PBS-treated and VERv-infected samples was confirmed by conventional PCR using specificprimers for the VERv capsid protein, and ampliconswere found onlyin VERv-infected fish (data not shown). Of the 7 fish/group/timepoint sampled, 4 fish per group were employed, namely those forwhich the cDNA preparation from HK tissue gave the best quality.
The cDNA obtained from head kidney of four sampled fish wassubjected to quantitative PCR for selected genes to test their tran-scription levels by using the PCR array system described above, andresults are shown in Fig. 3a and b. The housekeeping gene employedto determine the “fold change” was the ribosomal 18S RNA, and an
iferation (ATP)
3 C43+30 VERv43+30 C43 VERv43 C43+30 VERv43+30
days
K Gills
* *
*
measured in in vitro cultures of leucocytes deriving from samples inoculated with PBSere added heath-inactivated VERv preparation. Values are the mean � S.D. of relativeg time, with background (no VERv added) subtracted. Where indicated by asterisks, inBS-treated fish.

1:200
00,10,20,30,40,5
0,60,70,80,91
43 43+10 43+20 43+30 43+40 43+50 43+60
days
)mn
294(D
O
VERvPBS
1:3200
0
0,05
0,1
0,15
0,2
0,25
0,3
0,35
0,4
43 43+10 43+20 43+30 43+40 43+50 43+60days
)mn
294(D
O
VERvPBS
a
b
Fig. 2. ELISA of sera. The figure shows the absorbance values obtained by ELISAanalysis of sera from control fish (triangles line), and from VERv-treated fish (dottedline). Two representative lower (1:200, Fig. 2a) and higher (1:3200, Fig. 2b) dilutions ofsera are shown at 43 days after infection, and at 43 þ indicated days after boosting.Absorbance values at each indicated sampling time are the mean (492 nm) � S.D. oftriplicate readings from 10 individual sera. Statistical analysis of data showeda significant differences between VERv-treated fish with respect to PBS-treated fish(p < 0.05, ANOVA) for all sampling times at dilution of 1:3200.
G. Scapigliati et al. / Fish & Shellfish Immunology 28 (2010) 303e311 307
arbitrary expression baseline at value of 1.0 was drawn for theexpression of each tested gene in control fish injected with PBS. Thesequence of primers employed for PCR arrays is shown in Table 2.
The antiviral proteins IFN and MX showed similar temporalkinetics, with a strong increase at 6 h after infection, followed bya decrease, and with a new significant increase after boosting.
The cytokine TGF-beta had a modest increase after infection(2 fold), and a more marked increase (6 fold) at 10 days afterboosting. The anti-inflammatory cytokine IL-10 had a 3-foldincrease after infection, and a higher expression increase (10 fold,and 20 fold) at one day and 10 days after boosting.
Thepro-inflammatorycytokinesCox-2and IL-1 showeddifferentexpression kinetics, with the Cox-2 steadily increasing fromone dayafter infection (3 fold) until one day after boosting (22 fold), witha following decrease. On the other hand, IL-1 displayed a 9-foldincrease at three days after infection, and a 6-fold increase one dayafter boosting,with lower expression levels at other sampling times.
The IgM light chain gene showed a potent expression (around100 fold) soon after infection, remaining steadily high until day 30after infection. A further increase in transcription of the IgM genewas recorded one day after boosting (125 fold), then the expressiondecreased with time. The T cell-specific genes TCRb, CD4, and CD8adid not showa significant increase in their expression (maximumof2 fold) during all sampling times after infection and after boosting.
4. Discussion
The Mediterranean sea bass is an important wild and farmedspecies quite sensitive to encephalopathy and retinopathy induced
by VERv and it is believed that most sea bass individuals from fishfarms have indeed encountered and survived the virus during theirlife. Despite this, the cellular and molecular immune responses ofsea bass to VERv infection are largely unknown, with a consequenthampering in the production of potential vaccine candidates tofight the pathology.
With these premises, the aim of thework described in this paperwas touse in seabass an invivo infectionmodelwithVERv inorder tostudy some cellular and molecular immune responses. To performthis work, we injected sea bass juveniles with a number of virusparticles previously tested to induce lowmortality (not shown) and,as expected, the infection resulted in an overall mortality of 7.6%.
The first part of the study was addressed to test if VERv infectionaffected the lymphocyte profile in organs and tissues. This wasperformed by employing in IIF specific antibodies for sea bass Tcells and B cells [28,29] after infection and boosting. The resultshave shown that, among investigated tissues, blood leucocytesshowed a significant increase of T cells at all sampling times, anda significant increase of B cells at 43 d after infection and 30 d afterboosting (Table 1). To our knowledge, this is the first description ofa modulation of lymphocyte content induced by a viral infection ina fish species.
Afterwards, to assess whether viral infection was able to inducea measurable cellular immunity, leucocytes from control andtreated fish have been collected and stimulated in vitro withtemperature-inactivated VERv at 43 and 43þ 30 days after infectionand boosting, respectively. Since the content of intracellular ATP incultured cells has been indirectly related to cell activation andproliferation, both in mammals and fish [26,27], we analysed theVERv stimulation ability by applying the ATP intracellular assay toPBL of infected fish re-stimulated in vitrowith inactivated VERv. Assummarised in Fig. 1, after 48 h of co-culture with inactivated VERv,PBL of infected fish showed a significantly higher level of intracel-lular ATP content than PBL of controls. Differently from PBL, theleucocytes from head kidney showed a minor level of ATP content,with a statistically significant increase at 43 days after boosting, ascompared to infected fish. Interestingly, leucocytes from gills ofVERv-treated fish, upon addition of the inactivated virus, showedthe highest (up to tenfold) increase in intracellular ATP, with respectto mock-treated fish, suggesting a possible contribution of mucosalimmunity in this system of sea bass virus infection.
Taken together, the data we obtained by the cellular immu-nology approach showed that blood leucocytes of sea bass areresponsive to in vivo VERv infection, in terms of both modulation oflymphocyte number and leukocyte activation, as assessed by ex-vivo and in vitro analysis. Consequently, blood leucocytes shouldbe considered as an important cell source for further studiesaddressed to measure VERv-induced immune responses in the seabass. In addition, we demonstrated, for the first time in sea bass, theexistence of an in vitro leucocyte response against a viral antigenlasting up to 73 days after in vivo stimulation, suggesting that VERvinfection may induce the presence of “memory” or “activated”leucocytes in this species.
The infection with VERv was effective in inducing a low, butspecific antibody titer against the virus, as shown in Fig. 2. The ELISAdata, deriving from a large number of tested sera, have beenobtained both at low (1:200, Fig. 2a) and higher (1:3200, Fig. 2b)serum dilutions. The results showed the presence in all sera ofnatural/unspecific IgM at both dilutions (absorbance values from0.08 to 0.2), with a statistically significant increase in anti-VERvspecific IgM thatwas clearly observed only in sera of infected fish, ascompared to control animals. Thus, it can be suggested that a VERvexposure without a previous immunisation may induce the pres-ence of specific serumantibody. Accordingly, the immunogenicity ofVERv in seabasshas beenpreviously studiedwith the aid of peptides

Fig. 3. Quantitative PCR. The expression level of genes coding for IFN, Mx protein, TGF-b, IL-10, Cox-2, IL-1 (Fig. 3a), and of IgM, TCRb, CD4, CD8a (Fig. 3b) are shown in control fish(indicated), in infected fish (black bars), and in infected and boosted fish (grey bars) at indicated sampling times. Basal expression levels related to transcripts in control fish isindicated in each panel by a continuous line. The quantitative PCR amplification was performed in PCR arrays, and each point represents the mean � S.D. of triplicate readings from4 individual fish. Numerical data were analysed by one-way ANOVA and Bonferroni's post test, letters indicate significance of a p < 0.05 and b p < 0.01.
G. Scapigliati et al. / Fish & Shellfish Immunology 28 (2010) 303e311308
derived from the VERv capsid protein [21] and three regions of thecapsid protein comprising amino acid residues 1e32, 91e162 and181e212 have been found strongly immunoreactive with sea bassserum samples. Those and our data confirm that VERv and itsderived antigens can induce the production of specific antibodies,suggesting their possible use as immunogens in sea bass.
The effects of infection with VERv were also investigated bymonitoring the expression levels of genes coding for importantinnate and acquired responses of sea bass by using qPCR in cDNA
prepared from the HK of VERv-infected andmock-infected fish. Dueto the number of samples to be tested during the sampling protocol,the qPCR was conducted by using an in-house developed PCR array,adapted to sea bass from an array system already available forhuman qPCR [30] (seeMethods). With this system, for the first timeadapted to a non-mammalian model, the simultaneous amplifica-tion of up to 96 samples in each qPCR run was achieved.
Results from PCR array on tested samples showed, as expected,a robust amplification in the expression of the antiviral proteins IFN
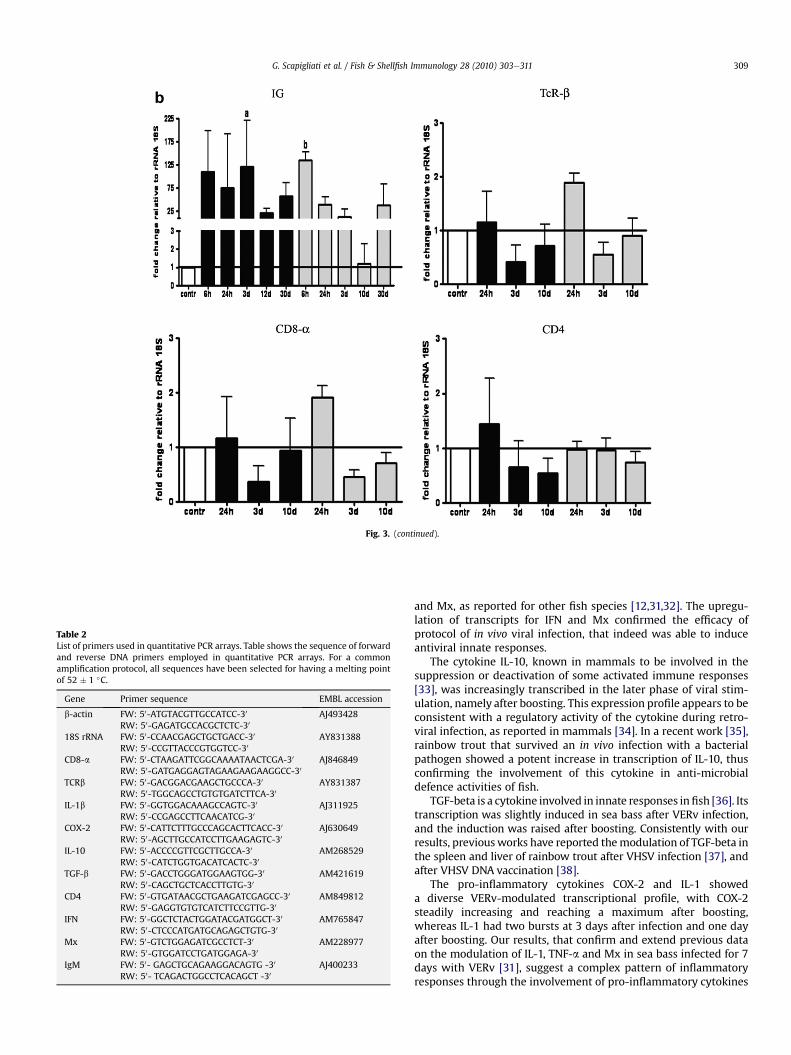
Fig. 3. (continued).
Table 2List of primers used in quantitative PCR arrays. Table shows the sequence of forwardand reverse DNA primers employed in quantitative PCR arrays. For a commonamplification protocol, all sequences have been selected for having a melting pointof 52 � 1 �C.
Gene Primer sequence EMBL accession
b-actin FW: 50-ATGTACGTTGCCATCC-30
RW: 50-GAGATGCCACGCTCTC-30AJ493428
18S rRNA FW: 50-CCAACGAGCTGCTGACC-30
RW: 50-CCGTTACCCGTGGTCC-30AY831388
CD8-a FW: 50-CTAAGATTCGGCAAAATAACTCGA-30
RW: 50-GATGAGGAGTAGAAGAAGAAGGCC-30AJ846849
TCRb FW: 50-GACGGACGAAGCTGCCCA-30
RW: 50-TGGCAGCCTGTGTGATCTTCA-30AY831387
IL-1b FW: 50-GGTGGACAAAGCCAGTC-30
RW: 50-CCGAGCCTTCAACATCG-30AJ311925
COX-2 FW: 50-CATTCTTTGCCCAGCACTTCACC-30
RW: 50-AGCTTGCCATCCTTGAAGAGTC-30AJ630649
IL-10 FW: 50-ACCCCGTTCGCTTGCCA-30
RW: 50-CATCTGGTGACATCACTC-30AM268529
TGF-b FW: 50-GACCTGGGATGGAAGTGG-30
RW: 50-CAGCTGCTCACCTTGTG-30AM421619
CD4 FW: 50-GTGATAACGCTGAAGATCGAGCC-30
RW: 50-GAGGTGTGTCATCTTCCGTTG-30AM849812
IFN FW: 50-GGCTCTACTGGATACGATGGCT-30
RW: 50-CTCCCATGATGCAGAGCTGTG-30AM765847
Mx FW: 50-GTCTGGAGATCGCCTCT-30
RW: 50-GTGGATCCTGATGGAGA-30AM228977
IgM FW: 50- GAGCTGCAGAAGGACAGTG -30
RW: 50- TCAGACTGGCCTCACAGCT -30AJ400233
G. Scapigliati et al. / Fish & Shellfish Immunology 28 (2010) 303e311 309
and Mx, as reported for other fish species [12,31,32]. The upregu-lation of transcripts for IFN and Mx confirmed the efficacy ofprotocol of in vivo viral infection, that indeed was able to induceantiviral innate responses.
The cytokine IL-10, known in mammals to be involved in thesuppression or deactivation of some activated immune responses[33], was increasingly transcribed in the later phase of viral stim-ulation, namely after boosting. This expression profile appears to beconsistent with a regulatory activity of the cytokine during retro-viral infection, as reported in mammals [34]. In a recent work [35],rainbow trout that survived an in vivo infection with a bacterialpathogen showed a potent increase in transcription of IL-10, thusconfirming the involvement of this cytokine in anti-microbialdefence activities of fish.
TGF-beta is a cytokine involved in innate responses infish [36]. Itstranscription was slightly induced in sea bass after VERv infection,and the induction was raised after boosting. Consistently with ourresults, previousworks have reported themodulation of TGF-beta inthe spleen and liver of rainbow trout after VHSV infection [37], andafter VHSV DNA vaccination [38].
The pro-inflammatory cytokines COX-2 and IL-1 showeda diverse VERv-modulated transcriptional profile, with COX-2steadily increasing and reaching a maximum after boosting,whereas IL-1 had two bursts at 3 days after infection and one dayafter boosting. Our results, that confirm and extend previous dataon the modulation of IL-1, TNF-a and Mx in sea bass infected for 7days with VERv [31], suggest a complex pattern of inflammatoryresponses through the involvement of pro-inflammatory cytokines

G. Scapigliati et al. / Fish & Shellfish Immunology 28 (2010) 303e311310
during in vivo viral infection in fish species. This speculation hasbeen recently reinforced by the description of modulation of pro-inflammatory cytokine genes during in vivo viral infection in theAtlantic halibut [39].
For their importance, more work is required to investigate therole of innate and inflammatory responses in sea bass. However,with the recent availability of an immunome gene panel [40]addressed to study pathogen-induced modulation of expression,together with the possibility of PCR arrays for analysis of tran-scripts, this could be soon approached.
Interestingly, the gene coding for the IgM light chain of sea bassshowed a potent upregulation in its expression soon after infection,followed by a slight decrease and a new spike after boosting, thussuggesting the importance of VERv in modulating IgM production.Unfortunately, the sampling of sera started at day 43 and no ELISAdata for comparison were produced before.
The genes coding for the T cell-specific molecule TCRb, and forthe T cell co-receptors CD4 and CD8a did not show any significanttranscriptional variations during all the sampling protocol. Albeitthese data apparently disagreewith our previous observation that Tcells increase in PBL of virus-infected fish, it should be taken intoaccount that the two kinds of experiments differ in tissue type andsampling times analysed. In addition, in a previous work on Atlantichalibut experimentally exposed to VERv, no significant variations ofCD8a and CD8b transcripts were observed in the head kidney [41],thus confirming our observations.
Taken together, our quantitative PCR data depict a comprehen-sive and original picture of VERv infection-specific transcripts fromsea bass. Another paper recently investigated by qPCR the innateresponse genes of sea bass following VERv infection, but since noattention was surprisingly paid to transcripts coding for antiviralproteins and pro-inflammatory cytokines as well as to lymphocyte-specific genes [17], it is difficult to make a comparison between ourand those results.
In conclusion, our study presents for the first time an integratedview on some innate and acquired responses of sea bass to VERvinfection in naïve fish, identifying cellular and molecular candidateelements whose immunobiology might be crucially modulated byin vivo VERv infection.
In addition, we presented in this work an adapted qPCR arraystrategy, which could generate easier approaches to study the tran-scription level of gene clusters in a large number of samples in fish.
Ultimately, the here described data would be useful whenapplied to plan VERv vaccination routes, or to monitor the effects ofVERv antigenic preparations in the sea bass.
Acknowledgements
This work was supported by the 6FP project IMAQUANIM(Improved immunity of aquacultured animals), contract 007103.
References
[1] Emmenegger E, LaPatra S, Winton JR. Immune response to synthetic peptidesrepresenting antigenic sites on the glycoprotein of infectious hematopoieticnecrosis virus. Vet Res 1995;26:374e8.
[2] Cain KD, LaPatra SE, Shewmaker B, Jones J, Byrne KM, Ristow SS. Immuno-genicity of a recombinant infectious hematopoietic necrosis virus glycoproteinproduced in insect cells. Dis Aquat Organ 1999;36:67e72.
[3] Ellis AE. Innate host defense mechanisms of fish against viruses and bacteria.Dev Comp Immunol 2001;25:827e39.
[4] Munday B, Kwang J, Moody N. Betanodavirus infection of teleost fish:a review. J Fish Dis 2002;25:127e42.
[5] Esteban MA, Meseguer J, Tafalla C, Cuesta A. NK-like and oxidative burstactivities are the main early cellular innate immune responses activated aftervirus inoculation in reservoir fish. Fish Shellfish Immunol 2008;25:433e8.
[6] Lorenzen N, LaPatra SE. DNA vaccines for aquacultured fish. Rev Sci Tech2005;24:201e13.
[7] Einer-Jensen K, Delgado L, Lorenzen E, Bovo G, Evensen Ø, Lapatra S, et al. DualDNA vaccination of rainbow trout (Oncorhynchus mykiss) against two differentrhabdoviruses, VHSV and IHNV, induces specific divalent protection. Vaccine2009;27:1248e53.
[8] Frerichs GN, Rodger HD, Peric Z. Cell culture isolation of piscine neuropathynodavirus from juvenile sea bass, Dicentrarchus labrax. J Gen Virol 1996;77:2067e71.
[9] Péducasse S, Castric J, Thiéry R, Jeffroy J, Le Ven A, Baudin Laurencin F.Comparative study of viral encephalopathy and retinopathy in juvenile seabass Dicentrarchus labrax infected in different ways. Dis Aquat Organ1999;36:11e20.
[10] Bovo G, Nishizawa T, Maltese C, Borghesan F, Mutinelli F, Montesi F, et al. Viralencephalopathy and retinopathy of farmed marine fish species in Italy. VirusRes 1999;63:143e6.
[11] Breuil G, Mouchel O, Fauvel C, Pepin JF. Sea bass Dicentrarchus labrax nervousnecrosis virus isolates with distinct pathogenicity to sea bass larvae. Dis AquatOrgan 2001;45:25e31.
[12] Leong JC, Trobridge GD, Kim CH, Johnson M, Simon B. Interferon-inducible Mxproteins in fish. Immunol Rev 1998;166:349e63.
[13] Collet B, Secombes CJ. Type I-interferon signalling in fish. Fish ShellfishImmunol 2002;12:389e97.
[14] Wu YC, Chi SC. Cloning and analysis of antiviral activity of a barramundi (Latescalcarifer) Mx gene. Fish Shellfish Immunol 2007;23:97e108.
[15] Accession Number GenBank AY424963.1.[16] Casani D, Randelli E, Costantini S, Facchiano AM, Zou J, Martin S, et al.
Molecular characterisation and structural analysis of an interferon homologuein sea bass (Dicentrarchus labrax L.). Mol Immunol 2009;46:943e52.
[17] Sarropoulou E, Sepulcre P, Poisa-Beiro L, Mulero V, Meseguer J, Figueras A,et al. Profiling of infection specific mRNA transcripts of the European seabassDicentrarchus labrax. BMC Genomics 2009;10:157e75.
[18] Pakingking Jr R, Seron R, dela Peña L, Mori K, Yamashita H, Nakai T. Immuneresponses of Asian sea bass, Lates calcarifer Bloch, against an inactivatedbetanodavirus vaccine. J Fish Dis 2009;32:457e63.
[19] Yuasa K, Koeshyani I, Roza K, Mori K, Katata M, Nakai T. Immune response ofhumpback grouper, Cromileptes altivelis (Valenciennes) injected with therecombinant coat protein of betanodavirus. J Fish Dis 2002;25:53e6.
[20] Coeurdacier JL, Laporte F, Pepin JF. Preliminary approach to find syntheticpeptides from nodavirus capsid potentially protective against sea bassviral encephalopathy and retinopathy. Fish Shellfish Immunol 2003;14:435e47.
[21] Costa JZ, Adams A, Bron JE, Thompson KD, Starkey WG, Richards RH. Identi-fication of B-cell epitopes on the betanodavirus capsid protein. J Fish Dis2007;30:419e26.
[22] Thiéry R, Cozien J, Cabon J, Lamour F, Baud M, Schneemann A. Induction ofa protective immune response against viral nervous necrosis in the Europeansea bass Dicentrarchus labrax by using betanodavirus virus-like particles.J Virol 2006;80:10201e7.
[23] Chistiakov DA, Hellemans B, Volckaert FA. Review on the immunology ofEuropean sea bass Dicentrarchus labrax. Vet Immunol Immunopathol2007;117:1e16.
[24] Cunningham CH. Quantal and enumerative titration of virus in cell cultures.In: Kruse Jr PF, Patterson Jr MK, editors. Tissue culture: Methods and appli-cations. New York: Academic Press Inc; 1973. p. 527e32.
[25] Scapigliati G, Romano N, Abelli L, Meloni S, Ficca AG, Buonocore F, et al.Immunopurification of T-cells from sea bass Dicentrarchus labrax (L.). FishShellfish Immunol 2000;10:329e41.
[26] Crouch SPM, Kozlowski R, Slater KJ, Fletcher J. The use of ATP bioluminescenceas a measure of cell proliferation and cytotoxicity. J Immunol Meth 1993;160:81e8.
[27] Meloni S, Zarletti G, Benedetti S, Randelli E, Buonocore F, Scapigliati G. Cellularactivities during a mixed leucocyte reaction in the teleost sea bass Dicen-trarchus labrax. Fish Shellfish Immunol 2006;20:739e49.
[28] Scapigliati G, Mazzini M, Mastrolia L, Romano N, Abelli L. Production andcharacterisation of a monoclonal antibody against the thymocytes of the seabass Dicentrarchus labrax L. (Teleostea, Percicthydae). Fish Shellfish Immunol1995;5:393e405.
[29] Scapigliati G, Romano N, Picchietti S, Mazzini M, Mastrolia L, Scalia D, et al.Monoclonal antibodies against sea bass Dicentrarchus labrax (L.) immuno-globulins: immunolocalization of immunoglobulin-bearing cells and applica-bility in immunoassays. Fish Shellfish Immunol 1996;6:383e401.
[30] Lim J, Derrick SC, Kolibab K, Yang AL, Porcelli S, Jacobs WR, et al. Earlypulmonary cytokine and chemokine responses in mice immunized with threedifferent vaccines against Mycobacterium tuberculosis determined by PCRarray. Clin Vaccine Immunol 2009;16:122e6.
[31] Poisa-Beiro L, Dios S, Montes A, Aranguren R, Figueras A, Novoa B. Nodavirusincreases the expression of Mx and inflammatory cytokines in fish brain. MolImmunol 2008;45:218e25.
[32] Cuesta A, Tafalla C. Transcription of immune genes upon challenge with viralhemorrhagic septicemia virus (VHSV) in DNA vaccinated rainbow trout(Oncorhynchus mykiss). Vaccine 2009;27:280e9.
[33] de Waal Malefyt R, Coffman RL, O'Garra A. Interleukin-10 and the interleukin-10 receptor. Annu Rev Immunol 2001;19:683e765.
[34] Brockman MA, Kwon DS, Tighe DP, Pavlik DF, Rosato PC, Sela J, et al. IL-10 isup-regulated in multiple cell types during viremic HIV infection and revers-ibly inhibits virus-specific T cells. Blood 2009;114:346e56.

G. Scapigliati et al. / Fish & Shellfish Immunology 28 (2010) 303e311 311
[35] Raida M, Buchmann K. Development of adaptive immunity in rainbow trout,Oncorhynchus mykiss (Walbaum) surviving an infection with Yersinia ruckeri.Fish Shellfish Immunol 2008;25:533e41.
[36] Secombes C, Zou J, Daniels G, Cunningham C, Koussounadis A, Kemp G.Rainbow trout cytokine and cytokine receptor genes. Immunol Rev 1998;66:333e40.
[37] Tafalla C, Coll J, Secombes CJ. Expression of genes related to the earlyimmune response in rainbow trout (Oncorhynchus mykiss) after viral hae-morrhagic septicemia virus (VHSV) infection. Dev Comp Immunol2005;29:615e26.
[38] Jimenez N, Coll J, Salguero FJ, Tafalla C. Co-injection of interleukin 8 with theglycoprotein gene from viral haemorrhagic septicemia virus (VHSV) modulates
the cytokine response in rainbow trout (Oncorhynchus mykiss). Vaccine2006;24:5615e26.
[39] Patel S, Malde K, Lanzen, Olsen RH, Nerland AH. Identification of immunerelated genes in Atlantic halibut (Hippoglossus hippoglossus L.) following in vivoantigenic and in vitro mitogenic stimulation. Fish Shellfish Immunol2009;27:729e38.
[40] Randelli E, Buonocore F, Casani D, Fausto AM, Scapigliati G. An “immunome”gene panel for transcriptomic analysis of immune defence activities in theteleost sea bass (Dicentrarchus labrax L.): a review. Ital J Zool 2009;76:146e57.
[41] Patel S, Øvergård A-C, Nerland AH. CD8a and CD8b in Atlantic halibut, Hip-poglossus hippoglossus: cloning, characterization and gene expression duringviral and bacterial infection. Fish Shellfish Immunol 2008;25:570e80.