Effects influencing the compressive strength of a solid, fired ...
12
Ŕ periodica polytechnica Civil Engineering 55/2 (2011) 117–128 doi: 10.3311/pp.ci.2011-2.04 web: http:// www.pp.bme.hu/ ci c Periodica Polytechnica 2011 RESEARCH ARTICLE Effects influencing the compressive strength of a solid, fired clay brick Anita Fódi Received 2011-01-03, accepted 2011-03-01 Abstract The aim of the paper was to analyze the effect of the differ- ent influencing factors on the compressive strength of a solid, clay brick. The effect of the surface polishing, the height, width and length of the specimens, the type of the sampling (drilled or cut) and the effect of the production technology were studied. Though being the moisture content of the specimen an important factor, it was not examined herein. More than 110 brick spec- imens were tested using two different types of measuring pro- cedures: standard (destructive) compressive tests and Schmidt hammer (non-destructive) tests were carried out. Formulae were proposed for determining the normalized mean compres- sive strength from every possible type of specimens that were adequate for testing in case of this type of unit. It was found that the behaviour of the brick is orthotropic. It was proved that the effect of the height of the specimen has the most significant effect on the compressive strength. A linear relationship was found between the normalized mean compressive strength and the Young’s modulus of the brick in each direction. Keywords solid clay brick · compressive strength · experimental investi- gation · size effect · Young’s modulus Acknowledgement The author would like to express her grateful thanks to the colleagues in the Laboratory of the Budapest University of Tech- nology and Economics and Wienerberger Ltd for offering mate- rials and subsidy. This work is connected to the scientific pro- gram of the “Development of quality-oriented and harmonized R+D+I strategy and functional model at BME” project. This project is supported by the New Hungary Development Plan (Project ID: TÁMOP-4.2.1/B-09/1/KMR-2010-0002). Anita Fódi Budapest University of Technology and Economics, Department of Structural Engineering, H-1111 Budapest, Bertalan L. 2, Hungary e-mail: [email protected] Notation f b,65 the compressive strength of the brick specimen of 65 mm height [N/mm 2 ] A loaded the loaded area [mm 2 ] h the height of the specimen [mm] f * b the compressive strength of the specimen of 100 mm x100 mm loaded area [N/mm 2 ] f b the normalized mean compressive strength of the brick [N/mm 2 ] δ the shape/conversion factor that is suggested to calculate the normalized mean compressive strength of a masonry unit ac- cording to [1] R i the rebound value of the Schmidt hammer tests v the smaller size of the loaded area of the brick (the width of the brick) [mm] 1 Introduction The determination of the compressive strength of the brick is not only important because it is necessary for the calculation of the compressive strength of the masonry but also it can be ap- plied for determining the Young’s modulus of the brick. The elastic modulus of the masonry is expressed in the function of the compressive strength of the masonry. For defining the com- pressive strength of the masonry Eurocode 6 [2] suggests using the normalized mean compressive strength that is the compres- sive strength of a unit with the dimensions of 100 mm × 100 mm × 100 mm in case of air-dried condition. The normalized mean compressive strength is hard to be mea- sured. For most of the bricks, the size of the unit makes it impos- sible to determine the strength of the brick directly. The standard MSZ EN 772-1:2000 [1] does not allow to investigate compres- sive strength on a sample that has a height/smaller length ratio smaller than 0.4 or if the height of the specimen is smaller than 40 mm. Therefore, in case of units with small height, samples have to be cut or the standard suggests applying multiple sam- ples. Large units are appropriate for cutting cubic samples of Effects influencing the compressive strength of a solid, fired clay brick 117 2011 55 2
-
Upload
khangminh22 -
Category
Documents
-
view
0 -
download
0
Transcript of Effects influencing the compressive strength of a solid, fired ...
Ŕ periodica polytechnica
Civil Engineering55/2 (2011) 117–128
doi: 10.3311/pp.ci.2011-2.04web: http://www.pp.bme.hu/ci
c© Periodica Polytechnica 2011
RESEARCH ARTICLE
Effects influencing the compressivestrength of a solid, fired clay brickAnita Fódi
Received 2011-01-03, accepted 2011-03-01
AbstractThe aim of the paper was to analyze the effect of the differ-
ent influencing factors on the compressive strength of a solid,clay brick. The effect of the surface polishing, the height, widthand length of the specimens, the type of the sampling (drilledor cut) and the effect of the production technology were studied.Though being the moisture content of the specimen an importantfactor, it was not examined herein. More than 110 brick spec-imens were tested using two different types of measuring pro-cedures: standard (destructive) compressive tests and Schmidthammer (non-destructive) tests were carried out. Formulaewere proposed for determining the normalized mean compres-sive strength from every possible type of specimens that wereadequate for testing in case of this type of unit. It was foundthat the behaviour of the brick is orthotropic. It was proved thatthe effect of the height of the specimen has the most significanteffect on the compressive strength. A linear relationship wasfound between the normalized mean compressive strength andthe Young’s modulus of the brick in each direction.
Keywordssolid clay brick · compressive strength · experimental investi-
gation · size effect · Young’s modulus
AcknowledgementThe author would like to express her grateful thanks to the
colleagues in the Laboratory of the Budapest University of Tech-nology and Economics and Wienerberger Ltd for offering mate-rials and subsidy. This work is connected to the scientific pro-gram of the “Development of quality-oriented and harmonizedR+D+I strategy and functional model at BME” project. Thisproject is supported by the New Hungary Development Plan(Project ID: TÁMOP-4.2.1/B-09/1/KMR-2010-0002).
Anita Fódi
Budapest University of Technology and Economics, Department of StructuralEngineering, H-1111 Budapest, Bertalan L. 2, Hungarye-mail: [email protected]
Notationfb,65 the compressive strength of the brick specimen of 65 mm
height [N/mm2]
Aloaded the loaded area [mm2]
h the height of the specimen [mm]
f ∗
b the compressive strength of the specimen of 100 mm x100mm loaded area [N/mm2]
fb the normalized mean compressive strength of the brick[N/mm2]
δ the shape/conversion factor that is suggested to calculate thenormalized mean compressive strength of a masonry unit ac-cording to [1]
Ri the rebound value of the Schmidt hammer tests
v the smaller size of the loaded area of the brick (the width ofthe brick) [mm]
1 IntroductionThe determination of the compressive strength of the brick is
not only important because it is necessary for the calculation ofthe compressive strength of the masonry but also it can be ap-plied for determining the Young’s modulus of the brick. Theelastic modulus of the masonry is expressed in the function ofthe compressive strength of the masonry. For defining the com-pressive strength of the masonry Eurocode 6 [2] suggests usingthe normalized mean compressive strength that is the compres-sive strength of a unit with the dimensions of 100 mm × 100 mm× 100 mm in case of air-dried condition.
The normalized mean compressive strength is hard to be mea-sured. For most of the bricks, the size of the unit makes it impos-sible to determine the strength of the brick directly. The standardMSZ EN 772-1:2000 [1] does not allow to investigate compres-sive strength on a sample that has a height/smaller length ratiosmaller than 0.4 or if the height of the specimen is smaller than40 mm. Therefore, in case of units with small height, sampleshave to be cut or the standard suggests applying multiple sam-ples. Large units are appropriate for cutting cubic samples of
Effects influencing the compressive strength of a solid, fired clay brick 1172011 55 2
10 cm height. The standard [1] allows putting more bricks oneach other. This raises the issue of contact, thus in this paper itis intended to be avoided.
The surface of the brick should be plane; the number of thetested specimens should be at least 6. A further problem of theinvestigation of the strength is that brick size tolerance can be6 mm in 65 mm. Most of the bricks are too flat to investigatethe strength directly. The standard [1] suggests determining themean value of the compressive strength of six bricks in real sizesand then calculating the effect of the dimensions of the brick.For the normalized mean compressive strength the mean com-pressive strength has to be multiplied by a shape factor. Thisfactor takes into account only the height and the smaller loadedside of the brick. The compressive strength of the brick candepend strongly on the production technology. The amount ofadditional sawdust, the splitting process and the firing tempera-ture, the restraint effect of the platens, the height and shape ofthe specimen can have an effect on the compressive strength.The size and shape of the loaded area can have an influence onthe results. In addition, the moisture content of the specimencan also have an effect on the strength. In this paper the effect ofthe surface polishing, the height, width and length of the speci-mens, the type of the sampling and the effect of the productiontechnology and the effect of the burn in were investigated on thecompressive strength.
The novelty of this paper is the investigation of the influ-ence of the effect of the production technology (effect of thedirection of the loading), the effect of the surface polishing, theheight, width and length of the specimens and the type of sam-pling (drilled or cut) on the compressive strength. The aim ofthe paper was to find a correlation between the compressivestrength and the mentioned features. Instead of the time con-suming method of the standard [1] a simple, quick determina-tion (Schmidt hammer tests) could be appropriate for determin-ing the normalized mean compressive strength.
2 MotivationsA comprehensive experimental investigation of the compres-
sive strength of solid bricks was missing from the literature be-fore. If the compressive strength of the brick is dependent onthe type of the production technology then brick anisotropy canbe assumed. The Eurocode 6 [2] does not contain the effect ofthe anisotropy.
The investigation of the effect of the loading direction oncompressive strength is important in the following cases: 1.when the unit is placed not only in the lengthwise direction ofthe brick into the wall (see for example [3] and [4]) or 2. it isbuilt in lengthwise but loaded from the other direction (in caseof retaining walls). 3. It is important in case of investigatingthe compressive strength of buildings, too. The solid clay brickbeing investigated herein is the most traditional brick type inHungary. There are a lot of buildings in Budapest built at the1900’s that are constructed from solid clay brick. This brick is
built in the wall normally lengthwise, the height of the unit is65 mm and as usual it is loaded on the 120 mm × 250 mm area.The thickness of the wall is 120 mm. In the case of buildings,the cores obtained by horizontal drilling from building alwaysshow the compressive strength of the other two directions.
3 The production technologyThroughout the world, there are two possible ways of brick
producing: the brick can be formed either by extrusion or bymoulding. The former is applied in case of clays with high levelof plasticity. When the plasticity of the clay is lower, the latterprocedure is used characteristically [5]. In this case the claycake is filled into brick moulds, and then pressed.
In Hungary only the first technology is typical. First, the clayexploited from the clay field is transferred into the factory whereit is smashed with additional water and sawdust. After mix-ing it is pressed into a machine, and upon extrusion a columnarises that is split into brick pieces. The raw bricks are con-veyed into the drier where the bricks lose the majority of theirmoisture content under 40-100 ˚C. Then units are transferredinto the brick burning oven, where they are fired and afterwardsburnished and bundled. That is the reason why visible shrinkagecracks can be seen on the surface of the most of the bricks.
Table 1 shows the results of a survey of the Brick Instituteof America for the bricks in the United States. It shows thatthe compressive strength of the brick depends strongly on theproduction technology (extruded or moulded).
Tab. 1. Effect of the production method [6]
Type of production
Mean value of
the
compressive
strength
[N/mm2]
Standard
deviation of the
compressive
strength
[N/mm2]
Coefficient of
variations (%)
Extruded 77.9 30.8 39.5
Moulded 36.5 12.6 34.5
The δ conversion factor of [1] can be applied in every loadingdirection. The factor contains the effect of the height and thesmallest width of the unit. The factor orders higher strength tothe bigger blocks, which is not always true. The height of thebrick is defined as the dimension of the sample in the directionof the load applied. Therefore it is applicable by calculation ofthe normalized mean compressive strength in every direction ofthe units. The δ factor does neither contain the effect of the otherdimension of the brick, nor the difference because of the produc-tion direction. Most bricks contain holes that cause a smallercompressive strength. In case of solid bricks – if orthotropydoes not exist –, the compressive strength after conversion dueto size should be the same according to [1] and [2].
Per. Pol. Civil Eng.118 Anita Fódi

4 Previous results of other researchersMost of the reports do not mention the way how the com-
pressive strength of the brick was obtained, under what kind ofcircumstances. As a result of determination of the compressivestrength, the most papers do not provide whether the value ofthe compressive strength is a mean value for the brick, or a meanvalue for a 10 cm × 10 cm × 10 cm unit. Even less publicationscontain empirical results for the determination of the relation-ship between the compressive strength and the Young’s modulusof the brick. However, the Young’s modulus of the masonry isgiven as the function of the compressive strength in few articles.
According to the work of Pate and Noble (1958) [7] therelationship between the elastic modulus and the compressivestrength of the clay bricks is linear in case of low compressivestrength. In case of higher compressive strength the Young’smodulus increases exponentially. They determined the rela-tionship between the firing temperature and the compressivestrength of the brick and then between the firing temperatureand Young’s modulus. They found that proportionality existsbetween the two mechanical features (see Figure 1). However itwas not defined which type of compressive strength (normalizedor mean) was taken into account. Pate and Noble investigatedthe compressive strength of the brick only in one direction.
Fig. 1. Relationship between the Young’s modulus and compressive strength[7]
Ayala (1998) [8] collected the compressive strength and theYoung’s moduluses of fired clay bricks, mortars and masonrywalls for a statistical analysis. He investigated the connectionbetween the Young’s modulus and the compressive strength ofthe masonry units, mortar and masonry walls. The compressivestrength of the mortar and the brick are normalized with respectto the thickness of the mortar, the height of the brick and themasonry wall. A direct proportionality was found between thecompressive strength of the unit, mortar, and the masonry wall.The compressive strength was investigated only in one directionof the unit. As Figure 2 shows the results have an extremelyhigh standard deviation.
Fig. 2. Relationship between the Young’s modulus and the compressivestrength of the brick, mortar and masonry [8]
5 Experimental programA comprehensive experimental investigation was worked out
with testing of more than 110 specimens in order to determinethe effect of the parameters mention below on the compressivestrength of the brick, the normalized compressive strength andthe Young’s modulus of the brick. The dimensions of the ma-sonry unit were 65 mm × 120 mm × 250 mm. This type of brickcan be built into the wall in every direction. For all types of in-vestigation all the specimens originated from the same bundle,from the same manufacturer. The bricks were tested under air-dried conditions. The maximum specimen size that could beobtained from this type of brick with a plane surface was a 5 cm× 5 cm × 5 cm cubic sample. The smallest reasonable samplewas analyzed, too.
18 specimens were investigated experimentally to determinethe effect of the roughness of the surface, 45 for defining theinfluence of the length (loaded area) of the brick. 17 full sizebrick and 10 drilled cores were tested in order to determine theeffect of the type of the sampling and the size of the brick and24 specimens to investigate the anisotropy of the brick.
Two types of testing machines were applied in order to reachthe ultimate loads in the 2/3 part of the loading capacity of themachine for all types of specimens. In both cases the experi-ments were force-controlled. The velocity of the loading wasapplied that the ultimate load was reached in 1-2 minutes afterbeginning the loading. Both machine were jointed at the top andfixed at the bottom.
Schmidt hammer tests were worked out in order to deter-mine the compressive strength in every direction with a non-destructive method.
The Young’s modulus of the brick was measured by twomethods: by strain gauges on the cylindrical, drilled samplesand by inductive transducers on full size bricks. The applicabil-ity of the tests was controlled.
6 Results6.1 Effect of the production technologyIn order to investigate the effect of the anisotropy of the brick
without the influence of the size effect it would be necessary
Effects influencing the compressive strength of a solid, fired clay brick 1192011 55 2

to test bricks of the same sizes (50 mm × 50 mm × 50 mm)under the same circumstances. The biggest cubic specimen thatcould be reasonably formed from this type of brick is 50 mm× 50 mm × 50 mm. To examine the effect of the location ofthe tested specimens in the brick (the effect of burning in duringthe firing process) specimens were produced from the side andfrom the middle of the brick. Figure 3 shows the adjustment andnomination of the cut specimens. S indicates that the specimenoriginated from the side part of the brick, M indicates that it wassituated in the middle of the brick.
For better identifiability of the effect of the production tech-nology, the following directions are defined: A is the directionof extrusion (flatwise), B is the direction of cutting (the secondshortest side) and C is lengthwise behaviour. Figure 4 shows thedefinition of the directions.
Fig. 3. Investigation of the effect of the location of the specimens within thebrick
Fig. 4. The loading directions defined
Altogether 24 specimens were investigated, 8 pieces in eachdirections. The experiment brought the result that it has no sig-nificant effect on the compressive strength of the brick wherethe sample was situated in the brick. Table 2 presents that thecompressive strength is different in each loading direction, thebrick shows a clear orthotropic material behaviour.
A statistical analysis was carried out to prove that suspi-cion. As the standard deviations of the samples were not thesame, a Welch’s test could be applied to determine the existenceof heterogeneity because of the different producing directions.Therefore, supposing the normal distribution of the strength ofthe samples it can be stated that the difference in compressivestrength between the directions A and B exists with a probabilityof more than 99.5%. Between the directions B and C it is 94.3%,and between the directions A and C it is at least 95.8%. (degreesof freedom in all cases approx. 14) Therefore, the difference be-tween the loading direction A, B and C dependably exists; thebrick shows an orthotropic material behaviour. This means thata difference of 30% and 16% in the compressive strength in caseof this brick only occurs due to the investigated loading direc-tion.
The experiments show that the samples are anisotropic and
have a fibrous construction. The production technology of thistype of brick leads to an orthotropy whose direction correspondsto the brick edges. That is the reason why an orthotropy of thebrick could be assumed. The loading direction A correspondsto the direction of the extrusion. The brick has the highest com-pressive strength in this direction, which is an obvious fact be-cause the degree of the compaction is the highest in this direc-tion. In the direction B, the compressive strength of the brickamounts to the smallest value. This direction corresponds to thedirection of the splitting.
In this paper, every investigated sample is produced by thesame manufacturer. The statements related to the degree of theorthotropy are true only for this production technology or forsolid bricks that are produced by the same method. Every otherstatement is of general validity.
Looking at the values of the multiplicator given by [1] be-cause of the size effect, it can be seen that the modification inthe compressive strength caused by the multiplicator takes 45-55%. This reflects that the effect of the loading direction cannotbe neglected in case of this brick type and this production tech-nology if the effect of the height is taken into account.
6.2 The effect of roughness of the surfaceIn order to investigate the effect of the smoothness of the sur-
face of the brick, specimens with raw and polished surfaces wereinvestigated, respectively. The specimens were polished by a di-amond saw. Table 3 shows the mean value of the compressivestrength, the standard deviation and the coefficient of variationresulting from the tests of 7 specimens. All sizes of the brickswere the same.
Table 3 shows that the polishing process results in a 26% in-crease in the compressive strength; however, it is coupled withan increasing coefficient of variation. The standard [1] orders tocarry out the compressive tests on polished bricks, however Ta-ble 3 shows that polishing increases the coefficient of variationand increases the mean value of the compressive strength. It isnecessary to notice that to avoid local effects of the small bulgeson the surface of the brick, thin carton layer was placed betweenthe brick surface and the platens.
6.3 Effect of the length of the loaded surfaceThe effect of the extension of the loaded surfaces on the com-
pressive strength bricks with full length, 3/4 length and 1/2length were examined in Table 4. It contains the mean valuesof the compressive strength in case of the same number of sam-ples.
Comparing the results, the difference in the mean values of thecompressive strength of the full length and three-quarter lengthbrick is only 7.59 %. The diagram of Figure 5 clearly shows thatby decreasing the length of the brick, if the height and the widthof the sample are constant, the coefficient of variation will in-crease extremely. In case of a loaded half length brick, the bricklength is 125 mm, being a bit longer than the other horizontal
Per. Pol. Civil Eng.120 Anita Fódi

Tab. 2. Orthotropy of the brick measured on specimens of same sizes
Investigated direction Number of samples
Mean value of the
compressive strength
[N/mm2]
Standard deviation
[N/mm2]
Coefficient of variation
[%]
A 8 29.32 5.17 17.63%
B 8 20.70 4.57 22.06%
C 8 24.64 4.72 19.13%
Tab. 3. Effect of the surface
Name of specimen Number of samples
Mean value of the
compressive strength
[N/mm2]
Standard deviation of
the compressive
strength [N/mm2]
Coefficient of variation
[%]
Raw surface 7 35.10 1.14 3.25 %
Polished surface 7 44.22 5.35 12.10 %
size of the brick. Thus, in case of this test the smaller horizon-tal dimension of the loaded area is the same, so it can be seenclearly that the compressive strength can depend on the othersize of the specimen. That statement does not correspond to theapplication of the conversion factor. Therefore, any size of theloaded area has an effect on the compressive strength.
Fig. 5. Change in compressive strength according to the length of the brickin case of 65 mm high and 120 mm wide brick
That means if the lowest values of the compressive strengthin Figure 5 are approached by a linear function or the wholeassembly by a constant function, than
1 the compressive strength will depend only on the smallerwidth
2 it will depend linearly on the larger dimension of the loadedarea in case of the same smaller width
3 it depends linearly on the extension of the loaded area
4 it does not depend on the loaded area.
Furthermore, Figure 5 shows that an optimal size of the spec-imen exists that results the maximal compressive strength ofthe brick. This phenomenon is known in case of the concrete.For this type of brick, the optimal size of the loading area thatpresents the maximum compressive strength is ca. 21000 mm2.
In case of investigating specimens with relatively smallheight, the size effect should be considered. Between the load-ing platens and the specimen’s surface a friction exists. Thisfrictional force tries to prevent the lateral deformation along theplatens. That is the reason why the crack pattern of a small sam-ple consists of an upper and lower triangle, and an undisturbedzone takes place only in the middle of the specimen. However,the height of this type of brick is only 65 mm, therefore it is notpossible to obtain higher specimens. It is not reasonably to in-vestigate specimens with smaller than 40 mm × 40 mm loadedsurface, because it contains more or less cracks, than the brick,i.e. the representative volume of the brick is surely bigger thanthis size.
6.4 Effect of the height of the samplesIn order to investigate the effect of the specimen’s height and
the type of the sampling, full size bricks were loaded in everydirection, on the polished surface. The height is defined as thedimension in the loaded direction. The Table 5 contains the re-sults measured. The values are not converted into the compres-sive strength of one direction.
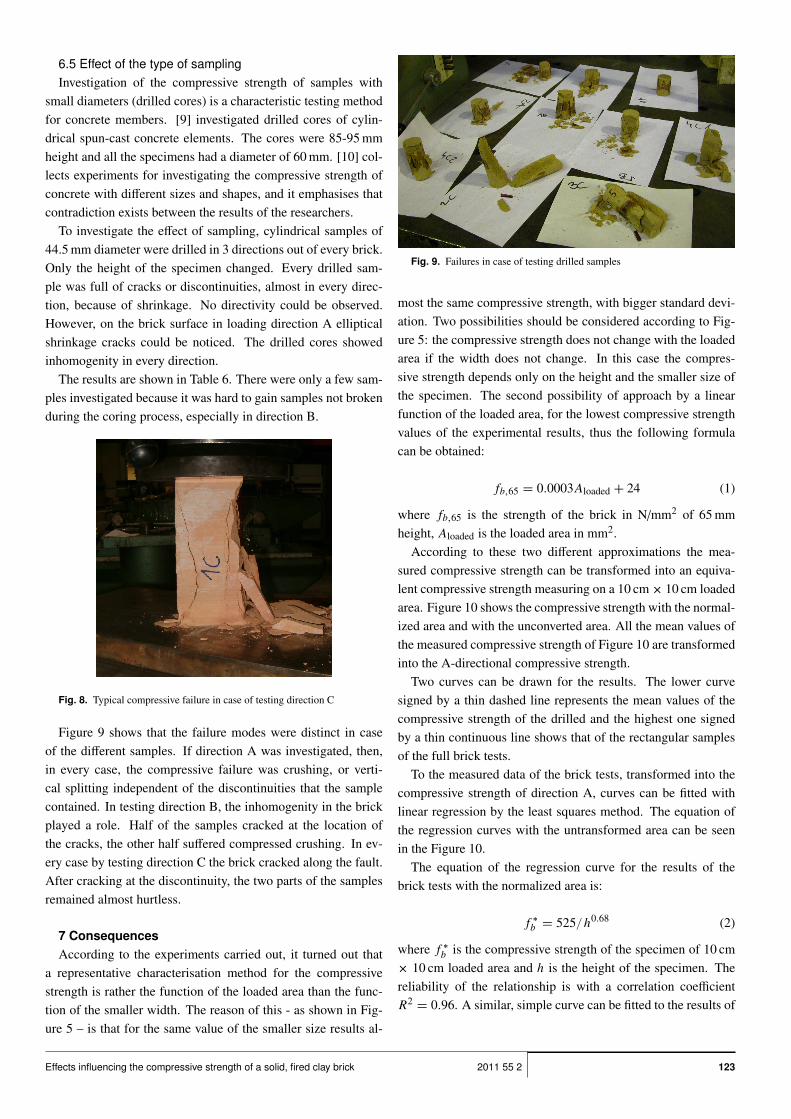
It could be clearly observed that the failure mode was differ-ent in case of the different testing directions due to the differenttesting sizes. In case of investigating direction A, a typical com-pressive crushing could be observed. An elliptical compressedzone remained almost hurtless, and the other part of the brickgot crushed. Figure 6 a and b show the compressive failure ofthe direction A. In case of direction B, as it is not usual, hori-zontal crack occurred along the length of the brick and then thewell known vertical splitting could be observed and a shear fail-ure occurred. An upper and a lower triangular prism could beobserved. Figure 7 b shows the two triangular prisms. In case oftesting the direction C, a compressive failure could be observed(Figure 8).
Effects influencing the compressive strength of a solid, fired clay brick 1212011 55 2

Tab. 4. Effect of the length (loaded area) of the specimen
Name of specimen Number of samples
Mean value of the
compressive strength
[N/mm2]
Standard deviation of
the compressive
strength [N/mm2]
Coefficient of variation
[%]
Raw surface, full size 11 35.66 2.31 6.49
Raw surface, 3/4 length 11 38.59 3.13 8.12
Raw surface 1/2 length 11 36.66 5.12 13.96
a) b)
Fig. 6. Crushing and vertical splitting in case of testing direction A (compressive failure)
a) b)
Fig. 7. Shear failure in case of testing direction B
Tab. 5. Test results of the full size bricks
DirectionNumber of
samples
Smaller size
(width) [mm]
Bigger size
(length) [mm]Height [mm]
Mean value
of the
compressive
strength
[N/mm2]
Standard
deviation
[N/mm2]
Coefficient of
variation [%]
A 5 117.8-118.7 246.5-251.0 55.6-56.3 45.3 6.23 13.73
B 5 63.4-65.1 246.2-246.9 110.0-112.6 16.73 4.76 28.45
C 5 64.2-64.8 118.6-119.3 231.0-241.1 10.48 2.26 21.56
Per. Pol. Civil Eng.122 Anita Fódi
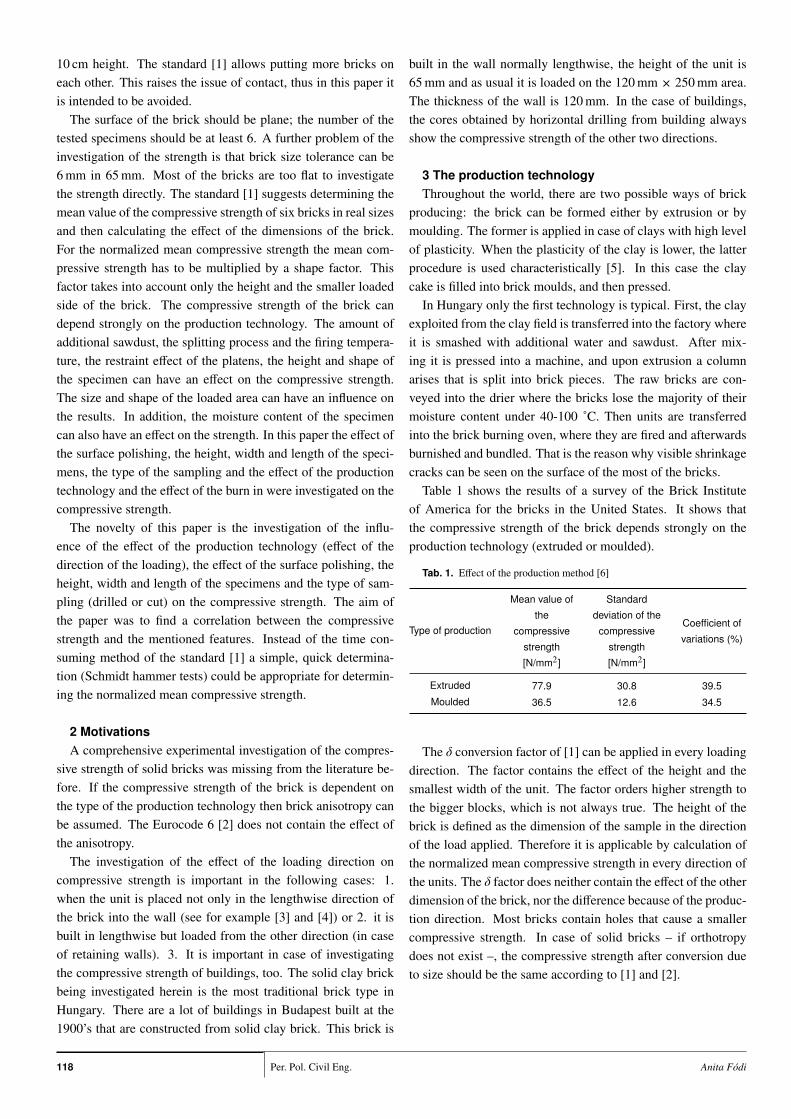
6.5 Effect of the type of samplingInvestigation of the compressive strength of samples with
small diameters (drilled cores) is a characteristic testing methodfor concrete members. [9] investigated drilled cores of cylin-drical spun-cast concrete elements. The cores were 85-95 mmheight and all the specimens had a diameter of 60 mm. [10] col-lects experiments for investigating the compressive strength ofconcrete with different sizes and shapes, and it emphasises thatcontradiction exists between the results of the researchers.
To investigate the effect of sampling, cylindrical samples of44.5 mm diameter were drilled in 3 directions out of every brick.Only the height of the specimen changed. Every drilled sam-ple was full of cracks or discontinuities, almost in every direc-tion, because of shrinkage. No directivity could be observed.However, on the brick surface in loading direction A ellipticalshrinkage cracks could be noticed. The drilled cores showedinhomogenity in every direction.
The results are shown in Table 6. There were only a few sam-ples investigated because it was hard to gain samples not brokenduring the coring process, especially in direction B.
Fig. 8. Typical compressive failure in case of testing direction C
Figure 9 shows that the failure modes were distinct in caseof the different samples. If direction A was investigated, then,in every case, the compressive failure was crushing, or verti-cal splitting independent of the discontinuities that the samplecontained. In testing direction B, the inhomogenity in the brickplayed a role. Half of the samples cracked at the location ofthe cracks, the other half suffered compressed crushing. In ev-ery case by testing direction C the brick cracked along the fault.After cracking at the discontinuity, the two parts of the samplesremained almost hurtless.
7 ConsequencesAccording to the experiments carried out, it turned out that
a representative characterisation method for the compressivestrength is rather the function of the loaded area than the func-tion of the smaller width. The reason of this - as shown in Fig-ure 5 – is that for the same value of the smaller size results al-
Fig. 9. Failures in case of testing drilled samples
most the same compressive strength, with bigger standard devi-ation. Two possibilities should be considered according to Fig-ure 5: the compressive strength does not change with the loadedarea if the width does not change. In this case the compres-sive strength depends only on the height and the smaller size ofthe specimen. The second possibility of approach by a linearfunction of the loaded area, for the lowest compressive strengthvalues of the experimental results, thus the following formulacan be obtained:
fb,65 = 0.0003Aloaded + 24 (1)
where fb,65 is the strength of the brick in N/mm2 of 65 mmheight, Aloaded is the loaded area in mm2.
According to these two different approximations the mea-sured compressive strength can be transformed into an equiva-lent compressive strength measuring on a 10 cm × 10 cm loadedarea. Figure 10 shows the compressive strength with the normal-ized area and with the unconverted area. All the mean values ofthe measured compressive strength of Figure 10 are transformedinto the A-directional compressive strength.
Two curves can be drawn for the results. The lower curvesigned by a thin dashed line represents the mean values of thecompressive strength of the drilled and the highest one signedby a thin continuous line shows that of the rectangular samplesof the full brick tests.
To the measured data of the brick tests, transformed into thecompressive strength of direction A, curves can be fitted withlinear regression by the least squares method. The equation ofthe regression curves with the untransformed area can be seenin the Figure 10.
The equation of the regression curve for the results of thebrick tests with the normalized area is:
f ∗
b = 525/h0.68 (2)
where f ∗
b is the compressive strength of the specimen of 10 cm× 10 cm loaded area and h is the height of the specimen. Thereliability of the relationship is with a correlation coefficientR2
= 0.96. A similar, simple curve can be fitted to the results of
Effects influencing the compressive strength of a solid, fired clay brick 1232011 55 2

Tab. 6. Experimental results for the drilled cylinders
Direction Diameter [mm] Height [mm]
Mean value of the
compressive
strength [N/mm2]
Standard deviation
of the compressive
strength [N/mm2]
Coefficient of
variation [%]
A 44.4 58.8
29.84 9.17 30.74A 44.5 57.7
A 44.5 56.3
A 44.4 57.0
B 44.5 75.611.58 - -
B 44.5 66.2
C 44.4 130.1
10.41 2.34 22.48C 44.5 132.0
C 44.4 90.0
C 44.5 89.6
Fig. 10. Mean values of the compressive strength in the function of theheight of the specimen with the equation of the untransformed curves
the drilled specimens and the cubic specimens with an equationof
f ∗
b = 831/h0.87. (3)
The correlation coefficient is R2= 0.83.
It is worth mentioning that one curve can be fitted to all thedata. In case of the measured normalized data the followingequation can be obtained:
f ∗
b = 521.3/h0.72. (4)
The correlation coefficient is R2= 0.75.
Supposing that the compressive strength of the brick dependson the height of the specimen and the smaller size of the loadedarea only, then – if the results are compared to the suggestions ofthe Eurocode 6 –, Figure 11 could be derived. The continuous,almost parallel curves show the effect of the δ factor [1] on thecompressive strength in case of different smaller size, v. If thenormalized compressive strength is derived from the cubic sam-ples according to [1], then the desired value is 25 N/mm2. Allthe values and the mean values from the experiments are shown
in the Figure 11. It shows that the height of the specimen hasthe biggest effect on the compressive strength of the brick. Thevalues are not transformed into the equivalent area and they aretransformed into the A directional compressive strength.
Fig. 11. The effect of height compared to the suggestion of the standard [1](mean values and all the results)
In order to determine the function that makes possible to getthe normalised mean compressive strength of every type of sam-ple, a function is needed to be found. This process was made bylinear regression with the least squares method.
As a first step, functions that are similar to the relationshipsgiven for concrete were investigated. For example [10] covers alot of relationships of the compressive strength and the geometryof concrete specimens. The compressive strength of concrete isgiven as the function of the edge length of the cube, of the loadedarea/volume and of the height/diameter ratio.
Figure 12 shows the experimental results of the compressivestrength in the function of the loaded area/specimen volume ra-tio. Linear functions were defined for the brick and for thecylindrical specimens with a good correlation. All results areconverted to the compressive strength of the direction A. The
Per. Pol. Civil Eng.124 Anita Fódi

height/loaded area ratio does not conduce to a result.
Fig. 12. The measured compressive strength in the function of the loadedarea/volume of the specimens
If the compressive strength of the brick is a function of the ra-tio of the smaller size and the height of the specimen, Figure 13can be derived. The smaller width is the diameter of the samplesin case of the cylindrical samples. All data are transformed intothe A-directional compressive strength
Fig. 13. The measured compressive strength in the function of theheight/width of the specimen ratio
In case of investigating the cylindrical samples only the heighthas an effect on the compressive strength. The measured valuescan be seen in the function of the height in Figure 14. The dia-gram shows the dependence of the compressive strength on theheight in case of cylindrical samples.
Fig. 14. The compressive strength in the function of the height for all resultsof the cylindrical samples
If the equation of Figure 14 is applied to convert the heightof the specimen into 10 cm height, then the loaded area or thesmaller size will be a function of the compressive strength. Incase of the drilled samples, the compressive strength of the100 mm high specimen is 13.31 N/mm2. If each of the othersamples is shown in the same diagram (see. Figure 15), thenit can be seen that the coefficient of variations of the strengthof the samples is relatively high (see Table 5 and 6). It is notreasonable to take the smaller size into account, as the standarddeviation has bigger effect than the smaller size. It shows thatthe height of the specimen has the biggest effect on the com-pressive strength. Each of the results are converted into the Adirectional compressive strength.
Therefore, the compressive strength of the unit is inverselyproportional to the height of the specimen. For the whole bricktest the dashed line, for the cylindrical sample the continuousline of Figure 15 is suggested to take the effect of the height ofthe specimen into account.
In case of this brick, the normalised mean compressivestrength in direction A is approx. 20-25 N/mm2.
Fig. 15. Compressive strength in the function of the height in case of allexperimental results
8 Determination of the compressive strength of thebrick by Schmidt hammer, type N (non-destructivetest)According to the directive MI 15011-1988 [11] it is possible
to determine the compressive strength of a brick by an N typeSchmidt hammer. However, it is not known whether the strengthobtained by Schmidt hammer is in conformity with the normal-ized mean compressive strength of Eurocode 6, or this testingmethod gives the compressive strength of a brick. The standard[1] does not dispose of the determination of the compressivestrength of the brick by Schmidt hammer.
Rebound tests were carried out using Schmidt hammer, typeN (two times 15 samples were examined). Full size bricks wereinvestigated in directions B and C. In the direction A it was notpossible to measure because of technical reasons. The brick hasto be pressed in order to prohibit the moving of the brick. It wasdetermined that the value of the rebound index strongly dependson the hold-down force. Each measurement published here was
Effects influencing the compressive strength of a solid, fired clay brick 1252011 55 2

carried out under 1.33 N/mm2 compressive stress, applying hor-izontal beating directions.
Pál Gábory investigated the compressive strength of masonryby Schmidt hammer, type N. The MI directive [11] suggests ap-plying the equation (10) in order to determine the compressivestrength of a brick by Schmidt hammer, type N according tohis work. Dulácska suggests a linear relationship (6) of thesetwo parameters in [12]. In 2001, Dulácska, Józsa and Boros-nyói modified the latter equation in [13], in case of investigatingthe compressive strength of bricks of old buildings. The modi-fied equation (7) and equation (6) applies to horizontal beatingdirections. Dulácska [14] found in 2008 that the relationship be-tween the rebound index and the compressive strength obtainedby [11] has to be modified. He corrected the equation of Gábory(10) and suggested applying (8) in case of horizontal beatingdirection, too.
fb = R2i /90, (5)
fb = 0.6Ri/ − 7 (6)
fb = 0.75Ri/ − 16 (7)
fb = R2i /110 (8)
where fb is the compressive strength of the brick in N/mm2, andRi is the rebound index obtained by Schmidt hammer, type N.
Figure 16 shows the change of the compressive strength inthe function of the rebound number according to the differentequations (10), (6), (7) and (8). It is interesting to note that anorthotropy of the compressive strength of the brick can be ob-served in directions B and C according to this type of measuring.The range of the mean value of the rebound number determinedby 9 rebound index on each sample was between 42 and 50.
Fig. 16. Comparison of the relationship of [11–13] and [14]
If the normalised mean compressive strength of the brickin loading direction A amounts to 20.0-25.0 N/mm2, then the
normalized mean compressive strength in direction B is 14.1-17.7 N/mm2, in direction C it is 16.8-21.0 N/mm2, as it was de-termined in Table 2. The normalized mean compressive strengthfrom the cubic test and from the standard compressive tests areshown in Table 7. The last four columns present the results ofthe Schmidt hammer test, calculated from (10), (6), (7) and (8),respectively.
Table 7 shows that the equations (6), (7) and (8) is applicablein order to determine the normalized mean compressive strengthin the direction A. If the normalized mean compressive strengthhas to be determined the relationships of the rebound numberand compressive strength need to be modified.
It can be suggested that for the Schmidt hammer tests, in caseof this brick, in case of 1.33 N/mm2 hold-down stress of thespecimen, in case of horizontal beating direction, that the re-lationship between the rebound index and the normalized com-pressive strength in direction B is:
fb = R2i /160, (9)
in the direction C:fb = R2
i /130, (10)
where fb is the normalized mean compressive strength of thebrick, and Ri is the rebound index. To get the compressivestrength of the loading direction A from the B and C directionalbeating, the normalized mean compressive strength of the unitin the direction B is suggested multiplying by 1.42 and in caseof direction C by 1.19. Testing directions B or C and applyingthe formulae of (7) and (8), the A-directional normalized meancompressive strength can be obtained safely.
9 Determination of the Young’s modulus of the brickThe Young’s modulus of the brick was measured by two types
of methods: by strain gauges, to avoid the restraint effect ofthe platens and by measuring the compression of the full sizesamples. In the first case, the strain gauges were glued on thecleaned surface of cylindrical samples. Three vertical straingauges were put on every sample with 120˚ offset. The resultsof the measurement are shown in Figure 17 signed with cylinderA, B and C in each direction.
Fig. 17. Young’s modulus in function of the compressive strength
In case of testing the full size bricks, the vertical compres-sion of the specimens was measured by an inductive transducer
Per. Pol. Civil Eng.126 Anita Fódi

Tab. 7. Mean values of compressive strength (rebound test using Schmidt hammer, type N – standard compressive test)
Normalized mean compressive strength [N/mm2]
Directions
Standard
compressive test
on cubic samples
Schmidt test
evaluated acc. to
(10)
Schmidt test
evaluated acc. to
(6)
Schmidt test
evaluated acc. to
(7)
Schmidt test
evaluated acc. to
(8)
A 20.0-25.0 - - - -
B 14.1-17.7 24.8 21.36 19.45 20.3
C 16.8-21.0 24.2 21.00 19.00 19.8
between the restraint platens. The results of the full brick areshown in Figure 17, as well. Compressive strengths presentedare the measured values on each specimen. The Young’s modu-luses are calculated from the slope of the stress-strain relation-ship, from the 1/3-2/3 of the elastic part of the diagram.
It can be stated that the Young’s modulus measured with straingauges is at least 3 times higher than the Young’s modulus of thebrick. The reason of that could be that the strain gauges mea-sured the compression of a length 10 or 20 mm, which presentsthe deformation of the material itself. The deformation of thebrick could be measured rather with measuring the compressionbetween the platens. It is worth noting that the strain gaugesmeasurements hardly take into account the effect of the crackslocated in the brick that modify the behaviour. However, mea-suring the compression of the brick itself is not the best methodto determine the Young’s modulus because of the support effectalong the loading platen due to friction. Young’s moduluses ofthe brick in the different directions are shown in the function ofthe normalized mean compressive strength, determined in Ta-ble 7, in Figure 18. It shows that the linearity in the differenttesting directions exists.
Fig. 18. Normalized mean compressive strength in function of the Young’smodulus from Table 7
Figure 19 presents the behaviour of the brick in direction Cwith a loaded area of ca. 7800 mm2. A force-displacement dia-gram is shown that reflects the compressing softening behaviourof the brick that is hard to be measured.
Fig. 19. Force-displacement diagram for direction C
10 ConclusionsThe novelty of the paper is a comprehensive experimental in-
vestigation of the compressive strength of one type of brick us-ing more than 100 brick specimens. The effect of the type of thesampling, the surface, the height, the width and the length of thespecimen were investigated.
In case of the investigated solid, fired clay brick a clear or-thotropy was found. The reason of the orthotropy is assumedto exist due to the production technology. According to the or-thotropy in the compressive strength and the Young’s modulus,three characteristic directions were defined that corresponds tothe direction of the manufacturing. Every relationship that wasdefined could be considered true only in the case when the ratiobetween the compressive strength in the three directions doesnot depend on the size of the specimen.
After investigating the smallest and the biggest specimen thatcould be reasonably obtained from this brick, correlations werefound for the height, the width, the loaded area of the speci-mens and the compressive strength. It was determined that theheight of the specimen has the biggest effect on the compres-sive strength. The orthotropy (the direction of the loading) hasthe same order of effect on the compressive strength as the ge-ometry of the specimen has. An optimal loading surface wasdetermined that results the maximal compressive strength.
A method was determined that makes possible to estimate thenormalized mean compressive strength of the brick independentfrom the type of the sample (drilled, cut or whole brick). Thesize and shape of the specimen is not restricted, the normalized
Effects influencing the compressive strength of a solid, fired clay brick 1272011 55 2
compressive strength can be evaluated from every type of sam-ple according to the equations that were presented.
A modified calculation method for measuring the compres-sive strength by an N-type Schmidt hammer was suggested forthis type of brick in order to receive directly the normalizedmean compressive strength. Two types of methods were carriedout for measuring the Young’s modulus of the brick. A clearlinearity was found between the Young’s modulus and the com-pressive strength in each direction. Orthotropy was determinedin the Young’s moduluses in the defined three directions, too.
It is proposed to control the applicability of the correspon-dence of the equations for other types of bricks of other manu-facturers. In case of bricks with vertical voids, it is suggested tocontrol the load bearing capacity of the other 2 directions.
References1 MSZ EN 772-1:2000, Methods of test masonry units Part 1: Determination
of the compressive strength, 2000. Hungarian Standard.2 MSZ EN 1996-1-1:2006, Eurocode 6: Design of masonry structures Part 1-
1: General rules for reinforced and unreinforced masonry structures, 2006.Hungarian Standard.
3 Fódi A, Bódi I, Comparison of shear behaviour of masonry walls with
and without reinforcement, Pollack Periodica 5 (2010), no. 13, 71–82, DOI10.1556/Pollack.5.2010.3.7.
4 Fódi A, Bódi I, Experimental Investigation of solid masonry walls rein-
forced in different directions, The Eighth International Masonry Conference(Dresden, November 2010, July 7), Masonry (11) Proceedings of the EighthInternational Masonry Conference, Vol. 1, Alinea Digitaldruck, Dresden,2010, pp. 843–852.
5 McKenzie WMC, Design of structural masonry, Palgrave, New York, 2001.6 Subasic CA, Borchelt JG, Clay and shale brick material properties – a sta-
tistical report, The 6th North American Masonry Conference, Proceedings ofthe 6th North American Masonry Conference, The Masonry Society, Boul-der, CO, 1993, pp. 12–. in: Technical Notes 3A – Brick Masonry MaterialProperties, Technical notes on brick construction, 1992, www.gobrick.com.
7 Pate K, Noble W, Stress-strain relationship in heavy clay products, Mechan-ical properties of non-metallic brittle materials, Butterworth, London, 1958,pp. 210–216. in: Blight GE, Calculated Load bearing brickwork, TechnicalPublications, 2009, www.claybrick.org.za.
8 D’Ayala DF, Numerical modelling of masonry structures reinforced or re-
paired, Computer Methods in Structural Masonry (Pande N G, Middleton J,Kralj B, eds.), Routledge, 1998, pp. 161–168.
9 Völgyi I, Farkas Gy, Nehme S G, Concrete strength tendency in the wall
of cylindrical spun-cast concrete elements, Periodica Polytechnica, Civil En-gineering 54/1 (2010), 23–30, DOI 10.3311/pp.ci.2010-1.03.
10 Szalai K, Windisch A, Újhelyi J, Erdélyi A, Halász I, Roknich Gy,
Strobl A, The quality control of concrete, Szabványkiadó, Budapest, 1982.11 MI 15011-1988, Technical directive, 1988. publisher: Magyar Szabványügyi
Hivatal.12 Dulácska E, Book of structural engineering, Bertelsman kiadó, Budapest,
2001.13 Dulácska E, Józsa Zs, Borosnyói A, Investigation of the compressive
strength of the brick by Schmidt hammer, Eurocode 6 – Masonry Struc-tures (Budapest, 2001), Proceedings of the Eurocode 6 – Masonry Structures(Balázs L Gy, ed.), Építésügyi Minoségellenorzo Innovációs KözhasznAsTársaság, 2001, pp. 129–132.
14 Dulácska E, The reconstruction and diagnostic of load bearing elements
of buildings, Budapest University of Technology and Economics, Budapest,2008. Lecture notes.
Per. Pol. Civil Eng.128 Anita Fódi