Effectiveness of a physical activity program on cardiovascular ...
11
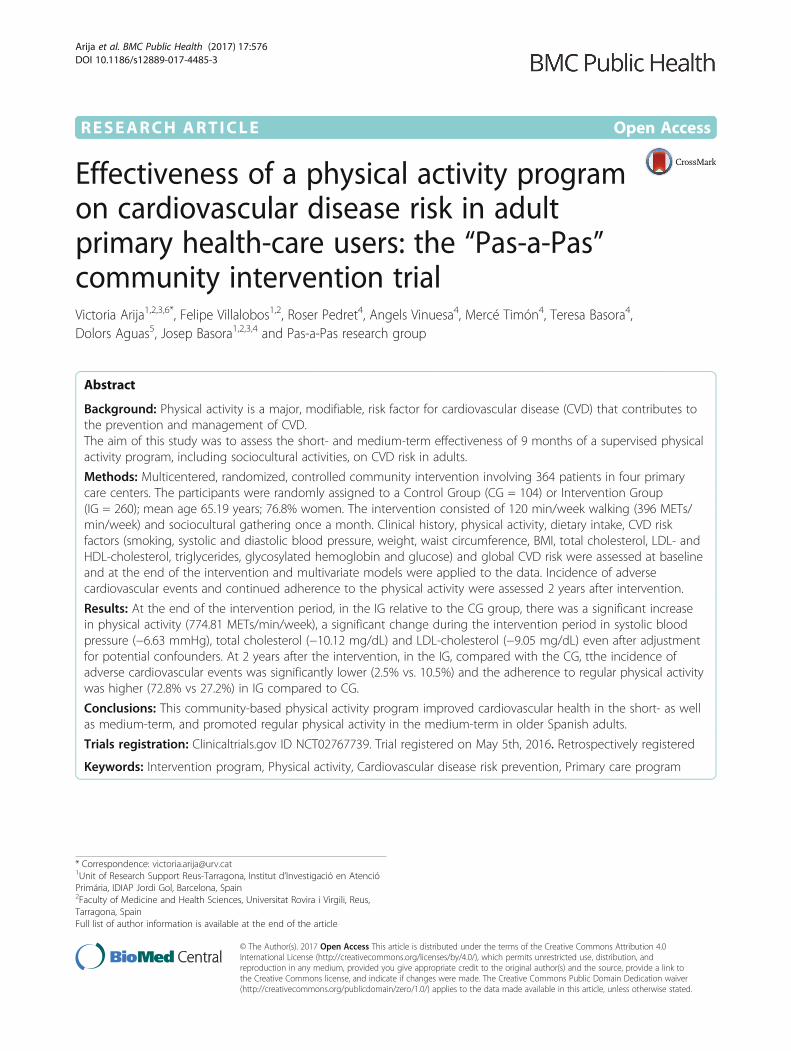
RESEARCH ARTICLE Open Access Effectiveness of a physical activity program on cardiovascular disease risk in adult primary health-care users: the “Pas-a-Pas” community intervention trial Victoria Arija 1,2,3,6* , Felipe Villalobos 1,2 , Roser Pedret 4 , Angels Vinuesa 4 , Mercé Timón 4 , Teresa Basora 4 , Dolors Aguas 5 , Josep Basora 1,2,3,4 and Pas-a-Pas research group Abstract Background: Physical activity is a major, modifiable, risk factor for cardiovascular disease (CVD) that contributes to the prevention and management of CVD. The aim of this study was to assess the short- and medium-term effectiveness of 9 months of a supervised physical activity program, including sociocultural activities, on CVD risk in adults. Methods: Multicentered, randomized, controlled community intervention involving 364 patients in four primary care centers. The participants were randomly assigned to a Control Group (CG = 104) or Intervention Group (IG = 260); mean age 65.19 years; 76.8% women. The intervention consisted of 120 min/week walking (396 METs/ min/week) and sociocultural gathering once a month. Clinical history, physical activity, dietary intake, CVD risk factors (smoking, systolic and diastolic blood pressure, weight, waist circumference, BMI, total cholesterol, LDL- and HDL-cholesterol, triglycerides, glycosylated hemoglobin and glucose) and global CVD risk were assessed at baseline and at the end of the intervention and multivariate models were applied to the data. Incidence of adverse cardiovascular events and continued adherence to the physical activity were assessed 2 years after intervention. Results: At the end of the intervention period, in the IG relative to the CG group, there was a significant increase in physical activity (774.81 METs/min/week), a significant change during the intervention period in systolic blood pressure (-6.63 mmHg), total cholesterol (-10.12 mg/dL) and LDL-cholesterol (-9.05 mg/dL) even after adjustment for potential confounders. At 2 years after the intervention, in the IG, compared with the CG, tthe incidence of adverse cardiovascular events was significantly lower (2.5% vs. 10.5%) and the adherence to regular physical activity was higher (72.8% vs 27.2%) in IG compared to CG. Conclusions: This community-based physical activity program improved cardiovascular health in the short- as well as medium-term, and promoted regular physical activity in the medium-term in older Spanish adults. Trials registration: Clinicaltrials.gov ID NCT02767739. Trial registered on May 5th, 2016. Retrospectively registered Keywords: Intervention program, Physical activity, Cardiovascular disease risk prevention, Primary care program * Correspondence: [email protected] 1 Unit of Research Support Reus-Tarragona, Institut d’Investigació en Atenció Primária, IDIAP Jordi Gol, Barcelona, Spain 2 Faculty of Medicine and Health Sciences, Universitat Rovira i Virgili, Reus, Tarragona, Spain Full list of author information is available at the end of the article © The Author(s). 2017 Open Access This article is distributed under the terms of the Creative Commons Attribution 4.0 International License (http://creativecommons.org/licenses/by/4.0/), which permits unrestricted use, distribution, and reproduction in any medium, provided you give appropriate credit to the original author(s) and the source, provide a link to the Creative Commons license, and indicate if changes were made. The Creative Commons Public Domain Dedication waiver (http://creativecommons.org/publicdomain/zero/1.0/) applies to the data made available in this article, unless otherwise stated. Arija et al. BMC Public Health (2017) 17:576 DOI 10.1186/s12889-017-4485-3
-
Upload
khangminh22 -
Category
Documents
-
view
5 -
download
0
Transcript of Effectiveness of a physical activity program on cardiovascular ...
RESEARCH ARTICLE Open Access
Effectiveness of a physical activity programon cardiovascular disease risk in adultprimary health-care users: the “Pas-a-Pas”community intervention trialVictoria Arija1,2,3,6*, Felipe Villalobos1,2, Roser Pedret4, Angels Vinuesa4, Mercé Timón4, Teresa Basora4,Dolors Aguas5, Josep Basora1,2,3,4 and Pas-a-Pas research group
Abstract
Background: Physical activity is a major, modifiable, risk factor for cardiovascular disease (CVD) that contributes tothe prevention and management of CVD.The aim of this study was to assess the short- and medium-term effectiveness of 9 months of a supervised physicalactivity program, including sociocultural activities, on CVD risk in adults.
Methods: Multicentered, randomized, controlled community intervention involving 364 patients in four primarycare centers. The participants were randomly assigned to a Control Group (CG = 104) or Intervention Group(IG = 260); mean age 65.19 years; 76.8% women. The intervention consisted of 120 min/week walking (396 METs/min/week) and sociocultural gathering once a month. Clinical history, physical activity, dietary intake, CVD riskfactors (smoking, systolic and diastolic blood pressure, weight, waist circumference, BMI, total cholesterol, LDL- andHDL-cholesterol, triglycerides, glycosylated hemoglobin and glucose) and global CVD risk were assessed at baselineand at the end of the intervention and multivariate models were applied to the data. Incidence of adversecardiovascular events and continued adherence to the physical activity were assessed 2 years after intervention.
Results: At the end of the intervention period, in the IG relative to the CG group, there was a significant increasein physical activity (774.81 METs/min/week), a significant change during the intervention period in systolic bloodpressure (−6.63 mmHg), total cholesterol (−10.12 mg/dL) and LDL-cholesterol (−9.05 mg/dL) even after adjustmentfor potential confounders. At 2 years after the intervention, in the IG, compared with the CG, tthe incidence ofadverse cardiovascular events was significantly lower (2.5% vs. 10.5%) and the adherence to regular physical activitywas higher (72.8% vs 27.2%) in IG compared to CG.
Conclusions: This community-based physical activity program improved cardiovascular health in the short- as wellas medium-term, and promoted regular physical activity in the medium-term in older Spanish adults.
Trials registration: Clinicaltrials.gov ID NCT02767739. Trial registered on May 5th, 2016. Retrospectively registered
Keywords: Intervention program, Physical activity, Cardiovascular disease risk prevention, Primary care program
* Correspondence: [email protected] of Research Support Reus-Tarragona, Institut d’Investigació en AtencióPrimária, IDIAP Jordi Gol, Barcelona, Spain2Faculty of Medicine and Health Sciences, Universitat Rovira i Virgili, Reus,Tarragona, SpainFull list of author information is available at the end of the article
© The Author(s). 2017 Open Access This article is distributed under the terms of the Creative Commons Attribution 4.0International License (http://creativecommons.org/licenses/by/4.0/), which permits unrestricted use, distribution, andreproduction in any medium, provided you give appropriate credit to the original author(s) and the source, provide a link tothe Creative Commons license, and indicate if changes were made. The Creative Commons Public Domain Dedication waiver(http://creativecommons.org/publicdomain/zero/1.0/) applies to the data made available in this article, unless otherwise stated.
Arija et al. BMC Public Health (2017) 17:576 DOI 10.1186/s12889-017-4485-3
BackgroundCardiovascular disease (CVD) is the leading cause of mor-bidity and mortality worldwide. For example, in 2012, 17.5million people died from this cause and accounted for31% of mortality. Further, the World Health Organization(WHO) estimates that by 2030, 23.3 million people willdie from CVD [1].Physical activity is a modifiable major risk factor for
CVD [2–6]. The 2007 European Guidelines on Cardio-vascular Disease Prevention in Clinical Practice recom-mended (as do other health-care organizations) at least120 min/week of moderate physical activity [7] and,recently, the European Guidelines have increased therecommended levels of physical activity for adults [8].Despite the health benefits of regular exercise, availabledata suggest that at least 31% of the world’s populationis not meeting the minimum physical activity guide-lines; the global prevalence of physical inactivity is17% and, at 27.8%, is more prevalent in developedcountries [9, 10].Given the importance of physical activity in the con-
trol of CVD risk, the European Society of Cardiology,the European Association for Cardiovascular Preventionand Rehabilitation and the American College of Prevent-ive Medicine have agreed a common policy statement toencourage integrated action by key stakeholders inorder to achieve the broad adoption of a healthy life-style pattern of behavior (including physical activity) ona global scale.Lifestyle interventions on CVD risk have been assessed
in two previous cohort studies (both conducted in devel-oped countries) and have shown an inverse relationshipbetween physical activity and overall CVD risk. In a 7-year follow-up study of 23,747 Norwegian adults with nohistory of CVD, 2 sessions/week of moderate intensityphysical activity reduced CVD risk by 49% [11]. A studyconducted over 8 years in 41,675 Taiwanese adults foundthat those in the intervention group (at least 100 min ofaerobic exercise/week) had a 14% lower CVD risk [12].Several randomized controlled trials (RCT) have pro-
vided evidence of the benefits of physical activity on cer-tain CVD risk factors, including reduction in systolicblood pressure (SBP) [13–15], improvements in lipid pro-file [16, 17], and anthropometric measurements [13, 18].However, other studies found no such benefits [19–22].These contradictory data could result from methodo-
logical differences in study design, target population, ortype of physical activity used in the intervention program(frequency, duration, intensity, under supervision byhealth-care professionals). Of note is that none of thesestudies described differences in responses in relation tothe population studied. For instance, these studies in-cluded individuals with or without CVD, individuals fromprimary care or general population, and individuals with
different levels of existing physical activity. Also, withrespect to duration of intervention, similar benefits wereobserved in interventions lasting from 4 to 12 months[13–18]. Further, greater benefits were observed in indi-viduals performing 120 min/week moderate-intensityphysical activity as those undertaking 60 min/weekvigorous-intensity and supervised by health-care profes-sionals and/or by a physical activity instructor [13–18] ascompared with those who received physical activity advicealone [19, 20, 22, 23]. Of note is that none of these earlierRCTs assessed the medium-term effects of physical activ-ity on CVD risk, and none analyzed the data using multi-variate models adjusted for risk factors related to CVD.Previous descriptive studies showed that inclusion of
socio-cultural activities within a physical activity programwas associated with increased social support networksand, consequently, with improved mental health and over-all well-being which, in turn, promoted cardiovascularhealth quite apart from the physical activity benefit alone[24, 25].In the light of these conflicting data, and based on
current recommendations of physical activity [7, 26, 27] aswell as previous physical activity interventions withproven benefits, the aim of the present study was to assessthe short- and medium-term effectiveness of a 9-monthsupervised physical activity program, and including socio-cultural activities, on CVD risk in adults accessing primaryhealth-care facilities.
MethodsDesignThe study was multicentered, randomized, controlled,community intervention of a program of physical activityand socio-cultural activities intervention of 9 monthsduration The program was applied in adults drawn fromamong those attending 4 primary care centers (PCC) inthe city of Reus (Catalonia; Spain). The incidence of CVDevents was recorded at 2 years after the intervention. TheResearch Ethics Committee of the Institut d’Investigacióen Atenció Primària de Salut (IDIAP), Jordi Gol, approvedthe study protocol. Data were analyzed in accordance withConsolidated Standards of Reporting Trials (CONSORT)guidelines for randomized trials. Clinicaltrials.gov IDNCT02767739.
Participants and randomizationDuring a 6-month period prior to the intervention, allhealth-care professionals of the PCCs invited adult usersof the services to participate in the program. Volunteerswere directed to the nursing health-care professional ofthe PCC for an assessment of the individual’s eligibilitycriteria.Inclusion criteria required the participant to be an
adult accessing the PCC’s health-care facilities. Exclusion
Arija et al. BMC Public Health (2017) 17:576 Page 2 of 11
criteria were: an episode of ischemic heart disease(<6 months previously), or an acute episode of arthritiswhich would limit the ability to walk, or having a lungor heart disease with dyspnea (mild to moderate effortdyspnea) which would limit the individual’s ability toundertake the proposed exercise regimen.Participants who met the eligibility criteria, signed the
informed consent document and were individually ran-domized to the IG or CG in a ratio of 3:1 using a tableof computer generated random numbers.The sample size calculation was based on global CVD
risk (REGICOR) as the main dependent variable, andusing the following criteria: an alpha risk of 0.05 and abeta risk of 0.2 in a bilateral contrast. Assuming a pa-tient loss-to-follow-up of 10%, a standard deviation of4% and a difference of ≥1.5 units, 250 participants inthe IG and 82 in the CG were needed. The estimatedsample size was calculated using the Granmo software(version 7.12; Granmo; IMIM Hospital del Mar,Barcelona, Spain).
InterventionBased on physical activity recommendations [7, 26, 27],the intervention program consisted of supervised walk-ing (396 METs/min/week over 120 min in 2 walkingsessions per week of 60 min each) and socio-culturalactivities once a month. A physical activity specialist wasresponsible for the standardization of procedures and forthe training of the primary care nurses. Walking itinerar-ies and cultural activities were pre-set. Walking itinerarieswere, on average, a five-kilometer circuit in and aroundthe city. Group sizes ranged from 15 to 30 participants.Monthly socio-cultural activities included: visits to mu-seums and libraries, cultural exhibitions, tourist attrac-tions and dance lessons.The program was supervised by the health-care pro-
fessionals who accompanied the participants in all theactivities, and who closely monitored the participants’adherence to the program.Participants who were randomized to CG received
usual care from health-care personnel, and were recom-mended to follow their habitual lifestyle.
MeasurementsOutcomes measured at baselineClinical historyAll participants had the following diagnoses recorded:hypertension, type 2 diabetes, dyslipidemia, overweight,obesity, depression, anxiety and osteoporosis.
Socio-demographic characteristicsAge, sex, social class, and educational level were obtainedfrom clinical data and face-to-face interviews. Class statuswas assessed using an adaptation of the British Registrar
General classification which yields three class categories:high (class I-II), middle (class IIIN-IIIM) and lower (classIV-V) [28].
Outcomes measured at baseline and at the end of theinterventionCardiovascular disease risk assessmentBlood pressure was measured with a manual sphygmo-manometer with the participants resting for at least fiveminutes. Three recordings were taken and the averageof the second and third readings was used in the statis-tical analyses. The CVD risk was estimated using thescale “Registre Gironí del Cor” (REGICOR), based onFramingham criteria standardized for the Spanish popula-tion. This scale includes sex, age, diabetes (yes, no), smok-ing (yes, no), systolic and diastolic blood pressure andserum cholesterol levels [29].
Physical activityLevels were measured using the short version of theInternational Physical Activity Questionnaire (IPAQ-S)validated for the Catalan population [30]. The variablessuch as intensity (light, moderate, or vigorous), fre-quency and duration of physical activity in the previous7 days, were collected using the IPAQ-S. The frequencyand intensity of each activity was used to calculate thetotal of an intensity category in terms of METs/min/week. These values were obtained by multiplying theaverage energy expenditure (3.3 MET for walking, 4.0MET for moderate intensity, and 8.0 MET for vigorousintensity) by min/week for each physical activity. Theresults of each category of activity intensity weresummed to obtain the total physical activity in METs/min/week. Based on total physical activity, participantswere classified into 3 levels of physical activity: low(<600 METs/min/week), moderate (≥600–2999 METs/min/week) and high (≥3000 METs/min/week).
Frequency of food consumptionFood consumption was assessed using a validated foodfrequency questionnaire containing 45 items [31]. Aface-to-face interview was conducted in the PCC settingby a nurse, who recorded times per week and times permonth for each food ration consumed and the rationsconsumed per day were calculated. To calculate g/day ofeach food item, daily portions were multiplied by gramsof each item consumed relative to reference data of foodconsumption evaluated in the same population andestablished by expert nutritionists [32]. Foods weregrouped according to their nutrient composition: dairy(milk, yogurt, dairy desserts, cheese); meat/fish/eggs (red,white, processed meat and cold meat, lean, fatty fish andshellfish); salad cereals (rice, pasta, bread, legumes andpotatoes); sweetened cereals (pastries, biscuits, breakfast
Arija et al. BMC Public Health (2017) 17:576 Page 3 of 11
cereals); fruits/vegetables (salad, tomatoes, vegetables sidedish, aubergines, courgettes, mushrooms; green beans,chards, spinach, fresh fruit and canned fruit); oils; nuts;and beverages (fermented beverages).
Anthropometric measurementsWeight (kg) was measured using a calibrated balance withthe measurements taken to the nearest 0.1 kg. Height(cm) was measured using a calibrated balance with themeasurements taken to the nearest 1 cm. Weight andheight measurements were then used to calculate the bodymass index [BMI as kg/m2]. Waist circumference wasmeasured at the top of the hip bone below the ribs withthe tape measure placed in the middle between thesepoints, and wrapped around the waist.
Biochemical analysisThe biochemical parameters analyzed were triglycerides,total cholesterol, HDL- and LDL-cholesterol, glycatedhemoglobin (HbA1c) and glucose. A study profile foreach individual was generated using all these parametersat the Tarraco laboratory (ISO9001:2000 certified ICSTarragona laboratory). Fasting blood was extracted atthe PCC by the primary-care nurses and transported onice to the central laboratory for analyses in as short atime-lapse as possible.
Changes during interventionChanges during the intervention period with respect tofood consumption, anthropometric measures and CVDrisk factors and the estimated REGICOR score werecalculated as the difference between the end-of-programand the baseline values. In addition, the change in physicalactivity levels in the participants by the end of the inter-vention period (compared with baseline levels) was calcu-lated. The participants were, then, classified into 3categories: lower, similar (unchanged) or higher.
Adverse cardiovascular events and adherence to physicalactivity 2 years after the interventionThe assessment of the incidence of adverse cardiovascu-lar events such as acute myocardial infarction (AMI)and cerebrovascular accident (CVA) 2 years after theintervention, was calculated using the computerizedclinical histories maintained at the PCC where the partici-pants attended, and the databases of the hospitals wherethe adverse events were treated.To assess the adherence to physical activity, the partic-
ipants were contacted by telephone and were asked ifthey had continued the physical activity along the linesof the intervention characteristics.
Statistical analysisAll categorical variables were described as percentageswhile means and standard deviation were reported forcontinuous variables. The χ2 test was used to compare cat-egorical variables in different groups. Unpaired Student’st-test was used to compare continuous variables, while thepaired Student t-test was used to compare values betweendifferent time-points (baseline and at the end of the inter-vention) for continuous variables, while the McNemar testwas used for the categorical variables.Multiple linear regression models were applied to assess
the effect of the intervention (0, 1) as an independent vari-able, with CVD risk factors as dependent variables (SBP,DBP, weight, BMI, waist circumference, total cholesterol,LDL- and HDL-cholesterol, triglycerides, and glucose)and CVD risk evaluated on the REGICOR scale. The fol-lowing covariates were considered: age (years), sex (male,female), social class (dummy variables comparing socialclass were created; low (reference) versus middle andhigh); PCC (dummy variables comparing centers werecreated; PCC1 (reference) versus PCC2, PCC3, PCC4),smoking (no, yes), BMI (kg/m2), diagnoses at baseline:hypertension (no, yes), type 2 diabetes (no, yes), dyslipid-emia (no, yes), depression (no, yes), anxiety (no, yes),osteoporosis (no, yes) and the dependent variable of eachmodel at baseline.Poisson regression was used to assess the relationship
between physical activity and adverse CVD events in par-ticipants 2 years after the intervention. In this assessment,the number of adeverse CVD events was considered thedependent variable while the intervention (0, 1) as the in-dependent variable. This model was adjusted for sex(male/female), diagnosis of systemic arterial hypertension,dyslipidemia, overweight, obesity, anxiety, depression, andchanges during intervention (end vs. baseline) of thevalues of the following variables: systolic arterial pressure,total cholesterol and LDL-cholesterol. The coefficient βand the standard error, obtained in the Poisson regression,were used to calculate the relative risk with the 95% confi-dence interval.The results were analyzed as per protocol (PP). The
intention-to-treat (ITT) analyses were also performed toverify the consistency between the results of both typesof analysis, as follows: an analysis of sensitivity wasperformed in which lost values were imputed using mul-tiple imputation (MI) from linear regression models inwhich 5 different combinations of data were created. Forthe MI we used the following predictive variables: age,gender, social class, diagnosis of chronic illness andchange in the CVD indicators during the course of theintervention.Statistical significance was set at p value <0.05. The
statistical software SPSS for Windows Version 22.0(SPSS Statistics 22.0) was used throughout.
Arija et al. BMC Public Health (2017) 17:576 Page 4 of 11

ResultsThere were 419 participants recruited from 4 PCC andassigned to CG (n = 114) or IG (n = 305). During theintervention period 13% dropped out: 8.8% belonging tothe CG and 14.7% to the IG. Dropout causes were:diagnosis of a pathology considered within the exclusioncriteria (29.1%); change of address (3.6%) and loss ofinterest by the participant (67.3%). By the end of theintervention period, 364 participants had completed theprogram (87%). Two years after the intervention, partici-pants were contacted by telephone to determine the in-cidence of adverse cardiovascular events and adherenceto the physical activity recommendations. In total, 96
participants of CG (92%) and 228 of the IG (91.5%) werecontacted (Fig. 1)There were no statistically significant differences with
respect to age, gender, social class and the presence ofchronic medical conditions (p > 0.05) between theparticipants who dropped-out compared to those whocontinued in the program.There were no significant differences in the socio-
demographic characteristics, social class, and risk factorsbetween groups at baseline (Table 1). Neither were theredifferences in the changes during intervention in food itemconsumption during the trial period between CG and IG,except in the food group of the sweetened cereals (Table 2).
Fig. 1 Flow diagram of the study
Arija et al. BMC Public Health (2017) 17:576 Page 5 of 11

In the intervention group, total physical activity signifi-cantly increased during intervention (774.81 METs/min/week) whereas it decreased in the control group (−357.61METs/min/week) (Table 3). In addition, in the IG levels ofphysical activity significantly increased during the inter-vention, compared to the control group (p = 0.033).Walking every week accounted for 396 METs/min/weekof physical activity energy expenditure. Average attend-ance at walking sessions was 74.3%, which represents amean expenditure of the participant group of 303.6METs/min/week.CVD risk indicators in the trial population are shown in
Table 4. At baseline there were no significant differences
between the control and intervention groups. However,there were significant differences with respect tochange during intervention in systolic blood pressure(−3.59 mmHg), total cholesterol (−10.68 mg/dL) andLDL-cholesterol (−7.18 mg/dL) levels in the IG vs.the CG.Two years after intervention the number of adverse
cardiovascular events was significantly lower in the IG(5 cases: 2 AMI, 3 CVA) compared to the CG (10 cases:8 AMI, 2 CVA); with a relative risk of 0.15 (95% CI0.04–0.51). With respect to adherence to physical activ-ity, 72.8% of subjects in the IG continued performingphysical activity with similar characteristics to that ofthe intervention, compared with 27.2% of the CG(p = 0.010).Table 5 summarizes the effects of the physical activity
intervention on CVD risk factors, and the REGICORscale. There were beneficial effects of the interventionon SBP (−6.63 mmHg) total cholesterol (−10.12 mg/dL),LDL-cholesterol (−9.05 mg/dL) and the REGICOR score(−0.72%).No significant effects of intervention on DBP,
weight, waist circumference, BMI, triglycerides andHDL-cholesterol, and HbA1c dependent variableswere observed.The results are presented as per protocol analysis (PP).
The results of the ITT analysis were similar to the PPresults of the intervention with respect to all the CVDrisk factors measured.
DiscussionThis community-based, randomized, controlled, inter-vention program among adults attending primary careclinics, has demonstrated that implementing a programto promote physical activity over a period of 9 monthssignificantly decreased SBP, total and LDL-cholesterollevels and overall CVD risk. The results were analyzedusing multivariate techniques to adjust for confoundingvariables associated with the putative causes. Theseincluded: socio-demographic, lifestyle, morbidity and
Table 1 Baseline characteristics of the participants in the controland intervention groups
Controlgroup
Interventiongroup
p
(n = 104) (n = 260)
Age (years)a 66.99 (10.28) 64.5 (9.20) 0.400
Women (%) 71.90 78.70 0.116
Social Class
High Class I-II (%) 27.08 23.70 0.222
Middle Class IIIN-IIIM (%) 59.30 54.50
Lower Class IV-V (%) 13.54 21.70
CVD risk factors
Smoking (%) 4.20 7.90 0.123
Hypertension (%) 57.30 54.20 0.343
Type 2 diabetes (%) 18.80 20.60 0.766
Overweight (%) 37.50 39.10 0.807
Obesity (%) 46.90 42.70 0.546
Dyslipidemia (%) 50.00 49.40 1.000
Depression (%) 10.40 16.20 0.234
Anxiety (%) 24.00 19.00 0.301
Without contributing pathology (%) 5.20 6.30 0.458aValues expressed as mean and (standard deviation)
Table 2 Food item consumption at baseline, and changes during intervention
Food Consumptiona Baseline p Changes during intervention (End - Baseline) p
CG (n = 104) IG (n = 260) CG (n = 104) IG (n = 260)
Dairy Products (g/day) 378.50 (185.80) 325.21 (142.85) 0.007 9.76 (171.49) 14.13 (122.04) 0.823
Meat/Fish/ Eggs (g/day) 148.87 (53.60) 147.59 (56,61) 0.857 2.40 (53.98) 6.69 (63.26) 0.569
Salad Cereals (g/day) 124.86 (59.76) 124.87 (51.29) 0.998 3.42 (65.09) −5.23 (52.62) 0.223
Sweetened Cereals (g/day) 28.20 (36.51) 21.47 (26.49) 0.073 −8.60 (25.65) −1.80 (25.43) 0.033
Fruits/ Vegetables (g/day) 328.59 (142.02) 302.98 (143.81) 0.150 −13.34 (150.78) 13.28 (146.53) 0.149
Nuts (g/day) 4.81 (6.92) 4.00 (5.09) 0.256 −0.96 (6.64) 0.21 (5.34) 0.148
Beverage (g/day) 55.32 (82.32) 53.57 (81.97) 0.864 8.27 (82.95) −5.61 (89.12) 0.201aValues expressed as mean and (standard deviation)CG Control group, IG Intervention group
Arija et al. BMC Public Health (2017) 17:576 Page 6 of 11

anthropometric measures. There were no differences inthe dietary intake of participants during the interventionand, as such, the effects on CVD appear specific to thephysical activity intervention i.e. related to the ability ofthe intervention program to decrease SBP and to improvelipid profile. Further, the present study led to an importantreduction of major adverse cardiovascular events assessed2 years after the intervention. Importantly, our resultsdemonstrated that the implementation of an interactivehealth-education strategy improves CVD risk outcomes inour older Spanish adults.Conducting a RCT, and controlling the risk factors
associated with the health outcomes studied, highlightedthe evidence of the impact of a physical activity inter-vention on CVD risk. In our study a large number ofparticipants were randomized to the IG, in a 3:1 ratio,since the favorable effect of the intervention was predict-able (based on published literature) and, as such, would
benefit a greater number of individuals. We also tookinto account the expected high drop-out rate in the IGduring follow-up.General and clinical characteristics of study subjects
are similar to previous interventions with respect to age,socio-economic status, level of education and the preva-lence of chronic diseases and conditions [13–18].At the time of the study design, participants were
instructed to perform 120 min/week of moderate-intensityphysical activity based on global recommendations [7,26, 27] although more recent European guidelinespropose 150 min/week of moderate-intensity physicalactivity [8]. We also took into account the characteris-tics of previous physical activity intervention programsthat showed major benefits on the individuals’ outcomesi.e. health benefits of physical activity intervention arehigher when the intervention is supervised by health-care personnel and/or a physical activity professional
Table 3 Physical activity at baseline, and changes during intervention
Baseline Change during the intervention(End - Baseline)
CG (n = 104) IG (n = 260) p CG (n = 104) IG (n = 260) p
Total physical activity (METs/min/week)a 2468.26 (4628.84) 2363.10 (3122.32) 0.808 −357.61 (4765.03) 774.81 (4004.22) 0.026
Level of physical activity % change
Low (%) 32.30 28.00 0.610 Lower 61.5 45.8 0.033
Moderate (%) 46.90 46.80 Similar 26.0 39.0
High (%) 20.80 25.20 Higher 12.5 15.3
CG Control group, IG Intervention group, METs Metabolic equivalentsaValues expressed as mean and (standard deviation)
Table 4 CVD risk inicators at baseline, and changes during intervention
Baseline Changes during intervention (End - Baseline)
CG (n = 104) IG (n = 260) p CG (n = 104) IG (n = 260) p
SBP (mmHg) 135.32 (16.62) 131.06 (15.94) 0.280 0.90 (18.63) −3.59 (16.45) 0.029
DBP (mmHg) 75.96 (9.86) 76.75 (9.09) 0.478 −1.29 (10.64) −3.03 (9.75) 0.140
Weight (Kg) 75.72 (14.92) 75.37 (14.80) 0.843 0.08 (4.52) −1.23 (8.02) 0.151
BMI (Kg/m2) 29.95 (4.88) 30.01 (5.02) 0.924 −0.03 (1.91) −0.22 (2.38) 0.471
WC (cm) 100.31 (11.74) 100.50 (11.81) 0.895 −1.58 (5.79) −2.96 (8.99) 0.168
Total Cholesterol (mg/dL) 206.83 (32.67) 205.26 (36.58) 0.713 0.09 (32.96) −10.68 (31.81) 0.006
HDL-cholesterol (mg/dL) 56.37 (16.09) 55.51 (14.86) 0.641 −1.18 (10.26) −0.07 (12.37) 0.435
LDL-cholesterol (mg/dL) 122.70 (29.62) 122.33 (34.14) 0.922 1.82 (26.48) −7.18 (29.04) 0.009
TG (mg/dL) 134.63 (83.91) 132.26 (67.75) 0.786 −3.11 (60.33) −3.26 (60.26) 0.983
HbA1c (%) 7.21 (1.61) 7.40 (1.37) 0.599 −0.33 (1.42) −0.08 (1.20) 0.476
Glucose (mg/dL) 99.19 (33.91) 98.66 (28.42) 0.883 −5.16 (21.04) 2.96 (19.45) 0.001
REGICOR 4.63 (3.54) 4.60 (3.97) 0.962 0.37 (2.53) −0.28 (2.55) 0.064
Change from smoking to non-smoking
Smoking (%) 4.20 7.90 0.123 1.00 0.90 0.369
Values are expressed in mean and (standard deviation)CG Control group, IG Intervention group, SBP Systolic blood pressure, DBP Diastolic blood pressure, BMI Body mass index, WCWaist circumference, HDL High-densitylipoprotein, LDL Low-density lipoprotein, TG Triglycerides, HbA1c Glycated hemoglobin; Cardiovascular disease risk REGICOR scale
Arija et al. BMC Public Health (2017) 17:576 Page 7 of 11

[13, 16–18]. In addition, as has been demonstrated, theinclusion of socio-cultural activities in the interventionprogram increases a person’s well-being and improvesmental health; both of which are related to decreasedCVD risk [24, 33].The strengths of our study include the assessment of
physical activity using a validated questionnaire [30],the evaluation of CVD risk factors and food consump-tion at two time-points (at baseline and at the end ofthe 9 month active intervention). Since diet is one ofthe main modifiable CVD risk factors, we assessed foodconsumption pre- and post-intervention using a food-frequency questionnaire previously validated in ourpopulation [31].In addition, we assessed a wide range of CVD risk
factors, as recommended by the European Society of
Cardiology. These included smoking, blood pressure,weight, waist circumference, BMI, total cholesterol,LDL- and HDL- cholesterol, triglycerides, glycatedhemoglobin and glucose. Also, a novelty of the presentstudy was that a global CVD risk and incidence of ad-verse cardiovascular events 2 years after the interventionwere assessed in order to have a broader overview of theeffect of physical activity on all CVD risk factors. Toestimate the CVD risk we used the REGICOR scale. Thisscale is the most recommended for primary preventionof coronary heart disease in Spain because othermethods such as the SCORE or Framingham scalesoverestimate the individual’s CVD risk [34].Our results showed that physical activity energy
expenditure increased by 774.81METs/min/week (24%)in the IG between baseline and the end of the
Table 5 Effects of the physical activity intervention program on CVD risk factors, and the REGICOR scale
β SE P
Model 1 SBP (mmHg)
Intervention (control, intervention) −6.63 1.67 0.001 R2c × 100 = 31.9%
Age (years) 0.23 0.10 0.024 F17,331 = 9.1
Hypertension (no, yes) 3.91 0.12 0.015 p < 0.001
Dyslipidemia (no,yes) 3.06 1.51 0.045
Smoking (no, yes) 7.17 2.87 0.013
BMI (kg/m2) 0.42 0.15 0.001
Baseline SBP (mmHg) 0.30 0.46 0.006
Model 2 Cholesterol (mg/dL)
Intervention (control, intervention) −10.12 3.48 0.004 R2c × 100 = 42.2%
Social Class (low; middle) −10.65 4.53 0.020 F17,328 = 14.0
Social Class (low, high) −14.03 4.87 0.004 p < 0.001
Type 2 diabetes (no, yes) 12.89 3.85 0.001
Anxiety (no, yes) 8.21 4.15 0.049
Baseline cholesterol (mg/dL) 0.55 0.47 0.001
Model 3 LDL-cholesterol (mg/dL)
Intervention (control, intervention) −9.05 3.07 0.003 R2c × 100 = 41.9%
Type 2 diabetes (no, yes) 9.11 3.43 0.008 F17, 329 = 36.8
Baseline LDL-cholesterol −0.59 0.04 0.001 p < 0.001
Model 4 Glucose (mg/dL)
Intervention (control, intervention) 8.21 2.29 0.001 R2c × 100 = 65.8%
Type 2 diabetes (no, yes) 19.90 3.32 0.001 F17, 326 = 36.8
Baseline Glucose (mg/dL) 0.57 0.04 0.001 p < 0.001
Model 5 REGICOR (%)
Intervention (control, intervention) −0.72 0.32 0.028 R2c X 100 = 60.3%
Sex (men, women) −1.19 0.35 0.001 F17,260 = 23.2
Baseline REGICOR -0.57 0.04 0.001 p < 0.001
Multiple linear regression models adjusted for intervention group (0 = control group; 1 = Intervention group); age (years), sex (0 = men; 1 = women); Social Class(dummy variables, 0 = reference); 4 Primary Care Centers (dummy variables, 0 = reference), smoking (0 = no; 1 = yes); BMI (kg/m2), hypertension (0 = no; 1 = yes);type 2 diabetes (0 = no; 1 = yes); dyslipidemia (0 = no, 1 = yes), depression (0 = no; 1 = yes); anxiety (0 = no; 1 = yes); osteoporosis (0 = no; 1 = yes); and thedependent variable of each model at baseline. Only significant variables are shown
Arija et al. BMC Public Health (2017) 17:576 Page 8 of 11
intervention. This was more than double that achieved inthe intervention program (303.6 METs/min/week). Theenergy expenditure of 774.81 METs/min/week is equiva-lent to a physical activity time of 284.86 min/week. Thisphysical activity time is even higher than the revised levelproposed by the new European Guidelines on Cardiovas-cular Disease Prevention in Clinical Practice (150 min/week of moderate physical activity) [8]. Conversely, totalphysical activity decreased by 357.61 METs/min/week inthe CG by the end of the intervention period, relativeto baseline. These data clearly indicate the effectivenessof the intervention program in promoting physicalactivity. Other RCTs employing a 12-month supervisedphysical activity program over 90–120 min/week showedan increase of 15 to 27% in total physical activity [13,15–18], and is concordant with our study (24%) find-ings. In contrast those programs based on physical activityadvice alone, observed a minor increase in total physicalactivity [19, 20, 22, 23]. In addition, our program not onlyencouraged activity in excess of the physical activity of theintervention program but also this beneficial habit wasseen to be consolidated in a large percentage of partici-pants 2 years after the intervention.With respect to improvement in CVD risk factors, we
observed a decrease in SBP (−6.63 mmHg), total choles-terol (−10.12 mg/dL), and LDL-cholesterol (−9.05 mg/dL).Overall CVD risk was reduced (−0.72%), based on multi-variate models adjusted for variables associated with theputative causes of CVD. For example, a reduction in SBPof 3 mmHg decreases peripheral vascular resistance [35],since physical activity increases the concentrations ofnitric oxide resulting in arterial vasodilation leading todecreases in peripheral vascular resistance and in-creased blood perfusion [4]. This effect is enhancedwhen there is a decrease in LDL-cholesterol levels andan increase in HDL-cholesterol levels, the latter (HDL-cholesterol) modulating the synthesis of nitric oxide inthe endothelium [36].The findings of this study are concordant with the
results of another RCT. As in our study, Halber, et al.found a benefit of physical activity on CVD risk factorsin Australian users of primary care facilities. Theyobserved a decrease of 21 mg/dL in total cholesterol and13.99 mg/dL in LDL-cholesterol levels. However, noeffect was observed on other variables assessed: SBP,DBP, weight, triglycerides and HDL-cholesterol [16].Although the reduction of LDL-cholesterol levels in ourintervention was a mean of 8.76 mg/dL, evidence fromprevious studies indicate that a reduction of only2 mmol/L (7.69 mg/dL) in LDL-cholesterol levels waseffective in reducing the formation of atheroscleroticplaques [36].Other similar RCTs had obtained different effects on
the CVD risk factors studied. Kim et al. observed, in
sedentary Japanese, a decrease of 31.2 mg/dL in trigly-ceride levels, a reduction of 1.47 cm in waist circumfer-ence, and an increase of 12.17 mg/dL in HDL-cholesterollevels. However, they did not find any significant effect onSBP, DBP and glucose [17]. Anderson et al., in a study ofPakistani immigrants in Norway, observed a reduction of1.9 cm in waist circumference; but no significant changesduring intervention in SBP, DBP, triglycerides, total chol-esterol and LDL- or HDL- cholesterol [18].Earlier RCT studies examining the impact of shorter
physical activity programs than the current recom-mended guidelines, found little or no beneficial effectson CVD factors. Studies in sedentary English andAfrican-American participants enrolled in a supervisedphysical activity program including less aerobic activ-ities (45–90 min/week) than ours, observed a higherdecrease in the individual’s SBP (5–12 mmHg) thanthat observed in our study. However, no significantbenefits on other CVD risk variables were observed[14, 15]. It is of note that other RCTs found no benefi-cial effects of a physical activity program on CVD riskfactors, probably because the intervention was basedon providing advice alone (educational materials andfollow-up medical visits) [19, 20, 22, 23].Despite the beneficial impact on health outcomes
observed, our intervention also led to an increase ofglucose levels in the IG (2.96 mg/dL). This could beexplained, in part, by the duration and type of aerobicexercise in our intervention. The guidelines for betterglycemic control proposed by the American DiabeticsAssociation (ADA) recommends the performance of150 min/week of moderate-vigorous physical activity[37]. In addition, the ADA suggests (as do some stud-ies) performing combined aerobic and resistance exer-cises because of better effects on insulin sensitivityand in glycemic reduction, compared to performingonly one type of exercise [38].With regard to overall CVD risk, few RCTs have ob-
served decreased CVD risk following a physical activityintervention program. Tiessen, et al., studied Dutch pa-tients accessing primary care facilities. The interventionwas a 12-month program consisting on 20 min physicalactivity advice sessions per month. [24]. They observed adecrease of 1.8% in CVD risk, which was higher thanthat observed in our study (−0.72%), However, Garcia-Ortiz, et al., found no effect on similar Spanish partici-pants following a physical activity program with similarcharacteristics to the Dutch study [20].Our intervention has mid-term beneficial effects on
adverse cardiovascular events. We observed a lowerpercentage of these events in the IG compared to theCG (2.5% vs. 10.4%) 2 years after the intervention. Otherobservational studies have demonstrated an inverserelationship between physical activity and the risk of
Arija et al. BMC Public Health (2017) 17:576 Page 9 of 11

adverse cardiovascular events. In a cohort study of6213 sedentary American adults with follow-up over13 years, >50% reduction in mortality risk was observedin those individuals with a higher level of physical ac-tivity [39]. In the Women’s Health Study of 10.9 yearsfollow-up, the risk of CVD decreased in relation tohigher levels of physical activity, together with a reduc-tion in adverse cardiovascular events [40].Despite the outcomes observed in previous physical
activity intervention programs being very variable (due,in part, to the characteristics of the program or thepopulation studied), most of the studies found at leastsome beneficial effects on CVD risk factors and, as such,provides support for intervention programs within thecommunity setting. Hence, more studies are needed toconfirm the beneficial effects on cardiovascular healthbased on reliable information and outcomes.
ConclusionThe physical activity program supervised by health-carepersonnel, and including socio-cultural activities, aimed atadults drawn from primary care facilities improved cardio-vascular disease risk by the end of the intervention periodof 9 months. The beneficial changes observed duringintervention were in SPB, total cholesterol and LDL-cholesterol, and overall CVD risk score. These outcomeswere independent of the participant’s food intake duringthe intervention program and, as well, other factors re-lated to CVD such as socio-demographic factors, lifestyleand the presence of disease. Two years after the interven-tion, the intervention group developed a lower incidenceof adverse cardiovascular events and a higher adherenceand continuation of physical activity, compared to the CG.The broad benefit in terms of cardiovascular benefitobtained from the intervention program was, in part,possibly due to the characteristics of the program i.e.being supervised by health-care personnel and the inclu-sion of group socio-cultural activities. The promotion andsupport of physical activity should be a global priority inprimary care because of the health benefits accruing toadults participating in such programs.
AbbreviationsADA: American Diabetics Association; BMI: Body mass index; CG: Controlgroup; CVD: Cardiovascular diseases; DBP: Diastolic blood pressure;HbA1c: Hemoglobin A1c; HDL-cholesterol: High density lipoproteincholesterol; IG: Intervention group; IPAQ-S: International physical activityquestionnaire, short version; LDL-cholesterol: Low density lipoproteincholesterol; METs: Metabolic equivalents; NO: Nitric oxide; PCC: Primary carecenter; RCT: Randomized controlled trial; SBP: Systolic blood pressure;TG: Triglycerides; WC: Waist circumference; WHO: World health organization.
AcknowledgmentsThe authors thank the Departament de Salut de la Generalitat de Catalunya,Societat Catalana de Medicina de Família i Comunitària (CAMFIC) i Associaciód’Infermeria Familiar i Comunitària (AIFICC) for the IV Premi de Recerca enProcessos d’Innovació dels Serveix d’Atenció Primària i Salut Comunitària
2011. Pas-a-Pas research group: Eva Domínguez, Dolores Jovani, GabrielPascual, Lorenzo Peralta and Alicia Reche.
FundingIV Premi de “Recerca en Processos d’Innovació dels Serveix d’Atenció Primària iSalut Comunitària 2011” provided by the Departament de Salut de la Generalitatde Catalunya, Societat Catalana de Medicina de Família i Comunitària (CAMFIC) iAssociació d’Infermeria Familiar i Comunitària (AIFICC).
Availability of data and materialsThe datasets used and analysed during the current study are available fromthe corresponding author on reasonable request.
Authors’ contributionsVA was responsible for the protocol; design and methodology of the study;analyses and interpretation of the data; drafting and overall responsibility for themanuscript. FV participated in the analysis and interpretation of the data, and indrafting the manuscript and its revision. RP, AV, TB, MT and DA conducted thefieldwork. AV coordinated the fieldwork. JB and RP implemented, coordinatedand managed the study within and between Centers. All authors reviewed thedrafts and the final version of the manuscript. All authors read and approved thefinal manuscript.
Competing interestsThe authors declare that they have no competing interests.
Consent for publicationNot applicable.
Ethics approval and consent to participateThe Research Ethics Committee of the Institut d’Investigació en AtencióPrimària de Salut (IDIAP), Jordi Gol, approved the study protocol. Only theparticipants who signed the informed consent document were included inthe study.
Publisher’s NoteSpringer Nature remains neutral with regard to jurisdictional claims inpublished maps and institutional affiliations.
Author details1Unit of Research Support Reus-Tarragona, Institut d’Investigació en AtencióPrimária, IDIAP Jordi Gol, Barcelona, Spain. 2Faculty of Medicine and HealthSciences, Universitat Rovira i Virgili, Reus, Tarragona, Spain. 3Institutd’Investigació Sanitària Pere Virgili, Reus, Tarragona, Spain. 4Primary HealthCare Area, Reus, Tarragona, Institut Català de la Salut, Generalitat deCatalunya, Barcelona, Spain. 5Department of Activities and Projects, ReusEsport i Lleure SA, Reus, Tarragona, Spain. 6Unit of Research SupportReus-Tarragona, Institut d’Investigació en Atencio Primária, (IDIAP) Jordi Gol(Barcelona), Camí de Riudoms 57, 43202 Reus, Spain.
Received: 13 October 2016 Accepted: 1 June 2017
References1. Organizacion Mundial de la Salud. Informe sobre la situación mundial de las
enfermedades no transmisibles. WHO. 2014;1–18.2. Claas SA, Arnett DK. The role of healthy lifestyle in the primordial
prevention of cardiovascular disease. Curr Cardiol Rep. 2016;18:56.3. Truthmann J, Busch MA, Scheidt-Nave C, Mensink GBM, Gößwald A, Endres M,
et al. Modifiable cardiovascular risk factors in adults aged 40-79 years inGermany with and without prior coronary heart disease or stroke.BMC Public Health. 2015;15:701.
4. Schuler G, Adams V, Goto Y. Role of exercise in the prevention ofcardiovascular disease: results, mechanisms, and new perspectives. Eur HeartJ. 2013;34:1790–9.
5. Dalleck LC, Van Guilder GP, Quinn EM, Bredle DL. Primary prevention ofmetabolic syndrome in the community using an evidence-based exerciseprogram. Prev. Med. (Baltim). 2013;57:392–5.
6. Stensvold D, Nauman J, Nilsen TIL, Wisløff U, Slørdahl SA, Vatten L. Even lowlevel of physical activity is associated with reduced mortality among people
Arija et al. BMC Public Health (2017) 17:576 Page 10 of 11

with metabolic syndrome, a population based study (the HUNT 2 study,Norway). BMC Med. BioMed Central. 2011;9:109.
7. Guía Europea de Prevención Cardiovascular en la Práctica Clínica.Adaptación española del CEIPC 2008 * Comité Español Interdisciplinariopara la Prevención Cardiovascular. Rev. Clin. Española. 2009;26:157–80.
8. Piepoli MF, Hoes AW, Agewall S, Albus C, Brotons C, Catapano AL, et al.2016 European guidelines on cardiovascular disease prevention in clinicalpractice. Eur Heart J. 2016;37:2315–81.
9. Dumith SC, Hallal PC, Reis RS, Kohl HW. Worldwide prevalence of physicalinactivity and its association with human development index in 76countries. Prev Med (Baltim). 2011;53:24–8.
10. Kohl HW, Craig CL, Lambert EV, Inoue S, Alkandari JR, Leetongin G, et al.The pandemic of physical inactivity: global action for public health. Lancet.2012;380:294–305.
11. Hamer M, Stamatakis E. Low-dose physical activity attenuates cardiovasculardisease mortality in men and women with clustered metabolic risk factors.Circ Cardiovasc Qual Outcomes. 2012;5:494–9.
12. Wen CP, Wai JPM, Tsai MK, Yang YC, Cheng TYD, Lee M-C, et al. Minimumamount of physical activity for reduced mortality and extended lifeexpectancy: a prospective cohort study. Lancet. 2011;378:1244–53.
13. Salinas CJ, Bello SM, Flores CA, Carbullanca LL, Torres GM. Actividad físicaintegral con adultos y adultos mayores en Chile: Resultados de un programapiloto. Rev. Chil. Nutr. Sociedad Chilena de Nutrición, Bromatología yToxicología. 2005;32:215–24.
14. Murphy MH, Murtagh EM, Boreham CA, Hare LG, Nevill AM. The effect of aworksite based walking programme on cardiovascular risk in previouslysedentary civil servants. BMC Public Health. 2006;6:136.
15. Duru OK, Sarkisian CA, Leng M, Mangione CM. Sisters in motion: a randomizedcontrolled trial of a faith-based physical activity intervention. J Am Geriatr Soc.2010;58:1863–9.
16. Halbert J, Silagy C, Finucane P. Physical activity and cardiovascular riskfactors: effect of advice from an exercise specialist in Australian generalpractice. Med J Aust. 2000;173:85–7.
17. Kim J, Tanabe K, Yoshizawa Y, Yokoyama N, Suga Y, Kuno S. Lifestyle-basedphysical activity intervention for one year improves metabolic syndrome inoverweight male employees. Tohoku J Exp Med. 2013;229:11–7.
18. Andersen E, Høstmark AT, Anderssen SA. Effect of a physical activityintervention on the metabolic syndrome in Pakistani immigrant men: arandomized controlled trial. J Immigr Minor Health. 2012;14:738–46.
19. Elley CR, Kerse N, Arroll B, Robinson E. Effectiveness of counselling patientson physical activity in general practice: cluster randomised controlled trial.BMJ. 2003;326:793.
20. García-Ortiz L, Grandes G, Sánchez-Pérez Á, Montoya I, Iglesias-Valiente JA.Recio-Rodríguez JI, et al. Efecto en el riesgo cardiovascular de unaintervención para la promoción del ejercicio físico en sujetos sedentariospor el médico de familia. Rev. Española Cardiol. 2010;63:1244–1252.
21. Liira H, Engberg E, Leppävuori J, From S, Kautiainen H, Liira J, et al. Exerciseintervention and health checks for middle-aged men with elevatedcardiovascular risk: a randomized controlled trial. Scand. J. Prim. Health Care.2014;32:156–62.
22. Lawton BA, Rose SB, Elley CR, Dowell AC, Fenton A, Moyes SA. Exercise onprescription for women aged 40-74 recruited through primary care: twoyear randomised controlled trial. BMJ. 2008;337:a2509.
23. Van Sluijs EMF, Twisk JWR, Calfas KJ, van Poppel MNM, Chin A, Paw MJ,et al. Effect of a tailored physical activity intervention delivered in generalpractice settings: results of a randomized controlled trial. Am J PublicHealth. 2005;95:1825–31.
24. Tiessen AH, Smit AJ, Broer J, Groenier KH, van der Meer K. Randomizedcontrolled trial on cardiovascular risk management by practice nursessupported by self-monitoring in primary care. BMC Fam Pract. 2012;13:90.
25. Kouvonen A, De Vogli R, Stafford M, Shipley MJ, Marmot MG, Cox T, et al.Social support and the likelihood of maintaining and improving levels ofphysical activity: the Whitehall II study. Eur J Pub Health. 2012;22:514–8.
26. Haskell WL, Lee I-M, Pate RR, Powell KE, Blair SN, Franklin BA, et al. Physicalactivity and public health: updated recommendation for adults from theAmerican College of Sports Medicine and the American Heart Association.Med Sci Sports Exerc. 2008;39:1423–34.
27. World Health Organization. Global recommendations on physical activity forhealth. Geneva World Health Organization. 2010;1–60.
28. Otero M, Domínguez-Gil A. Propuesta de un indicador de la “clase social”basado en la ocupación. Farm Hosp. 2000;24:258–66.
29. Marrugat J, Solanas P, D’Agostino R, Sullivan L, Ordovas J, Cordón F, et al.Estimación del riesgo coronario en España mediante la ecuación deFramingham calibrada. Rev Española Cardiol. 2003;56:253–61.
30. Ipaq. Guidelines for Data Processing and Analysis of the International PhysicalActivity Questionnaire ( IPAQ ) – Short and Long Forms. Ipaq. 2005;1–15.
31. Rodríguez IT, Ballart JF, Pastor GC, Jordà EB, Val VA. Validation of a shortquestionnaire on frequency of dietary intake: reproducibility and validity.Nutr Hosp. 2008;23:242–52.
32. Arija V, Salas Salvado J, Fernández-Ballart J, Cuco GM-H. Consumoalimentario, hábitos, y estado nutricional de la población de Reus (VIII).Evolución de la ingesta energética y nutricional desde 1983 a 1993. Med.Clin. (Barc). 1996;20:45–50.
33. Rippe JM, Price JM, Hess SA, Kline G, DeMers KA, Damitz S, et al. Improvedpsychological well-being, quality of life, and health practices in moderatelyoverweight women participating in a 12-week structured weight lossprogram. Obes Res. 1998;6:208–18.
34. Ramos R, Solanas P, Cordón F, Rohlfs I, Elosua R, Sala J, et al. Comparación dela función de Framingham original y la calibrada del REGICOR en la prediccióndel riesgo coronario poblacional. Med. Clin. (Barc). 2003;121:521–6.
35. Hegde SM, Solomon SD. Influence of physical activity on hypertension andcardiac structure and function. Curr Hypertens Rep. 2015;17:588.
36. Besler C, Heinrich K, Rohrer L, Doerries C, Riwanto M, Shih DM, et al.Mechanisms underlying adverse effects of HDL on eNOS-activating pathwaysin patients with coronary artery disease. J Clin Invest. 2011;121:2692–708.
37. American Diabetes Association. Standards of Medical Care in Diabetes-2016.Diabetes Care. 2016;39 Suppl 1:S1–112.
38. Segerström AB, Glans F, Eriksson K-F, Holmbäck AM, Groop L, Thorsson O,et al. Impact of exercise intensity and duration on insulin sensitivity inwomen with T2D. Eur J Intern Med. 2010;21:404–8.
39. Myers J, Kaykha A, George S, Abella J, Zaheer N, Lear S, et al. Fitness versusphysical activity patterns in predicting mortality in men. Am J Med.2004;117:912–8.
40. Mora S, Cook N, Buring JE, Ridker PM, Lee I-M. Physical activity andreduced risk of cardiovascular events: potential mediating mechanisms.Circulation. 2007;116:2110–8.
• We accept pre-submission inquiries
• Our selector tool helps you to find the most relevant journal
• We provide round the clock customer support
• Convenient online submission
• Thorough peer review
• Inclusion in PubMed and all major indexing services
• Maximum visibility for your research
Submit your manuscript atwww.biomedcentral.com/submit
Submit your next manuscript to BioMed Central and we will help you at every step:
Arija et al. BMC Public Health (2017) 17:576 Page 11 of 11