Device Simulation of High-Performance SiGe Heterojunction ...
Upload
independentCategory
view
1download
0
Effect of temperature on the morphological and photovoltaic stability
of bulk heterojunction polymer:fullerene solar cells
Sabine Berthoa,*, Griet Janssenb, Thomas J. Cleija, Bert Coningsa, Wouter Moonsa,
Abay Gadisac, Jan D'Haena, Etienne Goovaertsb, Laurence Lutsenc, Jean Mancaa,c, Dirk
Vanderzandea,c
aHasselt University, Institute for Materials Research, Wetenschapspark 1, Diepenbeek,
B-3590, Belgium
bUniversity of Antwerp, Physics Department, Universiteitsplein 1, B-2610 Antwerp,
Belgium
cIMECvzw, IMOMEC, Diepenbeek, B-3590, Belgium
e-mail: [email protected]
Abstract: In high performance polymer:fullerene bulk heterojunction solar cells the
nanoscale morphology of interpenetrating acceptor:donor materials is optimised through
appropriate preparation conditions such as annealing and choice of solvent, but this
initial state-of-the-art morphology will not remain stable during long term operation.
We report the effects of prolonged storage at elevated temperatures on both the
morphology and the photovoltaic performance for the model systems MDMO-
PPV:PCBM and P3HT:PCBM as compared to ‘High Tg PPV’:PCBM based solar cells,
where the ‘High Tg PPV’ is characterised by its high glass transition temperature
(138°C). In-situ monitoring of the photo-current-voltage characteristics at elevated
temperatures, in combination with a systematic Transmission Electron Microscopy
(TEM) study and complementary optical spectroscopy, reveals distinct degradation
1
kinetics and morphological changes that indicate the occurrence of different underlying
physico-chemical mechanisms.
Keywords: Organic photovoltaics, thermal stability, glass transition temperature,
morphology
1. Introduction
In the historical development towards state-of-the-art polymer:fullerene bulk
heterojunction solar cells the nanoscale morphology of the photoactive film always
played a crucial role [1-4]. In bulk heterojunction solar cells the morphology of the
donor-acceptor interpenetrating networks is fine tuned in order to optimize the
combination of both exciton dissociation and charge transport. Moreover, the short
exciton diffusion length in these material systems (5-10 nm) demands proximity of the
donor and acceptor regions on nanoscale. The nanoscale morphology of the
interpenetrating acceptor:donor materials is optimised through appropriate preparation
conditions such as annealing conditions and choice of solvents. For the model system
MDMO-PPV:PCBM, improvement of the film morphology has been obtained by
switching to the use of chlorobenzene as a solvent, resulting in 2.5 to 2.9% efficient
organic solar cells [3,4]. Nowadays efficiencies of 5% are achieved through the use of
high mobility donor polymers (e.g. P3HT) and through a continued nanoscale control of
the morphology of the donor-acceptor interpenetrating networks – which in some cases
has been realized by the introduction of an additional annealing step [5,6]. However, in
this paper it will be demonstrated that this initial optimized morphology will not remain
stable during long term operation or during storage at elevated temperatures and
2

therefore becomes one of the multiple stability issues encountered in organic solar cells.
Organic solar cells degrade because of their low resistance towards oxygen, light, high
temperatures etc. [7-16]. We will focus here on the instability of organic solar cells that
results from morphological changes in the active layer due to a thermal treatment [17-
19]. In particular, the relation between the morphological instability and the glass
transition temperature of the donor materials is studied in more detail. We investigated
the effect of temperature on the morphology as well as on the photovoltaic performance
of three polymer:fullerene material systems: the model systems MDMO-PPV:PCBM
and P3HT:PCBM as compared to ‘High Tg PPV’:PCBM, based on a conjugated
polymer with a high glass transition temperature. The photovoltaic output (i.e. the short
circuit current, open circuit voltage, fill factor and efficiency) was studied in-situ at
various annealing temperatures. Complementary with this in-situ electrical monitoring
of the degradation kinetics, the evolution of the active layer morphology was studied
with Transmission Electron Microscopy (TEM) and optical and photoluminescence
absorption spectroscopy results are discussed.
2. Experimental
Bulk heterojunction solar cells with three different conjugated polymers
(MDMO-PPV(Poly[2-methoxy-5-(3’,7’-dimethyloctyloxy)-1,4-phenylene vinylene])
with Tg ≈ 50°C, P3HT(poly(3-hexylthiophene)) with Tg ≈ 6°C [20-23] and ‘High Tg
PPV’ with Tg ≈ 138°C, all supplied by Merck) as electron donor materials and PCBM
([6-6]-phenyl C61 butyric acid methyl ester (Nano-C)) as acceptor material were made
according to the following preparation guidelines. The devices had a ITO/PEDOT-
PSS/polymer:PCBM/Al structure. Each device had an active area of 25.0 mm2. Indium
3

tin oxide (ITO, 100nm) coated glass plates were successively cleaned in a soap solution,
demineralised water and acetone, each for 10 minutes in an ultrasonic bath. This was
followed by cleaning in boiling isopropanol for 10 minutes. A 60nm thick Poly(3,4-
ethylenedioxythiophene-polystyrenesulfonate (PEDOT-PSS (Bayer)) layer was
spincoated on the clean glass/ITO substrates. The substrates were dried for 20 minutes
on a hotplate at 120°C. The active layer, with thickness of 120 nm, consisting of a blend
of polymer and PCBM in chlorobenzene was spincoated on top of the PEDOT-PSS
layer. The polymer:PCBM ratio for MDMO-PPV, ‘High Tg PPV’ and P3HT were
respectively 1:4, 1:4 and 1:1 (these ratios were chosen because they resulted in the best
solar cell performance). The concentrations of the solutions were respectively 0.5wt%,
0.3wt% and 1.0wt% (weight percentage of polymer in chlorobenzene solvent) for
MDMO-PPV, ‘High Tg PPV’ and P3HT. To obtain complete dissolution of MDMO-
PPV:PCBM and P3HT:PCBM, these solutions were stirred overnight at 50°C; the ‘High
Tg PPV’:PCBM solution was stirred for 3 days at 50°C. The solar cells were completed
by evaporating 80 nm of Al on top of the active layer.
The IV-characteristics were measured with an Oriel solar simulator equipped
with a Xenon Short Arc lamp with a power of 150W. The influence of thermal
annealing on the photovoltaic performance was measured in a set-up that measures IV-
characterisations at regular time intervals (illumination with a White 5500K LED
(Lamina)) while the samples were kept under continuous annealing. In between the
measurements, the samples were kept in the dark.
Values for the glass transition temperature (Tg) of the ‘High Tg PPV’ were
determined by UV-Vis spectroscopy. To this end, an Ocean Optics USB2000
spectrometer with fiber optics arrangement was used. Samples were prepared by
4

spincoating the polymer from a 1.0wt% solution in chlorobenzene onto a quartz
substrate. Subsequently the substrate was placed in a Linkam TMS94/THMS600
controlled heating/freezing stage, which was positioned in the optical path of the UV-
Vis spectrophotometer. The sample was then heated from room temperature to 200°C
(heating rate: 5°C/min) and subsequently cooled (cooling rate: 5°C/min) to room
temperature. Each measurement point was obtained by averaging 500 individual UV-
Vis absorption spectra. The second heating run was used for the determination of the Tg.
The active layer morphology was studied with a Transmission Electron
Microscope (Philips CM12-STEM). A Varian Cary absorption spectrometer and a
Varian Cary Eclipse fluorometer (excitation wavelength of 485 nm) were used for the
optical absorption and photoluminescence (PL) measurements respectively.
3. Results and discussion
3.1 ‘High Tg PPV’
As described earlier, ‘High Tg PPV’ is characterised by its rather high glass
transition temperature as compared to MDMO-PPV and P3HT. This means that its
blend with PCBM allows a wide window for investigation of thermal degradation under
elevated temperature conditions. However, while P3HT and MDMO-PPV are well
studied materials, ‘High Tg PPV’, is not well known and therefore requires an
appropriate introduction. Figure 1 shows the chemical structure of the conjugated
polymer that we call ‘High Tg PPV’ for simplicity. The material is a copolymer
designed by Merck. The synthetic route is described elsewhere by Becker et al. [24].
The glass transition temperatures of MDMO-PPV and P3HT (respectively 50°C
and 12°C) were determined through Differential Scanning Calorimetry (DSC)
5
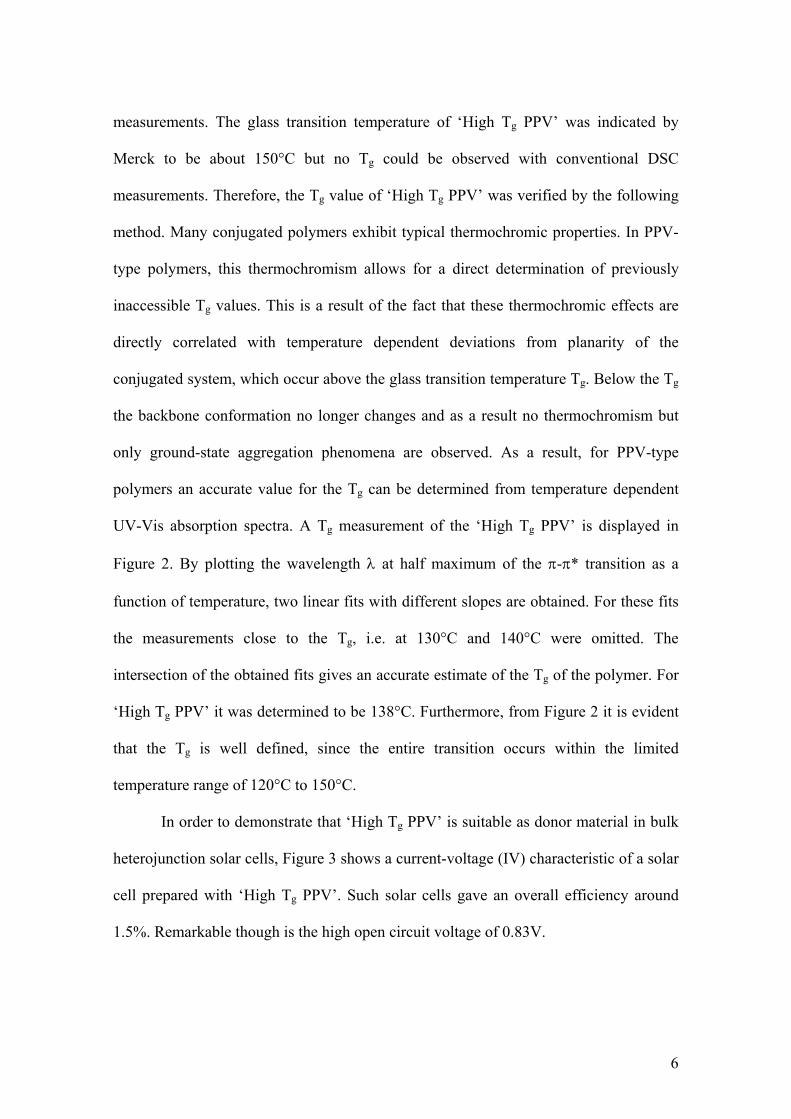
measurements. The glass transition temperature of ‘High Tg PPV’ was indicated by
Merck to be about 150°C but no Tg could be observed with conventional DSC
measurements. Therefore, the Tg value of ‘High Tg PPV’ was verified by the following
method. Many conjugated polymers exhibit typical thermochromic properties. In PPV-
type polymers, this thermochromism allows for a direct determination of previously
inaccessible Tg values. This is a result of the fact that these thermochromic effects are
directly correlated with temperature dependent deviations from planarity of the
conjugated system, which occur above the glass transition temperature Tg. Below the Tg
the backbone conformation no longer changes and as a result no thermochromism but
only ground-state aggregation phenomena are observed. As a result, for PPV-type
polymers an accurate value for the Tg can be determined from temperature dependent
UV-Vis absorption spectra. A Tg measurement of the ‘High Tg PPV’ is displayed in
Figure 2. By plotting the wavelength λ at half maximum of the π-π* transition as a
function of temperature, two linear fits with different slopes are obtained. For these fits
the measurements close to the Tg, i.e. at 130°C and 140°C were omitted. The
intersection of the obtained fits gives an accurate estimate of the Tg of the polymer. For
‘High Tg PPV’ it was determined to be 138°C. Furthermore, from Figure 2 it is evident
that the Tg is well defined, since the entire transition occurs within the limited
temperature range of 120°C to 150°C.
In order to demonstrate that ‘High Tg PPV’ is suitable as donor material in bulk
heterojunction solar cells, Figure 3 shows a current-voltage (IV) characteristic of a solar
cell prepared with ‘High Tg PPV’. Such solar cells gave an overall efficiency around
1.5%. Remarkable though is the high open circuit voltage of 0.83V.
6

3.2 In-situ monitoring of photovoltaic degradation kinetics
In the following, several experiments are performed at elevated temperatures to
speed up the degradation processes inside the solar cells presented above. Figure 4
shows the relative decay of the photovoltaic parameters of a solar cell with an MDMO-
PPV:PCBM 1:4 blend as active layer for an annealing temperature of 110°C. As can be
inferred from the figure, the open circuit voltage (Voc) is barely sensitive to the thermal
treatment performed over a long period of time. This is consistent with the fact that Voc
mainly depends on material properties, namely the ionization potential of the donor
polymer and electron affinity of the acceptor fullerene molecule. Only a relatively small
decrease in Voc (less than 10%) is observed. A larger decrease is observed in the short
circuit current (Isc) and the fill factor (FF). The efficiency of the solar cell, proportional
to Isc, Voc and FF, shows the largest decrease.
Figure 5 shows the decay of the short circuit current for solar cells based on the
three materials (MDMO-PPV, ‘High Tg PPV’ and P3HT) for several annealing
temperatures. At room temperature, the short circuit current of the PPV-derivatives
stays rather constant for several hours. Once the samples are annealed, a clear difference
can be observed in the decay characteristics of the three materials. Solar cells based on
MDMO-PPV show a monotonous decay. For P3HT based solar cells, Isc increases for
relatively short annealing times. After a certain time, which depends on the annealing
temperature, Isc starts to decrease (as can be observed for T = 110°C and 150°C). On the
contrary, solar cells based on ‘High Tg PPV’ remain rather stable, with no large impact
of the annealing temperature up to 150°C.
3.3 Morphology vs thermal annealing
7

Previous studies have already shown a strong correlation between the
morphology of the active layer of solar cells and their performance [3,25]. Here we will
demonstrate that the behavior of the short circuit current of the solar cells depicted in
Figure 5 can also be linked to morphology changes taking place in the active layer.
Figure 6 shows Bright Field TEM-images of the evolution of the active layers of
MDMO-PPV:PCBM (1:4) and ‘High Tg PPV’:PCBM (1:4) during annealing at 110°C.
In earlier work [26], it was already presented that the active layer morphology of ‘High
Tg PPV’:PCBM is much more stable than MDMO-PVV:PCBM. The high glass
transition temperature of ‘High Tg PPV’ results in a firm polymer:PCBM matrix where
the demixing of the two components is hampered. This difference in morphological
stability coincides with the observed decay of the short circuit current in Figure 5. The
slower decay of Isc for the ‘High Tg PPV’:PCBM based solar cells can be attributed to a
more stable active layer morphology.
The evolution of Isc for P3HT:PCBM 1:1 solar cells shown in Figure 5 can also
be linked to the active layer morphology. Bright Field TEM images show that after 4
hours of annealing at 110°C, PCBM starts to cluster (Figure 7a). For this material
however more information can be gathered from the SAED patterns of the
P3HT:PCBM matrix in between the clusters. Figure 7b shows the residual intensities of
these patterns for annealing at 110°C for several hours. The original diffraction patterns
suffered from a large background that resembled inelastic scattering. To improve the
signal-to-noise ratio, integration across the complete diffraction ring was done, from
which a calculated background due to inelastic scattering was subtracted (under the
assumption that the blend in between the clusters is quasi-amorphous[27]). The residual
intensities of the SAED pattern of the non-annealed active layer shows distinct peaks at
8

d-values of 2Å, 3.1Å and 4.6Å corresponding to nanocrystalline PCBM [28]. In
addition, for annealing times between 0.5h and 8h, some evolution in the intensity can
be seen at 3.8Å. The peak appearing here can be attributed to the superposition of the
(002) and (020) reflections from the crystal planes of semi-crystalline P3HT [23]. After
16 hours of annealing, the P3HT peak is very pronounced in the SAED pattern. At the
same time, the peaks corresponding to nanocrystalline PCBM are reducing. At this
point, P3HT has formed fibre-like crystalline structures that can be seen clearly in a
Bright Field TEM image (Figure 7c). On the other hand, PCBM is vanishing from the
P3HT:PCBM matrix and gathering in the PCBM-clusters.
It is clear now that in P3HT:PCBM active layers, two processes take place [29].
One of them, namely the local crystallization of P3HT into fibre-like structures, leads to
better charge transport, resulting in a higher Isc. The other process, as in blends with
MDMO-PPV, is again the clustering of PCBM, which at later times results in a decrease
of Isc mainly due to a lower interfacial area between P3HT and PCBM.
3.4 Thermal stability reflected in absorption and emission
The better thermal stability of ‘High Tg PPV’ as compared to MDMO-PPV and
P3HT is also confirmed by optical spectroscopy. Figure 8 shows the absorption spectra
of MDMO-PPV:PCBM (1:4), ‘High Tg PPV’:PCBM (1:4) and P3HT:PCBM (1:1)
films. An annealing treatment of 16 hours at 110°C results in a quite remarkable change
of the absorption spectrum of the MDMO-PPV:PCBM blend. The disappearance of the
PCBM-absorption in the spectrum of this blend reflects the growth of PCBM
crystallites as observed by TEM in the previous paragraph.
9

Indeed, since the optical spectrometer works in a transmission mode, the dense
PCBM crystals give rise to tremendous light scattering. As a result, the total transparent
film area is reduced, explaining the appearance of an overall background in the
spectrum. Only the polymer regions – essentially PCBM free – contribute to the
spectrum. The absorption of the ‘High Tg PPV’:PCBM film is stable during long
thermal treatments, which directly reflects the higher thermal stability of its
morphology.
The absorption spectra for the P3HT:PCBM blend reflect the dual crystallization
behavior. For the as-produced P3HT:PCBM blend the PCBM-absorption is lower than
for the PPV-derivatives because a lower amount of PCBM is used (a polymer:PCBM
ratio of 1:1 instead of 1:4). However, also for this blend, the PCBM-absorption is
reduced upon annealing, indicating the clustering of PCBM. For this blend, also a
redshift for P3HT is observed, which indicates the ordering of P3HT into the fiber-like
crystalline structures that were visible in de Bright Field TEM images[30].
An essential step in the PV effect, the electron transfer from polymer to
fullerene, can be monitored by the degree of PL quenching, which is close to complete
in the unannealed blend films (see Fig. 9, as produced films). In the pure MDMO-PPV
film, a drastic change in shape and peak intensity is observed in the first few minutes of
the treatment at 110°C after which the spectrum remains unaltered for hours. This initial
change is not related to degradation of the polymer, but should rather be ascribed to
local rearrangements of the polymer chains. (While not discernable in the figure, the
same fast change in shape is observed upon heating in the blend of MDMO-PPV with
PCBM). No such initial effect is found in the ‘High Tg PPV’ film, and only a minor
change is observed in both shape and intensity even after 16h of annealing at 110°C.
10

A thermal treatment of 16h increases the emission intensity of each of the
blends, pointing to decreasing charge transfer efficiency. This is much more pronounced
in the blend with MDMO-PPV compared to ‘High Tg PPV’, which correlates well with
the higher stability of the morphology in the latter. The decrease in charge transfer
efficiency is attributed to the clustering of the PCBM, reducing the interfacial area
between the two components of the blend. The TEM investigation has clearly
demonstrated the importance of segregation and clustering in MDMO-PPV:PCBM
blends, which is hardly observed for ‘High Tg PPV’:PCBM blends.
4. Conclusion
For the three materials (MDMO-PPV, P3HT and ‘High Tg PPV’) a clear
correlation between the morphological evolution of the active layer of solar cells and
the degradation of their characteristics is demonstrated. The active layers based on
MDMO-PPV show a rapid formation of PCBM-clusters upon annealing. The smaller
interfacial area between electron acceptor and electron donor results in a lower
photocurrent output. P3HT shows a dual crystallization behavior: on the one hand,
P3HT crystallizes, which leads to improved charge conduction and a higher
photocurrent output; on the other hand, PCBM groups into clusters, again reducing the
interfacial area between electron acceptor and donor regions, which results in a decrease
in photocurrent. Comparing the three materials, morphology changes are strongly
suppressed in the ‘High Tg PPV’ active layers which leads to the demonstrated high
thermal stability of the device characteristics. Due to the higher glass transition
temperature of ‘High Tg PPV’, its matrix is firmer. This strongly restricts the possible
11

migration and segregation of the PCBM molecules leading to a more stable active layer
and consequently to a more stable photovoltaic behavior.
The thermal stability of the MDMO-PPV and ‘High Tg PPV’ polymer films is
also reflected in the stability of the UV-VIS absorption spectra. The charge transfer,
monitored by the degree of PL quenching, is much less affected by the thermal
treatment in the blends with ‘High Tg PPV’ than with MDMO-PPV, which is directly
related to their very different morphological evolution.
Acknowledgements
The research was carried out in the framework of the IWT-project 030220
“Nanosolar”, the FWO-project G.0252.04 and the interregional project OLED+. The
work, as part of the project “SOHYDs” within the European Science Foundation
EUROCORES Programme was also supported from funds by the FWO (G.0685.06) and
the EC Sixth Framework Programme, under contract N. ERAS-CT-2003-980409.
Sabine Bertho is research assistant of the Fund for Scientific Research, Flanders
(Belgium) (F.W.O.). We thank Dr. H. Becker of Merck OLED Materials GmbH for the
supply of the ‘High Tg PPV’.
References
[1] G. Yu, J. Gao, J.C. Hummelen, F. Wudl, A.J. Heeger, Science 270 (1995) 1789.
[2] L.S. Roman, M.R. Andersson, T. Yohanms, Adv. Mater. 9 (1997) 1164.
[3] S.E. Shaheen, C.J. Brabec, N.S. Sariciftci, F. Padinger, T. Fromherz, J.C.
Hummelen, Appl. Phys. Lett. 78 (2001) 841.
12

[4] T. Munters, T. Martens, L. Goris, V. Vrindts, J. Manca, L. Lutsen, W. De Ceuninck,
D. Vanderzande, L. De Schepper, J. Gelan, N.S. Sariciftci, C.J. Brabec, Thin Solid
Films 403-404 (2002) 247.
[5] W. Ma, C. Yang, X. Gong, K. Lee, A.J. Heeger, Adv. Funct. Mater. 15 (2005) 1617.
[6] F. Padinger, T. Fromherz, P. Denk, C.J. Brabec, J. Zettner, T. Hierl, N.S. Sariciftci,
Synth. Met. 121 (2001) 1605.
[7] H. Neugebauer, C.J. Brabec, J.C. Hummelen, R.A.J. Janssen, N.S. Sariciftci, Synth.
Met. 102 (1999) 1002.
[8] J.M. Kroon, M.M. Wienk, W.J.H. Verhees, J.C. Hummelen, Thin Solid Films 403-
404 (2002) 223.
[9] F.C. Krebs, J.E. Carlé, N. Cruys-Bagger, M. Andersen, M.R. Lilliedal, M.A.
Hammond, S. Hvidt, Sol. Energy Mater. Sol. Cells 86 (2005) 499.
[10] S. Schuller, P. Schilinsky, J. Hauch, C.J. Brabec, Appl. Phys. A. 79 (2004) 37.
[11] H. Neugebauer, C. Brabec, J.C. Hummelen, N.S. Sariciftci, Sol. Energy Mater. Sol.
Cells 61 (2000) 35.
[12] N. Camaioni, G. Ridolfi, G. Casalbore-Miceli, G. Possamai, L. Garlaschelli, M.
Maggini, Sol. Energy Mater. Sol. Cells 76 (2003) 107.
[13] H. Hoppe, N.S. Sariciftci, J. Mater.Res. 19 (2004) 1924.
[14] Z. Zhu, S. Hadjikyriacou, D. Waller, R. Gaudiana, J. Macromol. Sci., Part A: Pure
Appl. Chem. 41 (2004) 1467.
[15] F.C. Krebs, H. Spanggaard, Chem. Mater. 17 (2005) 5235.
[16] F.C. Krebs, K. Norrman, Prog. Photovolt: Res. Appl. 15 (2007) 697
[17] X. Yang, J.K.J. van Duren, M.R. Rispens, J.C. Hummelen, R.A.J. Janssen, M.A.J.
Michels, J. Loos, Adv. Mater. 16 (2004) 802.
13

[18] X. Yang, J.K.J. van Duren, R.A.J. Janssen, M.A.J. Michels, J. Loos,
Macromolecules 37 (2004) 2151.
[19] X. Yang, J. Loos, S.C. Veenstra, W.J.H. Verhees, M. Wienk, J.M. Kroon, M.A.J.
Michels, R.A.J. Janssen, Nano Lett. 5 (2005) 579
[20] A. Swinnen, J. Zhao, G. Van Assche, D. Vanderzande, M. D'Olieslaeger, J. V.
Manca, and B. Van Mele, Proc. SPIE 6656 (2007) 665619 (2007)
[21] Y. Zhao, G. Yuan, P. Roche, M. Leclerc, Polymer 36 (1995) 2211
[22] X. Hu, L. Xu, Polymer 41 (2000) 9147
[23] S. Hugger, R. Thomann, T. Heinzel, T. Thurn-Albrecht, Colloid. Polym. Sci. 282
(2004) 932
[24] H. Becker, H. Spreitzer, W. Kreuder, E. Kluge, H. Schenk, I. Parker, Y. Cao, Adv.
Mater. 42 (2000) 42.
[25] T. Martens, J. D’Haen, T. Munters, Z. Beelen, L. Goris, J. Manca, M.
D’Olieslaeger, D. Vanderzande, L. De Schepper, R. Andriessen, Synth. Met. 138
(2003) 243.
[26] S. Bertho, I. Haeldermans, A. Swinnen, W. Moons, T. Martens, L. Lutsen, D.
Vanderzande, J. Manca, A. Senes, A. Bonfiglio, Sol. Energy Mater. Sol. Cells 91
(2007) 385.
[27] L. Reimer, Transmission Electron Microscopy, Springer-Verlag, 1989.
[28] M.T. Rispens, A. Meetsma, R. Rittberger, C.J. Brabec, N.S. Sariciftci, J.C.
Hummelen, Chem. Commun. 17 (2003) 2116.
[29] A. Swinnen, I. Haeldermans, P. Vanlaeke, J. D'Haen, J. Poortmans, M.
D'Olieslaeger, J. Manca, Eur. Phys. J. Appl. Phys.36 (3) (2006) 251-256.
14

[30] P. Vanlaeke, A. Swinnen, I. Haeldermans, G. Vanhoyland, T. Aernouts, D.
Cheyns, C. Deibel, J. D’Haen, P. Heremans, J. Poortmans, J.V. Manca, Sol. Energy
Mater. Sol. Cells 90 (2006) 2150.
15

Figure 1. ‘High Tg PPV’: a copolymer designed by Merck with a high glass transition
temperature [24].
y = -0.108x + 532.445R2 = 0.999
y = -0.197x + 544.750R2 = 0.999
505
510
515
520
525
530
20 40 60 80 100 120 140 160 180 200T (°C)
λ at
HM
(nm
)
Figure 2. Graph of the wavelength λ at half maximum of the π-π* transition as a
function of temperature, two linear fits with different slopes are obtained. The
intersection of the obtained fits gives a Tg for ‘High Tg PPV’ of 138°C.
16

-6
-5
-4
-3
-2
-1
00.0 0.2 0.4 0.6 0.8 1.0
Cur
rent
den
sity
(mA
/cm
2 )
Voltage (V)
FF = 40%
Voc = 0.83V
jsc = 4.61mA/cm²
η = 1.5%
Figure 3. The current-voltage characteristics obtained from a ‘High Tg PPV’:PCBM
solar cell under AM 1.5 illumination.
0 5 10 15 200.3
0.4
0.5
0.6
0.7
0.8
0.9
1.0
η
FF
Isc
Rel
ativ
e de
cay
of P
V-p
aram
eter
Annealing time (h)
Voc
Figure 4. Relative decay of the short circuit current (Isc), open circuit voltage (Voc), fill
factor (FF) and efficiency (η) of an MDMO-PPV:PCBM 1:4 solar cell at 110°C.
17

0 5 10 15 20 250.70
0.75
0.80
0.85
0.90
0.95
1.00
1.05
1.10
Rel
ativ
e de
cay
in I SC
150°C110°C
90°C
Annealing time (h)
MDMO-PPV:PCBM (1:4)
RT
0 5 10 15 20 25
0.6
0.7
0.8
0.9
1.0
1.1
Rel
ativ
e de
cay
in I SC RT
Annealing time (h)
90°C 110°C 150°C
High Tg PPV:PCBM (1:4)
0 5 10 15 20 25
0.6
0.7
0.8
0.9
1.0
1.1
1.2
150°C
110°C
90°C
Rel
ativ
e de
cay
in I SC
Annealing time (h)
P3HT:PCBM (1:1)
Figure 5. Relative decay of the short circuit current at several annealing temperatures
for solar cells based on MDMO-PPV:PCBM (1:4), ‘High Tg PPV’:PCBM (1:4) and
P3HT:PCBM (1:1).
18

Figure 6. Morphology changes in the active layer of MDMO-PPV:PCBM 1:4 (top) and
‘High Tg PPV’:PCBM 1:4 (bottom) as a result of annealing at 110°C. The solar cells
were annealed at 110°C for 0h, 1h, 2h, 4h and 16h yielding formation of large PCBM-
clusters for the MDMO-PPV based active layers while maintaining a more stable
morphology for the ‘High Tg PPV’ based active layers (scale bar: 2μm).
0
100
200
300
400
Figure 7. Evolution of a P3HT:PCBM (1:1) active layer during an annealing treatment
at 110°C, (a) after 4 hours some PCBM-clusters appear, (b) residual intensities of the
SAED-patterns of the bulk, (c) P3HT-fibres are clearly visible after 16h.
d-value (nm)
0.10.20.30.40.5
Res
idua
l int
ensi
ties
(a.u
.)
not annealed2h at 110°C 4h at 110°C 16h at 110°C
a b
c
19

300 400 500 600 700 8000.0
0.1
0.2
0.3
0.4
0.5
0.6
0.7
0.8
16 hours @ 110oC
as-produced
MDMO-PPV:PCBM 1:4
Abs
orba
nce
Wavelength (nm)
300 400 500 600 700 8000.0
0.1
0.2
0.3
0.4
0.5
0.6
0.7
0.8
16 hours @ 110oCas-produced
'High Tg PPV':PCBM 1:4
Abs
orba
nce
Wavelength (nm)
300 400 500 600 700 8000.0
0.2
0.4
0.6
0.8 P3HT:PCBM 1:1
Abs
orba
nce
Wavelength (nm)
as produced 16 hours @ 110oC
Figure 8. UV-VIS absorption spectra of MDMO-PPV:PCBM (1:4), ‘High Tg
PPV’:PCBM (1:4) and P3HT:PCBM (1:1) films. Both the spectra of the as-produced
films and after a heat treatment of 16 hours at 110°C are shown.
20

600 700 800
MDMO-PPV MDMO-PPV:PCBM 1:4
PL
Inte
nsity
(a.u
.)
Wavelength (nm)600 700 800
'High Tg PPV' 'High Tg PPV':PCBM 1:4
Wavelength (nm)
Figure 9. PL spectra from pure and blended MDMO-PPV and ‘High Tg PPV’ (1:4
ratio). The arrows indicate the effect of thermal heating during 16 hours at 110°C. Note
that the major effect in the pure MDMO-PPV film occurs within 3 minutes.
21
Copyright © 2022 FDOKUMEN