Effect of surface roughness on the strength of cleavage joints
10
International Journal of Adhesion & Adhesives 22 (2002) 235–244 Effect of surface roughness on the strength of cleavage joints M. Shahid 1 , S.A. Hashim* Department of Mechanical Engineering, University of Glasgow, James Watt Building, Glasgow G12 8QQ, UK Accepted 27 September 2001 Abstract In this paper experimental and numerical results on the effect of surface roughness on the cleavage strength of standard steel/steel cleavage specimens have been presented. Cleavage joints with different surface roughnesses were mechanically tested and examined. In numerical modelling, the effect was idealised by small butt joints with macro-roughness to determine the maximum normal tensile stresses at the interface between adhesive and adherend. Good agreements were found between the numerical and experimental results. It was also found that average roughness (R a ) appears to have a linear relationship with average cleavage strength. Average cleavage strength is also found to be a function of linear profile length (R lo ). r 2002 Elsevier Science Ltd. All rights reserved. Keywords: A. Epoxy; B. Surface roughness; B. Steel; Cleavage; Adhesive; Linear profile length 1. Introduction Roughness of adherend surfaces has frequently been used as a design parameter for adhesive joints. A number of researchers have examined its effect on the strength and durability of adhesive joints using various adherends and adhesives [1–7]. There is, however, no published quantitative data, which relates surface roughness parameters to the strength of cleavage joints. Some form of substrate pre-treatment is almost always necessary to achieve a satisfactory level of bond strength. Almost all treatment methods do bring some degree of change in surface roughness but grit-blasting is usually considered as one of the most effective methods to control the desired level of surface roughness and joint strength. Grit-blasting does not only remove weak boundary layers but can also alter the chemical characteristics of the adherends [7]. The authors’ earlier work on steel cleavage specimens showed the effective- ness of grit-blasting over diamond polishing in achieving improved cleavage strength [8]. The relationship between roughness and adhesion is not very simple. Optimum surface profile varies from one adhesive to another, and depends upon the type of stress applied [9]. Of possible positive effects of surface roughness [9–11], increase in surface area results in increasing intermolecular bonds and keying for mechan- ical adhesion. This in turn can divert the failure path away from the interface into the bulk of the adhesive. However, the actual microscopic distribution of stress at the rough interface is complex. This study examines the influence of surface rough- ness of a steel adherend on cleavage strength. An attempt has been made to relate the surface roughness parameters R a and R lo to cleavage strength. Appendix A illustrates the two parameters as defined by ISO 4287 1984. To produce varying degrees of surface roughness, steel specimens were diamond polished and grit-blasted with four sizes of alumna grit. Pre-treated surfaces were examined with Talysurf Form Series 2 surface profiler to measure surface roughness parameters like R a ; R lo and root mean square slope, R dq : Surface roughness was also modelled numerically, using finite element analysis to compare the level of stress at the flat and rough surface. 2. Experimental programme The materials used in this study were mild steel to British Standard BS4360 grade 43A and a structural epoxy adhesive, Araldite 420A/B (Redux 420A/B). *Corresponding author. Tel.: +44-141-330-4319; fax: +44-141-330- 4343. E-mail address: [email protected] (S.A. Hashim). 1 Presently at the Department of Engineering, University of Cam- bridge. 0143-7496/02/$ - see front matter r 2002 Elsevier Science Ltd. All rights reserved. PII:S0143-7496(01)00059-8
-
Upload
independent -
Category
Documents
-
view
4 -
download
0
Transcript of Effect of surface roughness on the strength of cleavage joints

International Journal of Adhesion & Adhesives 22 (2002) 235–244
Effect of surface roughness on the strength of cleavage joints
M. Shahid1, S.A. Hashim*
Department of Mechanical Engineering, University of Glasgow, James Watt Building, Glasgow G12 8QQ, UK
Accepted 27 September 2001
Abstract
In this paper experimental and numerical results on the effect of surface roughness on the cleavage strength of standard steel/steel
cleavage specimens have been presented. Cleavage joints with different surface roughnesses were mechanically tested and examined.
In numerical modelling, the effect was idealised by small butt joints with macro-roughness to determine the maximum normal tensile
stresses at the interface between adhesive and adherend. Good agreements were found between the numerical and experimental
results.
It was also found that average roughness (Ra) appears to have a linear relationship with average cleavage strength. Average
cleavage strength is also found to be a function of linear profile length (Rlo). r 2002 Elsevier Science Ltd. All rights reserved.
Keywords: A. Epoxy; B. Surface roughness; B. Steel; Cleavage; Adhesive; Linear profile length
1. Introduction
Roughness of adherend surfaces has frequently beenused as a design parameter for adhesive joints. Anumber of researchers have examined its effect on thestrength and durability of adhesive joints using variousadherends and adhesives [1–7]. There is, however, nopublished quantitative data, which relates surfaceroughness parameters to the strength of cleavage joints.
Some form of substrate pre-treatment is almostalways necessary to achieve a satisfactory level of bondstrength. Almost all treatment methods do bring somedegree of change in surface roughness but grit-blasting isusually considered as one of the most effective methodsto control the desired level of surface roughness andjoint strength. Grit-blasting does not only remove weakboundary layers but can also alter the chemicalcharacteristics of the adherends [7]. The authors’ earlierwork on steel cleavage specimens showed the effective-ness of grit-blasting over diamond polishing in achievingimproved cleavage strength [8].
The relationship between roughness and adhesion isnot very simple. Optimum surface profile varies fromone adhesive to another, and depends upon the type of
stress applied [9]. Of possible positive effects of surfaceroughness [9–11], increase in surface area results inincreasing intermolecular bonds and keying for mechan-ical adhesion. This in turn can divert the failure pathaway from the interface into the bulk of the adhesive.However, the actual microscopic distribution of stress atthe rough interface is complex.
This study examines the influence of surface rough-ness of a steel adherend on cleavage strength. Anattempt has been made to relate the surface roughnessparameters Ra and Rlo to cleavage strength. Appendix Aillustrates the two parameters as defined by ISO 42871984.
To produce varying degrees of surface roughness,steel specimens were diamond polished and grit-blastedwith four sizes of alumna grit. Pre-treated surfaces wereexamined with Talysurf Form Series 2 surface profiler tomeasure surface roughness parameters like Ra; Rlo androot mean square slope, Rdq:
Surface roughness was also modelled numerically,using finite element analysis to compare the level ofstress at the flat and rough surface.
2. Experimental programme
The materials used in this study were mild steel toBritish Standard BS4360 grade 43A and a structuralepoxy adhesive, Araldite 420A/B (Redux 420A/B).
*Corresponding author. Tel.: +44-141-330-4319; fax: +44-141-330-
4343.
E-mail address: [email protected] (S.A. Hashim).1 Presently at the Department of Engineering, University of Cam-
bridge.
0143-7496/02/$ - see front matter r 2002 Elsevier Science Ltd. All rights reserved.
PII: S 0 1 4 3 - 7 4 9 6 ( 0 1 ) 0 0 0 5 9 - 8
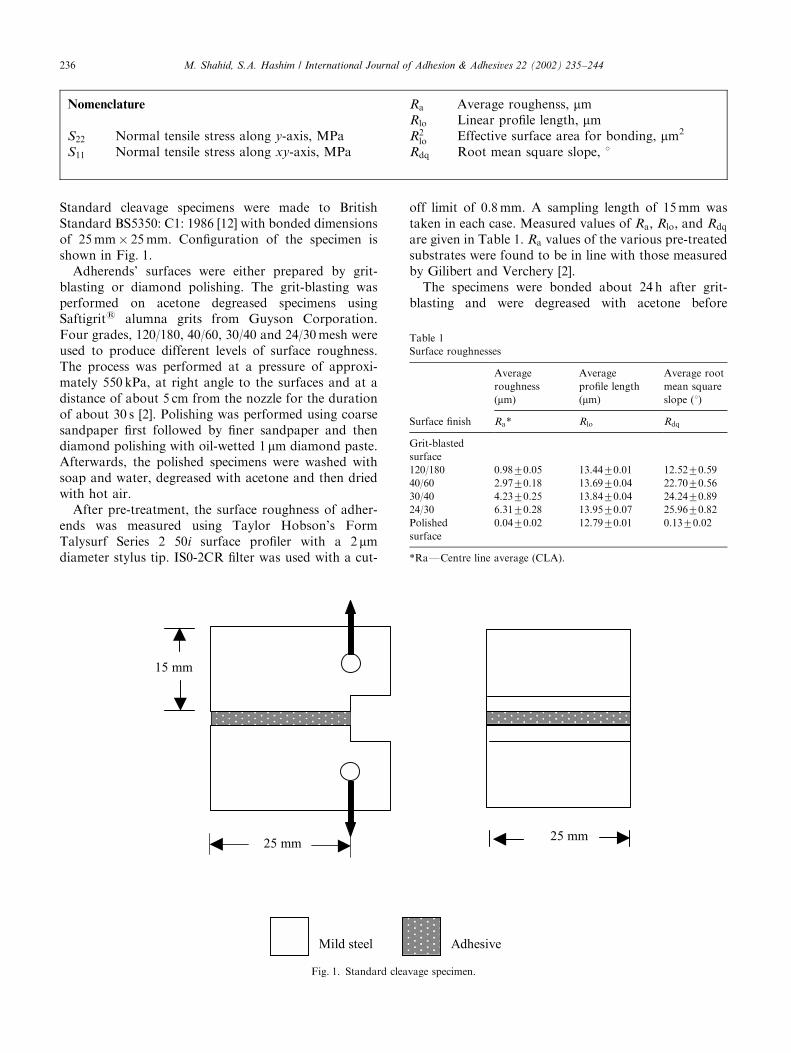
Standard cleavage specimens were made to BritishStandard BS5350: C1: 1986 [12] with bonded dimensionsof 25 mm� 25 mm. Configuration of the specimen isshown in Fig. 1.
Adherends’ surfaces were either prepared by grit-blasting or diamond polishing. The grit-blasting wasperformed on acetone degreased specimens usingSaftigrits alumna grits from Guyson Corporation.Four grades, 120/180, 40/60, 30/40 and 24/30 mesh wereused to produce different levels of surface roughness.The process was performed at a pressure of approxi-mately 550 kPa, at right angle to the surfaces and at adistance of about 5 cm from the nozzle for the durationof about 30 s [2]. Polishing was performed using coarsesandpaper first followed by finer sandpaper and thendiamond polishing with oil-wetted 1 mm diamond paste.Afterwards, the polished specimens were washed withsoap and water, degreased with acetone and then driedwith hot air.
After pre-treatment, the surface roughness of adher-ends was measured using Taylor Hobson’s FormTalysurf Series 2 50i surface profiler with a 2 mmdiameter stylus tip. IS0-2CR filter was used with a cut-
off limit of 0.8 mm. A sampling length of 15 mm wastaken in each case. Measured values of Ra; Rlo; and Rdq
are given in Table 1. Ra values of the various pre-treatedsubstrates were found to be in line with those measuredby Gilibert and Verchery [2].
The specimens were bonded about 24 h after grit-blasting and were degreased with acetone before
Nomenclature
S22 Normal tensile stress along y-axis, MPaS11 Normal tensile stress along xy-axis, MPa
Ra Average roughenss, mmRlo Linear profile length, mmR2
lo Effective surface area for bonding, mm2
Rdq Root mean square slope, 1
Mild steel Adhesive
15 mm
25 mm 25 mm
Fig. 1. Standard cleavage specimen.
Table 1
Surface roughnesses
Average
roughness
(mm)
Average
profile length
(mm)
Average root
mean square
slope (1)
Surface finish Ra* Rlo Rdq
Grit-blasted
surface
120/180 0.9870.05 13.4470.01 12.5270.59
40/60 2.9770.18 13.6970.04 22.7070.56
30/40 4.2370.25 13.8470.04 24.2470.89
24/30 6.3170.28 13.9570.07 25.9670.82
Polished
surface
0.0470.02 12.7970.01 0.1370.02
*RaFCentre line average (CLA).
M. Shahid, S.A. Hashim / International Journal of Adhesion & Adhesives 22 (2002) 235–244236

bonding. A manual dispensing/mixing gun was usedwith an appropriate mixing nozzle to dispense adhesivein the correct ratio. Adhesive was applied and spreadonto the bonding surfaces with a spatula. An adhesivethickness of 0.5 mm was applied to all specimens. Thiswas produced by attaching two wire spacers to theadherends near the front and rear ends of the joints. Thespecimens were then bonded and clamped using aspecially designed jig and were cured for 2 h at 701C.The cured specimens were removed from the jig and theadhesive fillets were removed manually with a razorblade.
The specimens were tested destructively on a Llyod10000 L tensile testing machine using standard testingfixtures. All tests were carried out under monotonicloading at room temperature with a cross-head speed of0.5 mm/min. A minimum of five specimens for eachsurface condition was tested to achieve an averageresult. After each test the failure load was recorded andfractured surfaces were examined to determine whetherthe failure was adhesion or cohesion. In some cases thefailure is referred to as adhesion/cohesion, especiallywhen no clear pattern is apparent.
3. Numerical modelling
Elastic stress distribution in a typical steel/steelcleavage joint was previously studied [8] and is shownin Fig. 2. It was realised that such a stress profile mightapproximately be represented as a histogram by assum-ing that a cleavage joint is made of a series of smallindependent butt joints. A similar approach was recentlyused for a lap shear joint by Owen and Lee-Sullivan [13].To study the effect of surface roughness on macro-leveleach bar in the histogram was then considered asrepresentative of a portion of surface roughness (Fig. 3).
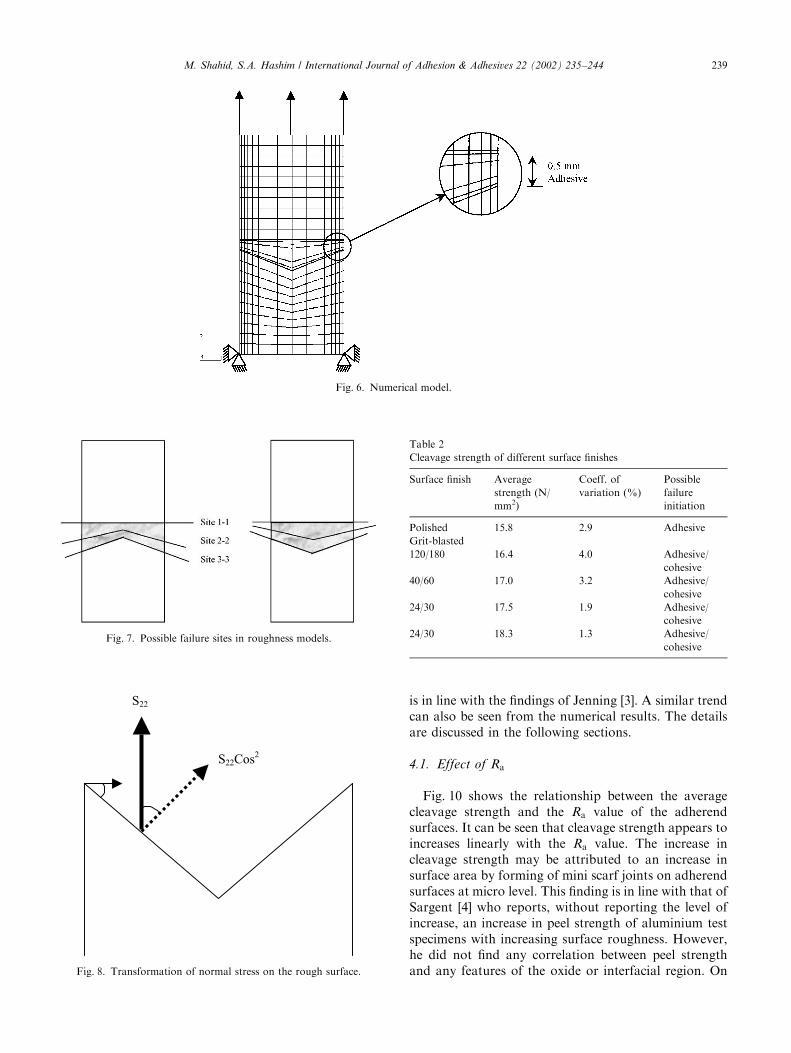
In view of the shape of the actual roughness profile of agrit-blasted specimen (Fig. 4) the roughness of the buttjoint was idealised into convex and concave shapes, asshown in Fig. 5. The surface of the upper adherend wasidealised as flat shape (polished). This was meant to givean easy comparison between the stresses at polished andat rougher surfaces. It was modelled in 2-D eight-nodedreduced integration quadrilateral shell elements using aPATRAN pre-processor and an ABAQUS processor(Fig. 6). The adhesive thickness (0.5 mm) was modelledwith five elements through thickness. Fine meshelements were applied to the adhesive region at theedges to account for the high stress gradients. Config-uration and meshing of the numerical models are shownin Fig. 7. Elastic isotropic properties were considered for
-5
0
5
10
15
20
0 5 10 15 20 25
Distance along adhesive line, mm
Norm
al
stre
ss,
MP
a
Fig. 2. Stress distribution in a typical steel/steel cleavage joint [8].
(a) (b)
Fig. 3. Idealisation of cleavage joint as a series of butt joints (a) full
model, (b) partial butt joint model.
M. Shahid, S.A. Hashim / International Journal of Adhesion & Adhesives 22 (2002) 235–244 237

both adhesive and steel. A nominal distributed load of1 kN was applied at the top of the butt joint and thelower adherend was constrained in the three axes.
Three possible failure sites within the adhesive linewere considered as shown in Fig. 8. These were the
adhesive interface with the upper flat steel surface (site1-1), the centre of the adhesive line (site 2-2) and thelower triangular steel adherend surface (site 3-3). Themaximum adhesive normal/tensile stress (S22) nearer theedge was taken as a comparative failure criterion. Incase of the lower triangular surfaces, values of normaltensile stress were transformed with reference to theslope angle (y) as shown in Fig. 8. The angle was takenas equal to the average of the root mean square slopeRdq for various specimens, which is 22.71 in the case of40/60 grit-blasted specimens. To avoid mathematicalsingularity problems at the free tension edge of the joint,stresses at the edge nodes were ignored.
4. Results and discussion
The roughness measurements and the results frommechanical testing are presented in Tables 1 and 2,respectively. The average cleavage strength from experi-ments (Table 2) is calculated by dividing the failure loadby the bonded area. The numerical results for the buttmodels are given in Fig. 9. The grit-blasted specimensproduced higher strength than the polished ones, which
Fig. 4. 3D and 2D surface profiles of grit-blasted steel surface measured by Talysurf.
Fig. 5. Schematic diagrams of roughness models.
M. Shahid, S.A. Hashim / International Journal of Adhesion & Adhesives 22 (2002) 235–244238
is in line with the findings of Jenning [3]. A similar trendcan also be seen from the numerical results. The detailsare discussed in the following sections.
4.1. Effect of Ra
Fig. 10 shows the relationship between the averagecleavage strength and the Ra value of the adherendsurfaces. It can be seen that cleavage strength appears toincreases linearly with the Ra value. The increase incleavage strength may be attributed to an increase insurface area by forming of mini scarf joints on adherendsurfaces at micro level. This finding is in line with that ofSargent [4] who reports, without reporting the level ofincrease, an increase in peel strength of aluminium testspecimens with increasing surface roughness. However,he did not find any correlation between peel strengthand any features of the oxide or interfacial region. On
Fig. 6. Numerical model.
S22Cos2
S22
Fig. 8. Transformation of normal stress on the rough surface.
Fig. 7. Possible failure sites in roughness models.
Table 2
Cleavage strength of different surface finishes
Surface finish Average
strength (N/
mm2)
Coeff. of
variation (%)
Possible
failure
initiation
Polished 15.8 2.9 Adhesive
Grit-blasted
120/180 16.4 4.0 Adhesive/
cohesive
40/60 17.0 3.2 Adhesive/
cohesive
24/30 17.5 1.9 Adhesive/
cohesive
24/30 18.3 1.3 Adhesive/
cohesive
M. Shahid, S.A. Hashim / International Journal of Adhesion & Adhesives 22 (2002) 235–244 239
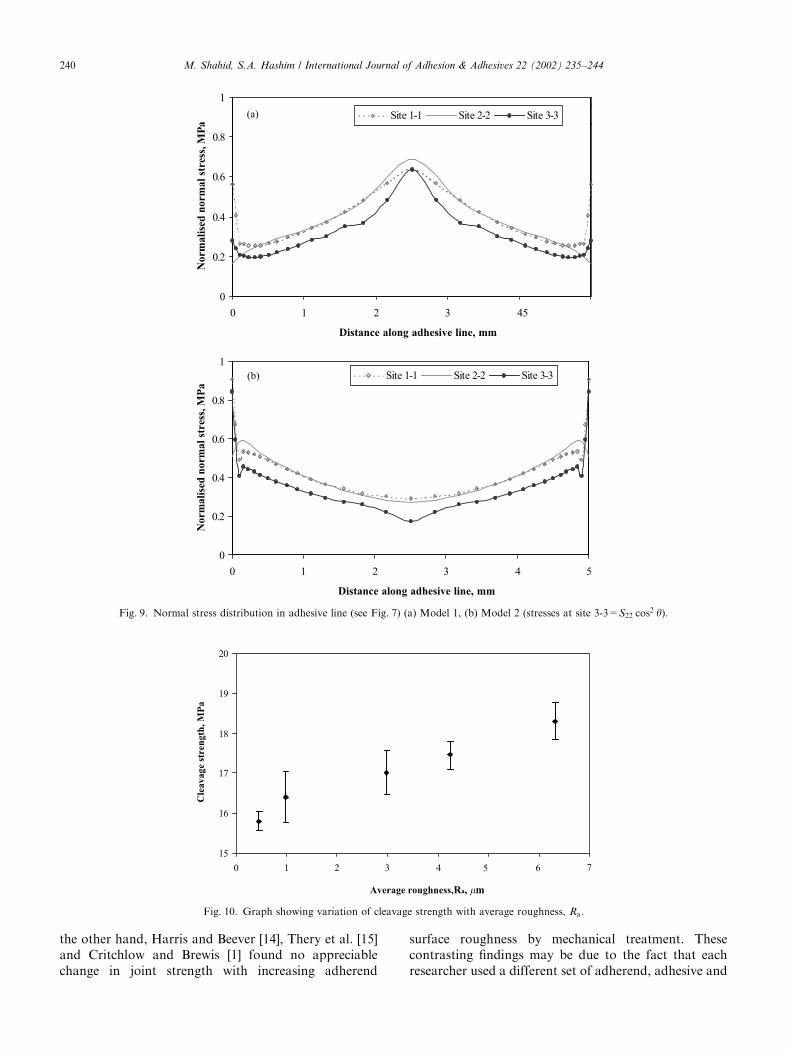
the other hand, Harris and Beever [14], Thery et al. [15]and Critchlow and Brewis [1] found no appreciablechange in joint strength with increasing adherend
surface roughness by mechanical treatment. Thesecontrasting findings may be due to the fact that eachresearcher used a different set of adherend, adhesive and
(a)
0
0.2
0.4
0.6
0.8
1
0 1 2 3 45
Distance along adhesive line, mm
No
rma
lise
d n
orm
al
stre
ss,
MP
a
Site 1-1 Site 2-2 Site 3-3
(b)
0
0.2
0.4
0.6
0.8
1
0 1 2 3 4 5
Distance along adhesive line, mm
Norm
ali
sed
norm
al
stre
ss, M
Pa
Site 1-1 Site 2-2 Site 3-3
Fig. 9. Normal stress distribution in adhesive line (see Fig. 7) (a) Model 1, (b) Model 2 (stresses at site 3-3=S22 cos2 y).
15
16
17
18
19
20
0 1 2 3 4
Average roughness,Ra, �m
Cle
av
ag
e st
ren
gth
, M
Pa
5 6 7
Fig. 10. Graph showing variation of cleavage strength with average roughness, Ra:
M. Shahid, S.A. Hashim / International Journal of Adhesion & Adhesives 22 (2002) 235–244240

joint geometry. Moreover, the overall effect of grit-blasting is not limited to the removal of contaminationor to an increase in surface area. This also relates tochanges in the surface chemistry of adherends [7] and toinherent drawbacks of surface roughness, such as voidformations and reduced wetting [17]. Sometimes thesemight act as antagonists.
4.2. Effect of R2lo
R2lo was considered as a measure of the effective
surface area available for bonding and this parameterwas noted in each case while keeping the sameevaluation length, filter, etc. These values were thencompared with cleavage strengths as shown in Fig. 11. Itcan be seen that the experimental cleavage strengthincreases as the effective surface area increases. It ishowever, realistic to believe that this increase in strengthcombined with an increase in surface area shall belimited by bulk adhesive strength i.e. until failurebecomes cohesive within the adhesive.
Due to concentrated loading at one end of the jointand the complex geometry of the surface consisting ofhills and valleys of various shapes, it is very difficult tolook into the contribution of different portions of theoverall surface. This is especially important because theinitial few millimetres of the adherends’ surface con-tribute significantly towards the total joint strength.
4.3. FE Analysis
Fig. 9 shows normalised critical failure stresses at thetwo adherends’ interfaces and the middle site of theadhesive layer. It can be seen that in both modelsstresses at site 1-1 (Fig. 7) are higher than the
corresponding stresses at sites 2-2 and 3-3. As expected,adhesive stresses nearer the edges are significantly higherthan other locations causing failure to initiate from theedges (Fig. 12). This is also consistent with experimentalobservations where stress whitening is more prominentat the edges. As an average of both models, stresses atsite 1-1 (flat top surface) are higher by about 30% thanat site 3-3 (rough lower surface). This is a goodrepresentation as in practice the roughness profiles aremade of a continuous series of concave and convexshapes. The experimental results (Table 2) show only
15
16
17
18
19
20
160 165 170 175 180 185 190 195 200
Effective area, Rlo2, �m2
Cle
av
ag
e st
ren
gth
, M
Pa
Fig. 11. Variation of cleavage strength with effective area of bonding (experimental results).
Fig. 12. Fractured surface of grit-blasted steel cleavage specimen
showing failure initiation from the edge.
M. Shahid, S.A. Hashim / International Journal of Adhesion & Adhesives 22 (2002) 235–244 241

16% difference in average cleavage strength between thepolished and rough (24/30 mesh) conditions. Althoughthese experimental conditions are assumed to representsites 1-1 and 3-3 of the numerical models, respectively,the scatter between the numerical and experimentalresults is somewhat high. Besides the model representa-tion problems, scatter is also possibly due to the lack ofwetting in bonded joints and this could be more criticalin the case of cleavage where stresses are highlyconcentrated at the edge. Surface profile can lead tothe trapping of air beneath the adhesive and poor fillingof crevices. These voids can lead to stress concentrationsand hence lower joint strength [16]. Depending on thenature of the roughness and adhesive, the surface maynot be wetted properly, and the adhesive may even startcuring before going deeper into the pore. Hitchcock et al.[17] reports that increasing roughness usually reducesthe wettability of the surfaces with the exception of verylow viscosity adhesive and significantly rough surfaces.Sargent [4] also analysed the contribution of increasedarea and surface roughness on the force required fordetaching adhesives and adherends. By considering asurface composed of spherical depressions, he found anincrease of 15% in the normal tensile force requireddetaching the adhesive from the adherend surfaces.
4.4. Loci of failure
Upon visual and light microscopic examination, itappeared that the specimens prepared by grit-blastingsteel adherends with coarser grit have shown signifi-cantly higher crazing (stress whitening zones due tomicro-cracking) in the initial area of the joint comparedto those prepared with the finer grit (Fig. 13). In bothcases, however, failure was near the interface region andapparently in a mixed adhesion/cohesion mode. Fromthe intensity of whitening it appeared that the failure
initialised from one of the corners of the adherend, apoint of theoretical singularity. This is in line with thefindings of Crocombe et al. [18]. On the other hand, inthe case of polished specimens, the fractured surfaces ofthe joints showed no sign of crazing, and bare steel andadhesive regions were clearly visible showing anapparent adhesion failure (Fig. 14). It is difficult toconfirm, without using more sophisticated techniquessuch as electron microscopy and X-ray diffraction, if thebare portions of fractured surfaces are completely free
Fig. 13. Fractured surface of grit-blasted cleavage joint showing stress whitening in the initial joint area.
Fig. 14. Fractured surface of polished steel cleavage specimen.
M. Shahid, S.A. Hashim / International Journal of Adhesion & Adhesives 22 (2002) 235–244242

from adhesive residues or not. However, the results fromthe numerical analysis clearly indicate adhesive failuremode and hence it may be said that failure initiation inall these cases was adhesive failure (adhesion). Theseobservations may only apply to specific cases includingloading conditions and type of adhesive and adherend.
It can be seen from Fig. 9 that the stresses near theedges of model 2 are significantly higher than those inthe centre or edges of model 1. However, if a void defectfinds its place at the convex top of model 1 then failuremay initiate from the centre. One way to verify this is byconducting experiments based on the models’ dimen-sions.
5. Conclusions
From the experimental and numerical work under-taken in this study it can be concluded that:
1. Normal tensile stresses in the case of rough steelsurfaces are lower than those in polished ones. Thisdifference could be as high as 30%.
2. A simplified numerical butt model with macro-roughness provides reasonable degree of correlationand representation of adhesion in the standardcleavage joint.
3. Cleavage strength appears to increase with theroughness level and profile area of adherend’ssurface.
4. Mode of failure initiation in steel cleavage jointsunder quasi-static loading and ambient conditions
may be classified as ‘‘adhesive (adhesion) failure’’.This mode seems to be independent of level ofadherend surface roughness.
Appendix A
Rlo is defined in ISO 4287 1984. It is the measuredlength of the profile surface within the evaluation length,ln i.e. the length obtained if the profile, within theevaluation length, was to be drawn out into a straightline [19]. Mathematically it is represented as follows:
Rlo ¼Z ln
0
ffiffiffiffiffiffiffiffiffiffiffiffiffiffiffiffiffiffiffiffiffiffiffiffiffiffiffiffiffi1 þ
dy
dx
� �2
dx
s:
A graphical representation of Rlo is given in Fig. 15.Rdq is defined in ISO 4287 1997 para 4.4.1. It is the
root mean square value of the ordinate slope dz=dx
within the sampling length. The mathematical represen-tation for this is
Rdq ¼
ffiffiffiffiffiffiffiffiffiffiffiffiffiffiffiffiffiffiffiffiffiffiffiffiffiffiffiffiffiffiffiffiffiffiffiffiffiffiffiffiffi1
L
Z L
0
ðyðX Þ � %yÞ2 dx
s;
where y is the slope of the profile at any given point and
%y ¼1
ln
Z ln
0
yðX Þ dx:
Graphically, this is explained in Fig. 16.
Fig. 15. Graphical representations of linear profile length, Rlo [19].
M. Shahid, S.A. Hashim / International Journal of Adhesion & Adhesives 22 (2002) 235–244 243

References
[1] Critchlow GW, Brewis DM. Influence of surface macroroughness
on the durability of epoxide–aluminium joints. Int J Adhesion
Adhesives 1995;15(3):173–6.
[2] Gilibert Y, Verchery G. Influence of surface roughness on
mechanical properties of joints. In: Mittal KL, editor. Adhesive
joints formation, characteristics, and testing. New York: Plenum
Press, 1982.
[3] Jennings CW. Surface roughness and bond strength of adhesive.
Am Chem Soc Div Org Chem 1971;31(2):184–92.
[4] Sargent JP. Adherend surface morphology and its influence on the
peel strength of adhesive joints bonded with modified phenolic
and epoxy structural adhesives. Int J Adhesion Adhesives
1994;14(1):21–30.
[5] Katona TR, Batterman SC. Surface roughness effects on the
stress analysis of adhesive joints. Int J Adhesion Adhesives
1983;3(2):85–91.
[6] Matsui K. Size-effects on average ultimate shear stresses of
adhesive-bonded rectangular or tubular lap joint under tension-
shear. J Adhesion 1990;10(2):81–9.
[7] Harris AF, Beevers A. Grit blasting of surfaces for adhesive
bonding. Conf Proc Structural Adhesives in Engineering V.
Bristol: Institute of Materials, 1998.
[8] Shahid M, Hashim SA. Cleavage strength of steel/composite
cleavage joints. J Adhesion 2000;73/4:365–84.
[9] Sykes JM. Surface treatments for steel. In: Brewis DM, editor.
Surface analysis and pretreatment of plastics and metals. London:
Applied Science Publishers, 1982. p. 153–74.
[10] De Bruyne NA. Aero Research Technical Notes, Bulletin No.168.
Cambridge: Aero Research Ltd., 1958.
[11] Packham DE. Roughness of surfaces. In: Packham DE, editor.
Handbook of adhesion. New York: Longman Group (FE) Ltd.,
1992.
[12] BSI, Determination of cleavage strength of adhesive bonds,
BS5350: Part C1:1986 (1986).
[13] Owens JP, Lee-Sullivan P. Stiffness behaviour due to fracture in
adhesively bonded composite-to-aluminium joints I. Theoretical
model. Int J Adhesion Adhesives 2000;20:39–45.
[14] Harris AF, Beevers A. Grit blasting of surfaces for adhesive
bonding. Int J Adhesion Adhesives 1999;19:445–52.
[15] Thery S, Legros A, Balladon P. Study of parameters
influencing the mechanical behaviour of and damage to steel-
polymer interfaces. In: Baptiste D, editor. Mechanics and
mechanisms of damage in composites and multi-materials,
ESIS11. London: Mechanical Engineering Publications, 1991.
p. 339–50.
[16] Wake WC. In: Eley DD, editor. Adhesion. London: Oxford
University Press, 1961. p. 191.
[17] Hitchcock SJ, Caroll NT, Nicholas MG. Some effects of substrate
roughness on wettability. J Mater Sci 1981;16:714–32.
[18] Crocombe AD, Bigwood DA, Richardson G. Analysing structur-
al adhesive joints for failure. Int J Adhesion Adhesives
1990;10(3):167–78.
[19] ISO 4287. Help file of Ultra Software. Taylor and Hobson,
1984.
Fig. 16. Graphical representation of Rdq [19].
M. Shahid, S.A. Hashim / International Journal of Adhesion & Adhesives 22 (2002) 235–244244