THE EFFICIENCY OF RIVETED STRUCTURAL JOINTS" ---
410
A ENGINEERING STUDIES STRUCTURAL RESEARCH SERIES NO. 30 THE EFFICIENCY OF RIVETED STRUCTURAL JOINTS" --- II By " -F-;'-W: "-SCH UTZ;"' JR. and N. M. NEWMARK UNIVERSITY OF ILLINOIS URBANA, ILLINOiS
-
Upload
khangminh22 -
Category
Documents
-
view
0 -
download
0
Transcript of THE EFFICIENCY OF RIVETED STRUCTURAL JOINTS" ---

A ENGINEERING STUDIES STRUCTURAL RESEARCH SERIES NO. 30
THE EFFICIENCY OF RIVETED
STRUCTURAL JOINTS" ---
II
By
" -F-;'-W: "-SCH UTZ;"' JR. and
N. M. NEWMARK
UNIVERSITY OF ILLINOIS
URBANA, ILLINOiS


THE EFFICIENCY OF RIVE"l'ED
STRUCTURAL JOINTS
by
Fo Wg Schutz 9 Jro and
No Mo Newmark
A Progress Report of an Investigation Conducted by
THE UNIVERSITY OF ILLINOIS ENGINEERING EXPERIMENT STATION .
in Co.operation with
THE BESEARCH COUNCIL ON RIVETED AND BOLTED STRUCTURAL JOI~S9
TEE ILLINOIS DIVISION OF HIGHWAYS
and
THE BUREAU OF PUBLIC ROADS
Project II
TIrbana9 Illinois September 1952


i
CONTENTS
I.. INTRODUCTION
10 Obje~t and Scope of Investigation 0 0 " " 00 1
20 SpeGification Governing the Design of Tension
Mem.bers o " " o 0 0 000 Q 4-6 3.. Aeknovledgment o 0 0 Q 0 Q 0 0 Q 0 0 0 0 0 0 GOO
IIo DESCRIPTION OF SPECIMENS AND EQUIPMENT
40 Des~iption of Specimens " " ';0 Pro~rties of Materials " 0 0 0 " " " 0 0 " 60 Description of Equipment 0 .. " 0 " "
70 Test Proced~s . . " 0 0 0 0 0
1110 RESULTS OF TESTS
80 General Remarkrs .. 0 000 0 " 0 .. 0 000 "
90 Relat,ionship between Load and Deformation "
100 Analysi~ of Results 0 0 " 0 0 " " " "
IV 0 RELATIVE GAGE METHOD OF PREDICTING EFFICIENCY
Development of Theory 0 " 0 0 0" " "
" "
"
" 0
" 0
" "
" . 9
12
14
" 0 16
" 0 17
" 0 18
19
35 Relationship between Efficiency and Relative Gage.. 41 Applieati,on of the Relative Gag'e Method
V.. COMP .ARISON OF TEST AND PREDICTED EFFICIENCIES
140 Method of study " 0 .. 0 0 .. .. " 0
1, 0 Tests of Present Program
160
170
180
190
200
210
Test.s by Fefferman and Langhaa:r 0 0
Tests by Moisseiff 9 Hartmann. and Moore
Tests by Watertown .Arsenal 0 0 ..
Tests ~ Gayhart 0 0 0 0 .. 0
Test,s by Davis 9 Woodruff and Davis
Tests by Gay~i9 Munse and Wilson
1/5
53 57 ,S
" 0 61 o 0 0 0 61
o " 0
o " 0
62
63

ii
CONTENTS (Cont l d)
Tests by Becker, Sinnamon and Munse • • •
Tests by Massard, Sinnamon and Munse
22.
23. 24. Tests by Bergendoff and Schutz . . . . . . .
64
65
66
25. Tests Qy Baron and Larson, Research Council,
PI-oject 5 0 • • • • • • '" • • • • • • • • • • 67
26. Tests by Baron and Larson, Research Council,
Project 7 • . . . . • . . .
27 • Tests by Harris • • • • • • • . • • . . . •
28. Tests by Wilson and Thomas •• • • • • • •
29. Tests by Wilson, Bruclmer and McCrackin • •
30. Tests by 'Wilson, Mather and Harris
VI. S1JMMARY OF RESULTS AND CONCLUSIONS
. 31 (t Summary of Present Program
67
68 68
• • • 0 68 69
• • • • 71
320 Factors which Affect Joint Efficiencr,r • • • • • • • 75
3.30 Design Rules • • 0 • 78
BIBLIOGRAPHY 0 0 • •
.APPENDIX I - TABLES
APPENDIX II - FIGURES
85


Table No.
, ..L.
2
3
4
5 6
7
8
9
10
11
12
1:3
14 15 16
17
18
19 20
21
22
2.3
24
25
iii
LIST OF TABLES
APPENDIX I
Title
Initial Fastener Tensions for llA,Art Series
Results of Tests of Present Test Program
Properties of Center Plate Material
Meehanical Properties of Fastener Material
Results of T?sts by Fefferman and Langhaar (9)
Results of Tests by Mo1sseiff~ Hartmann and Moore (10)
Results of Tests by Watertown Arsena1 9 1882 (11)
Results of Tests by Watertown Arsenal 1 188.3 (12)
Results of Tests by Watertown Arsena1 9 1885 (1,3)
Results of Tests by Watertown Arsena1 9 1886 (14)
Results of Tests by Watertown .Arsena19 1887 (15)
Results of Tests by Waterto'WIl Arsena1 9 1891 (16)
Results of Tests by Watertown .Arsena1 9 1896 (17)
Results of Tests by Gayhart (18)
Results of Tests by Davis 9 Woodruf"f and Davis (1)
Results of Tests by Gayei~ Munse and Wilson (2)
Results of Tests by Becker 9 Sinnamon and MlIDse (19)
Results of Tests by Massard 9 Sinnamon and Munse (20)
Results of Tests by Bergendoff and Schutz (21)
Results of Tests by Baron and Larson~ Research Council Project 5 (22)
Results of Tests by Baron and Larson9 Research Council Project 7 (23)
Results of Tests by Harris (24)
Results of Tests by Wilson and Thomas (25)
Results of Tests by Wilson, Bruckner and McCrackin (26)
Results of Tests by Wilson 9 Mather and Harris (27)


iv
LIST OF FIGURES
APPENDIX II
Figo No. Title
1 Joint Details
2 Layout of Parent Plates
3 Typical Specimen and Test Assemb~y
4 Average Ultimate Strength Across Width of Parent Plates
5 Average Plate Thickness Across Width of Parent Plates
6 Comparison of Ultimate Strengths from Full Width and 1/2-in. Wide Coupons
7 Bolt" Extensometer Being Used to Determine Fastener Tension
8 Load-DerormatiQn Curves for Joints Having a Varying Stagger
9 Load-Deformation Curves for Joints Having a Varying Pitch
10 Mode of Fracture of Scale Ef'fect Series
11 Effect or Fastener Tension on Joint Efficiency
12 Effe"ct of Stagger in rtP" and liNn Series on Joint Efficiency
1.3 Mode of-Fracture of tiN" Series
14 ~fect of Stagger on Efficiency in 3, 5 and 7 Line Joints
15 Effect of Stagger on Mode of Fracture
16 ~fect of Stagger in all Transverse Rows of Fasteners on Joint Efficiency
17 Comparison of the Mode of Fracture of Joints with One Row Staggered and All Rows Staggered
18 Effect of Varying the Gage on Joint Efficiency
19 Effect of" Varying the Gage on Mode of Fracture
20 Effect of Varying the Pitch on MOde of Failure
21 Effect of Varying the Pitch on Joint Efficiency


v
LIST OF FIGURES (Continued)
Fig. No. Title
22 Effect of Number of Transverse Rows on Joint ~iciency
23 Effect of Number of Transverse Rows on Mode of Failure
24 Effect of Number of Longitudinal Lines of Fasteners on Joint Efficiency
25 Effect of Number of Longitudinal Lines on Mode of Fracture ,
26 Modes of Fracture of "ST JI Series
27 Origin of Fractures
28 Effect of 14inimum Gage on Joint Efficiency
29 Effect of Plate Thickness on Joint Efficiency in Present Tests
30 Effect of Plate Ductility on Joint Efficiency in Present Tests
31 Two Modes of Fracture in Duplicate Joints
32 Comparison of Various Methods of Predicting Efficiency of Joints
33 Legend of" Symbols Used in Plotting Results on Following Figures
34 Variation of Test Efficiencies From Efficiencies Predicted by Relative Gage Methods for Joints with Drilled Holes
35 Variation of Test Efficiencies From Efficiencies Predicted by Relative Gage Method for Joints with Punched Holes
Variation of Test Efficiencies from Efficiencies by wilson Rule for Effective Net Width
37 Variation of Test Efficiencies from Efficiencies Predicted by Hodified .AREA Rule for Net Section
38 Error Distribution of Predict.ed Joint Efficiencies for 855 Tests Studied
39 Error Distribution of Predicting Joint Efficiencies for Present Program
40 Effect of Plate Ductility on Joint Efficiency
41 Effect of Bearing Stress to Tensile Stress Ratin on Joint Efficiency


vi·
SYNOPSIS
Previous investigations on the efficienqy of riveted structural
j~ints have shown the need for a better method of predicting the strength
{sf 'thss'o jointso The investigation reported here was made to fill this needo
T.u.is !"e8eaI~ch program includes the testing of one hundred and thirty joints
and the analysis of the result~ of these tests and of some nine hundred tests
m.ads by other investigators 0 This study led to the discovery of a new method
of predicting joint efficienC,19 the relative gage method. The relative gage
method is compared with t~o other methods of predicting efficiency of joints
and is found to be superior to both 0


I. INTRODUCTION
1. OBJECT AND SCOPE OF INVESTIGATION
The research program described herein was carried ou.t to fulf'ill the
following objectives:
10 To determine the static strength of double-strap butt type riveted
or bolted structural joints, in order that the relative merits of
various fastener patterns might be evaluated.
20 To determine ~ch variables other than fastener pattern influence
to a major degree the static strength of structural joints 9 and to
investigate the relative importance of these variables 0
3. To determine a simple ~ethod for the prediction of the effi~iency
of riveted or bolted structural joints.
40 To compare the efficiencie·s found by tests· wi tb. those predicted
~. several design rules.
In order to attain the objectives of this program a great many variables
'W'8re investigatedo When a certain variable was under study by a series of tests
all other variables were held constant. Some of the variables studied shoved no
influence whatsoever on joint efficiency. others had an insignificant effect,·
and a few were fo~ to be quite important 0
The variables which were studied to deterMine their possible effect on
efficiency are as follows:
1 0 Initial faGtener tension
20 Size of geometrically similar joints


2.
3. Stagger of fasteners
4. ,Transverse spacing or gage
5. Longi tudinal spa cing or pi tch
6. Width or length of joints with constant gage or pitch
7 • Po~ tion and size of the minimum gage in a joint with
variable gages
8. F8stener material
9. Thickness and ductility of the plates
10. Method of forming holes for the fasteners •. ,
Practically all previous investigations failed to control some or
all of the variables. This made correlation of the earlier work with theore-
tical studies difficult, and conclusions drS'WIl from the earlier tests were
often looked upon with some doubto One of the most elaborate series of te3tS
* of riveted steel joints was reported by Davis, Woodruff and Davis (1) in
connection with the design and construction of San Francisco-Oakland Bay
Bridge. In their conclusions the authors state,
flNothing is gained by an attempt to detail a tension member with a c:t1-tical. net area greater than 75 per cent of the gross area. n
However, in the discussion, of this paper. some engineers pointed out results
of tests where joint efficiencies were as high as 85 per cent.
In an attempt to answer some of the questions on this subject, the
Research Council on Riveted and Bolted Structural' Joints, the Illinois Division
* Numbers in parenthesis indicate the reference number in the bibliographyo
.. ~


3.
of High1.1ays 'and the Bureau of Public Roads set .. up a research. program at the
University of Illinois known as Project II, ,"The Effect of the Rivet Pattern on
the Static S~engths of Jointso-" The first progress report of this project by
Wilson, Munse and Cayci (2) was subnitted in January, 19509 and in this report'
the authors said~
"Although the average efficiency .. for a number of riveted joints may'be as grecit as 80 per cent9 there is no assurance that the efficiency of an occa- . sional joint may not be as low as 75 per cent, possibly a little lowero"
Because of the conflicting and indecisive results of preVious reports on
this subject, the research program reported herein 'WaS proposed in an attempt
to gi ve a firm basis for future work in, this field and also to a?syer, the
question9 ,."Can 'efficiencies 'greater than 75 per cent be generally ob,tained?~
The program was ap~ved by the .Research Council on Riveted and Bolted Structu:ral
Joints at the annual meeting on ,January 30, 19510-
This report contains the results of tests made on 130 joints having
62 distinct designsQ The joints vere all of double-strap butt type and 'Were
tested at room temperature under static ,loading 0' In addition to the joints some
120 control coupons cut from the parent plate were tested"
.An extensive, study was made of the test results in this test program and
of all other test results that were available to the -writer" This study lead to
the development o£ a new method of predicting the efficiency of riveted or bolted
structural jointso The new mei:.hod9 which is referred to as the trre1ative gage
method ii 9 is presented hereino ine efficiencies of all available test joints are .
predicted by means of this method and compared with their test efficiencies a In
general the agreement is remarkably goodo


2. SPECIFICATIONS GOVERNING THE DESIGN OF TENSION MEMBERS
The three specifications most commonly used in the United States for
the design of steel bridges and steel buildings have the same rule for the . -
computation of the effective net section of riveted tension members. This
rule appears in the specifications of the f'911owing organizations: The American -. _. .
Railvay Engineering Association (3) ~ The American Association of State Highvay
Officials (4), and The American Institute of Steel Construction (5)9 and it
reads as follows:
nThe net section of a riveted tension member is the sum of the net sections of its component partsQ The net section of a part is the product of the thickness of the part multiplied by its least net ~dthon
nThe -net lddth for any chain of holes extending progressively across the part shall be obtained by deducting from the gross width the sum of the diameters of all the holes in the chain and adding, for each gage space in the chain 9 the quantity
2 L 4g
s = pitch of ~ two successive holes in the chain
g = gage of the same holeso
"The net section of the part is obtained from that chain which gives the least net width 0 rt
"For angles, the gross 'Width shall be the sum of the widths of the legs less the thicknesso The gage for holes in opposite legs shall be the sum of the gages from back of angle less the thicknesso"
"For splice members, the thickness shall be only that part of" the thickness of the member which has been developed by rivets beyond the section consideredo tl
. i
liThe diameter of the hole shall be taken as 1/8 ino greater than the nominal diameter of the rivet 0 tI


"Ir angles in tension are so connected _-:that 'tending cannot occur in arty' direction, the effective ..section shall be the net section of the angleo If such angles are c6nnecteq. en one sideo£ a gusset plate, the effective section- shall be the net section of the connected leg plus 1/2 the section of the unconnected lego-n
The above rule is referred to herein as the AREA rule and it is used
in a slightly modified formo This modification was necessary because m8l:\1
of the joints studied were ma~e With small diameter holes for which the
following clause was never iritended~
!!The diameter of a hole shall be taken -as lis ina greater than the nominal diameter of the ri veto
This clause has been modified to read:
"The diameter of a hole. shall. be taken as the actual diameter of the hole regardless of the method used·in making the holen
0
Since 1908 many rules for the computation of the net section have been
presented in the 11 terature 0 Few if any of these rules have been based on a
comprehensive test program or survey of past test programso
In 1908 Vo Ho Cochrane (6) submitted a so-called rational method fo~
calculating the net section of tension members 0 This method was based on several
erroneous assumptionso The expression determined qy Cochrane vas later simplified
by T .. Ao Smith in 1915 (7)0 Even with this simplification the Cochranec-Smith
rule was too complex to be usedo
M'r 0 V 0 Eo Cochrane in 1922 (8) presented the method of handling the
staggered row connection which finally was expressed in our present d5.1 speci= this es 2
fications; -the clause involvHlg the term "S /4g" 0
Several persons among the many wo discussed the paper by Davis 9 Woodruff
and Davis (1) presented rules for determining the net sectional area of tension
members 0 The best of these rules on the basis of agreement with test results


6.-
.. -was the one proposed by W." M~ Wilson in his discussion. This rule is given
by the following equat~on and rules of "interpretation:
"Effective net width (Wn ) = 0085 (Yg-ND) (1 + ~)
in which
and
W = gross width of the member, g -".' -
D = nominal diameter .. of -the- rivet 'plus l/8-in.,
N = the number of rivet holes to be deducted 9
G = transverse distance bet~en rivets or twice the edge.) distance 9 whichever is the greater 0
- -
!fIT rivets are omitted from the outer rov, Nand G shall be determined by the rivets in the outer roW' provided the pi too . eqUals or exceeds 0.80 of the gage; otherwise the intervening rivets in the second-row and all-of the rivets in the outer row will be considered in determining N and Go"
As a result of the present investigation a rule for the net
section of tension members has been developed which agrees more closely Yith
the-test- -results than either of the above-mentioned rules 0 The developnent
of this new rule will be presented in Chapter IV and it will be given in
specification form in Chapter VI.
30 ACKNOWLEDGMENT
The study described in this report is part of an investigation '-
carried on as a result of a cooperative agreement between the Engineering"
~~r.~~nt ~~at~?n ~f the university of Illinois 9 the Illinois Division of
Highv~s9 the Bureau of PUblic Roads, and the Research Council on Riveted and


7·
Bolted Structural Joints. It is a part of the structural research program of
the Department of Civil Engineering under the general direction of N. M. Newmark,
Research Professor of Structural Engineering. The work was carried out by
F. W. Schutz, Jr. R~search Assistant in Civil Engineering working under the direct
supervision of W. H. Munse, Research Associate Professor of Civil Engineering.
'" R. C. Bergendoff, Research Assistant in Civil Engineering, assisted lin the
performance of many of the tests.
The tests described in this report were planned by F. W. Schutz, Jr.
and were subsequently amended and'approved by the Project II Committee of the
Research Council on Riveted and Bolted Structural Joints. This committee is
concerned primarily with the study of the effect of rivet pattern on static
strength of structural joints. The members of the Project II Committee are as
follows~
N. M. Newmark, Chairman J. I. Parcel
Raymond Archibald C. H. Sandburg
Frank Baron W. Mo Wilson
'W .. H. Munse G. B. Woodruff
R. B. Murphy


IIo DESCRIPTION OF TEST SPECIMENS AND EQUIPMENT
4 0- DESORIPTION OF TEST "SPECIMENS
The details of the joints which were tested in the course of this investigation are shown in Figs. la to Ij inelusive.· The joints were essenti
ally one half of a double-strap butt joint designed to fail in the center
plate~ Except where noted on the detail draw~ngs the center (or failure)
plate vas 5/lO-in. thick and the strap or splice plates were 1/ 4-ino thick.
All fastener spacings were 1 l/2-ino and ·all edge distances were 31 4 in~
unless noted otherwiseo The holes· were drilled and reamed to 00375 in.
·~aept as noted in the seale eff;ect series and joints APlo The hole diameter
varies :for the scale effect series (I Joint API had 00 "J75ino diameter punched
holes.
The joints were held together by Oo375-ino diameter studs made from
2~ino lengths of cold-rolled rods 9 threaded at both ends., The clearance
betveen fastener and hole was not more than 00001 ina The fasteners for the
main program were given an initial axial tension of 30,000 psi on the gross
area.. Only joints of series nAA" (the fastener tension effect series) and
series "FM" (fastener material effect series) were fabricated with fastener
tensions other than 309 000 psio The tensions for the uAAn series are given
in Table 10 The fasteners in the "FM" series had no initial tensiono
Nuts for the fastener were standard finished hexagon nuts.with coarse
threads., There was a special l/8-inOl thick washer under each nut., These
washers had an inside diameter of 0 0 391 in. and an outside diameter o£
0 0 625 in 0 The outside washer diameter approximated closely the head diameter
of an equivalent standard riveto


10 •.
The joints vere intended to be hall scale models of structural joints
having ll/l6-in. diameter rivets driven in .3/4-in. drilled holes. The details
of the fasteners and joints simulate this condition.
Additional information about the joints is given in Table 2. This
table includes the following data for the joints: gross are~, T:S:B ratios
(values relating the tensile stress 9 shearing .. stress, and bearing stress·,
respectively, to the tensile stress), predicted efficiencies, and actual test
efficiencies.
There are two groups of T:8:B ratios reported: one based on the
tensile area predicted ~ the modified AREA rule for net section and the
other on the new method of predicting net section developed in this investi~
gation (the relative gage method). The efficienc.y of a joint as used herein
is the maximum load the joint 'Will carry divided by the product of the gross
cross sectional area of the "failure n plate and the u.ni t ultimate strength of
the plate material. The efficiency of each joint is predicted by the modified
AREA rule for net seetion, the Wilson rule for effective net width and relative
gage method of predicting effective net sectiono
In order to differentiate between test specimens, the specimen designa
tion given on Table 2 is divided into two partso The first part of the desig
nation which :is composed of 1 or 2 letters and then an Arabic number indicates
the joint design as shown on Fig. 1. The second and last part of the designa-
tion which is a single letter identifies the various specimens within a given
joint designo Therefore~ joint design ACI ~hown on Fig. lb vas tested in
duplicate by specimens ACJ...A and ACIB as listed in Table 2. All joint deSigns
except FMl, FM2 and PI were tested by duplicate specimens. Three specimens
each were tested o£ FMl and FM20 ~oint PI was tested by 6 identical specimenso


t~-~--- 11.
The center (failure) plates of the main program were cut from 4 large
parent plates 36 ino 'Wide and 10 fto 19n9" These plates had a il6rirl.nal thick
ness of' 5/16c-in" and 'Were cut from one long Universal Mill plate ,36-in" -wide.
The 36-:ino width was bounded by 2 rolled edgeso As will be sho'WD. later 9 the
position on the parent plate from which the joint center plate was eut was of
great importance" Figures 2a and 2b sh9w the location of all center plates
used" The narrow strips of plate between specimens which do not have
identif'ying marks repre'sent control coupons 0
. The specimen plates were laid out 1/4-ino oversize and sawed 'from the
parent plate~ After Sav.ing9 the plates 'Were machined to exact size in a
shaping machine 0 Actual layout of the fast-ener pattern was made on one of'
tJle side plates 9 after which the joint was assembled and clamped together while
drilling and reaming was doneo This procedure assured perfect alignment of
holes and simplified the layout and machine worko
When the plates of a joint had been carefully cleaned of all oilg
chips and burrs 9 the joint was reassembled and the fasteners were tightened
to the desired initial tension" The pull plates and joints were aligned and
then clamped securely on a special frame as they were being welded togethero
The pull plates served as connections between the specimen and pull heads which
were clamped in the jaws of the testing machine 0 A typical specimen and test
assembly are shown in Figo 30
The possibility that the welding 9 required to attach the pull plates 9
might affect the fastener tension which had been set previouslY9 was recognized
and investigatedo The fasteners invariably returned to their initial elonga-
tion after showing an added elongation when heated by the welding of the pull
plates 0


12.
5. PROPERTIES OF MATERIAlS
'When this test program was planned~' one of the primary objectives was
to control as much as possible any variation of the properties of the plates
of the joints which were subject to failureo This was to ;beaccomplished in
wo ways; (1) to have all "failure" pl~tes ~f one thickness and (2) to have
all specimens cut from one parent plateo In accordance with this plan the
center plate material vas ordered as 5 plates 5/l6-ino thick, .36 ino wide and
10 fto long of structural grade stee19 ASTM Designation A7-5C/!. It was further
required that all of these plates be cut from one longer plateo The plate 9 as
received, fully met these requirements but the full intent of the original
planning was not attainedo
In order to determine the ultimate strength of the parent plates used
in the present program some 120 control coupons were testedo These coupons
were taken from all parts of the parent plateso On Fig. 2, the coupons are
the unidentified strips of plate between the joint center plateso This
coupon test program showed that the ultimate strength of the plate did not vary
with the longitudinal posi tion9 but did vary with transverse posl tiono The
results of 109 tests of coupons 1/2,.,ino wide with a 2-ino gage length were
used to obtain a curve relating the average ultimate strength with transverse
position on the parent plate 0 This curve is shown on Fig 0 40
It was observed that the parent plates of this program had considerable
variation of thickness with transverse positiono This variation is indicated
by the CUI"V'e on Fig 0 5 0
It was recognized that the gross strength of a wide plate may not be
equal to the ultimate strength obtained from a narrow coupon multiplied by


the gross areao To ascertain the best method of predicting the gross strength
of a jOint9' 8 series of test of full size coupons were made 0 These fullcmSized
coupons were tested in widths of 4 1/29 69 7 1/2 and 10 l/2-ino (the same
widths that occurred in the joints of the program) 0
The positions on the parent plate of these fUll width coupons which' are X
designated as D29 X29 ~51 x6 9 X8 9 Xl0 9 ... n39 XZ79 X28 9 and X29 are shown in
Figso 2a and 2bo The results of the tests are given in Table 30 Figures 6a
and 6b g:i.ve 8 comparison of the ult:ilnate strengths given by the full width
?oupon and that given by th~ narrower 1/2-ino wide control coupons for comparabl.e
transverse positionso This comparison shows that the ultimate strengths obtained
from the full size coupons agree best with the minimum ultimate strengths
predicted by the 1/2-ino 'Wide coupons for the particular width of the parent
plate from which the full size coupons were takeno For this reason9 the gross
strengths for all of the joints of the main program were computed by taking the
product of the actu~l area of the center plate and the minimunt ultimate strength
that 1/2-ino wide control coupons cut from the joint plate would have sho'W
had they been made 0 The variation between test efficiencies of duplicate speci-
mens was f01.n1d to be smaller when this method of computing gross strength was
used than when alternate methods vere used o
The commonly known phenom.enon of size effect is clearly shown in Figo 6b
where the 7 1/2-ino and 10 1/2-ina wide coupons are compared 'With the results
of the l/2..".ino coupons a The wider coupons show ultimate strengths which m"S
noticeably smaller than those given by the 1/2~ino wide coupono This reduction
is not9 however 9 more than 108 per cent of the ultimate strengths given by the
1/2-ino coupons and it was not deemed necessary to make a correction for size
effect when computing the gross strength of joints of this program 0


E
Table 3 contains the mechanical properties of other center plates
used in the program. The two preliminary programs were carried out before
the 5/l6-in. plate described above was received and the plates necessary for
manufacture of these joints were taken from laboratory stock. The mechanical
properties of this plate are listed tmder Plate for Preliminary Program in
Table 3. The nSrt series of tests was planned to determine the effect of
plate thickness on joint efficiena,y; hence, plates 1/4-in. and 3/S-in& thick
were necessary for this small number of tests. The mechanical properties o:f
the plates for the "sn series is listed under Plates for Main Program in
Table 3.
The mechanical properties of the material used as fasteners in this
program are shown in Table 4. In the preliminary series of tests m.ade to
determine the effect of fastener material on joint efficiencr.r, two fastener
·~aterials were used. For one group of 3 tests, the fasteners were machined
from semi-killed rivets., In the second group, the fasteners were machined
from high tensile strength belts s> meeting the requirements of ASTM Designa-
tion A325-49T, uQuenched and Tempered Steel Bolts and Studs.,rT Standard
Oo505-in. diameter coupons were machined from the same iots of material as
the fasteners.
The fasteners for the main program were made from 3/8-in. diameter
cold-rolled rodo Sample lengths of this rod yere tested Yithout ~ reduction
of diameter of the rod before testing., The O~2 per cent offset method was
used to determine the reported yield strength.


6 (> DESCRIPTION OF EQDm1ENT
Aside from· the equipment used as a matter of routine in the testing
laboratory9 several pieces of special equipment were necessary for the conduct
of this test program. The pull plates and pull heads have already been described
to some extent in an earlier section. The arrangement for applying the load to
the joint was devised to insure uniform and concentric loading with a minimum.
of time required for assembly of the specimen in the testing machine C) There
was a d~f'ini te saving of material achieved by use of this pulling arrangement
since the "Tn shaped pull plates were used over and over againo
o Since the $longations of the fasteners caused by the tensions used in
this program were too small to be measured by the bolt eriensometers on hand
at the laboratory9 a special bolt extensometer was built to mp.et the needo
This extensometer9 shown in Figo 79 is capable of measuring the elongation of
the fasteners accurately enough to allow the determination of-the fastener
tension ~thin 5 per cent of the 309 000 psi used for the main programo
A means of obtaining the mean slip of the joint at the first transverse
ro'w of :fasteners was requiredo This was attained by mounting 3 mechanical micro ....
meter dials on a bracket which was attached to the side plates of the joint by
means o:f IX'inted set screws 0 This arrangement mounted on a joint ready for
testing is shown in Figo 3bo The mean slip and the differential slip of the
two edges of the joint were obtained from this device.
To determine the total deformation (or elongation) of the joints9 a
simple arrangement of 2 mechanical micrometer dials was usedo The dials were
attached to one end of 3/8~ino diameter steel rods; the other ends of the rods
"Were clamped to opposite edges of the upper tTTfT shaped pull plates 0 The
plungers of the dials rested against the lower pull head as shown in Figo 3bo


7 • DESCRIPl'ION OF" TEST PROCEDURE
The test procedure on all tests of this program was essentially the
same and only the general procedure will be described."
After the "joints had been yelded to the pull plates, the points where
the slip dial brackets were to be attached were laid out and center punchedo
No soldered lugs or tapped holes were required to mount these brackets since
they were supported only by pointed set screws placed in the center punch
marks on the splice and center plates at the center line of tne first trans-
verse row of fastenersg
After the joints had been plaeed in the testing machine and carefully
aligned, a load of from 1,000 to 2,000 lb was applied" The slip dials and
total deformation dials were then attached and the first readings taken"
Further readings of these dials were recorded as the load was slowly applied
in increments. The increment of load between readings was chosen so that
between 15 and 20 measurements of slip were obtained. The slip and total
deformation measuring devices were removed from the specimen some 109 000 or
15~OOO Ibo before maximum load was reached~
During the process of loading both local yield and general yield loads
were noted and recorded. Local yield load was defined as that load at which
yield lines on the center plate began to project from under the splice plates
of the joint" The load at which general flaking of the mill seale over the
entire gross ~dth of the center plate occurred was taken as the general yield
load. A drop off in load usually accompanied this general flaking of the mill
scale, even though a constant rate of strain 'tvas maintainedo The load just
prior to the load drop off was recorded as the general yield loado
Finally the maximum load attained and the nature of the failure were
recorded as the joint was loaded to failureo


IIIo RESULTS OF TESTS
8. GENERAL REMARKS
The test program carried out in this investigation gave results which
were generally quite satisfactorya The difference of test efficiencies
found for identical joints was never greater than 4aO per cent and the aver
age difference was 103 per cento In the case of joint PI where 6 identical
joints were tested 9 the marlmtml difference between any 2 of the 6 test
efficiencies ~s 201 per cento
It was the intent of the original planning that no fastener failures
should occuro Ina vast majority of the tests this expectation was fulfilledo
Only 5 joints failed by shearing of the fasteners a The cause of these shear
failures will be discussed wen the particular test series is describedo
In only one instance did the weldment connecting the joint to the pull
plate fail before complete fracture at the joint occurreda Even in this case9
the fracture at the joint had started when the 'W'eldment suddenly failedo The
particular weldment involved was weak because insufficient gap ~s left
between the joint and pull plate at the time the welding was doneo
The fractured surfaces of the joints showed that all failures yere of
the ductile or shear type for the full extent of the fracture areae


9. RELATIONSHIP B~ LOAD AND DEFORMATION
... '- Since the primary objective of the present investigation was to find
the ultimate strength eharacteristics of joints which had plate £ailures,
the data obtained regarding slip and total deformation of the joints has
not been studied erlensi vely and only a brief discussion of the results "Will
be given here 0
It was also recognized that certain differences in the actions of the
joints of the present program and true riveted joints would prohibit the
extension of the conclusions reached to joints that are actual~ rivetedo
The load-slip relationships found are not in complete agreement with
those found by other investigators for two reasonso First, the shearing
deformation characteristics of the cold-rolled rod used for fasteners are
different from those of mild steel rivetso Secondly, the fasteners fitted
the holes so tightly that hardly any slip was necessary to bring the fasten~
ers into bearing against the plateso
Figures 8 and 9 show the load-slip and load-total deformation
relationships measured for two selected series of tests.o The term "slip"
is used to define the movement between the center plate and the splice plates
of the butt joint at the first transverse row of rivets. It is the summation
of deformations resulting from several types of action occurring within the
joint (shearing deformation of fasteners, compression deformation of the
plates under the pres~~e from the fasteners, tensile deformation of plates
where subjected to tension~ and the true slip of the joint)o "Total deforma-
tion" is a term which defines the measurement made of the movement between
the top pull plate and the lower pull head of the test assembly, (See Figo 3b).

The measurement gives a good approximation of the total elongation of the
joint between the pull-plateso-
The series o£ three specimens shown in Figo 8 have stagger as a -
variable 0 Joints VIA, V5B and V4A have relative staggers 9 (stagger divided
py gage) of 0 9 005 and 1017 9 respective1yo No significant difference is
noted between the relationships shown on this graph~
The load-deformation relationsbips for a test series ~here pitch is
,varied from joint to joint are show. on Fig" 90 The three joints studied
are ·P3A9 Q2A and Q3A and have relative pitches (pitch divided by hole
diameter) of 49 5033 and 8 9 respeetive1yo In this series both the load-
slip relationships and the load-total deformation relationships are virtually
identical for all three jointso
100 ANALYSIS OF RESULTS
ao Scale Effect
It was necessary at the outset of the present program to determine
if the test results obtained from small size joints were applicable to
larger joints if the two sizes of joints were geometrically similaro A
preliminary test series known as t.he scale effect series was planned to
answer this question" The joints were of such dimensions that they repre=
sented a full size joint9 a 2/3 scale joint and a 1/3 scale jointo The
dimensions and details for the series (Joints SE1 9 SE2 and SE3) are given on
Fig" 19a
The test results (Table 2) shoy that the efficiencies for the 3
sizes of joints are in complete agreement when the scatter of test results


20.
is taken into consideration. The average test efficiencies found were 8106',
$2.4, and 82.3 per cent respectively .for the £nll size, 2/3 size, and 1/3
size specimens. The mode of fracture for all sizes of joints was identical
as is shown in Fig. 10 by the photograph of the center plates after failureo
b. Fastener Material Effect
In order to determine the effect of varying the fastener material on
efficiency of joints which undergo plate failures, a series of preliminar.y
tests were conducted. The tWQ materials chosen for the fasteners in this
series were machined from semi-killed steel rivets and high strength boltso
The mechanical properties of the tvo materials are given in Table 4. The
'joints which had fasteners machined from the high strength bolts (FMl) had
an average test efficiency of 9207 per cent, while those with fasteners
machined from semi-killed steel rivets (FM2) had an average test efficiency
of 91.3 per cent. On the basis of these tests, it was assumed that the
fastener material has no great effect on joint efficiencY if the joint fails
in the plateo
Since the effect of the fastener material on efficiene.y was found to
be negligible, the choice of a fastener material for the main test program
~s made on the basis of ease of manufacture and strengtho The 3/8-ino cold
rolled steel rod vas chosen because it required no machining to obtain the
desired diameter within close tolerance and was strong enough to allow appli
cation of axial tension in the order of 45~OOO psi on the gross section
without yielding in the threaded sections of the fastener~


Co Fastener Tension Effect
The· -effect of fastener tension on joint efficiency was studied in
the n!An sar-Ieso The details ··of these joints are given on Figo la and the
fastener tensions used are tabulated in Table lei Joints AAl9 J.A3 and AA'3
were assembled Yith uniform fastener tension patterns having fastener tensions
of 409 °00 9 30 9 000 and 0 psi on the gross area 9 respectively 0 The test effi
ciencies of these specimens are shown on the graph in Figa 110 The tests
show that increasing the fastener tension from 0 to 40 9 000 psi on the gross
area caused a reduction of about 2 per cent in test efficiencyo
Joints AA49.AA5 and AA6 were fabricated with fastener tensions that
varied across or along the array of fastenerso Even though the variation
of test efficiency is not great among these 3 jointsg the trend here agrees
. very well with the trend shown by the uniform fastener tension tests discussed
above 0 Where the joints had high fastener tension in the back roys of fasten
ers (jointAA5)9 the tests showed efficiencies identical with those for
joints "With r..igh tension in all rows (joint AAl) 0 This should be the case
since the front rows of fasteners in joint AA1 must lose their tension as
the test progresses because the center plate reduces more in thiclG1ess in
this region than in the region of the back rOHSo The fasteners in the back
rows do not lose all of their initial tension and their clamping action has
some influence on the behavior of the joint at maximum loado The same
reasoning explains the fact that the joint \·Jith zero tension in the back
row (joint AA6) showed test efficiencies near those shown by the joints with
zero uniform fastener tension (joint AA3)o


22.
Joint AA4 had fastener tensions which varied across the Yidth of
the joint; -it gave-test efficiencies of the same order as those joints
having bigh fastener tension in the back rows (joints AA1 and AAS).
d. Stagger Effect
Several series of tests were carri~d out to investigate the effect
of staggering the fasteners of a joint~ The results of the test series
planned to study this question are in general agreement except for one
series. The series of tests, the results of which do not appear to be in
agreement with the other test results, is the "N" series (joints Nl, N2,
N3, and N4). These joints had three longitudinal lines of fasteners and
the center fastener in the first row was moved back into the joint to give
increasing values of stagger. The joints are detailed on Figo leo
In the npn series of tests (joints Nl, Pl,'P2 and P3)7 the joints
are similar to those for the "N" series except the center fastener in the
first roW' is moved forward away from the joint to give increasing values of
stagger. The test efficiencies given by the "ptt and "N" series are compared
in Fig. 12 where the test efficiency is plotted against a dimensionless
parameter, stagger divided by gage, which is denoted herein as S/Go Accord
ing to the present design specification joints Pl and N2 should have the
same efficien~; however, this is not the case for the joints tested even
though the mode of failure of the two ~~s identical~ The average test
efficiencies of joints H2 and N4, 87.1 per cent in both cases, are too high
to be in agreement with the other test re sul ts Q These high values may be
due to experimental scatter or there may be a logical explanation which has
not as yet become evident. The tests of joint C3 which is almost identical


23"
to N29 resulted in efficiencies that averaged 8207 per cento This value
is in complete agreement with the results of other tests in the stagger"
serieso
The mode of failure in ttNTt series of joints is sho1ID by the photo
graph in Fig ~ 130
The effect of staggering alternate fasteners in the first row of a
joint was given by the results of the nptt9 "V" and "ACYl series of tests "Which
"have 39 5 and 7 longitudinal lines of fasteners 9 respectivelyo These results
are plotted against the parameter~ S/G9 on the graph sho-wn in Figo 140 This
graph shows clearly that increasing stagger does increase the efficiency of
a jointo The upu and nv" series show that a small amount of stagger reduces
the test efficiency very slightlyo In the case of the tlvn series changing
the S/G value from 0 to 0033 caused the test efficiency to change from 8204
to 8108 per cento This change is so small that it may not be significant
since experimental scatter may account for this small variationo
It will be noted that average t.est efficiency for an S/G value of 0
is about 8105 per cent9 wt-...ile for values of S/G greater than 2/3 it is about
8700 per cento This ~ariation of about 505 per cent is small compared to a
change in efficiency of 15 per cent which is predicted for some of these
joints by the present AREA specifications for design of tension memberso
The modes of fracture of 3 series of tests 9 npu 9 "VTI and fiAcn series 9
are shown in Figo 15&
In order to compare the efficiencies of joints vhich had the fasteners
staggered in all transverse rows with joints in which only the first row ~s
staggered9 the try" series of joints was plannedo These joints are similar to
the nvn series except that all transverse ro"t-lS of fasteners are staggered
instead of only the first row as in the t1Vrr serieso


~n the test efficiencies of the "Y" and "V" series are compared as
they ~re in ,Fig. 16, no real variation in joint strength is noted. The mode
of failure for joints of the two series having comparable values of S/G
were identical as shown py Fig. 170
e. Transverse Spacing ~ffect
The effect of transverse spacing (or gage) of longitudinal lines' of
fasteners on efficien~ was investigated by the "AD" series. In this series
of tests the joint fastener pattern was rectangularo This means that there
was no stagger of fasteners and that the transverse edge distance was one-
half as large as the uniform interior spacing or gage 0 On the graph shown
in Fig. 18 the efficiencies of these tests are plotted against the dimension
less parameter, (G/D), gage divided by hole diameter. In order to extend
this graph to cover a larger range of G/n values, the results of certain
tests other than the nAD" series are usedo Joint JAl had a rectangular
pattern of fasteners the same as did the nAn" joiIl;ts and therefore was
included in the study 0 Joints P3, JAJ and JA5 had a staggered fastener
pattern, but the failure occurred across the forward row holes of these
joints. The forward row of fasteners on joint P3, JA3, and JA5 have uniform
gage and the inclusion of their test results with those for rectangular
pattern joints is justifiedo
As a matter of interest the efficiencies as predicted by the AREA
rule for net section are shown on the same graph (Figo 18)~ It will be
observed that the test efficiencies are greater than the AREA efficiency for
a range of G/n values up to 8 and are less than the AREA predicted values for
G/D values greater than 8. It is evident also, from the graph, that the test


efficiencies for all practical purposes reach a limiting value at a G/D of
about 80 FUrther increase in the G/D value does not appreciably incr"ease
the efficiencyo
Fig. 19 shows the center plates of the nADn series after failure~
As would be expected, the mode of failure is identical for all the jointso
f 0 Longitudinal Spacing Effect
In order to determine the effect, if any 9 of longitudinal spacing
(or pitch) of transverse rows on efficiencY9 the test results of joints P3 9
Q2 and Q3 were studied 0 The efficiencies for this series of tests are
plotted on the graph in Fig 0" ?l against the dimensionless parameter 9 pitch
divided by hole diameter9 herein referred to as p/Do The most important"
~esult of this series is the change in the mode of failure caused by the
variation of the pitcho This change can be seen from the photograph on
Figo 20 showing the center plates after failureo The joints P3 which had a
p/D value of 4 failed on a tr~nsverse line through the first hole in the
jointo This joint had an average test efficiency of 8904 per cento
When the pin value was increased to 5033 for jointQ29 the average
effiCiency changed only slightly to 8908 per cent9 but the mode of failure
changed completely from that shown by joint P30 During the testing of the
Q2 joints when ma~mum load had been attained and before final rupture of
the plate occurred9 the single fastener in the first row failed in double
shear 0 In the case of Q2B9 the center plate failed in the same manner as
the P3 joints9 through the hole in the first rowo Joint Q2A, however 9
failed through the second row of fastener holes after the forward fastener
had failed in shearo In the case of joints Q2 9 the fastener shear failures


26.
had no effect on joint efficiency since it was evident that the plate had
reached its maximum load carrying capacit.y before the fasteners shearedo
In joints Q3 where the P/D ratio was increased to 89 the failure of
the joint was rather abrupt~ The forward fastener failed in shear before
a definite ultimate load was noted~ Once the first fastener haq failed in
joint Q3A, the other fasteners followed in rapid ordero The action of
. joint Q3B ~s slightly different o When the load reached 849700 lb the
forward fastener failed in double shearo This shear failure was followed
by a drop of load and then a gradual increase in load to 83,000 Ib, at which
the plate failed across the second row of fasteners. The joint efficiencies
for test Q3Aand Q3B were 8902 and 8801 per cent, respectively.
Even though the series of tests on effect of pitch did not show any
real change of efficiena,y of the joint with pitch, the tests showed a great
change in mode of failure and thus indicated that larger pitches than those
investigated would surely result in more fastener shear f<?iluxes and.lower
efficiencies 0
go Effect of Method of Hole Manufacture
Although the primary object of this investigation was not to study
the effect of joint manufacture on joint efficiency, one joint (API) ~s
fabricated with punched holes so that a comparison might be made with a
similar joint (81) manufactured with drilled and reamed holes. The joints
with punched holes had an average efficiency of 73.6 per cent compared to an
average efficiency of 8201 per cent for joints with drilled and reamed holeso
Thus~ for the case studied, the punched hole joint was only 8903 per cent as
efficient as the drilled hole jointo


ho Effect of Number of Transverse Rows
The question of whether or not the number of transverse rovs affects
the efficien~ of a joint brought about the 2 series of tests. involving
this parametero Joints of 39 4 and 5 transverse rows of fasteners were
tested in.two widths 9 3 and 5 longitudinal lineso The joints in the 3 line
series were Rl9 R2 and R3a The 5 line s~ries ~s made up of joints Wl9 V4
and X20
The modes of failure for these series are sho-wn in Figo 230 In both
widths 9 the 3 row joint failed by shearing of the fasteners at an efficiencr,1
somewhat below that found for the other two joints of the series o ~ese
shear failures were not expected even though the shearing stress to tensile
stress ratio was over 0094 in both casesa It ~s incorrectly assumed that
the high strength of the cold rolled rod used for the fasteners would make
certain a tensile failure of the plate o
In an effort to explain the shear failures of joints R1 and Wl9
sample fasteners made from both cold-rolled rod and mild=steel rod were
tested in shear by means of a butt joint containing a single fastenera These
tests re·vealed tha t "While the cold=rolled rod did have a shearing strength
some 105 times as great as the mild steel rod~ the shearing deformation or
slip of the joint required to cause failure of the cold rolled rod was slightly
less than that required to cause the mild steel to fail in shearo Therefore 9 it
is believed that if all the fasteners in Joints Bl and Wl had been subject·ed to
the same. amount of shearing deformation the joints would have suffered a plate
failure 0 Of CourS6 9 uniform shearing deformation of the fasteners throughout
this joint can not exist 9 and in the cases here being considered, the fasteners
in the :first roW' were subj ect,ed to somewhat larger deformation than those


£asteners in the back rowso These forward fasteners then failed in shear 9
initiating a failure that spread immediately to all the fasteners in the
jointo
Because of the fastener failures in the 3 row joints, only the test
efficiencies of the 4 and 5 row joints can be compared to find the possible
effect of number of transverse rows ~ Such a study is made on the graph shown
in Figo 22, where the test efficiency is plotted against the number of trans-
verse rows for each of the two serieso In each case, an increase from 4 to 5
transverse rows resulted in an increase of about 1 per cent in test efficiency.
This small increase of efficiency is insignificant and the joints can be
assumed to have the same efficiency 0 Close examination of the photograph in
Fig. 23 will reveal that the plate around the fastehers in the last row of the
5 row joints never reached the yield stress even 'at points of high stress
concentration 0
io Effect of Joint Width
In order to evaluate the effect9 if anY9 of joint ~ddth on efficiencY9
joints having widths from 1 1/2 to 10 1/2-ino were included in this programo
For a basic transverse spacing of 4 times the hole diameter~ joints having
19 3, 49 5 and 7 longitudinal lines of fasteners were testedo
The results of 3, 5 and 7 line joints have been presented in one form
in Fig. 14 where the test efficiency was plotted against the S/G parametero
Each of the joint widths are represented by a line drawn through the average
test efficiency at each of several S/G values. This graph does not show a~
significant difference in the action of; the 3 joint widths studied 0
-(~


,The graph in Fig. 24 is another way in which the data can be . .
studiedo.Here 9 the efficien~ yaS plotted against the number of longitu
dinal lines for all joints having a constant G/n value. The various lines
drawn on this graph connect the average test efficiencies of joints having
a common S/G valueo Tbis plot reveals very little more than the one sho'WD.
on Fig 0:140 If arry trend exists at all,? it is the slight drop in efficiency
shown for all curves in going from a 5 to 7 longitudinal line jointo
Figure 25 shows the mode of fracture of the center p1.ates from joints
having 39 59" and 7 longitudinal lines of fasteners. The joints in Figo 25a
had small S/G values o Joints PIB and V2B had S/G values of 0033 while joint
AC2B had a value of 00500 All joints shown in Fig~ 25b had S/G values of
" 10170
jo 'Minimum Gage Effect
'The "STU series of tests ~ planned in order to study joints which
have no stagger9 but do have different gages across the failure sectiono
This series of tests which are detailed in Figo 1h had a maximum gage which
was held constant and a IDinimum gage which variedo The fixed maximum gage
had a G/D value of 8 and the minimum or variable gage had Gin values which
va,.-ied !'rom 2067 to 80 In this report9 an edge distance is considered as
one=half of a gagea Thus 9 an edge distance of 1/2-ino is one half of a gage
of one inch)) and if the hole diameter is 3/8-ino the GID value for the edge
strip is 2067 (3
One question that .,can be answered by the nST" series is "What effect
does the position of the minimum gage on the transverse failure section have
on joint efficien~?n In this series~ there are pairs of joints ybich have
the same minimum gage 9 but in one case9 the minimum gage is the edge distances


and in the other, the minimum gage occurs at the center of the joint. The
effect of Ednimum gage position can be seen from the following tabulation"
Spec. Min 0 G/D Max" G/D Ave" -Test-· Noo At Edge At ctrQ At Edge At Gtr. Efficiency
STl 2067 8.00 82.0 ST5 2.67 _8¢OO 79.5
ST2 3047 8,,00 85.5 ST6 3.47 8 0 00 83.8
ST3 5000 - 8,,00 88.1 ST7 5000 8 0 00 8606
This study shows that for the joints of this series which have the
minimum gage at the edge of the joint gave test efficiencies which are in
the order of 2 per cent greater than those joints where the minimum gage
occurs in center of the jointo
The fractured center plates of the "ST" series are shown on Figo 260
Figure 27 shows at closer view some of the joints of the "5T" series so that
one can see that the im tial fracture of these joints vas across the minimtml
gage 0 This is true regardless of whether the minimum gage is at the interior
or the edge of the jointo After specimen ST5A had reached its maximum load 9
it YES removed from the testing machine before complete rupture of the eenter
plate occurredo - The photograph of this center plate (Fig 0 27b) shows the
fracture extending completely across the minimum gage; even thOugh9 the metal
in the maximum gage has just begun to crack 0


The possibility that the minimum gage of a joint might be the factor
whioh controls the effieiencr,r of a joint9 was one of the main reasons for .. . -. -
the t1ST~ series being included in this investigationo It has been shown in
Fig Q 18 that for joints of rectangular fastener p8ttern9 the efficiency is
a funct:i.on of the parameter G/Do A portion of this experimental relationship
taken f'rom Fig '1 18 is reproduced on Fig-o 280 The test results of the n8TtY
serIes are plotted on the same grapho The test efficiencies are plotted
against the mi nimum GID of the joints 0 This method of plotting shows tha~ a
joint with variable values of GID across the failure section does not have an
efficiency equal the efficiency of a rectangular pattern joint with a G/D
value equal the minimum. G/D value of the joint in questiono
A method by wbich;the efficiency of the "STU type joint may be predicted
will be developed in later section of this report.,
ko Effect of Plate Thickness and Ductility
Three joints of identical fastener pattern having different thicknesses
of center plate were tested in the "S" series. Although plate thickness ~s
not expected to cause a variation in efficien~ it was deemed necessary to
make these few tests to check on the possibility a The center plate thickness
for joints S29 S19 and 83 were 1/4~ino9 5/l6-ino and 3/8-ino 9 respectively 0
The test efficiencies for the "S" series are plotted against the plate
thickness on the graph in Figo 290 The results do not show a trend with
plate thicknessa However 9 when the ductilities of the plat~s as represented
~ the reduction in area of the control coupons are studied 9 a definite
trend is noted with the change of center plates'1 This change of joint test
efficiency 'With change in plate ductility can be seen on the graph in Figo .30


320
where the test efficiency is plotted versus reduction in area of the control
coupons. Reduction in area of the failure section of control coupon in per
cent will be denoted herein py the s.y.mbol R"
The change in efficienc.y for the test results plotted in Figo 30 is not
more than 2~4 per cent but it will be shown later that larger Changes in
ductility ~ll eause much larger Changes in efficien~Q
1" Constant Number of Fasteners
The "JAil series "tilaS planned to investigate just how high an efficiency
could be attained for a j oint of a given width 0 In this series the number
of fasteners was held eonstant as the fastener pattern was changed from joint
to jointo The AREA predicted efficiencies varied from 75 to 9308 per center
The results of the tests on JAl9 JA3 and JA5 have already been used in
plotting the experimental relationship between efficien~ and relative gage
(G/D) shom! on Fig" 18" Joint JAl had a rectangular pattern; therefore, it
was considered as part of the nAD" serieso The first row of Iasteners across
which the £ailure occurred in joints JA3 and JAS had uniform gage and the test
efficiencies also fit the data of the rectangular pattern well~
Joints JA2 and J.A4 have the same G/D values in the first rOLf of fasteners"
In JA2 the minimum G/D value of 4 occurs at the edge while in JM this same
minimum G/D occurs at the center of the jointo These two joints showed the
same behavior as the "STU series in that the test efficiency is essentially
the same for the two joint designs regardless of the position of the minimum
gage 0
Joint JAS ~s an extreme effort to get the maximum efficiencr,y from the
joint having the width of the "JAn series 0 The joint had a G/D value of 16


a·<
. '.
'.
". ::.' .... ~
~:.~ 33.
on the transverse section at which failure occurred. Yet, the test efficien~
1185 essentially the same as that for JA3 where the G/D value was 8.
Two Modes of Fracture in Duplicate Joint
For most of the joints tested duplicate specimens exhibited identical
modes of fracture. One case 'Where this ws not true is shown in Fig. 310
Joint R2A failed on a transverse section through the forward fastener ho1e 9
but in joint R2B failure occurred on a diagonal between the single fastener
on the first row and the fastener nearest the edge on the second row. The
test efficiency of the two joints, however, are in very good agreement9
being 88.8 and 89.5 per cent for joints R2A and R2B, respectively.


IV. . RELATIVE GAGE METHOD 'OF 'PREDICTING EFFICIENCY
11 0 DEVELOPMENT OF THEORY
In this report a joint is eonsidered 'to have a rectangular fastener , ,
pattern when the fasteners are located at the node points of an imaginary'
rectangular irid on the plate and when the edge distance in the ~anSverse
direction'is one-hall of' the ~ansverse spacing of the longi tlldinaJ line of
fasteners.. The relative gage for suCh 'a joint is the transVerse distance
between iongi tudinal lines divided by the diameter of the holes in the first
transverse row of fasteners and is denoted by G/Da
A definite relationship betveen test efficiency and the parameter 9 G/D 9 :
has been shown to exist 'for the j oints with rectangular fastener ps'tterns for
the present programo The graphical representation of this relationship is
shown in Fig .. 18,. Similar curves can be drawn from the results of other
investigations 'Where the material used was' consistent in its 'mechanical
properties and the method of manufacture was held constanto
These experimentally determined relationships between efficien~ 'and
relative gage can 'be used to predict the efficien~ of additional joints of
rectangular pattern for' the same test 'program if desiredo For example 9 the
experimental curve shown on Figo 18 can be used to predict the efficiencies
of other joints that might have been testedo For instance 9 a joint having a
Gin value of 300 would have had a test efficiency of about 7507 per cent even
though its true net cross sectional area is only 6607 per cent of the gross
cross sectional area o


.36.
Since these efficiencr.y-G/D relationships exist for individual groups
of tests, there is the possibility that the rel&tionship might be expressed .
in 5uch 8 way that all test. results obey it regardless of the type of .a~rial
used, method of joint manufacture, or other variable~ which may effect the
efficiency of rectangular pattern joirits. If such an expression could be
developed, it would be .8 very simple matter to predict the efficiency of - .
joints with rectangular fastener pattern. A relationship which fills these ..;:,;
requirements has been developed and will be presented ina later sectiono
The efficienc.y of a rectangular pattern joint can be predicted .~
accurately, as has been shown above, if the efficiencr,y-G/D relationship is
known. The case of a joint having a fastener pattern which has no staggered
transverse rows, but which has variable gages across the width of the joint
is a common one and requires a method by which the efficiency m.ay be predicted.
In considering this problem of the joint with variable gages, the
question arises, "Can the relation~hips between efficiency and relative gage
found by tests of rectangular pattern joints be used to predict the efficiency
of joints ~th variable gages?" It so happens that they cano The efficiena,y
of joints with variable gages can be predicted quite accurate~ if the follow-
ing assumptions are acceptedo
. 1. Assume the joint is composed of a series of independent longitu-
dinal strips e The joint is divided into these strips by the
center lines of the rivets in the first row of fastenerso The
two transTerse edge distances combine to form one of these strips 0
2. Each longitudinal strip within the joint has a relative gage, G/D,
which is given by dividing ths width of the particular strip by "
the hole diam.eter. Ass1JJle that the efficiency of any longitudinal


370
strip may be found b.r so~ving the efficien~-G/D relationship
for the known value of G/Do
- 30 Assume that the efficiency of the joint is the weighted summa
tion of the efficiencies of all the longitudinal strips in the
joint 0
An example of the procedure for~redicting the efficiency of a
joint having a variable gage is as follows:
Joint STI of the present program which has a variable gage will be
analyzed by this method to find the joint efficien~Q
Step 10 STl is composed of two longitudinal stripso One strip
is formed by the two edge distances and is l=ino wideo
The second strip is the interior gage and is 3=ino
wide 0 The total width of the joint is 4 ino
Step 2" T..ae two strips have CjD values of 2067 and 8 Q By
referring to the experimental curve relating efficien~
and G/D for rectangular pattern joints of the present
program (Figo 18)9 one finds that the efficiencies of
these two strips are 7201 and 8705 per cent 9 respectivelyo
Step 30 The weighted summation of efficiencies may here be made
on the basis of width since the plate material is of
constant thickness o Where the joint is composed of longi
tudinal strips having variable thickness~ the summation
must be made on the basis of cross sectional areao Thus~
Predicted Efficiency = (t x 7201) + (t x 8!7 05) = 8307 per cent


38.
From Table 2 it will be seen that the average test efficiency for
joint STl was 82.0 per cent. The predicted efficien~ compares favorably
with the test effieienqro The test efficiency for the remainder of the
nST" series can also be predicted quite well by the above procedure 0
A method Whereby the efficiencies of joints having fasteners on
the first transverse row staggered will ~ow be developedo Experimental
data by which this problem can be studied is particularly scarceo The tests
of the present program give about the only reliable results on this phase of
the joint problemo But 9 eTen in this prograI!l9 the results are limited to a
series of joints having a basic fastener pattern with a constant G/D value
of 40
The test results given on Fig 0 14 could be used to determine a
relationship between efficien~ of a longitudinal strip of a joint and the
relative stagger9 the stagger divided by the gage 9 for the particular value
of G/Do A study of Fig. 14 and Figo 18 will show that when the relative
stagger, 8/G 9 was zero 9 the efficiencies represent the efficiencies of
rectangular pattern joints having G/D values of 40 Then, as the S/G para=
meter increases, the efficiencies increase until they attain a value comparable
to that shown by a rectangular pattern joint with a G/D value of 80 For the
particular joints studied in the present program 9 this change in efficiency
caused by varying from a zero stagger to a fully effective stagger was some-
where between 505 and 700 per cent9 depending on how one interprets the data o
Had a series of joints been tested with a basic fastener pattern
having a Gin value of 39 the change from zero stagger to a fully effective
stagger would have resulted in a change in test efficien~ from about 7506
per cent to about 8508 per cento Since 3 is the minimum practical G/D
value, this variation of 1002 per cent represents the m~~um probable change
.::

in efficiency that would be achieved by staggering alternating fasteners
in a transverse rowo
The present design specifications predict a change in efficiency
of 1205 per cent for the joints with a basic Gin value of 40 For the
joints ~th a basic GjD value of 39 the predicted change is 1607 per cento
Because there is insufficient test data available upon which a
correct expression for the effect of stagger can be based 9 particularly
at other values of relative gage than 49 an alternate method of handling
this problem is herein proposed" .The data plotted on Fig" 14 indicates
that all joints with a sjG value less than 2/3 have an average test effi
ciencyof about 82.5 per cent; whereas 9 joints with S/G values of 2/3 and
greater have test efficiencies in the order of 8700 per cent or greatero
Thus 9 if one assumes that joints having sjG values less than 2/3 behave as
if they have no stagger and those ~th sjG values of 2/3 or larger have
full effect of the stagger, the continuous function relating efficiencr,y and
the relative stagger is replaced qy a step function relating efficiency and
relative stagger. The two levels of the step function may be determined·
from the efficienc.y-G/D relationship of joints with rectangular fastener
patterns/)
For joints with a basic Gin value of 49 the above method of using
a step function for the relationship between efficiency and relative stagger.
~ll give values of efficiency for joints with sjG values just under 2/3
which are ·too conservative o For joints with S/G values 2/3 or more 9 the
predicted efficienC,1 will be about correct when the possible experimental
scatter is taken into considerationo


40.
In this report, because of the lack of a better means of predicting
the effect of stagger, the step function procedure discussed above will be
used. All joints with less than 2/3 as a value of S/G will be considered
to have no stagger 0 Those joints with S/G values of 2/3 or more will be
considered to have full benefit of the stagger.
On the basis of this assumption, the joints of the tTv n series will
be analyzed. Joints VI, V2, and V5 have S/G values less than 2/3; therefore 9
they are assumed to behave as if no stagger existso This being the case 9
the joints are of a rectangular fastener pattern and the predicted efficiency .~
can be taken directly from the efficiency-Gin curve on Figo 180 This curve :.
gives an efficiency of 8105 per cent for a G/D value of 4Q The average test
values for the joints are 8205, 8l08~ and 84~6 per cent, respectively, for
joints VI, V2 and V50
Joints V6, V7 and V4 have S/G values of 2/3 or more; therefore 9 they
are considered to receive full benefit of the stagger. If the staggering is
fully effective, these joints will have a failure section across the first
line of fasteners and the joint will be assumed to be made up of 2 longitu-
dina I stripso The strip formed by the two edge distances has a width of
2 1/4 in. and a G/D value of 120 The second strip is the interior gage of
3 in. and has a Gin value of 8. By using the weighted summation procedure
described earlier and the experimental curve on Fig. 18, the efficiency is
predicted as followsg
41 :x: 7t
8708 = 5207
1... x 8705 = 3500 7t -
Predicted efficienqy = 8707 per cent
...


Tne average test efficiencies of joints V49 V6 and V7 were 86079 8603 and
10_- ... :_.~~ .':."~"
A new method of predic~ing the efficiency of joints has been ·pres.ented.
The method works well in the analysis of the joints tested in the present
program. 9 and as will be shown later~ the method is applicable to all test
data studiedo" The method can beimprov~dwhen sufficient test data are ..:
available to warrant developing a more accurate expression for·the relation~·
shi p between efficiency and stagger 0 The primary requirement for the· use of
this method is the correct expression for the relationship between joint
efficienc.y and GID for rectangular pattern jointso
120 RELATIONSHIP BETWEEN EFFICIENCY AND BELATIVE GAGE
. As was pointed out in the preceding seetion9 the relationship between
efficienc.y and relative gage can be determined for a particular series of
tests of rectangular pattern joints where all the variables are held constant
exeept the relative gageo ~om this obserVation9 it can be said that the
efficiene,y of rectangular pattern joints of a particular material and method
of manufacture is expressed by the equationg
Efficiency = f (G!D)
A study of available test data shows that this expression varies
from investigation to investigation; thus 9 there must be other variables
besides relative gage vmaeh affeets the efficien~ of rectangular pattern
joints 0 The results of the present program and the reports of other inves+~-
gators show that other important variables are ductility of the material


being connected by the joint, method of making the holes and the bearing
stress-tensile stress ratio of the joint. Thus, an approximate equation
for efficiency of all rectangular pattern joints is:
Efficiency = f (G/D, R, M, BIT)
where G/D 2S relative gage, R is the reduction in area of the control
coupons at the fractured surface, M is a representation of the method of
hole manufacture, and BIT is the ratio of bearing stress to tensile stress
in the joint.
After a comprehensive study had been made of all test results, the
best expression for joints of rectangular pattern that could be determined
is as follows: h\~'J. ~f,l\ut of +hi~ -\.0 ~~ i8,~ Z ~
t:.G D2. Efficiency in per cent = (68 + ~D) (1 - -) KBH
G2
'With a maximum value of 87 00 per cent of KBH.
In equation (1),
K = 0082 + 0.0032 R, but cannot be greater than l~OO
R = reduction in area of standard control coupons
B = function of the bearing stress-tensile stress ratios less than 2, B = l~OO
H = function of the method of hole manufacture for drilled holes H = 1.00 for punched holes H = 0.862
(1)
That part of eq~ation (1) which is the coefficient of KBH represents
the relationship between efficiency and relative gage for joints with rectangn-
lar fastener patterns made from a material with a reduction in area of 57 per
cent or more, with the holes made by drilling or by a method equivalent to
drilling. In addition, the joints have bearing stress to tensile stress ratios
less than 2.000 The joints of the present program meet these conditionso


~e "K" in equation .(1) is thefaetor that ta~es the effect of
ductili ty of material in"tc> account.., The verifieation for this fa~tor mil
be presented in a later section..,
No attempt ~as been made in this investigation to establish an
expression for the factor B which would show the effect if the bearing
stress to tensile stress ratio on joint efficienQY9 beca~e of the small
ntmlber of tests of steel joints tdth high ratioso Never~heless, the study·
of available data definit~ly does shoy there is an effect when the ratio is
greater than 20000 This study will be presented in a later section..,
Because the coefficient of KBH in equation (1) is rather awkward
for rapid slide rule ··computati9n~ a more simple expression. is desirable 0-
...,. " ' :;." .
At the expense of having a slightly less accurate expression9 the following
form. for the relationship between efficiency and relative gage isgiven~
Effieiene,y in per cent = 1005 (100 _ 90D) KBH . G
but not greater than 8700 per cent ofKBHo
(2)
When G/D = 5025'1 the coefficient of KBH in equation ('ZJ is equal to
87 0 0 per cent so that for all greater values of G/D the efficiency of the .
joint is ~ .. O KBHo The factors 9 K9 Band H, in equation (2) are the same
as for equation (1)0
A comparison of predicted efficiencies for all joints by the various
methods available at the present time is not possible because of the variety
of ways joints with variable gage and variable stagger are treated by the
different methodso Hoyever 9 a comparison ean be made for ~ one series of
joints with rectangular fastener patterns with a given fastener diameter and


hole diameter, and which have given values of R, H, and B. Such a comparison
is made in Fig. 32 where the efficien~ for a series of rectangular pattern
joints having SiS-in. rivets driven in 1l/16-in. holes. The material of
this series is assumed to have a reduction in area of 57 per cent or more
and the bearing stress to tensile stress ratio is less .than 2~OO. The
efficiency of this joint is predicted Pi the modified AREA rule for net
.. ~.
section, the Wilson rule, and the relative gage method, using equation (1) .'~
for drilled holes and equation (2) for both drilled and punched holes~
Figure 32 shovs only partially the merits and shortcomings of the
various methods of predicting efficienqyo The AREA and Wilson rules fail ...\f'
to take ductility, method of hole manufacture, or the bearing stress to
tensile stress ratio into aecount~ and a combination of these factors will
cause these methods to predict efficiencies which are much too high. An
example here might be quite revealing. The joint to be analyzed has a rectan-
gular fastener pattern and is made of a steel with a R value of 26 per- cent
(such a lov value is possible for a steel meeting ASTM Designation A7-5OT).
The joint has punched holes and the bearing stress to tensile stress ratio
is 2.5. The joint in question has an efficien~ of 90 per cent as predicted
by the modified AREA rule a The true efficiency of this joint would be about
61 per cent, assuming a bearing stress to tensile stress ratio effect of B
equal 0.9 which is not severe when the evidence on this matter is examined.
The example given is admittedly an extreme case but not an impossible one.
A more likely case would be the same joint design with punched holes made
from a material for ~ch the R value is 40 per cent and a bearing stress-
tensile stress ratio less than 20000 In the latter case~ the actual test
efficiency would be in the order of 71 per centv


APPLICATION OF THE RELATIVE GAGE METHOD
The theory of joint action and the empirical efficienc.y relationship
for joints of rectangular pattern developed in Section II and 12 will be
combined in this section to predict the efficiency of several types of
joints 0 The more smple relationship bewe'en efficiency and relative gage,
aquation (2)9 will be used in this section and the remaining sections of
this report for the prediction of joint efficiency 0 The method will be
Teferred to as the relative gage methodo
Example 10 Find the predicted efficiency of a plate joint of the same pattern
as 81 of the present test programo The details of the joint are
on Figo 19o The holes are drilled and R for the plate is 30 per
cent 0
The procedure for determining the efficiency is as follows g
10 Observe that this joint has rectangular pattern 'With
G/D = It:- 3/8 = 4
20 Evaluate the K and H factors for equation (2)
K = 0 0 82 ? O~0032 x 30 = 00916 and
H = 1 0 00
307 Use equation (2) to find efficiency
( 90) 6 Efficiencr.y = 1005 100 - ~ 0091 x 1
= 7405 per cento

4. Determine the bearing stress to tensile stress ratio· by using
the efficiena.Y found in Step 3 to determine the effective tensile
area of the joint. If the ratio is less than 2.00, the efficiency
computed in Step 3 is the correct predicted efficiency. In case
the bearing stress to tensile stress ratio is greater than 2QOO
the efficienqy predicted in Step 3 should be reduced by a factor
reflecting the loss of efficiencr,y caused by such high ratios of
bearing to tensile stress. For this example, the bearing stress-
tensile stress ratio is less than 2.00 thus the predicted
efficiency is 7405 per cento
Note: This predicted value should not be compared to the test
efficiency of joint Sl since the plate used in Sl had a R value
of 5601 per cent.
\
Example 2. Find the efficiency of a joint the same as the one in Example 1
except that the holes are punched instead of drilled.
The procedure for determining the efficiency is as fo11o'l::s:
l. Observe that this joint has rectangular pattern vrlth Gin = 4
20 Evaluate K and H
K = 0082 + 000032 x 30 = 00916 and H = 0.862
3. Use equation (2) to find efficiency
90 EffiCiency = 1005 (100 - 7;) 00916 x 0.862 = 6403
4. Check the bearing stress to tensile stress ratioo It is less
than 2 0 0 so efficien~ equals 6403 per cent. .", . . ~..:


Example 3. Find the efficiencr.r of a plate joint of the same fastener
pattern as joint ST2 of the present program (Fig. lh) 0 The
holes are drilled in a plate having an R value of 57 per cent 0
The procedure for predicting the efficien~ is as fol1owsg
1. Observe that this joint might fail along one of 2 lines. One
possibility is straight across the joint at the fil"'st row of
fasteners. The second possibility is through the fasteners in
the first row and the center fastener in the second rowo
Since the S/G value for diagonal line failure possibility is
greater than 2/39 the failure is expected to occur straight
across the joint on the first row 0 This line has a variable
G/Do The joint is therefore considered to have two longitudinal
strips 0 One has a G/D value of 3 ~ 3/8 = 8 and the other value
of 103 ~ 3/8 = 30470 o
2. Evaluate the factors K and H
K= I H=l
3. Determine efficiency of the strips
The center strip efficiena.y is 8700 per cent since the G/D
value is greater than 5~25o
The edge strip efficien~ = 1005 .2L (100 - 3047)
= 7708 per cent
4. Weighted summation of the strip efficiencies is now madeo
.....L x 87 0 0 = 6007 4030 10~0 x 7708 = 2305 4030
Predicted Efficien~ = 8402 per cent


5 ~ Check the bearing stress to tensile stress ratio 0 In this
case it is less than 2.000 Thus, the efficiency is the same
as predicted in step 40
Example 4. Find the predicted efficiency for a plate joint having the
fastener pattern of joint V2-of the present program (See FigQ Ii).
The holes are drilled in a plate having a R value of 60 per cento
The procedure for predicting the efficienc.y is as follows:
l. Observe that the S/G value for this joint is less than 213 so
that it will be considered as having no stagger in which case
the joint has a rectangular pattern with a Gin value of 40
2. Evaluate values of K and H
K = 0082 + 000032 x 60 = 1 0 01
= more than 1 so that
K=l
H=l
3. Determine joint efficiency
Efficiency = 1005 (100 ... r) = 8104 per cent
4. Check the bearing stress to tensile stress ratioo In this case
the ratio is less than 2 and the efficien~ is equal that
calculated in Step 30
Example 50 Find the efficiency of a 14ft WF at 2r1 lb 1-1hich is used as a
tension membero The connection is made to the flanges of the
WF. The rivets are 1 ino in diameter and the 1 1/l6-ino diameter
of'·


holes are punched a The holes are ,placed in the ~ section 'on
a plane ,perpendicular ,to the 'length of the section with no
stagger 0 , Four holes are punched in e.ach flC!nge and the gages
, across the flanges are 3 ina 9 5 1/2 ino and 3 ina 9 leaving an
edge distance of 11/2ino Assume the section has, an R value
of 57 per cent or moreo
The procedure for predicting the efficiency is as follows:
1. Observe that the joint has variable gages, therefore 9 it must
be considered to be made up of several longitudinal stripso
These strips are as fol1owsg
(a) Two s'trips made up of the 4 edge distances on the flanges.
Width = 3 inc Thickness = 00688 ino
Gross sectional area of each strip =
G/D value = 3 ~ 1 1/16 = 2082
(b) Four strips from the four 3 inc gages on the flangeso
Width = 3 inc Thickness = 00688 ino
Cross sectional area of each strip = 3 x 00'688
= 2006" sqo ino
G/D value = 3 ; I 1/16 = 20'82
(0) ~wo strips from 5 1/2 ina gages on the flanges 0
Width = 5 1/2 ino Thickness = 00688 ino
Cross sectional area of each strip = 5 1/2 x 00688 = 3078 sqo ina
G/D value = 5 1/2 0 1 1/16 = 5018 0-


50.
(d) One strip from the web which has no holes.
Width = 12.624 ins. Thiclmess· = 0.420 ins.
Cross sectional area = l20624 x 0.420 = 5030 sq. in.
G/D value = CIO
. 2. Evaluate K and Ho
K = 1 0 00 because R = 57 per cent or more
H = 0.862 (punch~d holes)
3. Determine the efficiency dr various strips 0
Efficiency of t.b~ .3-ino mde strips 90 = 1.05(100 - 2082) 00862
= 6106 per cent
Efficiency of the 5 1/2-in. wide strips = 1005 (100 - 5 :~8) 00862
= 7408 per cent
Efficiency of the 12.624-ino wide strip = 75 00 per cent
4. Make a weighted summation of the efficiencies o The cross
sectional area must be used here to give proper weight to the
strips since the section had a variable thicknesso
(6 strips - 3-ino wide)
(2 strips - 5 1/2-in. wide) 2;:~~ x 7408 = 2204
(1 strip - 120624-ino Yide) 2~:~ x 7500 = 1508
Predicted Efficiency = 6802 per cent
rne actual net area of the section is 19~71 sqo ino The percentage
of net area when compared to gross area is 19071 ~ 25056 x 100 = 7701 per cent 0 o


~ .... " ~~ 510
The method of determining the efficiena,y of a tension connection
for a section with a variaole thickness, such as the case for Example 5
gi~en above, does not have experimental verification as no tests have been
made to determine the efficienc.y of such a connectiono The method is a
logical extension of the results obtained from tests of plate joints~


53.
v 0 COMPARISON OF TEST AND PREDICTED EFFICIENCIES
14 0 METHOD OF STUDY
The object of this Chapter is to examine the applicability of three
methods for predicting efficiency of joints which suffer plate tension
failures 0 The AREA 9 Wilson and relative gage methods are used to predict the
efficiency of approximately one thousand and twentyaafive join.ts tested by
various investlgatOrso The studiO presented will show the basis for the faetors
K9 Band H9 which appear in the relationship betVeen efficiency ~nd rel~tive
gage given in Seetion 120
The tests studied represent practically all tests reported in American
engineering literature since 1882~' In this study no tests of joints whlch
resulted in plate failures were omitted unless insufficient data were given
in the reports of the testso The tests cover a ~de range of p~ate materia19
methods of manufacture 9 types of fasteners and types of jointso
The AREA rule for net section vas used as presented in the AREA speGi~
rieations (3) with the exception that the actual hole diameter was used instead
of the nominal fastener diameter plus 1/8 ino This slight modificationtlas
necessary to insure consistent interpretation of test results for joints having
a wide range of fastener sizeo
The Wilson rule was used as presented in his discussion of the paper
by Davis~' Woodruff and Davis (1) for those joints having fastener diameters of
1/2 inote 1 1/4 ino For the half scale joints of the present program 9 the
definition of D was taken to be the nominal fastener diameter plus 1/16 ino
For the joints having very small hole diameters (00131 ino to 00256 ino)9 the
definitiOll of nDn was taken to be 10067 times the actual hole diametero


The relative gage method WES used as presented in Sections 12 and 13:'
The ~elationship between efficienc.y and relative gage as defined ~ equation
was used to determine the predicted efficfencfeso The predicted values of
efficiency reported in the tables of results have not been corrected for the
effect of high bearing stress to tensile stress ratios. When the joints had
bearing stress to tensile stress ratios over 2~'OO, the predicted efficiencies
in the tables are marked with an asterisko Results of joints marked in this
manner were not included in t~e various comparisons of design rulesa Some of
these test results are used,. however, to indicate the effect of p;gh bearing )
stress to tensile stress r~tios on joint efficien~G
'~"
In order to determine the appliea bili ty of the tr~ee methods of predict- ~
ing efficienc.y, a common method of plotting error for all three methods was
necessary. To do this, the relationship between efficienc.y and relative gage
for a series of j?ints with rectangular fastener patterns. having 7/8-ino rivets
and 15/16-in. holes vas determined by each of the three methods of predicting
efficienc.y. For the relative gage method~ the plate yas assumed to have' a
reduction in area of standard control coupons of 57 per cent~ The efficiency
relationship by the relative gage method was determined for both drilled and
punched holes. These four relationships form the standard upon which all test
results are related one to anothero The four standard relationships are as
follows:
1. Relative gage method for drilled holes 9
Efficien~ in per cent = 105 (1 - 009 DIG)
but not more than 87
2. Relative gage method for punched holes9
Efficiency in per cent = 105 (0 ~-862) (1 - 0" 9 D/ G)
but not more than 75


55.
3 • .AltE.l rule ~
Efficiency in per cent = 100 (1 - DIG)
4 • Wilson rule,
. : D+l/16D+l/16 Efficiency in per:, cent = 85 (1 - . G . .) (1 +, :. G )
As an example of how :these stan~ard relationships we~e used atyPical·
joint was studied as follo'W's:
A particular joint, "XU, 'Which does not have a rectangular fast'ener·
pattorn, but has an .AREA predicted efficiency of 75 per· cent, is said to be'
equivalent to a rectangular fastener pattern joint which has an .ABE.A predicted·
effio1oney of 75 ~r cent" Joint "X"· is said to have an ,"equivalent relative
gago", by the AREA rule, of 4, sinee'the rectangular .fastener pattern joint
to whioh it is equivalent has a relative gage of 4", In a like manner 9 the
nequi volent relative "'gage" of joint "X" may be· found for the other two methods~ :
used in the study. Only wen joint nx" meets the requirements of·· a standard
jOint will the three "equivalent relative gages" be equalo
The applicability of the three methods of predicting efficiene,y is
indiooted on Figs 0 34 to '37 0 In these graphs, the difference between test
eff101on~ and predieted efficien~ for each test of a joint with a bearing
ratio of 2.00 or less is plotted against its· equivalent relative gage for eaoh
of tho three methods of computing efficiency 0
The graphs show the manner in which the error of the predicted effi
ciencios vary with relative gage~ Figure 34 shows that the relative gage
method of predicting efficien~ has about the same spread of error over the
entire range of relative gageo This is not true of the results plotted for
the MiliA and Wilson rules on Figs ~ 36 and Y7 0 The.AREA rule shoW's a vide
scatter band which varies from a position above the zero variation axi~ for


low relative gages to one below the zero variation ~"ti.s for large relative
gages.
The plot of test results on Figo 35 for joints with punched holes
indicates the applicability of the relative gage method for joints with
punched holes. Many of the joints, the results of which are plotted on Figo
were subpunched and reamed but the amount of reaming was not specified in the
reports of these tests. The reaming of some of these subptmched holes 1.m.doubt- ._"
edly improved the efficiency of the joints concerned 0 This increase in ,...
efficiency over the efficiency of a ptmched hole joint accounts for much of'
the scatter on Fig. 35. It will be noted that the large variations on this .~
plot are positive variations indicating that many of the holes behaved like
drilled holes when the reaming was effectiveo Since no information on the
amount of reaming was available for these joints, it was necessary to place
their results among those for the punched hole jointso The number of tests
of joints for Yhich it was definitely noted that the holes were formed by
punching was very small in comparison to the number of tests of joints 'With
subpunched and reamed or drilled holeso
The accuracy of the three methods of predicting efficiency is indicated
in another wayan Fig. 380 The differences be~~een test efficien~ and the
predicted efficiencies vere studied for all tests (855 tests) of joints 1iLth
bearing stress to tensile stress ratios of 2 or less 9 and the number of tests
showing errors in predicted efficien~ in each of several error increments were
determined. The error increments used have 'Wid ths of 1 per cent 0 The vertical
ordinate of an error increment was determined by finding the percentage of the
total number of tests ~ch had errors falling within the particular error"


incremento The three graphs on Fig. 38 show that the relative 'gage method
is by far the best method of the three considered for predicting joint eifi~~ --'
cienCYQ . ". - ::.:".
The, study 6f error distribution for the three methods 'shows that th~' '~"
Dlean errors are +1007 91 col g 17 and ~lo39 for the relative gage 9 Wilson and'
.AREA methods~ respectiveiyo It is also shown that -50 per cent' 'oftbe':tests
fall within 'an error 'range 'of -Oo53-'to' -?207SPer cent9 ~g16 to +2'~-40 "'per'" '<,
cent and ... 5 c,'OO to +6 0'30 :Per cent for the 'relative gage 9 Wilson9 and AREA
methods, respectively., The 'number of tests in per cent bf the total nUm.b~!' -" ',,' ;',
of tests 'which have errors within the range of -405 to +405 are 86g8' per~ent9'
6504 per cent and 4001 per cent for the, relative gage~ Wilson9 and ABE.A methods 9
respectivelyo These figures indicate that the relative gage method of predic~
ing efficiency is slightly conservative 0' The sharp peak on the error' distribucz>
tion plot for the relative gage method indicates that the method is essentially
correct 0 The large error range on the posi tive side of the mean error for the
relative gage method is primarily due to the' joints with subp1m.ched and reamed
holes which were considered to be punched holes but actually behaved as drilled
holes 0
150 TESTS OF PRESENT PROGRAM
The various aspects of the present test program have already been
discussed at length in Chapter 1110 Only the comparison of the predicted and
test efficiencies will be covered here 0 The predicted and test efficiencies'
are given in Table 20


58.
The joints of the present program were so designed that the vast
majority of joints have relative gages of 4 and 8 or more. Those joints with
relative gages of 8 have predicted efficiencies by the AREA and relative gage
methods which are practically equal since it is near this value that the two
efficiencr,y curves cross on a plot of efficienc.yversus relative gage.
The differences between test and predicted efficiency by the three
methods vere determined for these one hundred and thirty tests and error distri-
bution graphs plotted as shown in Figo 39. These graphs show very well the
superiori~ of the relative gage method for predicting efficiencr,y of the
joints in this test program. It should be pointed out that because of the ~
large number of tests having a relative gage of 8, the AREA rule appears to -
be better than it really iso
The Wilson rule gives an error distribution graph which has a good
shape, b~t the mean error is large (4.92 per cent).
The variations between test and predicted efficien~ for the present
program are plotted on Figures 34 to 37 according to the equivalent relative
gages of the joints. It will be seen from these graphs that the present test
program results agree very well vIi th predicted values of the relative gage
method.
160 TESTS BY FEFFERMAN' AND L.ANGRAAR
Fefferman and Langhaar (9) reported tests on more than 240 joints made
of 24S-T aluminum. The joints covered a wide range Qf gages and had several
sizes of fastenerso The test results are of particular interest for 2 reasonsa


, .
Oi( 59.
~ \ Because of the low ductility of the 24S-T aluminum, the tests giv:e a good \
\ indication of the effect of duetili ty on. j oint efficiency. Se ~o~CiJy, the
test program included a large number of joints whieh had high bearing stress
to tensile stress ratios; therefore, the test results give an excellent
check on the effect of this variable &
The results of this program and the efficiencies predicted by the
three methods are given in Table 5. In order to conserve space in t~e tables
average test efficiencies are given for identical joints. The number of tests
averaged is given in column Ie of t:p.e table o Since the authors did not give ,- .'.
each joint design a distinct marking, it was necessary to indicate the table
number of the reference from which the data vas takeno
The quantity,. test efficiency divided by the relative gage predicted
efficiency wen K equals 1, is plotted' on the graph in Fig. 40 against the '
reduction in area of the standard control coupons. This type of plot should
show the effect, if any, of material ductility on joint efficiency. In order
to reduce the number of points that would need to be plotted, many of the
points on this graph represent the average of several tests o The numbers
appearing beside the plotted points indicate the number of tests averagedo
The results of one hundred and eighty-eight tests by Fefferman and Langhaar
for joints with bearing stress to tensile stress ratios of 2.00 or less are
represented by a single point at a reduction in area of" 2605 per cent 0 The
reductions in area for the plates used in these joints were not reported;
therefore, a typical value for the material had to be assumed on the basis
of other test results for the same alloy.
The graph on Figo 40 gives the verification of the expression for the
ductility factor, K, .given in Section l2~ It can be seen that the expression,
K = 0.82 + 0.0032R, is a good average representation of the test results


60.
presently available. A carefully planned research program aimed specifically
at th~q.ue8tion of effect of material ductility might change· the expression
slightly, but it is-believed thst the expression as given is adequateo
All.results listed in Table 5 are used in plotting the graph shown on
Fig. 42. The quotient of the test efficiency divided by the efficiency
predicted by the relative gage method assuming a B factor of 1.00 was plotted
against the. bearing stress to tensile stress ratio on this grapho ~ne tensile
stress used to determine the bearing stress to tensile stress ratio is based
on the effective net area fotmd by the relative gage method o Various series ~
of joints of the Fefferman and Langhaar test program wherein the bearing ratio
was a variable are indicated by the straight lines connecting the tests of
each series. The points plotted for the Fefferman and Langhaar program repre-
sent the average of the results of 2 or more testso
The results of other test programs, where joints having high bearing
stress to tensile stress ratios were tested, are also given on Fig. 410 The
results of these few steel joints appear to be in good agreement with the test
results of the-24S-T aluminum joints tested by Fefferman and Langhaaro
Figure 41 shows very definitely that bigh bearing stresses ~ll lower
the e.fficiency of joints which fail in plate tensiono Because of the small
number of steel joints which had drilled holes and high bearing stresses 9 it
was not deem.ed.wise to write an expression indicating the effect of the-
bearing stress to tensile stress.ratio until more data-are availableo
The presently available test results indicate, however 9 th~t for
bearing stre~s to tensile stress ratios of 2000 or less, the effect of the
ratio on erficie~~ is so small that it can be neglectedo Since the present
allovable bearing and tensile stresses for steel construction are such that


rgtio~ more than 2 0 00 are prohibited 9 there is no need for an expression
shouingthe bearing ratio effect for joints of steel at the present timeo ~
In addition to Figso 40 and 41, the results of the Fefferman and
Langhaar tests are plotted on Figs 0 34 9 36 and '37 0
170 TESTS BY MOISSEIFF 9 RARTMANN AND MOORE
The tests reported by Moisseiff 9 Hartmann and Moore (10) are very
limited in number and variation o£ fasteners pattern but they do cover a
wide range of plate material; therefore, they are of interesto The joints
of test program vere made from silicon stee19 carbon stee19 24S-T aluminum 9
17S-T aluminum, and 53S-T aluminumo The joints vere designed to fail in .3
ways; rivet shear, plate tension and plate bearingo The results of the tests
of the joints which failed in plate tension and bearing are given in Table 60
The results are used in plotting the graphs showing the effect of
materiai ductility and bearing stress to tensile stress ratio
(Figso 40 and 41). They are also used in plotting the graphs of Figo 349 36
and :J7 0
180 TESTS BY WATERTOWN ARSENAL
The annual reports (References 11 to 17) of the Watertown Arsenal to
the united States Congress for the fiscal years ending on June 30 of 18829
1883, 18859 18869 1887 9 1891 and 1896 include reports on the tests of many


62.
riveted joints. The results of these tests which had plate tension failures
are given in Tables 7 to 130 In a1l 9 three hundred and twenty-one joints
having plate failures were testedo The joints were made from both iron and
steel plates which had a wide range of ductility~ The joints had a range of
relative gages from 105 to over 9000
The results of the Watertown Arsenal tests were used in the graphs
on Figs. 35 to 410
190 TESTS BY GAYHART
The results of the tests reported by Gayhart (18) are given in
Table 14. The joints tested were made from plates of mild steel and high
strength steel. The author does not report the reductions in area of
coupons taken from the plates used 9 therefore 9 it was necessary to assume
values for this property of the plateso These assumed values are given in
Table 14.
The results of this test program agree well with the predicted effi-
ciencies given by the relative gage methodo The results were used in
plotting the graphs on Figs. 34~ .36 and '37 0 Each point plotted from this
test program represents the average results of three testso

20. TESTS BY DAVIS~ WOODRUFF AND DAVIS
The paper by Davis, Woodruff and Davis (1) has caused much discus.:..
sion on the question of joint efficiency. The results of their test
program for joints that >·failed in pl,ate tension are given in Table 150 In
reporting the results of_ their tests, the authors did not give the reductions
in area of the plat~ material used in the joints nor the exact method of
forming the holeso The method of hole manufacture was given as sUbpunchl.ng
and reaming with no indication as to how much reaming vas done, nor did they
report' whether the reaming was done before or after assembly of the jointso
.Any one, or ,a combination of these unreported factors could have caused the
ttseeminglyft low efficiencies of these' joints 0 For the purpose of the present
study, the reductions in area were assumed to be 57 per cent or more and the
holes were considered as punched holeso When these assumptions are mads 9 the
effi,ciencies predicted by the relative gage method agree quite well with the
test results. The results of these tests are plotted on Figso 35 9 36 and 370
21~ TESTS BY CAyeI, MDNSE AND WILSON
The first progress report to the Research Council on Riveted and
Bolted Structural Joints for Project II written by Cayci9 Munse and Wilson (2)
included the test results of joints tested at 120 degrees F9 -20 degrees Fa
and at room temperature C) The results of the tests made at room temperature
and at 120 degrees Fa are given in Table 160 It was reported that the holes
for these joints were formed by subpunching ,and reaming9 but the amount of ream
ing that was done before or after the assembly of the joint was not giveno


For purposes of computing the relative gage predicted efficiencr.y9
the holes were conSidered as punched. The predicted efficiencies found by
the relative gage method are in good agreement Yith most of the test resultso
Three of the joints showed efficiencies high enough to indicate that the
holes in these three joints were equivalent to drilled holeso
The results of the test program are plotted on Figs 0 35 9 36 and 37 0
220 TESTS BY BECKER, SINNAMON AND MUNSE
The tests reported by Becker 9 Sinnamon and Munse (19) were part of
the work sponsored by the Research Council on Riveted and Bolted Structural
Joints, Project I. The tests were planned to investigate the effect of the
bearing stress to tensile stress ratio on joint strengtho
The holes of these joints were described as subpunched and reamed.
or drilled. This description made the use of the relative gage method for
predicting efficiency' ratherdi!ficulto In order to be conservative 9 the '/' ...
holes were assumed to be· punched.. The test efficieneies of twenty-two of the
thir~-two joints tested agree with the relative gage predicted efficiencies .~
based on the punched hole assumptiono Two tests (joints 49-lA and B) gave ~
test efficiencies which are considerably below the predicted, but the relative
gage predicted efficien~ is nearer the test efficien~ than either of the
other predicted efficiencieso The other eight joints of the test program
had test efficiencies which were equivalent to efficiencies that would be
predicted by the relative gage method for joints with drilled holeso


65.
Because of the apparent inconsistency of the method in which the
holes of these joints were prepared, the results were not used in the study
of bearing stress to tensile stress ratio effect. They are .plotted9 never
theless, on the graphs on Figs. 35, 36 and '510
23~,. TESTS BY MASSARD, SINNAM:ON .AND MUNSE
The progress report to the Research Council on Riveted and Bolted
structural Joints witten by Massard, Sinnamon and Munse (20) gives the
results of tests of thirty-three joints 0 The test program was designed to
investigate the effect of bearing stress to tensile stress ratio on joint
efficiency.
The joints had subptmched and reamed holes but the amount of reaming
is not known. The jQints show consistently high test efficiencies; therefore 9
they vere considered to have holes ·made by~. a method equivalent to drilling 0
The test efficiencies agree with the predicted efficiencies by the relative
gage method for drilled holesG
The test results of this program were plotted on Fig. 41 to study
the effect of the bearing stress to tensile stress ratio on joint efficien~o
The results plotted on this graph show that the steel joints of this program
follow the same trend as sho'W!l by the 24S-T aluminUIrl joints tested by
Fefferman and Langhaar (9).
Results of this program are also used in the graphs on Figs. 349 36
and '37.


24. TESTS BY BERGENDOFF .AND SCHUTZ
A new series. of tests (the "5ln series) for Project I Qf the Research
Council on Riveted and Bolted Structural Joints are in the process of being
tested at the university of Illinois. The tests used herein have been
perfor.med by Bergendoff and Schutz (21). The test results of five joints of
this program were available for study as this was moi tten. These results are
given on Table 19.
The holes in the joints of this series of tests were made py subpunch-
.~.
.~
ing the holes at least 3/l6-in. smaller than the required diameter and reaming
to size. The joints had test efficiencies that are equivalent to efficiencies
that would be expected of joints ~th drilled holes; therefore, the method of
hole manufacture can be considered as equivalent to drilling.
The plate material used in the manufacture of these joints has a
wide range of ductility. The least ductile plate had a reduction in area of
25.S per cent and the most ductile had a value of 50~5 per cent. Because of
this variation in plate ductility, the test results will serve as a good check
on the K factor expression when the entire test program is completed. The
results of 3 tests are plotted on Fig. 40, and they show good agreement with_
the expression for ductility effect.
The results of the 5 tests are plotted on Fig. 41 where the effect of
the bearing stress to tensile stress ratio is studied. These 5 steel joints
give results which agree quite well with the tests of 24S-T aluminum joints 0
The test results are also plotted on Figo 34, 36 and 370


67.
25. TESTS ~ BARON AND LARSON 9 RESEARCH COUNCIL9 PROJECT V
The tests reported by Baron and Larson (22) in a progress report
to the Research Council on Riveted and Bolted Structural Joints 9 Pr9ject V9
were primarily fatigue tests but several control joints were tested to failure
by static loading. The results of these static tests are given in Table 200
The joints had holes ~ch were drilled and the test efficiencies
agree very well with the predicted efficiency by the relative gage method
for drilled holeso
The results of these tests are plotted on Figso 34, 36 and 370
260 TESTS BY BARON AND LARSON, RESEARCH COUNCIL~PROJECT VII
Project VII of the Research Council on Riveted and Bolted Structural
Joints is concerned with the effect of fastener pattern on the fatigue strength
of structural jointso In the progress report on the work of the project9
Baron and Larson (23) reported the static tests of several control jointso
The joints of this program had drilled holes 0 The test results are in
good agreement with the predicted efficiencies by the relative gage method for
most of the tests of this program as can be seen ~rom the values given in
Ta ble 21 and shown on Figs. 34, .36 and J7 0


68.
Z7 • TESTS BY HARRIS
In a thesis written in partial fulfillment of the requirements for
the degree of master of science in civil engineering, C. 00 Harris (24)
reported tests made of thirty riveted jointso Some of these joints had
holes made by punching and others had holes made by drilling 0
The results of these tests are plotted on Figs. 34, 35, 36 and 370
28. TESTS BY WILSON .AND THOMAS
In the Dbiversity of Illinois Engineering Exp€riment Station Bulletin
No. 302, Wilson and Thomas (25) report a series of fatigue tests of riveted
joints. Several joints were tested statically for control of the fatigue
tests. The results of these static tests are given in Table 230 These
res~ts were used in plotting the graphs on Figs. 349 36 and 370
29. TESTS BY WILSON ~ BRUCKN1i'-E AND NCCRACKIN
Wilson, Bruckner and McCrackin (26) reported the tests of riveted
joints made of low-alloy structural steel in University of Illinois Enginee=-ing Experiment Station Bulletin No. 3370 The joints were essentially of o~
fastener pattern. The plates used in this program had 3 different ductil..:. -:':'=5
and, therefore, give a good check on the effect of this factoro
The results are plotted on Figs. 34, 36, 37 and 40 0
~
~ ~
~a
.t ~~;:
'~.:.


~F:'-~- 69.
300 TESTS BY WILSON, MATHER AND HARRIS
Bulletin Noo 239 of the University of Illinois Engineering Experi
ment ~tation witten by Wilson, Mather and Harris (Z7) reports the tests of
riveted joints of ride plates. Most of the joints tested had high bearing
stress to tensile stress ratioss There were joints made with both drilled
and- punched holes. The ratio of hole diameter to plate thickness was about
2 for the joints having punched holes. This large value may account for
the high test efficiencies shown by the punched hole joints of this programo
It is quite obvious that the effect of punching the holes will become more
serious as the ratio of hole diameter to plate thickness becomes smallero
Only three tests of those reported in this Bulletin could be used
in the graphs of Figs. 35, 36 and 37. The remaining joints had bigh bearing
ratios or had gage holes drilled in the plates at the failure section such
that the interpretation of the results was difficult&
The results of the joints with drilled holes and with high bearing
ratios were plotted on the graph in Figo 41 where the bearing stress to tensile
stress ratio is studied8


'f 71.
VI.· " STIMMARY,· OF RESULTS AND CONCLUSIONS. ..-....
. . ',:
. 31. SUMMARY OF PRESENT. PROGRAM
The tests of' the half'· .scale si:roulated rive~ed joints of the present
program. appear to justif'y thefollowing .. concl-p,sions,: ...
/' 1. ,Te~ts of half-scale models ~f· s~ruqtural jqints. are representa-
tiveof tests of -prototype. joints. if-the model and;- pz,-~~type
are made from similar materials. If the materials have different
mechanical propert;ies,. these differenc~s: must be .ta~en into
account -when . the interpre,tation ismadBof the .~odeJresults"
~2. Fastener tension has but a very slight effect on joint efficien~.
A reduction in fastener tension. from 40,qoo psi . to, 0 psi on the
gross section of the fastener~ ,ca~s,ed an . increase of' about 2 per
cent in test efficiency.,
'. [/3. Variable f'astener tension across a fastener pattern has no notice-
able effect on efficienc.y. Three arrangements of fastener tensions
resulted in test efficiencie$ equivalent to thos~ shown·by uniform
fastener tension patterns.
/ : 4. The mechanical properties of the fastener material have no great
effect on the test efficiency of a joint which .suffers a tension
failure in the plates. For two fastener materials tested.having
a large diff'erence in mechanical properties the test efficiencies
varied 1.4 per cent.


72.
5. staggering alternate f8sten~rs in th~ first transverse row of
a joint increases the efficiency of 8 joint, For joints having
a gage of 4 times the hole diameter, the increase in efficiency
was about 7 per cent when the stagger was increased from zero to
1.17 times the gage. There is a value of stagger which will
give the maximum increase in efficiency; further increases ,in
stagger will not increase the efficiency, but will increa~e the
likelihood of fastener shear failures. For joints with a gage
of 4 times the hole diameter, the optimum stagger is approximately
4 times the hole diameter.
6., Joints with stagger in all transverse rows of fasteners behaved
in the same way as joints with stagger in only the first transverse
roW.
7. The transverse spacing (or gage) of longitudinal lines of fasteners
in a joint has a large effect on joint efficiency. Joints with a
uniform gage across their entire width, and no stagger in the first
row of fasteners, have efficiencies which vary according to the
relative gage (gage divided by hole diameter) of the joint 0 Joint
efficiency increases with increasing values of relative gage up
to values of about 8. Relative gages larger than 8 do not produce
a significant increase in efficiency. For the joints of the
present test program, the maximum joint efficiencies that could be
obtained consistently were about 87 to 89 per cent.
8. The longitudinal spacing (or pitch) of transverse rows of fasteners
has no great effect on joint efficiency as long as the failure
is a plate failure. The most important effect of increasing the
-~
~ ~~
~;,


E,""" ~:~, t-~
73.
pitch is the possibility of causing the joi:nt failure to change
from a plate failure to a fastener shear failure as the pitch
is increased. ,! _i
9. The efficiency of a joint is virtually independent of the . ,
number of longitudinal lines of fasteners for joints with up to
7 lines. The test results indicate that a 7 line joint may have
test efficiencies 1 or 2 per cent lower than those shown by a
comparable 5 line jointo
/10. Joint efficiency is not dependent on the number of transverse
rows of fasteners as long as there are enough fasteners in the
joint to pre'Vent fastener shear failure.
-ll~ The method of manufacturing the holes of a joint has a large
effect on joint efficiency. For the one joint design tested in
the present program, the punched hole joints were only 8903 per
cent as efficient as the drilled hole joints •
. 12. "W11en a joint has variable gages on the transverse failure section9
the position of the minimum gage on this section has no significant
sffect on effi~iency. Test efficiencies for joints with the rnini-
m~ gage at the edge of the joint were about 2 per cent greater
than those for joints with the minimum gage at the center of the
joint.
13. The efficiency of a joint is not controlled by the minimum. relative
gage, but by the weighted average relative gage.
14. The thicla1ess of the plates of a joint has no effect on efficiency
if the failure is a pl,ste tension failure.


•
15. The tests of the present program indicated that ductility of
the material has an important effect on joint efficiency.
The test program reported herein gave valuable information which led
to the conclusions listed above, but what may be more important is the fact
that these tests showed the way to the new concept of joint action presented
in Section 11. Wi thout the careful control and ?_ndependent study of the
variables which tr...:is program providec~, it may not have been possible to
discover the relative gage method of predicting joint efficiency.


320 FACTORS WHICH ,AFFECT JOINT EFFICIENCY .
The studies made of:·the results o:fthe present test program and of
several other test ·programs have :!hown that manv fac-bers hevean iD.:nuenee··
on the. efficiency of' riveted jOints· wl:l1ch have plate failures. Only four ~.
theeefactors affeat·the joint ~c4eIlD¥ ~ough to be considered of major
importance ~ 'thesra £*'1ll" domi:nant factors are fastener pattern, .methoa .of
holemanu.i'aetmwe, ductility· of the lnsterialfJ being conne"te:d and tlle ratio
of bearing stress to 'hensile stress of the joint~ Of these £aur faetorsp ----.-
o~ on~, the fastener pattern, is consida:r.;ted. in the present rules for design
ot tension members", Furthermore, this ~sentJ.y used expressionf xslating
efficiency and tastelt$r pattern, is· not ill agreement vi th the ;r-t!sul ts of
tests where fastener pattern is the ~ varU(bl.e.
The mOfSt important factor affecting the efficie~ t!!£ riveted or bc!lted - --" ---.- -_ ... --- - .. -"~
joiRts is the f'aetener patterno The study of re3ul ts shows that· the ··:pattern
can cause the efficiency to vary from virtually zero to values in the range
of' eJ7. to 90 per cent if the materi!Sl used has the proper characteristics 0 The
studies mane show that the spaaing of the fasteners in the first transverse
row is of majer im~aneeo There is a definite relation~hip between effim.ency
and relativf! ga~ (g!ge dirldsd by hole diamete~) of a jointQ The joInt
efticienc,1 varies f~ zero to a maximumvslue as the relative gage varies
frcm 1 t. approximate~ 80 3Qints having relative gages aver 8 do not show
significantly larger efficiencies than joints 1dth values of 8. Stagg~ring·
alternate fmsteners in the first transverse row of fasteners will increase
the efficiency of 2 joint if the st2gger is large enough and if the gage over
which the stagger ocaurs is less than 8 hole diameters o


The ~econd .oet iaportant Tari.ble affecting joint efficien~ ie the
Ilethod used in the manufacture of the holes of the joint. The two e:rlra.es
of the COlaonly used methode of forJlin: holse are drillin: and punching. It
has been sho'Wll by the studies made that punching the hole. of a joint can ..,~.
--~
cause the joint to be between 13 and 14 per cent less efficient than· it 'Would .~
is by subptmching and reaming. It is regrettable that most of the reports
on ~st programs using j oints with aubptmched and reamed holes do not rePort.
th~ amomlt of reaming done, nor do they report whether the reaming was done
before or after the joints were assembled. BeeaUBe of this lack of information,
it was impossible to determine what effect subpunching and reaming has on joint
erricienc,y, but it was noted that the efficien~ o~ such joints fal1 between
those found for joints with punched hole8 and for joints with drilled holeso
In one program where the holes were subpunched to a diametar 3/16 in. less
than the final diameters of 13/16-in. and 1 1/2-in., the joints b8haTed
exactly the same as if' the holes had been drilled.
still another important variable affecting joint efficiencr.y is the
ductility of the material being connec~do So far as 18 knO'Wn9 previous inves
tigations have not recognized the impor~nc. of this factor 0 The range of
ductilities found in the common struotur~l metals cau~e~ variations in rivQtad
joint efficiency in the order of 15 per canto The measure of ductility which
seems to be the most sensitive indicator of the effect on joint efficiency is
the reduction in area of standard control coupons of the Ilaterial ~ing
connected. cToints made from a .aterial with a reduction in area of only 10
per cent will h~ve efficiencies which are 2bout 15 per cent lower than the
same joints made frOll1 a material 'With a reduction in area of 57 per cent. Joints
made from material with reductions' in ~rea greater than 57 per cent do not 3how

I
any marked increase in efficien~ over the same joints made from material
,wi th 57 per cent reduction in area.
The fourth, and last, major, factor affecting efficiencr,y is the ratio
of bearing stress to' tensile stress of the jointQ This ratio is presently
limited by American specifications to 2000 or less. Some American specifica
tions limit the value to 10500 The data available for a study on this effect
are limited especially for joints made of steelo The data studied 9 however 9
are sufficient to indicate that the bearing stress to tensile stress ratio
has a large effect on joint efficiencr,ro
A joint with a bearing stress to tensile stress ratio of 205 may only
be 85 per cent 8S efficient as one with a ratio of 1.50, and one with a ratio
of 3Q5 may be only about 50 per cent as efficient as the joint with a ratio
of 10500
When the bearing stress to tensile stress ratios are 2~OO or less 9 the
effect of this factor on efficiency is small o The presently available test
results indicate that a joint with a bearing stress to tensile stress ratio
of 2000 will be between 0 and 5 per cent we~ker than a similar joint ~rlth a
ratio of 10500 The question as to whether this small reduction can be neglect
ed is yet to-be definitely decidedo For the purposes of this investigation9
jqints.with bearing stress to tensile stress ratios of 2 0 00 or less were
assumed to suffer no loss of strength due to this factoro
There are factors~ other than those given above, which affect joint
efficien~, but their influertce is so small that they do not warrant inclusion
in this section <) Further study may show that one or more of these other fa'ctors
are more important than is now apparen~o The study made herein on the appli
cability of the relative gage method of predicting efficiency, however~


78.
indicates that the four important variables affecting joint efficiency when
plate failures occur are fastener pattern, method of hole manufacture,
ductility to the materials connected, and the ratio of bearing stress to
tensile stress for the jointo
330 DESIGN RULES
Three methods have been used herein to predict the efficiency of one
thousand and twenty-five joints for which the test efficiencies are known and
which had plate failures. The first method used is based on the AREA specifi-
cations (3) provisions for net section of tension memberse A second method
is based on the Wilson rule for effective net width presented in the discussion
of the paper by Davis, Woodruff and Davis (1)0 The third method is a new
method developed herein, which is referred to as the relative gage methodo
The AREA specifications rule is representative of the method for
determining the net section of tension members used at the present time in
American structural engineering practiceo The Wilson rule is the best of
previously proposed design rules as far as agreement with test data is con-
eerned. The relative gage method developed herein is believed to be superior
to either of the above methodso
The presently used design rules for net section give poor predictions
of test efficiencies. Several interesting facts about these rules are as
foll01'[8:
1. The rules do not take into account the notching effect of closely
spaced fastener holes. They allow the prediction of very high
.~


• efficiencies in extI'~me ca,ses ,which are impossible to obtain under
any circumst~nceso '.'
2. The ~ules do ,not. tCike ... propE;3r account of the effect of the method
of hole forming on joint efficien~~
3. No recognition is made in the present specifications of the effect
of material ductility~
40 The specifi9ations do limit the.ratio of bearing stress to tensile
str.ess ~pdirectIY~,but the fact that this quantity has an influence
on efficiency of joints which suffer a plate tension failure is not
generally recognizedo
5. The presently, us~dclause.in the specifications for treatment of
joints having staggered fasteners is based on assumptions which
are unrealistico The clause is not, verified by any test resultso
The rule for effective net width proposed by W .. M .. Wilson in his
discussion of t...l:!.e paper by . Davis·, 'Woodruff , and Davis (1) gives better predict-
ed values of joint efficiency than any other previously proposed rules .for net . '
section of tension members.. The following facts about the rule are of interest 0
1.. The Wilson rule does take into account the notching effect of
closely spaced fastener holes and puts a limit on the efficiency
of a joint which is essentially correct for joints with drilled holes
made from a ductile mild steel ..
2.. The rule fails to provide for the difference in joint efficiencr,y
which the method of hole manufacture causes ..
3$ No provision is made for the effect of material ductility on
joint efficien~Q


80.
40 The provisions of the rule regarding the effect of staggAr give
predicted values of efficiencr,r which are in better agreement
with test results than those predicted by presently used speci-
fications.
50 The rule is overly conservative in the case of joints having a """,.
variable gage across the failure section. The joint efficiency
is assumed to be controlled by the weakest longitudinal strip
within the joint. This assumption has not been borne out by the
test results.
60 The rule makes no reference to the effect of bearing stress to
tensile stress ratio on joint efficiency where the joint fails in ----
plate tension.
The relative gage method of predicting joint efficiena,y provides a
means of accurately predicting joint efficiencies for any type of joint
made from any of the common structural materials. The method is such that it
may be improved as more test data become available on certain factors such as
the effect of bearing stress to tensile stress ratio. In the' form used in the
studies presented herein 9 the method is much more accurate than'either of the
other two methods considered. The method takes into account all four of th~
major factors influencing joint efficien~.
Because the relative gage method, as presented herein, enables one to
predict efficiencies with such a high degree of accura~, it is natural that
it should be asked 9 nean the relative gage method be expressed in clear,
concise specification provisions for the net section of a tension member?g"
As an indication of how the relative gage method might be written in specifi-
cation form 9 Section 19 of the AlSe Specification for the Design9 Fabrication


81 ..
and Erection of structural Steel Buildings9 Revised Febo 1946, has been revised
to read as follows:
. Section 19. GROSS AND NET SECTIONSo'
(a) Defini tions 0
The gross section of a member at any point shall be determined by summing the products of the thickness and the gross width of each element as measured normal to the axis of the member~ The effective net section shall be determined in accordance with paragraphs (c) to (g) of this sectiono
(b) Application.
unless otherwise specified, tension members shall be designed on the basis of effective net section. Columns shall be designed on the basis of gross section. Beams and girders shall be designed in accordance with Section 26 (a) o· .
In determining the net section across plug or slot welds the weld metal shall not be considered as adding to the net areao
(c) Effective Net Sectiono
In the case of a chain of holes extending across a part in a zigzag9 diagonal or straight line~ the effective net section of the part shall be the summation of the effective net sections of all the gage strips along the chain of holes. No chain of holes shall be considered which has a gage strip with a pitch of 2/3 or more of the gage of that stripo
The critical net section of the part is obtained from that chain which gives the least effective net sectiono
A gage strip is the portion of the part bounded by the longitudinal center lines of two successive holes in the chain of holes being investigatedo A transverse edge distance is considered as one half of a gage strip which has a gage twice the edge distanceo The effective net section of a gage strip is the product of the effective net width and thickness of the strip 0
The effective net width (E. No Wo) of a gage strip shall be dete~mined by the following equation:
Eo N. Wo = 1.05 (G - Oo9D) K H but not more than 0087 G K H


where
(d) Angles.
82.
D = Actual hole diameter. G = Transverse spacing (gage) of any two
successive holes .. K = 0.82 + 0.0032 R but not more than 1.00. R = Reduction in area of standard control
coupons in per cent. H =1.00 for drilled holeso H = 00862 for punched holes.
For angles, the gross width shall be the sum 9f the ~dths of the legs less the thickness. The gage for holes in opposite legs shall be the sum of the gages from back of angle less the thickness. .
(e) I, WF and H Sections and Channels.
These shapes shall be considered to be composed of 3 parts, 2 flanges and the web. The size of the flanges shall be taken as the given size co The web shall have a width equal the given section depth minus twice the flange thickness.
(f) Splice Memberse
For splice members, the thickness considered shall be only that part of the thickness of the member which has been developed by rivets or welds beyond the section consideredo
(g) Pin Holes ..
In pin connected tension members, other than forged eye-bars 9 the net section across the pin hole, transverse to the axis of the member 9 shall be not less than 135 per cent, and the net section beyond the pin hole, parallel with the axis of the member, not less than 90 per cent of the net section of the body of the member ..
In all pin-connected riveted members the net width across the pin hole, transverse to the axis of the member, shall not exceed 8 times the thickness of the member at the pin, unless lateral buckling is prevented ..
The above revision would provide a means of designing tension members
which agrees very well indeed with test results. The graphs on Fig" 38
indicate how much better this specification agrees with the test results than
does the present specifications used in the United stateso


The revised Section 19 as given above is believed to be clear and is
eas.y to use. It provides a design rule which is realistic and accurate.
There are several factors which must be taken into account before any
specification provision is adoptedo Only two of these factors, accuracr,y and
clarity, have been considered in writing the above suggested revisiono
Neither the economic consequences of suCh a revision nor the question of re
education of structural engineers in the new concept of riveted joint action
have been considered.
Even though there remain several important unanswered questions concern
ing the efficiency of riveted joints which fail in plate tension, it is
believed that the results of the present test program and the study made of
the results of several other test programs have answered some of the most
important questions in this fieldo


r",-':,, . - -
" 85 .
BIBLIOGRAPHY
1. Davis, R. E., Woodruff, G. B., and Davis, H. E., TTTension Tests of Large Riveted Joints, n Trans. ASCE Volo 105, p. 1193, 1940
2. Wilson, W. M., Munse, W. Ho'andCayci, M.A., trThe Effect of the Rivet Pattern on Static Strength of Riveted Joints Connecting Plates,"
-Unpublished Progress Report, Engineering Experiment Station9 lJiiiversity of Illinois, January, 1950 .
.3. American Railway Engineering Association, nSpecifications for Steel Railway Bridges for Spans not Exceeding 400 Feet in Length," 1946
4. American Association of State Highway Officials, "Standard Specifications for Highway Bridges, n 19499 Fifth Edition
5. American Institute of Steel Construction, nSteel Construction, n Fifth Edition, 1949
6. Cochrane, V. H., ttCalculating Net Section of Riveted Tension Members and Fix::i.ng Rivet Stagger, n "Engineering News Record, n Volo 66 April 23, 1908, po 465
7 • Smith, T. A., "Diagram for Net' Se ction of Riveted Tension Members 9 "
Engineering News Record, Vo1o 73, May 6~ 1915, po 89.3 - ,-
8. Cochrane, V. H., "Rules for Rivet Hole Deduction in Tension Members 9fi
Engineering News Record, Volo 80 9 November 16, 1922 . . -
9. Fefferman, R. L. and Langhaar, E~ --L., tfInves;tigations of 24S-T Riveted Tension Joints9" JIo of the Aeronautical Sciences, Vol 0 14, March 1947, po 133
100 Moisseiff, L. S., Hartman, Eo C. "and' Moore ~ R. Lo, Riveted and Pin Connected Joints of Steel and Aluminum Alloys, n Froc. ASCE 9
Vol. 69, January 19439 po 340
11. Watertown Arsenal, Mass", TfTests on the strength of structural Materials 9fT
Tests during fiscal year ending June 30, 1882
12. Watertown Arsenal, Mass 0, ftTests on the Strength of Structural Materials 91l
Tests during fiscal year ending June .30 9 188.3
13. Watertown Arsenal, Mass 09 "Tests on the Strength of Structural Materials 9 "
Tests during fiscal year ending June 30, 1885
14. Watertown Arsena1 9 Masso, "Tests on the Strength of Structural Materials 91t
Tests during fiscal year ending June 30 9 1886
It:: ..... J .. Watertown Arsena1 9 Mass O!J tlTests on the Strength of Structural Materials9 tr
Tests during fiscal year ending June .30 9 1887


17.
Watertown Arsenal, Mass., "Tests Tests during fiscal year
Watertown Arsenal, Mass., "Tests Tests during fiscal year
860
on the strength of structural Materials .~ .... , .",.
ending June 30 9 1891 .~."
on th~ Strength of· Structural Materia;s:! I ending June 309 1896"
18.. Gayhart, E. La, "An Investigation of the Behavior and lltimate strength .,~ of Riveted Joints Under Load~ TI Soc .. Naval Arch .. and Maro Engrs., Trans. Vol .. 34~ November 119 1926, po 55
190 Becker, W. K. 9 Sinnamon, G. Ko and Munse, vlo E"9 tIThe Effect of Bearing Pressure on the Static Strength of Riveted Joints9" Unpublished Progress Report, Engineering Experiment Station, University of Illinois, Jan~, 1951
200 Massard 9 J It Mo, Sinnamon Sl GoK .. and Muhse, Wo H" 9 tfThe Effect of" Bearing Pressure on the Static Strength of Riveted Joints 9 " Unpublished Progress Report9 Engineering Experiment Station9 university of Illinois, January, 1952
210 Bergendoff, R. C. and Schutz, F. Wo Jr., Unreported tests of the tt51H Series for Project I of the Research Council on Riveted and Bolted structural Joints, Engineering EXperiment Station9 Dbiver-sity of Illinois .
220 Baron 9 Frank9 and Larson, Eo W 09 Jr", TfResul ts of Static and Fatigue Tests of P~veted and Bolted Joints Having Different Lengths of Grip9" Northwestern University, January 29 1952
2.30 Baron, Frank, and Larson, Eo Wo 9 Jr. 9 TtThe Effect of Certain Rivet Patternl on Fatigue and Static Strengths of Joints 9 it Northwestern lim:ver-sitY9 February 19 1952
24. Harris, Co 00, "Effective Net Section of a Riveted JO-'int9 n Hasterus Thesis. Uhiversity of Illinois 9 1932
25 0 Wilson 9 W. M 0, and Thoma s 9 F" Po, uFa tigue Tests of Rl:veted Joints 9 !i
Bulletin 3029 Engineering Experiment Station 9 Ubiversity of Illinois, May 1936
260 Wilson, W. Mo, Bruckner 9 W" H0 9 and McCrackin 9 T" H0 9 Jro 9 HTests of Hiveted and Welded Joints of Low-Alloy structural Stee19 n Bulletin 2279 Engineering Experiment Station, university of Illinois 9
September 1942 c.o.
270 Wilson 9 Wo M.~ " Mather 9 James, and Harris 9 ~Q9 "Tests of Joints in Wide Plates 9 " Bulletin 239 9 Engineering Experiment Stations UniversitJ of Illinois 9 November 1931


I
APPENDIX I
TABLES

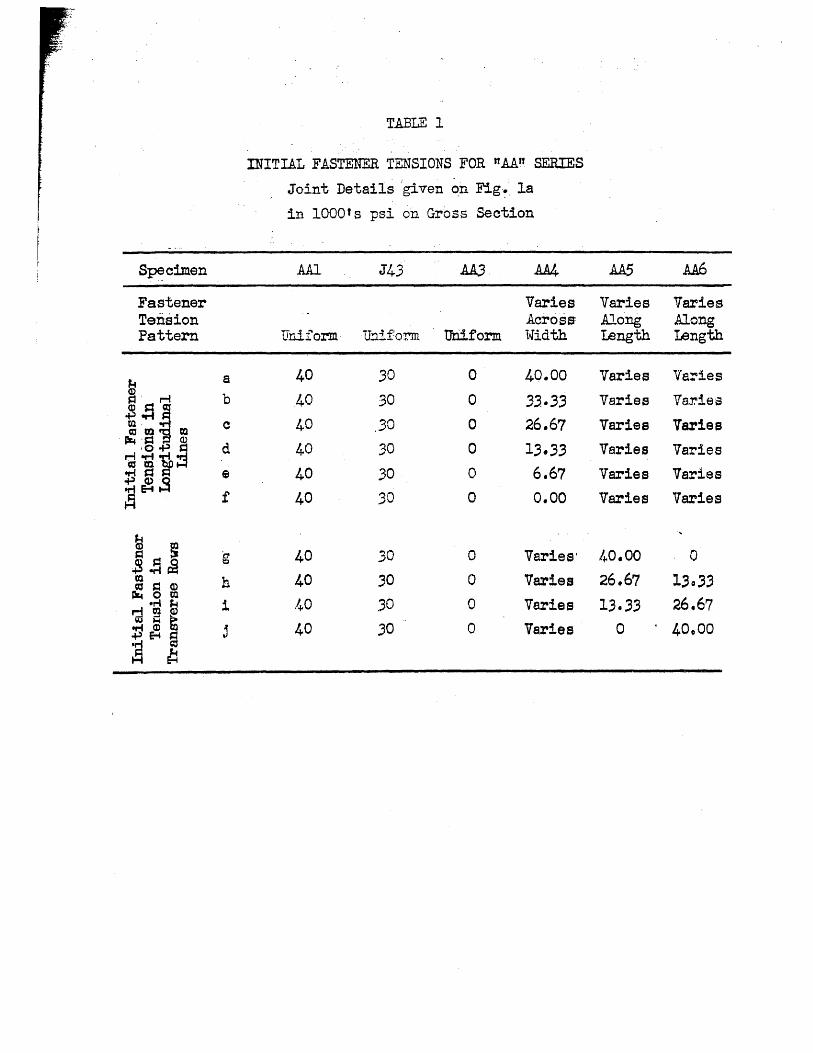
TABLE 1
INITIAL FASTENER TENSIONS FOR "AA" SERIES
Joint Details 'given ~n Fig. la
in 1000's psi on Gross Section
Specimen AAl J43 AM. AA5 .AA6
Fastener Varies Varies Varies Tension Across Along Along Pattern Uniform U!lifoT.'Dl uniform Width length length
~ a 40 30 0 40.00 Varies Ve:ries ~. r-i b .40 30 0 .33·.33 Varies Va1."ies
$;!~ til· e 40 ,3D 0 26.67 Varies Varies ~ al til . rx.. .= Q)
d 40 30 0 1.3 • .3.3 'OJ ~ i~ Varies Varies eMS= e 40 30 0 6.67 Varies Varies ~~.s £ 40 30 0 0.00 Varies Varies
fa $~I g 40 30 0 Varies' /400 .00 0 to h 40 .30 0 Varies 26.67 1;0;.3 ctJ ~ CD
P&4 0 til 1+0 .30 0 26.67 .r-t ~ 1 Varies 13 • .3.3
~ ~ ~ ~ ~ m 40 30 0 ~~ j Varies 0 40 0 00
~ ~


· ... ,,1.
TABLE 2
RESULTS OF PRESENT TEST PROGRAM
t . P;.. Effi,~~en? .. lee in ... Per ~at{t Spec. Fig. T: S:B Ratios Mat 1. S~r8ngth Gross, Max. Ave" N~. No. AltEA."· Relo Gag.e ~. kSl Area Load AREA WUs.o:o £tel. Test of
Max,. Min. Sq .In. kips. -Gag~ Tests
(1) (1a.) (2L (3) ~5a) (5b) ow orl 61 ~,. (7) (8) __ ?"O!l(91.. ,~(1.0J." {Ill· . (,121 AA1A 1a 1:0~74tl.21 1:0.73:1.27 65.64 64.83 1~980 111.80 87.5 83.2 er.o 87.1 AA1B la 1:0.7411.21 l;0~73:1.27 61.90 65.64 1.962 l09~90 87.5 83.2 87.0 85.3 86.2
AA3A AA3B
AA4A AA4B
AA5A AA5il
AA6A AA6B
ACIA AC1E
AC2A AC2B
AC3A AC3B
Ac4A Ac413
ADlA· AD1B
la la
la la
161 1&1.
la 1a
181. 1a
la lEI.
1a la
1a la
1b Ib
1:0 p 74,1 .. 27 1:0.73:1.27 ·64.83· 64.70 2 .. 016 115.00 87., 83.2 87-0 88.2 1:0.74t1.27 l=.0 .. 73:1.27 .64 .. 85 64.70 :L.99B liS·aGO 87,,5 83.2 B7.0· 89.0 B8.6
1:0.7421.27 1:0.74:1.27
1:0.74 11.21 1:0.741l,.21
1:0.74:1.27 1 : o. 74: 1" 27
1;0.73:1 .. 27 110~73:1.27
1!O.73:1,27 1:0 .. 73;1.21
1:0 .. 73:1.21 1:0.73:1.21
1;0.63:1009 ~:o.68:1~18 1~0.63:1~09 1~0.68!1~18
1:0.68:1.17 1:0068:1.18 1!0.68:1e17 1:0.68;1618
67.90 65.64
64.83-64.85
67.90 65086
65.64 64',,83
64.70 64.70
65.~ 64~75
67.28" 64.82 64.J3l 64. 70
67 .. 45 64,8:) 64,,8l 64.70
1:0.7,%1427 1:0.73:1027 67028 64082 1:0.73:1027 1:0.73~lq27 67~28 64082
1~0.75:1030 1:0~73:1~27 67~45 64~83 1:0075:1.30 1:0073:1~27 64~81 64.70
1.962 2.004 .
2#016 ~ .004-
1 .. 962 1 .. 94lf
109 ... 05 113.20
110.30 113.40
111_00 111 ... 10
87 .. 5 ~7 .. ' 87,,5 87.5
87.5 f37.5
3.378 ·175.92 15.0 :;.479 '178 .. 17 75.0
~f473 1B3.71 Bo.4 3.50i 190.25 Bo.4
83.2 83 .. 2
8,.2 83,,2
83.~ . 83,.~
77.8 17.f}
77.8 71.8
87.0 (37,,0
€7 .. 0 67.0.
. f)7 .. ·o ¥37 .. 0
.135.1 £7.1
84~6 87.5
e6.2 $8·3
81.4 80,3 81 .. 4 79.'2
B1 .. 4 ,81.6 81 ~4 84.0
3~419 186'-35 H7.1 Bl.G ·87.0 84.,1
86.1
86.0
8?~2
'19.7
S~8
~G401 192~53 ~7ql·· 8lp6 ·e7~0 B743 85.7
3ct440 195.93- 89.3 '8106 .87.0 87.9 '~482 192.79 89.3 81~6 87~0 e5~6 86.7
1:0.46:0.79 1:oQ51~0.87 1:0.46:0079 1~0.51:0~87
65.29 64.78 lo569 64.78 64.70 10582
78 .. 05 ·68,,4 79.10 68.4
7304 . 75.2 76.7 7304 7502 770·3· 77~O
..r.;.!- . t .. 1 j ... , .. ,.. ,J"h.d ...... ;(, ·>tl.,'dt, .... c.aiifwe' ~ ... ~.l..tt ......... ;.tJ •• ,i.", .·w.; .. .. L .• ><\i."".L..J" • .b.,.K.~ ~ Jl, .a, .i~,.,dJw.tI!.it·,;iU~;.,.;&.L !lot ,Mdl.Jii~


.' ow 1+1.1f11 ~.' '.1 . ~.'
Table 2 (cont'd)
(1) (la) (2) (3) ( 5a) (5b) (6) (7) (8) (9) (10). (11) (12)
AD2A Ib 1:0 .. 28:0.48 1:0.31:0·53 64.75 64.70 1.162 47.95 57·1 63.8 64.4 63.8 AD2B Ib 1 : 0 .. 28 : 0 . 48 1:0.31:0.53 66.73 65.56 1.161 48.50 57.1 63.8 64.4 63.7 63.8
AD3A Ib 1:0 .. 84:1045 1:0.89:1.54 67.40 65.15 2.424 135.68 81.3 80.4 .86.1 85.9 AD3B Ib 1:0 .. 84:1.45 1:0.89:1.54 65.00 64.70 2.483 132.96 81.3 80.4 86.1 82.8 8403
AEIA Ib 1:0 .. 63:1.09 1:0.68:1.18 65.22 65.00 0.498 25.70 75.0 77.8 81.4 79.4 AEIB Ib 1:0 .. 63:1.09 1:0.68:1.18 69.90 64.81 0.496 25.70 75.0 77.8 81.4 80.0 79·7
APIA Ib 1:0 .. 63:1.09 1:0.59:1.02 65.32 64.82 1.456 69.10 75.0 7708 70.1 73.2 APIB Ib 1:0 .. 63:1.09 1:0·59:1.02 65.32 65.56 1.421 69.00 75.0 77.8 70.1 '74.1 73.6
C3A Ie 1:0.73:1.26 1:0.77:1.34 61~. 96 64.75 1.499 79·90 76.8 77.8 81:4 8203 C3B Ie 1:0.73:1.26 1:0.77:1.34 65.70 65.68 1.486 81.00 76.8 77.8 81.4 83.0 82·7
C8A Ie 1:0·79:1.36 1:0.81:1.39 67.75 65.60 1.438 80.40 . 83.4 78.5 85~1 85.2 ~':' 1
C8B Ie 1:0.79:1.36 1:0.81:1.39 67.51 65.80 1.463 83.13 83.4 78.5 '85~1 86.3 85.8
FMIA Ie 1:0.63:1.09 1:0.63:1.08 63.97 63.39 1.890 110.20 87.5 83.2 87.0 91·.~
FMIB Ie 1:0063:1~09 1:0.63:1.08 63.97 63.39 1.896 110.30 87.5 83.2 87_0 91.4m FMIC Ie 1:0.63:1.09 1:0.63:1.08 63.97 63.39 1.896 112.55 87.5 83.2 87.0 91.lm 91.3
, ..
FM2A Ie 1:0.63:1009 1:0.63:1.08 63.97 63.39 1.899 112.55 87.5 8302 87.0 '93 ~ 1m FM2B le 1:0.63:1.09 1:0.63~1.08 63097 63.39 1.890 111.30 87.5 83.2 87.0 92.4ru FM2C Ie 1:0.63~1.09 1:0.63:1.08 63.97 63.39 :1.896 111·70 87.5 83.2 87.0 . 92. 5:n 92.7
JAIA Ib 1:0.63:1.09 1:0.68:1.18 65.48 64.77 ·1.986 ,104.60 75.0 77.8 81.4 . 81.3 JAIB Ib 1:0.63:1.09 1:0.68:1.18 67.75 65.49 '1·929 103.15 75.0 77.8 81.4 81.7 81.5
JA2A Id 1:0.74:1.27 1:0.72:1.24 65.64 64.83 2.007 108.10 87.5 7907· 85~6 83.1 JA2B Id 1:0.74~1.27 1:0.72:1.24 67·90 65.64 1.967 107.20 87.5 79·7 85.6 83.0 83.1
JA3A la 1:0·74:1.27 1:0.73:1.27 64.83 64.70 2.022 115·30 87·5 83.2 87.0 88.1 JA3B la 1:0074:1.27 1 : 0 0 73 : 1 . 27 . 64.85 64.70 20004 112.75 87.5 83.2 87.0 87 .. 0 87 q 6


Table 2 (oont1d) I (1 ) (la) ( 2) (3) (5a) (5b) (6) (7) (8) (9) (10) (11) (12)
JA4A Id 1:0.74:1 ... 27 1:0.72:1.24 65086 64.75 1·950 105.60 87.5 7907 85.6 83.6 JA4B Id 1:0~74cl.27 1:0.72:1.24 65.86 64.75 1.958 105080 87.5 79·7 85.6 83.5 83.6
JA5A Id 1:0.79:1036 1:0073:1.27 65.64 64.83 2.005 112.60 93.8 84.5 87.0 86.6 JA5B Id 1:0.79:1.36 1:0.73:1.27 64.83 64.70 2.024 116090 93.8' 84.5 87.0 89·3 88.0
MIA Ie 1:0.79:1.36 1:0.81:1.39 66.54 65.19 1.439 80.40 83.4 78.5 85.1 85.7 MIB Ie 1:0.79:1.36 1:0.81:1039 64.83 64.70 1.474 82.45 8304 78.5 85.1 86.5 86.1
NIA Ie 1:0·71:1.23 1:0.77:1.33 67.90 66.06 1.459 79.80 75.0 77.8 81.4 82.8 NIB Ie 1:0.71:1023 1:0.77:1.33 66.02 65.07 1.485 81.00 75.0 77.8 81.4 83.8 83.3
N2A Ie 1:0.73:1.26 1:0.77:1.33 64.75 64069 1.512 85.00 76.8 77.8 81,,4 , 86.9 N2B Ie 1:0.73:1.26 1:0.77:1033 65.07 64,74 1.504 84000 76.8 77.8 8104 87.3 87.1
N3A Ie 1:0.79:1036 1:0.81:1.39 67.90 66.06 1.454 83.50 83.3 78.5 85.1 8609 N3B Ie 1:0.79:1.36 1:0.81:1039 64.97 64.73 1.501 84.80 83.3 78.5 85.1 87.3 87·1
N4-A Ie 1:0.79:1.36 1:0981:1.39 64 .. 90 64.71 1.492 81.10 83.4 78.5 85.1 84.0 N4B Ie 1:0.79~1.36 1:0.81:1.39 66.70 65.42 1.465 81.50 83.4 78.5 85.1 85.0 84.5
PIA If 1:0.65:1.11 1~0.69:1018 65.60 64.87 1.469 79.40 76.8 77.8 81.4 83~3 PIB If 1:0.65~lo11 1:0.69:1.18 65051 64.90 1.475 78.90 76.8 77.8 81.4 8204 PIC If 1:0.65:1011 1:0.69:1018 67045 65.76 1.433 77000 7608 77.8 81.4 81.7 PID If 1:0.65:1.11 1:0.69:1.18 65.51 64.83 1.471 79·70 76.8 77.8 81.4 83.6 PIEl If 1:0.65:1.11 1:0.69:1.18 64.83 64.70 1.496 81.10 76.8 .77.8 81.4 83.8 PIF If 1:0.65:1.11 1:0.69:1.18 64075 64.70 1.503 81.40 76.8 77Q8 81.4 8307 83.1
P2A If 1:0072:1.26 1:0082:1.42 65.51 64092 1.470 82.10 86.8 84.2 87.0 86.0 P2B If 1 : 0 . 72 : 1. ~:'~6 1:0~82:1.42 66.82 65.32 1.429 81.30 86.8 84.2 87.0 87.1 86.6
P3A If 1:0·77:1.33 1:0082:1042 64085 64.70 10503 87030 91.7 84.2 87.0 89'.8 P)B If }:O.'7'7~1.33 1:0<82:1042 65.15 64.77 10483 85.50 91·7 8402 87.0 89.0 89.4
,"~ •. adi~ , ~:l",.L-.;i~:;S:~" *;.M' , •• ", ,~!" ":, . · ... .i:;,;,l .. i ;1: :~., .• 1 .. ,'" ~I_, J!:. : ,;C.l '.~ , .' ,; . ' {. l} .. ; I .. :' ,":.~! j:.~'( , ;
i: ,;:J ' .ll -~; Mti!!t:i~ilM'l' tMI:qg :;~ ~ 'ljVi'~~';:j~lJ~ 4 ~t~ ~l *;, ';!i.;4hi·tt~~ri:(~'·li'I'i i~jfi!:~: ,_ . I •• • . '.. . .~ I .,.' J •• ~' 'I -", 1<., 'f.: r .' ,.' .... :": i~. /.~.,., '. ',r '. ~~.~:,


~" Ta.ble 2 (Dant ,I d)
(1) (la) (2) (3) (5a) (5b) ( 6) (7) ( 8) (9) (10) (11) (12)
Q2A If 1:0.77:1.33 1:0.82:1.42 64.80 64.69 1~485 86.00 91·7 84.2 87.0 89·5r( Q2B If 1:0.77:1.33 1:0.82:1.42 65.12 64.70 1.465 85.50 91.7 84.2 8'"(_0 90.0r( 89.8
Q3A If 1:0.77:1.33 1:0.82:1.42 67.46 65.75 10456 85.35 91.7 84.2 87.0 89.2T} Q3B If 1:0.77:1.33 1:0.82:1.42 64.80 64.69 1.487 83.00 91·7 84.2 87.0 88.1p 88.6
RIA If 1:0·99:1·71 1:0.94:1.62 64.82 64.69 1.497 83.10 91·7 84.2 87.0 85.8T} RIB If 1:0·99:1·71 1:0.94:1.62 67.75 65.80 1.431 82.80 91.7 84.2 87.0 87.9T} 86.9
R2A If 1:0.69:1.20 1:0.66:1..14 64.78 64.70 1.511 86.80 91·7 84.2 87.0 88.8 R2B If 1 : 0 . 69 ~ 1 ~ '20 1:0.66:1.14 66~73 65.32 1.450 84.80 91·7 84.2 8T.q 89.'5 89.2'
R3A Ig 1:0.53:0·92 1:0.51:0.88 67.45 65.75 1.447 86.40 91.7 84 .. 2 87.0, 90.8 R3B 19 1:0.53:0·92 1:0.51:0.88 64.75 64.70 1.485 85.80 91·7 84'.2 87.0 89~3 90.1
SlA 19 1:0.63:1.09 1:0.68:1.18 651.76 64.96 1.483 79·00 75.0 77.8 81.4 82.0, SIB 19 1:0.63:1.09 1 :'0.68: 1. 18 64-.73 64.70 1.507 80.15 75.0 77'.8 81'~ 4, 82'.2 8-2~r
S2A Ig 1:0.51:1.09 1:0.55:1.18 49.00 48.68 1.124 45.30 75.0 77!,8 81,~4 82.8 ' '
S2B Ig 1:0.51:1.09 1:0.55:1.18 49·17 48.68 1.127' 46.30 75·0 77. 8 8~'.4 84.4 83'.6
S3A 19 1:0.76:1.09 1:0.82:1.18 6~).5,5 63.10 10702 88.80 75.0 77.8 81.4 82.7 S3B Ig 1:0076:1.09 1 : 0 . 82 : I'. 18 6t~ .13 63.66 1.',706 89.20 75.0 77.8' 81.4 82.1 82.4'
SEIA 19 1:0.63:1.09 1:0.68:1.18 65.73 65.67 6.651 353.00 75.0 77.8, 81.4 80.8T} SEIB 19 1:0.63:1.09 1: 0 . 68: 1. 18' 65.73 65.67 6.651 356.50 75.0 77.8 8104, 81.6, 81.2-
SE2A 19 1:0.63:1.09 1:0.68:1018 66.56 64.40 3.024 165.60 75.0 77.8 81.~ 83.6 SE2B 19 1:0.63:1.09 1:0.68:1.18 66.56 64.40 3.024 160.70 75.0 77.8 81.4, 8i~2 82.4
SE3A 19 1:0.63:1.09 1:0.68:1.18 63.69 63.78 0·732 38.20 75·0 77.8 81.4 ' ' 81.9 SE3B 19 1:0.63:1.09 1:0.68:1018 63.69 63.78 0.732 38.60 75.0 77.8 81.4 82~7' 82.3


Table 2 (cont'd)
(1) (la) (2) (3) (5a) (5b) ,( 6) (7 ) (8) (9 ) (10) (11) (12)
STlA Ih 1~0.68~1.18 1~0069~1.20 67027 65075 10269 68.40 8103 76.1 82.6 82.0 STlB Ih 1~Oo68~1.18 1~0069~1.20 65.53 64.85 1.298 68090 8103 76.1 82.6 8109 82.0
ST2A Ih 1~0075~lo25 1:0076~1031 64.94 64070 1.432 79·10 82.6 7803 84.2 85.4 ST2B Ih 1~0·75~1.25 1~0.76~1·31 66.03 65.03 1.414 78.60 8206 78.3 84.2 85.5 85.5
ST3A Ih 1~0.69~1.20 1~0·71~1.23 64·75 64.70 163.4 92.80 84·7 79·9 86.7 87.8 ST3B Ih 1~0.69~1.20 1~0·71~1.23 65035 64080 160.6 92.10 84·7 79·9 8607 88.5 88.1
ST4A Ih 1~0.80~1.39 1:0.80~1.38 65.03 64·70 19805 112000 87·5 83b2 87.0 87·2 sT4B Ih 1~0.80:1·39 1~0.80:1038 64.82 64.70 199.0 114.30 87.5 83.2 87.0 88.8 88.0
ST5A Ih 1~oo68~1.18 1~0.70~1020 64090 64070 132.0 68.00 81.3 7601 8206 7906 ST5B Ih l~oo68:1018 1:0070~1.20 64070 64070 13209 68.40 81·3 76.1 82.6 79·5 79.5
ST6A Ih 1~0075~1.29 1~0076~1031 65065 64095 10426 77015 82.6 7803 84.2 8303 sT6B Ih 1~0,75~1.29 1~0076~lo31 67.90 65095 10399 77.65 8206 7803 84.2 84.2 8308
ST7A lh 1~0.69~1.20 1~0071~.l.23 67052 65058 10565 89.50 8407 7909 8607 87.2 STTB Ih 1~0069~1.20 1~o.71~1023 64083 64070 1.634 91.20 8407 7909 86.7 8603 86.6
ST8A Ii 1~0069~1019 1~ 0 0 78.~ 1034 65.73 64.82 10936 105070 8900 7803 8405 8402 ST8B 1i 1~0069~1019 1~0078~1034 67090 65070 10925 110060 8900 7803 84.5 87·4 8508
V.lA Ii. 1~0063~1009 .l.~0068~1.18 64.93 64070 20476 131088 75·0 7708 8104 82.3 V.lB .1i. 1~0063~1009 1~0068~1018 67054 65017 20442 131068 7500 7708 81.4 8207 8205
V2A 1i. 1~0065~1012 .J .. ~ 0 0 69 ~ .1. 0 18 64092 64070 2c455 129027 7702 77.8 81.4 81.8 V2B :U. 1~0065~1..12 .l~Oo69~.l018 67016 65.02 20383 126066 7702 77.8 8104 8108 8108
v3A 1.i 1~0075~la31 .1.~0073~1027 67027 65.06 20388 1.32.86 8609 8204 8700 85.5 V3B 11 1~0075~1031 1~Oo73~lo27 65004 64070 20473 138029 8609 8204 8700 8604 8600
:i.!rii ,. I ,i>, :" .;iL .i. l:r ,jWj,


Table 2 (cont'd) "~ ·1, ..... -.: .
1 ' ••
(1) (:La) (2) (3) (5a) (5b ) (6) (7) (8) (9) (10) (11) (12)
V4A li 1:0.76:1.31 1~0·73:1.27 64.94 64.70 2.464 135.07 90.0 82.4 87.0 84.7 V4B li 1:0.76~1.31L 1:0.73~lo27 67.45 65.17 2.423 139.91 90.0 82.4 8700 88.7 86.7
V5A Ii 1~0.67~1.16 1~0.68~1.18 66.25 64085 2.471 138066 79·9 77.8 81 .. 4 ,86.5 V5B li 1:0067~1.16 1~0.68~1.18 67.45 65016 2.438 130·99 79·9 77.8 81.4 ;;82.4 84.6
V6A Ii 1:0.71:1.22 1:0·73:1.27 65.03 64·70 20519 140071 83·9 77.8 87·0 ,86·3 . V6B Ii 1:0·71:1.22 1~0.73:1.27 67.45 65.15 2.471 138.95 83·9 77.8 87.0 8603 86.3
V7A Ii 1~0.76~1.31 1~0·73~1.27 67.27 65005 2.427 143.42 90.0 8204' 87.0 90.8 V7B Ii 1:0076~1031 1~0·73:1.27 64.93 64.70 2.507 ' 141094 9000 82.4 87.0 ,8705 89.2
\
: 85 04Tj WlA 1j 1~0093~lo62 1~1.10:1090 67.27 65006 2.381 132024 90.0 ,8204 87.0 WlB 1j 1~0·93~1.62 1:1.10:1090 64094 64.70 20449 132.82 9000 82~4 87.0 :83 J~,n .84.6
X2A . . lj 1~Oo56~0.97 1:0.61~1005 67.27 65.06 20340 136099 9000 82.4 87.0 : 8807 . X2B Ij 1~0.56~0097 1~0.61:1.05 65.04 64.70 20462 137057 9000 82.4 87.0 86.4 . 87~5
, .
YlA Ij 1~0.66~1014 1~0.69~1.19 67.27 65006 2.411 13~·77 78.6 7708 81.4 ; 84.6 YlB lj 1~oo66~lo14 l~0~69:10J-9 65.04 64070 2.495 136.82 78.6 77.8 81·4 84.8 84.7
Y2A lj 1:0075~1~29 1~0075~1.29 64094 64070 2.456 133.63 86.9. 82.4 87.0 ,84.1 Y2B .lj 1:0075~1.29 1~0·75~1.29 67·45 65015 2.417 136.10 86·9' 82.4 87.0 :86.4 85.3
I'
Y3A lj 1~0.76~1.31 1~0.76~1.31 65.04 64·70 2.467 140.35 9000' 82.4 87~o ',87.9 Y3B Ij 1~0.76~1.31 1~0.76g1.31 67.45 65017 2.423 139041 90.0 8204 87~0 ;88.~ 88.1
NOTES:
(J.) Gross strength based on average coupon strength used to 'compute test efficiency
:n: Single fastener in: fi.rst row failed in shear just before ,plate failure
1) All fasteners failed in shear
p Single fastener in first row failed in shear just before plate failure, but all fasteners were near failure in shear


.-
TABLE 3
PROPERTIES OF CENTER PLATE ¥.i ... TERI.AL
Mill Report on 5/16" Center Plate for Main Test Program
Chemical Composition in per cent
c = 0.23 Mn = 0044
p = 0.013 S = O.Op
Mechanical Properties
Yield Strength = 39<;160 psi ID.timate Strength = 65~240 psi Elongation in 8 ina per cent = 30 Bends = OoK.,
MechanicalPro~rties of Failure Plates
Coupon Coupon Gage Yield mtimate Elongation 9 Reduction No. Width, Length Strength, Strength 9 per cent in Area 9
in. in. psi psi per cent (1) (2) (3) (4) (5) (6 ) (7 )
Plate for Main Test Pro~am
5/16" Plate
Total 49,280 69,420 4000 6406 of 1/2 2 to to to to 109 Coupons 38,410 63 9410 22 .. 6 4107 .
Average 439350 See 3501 5501 Fig., 5
4 4 1/2 8 389190 649 030 2703 4303 8 6 8 39,310 63 9820 3000 4205
12 4 1/2 8 42 9 557 65 9650 29.,3 4309 13 6 8 41,790 65 9460 2905 4107 27 10 1/2 8 40,660 63,670 490.3 28 7 1/2 8 40 9 200 639640 4801 29 7 1/2 8 419600 63 9 850 4806
1/4 lt Plate
3-1 1/2" 2" 49,320 35,,0 68.0 3-2 n n 37 ,800 48 9730 3500 7003 3-3 " TT 37 9360 48 9630 3605 6901 3-4 n " 38 9460 49 9 230 3705 6705
'~" ~~'-


TABLE 3, (co~tinued) .. ".':".:": .
- .
Coupon Coupon Gage Yield Ultimate Elongation 9 Reduction No. Width, Length strength 9 Strength, per cent in !::rea']
in •. ' in •. .psi. psi . per cent (1) (2) (3) -(4) . (5). . (6) (7)
3/g" Plate
1 ~ 1/2" - 2r~ 38,280 63,040 -400; .' ... -, -5900 2 " n 389800 62']900 .' _ 3905 58.7 3 n n ',36,200 63,640. .. -·-40.0 5603 -
4 " f( .36,7QO 64,260 3905 56~2 ~
5 n n 36,770 649190- 3$05 5506 -
.'
Plate for PreJ.im:ixiary Tests
Scale Effect Series
3/4 tf Pla~
1 1 1/2u 8" 369190 65 9730 30~1 .5206 2 rr n 35 9620 65 9 670 2909 51,,7
1/2ft Plate·
1 1 1/2" 8" 369790 66 9 560 2701 5007 2 1 1/2" 8" 33,440 649400 30,,3 5204
1/4" Plate
1 1 1/2" . gn 459410 6.3 9780 2908 5005 2 " " 459800 639690 2901 5105
Fastener Material Effect Tests
5/l6n plates
1 1 1/2" 8" 399620 63 9 390 3004 4707 2 rr It 399730 63 9 970 2808 46,,3 .3 n n 360750 62 9 900 2908 4707


Coupon No.
1
1
1
2
TABLE 4 MECHANICAL PROPERTIES OF FASTENER MATERIALS
Diameter of Coupon,
in.
Gage Yield mtimate Elongation, Length, Sprength, strength, per
in. psi psi 2
Fastener M8terial Effect Series
Coupon cut from Semi-Killed Rivet Stock
in. cent G.Lo
0.505 2 42,500 68,500 3700
Coupon cut from Hi-Tensile Strength Bolt
0.505 2 83,600 112,400 2400
0.'J742
0.3742
Main Test Program
3/8 in. Diam. Cold-Rolled Rod
2 70,450 84,730
2 68,180 819180
Reduction -in Area 9
per cent
56,,2
Shear test on single cold-rolled steel fastener showed shearing streng+b
ultimate 'Was 69.3 per cent of tensile strength ultimate.
-¢~
j -~~~1
···E 1


Me + be ," '.. .. . ,,' .', ' .' . " .. ' ...... 'd. '
ha .. fH",& ...... ~--"" at' rM: ttbti bn UMr _.,i:l:' 'H H ::1.7 4. L Il\'idilJlAiU;"liRl'%,il •• flli'ffi. ; I ....... ~" .. "\ " ..
~rn5 '
RESULTS OF TESTS BY FEFFERMAN AND LANGHAAR (9)
All holes ~ere drilled. Plate material Vias 24 S-T alumtnum. Reduction in area of coupons ~as assumed to be 25 percent.
Hef. No. T~S:B Ratios gfficiencies in Per Cent
Spec. Table Tests AREA Wilson Rel. Ave. No. No. Aug'd. AREA Rel. Gage
Gage of Tests
(1) (lb) (lc) (2) (3) {B ~ (9 ~ {10} {12l
1 to 3 I 6 1:0.26:1.21 1:0.25:1.18 69.7 7008 68~1 70.2 4 to 6 I 6 1~0.32:1.49 1:0·31:1.45 74.0 73·7 72.0 72·3 7 to 9 I 6 1~0.38~1·76 1:0·36:1.68 77·3 7507 73.9 72·7
10 to 12 I 6 1~0046:2.14 1~0~44:2.03 80.3 7706 76.2* 7003 1 II 2 1~0.14:1.21 1:0014:1.18 69.7 7008 68.:1 ' 70 1 3
2 II 2 1~0.26~1.21 1~0025:1.18 6907 70.8 68~1 71.2 3 II 2 1:0.52~1021 1:0.51:1.18 6907 70.8 68.1 69.9 4 II 2 1~0.17:1049 1~O.17:1.45 74.0 73·7 7qoO , 70.2 5 II 2 1~0·32~1.50 1~0.31:1.46 74.0 73·7 72.0 73·5 6 II 2 1:0.19~1.76 1~0018:1.68 7703 75 ·7 73·9 70.2
7 II 2 1~0.38:1.76 1:0.36:1068 77.3 75.7 73·9 73.3 1 III 2 1:0.22:1·93 1:0.22:1090 66.7 73·9 65.8 67.7 2 III 2 1:0.25:2.21 1:0.25:2.17 69.2 72.9 68.0* 70.3 3 III 2 1~0.28:2.47 1:0.27:2.42 71.4 72.8 70.0* 70.5 4 III r 1-~Oo33.2.96 1: 0 '.32: 2 088 75.0 78.8 73.0* 75.0 t::~
5 III 2 1:0.37~3.28 1:0.36:3.19 76.9 77.6 74.7* 74.2 6 III 2 1:0.41~3·61 1: 0 .38: 3 .45' 78.6 77·1 75·2* 72.0 7 III 2 1:0.26:1.21 1:0.25:1.18 69.7 70·9, 68.1 71.2 8 III 2 1:0.38:1.76 1:0.36:1.68 77·3 75,,7 73·9 73·3 9 III 2 1~Oo27:2044 ,1:0.26:2.35 73·3 70·9 70.7* 7006


Table 5 (eontVd)
~
(1) (lb) (Ie) (2) (3) (8) (9) (10) (12)
10 III 2 1:0·30:2·70 1:0028:2.54 75.8 71.5 71·3* 66.6 1 VI 2 l~0·53:2.07 1:0053:2.06 65.8 73.6 65.5* 55.2 2 VI 2 1~0.82:3016 l:D.80:3·09 74.4 78.6 72·7* 45.3 3 VI 2 1:1·33=5.12 1:1025:4.83 83.0 82.2 78.3* 36.0 4 VI 2 1:0.31:1.39 1~0.31~1.41 57.6 67.6 58,,5 54.4
5 VI 2 1:0.37:1.68 . 1:0.37:1.69 60.8 71.2 61.0 60.1 1 & 9 VII 3 Ig0~20~0·91 1:0.20:0·91 63.1 66.3 63·1 65.0 2 & 10 VII 3 t~0.26~1.19 1~0.26~1.17 6901 7009 68.1 71.1 3 & 11 VII 3 1:0.32:1048 1:0a30:1a45 73.6 73.6 72.0 73.9 4 & 12 VII 3 1~0.38:1.75 1:0.37:1~69 76.9 75.5 74.3 73.1 5 & 13 VIr 3 1:0.46:2012 1~0.44:2.02 80.0 77.5 76·3* 72.6 6& 14 VII 3 1~0.52~2.40 1:0.49:2.27 82.0 7806 77.6* . 69.1 7 & 15 VIr 3 1~0.58:2.71 1:0054~2o54 83.6 79.3 78.3* 64.8 8 & 16 VII 3 1:0.65:3001 1:0060:2.78 8409 7909 78·3* 5905
17 VII 2 1:0.24:2012 1~0.23:2003 79.7 7704 76.3* 66.5
. 18 & 22 VIr 4 1~0026~1.05 1:0.26:1.03 69.6 75 ·9 6805 71·7 19 & 23 VII !~ 1~0033~1034 1:0032:1.31 74.6 78·7 72·9 75·7 20 & 21~ VII 4 1:0040:1.64 l~0·39:1.59 78.2 80.4 76.0 79·0 21 & 25 VIr 1,_ 1:0.47:1092 1~0047:1086 80.9 81.5 78.3 79·7
26 VII 2 1:0.30~1.18 1~0029:1.15 74.3 78.,4 72.3 75·3
27 VII 2 1.: 0 0 3'7: 1 .48 l:0·36~1044 7802 80.4 76.0 77·7 28 VII 2 1~Oo46:1082 1:0044~lo74 81.3 8106 78.3 .81·7 33 VII 2 1~004o~1078 1~Oo38~1.70 8100 77·8 77·2 78.1 34 VII 2 1:0049:2019 1~0046:2.04 8402 79.4 78·3* 75 ~7 35 VII 2 1.~ 0 0 59 ~ 2 062 1:0053~2037 8604 8004 78.3* . '76.2 .
36 VII 2 1. ~ 0 0 68 ~ 3 0 07 1~0060g2073 8801 8101 780),* 70·7 3'7 VII 2 1:0036:1018 1~Oo36~1016 70·5 7106 6906 72.0 38 VII 2 .1.: 00 41 ~ 1. 032 1.: 0 0 40 ~ .1. 0 30 7302 7300 7203 7307 39 VIr 2 1~0049~lo59 1.:O047~1052 7603 7503 7302 7309
1. & 5 VIII 4 1~0027~lo26 .l~0026g1022 7206 6308 7006 7009
! ;. ,.j :1'. Iii. ~ ~tk:;W~ " I '. '.. ,'; ,.8 ... , .... !


Table 5 (cont'd)
(1) (lb) (1e) (2 ) (3) (8) (9 ) (10) (12)
2 & 6 VlrI 4 1:0.33:1.55 1:0.31:1.48 76.5 67~6 73.0 74.1 3 &,7 VIII 4 1:0.40:1.87 1:0·38:1.76 79·4 70.2 74·9 73·9 4 & 8 VIII 4 1:0.48:2.25 1:0.44:2.08 82.9 72.1 76.7* 74.4
1 IX 2 1:0.31:1.41 1:0·30:1·37 77·7 79·0 75.4 75.0 2 IX 2 1:0.38:1.78 1:0.36:1.69 81.3 80.5 77.4 76.3
3 IX 2 1:0.46:2.11 1:0.43:1.97 83.8 81.5 78~2 75.1 4 IX 2 1:0.54:2.51 1~0.49:2.28 86.0 82.2 78.3~ 68.5 5 IX 2 1:0034~lo55 1:0.33:1.48 79.2 78.5 75·7 74.1 6 IX 2 1:0.40~1.84 1:0·37:1.71 82.2 79.8 76.5 77.6 7 IX 2 1~0.47~2019 1:0.43:2.00 84.5 80.7 77.1 77.0 8 IX 2 1:0.44~1.51 1~0.43:1.46 79.6 80.1 77.2 75·7 9 IX 2 1:0.58:2.02 1:0.54:1.89 83.4 81.3 78.0 75·3
10 IX 2 1:0.72:2.47 1~0.65:2.25 86.1 82.2 78·3* 75.5 11 IX 2 1~0.35~1.48 1:0·33:1.38 81.6 79·5 76.1 77.4 12 IX 2 1:0.48:2.06 1:0.44:1.87 86.1 82.2 78 . .3 78.1
13 IX 2 1:0.47:2.02 1:0.42:1.82 85·9 81·3 77·2 79.6 14 IX 2 1:0.38:1.60 1:0·35:1.46 84.3 80.6 76.8 79.8 15 IX 2 1~0.49:1.98 1:0.42:1.76 87.0 81.7 77·5 79.2 16 IX 2 1:0.59:2.76 1~0.51:2.38 90.6 83.5 78·3* 75.5 17 IX 2 1:0.58:2070 1:0.51:2.38 88.8 83.5 78.3* 73.4
1 X 2 1:0043~1.97 1:0·39:1.77 87.0 \' 83.3 78.3 79.0
2 X 2 1:0.37:1.69 1:0.34:1.55 85.3 82.8 78.3, 79·9 3 X 2 1:0.31:1.42 1:0.29:1.34 82.7 82.1 78·3 78.6 ' 1 XI 2 1:0013:0.59 1:0.13:0.59 62.8 66.1 62.8 63.9 2 XI 2 1:0.17:0078 1:0.17~0·77 69.0 7005 78.1 69.9
3 XI 2 1:0020:0093 1:0.20:0091 72.6 77.7 71·3 ' 72·3 4 XI 2 1:0.26:1.19 1:0.25:1.16 77·2 80.0 / 75'·1 75.7 5 XI 2 1~Oo31:1.44 1:0.30:1.40 80.4 81.3 77·9 7703 6 XI 2 1:0.41:1091 1:0.38~1.76 84.9 7909 7803 7506 '7 XI 2 19Oo50~2030 Igoo45:2.o7 86.9 8008 7803* 7405


Tab.le 5 (cont' d)
~-.':"
(1) (.lb) (Ie) (2) (3) (8 ) (9 ) (10) (12)
8 XI 2 1~Oo57~2066 1~0050~2.35 8806 8104 7803* 67.0 9 XI 2 1~0.32~10~8 1~0031:1014 76.8 7505 7403 74.9
10 XI 2 19Ool~6g1068 1:0.44~lo60 82.3 7806 78.2 80.3 11 XI 2 1~0050~1081 1.~oQ45~1.64 86.3 80.5 78.3 75·3 1.2 XI 2 1 ~ 0 o. 77 ~ 2 0 77 1~0068~2.45 88.6 81.4 78.3* 70.0
13 XI 2 19O.31.~OQ77 1~0.31g0.76 67.6 6906 6701 68.1 14 XI 2 1.~0.45~1011 1~0.43~1.07 76.0 7405 7304 75.8 15 XI 2 1~0.62~1052 1~0059~1044 8101 77.6 7700 78.6 16 XI 2 1~0025~0055 1~0025~0.55 6006 64.4 60.8 61.4 17 XI 2 1~003l~0.67 19O.31g0066 65.4 68.1 65.1 6509 18 XI 2 1~0.44~0096 1~0043~0094 72·9 73·5 7105 71·9 19 XI 2 1~0056~1023 1~0054~1~19 7704 76.2 74.7 73.8 20 XI 2 1~0059~1029 l~0057~1.25 7802 80.4 76.0 76.2 21 XI 2 1~0.26~1003 19O.25~0098 8101 77.8 7702 78.6 22 XI 2 l~0039g1054 1~0035gl039 8605 8005 78·3 7909
23 XI 2 1~0048g1088 190041~1.62 9007 82.3 7803 80.B 1 XII 2 190027~1020 190.25~1009 8601 8202 7803 BO.l 2 XII 2 190033~104'7 1~0029~J.·30 8805 82.2 7803 77·0 3 XII 2 1~0.38~1.69 190033~1047 890B ·8206 7803 77·0 4 XII 2 .1.~0043~1091 1~0037~1065 9008 83.0 7803 8000
5 XII 2 1~00~8~2011 1~Oo41.~10Bo 910'7 83.2 7803 80.5 6 XII 2 1 ~ 0 0 29 ~ .1 0 28 . 1 ~ 0026 g 1. 0 l~· 8802 8209 7803 8004 '7 XII 2 l;0041~lo80 1~Oo35~1054 9104 8301 7803 ·8002 8 XII 2 1~0046~2001' lg0039~1071 9202 8303 7803 8006
./... High beari.ng stress ~ tensile stress rati.o not taken i.nto account in computing this eff1ciencyo
NOTE~ Al..l. of these test resuJ.ts 'Were used in the stUdies of bearing stresB ~ tensile stress ratiq and the mater:La.l. ductility effect.
,I· .,. ,i~ ~,h ltik.~. ~!~ J : .. " , ! '~: 4f.' ~ .~: ~~l: t\'l~

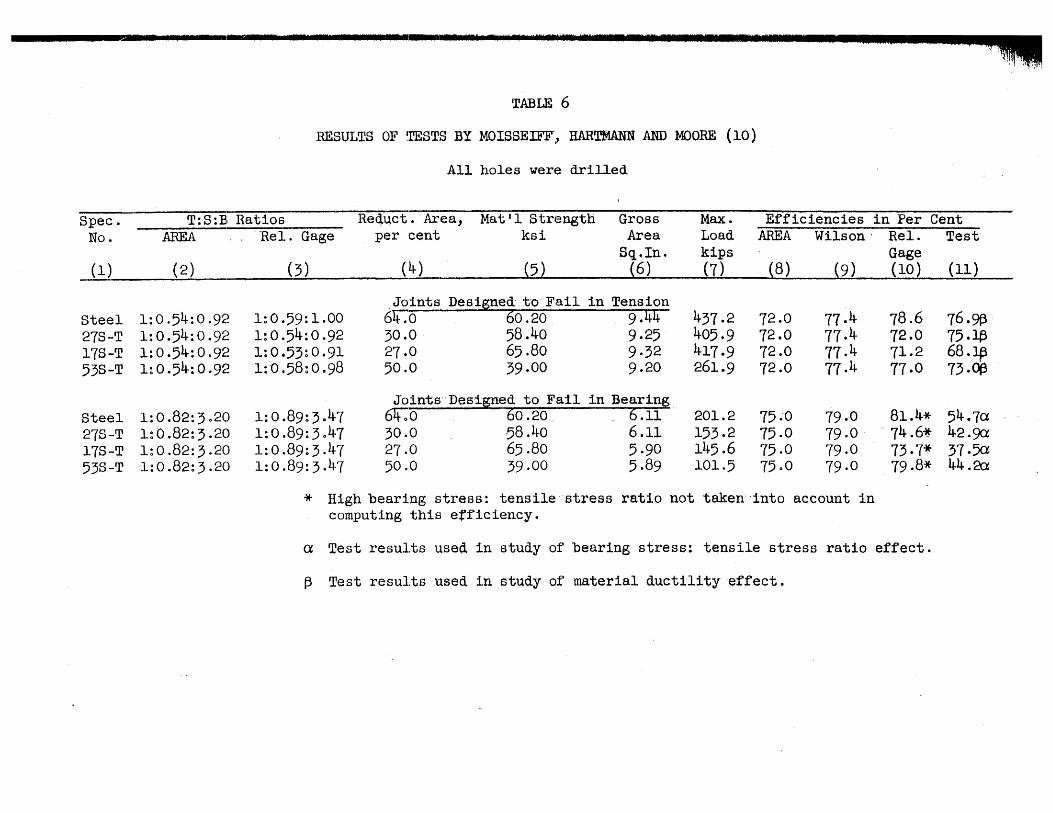
"m •• IF 2 J :j_ ' '\,1 1 .... 1
TABLE 6
RESULTS OF ~rESfj~;S BY MOISSElFF"" HARTMANN AND MOORE (10)
All holes were drilled
Spec. T:S:B Ratios Req,uct. Al=ea, Mat'l Strength Gross Max. Efficiencies in Per Cent No. AREA ReI. Gage J!?er cent ksi Area Load AREA Wilson' ReI. Test
Sq~In. kips Gage (1) (2) (3) (4) {5} (6) (7) (8) (9) (10) (II)
JointB Designed t·oFail in Tension Steel 1: 0.54: 0 .9~~ 1~O·59:1.00 61i":o· 60 .20 9 • 44 431.2 12.0 17.4 78.6 76.9f3 21S-T 1: 0 . 54: 0 · 9~~ 1:0.54:0.92 30.0 ' 58.40 9·25 405.9 12.0 11.4 72.0 75·~ 11S-T 1: 0 .54: 0 .9~~ 1:0.53:0·91 21·0 65.80 9·32 417.9 12.0 17.4 71.2 68.lf3 53S-T 1: 0 .54: 0 .9~~ 1:{).58: 0 098 50.0 39·00 9·20 261.9 72.0 77.4 71·0 73 ·013
Jointf3,"De6i~ed to Fail in Bearing Steel 1:0.82:3020 1:0.89:3041 6!f:O· 60.20" . 6.11 201.2 75·0 19.0 81.4* 54.10 21S-T 1:0.82:3·20 1:0.89:3047 30.0 58.40 6.11 153·2 75·0 19·0 ' 74.6~ 42.9a 11S-T 1:0.82:3.20 1:0.89:3.41 21·0 65·80 5·90 145.6 15·0 19·0 13·1* 31·50 53S-T 1:0.82:3·20 1:0.89:3·41 50.0 39·00 5.89 101·5 7500 19·0 19.8* 44.20
* High bearing stress: tensilestresB ratio not taken' 'into account in computing thiB effiCiency.
a Test results used in study of bearing stress! tensile stress ratio effect.
f3 Test results used in study of material ducti1ityeffect.


TABLE 7
RESULTS OF TESTS BY WATERTOWN ARSENAL 1882 (11)
Spec. T~S~B Ratios Reduct. Area:; Matll Strength Gross Max. Efficiencies in Per Cent No. AREA Rela Gage per cent ksi Area Load AREA Wi:lson Relo Test
Sq.lno kips Gage (1) ~,2) (3) (4)~ (6) i7) (§~ (9) ~10) (11)
Punched Holes 39 IbO.76~1050 1~0.66~1030 22.0 47.93 2.66 7702 57.6 66.8 4908 6006 4·0 1~0076~lQ50 1~0.66~1·30 2200 47093 2065 81·3 57.6 66.8 49.8 6400
617 1~o.67~1006 1~Oo57~0·90 22.0 47093 2·71 8505 65.4 72.4 55.4 6508 618 l~ a .-67 ~ lo06 1~Oc5"(~0.90 2200 47093 2·73 8504 65.4' 72.4 55.4 65<; 432 l~Oo53~lo05 l~oo50~10OO 5601 55077 2.49 97.8 65.6 7300 62.4 ' 7004
433 1~0·53~1.05 1~oo50~1~OO 5601 55·77 2054 9803 6506 TI~O 62.4 6904 615 1~0038~lo50 1~Oc33~1030 22.0 47093 2·53 75.4' . 57·6 6'6·9 49.8 6202 616 1~0038~1.50 1~0033~1030 22.0 47093 2062 7404 5706 66·9 4908 5903 66 1~1,,01~1.45 1~0085~lo21 llLO 47.18 3·95 93·1 57·1 66·7 48.0 50.0 67 1~loOl~1045 1~o.85~1.21 14.0 47.18 ,·99 92·9 57·1 66·7 4800 49 03
720 l~ 0 o4.s~ 0 099 1~o.42~0086 14.0 47.18 4.07 116.0 48.4 59·7 42.0 60.4 721 l~ 0 .~.s~ 0 099 1~ 0 .4·2~ 0086 1400 4,7 018 4008 11000 4-804 5907 4200 57·1 68 1~oo63~0091 1~0053~Oo82 1400 47.18 3·75 11204 6205 7100 51~9 6305 69 1~oo63~0091 1~0.53~Oo82 1~·oO 4,7,,18 3079 11807 6205 7100 51.9 6604 58 1~oc63~O·91 1~0053~0082 14.0 47018 3071 115·0 62·5 'TIoO 51Q9 65 07
70 1~0070~1001 1~ 0 ,.58~ 0.84· 1400 1~7 018 3·94 11204 62.5 71.0 51·9 60·5 71 1~0070~loOl 1~ 0 o58~ 0 .Sli· 1400 47018 3087 110.2 6205 71.0 51·9 60.4 57 1~oo63~Oo91 1~o.61~0,,87 5702 53033 3076 146.7 62.5 71.0 60.0 7302 59 1~ (L63~ 0.91 1~O.61~O.87 5702 53·33 3,,73 149.5 6205 71'.0 60'00 7502
240 1~lo34~1·58 1~ 1.14·~ lo.3k 1800 44.62 5010 90·5 59·3 6807 50.4 3908
241 l~ 1. G34~ J .. 58 191,,14~1.34 1800 4·4062 5014 92., 5903 6807 5004 3907 295 1~Oo72~lo07 1~0071~lo05 5200 57022 4091 12000 50.0 7108 4901 4202 619 l~ 0 036~ 0 05;/ 19O,,35~O,,52 5200 57022 5002 15404. 5000 71.8 4901 53.8 ' 620 J.~Oo36~Oo53 1~Oo35~Oo52 5200 57022 5001 154.2 5000 7108 4901 5308 '731 1~lo24glo56 l~ 1 cObJ'~ l,,31 15·0 h4.6h· 6.28 124,,0 5905 6904 5000 4200
liM """,.,i,.,\,.,. ";<'1:"'. "
! .;! ~ .. 1;!~1'11, '1' I" f' "!' ~~,~ tt ' i . '" .," >~. ';' I.. .. ; ~Q, :';: :.


~i
TABLE 7 (cont'd)
{1} (2) {,} {4) {5 } ~or---~~7T ' (8) {9) (10) (11)
7:)2 1~'0 .6~~: 0.78 1:0.52:0.66 15·0 44.64 6.48 ' 163.0 59·5 69.4 50.0 56., 7~), I: 0 . 6~~: 0 . 78 1:0.52:0.66 15·0 44.64 6.,4 167.8 59·5, 69.4 50.0 59·3 736 1:0.52~0.66 1:0.51:0.65 62.1 52.45 5·81 216.0 55.4 65·9 54.1 70·9 7~57 I: 0 .5:2~ 0.66 1:0.51:0.65 62.1 52.45 5.81 208.0 55.4 65.9 54.1 68·3 7~~2 1~1·37:1.61 1~1.15:1.,6 17·0 46.59 8·38 144.4 60·5 70·2 51.0 37·0
7~23 1:1.3'7:1.61 1:1.15~1.36 17·0 46059 8038 151·5 60.5 70·2 51.0 38.8 7:24 1~0.6B:o.81 1:0057:0.68 1700 46.59 8.41 207·9 60.5 70·2 5100 53·1 7:25 1:0.6B~0.81 1:0.57:0.68 1700 46.59 8017 211'.4 60·5 ,0.2 51.0 55·5 7:26 I~Oo99:1.17 1~0·98:1.66 640' 51.55 7·39 14909 52.6 67.8 52.0 39·3' 7:21 1:O·99~1.11 1~0.98:1.66 64.3 51·55 7·38 17607 52.6 63·8 52.0 46.4
7:28 1~ 0 050: 0 .58 1~0.49:0.57 64.3 51·55 7033 181.2 52.6 63~8 52.0 48.0 729 l:0·50~0.58 1~0049:0·57 6403 51·55 7·39 177·7 52.6 63·8 52.0 46·7
Drilled Holes 438 1~1.O7:2.10 1:1.20:2·36 5601 55·77 2.53 104·9 65·6 73·0 73·5* 74.3 439 1~1.07:2.10 1:1.20:2·36 56.1 55·77 2.45 98.1 65·6 1"5·0 73·5* 71.8 430 1~0"76:1.50 1:0.85~1.68 56.1 55·77 2.44 93.6 57.6 66.9 64.8 68.8 431 1~0.7'6:1·50 1:0.85:1.68 56.1 55·77 2.44 98.1 57·6-' 66'.9 64.8 72.0 245 1: 0 .5i4:: 1.42 1:0·51:1·32 1400 47.18 4.69 163.7 79·7 80.9 74.2 74.0t3
296 1:0.54:1.42 1:0·51~1·32 1400 47.18 4.51 161~0 79·7 80·9 74.2 75·7t3 297 1: 0 .~;4:~ 1042 1~0·51:1·32 1400 47018 4.45 151.1 7907 80.9 74.2 71.~ 246 1: 0 . ~;8: 1 .1 7 1:0.40:1.26 5702 55·33 4.34 206.0 7606 79·7 82.8 89.0 2~47 1: 0 . ~)8: 1 .1 7 1:0.40:1.26 5702 55033 4.41 211·9 76.6 79·7 8208 90.1
* High bearing stress:. tensile stress-ratio not'taken into account in computing this efficiency.
t3 Test results used in study of material ductility effect.


TABLE! 8
RESULTS OF TESTS OF WATERTOWN ARSENAL, 1883 (12)
~~----..~"-~~~ .. ,..~~~~ ... ~~. Reduct" Area:; Matil Strength Gross Max. Efficiencies inFer Cent Specc 'r~S~B Ratios
No" ~ .. AREA~ Relo Gage per cent ksi Area Load AREA Wilson Rel. Test
Sq.luo kips Gage .-i l)~. ~1~L_~~~_"-~, ... - . ______ .. ~.{!±1_ .. ___ ~ ____ 12_) ___ (§J __ JJ) (8) _121 ... _ .l19~__ . .t 11)
4.1~18 1; 1.Ol~ 1.1}5 1~o,,87~1.25 2000 Iron Joints - Punched Holes --~.18 b ~oo6 90000 56·9 66.7 48.9 4700
4L,.l9 l~ 1. Jjl~ 1. 045 l~ 0 .8rr~ 1025 2000 4·7.18 4'006 93·90 5609 6607 4809 49·0 ~h28 l~ 1 c311'~ 1.58 1~ 1. ,,14,~ 1035 19,,0 4,11, .62 4075 96.60 5903 6807 5005 4506 !~1+29 1~lu34~1.058 1~1014~1,,35 19·0 !i4 .62 4075 95025 59·3 6S-.7 5005 4409 761~ I~I026~1.82 l~ 1.0'7~ 1. 05:> 2000 It7018 3097 112.20 62.5 71.0 5301 5909
765 1~1.26~lo82 1~lo07~1)55 20.0 1~7 018 3094 112·50 6205 71.0 5301 60.5 768 1~1034;lo58 1~1()14~1.34 1900 41} 062 4081 127060 59?3 6807 50.5 59.4 769 1;lc34~l.o58 l~ 1 vl1i,~ 1034 1900 41~ 062 4077 125095 5903 6807 50,,5 5902 772 1~lo24~1.56 1~ 1 oo4~ 1 0~50 1300 1}4064 6038 162090 5905 69J~ 4907 5702 773 1~1024~1056 l~ 1 oOll·~ 1030 1300 4~, 064 6045 157098 5905 69.4 4907 5409
7'76 l~ 1 vlf3~ 1. 0:52 IblvOO~1028 1'700 46059 7098 193080 5900 6902 4909 5201 '7'77 l~1,18~1052 1 ~ 1 .) 00 ~ 1 0 28 1700 1j·6059 8015 196.20 5900 6902 49.9 51·7
Steel J'oints ~ Punched. Holes .4.31 J.~O·72~1.07 1~ 0 v69~ 1..0.3 .45,,0 ~57 0 22~~-~~ 5005 122010 50.0 61.0 4800 4203 710 1~ 0 ,.36~ 1.0,( l~0·35~10O) 4500 57022 4089 199·90 .50.0 61.0 4800 5701 7'11 1~Oo36~lo07 1~Oo:J5~lo03 1!'500 57022 4096 156010 5000 61.0 48.0 51.1 718 1~O,,50~lo17 l~ 0 v)~9~ 1 016 6200 51055 7039 205050 5206 6308· 5200 5400 779 1~Oe50~101'7 1~ 0 .,1~9~ 1016 62cO 51055 7037 202,,70 5206 6308 5200 53.4
I
i~·\ ~ *t l • _ • _
_~~"~~""~"""""". __ """"""",,,, ____ ~--__ ,,,,~" ______ "~""""""~".1.r ............. ~t ..... ~!~I.~.~ .... ~~, .... ·•· .... --................... 1·., •• ·· I"'-'-"'-'~ • _t_ -


,"'~
'TABLE 9
RESULTS OF TEBTS B~ WATERTOWN" ARSENAL, 1885 (13) All holes were drilled
. ~ Speeo T~S~B Ratios ' Reduct,; Area~ Mat WI Stre'ngth Gross Max 0 Efficiencies in Per Cent
No. AREA Relo Gage per cent kEli Area Load AREA, Wileon' R~l. Test Sqolno kips, " Gfige
~1) ~2) (3) (4) ~5) ~6) (7) (~) , (9) ,~'10), (11)_ ~_~ -
1308 1~.l.00~ 1.77 1:1.09~1·93 48.2 , 61 ~ 74 ' ,2·36 98.40 " 61.5 69.8 ' ~7.0 67.5' 1309 1~1000~1·77 1~1·o.9~1·93 " 48 .. 2 61.74 ,2~36 99·55 61.5 69.8 ' '67,.0 68.3 1310 1~1013~1·99 1~1~22~2.15 48.2 61·74 2.54 108010 64·3 71·9 6905*, 68.9 ' 1311 1~1013~1099 1~1.22~2015 48.2 61.74 2062 112."90 64.3 71·9 '69'·5*, ,6909 1312 1~ 1 o26~ 2 .. 22 1~l036~2·39 4802 61·74 2075 123·30 ' 6607 ,7306 ' '71.7*,,7208"
1313 1~1026~2.22 1~1036~2·39 4802 61074 . 2074 121·95 ,660'7 ,7306, .' 7l.0 7~' . 72.1 1314 1~Oo67~1045 1~0074~1.60 4802 , 61074 2.60 105·90 5701 66.7 '62~8 __ 65.9 1315 1~O067~1.45 1~0.74~lo60 4802 ,61.74 2.54 101.64 57·1 6607 '62'08 '61)..9 1316 190076g1063 1:o.83~1078 48.2 61074 2075· . 112 069 6000 6900 6505 6604 1317 1~0076~1.63 1~Oo83~1078 48.2 61074 . 2 077 ,", ~14 085 60.0 6900 "6709 67.1
1318 l~ 0 .84~ 1'.82 '1~O091~1098 4.8 .2 61.74 2·94 ' 124.10 6205 71.Q ' 68<~' 68.3 1319 19o.84~1.82 160·92~1·99 50)'~ , 62.66 .2.88 12; ·9;' '. 62·5 71.0.,' ,'~ 68.:; , 68.6 1320 1~0·9'~2.00 1~1.01~2.09 ' 5004' ,62066 3·10 '133.50 . 64,7" 72~~', ,-70.3* .68.7 1321 1~0·93~2.00 1~1.01~2.09 50 .l~ 62.66 3·10. 136~50 64·7 . 72~6 . " 70 ,. 3it", --70 .; . 1322 1~1,.Ol~2018 1~"1.10'~ 2 .38 5308 . 59018 3·33 142.45 ·66.7 73 09 ,72~9* .7.2. 7
1323 1~1.01~2.18 1~1.10~2038 53·8 59·18· '3~34 146018 .66·1 73·9 72.9* 74 .Q--,/ 1324 1~O048~1023 1~ 0 054.~ 1.,7 4802 61.74 2079 ' 107.90 53·3 .63.8 . , 59 .4~- --62'.0 1325 1~Oo48~1.23 1~0054~1037 4802 61074· 2076 108068 5303 63·8 . 59 .. 4 . '63~8 1326 1~0054~lo39 1~Oo60~1054 5004 " 62.66 2089 i16065 56·3' 66.3 . 62':5.' "64._ 1327 1~0.54~1.39 1~O060~1054 " 50.1 ... 62066 ' ',2091 .120008' -56;3 ' ,66.} '62.5,'· 6509
1328 l~ 0 060g i 054. 1~oo66~1069 5004 62066 ;:.08 1300'05,:5808 6805 " 6405 ~6't·' 1329 l~ 0 06o~ 1054· 1~oo66~1069 50.4 62.66 3·09 132~OO 58.8 6805 64.5 68~2 1330 1~Oo66~1069 1~Oa72~1.84 . 4802 61.47 3035 144.3q 6101 70.2 6505 70~1 1331 1~o.66~1069 1~Oo73~1088 5308 59.18 . :; 0"32 137065 6101 70.2 67 07, 70.0 1332 1~O·35~1080 l~ 0 .39~ 1099 " 53·8 ·59018 .' ,.53- 147 ~78 ·6301 72.6 6906 ':,7007


TABLE 9 (contUd)
~=rn=-- '~~-r~~~-==-~~(~5T~"'-~'--=-~~~--rIi1~~~'=='~-~=~()5~-=~c
l?,:i::; l.j~:~·~ l~~)::;
13~6 )';:£"5:.7 ·~jv' I
15?/j 1;)39 ] 34,t~) 1.31:,1 :l.~~li':~
.1.34j
.131),;, 134,5 I ';.;;,lt 6 1347 13 l+n 13)&9 15~jO
1.3~)1 1.35[:
1~;-:53 J.-55i.j, 1~Y5~,;:
1.3~)(;
13~j7
1~0035~lo80 l~ 0 o.:)9~ 8 JJO 1~ 0 o39'~ 2 .00 }., 0 ,.1~2~ 2016 l~ 0 ,;h.;~l.~ 2 ~16
1, (\ c.~J3~.1· .. (;1 1 ': 1') , 18 ~ J~ c ~Yr 1 ~ 0 " ~'D .; 1 0 ~~o
l~ iJ c :2C:~ 1 G :;:~)
Je.; ~) c ';~~~~ ~ 1. ~ ~)4,
1. ~ 0 c. '?") ~ 1 ~ 53~ I,~. 0 '0~~5~ 1 G~6,'7 1 ~ 0 (. ~;~5 ~ 1 0 Iry 1 ~ C) c27 ~ }, ,,60 1. ~ 0 0 2' r:; 1 " Go
l~ 0 ,,29~ 10 7J~· 1. : 0 ,.29 ~ 1 " T~' 1~ 0, )2:; 1 J}'I 1~ (: ,52:~ 1. 08'1 1;; 0 0 jt.l1,: :2 ~ 01.
1.? 0 '0 ")\~,;~ 2 ° 01 1~ () ~)6~ 2 ~.lh .}. ~ c~ 0 :)r:~.~ 2 c l)~~ 1.; 0 .; 1:5~ 1" '0(8 1~Oo7~5~1;Y-(B
MI~ ::,;:' ,ii. ,>
~~t.. k ___ ~ ~ .~
1~Oo)9;lc99 l~ i) (>1~.3~ 2,,2;:2 1.; () J~·2~ 2 ~ lk .l~ 0 ){·6~ 2 ~ 36 l'~ 0 ,,~,6~ 2 ,,34
:1, ~ (j -J ~~{.; 6 1, 0 ~;22
J~ ~ 0 0 ~~~~~'~ ~ 1, 0 ~~~2
l~ 0 ~2{~~ 1 ~3~j 1:; (') c~?~~:l )~;(·5 l.~ ()J~2{j,~ 1. ",:50
1; 0 ·/c~l6 j 1 »')
1:; 0 ?28~ 1. 06:> l~ O:2EL 1,6) 1~ 0 o.30'~:1 0 Tt <L~ c; Q:50~ 1" 71
1'; 0 v 1,92 1~Oo?}~:~~lQ91
1 ~ 0 0 ~}6 ( ~~ u C)S 1;:; (0)6':;2 :on 1~Ooj'7~:2c20
1 ~ 0 0 ~) 7.~ '{;':., :. ·~~o l:~ (l )H)g r;} 0
1. ~ 0 )~O ~ ::~~ 056 1~ 0 j~~.~,~ 1099 l~ 0 u8i.J·~ 1. 099
:)) ce 62. 0.) l:~6" ~~ 5308 51LJ ~<: I"~· II ::j"~J ot:..·/
~~-Bo~ ~~O )~ r~n ~1 ...;,;1<.,1" .)~'
51
51 ~;:S JI1.,~~
55ot:, ;:;.~,6 &7, £,/11 J t·'.4
:56
~~5 J'~ ~~O .,~. ~,;9·,H :~)9 }3 ;j3J1
~j3 coB 560'5 :1(; 57 ~ ''( 57,,7
~j9 olB 5801,,/ 6tj, 01"{
~j9 GIB 6J. Jrr
62066 {"'i ".~, .J<~, " 6 "J'
62066 62c.66-Gloh7
f;;" )~7 r: "I ~; r (,!,!, .),,-~, 7 :390,1.8 60 .,l~-e 60'jhH
~59 .,]8 6i?' 066 ::)~j u 7h ~5, ·,T~ ~59 olB
'5901a 6004-B 6~) "he 5~'026 ;\1} 026
fb\ t J
~ ~'J; .d c~.pd
3065 )068 )013 3031
2086 2098 3006 )009 ~ -;x,p :J ," ~r,d
30)8 )0,6 ,,,52 :')077 3078
3020 :)013 :; ~~·4 3J~j 3,,55
30'57 )0'{8 ~ '1(11 ~1; 0 U
3056 3055
,!
= (7) -=tBr
151.12 16:2075 15·8 0~2 1290J.O 1,8~97
116000 lD8"OO 118030 111034. 12.7,,10
1;5106, 139030 1~-2 ,38 .l61} 010 156·,56
12.309(1 134030 lh,7 }~8 1~'3 ~15 154065
155J~4 ,."p ,..
~.c",) 050 1700;20 11~3 098 139090
6301 6500 65~O 660'{ 6607
5000 50,,0 5)01 53,,1 ..... r;; t:.. ),,} oV
55~6 ~iB,,0 58uO 60,,0 6o?o
62,,0 6:200 6.~) ,,6 65u6 65 ~:)
650.3 6601 ~ [ .-,
6vo I'
6105 6105
191 llO) (11)
72',,6 13,,0 7300 7402 74.2
6100 6100 6308 630B 6600
6600 6800 6800 6906 69,,6
7101 7101 72,,3 r(2 0 3 7304
7304 7404 74. o~· 6908 69 0 8
6906 7200* 6907* 'l209* 12,4.#
5608 5608 5906 5906 6201
6201 6403 6408 6602 6602
6805 6709 7001'* 7007* '1106*
7106~' 7305* 7305* 6807 6807
7203 '1608 6701 6908 6803
6408 5.a~8 6101 6006 6105
6304, 63 0 6 68.) 7201 6805
65J+ 68J~ Tlul 7409 7305
71} 01 7307 73Jt, 7406 7206
. ~. ;k~J ,~, \J:ll i!'.f~ I' I J *ftf ~Ili! ~~, :(;,:t H~ : 'I I . j ~ , '


C,inr"!1:'!
TABLE 9 (cont'd)
{1) --c2) (3J pq (5J (is) (7) {8J {9J (lOJ (11)
1;60 1~0051~1045 1~0058~1.64 5707 54.26 ,084 143·19 57·1 ; 66;.7 64.4 68.2 1361 1~0.51~1.45 1~0.58~1.64 57·7 54.26 ,085 142078 5701 66;.7 64;.4 680' 1362 1~0057~1.63 1~0.62~1080 57·7 54.26 4.12 154020 60.0 69·0 6602 69.0 1363 1~0.57~1.63 1~0.62~1.80 5707 54.26 4.11 156.20 60.0 6900 66.2 70.1 1364 1~ 0 0631~ 1082 1~0069~2000 52.6 59·7, 4066 194.70 62~5 71.0 6808· 70.0
1365 1~0065~1.82 1~o.69~2.00 52.6 59073 4.68 196.56 62·5 71.0 6808 70.; 1366 1~0.70~2000 1~Oo77~2020 53 06 57089 4068 192.20 6407 72.6 71.0* 7009 1368 1~0036~1.23 1~o041~1.40 57·7 54.26 4015 145029 5303 6;08 6008 54.5 1369 1~0036~1023 1~0041~1040 5707 54026 4011 140060 5303 6308 6008. 6300 1370 1~Oo4JL~1.,8 1~O046~1054 52.6 59073 4067 172010 560' 6603 6209 61.7
1371 l~ 0 Jtl~ 1 .38 1~0046~1·54 5206 59073 4.66 181.:;0 5603 66·3 62·9 6502 1372 l~ 0 04~5~ 1.54. 1~0048~1.65 52.6 59·73 4.92 190.40 5808 6805 6209 64 .. 8 1373 1~ 0 .4~5~ 1.54 1~0050~1·72 53·6 57.87 4.67 182025 5808 68.5 6506 6704 1374 1~O050~1.69 1~o.56~lo88 55·7 53·73 5.08 192·70 61.1 70.2 68.1 70.6 1375 1~0050~1.69 1~0.56~1..88 55.1 58.34 5·13 204.20 61.1 7002 68.1 68.2
1376 1~ 0 .514-~ 1.84· 1~0.60~2.04 5507 53·73 5·45 212.10 6301 72.6 70.1* 72 .. 4 1377 l~ 0 .51t~ 1 .84 1~0060~2.05 5706 56.67 5·29 210·90 6301 7206 70.2* 70.4 1378 1~Oc90~2000 1~1000~2.21 5507 53073 5075 2,3000 6500 7300 71·9* 7505 1379 1~0·90~2.00 1~1000~2021 5507 53073 5·78 235006 6500 7300 71.9* 75·7 1380 1~O.27~lo07 1g0031~1022 5206 59·73 4066 160065 50.0 61.0 57·1 57.8
58034 4058 61.0 " 1381 1~0.27~1007 1~0031~1022 5501 152090 50.0 5701 5703 1382 I~0031~1.20 1~Oc35g1036 5206 59073 4095 176.08 53·1 6308 60.0 5906 1383 1~o·31~1.20 1~0035~1036 5501 58034 4088 160000 5301 63.8 6000 5905 1384 1~O034~1033 1~0039~1·51 5708 54029 5014 182045 5506 6600 6300 65.4 1385 1~Oo34~1033 1~0039~lo50 5501 58034 5013 183 070 5506 6600 6207 6104


TABT)-~ 9 ~ t~tm;t ~ d)
~·T.1 ~~.~' ~~=~. ~~:T~-~~~~"~-'=~(5T~~-···~·~,-~~~~·c,c.,~~.r_-~[1~~r~-~<~"~c"~~'~---~~'Gr=~~"~~~1J)J~'=C>=~r7)~'~1rrr~-~. .~ ( 9 ) "(10 j 1 rrl~~
l?i~~(
1':~13? J~'; (~f)
1 ~~>SSJ ] ,-59!.'!
Ij91 1'~;9~2
1:-9?,: 1:::94 }:;95
:";=~ .. ]I.---'-"'-"--\-oQ_:;;:""::""" ___ :.._c.I..:~._<t,r. ......... __ : L· .... .<-6.:..._·I...--::......:.·--.:;--"---·-..:::....:.;:~·-:::-_·-I..-,;.:.. .... · .. "'..:..<.l...:...a-:.. .......... ~_~=-~-=..:u. __ """-~ ... I....-. ... ~ .. A>..~_;..: .. =:....-;-=...--=-~. =-=-~..:-.:::~-..:......:...L~ ..... ,,~~_=-=._~~"'~. ,..,..,~. ~"""""'L- ~~
u, :, :), :~th ,1.. tj.'{ )'-~ () j --'Sd~ ,1}(7 :i. ;',} ~tq.~:1 's:.: ";:. ~: :~.r 0 2~. I, ~ ~L t.. ~~j(i
"( ,~o,.ktl·~.lj73
.1;" (:': , ~i,!. ~ 1 0 73 .1 ~ rJ c 1'/ ~ .1 0 ~36 1; I') _,h 7~ 1. ,86
: 0 :~:;:L; ~~ cO~) l.~ 0 ,)~)l:.:2 DOC;
1, t~I~-~ .~ .!, , t/~ .1 ~ C o.l:'~"; 1 ,,66 1 ~ I') ,Lt·:> ; .1. " ,?''2~ 1 ~ 0 ,):'5; 10"((:: l~ 0 )·~92 J. 'J91
1;och9~1091 l~ 0 ,):S:2~ 2,,05 l~ 0 <,~~~2~ 2 ~V5 1:: () ",56 ~ ~~ ":;~1 l~ Do56'/; 2 ,21
~.~;)'It 06 ;'::r;' h L":' ~ -' - 'J
07 j5 ).~ ~~;;;i ,,6
~~j' r ..;-:: -~) < ~I
~55-6 ~53 06 ;'~h .'~
.:JJ c' j
::'~),7
136,,6'7 ~;~] ~EV~ 5.3 'J 73 )~5J73 !~> (' c t~'{
r r. i-jr
'57,,81 57uB7 !;l)., 7~~i S)J'(:':
5,,24· ~) ~2D
507L1 ~.~, 079 ~·~88
~, u81~ 5 oli~ )011 ~~ 056-5(,50
194'010 191,j;O ~:~16 o~~>n
2160.30 190,36
191,,)0 ~040H5 2.06060 :2.18 o6:~ 21600;Q
~)8 00 5800 6000 6000 6200
6200 6306 6306 65,) f :k ',;' '~jj 0,)
;;, Hi.gh l;:;.";a.:O::':i;:1s fd:;'ee8S.~ t~:r~f.;t,le 8t;:r.'·~:S8 ra:ti.O L~nt t[-;l.k~l!:l int;() 8,'<::;COU!lt :1n. :;'I.'1LT1l':'t'\,t.i.ng th:Ls e:ffic~~lt~(q=~y 0
,,~sp ~~l!
.~--~.. ..... ".;i ~ J
6800 6800 6906 6906 7101
7101 72Q3 7'20.3 73,,4 7304
'. !l'~' J ;:c. i;~l': :~" r !' ,: '!~;:
6503 6503 6601 66Q1 6805
6805 7001* 70 ol~' 720101: 12 ol~'
6503 68,,2 6908 690) 67 )~ .
680) 6809 6808 7302 7500


TABLE 10
RESULTS OF 'rESTS BY WATERTOWN ARSENAL, 1886 (14)
All holes were drilled
Spece T~S~E Ratios Reduct. Area, Mat'l Strength- Gross Max. Efficiencies in Per Cent Noo AREA Rel~ Gage per cent ksi Area Load AREA Wilson ReI. Test
Sq.lu o kips Gage ~l) ~2) (3) (4) ~5) ~6) ~7~ (8) (9) (lO) (11)
1,97 1;0.67g1.45 1~0·75~1.62 5306 57·18 5·08 190·70 57.1 66.7 6,09 68.1 1400 1~0.84~1.82 1~0·93~2.01 5306 57·18 5.84 216.15 6205 7-1;0-- 69.0* 64.70 1402 1~0.48~1 23 1~0.54~1.39 5306 57·18 5·42 199.80 53., 6,.8 60.4- 64.5 140~· 1~Oo54~1.39 1~0.61~1056 5306 57·18 5083 221010 56.3 66.3 63·2 660' 1407 1~0.6o~1.54 1~0.65~1.68 tt6.4 59·05 - 6.01 235·70 5808 6805 6400 66·313
1408 1~0066~1.69 1~0.72~1.84 4800 60.00 6056 261050 61.1 7002 6604 66.4{3 1413 1~Oo,6~1.07 1~Oo42~1023 53·6 57018 5·77 198050 50.0 6100 5703 60.1 1414 190041~lo20 1~0045~1033 46;4 59·05 6002 210081 53·1 6308 5808 5902t3 1417 1~0045~1.33 1~O049~1046 4.800 60000 6051 240068 5506 6601 6104 6105f3 1419 1~O.50~1047 1~0·55~1.61 4800 60000 6088 266050 5800 6800 63-.5 64.5f3
1421 1~0054~1.60 1~0.60~1·77 52.0 58.00 7·25 280010 6000 6906- 66.3 66.9 1422 1~0059~1.74 l~o.64~1.88 46.4 59005 6017 245.05 6200 11.1 66.9 67.$ 1425 1~0.63~1.87 1~0.68~2.02 48.0 60.00 6.63 269.25 63.6 7203 68.9* 67·60 1427 190.28~O~94 190032~1.o6 46.4 59·05 6.05 183·80 47.1 5805 53·2- 51·513 1429 1~0032~1.06 1~0.36~1.19 46.4 59.05 6.28 209080 50.0 61.3 56·~0 56.513
1431 1~0.35~1018 1~0·39~1.33 52.0 58000 6.89 232000 5206 6308 59·4 58.0 1432 1~0·39~1030 1~0044~lo48 62., 58000 7·72 262.80 55.0 65.8 6205 62·3 1434 1~0.42~1041 1~0.47~1.58 5306 57018 6.19 227010 57.1 6706 63.9 62.0 1435 1~0042~1.41 1~0.46~1.54 46.4 59·05 6023 211.00 5701 67·6 620' 61·213 1437 1~0.46~1053 1~0050~1.68 4800 60000 6063 256.80 5900 6902 6406 6405t3
1439 1~00lt9~i065 1~0054~1082 5200 58.00 6097 271030 6009 70.6 6701 6700 1441 1~Oo53~1077 1~Oo58~1095 5200 58000 7025 249060 6205 7107 6806 1000 1444 1~006o~1023 1~Oo68~1040 5507 55000 6099 235080 53·3 6,08 6008 6001 1445 1~Oo90~lo23 1~Oo68~1.40 5507 55000 1002 242.40 5303 6,.8 6008 6207 1447 l~ O-~ 70~ 1042 1~0019~1.60 55·7 55·00 7·49 26,.00 5708 66.3 6500 63.8


~lA'BLE! 10 {~01CJj ii.)
~ (i1~~--'-~-'~~r-'~-~"~-~~--r31~->~~~-' ~~-==p~}~-"'~~. ~-~~'(5r-~~' ~-1-=--=~~m~===rrr'~'l"nJ \9) (IO ) (lIr-~~. ~~-,,--~....:..>oL-~ ___ "'OI'_...u:-::n~"".&J<:.,..I..)I:I,~· --~ ~~ •• ~-:;.&..-_LalI~"'-='~· - ""..:D.o..J;S..~--=~~~·,~-.r_:.-..a.~ ... ~~~...,::.~T_~=-=-=-.~~~:-=·-=-=ono=-=' ~~~. ~
1~l52 1 ~ 0 )~j ~ .1 oOT 1~Or,52~lo23 55c7 55c00 7 J~9 240020 50,,0 61~O 57 01 5803 .1hS:· 1 ~ 0 " 4',;; ~ 1 007 l~ 0 o5:2~ 1 c :~::.? 5.!) ,7 5~i .,00 1 J~l~ 238,,50 50,,0 6100 5707 5803 1t5,4, ] ~ (Lose;; lolb 1~ 0 u;;t1~: 10.37 550'{ :5~i 000 7093 270060 5201 6308 6006 6o~o 11';;:5 1 ~ 0 ,,51) ~ 1 "J(j l~ 0 ,,58~ 1 <>.31 5507 55000 7088 267092 52c1 6308 6006 6108 , ~.J" ltj'S6 1~ 0 ,,57~.l r,,:'.3 1~oo6o~1,41 3509 5'7029 8026 301050 5506 6600 5809 63·6{3
1h .. 57 1~o057;lo3) l~, 0 06o~ 1 )-ll 35, 09 5'7029 8025 291010 5506 6600 5809 62,,8t3 11',58 l~ 0 062~ 1 )~'7 1~O065~1055 3~~ 09 57029 8066 3260'{o 5800 6800 6100 65oBf3 1459 l~ 0 o62~ 1 ,,4'7 19!Jo65~lc55 3509 57029 8066 3250,0 5800 6800 6100 65~5f3 1,~,6!~ 1~Oc35g0oq4 1;; 0 c4·1~ 1010 ~~}:; a ~7 55000 7095 24-7020 ~'7 01 5804 5409 56,5 1465 1 ~ 0 c' 35 ~ I) 094- 1.~U~41g1010 :)501 55000 7095 247,,20 4701 5804 5409 5605
11~,66 1~o.hO~lo()7 1.~O,,4)~lc1.6 3~L9 57029 80~n 274'010 5000 6103 5400 5708t3 lJ!-67 1 ~. 0 "j~() ~ .i 0 :) . ( l~ 0 ,,43~ 1,16 .3509 5'7029 8018 271000 5000, 6103 54· 00 5800(3 14·68 l~ 0 .,!t4g 1.18 .l ~ 0 4· 7 ~ 1. . 26 35c9 57·29 8074 299030 5~~ 06 6308 5604 590Bt3 lJ~·69 Ib 0 o4Jg·~ 1. olt) 1~ (I o47~ 10~26 3509 57029 8069 302035 52~6 63·8 56.4 60.7t3 lL:70 1 ~ 0 ,l{) ~ 1 .. 3'~ 1: 0 ,,5.:,~ 1 )~l~. 1~8 07 55094 9~29 324080 55 09 1003 6009 62~5~
J !~'(l 1 ~ 0 0 1~-9 ~ 1 " ,5 ~ l~ «) c53~ 1. ,_~Ji- 4,807 550911} 902J} )21~30 5;,L9 700; 6009 6201(3 l1i'?~~~ 1. ~~ n ., :)):, ,'L. ,1) .. 1 1:; 0 "fjo'~ 1.)~)9 t~&"'" ..,'
j,"" a 55~OO 802<lt. 299050 5701 6706 6403 6601 14,73 ], :, 1) v '-5 5 ~ 1 c ~·1 1~ (I c :;~6:, }, "~9 3~vo9 57029 '"( 098 296,,00 57,,1. 6'(06 6002 6~· 0 1l~ :Urr~· 1. ~ 0 /)'7 ~ 1. " :) ~ .1., [\ c,6o~ 1 c6l 35' v9 57029 8·)36 31.9000 ,900 6901 6200 66u5f3 Ih751 l~; 0 ':f'(:;.i. <35 lo006o~lo61 35,9 57029 i3,38 3190)0 5900 6901 6200 6605f3
.1Jv(6 1~, O,Y).:~ i L (b) 1:: 0 ,,65 ; }, " '7:; 35,,9 57,29 8,.8:; 34-1 10 6009 7005 6307 67o~ 1'477 1~ (J 06:;-' .' _L 6:' l~ 0 ,;6~:i~ 1. ( 73 35,,9 57029 8074 333080 6009 7005 6307 6606{3 1~''79 19:J ,,66 ~ 1,:7( }:; 0 '"('2.; .';, ,9~~ jl,8.7 ::;~)J 94 9035 358095 6205 1107 6109 680Cf3 llLiR~:~ 1~; 0 :il~.~ 1, ('7 1 \ 0 b?:; 1, :2:~-1 ~"1 .0
:,J~. v./ :59000 8085 283000 5000 61,,0 5700 54'02 148.3 l~ 0 (,)h,; 1. c 'J'( :" u c6~2~ 1 (,~!~ :5109 59000 9010 291.00 5000 61uO 5700 5402
Frlr'~ A til .-10 ... '" .'11 I ...... ".... .. .. $, * III * • . -- - '._ ....... k 1P h I "G. t i 1~'t: .... it .• «iIO *i'ii'S.r


;'T~~;'.
TABLE 10 (conttd)
{1~ {2,~ {3J {fi:J {5J {bJ ~7' ~8J ~9J ~10J (11)
1484 1~oD60:1.18 1:0.69:1 036 51·9 59·00 9.48 326·30 52.1 63.8 59·9 58.3 1487 1~0.68~1.33 1:0·16:1048 51·9 59.00 10033 379090 55.6 66.0 6201 62·3 1488 1~0075~1.47 1:0.83:1~63 5109 59000 10.62 405·QO 5800 6800 64.4 64.6 1490 1~0042:0094 1~0048:1.08 5109 59.00 9023 286·10 47.1 5804 54.2 52.6 ' 1491 1:0042~Oo94 1:0.48:1008 51·9 59·00 9·60 307·01 47.1 58.4 54.2 54.2
1492 1~0.48~1006 1~0.55:1.21 5109 59.00 9095 341.00 50.0 61.3 5700 58.0 1493 1~0.48~1.06 1~Oa55~1.21 5109 59·00 10.18 343·70 50.0 61.3 51·0 57.0 1494 1~0·53~1.18 1~0.60~1.33 5109 59·00 10085 378·50 5206 6308 5905 59.1 1495 1~0053~1.18 1~0.60~lo33 5109 59.00 10084 388010 5206 63.8 59·5 60.6 1496 1~0059~1032 1~0.66~1.47 55~1 60.42 11018 429·90 55·9 70·3 62,02 6306
1497 1~ 0 059: 1032 1~0066~1047 5501 60042 10089 411.00 55.9 7003 6202 6204 1499 1~0063~1041 1~0070~1059 5109 59000 9078 356055 5701 67.6 63.5 6107 1500 1~Oo6961053 1~Oo76~1069 5109 59000 10048 406010 5900 6901 65.4 65.7 1502 1~0074~1065 1~0082~1082 51.9 59000 10039 394010 6o Q 9 70·5 6701 6403 1503 1~Oo74~1.65 1~o082~1082 5109 59·00 10066 433.20 6009 70·5 67.1 6808'
1504 1~0034~Oa84 1~0040gQ.98 51·9 59000 9.76 284.00 44.4 5601 5108 49·3 1505 1~0034~o.84 1~0040~0.98 51·9 59·00 10.29 308.68 44.4 56.1 51.8 50.8 1506 1~Oo38~0.95 1~0.44:1.11 5501 60.42 10037 )48.40 47.4 59·0 55.1 5506 1507 1~0 .. 3a~Oo95 1~0.44~lo11 5501 60.42 10.47 352.60 4704 5900 5501 55·7 1508 l~ 0 o42~~ 1005 1~0052~1029 5501 60042 11.07 385.00 50.0 '61~6 57.6 57.' 1509 1~ 0 o4~~~ 1.05 1~0052~1029 5501 60042 11/·31 392010 50.0 61.6 57.6 57.4 1510 1~Oo47'~lo16 1~0054~1032 5501 60.42 9·92 358050 ,5204 6308 59.8 59·7 1511 1 ~ 0 04· (' ~ 1 0 16 1~0054~1032 55·1 60.42 9·93 366070 5204 6308' 5908 61.1 1512 1~Oo51:1026 1~0.57~1.41 5~·9 59000 10·,3 348,.40 54·5 6506 610-2 57.0 1513 1~O·51~1026 1~0·57~1.41 51.9 59·00 10·51 370.40 54 05 65·6 61.2 5907


TABLE :LO (contwd)
w~-~-'-121~~~~~~-~~~ (5)· T6)-~T7) (8) (9) (10) (11)
1514 1515 1516 1519 1520
.-~-~. ~. -~-
1~Oo55g1.o37
1~Oo55~lQ37
l~ 0 o59~ 1. )\'7 1~Ou63~lo58 1~0068~lo68
1~0062~lo54 5501 60042 10093 414050 56,,6 1~o(J62~1054 5501 6004·2 10 0 71~ 4·15070 5606 1~o066~1~65 55052 llo21 409030 5803 1~Oc70~lo75 5109 59000 9028 361080 6000 1~Oo75~lo85 5109 59000 9093 373050 6105
* High bearing stress~ tensile stress ratio not taken into account in conwutir~ this efficiency
6703 6306 6207 6703 6;06 64~o 6807 6506 6508 7000 66~3 6601 7101 6707 6307
a: Test results used in study of bearing stress~ tensile stress ratio effect
~ Test results used tn study of material ductility effect
1'\ I :1 .. kW ~; 'iJit : J -/ '!j:wlA '. I ~':.' t .~. ~C:i ~ '1\ ;. .', 1:' l~' "<' .... j'::~, .. ! . ""~:' ..... , .
. -.~~.~---'-""""-~'-~--""" ..... 11' II. it un"


·;ilt1l 1
TABLE 11
RESULTS OF TESTS BY WATERTOWN ARSENAL, 1887 (15)
All holes were'drliled~ All test results were used in tbe~ study of material.duct"i1ity effect.
Speeo T~B:S Ratios Reduct 0 Area, Matll Strength Gross Max. Efficiencies in Per Cent Noo AREA ReI. Gage per cent ksi Area Load AREA Wilson ReI. Test
Sqolno kips Gage (1) (2) ~3) ~4) ~5) ~6) ~7) (8 ) (9) (10) (11)
911 1~Oo78~1.47 1~0085~lo59 4oQO 53·71 13008 53508 7107 7307 7'706 7603 912 1~0078~1047 1~0.85~1059 4000 53·71 12.41 530.1 7107 7307 77.8 7905 913 1~0066~1026 1~0.71~lo35 4000 53071 12.81 557.2 75.6 76.5 80.0 80·9 914 1~Oo66~1.26 I~Oo71~1·35 40.0 53·71 12.69 512·5 75.6 76.5 8000 7502 915 1~0.66~1.26 1~Oo71~1·35 40.0 53071 12.69 562.1 75·6 76.5 80.0 '8205
916 I~Oo72~1·30 I~Oo76~lo38 45.2 51.19 14.67 516.1 6808 7309 7208 7007 917 1~0·72~1·30 1~0076~1.38 4502 51.19 14.65 530.1 6808 7309 72.8 6909 918 lg0072~1·30 1~0.76~1·38 45.2 51.19 14071 526.2 6808 73·9 72.8 7401 919 1~0062~1.11 1~0.65~1016 45.2 51.19 14.32 54300 74.2 77·1 . 7708. 74.1 920 1:0062~1011 1~0.65~1~16 45.2 51.19 14.44 554'~4 7402 77.l. 7708 7500
921 1~0.62~1011 1~0.65~1.16 45.2 51.19 14026 54100 7402 77·1 7708 7401 722 1~0.43~O.69 1:0.44~0071 45·2 51019 13.78 56204 7708 79.7 7906 79·7 923 1~Oo43~0.69 1~0.44:0.71 45.2 51019 13085 578.2 77.8 7907 79.6 8105 924 1~0043~0069 1~0.44~0071 45.2 51.19 13G74 5510' 7708 7907 7906 78.4 925 1'~ 0 0 36 ~ 0 D 77 1~OD36~0077 4000 53071 13·25 56705 7704 77·1 77·3 79.4
926 1~Oo36~0.77 1~O.36~0·77 4000 53·71 12·78 57808 77.4 77·1 77·' 84.3 927 1~0·36!Oo11 1~0.36~Oo71 40.0 53·7~ l2.81 59002 i 77.4 77·1 77·3 85·8 932 1~0066~1.26 1:0~71~1035 40.0 53·71 12·93 55903 / 75.6 76.5 80 .. 6 80.5


TABLE 12
RES"lJLTS OF 'rESTS BY WATFJi.TOWN ABSENAL y 1891 (16)
,_~.~~_. _~"" __ -':_J~~~' _~~~~
Reduct 0 Gross Max 0 Efficie~cy in Per Cent . . '.
Spec" T~S~B Ratios Area Matilo strength Area Load Relo Noo AREA Rel o Gage per cent ksi Sqo tno kips AREA Wileon Gage Test ~.llL~_~ (2) (3) . ________ (4-l~. ~ _____ ._i~ __ . __ ~ 6) (7) (§t ____ 19) (10) (11)
DRILLED HOLES
4911 1 ~ 00 50 ~ 10'78 1~0054~1093 5805 58015 3031 162050 76,,2 79~2 8205 84.4 4912 1~Oc50~1078 -I ~ 0 0 5 3 ~ 1. 0 90 5105 61047 3031 172000 7602 79·2 8102 84Q5 4913 1~Oo45:2031 1~0049~2052 5308 59018 3039 151090 68.2 7501 7404* 7507 4914 1~0045~2031 1~0049~2050 5105 61'047 3040 147090 6802 7501 7307* '70.8
4919 1~0.24:1023 1~Oo26~1033 51.5 61047 3.54 165072 69.6 7600 7501 76.1 4920 1~0024:1023 1~0026~.l033 5105 61047 3057 163015 6906 7600. 7501 74.3
4927 1~O027~1·37 1~0030~1.50 6203 58017 3059 172085 69.6 7600 76.3 80.3
4928 1~0027~lo37 1~ 0 0 29 ~ ,1048 51.5 61.47 3054 167088 69.6 76.0 7501 7701
4921 1. ~ 0 0 27 ~ 1 0 38 1~0030~1051 5805 58015 3016 146040 7200 '7704 7806 7906 ~·922 1~0027:1038 1~0030~J.051 5805 58.15 3015 147020 7200 77.4 78.6 8003
4929 1~0031~1058 1~Oo34~.1073 5805 58015 30.19 148070 7200 7704 78.6 8002 4930 1~0031~1058 1~Oo34~1073 5805 58015 3 oll~ 149020 7200 7704 7806 8107
4923 1~0036~1085 1~0039~1099 5308 61000 2057 147006 7704 8000 83·1 8102 4924 .l~OQ36~1085 1~0039~1099 5308 61.00 2055 145040 77.4 8000 8301 8101
4925 1~004~:201.6 1~0044g2028 5105 61047 3·29 169024 8000 8101 840 T* 8307
: ,UiiV!~ Ii H.~~;i~ .. · ",r~~~:, '111-'f1'fl
. ..• i .i";: ,L


I .... • •• IM llijj I iii I II 1IIIIIIII -... '. I ..... 1111111 • ' '1"1 _iii ... lliihilHII •• II.f. _IO •••• 'n.I •• " .'
Tab1e 12 (cont.c1) • Tan ••• 11111 ;"',' "
I ... : - ~
(1) (2) (3) (4 ) (5) (6) (,) (8) (9) ( lO) (ll)
4926 1:0.42:2016 1:0.45:2.32 58.5 58.15 3.01 16,.06 80.0 81~1 86.1* 95.4
4931 1:0.51:2.59 1 : 0 . 55 : 2. (7 53.8 58.18 3.25 154~82 80.0 81.1 85.5 * 80,5 4932 1:0.51:2.59 1:0.~5:2.7' 53.8 59·18 3.23 150·90 80.0 81.1 85.5* 78·9
4935 1;00,0:0077 1:0.33:0.86 53.8 61.00 2.74 117·20 58.6 68,.5' 65.6 70.1 4936 1:0.30:0.77 1:0034:0.87 56.5 62.30 2.64 111.80 5(3.8 68.5 66.1 67.9
4937 1:0.4-8:1.23 1~0.52:1.33 51o~ 61.47 3.57 170·90 69.6 761>0 75.1 7709 4938 1:0048:1.23 1:0.52:1033 51.) 610 47 3.58 173075 69.6 76.0 75,1 78.9
4941 1:00 49:1.65 1:0.54:1083 53.8 61000 2·90 125.50 60.9 67.3 6706 70·9 4942 1:0049:1065 1:0055:1085 5805 58.15 2088 123018 60.9 67.3 68.1 T~L5
4943 1:0037:1037 1:0042:1.55 58.5 58.15 2·90 119·27 5605 67~3 63.9 70.7 4944 1:0037:1.37 1:0042:1.55 58.5 58.15 2·91 116.98 56.5 67., 6309 69,,1
4945 1:0042:1058 1:0047:1.77 58.5 58015 3.10 124.10 60.0 70.0 67.2 69.1 4946 1~oo42:1.58 1:0.46:1074 5105 61047 3.17 134040 60.0 70.0 66.1 68.0
5125 1:0052:1014 1:0059:1030 51·9 61013 3007 110.30 5000 57.4 57.0 58.8
5128 1:0.65:1.42 1:0.70:1.53 51·9 61013 3073 177.30 7104 76.2 76.9 76 04
5129 1:0078:1.71 1:0.85:1.86 56.9 56.76 4.27 209.39 75.0 78:3 81.4 86.4
4993 1:0057:1.34 1:0.62:1c47 56.9 56076 4034 149.15 71.4 77.2 78 .. 0 78.8'
4995 1:0057:1.34 1:0062:1.47 5609 56~76 4.29 195.15 71.4 77.2 78.0 80, i'
4997 1~0.57:1.34 1:0.62:1.47 5609 56.76 4.39 197 q 60 71.4 77.2 78.0. 80.2
5119 1:0.68:1.36 1:0.83:1066 5609 . 56.76 4.24 181.28 63.8 7708 78.0 75.,
4999 1:0057:1.34 1:0062~1.46 56.9 56.76 4028 197·20 71.8 77.2 78.4 Bo.1: ,


Table 12 (cant I d)
"-"""',.-:::..-_a..><:";=~~~"~~~~~"",,~L-' :=o=-"-;~~='"'
(1) (2) (3) (4) (5) (6) (7 ) (8) (9 ) (10) (11) -;;-.>---~
4951 .l~Oo34~Oo97 1~Oo37~1006 5206 59073 3034 144058 64.7 72.6 7007 7204 4952 1~0034~Oo97 1~0.37~1.07 5501 58034 3026 138015 6407 72.6 7103 7206
4953 1: 0 .L~8: 1037 1~0053~lo50 5501 58034 4008 190010 7104 7609 7707 7908 4954 1~0.48~1·37 1~0.53~1050 5501 58.34 3085 189015 71.4 7609 7707 84.2
1~955 1~0.60~1073 1~0.65g1087 55.1 58034 4079 232086 76.0 79·3 82.0 8303 4957 1~0073~2009 1~0079~2026 5706 56067 5035 259·50 7903 8007 8505* 85.5 4967 1~0025~1000 1~0027~1010 5305 57087 5039 231020 65.3 7304 7106 7401 4969 1:0·32:1027 1~0035~1·38 5501 58034 5016 228040 7004 76.6 76.7 7509 4970 1~0032:1027 1~0.35~1.039 57.8 54029 5016 223010 7004 7606 7700 7906
4971 1~0039:1053 1~0042~1066 5602 57013 5086 263.20 7402 78.6 80.5 7806 4973 1~0046~1080 1~0050~1094 5501 58034 5.20 239010 77·2 80.0 8301 78.8
4975 1~0053~2007 1~0056~2019 5004 59003 5046 255.10 7905 8100 8400* 79·1a 4977 1~0059~2033 1~0063~2049 5602 57·13 6009 271094 8104 81.8 86.9* 78,la
4·963 1~0051~0073 1~Oo57~0082 5501 58034 4.06 164070 5701 66.7 6401 6905
4-965 .l~0063~0091 1~Oo70~1001 550]. 58034 4061 195030 6205 7100 6903 7202
4-981 1~0037:0073 1~0042:0082 5507 53073 4055 176048 5800 6800 6501 72.2
4983 1~0051~.loOO 1~0056g.lo.l1 4706 56067 5031 228060 6503 7304 7202 76.0
5145 1~0058~1.069 190065~.l089 59,5 52091 5086 247060 6101 7002 6802 7908
4968 .1.g0030~1.000 .1.~O033~1009 5107 61014 5089 255040 6503 7106 7101 7009
513.1. 1 ~ 00 52 ~ 0 .'rr 1~0061~0090 4906 59000 5012 162050 4105 5108 4806 5308
5.149 1~0048~0069 1~0054~0078 5308 61065 5095 24·1070 5603 6603 6302 6508
i ~i ;., il £'1 .. ~ : ~ J l·-, 1


·~r:u ..
Table 12 (cont l d)
(1) (2) (3) (4) (5) (6) , (7) (8) (9) (10) (11)
5151 1~Oo58~Oo85 1~oQ63~0093 4906 59000 5079 249082 6101 7002 66.8 73·1
5157 1~0053:0077 1~0057~0083 49c6 59000 5·93 271.10 68.2 ' 7501 7303 77·5
5158 1~0060~0087 1~0066~0095 5905 52091 6020 301098 7008 76.7 7705 9201
5159 1~0.67~0097 1~0073~lQ05 5406 58009 5052 265020 7300 7709 7901 82.7
5139 1~0030~0063 1~0037~0·77 5406 48009 5016 145048 3705 4804 4507 4805
PUNCHED HOLES
5120 1~oQ68~1036 1~0065~1027 5405 59030 4028 173090 7104 7708 -6608 6805
5000 1~0057~1Q34 1~0053~1026 5405 59030 4028 188015 7108 7702 6702 7401
5143 l~0048:1039 1~0.46~1032 4807 59039 6017 200080 56.3 6603 5306 54.8
5146 1~0058~1069 1~0055~1061 5308 61065 5069 226.10 6101 70.2 '580"3 64.5
5148 1~0070~2000 1~Oo66g1q89 51,7 61014 6017 226020 6500 7300 6103 ' '60.0
5132 1~0052~0077 1~0054~0080 5905 52091 4099 138080 4105 5108 4209 5206
5134 1~0052~Oo77 1~0052~Oo78 5107 61014 ,5037 163010. 4105 " ,5108 42o~ 4907
5150 l~0048~0.69 1~0046~0067 5308 61065 5093 224080 5603 6603 ' 54.5' 6104
5152 1~0058~0085 1~0054~0080 4807 59039 5094 230090 61.1 7002 5704 65.4
* High bearing stress~ tensile stress ratio not taken in.to account in computing this efficiency.
ex Test results used in study of bearing stress: tensile stress ratio effeot.


TA81& 1.3
RESULTS OF TES'I'S BY \lTATERTOWN ARSENAL, 1896 (18)
All Holes were drilled 0
Reduct 0 GroBs Max 0 Efficiencl in Per Cent Spec. T:S~B Ratios Area Mat'l. Strength Area Load Re1.
No. AREA Rel. Gage per cent ksi Sq. in. kips AREA Wilson Gage Test (1) (2) (3) (4 ) (5) (6) (7) (8 ) (9 ) (10) (11) .
8507 1~Oo42:1.02 1:0.45~1.lO 53 0 0'/ 60.55 4.91 248.2 80.0 81.6 86.1 8305 8515 1:0.40:0.98 1~o.43:1.06 52 .9 59.89 7~05 36100 80.0 81.6 86.1 85.5 8509 1:0.40~0.93 1:0.42~0·97 53.0,,! 60055 7.49 384.1 86.6 81.0 86.1 8407 8510 1~0.56~1.29 1~0:54:1.24 53.0,,! 60.55 10.08 503.5 89.4 83.0 86.1 82.5
"! Assumed values.
- ~,
~'--... ~ ............... .~ ...-..- _ .......... .-...._ ............... 2" t • • _ ~_,. ____ ~--... ..... '" •• _P ... ..... .... at to ... ", n ....... litM ....... - ........ tinb.n ••• 'lhjl"n ••


t~'i'_ ::, .
TABLE 14
RESULTS OF TESTS BY GAYHART (18)
All holes were drilled. Reductions in areas listed were a.ssumed.
No. Reduct. Max. Efficiencies in Per Cent Speco Tests T:S:B Ratios Area Mat'l. strength Load
AREA Wilson Rel. No. Avg'd, AREA Rel. Gage Percent ksi kips Gage Test
(1) (lc) (2) (3) (4) (5) (7) (8) (9 )' (10) (11)
A-MS 3 1:0.82:1.72 1~0.89~1.86 57.0 57.40 806 76.4 79·7 82.7 85.0 A-HTS 3 1~Oo82:1072 1:0.86:1.80 47:0 79·17 1055 76.4' 79·7- 86'.2 81.5 B-MS 3 1~0.55:1.15 1:Oo60:1.21~ 57·0 59.76 824 76.4 79·7 82.7 84.0 B-HTS 3 1:0.55:1.15 1: 0 . 58 :. 1021 47.0 80.74 1089 76.4 79·7 80.2 81.7 C-MS 3 1:0.41:0.86 1~0.43:0090 45.0 65.31 868 76.4 79·7 79.7, 82.3
C-HTS 3 1:0.41:0.86 1:0.43:0090 47.0 79.97 1060 76.4 79 ·7, 80.2 80.3· D-MS 3 1~0.71~1.49 1:0.69:1.44 45·0 64.98 851 85.8 79· 7 . , 83.0 81.1 D-HTS 3 1~0.71:1.49 1:0.69:1.45 4700 80.32 1053 85.8 79·7 83.5 79.7 E-MS 3 1~0.51~1.08 1~0.49~1.04 45.0 65.26 849 ·85.8 79·7, 83.0 81.0 E-HTS 3 1:0.51~1.08 1:0.49:1.04 47.0 81.52 1091 65.8 79·7 83.5, 80.3
F-MS 3 1:0.80:1.68 1:0.77:1.63 45.0 65.73 902 85.8 79·7 83.0 85.0 F-HTS 3 1:01.80:1068 1:0.77~1.64 47·0 81.60 1113 85.8 79·7 83.5 81.0 G-MS 3 1:0.56~1.17 1~0.54:1~13 45.0 65·31 905 85.8 79·7 83.0 84.3 G-HTS 3 1:0.56:1.17 1:0.54:1.13 47.0 78.55 1096 85.8 79·7 83.5 83.0


- .--- - ~ ..
Spec. No.
(1)
CCC2-2-1 CCC2-2-2 CCC2-3-1 CCC2-3-2 ccc2-4-1
ccc2-4-2 CCC2-5-1 CCC2-5-2 ccc2-6-1 ccc2-6-2
CC5-1 CC5 ... 2 OCC2-3-1 DCC2-3-2 DCC2-4-1
.L":'.I.
TABLE 15
RESULTS OF TESTS BY DAVIS~ WOODRUFF~ AND DAVIS (1)
All holes were subpunched and reamed. Material was assumed to have a reduction in area of 57 per cent.
T~S:B Ratios Mat'l. Strength Gross Max. AREA ReI. Gage ksi Area Load AREA
Sq. in. kips (2) (3) (5) (6) ill {8)
1:0.66:1.39 1:0.58:1.22 69.3 7.80 399 79.5 1~0.66:1.39 1:0.58:1.22 69·9 7·77 390 79.5 1:0·71:1.49 1:0.63:1.31 68.2 7·77 388 8,5.1 1:0.71:1049 1:0.63:1.31 68.1 7·79 391 85.1 1:0.75:1.56 1:0.63:1.31 68.4 7.76 400 B9.3
1~Oo75:1.56 1:0063~1031 70.4 7·70 403 89.3 1:0.75:1.58 1:0.63:1·31 69.7 8.03 428 90.0 1:0.75:1.58 1:0.63:1.31 70·3 8.04 410 90.0 1:0.75:1.58 1:0.63:1031 69.8 7.98 420 90.0 1~0.75:1058 1:0.63:1.31 69.9 9·01 417 90.0
1:0.75:1.57 1:0.70:1.47 68.2 8.04 ~-23 74.7 1:0·75:1.57 1~0.70:1047 67.6 8.07 413 74.7 1 ~ 0 0 66 : 0 0 E33 1:0.6~~~.79 68.1 13.08 691 79·5 1~0066:0.a3 1:0063~0079 68.1 13.11 703 7905 1:0.75:0094 1:0063:0079 68.4 13.18 701 89.3
("~ ....... -:--'" f·--"'~- --.~~:~
Efficiencies in Per Cent
Wilson ReI. Test Gage
(2) (lQ)_ _( 11 )
76.2 69.9 73.8 76.2 69.9 71.8 76.2 75.0 73·2 76.2 75.0 73.7 82.5 75.0 75.4
82.5 75.0 74·3 82.5 75.0 76.5 82.5 75.0 72.5 82.5 75.0 75.4 82.5 75.0 74.5
76.2 69.9 77·1 76.2 69·9 75·7 76.2 75.0 77.6 76.2 75.0' 78.7 82.5 75.0 77.8
. L, .dl. Ii-. " "I.+;c ,j; uD:l} .iJ\,.J~,i;';' ,iiiti, JiJ .~Jijl.d'~


-'nr.~
(1) (2) (3) (5) (6) (7) (8) (9) (10) (11)
DCC2 .... 4 ... 2 1:0.75:0.94 1:0.63:0.79 67.6 13.17 698 89.3 82.5 75.0 78.4 DCC2-4-3 1~0.75:0.94 1:0.63:0.79 67.2 _ 13015 .710 89.3 8295 75·0 80.31-DCC2-4-4 1:0.75:0.94 1:0.63:0.79 69.2 13·17 717 89.3 82.5 75·0 78.6 DCC2-5-1 1:0.75:0.94 1:0.63:0.79 67.6 \ 13.02 686 90.0 82.5 75.0 -77.9 DCC2-5-2 1:0.75:0.94 1:0.63:0.79 67.8 13.05 695 90.0 8205 75.0 78.5
DCC2-6-1 1~0.75:0.94 1:0.63~Op79 67.0 12·97 669 90.0 82.5 75.0 77·0 DCC2-6-2 1~0075:0.94 1:0063:0.79 67·3 12·99 684 9000 82.5 75·0 78.2 DCc5-1 1:0078:0.98 1:0·73:0.92 6709 12·79 754 74.7 7602 69.9 7503 DCc5-2 1:0.78:0.98 -1~0·73:0·92 67·3 12.80 671 74.7 76.2 69.9 77.9 FSCA-l 1~0.52~1.04 1:0.45~0990 92.1 13.74 941 86.3 81.3 74·3 74-.4
FSCA-2 1~Oo52:1.04 1~0045~0090 90.8 13.84 957 86.3 81·3 74.3 7602


TABLE 16
RESULTS OF TESTS BY CAYCI J MONSE AND WIlSON (2)
Holes were subpunched and reamedo
Reduct 0 Gross Max 0 Efficiency in Per Cent Speco T~S~B Ratios Area Mat'lo Strength Area Load Relo No. AREA Re.l. Gage Per cent ksi Sqo ino kips AREA Wilson Gage Test (1) (2 ) (3) (4) (5) (6) (7) (8) (9 ) (10) (11)
Al I~Oo60~1010 1~0052~0095 5106 6108 11074 60509 8404 80.6 7300 8304 Bl 1~0060~1010 1~0.52~0095 5106 6108 11070 558.0 84.4 8006 73·0 77·2 B2 1~0060~1010 1~0052~Oo95 5106 6108 11.45 52306 8404 8006 6300 74.0 Cl Ig0046~0.84 1~0041~0074 5106 6108 11078 56100 84.4 80.6 73·0 7702 D1 1~0052:0095 1~0044~0080 5106 6108 11074 63600 8803 81.8 7309 8702
El 1~0048~0088 1~0044~0081 5106 6108 11078 56800 7606 ~907 7003 7801 Fl 1~0035~0065 1~0032~0060 5106 6108 11072 56308 7007 73-1 6506 7708 A3 1~Oo58~1036 1~0049~10l4 6300 6503 8024 40400 8903 8102 7407 75.0 B3 1~0.58~1036 1~0049~1014 6305 6404 7095 39607 8903 8102 7407 77·5 C3 1~0042~1001 1~0037~0089 60.6 6401 8007 40104 84.8 8106 7407 77.6
D3 1~0048~1013 1~Oo40~0094 6404 6400 8.22 402.5 89.8 82·3 7500 7604 E3 1 ~ 0 0 l~ 5: 1 006 1~0042~0099 6301 6400 8026 39907 7906 80.9 7400 7505 F3 190034:0080 1~0032~Oo75 6304 6407 7099 37007 7406 7503 6908 7107
1lla.· "·1 /" :1 ..... .' 4HH .. 11: ... -.. .......
:! :~. 1.I,i;,'(j \' i:; , !if .,. r
..... _ .• "-...... , . __ .-,,: .. ,._.-'Loi. .... ~ ...-.. •• .:L ... ,_ • . ~ ...... .l.,.;...1,.,,"-, 4ir.. ~L~~&I...l..J ~ .L. •.


r:flt"!~f" Table 17
RESULTS OF -TESTS BY BECKER SINNAMON J AND MUNSE (19)
Holes were subpunched and reamed.
Reduct 0 Gross Max 0 Efficienc~ in Per Cent Spec o T:S:B Ratios Area Mat'l. strength Area Load ReI.
No. AREA ReI. Gage per cent 'ksi Sq. in. kips, AREA Wilson Gage Test (1) (2) (3) (4) , (5) (6) (7) (8) (9) (10) (ll)
, . 49-lA 1~0.82~1.29 1~0·73:1.15 42.6 6704 4.908 180·7 7408 74·9 66.9 5406 49-lB 1:0.82:1029 1:0073~1.15 4206 67.4 4.909 168.6 74.B 74.9 66.9 51.0 49-2A 1 ~ 0 . 82 ~ 1 . 5~· 1~0.72~1.36 46.5 66.4 4.BI0 21tl·7 7B.0 76.4 6B.9 66.3 49-2B 1~0.82:1.54 1:0.72~1.36 46.5 66.4 40821 214.2 7B.0 76.4 68.9 66.9 49-3A 1:0081~1.91 1~0.70~1.64 45.3 6300 4.3B7 195·0 Bl.6 7B·3 7002 70.6
49-3B 1~0.81~1.91 1~0·70~1.64 45.3 63.0 40445 196.0 81.6 78.3 70.2 7000 49-4A 1~0081~2.54 1:0.68~2.12 4500 66.6 40213 188.2 85.5 80.1 71.5* 67.1 49-4B 1~0.81:2.54 1:0.68:2.12 45.0 66.6 4.289 202.0 85.5 BO .. 1 71.5* 70·7 49-5A 1:0.81:3.05 1:0.68:2.55 48.5 6209 4.200 191.2 8705 81.0- 7301* 72.4 49-5B 1:0.81~3.05 1:0.68:2.55 4805 62.9 4.228 194.2 87·5 B1 .. 0 73·1* 73.oa 49-6A 1:0082:1.28 1:0·76~1.19 55.4 5707 8.546 39004 ' 75.1 74.9 69.9 79.2r] 49-6B 1:0.82~1.28 1:0.76:1.19 5504 5707 8.504 389·9 75.1 74.9 . 69.9 79.~, 49-7A 1~0082:1.57 1:0.74:1042 5408 60.7 80197 34101 78·7 77·0 71.1 68.6 49-7B 1:0.82:1.57 1:0.74:1.42 54.8 60.7 80145 334.4 7B.7 77·0 71.1 67.6 49-8A 1:0082:2.04 1:0·70~lo73 44.1 65.5 7.932 370.0 82.7 79·0 70.2 71.2
49-BB 1:0.82:2.04 1~0·70~1.73 44.1 65.5 7·932 369.0 82.7 79·0 700.2 7100 49-9A 1:6.82~2054 1:0.70~2.16 49.2 6209 7.499 331.2 85.6 80.3 72·7*.70.2 49-9B 1:0.B2:2.54 1:0.70~2.16 4902 62.9 7.499 32B.6 85.6 BO.3 72.7* 69.7 -49-10A 1:0.82:2.90 1:0060:2.41 45.4 65.0 70584 341.9 87.2 81.0 72.4.* 69·~ _ 49-10B 1:0.82:2.90 1:0.60:2.41 45.4 65.0 7·604 357·0 87.2 Bl.0 72.4* 72.2·


Table 17
(1) (2) (3) (4) (5) (6) (7) (8) (9 )
49-1XA 1~0082~1029 1~0076~1020 5400 6002 4.751 211.6 74.9 74.6 49-lXB 1:0082~1029 1~0076:1q20 5400 60.2 40750 209.2 74.9 ·74.6 49-lXXA 1~0082~1.29 1~OQ76~lo20 54.0 6002 40750 208.9 7409 74.,6 49-lXXB 1~0082~1.29 1~0076~1.20 5400 60.2 4.,748 22904 7409 74.6 49-4XA 1~0.82g2.55 1~0.71~2.19 52.9 6200 40225 368.0 85.5 80.1
49-4XB 1:0.82~2055 1~Oo71~2o,19 5209 6200 4.248 377·0 85.5 8001 49..,6XA 1~0.82:1028 19O.75~1018 52.0 5705 80522 376.0 75.1 7409 49-6XB 1~0082~1028 1~0.75~1018 5200 5705 8.485 34700 75.1 '7409 49-6XXA 1~0082~1028 1~0075:1018 5200 5705 8.529 21403 7501 7801 49-6XXB 1:oo82~1.28 1~0075~lq18 52.0 57.5 80511 211·9 7501 7801,
49-9XA 1~Oo82~2054 l~0070~2.17 5104 63.7 70337 34906 85.7 8003 49-9XB 1~oo82~2054 1~0070~2017 51.4 6307 70343 35003 85.7 8003
* High bea.ring stress: tensile stress ratio not taken into ,account in oomputing this effioienoy 0
1) Rivet shear failure
a Combined plate and rivet shear failure
,\lAiI " ,J.., j~ ,~ ~:" .. , . j ,iki .:i:i . .' ; ,:.!. ,'., 11.." .'1 H, ,1 ul;JJ. ;;:,iti,' " I .. ""1IIiIil
!·Li> :111.1 ~J).l;tll~_~i.'.WJHi.illi.iUi~l
~10) (11)
69.5 74.0 69.5 73<12 69.6 73·111 6906 80q~ 73.5* 81.8
7305* 80.5 6900 75" IT} 69,,0 77·2
' 69.;1 ,76.711 6900 71~,411
,7302*7,4'.8 7302* 7409


TABLE 18
RESULTS OF TESTS BY MASSARD, SINNAMON AND MONSE (20)
All holes were subpunched and reamed. All results used in bearing stress: tensile stress ratio effect study.
Reduct 0 Gross Max. Efficiency in Per Cent Spec. T~S~B Ratios Area MatVl. strength Area Load ReI.
No. AREA ReI. Gage Per cent ksi Sq. in 0 kips AREA Wilson Gage Test (1) (2) (3) (4) (5) (6) (7 ) (8) (9) (10) (11)
50-lA 1~0.75~lo42 1~Oo80~1052 53·2 6304 20771 27101 7203 74.6 7703 77·2 50-lB 1. ~ 0 .75 ~ 1 0 42 1~0080~1052 5302 6304 20651 26902 72·3 7406 77·3 77 01 50-1C 1~0075~1042 1~0.80~1.52 '53.2 6304 20755 270·3 72.3 74.6 77·3 77.4 50~2A 1~0075~1.76 1~0080~1.87 :5009 5907 2.502 246.6 7605 79.4 81.3 8206 50-2B 1~0.75:1<76 1~0080~1087 50·9 59·7 20512 244.0 76.5 7904 81.3 81.4
50~2C 1~0.75~lo76 I~Oo80~1.87 50·9 5907 20481 24505 7605 7904 81.3 82.9 50~3A 1:0.75~2·36 1~0·78~2.46 5104 6102 2.398 225.6 81.3 . 80.3 84.6* 76.9 50-3B 1~0075:2036 1~0.78~2046 51.4 61.2 2·371 240·9 81.3 80·3 8406* 83·0 50-3C 1~0075~2036 1~0078~2046 5104 6102 2·373 23208 81·3 80·3 8406* 80.1 50-4A 1~0075~1·37 1~Oo81~104·9 5206 62.0 3.755 35803 71.9 75·4 77.6 77·0
50-4B 190.75:1·37 1~0.81:1049 52.6 62.0 30753 355·.8 71·9 75.4 7706 760~ 50-4c 1~0.75~lo37 1~0.81:1.49 5206 62.0 30757 360.3 71·9 75.4 77.6 77 .311 50-5A 1:0075~1.65 1~0080~1076 5002 63.4 3.625 35803 75.5 79.1 80.4 7709 50-5B 1~0075~1.65 1~0080~1·76 5002 6304 3.628 358.6 75·5 7901 80.4 78.0 50-5C 1~Oo75~1.65 1:0080~1.76 50.2 6304 30593 361.5 7505 79·1 80.4 79.411
50-6A 1~0.75~2.06 1~0.78~2.15 46.4 62.3 3~504 34700 7904 79·7 8207* 79·511 50-6B 1~0075~2.06 1~0.78~2,,15 46.4 62.3 3.449 35109 79.4 79·7 82.7* 81.2r) 50-6c 1~0.75~2006 1~0.78~2015 46.4 62.3 3·391 337~6 7904 79·7 82.7* 79·9 50-7A 1~0075~2075 1~0076~2.79 53.1 6001 30276 288,,8 8307 80.6 84.9* 73·3 50 ... 7B I~Oo75~2075 1~0076~2.79 53·1 60.1 3·227 295,,3 83.7 80.6 84.9* 76.1


Table .1B \ c:ont I d)
.-~. ~. '~--=-=--'-~~' -~~. -.~'~
(1) (2) (3) (~. ) (5) (6) (7) (8) ---.....::-=-"-
50-7C 1.g0075g2075 190076g20?'9 5301 600.1 30243 28502 8307 50~8A 1. ~ 007 5 ~ 1034 1 ~ 0 0 7 9 ~ .1. c 4·1 5203 6409 4'0816 44207 710'7 50-BB .l~0075~1034 1. gOo 79 ~ .1.0 4·.l 5203 6409 40782 44405 710'7 50~8c 1~0075~1.034 .l~ 0 0 79 ~ 1. 0 4·1 5203 6409 40765 44202 7107 50-9A .1. ~ 0 075 ~ 1. 0 57 1~0080~106U 5203 6207 407.18 43607 7407
50-9B 190075~1057 1~0080g.l068 5203 6207 4p718 44809 7407 50o-9C 190075~lo5'7 1~0080g1068 5203 6207 4'0718 45408 7407 50-lOA .l~ 0 075 ~ .1 088 ]. ~ 0 " 08 g 2 000 5107 6209 4065.1 4·6502 7800 50-1GB 190075g1088 lg0008g2000 5107 ()209 40592 47105 7800 50-l0C 190075~1088 1~0008g2o()0 5107 6209 40611 46008 7800
50-11A 1~0075g2035 1 gOo '77 ~ 2 0 t~o 4907' 6001 40186 39303 8106 50-1.lB 1~0075~2035 1 gOo 77 ~ 2 )~O 4907 6001 40223 39202 8106 50~11.C 1.~0.75~2035 1~0077~2040 490{, 6001 40206 . 39905 8106
NOTE~ For purposes of computing the relative gage efficiencies the holes of this series were considered to be drilledo
(9) (10)
8006 8409 7603 7504 7603 7504 7603 7504 7805 8001
7805 8001 7805 8001 7902 83cO 7902 8300 7902 8300
8000 8305* 80.0 8305* 8000 8305*
* High bearing stress: tensile stress ratio not taken into acoount in computing this efficiency.
'l1 Rivet shear faj.lures 0
~~i j; ;:;.ji' . 1,1 :kf . :;.;. ~,' ! ~ ~'{' };r~~~'ll h,J; .il i,~ , ~,~ ; , t ~'~1~'; ;" '~L ,
(11)
7302 7008 7106 7105 T}
7308
75.9 7609 7905 8105 7904
7904 7703 79·0


_J.~--"'·"-"''''''·t #1_'1 * WthMtOt4·W· • • ,-., ItH:iM*. *Ih ' .... ''M .1 l..IIi&..;.-..I;IM,' ............... ~··-' .......... 'mnr'.,,:!"n. 1,.11 •
,1M" ~rn~ ,
RESULTS OF TESTS BY BERGENDOFF AND SCHUTZ (21)
All holes subpunched at least 3/16 in. and reamed. All results used in bearing stress: tensile stress
ratio effect study.
Reduct. Gross Max. Efficiency in Per Cent Spec. T:S:B Ratios Area Mat'l. Strength Area Load Rel.
Noo AREA Relo Gage per cent ksi Sq. ino kips AREA Wilson Gage Test (1) (2) (3) (4) (5) (6) (7 ) (8) (9 ) (10) (11)
51-lB-l 1~Oo75~1056 1:0.80~lo60 50·5 64052' 5.432 26709 7404 7803 79.3 7604 51-2A-l 1~0075~1076 1~0079g1085 4704 64005 ~50 176 26~1.9 7604 7905 80.3 78o~ 51-2B-1 1~Oo75~1076 1~o.8o~1087 4909 67012 5.165 279.2 76.4 79·5 8100 . 80.5t3 51-4A01 1~O075~1045 1~Oo74~lo42 2508 66066 90627 45702 73·1 78.1 71.8 7102f3 51-6A-l 1~O075~2009 1~oo7e~2.18 4407 64044 8.657 42.1.7 7908 81.1 8301* 75.6
~ Test results used in study of material duotility effeot.
* High bearing stress: tensile stress ratio not taken into aooount in oomputing this effioienoy.
NOTE~ The holes of this program are considered equivalent to drilled holes.


TABLE 20
HEsunrs OF' TESTS BY BARON AND LARSON, RES 0 COD OJ PRO,J 0 V (22)
All holes were drilled 0
.=~~~~
Reduct 0
S.peco T.~S~B Rati.os Area Mat!lo Strength No 0 AREA Helo Gage per cent ksi
,~ 11~~~"~-.1?J __ .~_.~_~~~ ~~U) ( 4) 15 )
A.IR-AI A2H-A1 A3H=A2 A.1.CC~Al
AICCa·.Bl
A2CC=A2 A2CC=B2 A3CC~A2
A3CC~B2
AlCH-A1
AlCH~Bl
A2CH~Al
A2CH-A3 A3CH~Al
A3CH-B1
AlB-AI A2B-A1 A3B-Al B1CH-A2 BICH-B2
B2CH-A2 B2CH-B2 B3CH-A2 B3CH-B2
.l~Oo75~lo57
l~0075~l057
l~0075~1057
1~0075~1.57 .1 ~ 007 5 ~ lo 57
1~0·75~1057
1~0075~1·57 1~0075~1057
1~0075~1057
1~0075~lo57
1~0075~1.57
1~0·75~lo57 l~Oo75~lo57
l~Oo75~lo57
19Oo75~lo57
1~0·75~1.57
l~0·75~1·57 1~0·75~1·57 l~0·76~1059 1~0.76~1.59
1~0076:1.59 1~0·76:1.59 1~0076:1059 1~0076:1.59
1~Oo81~1071 1~008.l~1071 l~ 0 .8.1~.l 071 1~008l~.l.071 1~0.8.1.~10Tl
1~0081~1071 1~0081~l071 1~0081~1071 1~Oo81~l07l 1~0.81~.l.7l
.l~008.1.~1071 I~0081~.l071 1~0081~1071 1~0.81~lo71 1~0.81~1.71
1~o.81~1.71 l~0.81:1.71 1~0.81~.l.071 1~0.82~1·72 1~0082~1072
1~0.82~1.72 1~0.82~=L.72 l~0.82~1072 1~0.82~1·72
6000 6000 6000 6000 6000
6000 6000 . 60.0 6000 6000
6000 6000 60.0 60.0 6000
6000 6000 60.0 55·0 55.0
55·0 55.0 S,500 5500
6509 6509 6509 6509 65.9
6509 6509 65.9 65.9 65.9
65.9 6509 65.9 6509 65.9
65.9 65·9 65.9 63.2 6302
63·2 6302 63·2 6302
Max 0 Effioienoies in Per Cent Load Relo kips AREA 17) (8)
28105 28400 28500 27700 28100
28000 27800 27300 27900 287·0
:282.0 282.0 286.0 286.0 :289.0
287.0 :290.0 :29600 273·0 :26700
265.0 :267.0 :264.5 259·0
7403 7403 7403 7403 7403
74.3 7403 7403 7403 7403
74.3 74·3 7403 74·3 74.3
74·3 74·3 7403 75·3 75.3
75·3 75·3 75·3 75·3
Wilson Gage Test (9) (10) (l~
76.9 7609 7609 7609 7609
7609 76.9 76.9 76·9 76.9
76.9 76.9 76.9 76·9 76.9
76.9 76·9 7609 76·9 76.0
7609 76.9 76.9 76.9
8007 8007 8007 8007 8007
8007 80·7 80.7 80.7 80·7
80.7 80·7 80.7 80·7 80.7
80.7 80.7 8007 81.3 81.3
81.3 81.3 81.3
·81.3
8001 80.8 8307 7808 80.0
80.5 8302 83.2 82.5 8106
80.3 80.3 8105 81.5 82.2
81.7 82.5 84.4 82.0 81.6
81.6 81·3 81.6 81.6
I" .;' :', ~ft , ~ j ~< ,~t, ~! : j" i1t ,! if " ' Ii i;J (.;~ i/lt '}'


• •••••• IIi~ *. sdt& iii t I,,' t+. AM '**~ ... tit 'del. #Hi 'ttid.'. bL W· t riM }"k''"' W,*" tWM·iN"dwtbTSZ·' M """"='1"1_' # . mn'Tm '"~"""'jH . ~~ I 'f. -; : .• ~,
TABLE 21
RESULTS OF TESTS BY BARON AND LARSON, RES. COU., PROJ. VII (23)
All holes were drilled.
Reduct. Max. Efficiencies in Per Cent Spec. T:S:B Ratios Area Mat'l. Strength Load Rel.
No. AREA ReI". Gage Per cent ksi kips AREA Wilson Gage Test .. J2:) (2) (3) (4) (5) {72 (8) __ C2L_ (10) (11)
SA-7 1:0.76:1.30 1:0.82:1.39 53·9 69.00 593·0 78·3 80.5 84.0 83·0 01-7 1:0.78:1.33 1:0.82:1.40 53·9 69.00 604.0 79·7 80.5 84.0 84."5 01-13 1~0.78:1.33 1:0.82:1.40 53·9 69.00 605.0 79·7 80.5 84.0 84.7 02-7 1~0.87~1.48 1~0.84:1.43 53·9 69.00 603.0 89.1 81.2 85.8 84.4 11-7 1:0.78~1.33 1~0.82:1.40 53·9 69·00 581.0 79·7 80.5 84.0 81.3
II-E3 1:0.78:1·33 1:0.82:1.40 53·9 69.00 558.0 79·7 80.5 84.0 82.3 12-'7 1~0.87~1.48 1:0.84:1.43 53·9 69.00 592.0 89·1 81.2 85.8 82.8 12-8 1:0.87:1.48 1:0.84:1.43 53·9 69.00 594.0 89·1 81.2 85.8 83.1 SB-'7 1:0.76:1.30 1:0.81:1.039 53·9 69.00 550.0 78·3 80.5 83.9 82.4 SB-a 1~0.76:1.30 1:0.81:1.39 53·6 64.80 542.0 18.3 80.5 83.9 81.3
P1-'7 1:0.76:1.30 1:0.81:1.39 53.6 64.80 536.0 78.3 80·5 83·9 80·3 Pl-8 1:0.76:1.30' 1:0.81:1.39 53.6 64.80 520.0 78.3 80.5 83·9 77·9 P2-7 1:0·76:1·30 1:0.81:1·39 53.6 64.80 553.0 78.3 80.5 83.9 82.8 P2-8 1:0.76:1.30 1:0.81:1·39 53.6 64.80 554.0 78.3 80.5 83.9 83.0 13-8 1:0.87:1.48 1:0.84:1.42 53.6 64.80 540.0 89.1 81.2 85.7 81.0


TAB.LE 22
RESULTS OF TESTS BY HARRIS (2.4)
-~
Reduct 0 Gross Max 0 :B!ffi.ciency :i.n Per Cent Speco 'rgS~B Ratios Ares" Mat~lo strength Ar'ea Load Relo
Noo AREA Re1Q Gage Per cent ksi Sqo tne kips AREA WIlson Gage Test (1) (2 ) (3) (4) (.5 ) (6 ) (7 ) (8) (9 ) (10) (11)
~.~=-
DRIlLED HOLES
Cl 1~oQ46~.loOl l~ 0 049~ 1 007 4-501 56030 50408 22609 680'( 7506 7208 7405 D1 .1 ~ 0 0 4 6 ~ :1. 00.1. 1.~0049~1,07 L! 501 57 04-0 50390 22803 680'{ 7506 7208 7308 C2 .1 ~ 0 c 47 ~ 1 c,04 1~Oo49~.1.008 4501 56030 50439 226,0 7004 7506 7208 7308 D2 .1 ~ 0 0 4''( ~ 1. " 04 .1. ~ 0 0 !~9 ~ .1. 008 L\ 50.1 5'7 04·0 5 o~67 23101 7004 7506 7208 7306 C3 .1 ~ 0 c I) 8 ~ 1 0 04 1~0049g1007 4501 56080 50477 23200 71.0.1 7506 7208 7406
D3 1~0.4-8~J.o04 l~ 0 "LI9~.1. 007 4 ~j c1 57050 50485 23907 7.l01 7506 7208 7600 c4 .1 ~ 0 0 50 ~ 1009 .l~Oo49~1007 )+501 56080 50510 23703 7403 7506 7208 7508 D4 .l~0050~1009 .l ~ 0 0 49 ~ :1. 0 07 450.1 51050 50539 23904 7403 7506 7208 7502 C5 1~Oc53~10.l7 1~ 0 0 .54~ 1018 45,,1 57050 505.16 23706 7904 7701 8003 7409 D5 1~0053~10.1'7 1~0054~1018 4·501 57070 50537 24406 7904 7701 8003 7606
c6 .1.~0053~1017 1 ~ 0 0 5!~ ~ .1 018 4501 57050 50496 23903 7904 7701 8003 7507 D6 .1 ~ 0 ,. 53 :: ,]. ol'{ 1. ~ 0 0 5ll ~1 0 18 L~5 01. 5'(' c 70 50527 24500 7904 7701 8003 7608 C,(, 1 ~ 0 05 3 ~: 1 0 1'( 1.~0054~1018 4501 57 )1-0 50511 24103 7904 7701 8003 7603 D7 1~O,53::1017 1 ~ 0 0 54- ~ 1 0 18 4501 57050 50520 24403 7904 7701 8003 7700 c8 1~0053~.101'( l~ 0 0 54~ ~L 18 4501 57040 50487 24101 7904 7701 8003 7605
D8 1 ~ 0 0 5 3 :~ .1 0 17 I~Oo54~.1018 4501 57050 50521 25000 7904 7701 80 03 7807 C9 .1 ~ 0 0 5 3 :~ 1. 0 17 1~0054~1018 450.1 .56080 50518 23406 7904 7701 8003 7409 D9 1~00.5.3:;10.17 .1 ~ 0 0 54· ~ 1018 450.1 57050 50395 24506 7904 7701 8003 79Q2 C10 1. ~ 0 0 53 :; 1 0 17 .1 ~ 00 54 ~.1 0 18 450.1 56080 50457 24208 7904 7701 8003 7803 DIO 1~0053~1017 1~0054~1018 45~1 57050 50506 242'03 7904 77Ql 80.3 7605
!. " :"1' r 'i; ~W~ .1. ",.<,


'l'AJj.L~ c j
RESUI,TS OF TESTS BY WILSON AND THOMAS (25)
Holes were subpunched and reamed 0
Reduct 0 Nomo Max 0 Efficiency in Eer cent Speco T~S~B Ratios Area M.atglo strength Gross Load Relo
No. AR.EA Re.1o Gage per cent ksi Area kips AREA Wilson Gage Test Sq 0 i.n 0
.. (.ll~.~~~L (3) _ .( ~-) _~~~_ ~(~5 )~. _ ~6b) _ (71 ______ (~__._i_~ ___ Jl0) (11)
Hcc6=.l .1~ 0 o6.l~ 0076 1~0072~O089 .5803 63030 4038 21607 6500 7602 76.3 7802 Hcc6~2 .1.~006].~00'76 1~0072~0089 5801 62095 4038. 2.1.402 65.0 7602 7603 7707 Hcc6'~3 .l.~006.1~Oo76 l~0072~Oo89 5900 63023 4038 21404 6500 7602 7603 7704 HSM6~1. .l~Oo61~0·76 J.~ 0 070~ 0088 5101 83090 l~ 038 26900 6500 7602 7500 7302 HSM.6~2 .1.~006.1.~00'76 1~0070~Oc88 5008 83090 4038 26703 6500 7602 7500 7207
HSM6'~3 1~0061~0076 1~0070~0088 4-9 d'9 84050 4038 27703 6500 7602 7603 74·9 HCM5~.1. 1~0085~1008 1. ~ 0 0 9 3 ~ .1. 0 1''( 5703 62075 4069 23500 71.07 76:2 7802 7909 HCM5-2 .l.~ 0 085 ~ J. 00'( .1 ~ 0 0 9 3 ~ 1. 0 1'{ 5805 63020 4069 23600 717 7602 78.2 7906 HCM5-3 1. ~ 0 . 8.5 ~ 1 0 07 1~0093~1017 5508 6302.5 4069 23504 7107 7602 7801 7904 Hsc8coo.1 1~0061~0076 .1.~0075~l057 5000 85090 4038 28007 6500 7803 7408 7406
HSc8~2 1.~006.l~0076 1~Ou75~1057 4906 85005 4038 280.0 6500 7803 7407 7502 Hsc8~3 1~006.l~00 76 1~0075~1.057 5000 85005 4038 27905 6500 7803 7408 7500
NOTE~ Holes were considered equi.valent to clri11ed holes 0
.1 ';4;. 1\ 1, :\ "'1* rt we k .... ........... _ .' .F~ __ ,,_"""""","''''''' .• o! .......... ~Io.. ................... r-.Jr_'" _,~, ... ~ •. ~~ ... 041 ...... ,.~· . ." .. , .k>< ... h~d .... ·.n,-l· ..10'. '..... . ..... _.:k~ ·AC ....... ~~.( v...,....,~ .. ....... ..:. ... f .... 'l .• ..:~~.,..:~ ••. 1 J.it.~., __ ...... ~ ... \o.~~~ ..... __

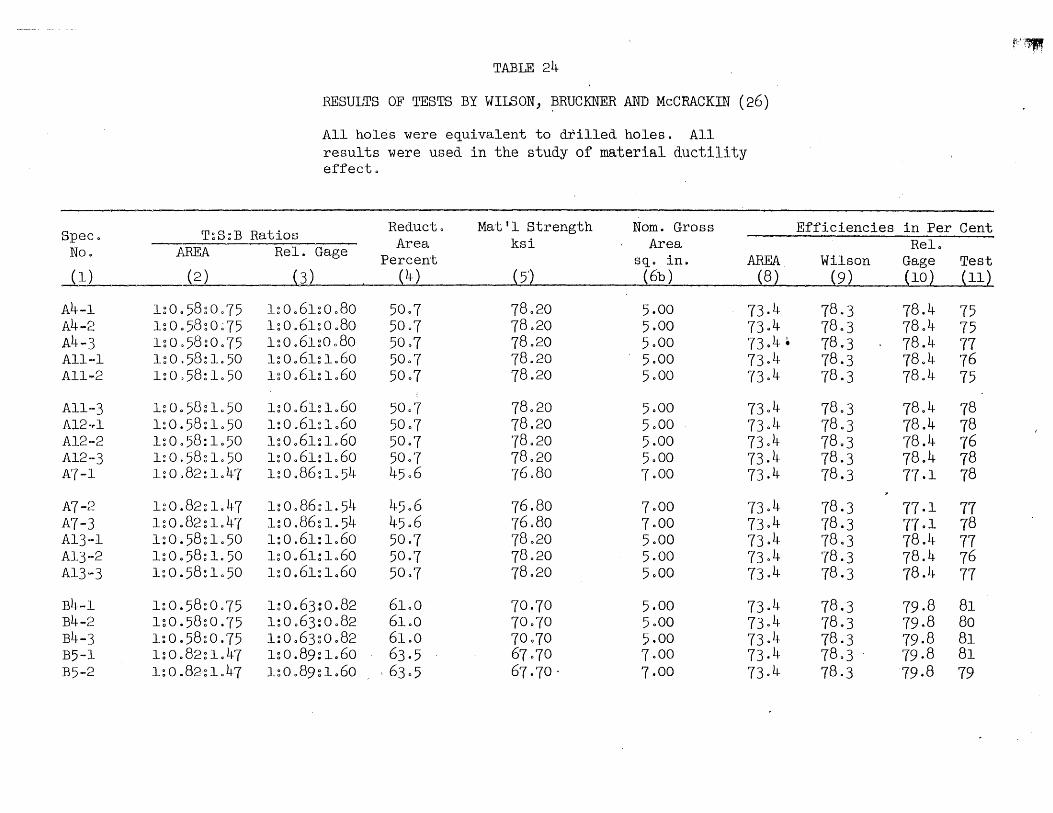
Spec. No.
.JlJ A4-1 A4-2 A4-3 All-·l All~o2
Allo-3 A120rl A12··2 A12'-3 A7-1
A7-2 A7-3 A13·-1 A13 o-2 A13··3
B4-1 B4-2 B4-3 B5-1 B5-2
T~S:B Ratios
TABLE 24
RESULTS OF TESTS BY WILSON, ~RUCKNER AND McCRACKIN (26)
All holes were equivalent to drilled holes. All results were used in the study of material ductility effect.
Reduct. Mat'l strength Nom. Gross Area ksi Area
ARF..A Rel. Gage Percent sq. in. AREA
Efficiencies in Per Cent Rel.
Wilson Gage Test (2) (3) (4) { 5') {6b) ~§l__ ____( 9 ) (10) (11)
1:Oo58~0.75 1:0.61~0.80 50.7 78.20 5.00 73·4 78·3 78.4 75 1~0 .. 58~0~75 1~0.61~0.80 50·7 78.20 5·00 73.4 78·3 78.4 75 1~0,,58~0·75 1~0.61:0080 50.7 78.20 5·00 73.4 • 78.3 78.4 77 1 ~ 0 " 58 ~ 1. 50 1~0.61:1.60 50.7 78.20 5·00 73.4 78.3 78.4 76 1 ~ 0 " 58 ~ 1. 50 1~0.61~1.60 50·7 78.20 5·00 73.4 78.3 78.4 75
1~0,,58:1.50 1~0.61~lo60 50·7 78.20 5·00 73.4 78.3 78.4 78 1~0,.58~1.50 1:0.61~1.60 50·7 78.20 5.00 73.4 78.3 78.4 78 1~0.58:1.50 1~0.61~1.60 50·7 78.20 5.00 73.4 78.3 78.4 76 1~0.58~1.50 1~0.61:1.60 50·7 78.20 5.00 73.4 78.3 78.4 78 1~0.82~1.47 1:0.86~1.54 45.6 76.80 7·00 73.4 78.3 77·1 78
1~0.82:1.47 1:0.86:1.54 45.6 76.80 7·00 73.4 78.3 77·1 77 1~0.82~1.47 1~0.86~1.54 45.6 76.80 7·00 73.4 78.3 77·1 78 1~0.58~1.50 1:0.61:1.60 50·7 78.20 5.00 73.4 78.3 78.4 77 1:0.58:1.50 1:0.61~1.60 50·7 78.20 5·00 73.4 78.3 78.4 76 1~0.58:1.50 1~0.61:1060 50·7 78.20 5.00 73.4 78.3 78.4 77
1:0.58:0.75 1~0.63:0.82 61.0 70·70 5.00 73·4 78.3 79·8 81 1~0.58:0.75 1:0.63~0.82 61.0 70·70 5·00 73.4 78.3 79·8 80 1~0.58~0.75 1:0.63~0.82 61.0 70·70 5·00 73.4 78·3 79.8 81 1~0.82:1.47 1~0.89~1.60 63·5 67·70 7·00 73.4 78.3 . 79·8 81 1~0.82~1.47 1~0.89:1.60 ' 63.5 67. 70 . 7·00 73.4 78.3 19.8 79
r'~


Table 24
l--- ... _=~~cr __ -:;::";",:"",_-----,,,,,=:.&<~ __ ··.~_-'--'L"~·- "-'.,._-~~-~'=-L=--~---.;o;..=.o-....;c-... ~~--~' ...,..~=.;o_~=.~ ~- ---·-0 • --~
(1) (2) (3) (4- ) {5) (6b) (8) (9) (10) (11) ~:o,..~-~~~~~. --
B5=3 .1 ~ 0 0 82 g .1 0 47 190089g1c60 6305 67070 7000 73.4 7803 79.8 81 :2:1.1.=1 190058g1050 .1. ~ 0 0 63 g 1. 0 63 61.0 70070 5000 7304 7803 '7908 ,81 . Bl1~,2 .1 gOo 58 g 1.50 190063~1063 6100 70070 5000 7304 . 78.3 79.8 78 81.1.=3 190058g1050 1~ 0 063g 1,063 6.1.00 '70070 5000 7304 rr8 03 7908 81 .R6=.1. .1 gOo 82 ~ .1. 0 47 lg0089~1060 6305 67070 7000 7304 7803 79,,8 83
.86=2 190082gl047 1 gOo 89 g :I. 0 60 6305 67.70 7·00 7304 7803 '7908 82 B6=3 :1. gOo 82 ~ 1 04-7 190089~1060 6305 67070 7000 7304 7803 7908 83 B.12=1 .'1. ~ 0 . 58 g.1. 050 190063g1063 6100 700'70 5.00 7304 78.3 79·8 81 B12,=? 1~0058g1050 190063~1063 6100 70070 5.00 ''"( 3 0 4· 7803 ' 7908 81 :8.12=3 190058g10,50 19006.3~.l063 6100 70·70 5000 73.4 7803 7908 81 .B7=1 .1.g 0082 g 1 047 .l~0089g1060 6305 6r
{ 070 7000 7304 '7803 7908 82 B7=2 1~0082g1.047 1:oo89g.l060 6305 67070 7.00 7304 7803 7908 80
B'7~3 1 ~ 0 .82 g .1. 047 .1 gOo 89 g 1 060 6305 6'l ·70 7000 7304 7803 7908 81 B1.3=1 1 ~ 0058 g .1050 190063~.1063 6100 ''"(0070 5000 73.4 7803 7908 80 R13~2 1. gOo 58 g 1. 0 50 1.~0063~l063 6100 70070 5.00 7304· 7803 7908 78 '8]3=3 1~o.58~lo.50 1g0063g1063 6100 70070 5000 7304 7803 7908 79 ('14=1. 190058~1075 1~0063g0082 5708 82040 5000 7304 • 7803 7908 80
C4~2 190058~1075 190063g0082 57.8 82040 5.00 7304 7803 7908 78 c4-3 1 gOo 58 ~ 1. '(5 1~0063g0082 5708 82040 5·00 7304 7803 7908 79 C.ll-l 190058g1050 190063g1063 5708 82040 5·00 7304 7803 7908 80 C11-2 190058~1050 190063:1063 5708 82040 5000 7304 7803 7908 78 ell"'3 1:0058g1050 1~0063~.l063 5708 82040 5000 7304 '7803 7908 81
C6~1 190082~1.47 1~0089~1060 5701 80·70 7000 7304 7803 79.8 81 C6-2 1:0.82~lo47 1~0.89~lo60 5701 80.70 7000 7304 7803 79.8 79 c6~3 19o.82g1047 l~oo89g1060 5701 80070 7000 7304 78·3 79.8 80 C12~1 l.~ 0 . 58 ~ 1050 l~oo63:1063 5708 82040 5000 73.4 7803 7908 80 C12=2 .1 gOo 58 ~ lo 50 19o.63~lo63 5708 82040 5000 73.4 78·3 79.8 79
iIIi.t. .L..i.- ••••. _.a...


"" ., fitMM )~'._'''''''I''_'':'' ____ '''''''''''''~ .. ~ ... ~---... ___ .,_..-..- ............ _"" ............... __ ... ""L .. ~."""""""""'~d"""d W' ... ,WMf.'iizbahi.iM4. •• lttJ.i4 ......... eMid" .... · ••• · ....... +,'Nt' ........ " ......... a" tm me ~~t
Table 24
(1) (:2 ) (3) (4) (5) (6b) (8) (9) (10) (11)
C12-3 1:0 .. 5B:1.50 1:0.63:1.63 57·8 82.40 5·00 73~4 78.3 79.8 80 C7-1 1~oCl82:1.47 1:0089:1.60 57·1 80070 7·00 73·4 78.3 79.8 80 C7-2 1:oCl82~1.47 1~0.89~1.60 5701 80.70 7·00 73.4 78.3 79.8 80 C7-3 1:0,,82:1.47 1:0.89:1.60 5701 80.70 7·00 73.4 78.3 79.8 81 C13-1 1:0 .. 58:1.50 1:0063:1.63 57.8 82.40 5.00 73.4 78.3 ,79.8 79
C13-2 1:0058:1.50 1:0063:1063 57·8 82.40 5000 73.4 78.3 79.8 78 C13-3 1:0.58:1050 1~0063~1.63 57.8 82040 5.00 73.4 78.3 7908. 79


TABLE 25
RESULTS OF TESTS BY WILSON, MATHER AND HARRIS (27)
Spec. T~S~B Ratios Reduct. MattI Strength Gross Max 0 Efficiences in Per Cent Area k.ips Width Load ReI. No. AREA ReI. Gage Percent per ino width ina kips AREA Wilson Gage Test
(1) (2) (3) (4) (5c) (6a) (7 ) (8) (9) (10) (11)
DRILLED HOLES
SlA 1:0.67:2.10 1~Oo74~2Q32 59.7 15025 36.0 373·0 65.6 73.0 72.5* 68 9 0cx SlB 1:0.67:2.10 1~0.74~2032 59.7 15041 3600 37805 65.6 73.0 7205* 68.20: SIC 1:0.67:2 .. 10 1:0:74~2032 5907 15.27 36.0 36500 6506 73.0 72.5* 66.4a S3A 1~0069~2.16 1~OQ76~2039 6106 15.46 3600 388.0 65.6 7300 72.5* 69070: S3B 1~Oo69~2.16 1~OQ76~2039 6106 15060 3600 39906 6506 7300 72·5-x- 71.20:
S3C 1~0069~2.16 1~0076~2039 6106 15.46 3600 386.5 65.6 73.0 72.5* 69.40: S5A 1~0069~2016 1~0076~2039 6302 15048 3600 37600 6506 7300 72.5* 67·50: S5B 1~Oo69~2016 1~0076~2039 6204 15030 3600 39400 6506 7300 72.5* 71050: S7A 1~0069~2016 1~0076~2039 5705 19007 3600 44100 6506 7300 72.5* 64.20: S7B 1~0069:2016 1~OQ76~2039 5705 18.91 3600 430.0 6506 7300 72.5* 63020:
BBl 190063~1017 190063~1017 59Q8 28035 7200 165000 8300 82.2 86.611 80.8 BB2 _1~Oo63~1017 1~0.63gl017 5905 28009 72.0 169500 84.7 82.2 86~61l 8308 AB3 1 ~ 0075: 1. )~2 1~0070~.lo32 6103 36060 7200 228000 9109 8503 87·011 8605 AB4 1~Oo'75~lo42 1~Oo70~1032 6301 36.20 72.0 227000 9109 85.3 87·011 8701
,i~l "··1"::'1.'." .... "' .. : .. , : . .:. ~ ~
- ,


_______ ... ,~._...... .. II. ...... .. _-- .-.--....... _ .... __ .... --...... ,~.-------.,,-----. -- -._-- .--~ ___ ._~ __ .
Table 25 (cont'd)
_ (1) (2) ( 3 ) ( 4 ) ( 5 c ) ( 6a ) (7) ( 8) (9 ) (10) (11)
PUNCHED HOLES
S2A 1~0.67~2.10 1:0.64~2.00 62.3 1506~ 36.0 363.0 6506 73·0 S2B 1:0.67:2.10 1~0.64:2000 6243 15.53 36.0 348.0 65.6 73·0 S2C 1:0.67:2.10 1:0.64:2.00 62.3 15~59 36.0 352.0 65.6 73·0 S4A 1:0.69~2.16 1:0.66:2.07 62.3 15.50 36.0 386.1 65.6 73.0 S4B 1:0.69~2.16 1~0.66~2.06 62 .. 6 15.47 36.0 39400 65.6 73·0
s4c 1~0.69:2.16 1:0966~2006 62.6 15031 36.0 367.0 65.6 73 .. 0 S6A 1~0.69:2016 1~0.66:2006 63.4 15059 36.0 394.0 6506 73~0 S6B 1~0.69:2016 1~0066~2.06 63.4 15.28 36.0 388.0 65.6 73~0 8AB 1:0.69~2.16 1:0066~2.06 54.5 18.77 36.0 442.0 65.6 73.0 SAC 1~0.69:2.16 1~0.66:2.06 55.0 18.75 36.0 J+18.0 65.6 73·0
* High bearing stress: tensile stress ratio not taken into aocount in oomputing this efficienQY.
11 Gage holes in plate at line failure not taken into account when computing this efficiency
a Test results used in study of bearing stress: tensile stress ratio effeot.
62.5 64.5 62.5 62.2 6205 6207 62.5* 69.6 62.5* 70·7
62.5*' 66 .. 6 62.5* 70.2 62.5* 70·5 62.2* 65.4 62.3* 61.9
.~;c~


.APPENDIX TI
FIGURES


FIG.I· JOINT DETAILS
(DETAILS OF SPECIFIC SPECIMENS GIVEN ON FIGS. 1 a TO I b)
GENERAL NOTES ON JOINT DETAILS
ALL JOINTS ARE DOUBLE-STRAP 'BUTT JOINTS.
PLATE MATERIAL = MILD STEEL- ASTM DESIGNATION A7-50T.
CENTER PLATES = 5/16 IN~ THICK UNLESS NOTED OTHERWISE
STRAP PLATES - 1/4 IN.
HOLES= 23/64 IN. DRILLED a 318 I N. REAMED
ALL SPACINGS = I 1/2 IN.
EDGE DISTANCES =- 3/4 tN.
.. "
II
..
..
.. ..
.. II
.. II
.. ..
FASTENERS = 2-IN. LENGTHS 3181N. DIA. COLD-ROLLED ROD
THREADED AT BOTH ENDS.
INITIAL FASTENER TENSION = 30,000 PSI ON GROSS AREA UN LESS NOTED OTHERWISE
WASHERS = lIS-IN. THICK, 5/&-IN. 0.0., 23164-1N.I.D.


..... --'-_t__---+-
o h i j a" 41/2 1
' .1 n .1 n
SPECIMENS: AAI, AA3, AA4, AA5, AA6, 8 JA3
FOR VARIOUS FASTENER TENSION PATTERNS, SEE TABLE I
1'- 2"
SPECIMEN ACI AC2 AC3 AC4
FIG. I a
I ~I 1 .-rt')
-~ o
s 1'- 2"
VARIABLE, "SII., INCHES o 3/4
I '/4 I 3/4
JOINT DETAILS
:1
J


~I f I \,~ .\,.v \,./ -
I"r"\ 1""'\ /"'"\ \,.v \,./ \,./ (!)
I I .... 3 0 I"t"\ I"~ ('1"\ rt) \,.v \,,/ ,~
I"~ ("\ ('~ -\,./ \,,/ ,~
~ I (!)
I L 3" L
SPECIMEN VARIABLES, INCHES G W L
ADI 13/16 4 3/4 6 3/8 AD2 7/8 31/2 4. 1/16 AD3 17/8 7 1/2 10 JAI I 1/2 6 "S
SPECIMEN AEI
iA I"r'\. t+\ I \,./ \,.v \,../
I ~
'" I 1""\ I"t" I"r'\ ~
I \.../ \.../ \.../ ~
I I"~ 1"'"'\ I"~ I \,../ \,./ \"f/ I
6" 3" 6~' I
SPECIMEN API PUNCHED HOLES
FIG I b JOINT DETAILS


-------------')
I I'~ th I \..v ..... : . ./ - \.../ I I ,1\ th.
C\,I ...... I \..v \.../ q-I I 1'1\ I' ... "'J.. - I'"~ I \..v \..~ \...V
S
6" 'I Vi 3 3/4" 6"
SPECIMEN C3 ca
a"
SPECIMEN FMl FM2
I I'~ I \.v I If, I \.v I ;i\ I \.../ I I " I ...... v
1'''''\ \.../
L ... '\
\.~
('i\ ...... v
VARIABLE, "S .. , INCHES 1;2
21/2
/t"'\ =C\,I ......
\.V -L~
+.,.1
\.V =J'f) -(,0
f~ \.../
0 ,,,,,\
,.I =C\,I :::::: \../ -
4 1/2" a"
FASTENER MATERIAL MILD STEEL
HIGH STRENGTH STEEL
SPECIMEN JAI DETAILED WITH ADI, SEE FIG. 1 b
FIG. 'c JOINT DETAILS
~~


4 "2"
SPECIMEN J A2
. SPECIMEN JA3 DETAILED WITH AAI, SEE FlG. I a
SPECIMEN JA4
..
6" .
SPECIMEN JA5
I FIG. I d JOINT DET AILS
.~------~------------------------------------------~


a"
SPECIMEN
MI N4
6"
SPEC1MEN
Nl N2 t\I~ ., .....
N4
FlG. Ie
IA I \.j..I
I I [t\ I \.v I r~ I \.v I
VARIABLE "5" I NCHE 5 , ,
[~ \.V \.V
::
B- ~ -v rf\ I"~
'+' \...,,/
S 31'1 6"
VARIABLE "s" , , INCHES
0 II?
11'4 DETAILED WITH MI
JOINT DETAILS


L
6"
SPECIMEN
PI P2 P3 Q2 Q3
I-$-- I'h I'"~ . '
I. \.~ \.L./
I ~
eN
l-E ~- - ...... .q-
I 1'"""'\
: ~ I'"~ f.J \'f-" \.i-/
R R S 611
VARIABLES, INCHES R S 1"2 1/2 11/2 11/4 11/2 13/4 2 13/4 3 13/4
SPECIMEN Rl
6" - I
SPECIMEN R2
FI G. 1 f JOINT DETAILS


SIDE PLATE THICKNESS nAil ,
L
SPECIMEN
SI 52 53
CC'I ~ L.- I
5E2 SE3
7
13/41
SPECIMEN R3
( HOLE DIAMETER "0" ,
I~ I"i'\ I'i\
I "v \,.,v 'v I I
:-( ~ ~"'- (0-,.,I \,.,./
I I 1""'\ 1" .. '\ I"~ I \.i-/ \..v "V I
G G
VARIABLES, A 0 G
\/4 3/8 11/2 114 3/8 \1/2 114 3/8 11/2 5/S 31A :3 "T
3/8 1/2 2 3/16 1/4 I
C\I
~
(!)
c:J
~ (!)
L
= t\l ....... -
CENTER PLATE THICKNESS liT II ,
j
~
INCHES L T W
6 5116 41/2 6 114 4 1/2 6 3/8 41/2 12 3/4 9 8 1/2 6 4 1/4 3
FlG. I g JOINT DETAILS


IN' 'ST3 ONLY -- IN ST4 ONLY
~ rt') ~
(\J ........ (!)
L K L
SPECIMEN VARIABLES, INCHES
G/2 K L W STI 1/2 3 53/8 4 ST2 0.65 3 53/4 4.30 ST3 15/16 41/2 6 1/2 47/8 ST4 I V2 4 1/2 ·8 6
IN ST7 ONLY
zttll • C\I ~
(!) ~
Z ttl I
=(\1
.:::::
L K L
SPECIMEN VARIABLES, INCHES
A G K L W ST5 • 'I,. 3 5 3/S .A
I ""+ .., ST6 1.40 1.30 3 5 3/4 4.30 ST7 111/16 17/8 4 1/2 6 1/2 47/8
FI G. I h JOINT DETAILS


l 10"
en
I I'"t'\ I'"~ 0-=(D I \..v \..',./ ........
I rt) It)
I ("~ ("';:\ ('~\ =(D I \..V 'I--' \,,',./
-<.0 '- +~ 10
I r~ - I't\ ('"\ = I \..~ \",~ \",./ (D
-r<) '- I It) - I I"~ ("~ I'~ I \"f-" '+' \.~
-co
" en
a" 4 fl211 a"
SPECIMEN ST8
~
-C\J .:::::. --'0
v
~
SPECIMEN VI V2 V3 V4 V5 V6 V7
F 1 G. I i
I~ I"t'\ ([7-I \.~ \.V I II' '\ (''\ L~ I \"./ \",./ \. ./ =(\,1
i " I 1""\ ('~, 1'"\ r--I \,,1'.../ \",v \",./
:-E ~--E ti-- -$-I I I'+~ 1':'\ i \.~ \"v
311
(ff-
S 10"
VARIABLE, liS·: INCHES o 1/2 11/4 13/4
3/4
I 11/2
JOINT DETAILS


I.
THESE TWO ROWS INX2. ONLY
~
+-e
~
10" ~
SPECIMEN
WI
X2
"'-ro
~ -+-0
~
10" ~ ro
SPECIMEN
YI Y2 Y3
: I \,~ I I i I I ~ v I I I I
-' L~ ; '-v
FIG. I j
-N ........
t-
K 13/4" 10"
VARIABLE, K, INCHES
II/z"
41/z 11
I'i'\ ri'\ \.i..I ,~
~ \,~ I'h \,~
-N ('""\ ~ 'v ......
1';"'\ I"~ ~ :t-'t' '-I-"
I'"~ 1''"\
'+'
5 at K 10"
VARIABLE_"K'~ INCHES .. ---- .. - ..
11/4"
JOINT DETAILS


JA2B JA2A JA3A ·JA3B
AAIB AAIA AA3A AA 3 B
AA4A AA4B AA5A AA5B AA'B ~
~ ~ AA6A JA5A JA5B ~ JAIA JAIB
~ ~ ~ v
////// C3A ~ CBA
NIA NIB N2B N2A I C8B G3B P3A R2A P3B R2B
N3A SIA N3B SIB RIA PIA RIB
AC4A AC4B AC3A
N4B N4A MI B MIA
III III III III III
R3A P2A Q2A R3B Q2B P2B
X 12
X 4
X 8
X 13
~_AD2A APIA API B
Y3B Y3A ~ V ~
WI8 WIA
V4B V3B V4A V3A
Y2B X2B Y2A X2A
VIB YIB VIA YIA
Q3A k'a Q3B v2A V2B ,/ . "/
fl II II II II II
FIG. 2A LAYOUT OF PARENT PLATES
-1 .J:
I ~


:
ACIA ACI8
~ V5A AC2B
~ ?§ ~ ~
AD28 ADIA ADIB AD3B
~
~ ~ ~
ST6B
X
27
5128
ST6A
V6B
PIF
ST2A ST58
ST7B
V6A
PIE
X
28
ST5A
ST3A
V7B
PID
AC2A
AC38
AD3A
X
29
PIC
STI8 STIA
-
ST38 ST7A
V7A
V58 ST4A ST48
77
ST88 ~ ~ ~ .~
7 7 Z '-
FIG. 28 LAYOUT OF PARENT PLATES
ST8A


Q. SPECIMEN AFTER WELDING
OF PULL PLATES b. ASSEMBLY READY FOR
TESTING
FIG.3 TYPICAL SPECIMEN AND TES T ASSEMBLY·
T"-,


--- ....~ --- _-w +. ".. " ...... _ .......................... '" - ,'" .... "".'1Iiii ... ' ..... ·-YtlM.' ... Il, '111'*"" ....• 1 •• I' •••• n.rnr , ; ii'll '--------------.------~------~~--~---------," '
(/) a.. 0 0 0
Z
:J: ~ CD Z W 0:: t-(J)
w ~ ~
~ :::>
w (!) <l a:: w ~
68
~ 61 \
i\ \,
66 ~
"" 65
64
~ EdQe 011 Plate
63
° 2 4
~
6
..
,,-
,-, "~
L I
L L V
V '" ~ V
~ ~ ~
V r---. t-- --
Edge of Plate ~
. 8 10 12 14 16 18 20 22 _ 24 26 28 30 32 34 36
TRA,NSVERSE POSITION IN INCHES
FIG. 4 AVERAGE ULTIMATE STRENGTH ACROSS WIDTH OF PARENT PLATES


0.338
0.336
0.334
/;' --- --....... ~
/ / ~,
(/) 0.332 W
:x: (.)
z 0.330
z
(f) 0.328 c.n l.L.I Z ~ 0.326 (,)
I t-
0.32,4
/ / ~
I'\. . / ~ I
/
/ I~ /'/
'\
\ Edoe of Plate ~ I' v
\ / \ w ..... <t --l
0.322 0..
w C> 0.320 <t 0:: W
~ 0.318
0.316
/ \ 1\
I'---Ed~El of Plote \ 1\
\ \
0.314 o 2 4 6 8 10 12 14 16 18 20 22 24 26 28 30 32 34 36
TRANSVERSE POSITION IN INCHES
F\G. 5 AVERAGE PLATE THICKNESS ACROSS WIDTH OF PARENT PLATES , :1:·,:/ ... :.
~ ::~ •. i· ,.


68
(J)
a.. 6'7'
0 0 0
I 6E. l-e> Z UJ a::: t-en
651
w t-e:(
:E
~ ::J 64
6~)
'::·:4 ... ~ '.
" A4 I A I -I r I I V'I I ' I I I I
f- EDGES EDGES EDGES EDGES - t--
~ XI2 X4 X8 X~
/ A A
.~
\ / ~
V
I / 41/2" \\ 6"/
i
~ 41/2" 6"
--/.
I
~ 0---.---..-~ ) ~ //
"'" / .....,
"'-'" i / A ~ I 17
,.,..." ,,. y --,--'-
I---- --I~ I'
(AVERAGE ULTIMATE ,... I STRENGTH CURVE FROM
-0
1/2" WIDE COUPONS 1
r r
o 2 4 6 8 10 12 14 16 18 20 22 24 26 28 30 32 34 36
TRANSVERSE POSITION IN INCHES
FIG.6a COMPARISON OF ULTIMATE STRENGTHS FROM FULL WIDTH
ANI) 1/2 IN. WIDE COUPONS


68
1\ ~ 67
\ 0 0 0
:I: 66 r---t-(!)
z W 0:: t-en
w ~ 2
!J :::l
65
64
63 o
A A It A , r If r
/ - EDGES EDGES EDGES
/ X27 X 2B X29 A -A A
~
1\ L \
71/2-Y 1'\ 10 1/211 7 1/2" -
~ V '" /
~
~ V V
- )------ ~ I""
1--.... --AVERAGE ULTIMATE STRENGTH
CURVE FROM 1/2" WIDE
COUPONS
-0
i l' -0
A A J I A A
r r r 1 ~ ----- -~ -- - ---- --~--- ---- --- --- -- -------- ----------~--.. ------- ~--------- ~-~-'---~-
2 4 ~) B 10 12 14 16. 18 20 22 24 26 28 30 32 34 36
TRANSVERSE POSITION IN INCHES
FlG.6b COMPARISON OF ULTIMATE STRENGTHS FROM FULL WIDTH AND 1/2 IN. WIDE COUPONS
:~ ~;~-;,;.;(-;
.eli ' .. ~l ~. '.


FIG.7 BOLT EXTENSOMETER BEING USED
TO DETERMINE FASTENER TENSION


yjil'hiH tiM. en+liee • ..wJ-~ _ .............. 'J .. __ ... ' ... I. ...
140
120
100
~80 -~ ..
o c( 60 o ..J
40 I
20
c: I
!
! f
FlG. 8
- ,"" ,-.... " .-... .... , ......... ,~'" , ...... •• v. - ...... , ...... ~ ......... ----........ l .. ~,. ..I-c. ,,_ ..... L .... I,j...." ... ../ ..... "ml 4~ .J.j.,.JU .. ,.h,,~,I""li~.N' d ,,,W'ri~'.~~,_ • ..,. 'i** I .•... .' •..•...•. ·,c... " .•• ·~.uf"'f'VI!.'.
I I 1
I
~'
VIA~ V---- V> ~ ---./ /
V V~/ ~ ....
~/~4A I
I
// V5 B I
/ ~ ./ I
/ /( -' V4A
V V -------/ ( I (
I I I I
I
I
I
I
0.0500" 0.2000"
I SLIP TOTAL DEFORMATION
LC)AD DEFORMATION GURVES FOR JOINTS HAVING A VARYING STAGGER


r
FIG. 10 MODE OF FRACTURE OF SCALE
EFFEC T SERIES


I j I
92
91
90
I- 89 z w o
88 Q: W a.. 87 z
>- 86 () z W 85 o LL. iL
w 84 I-CJ1
~ 83
82
AA3 .I
-------- (_)JA3 ) ----- ----------~ 0 \"'
~,
-) AAl
o 10 20- 30 40 INITIAL FASTENER TENSION IN 1000'S PSI
BASED ON GROSS AREA
FIG. II EFFECT OF FASTENER TENSION ON JOINT
EFFICIENCY


FIG. 13 M ODE OF FRACTU R E


-.~
93
92
91
90
89
88
r- 87 z w o
a::: w CL
z
86
85
r 84 (,)
z W 83 o LL
d)
<)
lJ.....
w 82 . ~-tCf)
w 81 t-
80
79
78
.. " ..... ./
"./
0 lip" SERIES 3 LONG ITUDINAL LINES L~
f:r------- "Vn
SERIES 5 LONGITUDINAL LINES
)t---------- "AC" S ERI ES 7 LONG/TU DINAL LINES
/ .' lX ,/ / \
IY" , ,
x 0
/1 ~~ --r------ _ .. .---/' /
.... _ .... /-
/ "6.
/' ~ '" ~ 0
./
~ /" .// .
./
J /
" -'" "'./ )l.
~/ W ./
/ ./
./ , ./ - / ./
/ l/
..... ~~ o ~ .....
/ ...... v""" -=-- --l::&'
./ ..... GAGE CONSTANT: 4 ...... = ./ HOLE D1A. ...... /'
" "
0.2 0.4 0.6 0.8 1.0
STAGGE R ~ GAGE
FIG.14 EFFECT OF STAGGER ON EFFICIENCY
IN 3,5 AND 7 LINE JOINTS
0
~ / ~
6.
x
\, ,
--~ X
A.
12


,~:;~~.£~~~?~:~ , ; . ~~~t':~·~·;;
. -:~. -_. o. FOR :; LINE JOINTS
b. FOR 5 LINE JOINTS
c. FOR 7 LINE JOINTS
FiG. i5 EFFECT OF STAGGER ON
MODE OF FRACTURE


92
80
78
~!:::r- - - ---- "v" SERIES, STAGGER
: IN FIRST TRANSVERSE ROW ~l.
0 "y" SERIES, STAGGER
I N ALL TRANSVERSE ROWS
Ji\.
/ '\ ,
\ / . /
I L~ /
I /
/ V
J.~
."A- 0/' ... ---. V 0/ /
,
--~ V ~
-r--I' e
V ,/
~ V (~ /' J.~
I I-- - __ / --- --6
o 0.2 0.4 0.6 0.8 1.0
STAGGER _ GAGE
AG_ 16 EFFECT ON EFFICIENCY OF
STAGrGER IN ALL TRANSVERSE ROWS OF TH·E
FASTENERS
A
0 ~ KO
. \
6
1.2


j i
~ I j i .~
~ 4
j 1
j j .
. ~
~ 1 1
l
~ FIG. 17 COMPARISON OF MODES OF FRACTURE ~ i OF JOINTS WITH ONE ROW STAGGERED
AND ALL ROWS STAGGERED


.~ .••• _._· •• k •••• _ ••
94
92
90
88
86
r- 84 z w <.) 82
0:: W 80 a..
z 78
t 76 z w o 74 LL LL w 72 r-(J)
w 70 r-
68
66
64
62 2
ii· ."il; ,.l\dL .~ 4~Hi., lll,:;illU.\, 'il!' ............ 11III11.1l;;; II !III
~------ l-----
t------I-
.----------~
p
) P3 cb JA3 ~
V
/'"
~ ~) JA5
CD
V "" ./ AD3 / ./
/' D/ r---MODIFIED AREA RULE /
/ ~ JAI / /
/ / ADI II / I /
1/
/ / I i
I / /
/ ;1.
- ----
4 6 8 10 12 14 16 GAGE -:- HOLE DIAMETER
FIG. 18 EFFECT ON JOINT EFFICIENCY OF VARYING THE· GAGE


-" ... ~. '··'··~~.'·-~·~~'~-·'~:;:~:::;·~1:.!:::~;7;"'··~: .:'!.>~.-'
-~ . , . <;:c~:: . , ... " .. """S~"'.7_
;iti,;t~~;;i~~"{~li2~~{1~':0'~;~~;'j';':> {:,:~':~Ji.;,::c',<,<";:: . . . . . . . .' , :,.ty-
~ -_ ..
FIG. 19 EFFECT OF VARYING GAGE ON
MODE OF FRACTURE
FIG. 20 EFFECT OF VARYING PITCH ON
MODE OF FRACTURE


I.----------~ c;:':t ~ ..., J
!;i
~ :~~
~
~ j
.. ~ "j
t-ffi 90 o a::: LLJ Q.
Z
t; 89 z LLJ .0
""w
t; 88 LLJ t-
(~
~ P3 (.,
4.0
()
~ ~ ()
5.0 PITCH
Q2
~ ~ ~L: FAILURE,,)
~
~
PLATE FAILURE. (.:)
6.0 7.0 HOLE· DIAMETER
8.0
Q3
FiG. 21 EFFECT OF VARYING THE PITCH ON JOINT
91
90 1--Z UJ (.) 89 a::: w a.. z 88
>(.)
~ 87 o u.. tti 8-6
.... en W 85 t=--- - -
84
83
EFFICIENCY
6 R3
~ ~-
. ? // 8 6
/ \-" ,
/ /
~ / X2 , ~
"" v---RI //
V4 ( /
/
/
// -/
,
/ V
WI
Q
3 4 5 NQ OF TRANSVERSE ROWS OF FASTENERS
FIG. 2-2 EFFECT OF NUMBER OF TRANSVERSE ROWS ON JOINT EFFICIENCY


- , ,,~
.. ' ::>;~{~:~,,::, ':'
-.'1'· .... +-. . : , ,
: ~
o. 3 LINE JOINTS
... .. .. ., .. ft
.: •• ~ .. .. .. ,' t', - ,
'~7'":: .... ~:: 't~ '-:.:~ .>
'. . f. ~~:;.
b. 5 LINE JOINTS
FIG.23 EFFECT OF NUMBER OF TRANSVERSE
ROWS ON MODE OF FAILURE


r Ii IQ
I I ~ ~ ~
90
89 P3(-~
88
87 I~ ([S/G=1.167
v 4 \v----+---...1.-/~-i ,) AC4
I-~ 86
P21'\- V 3
(.)
a:: ~ 85
--~)AC.3
\-.- S/G = 0.833
z
b 84 z UJ (.)
u:: 83 u.. UJ
Y5(~
"~S/G = 0.500
""t AC 2
.... en 82 LIJ ....
81
80
/ S/G=0.333~S/G= 0
v \/~ / JAI~)' \
v ~ AEI( V ACI
79 G/D = 4
78 I I 2 3 ~- 5 6 7 8 9
NO. OF LONGITUDINAL LiNES IN JOINT
FIG. 24 EFFECT OF NUMBER OF LONGITUDINAL
LINES OF FASTENERS ON JOINT EFFICIENCY


. . . . . '-; •• -;"e •• - ' •••
::a iif.;;.. .;.;.; .l.:" ... ~
Q. SMALL STAGGER
b. LARGE STAGGER
FIG. 25 EFFECT OF NU MBER OF LONGITUDINAL
LINES ON MODE OF FRACTURE
~
- ~:-~~

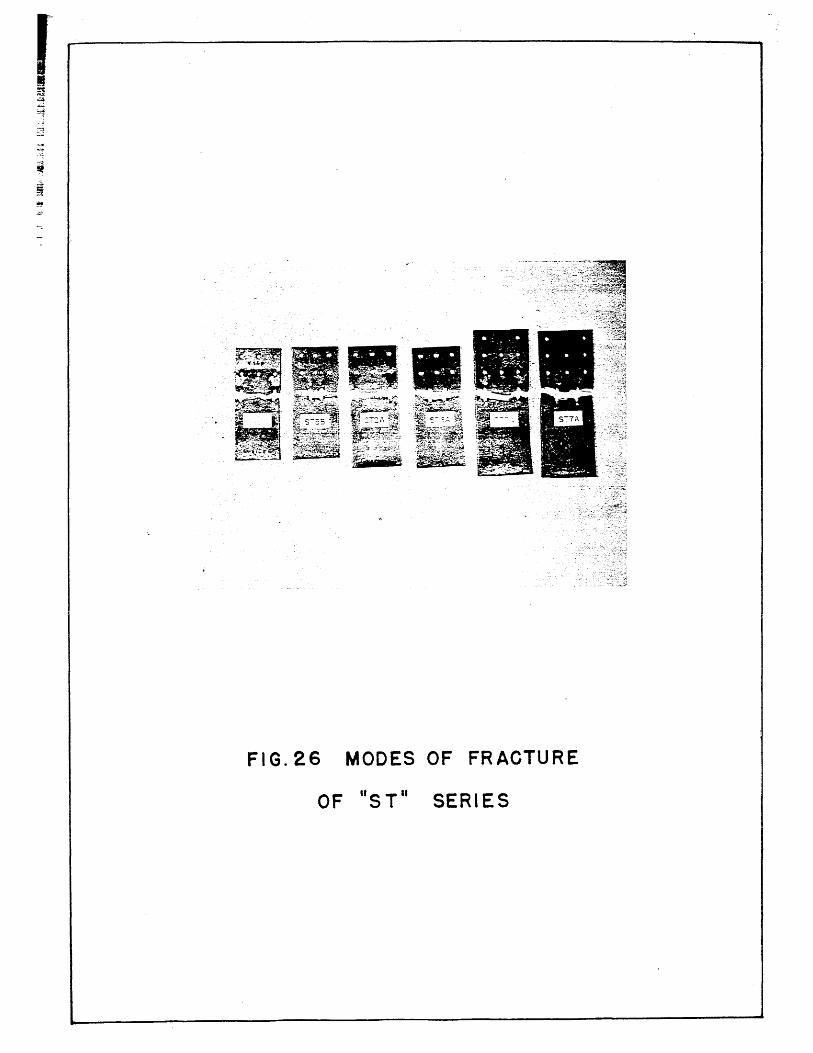
FIG.26 MODES OF FRACTURE
OF "STu SERIES


I -~
-4'--
,0.
b.
FIG.27 ORIGIN O'F FRACTURES


J I ~ 94
r-----~-----~--~-----~~~~~~~~~~....:.:.;..~:~:o.~~ • ".I'-~ _ ••• -._. __ •••.•• .., •• _'. __ _
":i ~
~ ~ 92
" i o .STv SERIES PLOTTED ACCORDING
i 90 , - - 0 TO MINIMUM G/D 0'0 --- .".
~ ST 3 !:
88 _ .0 (0)
-86
84
82
~~ ~
:-----
~ -) ST4
ST2 ( ST7
Y / ,...,
./ V °ST6 / o~ /
.... z UJ 0 80 a:: UJ Q.
78
STI"j V \ ,
ST59 '/EXPERlt.fENTAL CURVE
FROM FIG. r8 z
> 0 76 z
!I l.LI 0
"- 74 / u.. l.LI
..... 72 en l.LI .....
70
68
I I I I
66
64 ,
62 2 A 5 6 7 8 9
GAGE DIAMETER
FIG. 28 EFFECT OF MINIMUM GAGE ON
JOINT EFFICIENCY


>-0...-22 !:!:!UJ go LL LLa: LLJW
a. .... (/)2 LIJ....
>-1-02 ZlIJ LLlO -0 u::~ lI-LU We.
I- z· (f)
lIJ I-
85 AVERAGE PER CENT
84 1----+--- REDUCTION. IN AREA, R· 52 56.1 52 .. 7
83
82
81
85
84
83
82
81
51
Q250 Q300 a350 a400
THICKNESS OF CENTER PLATE IN INCHES
FlG.29 EFFECT OF PLATE THICKNESS ON . I
JOINT ·EFFICIENCY IN PRESENT TESTS
52 0
~----l.-----~ ~
~ 0 51' 0
Va ~
54 56 58 60' 62 64 66 68 70
PER CENT REDUCTION. IN AREA, R , IN PER. CENT
FIG.:30 EFFECT OF PLATE DUCTILITY ON
JOINT EFFICIENCY IN PRESENT TESTS
._<. ,
.. -j


r I J
I I
FIG. 31 TWO MODES OF FRACTURE
IN DUPLICATE JOINTS


95
I
90
~ /' .........-----.
/---m// J ~~--
~' " f,/ V' .... ,,/
/ /
/
// / /
/ I
if I VV ;/ I
I I
I I
I
If i/ /'1 / '/ ,tV
/ // ! fll I, I
II I ; I
85
80
t- 75 z w 0
0:: 70 w 0-
Z 65
b Z ~ 60 0 lL LL w
55
50
45 /// 2. 4
FIG.32 COMPARISON OF
I ----- -- ----AREA 0 _--- I- - ---
.... ------.,......-....--
-- ,..--f-.-----:.~ ,.--
,. f----C-Wilson --
---r-.---./ 1---- -------~---
-
"®
RELATIONSHIPS FOR RECTANGULAR PATTERN JOINTS
%'0 Rivets "/jS" Holes
Modified AREA Efficiency :: (G ~ D)
Wilson Efficiency :: (G ~ D,) (I + %) 0.85
Equation No.1, EtfiCienCY::(68+~)(I-~) ~ 87%
Equation No.2, Efficiency = 1.05 (100 -~) ~ 87%
Equation No.3, EfficiehcY=0.905(100-~) ~ 75%
6 8 10 12 DIAMETER
It, 'i I 1;t"I'S/!, ' .• ',' "';I~i~ 1:'f"fl !;Jf. ;.\, I:: !'!"'H'~'T'''1~
-----~----~
--f--
14
I
~ ···.4 <..:?~
tJ tzj
;j~ " ct t-l-
-f-~
f\ ~ "'\
~ 3 0 . ~~ "- t-l-00 rn
+ 't:t
t!\"" b $~
(b
i flJ
G t "" +' 0 0
(J ~ " co
0
;r ci-t. J;: ..,
t 0-<:,
+ " (-
~ D() -+-~ ~ UJ
16~ ~. ~~;~ !
, { GAGE
VAHIOUS ME THODS OF P.REDICTING JOINT EFFICIENCY ~ ~
.... t\
~ I
c.:;- llh'tl '-----------------~-____:_~~--..-----.::.:. ... ·~I.:it ... ·,.;':;
I!~


;YMBOL
• o
H
• o A
T
+ ~
o X
+
TESTS REPORTED BY
PRESENT PROGRAM
FEFFERMAN a LANGHAAR
MOISSEIFF, HARTMANN 8 MOORE
WATERTOWN ARSENAL, 1882
" 1\ , 1883
" , 1885
" " , 1886
II .. , 1887
.. .. , 1891
.. .. , 1896
GAYHART
DAVIS, WOODRUFF a DAVIS
CAYel, MUNSE Sa WILSON
BECKER, SINNAMON a MUNSE
MASSARO, SINN AMON a MUNSE
BERGEN DOFF 8 SCHUTZ
BARON a LARSON, RES. COU., PROJ. Y
'I II .. II .. \I
HARRIS
WILSON a THOMAS
WILSON, BRUCKNER a MC CRACKIN
WiLSON, MATHER 8i HARRIS
RESULTS
GIVEN IN
TABLE NO.
2
5
6
7
8
9
10
r I
12
13
14
15
16
17
18
19
20
21
22
23
24
25
REF.
NO.
9
10
I 1
12
13
14
15
16
1.7
18
2
'9 20
21
22
23
24
25
26
27
LEGEND OF SYMBOLS USED IN PLOTTING
RESULTS ON FOLLOWING FIGURES


12
L-----A-+->- 8 I <.) z
h.
A
A -A ..
6 . .... A ~
J!- 6
w --1---~A~r-~~--1 (3 H 0 =\ tt: T A. .A.. 0
lJJ 0 .0 ___ • • a: 4 A 00£ A °0 ~o -0-
0
A A . . f-~ 0 ij .0
Z 0..... A 00 ooA lJJ - ~ 0 0 O~ T ~
A
d
a: a: o. .-0-
W ~ 0 •
a. • Zl • • y z>-
~ ~ -41 lOT I I· "I ·11 0 u~ y
>L1.. W
.en w
• 'f' .. y • H
...... -8 I
-12 ! J... I I I
RELATIV~ GAGE M~THOD DR~LLED HOU.ES
\.4 I.e; 1.8 2.0 2.2 2.4 2.6 2.8 3.0 EClUIVALENT RELATIVE GAGE
FIG. 34 VAHIATION OF TEST EFFICIENCIES FROM EFFICIENCIES PREDICTED BY THE
3.2
. ;f¥'1F~
\: <;1
RELATIVE GAGE METHOD FOR JOINTS WITH DRILLED HOLES I Jd! "lit.


! 14.6
. ~ 8~--------+---------+---------+-~~--~~---------r--------~--------~---------T---------;
~ • 6 () 2: ~ ~~ ~ C,) 4~.
u., u. 4 A
0:: wi - 6. ~ O O...AJL /). it
o 0 A --vv .11il- t • 01 6 0 )( ~ ~
J- WI ~. A 66 cP 8 ~ It. X X • Z .... 0 <>- ~, o. ,..a ~~ 13 -9-~. ~r. ~ • W () 0.:8: 0 ~ I '-0 4-~ ~ ~ 0 -04,," A X X, • • , <.) 01 '-¢~ 6. 0 ~ ~IO -V-~ ',,~. ....
I.LI 0 ~ 0 ,,-o-.+J '}L -V-~_ -n.. ~ -...a 0:: 0:: 0 -::ru e: -0- ~ 6 . 1?" -6: 2 • v.·" W [1 -0- 0 .-yyv- AI -"'r-V-' ~ • • " \i
a. a. 0 A 0 -0- £4 • -V- 5 ~ t .... • • '0 u. -<:&~ H .... ..A.....J :&:- 4 ___ -0- .... ..,.. ... ()
Z ~ T Y ~ ~ X~ ••
Z ~ • 0 r -l:r ~ • ~~ .... ~ •••. ~ W 0 -t:t-::t-. .;r-- .
~ (,) -4 .. *~ "iii" =JI:..... :fl:~ L.- ..... '.' ¢ <:{ 11. ... .. .. 0::: 11. ~ W ..... > 0 ~
.... +;r. en W • .... -8 ~--------+---------+---------;---------~---------r---------+---------+--------~---------,
RELATI\'E GAGE I.1ETHOD
DR LLED HOL.ES -12 ~ ________ ~ _________ ~ ________ ~ _________ ~ ________ ~ ________ ~ __________ ~ __________ ~ _________ -,
3.2 3.4 3.6 3.8 4.0 4.2 4.4 4.6 4.8 EQUIVALENT RELATIVE GAGE
F ,G. 34 (CONTaD)
: \; i:, ,-t
i'l :t~< ,i
*,ihA l.j- ,;, L ·./t.:. , .• 1 ,Hi:. . t.,


c 0 J: (/) I-wlL! ~o UJ J: (!) 0 « LJJ (!) ...J • I
...J U) - ... - ->0:: -0 I-« ...J UJ a::
o-
w C!> <t (!)
.-.i._ -. t'JW r-
_ow. ..... ... ->
~ ...J "-I a::
t-z W ...J
~ :::> a
___ tfJ L .- .... qW - - - - CX) - -Ift- • I ---• • • • •
.. ---
~
C
l-N Z l(", r'\ -. . ~ • (,) -
q-ro
0 (!$ aD -C\J cp ~ 0 ~ CD (.\.I
LL - I , I
).. ON310l.:l.:l3 a3.l01a3~d - AON310l=l=l3 .lS3.l ~O .lN30 ~3d Nl NOI.l'Vl~'JA


IZ ~ 18.4
I~ ...... --. T't3:s ~16.8 "15.2 14.2 15.1 l~ 14.2 • ------• --------~-'- -- ---- - ----- ---
a B -----
.~-1---b 8 ----- " -. -- c
'" G/D EFF. z -- DRILLED) - SID EFF. (PUN tA-tED) • ...-- 0 W - c .--0 -- - • LL ....... - ----LL f.--- ........ [~
--* 0:: W •• • 0 4 ...... 0
.... W Z .... W 0 0 • c .. o 0 • c
W • c 0:: 0:: W Cl.. Cl.. 0 " ... z I * -Z >- c o 0 - Z ~ W - 0 4 -0::: - - -~ tt a
W • a a • .... (/) • W ....
-8 --RELATI' IE GAGE I ~ETHOD,
I. T12.7 PUN GHED HOl ES
-12 ;14.0
12.2
1.4 1.6 1.8 2.0 2.2 2.4 2.6 2.8 3.0 .3.2 EQUIVALENT RELATIVE GAGE ,
FIG. :3 5 VARIATION OF TEST EFFICIENCIES FROM EFFICIENCIES PREDICTED BY THE ;' :t
;4 RELATIVE GAGE METHOD FOR JOINTS WITH PUNCHED HOLES
" i <Lf ~f f,.i
, ~J I ~·~l~·
.':.. !l~ t • ~. • '.
1 It ·~i· foil·; t!* 'ill.~ .H :' ~ ,.~ll.' ,!I


12 ~112.2.. -------~------1-- -1---- ----1------- --,----- -=------- 113.3
-------
~G/D EFF.
1---_.- --- ... I * ~
DRILLED) - G/D EFF. (PU" CHEO)
>- 8 --'-
<.) ...
ffi + L:J.
Q + u. + u..
a:: W
00 4 -.. T
I-~ Z<..) w-OO .... t A +
W ..... a:: a:: 1= ++ ...... Wa... a... 0 1-. + .+
zl :::-.... I ...... ..... ...,..
* + +
Z >- + -----o <.) -. + t + ... ~
- Z + ~~ ~
~ °-4 ~~
~ t!: w I-cJ) W I-
-8
RELATI' fE GAGE I ~ETHOD
t l2..a PUN OHED HOl ES
-12 15.9
:3.2 3.4 3.6 3.8 4.0 4.2 4.4 4.4 4.8 5.0 EQUIVALENT RELATIVE GAGE
FIG. 35 (CO NT aD)


12
>- B
I ()
~I -,.
I A
iI!._ LJJ ()
A
u_ A
u_ + 0:: LJJ
o Cl 4 ..... LLJ Z ... - *
++-t t:) w __
o C)
t~
0:: LLJ ....
W a:
+
0... a. 0 ... A +
++ z I i:-- >. Z t:)
A
o 2~
+
..... u]
. + +
« --- t:) 4 0:: _. -<{ u. > u.
l1J
..... (f) l1J t-.
-8
RELATI~E GAGE t,.1ETHOD
-12 I .1 I PU~HED HO~ES I 5.0 S.2 5.4 5.6 5.8 6.0
EQUIVALENT RELATIVE GAGE
FIG. 35 (CONT'D)
6.2 7 . .t4 7.6
t.l ;fj 1 J ,t,
J t "f .
__________ -------------~-~I


16
12 ••
~
8 >-0 c) Z 141 0
A -(.) -u.. u.. • • UJ
4 6 •
Cl • ~ 0
w ..... ~ A 0 • .... - .>- • Cl ' . -6 lJJ A Y
A
0:: A A
.0-4~ • ~~ ~.
1 0 J>... ~ . " °0
>-• .·A t • ••
(,) y.ra • 0 c98i .. •• A;
Z Il .. .. UJ
y OA .. - 'YY ~ ... A • .. (.)
,~ • ~ 01 • At.
- • ,Ir . ... A A
u.. •• • • oM ..
l~.o .y
u.. y. .,y • • ' . .. y
UJ ~ y. .. ,yy .. o
..... -4 1-----A .' V YTY
.~ ,Y
A 0 (f) • F ... -" y b • A LLI ..... .. , 0 •
• c ~. • ~ ~ • 0:: • I?
y
0 • w ~ . I
• I ..... Z • '. •• w -8 ~
(.) • 0:: 8 w ,) a... • z
t ala , - gO
Z A
0-12 a
1;i a:: bULE
0 • <t:
WlLSON I
> a III
I I • ,2.7.4 -16
23.1~ T28.9 29.6;
I . ~ 23.8 a-9.~ • 43.2
~18.7 i ,24.5 • 19c1 c ' 41.4 -p
1.4 1.6 1.8 2.0 2.2 2.4 2.6
EQUIVALENT RELATIVE GAGE
FIG. 36 VARIATION OF TEST EFFICIENCIES FROM EFFICIENC1E S
PREDICTED BY WILSON RULE FOR EFFECTIVE NET WIDTH


_ "~ • ..,A. __
, .........
16 .~
I
12
>- , .. a •• • z • .. • LIJ A • 0 8 • - bo • ... LL I LL • • IJJ • .. • • •• • • ~ • • ..LI • • k ~ - ..... :t: • •• A .... A D 4 • A·~""bo ... :-- .. + ~ • JJ.
-a-~ +A 6 LlAA boA. +-- 13-+~ 1: fl. t
• A I ::L :l+ .....
1 & ..-..A • 9 .... ~ 0 ~ 0 ~ :.J 00- 0 2: 0 /:,.
~ 0 6~~
~ 0 A o • ..... A II ~r-
r~ 0 o· .... 1 IO+~ -:.J + + H - + A. .1- + ~ .....
-0- • +4+~ -i:I--[)-
00 0 .... .1-~ 8: bo ~
Jl • ....... *-000 + to H A • -0-- 0 +-s>- •• 0 :f)
o • -0-
~~o .u • ..... ..... • -0-
- -4 T 0 H .... .....
0 +..c--a- • -0-
1:: :> 0 -0- 0
- 0 .. * 2 :t .u f :.J ... ~- + .....
-8 .... -+t + .....,.. :t: .... JJ l.. + t-:..· H A
2: + + ..... z :,) = -12 ::l:
A :t: :::t I WILSON RULE >
-16
-+- 20.3 + 23.9
2.6 2.8 3.0 3.2 3.4 3.6 3.8 EQUIVALENT RELATIVE GAGE
FIG. 36 (CONT'O)


.-
12
I~ r 0
E ~ Z L&J • 0 8 ii: • LI- • -.svt-
L&J -Q-
• -v--v-4_
0 )0< • ~: .. L&J 6b.
4--:r t- '> -'\l-~ 0 -<" ... 4-- 4 A .I.
0 ...... ,I • y
~ () v I.&J ~ )(4 a. ...... a: ~ .z:r a.. ,( .~~ 4_ -0-t -P- X~ ~X + +-=.- ~. :; i >- ,(X
0 -* AA z )0 < ..- .... w -0--0- l ..... ~ 0 " ~~ .... 0 -b:-- () LI-
~~ A LI- 0 UJ • 0 0
~ 0 -y-CJ) ~
) ... W 0 ~ ~ -4 o 0 0 ''i''
0 0::
0 -eJr + 0 .... t- ---
)
o. Z -41-
-+ I.&J .. 0
-8 0:: UJ • a..
z -z 0 ~ -12 ct a:
R ct WILSON ULE >
-16
3.8 4.0 4.2 4.4 4.6 4.8 5.0 EQUIVALEN T RELATIVE GAGE
FIG. 36 (CONTID)


16
,
12
• -:> ~ •• J • •• -:> 8 • -J •• • • )
~ • J • •• -:>
4 .... ~ .-) ••• J •• • .. - •
I I • - • , ~ J
0 -, -- 0 J 0 +
0 0 -
) 0
J -4 + - i -- 0
) + 0 .. + -~
J + +-)
..;.8 ~ . j
-~
;-
-~
) : -12 (
( WILSON FULE .
-16
5.0 5.2- 5.4 5.6 5.S 6.0 6.2 EQUIVALENT RELATIVE GAGE
FIG. 36 (CONTI D)


, ..
!
16
12
>-0 Z l.Ll
O. U-U- 8 l.Ll
0 0 1LJ l- I t-o .1 - I I • 0 UJ 4 a::: u a.. u I
>- • 0 j.
z • L.LJ -U.
0 u.. L.LJ I}
l-00 lJJ 0 l- 0 0 0
0
0:: -4 0 0
t-Z L&.I 0
0:: -8 w Cl..
z -Z 0 l- -12 ~ -a:: <:( WILSON RULE >
-16
6.2 6.4 6.6 6.8 7.0 10.25 13.0 EQUIVALENT RELAT IVE GAGE
FIG. 36 (CONT1D)


,.?,~ ~~~~~~~--~~-----T~-----r------~------~~--'~~ I, I I I It: ~~ __ ~ __ ~~--------~---------r---------+---------+------_18~.7~J~--~
•
At:.
) O~----~--+---------~--------~---------r---------+--~------+--~ ~ ~ J , j
-
A
o
o I
1 _4~'---------+---------4--------~----------~--------+---------+---~ J
I~
• •
o
~ . tT d • J Ita. , _8~--------+---------4---------~--------~--~~n~--+---------+----;
... J
~
~ _12.1---------I-----------+-----------+-----------+----------l----------+-----I -( .. •
AREA RULE o tl
_16r---------+---------4---------~--------~--------~---------+--~
19.5, .23.5 19.6 .. 21.7
-1.4 1.6 1.8 2.0 2.2 2.4 2.6
EQUfVALENT RELATIVE GAGE
FIG.37 VARIATION OF TEST EFFICIENCIES FROM EFFrCIENCIES
PREDICTED BY MODIFIED AREA RULE FOR NET SECTION


-
16 t 21.3
-0->-- • 0 :g:. 6.
z 12 w ~ -:If-0 • ~ t:J. - -t'" LL
~-o-LL II w A A~ • A A A • ~~-o- A~ Cl • A -#-w -0- •
.... B ... : A ~:-O- A+~ 13-+ 0 ! ...... Cl ·,At ... 10--4-UJ a:: A ~~ 7--¢-C- A.-y A A +~ 1 • A
.... ll ~-o- 10--4--ir >- 4 0 .. . • --- 4-+ z =I: w • +i
- "3 -..,.-¢--(.) A
0 ~O 0
IJ.. ~O
00 0 "3 ~+ LL .0 () f-I W
.0 0 80 0 0
t- o • "'-1-0- 0 (/)
-0-W ... 1= 0
t-~ -j 0
~ a ... -/:r a:: 0 tl ... -JI- =I: A .. t-z -4 ti w
A 0
a:: w c-
~ -8
z 0 -t-<1: -a:: <1: > -12
AREA RULE
-16
2.6 2.8 :3.0 3.2 3.4 3.6 :3.8
EQUIVALENT RELATIVE GAGE
FIG.37 (CONT'O)


~~- ,.------~.--.. -, -- -.-.- ._-.. - ~-
..... - .. '-,~.:.i..~ ~ .. :.:;;;':;'(~~- . . -I.~.,:':.~'~~-:- .... ~ :-;' __ .-
~. .,;..- ... _,-, .... "::":--. "'
, .... .. \.--:; .. :~.!~-- .- ....... .. _ ... __ .... _- . - .-."' ~
.~ .. . .... - -' ...... :.-0: ~ ..
~~
-~ -
16 ... :.;.
~, -• "' .. --•
\2 ... ~ ~
-
• ""9- •
.-"i1- t ~\l
X • 8 ~ ~~A v .. • X -V....rv--V-~ _ t • A • ~.: I·
3~~~ • -c- I • X-O- I
~ ~ t X~ I <>
t • -~ .. ~ ~ b,"'V- l:
., • -4 ... .I!r ... 4 . .., -u- /'. "uA
+ -0- ~) rte-
-A-to- ~ -o--P- -A- ~
I A • + .~
I ... --- -0-..0- ~
~r- + c I 0 ..l ... !~
~ '" + 0 O~ -~
~.4 .... + ... I
-+--t1 0 I 0 0 0 + 00 0 .1 • -...
)
-~ 0 0 0 4- n. -4
,.. ..... ...... . 0 .... J ..... b
0+ ) • .. . ...... • J
- (
-8 + • ~ -~ * )
+ ---- • -l:
t + * -t::
~ :t: -12 >
AREA RULE
I J -16 .-.--- -----.-
20.2+ 23.0 '"
3.8 4.0 4.2 4.4 4.6 4.8 5.0
EQUIVALENT RELATIVE GAGE
FIG.37 (CONT'D)


- .. . ..... , ~ .............
. :~,~
16
·12
>-0 Z lLI
" ~ ~ 8 w
0 w ~ 0 0 w • a:: 4 a.. • n I • >- ••
0 • z • •• w • <3 • - . ~ • • ~ u... 0 w ~ 0 CJ) •• 0 w •• ~ 00
a:: 0
0 -4 u
~ 0 z 0 w ..... 0
a:: w a..
~ -8 0
z 0 -~ 4: - + a::
* ~ + >-12
AREA RULE
-\6
5.0 5.2 5.4 5.6 5.8 6..0 6.2 EQUIVALENT RELAT IVE GAGE
FIG. 37 (CONT'O)


. : .... ~.; .• ..,;.:o~;.~. : .. ~ .
, ...... ;: .. ~ .. .. ,. ..... , ..
'. ·;~"··1 ~~"'}..'f"!.....-:- •
t
16 .. . -
-
~
ti ~
::> 12. "
~ .:
U "
::> --I- .:
I-U
::l U 8 -::> -::l U' 1: 1.. -I ~
4 ;> • z • u • ;> -l- • I-U
- 0 f)
.Ll -4~ x
- x t: :) x - + z -4 .u ;,) 0
* )(X X ..-
t: 0 X
J.I x 0 J.. 0
Z -4~ .. z -SI :::> -- 0 c:t i" - ~~ :x:: ~ c:t -1 0
> + -12 4- 4-
AREA RULE
-16
6.2 6.4 6.6 6.8 7.0 7.2 7.4
EQUIVALENT RELATI VE GAGE
FI G. 37 (CONT1O)


16r---------~---------+--------~--+---+---~--~--~----~----~--~
12.
>-0 z w 0 -u.. u.. 8 w Cl W I-0 4. -Cl 4,. W a: 4 CL 4,-I
~ <.) Z 0 W (.) 4~' u.. 0 • • u.. •• • •• W
l- • • 4t -1~ • (J) ~ • W ~. l- • 0 a:: • 0 • •
-4 I- .-. .... Z • iJ.j t) .. a:: 0 w a.. 0
z -8 Q ~ ~ -r
-+
Z 0 t= <t + -a:: ~ ) <t .. + > -12
AREA RULE + .. +
-16
7.4 7.6 7.8 8.0 8.47 8.71 9.10 9.20 9.30 9.40
EQUIVALENT RELATIVE GAGE
FIG. 37 (CONT'O)

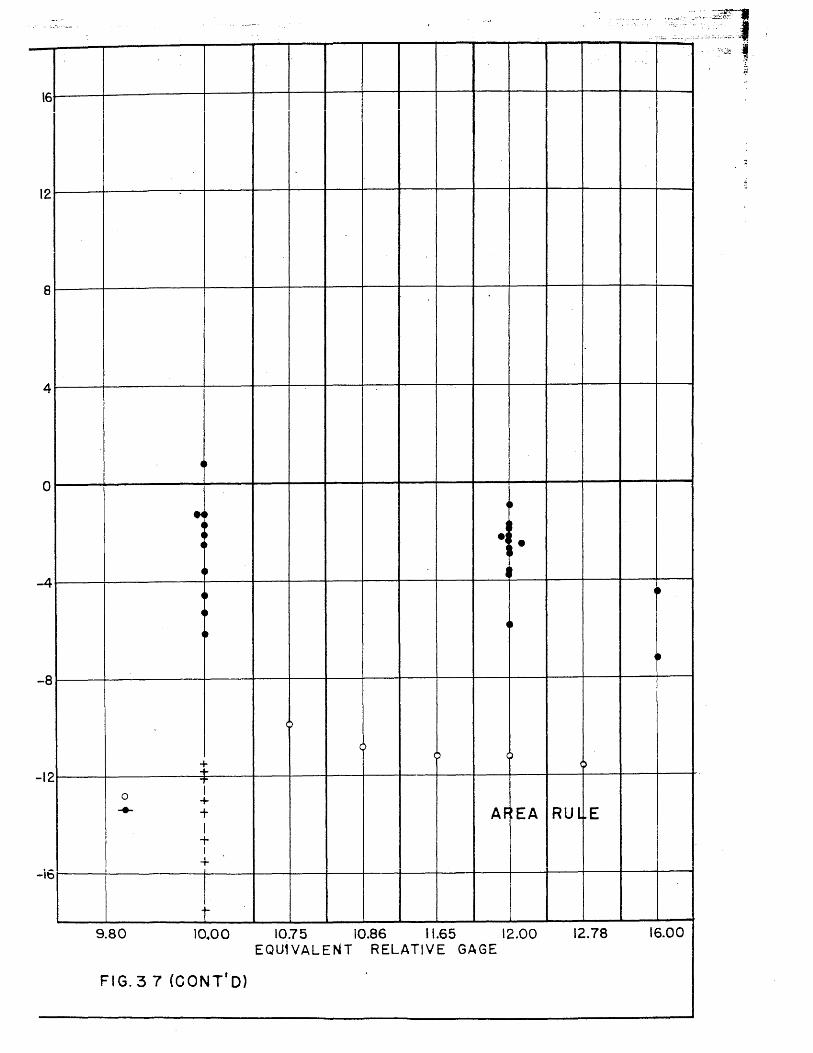
. . '. :~.: .. ~ ... '~'.::;?1/ I . . . .. , ... ::.. ......... ,.:.:.:o.:: .. , .. , .. j
I I II I I II I I 1·111~1
12
8
4
H
0
• ~~ 4~ .~ I 4~ 4.
I • ! t
4' ~ t
-4 • 0
0
• 0
• -8
)
) c ()
t )
12 T 0 + ... + AF EA RUL E I
-t I
+ -i6
-9.80 10.00 10.75 10.86 11.65 12.00 12.78 16.00
EQU1VALENT RELATIVE GAGE
FIG.37 (CONT'O)


I' :0IIII .... 20 ~
., r-~' M AI ERR( ~R= 1.07 % 18 :
~~
-," ~ 0 16 r- RELATIVE GAGE -- I ~ t-E RCR F AN ~E FOF ~ )% i---
1 0 TES' S
~ 0 I - I ~ en 14 ~ I-
f
en I "-! IJJ 12 I- I
r- I u.. 0 10
I I I
0 I
z 8 I '-1 I
~ 6 '0
I I
I- I
4 I -I- I ,
2 ~
I- I
Z W 0 ~ w
J -.. u, I I 1-r H h ~ .. _ .. r-I---M AN Ef RO R= I. 7 9~
a:: 0 10 -f-+ I r+- -E ~R4 )R RAI GE Fe R ~O We, Z
a:: 8 0 a::
r- ~ Of TEs~rs
- - WILSON r I
I a::
6 w ~. ...
~" I
z w 4 >
I -r- I
I I
(!) J r-
::I: 2 - 't ~
t: ~ 0
.. 'h
.. --- -~ - r ....... r.., r fn. r--lJl. .M I ~ .. -en f-en 8 w
,... f-- ME N ~R' OR:: .39
I r;= '~RROR RA NGE FOR,'-s:;'°J., OF T~S"S
l f-U- 6 0
~ r- AREA I
-' ,...
0 4 Z
-[ -2 n !- -I
01 ... W ! fh I n I
-36 -32 -28 -24 -20 -16 -12 -8 -4 0 4 8 12 16 20 22
ERROR IN PER CENT=TEST EFFICIENCY - PREDICTED EFFICIENCY
FIG~ :3 8 ERROR DISTRIBUTION OF PREDICTED EFFICIENCIES
FOR 855 TESTS STUDIED


~ ---~-------~,--... -.>-",-:~~.-.. --------------------~--------~~------~~-'-.'~~~~~~~'
0 0 -en t-en LIJ t-
LI-0
0 Z
...J
~ 0 t-
·1·
t-Z lLI ~ lLI a: 0 Z
a: 0 a: a: UJ
Z lLI > (!)
:I: t-3 en t-en w t-
~ 0 z
20 I ~I-
I I I I I
18 f--- - RELATIVE GAGE .... ~
16 -I- ---- ~ I
l4 ~
1MEAN ERROR = 0.55 %
12
10
8 ~ - I ~
6 ~ -
4
2 I-I-~ ~ I
0 I-l r -
I
20
18 .{,~~AN ERROR = 4.92%
I--- - WILSON ~
~
16 .. I-~
14
12
10
8 r---
6 ~ -
~ -4
2 I CI-
0
20
18
rt1, I r-I, ! ! ! , I , I , I • I I , I ,
I I I I I I
~V -MEAN ERROR = 1.83 %
- I---
r---r AREA 16 I
14 : 12
I .... I-- I
10 I r--1-1
8 I I
6 I .... - ~- J .... - l-
I 4 I -I- ~ -2
1---1
I'"'""!-- I ~r-,
0 I I I i I n -12 -10 -8 -6 -4 -2 0 2 4 6 8 10 12
ERROR IN PER CENT =-TEST EFF fCIENCY-PREDICTED EFFICIENCY
FIG.39 ERROR DISTRIBUTION OF PREDICTED EFFICIENCIES
FOR PRESENT PROGRAM
#.
. -t


1.04
1.02 0 II
~
1.00 z W I ~
r 0.98 <.) z w (.)
U- 0.96 LL w W· C> <t 0.94 C9
w .> ~ 0.92 -.J
~ ~I·
0.90 >-0 z w 0 0.88 LI-u. W
t-0.86 CJ)
w t- V II
::t: 0,84
0.82
13 &0- -<>-1.2 "-..,. V~') 3~
/ (r-
5. "-V 3 ro- "'-l. rl
9 ~~ / A ~
/9 -'V"'1'-
1 H -LrJ
/ ~
/ / " ~~
~8-/ A K= I D.82 +c ~.003 2 R
V rtrl / 1-.-
"t.-
V ~
NUMBERS BY PLOTTED 1 H I POINTS INDICATED
NUMBER OF TESTS AV.ER.AGED.
.r
20 30 40 50
REDUCTION IN AREA, R , IN PER CENT
FIG. 40 EFFECT OF DUCTILITY ON JOINT
EFFICIENCY
60


)6------~------~------_r------~------~------r_----~--~--~
)4L------+-----7~~==o=~~----i_------r_----_I:_----_r------_j
34~-----+------_+--~+_~----~~rr_=-~r_~----r_----~------_!
32L------+------~------~~----+_~----~ __ ~~------_T------~
90L------+------_+------~------+_--~~~~~~~----~------~
B8 I
86
84
82
80 0.4
,
\~ ~ \ I
\\ \
~
6
1\ Q
\ \ ~ 0.623
I I O.so.flj ~ \ 0.575 *
0.554 0.672
0.8 1.2 1.6 2.0 2.4 2.8 3.2 3.6
BEARING STRESS -7 TENSILE STRESS
FIG.4( EFFECT OF BEARING STRESS to TENSILE STRESS
RATIO ON JOINT EFFICIENCY
.'
'.",~ . , ... ~~;
':?~tft' :.