Effect of pea proteins extraction and vicilin and legumin fractionation on the phase
12
Effect of pea proteins extraction and vicilin/legumin fractionation on the phase behavior in admixture with alginate J.-L. Mession a , A. Assifaoui a, b , P. Cayot a , R. Saurel a, * a AgroSup Dijon, UMR PAM 02.102, Equipe PAPC (Procédés Alimentaires et Physico-Chimie),1 Esplanade Erasme, 21000 Dijon, France b School of Pharmacy, Université de Bourgogne, 7 bd Jeanne d’Arc, 21079 Dijon, France article info Article history: Received 23 May 2011 Accepted 12 March 2012 Keywords: Pea globulins Legumin Vicilin Heterogeneity Sodium alginate Segregative phase separation CLSM Microstructure abstract Soluble and natural mixed pea proteins (PP) were extracted from defatted pea seeds according to acidic precipitation (PPP) or ultrafiltration/diafiltration (PPDF) procedures. The isolates contained proteins with a low level of denaturation. Mixed pea globulins isolates presented quite similar solubility and thermal profiles, also a similar polypeptide composition. Vicilin/convicilin 7S (Vic) and legumin 11S (Leg) fractions were obtained by batch chromatography using a salt gradient for the elution. Several incompatible systems were built by mixing the pea proteins with an anionic polysaccharide (sodium alginate, SA), when biopolymers were both negatively charged. Most of mixtures exhibited a phase separation phenomenon. From phase diagrams, experimental binodal curves obtained with either mixed globulins or legumin fraction were apparently very close. However phase boundary was better-defined with the Leg fraction. No macroscopic phase separation was evidenced for mixtures with the vicilin fraction. Microstructure of the PP-SA mixtures was investigated by confocal microscopy (CLSM) according to PP composition and biopolymer initial composition. The Leg-SA and most of PPP-SA mixtures exhibited a droplet-like structure, while structure of PPDF-SA mixtures was aggregated-like. With mixed PP, an alginate entrapment within the PP-enriched phase would disturb phase separation. Also density and shape of the protein-enriched microdomains influenced kinetics of demixing. Polydispersity within the PP-SA mixtures, in terms of wide range molecular weights distribution and charge heterogeneity would explain such differences. Ó 2012 Elsevier Ltd. All rights reserved. 1. Introduction Proteins and polysaccharides are two major compounds encountered in almost all food systems. When mixed together in solution, interaction between those biopolymers governed the phase behavior of such blended systems, hence impacting their structural, textural properties and hence their stability. Biopoly- mers in admixture can be miscible or immiscible (unless limitedly co-soluble). Single-phase mixtures refer commonly to diluted biopolymers solutions and/or biopolymers with a low molecular weight so that they do not interact to each other. Increasing biopolymer initial concentrations led to unstable mixtures. Depending on the type of interaction, such phase separation phenomenon could be “associative” or “segregative” (De Kruif and Tuinier, 2001; Grinberg & Tolstoguzov, 1997; Syrbe, Fernandes, Dannemberg, Bauer, & Klostermeyer, 1995; Tolstoguzov, 1986, 1991). Associative phase separation occurs when protein and anionic polysaccharide are oppositely charged (below the protein’s isoelectric pH). Soluble or insoluble interbiopolymer electrostatic complexes are then formed, and concentrated in a lower phase while the upper phase is depleted with biopolymers (Schmitt, Sanchez, Desobry-Banon, & Hardy, 1998; Tolstoguzov, 1991). For a mixture containing polymers (1, 2) with a random coil conformation, segregative phase separation is usually described by the FloryeHuggins theory; indeed, phase behavior of a mixture is a consequence of the balance between polymer1-polymer2 and polymer1(2)-solvent interactions (Grinberg et al., 1997). The appearance of an excluded volume for each polymer led to an enhancement of polymeresolvent interaction. Then mixture split into two liquid phases at the equilibrium, as a result of polymer segregation in separated phases. By thermodynamic incompati- bility, it is more favorable that each polymer is surrounded by like polymers than unlike polymers remain mixed together (Tolstoguzov, 1986, 1991). Nevertheless, the Flory theory could not be applied reliably for mixtures of dissimilar polymers, in terms of shape and structure; this is the case for globular proteins or colloidal protein particles mixed with polysaccharides of elongated shape (De Kruif & Tuinier, 2001). * Corresponding author. Tel.: þ33 380 774 051; fax: þ33 380 396 647. E-mail address: [email protected] (R. Saurel). Contents lists available at SciVerse ScienceDirect Food Hydrocolloids journal homepage: www.elsevier.com/locate/foodhyd 0268-005X/$ e see front matter Ó 2012 Elsevier Ltd. All rights reserved. doi:10.1016/j.foodhyd.2012.03.003 Food Hydrocolloids 29 (2012) 335e346
-
Upload
independent -
Category
Documents
-
view
1 -
download
0
Transcript of Effect of pea proteins extraction and vicilin and legumin fractionation on the phase

at SciVerse ScienceDirect
Food Hydrocolloids 29 (2012) 335e346
Contents lists available
Food Hydrocolloids
journal homepage: www.elsevier .com/locate/ foodhyd
Effect of pea proteins extraction and vicilin/legumin fractionation on the phasebehavior in admixture with alginate
J.-L. Mession a, A. Assifaoui a,b, P. Cayot a, R. Saurel a,*aAgroSup Dijon, UMR PAM 02.102, Equipe PAPC (Procédés Alimentaires et Physico-Chimie), 1 Esplanade Erasme, 21000 Dijon, Franceb School of Pharmacy, Université de Bourgogne, 7 bd Jeanne d’Arc, 21079 Dijon, France
a r t i c l e i n f o
Article history:Received 23 May 2011Accepted 12 March 2012
Keywords:Pea globulinsLeguminVicilinHeterogeneitySodium alginateSegregative phase separationCLSMMicrostructure
* Corresponding author. Tel.: þ33 380 774 051; faxE-mail address: [email protected] (R. Saure
0268-005X/$ e see front matter � 2012 Elsevier Ltd.doi:10.1016/j.foodhyd.2012.03.003
a b s t r a c t
Soluble and natural mixed pea proteins (PP) were extracted from defatted pea seeds according to acidicprecipitation (PPP) or ultrafiltration/diafiltration (PPDF) procedures. The isolates contained proteins witha low level of denaturation. Mixed pea globulins isolates presented quite similar solubility and thermalprofiles, also a similar polypeptide composition. Vicilin/convicilin 7S (Vic) and legumin 11S (Leg) fractionswere obtained by batch chromatography using a salt gradient for the elution. Several incompatible systemswere built by mixing the pea proteins with an anionic polysaccharide (sodium alginate, SA), whenbiopolymers were both negatively charged. Most of mixtures exhibited a phase separation phenomenon.From phase diagrams, experimental binodal curves obtained with either mixed globulins or leguminfractionwere apparently very close. However phase boundary was better-definedwith the Leg fraction. Nomacroscopic phase separation was evidenced for mixtures with the vicilin fraction. Microstructure of thePP-SA mixtures was investigated by confocal microscopy (CLSM) according to PP composition andbiopolymer initial composition. The Leg-SA andmost of PPP-SAmixtures exhibited a droplet-like structure,while structure of PPDF-SA mixtures was aggregated-like. With mixed PP, an alginate entrapment withinthe PP-enriched phase would disturb phase separation. Also density and shape of the protein-enrichedmicrodomains influenced kinetics of demixing. Polydispersity within the PP-SA mixtures, in terms ofwide range molecular weights distribution and charge heterogeneity would explain such differences.
� 2012 Elsevier Ltd. All rights reserved.
1. Introduction
Proteins and polysaccharides are two major compoundsencountered in almost all food systems. When mixed together insolution, interaction between those biopolymers governed thephase behavior of such blended systems, hence impacting theirstructural, textural properties and hence their stability. Biopoly-mers in admixture can be miscible or immiscible (unless limitedlyco-soluble). Single-phase mixtures refer commonly to dilutedbiopolymers solutions and/or biopolymers with a low molecularweight so that they do not interact to each other. Increasingbiopolymer initial concentrations led to unstable mixtures.Depending on the type of interaction, such phase separationphenomenon could be “associative” or “segregative” (De Kruif andTuinier, 2001; Grinberg & Tolstoguzov, 1997; Syrbe, Fernandes,Dannemberg, Bauer, & Klostermeyer, 1995; Tolstoguzov, 1986,1991). Associative phase separation occurs when protein and
: þ33 380 396 647.l).
All rights reserved.
anionic polysaccharide are oppositely charged (below the protein’sisoelectric pH). Soluble or insoluble interbiopolymer electrostaticcomplexes are then formed, and concentrated in a lower phasewhile the upper phase is depleted with biopolymers (Schmitt,Sanchez, Desobry-Banon, & Hardy, 1998; Tolstoguzov, 1991).
For a mixture containing polymers (1, 2) with a random coilconformation, segregative phase separation is usually described bythe FloryeHuggins theory; indeed, phase behavior of a mixture isa consequence of the balance between polymer1-polymer2 andpolymer1(2)-solvent interactions (Grinberg et al., 1997). Theappearance of an excluded volume for each polymer led to anenhancement of polymeresolvent interaction. Then mixture splitinto two liquid phases at the equilibrium, as a result of polymersegregation in separated phases. By thermodynamic incompati-bility, it is more favorable that each polymer is surrounded bylike polymers than unlike polymers remain mixed together(Tolstoguzov, 1986, 1991). Nevertheless, the Flory theory could notbe applied reliably for mixtures of dissimilar polymers, in terms ofshape and structure; this is the case for globular proteins orcolloidal protein particles mixed with polysaccharides of elongatedshape (De Kruif & Tuinier, 2001).

J.-L. Mession et al. / Food Hydrocolloids 29 (2012) 335e346336
Mainly for reasons of chemical composition, size, molecularweight, conformation and solvent affinity, unlike biopolymersmixed together are usually limitedly co-soluble. Incompatibilitybetween unlike biopolymers is a general phenomenon, promotedat alkaline pH, far from the protein’s isoelectric point. This con-cerned most of food systems. When protein and polysaccharide arenegatively-charged, interbiopolymer interaction is inhibited. Asufficient ionic strength is needed, so as to shield electrostaticrepulsions between proteins and promote proteineprotein inter-action. This induced biopolymer incompatibility. Water partition-ing took place between co-existing phases, since solvent qualitydecreased for the protein and increased for the polysaccharide(Grinberg et al., 1997).
Phase separation for mixtures containing dissimilar macro-molecules would be more likely attributed to depletion interaction.Adding non-adsorbing polymers to a suspension of colloidal(spherical) particles led to colloidecolloid attraction (De Bont, vanKempen, & Vreeker, 2002; De Kruif & Tuinier, 2001). If attraction isstrong enough, this leads to a macroscopic phase separation. Suchmechanism is well-known in colloid physics (Verhaegh, VanDuijneveldt, Dhont, & Lekkerkerker, 1996). It would suit as wellfor aqueous mixtures of milk proteins (casein micelles or wheyproteins aggregates as colloids) or soy proteins aggregates mixedwith neutral or charged polysaccharides (De Bont et al., 2002; Li,Cheng, Hua, Yang & Cui, 2009; Syrbe et al., 1995). Colloid particleswere assimilated to spherical protein and flexible polymer topolysaccharide. Experimental evidence of depletion interactiontheory was found for model polymer-colloid systems rathermonodisperse, with a colloid larger in size (by means of radius ofgyration) than that of polymer (De Bont et al., 2002; Doublier,Garnier, Renard, & Sanchez, 2000). From those authors, thecolloidal polydispersity would weaken depletion interaction.Moreover, the role of depletion forces remained unclear whensmall colloids weremixed with an elongated polymer. This peculiarcase was encountered for mixtures containing native globularproteins of a spherical shape which size was expected to be muchsmaller than that of a linear polysaccharide (Grinberg et al., 1997).
The phase diagram of a specific incompatible system charac-terizes themacroscopic phase behavior of amixture according to itsinitial biopolymer composition. The binodal curve is a co-solubilitycurve at the equilibrium. Mixtures are single-phase below thebinodal, while mixtures exhibit two-phase when located above it,giving rise to various microstructures. Hence it would be relevant toconsider kinetics of phase separation; an entrapment of themicrostructure at different stages of the phase separation processwould supply gelled materials in a non-equilibrium state, withspecific texture and mechanical properties (Butler & Heppenstall-Butler, 2003; Norton & Frith, 2001).
With the aim to develop a new tailored food system withversatile properties, this present study investigated the phasebehavior of a plant globulins (pea proteins, PP) e anionic poly-saccharide (sodium alginate, SA) aqueous system, under non-gelling conditions.
SA is a linear anionic polysaccharide mainly extracted frombrown seaweeds, used in numerous food and pharmaceuticalapplications for its thickening and gelling properties (Moe, Draget,Skjak-Brick & Smidsrød, 1995). It consists of (1 / 4) linked b-D-mannuronate (M) and its C-5epimer, the a-L-guluronate (G) resi-dues. The alginate chains have a high affinity for bivalent cationssuch as Ca2þ cations. This interaction leads to the formation ofcross-links between the G residue in its alternate 1C4 form via Ca2þ,inducing gel formation (Smidsrød & Draget, 1996).
Pea (Pisum Sativum L.) is a leguminous plant which can beconsidered as a valuable protein source. Dry pea seeds containbetween 18 and 30% proteins (Guéguen, 1983; Koyoro & Powers,
1987). Peas are an interesting alternative for soybean proteinswhich are themost represented plant proteins isolates in the globalmarket (O’Kane, Happe, Vereijken, Gruppen, & van Boekel, 2004a,2004b, 2004c; USDA, 2009). Proteins play an important role in theformulation and processing of foodstuff for both their nutritionalvalue and their functional properties. Plant proteins are of growinginterest as a way to substitute proteins, since they are cheaper toproduce (Lundqvist, 2007). Therefore, this issue implies solidknowledge on the physicochemical properties of these proteins.The first step is to develop a reliable extraction procedure. Mean-while, peas and other leguminous plants contain antinutritionalfactors such as phytate, limiting applications of plant protein forfood formulation (Fuhrmeister & Meuser, 2003).
Few recent publications are available on pea proteins extractionand characterization (Fuhrmeister et al. 2003; O’Kane et al., 2004a,2004b, 2004c; Shand, Ya, Pietrasik, & Wanasundara, 2007). Peaproteins are mainly albumins and globulins. Globulins represent65e80% of the total salt-extractable proteins (Koyoro et al., 1987).Globulins are composed of legumin 11S and vicilin 7S. Legumin isa hexameric oligomer of 330e410 kDa constituted of six poly-peptides of z60 kDa, with one basic Lb (19e22 kDa) and one acidicsubunit La (38e40 kDa) associated via SeS bond. Legumin oligomerheterogeneity depends on both molecular weight and isoelctricpoint of its subunits (Gatehouse, Lycett, Croy & Boutler, 1980;O’Kane et al., 2004c). A lot of polypeptides are present in the vici-lin fraction, produced from a precursor of z50 kDa considered asa subunit which assembles in vivo into a trimeric oligomer (Gate-house, Croy & Boutler, 1982; O’Kane et al., 2004a, 2004b). Vicilinhave several cleavable sites (a:b and b:g processing sites), asspecified by vicilin genes encoding. Proteolysis produces smallerpolypeptides ranging from 33 kDa (ab), 30 kDa (bg), 19 kDa (a), 13.5kDa (b) and 12.5e16 kDa (g) kDa. Convicilin is a polypeptide of70 kDa associated in trimers. It has a very close amino acid profilewith vicilin on its C-terminus, but also a N-terminal extensionhighly charged (Croy, Gatehouse, Tyler, & Boulter, 1980).
The objectives of this work were (i) to compare different PPextraction procedures, and to evaluate their effects on the poly-peptide composition, solubility and thermal denaturation. Then (ii)the phase behavior at 20 �C of mixed pea globulins and vicilin/convicilin or legumin separated fractions in admixture with SAwere described in terms of phase diagrams, at pH 7.2 and in 0.1 MNaCl. The microstructure (iii) of several mixtures was investigatedby confocal microscopy (CLSM); kinetics of demixing also intrinsicfactors related to pea proteins influencing phase behavior werediscussed.
2. Materials and methods
2.1. Materials
Sodium Alginate was provided by SigmaeAldrich (St Louis, MO,USA). It was used after purification. Ashes contents (on a dry basised. b.) of commercial and purified alginate were 15.2 wt% and18.89 wt%, respectively. Pea globulins were extracted from smoothyellow peas (P. Sativum L.) supplied by Roquette SA (Lestrem,France). The ground peas had nitrogen content of 4.3 wt% (d. b.);1.3 wt% fats (d. b.); 2.2 wt% ashes (d. b.).
All other reagents and chemicals purchased fromSigmaeAldrich were on analytical grade.
2.2. Methods
2.2.1. SASA was purified according to Panikkar and Brasch (1996). Algi-
nate powder was slowly poured in deionized water, and mixture

J.-L. Mession et al. / Food Hydrocolloids 29 (2012) 335e346 337
(4 wt%) was stirred with a propeller at room temperature. A solu-tion of CaCl2 was added slowly to remove non-gelling material. Thegel was collected, placed on a filter and washed extensively withwater. The gel was placed and stirred vigorously in a solution ofEDTA until complete dissolution. The alginate solution was exten-sively dialyzed for several days against water and with a solution of0.1 M NaCl (alginate solution-to-dialysis buffer ratio of 1:10, 4changes per 24 h). Alginate (SA) was frozen and freeze-dried.
The intrinsic viscosity [h] before and after purification of SA in0.1 M NaCl at 20 �C was 564 and 493 mL/g, respectively. Calciumcontents for both commercial alginate and purified one wereevaluated from the ashes by the classical colorimetric-complexometric titration with the Cal-Red indicator; contentswere 2.9 and 3.4 mg Ca2þ/g alginate, respectively. As purificationprocedure modified the salt composition of alginate, this wouldaffect slightly chains conformation and hence [h].
2.2.2. PP extraction and purificationPea yellow seeds were first hulled manually and finely ground
with a mortar at room temperature. Then the flour was defatted bystirring it vigorously in pentane (98%) twice for 2 h at 4 �C (ratioflour-to-solvent of 1:5). Between each washing, the slurry wasvacuum filtered on a glass filter n� 4. The flour was vacuum dried atroom temperature. The flour was then stirred in ethanol (95%) 5times for 1 h at 4 �C (ratios flour-to-solvent of 1:5 three times, 1:3twice). Between each washing, the slurry was vacuum filtered. Thedefatted flour was vacuum dried at room temperature. The dryflour was poured in a 0.1 M triseHCl, pH 8 buffer and solubleproteins were extracted for 5 h at room temperature (ratio flour-to-buffer of 1:10). Insoluble materials were removed by centrifugation(12,000g, 50 min, 20 �C) and the supernatants were collected andcooled in ice. Acidic precipitation of the PP crude extract (PPE) wasused to isolate the pea globulins by adding slowly HCl 0.1 M.Mixture was stirred for 1 h at 4 �C. The pH of precipitationwere 3.5;4.0; 4.8; 5.5. Proteins were collected by centrifugation (12,000g,25 min, 4 �C), the pellets were washed with distilled water (pellet-to-water ratio of 1:4). The proteins were collected by centrifugation(12,000g, 15 min, 4 �C), re-suspended at a concentration ofz4 wt%and neutralized (pH 7.2) by adding slowly NaOH 0.25 M. Themixture was stirred at room temperature for 1 h, and againcentrifuged to remove remaining insoluble material (12,000g,15 min, 4 �C). The solution was finally frozen, and freeze-dried. ThePP isolate was noted PPP.
Alternatively, globular pea proteins were extracted from defat-ted pea flour by ultrafiltration using a Millipore Pellicon 2� Miniholder (Millipore Corp., USA). A 100 cm2 polyethersulfonemembrane was used (Kvick Cassette UFELA0100001ST, GEHealthcare, Amersham Biosciences Corp., Uppsala, Sweden) witha molecular weight cut-off of 100 kDa. The trans-membrane pres-surewasmaintained at 2.2 bar. The feed solution (V0¼ 400mL)wasthe PP crude extract PPE prepared as described above, from 60 g ofpea defatted flour. The PPE was filtered tangentially at 20 �C and re-circulated until the final volume of retentate (VR, mL) was threetimes less than the initial volume (V0, mL). The Volume Concen-tration Ratio (VCR, mL/mL) was calculated according to Eq. (1):
VCR ¼ V0=VR ¼ V0=ðV0 � VP1Þ (1)
with VP1 the volume of permeate (mL). Here, VCR ¼ 3.It is followed by a continuous diafiltration (CDF). The volume of
concentrate was washed by adding deionized water with the samerate than the permeate flux. This second step is characterized by thevolume permeated ratio (VPR, mL/mL), according to Eq. (2):
VPR ¼ VP2=VR (2)
with VP2 the volume of permeate during the CDF step. Here,VPR ¼ 3.
Diafiltrate was quickly frozen and freeze-dried. Isolate wasnamed PPDF.
Vicilin (Vic) and legumin (Leg) separated fractions were iso-lated by batch chromatography on DEAE Sepharose Fast Flow(GE Healthcare). The method was adapted from studies aboutlarge-scale purification of pea globulins (Guéguen & Larré, 1984;Larré & Guéguen, 1986). A PP concentrate (VCR 3) was diafiltrated(VPR 4) against a phosphate buffer (0.1 M Na2HPO4 e citric acid, pH7). The diafiltratewas thenmixed for 1 h at room temperature with100 mL of the DEAE gel, previously equilibrated with the phos-phate buffer. The mixture was loaded on a glass filter n� 4, stirredmanually, and z150 mL of filtrate was vacuum filtered each time.The protein content in the filtrate was followed by reading theoptical density (OD) at 280 nm on a spectrophotometer. Proteinswhich were not bound to the DEAE gel were eliminated in a broadexclusion peak by continuous washings of the mixture with thephosphate buffer at pH 7, without NaCl. Then, vicilin and leguminproteins were eluted with a step by step salt gradient (from 0 to0.5 MNaCl). A higher ionic strength of the buffer was applied whenthe real OD of the filtrate was lower than 0.1. Ionic strengthsapplied were 0.06; 0.1; 0.15; 0.25; 0.5 M NaCl in the phosphatebuffer, pH 7. Filtrates (eluates) were collected in separated flasks,and protein composition was checked by SDS-PAGE. The firsteluates collected with a higher ionic strength than previously werediscarded. Eluates showing bands at 20, 26, 30e50, 52 and 68 kDabelonging to vicilin/convicilin or a band at 56 kDa belonging tolegumin were pooled together (z1500 mL). Each fraction wereconcentrated by UF (VCR 4) and desalted extensively by CDF (VPR3). Polypeptide compositionwas checked in the diafiltrates by SDS-PAGE. Diafiltrates were freeze-dried, Vic and Leg fractions wereobtained.
2.2.3. Composition of PP isolatesThe dry matter of the freeze-dried samples was measured by
drying overnight at 105 �C. Ash content was determined by burningthe samples in a muffle furnace at 600 �C overnight (AOACInternational, method 920.03, 1995). The crude protein contentwas calculated by the Kjeldahl method with a nitrogen-to-proteinsK conversion coefficient of 6.25 (AOAC, 1990).
Phytate was estimated as the total phosphorus content for PPPand PPDF by a complexometricecolorimetric titration based on thecolor change when an excess of Fe (III) free ions react with5-sulfosalicylic acid. This was achieved after removal of thephosphate-Fe(III) complexes (Garcia-Estepa & Guerra-Hernanadez,1999). Phosphate compounds were extracted from PP isolatesstirred in a solution of 0.4 M HCl with 10% (w/v) Na2SO4, pH 1.8, for3 h at room temperature. The final mixture containing remainingFe(III) was titrated with a solution of EDTA.
2.2.4. Protein composition by SDS-PolyAcrylamide GelElectrophoresis (SDS-PAGE)
The composition of PP isolates in denaturing conditions wasstudied by SDS-PAGE technique, according to Laemli et al. (1970).The continuous gel system was composed of 10% acrylamide and0.1% (v/v) SDS. Protein samples were prepared at a concentration of5 mg/mL in the sample buffer (62.5 mM triseHCl, pH 6.8, 10%glycerol (w/v), 0.005% bromophenol blue (v/v) and 0.2% SDS (w/v))and loaded onto a vertical electrophoresis cell running at 10 mA,185 V. The migration buffer contained 25 mM tris, 0.192 M glycine,0.1% SDS (w/v). Wide range molecular weight markers (S8445,Sigma) were applied on a separated lane. Proteins were stainedwith Coomasie Blue R-250. Photos of the gel were taken andanalyzedwith SigmaScan� Pro (Systat Software Inc., Version 5). The

J.-L. Mession et al. / Food Hydrocolloids 29 (2012) 335e346338
polypeptide composition for each protein sample was measured bydensitometry, on at least four lanes.
Glycoproteins were detected using the Pierce GlycoproteinStaining kit (Thermo Fisher Scientific, Waltham, Ma, USA); proteinspreviously separated by SDS-PAGE (10%) were stained with thePeriodic Acid-Schiff (PAS) reagent method. Carbohydrate moietyproduced magenta bands on the gels.
2.2.5. Solubility tests of PP isolatesSolubility as a function of the pH (values from 3 to 8) was
investigated by extracting 25 or 50 mg of each PP extract in a totalmixture volume of 10 g, completed with deionized water, the pHwas adjusted previously by adding slowly 0.1 M HCl or NaOH. Afterstirring for 2 h at 4 �C, mixtures were centrifuged (2500g, 25 min,room temperature). The nitrogen content of the supernatant wasmeasured by the Kjeldahl method. The Nitrogen Solubility Index(NSI) was determined by using the Eq. (3):
NSI ð%Þ ¼ ð% nitrogen dissolved in the supernatantÞ=ð% nitrogen in the PP isolateÞ*100% ð3Þ
2.2.6. Thermal properties by Differential Scanning Calorimetry(DSC) of PP isolates
The laboratory-prepared isolates (10 wt%) were dissolved ina buffer containing 0.1 M NaCl and 5 mM triseHCl, pH 7.2. Onsettemperature (T0), Temperature (Td) and enthalpy of denaturation(DH) were evaluated using a Q20 calorimeter (TA Instruments,Newcastle, DE, UK). Protein solutions wereweighed in an aluminumpan, hermetically sealed, and heated from 25 to 110 �C at 10 �C/min.An empty panwas used as a reference. One replicate of each samplewas reheated after cooling to check that denaturation was irre-versible. The thermograms were computed with the TA Universalanalysis Software (Universal Analysis Program, TA Instruments,Newcastle, DE, UK). Temperature calibrationwas done with indium.
2.2.7. Phase diagrams determinationSA and PP isolates laboratory-prepared stock solutions were
obtained separately bymixing powders at room temperature for 2 h.Solutions were centrifuged (12,000g, 25 min, 25 �C). They were dia-lyzed (24 h, 4 changes) against a 0.1MNaCl and 5mMtriseHCl pH7.2buffer (ratio biopolymer stock solutions-to-buffer of 1:20), at 4 �C.
To establish phase diagrams at 20 �C of biopolymer systems(0.1 M NaCl and pH 7.2), amounts of SA (3.2 wt%) and PP isolatesstock solutions (10e16 wt%) were weighted and mixed together inglass tubes, stirred vigorously for 1 min with a vortex and leftovernight at 20 �C. Tubes were centrifuged (2500g, 30 min 4 times,20 �C), until the boundary between upper and lower phases wasdetected by eye. The upper and clearer phase was carefully takenwith a pipette and weighed; the weight of the lower phase wasdetermined by difference. The biopolymer concentrations weredetermined in the upper phase by chemical titrations: by theKjeldahl method for PP and by the Carbazole e acid sulphuricmethod (Bitter & Muir, 1962; Kosakai & Yosisawa, 1979).
Biopolymer composition of initial mixtures and compositions oftheir related co-existing phases at the equilibrium were plotted onthe phase diagram. The binodal curve (or phase boundary) whichseparates the single-phase domain from the biphasic one wasmanually-fitted to the equilibrium phase compositions (Syrbe et al.,1995; Tolstoguzov, 1986, 1991).
2.2.8. CLSM and image analysisMicrostructure study of PP-SA mixtures was performed with
a confocal microscope TE-2000 Eclipse (Nikon), in fluorescencemode. The light source was a NeeAr beam laser.
PP were stained by adding 10 mL of an aqueous solution ofrhodamine B isothyocyanate (RITC, 1 mg/mL) per mL of proteinstock solution, stirred in dark for 1 h at 4 �C. Excitation and emis-sionwavelengths for PP-labeledwere 543 nm and between 560 and590 nm, respectively. It was checked that labeling did not modifysignificatively thermal properties of PP (Data not shown).
Mixtures with different PP and SA compositions were stirredvigorously for 1 min with a vortex, the samples were deposited(20 mL) between the slide and coverslip, hermetically sealed.
Micrographs were converted into gray scale at 8-bit format, andbackground correction was applied to reduce artifacts from theoptical equipment. 2D-Fourier transform was performed onimages, and power spectra were radially-averaged using Matlabsoftware (The Mathworks, Inc., v.7.5.0.342). Appearance of a peakmaximum of intensity in the low-frequency range was related toa particular distance scale of the microstructure (Butler et al., 2003;Norton et al., 2001). The image width was 635.5*635.5 mm fora resolution of 512*512 (0.8 pixel/mm).
2.2.9. Statistical analysisExperiments on extraction procedures of pea proteins were
duplicated. Data in parts 3.1.2e3.1.4 were amean of two repetitions.When measurements were at least triplicates, mean � standarddeviation (SD) were given. Analysis of variance and Bonferroni’stest were performed at the p � 0.05 level.
3. Results
3.1. Extraction of PP
3.1.1. Fat removalPrior to each extraction procedure, fats were extracted exten-
sively from the pea flour first with pentane, thenwith ethanol. Fat isa contaminant naturally present in flours from ground seeds. Fatrecovery was 1.2 � 0.1 wt% (on a d. b. of the crude pea flour). It wasreported a fat content in soy flakes around 6 wt% (d. b.), while fatcontent in smooth peas was in the range 1e4 wt% (Fuhrmeister,2003; Shand et al., 2007). Extracting proteins from non-defattedflours tended to concentrate fat in the isolates produced. Fatretention was due to both lipid chemical composition and locationwithin the crude pea flour matrix. The reported fat content of PPisolates varied from 3 to 6 wt% (Fuhrmeister et al., 2003; Koyoroet al., 1987). Shand et al. (2007) reported also higher contents(z10 wt%); fat tend to associate with the protein fraction, espe-cially for PP extracted by alkaline dissolution and isoelectricprecipitation.
3.1.2. PP extracted by acidic precipitationAn acidic precipitation by lowering the pH of the protein crude
extract PPE is a classical method to isolate globular proteins.Nitrogen content in the defatted pea flour was 3.6 wt% (on a d. b.).The NSI for the defatted pea flour was 87.8 � 5.8% in the triseHCl0.1 M buffer, pH 8.
Protein recovery yields were 19.9%; 19.0%; 26.0% and 22.6% (asa percentage of total dissolved PP in PPE), for the pH of precipitationof 3.5; 4.0; 4.8; 5.5, respectively. The low yields were due to eitherthe removal of small nitrogen compounds or the high phytatecontent, shifting the protein minimum of solubility and hencerecovery by precipitation at lower acidic pH. A similar result wasfound for wrinkled peas (Fuhrmeister et al., 2003).
Phytate is the main storage molecule containing phosphorus inseeds (Selle, Ravindran, Caldwell, & Bryden, 2000). The totalphosphorus content of the PPP isolates depending on the precipi-tation pH was investigated. The lower is the pH, the higher is thephosphorus content for PP extracted from defatted pea flour.

J.-L. Mession et al. / Food Hydrocolloids 29 (2012) 335e346 339
Phosphorus content were 10.3; 12.2; 4.8; 3.5 mg/g PP for theprecipitation pH of 3.5; 4; 4.8; 5.5, respectively. As the number ofpositive charges of the proteins increased by lowering the pH,interaction between positive sites and highly negatively chargedphytate were enhanced. A similar electrostatic phenomenon wasreported for soy proteins (Ali, Ippersiel, Lamarche, &Mondor, 2010).Lower phosphorus contents were obtained for a pH of precipitationof 4.8 and 5.5. A higher pH reduced interactions between PP andphosphorus compounds such as phytate, since bonding could occurvia bivalent cations bridges. Fuhrmeister et al. (2003) showed thatthe yield of phytate recovered with proteins from wrinkled peaswas practically divided by 4, from a pH of precipitation of 3.5e4.8.
In the following, only the PPP isolate prepared at pH of precip-itation of 4.8 was further characterized.
3.1.3. PP extracted by ultrafiltration e diafiltrationAlternatively, PP were isolated by an UF (VCR 3)/CDF (VPR 3)
sequence. The chemical composition of the concentrate wasstudied, in terms of PP content (d. b.), PP retention and totalphosphorus content (mg/g PP recovered).
As the UF/CDF sequence proceeded, the PP content in the drymatter increased. This content increased from 74.6 wt% in the PPE,to 84 wt% in the concentrate (VCR 3) and finally reached more than95 wt% in the diafiltrate (VPR 3). The PP retention (as a percentageof PP dissolved in the PPE) decreased from 60.8 wt% in theconcentrate to finally 47.4% in the diafiltrate. Protein recovery wasclose to that obtained from a desalting procedure of the concen-trate, by simple dialysis (concentrate-to-water ratio 1:10, 4 changesfor 24 h). Nevertheless a fraction of proteins precipitated at thebottom of the membrane. Small nitrogen compounds with a lowmolecular weight (<10 kDa) were also removed by CDF. The lowrecovery was particularly attributed to the membrane sealingoccurring as the UF/CDF proceeded, since the permeate fluxdecreased continuously.
The phosphorus content in the isolate PPDF was 2.4 mg/g PP;CDF was an efficient procedure to remove salts (bivalent cations),hence reducing proteinephytate interaction, as assumed by Aliet al. (2010) for soy proteins.
3.1.4. Chemical composition of the PP isolatesThe laboratory-prepared isolates PPP and PPDF had protein
contents of 85.1 wt% and 85.8 wt% respectively. A protein isolateprepared by acidic precipitation has usually a higher salt content,than an isolate obtained by an UF/CDF procedure (Fuhrmeisteret al., 2003).
The remaining compounds represented 8.2 wt% and 10.7 wt%(on a d. b.) of PPP and PPDF, respectively. It was not fat: a re-extraction at 50 �C in pentane: ethanol (2:1, with a solvent-to-powder ratio of 1:5) showed only extractable fat traces (<1 wt%).Those contaminants may be fibers and/or sugars. For smooth/wrinkled pea protein isolates prepared by acid precipitation andultrafiltration, it was reported a dietary fiber content of 0.7e9 wt%
Table 1Polypeptide composition from the crude pea extract (PPE) to the laboratory-preparedabbreviations).
Material Band (Mw kDa)
P1 (14e20) P2 (25) V1eV5 (30e50)
PPE 17.6 � 1.7a 6.7 � 1.7a 22.5 � 3.3a
PPP 8.4 � 2.7b 1.9 � 0.4a 27.1 � 2.9a
Concentrate 9.4 � 1.6b 4.9 � 1.2a 20.6 � 1.7a
PPDF 5.2 � 1c 3.3 � 0.1a 27.1 � 0.3a
Leg e e 17.5�1a
Vic 8.4 � 0.9b 4.6 � 0.8a 22.9 � 0.8a
Means of at least four measurements � SD. Means in a column bearing the same letter a
to 10e13.3 wt% (d. b.), respectively (Fuhrmeister et al., 2003; Shandet al., 2007).
3.1.5. Polypeptide composition by SDS-PAGEPatterns of globular PP isolates and Vic/Leg separated fractions
were analyzed by electrophoresis under non-reducing conditions,except on lane 6 (with dithiotrheitol e DTT). Polypeptide compo-sition in each laboratory-prepared isolate was evaluated by densi-tometry (Table 1). Glycoproteins were detected using the PASreagent method (Fig. 1b).
A great number of polypeptides constituted PP (lanes 1e4,Fig. 1a). This wide polypeptide Mw distribution showed bandsranging from 20 to 89 kDa, belonging to vicilin V1e6 (7S), convicilinC (7S), legumin L (11S), and two extra polypeptides identified as animpurity belonging to legumin polypeptides and the lipoxygenaseLip (Crévieu, Carré, Chagneau, Quillien, Giérot & Guéguen, 1997;Gatehouse et al., 1980; Shand et al., 2007). The vicilin was hetero-geneous; at least six polypeptides were counted; V6 (z52 kDa),was the most represented (Gatehouse et al., 1982). Smaller frag-ments a (20 kDa), b (13 kDa), g (12e16 kDa) were produced byin vivo proteolysis of the polypeptides V5 (z47 kDa) and V6(z52 kDa) assembled into trimers. It was unclear whether smallerpolypeptides of >14 kDa (P1) and z25 kDa (P2) were attributed toremaining pea albumins or vicilin polypeptides (Crévieu et al.,1997; Guéguen, Vu, & Schaeffer, 1984). Table 1 showed that halfof those polypeptides were removed from PPE to PPP/PPDF isolates;faint remaining bands would be attributed to smaller vicilin poly-peptides (O’Kane et al., 2004a, 2004b). The band at z70 kDa cor-responded to convicilin C.
The legumin polypeptide appeared as a strong band atz56 kDa.Leguminwas eluted together with an extra polypeptide ofz40 kDaattributed to an impurity. Under reducing condition (with DTT), thelegumin polypeptide dissociated into its basic Lb (z20 kDa) andacid La (z38 kDa) subunits, indicating in fact that they were boundtogether via SeS bridge (Gatehouse et al., 1980).
Vicilin V1�6, legumin L and convicilin C contents representedz50%, z33% and z10% of the total polypeptides in the isolates,respectively. Lipoxygenase Lip content was estimated at 3.3%.Crévieu et al. (1997) reported, also by densitometric analysis onSDS-PAGE, a quite similar polypeptide composition.
A protein separation was achieved by batch chromatography(Fig. 1a, lanes 5e7). Protein recovery of Vic and Leg fractions wasabout 800 mg for each, starting from z140 mL of a diafiltratecontaining z4.2 g of mixed globular PP. Proteins eluting at ionicstrengths of 0.06 and 0.1 M NaCl were mainly vicilin and convicilin.Vicilin elution was particularly time-consuming, since it couldinteract non-specifically with the ion-exchange carrier which wasagarose (Guéguen et al., 1984). A transitional fraction betweenvicilin and legumin was removed at 0.15 M NaCl. Legumin waseluted at 0.25 M NaCl, with a purity of z80%.
SDS-PAGE stained with the PAS reagent method revealed thecarbohydrate moiety of the pea polypeptides (Fig. 1b). Glycoprotein
isolates. Analysis performed by densitometry of the SDS e PAGE (See Fig. 1 for
V6 (52) L (56) C (70) Lip (89)
11.9 � 1.6a 28.2 � 2.6a 10 � 2.1a 3.1 � 1.1a
15.4 � 2.7a 35.2 � 4.5a 9 � 0.9a 3 � 0.7a
16.2 � 1.4a 35.4 � 5.8a 11 � 2.1a 2.4 � 0.9a
11.9 � 1.4a 38.2 � 1.7a 9.7 � 1.6a 4.3 � 0.4a
e 79.1 � 2.3b e 3.6 � 1.2b
43.4 � 3.4b e 20.6 � 1.8b e
re not significantly different (p � 0.05).

Fig. 1. (a) SDS-PAGE (10%, continuous gel) patterns, non-reducing conditions (excepted lane 6), of the pea protein products. Lane 0: Molecular weight (Mw) markers, lane 1: proteincrude extract (PPE), lane 2: concentrate from the UF step (VCR 3), lane 3: protein isolate prepared by UF/CDF procedure (PPDF), lane 4: protein isolate prepared by acidicprecipitation (PPP), lane 5: Legumin (Leg) fraction, lane 6: Leg under reducing conditions with 10% (w/v) DTT, lane 7: vicilin (Vic.) fraction; (b) SDS-PAGE (10%, continuous gel)stained with the Periodic Acid-Schiff (PAS) reagent method for glycoproteins detection. On lanes 10e70, protein products were deposited in the same order than on lanes 1e7. In thelanes, P1e2: bands from pea albumins or small vicilin polypeptides (see text), V1e6: bands from vicilin, Imp: impurity, L: legumin band, La and Lb: acidic and basic subunits oflegumin, respectively, C: convicilin, Lip: lipoxygenase.
J.-L. Mession et al. / Food Hydrocolloids 29 (2012) 335e346340
bands were associated with their corresponding polypeptide,according to retardation factor determined on SDS-PAGE stainedwith Coomasie blue (Fig. 1a). Strong bands revealed V6 and Lsubunits. From PPE to PPDF and PPP, an enrichment of smallglycoproteins (z26 kDa) was evidenced. The polypeptide g(12e16 kDa) belonging to vicilin could be N-glycosylated close tothe C terminus (Wright, 1987, O’Kane et al., 2004a). Convicilin hadfewer carbohydrate content than other vicilin polypeptides. Adensitometric analysis performed on lanes 30 and 40 (Fig. 1b) evi-denced glycoprotein bands which were darker for PPDF than forPPP, for a same protein concentration applied on the lanes (5 mg/mL); glycoprotein content was assumed to be higher for PPDF thanfor PPP. Pea protein samples appeared to be particularly contami-nated with carbohydrates, which could promote solubility ofglobulins (Davey & Dudman, 1979).
3.1.6. Nitrogen solubility index (NSI) of PP isolatesSolubility profiles depending on the pH (Nitrogen Solubility
Index, % NSI) of PPP, and PPDF laboratory-prepared isolates wereinvestigated (Fig. 2). Solubility reflects protein quality, by means oflow-denaturing extraction procedure (Fuhrmeister et al., 2003;Shand et al., 2007). Profileswere typical of proteins extracted inmildconditions from leguminous plants. The isolate PPP had a minorsolubility from pH 4 to 6, while it was from pH 4.5 to 6 for PPDF. TheNSI increased strongly in both cases under pH 4 and above 6. Theincrease of NSI at acidic pH could be attributed to the dissociation ofthe subunits belonging to legumin oligomer 11S (Subirade,Guéguen, & Schwenke, 1992). At pH 7, NSI for PPDF was lowerthan that for PPP; the UF sequence conducted at room temperature
for a couple of hourswould be detrimental. The lower NSI values forall PP isolates were uncommonly about 20%. The carbohydratemoiety would influence solubility profiles of protein products.Pedrosa, Trisciuzzi, and Ferreira (1997) reported that a chemicalglycosylation of pea vicilin 7S with polysaccharides shifted theminimum of solubility at pH 5 to higher values, compared tounmodified vicilin. Fuhrmeister et al. (2003), found a minimumNSIvalue of z24% between pH 4e5, with a wrinkled pea isolateprepared by ultrafiltration containing a high carbohydrate content(>10 wt%). The isolate PPDF had a narrower pH domain of minorsolubility (pH 4.5e6) than the isolate PPP (between pH 4e6); thelower phosphorus (phytate) content in PPDF than in PPP wouldexplain the its higher solubility at acidic pH.
In Fig. 2b, NSI profiles of Leg and Vic had aminimumNSI value ofabout 30% at pH 6 and 5.7, respectively. At pH 3, NSI reached morethan 80% in both cases while at pH 7, NSI was 90% and 78% for Legand Vic, respectively. Solubility started to increase earlier at acidicpH (4.8) for separated fractions than for non-separated PP (4). Thesuperposition of the solubility curves from Leg/Vic separated frac-tions did not coincide with the solubility curve of PPDF. The proteincontent of PPDF, as well as interaction between globulins related totheir surface charge would be pointed out.
3.1.7. DSCPP isolates (10 wt%) in 0.1 M NaCl and pH 7.2 were examined
using DSC, thermal properties (Tonset, Td and DHd) were calculatedfrom the thermograms (Table 2). One broad endothermic peak wasobserved at z88 �C for all PP isolates. It corresponded to thedenaturation of the legumin and vicilin fractions together (Shand

Fig. 2. Nitrogen solubility of Pea Protein isolates, prepared by: (a) acidic precipitation(PPP) or UF/CDF (PPDF); (b) batch chromatography: vicilin (Vic) and legumin (Leg)fractions.
Fig. 3. Phase diagrams at 20 �C (0.1 M NaCl, pH 7.2) for different pea proteins (PP) esodium alginate (SA) ternary systems. PP were prepared by: (a) isoelectric precipita-tion (PPP-SA); (b) UF/CDF (PPDF-SA); (c) batch chromatography (Legumin fraction,Leg-SA). Some mixtures of interest were designed by letters, for the further micro-structure studies.
J.-L. Mession et al. / Food Hydrocolloids 29 (2012) 335e346 341
et al., 2007). Because of the small differences of Td for each PPfraction, as well as vicilin heterogeneity, the endotherms wereoverlapping in one unique peak around 88 �C. Sun et al. (2010)reported the same Td (86.2 �C) with DH ¼ 15.8 J/g PP at low ionicstrength, by heating at 10 �C/min. The enthalpy of denaturation DHwas higher for Leg fraction, since it presented a hexamericquaternary structure compared to the trimeric vicilin/convicilinoligomers.
No endothermic peak corresponding to pea starch gelatinizationwas evidenced (Sun & Arntfield, 2010).
3.2. Phase behavior of PP-SA aqueous mixtures
3.2.1. Phase diagramsPhase diagrams were built for PPP, PPDF and Leg mixed with SA
(Fig. 3). At pH 7.2, both biopolymers carried net negative charges,
Table 2Onset temperature (Tonset), denaturation temperature (Td) and enthalpy of dena-turation DH of the pea proteins isolates laboratory-prepared.
Material Tonset (�C) Td (�C) DH (J/g PP)
PPP 75.7 � 0.3a 87.4 � 0.4a 11.4 � 1.06a
PPDF 77.5 � 0.3a 87.6 � 0.7a 14.8 � 1.7a
Leg 77.9 � 1a 88.9 � 1.4a 17 � 1.78c
Vic 78.5 � 2.7a 88.4 � 1.9a 11.5 � 1.6a
Means of at least four measurements � SD. Means in a column bearing the sameletter are not significantly different (p � 0.05).
electrostatic repulsive forces predominated in the mixtures(Tolstoguzov, 1986, 1991). The NaCl concentration of 0.1 M allowedmore attractive proteineprotein interaction, because of the(partial) shielding of dipoleedipole interaction (Grinberg et al.,1997). Most of biopolymer mixtures showed a phase separationafter centrifugation, with a clear upper SA-enriched phase and anorange-colored turbid PP-enriched lower phase. A higher proteinself-association by addingmore polysaccharide reflected a decrease

J.-L. Mession et al. / Food Hydrocolloids 29 (2012) 335e346342
of solvent quality for proteins; change of the excluded volume forproteins was evidenced by the non-parallelism of the tie lines(Tolstoguzov, 1991).
No phase separationwas evidenced for the Vic-SA system, in therange of concentrations studied (2e8wt% Vic with 0.2e0.8wt% SA).However, a sediment deposited at the bottom of the tubes.Chemical titrations performed on the supernatant showed neithera significative depletion of proteins (<8% of the initial content) nora SA enrichment. The PPDF-SAmixtures with 4; 6; 8 wt% PP and 0.1or 0.2 wt% SA, also mixtures 2e0.8, 1.2 wt%, showed a proteinsediment at the bottom of the tubes (>24 h after mixture prepa-ration and centrifugation). Sediment could not be attributed toa “true” lower, liquid phase. Also there was no significative deple-tion of proteins in the clear upper phase after centrifugation.Mixtures 2e0.8 and 1.2 wt%, evidenced the binodal shifting tolower PP concentration with larger SA concentration.
The lowest biopolymer composition to induce phaseseparation (threshold) was z4 wt%, typical for globularproteinsepolysaccharide systems (Doublier et al., 2000;Tolstoguzov, 1986, 1991). Phase diagrams had a narrower single-phase domain in the order PPP < PPDF zLeg (Fig. 3). The PPP-SAsystem exhibited a higher SA content in the PP-enriched lowerphase than that of PPDF-SA system. No clear differences of phaseboundary were observed between PPDF-SA and Leg-SA systems, asbinodal curves appeared to be very close. Legumin within mixedglobular PP would govern the phase separation process. However,the experimental binodal was better-defined with Leg than withPPDF: most of Leg-SA mixtures demixed into coexisiting phaseswhich compositions (tie line ends of the phase diagram) matchedwith the binodal. That would mean that Leg-SA-mixtures weremore likely to reach thermodynamic equilibrium contrary to somePPP/PPDF-SA mixtures.
For concentrated mixtures PPP/PPDF-SA, it happened that thebiopolymer composition in co-existing phases did not to reach anequilibrium state. The upper phase could be also slightly turbidafter extensive centrifugation. Such concentrated mixtures werediscarded so as to establish phase boundary for the PPP/PPDF-SAsystems. By replicating those concentrated mixtures, thebiopolymer composition in co-existing phases was found to besurprisingly repeatable. Such phenomenon could not be attributedto measurements artifacts; such phase separation disturbanceoccurred in a samemanner. A first considerationwould be viscosityeffects: a part of the PP-enriched phase would be entrapped withinthe upper and viscous SA-enriched phase. Simonet, Garnier, andDoublier (2000) ever encountered such phenomenon ina dextran-guar aqueous system. Nevertheless, biopolymercomposition and co-existing phase volumes did not vary witha higher centrifugation speed (4000g).
3.2.2. CLSMCLSM micrographs of several PPP-SA, PPDF-SA and Leg-SA are
presented in Fig. 4. PP stock solutions (16 wt% for both PPP andPPDF, 10 wt% for Leg) exhibited a uniform fluorescence on themicrograph (data not shown). Phase separation occurred betweenwhite (fluorescent) protein-enriched areas and black areas con-taining the alginate phase. As first insights, it will be consideredmicrostructure 1 min after stirring was stopped. Time evolutionwill be approached thereafter.
3.2.2.1. Overall observation of selected mixtures (Fig. 4). PPP-SAmixtures: changes in the microstructure along a same tie line ispresented in Fig. 4a for the PPP-SA system. Immediately aftersample preparation, bulk phase separation took place betweenprotein-enriched areas and SA-enriched areas, occupying co-existing phases.
Mixtures A, B, C at respectively at 25, 50 and 75% of the same tieline from the phase diagram were selected to show a typical phaseinversion phenomenon (Fig. 3a). There was a passage from analginate-continuous phase at high SA concentration dispersingPPP-enriched areas (mixture A) to a PP-continuous phasedispersing the SA-phase (mixture C). At the mid position of the tieline, microstructure of B was rather bicontinuous. Taken separately,the upper phase of mixture B after extensive centrifugation wasrather homogeneous and practically devoid of PP-areas (size2e5 mm), while the lower phase exhibited a uniform fluorescenceentrapping small amounts of the alginate phase.
PPDF-SA mixtures: microstructure of several mixtures wasinvestigated so as to screen a wide range of compositions (Fig. 4b).The two mixtures D and F located close to the binodal showed faintprotein aggregates spread all over an alginate-continuous phase.However mixtures E (6e0.3 wt%) and 12e0.3 wt% (close to thelower branch of the binodal, micrograph not shown)) werePP-continuous. Also upper and lower phases from a two-phasemixture presented similar microstructures than those observed inFig. 4a. Just after sample preparation, all mixtures expect G pre-sented microstructures typical of single-phase mixtures. Movingfurther away from the binodal curve with higher PP concentration,PP-aggregates for mixtures G and H seemed to be closer andbrighter; mixture H (12e0.8 wt%) showed the largest proteinaggregates in the beginning of the phase separation phenomenon.
Leg-SA mixtures: Leg-enriched areas were well-defined andpresented a droplet-like shape dispersed in a SA-continuous phase(Fig. 4c). While comparing microstructure of mixtures D0-F0 andE0-G0, a higher SA concentration (0.3e0.8 wt%) led to largerdroplets; from mixture F0 to G0, the approximate droplet sizeincreased from lower than 10 mm to about 20 mm, respectively.Increasing the Leg initial concentration (from 4 to 6 wt%) led tomore numerous protein enriched-areas. It was obvious thatproteins occupied a higher volume fraction (assimilated to theprotein surface coverage of the micrograph) with higher proteininitial concentration.
Vic-SA mixtures (Micrographs not shown): Microstructure ofthe Vic-SA mixture 6e0.8 wt% showed as well small and faintprotein aggregates. In the neighborhood of vicilin proteins, therewould be a volume not penetrable by alginate chains for reasons ofelectrostatic repulsions; consequently they segregated from thisexcluded volume. By local segregative effect, proteineproteininteraction took place, but too weak to lead to macroscopic phaseseparation. This hypothesis will be further discussed in part 3.2.3.
To recapitulate, PP-enriched areas presented several morphol-ogies; an aggregate-like structure for PPDF-SA mixtures, a transi-tion from aggregate-like (when SA was the continuous phase) todroplet-like (at higher initial PP concentration for PPP-SAmixtures, and a droplet-like for Leg-SA (water in water emulsion).Thus thermodynamic incompatibility would be the main drivingforce leading to phase separation for both Leg-SA and most of PPP-SA mixtures. However, the aggregated structures observed for thePPDF-SA mixtures suggested disturbances as phase separation tookplace (discussed in part 3.2.3).
3.2.2.2. Time evolution of the microstructure (Fig. 5). Several PP-SAmixtures were selected to investigate kinetics of demixing. ThePPP-SA mixture B (8e0.65 wt%) was located in the middle of a tieline, far from the binodal of the phase diagram (Fig. 3a). The PPDF-SA mixture G (6e0.8 wt%) laid in the two-phase domain (Fig. 3b)The effect of SA concentration was studied for the Leg-SA mixturesE0 (6e0.3 wt%) and G0 (6e0.8 wt%) (Fig. 3c and d).
PPP/PPDF-SA mixtures: at intermediate SA concentration, aninterconnected structure of the protein-enriched phase wasobserved for the PPP-SAmixture B (8e0.65 wt%), immediately after

Fig. 4. CLSM micrographs of PPDF-SA aqueous mixtures, taken 2 min after stirring was stopped. Protein areas appeared in clear. Mixtures investigated were designed by letters,which biopolymer initial composition was plotted on phase diagrams (Fig. 3). (a): PPP-SA mixtures, as well upper (up.) and lower (low.) phases of mixture B taken separately(Fig. 3a); (b): PPDF-SA mixtures (Fig. 3b); Leg-SA mixtures (Fig. 3c). Image width is 636.5* 636.5 mm.
J.-L. Mession et al. / Food Hydrocolloids 29 (2012) 335e346 343
sample preparation (Fig. 5a). Restructuration and ripening of theprotein-enriched phase occurred with time, as evidenced bythe denser and more elongated PP-enriched microdomains(or droplets). With time (>2 h), the ripening led to larger proteindroplets which coalesced.
Kinetics of demixing of several PPDF-SA mixtures revealeda slow ripening of the protein-enriched phase. Mixture G was givenas example (Fig. 5b). With time, larger PP-aggregates of irregularshape were observed. They presented as well a porous structure.Aggregated-like structures reflected a non-equilibrium state,resulting of short-range interaction between proteins (De Bontet al., 2002). Time for sedimentation of the PP-enriched domainsappeared to take more than 24 h, meanwhile observations were ofbad resolution as the bleaching of the fluorescent dye RITC occurredfor a long storage period (Data not shown).
Leg-SA mixtures: the mixtures evidenced a growth of theprotein-enriched areas with time (Fig. 5c and d). The size of theprotein-enriched microdomains appeared to increase quicker withhigher SA concentration. Mixture E0 with a low SA concentration(0.3 wt%) showed protein-enriched areas which remained isolated.At higher SA concentration (0.8 wt%), phase separation was sostrong for mixture G0 that the protein-enriched phase coveredpractically the overall surface of the microscope slide after 45 min.This was also the case for the Leg-SA mixtures 3; 4e0.8 wt% (Data
not shown). The rapid growth of Leg-enriched microdomains(droplets) led to their coalescence; density of larger Leg dropletsincreased by gravity effects. Sedimentation of the Leg dropletsoccurred finally (z45 min). Consequently, the micrograph blurred(Fig. 5c). A higher alginate concentration led to enhancedproteineprotein attraction, giving rise to a denser protein-enrichedphase; on the other hand a higher alginate concentration raisedviscosity of the whole mixture. Time for creaming of the alginatephase and sedimentation of the protein-enriched phasewas relatedto the difference of density between both enriched phases. Thuskinetics of demixing depended on both coalescence and creaming/sedimentation rates, as stated by the Stokes law. A similar strongcoalescence and then sedimentation of the protein droplets wasever described for incompatible mixtures of milk proteins-locustbean gum (Schorsch, Jones, & Norton, 1999).
Summarizing, the Leg-SA mixtures showed dense and smoothLeg-enriched droplets (water-in-water emulsion) while phaseseparation took place. It was also the case for most of PPP-SAmixtures. PPDF-SA mixtures exhibited however fine and irregularaggregates. Some PP-aggregates of a more compact structurewithin an alginate-continuous phase were also observed for thePPP-SA mixture A (Fig. 4a). With more concentrated PPDF-SAmixtures (for example 12e0.8 wt%), a porous and weak proteinnetwork was evidenced (Micrographs not shown). Hence, a part of
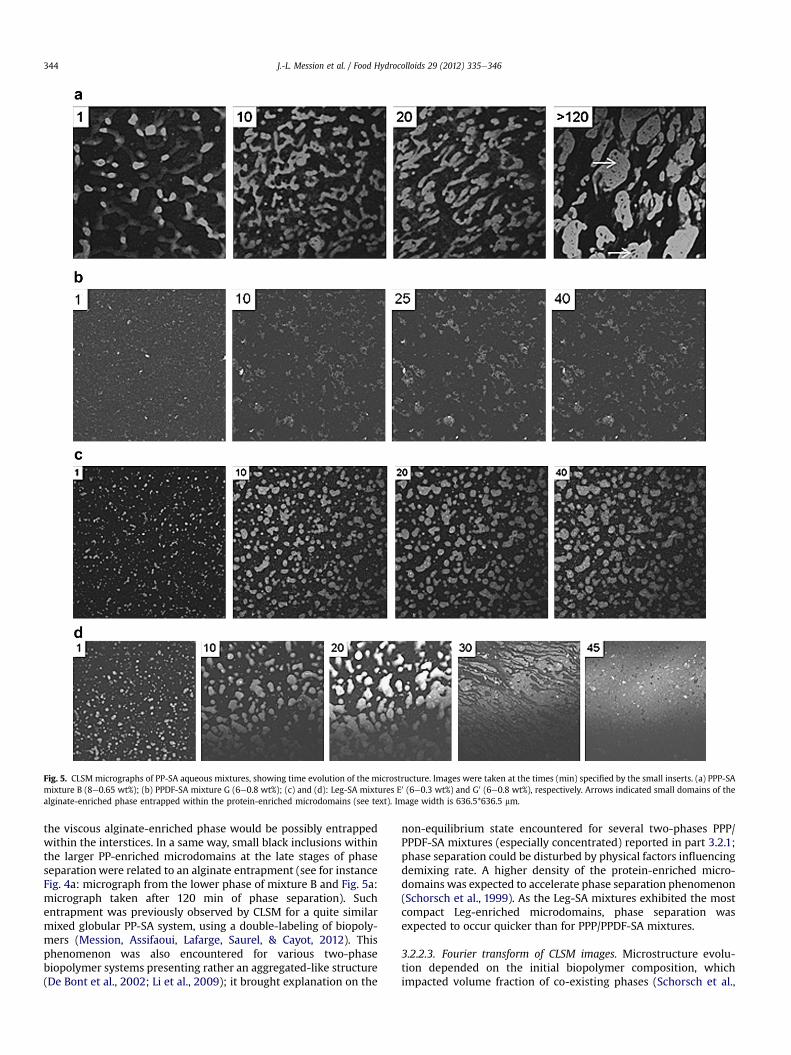
Fig. 5. CLSM micrographs of PP-SA aqueous mixtures, showing time evolution of the microstructure. Images were taken at the times (min) specified by the small inserts. (a) PPP-SAmixture B (8e0.65 wt%); (b) PPDF-SA mixture G (6e0.8 wt%); (c) and (d): Leg-SA mixtures E0 (6e0.3 wt%) and G0 (6e0.8 wt%), respectively. Arrows indicated small domains of thealginate-enriched phase entrapped within the protein-enriched microdomains (see text). Image width is 636.5*636.5 mm.
J.-L. Mession et al. / Food Hydrocolloids 29 (2012) 335e346344
the viscous alginate-enriched phase would be possibly entrappedwithin the interstices. In a same way, small black inclusions withinthe larger PP-enriched microdomains at the late stages of phaseseparationwere related to an alginate entrapment (see for instanceFig. 4a: micrograph from the lower phase of mixture B and Fig. 5a:micrograph taken after 120 min of phase separation). Suchentrapment was previously observed by CLSM for a quite similarmixed globular PP-SA system, using a double-labeling of biopoly-mers (Mession, Assifaoui, Lafarge, Saurel, & Cayot, 2012). Thisphenomenon was also encountered for various two-phasebiopolymer systems presenting rather an aggregated-like structure(De Bont et al., 2002; Li et al., 2009); it brought explanation on the
non-equilibrium state encountered for several two-phases PPP/PPDF-SA mixtures (especially concentrated) reported in part 3.2.1;phase separation could be disturbed by physical factors influencingdemixing rate. A higher density of the protein-enriched micro-domains was expected to accelerate phase separation phenomenon(Schorsch et al., 1999). As the Leg-SA mixtures exhibited the mostcompact Leg-enriched microdomains, phase separation wasexpected to occur quicker than for PPP/PPDF-SA mixtures.
3.2.2.3. Fourier transform of CLSM images. Microstructure evolu-tion depended on the initial biopolymer composition, whichimpacted volume fraction of co-existing phases (Schorsch et al.,

Fig. 6. Radial-averaging of 2D-Fourier transform power spectrum, performed on time-resolved CLSM images (see text). (a): PPP-SA mixture B (8e0.65 wt%); (b) Leg-SAmixture E0 (6e0.3 wt%).
J.-L. Mession et al. / Food Hydrocolloids 29 (2012) 335e346 345
1999). According to the position of a mixture relative to the phaseboundary, the early stages of phase separation were governed byeither nucleation and growth e NG or spinodal decomposition e
SD (Butler et al., 2003; Norton et al., 2001). NG occurred close tothe binodal within themetastable region of the phase diagram. Thefirst step was the formation of stable and localized nuclei. This ledto random protein attraction which provided protein-enricheddomains of various sizes. For mixtures lying within the spinodalline (in the unstable region), phase separation by SD appeared tobe more “ordered”, as protein-enriched areas (droplets) wereregularly spaced; this allowed measurement of a particulardistance scale or “structure factor”. Such mechanisms were well-established for colloid-polymer model systems; howeverVerhaegh et al. (1996) argued that the transition from NG to SDremained unclear; also distinction between those mechanismswas allowed in the early stages of phase separation (at short times,z2 min after end of stirring). For incompatible biopolymermixtures, spinodal and binodal lines were reported to be very close(De Bont et al., 2002; Norton et al., 2001). From those authors, lightscattering (SALS) and CLSM methods provided similar results onkinetics of demixing. Meanwhile measurements could be hardlyperformed in the first minute following sample preparation. Thusphase separation was usually investigated in the late stages of theprocess; the ripening of the structure occurred as co-existingphases (microdomains or droplets) grew in size. For this presentstudy, it took also several seconds to adjust optical settings of themicroscope.
To evidence any protein-phase ordering as phase separationtook place, 2D-Fourier transform was performed on CLSM micro-graphs, followed by a radial-averaging providing 1D spectra. Typi-cally, a peak was evidenced at a space frequency (mm�1)corresponding to a peculiar distance scale. In the late stages ofphase separation, the peak increased in intensity and shifted tolower frequencies as protein-enriched microdomains grew in size.Such structure ripening was shown for the PPDF-SA mixture B(8e0.65 wt%) and Leg-SA mixture F (6e0.3 wt% e Fig. 6). It couldreflect a phase separation process following SD, however nodefinitive conclusion could be drawn; it was reported that NG couldalso exhibit such a tendency (Norton et al., 2001). On the otherhand, this image processing did not provide satisfactory results forPPDF-SA mixtures, as PP-aggregates were dissimilar in shape withno evident spatial organization. Also no reliable measurement ofany distance scale was possible when larger protein-enrichedmicrodomains strongly coalesced and sedimented (as observedby CLSM, the Leg-SA mixture 6e0.8 wt% was not presented heresince the rapid phase separation process blurred strongly themicrograph).
3.2.3. Protein heterogeneity and phase behaviorComplexity within such real PP-SA systems would affect phase
behavior, as evidenced by the microstructure analysis. Phaseseparation for the Leg-SA mixtures (assumed to exhibit one proteinsize, from SDS-PAGE measurement) appeared to be well-defined.As PPP/PPDF contained mixed globular proteins with heteroge-neous size, shape and charge, local segregative effects would bedissimilar for alginate chains in the neighborhood of either vicilinor legumin proteins. This gave rise to complex proteineproteinattraction.
Moreover, the carbohydrate moiety of PP would alter bothprotein charge and conformation. As shown in part 3.1.6, PPP andPPDF would exhibit differences of surface charge density; thehigher NSI for PPDF in the pH range 4.5e6, would reflect a higherglobal negative charge than that for PPP. Thus it was suggested thatelectrostatic repulsion at alkaline pHwere higher between proteinsextracted by UF/DF (PPDF) than that by acidic precipitation (PPP).
An excessive negative charge of proteins would hinderproteineprotein attraction while segregative effects in presence ofalginate occurred. In a same manner, convicilin 7S would bepointed out. Convicilin possessed an extended N-terminus region,highly charged with acidic residues. O’Kane et al. (2004a, 2004b)suggested that the excess of negative charges brought by con-vicilin in a vicilin fraction could reduce strongly proteineproteininteraction at pH 7.6, preventing heat-set gel formation. Thus itwas suggested that convicilin could hinder phase separation for theVic-SA system and led to badly-defined phase boundary for severalmixed globular PP-SAmixtures; convicilin polypeptide content wasestimated atz10 andz20% for mixed globular PP and Vic isolates,respectively (Table 2). Excessive repulsions could reduce proteinself-association in presence of alginate. To check this, a higher NaClconcentration for the PPP/PPDF/Vic-SA mixtures would enhancecharge shielding, allowing more favorable protein self-association(Grinberg et al., 1997). Further investigations on the influence ofsalt concentration on the phase behavior of PP-SAmixtures are thusneeded.
4. Conclusion
At pH 7.2, mixed pea globulins or legumin in admixture withsodium alginate phase-separated. This was mainly due to segre-gative effects between unlike biopolymers mixed together. Fromphase diagrams, legumin-alginate and mixed globulins-alginate

J.-L. Mession et al. / Food Hydrocolloids 29 (2012) 335e346346
systems had apparently a close phase boundary. Legumin withinmixed globular pea proteins appeared to govern the phase sepa-ration process. Contrary to the legumin-alginate system, a well-defined phase boundary could not be obtained reliably whenmixed pea globulins were used. For the former system, CLSM evi-denced dense protein-enriched microdomains of a droplet-likestructure. With time, coalescence and sedimentation of leguminmicrodomains was observed, leading to a net phase separation.With mixed pea globulins, phase boundary was unclear; in pres-ence of alginate, protein associated intomicrodomains with a lowerdensity, possibly entrapping at high concentration a part of theviscous alginate-enriched phase. Thus phase separation appearedto be greatly slowed down for these polydisperse mixtures. Chargeheterogeneity of mixed globulins was suggested to hinder proteinself-association in presence of alginate. Also the high content ofconvicilin would prevent the macroscopic phase separation for thevicilin-alginate system.
Entrapping such various microstructures at different stages ofphase separation would be the subject of further investigations, asit would lead to relevant mechanical properties of these designedsemi-solid food matrixes.
Acknowledgment
Financial support from the Ministère de l’Economie, desFinances et de l’Industrie (Direction Générale des Entreprises) ofthe French Government and Le Grand Dijon are gratefullyacknowledged. We would like to thank also Y. Roche, E. Donat andB. Rollin for their technical support.
References
Ali, F., Ippersiel, D., Lamarche, F., & Mondor, M. (2010). Characterization of low-phytate soy protein isolates produced by membrane technologies. InnovativeFood Science and Emerging Technologies, 11, 162e168.
AOAC International, Method 920.87. (1990). Official methods of analysis of AOACInternational (15th ed.). VA, USA: Association of Official Analytical Chemists.
AOAC International, Methods 923.03. (1995). Official methods of analysis of AOACInternational (16th ed.). VA, USA: Association of Analytical Communities.
Bitter, T., & Muir, H. M. (1962). A modified uronic acid carbazole reaction. AnalyticalBiochemistry, 4, 330e334.
Butler, M. F., & Heppenstall-Butler, M. (2003). Phase separation in gelatin/dextranand gelatin/maltodextrin mixtures. Food Hydrocolloids, 17, 815e830.
Crévieu, I., Carré, B., Chagneau, A.-M., Quillien, L., Guéguen, J., & Bérot, S. (1997).Identification of resistant Pea (Pisum sativum L.) proteins in the digestive tractof chickens. Journal of Agricultural and Food Chemistry, 45, 1295e1300.
Croy, R. R. D., Gatehouse, J. A., Tyler, M., & Boulter, D. (1980). The purification andcharacterisation of a third storage protein (convicilin) from the seeds of pea(Pisum sativum L.). Biochemistry Journal, 191, 509e516.
Davey, R. A., & Dudman, W. F. (1979). The carbohydrate of storage glycoproteinsfrom seeds of P. sativum: Characterization and distribution on componentpolypeptides. Australian Journal of Plant Physiology, 6, 435e447.
De Bont, P. W., van Kempen, G. M. P., & Vreeker, R. (2002). Phase separation in milkproteins and amylopectin mixtures. Food Hydrocolloids, 16, 127e138.
De Kruif, C., & Tuinier, R. (2001). Polysaccharide-protein interactions. Food Hydro-colloids, 15, 555e563.
Doublier, J. L., Garnier, C., Renard, D., & Sanchez, C. (2000). Protein-polysaccharideinteractions. Current Opinion in Colloid & Interface Science, 5, 202e214.
Fuhrmeister, H., & Meuser, F. (2003). Impact of processing on functional propertiesof protein products from wrinkled peas. Journal of Food Engineering, 56,119e129.
Garcia-Estepa, M., & Guerra-Hernanadez, E. (1999). Phytic acid in milled cerealsproducts and breads. Food Research International, 32, 217e221.
Gatehouse, J. A., Croy, R. R. D., & Boulter, D. (1980). Isoelectric focusing propertiesand carbohydrate content of pea (Pisum sativum) legumin. Biochemistry Journal,185, 497e503.
Gatehouse, J. A., Lycett, W., Croy, R. R. D., & Boulter, D. (1982). Characterization andsubunits structures of the vicilin storage proteins of pea (Pisum sativum L.).European Journal of Biochemistry, 118, 627e633.
Grinberg, V. Y., & Tolstoguzov, V. B. (1997). Thermodynamic incompatibility ofproteins and polysaccharides in solutions. Food Hydrocolloids, 11, 145e158.
Guéguen, J., Vu, A. T., & Schaeffer, F. (1984). Large-scale purification and charac-terization of pea globulins. Journal of the Science of Food and Agriculture, 35,1024e1033.
Guéguen, J. (1983). Legume seed extraction, processing and end product charac-teristics. Plant Foods for Huma Nutrition, 32, 267e303.
Kosakai, M., & Yosisawa, Z. (1979). A partial modification of the carbazole method ofBitter and Muir for quantitation of hexuronic acids. Analytical Biochemistry, 93,295e298.
Koyoro, H., & Powers, J. R. (1987). Functionnal properties of pea globulin fractions.Cereal Chemistry, 64, 97e101.
Laemli, U. K. (1970). Cleavage of structural proteins during the assembly of the headof bacteriophage T4. Nature, 227, 680e685.
Larré, C., & Guéguen, J. (1986). Large-scale purification and characterization of peaglobulins e comparison between six anion exchangers in medium pressureliquid chromatography. Journal of Chromatography, 361, 169e178.
Li, X., Cheng, Y., Yi, C., Hua, Y., Yang, C., & Cui, S. (2009). Phase behavior andmicrostructure of soy proteins and k-Carrageenan mixtures. Food Hydrocolloids,23, 1015e1023.
Lundqvist, J. (2007). Water pressures and increases in food & bioenergy demandimplications of economic growth and options of decoupling. In. Scenarios ofeconomic growth and resource demand, Swedish Environmental AdvisoryCouncil memorandum: 1.
Mession, J.-L., Assifaoui, A., Lafarge, C., Saurel, R., & Cayot, P. (2012). Proteinaggregation induced by phase separation in a pea proteins-sodium alginate-water ternary system. Food Hydrocolloids, 28, 333e343.
Moe, S. T., Draget, K. I., Skjak-Brick, G., & Smidsrød, O. (1995). In A. M. Stephen (Ed.),Food polysaccharides and their applications (pp. 245e286). New York: MarcelDekker.
Norton, I. T., & Frith, W. J. (2001). Microstructure design in mixed biopolymercomposites. Food Hydrocolloids, 15, 543e553.
O’Kane, F., Happe, R. P., Vereijken, J. M., Gruppen, H., & van Boekel, M. A. J. S.(2004a). Characterization of pea vicilin. 1. Denoting convicilin as the a-Subunitof the Pisum vicilin family. Journal of Agricultural and Food Chemistry, 52,3141e3148.
O’Kane, F., Happe, R. P., Vereijken, J. M., Gruppen, H., & van Boekel, M. A. J. S.(2004b). Characterization of pea vicilin. 2. Consequences of compositionalheterogeneity on heat-induced gelation behavior. Journal of Agricultural andFood Chemistry, 52, 3149e3154.
O’Kane, F., Happe, R. P., Vereijken, J. M., Gruppen, H., & van Boekel, M. A. J. S.(2004c). Heat-induced gelation of Pea Legumin: comparison with soybeanglycinin. Journal of Agricultural and Food Chemistry, 52, 5071e5078.
Panikkar, R., & Brasch, D. J. (1996). Composition and block structure of alginatesfrom New Zealand brown seaweeds. Carbohydrate Research, 293, 119e132.
Pedrosa, C., Trisciuzzi, C., & Ferreira, S. T. (1997). Effects of glycosylation on func-tional properties of vicilin, the 7S storage globulin from pea (Pisum sativum).Journal of Agricultural and Food Chemistry, 45, 2025e2030.
Schmitt, C., Sanchez, C., Desobry-Banon, S., & Hardy, J. (1998). Structure and tech-nofunctional properties of protein-polysaccharide complexes: a review. CriticalReview of Food Science and Nutrition, 38, 689e753.
Schorsch, C., Jones, M. G., & Norton, I. T. (1999). Thermodynamic incompatibility andmicrostructure of milk protein/locust bean gum/sucrose systems. Food Hydro-colloids, 13, 89e99.
Selle, P. H., Ravindran, V., Caldwell, R. A., & Bryden, L. W. (2000). Phytate andphytase: consequences for protein utilisation. Nutrition Research Reviews, 113,255e278.
Shand, P. J., Ya, H., Pietrasik, Z., & Wanasundara, P. K. J. P. D. (2007). Physicochemicaland textural properties of heat-induced pea protein isolate gels. Food Chemistry,102, 1119e1130.
Simonet, F., Garnier, C., & Doublier, J.-L. (2000). Partition of proteins in the aqueousguar/dextran two-phases system. Food Hydrocolloids, 14, 591e600.
Smidsrød, O., & Draget, K. I. (1996). Alginates: chemistry and physical properties.Carbohydrates in Europe, 14, 6e13.
Subirade, M., Guéguen, J., & Schwenke, K. D. (1992). Effect of dissociation andconformational changes on the surface behavior of pea legumin. Journal ofColloid and Interface Science, 152, 442e454.
Sun, X. D., & Arntfield, S. D. (2010). Gelation properties of salt-extracted pea proteininduced by heat treatment. Food Research International, 43, 509e515.
Syrbe, A., Fernandes, P. B., Dannemberg, F., Bauer, W., & Klostermeyer, H.(1995). Whey proteins þ polysaccharide mixtures: polymer and incompat-ibility and its applications. In E. Dickinson, & D. Lorient (Eds.), Foodmacromolecules and colloids (pp. 328e339). Cambridge UK: Royal Society ofChemistry.
Tolstoguzov, V. B. (1986). Functional properties of protein-polysaccharidemixtures. In J. R. Mitchell, & D. A. Ledward (Eds.), Functional properties offood macromolecules (pp. 385e415). London, New York: Elsevier AppliedSciences.
Tolstoguzov, V. B. (1991). Functional properties of food proteins and role of protein-polysaccharide interaction. Food Hydrocolloids, 4, 429e468.
USDA Soy stats. (2009). A reference guide to important soybean facts and figures.Soystats.com Web site.
Verhaegh, N. A. M., Van Duijneveldt, J. S., Dhont, J. K. G., & Lekkerkerker, H. N. W.(1996). Fluid-fluid phase separation in colloid-polymer mixtures studiedwith small angle light scattering and light microscopy. Physica A, 230,409e436.
Wright, D. J. (1987). In B. J. F. Hudson (Ed.), The seed globulins. Developments in foodproteins, Vol. 5 (pp. 81e158). London: Elsevier.