Effect of particle size on processing of bioactive glass powder ...
22
1 Effect of particle size on processing of bioactive glass powder for atmospheric plasma spraying E. Cañas * , M. Vicent, E. Bannier, P. Carpio, M.J. Orts, E. Sánchez a) Instituto de Tecnología Cerámica (ITC), Asociación de Investigación de las Industrias Cerámicas (AICE), Universidad Jaume I, 12006 Castellón, Spain Eugeni Cañas Recacha Telephone number: (+34) 964342424 Email: [email protected] Fax number: (+34) 964342425 Mónica Vicent Cabedo Email: [email protected] Emilie Bannier Email: [email protected] Pablo Carpio Cobo Email: [email protected] María José Orts Tarí Email: [email protected] Enrique Sánchez Vilches Email: [email protected]
-
Upload
khangminh22 -
Category
Documents
-
view
0 -
download
0
Transcript of Effect of particle size on processing of bioactive glass powder ...

1
Effect of particle size on processing of bioactive glass powder for
atmospheric plasma spraying
E. Cañas*, M. Vicent, E. Bannier, P. Carpio, M.J. Orts, E. Sánchez
a) Instituto de Tecnología Cerámica (ITC), Asociación de Investigación de las
Industrias Cerámicas (AICE), Universidad Jaume I, 12006 Castellón, Spain
Eugeni Cañas Recacha Telephone number: (+34) 964342424
Email: [email protected] Fax number: (+34) 964342425
Mónica Vicent Cabedo
Email: [email protected]
Emilie Bannier
Email: [email protected]
Pablo Carpio Cobo
Email: [email protected]
María José Orts Tarí
Email: [email protected]
Enrique Sánchez Vilches
Email: [email protected]

2
Abstract
The work addresses the effect of the particle size of a bioactive glass feedstock on the
processing and microstructure of the resulting coatings obtained by atmospheric plasma
spraying (APS). It was observed that the reduction of particle size negatively affects the
flowability of the powder. In addition the thermal behaviour (weight losses, glass
transitions, crystallisations, etc) also depended on the particle size of the glass powder.
No coating was obtained with the coarser fractions (higher than 200 µm) due to their
low melting degree in the plasma. For the intermediate fractions (200 to 63 µm)
coatings were obtained but insufficient particle melting was produced. On the contrary,
the finest fraction (<63 µm) needed a fluidiser which enabled the samples to be sprayed.
Keywords: Bioactive glass powders; Feedstock flowability; Feedstock thermal
behaviour; Atmospheric plasma spraying; Bioactive glass coatings
1. Introduction
From the sixties there is an important need for bioactive materials to heal or replace
damaged areas of the body, due to the ability of these materials to prevent fibrous
encapsulation when compared with an inert implant. Bioactive materials include
hydroxyapatite (HA) ceramics, glasses, glass–ceramics and surface–active composite
materials [1,2]. The most studied of the above materials are glasses, known as bioactive
glasses (BGs), because of their higher bioactivity index [3].
BGs are materials based on mixtures of oxides from the SiO2–CaO–MgO–Na2O–K2O–
P2O5 system. The first BG, developed by L. Hench et al., was 45S5 bioactive glass or
Bioglass®, which consists of 45% SiO2, 24.5% CaO, 24.5% Na2O and 6% P2O5 (all
percentages in wt%) [4].
BGs preparation techniques include both melting (fusing and crushing) and sol–gel
methods [5]. Employing the sol–gel technique, BGs exhibit more bioactivity than those
obtained by melting in spite of having lower mechanical properties.
BGs are the most promising materials for bone grafting in several clinical applications,
such as orthopaedic, dental, maxillofacial and otolaryngological [6]. Nevertheless, BGs
applications are limited due to their brittleness and poor mechanical properties. In order

3
to solve these problems, BGs can be deposited onto a bioinert substrate to obtain a
composite that improves its mechanical strength without changing its bioactivity [4].
There are many techniques to coat a substrate, usually metallic alloys, with BGs. These
techniques can be enamelling, sol–gel method, electrophoretic deposition, laser cladding
and thermal spraying techniques (plasma spraying and high–velocity oxy–fuel).
Nonetheless the most employed technique to spray BGs, since 1980, is thermal
spraying, specifically atmospheric plasma spraying (APS) due to its low cost and
industrial feasibility [1–4].
The literature shows many papers about optimisation of plasma spray conditions to
obtain BG coatings by APS. Most of these papers also include the characterisation of
the resulting coatings [7–12]. However, very few papers have dealt with the effect of the
particle size of the bioactive glass feedstock on the processing and final microstructure
of the obtained coatings. This aspect is of paramount importance when a glass powder
feedstock must be fed into the plasma torch. Fine particle size is required for the powder
to sufficiently melt and then adhere on the substrate during splat (melted particle)
deposition in the APS process [13]. Moreover too fine particles dramatically impair
powder flowability making it difficult or impossible the pneumatic transport of the
powder from the container to the plasma torch. Besides the glass powder particle size
strongly affects the liquid phase sintering of the as-deposited glass splats as well as the
evolving of gas bubbles occurring during the rapid sintering of melted glass particles
[14,15]. In other words, particle size of the BG feedstock is expected to drastically
impact on the microstructure of the final coatings and therefore on their final properties.
Consequently, the present work aims at addressing the effect of the particle size of a
given BG composition prepared by fusing and crushing on the flowability and thermal
behaviour of the powder feedstock. The studied BG powder fractions were obtained
from a frit by milling and sieving. Then the different BG powder fractions were sprayed
onto metallic substrates by APS. The microstructure of the obtained coatings was
examined. The final purpose of the research is to provide the necessary information to
contribute to optimise the feeding of BG powder feedstocks in the APS process as well
as the microstructure of the resulting coatings.

4
2. Experimental
2.1. Feedstock preparation
A mixture of analytical grade SiO2, Ca3(PO4)2, Na2CO3 and CaCO3 was melted in the
home–made rotary furnace showed in figure 1, to get the frit. The mixture of raw
materials was introduced into the furnace on the left side, whereas the melt was
collected on the right side. The maximum temperature reached into the furnace was
1450 ºC.
Figure 1 Rotatory furnace employed to obtain the frit
The melt was quenched into water and a BG frit was obtained. The chemical
composition of the frit (Table 1) was determined by wavelength dispersive X–ray
fluorescence spectrometry (AXIOS, PANalytical, The Netherlands). Table 1 shows the
nominal and as–melted glass composition. As observed the frit composition is close to
the nominal one. The frit was dry milled in a hammer mill. The milled powder was
sieved to obtain different powder size fractions, which were conditioned and used as
APS feedstocks. The different size fractions obtained are detailed in table 2. The
morphology of both coarse and fine fractions, with the typical angular shape of a milled
frit particle, can be observed in figure 2.

5
Table 1 Nominal and as–melted chemical composition of the frit
Composition (wt%) SiO2 P2O5 CaO Na2O
Nominal 45.0 6.0 24.5 24.5
As–melted 47.6 5.3 23.1 24.0
Table 2 Size fractions obtained from the BG powder
Powder fraction
reference BGGS BGGS1* BGGS2 BGGS3 BGGS4
Particle size distribution
(µm) 700–200 400–200 200–100 150–63 < 63
Representative size of
each fraction (µm) 450 300 150 107 63
*The percentage of BGGS1 fraction included in the BGGS fraction is 37.2 ± 0.8 %.
Figure 2 FEG–ESEM morphology of both (a) coarse (BGGS) and (b) fine (BGGS4) powder fractions
2.2. Feedstock characterisation techniques
The amorphous/crystalline character of the different size fractions was determined by
X–ray diffraction (XRD) using a diffractometer (Advance diffractometer, Bruker
Theta–Theta, Germany). The analysis was performed with Cu Kα radiation (λ= 1.54183
Å), generator settings of 30 kV and 40 mA and data were collected in a 2θ range of 5–
90º with a step size of 0.02º and a scanning speed of 0.5 s step-1.

6
Flowability of the BG fractions was determined by means of two different methods,
namely Hausner ratio (HR) and angle of repose (αM). Hausner ratio represents a method
to estimate the flowability–cohesiveness of a given powder. Due to its simplicity HR
has been extensively used to characterise APS feedstocks [16,17]. HR is defined as the
quotient of the tapped density to the bulk (or poured) density of the powder. On the
other hand to determine the angle of repose, a home–made device (Figure 3) was used
which consisted in a powder holder coupled to an angle protractor. The holder filled
with powder rotates until the powder falls. Then, the clock hand hitched to the holder
indicates the angle of repose.
Due to the sensitivity of the BG powder to moisture, flowability tests of some fractions
were also carried out with samples which had been left in contact with humid ambient
in a climatic chamber in order to determine changes in flowability with adsorbed water
[18]. The powder fraction was dried in an oven at 110 ºC and then cooled at room
temperature in a desiccator. The dry powder was then introduced in the climatic
chamber (WK3, Weiss Umwelttechnik, Germany) at 20 ºC and 60% relative moisture
and the adsorbed water was measured by weighing after 24 hours inside the chamber so
as to ensure that equilibrium was reached. These temperature and humidity conditions
try to reproduce the typical conditions operating in the laboratory during plasma spray
experiments
Figure 3 Device for the measurement of the angle of repose
The feedstocks thermal behaviour was investigated by simultaneous thermal analysis
(DTA–TG) and heating microscopy. DTA–TG tests (TGA/SDTA 851e, Mettler Toledo,
Switzerland) were carried out using a platinum crucible in air atmosphere, with a heating
rate of 10 ºC min-1 until a maximum temperature of 1200 ºC. In order to complement
these tests, a heating microscope (Misura 3, Expert Systems Solutions, Italy) was used

7
and some characteristic temperatures for the powders were determined [19,20].
Cylindrical test samples of the powder fractions were prepared by pressing and, in the
heating microscope, were subjected to a thermal cycle at a heating rate of 25 °C min-1
up to 1250 ºC.
2.3. Coating deposition and characterisation
The different size fractions of the BG powder were sprayed onto metallic substrates by
APS. Previously to deposition, the substrates (AISI 304) were grit–blasted and cleaned.
Grit–blasting was performed using black corundum with a pressure of 4.2 Pa, and then
the substrates were cleaned with ethanol. Surface roughness (Ra) of grit-blasted and
cleaned substrates was measured with a roughness tester (HOMMELWERKE T8000,
Hommelwerke GmbH, Germany). Roughness was 2.2 ± 0.1 µm.
The APS facility used comprises a plasma gun (F4–MB, Sulzer Metco, Germany)
managed by a six axis robot (IRB 1400, ABB, Switzerland). In the plasma gun, the
torch generation was accomplished using argon as primary plasma gas and hydrogen as
secondary plasma gas. Spray conditions used were the same for all feedstocks as
detailed in table 3. Powders were fed into the plasma torch by pneumatic transport
employing argon as carrier gas.
Table 3 Plasma spray conditions used
Ar (slpm*) 25
H2 (slpm*) 15
I (A) 600
Plasma average enthalpy (MJ kg-1) 30–35
Spraying distance (m) 0.11
Spraying velocity (m s-1) 1
Powder mass flow (kg s-1)·104 2.5
* Standard litre per minute
The microstructure of the obtained coatings was observed in a field-emission gun
environmental scanning electron microscope (FEG–ESEM) (QUANTA 200FEG, FEI
Company, USA), and their amorphous/crystalline character was determined by XRD.

8
3. Results and discussion
3.1. Effect of powder particle size on the feedstock flowability
Figure 4 Flowability tests versus mean particle size of the tested glass powder fractions: (a) Hausner ratio, (b) Angle of repose and (c) Hausner ratio versus angle of repose for dry (●) and moist (▲) powders
Figure 4a plots the results of HR tests for the different glass powder fractions. As
expected HR increases (flowability decreases) as the particle size of the powder is
reduced. This is because when the frictional forces between particles increase the
difference between the tapped (vibrated) powder density and the as-poured powder
density also tends to rise. Free–flowing powders display HR lower than 1.25 [21]. Thus,
samples can be considered as free–flowing powders except those with particles smaller
than 150 µm (BGGS3 and BGGS4). In fact, when the particle size of the powder
becomes increasingly smaller the adhesion forces between particles overcame the
gravity forces, which predominate for coarse particles. Findings obtained with the other
test (Figure 4b) ratify the effect of the particle size on flowability: the finer the particle
size of the powder the higher the angle of repose is, i.e there is a clear flowability
decrease as particle size is reduced. According to literature, for angles below 30º
powder has good flowability, angles comprising 30–45º give some cohesiveness, angles
between 45–55º lead to cohesiveness and for angles higher than 55º powder displays
remarkable cohesiveness [22,23]. The correlation of the data obtained from both

9
flowability measurement tests was plotted in figure 4c. As observed there are three
different flowability zones in function of the HR and angle of repose. Coarse fractions
(BGGS, BGGS1 and BGGS2) are in the good flowability zone in comparison with the
fine fractions (BGGS3 and BGGS4) that are in the some cohesiveness zone. From the
data acquired, it is then possible to obtain a good correlation between the two methods
in both zones confirming the validity of these simple techniques to assess the
flowability of powder feedstocks to be used in APS processes.
In addition flowability tests (HR and angle of repose) were also carried out with some
samples which stayed inside the climatic chamber (at 20 ºC and 60% relative moisture)
and for 24 h in order to allow the samples to adsorb their equilibrium moisture. The
samples tested were BGGS3 and BGGS4, which corresponded to the smallest particle
size fractions. Figure 4c collects the flowability findings (triangle dots) of these two
samples. These data show a significant worsening of flowability (increasing of HR and
angle of repose values) after a 24 h soaking time in the climatic chamber. This change
in flowability can only be attributed to the fact that the bioactive glass powder samples
are highly hygroscopic [18]. As expected, the amount of adsorbed water increases when
particle size decreases, due to the increase of specific surface area. Adsorbed water on
the powder surface markedly impairs the flowability of the samples, in particular of the
finest powder due to the increasing of the adhesion forces associated with water [24].
As a consequence both samples shift to the cohesiveness zone in figure 4c, specially the
finest powder (BGGS4).
In an APS experiment, the powder feedstock can stay for some period of time (between
15–30 min) in contact with room air inside the container of the plasma equipment
before it is fed into the torch. That allows the powder to adsorb water. With the aim to
assess the changes in water adsorbed with time and its effect on the flowability of the
finest powder feedstock the water adsorbed inside the climatic chamber (20 ºC, 60%
relative moisture) as well as the angle of repose were monitored with time up to 8 hours.
Figure 5 plots the variation of the adsorbed water and the angle of repose with the
soaking time of the sample inside the climatic chamber. As it can be seen, there is a
good parallelism between the amount of adsorbed water and the flowability of the
powder. Thus as the water is adsorbed the flowability decreases being this decrease
much more significant during the first hour of contact between the powder and the
humid air. This is because the first layers of water dramatically increase the molecular
adhesion forces by reducing particle surface asperities while the successive water layers

10
become less efficient for this purpose [24]. The adsorbed water as well as the angle of
repose seem to stabilise after 5 hours of soaking time in the climatic chamber. From
figure 5 it can be concluded that in 30 min the powder can adsorb more than 0.2% of
water resulting in a significant increase of angle of repose from 33º to 35.5º and
consequently in an impairing of flowability. In fact, the high cohesiveness rise observed
in the BGSS4 sample after being in contact with room air for some time can block the
feeding of this feedstock to the plasma torch.
Figure 5 Variation of the adsorbed water and angle of repose of the finest powder fraction (BGGS4) with time exposure to 60% relative humidity air at 20 ºC. Bold points for sample without fluidiser and hollow
points for sample with fluidiser
3.2. Effect of powder particle size on the thermal behaviour of the feedstock
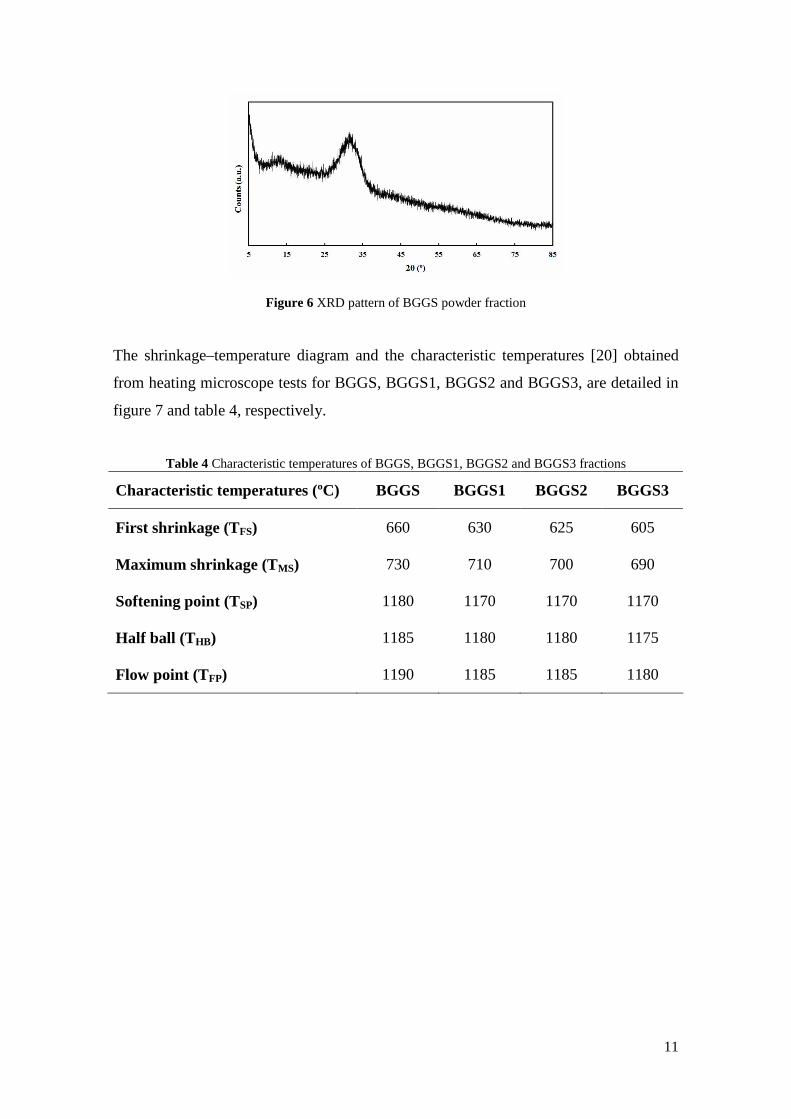
Figure 6 shows the XRD pattern of the BGGS fraction. The other powder fractions
exhibited analogous patterns. As expected, this diffractogram corresponds to fully
vitreous material. Thus, all fractions display amorphous structure without any
devitrifying phase occurring during melting or crushing of the frit. Consequently, all
BG powder fractions seem to be, at first, suitable to obtain bioactive glass coatings as
reported elsewhere [25].
11
Figure 6 XRD pattern of BGGS powder fraction
The shrinkage–temperature diagram and the characteristic temperatures [20] obtained
from heating microscope tests for BGGS, BGGS1, BGGS2 and BGGS3, are detailed in
figure 7 and table 4, respectively.
Table 4 Characteristic temperatures of BGGS, BGGS1, BGGS2 and BGGS3 fractions
Characteristic temperatures (ºC) BGGS BGGS1 BGGS2 BGGS3
First shrinkage (TFS) 660 630 625 605
Maximum shrinkage (TMS) 730 710 700 690
Softening point (TSP) 1180 1170 1170 1170
Half ball (T HB) 1185 1180 1180 1175
Flow point (TFP) 1190 1185 1185 1180

12
Figure 7 Shrinkage–temperature diagrams for BGGS, BGGS1, BGGS2 and BGGS3 powder fractions obtained in the heating microscope
No significant differences in the characteristic temperatures were observed except for
the first shrinkage temperature (TFS). As it can be observed, the particle size defines
when particles start sintering. Hence, the smaller the particle size, the lower the
temperature at which shrinkage starts. For all particle sizes, it can be observed that in
the temperature range 700–1000 °C devitrification takes place and as a result sintering
(shrinkage) stops. In order to identify the phases that crystallize, an amount of BG
powder was heated on a ceramic substrate with a corundum layer to prevent the
adhesion of both materials. The sample was heated at 25 °C min-1 to a maximum
temperature of 800 ºC, and the resulting material was quenched to avoid changes on
cooling. XRD of this sample (Figure 8) shows a sodium calcium silicate phase with
combeite structure (Na6Ca3Si6O18) as major phase and of a sodium calcium phosphate
phase with rhenanite structure (NaCaPO4) as minor phase [26–28]. The corundum peak
corresponds to the substrate used. From figure 7 it can be stated that particle size also
influences the devitrification process. The smaller the particle size, the lower the

13
temperature at which shrinkage stops as a consequence of the new formed crystals [29]
as well as the lower the temperature at which sintering reinitiates.
Figure 8 XRD pattern corresponding to the crystallised species at a peak temperature of 800 ºC
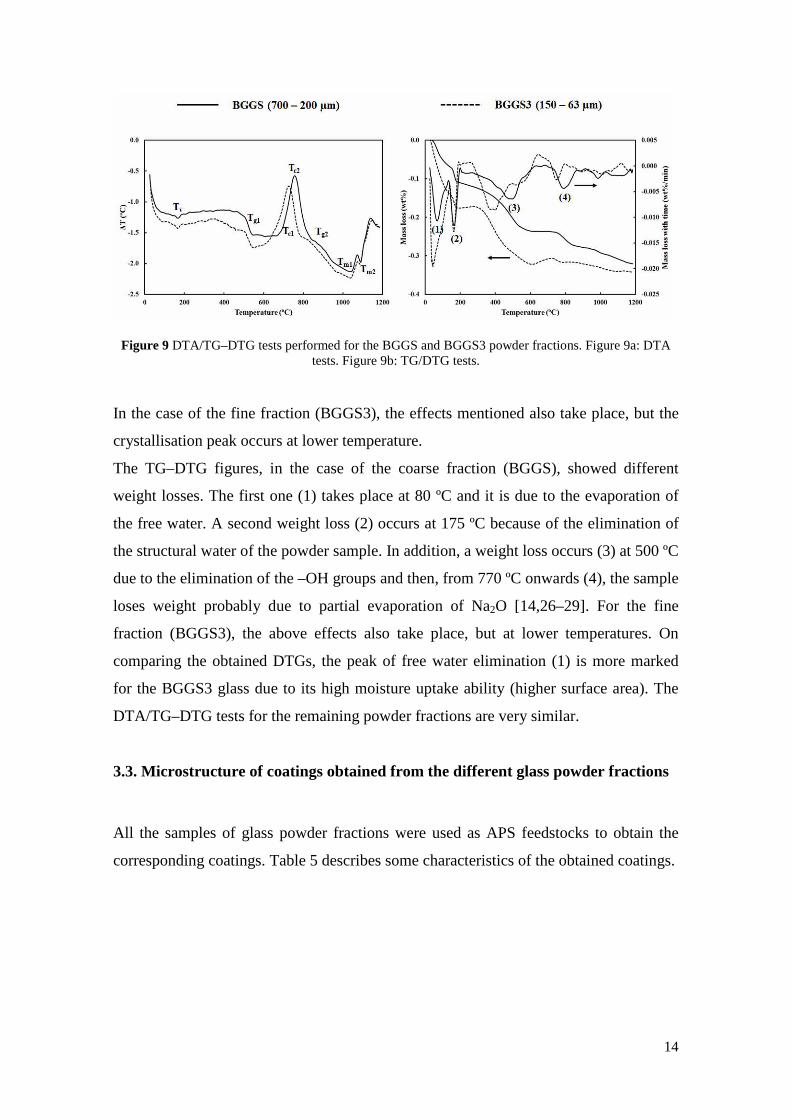
The effect of particle size can be more easily observed in DTA/TG–DTG curves. Tests
performed for BGGS and BGGS3 powder fractions are shown in figure 9. Curves are
very similar; exothermic peaks start at lower temperature when the particle size is
smaller. For the coarse fraction (BGGS), an endothermic effect corresponding to the
elimination of the structural water (Tv = 180 ºC) and another endothermic effect due to
the glass transition (Tg1 = 520 ºC) occur. These two endothermic peaks are followed by
an exothermic peak due to the overlapping effect of the crystallisation of two different
phases (combeite and rhenanite respectively), at Tc1 = 720 ºC and Tc2 = 770 ºC [26–28].
The formation of these crystalline phases is attributed to a glass phase separation that
occurs after the glass transition. The process of glass phase separation is due to the high
concentration of Si+4 and P+5 (high valence ions) into the starting glass [14,29]. These
elements are glass network formers; hence, a rich silica phase and a rich phosphate
phase are formed when temperature increases. Finally, melting occurs for a range of
temperatures between 1000–1180 ºC. In this temperature range there are two
endothermic peaks (Tm1 = 1060 ºC and Tm2 = 1100 ºC) corresponding to the partial
melting of the two crystalline phases formed. Besides, another endothermic peak is
observed at a temperature of Tg2 = 840 ºC which is attributable to a second glass
transition as reported elsewhere [26–28].
14
Figure 9 DTA/TG–DTG tests performed for the BGGS and BGGS3 powder fractions. Figure 9a: DTA tests. Figure 9b: TG/DTG tests.
In the case of the fine fraction (BGGS3), the effects mentioned also take place, but the
crystallisation peak occurs at lower temperature.
The TG–DTG figures, in the case of the coarse fraction (BGGS), showed different
weight losses. The first one (1) takes place at 80 ºC and it is due to the evaporation of
the free water. A second weight loss (2) occurs at 175 ºC because of the elimination of
the structural water of the powder sample. In addition, a weight loss occurs (3) at 500 ºC
due to the elimination of the –OH groups and then, from 770 ºC onwards (4), the sample
loses weight probably due to partial evaporation of Na2O [14,26–29]. For the fine
fraction (BGGS3), the above effects also take place, but at lower temperatures. On
comparing the obtained DTGs, the peak of free water elimination (1) is more marked
for the BGGS3 glass due to its high moisture uptake ability (higher surface area). The
DTA/TG–DTG tests for the remaining powder fractions are very similar.
3.3. Microstructure of coatings obtained from the different glass powder fractions
All the samples of glass powder fractions were used as APS feedstocks to obtain the
corresponding coatings. Table 5 describes some characteristics of the obtained coatings.
15
Table 5 Characteristics of the obtained coatings
Powder fraction Coating Observation
BGGS No coating was obtained Particles cannot adhere
BGGS1 No coating was obtained Similar to BGGS fraction
BGGS2 Coating was obtained Peak and valley, cracked
and porous surface
BGGS3 Coating was obtained Similar to BGGS2 fraction
BGGS4 No coating was obtained No powder flowability
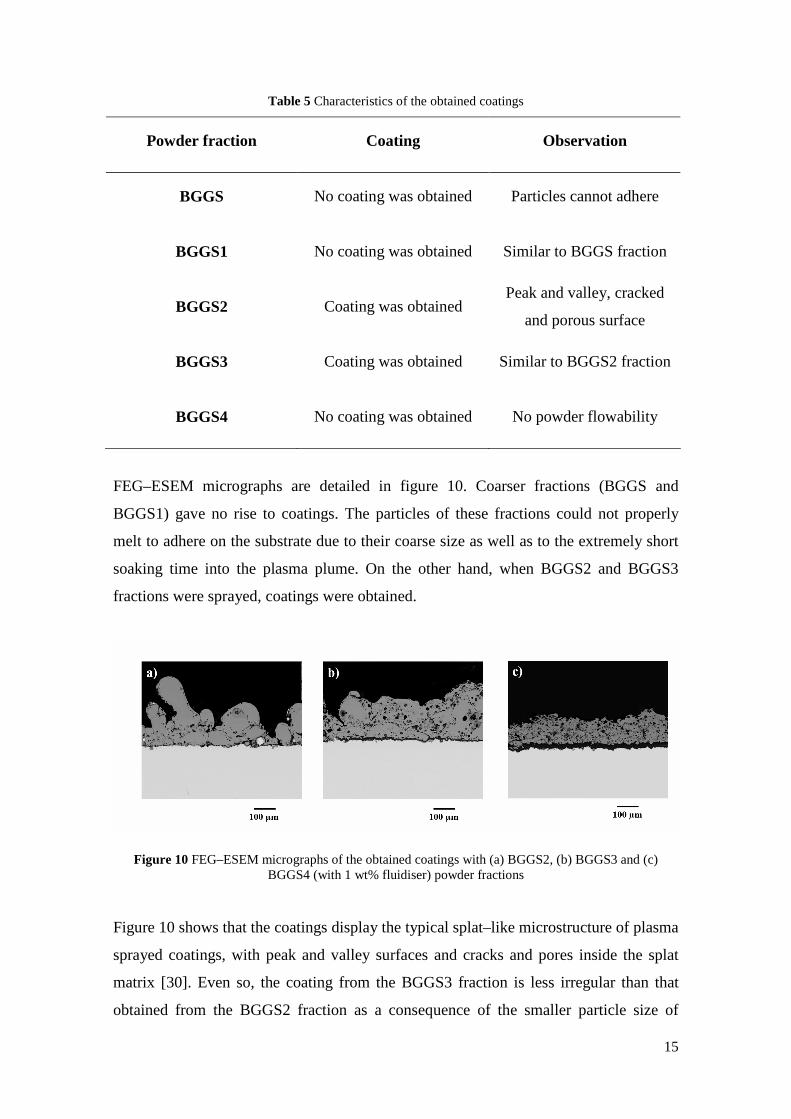
FEG–ESEM micrographs are detailed in figure 10. Coarser fractions (BGGS and
BGGS1) gave no rise to coatings. The particles of these fractions could not properly
melt to adhere on the substrate due to their coarse size as well as to the extremely short
soaking time into the plasma plume. On the other hand, when BGGS2 and BGGS3
fractions were sprayed, coatings were obtained.
Figure 10 FEG–ESEM micrographs of the obtained coatings with (a) BGGS2, (b) BGGS3 and (c) BGGS4 (with 1 wt% fluidiser) powder fractions
Figure 10 shows that the coatings display the typical splat–like microstructure of plasma
sprayed coatings, with peak and valley surfaces and cracks and pores inside the splat
matrix [30]. Even so, the coating from the BGGS3 fraction is less irregular than that
obtained from the BGGS2 fraction as a consequence of the smaller particle size of

16
sample BGGS3. Unlike other APS coatings obtained from highly refractory crystalline
oxides such as alumina or zirconia, the liquid phase sintering occurring during the
thermal treatment of glass powders gives rise to an abundance of round pores inside the
coating. These findings confirm the results obtained by Canillo et al. [10]. According to
these researchers the round particles visible on the coating surface, especially in the
BGGS2 coating, are the consequence of semi-melted particles in the plasma plume.
Thus if the starting glass particle is too coarse the core of the particle, which is not
melted, prevents the flattening of the particle, which preserves its sphere–like
appearance.
For the finest particle size fraction (sample BGGS4) no coating was obtained either.
This was due to its high ability of adsorbing water, which dramatically reduces the
flowability of this powder preventing the feeding of the sample to the plasma by means
of the pneumatic conveying system.
In order to solve the flowing problem of BGGS4, a fluidiser was added to the powder.
The fluidiser used was hydrophobic fumed silica (Aerosil R812, Evonik Industries,
Germany) with a mean particle size of 7 nm and a specific surface area of 260 ± 30 m2
g-1. This fluidiser was chosen from previous experience on flowability enhancement
with other cohesive powders. A home–made high–intensity knife–type mixer was
employed to mix the fluidiser with the fine powder. Several tests were performed and
the best results were obtained for a mixing time of 5 minutes and a concentration of
fluidiser in the powder of 1 wt%. FEG–ESEM micrographs of the BGGS4 fraction with
fluidiser are detailed in figure 11. Micrograph (a) shows the powder fraction mixed with
fluidiser and micrograph (b) shows (at high magnification) the nanometric particles of
fluidiser onto the surface of the glassy powder.

17
Figure 11 FEG–ESEM micrographs of the BGGS4 powder fraction with 1 wt% fluidiser
In order to know if the use of the fluidiser could affect the water adsorption ability of
the glass powder, moisture uptake with time and the angle of repose were determined
for BGGS4 powder containing fluidiser in the same way as set out with the sample of
BGGS4 fraction without fluidiser. Furthermore, Hausner ratio (HR) values of the
BGGS4 powder fraction with and without fluidiser are shown in figure 5 and table 6,
respectively.
Table 6 Hausner ratio variation with fluidiser content for BGGS4 powder fraction
Powder fraction Fluidiser content (wt%) Hausner ratio (HR)
0 % 1.40 ± 0.03 BGGS4
1 % 1.30 ± 0.01
HR decreased when 1 wt% fluidizer was added to the BGGS4 powder, that is, powder
flowability improved. On the other hand, as it can be seen in figure 5 (hollow circles),
the maximum values of the moisture uptake and the angle of repose (αM) of the powder
also decreased when 1 wt% fluidiser was added, confirming the hydrophobic character
of this additive. The reduction in water adsorption with time results in a parallel
decrease of the angle of repose (hollow triangles), i.e. an improvement of flowability.
Consequently, the powder with fluidiser could be led into the plasma plume, allowing to
obtain a coating. The FEG–ESEM micrograph of this coating is shown in figure 10c.
The microstructure is similar to that of the BGGS2 and BGGS3 coatings; but, in this

18
case, the surface is much more regular as a consequence of the smaller particle size of
the starting powder.
As the coatings showed no or little adherence to the substrate, they were XRD analysed.
The obtained XRD patterns corresponded to amorphous materials, as depicted in figure
12. Hence, the amorphous structure of the feedstocks was preserved in the obtained
coatings. These findings demonstrate that the crystalline phases that appear during the
thermal treatment and started to melt at temperatures between 1000 ºC and 1100 ºC
(Figure 9), completely melt in the plasma torch as a consequence of the extremely high
temperatures reached (higher than 10000 ºC). Thus, despite the effect of the particle size
of the glass powder feedstock on the crystallisation phenomena the huge energy
provided by the plasma ensures the melting of any of the crystalline phases newly
formed when heating the glass. Besides, the rapid cooling that takes place after coating
deposition impedes any devitrifying process, which can occur during the cooling of the
melt for the powder feedstock.
Figure 12 XRD pattern of the obtained coating starting from BGGS3 powder fraction
4. Conclusions
Bioactive glass powder fractions with different particle size were prepared by melting,
milling and sieving. The powders, used as feedstocks for APS, showed fully amorphous
character as revealed by XRD analysis.
Thermal behaviour of the feedstocks was highly dependent on their particle size. All
fractions underwent the same processes (weight losses, glass transitions,
crystallisations, etc). However, the smaller the particle size the lower the temperature at
which most of these processes took place.

19
The finest powder fraction showed highly hygroscopic behaviour, due to its higher
specific surface area. Consequently, when this powder fraction adsorbs water from
indoor air its flowability is seriously impaired.
With regard to the deposition of the powder fractions, at first coatings were only
obtained from intermediate fractions BGGS2 (200–100 µm) and BGGS3 (150–63 µm).
Thus, when coarse fractions (BGGS and BGGS1) were sprayed, no coating was
obtained due to the low melting degree of the larger powder particles as soaking time in
the plasma plume is extremely low. The finest powder fraction (BGGS4) needed a
hydrophobic fluidiser in order to improve its flowability and reduce its water adsorption
ability. When 1 wt% of fluidiser was added it was possible to obtain a coating by APS.
All the obtained coatings showed amorphous character which evidenced the melting of
any crystalline phase that could appear during APS deposition. The microstructure of
the obtained coatings corresponded to the typical splat–like matrix of APS coatings
containing pores and cracks. Nevertheless the coarser the feedstock particle size the
more irregular the coating surface was as a consequence of the insufficient particle
melting which prevented the flattening of some particles when impacting on the
substrate. The abundance of round pores in the microstructure is consequence of a liquid
phase sintering mechanism operating during the thermal treatment of glassy particles.
Concerning the adherence between coatings and substrates, no consideration was made
since the aim of this work was to determine the effect of the particle size. However, this
is already under study by using a bond coat as well as testing different metallic
substrates.
Acknowledgements
Authors wish to acknowledge the University Jaume I of Castellon for the support in the
RECUBIO project (P1-1B2013-69) and Fritta S.L. for the support in feedstock
synthesis.
References
[1] Juhasz JA, Best SM (2012) Bioactive ceramics: processing, structures and
properties. J Mater Sci 47:610–624
[2] De Aza PN, De Aza AH, Pena P, De Aza S (2007) Bioactive glasses and glass–
ceramics. Bol Soc Esp Ceram V 46:45–55

20
[3] Helsen JA, Proost J, Schrooten J, Timmermans G, Brauns E, Vanderstraeten J
(1997) Glasses and bioglasses: synthesis and coatings. J Eur Ceram Soc 17:147–
152
[4] Sola A, Bellucci D, Canillo V, Cattini A (2011) Bioactive glass coatings: a
review. Surf Eng 27:560–573
[5] López V, Vicent M, Bannier E, Cañas E, Sánchez E (2014) 45S5 bioactive glass
coating by atmospheric plasma spraying obtained from feedstocks prepared by
different routes. J Mater Sci 49:7933–7942
[6] Shirtliff VJ, Hench LL (2003) Bioactive materials for tissue engineering,
regeneration and repair. J Mater Sci 38:4697–4707
[7] Monsalve M, Ageorges H, Lopez E, Vargas F, Bolivar F (2013) Bioactivity and
mechanical properties of plasma–sprayed coatings of bioglass powders. Surf Coat
Technol 220:60–66
[8] Bolelli G, Bellucci D, Canillo V, Lusvarghi L, Sola A, Stiegler N, Müller P,
Killinger A, Gadow R, Altomare L, De Nardo L (2014) Suspension thermal
spraying of hydroxyapatite: Microstructure and in vitro behaviour. Mat Sci Eng C
34:287–303
[9] Lee TM, Chang E, Wang BC, Yang CY (1996) characteristics of plasma–sprayed
bioactive coatings on Ti–6Al–4V alloy: an in vitro study. Surf Coat Technol
79:170–177
[10] Canillo V, Sola A (2010) Different approaches to produce coatings with bioactive
glasses: enamelling vs plasma spraying. J Eur Ceram Soc 30:2031–2039
[11] Goller G (2004) The effect of bond coat on mechanical properties of plasma
sprayed bioglass–titanium coatings. Ceram Inter 30:351–355
[12] Verné E, Ferraris M, Ventrella A, Paracchini L, Krajewski A, Ravaglioli A (1998)
Sintering and plasma spray deposition of bioactive glass–matrix composites for
medical applications. J Eur Ceram Soc 18:363–372
[13] Davis JR (2004) Handbook of thermal spraying technology 1st edn. In: Coatings,
equipment and theory. ASM International, The USA, pp 66–67
[14] Fernández Navarro JM (2003) El vidrio (The glass) 3rd edn. CSIC, Madrid
[15] Alvarez-Estrada D (1962) Formación y eliminación de burbujas en vidriados
cerámicos (Formation and removal of bubbles in ceramic glazes). IV Conference
of Week Ceramic Studies of the Spanish Ceramic Society, Madrid 511–526

21
[16] Vicent M, Bannier E, Benavente R, Salvador MD, Molina T, Moreno R, Sánchez
E (2013) Influence of the feedstock characteristics on the microstructure and
properties of Al2O3–TiO2 plasma–sprayed coatings. Surf Coat Technol 220:74–79
[17] Vicent M, Bannier E, Moreno R, Salvador MD, Sánchez E (2013) Atmospheric
plasma spraying coatings from alumina–titania feedstock comprising bimodal
particle size distributions. J Eur Ceram Soc 33:3313–3324
[18] Popa AC, Marques VMF, Stan GE, Husanu MA, Galca AC, Ghica C, Tulyaganov
DU, Lemos AF, Ferreira JMF (2014) Nanomechanical characterization of
bioglass synthesized by magnetron sputtering. Thin Solid Films 553:166–172
[19] Mestre S, Bou E, Quereda P, Barba A (2001) Using the hot stage microscope for
estimating frit sealing temperature. Ceram Forum Internation 78:36–39
[20] Pascual MJ, Pascual L, Durán A (2001) Determination of the viscosity–
temperature curve for glasses on the basis of fixed viscosity points determined by
hot stage microscopy. Phys Chem Glasses 42:61–66
[21] Amoros JL, Blasco A, Enrique JE, Negre F (1987) Características de polvos
cerámicos para prensado (Characteristics of ceramic powders for pressing). Bol
Soc Esp Ceram Vidr 26:31–37
[22] Geldart D, Abdullah EC, Hassanpour A, Nwoke LC, Wouters I (2006)
Characterizacion of powder flowability using measurement of angle of repose.
China Part 4:104–107
[23] Wong AC (2002) Use of angle of repose and bulk densities for powder
characterization and the prediction of minimum fluidization and minimum
bubbling velocities. Chem Eng Sci 57:2635–2640
[24] Sherrington PJ, Oliver R (1980) Granulation. In: Particle-particle attractive forces
1st edn. Heyden, London
[25] Peitl Filho O, LaTorre GP, Hench LL (1996) Effect of crystallization on apatite–
layer formation of bioactive glass 45S5. J Biomed Mater Res B 30:509–514
[26] Lefebvre L, Chevalier J, Gremillard L, Zenati R, Thollet G, Bernache–Assolant
D, Govin A (2007) Structural transformations of bioactive glass 45S5 with
thermal treatments. Acta Mater 55:3305–3313
[27] Lefebvre L, Gremillard L, Chevalier J, Zenati R, Bernache–Assolant D (2008)
Sintering behaviour of 45S5 bioactive glass. Acta Biomater 4:1894–1903

22
[28] Bretcanu O, Chatzistavrou X, Paraskevopoulos K, Conradt R, Thompson I,
Boccaccini AR (2009) Sintering and crystallisation of 45S5 Bioglass® powder. J
Eur Ceram Soc 29:3299–3306
[29] Boccaccini AR, Chen Q, Lefebvre L, Gremillard L, Chevalier J (2007) Sintering,
crystallisation and biodegradation behaviour of Bioglass®–derived glass–ceramic.
Faraday Discuss 136:27–44
[30] Pawlowski L (2008) The Science and Engineering of Thermal Spray Coatings 2nd
edn. John Wiley & Sons, Great Britain