Effect of Natural Graphite Particle size in friction materials on thermal localisation phenomenon...
11
Wear 268 (2010) 1472–1482 Contents lists available at ScienceDirect Wear journal homepage: www.elsevier.com/locate/wear Effect of Natural Graphite Particle size in friction materials on thermal localisation phenomenon during stop-braking D.K. Kolluri a , X. Boidin c , Y. Desplanques c , G. Degallaix c , A.K. Ghosh a , M. Kumar b , J. Bijwe b,∗ a CPSE, Indian Institute of Technology, Delhi, India b ITMMEC, Indian Institute of Technology, Delhi 110016, India c Laboratoire de Mécanique de Lille (CNRS UMR 8107), École Centrale de Lille, 59650 Villeneuve d’Ascq, France article info Article history: Received 6 June 2009 Received in revised form 17 February 2010 Accepted 18 February 2010 Available online 25 February 2010 Keywords: NAO friction materials Thermal localisation Natural graphite Hot band Hot spots abstract Thermal localisation (TL) phenomenon is defined as localisation of high temperature as consequences of high strain gradients developed in the bulk of materials of a tribo-pair. High extent of localisation of thermal gradient is rated as a non-desirable parameter for a good friction material because it affects both the surfaces leading to thermal crazing, cracks and fatigue, especially of the disc apart from affecting wear. In the present work, four composites with identical parent composition (containing ingredients of all the four categories) but differing in the average particle size of natural graphite (21, 41, 71 and 137 m) were developed and evaluated on specially designed tribometer for enabling the studies of TL phenomenon. Two series of testing modes viz. inertia mode and rpm-mode were selected to bring out the correlation of selected graphite and their tendency to produce hot bands, hot spots and related phenomena on the counter-face. Overall, it was observed that the composites with lower particle size of graphite rendered better results than that with higher particle size. The study of hot-spot appearance and the TL behavior of tribo-pair are discussed in details in the paper. © 2010 Elsevier B.V. All rights reserved. 1. Introduction Friction materials are expected to fulfill various performance criteria such as adequate coefficient of friction () and its low sen- sitivity towards load, speed and temperature, moderately low wear, low fade and high recovery, resistance to generation of squeal, noise, judder, ease consistency in manufacturing, adequate cost, etc. Amongst these, counter-face friendliness is one of the impor- tant selection criteria. In general, counter-face such as drum, disc, clutch plate, railway wheel, etc. are much expensive than the shoe, pad, facing, block and more life expectancy is necessary. Following are the desired criteria for the counter-face friendliness of a friction material: • It should not alter the roughness of the counter-face either by abrasion, scratching etc. leading to excessive roughness which cause fluctuations in or transferring the glaze leading to smoothness and hence deterioration in ; • it should not induce thermal fatigue, cracking, etc. on the counter- face which reduces the life drastically. ∗ Corresponding author. Tel.: +91 11 26591280; fax: +91 11 265962222. E-mail address: [email protected] (J. Bijwe). Literature on the aspect of counter-face friendliness indicates that a few papers are available on the measurement of surface roughness, related parameters and microscopic studies on worn surfaces [1,2]. Papers on studying phenomenon of TL which leads to thermal fatigue or crazing are numbered [3–7]. TL corresponds to transient phenomena defined as localisations of high temper- ature on the rubbing surface of a tribo-pair. As consequences of high strain gradients developed in the bulk of materials, their nature depends on the severity of thermal gradients induced by friction. At low and mean dissipated power and energy, hot bands migrate on the rubbing surface, while hot spots appear and develop at higher level of dissipation [5–7]. Moreover, these phenomena, which are highly influenced by the thermal properties of materials, are also sensitive to friction behavior of a tribo-pair. Efforts have been made in the literature to investigate this aspect with selected pair of friction material and counter-face. No papers, however, are reported on investigating the influence of a selected ingredient in friction material on TL phenomenon. The performance proper- ties of a friction material are composition specific. Non-asbestos organic (NAO) friction material is a multi-ingredient system con- taining ingredients ranging from 10 to 20 in general. These are of four type’s viz. binder, fibers, inert fillers and functional fillers to achieve the desired amalgam of performance properties. Most of the ingredients are multifunctional. Amongst these, graphite is almost inevitable functional filler added in friction composites to smoothen the unwanted fluctuations in with operating param- 0043-1648/$ – see front matter © 2010 Elsevier B.V. All rights reserved. doi:10.1016/j.wear.2010.02.024
-
Upload
independent -
Category
Documents
-
view
1 -
download
0
Transcript of Effect of Natural Graphite Particle size in friction materials on thermal localisation phenomenon...
El
Da
b
c
a
ARRAA
KNTNHH
1
cslnetcpam
•
•
0d
Wear 268 (2010) 1472–1482
Contents lists available at ScienceDirect
Wear
journa l homepage: www.e lsev ier .com/ locate /wear
ffect of Natural Graphite Particle size in friction materials on thermalocalisation phenomenon during stop-braking
.K. Kolluri a, X. Boidinc, Y. Desplanquesc, G. Degallaixc, A.K. Ghosha, M. Kumarb, J. Bijweb,∗
CPSE, Indian Institute of Technology, Delhi, IndiaITMMEC, Indian Institute of Technology, Delhi 110016, IndiaLaboratoire de Mécanique de Lille (CNRS UMR 8107), École Centrale de Lille, 59650 Villeneuve d’Ascq, France
r t i c l e i n f o
rticle history:eceived 6 June 2009eceived in revised form 17 February 2010ccepted 18 February 2010vailable online 25 February 2010
a b s t r a c t
Thermal localisation (TL) phenomenon is defined as localisation of high temperature as consequencesof high strain gradients developed in the bulk of materials of a tribo-pair. High extent of localisation ofthermal gradient is rated as a non-desirable parameter for a good friction material because it affects boththe surfaces leading to thermal crazing, cracks and fatigue, especially of the disc apart from affecting wear.In the present work, four composites with identical parent composition (containing ingredients of all the
eywords:AO friction materialshermal localisationatural graphiteot bandot spots
four categories) but differing in the average particle size of natural graphite (21, 41, 71 and 137 �m) weredeveloped and evaluated on specially designed tribometer for enabling the studies of TL phenomenon.Two series of testing modes viz. inertia mode and rpm-mode were selected to bring out the correlationof selected graphite and their tendency to produce hot bands, hot spots and related phenomena on thecounter-face. Overall, it was observed that the composites with lower particle size of graphite renderedbetter results than that with higher particle size. The study of hot-spot appearance and the TL behavior
d in d
of tribo-pair are discusse. Introduction
Friction materials are expected to fulfill various performanceriteria such as adequate coefficient of friction (�) and its low sen-itivity towards load, speed and temperature, moderately low wear,ow fade and high recovery, resistance to generation of squeal,oise, judder, ease consistency in manufacturing, adequate cost,tc. Amongst these, counter-face friendliness is one of the impor-ant selection criteria. In general, counter-face such as drum, disc,lutch plate, railway wheel, etc. are much expensive than the shoe,ad, facing, block and more life expectancy is necessary. Followingre the desired criteria for the counter-face friendliness of a frictionaterial:
It should not alter the roughness of the counter-face either byabrasion, scratching etc. leading to excessive roughness whichcause fluctuations in � or transferring the glaze leading to
smoothness and hence deterioration in �;it should not induce thermal fatigue, cracking, etc. on the counter-face which reduces the life drastically.∗ Corresponding author. Tel.: +91 11 26591280; fax: +91 11 265962222.E-mail address: [email protected] (J. Bijwe).
043-1648/$ – see front matter © 2010 Elsevier B.V. All rights reserved.oi:10.1016/j.wear.2010.02.024
etails in the paper.© 2010 Elsevier B.V. All rights reserved.
Literature on the aspect of counter-face friendliness indicatesthat a few papers are available on the measurement of surfaceroughness, related parameters and microscopic studies on wornsurfaces [1,2]. Papers on studying phenomenon of TL which leadsto thermal fatigue or crazing are numbered [3–7]. TL correspondsto transient phenomena defined as localisations of high temper-ature on the rubbing surface of a tribo-pair. As consequences ofhigh strain gradients developed in the bulk of materials, theirnature depends on the severity of thermal gradients induced byfriction. At low and mean dissipated power and energy, hot bandsmigrate on the rubbing surface, while hot spots appear and developat higher level of dissipation [5–7]. Moreover, these phenomena,which are highly influenced by the thermal properties of materials,are also sensitive to friction behavior of a tribo-pair. Efforts havebeen made in the literature to investigate this aspect with selectedpair of friction material and counter-face. No papers, however, arereported on investigating the influence of a selected ingredientin friction material on TL phenomenon. The performance proper-ties of a friction material are composition specific. Non-asbestosorganic (NAO) friction material is a multi-ingredient system con-taining ingredients ranging from 10 to 20 in general. These are
of four type’s viz. binder, fibers, inert fillers and functional fillersto achieve the desired amalgam of performance properties. Mostof the ingredients are multifunctional. Amongst these, graphite isalmost inevitable functional filler added in friction composites tosmoothen the unwanted fluctuations in � with operating param-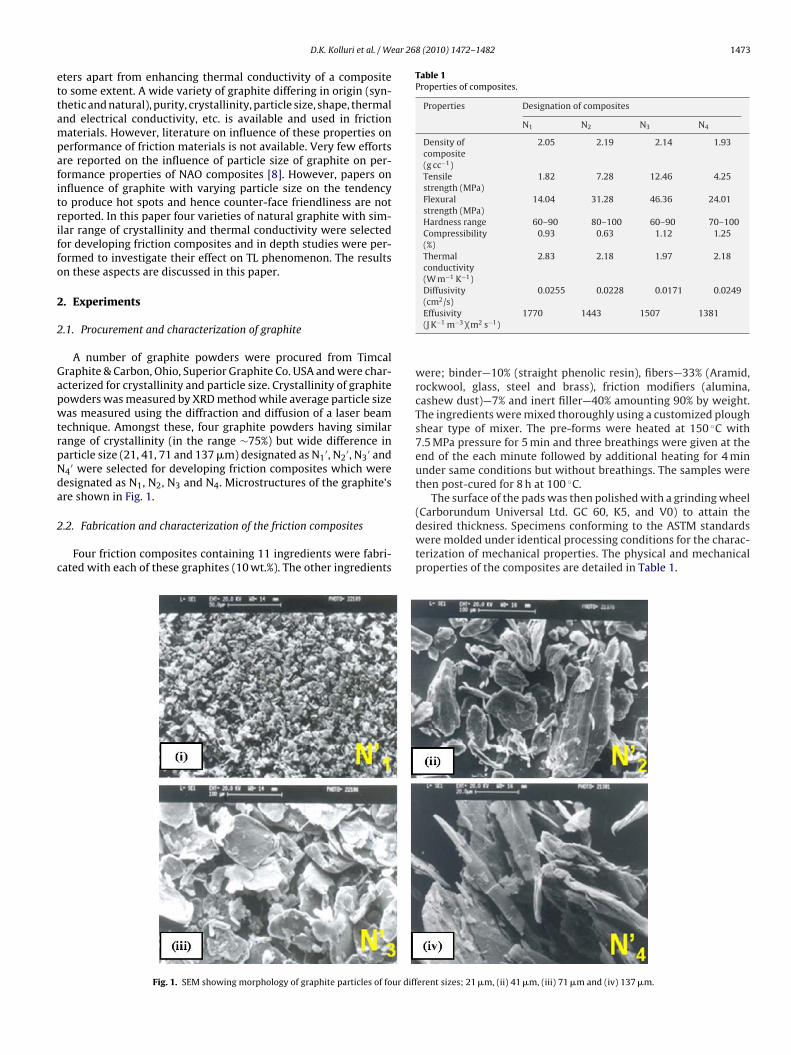
ear 268 (2010) 1472–1482 1473
ettampafitriffo
2
2
GapwtrpNda
2
c
Table 1Properties of composites.
Properties Designation of composites
N1 N2 N3 N4
Density ofcomposite(g cc−1)
2.05 2.19 2.14 1.93
Tensilestrength (MPa)
1.82 7.28 12.46 4.25
Flexuralstrength (MPa)
14.04 31.28 46.36 24.01
Hardness range 60–90 80–100 60–90 70–100Compressibility(%)
0.93 0.63 1.12 1.25
Thermalconductivity(W m−1 K−1)
2.83 2.18 1.97 2.18
Diffusivity(cm2/s)
0.0255 0.0228 0.0171 0.0249
D.K. Kolluri et al. / W
ters apart from enhancing thermal conductivity of a compositeo some extent. A wide variety of graphite differing in origin (syn-hetic and natural), purity, crystallinity, particle size, shape, thermalnd electrical conductivity, etc. is available and used in frictionaterials. However, literature on influence of these properties on
erformance of friction materials is not available. Very few effortsre reported on the influence of particle size of graphite on per-ormance properties of NAO composites [8]. However, papers onnfluence of graphite with varying particle size on the tendencyo produce hot spots and hence counter-face friendliness are noteported. In this paper four varieties of natural graphite with sim-lar range of crystallinity and thermal conductivity were selectedor developing friction composites and in depth studies were per-ormed to investigate their effect on TL phenomenon. The resultsn these aspects are discussed in this paper.
. Experiments
.1. Procurement and characterization of graphite
A number of graphite powders were procured from Timcalraphite & Carbon, Ohio, Superior Graphite Co. USA and were char-cterized for crystallinity and particle size. Crystallinity of graphiteowders was measured by XRD method while average particle sizeas measured using the diffraction and diffusion of a laser beam
echnique. Amongst these, four graphite powders having similarange of crystallinity (in the range ∼75%) but wide difference inarticle size (21, 41, 71 and 137 �m) designated as N1
′, N2′, N3
′ and4
′ were selected for developing friction composites which wereesignated as N1, N2, N3 and N4. Microstructures of the graphite’sre shown in Fig. 1.
.2. Fabrication and characterization of the friction composites
Four friction composites containing 11 ingredients were fabri-ated with each of these graphites (10 wt.%). The other ingredients
Fig. 1. SEM showing morphology of graphite particles of four diff
Effusivity(J K−1 m−3)(m2 s−1)
1770 1443 1507 1381
were; binder—10% (straight phenolic resin), fibers—33% (Aramid,rockwool, glass, steel and brass), friction modifiers (alumina,cashew dust)—7% and inert filler—40% amounting 90% by weight.The ingredients were mixed thoroughly using a customized ploughshear type of mixer. The pre-forms were heated at 150 ◦C with7.5 MPa pressure for 5 min and three breathings were given at theend of the each minute followed by additional heating for 4 minunder same conditions but without breathings. The samples werethen post-cured for 8 h at 100 ◦C.
The surface of the pads was then polished with a grinding wheel(Carborundum Universal Ltd. GC 60, K5, and V0) to attain the
desired thickness. Specimens conforming to the ASTM standardswere molded under identical processing conditions for the charac-terization of mechanical properties. The physical and mechanicalproperties of the composites are detailed in Table 1.erent sizes; 21 �m, (ii) 41 �m, (iii) 71 �m and (iv) 137 �m.
1474 D.K. Kolluri et al. / Wear 268 (2010) 1472–1482
ermo
tadiiruatas[
cmpmeetooavmI
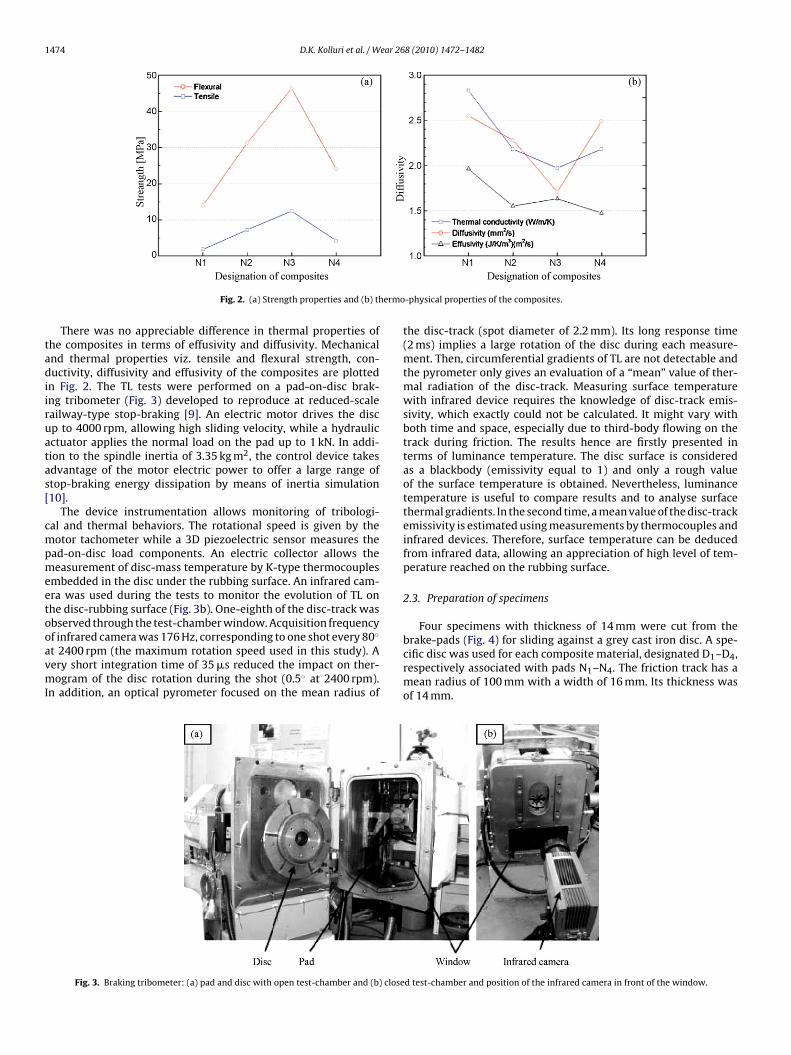
Fig. 2. (a) Strength properties and (b) th
There was no appreciable difference in thermal properties ofhe composites in terms of effusivity and diffusivity. Mechanicalnd thermal properties viz. tensile and flexural strength, con-uctivity, diffusivity and effusivity of the composites are plotted
n Fig. 2. The TL tests were performed on a pad-on-disc brak-ng tribometer (Fig. 3) developed to reproduce at reduced-scaleailway-type stop-braking [9]. An electric motor drives the discp to 4000 rpm, allowing high sliding velocity, while a hydraulicctuator applies the normal load on the pad up to 1 kN. In addi-ion to the spindle inertia of 3.35 kg m2, the control device takesdvantage of the motor electric power to offer a large range oftop-braking energy dissipation by means of inertia simulation10].
The device instrumentation allows monitoring of tribologi-al and thermal behaviors. The rotational speed is given by theotor tachometer while a 3D piezoelectric sensor measures the
ad-on-disc load components. An electric collector allows theeasurement of disc-mass temperature by K-type thermocouples
mbedded in the disc under the rubbing surface. An infrared cam-ra was used during the tests to monitor the evolution of TL onhe disc-rubbing surface (Fig. 3b). One-eighth of the disc-track wasbserved through the test-chamber window. Acquisition frequency
◦
f infrared camera was 176 Hz, corresponding to one shot every 80t 2400 rpm (the maximum rotation speed used in this study). Aery short integration time of 35 �s reduced the impact on ther-ogram of the disc rotation during the shot (0.5◦ at 2400 rpm).n addition, an optical pyrometer focused on the mean radius of
Fig. 3. Braking tribometer: (a) pad and disc with open test-chamber and (b) close
-physical properties of the composites.
the disc-track (spot diameter of 2.2 mm). Its long response time(2 ms) implies a large rotation of the disc during each measure-ment. Then, circumferential gradients of TL are not detectable andthe pyrometer only gives an evaluation of a “mean” value of ther-mal radiation of the disc-track. Measuring surface temperaturewith infrared device requires the knowledge of disc-track emis-sivity, which exactly could not be calculated. It might vary withboth time and space, especially due to third-body flowing on thetrack during friction. The results hence are firstly presented interms of luminance temperature. The disc surface is consideredas a blackbody (emissivity equal to 1) and only a rough valueof the surface temperature is obtained. Nevertheless, luminancetemperature is useful to compare results and to analyse surfacethermal gradients. In the second time, a mean value of the disc-trackemissivity is estimated using measurements by thermocouples andinfrared devices. Therefore, surface temperature can be deducedfrom infrared data, allowing an appreciation of high level of tem-perature reached on the rubbing surface.
2.3. Preparation of specimens
Four specimens with thickness of 14 mm were cut from the
brake-pads (Fig. 4) for sliding against a grey cast iron disc. A spe-cific disc was used for each composite material, designated D1–D4,respectively associated with pads N1–N4. The friction track has amean radius of 100 mm with a width of 16 mm. Its thickness wasof 14 mm.d test-chamber and position of the infrared camera in front of the window.
D.K. Kolluri et al. / Wear 268 (2010) 1472–1482 1475
iattfluot
rTmop
2
ptosmsms
•
•
tsdsq
TD
Table 3Stop-braking parameters of rpm-mode series.
Mean contact pressure 0.87 MPa
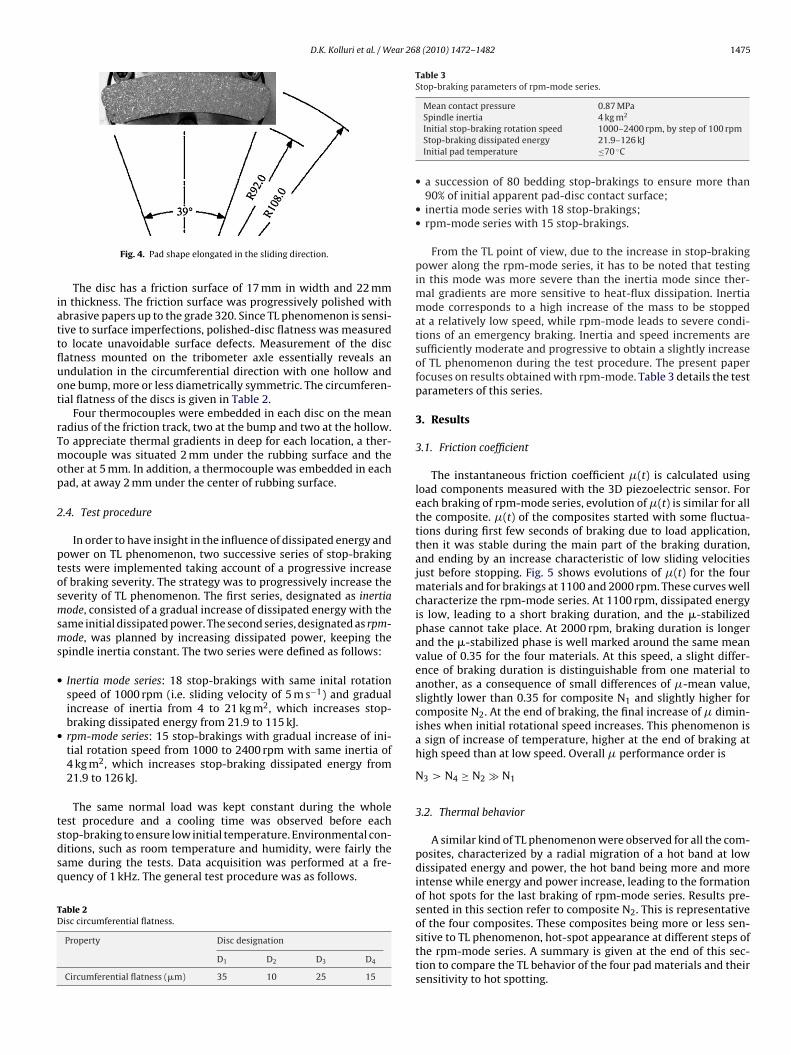
Fig. 4. Pad shape elongated in the sliding direction.
The disc has a friction surface of 17 mm in width and 22 mmn thickness. The friction surface was progressively polished withbrasive papers up to the grade 320. Since TL phenomenon is sensi-ive to surface imperfections, polished-disc flatness was measuredo locate unavoidable surface defects. Measurement of the discatness mounted on the tribometer axle essentially reveals anndulation in the circumferential direction with one hollow andne bump, more or less diametrically symmetric. The circumferen-ial flatness of the discs is given in Table 2.
Four thermocouples were embedded in each disc on the meanadius of the friction track, two at the bump and two at the hollow.o appreciate thermal gradients in deep for each location, a ther-ocouple was situated 2 mm under the rubbing surface and the
ther at 5 mm. In addition, a thermocouple was embedded in eachad, at away 2 mm under the center of rubbing surface.
.4. Test procedure
In order to have insight in the influence of dissipated energy andower on TL phenomenon, two successive series of stop-brakingests were implemented taking account of a progressive increasef braking severity. The strategy was to progressively increase theeverity of TL phenomenon. The first series, designated as inertiaode, consisted of a gradual increase of dissipated energy with the
ame initial dissipated power. The second series, designated as rpm-ode, was planned by increasing dissipated power, keeping the
pindle inertia constant. The two series were defined as follows:
Inertia mode series: 18 stop-brakings with same inital rotationspeed of 1000 rpm (i.e. sliding velocity of 5 m s−1) and gradualincrease of inertia from 4 to 21 kg m2, which increases stop-braking dissipated energy from 21.9 to 115 kJ.rpm-mode series: 15 stop-brakings with gradual increase of ini-tial rotation speed from 1000 to 2400 rpm with same inertia of4 kg m2, which increases stop-braking dissipated energy from21.9 to 126 kJ.
The same normal load was kept constant during the wholeest procedure and a cooling time was observed before each
top-braking to ensure low initial temperature. Environmental con-itions, such as room temperature and humidity, were fairly theame during the tests. Data acquisition was performed at a fre-uency of 1 kHz. The general test procedure was as follows.able 2isc circumferential flatness.
Property Disc designation
D1 D2 D3 D4
Circumferential flatness (�m) 35 10 25 15
Spindle inertia 4 kg m2
Initial stop-braking rotation speed 1000–2400 rpm, by step of 100 rpmStop-braking dissipated energy 21.9–126 kJInitial pad temperature ≤70 ◦C
• a succession of 80 bedding stop-brakings to ensure more than90% of initial apparent pad-disc contact surface;
• inertia mode series with 18 stop-brakings;• rpm-mode series with 15 stop-brakings.
From the TL point of view, due to the increase in stop-brakingpower along the rpm-mode series, it has to be noted that testingin this mode was more severe than the inertia mode since ther-mal gradients are more sensitive to heat-flux dissipation. Inertiamode corresponds to a high increase of the mass to be stoppedat a relatively low speed, while rpm-mode leads to severe condi-tions of an emergency braking. Inertia and speed increments aresufficiently moderate and progressive to obtain a slightly increaseof TL phenomenon during the test procedure. The present paperfocuses on results obtained with rpm-mode. Table 3 details the testparameters of this series.
3. Results
3.1. Friction coefficient
The instantaneous friction coefficient �(t) is calculated usingload components measured with the 3D piezoelectric sensor. Foreach braking of rpm-mode series, evolution of �(t) is similar for allthe composite. �(t) of the composites started with some fluctua-tions during first few seconds of braking due to load application,then it was stable during the main part of the braking duration,and ending by an increase characteristic of low sliding velocitiesjust before stopping. Fig. 5 shows evolutions of �(t) for the fourmaterials and for brakings at 1100 and 2000 rpm. These curves wellcharacterize the rpm-mode series. At 1100 rpm, dissipated energyis low, leading to a short braking duration, and the �-stabilizedphase cannot take place. At 2000 rpm, braking duration is longerand the �-stabilized phase is well marked around the same meanvalue of 0.35 for the four materials. At this speed, a slight differ-ence of braking duration is distinguishable from one material toanother, as a consequence of small differences of �-mean value,slightly lower than 0.35 for composite N1 and slightly higher forcomposite N2. At the end of braking, the final increase of � dimin-ishes when initial rotational speed increases. This phenomenon isa sign of increase of temperature, higher at the end of braking athigh speed than at low speed. Overall � performance order is
N3 > N4 ≥ N2 � N1
3.2. Thermal behavior
A similar kind of TL phenomenon were observed for all the com-posites, characterized by a radial migration of a hot band at lowdissipated energy and power, the hot band being more and moreintense while energy and power increase, leading to the formationof hot spots for the last braking of rpm-mode series. Results pre-sented in this section refer to composite N2. This is representative
of the four composites. These composites being more or less sen-sitive to TL phenomenon, hot-spot appearance at different steps ofthe rpm-mode series. A summary is given at the end of this sec-tion to compare the TL behavior of the four pad materials and theirsensitivity to hot spotting.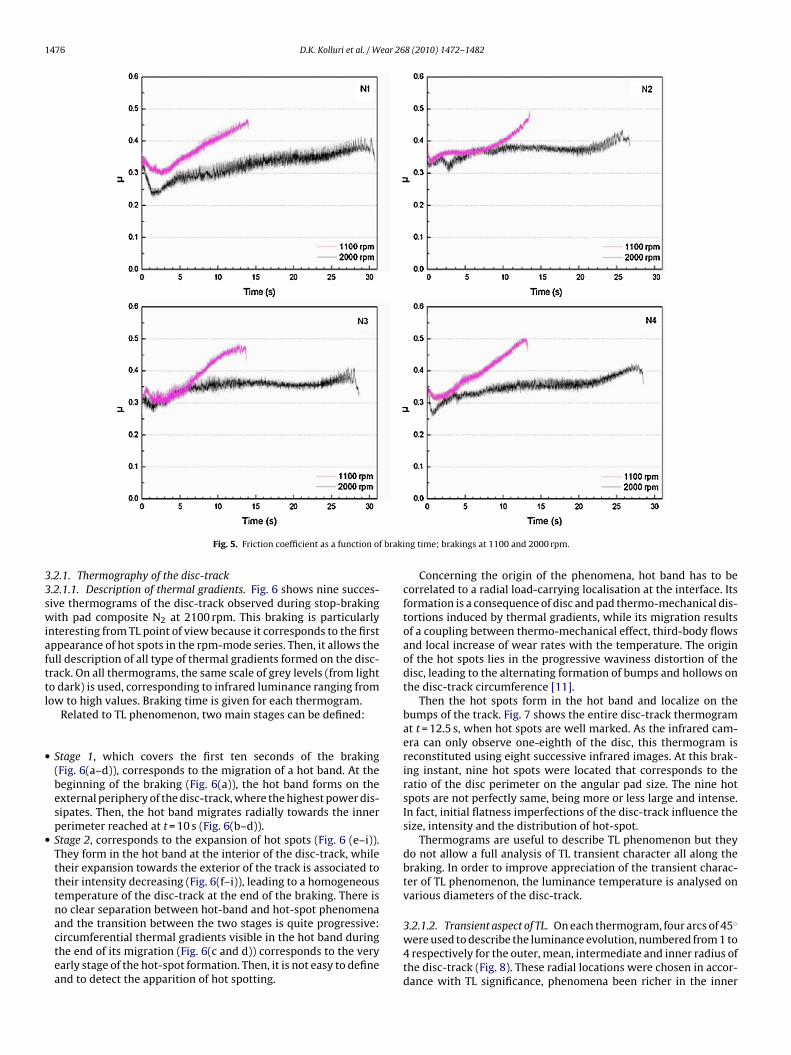
1476 D.K. Kolluri et al. / Wear 268 (2010) 1472–1482
braki
33swiafttl
•
•
Fig. 5. Friction coefficient as a function of
.2.1. Thermography of the disc-track
.2.1.1. Description of thermal gradients. Fig. 6 shows nine succes-ive thermograms of the disc-track observed during stop-brakingith pad composite N2 at 2100 rpm. This braking is particularly
nteresting from TL point of view because it corresponds to the firstppearance of hot spots in the rpm-mode series. Then, it allows theull description of all type of thermal gradients formed on the disc-rack. On all thermograms, the same scale of grey levels (from lighto dark) is used, corresponding to infrared luminance ranging fromow to high values. Braking time is given for each thermogram.
Related to TL phenomenon, two main stages can be defined:
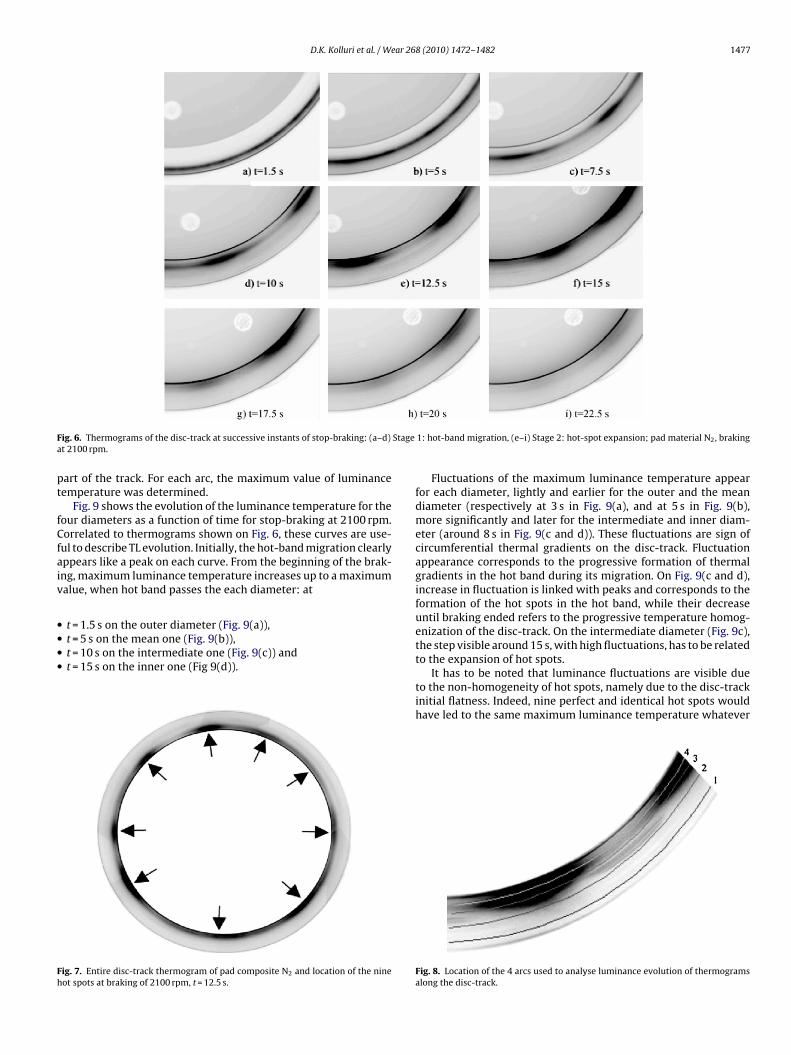
Stage 1, which covers the first ten seconds of the braking(Fig. 6(a–d)), corresponds to the migration of a hot band. At thebeginning of the braking (Fig. 6(a)), the hot band forms on theexternal periphery of the disc-track, where the highest power dis-sipates. Then, the hot band migrates radially towards the innerperimeter reached at t = 10 s (Fig. 6(b–d)).Stage 2, corresponds to the expansion of hot spots (Fig. 6 (e–i)).They form in the hot band at the interior of the disc-track, whiletheir expansion towards the exterior of the track is associated totheir intensity decreasing (Fig. 6(f–i)), leading to a homogeneoustemperature of the disc-track at the end of the braking. There isno clear separation between hot-band and hot-spot phenomena
and the transition between the two stages is quite progressive:circumferential thermal gradients visible in the hot band duringthe end of its migration (Fig. 6(c and d)) corresponds to the veryearly stage of the hot-spot formation. Then, it is not easy to defineand to detect the apparition of hot spotting.ng time; brakings at 1100 and 2000 rpm.
Concerning the origin of the phenomena, hot band has to becorrelated to a radial load-carrying localisation at the interface. Itsformation is a consequence of disc and pad thermo-mechanical dis-tortions induced by thermal gradients, while its migration resultsof a coupling between thermo-mechanical effect, third-body flowsand local increase of wear rates with the temperature. The originof the hot spots lies in the progressive waviness distortion of thedisc, leading to the alternating formation of bumps and hollows onthe disc-track circumference [11].
Then the hot spots form in the hot band and localize on thebumps of the track. Fig. 7 shows the entire disc-track thermogramat t = 12.5 s, when hot spots are well marked. As the infrared cam-era can only observe one-eighth of the disc, this thermogram isreconstituted using eight successive infrared images. At this brak-ing instant, nine hot spots were located that corresponds to theratio of the disc perimeter on the angular pad size. The nine hotspots are not perfectly same, being more or less large and intense.In fact, initial flatness imperfections of the disc-track influence thesize, intensity and the distribution of hot-spot.
Thermograms are useful to describe TL phenomenon but theydo not allow a full analysis of TL transient character all along thebraking. In order to improve appreciation of the transient charac-ter of TL phenomenon, the luminance temperature is analysed onvarious diameters of the disc-track.
3.2.1.2. Transient aspect of TL. On each thermogram, four arcs of 45◦
were used to describe the luminance evolution, numbered from 1 to4 respectively for the outer, mean, intermediate and inner radius ofthe disc-track (Fig. 8). These radial locations were chosen in accor-dance with TL significance, phenomena been richer in the inner
D.K. Kolluri et al. / Wear 268 (2010) 1472–1482 1477
F Stagea
pt
fCfaiv
••••
Fh
ig. 6. Thermograms of the disc-track at successive instants of stop-braking: (a–d)t 2100 rpm.
art of the track. For each arc, the maximum value of luminanceemperature was determined.
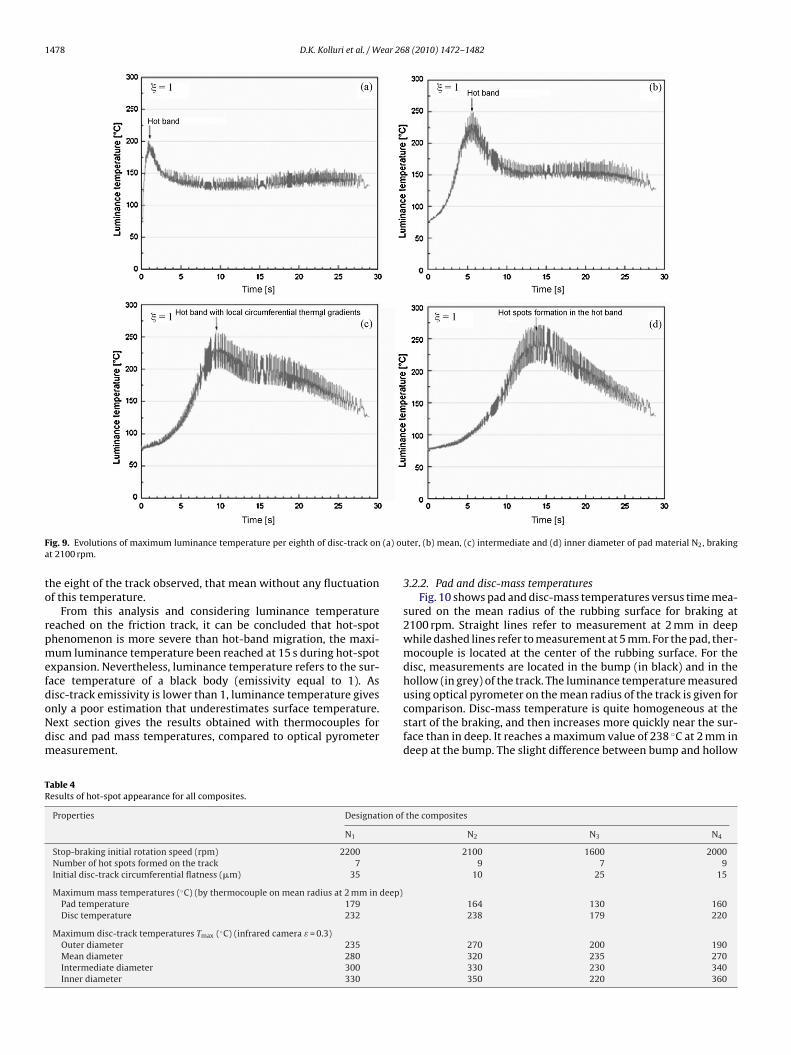
Fig. 9 shows the evolution of the luminance temperature for theour diameters as a function of time for stop-braking at 2100 rpm.orrelated to thermograms shown on Fig. 6, these curves are use-
ul to describe TL evolution. Initially, the hot-band migration clearlyppears like a peak on each curve. From the beginning of the brak-ng, maximum luminance temperature increases up to a maximumalue, when hot band passes the each diameter: at
t = 1.5 s on the outer diameter (Fig. 9(a)),t = 5 s on the mean one (Fig. 9(b)),t = 10 s on the intermediate one (Fig. 9(c)) andt = 15 s on the inner one (Fig 9(d)).
ig. 7. Entire disc-track thermogram of pad composite N2 and location of the nineot spots at braking of 2100 rpm, t = 12.5 s.
1: hot-band migration, (e–i) Stage 2: hot-spot expansion; pad material N2, braking
Fluctuations of the maximum luminance temperature appearfor each diameter, lightly and earlier for the outer and the meandiameter (respectively at 3 s in Fig. 9(a), and at 5 s in Fig. 9(b),more significantly and later for the intermediate and inner diam-eter (around 8 s in Fig. 9(c and d)). These fluctuations are sign ofcircumferential thermal gradients on the disc-track. Fluctuationappearance corresponds to the progressive formation of thermalgradients in the hot band during its migration. On Fig. 9(c and d),increase in fluctuation is linked with peaks and corresponds to theformation of the hot spots in the hot band, while their decreaseuntil braking ended refers to the progressive temperature homog-enization of the disc-track. On the intermediate diameter (Fig. 9c),the step visible around 15 s, with high fluctuations, has to be relatedto the expansion of hot spots.
It has to be noted that luminance fluctuations are visible dueto the non-homogeneity of hot spots, namely due to the disc-trackinitial flatness. Indeed, nine perfect and identical hot spots wouldhave led to the same maximum luminance temperature whatever
Fig. 8. Location of the 4 arcs used to analyse luminance evolution of thermogramsalong the disc-track.
1478 D.K. Kolluri et al. / Wear 268 (2010) 1472–1482
F (a) oua
to
rpmefdoNdm
TR
ig. 9. Evolutions of maximum luminance temperature per eighth of disc-track ont 2100 rpm.
he eight of the track observed, that mean without any fluctuationf this temperature.
From this analysis and considering luminance temperatureeached on the friction track, it can be concluded that hot-spothenomenon is more severe than hot-band migration, the maxi-um luminance temperature been reached at 15 s during hot-spot
xpansion. Nevertheless, luminance temperature refers to the sur-ace temperature of a black body (emissivity equal to 1). As
isc-track emissivity is lower than 1, luminance temperature givesnly a poor estimation that underestimates surface temperature.ext section gives the results obtained with thermocouples forisc and pad mass temperatures, compared to optical pyrometereasurement.able 4esults of hot-spot appearance for all composites.
Properties Designation of
N1
Stop-braking initial rotation speed (rpm) 2200Number of hot spots formed on the track 7Initial disc-track circumferential flatness (�m) 35
Maximum mass temperatures (◦C) (by thermocouple on mean radius at 2 mm in deep)Pad temperature 179Disc temperature 232
Maximum disc-track temperatures Tmax (◦C) (infrared camera ε = 0.3)Outer diameter 235Mean diameter 280Intermediate diameter 300Inner diameter 330
ter, (b) mean, (c) intermediate and (d) inner diameter of pad material N2, braking
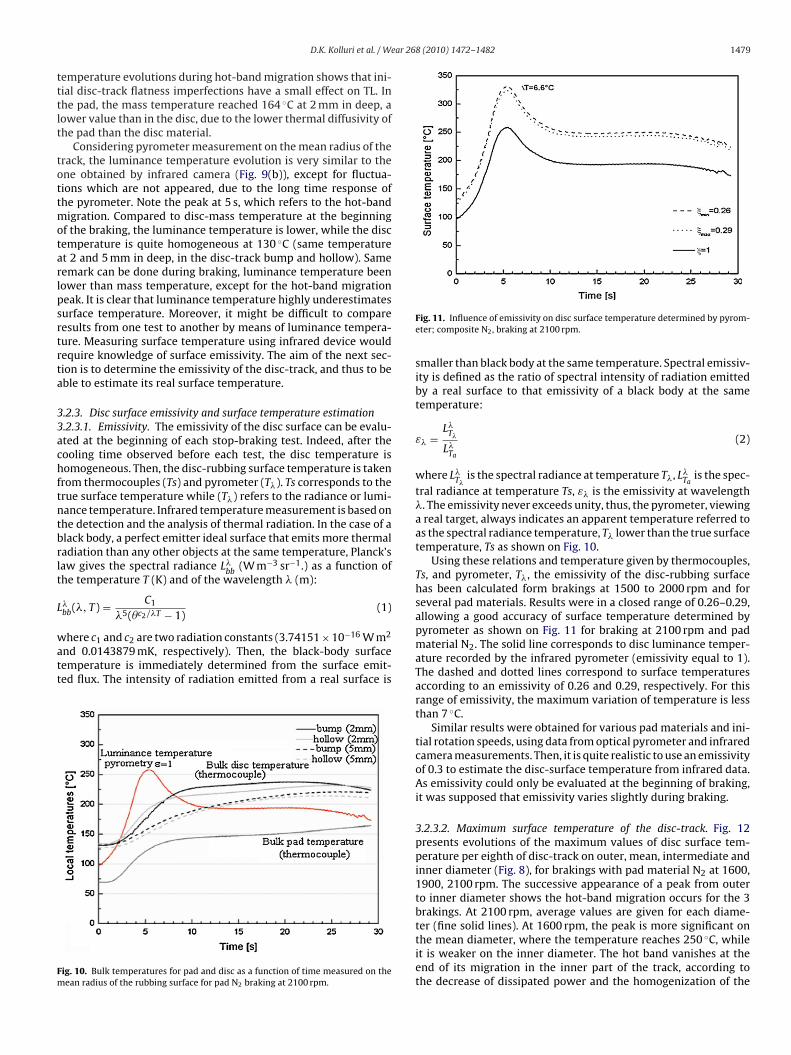
3.2.2. Pad and disc-mass temperaturesFig. 10 shows pad and disc-mass temperatures versus time mea-
sured on the mean radius of the rubbing surface for braking at2100 rpm. Straight lines refer to measurement at 2 mm in deepwhile dashed lines refer to measurement at 5 mm. For the pad, ther-mocouple is located at the center of the rubbing surface. For thedisc, measurements are located in the bump (in black) and in thehollow (in grey) of the track. The luminance temperature measured
using optical pyrometer on the mean radius of the track is given forcomparison. Disc-mass temperature is quite homogeneous at thestart of the braking, and then increases more quickly near the sur-face than in deep. It reaches a maximum value of 238 ◦C at 2 mm indeep at the bump. The slight difference between bump and hollowthe composites
N2 N3 N4
2100 1600 20009 7 9
10 25 15
164 130 160238 179 220
270 200 190320 235 270330 230 340350 220 360
ear 268 (2010) 1472–1482 1479
tttlt
tottmotarlpsrtrta
33achftntbrlt
L
watt
Fm
D.K. Kolluri et al. / W
emperature evolutions during hot-band migration shows that ini-ial disc-track flatness imperfections have a small effect on TL. Inhe pad, the mass temperature reached 164 ◦C at 2 mm in deep, aower value than in the disc, due to the lower thermal diffusivity ofhe pad than the disc material.
Considering pyrometer measurement on the mean radius of therack, the luminance temperature evolution is very similar to thene obtained by infrared camera (Fig. 9(b)), except for fluctua-ions which are not appeared, due to the long time response ofhe pyrometer. Note the peak at 5 s, which refers to the hot-band
igration. Compared to disc-mass temperature at the beginningf the braking, the luminance temperature is lower, while the discemperature is quite homogeneous at 130 ◦C (same temperaturet 2 and 5 mm in deep, in the disc-track bump and hollow). Sameemark can be done during braking, luminance temperature beenower than mass temperature, except for the hot-band migrationeak. It is clear that luminance temperature highly underestimatesurface temperature. Moreover, it might be difficult to compareesults from one test to another by means of luminance tempera-ure. Measuring surface temperature using infrared device wouldequire knowledge of surface emissivity. The aim of the next sec-ion is to determine the emissivity of the disc-track, and thus to beble to estimate its real surface temperature.
.2.3. Disc surface emissivity and surface temperature estimation
.2.3.1. Emissivity. The emissivity of the disc surface can be evalu-ted at the beginning of each stop-braking test. Indeed, after theooling time observed before each test, the disc temperature isomogeneous. Then, the disc-rubbing surface temperature is taken
rom thermocouples (Ts) and pyrometer (T�). Ts corresponds to therue surface temperature while (T�) refers to the radiance or lumi-ance temperature. Infrared temperature measurement is based onhe detection and the analysis of thermal radiation. In the case of alack body, a perfect emitter ideal surface that emits more thermaladiation than any other objects at the same temperature, Planck’saw gives the spectral radiance L�
bb(W m−3 sr−1.) as a function of
he temperature T (K) and of the wavelength � (m):
�bb(�, T) = C1
�5(�c2/�T − 1)(1)
here c1 and c2 are two radiation constants (3.74151 × 10⁻¹⁶ W m2
nd 0.0143879 mK, respectively). Then, the black-body surfaceemperature is immediately determined from the surface emit-ed flux. The intensity of radiation emitted from a real surface is
ig. 10. Bulk temperatures for pad and disc as a function of time measured on theean radius of the rubbing surface for pad N2 braking at 2100 rpm.
Fig. 11. Influence of emissivity on disc surface temperature determined by pyrom-eter; composite N2, braking at 2100 rpm.
smaller than black body at the same temperature. Spectral emissiv-ity is defined as the ratio of spectral intensity of radiation emittedby a real surface to that emissivity of a black body at the sametemperature:
ε� =L�
T�
L�Ta
(2)
where L�T�
is the spectral radiance at temperature T�, L�Ta
is the spec-tral radiance at temperature Ts, ε� is the emissivity at wavelength�. The emissivity never exceeds unity, thus, the pyrometer, viewinga real target, always indicates an apparent temperature referred toas the spectral radiance temperature, T� lower than the true surfacetemperature, Ts as shown on Fig. 10.
Using these relations and temperature given by thermocouples,Ts, and pyrometer, T�, the emissivity of the disc-rubbing surfacehas been calculated form brakings at 1500 to 2000 rpm and forseveral pad materials. Results were in a closed range of 0.26–0.29,allowing a good accuracy of surface temperature determined bypyrometer as shown on Fig. 11 for braking at 2100 rpm and padmaterial N2. The solid line corresponds to disc luminance temper-ature recorded by the infrared pyrometer (emissivity equal to 1).The dashed and dotted lines correspond to surface temperaturesaccording to an emissivity of 0.26 and 0.29, respectively. For thisrange of emissivity, the maximum variation of temperature is lessthan 7 ◦C.
Similar results were obtained for various pad materials and ini-tial rotation speeds, using data from optical pyrometer and infraredcamera measurements. Then, it is quite realistic to use an emissivityof 0.3 to estimate the disc-surface temperature from infrared data.As emissivity could only be evaluated at the beginning of braking,it was supposed that emissivity varies slightly during braking.
3.2.3.2. Maximum surface temperature of the disc-track. Fig. 12presents evolutions of the maximum values of disc surface tem-perature per eighth of disc-track on outer, mean, intermediate andinner diameter (Fig. 8), for brakings with pad material N2 at 1600,1900, 2100 rpm. The successive appearance of a peak from outerto inner diameter shows the hot-band migration occurs for the 3brakings. At 2100 rpm, average values are given for each diame-
ter (fine solid lines). At 1600 rpm, the peak is more significant onthe mean diameter, where the temperature reaches 250 ◦C, whileit is weaker on the inner diameter. The hot band vanishes at theend of its migration in the inner part of the track, according tothe decrease of dissipated power and the homogenization of the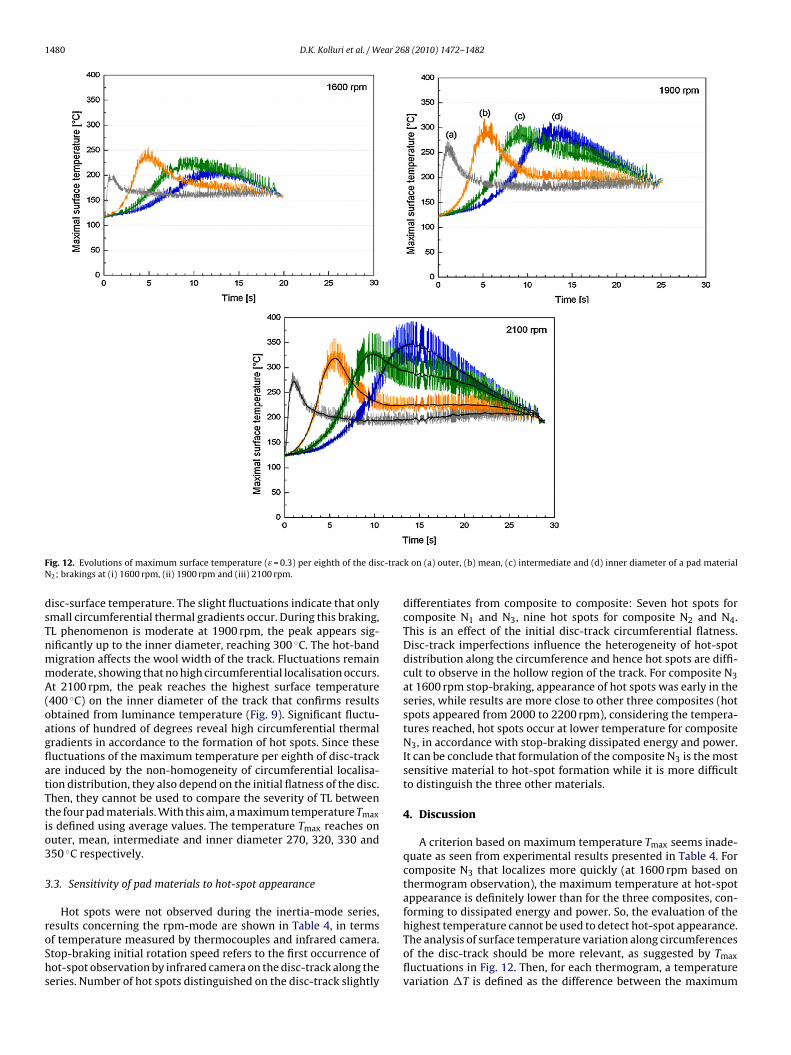
1480 D.K. Kolluri et al. / Wear 268 (2010) 1472–1482
F c-tracN
dsTnmmA(oagflatTtio3
3
roShs
ig. 12. Evolutions of maximum surface temperature (ε = 0.3) per eighth of the dis2; brakings at (i) 1600 rpm, (ii) 1900 rpm and (iii) 2100 rpm.
isc-surface temperature. The slight fluctuations indicate that onlymall circumferential thermal gradients occur. During this braking,L phenomenon is moderate at 1900 rpm, the peak appears sig-ificantly up to the inner diameter, reaching 300 ◦C. The hot-bandigration affects the wool width of the track. Fluctuations remainoderate, showing that no high circumferential localisation occurs.t 2100 rpm, the peak reaches the highest surface temperature
400 ◦C) on the inner diameter of the track that confirms resultsbtained from luminance temperature (Fig. 9). Significant fluctu-tions of hundred of degrees reveal high circumferential thermalradients in accordance to the formation of hot spots. Since theseuctuations of the maximum temperature per eighth of disc-trackre induced by the non-homogeneity of circumferential localisa-ion distribution, they also depend on the initial flatness of the disc.hen, they cannot be used to compare the severity of TL betweenhe four pad materials. With this aim, a maximum temperature Tmax
s defined using average values. The temperature Tmax reaches onuter, mean, intermediate and inner diameter 270, 320, 330 and50 ◦C respectively.
.3. Sensitivity of pad materials to hot-spot appearance
Hot spots were not observed during the inertia-mode series,
esults concerning the rpm-mode are shown in Table 4, in termsf temperature measured by thermocouples and infrared camera.top-braking initial rotation speed refers to the first occurrence ofot-spot observation by infrared camera on the disc-track along theeries. Number of hot spots distinguished on the disc-track slightlyk on (a) outer, (b) mean, (c) intermediate and (d) inner diameter of a pad material
differentiates from composite to composite: Seven hot spots forcomposite N1 and N3, nine hot spots for composite N2 and N4.This is an effect of the initial disc-track circumferential flatness.Disc-track imperfections influence the heterogeneity of hot-spotdistribution along the circumference and hence hot spots are diffi-cult to observe in the hollow region of the track. For composite N3at 1600 rpm stop-braking, appearance of hot spots was early in theseries, while results are more close to other three composites (hotspots appeared from 2000 to 2200 rpm), considering the tempera-tures reached, hot spots occur at lower temperature for compositeN3, in accordance with stop-braking dissipated energy and power.It can be conclude that formulation of the composite N3 is the mostsensitive material to hot-spot formation while it is more difficultto distinguish the three other materials.
4. Discussion
A criterion based on maximum temperature Tmax seems inade-quate as seen from experimental results presented in Table 4. Forcomposite N3 that localizes more quickly (at 1600 rpm based onthermogram observation), the maximum temperature at hot-spotappearance is definitely lower than for the three composites, con-forming to dissipated energy and power. So, the evaluation of the
highest temperature cannot be used to detect hot-spot appearance.The analysis of surface temperature variation along circumferencesof the disc-track should be more relevant, as suggested by Tmaxfluctuations in Fig. 12. Then, for each thermogram, a temperaturevariation �T is defined as the difference between the maximum
D.K. Kolluri et al. / Wear 26
Fd
sttb(
�
olfimt5thidttctmai
1to
Ff
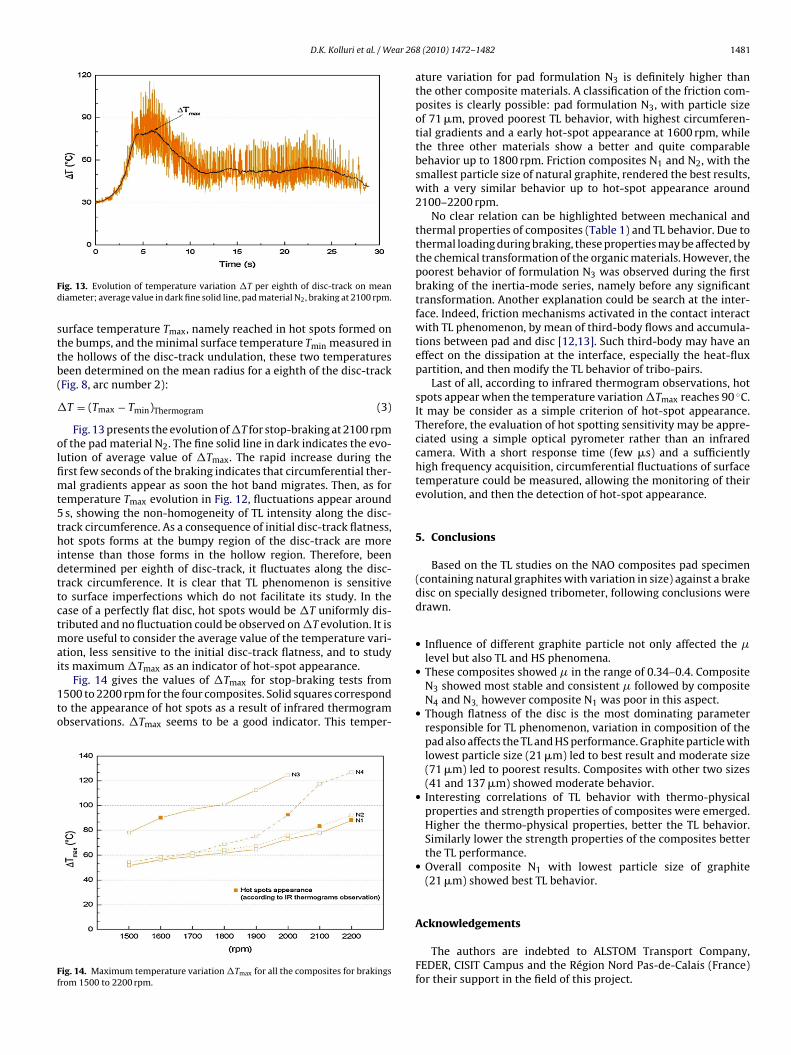
ig. 13. Evolution of temperature variation �T per eighth of disc-track on meaniameter; average value in dark fine solid line, pad material N2, braking at 2100 rpm.
urface temperature Tmax, namely reached in hot spots formed onhe bumps, and the minimal surface temperature Tmin measured inhe hollows of the disc-track undulation, these two temperatureseen determined on the mean radius for a eighth of the disc-trackFig. 8, arc number 2):
T = (Tmax − Tmin)Thermogram (3)
Fig. 13 presents the evolution of �T for stop-braking at 2100 rpmf the pad material N2. The fine solid line in dark indicates the evo-ution of average value of �Tmax. The rapid increase during therst few seconds of the braking indicates that circumferential ther-al gradients appear as soon the hot band migrates. Then, as for
emperature Tmax evolution in Fig. 12, fluctuations appear arounds, showing the non-homogeneity of TL intensity along the disc-
rack circumference. As a consequence of initial disc-track flatness,ot spots forms at the bumpy region of the disc-track are more
ntense than those forms in the hollow region. Therefore, beenetermined per eighth of disc-track, it fluctuates along the disc-rack circumference. It is clear that TL phenomenon is sensitiveo surface imperfections which do not facilitate its study. In thease of a perfectly flat disc, hot spots would be �T uniformly dis-ributed and no fluctuation could be observed on �T evolution. It is
ore useful to consider the average value of the temperature vari-tion, less sensitive to the initial disc-track flatness, and to studyts maximum �T as an indicator of hot-spot appearance.
maxFig. 14 gives the values of �Tmax for stop-braking tests from500 to 2200 rpm for the four composites. Solid squares correspondo the appearance of hot spots as a result of infrared thermogrambservations. �Tmax seems to be a good indicator. This temper-
ig. 14. Maximum temperature variation �Tmax for all the composites for brakingsrom 1500 to 2200 rpm.
8 (2010) 1472–1482 1481
ature variation for pad formulation N3 is definitely higher thanthe other composite materials. A classification of the friction com-posites is clearly possible: pad formulation N3, with particle sizeof 71 �m, proved poorest TL behavior, with highest circumferen-tial gradients and a early hot-spot appearance at 1600 rpm, whilethe three other materials show a better and quite comparablebehavior up to 1800 rpm. Friction composites N1 and N2, with thesmallest particle size of natural graphite, rendered the best results,with a very similar behavior up to hot-spot appearance around2100–2200 rpm.
No clear relation can be highlighted between mechanical andthermal properties of composites (Table 1) and TL behavior. Due tothermal loading during braking, these properties may be affected bythe chemical transformation of the organic materials. However, thepoorest behavior of formulation N3 was observed during the firstbraking of the inertia-mode series, namely before any significanttransformation. Another explanation could be search at the inter-face. Indeed, friction mechanisms activated in the contact interactwith TL phenomenon, by mean of third-body flows and accumula-tions between pad and disc [12,13]. Such third-body may have aneffect on the dissipation at the interface, especially the heat-fluxpartition, and then modify the TL behavior of tribo-pairs.
Last of all, according to infrared thermogram observations, hotspots appear when the temperature variation �Tmax reaches 90 ◦C.It may be consider as a simple criterion of hot-spot appearance.Therefore, the evaluation of hot spotting sensitivity may be appre-ciated using a simple optical pyrometer rather than an infraredcamera. With a short response time (few �s) and a sufficientlyhigh frequency acquisition, circumferential fluctuations of surfacetemperature could be measured, allowing the monitoring of theirevolution, and then the detection of hot-spot appearance.
5. Conclusions
Based on the TL studies on the NAO composites pad specimen(containing natural graphites with variation in size) against a brakedisc on specially designed tribometer, following conclusions weredrawn.
• Influence of different graphite particle not only affected the �level but also TL and HS phenomena.
• These composites showed � in the range of 0.34–0.4. CompositeN3 showed most stable and consistent � followed by compositeN4 and N3, however composite N1 was poor in this aspect.
• Though flatness of the disc is the most dominating parameterresponsible for TL phenomenon, variation in composition of thepad also affects the TL and HS performance. Graphite particle withlowest particle size (21 �m) led to best result and moderate size(71 �m) led to poorest results. Composites with other two sizes(41 and 137 �m) showed moderate behavior.
• Interesting correlations of TL behavior with thermo-physicalproperties and strength properties of composites were emerged.Higher the thermo-physical properties, better the TL behavior.Similarly lower the strength properties of the composites betterthe TL performance.
• Overall composite N1 with lowest particle size of graphite(21 �m) showed best TL behavior.
Acknowledgements
The authors are indebted to ALSTOM Transport Company,FEDER, CISIT Campus and the Région Nord Pas-de-Calais (France)for their support in the field of this project.

1 ear 26
R
[
[
482 D.K. Kolluri et al. / W
eferences
[1] D. Chan, G.W. Stachowiak, Review of automotive brake friction materi-als, Proc. Instn. Mech. Engr., Part D: J. Automobile Eng. 218–9 (2004)953–966.
[2] W. Osterle, Ingrid Urban, Third body formation on brake pads and rotors, Tri-bology Int. 39–5 (2006) 401–408.
[3] J.R. Barber, Thermoelastic instabilities in the sliding of conforming solids, Proc.R. Soc. London, A 312 (1969) 381–394.
[4] G. Degallaix, P. Dufrenoy, J. Wong, P. Wicker, F. Bumbieler, Failure mechanismsof TGV brake discs, Key Eng. Mater. 345–346 (2007) 697–700.
[5] A.J. Day, T.P. Newcomb, The dissipation of frictional energy from the interfaceof an annular disc brake, J. Automobile Eng. 198 (1984) 201–209.
[6] A.E. Anderson, R.A. Knapp, Hot spotting in automotive friction systems, Wear135 (1990) 319–337.
[7] S. Panier, P. Dufrenoy, D. Weichert, An experimental investigation of hot spotsin railway disc brakes, Wear 256 (2004) 764–773.
[
[
8 (2010) 1472–1482
[8] R.A. Lamport, V.K. Jain, Effect of Graphite Morphology on Tribological Propertiesof a Disc Brake Lining, in: Proceedings of 11th Annual Advanced CompositesConference & Exposition’95, November, Detroit, MI, 1995.
[9] Y. Desplanques, O. Roussette, G. Degallaix, R. Copin, Y. Berthier, Analysis of tri-bological behavior of pad-disc contact in railway braking. Part 1. Laboratory testdevelopment, compromises between actual and simulated tribological triplets,Wear 262 (2007) 582–591.
10] O. Roussette, Y. Desplanques, G. Degallaix, Thermal representativity of tribolog-ical reduced-scale testing, Comptes Rendus Mécanique 331 (2003) 343–349.
11] S. Panier, P. Dufrénoy, J.-F. Brunel, D. Weichert, Progressive waviness distortion:a new approach of hot spotting in disc brakes, J. Therm. Stresses 28 (2005)
47–62.12] A.-L. Cristol-Bulthé, Y. Desplanques, G. Degallaix, Coupling between frictionphysical mechanisms and transient thermal phenomena involved in pad-disccontact during railway braking, Wear 263 (2007) 1230–1242.
13] D. Majcherczak, P. Dufrenoy, Y. Berthier, Tribological, thermal and mechanicalcoupling aspects of the dry sliding contact, Tribology Int. 40 (2007) 834–843.