Regenerative Braking for Energy Recovering in Diesel ...
16
energies Article Regenerative Braking for Energy Recovering in Diesel-Electric Freight Trains: A Technical and Economic Evaluation Sergio Mayrink Jr. 1 , Janaína G. Oliveira 2,3 , Bruno H. Dias 2, * , Leonardo W. Oliveira 2 , Juan S. Ochoa 3 and Gustavo S. Rosseti 4 1 MRS Logística, Juiz de Fora 36015-000, Brazil; [email protected] 2 Department of Electrical Energy, Federal University of Juiz de Fora (UFJF), Juiz de Fora 36015-000, Brazil; [email protected] (J.G.O.); [email protected] (L.W.O.) 3 Division for Electricity, Uppsala University, 75236 Uppsala, Sweden; [email protected] 4 Federal Institute of Education, Science and Technology of Southeast of Minas Gerais, Santos Dumont 31270-901, MG, Brazil; [email protected] * Correspondence: [email protected]; Tel.: +55-32-21023495-222 Received: 8 January 2020; Accepted: 19 February 2020; Published: 21 February 2020 Abstract: The present work evaluates the application of regenerative braking for energy recovery in diesel-electric freight trains to increase efficiency and to improve decarbonization. The energy from regenerative braking has to be stored onboard when the track is not electrified. Different technologies of energy recovery are presented and discussed. The energy balance of an existing route is presented and simulated for different battery sizes. The analysis is illustrated with experimental data from an important Brazilian railway. Results show that the energy recovery from regenerative brake is a feasible investment and may be recommended to increase the efficiency in transportation and also to improve the low carbon mobility in railway systems. Keywords: regenerative braking; energy storage; railway; economic feasibility 1. Introduction The use of railway systems in the transport sector presents advantages relative to other systems regarding energy efficiency, environmental impact, reliability, security and economic feasibility [1,2]. Railways present some common characteristics. The friction coefficient is very low resulting in low friction. As a result, the track gradient has to be very gentile due to the low friction coefficient. High peak power is demanded during braking and uphill climbing [3], creating big differences between average power and peak power in freight trains considering storage and diesel demand, respectively. New infrastructure comprising electrification, improved operation through the optimization of timetables for maximizing the use of the regenerated energy [4], as well as storage devices [5] are ways of increasing the transport efficiency of a railway system. Regenerative braking is an interesting technology to increase efficiency [6,7], consisting of inverting the propulsion machine functioning mode from motor to generator. It is feasible for locomotives with electric traction motors, both electric and diesel-electric. With the purpose of maximizing the regenerated energy, the Bellman–Ford algorithm has been used in [8] to optimize the braking and speed of a train. The train speed optimization is also proposed in [9] under the point of view of the energy recovered in the braking in different scenarios. Another optimization approach, based on the dual speed curve method, is presented in [1], to determine the effective speed curve for maximizing the energy economy. In [10] the authors present a comparison between different storage configurations in regenerative braking systems of locomotives, in railways Energies 2020, 13, 963; doi:10.3390/en13040963 www.mdpi.com/journal/energies
-
Upload
khangminh22 -
Category
Documents
-
view
0 -
download
0
Transcript of Regenerative Braking for Energy Recovering in Diesel ...

energies
Article
Regenerative Braking for Energy Recovering inDiesel-Electric Freight Trains: A Technical andEconomic Evaluation
Sergio Mayrink Jr. 1, Janaína G. Oliveira 2,3, Bruno H. Dias 2,* , Leonardo W. Oliveira 2,Juan S. Ochoa 3 and Gustavo S. Rosseti 4
1 MRS Logística, Juiz de Fora 36015-000, Brazil; [email protected] Department of Electrical Energy, Federal University of Juiz de Fora (UFJF), Juiz de Fora 36015-000, Brazil;
[email protected] (J.G.O.); [email protected] (L.W.O.)3 Division for Electricity, Uppsala University, 75236 Uppsala, Sweden; [email protected] Federal Institute of Education, Science and Technology of Southeast of Minas Gerais, Santos Dumont
31270-901, MG, Brazil; [email protected]* Correspondence: [email protected]; Tel.: +55-32-21023495-222
Received: 8 January 2020; Accepted: 19 February 2020; Published: 21 February 2020�����������������
Abstract: The present work evaluates the application of regenerative braking for energy recovery indiesel-electric freight trains to increase efficiency and to improve decarbonization. The energy fromregenerative braking has to be stored onboard when the track is not electrified. Different technologiesof energy recovery are presented and discussed. The energy balance of an existing route is presentedand simulated for different battery sizes. The analysis is illustrated with experimental data froman important Brazilian railway. Results show that the energy recovery from regenerative brake is afeasible investment and may be recommended to increase the efficiency in transportation and also toimprove the low carbon mobility in railway systems.
Keywords: regenerative braking; energy storage; railway; economic feasibility
1. Introduction
The use of railway systems in the transport sector presents advantages relative to other systemsregarding energy efficiency, environmental impact, reliability, security and economic feasibility [1,2].Railways present some common characteristics. The friction coefficient is very low resulting in lowfriction. As a result, the track gradient has to be very gentile due to the low friction coefficient. Highpeak power is demanded during braking and uphill climbing [3], creating big differences betweenaverage power and peak power in freight trains considering storage and diesel demand, respectively.
New infrastructure comprising electrification, improved operation through the optimization oftimetables for maximizing the use of the regenerated energy [4], as well as storage devices [5] areways of increasing the transport efficiency of a railway system. Regenerative braking is an interestingtechnology to increase efficiency [6,7], consisting of inverting the propulsion machine functioningmode from motor to generator. It is feasible for locomotives with electric traction motors, both electricand diesel-electric.
With the purpose of maximizing the regenerated energy, the Bellman–Ford algorithm has beenused in [8] to optimize the braking and speed of a train. The train speed optimization is also proposedin [9] under the point of view of the energy recovered in the braking in different scenarios. Anotheroptimization approach, based on the dual speed curve method, is presented in [1], to determine theeffective speed curve for maximizing the energy economy. In [10] the authors present a comparisonbetween different storage configurations in regenerative braking systems of locomotives, in railways
Energies 2020, 13, 963; doi:10.3390/en13040963 www.mdpi.com/journal/energies
Energies 2020, 13, 963 2 of 16
electrified by a micro DC network connected to the electrical network by a unidirectional substation.The referred work proposes a braking system with a control algorithm that considers the mass variationand the resistances that participate in the breaking, pointing out the off-board system as the moreinteresting in the considered condition.
Research on advantages and drawbacks of different technologies applied to regenerative brakingof locomotives can also be found in the literature. Recent applications of systems with batteries,flywheels, capacitors, and hybrid devices are described in [11]. Information on specific capacity ofpermanent and temporary batteries for saving energy is given in [12]. Data on energy density, lifetimeand operating temperature of batteries, in turn, are presented in [13]. A review of technologies for themanagement of regenerative braking energy is made in [2], which comprises reversible substations andtariff scenarios. Ultracapacitors are considered in [14], for a hierarchical control strategy that consists ofenergy management and converter control layers in urban railway, as well as in [15], through practicalexamples of eco-friendly solutions implementation in urban municipal transport.
The methodology proposed in [13] seeks to determine the sizing of a hybrid energy storagesystem for regenerative braking involving batteries and ultracapacitors. The advantage of the hybridsystem is to combine the energy capacity of the batteries with the power density of ultracapacitors.Electrochemical double-layer capacitors and Li-ion batteries are evaluated as storage options. In [16],a methodology is proposed for optimal operation of railway electric energy systems consideringrenewable energy sources (solar panels and wind turbines), regenerative braking capabilities andhybrid electric energy storage devices (ultracapacitors and batteries). The authors of [17] presented anoptimized sizing and scheduling of hybrid energy storage systems for high-speed railway tractionsubstations integrated with removable energy, with the intention of minimizing the total cost throughoutthe project service period. The battery degradation and replacement cost were taken into account.
On the other hand, the onboard storage is indicated as the most worthwhile option in [18] fordiesel-electric locomotives in non-electrified railways. A small size fuel cell based on a proton exchangemembrane (PEM) is evaluated in [19] for energy management of a train with a focus on the maximumpropulsion system efficiency, considering losses in auxiliary components. The efficiency is assessedboth for individual components and the integrated propulsion system during steady-state and dynamicconditions, under different control strategies. The analysis performed in [20] evaluates the potentialenergy recovery from regenerative braking of diesel-electric locomotives in freight service, by usingand comparing locomotive event recorder data with results obtained from computer simulations.The purpose is the sizing of the storage capacity by carrying out economic and environmental analysesthat consider, among the candidate technologies, batteries, supercapacitors, and flywheels. The contextis near the Brazilian railway scenario. However, the economic feasibility analysis should be updatedregarding technologies and scale gains.
The analysis of energy recovering and storage in locomotives consists of an open and promisingtopic for research, particularly concerning the more suitable alternatives for a given type of system andits interactions [21]. Moreover, most of the studies are devoted to systems for electric locomotives,whereas the number of contributions for diesel-electric locomotives in non-electrified railways is stillrelatively low. Such systems can operate in an independent way, where each train can be considered asa microgrid with onboard generation and consumption.
Following the previously described research line and the relative lack of works for diesel-electriclocomotives in non-electrified railways, the present work seeks to evaluate the application of onboardregenerative braking for energy recovery in freight trains, considering a realistic scenario for a Brazilianrailway system and real technical aspects of the storage devices. The objective is to present an approachto determine the recoverable energy potential from the application of an energy storage system (ESS)and to maximize net present value (NPV).
The paper is outlined as follows. Section 2 introduces the general energy recovery and storagedevices in railway systems. Section 3 details the proposed methodology to estimate the recoverableenergy from regenerative brake systems and also the investment analysis tools used to evaluate the
Energies 2020, 13, 963 3 of 16
ESS. In Section 4, the case study comprising a Brazilian railway is presented as a case study togetherwith the results for this system. Finally, conclusions are drawn in Section 5.
2. Energy Recovery in Railway Systems
Different technologies and interdependencies between subsystems, like vehicles, operation, andinfrastructure have been investigated for regenerative braking [22–25].
Energy recovered from regenerative braking can be stored onboard or injected to the grid throughthe catenary. The power injected in the catenary can be returned to the grid only if the railwaysubstation is prepared for bidirectional operation. Railway substations are usually not bidirectional, sothe recovered energy has to be used either by another train running in the same line, stored locally atthe substation, or dissipated in resistance [26]. Diesel-electric trains are not connected to a catenaryto return the regenerative braking energy and have to dissipate the braking energy in resistances.The only options to recover the energy are either to use it in onboard consuming systems or to storeit, also onboard. On-board storage systems offer the advantage of reducing the energy consumption,however, they add larger weight for the train with its related energy demand, as well as an increase incost and maintenance requirements [7,27]. There are only two alternatives for regenerative braking fortrains not connected to a catenary. The train can either have an ESS that can store the energy for longdrive cycles or connecting points may be installed along the line at planned stops and reduce the sizeof the energy storage [15].
Storage Devices
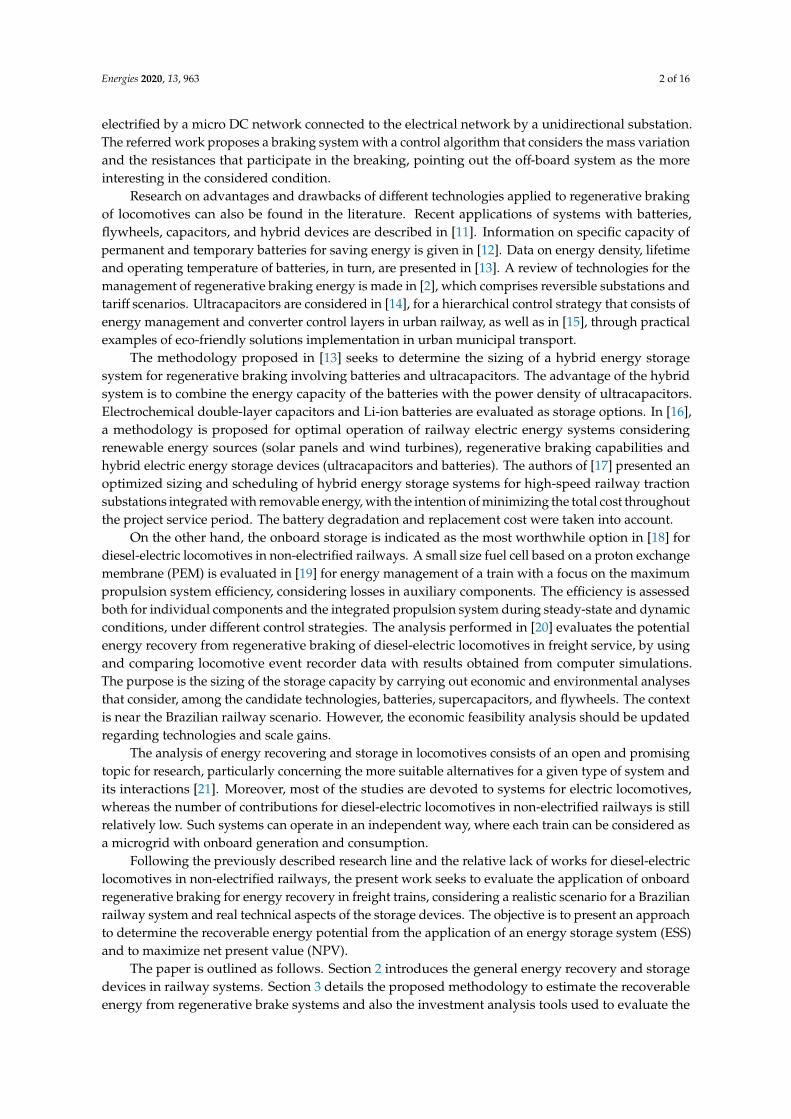
Different kinds of ESS are available and they are generally classified based on the kind of energyin use: electrochemical, electrical, mechanical, chemical, or thermal. Some examples are depicted inFigure 1.
Energies 2020, 12, x FOR PEER REVIEW 3 of 17
ESS. In Section 4, the case study comprising a Brazilian railway is presented as a case study together
with the results for this system. Finally, conclusions are drawn in Section 5.
2. Energy Recovery in Railway Systems
Different technologies and interdependencies between subsystems, like vehicles, operation, and
infrastructure have been investigated for regenerative braking [22–25].
Energy recovered from regenerative braking can be stored onboard or injected to the grid
through the catenary. The power injected in the catenary can be returned to the grid only if the
railway substation is prepared for bidirectional operation. Railway substations are usually not
bidirectional, so the recovered energy has to be used either by another train running in the same line,
stored locally at the substation, or dissipated in resistance [26]. Diesel-electric trains are not connected
to a catenary to return the regenerative braking energy and have to dissipate the braking energy in
resistances. The only options to recover the energy are either to use it in onboard consuming systems
or to store it, also onboard. On-board storage systems offer the advantage of reducing the energy
consumption, however, they add larger weight for the train with its related energy demand, as well
as an increase in cost and maintenance requirements [7,27]. There are only two alternatives for
regenerative braking for trains not connected to a catenary. The train can either have an ESS that can
store the energy for long drive cycles or connecting points may be installed along the line at planned
stops and reduce the size of the energy storage [15].
Storage Devices
Different kinds of ESS are available and they are generally classified based on the kind of energy
in use: electrochemical, electrical, mechanical, chemical, or thermal. Some examples are depicted in
Figure 1.
Figure 1. Classification of storage systems (adapted from [28]).
The most adequate storage device can be determined by the system main characteristics, such
as specific energy (Wh/kg), specific power (W/kg), and charge/discharge cycle duration, among
others [29]. The main alternatives to be used in the energy recovery from regenerative braking are
batteries [30,31], supercapacitors [32,33], and flywheels [34,35]. Among them, the batteries are the
most adequate for freight trains [36].
The main advantages of the batteries are reliability, low maintenance, safety, and good energy
density. Additionally, as an advantage, it presents a wide range of sizes, values of the nominal power,
voltages, and configurations. On the other hand, batteries are still a high-cost solution, with a low
power density (thus presenting high weights in some applications). In addition, a drawback is the
use of materials that can harm the environment and a short lifespan [37].
3. Methodology
This section presents the energy balance related to the movements of trains. Thus, a method to
estimate the potential energy recovery from regenerative braking is presented. Additionally, this
Energy System Storage
Mechanical
• Flywheel
• Hydro pumping
• Compressed air
Thermal
• Heat Pumpers
Chemical
• Fuel Cells
Electrical
• Capacitor
Electrochemical
• Batteries
Figure 1. Classification of storage systems (adapted from [28]).
The most adequate storage device can be determined by the system main characteristics, such asspecific energy (Wh/kg), specific power (W/kg), and charge/discharge cycle duration, among others [29].The main alternatives to be used in the energy recovery from regenerative braking are batteries [30,31],supercapacitors [32,33], and flywheels [34,35]. Among them, the batteries are the most adequate forfreight trains [36].
The main advantages of the batteries are reliability, low maintenance, safety, and good energydensity. Additionally, as an advantage, it presents a wide range of sizes, values of the nominal power,voltages, and configurations. On the other hand, batteries are still a high-cost solution, with a lowpower density (thus presenting high weights in some applications). In addition, a drawback is the useof materials that can harm the environment and a short lifespan [37].
Energies 2020, 13, 963 4 of 16
3. Methodology
This section presents the energy balance related to the movements of trains. Thus, a methodto estimate the potential energy recovery from regenerative braking is presented. Additionally, thissection shows the choice and sizing of the storage device, as well as the economic analysis used tochoose the best option.
3.1. Energy Balance—Train Movement
There are a number of forces involved in the train’s drive cycle. The forces are grouped in thethrust, as the positive thrust of brake force (Wmot/brake), the friction forces (W f riction) representing powerlosses, and the railway profile, descending or ascending, representing the weight component parallelto the ground that contributes to the gain or loss of potential energy (Wgravity). The force balance ispresented in Equation (1) gives the exceeding force that contributes to the train’s acceleration.
Facceleration = M·Wacceleration = Fmot/brake − F f riction ± Fgravity (1)
Each term of Equation (1) will be detailed.
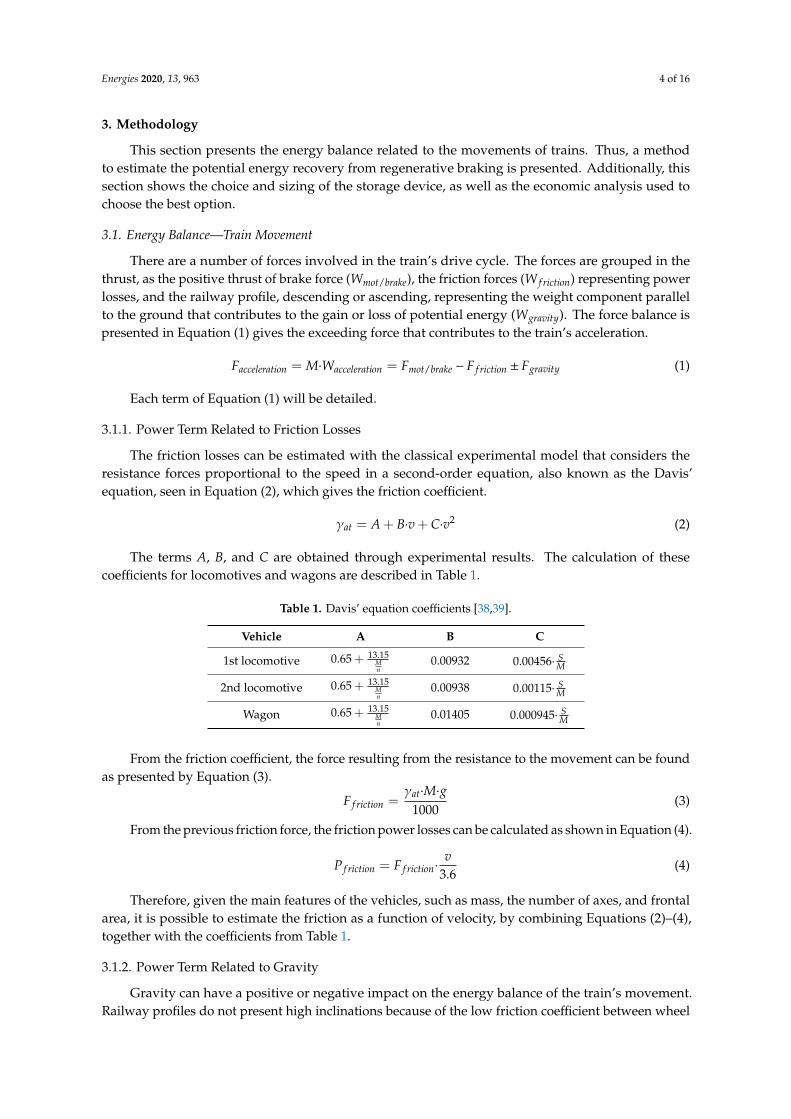
3.1.1. Power Term Related to Friction Losses
The friction losses can be estimated with the classical experimental model that considers theresistance forces proportional to the speed in a second-order equation, also known as the Davis’equation, seen in Equation (2), which gives the friction coefficient.
γat = A + B·v + C·v2 (2)
The terms A, B, and C are obtained through experimental results. The calculation of thesecoefficients for locomotives and wagons are described in Table 1.
Table 1. Davis’ equation coefficients [38,39].
Vehicle A B C
1st locomotive 0.65 + 13.15Mn
0.00932 0.00456· SM
2nd locomotive 0.65 + 13.15Mn
0.00938 0.00115· SM
Wagon 0.65 + 13.15Mn
0.01405 0.000945· SM
From the friction coefficient, the force resulting from the resistance to the movement can be foundas presented by Equation (3).
F f riction =γat·M·g
1000(3)
From the previous friction force, the friction power losses can be calculated as shown in Equation (4).
P f riction = F f riction·v
3.6(4)
Therefore, given the main features of the vehicles, such as mass, the number of axes, and frontalarea, it is possible to estimate the friction as a function of velocity, by combining Equations (2)–(4),together with the coefficients from Table 1.
3.1.2. Power Term Related to Gravity
Gravity can have a positive or negative impact on the energy balance of the train’s movement.Railway profiles do not present high inclinations because of the low friction coefficient between wheel
Energies 2020, 13, 963 5 of 16
and rail. Those inclinations are represented as a percentage value. For example, a ramp has 1%inclination if it presents a vertical variation of 1 m for 100 m of horizontal movement. That is, thetangent of the inclination angle is 0.01.
The necessary power for the train to climb a ramp can be described as presented in Equation (5).
Pgravity = Fgravity·v =Mtrain·g·tan(α)·v
3.6(5)
3.1.3. Power Term Related to the Motor or Brakes
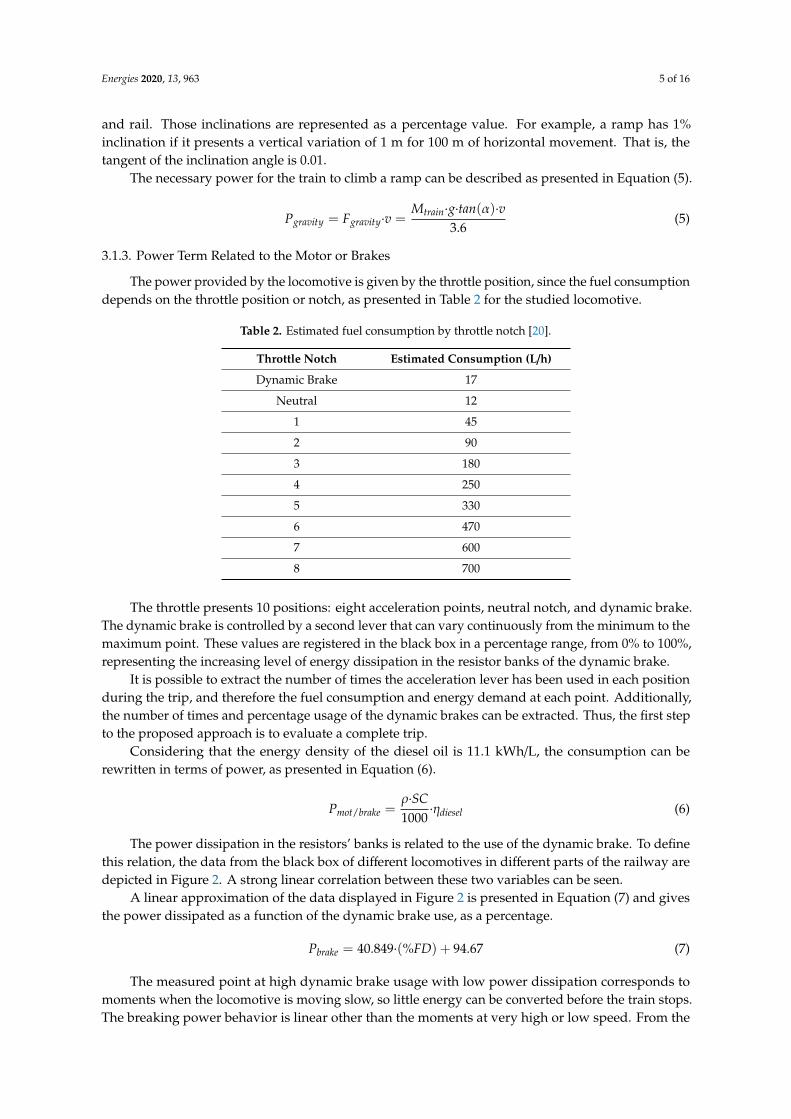
The power provided by the locomotive is given by the throttle position, since the fuel consumptiondepends on the throttle position or notch, as presented in Table 2 for the studied locomotive.
Table 2. Estimated fuel consumption by throttle notch [20].
Throttle Notch Estimated Consumption (L/h)
Dynamic Brake 17
Neutral 12
1 45
2 90
3 180
4 250
5 330
6 470
7 600
8 700
The throttle presents 10 positions: eight acceleration points, neutral notch, and dynamic brake.The dynamic brake is controlled by a second lever that can vary continuously from the minimum to themaximum point. These values are registered in the black box in a percentage range, from 0% to 100%,representing the increasing level of energy dissipation in the resistor banks of the dynamic brake.
It is possible to extract the number of times the acceleration lever has been used in each positionduring the trip, and therefore the fuel consumption and energy demand at each point. Additionally,the number of times and percentage usage of the dynamic brakes can be extracted. Thus, the first stepto the proposed approach is to evaluate a complete trip.
Considering that the energy density of the diesel oil is 11.1 kWh/L, the consumption can berewritten in terms of power, as presented in Equation (6).
Pmot/brake =ρ·SC1000
·ηdiesel (6)
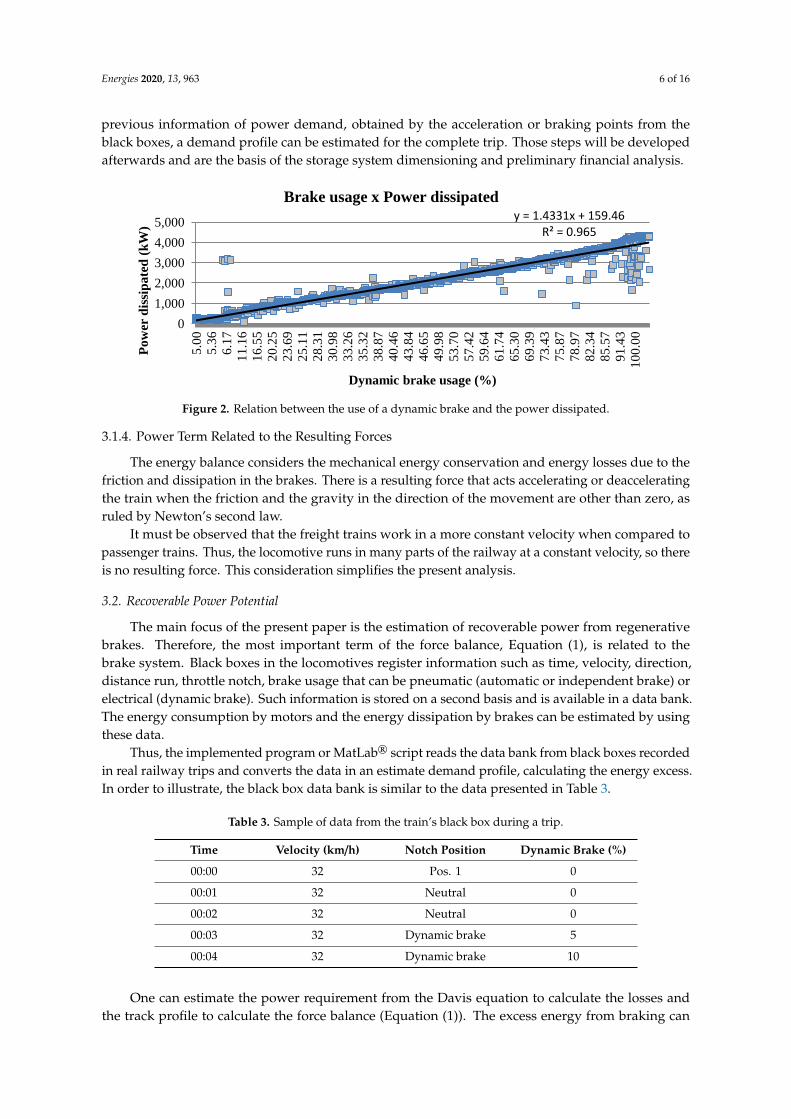
The power dissipation in the resistors’ banks is related to the use of the dynamic brake. To definethis relation, the data from the black box of different locomotives in different parts of the railway aredepicted in Figure 2. A strong linear correlation between these two variables can be seen.
A linear approximation of the data displayed in Figure 2 is presented in Equation (7) and givesthe power dissipated as a function of the dynamic brake use, as a percentage.
Pbrake = 40.849·(%FD) + 94.67 (7)
The measured point at high dynamic brake usage with low power dissipation corresponds tomoments when the locomotive is moving slow, so little energy can be converted before the train stops.The breaking power behavior is linear other than the moments at very high or low speed. From the
Energies 2020, 13, 963 6 of 16
previous information of power demand, obtained by the acceleration or braking points from theblack boxes, a demand profile can be estimated for the complete trip. Those steps will be developedafterwards and are the basis of the storage system dimensioning and preliminary financial analysis.Energies 2020, 12, x FOR PEER REVIEW 6 of 17
Figure 2. Relation between the use of a dynamic brake and the power dissipated.
A linear approximation of the data displayed in Figure 2 is presented in Equation (7) and gives
the power dissipated as a function of the dynamic brake use, as a percentage.
𝑃𝑏𝑟𝑎𝑘𝑒 = 40.849 ∙ (%𝐹𝐷) + 94.67 (7)
The measured point at high dynamic brake usage with low power dissipation corresponds to
moments when the locomotive is moving slow, so little energy can be converted before the train
stops. The breaking power behavior is linear other than the moments at very high or low speed. From
the previous information of power demand, obtained by the acceleration or braking points from the
black boxes, a demand profile can be estimated for the complete trip. Those steps will be developed
afterwards and are the basis of the storage system dimensioning and preliminary financial analysis.
3.1.4. Power Term Related to the Resulting Forces
The energy balance considers the mechanical energy conservation and energy losses due to the
friction and dissipation in the brakes. There is a resulting force that acts accelerating or deaccelerating
the train when the friction and the gravity in the direction of the movement are other than zero, as
ruled by Newton’s second law.
It must be observed that the freight trains work in a more constant velocity when compared to
passenger trains. Thus, the locomotive runs in many parts of the railway at a constant velocity, so
there is no resulting force. This consideration simplifies the present analysis.
3.2. Recoverable Power Potential
The main focus of the present paper is the estimation of recoverable power from regenerative
brakes. Therefore, the most important term of the force balance, Equation (1), is related to the brake
system. Black boxes in the locomotives register information such as time, velocity, direction, distance
run, throttle notch, brake usage that can be pneumatic (automatic or independent brake) or electrical
(dynamic brake). Such information is stored on a second basis and is available in a data bank. The
energy consumption by motors and the energy dissipation by brakes can be estimated by using these
data.
Thus, the implemented program or MatLab® script reads the data bank from black boxes
recorded in real railway trips and converts the data in an estimate demand profile, calculating the
energy excess. In order to illustrate, the black box data bank is similar to the data presented in Table
3.
One can estimate the power requirement from the Davis equation to calculate the losses and the
track profile to calculate the force balance (Equation (1)). The excess energy from braking can be
obtained from the power formulated by Equation (7) together with the data from the black box
presented in Table 3, second by second. Thus, it is possible to find the total amount of recoverable
y = 1.4331x + 159.46R² = 0.965
0
1,000
2,000
3,000
4,000
5,000
5.0
0
5.3
6
6.1
7
11
.16
16
.55
20
.25
23
.69
25
.11
28
.31
30
.98
33
.26
35
.32
38
.87
40
.46
43
.84
46
.65
49
.98
53
.70
57
.42
59
.64
61
.74
65
.30
69
.39
73
.43
75
.87
78
.97
82
.34
85
.57
91
.43
10
0.0
0
Po
wer
dis
sip
ate
d (
kW
)
Dynamic brake usage (%)
Brake usage x Power dissipated
Figure 2. Relation between the use of a dynamic brake and the power dissipated.
3.1.4. Power Term Related to the Resulting Forces
The energy balance considers the mechanical energy conservation and energy losses due to thefriction and dissipation in the brakes. There is a resulting force that acts accelerating or deacceleratingthe train when the friction and the gravity in the direction of the movement are other than zero, asruled by Newton’s second law.
It must be observed that the freight trains work in a more constant velocity when compared topassenger trains. Thus, the locomotive runs in many parts of the railway at a constant velocity, so thereis no resulting force. This consideration simplifies the present analysis.
3.2. Recoverable Power Potential
The main focus of the present paper is the estimation of recoverable power from regenerativebrakes. Therefore, the most important term of the force balance, Equation (1), is related to thebrake system. Black boxes in the locomotives register information such as time, velocity, direction,distance run, throttle notch, brake usage that can be pneumatic (automatic or independent brake) orelectrical (dynamic brake). Such information is stored on a second basis and is available in a data bank.The energy consumption by motors and the energy dissipation by brakes can be estimated by usingthese data.
Thus, the implemented program or MatLab® script reads the data bank from black boxes recordedin real railway trips and converts the data in an estimate demand profile, calculating the energy excess.In order to illustrate, the black box data bank is similar to the data presented in Table 3.
Table 3. Sample of data from the train’s black box during a trip.
Time Velocity (km/h) Notch Position Dynamic Brake (%)
00:00 32 Pos. 1 0
00:01 32 Neutral 0
00:02 32 Neutral 0
00:03 32 Dynamic brake 5
00:04 32 Dynamic brake 10
One can estimate the power requirement from the Davis equation to calculate the losses andthe track profile to calculate the force balance (Equation (1)). The excess energy from braking can
Energies 2020, 13, 963 7 of 16
be obtained from the power formulated by Equation (7) together with the data from the black boxpresented in Table 3, second by second. Thus, it is possible to find the total amount of recoverableenergy from the system. Based on this information, the optimal size of a storage system can bedetermined, based on storage systems characteristics.
3.3. Determining the Size of the Energy Storage
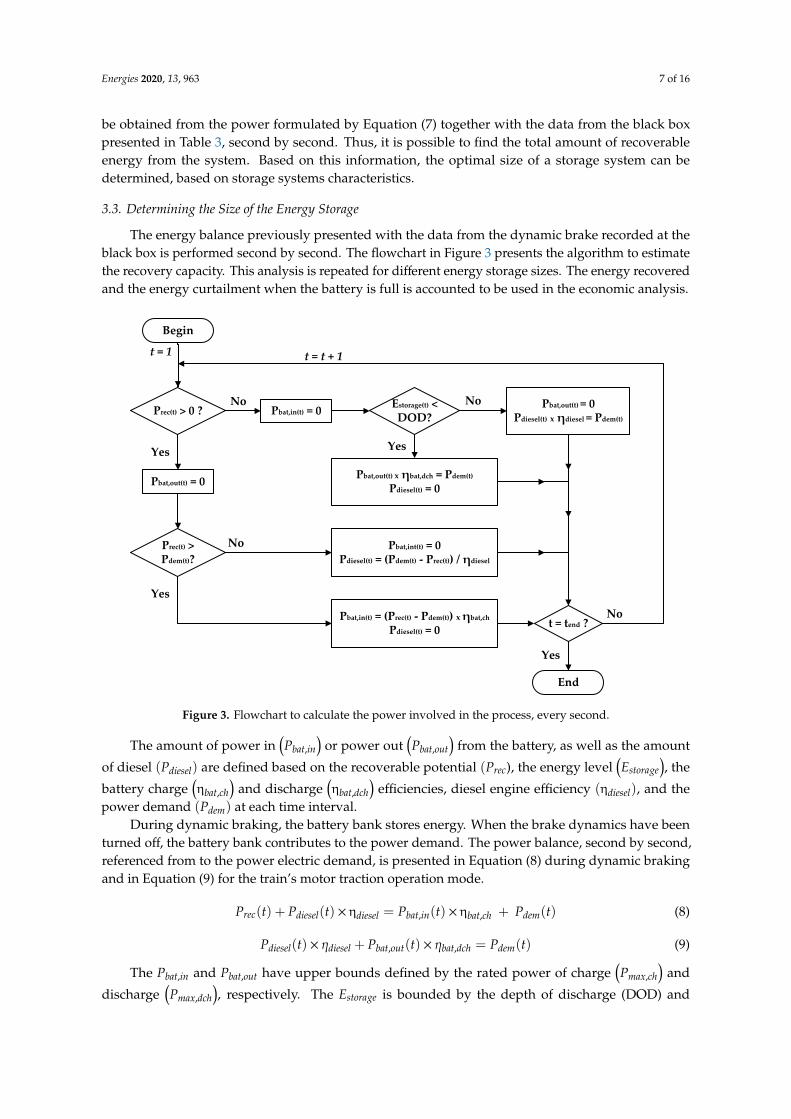
The energy balance previously presented with the data from the dynamic brake recorded at theblack box is performed second by second. The flowchart in Figure 3 presents the algorithm to estimatethe recovery capacity. This analysis is repeated for different energy storage sizes. The energy recoveredand the energy curtailment when the battery is full is accounted to be used in the economic analysis.
Energies 2020, 12, x FOR PEER REVIEW 7 of 17
energy from the system. Based on this information, the optimal size of a storage system can be
determined, based on storage systems characteristics.
Table 3. Sample of data from the train’s black box during a trip.
Time Velocity (km/h) Notch Position Dynamic Brake (%)
00:00 32 Pos. 1 0
00:01 32 Neutral 0
00:02 32 Neutral 0
00:03 32 Dynamic brake 5
00:04 32 Dynamic brake 10
3.3. Determining the Size of the Energy Storage
The energy balance previously presented with the data from the dynamic brake recorded at the
black box is performed second by second. The flowchart in Figure 3 presents the algorithm to estimate
the recovery capacity. This analysis is repeated for different energy storage sizes. The energy
recovered and the energy curtailment when the battery is full is accounted to be used in the economic
analysis.
Begin
Prec(t) > 0 ?
Pbat,out(t) = 0
Prec(t) > Pdem(t)?
Pbat,int(t) = 0Pdiesel(t) = (Pdem(t) - Prec(t)) / ηdiesel
Pbat,in(t) = (Prec(t) - Pdem(t)) x ηbat,ch
Pdiesel(t) = 0
Pbat,in(t) = 0Estorage(t) < DOD?
Pbat,out(t) x ηbat,dch = Pdem(t)
Pdiesel(t) = 0
Pbat,out(t) = 0Pdiesel(t) x ηdiesel = Pdem(t)
Yes
Yes
Yes
No No
No
End
t = tend ?
Yes
No
t = t + 1t = 1
Figure 3. Flowchart to calculate the power involved in the process, every second.
The amount of power in (𝑃𝑏𝑎𝑡,𝑖𝑛) or power out (𝑃𝑏𝑎𝑡,𝑜𝑢𝑡) from the battery, as well as the amount
of diesel (𝑃𝑑𝑖𝑒𝑠𝑒𝑙) are defined based on the recoverable potential (𝑃𝑟𝑒𝑐), the energy level (𝐸𝑠𝑡𝑜𝑟𝑎𝑔𝑒), the
battery charge (η𝑏𝑎𝑡,𝑐ℎ) and discharge (η𝑏𝑎𝑡,𝑑𝑐ℎ) efficiencies, diesel engine efficiency (η𝑑𝑖𝑒𝑠𝑒𝑙), and the
power demand (𝑃𝑑𝑒𝑚) at each time interval.
During dynamic braking, the battery bank stores energy. When the brake dynamics have been
turned off, the battery bank contributes to the power demand. The power balance, second by second,
referenced from to the power electric demand, is presented in Equation (8) during dynamic braking
and in Equation (9) for the train’s motor traction operation mode.
Figure 3. Flowchart to calculate the power involved in the process, every second.
The amount of power in(Pbat,in
)or power out
(Pbat,out
)from the battery, as well as the amount
of diesel (Pdiesel) are defined based on the recoverable potential (Prec), the energy level(Estorage
), the
battery charge(ηbat,ch
)and discharge
(ηbat,dch
)efficiencies, diesel engine efficiency (ηdiesel), and the
power demand (Pdem) at each time interval.During dynamic braking, the battery bank stores energy. When the brake dynamics have been
turned off, the battery bank contributes to the power demand. The power balance, second by second,referenced from to the power electric demand, is presented in Equation (8) during dynamic brakingand in Equation (9) for the train’s motor traction operation mode.
Prec(t) + Pdiesel(t) × ηdiesel = Pbat,in(t) × ηbat,ch + Pdem(t) (8)
Pdiesel(t) × ηdiesel + Pbat,out(t) × ηbat,dch = Pdem(t) (9)
The Pbat,in and Pbat,out have upper bounds defined by the rated power of charge(Pmax,ch
)and
discharge(Pmax,dch
), respectively. The Estorage is bounded by the depth of discharge (DOD) and

Energies 2020, 13, 963 8 of 16
maximum state of charge (SOCmax). If Estorage(t) = SOCmax, Pbat,in(t) = 0, whereas Estorage(t) = DODimplies Pbat,out(t) = 0.
With the power injection or extraction from the ESS, the demand profile is determined in orderto estimate the size of the ESS. By comparing the demand of diesel when considering the ESS andthe regenerative brake with the situation without ESS, one can estimate the financial economy, as thediesel is the only sort of fuel used in this kind of freight train. Thus, the economy is determined fromcomparison involving the integral of the variable Pdiesel in each previous situation.
The maximum values for the power injection (Pbat,in), extraction(Pbat,out
), and energy storage
Estorage must be defined according to the type of ESS under evaluation. A direct way to achievethe optimal size of ESS, whatever kind of technology considered, can be by simulating differentsystem sizes.
Notice either the battery or diesel engine is working at traction stage, i.e., the battery can beconsidered as the primary power supplier compared with diesel engine at this stage, through a systemknown as auto engine start stop (AESS).
3.4. Economic Analysis
In order to properly evaluate the proposed solution, it is necessary to consider economic parametersto guarantee a proper return on the investment for the railway company. Thus, the net present value(NPV) can be considered at first. Additionally, the intern return rate (IRR) and the payback period canbe of interest to companies even considering the drawbacks of the use of both methods [40].
The NPV is a significant parameter for the economic analysis of projects. It seeks to evaluate theviability of a given project and is based on the calculation of the present value of a series of futurepayments, subtracted by the capital expenditures. The NPV equation is represented in Equation (10).
NPV = −CAPEX +k∑
t=1
CFt
(1 + i)t (10)
where CFt is the cash flow of each period t and i is the discount rate considered that depends on therisk of the investment, the company’s opportunity cost, and liquidity. This discount rate is usuallycalled minimum attractive rate of return (MARR) and varies from company to company.
The internal rate of return (IRR) is another important parameter when evaluating a project and isdefined as the rate of return that turns the NPV equal to zero. Thus, IRR represents the rate of returnof a given project and can be compared with the MARR. Given an IRR greater than the MARR, theinvestment is economically attractive [41].
Another general financial index is the payback period, which is the time required to recover thecapital invested. In order to better consider the time value of money, the discounted payback period isused in the present work [42].
Given the technical parameters of the storage device for the energy recovery from the regenerativebrake, it is possible to conduct a preliminary economic analysis of the investment. Therefore, theinvestment analysis indexes are calculated for each proposed size of storage device.
4. Results
4.1. Energy Balance
This present work makes use of data close to a real Brazilian railway, that is, it is based onthe operational data from MRS Logística S/A. In this heavy hull system the trains, when empty, arecomposed of 136 wagons of 20 tons each and two 4400 HP locomotives of 195 tons each, thus 3115 tonsin total. In a full load trip there are three 4400 HP locomotives of 195 tons with 136 wagons of 125 tonseach, thus a total of 17,390 tons.
Energies 2020, 13, 963 9 of 16
From Table 2 and Equation (8), that relates data from locomotives’ black boxes with the diesel oilconsumption, it is possible to define a consumption profile during a trip, based on the railway data.The same procedure can be done with information of power dissipation in dynamic brakes.
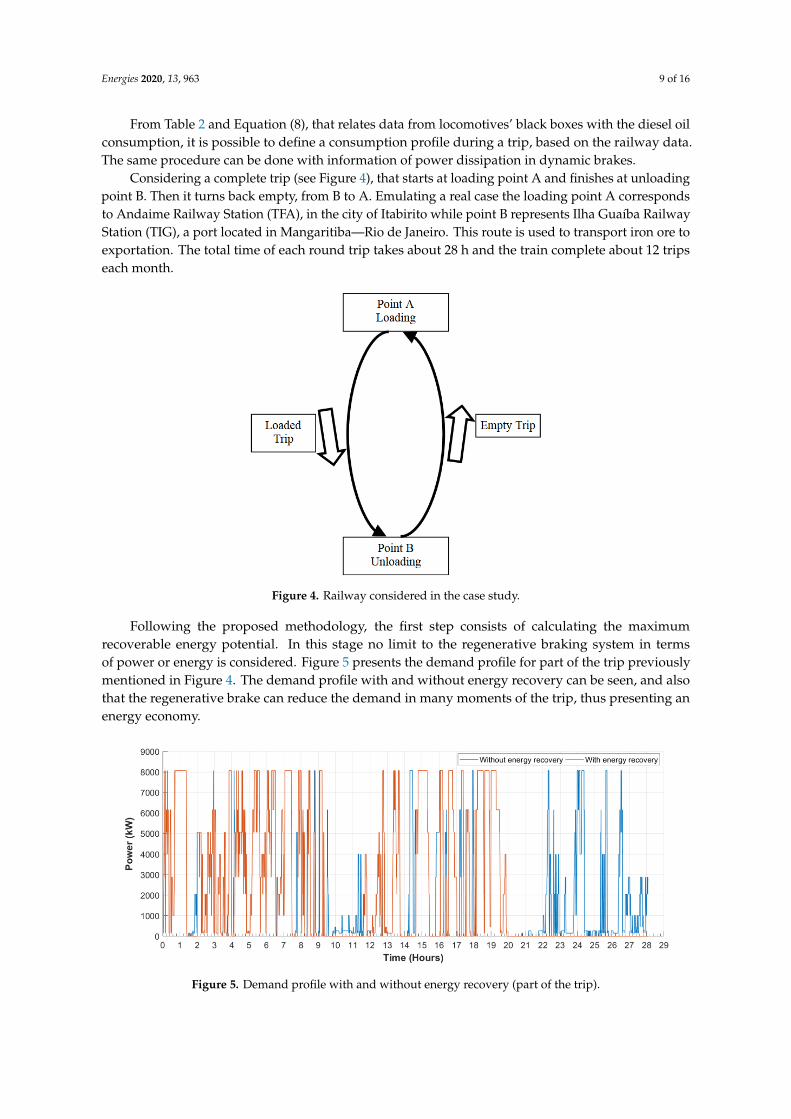
Considering a complete trip (see Figure 4), that starts at loading point A and finishes at unloadingpoint B. Then it turns back empty, from B to A. Emulating a real case the loading point A correspondsto Andaime Railway Station (TFA), in the city of Itabirito while point B represents Ilha Guaíba RailwayStation (TIG), a port located in Mangaritiba—Rio de Janeiro. This route is used to transport iron ore toexportation. The total time of each round trip takes about 28 h and the train complete about 12 tripseach month.
Energies 2020, 12, x FOR PEER REVIEW 9 of 17
This present work makes use of data close to a real Brazilian railway, that is, it is based on the
operational data from MRS Logística S/A. In this heavy hull system the trains, when empty, are
composed of 136 wagons of 20 tons each and two 4400 HP locomotives of 195 tons each, thus 3115
tons in total. In a full load trip there are three 4400 HP locomotives of 195 tons with 136 wagons of
125 tons each, thus a total of 17,390 tons.
From Table 2 and Equation (8), that relates data from locomotives’ black boxes with the diesel
oil consumption, it is possible to define a consumption profile during a trip, based on the railway
data. The same procedure can be done with information of power dissipation in dynamic brakes.
Considering a complete trip (see Figure 4), that starts at loading point A and finishes at
unloading point B. Then it turns back empty, from B to A. Emulating a real case the loading point A
corresponds to Andaime Railway Station (TFA), in the city of Itabirito while point B represents Ilha
Guaíba Railway Station (TIG), a port located in Mangaritiba—Rio de Janeiro. This route is used to
transport iron ore to exportation. The total time of each round trip takes about 28 h and the train
complete about 12 trips each month.
Figure 4. Railway considered in the case study.
Following the proposed methodology, the first step consists of calculating the maximum
recoverable energy potential. In this stage no limit to the regenerative braking system in terms of
power or energy is considered. Figure 5 presents the demand profile for part of the trip previously
mentioned in Figure 4. The demand profile with and without energy recovery can be seen, and also
that the regenerative brake can reduce the demand in many moments of the trip, thus presenting an
energy economy.
Figure 4. Railway considered in the case study.
Following the proposed methodology, the first step consists of calculating the maximumrecoverable energy potential. In this stage no limit to the regenerative braking system in termsof power or energy is considered. Figure 5 presents the demand profile for part of the trip previouslymentioned in Figure 4. The demand profile with and without energy recovery can be seen, and alsothat the regenerative brake can reduce the demand in many moments of the trip, thus presenting anenergy economy.
Energies 2020, 12, x FOR PEER REVIEW 10 of 17
Figure 5. Demand profile with and without energy recovery (part of the trip).
The results considering the whole trip for both cases can be seen in Table 4. Those values give a
first suggestion of the size of the regenerative brake system. A total of 23.87% of the economy can be
seen as part of the energy wasted during braking. There is still the parcel related to the pneumatic
brakes.
Table 4. Recoverable potential without limiting the storage capacity.
Consumption (kWh) Economy (%)
Without energy recovery 78,740.54 -
With energy recovery 59,948.42 23.87%
Figures 6 and 7 present the recovered power and remaining energy in the battery without
considering a power or energy limit to the regenerative braking, that is, all the energy from the brakes
can be recovered.
Figure 6. Recovered power (without limit to the storage size).
Figure 5. Demand profile with and without energy recovery (part of the trip).

Energies 2020, 13, 963 10 of 16
The results considering the whole trip for both cases can be seen in Table 4. Those values give a firstsuggestion of the size of the regenerative brake system. A total of 23.87% of the economy can be seenas part of the energy wasted during braking. There is still the parcel related to the pneumatic brakes.
Table 4. Recoverable potential without limiting the storage capacity.
Consumption (kWh) Economy (%)
Without energy recovery 78,740.54 -
With energy recovery 59,948.42 23.87%
Figures 6 and 7 present the recovered power and remaining energy in the battery withoutconsidering a power or energy limit to the regenerative braking, that is, all the energy from the brakescan be recovered.
Energies 2020, 12, x FOR PEER REVIEW 10 of 17
Figure 5. Demand profile with and without energy recovery (part of the trip).
The results considering the whole trip for both cases can be seen in Table 4. Those values give a
first suggestion of the size of the regenerative brake system. A total of 23.87% of the economy can be
seen as part of the energy wasted during braking. There is still the parcel related to the pneumatic
brakes.
Table 4. Recoverable potential without limiting the storage capacity.
Consumption (kWh) Economy (%)
Without energy recovery 78,740.54 -
With energy recovery 59,948.42 23.87%
Figures 6 and 7 present the recovered power and remaining energy in the battery without
considering a power or energy limit to the regenerative braking, that is, all the energy from the brakes
can be recovered.
Figure 6. Recovered power (without limit to the storage size). Figure 6. Recovered power (without limit to the storage size).Energies 2020, 12, x FOR PEER REVIEW 11 of 17
Figure 7. Remaining energy (without limit to the storage size).
Given the main features of the potential recoverable energy, the next step consists of defining
the kind of storage device will be used in the proposed application. Even more, it can be noted that
the maximum recoverable power and maximum energy level of the storage application are very high,
which means a high investment cost. Thus, it is necessary to consider optimal sizing of the storage
device.
4.2. Optimal Sizing of Energy Storage System
In this work, the authors classified the different types of storage devices according to the energy
capacity and time of discharge. Considering the characteristics of the railway system under study,
the best choice is a battery bank, and the technology selected was Lithium Titanium Oxide (LTO)
[43].
Given the input data, presented in Table 5, the proposed methodology was implemented in
MatLab® considering different energy capacities for the storage system, up to 3000 kWh. Figure 8
shows that the 950 kWh system presents the best result, with an NPV of R$ 1,888,465.24 (or US$
470,938.96) in a 10-year horizon.
Table 5. Input data to model the optimal size of the storage system.
Variable Value Unit Reference
Initial investment 469.00 US$/kWh [44]
Maximum C-rate charge/discharge battery 3C kW [43]
Depth of discharge battery 80 % [43]
State of charge battery range 20–90 % [43]
Efficiency charge/discharge battery 92 % [31]
Efficiency diesel engine 37 % [36]
Lifespan of the battery > 20,000 cycles [43]
Lifespan of the system 10 years
Brazilian Real to US$ exchange rate 4.01 R$/US$ [45]
Fuel cost (diesel oil) 3.69 R$/L [46]
Fuel costs increase rate 8.33 % yearly [46]
Discount rate (in NPV)/MARR 1.5 % monthly [47]
Figure 7. Remaining energy (without limit to the storage size).
Given the main features of the potential recoverable energy, the next step consists of definingthe kind of storage device will be used in the proposed application. Even more, it can be notedthat the maximum recoverable power and maximum energy level of the storage application are veryhigh, which means a high investment cost. Thus, it is necessary to consider optimal sizing of thestorage device.

Energies 2020, 13, 963 11 of 16
4.2. Optimal Sizing of Energy Storage System
In this work, the authors classified the different types of storage devices according to the energycapacity and time of discharge. Considering the characteristics of the railway system under study, thebest choice is a battery bank, and the technology selected was Lithium Titanium Oxide (LTO) [43].
Given the input data, presented in Table 5, the proposed methodology was implemented inMatLab® considering different energy capacities for the storage system, up to 3000 kWh. Figure 8shows that the 950 kWh system presents the best result, with an NPV of R$ 1,888,465.24 (or US$470,938.96) in a 10-year horizon.
Table 5. Input data to model the optimal size of the storage system.
Variable Value Unit Reference
Initial investment 469.00 US$/kWh [44]Maximum C-rate charge/discharge battery 3C kW [43]Depth of discharge battery 80 % [43]State of charge battery range 20–90 % [43]Efficiency charge/discharge battery 92 % [31]Efficiency diesel engine 37 % [36]Lifespan of the battery >20,000 cycles [43]Lifespan of the system 10 yearsBrazilian Real to US$ exchange rate 4.01 R$/US$ [45]Fuel cost (diesel oil) 3.69 R$/L [46]Fuel costs increase rate 8.33 % yearly [46]Discount rate (in NPV)/MARR 1.5 % monthly [47]Energies 2020, 12, x FOR PEER REVIEW 12 of 17
Figure 8. Storage system optimal sizing.
Considering the storage system presented, the recoverable power and the load levels in the
storage system are presented in Figures 9 and 10.
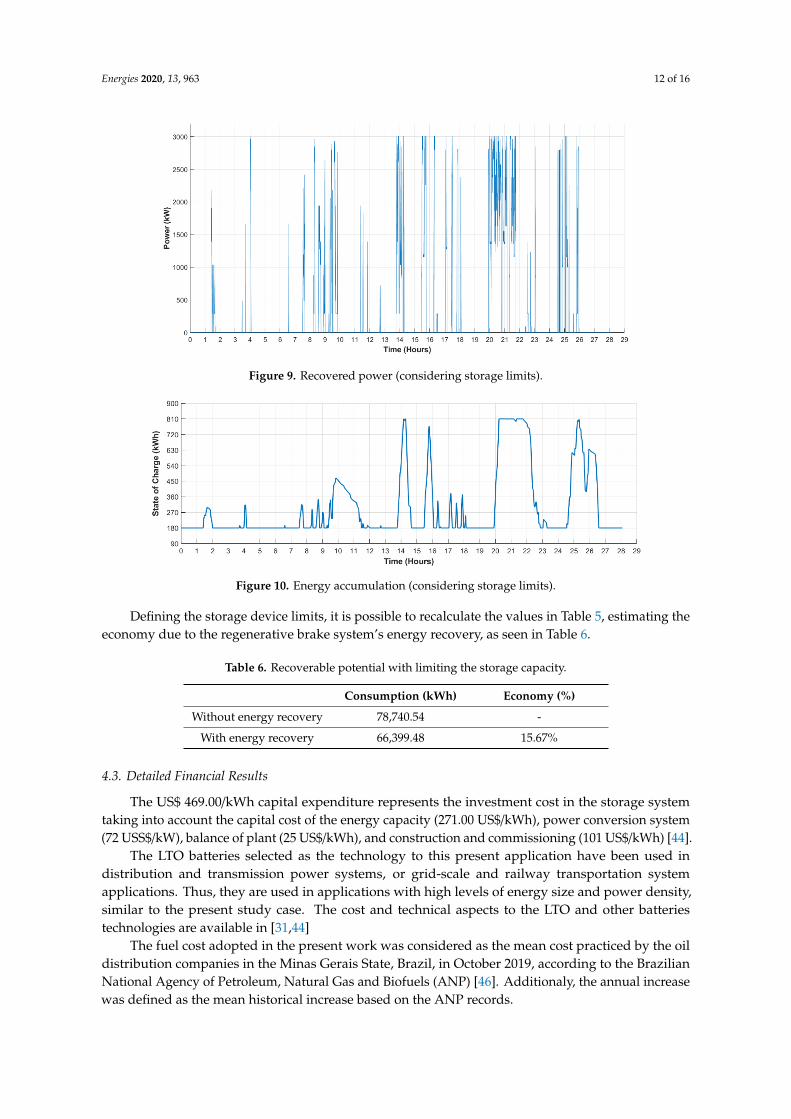
Figure 9. Recovered power (considering storage limits).
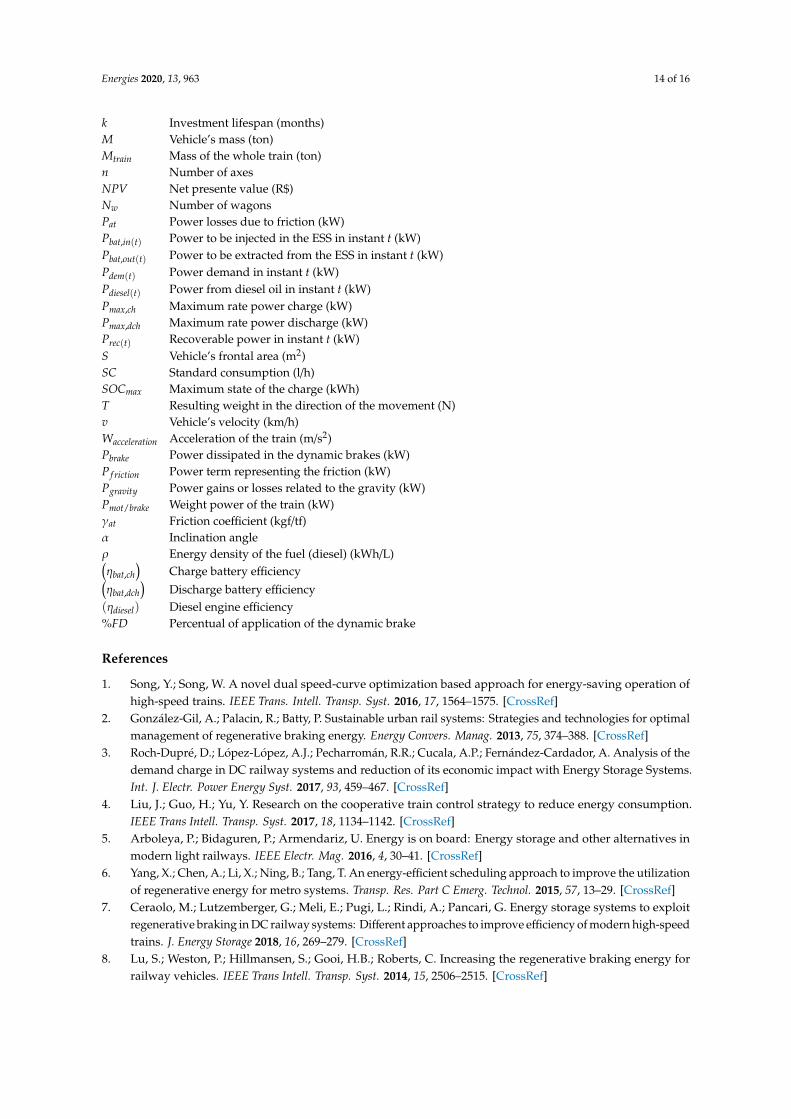
Figure 10. Energy accumulation (considering storage limits).
Defining the storage device limits, it is possible to recalculate the values in Table 5, estimating
the economy due to the regenerative brake system’s energy recovery, as seen in Table 6.
Figure 8. Storage system optimal sizing.
Considering the storage system presented, the recoverable power and the load levels in the storagesystem are presented in Figures 9 and 10.
Energies 2020, 13, 963 12 of 16
Energies 2020, 12, x FOR PEER REVIEW 12 of 17
Figure 8. Storage system optimal sizing.
Considering the storage system presented, the recoverable power and the load levels in the
storage system are presented in Figures 9 and 10.
Figure 9. Recovered power (considering storage limits).
Figure 10. Energy accumulation (considering storage limits).
Defining the storage device limits, it is possible to recalculate the values in Table 5, estimating
the economy due to the regenerative brake system’s energy recovery, as seen in Table 6.
Figure 9. Recovered power (considering storage limits).
Energies 2020, 12, x FOR PEER REVIEW 12 of 17
Figure 8. Storage system optimal sizing.
Considering the storage system presented, the recoverable power and the load levels in the
storage system are presented in Figures 9 and 10.
Figure 9. Recovered power (considering storage limits).
Figure 10. Energy accumulation (considering storage limits).
Defining the storage device limits, it is possible to recalculate the values in Table 5, estimating
the economy due to the regenerative brake system’s energy recovery, as seen in Table 6.
Figure 10. Energy accumulation (considering storage limits).
Defining the storage device limits, it is possible to recalculate the values in Table 5, estimating theeconomy due to the regenerative brake system’s energy recovery, as seen in Table 6.
Table 6. Recoverable potential with limiting the storage capacity.
Consumption (kWh) Economy (%)
Without energy recovery 78,740.54 -
With energy recovery 66,399.48 15.67%
4.3. Detailed Financial Results
The US$ 469.00/kWh capital expenditure represents the investment cost in the storage systemtaking into account the capital cost of the energy capacity (271.00 US$/kWh), power conversion system(72 USS$/kW), balance of plant (25 US$/kWh), and construction and commissioning (101 US$/kWh) [44].
The LTO batteries selected as the technology to this present application have been used indistribution and transmission power systems, or grid-scale and railway transportation systemapplications. Thus, they are used in applications with high levels of energy size and power density,similar to the present study case. The cost and technical aspects to the LTO and other batteriestechnologies are available in [31,44]
The fuel cost adopted in the present work was considered as the mean cost practiced by the oildistribution companies in the Minas Gerais State, Brazil, in October 2019, according to the BrazilianNational Agency of Petroleum, Natural Gas and Biofuels (ANP) [46]. Additionaly, the annual increasewas defined as the mean historical increase based on the ANP records.

Energies 2020, 13, 963 13 of 16
The Brazilian Real to US$ exchange rate was considered on 4 November 2019 [45]. The discountrate used in this paper represents the MARR [47] and is dependent on capital costs of each company.Thus, this rate was defined as an expected return rate found in the market.
This project presents a positive NPV of R$ 1,888,465.24 (or US$ 470,938.96) during the 10-yearlifespan given by the manufacturer. Thus, this is a viable investment according to the chosen MARR.Additionally, this investment presents a payback period of 35 months and a discounted payback periodwith a 1.5% monthly MARR of 43 months.
The intern return rate (IRR) of this investment is 6.2% monthly that can be compared to the MARRof each company, especially railway companies.
5. Conclusions
This paper presented a preliminary analysis of a storage system to recover energy from regenerativebraking considering diesel-electric freight trains in non-electrified railways. The proposed analysisincludes the evaluation of the inherent energy balance involving each term and the information fromthe train black box, after a real trip, which provided a practical evaluation. In this sense, the proposedapproach was applied to real data from MRS Logística S/A, a Brazilian Railway company. The recoverypotential was calculated, then, the optimal size of the storage system was defined based on the NPV.As a preliminary investment analysis study, the results of this paper may help to guide the projectsand also to better define the viability and the execution plan. In a general manner, based on thepositive NPV and a relatively small payback from the obtained result, it can be concluded that theenergy recovery from regenerative braking is a feasible investment and may be highly recommendedwhen dealing with the necessity to increase the efficiency in transportation and also to improve thelow-carbon mobility. Notice that, in the present work, the initial investments already comprise themaintenance and installation of the storage system. Even though, future research could be conductedto define the power electronics costs that must be implemented to process the energy recovery.
Author Contributions: Conceptualization, S.M.J., J.G.O. and B.H.D.; Data curation, S.M.J.; Formal analysis, J.G.O.,B.H.D. and J.S.O.; Funding acquisition, J.S.O.; Investigation, L.W.O., J.S.O. and G.S.R.; Methodology, S.M.J., J.G.O.,B.H.D., J.S.O. and G.S.R.; Software, S.M.J. and G.S.R.; Supervision, J.G.O. and B.H.D.; Validation, S.M.J., J.G.O.,B.H.D., L.W.O. and G.S.R.; Writing—original draft, S.M.J., J.G.O., B.H.D., L.W.O. and J.S.O.; Writing—review andediting, S.M.J., J.Oliveira, B.H.D., L.W.O., J.S.O. and G.S.R. All authors have read and agreed to the publishedversion of the manuscript.
Funding: This research received no external funding.
Acknowledgments: The authors would like to thank the National Council for Scientific and TechnologicalDevelopment—CNPq, the Coordenação de Aperfeiçoamento de Pessoal de Nível Superior-CAPES, the State ofMinas Gerais Research Foundation—FAPEMIG and INERGE for their financial and/or technical support in thedevelopment of this paper. This work was conducted within the STandUP for Energy strategic research framework.
Conflicts of Interest: The authors declare no conflict of interest.
Nomenclature
A Resistance coefficient due to the wheel-rail friction (kgf/tf)B Resistance coefficient due to the bearings’ friction (kgf.h/tf.km)C Resistance coefficient due to the air friction (kgf.h2/tf.km)CAPEX Initial investiment (R$)CFt Cash flow in period t (R$)DOD Depth of the discharge (kWh)Estorage(t) Stored energy in instant t (kWh)Fat Friction force (kN)F f riction Force resulting from the resistance to the movement (kN)Fgravity Force related to the gravity (kN)Fmot/brake Train force (motor or brake) (kW)g Gravitational acceleration (m/s2)i Discount rate
Energies 2020, 13, 963 14 of 16
k Investment lifespan (months)M Vehicle’s mass (ton)Mtrain Mass of the whole train (ton)n Number of axesNPV Net presente value (R$)Nw Number of wagonsPat Power losses due to friction (kW)Pbat,in(t) Power to be injected in the ESS in instant t (kW)Pbat,out(t) Power to be extracted from the ESS in instant t (kW)Pdem(t) Power demand in instant t (kW)Pdiesel(t) Power from diesel oil in instant t (kW)Pmax,ch Maximum rate power charge (kW)Pmax,dch Maximum rate power discharge (kW)Prec(t) Recoverable power in instant t (kW)S Vehicle’s frontal area (m2)SC Standard consumption (l/h)SOCmax Maximum state of the charge (kWh)T Resulting weight in the direction of the movement (N)v Vehicle’s velocity (km/h)Wacceleration Acceleration of the train (m/s2)Pbrake Power dissipated in the dynamic brakes (kW)P f riction Power term representing the friction (kW)Pgravity Power gains or losses related to the gravity (kW)Pmot/brake Weight power of the train (kW)γat Friction coefficient (kgf/tf)α Inclination angleρ Energy density of the fuel (diesel) (kWh/L)(ηbat,ch
)Charge battery efficiency(
ηbat,dch)
Discharge battery efficiency(ηdiesel) Diesel engine efficiency%FD Percentual of application of the dynamic brake
References
1. Song, Y.; Song, W. A novel dual speed-curve optimization based approach for energy-saving operation ofhigh-speed trains. IEEE Trans. Intell. Transp. Syst. 2016, 17, 1564–1575. [CrossRef]
2. González-Gil, A.; Palacin, R.; Batty, P. Sustainable urban rail systems: Strategies and technologies for optimalmanagement of regenerative braking energy. Energy Convers. Manag. 2013, 75, 374–388. [CrossRef]
3. Roch-Dupré, D.; López-López, A.J.; Pecharromán, R.R.; Cucala, A.P.; Fernández-Cardador, A. Analysis of thedemand charge in DC railway systems and reduction of its economic impact with Energy Storage Systems.Int. J. Electr. Power Energy Syst. 2017, 93, 459–467. [CrossRef]
4. Liu, J.; Guo, H.; Yu, Y. Research on the cooperative train control strategy to reduce energy consumption.IEEE Trans Intell. Transp. Syst. 2017, 18, 1134–1142. [CrossRef]
5. Arboleya, P.; Bidaguren, P.; Armendariz, U. Energy is on board: Energy storage and other alternatives inmodern light railways. IEEE Electr. Mag. 2016, 4, 30–41. [CrossRef]
6. Yang, X.; Chen, A.; Li, X.; Ning, B.; Tang, T. An energy-efficient scheduling approach to improve the utilizationof regenerative energy for metro systems. Transp. Res. Part C Emerg. Technol. 2015, 57, 13–29. [CrossRef]
7. Ceraolo, M.; Lutzemberger, G.; Meli, E.; Pugi, L.; Rindi, A.; Pancari, G. Energy storage systems to exploitregenerative braking in DC railway systems: Different approaches to improve efficiency of modern high-speedtrains. J. Energy Storage 2018, 16, 269–279. [CrossRef]
8. Lu, S.; Weston, P.; Hillmansen, S.; Gooi, H.B.; Roberts, C. Increasing the regenerative braking energy forrailway vehicles. IEEE Trans Intell. Transp. Syst. 2014, 15, 2506–2515. [CrossRef]
Energies 2020, 13, 963 15 of 16
9. Domínguez, M.; Fernández-Cardador, A.; Cucala, A.P.; Pecharromán, R.R. Energy savings in metropolitanrailway substations through regenerative energy recovery and optimal design of ATO speed profiles.IEEE Trans. Autom. Sci. Eng. 2014, 9, 496–504. [CrossRef]
10. Yoshida, Y.; Figueroa, H.P.; Dougal, R.A. Comparison of energy storage configurations in railway microgrids.In Proceedings of the IEEE Second International Conference DC Microgrids (ICDCM), Nuremburg, Germany,27–29 June 2017; pp. 133–138.
11. Ratniyomchai, T.; Hillmansen, S.; Tricoli, P. Recent developments and applications of energy storage devicesin electrified railways. IET Electr. Syst. Transp. 2014, 4, 9–20. [CrossRef]
12. Konishi, T.; Morimoto, H.; Aihara, T.; Tsutakawa, M. Fixed energy storage technology applied for DCelectrified railway. IEE J. Electr. Electron. Eng. 2010, 5, 270–277. [CrossRef]
13. Torre, S.; Sánchez-Racero, A.J.; Aguado, J.A.; Reyes, M.; Martínez, O. Optimal sizing of energy storage forregenerative braking in electric railway systems. IEEE Trans. Power Syst. 2015, 30, 1492–1500. [CrossRef]
14. Zhu, F.; Yang, Z.; Xia, H.; Lin, F. Hierarchical control and full-range dynamic performance optimization ofsupercapacitor energy storage system in urban railway. IEEE Trans. Indust. Electron. 2018, 65, 6646–6656.[CrossRef]
15. Bartłomiejczyk, M.; Połom, M. Multiaspect measurement analysis of braking energy recovery. Energy Convers.Manag. 2016, 127, 35–42. [CrossRef]
16. Aguado, J.A.; Racero, A.J.S.; Torre, S. Optimal operation of electric railways with renewable energy andelectric storage systems. IEEE Trans. Smart Grid 2016, 9, 993–1001. [CrossRef]
17. Liu, Y.; Chen, M.; Lu, S.; Chen, Y.; Li, Q. Optimized Sizing and Scheduling of Hybrid Energy Storage Systemsfor High-Speed Railway Traction Substations. Energies 2018, 11, 2199. [CrossRef]
18. Steiner, M.; Scholten, J. Energy storage on board of railway vehicles. In Proceedings of the EuropeanConference Power Electronics Applications, Dresden, Germany, 11–14 September 2005; p. 10.
19. Corbo, P.; Corcione, F.E.; Migliardini, F.; Veneri, O. Energy management in fuel cell power trains. EnergyConvers. Manag. 2006, 47, 3255–3271. [CrossRef]
20. Painter, T.D.; Barkan, C.P.L. Prospects for dynamic brake energy recovery on North American freightlocomotives. In Proceedings of the 2006 IEEE/ASME Joint Rail Conference, Atlanta, GA, USA, 4–6 April2006; pp. 181–188.
21. Douglas, H.; Roberts, C.; Hillmansen, S.; Schmid, F. An assessment of available measures to reduce tractionenergy use in railway networks. Energy Convers. Manag. 2015, 106, 1149–1165. [CrossRef]
22. Yang, X.; Li, X.; Ning, B.; Tang, T. A survey on energy-efficient train operation for urban rail transit. IEEE Trans.Intell. Transp. Syst. 2015, 17, 2–13. [CrossRef]
23. Khodaparastan, M.; Mohamed, A.A.; Brandauer, W. Recuperation of regenerative braking energy in electricrail transit systems. IEEE Trans. Intell. Transp. Syst. 2019, 20, 2831–2847. [CrossRef]
24. Tian, Z.; Weston, P.; Zhao, N.; Hillmansen, S.; Roberts, C.; Chen, L. System energy optimisation strategies formetros with regeneration. Transp. Res. Part. C Emerg. Technol. 2017, 75, 120–135. [CrossRef]
25. González-Gil, A.; Palacin, R.; Batty, P. Optimal energy management of urban rail systems: Key performanceindicators. Energy Convers. Manag. 2015, 90, 282–291.
26. Frilli, A.; Meli, E.; Nocciolini, D.; Pugi, L.; Rindi, A. Energetic optimization of regenerative braking for highspeed railway systems. Energy Convers. Manag. 2016, 129, 200–215. [CrossRef]
27. Ciccarelli, F.; Iannuzzi, D.; Tricoli, P. Control of metro-trains equipped with onboard supercapacitors forenergy saving and reduction of power peak demand. Transp. Res. Part. C Emerg. Technol. 2012, 24, 36–49.[CrossRef]
28. International Electrotechnical Commission. Electrical Energy Storage; International Electrotechnical Commission:Geneva, Switzerland, 2011.
29. Møller, K.T.; Jensen, T.R.; Akiba, E.; Li, H.W. Hydrogen—A sustainable energy carrier. Prog. Nat. Sci. Mater.Int. 2017, 27, 34–40. [CrossRef]
30. Gao, Z.; Chin, C.; Woo, W.; Jia, J. Integrated equivalent circuit and thermal model for simulation oftemperature-dependent LiFePO4 battery in actual embedded application. Energies 2017, 10, 85. [CrossRef]
31. Irena, A.D. Electricity Storage and Renewables: Costs and Markets to 2030; International Renewable EnergyAgency: Abu Dhabi, UAE, 2017.

Energies 2020, 13, 963 16 of 16
32. Killer, A.; Armstorfer, A.; Diez, A.E.; Biechl, H. Ultracapacitor assisted regenerative braking in metropolitanrailway systems. In Proceedings of the 2012 IEEE Colombian Intelligent Transportation Systems Symposium(CITSS), Bogota, Colombia, 30 August 2012; pp. 1–6.
33. Lin, F.; Li, X.; Zhao, Y.; Yang, Z. Control strategies with dynamic threshold adjustment for supercapacitorenergy storage system considering the train and substation characteristics in urban rail transit. Energies 2016,9, 257. [CrossRef]
34. Gee, A.M.; Dunn, R.W. Analysis of Trackside Flywheel Energy Storage in Light Rail Systems. IEEE Trans.Veh. Technol. 2015, 64, 3858–3869. [CrossRef]
35. Spiryagin, M.; Wolfs, P.; Szanto, F.; Sun, Y.Q.; Cole, C.; Nielsen, D. Application of flywheel energy storage forheavy haul locomotives. Appl. Energy 2015, 157, 607–618. [CrossRef]
36. García-Garre, A.; Gabaldón, A. Analysis, evaluation and simulation of railway diesel-electric and hybridunits as distributed energy resources. App. Sci. 2019, 9, 3605. [CrossRef]
37. Reddy, T.B. Linden’s Handbook of Batteries, 4th ed.; McGraw Hill: New York, NY, USA, 2011.38. Halvor, S.; Hansen, M.U.N.; Nils, O. Using operational data to estimate the running resistance of trains.
Estimation of the resistance in a set of Norwegian tunnels. J. Rail Transp. Plan. Manag. 2017, 7, 62–76.39. Davis, W.J. The tractive resistance of electric locomotives and cars. Gen. Electr. Rev. 1926, 29, 685–708.40. Brealey, R.A.; Myers, S.C.; Allen, F.; Mohanty, P. Principles of Corporate Finance; Tata McGraw-Hill Education:
New York, NY, USA, 2012.41. Vale, A.M.; Felix, D.G.; Fortes, M.Z.; Borba, B.S.M.C.; Dias, B.H.; Santelli, B.S. Analysis of the economic
viability of a photovoltaic generation project applied to the Brazilian housing program “Minha Casa MinhaVida”. Energy Policy 2017, 108, 292–298. [CrossRef]
42. Blank, L.; Tarquin, A. Engineering Economy; McGraw-Hill: New York, NY, USA, 2005.43. Toshiba. Industrial Lithium-ion Battery SCiB™ SIP Series. Available online: https://www.scib.jp/en/product/
sip/index.htm (accessed on 1 November 2019).44. Mongird, K.; Fotedar, V.; Viswanathan, V.; Koritarov, V.; Balducci, P.; Hadjerioua, B.; Alam, J. Energy Storage
Technology and Cost Characterization Report; U.S. Department of Energy’s Water Power Technologies Office byPacific Northwest National Laboratory: Washington, DC, USA, 2019.
45. U.S. Dollar/Brazilian Real. Available online: https://www.tradingview.com/symbols/USDBRL (accessed on 4November 2019).
46. Agência Nacional do Petróleo, Gás Natural e Biocombustíveis. Síntese dos Preços Praticados—MINASGERAIS. Available online: http://preco.anp.gov.br/include/Resumo_Por_Estado_Municipio.asp (accessed on1 November 2019).
47. Banco Central do Brasil. Taxa de juros. Available online: https://www.bcb.gov.br/estatisticas/txjuros (accessedon 4 November 2019).
© 2020 by the authors. Licensee MDPI, Basel, Switzerland. This article is an open accessarticle distributed under the terms and conditions of the Creative Commons Attribution(CC BY) license (http://creativecommons.org/licenses/by/4.0/).