Effect of natural antioxidants on protein and lipid oxidation in ...
241
Effect of natural antioxidants on protein and lipid oxidation in fish (Siganus sutor) processed in a locally fabricated hybrid windmill-solar tunnel dryer By Peter Michael Oduor-Odote A thesis submitted to the University of Surrey in partial fulfilment of the requirements for the Degree of Doctor of Philosophy in the Faculty of Health and Medical Science Department of Nutrition Faculty of Health and Medical Sciences University of Surrey Guildford, Surrey GU2 7XH, UK September 2018
-
Upload
khangminh22 -
Category
Documents
-
view
0 -
download
0
Transcript of Effect of natural antioxidants on protein and lipid oxidation in ...

Effect of natural antioxidants on protein
and lipid oxidation in fish (Siganus sutor)
processed in a locally fabricated hybrid
windmill-solar tunnel dryer
By
Peter Michael Oduor-Odote
A thesis submitted to the University of Surrey in partial fulfilment of
the requirements for the Degree of Doctor of Philosophy in the
Faculty of Health and Medical Science
Department of Nutrition
Faculty of Health and Medical Sciences
University of Surrey
Guildford, Surrey GU2 7XH, UK
September 2018

ii
ABSTRACT
The aim was to evaluate the drying characteristics, quality, safety, carbon footprint and physico-
chemical properties of fresh and antioxidant-treated dried Siganus sutor fish fillets. An
innovative hybrid windmill-solar tunnel dryer was designed and fabricated in Kenya to harness
solar and wind energy, day and night and in damp weather conditions. The moisture content for
both salted and unsalted Siganid fish reduced exponentially to 19.9 % over a 3-day drying
period. The quality and yield of Siganid fish fillets after delayed icing for 0, 2 and 4 h that was
determined using the Quality Index Method, was linearly related to storage time. Biochemical
evaluation of solar dried fish, stored for up to 75 days, showed lowest levels of Peroxide Value
(PV), Thiobarbituric Acid Reactive Substances (TBARS), Volatile -Total Basic Nitrogen
(TVB-N), trimethylamine, pH and moisture in vacuum packaging, followed by polythene packs
and highest levels in samples with no packaging. Microbial plate counts were significantly
reduced after solar tunnel drying of the Siganids.
Fish fillets were treated with synthetic antioxidant BHA (control) and extracts from water
hyacinth, seaweeds and turmeric as sources of natural antioxidants. The efficacy of antioxidants
to reduce lipid oxidation products PV and TBARS was in the order
BHA>tumeric>seaweed>water hyacinth and significant (p<0.05). Small deformation rheology
of stored (up to 90 days) solar dried fish fillets treated with natural antioxidants had lower G’
values compared to the control, reflecting desirable texture qualities. The thermodynamic
properties (denaturation temperature (Tm) and heat enthalpy change (∆H) altered significantly
only after 60 days storage.
The carbon footprint was low because of low labour input, non-motorized fishing vessels and
renewable energy-wind and solar used for drying. A descriptive generic Hazard Analysis

iii
Critical Control Point tool for solar dried fish was obtained for the first time. The above
findings can enhance the processing and preservation of fish and influence fish quality and
fisheries policies.

iv
DECLARATION OF ORIGINALITY
This thesis and the work to which it refers are the results of my own efforts. Any ideas, data,
images or text resulting from the work of others (whether published or unpublished) are fully
identified as such within the work and attributed to their originator in the text, bibliography or
in footnotes. This thesis has not been submitted in whole or in part for any other academic
degree or professional qualification. I agree that the University has the right to submit my work
to the plagiarism detection service TurnitinUK for originality checks. Whether or not drafts
have been so-assessed, the University reserves the right to require an electronic version of the
final document (as submitted) for assessment as above.
Peter Michael Oduor-Odote

v
ABBREVIATIONS
BHA Butylated hydroxyanisole
BHT Butylated hydroxytoluene
PG Propyl gallate
TBHQ Tert butyl hydroquinone
HACCP Hazard Analysis Critical Control Point
CP Critical Point
CCP Critical Control Point
BMU Beach Management Unit
AC Alternating current
DC Direct Current
PV Peroxide Value
TBARS Thiobarbituric Acid Reactive Substances
TMA Trimethlyamine
TVB-N Total Volatile Base Nitrogen
TPC Total Plate Count
QIM Quality Index Method
MDA Malondialdehyde
DSC Differential Scanning Calorimetry
Pa Pascal
G’ Storage modulus
G’’ Elastic modulus
∆H Heat enthalpy change
LCA Life Cycle Analysis
ISA Iron Sulphate Agar
RM Raw material
GHG Green House Gases

vi
ACKNOWLEDGEMENTS
This has been a long journey which started when I was not really feeling well but over time, I
regained my health and there was Prof. Nazlin Howell who stood firm and helped me
throughout this study with words of encouragement. The EU Securefish project, coordinated by
my supervisor Professor Nazlin Howell, for the period it lasted was key to major funding of the
project especially for work in specialized labs like at the University of Surrey where part of the
practical work was carried out. The contribution by Dr. Farah Badii is recognized in a big way
for her in-depth knowledge in lab analysis using the more advanced equipment. My fellow PhD
colleagues and laboratory staff during my presence at the University of Surrey are
acknowledged. Dr. Jorge Gutierrez-Merino joined in later in part supervision. I would like to
thank also my co-supervisor Prof. Douglas Shitanda. May I take this opportunity to thank and
acknowledge the financial considerations by Dr. Julius Francis of WIOMSA for enabling the
short visits to the University of Surrey. The role played by the local team members in KMFRI
and out of KMFRI led by Dr. Cyprian Odoli, Dr. Gareth Kituu, Josephine Marigu, Stanley
Onyango, Maurice Obiero, Raymond Ruwa, Sam Ng’ete, Melvin Karuiki and the late Benard
Ogongo is acknowledged. Dr. Marnix Poelman, Dr. Kees Goudswaard, Dr. Hans van de Vis,
Dr. Paul Bartels, are acknowledged. Thanks to KMFRI and the directors of KMFRI in
succession from Dr. Johnston Kazungu, Dr. Renison Ruwa and now Prof. James Njiru for an
enabling environment and the staff of the Faculty of Health and Medical Sciences, University
of Surrey, Kipini Beach Management Unit especially Bwanaher Hamadi (“Aboo”). My wife
Florence, daughter Yvonne and son Fred for bearing with my occasional absence and now my
grandchildren Hera Amani and Emanuel Chako, who may find more time with me after this are
acknowledged.
May god bless you all

vii
TABLE OF CONTENTS
ABSTRACT ............................................................................................................................... ii
DECLARATION OF ORIGINALITY ..................................................................................... iv
ABBREVIATIONS .................................................................................................................... v
ACKNOWLEDGEMENTS ...................................................................................................... vi
TABLE OF CONTENTS ......................................................................................................... vii
LIST OF FIGURES ................................................................................................................. xiv
LIST OF TABLES ................................................................................................................ xviii
ANNEXES ............................................................................................................................... xx
CHAPTER 1 ............................................................................................................................... 2
1.0 INTRODUCTION ......................................................................................................... 2
1.1. Background .................................................................................................................... 2
1.2 Hybrid solar tunnel windmill dryer .................................................................................. 5
1.3 The fishery and biology of Siganus sutor fish in Kenya .................................................. 7
1.4 The market value of Siganid fish ..................................................................................... 8
1.5 Quality of Siganids and safety .......................................................................................... 9
1.6 Moisture and water activity ............................................................................................ 10
1.8 Total Volatile Basic Nitrogen (TVB-N) ......................................................................... 10
1.9 pH ................................................................................................................................... 11
1.10 Microbiological evaluation ........................................................................................... 11
1.11 Biochemical changes .................................................................................................... 12
1.11.1 Lipid oxidation ...................................................................................................... 12
1.11.2 Evaluation of lipid oxidation ................................................................................. 14
1.11.2.1 Peroxide Value (PV) .......................................................................................... 14
1.11.2.2 Thiobarbituric Acid Reactive Substances (TBARS) .......................................... 14
1.11.3. Interaction of lipid oxidation products with proteins ........................................... 15
1.11.4 Protein structure .................................................................................................... 15
1.12. Rheological properties ................................................................................................. 17
1.12.1 Protein denaturation during processing ................................................................. 17
1.12.2 Rheological properties of proteins ........................................................................ 18
1.12.3 Thermodynamic properties .................................................................................... 19
1.13 Antioxidants ................................................................................................................. 21
1.14 Natural antioxidants ..................................................................................................... 22
1.14.1 Curcuma longa ...................................................................................................... 23
1.14. 2 Euchema denticulatum ......................................................................................... 23
1.14.3 Water hyacinth ...................................................................................................... 24
1.14.4 Mechanism of antioxidant activity ........................................................................ 25

viii
1.15 Packaging and Storage ................................................................................................. 26
1.16 Conclusion .................................................................................................................... 27
1.17 Aims and objectives ..................................................................................................... 28
1.17.1 Aim ........................................................................................................................ 28
1.17.2 The objectives ........................................................................................................ 28
CHAPTER 2 ............................................................................................................................. 30
2.0 Construction and modelling the drying of fish in the hybrid windmill solar-tunnel
dryer ........................................................................................................................................ 30
2.1. Introduction ..................................................................................................................... 30
2.2. Materials and methods ................................................................................................... 31
2.2.1 Dryer construction at Kenya Marine and Fisheries Research Institute (KMFRI) ... 31
2.2.1.1 Solar Collector ...................................................................................................... 31
2.2.1.2 The body of the collector ...................................................................................... 31
2.2.1.3 The frame ............................................................................................................ 31
2.2.1.4 The boards ........................................................................................................... 32
2.2.1.5 The drying and hot air chamber ........................................................................... 33
2.2.1.6 The roof of the dryer ............................................................................................ 33
2.2.1.7 The lower chute .................................................................................................... 35
2.2.3 Installation of photo voltaic part ................................................................................. 35
2.2.3.1 Power Source ........................................................................................................ 35
2.2.3.2 DC heating coil .................................................................................................... 37
2.2.4 The windmill system ............................................................................................... 38
2.2.4.1 The mast ............................................................................................................... 38
2.2.4.2 The wind generator ............................................................................................... 38
2.2.4.3 The battery bank ................................................................................................... 38
2.2.5 Drying of Siganids and drying characteristics ........................................................ 40
2.2.5.1 The preparation of salted and unsalted the fish samples ...................................... 40
2.2.5.2 The fish drying process ........................................................................................ 41
2.2.5.3 Modelling thin layer drying of fish ...................................................................... 43
2.2.5.4 Measures of performance of the models .............................................................. 44
2.3 Results and discussion .................................................................................................... 45
2.3.1 Performance of the fabricated dryer in the drying of fish ....................................... 45
2.3.2 Modelling of the drying of fish in the dryer ............................................................ 48
2.3.3 Drying temperatures in the hybrid windmill solar tunnel dryer at night ................. 51
2.4 Conclusions .................................................................................................................... 52
CHAPTER 3 ............................................................................................................................. 54
3.0 Biochemical, Microbiological and Quality of Siganus Sutor fillets ............................. 54

ix
3.1. Introduction ..................................................................................................................... 54
3.2. Materials and Methods .................................................................................................. 54
3.2.1 Influence of processing time on fillet yield and quality .......................................... 54
3.2.1.1 Fish handling ........................................................................................................ 54
3.2.1.2 Influence of Raw Material Quality on Process Yield ........................................... 55
3.2.2. Biochemical analysis during delayed processing ................................................... 57
3.2.2.1 Water Activity (aw) ............................................................................................... 57
3.2.2.2 Moisture content ................................................................................................. 57
3.2.2.3 pH ......................................................................................................................... 58
3.2.2.4 Peroxide Value ..................................................................................................... 58
3.2.2.5 TBARS ................................................................................................................. 58
3.2.2.6 TVB-N .................................................................................................................. 59
3.2.3 Biochemical changes during solar drying ............................................................... 60
3.2.3.1 Fish handling ........................................................................................................ 60
3.2.3.2 Drying ................................................................................................................... 60
3.2.3.3. Biochemical parameters during drying ............................................................... 60
3.2.4 Microbiological analysis ......................................................................................... 61
3.2.4.1 Sample collection and preparation for analyses ................................................... 61
3.2.4.2 Isolation and enumeration of bacteria .................................................................. 61
3.2.4.3 Storage of fish for microbiological analysis ......................................................... 61
3.3 Results and discussion .................................................................................................... 62
3.3.1 Quality scores during delayed icing for 0-4 hrs category ....................................... 62
3.3.2. Influence of Raw Material Quality on Process Yield and Labour Productivity .... 63
3.3.2.1 Quality index during delayed icing for 0- 4 hr category ...................................... 63
3.3.2.2 Individual quality parameters in QIM scheme ..................................................... 64
3.3.2.3 Influence of raw material quality on yield and labour ......................................... 65
3.3.3. Biochemical parameters during delayed processing for 0-4 hr category ............... 67
3.3.3.1 Water activity ....................................................................................................... 67
3.3.3.2 pH ......................................................................................................................... 68
3.3.3.3 Peroxide Value ..................................................................................................... 69
3.3.3.4 TBARS ............................................................................................................... 69
3.3.3.5 TVB-N .................................................................................................................. 70
3.3.3.6 Conclusions on delayed icing on 0-4 hr category ................................................ 71
3.3.4 Drying Siganid fish during delayed processing (0, 2, 4, 6, 8 and 10 hr delayed
processing) ........................................................................................................................ 71
3.3.4.1 Moisture content in fish samples .......................................................................... 71
3.3.5 Biochemical changes during drying (0, 2, 4, 6, 8 and 10 hr delayed processing) ... 72

x
3.3.5.1 Water activity in fish samples undergoing delayed filleting ................................ 72
3.3.5.2 pH ......................................................................................................................... 73
3.3.5.3 Peroxide value ...................................................................................................... 73
3.3.5.4 TBARS ................................................................................................................. 73
3.3.5.5 TVB-N and TMA ................................................................................................. 74
3.3.5.6 Conclusions .......................................................................................................... 78
3.3.6 Biochemical changes during storage of solar dried fish only at 0 h of delayed icing
.......................................................................................................................................... 78
3.3.6.1 Moisture during storage ........................................................................................ 79
3.3.6.2 Water activity ....................................................................................................... 80
3.3.6.3 pH ......................................................................................................................... 81
3.3.6.4 PV ......................................................................................................................... 81
3.3.6.5 TBARS ................................................................................................................. 82
3.3.6.6 TVB-N .................................................................................................................. 83
3.3.3.7 Temperature .......................................................................................................... 84
3.3.6.8 Conclusions .......................................................................................................... 87
3.3.7 Microbiological analysis and evaluation ................................................................. 87
3.3.7.1 Bacterial load of freshly harvested versus solar dried fish ................................... 88
3.3.7.2 Storage-specific, temporal variation in bacterial loads of solar dried fish ........... 89
3.3.7.3 The bacteriological quality assessment of ice and processing water ................... 91
3.4 Discussion-Microbiology evaluation and conclusions ................................................... 91
3.5 Conclusions ................................................................................................................ 93
CHAPTER 4 ............................................................................................................................. 95
4.0 Lipid oxidation in solar dried fish with and without antioxidants .............................. 95
4.1 Introduction ...................................................................................................................... 95
4.1 Materials and Methods ................................................................................................... 96
4.1.1 Preparation of plant antioxidant samples ................................................................ 96
4.1.2 Extraction of plant polyphenols .............................................................................. 97
4.1.3 Total phenolic content (TPC) .................................................................................. 97
4.1.3.1 Sample preparation for TPC. ................................................................................ 97
4.1.3.2 Total Phenolic Content (TPC) determination ....................................................... 98
4.1.3.3 Application of the antioxidant samples in fish muscle and storage trials ............ 98
4.2 Results and discussion .................................................................................................. 100
4.3 Storage trial results with antioxidants incorporated in fish muscle .............................. 101
4.3.1 Lipid oxidation indicators during storage of dried siganids .................................. 101
4.3.1.1 Peroxide value in fresh and stored Siganids ..................................................... 101
4.3.1.2 TBARS ............................................................................................................... 102
xi
4.3.1.3 Total phenolic content in Siganid muscle .......................................................... 104
4.3.1.4 % Inhibition of free radical formation during storage ........................................ 105
4.4 Discussion .................................................................................................................... 107
4.4.1 Conclusions ........................................................................................................... 109
CHAPTER 5 ........................................................................................................................... 111
5.0 Physicochemical properties of stored Siganid fish muscle treated with natural
antioxidants ........................................................................................................................... 111
5.1. Introduction ................................................................................................................... 111
5.2. Materials and methods ................................................................................................. 112
5.2.1. Materials ............................................................................................................... 112
5.2.2. Fish muscle preparation ........................................................................................ 112
5.2.3. Rheological properties .......................................................................................... 112
5.2.3.1 Setting up the rheometer for analysis ................................................................. 112
5.2.3.2 Sample loading on rheometer ............................................................................. 113
5.2.4 Thermodynamic properties .................................................................................... 113
5.3 Results and Discussion ................................................................................................. 114
5.3.1 Rheological analysis .............................................................................................. 114
5.3.2 Addition of antioxidants ........................................................................................ 116
5.3.3 Differential Scanning Calorimetry (DSC) Analysis .............................................. 124
5.4 Discussion .................................................................................................................... 127
5.5 Conclusions .................................................................................................................. 128
CHAPTER 6 ........................................................................................................................... 130
6.0 Carbon footprint for solar dried fish ............................................................................ 130
6.1. Introduction ................................................................................................................... 130
6.2 Materials and Methods ................................................................................................. 132
6.3 Results .......................................................................................................................... 135
6.4 Discussion .................................................................................................................... 137
6.5 Conclusions .................................................................................................................. 138
CHAPTER 7 ........................................................................................................................... 140
7.0 Quality safety tool -Generic HACCP for solar dried fish ........................................... 140
7.1 Introduction .................................................................................................................... 140
7.2 Materials and Methods ................................................................................................. 141
7.2.1 Defining the objectives .......................................................................................... 141
7.2.2.1 Application ......................................................................................................... 141
7.2.2.2 Definitions (taken from the literature and references cited) ............................... 141
7.2.2.3 Responsibility ..................................................................................................... 142
7.2.2.4 Possible Hazards ................................................................................................. 142

xii
Physical hazards ............................................................................................................. 142
Microbiological hazards ................................................................................................ 142
Mycotoxins: .................................................................................................................... 143
Chemical Hazard ................................................................................................................ 143
Allergens: ........................................................................................................................ 143
7.2.2.5 Products .............................................................................................................. 143
Product description ............................................................................................................. 143
Product usage ..................................................................................................................... 143
7.2.2.6 HACCP team ...................................................................................................... 143
7.2.2.7 Verification ......................................................................................................... 144
7.2.2.8 Flow chart for solar dried fish ............................................................................ 145
7.4 Discussion .................................................................................................................... 146
7.5 Conclusions .................................................................................................................. 147
CHAPTER 8 ........................................................................................................................... 160
8.0 DISCUSSION .................................................................................................................. 160
8.1 Introduction .................................................................................................................... 160
8.2 The hybrid windmill solar tunnel dryer ........................................................................ 160
8.3 Quality, Biochemical and Microbiological Properties of Siganus Sutor fillets ........... 162
8.3.1 Quality scores during delayed icing ...................................................................... 162
8.3.1.1 Quality index ...................................................................................................... 162
8.3.1.2 Individual quality parameters in QIM scheme ................................................... 162
8.3.1.3 Influence of raw material quality on yield and labour productivity ................... 163
8.3.2. Biochemical parameters during delayed processing ............................................ 163
8.3.3 Water activity and pH ............................................................................................ 163
8.3.4 Lipid oxidation ...................................................................................................... 164
8.3.5 TVB-N ................................................................................................................... 164
8.4 Drying characteristics during delayed processing (0, 2, 4, 6, 8 and 10 hr delayed
processing) .......................................................................................................................... 165
8.4.1 Moisture content in fish samples ........................................................................... 165
8.4.2 Biochemical changes during drying (0, 2, 4, 6, 8 and 10 hr delayed processing) . 165
8.4.2.1 Water activity and pH in fish samples undergoing delayed filleting ................. 165
8.4.2.2 Peroxide value and TBARS ............................................................................... 165
8.4.2.3 TVB-N and TMA ............................................................................................... 166
8.5 Biochemical changes during storage of solar dried fish only at 0 h of delayed icing
........................................................................................................................................ 167
8.5.1 Moisture during storage ......................................................................................... 167
8.5.2 Water activity ........................................................................................................ 167
8.5.3 pH .......................................................................................................................... 167

xiii
8.5.4 Lipid oxidation ...................................................................................................... 168
8.5.5 TVB-N ................................................................................................................... 169
8.5.6 Temperature ........................................................................................................... 169
8.5.7 Microbiological analysis and evaluation ............................................................... 169
8.6 Lipid oxidation in solar dried fish with and without antioxidants ............................... 171
8.7 Rheological and thermal properties .............................................................................. 172
8.8 Carbon footprint and quality tool during drying of Siganid fish in the Hybrid Windmill
Solar Tunnel Dryer ............................................................................................................. 173
8.9 Quality safety tool -HACCP for solar dried fish .......................................................... 174
8.10 CONCLUSIONS ........................................................................................................ 174
8.10.1 Hybrid windmill solar tunnel dryer ..................................................................... 174
8.10.2 Raw material quality ........................................................................................... 175
8.10.3 Effect of natural antioxidants on lipid oxidation ................................................. 176
8.10.4 Rheological and thermodynamic properties of dried fish ................................... 176
8.10.5 Carbon Footprint and quality tool – HACCP ...................................................... 176
8.11 FURTHER WORK ............................................................................................... 177
9.0 REFERENCES ................................................................................................................. 180
10.0 PUBLICATIONS AND PATENT REGISTRATION .................................................. 204
11.0 ANNEXES ..................................................................................................................... 205

xiv
LIST OF FIGURES
Figure 1.1:A comparison of long-term trends in marine fisheries production for Kenya based
on (a) Officially reported catches (Source: FAO unpublished data) and (b) reconstructed catches
(Source: La Manach, 2005) (Source: KMFRI State of Fisheries Report, 2018). ....................... 3
Figure 1.2: Traditional drying of fish in the open on rocks in the North coast of Kenya ......... 4 Figure 1.3: Schematic view of the Hybrid windmill solar tunnel dryer installed in Kipini, Kenya
.................................................................................................................................................... 6 Figure 1.4: Fresh Siganus sutor in Kenyan waters. .................................................................. 8 Figure 1.5: Structure of amino acid ......................................................................................... 16
Figure 1.6: Peptide bond ......................................................................................................... 17 Figure 1.7: Seaweed farming and harvesting in the South coast of Kenya ............................. 24
Figure 1.8: Water hyacinth in Lake Victoria blocking maritime transport and fishing areas . 25 Figure 2.1: Construction of the main frame of collector for the hybrid windmill solar tunnel
dryer with the boards and aluminium sheets ............................................................................ 32 Figure 2.2: a) The collector and hot air chamber b) Drying chamber ...... 33 Figure 2.3: The collector roof of the dryer: Before (a) and after (b) roof installation .......... 34
Figure 2.4: Circuit layout of the power supply system ........................................................... 36 Figure 2.5: Locations of switches A, B and C and the charge controller . .............................. 37 Figure 2.6: DC coil glowing with heat in drying chamber of the hybrid windmill solar tunnel
dryer in Kipini, Kenya .............................................................................................................. 37
Figure 2.7: The wind generator about to be hoisted and the windmill in operation for the hybrid
windmill solar tunnel dryer in Kipin, Kenya ............................................................................ 38
Figure 2.8: The battery bank and inverter for the hybrid windmill solar tunnel dryer in Kipini,
Kenya ........................................................................................................................................ 39
Figure 2.9: The drying system of the hybrid windmill solar tunnel dryer in Kipini showing the
tunnel dryer, drying chamber,windmill and hot water system ................................................. 39
Figure 2.10: Community house provided withelectricity from the hybrid windmill solar tunnel
dryer in Kipini .......................................................................................................................... 40 Figure 2.11: Members of Kipini BMU drying fish and other farm produce like mangoes during
low fishing season in the hybrid windmill solar tunnel dryer in Kipini, Kenya ...................... 40 Figure 2.12: Variation of moisture ratio, solar dryer and ambient temperatures during drying
of Siganid fillet in the hybrid windmill solar tunnel dryer in Kipini, Kenya.(Amb = Ambient
temperature, Drying chamber temp= Drying chamber temperature) ....................................... 45 Figure 2.13: Variation of ambient and drying chamber temperatures and relative humidity with
drying time in drying of Siganid fillet in the hybrid windmill solar tunnel dryer in Kipini, Kenya
(Ta=Ambient temperature, Td= Dryer temperature, Rha= Ambient relative humidity and
Rhd=Relative humidity inside the dryer .................................................................................. 46 Figure 2.14: Changes in temperature and humidity with time during the drying of Siganus sutor
using integrated windmill solar tunnel dryer. ........................................................................... 52
Figure 3.1: Quality assessment of fresh Siganids during ambient storage at 0hr, 2 hr and 4 hr
delayed processing ................................................................................................................... 63
Figure 3.2: Quality index (Max QI=21) of Siganus sutor freshness grades. Averages (±SD)
over each quality grade analysed (average score, N=5). 1= stored for 0 hours; 2= stored for 2
hours; 3= stored for 4 hours. .................................................................................................... 64 Figure 3.3: Average score for individual quality descriptors (attributes) of Siganussutor
evaluated with QIM scheme Rabbit fish (N=5). 1= stored for 0 hours; 2= stored for 2 hours; 3=
stored for 4 hours. ..................................................................................................................... 65

xv
Figure 3.4: Influence of raw material quality of Siganus sutor on filleting time and yield
because of delayed icing for 0, 2 and 4 hrs. (N=5). 1= stored for 0 hours; 2= stored for 2 hours;
3= stored for 4 hours. ............................................................................................................... 66 Figure 3.5: Changes in moisture content during drying of Siganids after delayed icing of 0, 2,
4, 6, 8 and 10 hr ........................................................................................................................ 72 Figure 3.6: Changes in water activity during the actual solar drying of Siganid fish fillet after
delayed icing for 0, 2, 4, 6, 8 and 10 hrs in the hybrid windmill solar tunnel dryer in Kipini,
Kenya. ....................................................................................................................................... 75 Figure 3.7: Changes in pH during the actual solar drying of Siganid fish fillets after delayed
icing for 0, 2, 4, 6, 8 and 10hrs in the hybrid windmill solar tunnel dryer in Kipini, Kenya. .. 76 Figure 3.8: Changes in PV (peroxide value) during the actual solar drying of Siganid fish fillets
after delayed icing for 0, 2, 4, 6, 8 and 10hrs in the hybrid windmill solar tunnel dryer in Kipini,
Kenya. ....................................................................................................................................... 76 Figure 3.9: Changes in TBARS during the actual solar drying of Siganid fish fillets after
delayed icing for 0, 2, 4, 6, 8 and 10hrs in the hybrid windmill solar tunnel dryer in Kipini,
Kenya. ....................................................................................................................................... 77
Figure 3.10: Changes in TVB-N during the actual solar drying of Siganid fish fillets after
delayed icing for 0, 2, 4, 6, 8 and 10hrs in the hybrid windmill solar tunnel dryer in Kipini,
Kenya. ....................................................................................................................................... 77 Figure 3.11: Changes in TMA during the actual solar drying of Siganid fish fillets after
delayed icing for 0, 2, 4, 6, 8 and 10hrs in the hybrid windmill solar tunnel dryer in Kipini,
Kenya ........................................................................................................................................ 78
Figure 3.12: Solar dried Siganid fillet stored in the open (i) in normal polythene packaging (ii)
and vacuum packaging (iii) ...................................................................................................... 79
Figure 3.13: Changes in %moisture content (wet basis) of solar dried Siganid fish fillets during
storage in the open air, in normal polythene packaging and vacuum packaging .................... 80
Figure 3.14: Changes in water activity of solar dried Siganid fish fillets during storage in the
open air, in normal polythene packaging and vacuum packaging. ......................................... 84 Figure 3.15: Changes in pH of solar dried Siganid fish fillets during storage in the open air,
in normal polythene packaging and vacuum packaging. ........................................................ 85 Figure 3.16: Changes in PV (peroxide value) of solar dried Siganid fish fillets during storage
in the open air, in normal polythene packaging and vacuum packaging. ............................... 85
Figure 3.17: Changes in TBARS of solar dried Siganid fish fillets during storage in the open
air, in normal polythene packaging and vacuum packaging. .................................................. 86
Figure 3.18: Changes in TVB-N of solar dried Siganid fish fillets during storage in the open
air, in normal polythene packaging and vacuum packaging. .................................................. 86
Figure 3.19: Changes in temperature surrondings of solar dried Siganid fish fillets during
storage in the open air, in normal polythene packaging and vacuum packaging. .................. 87 Figure 3.20: Total Plate Counts : Fresh vs Solar Dried Fish ................................................... 88
Figure 3.21: Spoilage Specific Organisms : Fresh vs Solar Dried Fish .................................. 89 Figure 3.22: Temporal variation in bacterial loads of solar dried fish stored differently ....... 90
Figure 4.1: Total phenolic content in graphic form for extracts of water hyacinth, turmeric
and seaweed ............................................................................................................................ 101 Figure 4.2: Change in peroxide value ( PV) levels during 90 day storage of Siganid fillets
treated with BHA (1% w/v in distilled water), seaweed (2.5% w/v in distilled water), turmeric
(2.5% w/v in distilled water) and water hyacinth (2.5% w/v in distilled water without
antioxidants. ........................................................................................................................... 102 Figure 4.3: Change in TBARS levels during 90 day storage of Siganid fillets treated with BHA
(1% w/v in distilled water), seaweed (2.5% w/v in distilled water), turmeric (2.5% w/v in

xvi
distilled water) and water hyacinth (2.5% w/v in distilled water) water soluble antioxidant
extracts . The control sample was treated with distilled water without antioxidants. ............ 104 Figure 4.4: Change in total phenolic content levels during 90 day storage of Siganid fillets
treated with BHA (1% w/v in distilled water), seaweed (2.5% w/v in distilled water), turmeric
(2.5% w/v in distilled water ) and water hyacinth (2.5% w/v in distilled water without
antioxidants ............................................................................................................................ 105 Figure 4.5: Change in % Inbition of free radical formation during 90 day storage of Siganid
treated with BHA (1% w/v in distilled water), seaweed (2.5% w/v in distilled water), turmeric
(2.5% w/v in distilled water ) and water hyacinth (2.5% w/v in distilled without antioxidants
................................................................................................................................................ 106 Figure 5.1: Small deformation rheology temperature sweep (20oC to 90oC and cooled back to
20oC) showing G’ and G’’ values for stored (day 0) solar dried Siganid fillets The control
sample was treated with distilled water without antioxidants. ............................................... 118 Figure 5.2: Small deformation rheology temperature sweep (20oC to 90oC and cooled back to
20oC) showing G’ and G’’ values for stored (day 60) solar dried Siganid fillets treated with
water hyacinth (2.5 % w/v in distilled water). The control sample was treated with distilled
water without antioxidants ..................................................................................................... 118 Figure 5.3: Small deformation rheology temperature sweep (20oC to 90oC and cooled back to
20oC) showing G’ and G’’ values for stored (day 90) solar dried Siganid fillets The control
sample was treated with distilled water without antioxidants. ............................................... 119
Figure 5.4: Figure 5.4 Small deformation rheology temperature sweep (20oC to 90oC and
cooled back to 20oC) showing G’ and G’’ values for stored (day 0) solar dried Siganid fillets
treated with water hyacinth (2.5 % w/v in distilled water). The control sample was treated with
water without antioxidants. .................................................................................................... 119
Figure 5.5: Small deformation rheology temperature sweep (20oC to 90oC and cooled back to
20oC) showing G’ and G’’ values for stored (day 60) solar dried Siganid fillets treated with
water hyacinth (2.5 % w/v in distilled water). The control sample was treated with distilled
water without antioxidants. .................................................................................................... 120 Figure 5.6: Small deformation rheology temperature sweep (20oC to 90oC and cooled back to
20oC) showing G’ and G’’ values for stored (day 0) solar dried Siganid fillets treated with
seaweed (2.5 % w/v in distilled water). The control sample was treated with distilled water
without antioxidants. .............................................................................................................. 120
Figure 5.7: Small deformation rheology temperature sweep (20oC to 90oC and cooled back to
20oC) showing G’ and G’’ values for stored (day 60) solar dried Siganid fillets treated with
seaweed (2.5 % w/v in distilled water). The control sample was treated with distilled water
without antioxidants. .............................................................................................................. 121
Figure 5.8: Small deformation rheology temperature sweep (20oC to 90oC and cooled back to
20oC) showing G’ and G’’ values for stored (day 90) solar dried Siganid fillets treated with
seaweed (2.5 % w/v in distilled water). The control sample was treated with distilled water
without antioxidants. .............................................................................................................. 121 Figure 5.9: Small deformation rheology temperature sweep (20oC to 90oC and cooled back to
20oC) showing G’ and G’’ values for stored (day 0) solar dried Siganid fillets treated with
Turmeric (2.5 % w/v in distilled water). The control sample was treated with distilled water
without antioxidants. .............................................................................................................. 122 Figure 5.10: Small deformation rheology temperature sweep (20oC to 90oC and cooled back to
20oC) showing G’ and G’’ values for stored (day 90) solar dried Siganid fillets treated with
Turmeric (2.5 % w/v in distilled water). The control sample was treated with distilled water
without antioxidants. .............................................................................................................. 122
Figure 5.11:Small deformation rheology temperature sweep (20oC to 90oC and cooled back to
20oC) showing G’ and G’’ values for stored (day 0) solar dried Siganid fillets treated with

xvii
BHA (1% w/v in distilled water). The control sample was treated with distilled water without
antioxidants. ........................................................................................................................... 123 Figure 5.12: Small deformation rheology temperature sweep (20oC to 90oC and cooled back
to 20oC) showing G’ and G’’ values for stored (day 90) solar dried Siganid fillets treated
with BHA (1% w/v in distilled water). The control sample was treated with distilled water
without antioxidants. .............................................................................................................. 123 Figure 5.13: Differential Scanning Calorimetry thermogram for fish muscle showing
denaturation temperature (Tmax) and heat enthalpy change values (∆H) for stored (day 0)
solar dried Siganid fillets treated with BHA (1% w/v in distilled water), seaweed (2.5% w/v in
distilled water), turmeric (2.5% w/v in distilled water) and water hyacinth (2.5% w/v in distilled
water) water soluble antioxidant extracts. The control sample was treated with distilled water
without antioxidants. .............................................................................................................. 124
Figure 5.14: Differential Scanning Calorimetry thermogram for fish muscle showing
denaturation temperature (Tmax) and heat enthalpy change values (∆H) for stored (day 60)
solar dried Siganid fillets treated with BHA (1% w/v in distilled water), seaweed (2.5% w/v in
distilled water), turmeric (2.5% w/v in distilled water) and water hyacinth (2.5% w/v in distilled
water) water soluble antioxidant extracts. The control sample was treated with distilled water
without antioxidants. .............................................................................................................. 125 Figure 5.15: Differential Scanning Calorimetry thermogram for fish muscle showing
denaturation temperature (Tmax) and heat enthalpy change values (∆H) for stored (day 90)
solar dried Siganid fillets treated with BHA (1% w/v in distilled water), seaweed (2.5% w/v in
distilled water), turmeric (2.5% w/v in distilled water) and water hyacinth (2.5% w/v in distilled
water) water soluble antioxidant extracts. The control sample was treated with distilled water
without antioxidants. .............................................................................................................. 125
Figure 6.1: System boundary for solar dried Siganids (RM is Raw Material). ..................... 133 Figure 6.2: Carbon footprint of solar assisted dried fillet and dried fillet based on fossil fuel.
................................................................................................................................................ 137 Figure 6.3: Carbon footprint of solar assisted dried fillet and dried fillet based on fossil fuel.
................................................................................................................................................ 137
Figure 7.1: Schematic flow sheet for solar dried Siganids .................................................... 145

xviii
LIST OF TABLES
Table 2.1: Mathematical thin layer drying models used to model the drying of fish in the hybrid
windmill solar tunnel dryer in Kipini, Kenya ........................................................................... 43 Table 2.2: Model performance parameters of various thin layer drying models in Table 2.1 50
Table 2.3: Data of humidity, temperature and windspeed in windmill dryer system at night 51 Table 3.1: Quality Index Scores for Siganids .......................................................................... 56 Table 3.2: Biochemical changes during delayed processing at 0, 2 and 4 hrs ........................ 67 Table 3.3: Bacterial Counts for Solar Dried Fish (Day 0) ....................................................... 89 Table 3.4: The MPN of the bacterial load in the processing (i.e. washing) water during
delayed icing ............................................................................................................................. 91 Table 3.5: The MPN of the bacterial load in the preservation ice during the project Period .. 91
Table 4.1: Incorporation of the natural antioxidant extracts from water hyacinth, seaweed,
turmeric and BHA (positive control) in the Siganid fillet for drying then storage. ................. 99 Table 4.2: Total phenolic content in water hyacinth stem, leaves and roots and in seaweeds
and Turmeric as plant sources for natural antioxidants .......................................................... 100 Table 4.3: Statistical analysis for -TBARS, PV, TPC and % Inhibition of Siganid fillets
treated with BHA (1% w/v in distilled water), seaweed (2.5% w/v in distilled water), turmeric
(2.5% w/v in distilled water ) and water hyacinth (2.5% w/v in distilled water soluble
antioxidant extracts . The control sample was treated with distilled water without antioxidants.
................................................................................................................................................ 107
Table 5.1: Rheological properties of solar dried Siganus sutor muscle treated with water as
control during ambient storage in normal polythene for up to 90 days. G and G’’ are mean
score in Pa units ...................................................................................................................... 114
Table 5.2: Rheological properties of solar dried Siganus sutor muscle treated with natural
antioxidant water extracts of water hyacinth (Eichronia) during ambient storage in normal
polythene for up to 90 days. G and G’’ are mean score in Pa units ....................................... 115
Table 5.3: Rheological properties of solar dried Siganus sutor muscle treated with natural
antioxidant water extracts of seaweed (Eucheuma) during ambient storage in normal
polythene for up to 90 days. G and G’’ are mean score in Pa units ....................................... 115
Table 5.4: Rheological properties of solar dried Siganus sutor muscle treated with natural
antioxidant water extracts of Turmeric (Curcuma) during ambient storage in normal polythene
for up to 90 days. G and G’’ are mean score in Pa units ........................................................ 115
Table 5.5: Rheological properties of solar dried Siganus sutor muscle treated with synthetic
antioxidant BHA during ambient storage in normal polythene for up to 90 days. G and G’’ are
mean score in Pa units ............................................................................................................ 116
Table 5.6: Transition denaturation temperatures Tonset, Tmax oC and Heat enthalpy change
(∆H) for myosin and actin proteins obtained by differential scanning calorimetry (DSC) for
stored solar dried Siganid fish muscle (control) ..................................................................... 126 Table 5.7: Transition denaturation temperatures Tonset, Tmax oC and Heat enthalpy change
(∆H) for myosin and actin proteins obtained by differential scanning calorimetry of stored
solar dried Siganid fish muscle treated with water extracts of water hyacinth as an as
antioxidants. Comparisons only with control for each treatment ........................................... 126 Table 5.8: Transitions denaturation temperatures Tonset, Tmax oC and Heat enthalpy change
(∆H) for myosin and actin proteins by differential scanning calorimetry (DSC) of stored solar
dried Siganid fish muscle treated with water extracts of seaweed (Eucheuma) as as
antioxidants. Comparisons only with control for each treatment ........................................... 126
Table 5.9: Transition denaturation temperatures Tonset, Tmax oC and Heat enthalpy change
(∆H) of myosin and actin protein s by differential scanning calorimetry (DSC) of stored solar
xix
dried Siganid fish muscle treated with water extracts of Turmeric as antioxidants.
Comparisons only with control for each treatment ................................................................ 127 Table 5.10: Transition denaturation temperatures Tonset, Tmax oC and Heat enthalpy (∆H) of
myosin and actin proteins by differential scanning calorimetry (DSC) of stored solar dried
Siganid fish muscle treated with BHA as antioxidant. Comparisons only with control for each
treatment ................................................................................................................................. 127 Table 6.1: Carbon footprint contribution in different steps of the production chain.
Represented are the solar assisted dried fish process, and the drying process using fuel-based
energy inputs. ......................................................................................................................... 136
Table 6.2: Carbon footprint contribution in different steps of the production chain.
Represented are the solar assisted dried fish process, and the drying process using fuel-based
energy inputs. ......................................................................................................................... 136
Table 7.1: The HACCP team composition ............................................................................ 144 Table 7.2: Overview HACCP plan Solar Dried Siganid fillet (Tafi or Rabbit fish) ............. 148 Table 7.3: Verification Stages and Their Minimum Frequency in a HACCP Plan (from
Sperber, 1998) ........................................................................................................................ 150
Table 7.4: HACCP-Hand book- Receiving of raw material .................................................. 151 Table 7.5: HACCP-Hand book- Washing in basins and tubs ............................................... 152 Table 7.6: HACCP-Hand book- Gutting, scouring and filleting ........................................... 153 Table 7.7: HACCP-Hand book- Washing in immersion basins/tubs .................................... 154
Table 7.8: HACCP-Hand book- Soaking in brine or marinating .......................................... 155 Table 7.9: HACCP-Hand book- Dripping ............................................................................. 156
Table 7.10: HACCP-Hand book- Drying .............................................................................. 157 Table 7.11: HACCP-Hand book- Labelling and packaging in cardboard boxes .................. 158

xx
ANNEXES
Annex 1: Reference for Carbon footprint was collected from literature used in Tables 6.1 and
6.2 (from SKAO 2014, CO2-prestation ladder, Generic Handbook, version 2.2) .................. 205 Annex 2: Environmental CO2 footprint records for solar drying of Siganids in Kipini ........ 207
Annex 3: Environmental CO2 footprint records for Landing Solar Dried Siganids in Kipini
................................................................................................................................................ 209 Annex 4: Environmental footprint records for CO2 for transport fish to the solar Dryer in Kipini
................................................................................................................................................ 209 Annex 5: Environmental footprint records for CO2 during solar drying of Siganid fish in Kipini
................................................................................................................................................ 211 Annex 6: Environmental footprint records for CO2 for fossil fuel during solar drying of Siganid
fish in Kipini ........................................................................................................................... 212 Annex 7: Environmental footprint records for CO2 during filleting of solar dried Siganids in
Kipini ...................................................................................................................................... 214 Annex 8: Environmental footprint records CO2 calculations for solar assisted drying in Kipini
................................................................................................................................................ 214
Annex 9: Environmental footprint records CO2 calculations fuel based drying Kipini ........ 218

CHAPTER 1

2
CHAPTER 1
1.0 INTRODUCTION
1.1. Background
The UN Food and Agriculture Organization (FAO, 2009) stated that “Food security exists when
all people, at all times, have physical, social and economic access to sufficient safe and
nutritious food that meets their dietary needs and food preferences for an active and healthy
life”. Just under one billion people in developing countries go hungry (www.fao.org, 2011) and
60% of infants die from not having enough protein, vitamins and minerals. Food insecurity is
likely to increase because of (i) a rise in population from 7 billion to 9 billion by 2050; (ii)
climate change; (iii) low energy and water availability and (iv) increased amount of food
required (Defra, 2010).
Fish, an important food commodity is worth 148 billion dollars and is consumed world-wide;
it is the main source of protein for nearly one billion people and affects the livelihood of 540
million people globally (FAO, 2007). Therefore, sustainable fisheries are necessary for
nutrition, hunger mitigation and food security. However, fish supplies are reducing because of
climate change, overfishing, pollution, bad management and losses postharvest. One of the aims
of the UN Development goals and the SECUREFISH project, that this research was part of, was
to address postharvest losses by building the local technology through sustainable processing,
storage and quality control of fish and fish products.
The fisheries in Kenya is divided into freshwater and marine water fisheries with total landings
of 160,000 mtonnes. The marine fisheries is now estimated to contribute about 23,000 mtonnes
before exploitation of the 200 nautical mile EEZ stretch with an estimated capacity of 150,000
to 300,000 mtonnes (KMFRI State of Fisheries report 2018). Kenya has now focused on the
blue economy for maximum utilization of aquatic resources. The current GDP from fisheries in
Kenya is 0.5% and with sustainable exploitation of the resources under the Blue Economy, the
GDP is expected to rise to 5%. (KMFRI State of Fisheries report 2018).
Approximately 14,000 fishermen are involved in the coastal fisheries, supporting about 60,000
people in the value chain. About 80% of production is by small scale artisanal fishers while the
rest (20%) is landed by industrial and semi-industrial fishers. The small scale fishers operate

3
traditional fishing boats in the 190 landing sites without ice and proper preservation methods,
and hence suffer post-harvest losses (KMFRI State of Fisheries Report, 2018). Most artisanal
fish landings take place in the reef area where demersal fish account for 45% of the landings.
Siganids are the most abundant demersal fish. The other fisheries include pelagic (35%),
mollusks (9%) and crustaceans (3%) (Figure 1.1). Other specialized fisheries within inshore
areas include sea cucumbers, cephalopods (octopus and squids), and elasmobranchs (sharks and
rays).
Figure 1.1: A comparison of long-term trends in marine fisheries production for Kenya based on (a) officially reported
catches (Source: FAO unpublished data) and (b) reconstructed catches (Source: La Manach, 2005) (Source: KMFRI State of
Fisheries Report, 2018).
Fish protein is important in the diet of local people and the Kenyan Government has targeted
fisheries in their poverty reduction strategy (Harris, 1993, Kenya Vision 2030). Value addition
and post-harvest control therefore become important areas of focus. Some value-added products
have been made from Lates niloticus like fish fingers and fillets but there is a huge gap in the
market for value-added products especially from waste products like bycatch and filleting waste
(FAO, 2007).

4
One of the commonly used traditional fish preservation methods in Kenya is sun drying. This
method or preservation is also reflected in the bulk of fish sold in the markets. The fish landings
in the coastal region of Kenya are low between the months of April and September when it is
raining, and the monsoon winds are strong. Between the months of October to March, there is
glut of fish (Fisheries Report, 2000), sunshine is abundant, fishermen sell fish cheaply to
middlemen and yet they can dry the fish using improved methods to lower moisture content
and store them for use during the lean fishing season.
Most fish landing beaches at the Kenyan coast are far from cities, lack regular transport and
there is no refrigeration as the areas lack power supply. Sustainable methods of fish preservation
therefore need to be developed for such areas for longer shelf life of fish. The traditional drying
methods employed by fishermen at the coast of Kenya include laying fish on rocks (Figure 1.2)
or on the ground to dry (Fisheries Dept Report 2000; personal observation).
Figure 1.2: Traditional drying of fish in the open on rocks in the North coast of Kenya
These traditional methods result in fish drying for a longer time, with risks of lipid and protein
oxidation (Gardner, 1979), poor hygiene and more labour incurred as fish must be brought home
every time it rains and, in the evenings, to avoid overnight dew leading to delayed drying and
higher chances of mould infestation. The fish are also exposed to contamination by dust and
sand including insect infestation. There is also exposure to harmful hazards from improper
human handling and from animals and birds. All these factors result in fish with low overall
quality. The market circulation of such fish is low leading to low income (Bala and Mondol,
2001; Sablani et al., 2003; Sankat and Mujaffar, 2004; Mujaffar and Sankat, 2005).

5
1.2 Hybrid solar tunnel windmill dryer
The quality of cured fish can be improved through technological advances. This will help in
reducing post-harvest losses and produce better quality fish with a wider market appeal. Drying
at higher temperatures and with controlled humidity can make fish dry faster and to a lower
moisture content with increased shelf life. As there is much sunlight available in Kenya,
improved drying methods can help to improve quality. Sustainable supplies of energy which
are cheap include solar and wind energy.
Improved drying was achieved by the introduction of tent-like enclosed solar dryers (Doe et al
1977; Ahmed et al, 1979; Curran and Trim, 1982; Rao et al, 1987; Bala, 1997, 1998; Bala,
2000), but these early models had problems of air movement inside the dryer (Bala and Woods,
1995; Bala and Mondol, 2001) and their drying capacity was also low. Improved dryers with
forced air convection (Elshiatryl et al, 1991; Muhlbauer et al, 1993; Bala, 1997; Bala and
Mondol, 2001) have been fabricated and a tunnel dryer was trialed in Kenya (Oduor-Odote et
al, (2008a) and Shitanda et al, (2008). These forced convection dryers like the solar tunnel dryer
have certain advantages because they have two DC fans at the entrance and exit ends of the
dryer. These fans provide air movement necessary to remove moisture that has evaporated to
the surface of the fish in the drying chamber and replace the evacuated air with fresh warm air
in a continuous process. These two DC fans require very little energy to drive them and a single
photovoltaic source of one deep cycle battery 100Ah and 40W solar panel is adequate. Drying
trials carried out on the Kenyan coast have shown that this solar tunnel dryer is suitable for
drying fish and other farm products (Oduor-Odote, 2009).
Solar drying is not possible on rainy days, damp weather and at night. It is important to have
dryers that allow drying to proceed always. This has been made possible by the introduction of
hybrid dryers that use biomass and solar systems (Elepano and Satairapan, 2001). These
systems use gas or gasifier stoves and agro-waste like coconut husks (abundant in Kenya) and
rice husks. Three disadvantages with this system were: 1) the biomass is obtained at a cost due
to quantities required and 2) this type of hybrid system has fluctuations including quality and
flow rate of drying air which may be due to changes in weather; 3) It is difficult to maintain the
required quality of air and the flow rate when operating supplementary heat sources.
The introduction of a hybrid windmill-solar tunnel dryer is a more efficient method of ensuring
drying is continuous using renewable energy (Figure 1.3). Apart from the advantages of the

6
solar tunnel dryer over the conventional solar dryers, integrating it with a windmill shall widen
the scope of utilization. This is because the windmill can generate its own power and
complement power from the solar system. The windmill will generate electricity and the
electricity will be used for lighting and for heating electric elements at night for heat generation.
The heat will be used for drying. Wind power will also be used to operate a fan for forced
convection through the solar tunnel dryer. This will enhance drying. Wind power and solar
power, both renewable energy types shall complement each other.
Figure 1.3: Schematic view of the Hybrid windmill solar tunnel dryer installed in Kipini, Kenya
The wind blows mostly after sunset and sunshine is available only during the day, if it not
raining. When the sun shines, the solar system produces DC electricity to drive the drying
system in the solar tunnel dryer and to charge batteries or to produce AC electricity after passing
through an inverter. When the windmill operates, its energy is stored in the deep cycle batteries
which generate electricity used in heating the DC coil in the drying chamber at night to enable
drying. Enough energy is also generated to operate the fans in the solar tunnel dryer for forced
air convection through the dryer to enhance drying. Wind power therefore complements solar
power. Drying (recorded by weight loss) is achieved continuously. The power can also be used
for other activities in the locality where fish is being processed. The introduction of a novel
hybrid solar tunnel dryer-windmill system is a more efficient method of ensuring that drying is
continuous and uses renewable energy, compared with the conventional solar dryers; this novel
design was one of the objectives and innovations of this project. Therefore, further
improvements in fish drying methods will help to enhance the quality and handling capacity of
dried fish by artisanal fishermen to reduce post-harvest losses and improve on food security at
the Kenyan coast with the aid of two major sources of renewable energy namely sun and wind.

7
In this study dying models were used to evaluate the performance of the hybrid windmill solar
tunnel dryer during the drying of Siganus sutor (Rabbit fish or Tafi), one of the most popular
fish at the Kenyan coast.
1.3 The fishery and biology of Siganus sutor fish in Kenya
The Kenyan coastline extends from Vanga (4o 40.2’ S, 39o 11.5E) in the south towards Tanzania
and 1o 39.8’ S; 41o, 33.4’ E towards Somalia in the North and covers 83,603km2 (Horril and
Kamau, 2001; Newell, 1959).
The Kenyan marine fishery is divided into industrial, semi industrial and artisanal fisheries. The
artisanal/small scale fishery is the most important fishery in the marine sector and Kenyan coast.
There are over 14,000 fishers using diverse gears with over 3000 vessels that operate in the
shallow reef lagoons and bays (Fisheries frame survey report, 2016, KMFRI State of Fisheries
report 2018).
They use various methods to catch the fish including reef and beach seines, seine, gillnets,
fishing traps like basket traps and fence traps among others (Wambiji et al 2008).
Vessels that are used to deploy basket traps include mashua (2%), ngalawa (1%), dugout (60%),
dau (4%) foot fishers (20%) and mtori (1%). Most of these vessels are non-motorized and are
propelled by sail or paddling (KMFRI State of Fisheries report 2018).
The traps account for 40% of fish landings and are made by local fishers. The traps target
Siganidae (rabbit fish) and the main species of Siganidae are Siganus sutor (Figure 1.4), Siganus
canaliculatus and Siganus argenteus.
These form the core group for the economically important fish to artisanal fishers. Siganids
have the potential of being farmed in Kenya. The Siganids are made up of 2 genera comprising
25 species so far identified.

8
Figure 1.4: Fresh Siganus sutor in Kenyan waters.
The fish are herbivorous, diurnal, tolerate low salinities and feed on benthic algae and associated
flora (Jones and Cooke, 1981, Frose and Pauly, 2004).
The Siganids (Rabbit fishes) reside in shallow lagoons with seagrass beds (Wambiji et al, 2008).
Siganus sutor also known as “Tafi” grows to a maximum length of 45cm and are one of the
most targeted reef fishes with a catch composition by weight of 63% in some areas (Wambiji
et al, 2008) and is most abundant. They spawn in January to February in Kenyan waters, May
to June in Tanzania waters (Wambiji et al, 2008) and appear again in Kipini area April to June
caught by drift net fishers.
1.4 The market value of Siganid fish
The market prices of Siganids in different areas are Kshs. 60/kg (0.6 USD) in Kiunga (Lamu)
in the North, and 250 /Kg in Shimoni south cost (KMFRI Status of Fisheries Report 2018).
The preservation of Siganids by drying will help in making it available all the times once stored
hence reducing frequency of fishing in the reefs because of longer shelf life thus reducing
pressure. Making value added dried Siganid fish products like dried packed fillet will increase
the market value of the novel product resulting in higher earnings.

9
1.5 Quality of Siganids and safety
For fish to be solar dried, an assurance of the quality of the fish being processed is necessary.
Currently on the coast of Kenya, only fish that has started to spoil is subjected to further drying.
This results in low quality fish and a wrong perception amongst consumers that dried fish is
undesirable. It is important to emphasize that the fish to be dried must to be as fresh as possible.
Thus far, there are no quality indicators for fresh Siganids currently in existence in Kenya.
One of the objectives was to establish the Quality Index Method (QIM) for freshness of
Siganids. The QIM was based on organoleptic attributes of the eyes, skin, gills, abdomen and
texture using the standard scores of 0-3 demerit points or index points. It is the sum of these
scores that are summarized and used to grade the Siganid fish. A quality score chart using the
Quality Index Method for Siganid freshness in Kenya has been developed (Odoli et al, 2013).
Coupled with quality are the quality costs during processing and the relationship between the
raw material and final product quality. This innovative way of ensuring fish quality was
investigated in the present novel study on dried fish.
The quality of raw material determines the success of any food processing establishment. Fish
is a highly perishable commodity and loses its quality immediately after catch (Zugarramurdi
et al., 2004). One of the main processing techniques in the fish processing industries is filleting.
This process is influenced by many factors including rigor mortis. Freshness, type of fish (lean
or fatty) and experience of personnel influence the yield and quality of the fillets (Zugarramurdi
et al., 2004). As the filleting time and yield also depend on freshness, a knowledge of freshness
quality of fish is important.
The solar dried Siganids that are dried by improved processing methods like solar drying require
that they meet certain internationally recognized hygiene standards. Development of a generic
HACCP system for solar dried Siganids is therefore important as there is no HACCP system
for solar dried fish in existence. All parameters that go into an HACCP system such as
biological, chemical and physical parameters must be considered including the microbiological
load in the process value chain and risk analysis. Consequently, the hazard analysis and
monitoring scheme was carried out for solar dried Siganids, including the determination of
possible microbiological, physical and chemical food safety hazards, Critical control points
(CCP) and Control points (CP) for each process step. The process steps from purchasing to

10
sales (from reception to transport to the consumer) including production and quality were
investigated in this study so that all the delivered raw material and dispatched final product
were at or below regulatory safe limits.
1.6 Moisture and water activity
Moisture and water activity are two parameters that affect storage of dried fish products because
when the fish muscle is dry, it again becomes hygroscopic and the moisture absorbed is
available for microbial growth. The safer moisture level that prevents microbial growth during
storage is below 25 % and below 15% prevents mould growth (Bala, 2001). Total moisture
content is also useful for weight loss during drying. The water activity is used to determine the
available moisture for microbial growth and values of 0.6 to 0.85 are ideal as 0.85 prevents
growth of Staphylococus aureaus.
Water or moisture content is the total moisture contained in food and is usually written as a
percentage of the total weight:
Mw (Wet basis) = (W-D/W) x 100
Mw = Moisture content on a wet basis
W = Wet weight
D = Dry weight
Water activity indicates the availability of water that promotes biological reactions. Water
activity determines microbial growth. A reduction in water activity causes a reduction in growth
of microorganisms (Oduor-Odote et al, 2010).
1.8 Total Volatile Basic Nitrogen (TVB-N)
Total Volatile Basic Nitrogen (TVB-N) are one of the spoilage indicators of fresh or even dried
fish. The composition of Total Volatile Bases is ammonia and amines like trimethylamine and
dimethylamine. Bacterial enzymes drive the formation of these amines during storage of fish.
As bacteria utilize these nitrogenous compounds, various compounds like hydrogen sulphide,
dimethyl sulphide and methyl mercaptan are formed. These are typical components of spoilt
fish (Zahid et al, 2011).

11
If drying is slow, odours and flavours associated with enzymatic and bacterial spoilage may
develop leading to the formation of nitrogenous volatile bases (TVB-N) from protein and free
fatty acids (Huss 1998). Determination of Total Volatile Basic Nitrogen is commonly used to
evaluate the extent of spoilage in fresh fish (Dhaouadi et al, 2006; Anderson 2008; Torry
advisory note no.92; Loughran and Diamond 2000, Castro et al 2000). The TVB-N
concentration of 30mg/100g is the legal permitted for fresh fish (Anderson, 2008; Torry note
no. 92). TVB-N limits for solar dried Siganid fish are still not known. This is because no studies
have been made in that field.
1.9 pH
Microorganisms grow optimally within certain ranges of pH (Ghaly, 2010). There is normally
an increase in pH of fresh fish samples during ambient or chilled storage. The increase in pH is
attributed to an increase in alkaline compounds like ammonia and volatile bases formed because
of microbial action during fish muscle spoilage. The changes in pH relate to the bacterial type
present, free fatty acids and level of glycogen converted to lactic acid (Huss, 1995; Susanto et
al, 2011). The pH decreases during the initial stages due to rigor mortis and then increases again
during storage due to spoilage bacteria, causing the release of amines (Susanto et al, 2011).
Type of species, fish catching methods, biology, season and methods of killing can affect pH
levels. Studies of pH changes during drying and storage of solar dried Siganid fish have not
been reported as yet.
1.10 Microbiological evaluation
Evaluation of microbiological changes of fish including solar dried fish during storage also
gives a more complete understanding of factors that affect quality. The microbial flora after fish
landing depends on the environment that the fish came from and can vary (Shewan, 1977).
There is a balance in the physiological status of the body that prevents bacteria from attacking
the fish when it is alive though this breaks down upon death of the fish for bacteriological
spoilage to start (Eyo, 2001). The awareness of the consumer on high quality fish products is
increasing therefore processes that avoid any hazards must be put in place and the public assured
(Abolagba & Uwagbai, 2011). A system of fish quality inspection and control in the dried fish
sector must be introduced in Kenya.

12
1.11 Biochemical changes
1.11.1 Lipid oxidation
Fatty fish and fish oils are nowadays considered beneficial to human health and there is an
increase in their consumption. Apart from being rich in essential amino acids, lipid soluble
vitamins like A and D, it is also rich in highly unsaturated fatty acids including eicosapentanoic
acid (20:5 n-3) and docosahexaenoic acid (22:6 n-6) with health benefits to humans (Shahidi
and Miraliakkbari, 2004). Fish oils are composed of 75 % triglycerides and 25% phospholipids.
The fatty acids common in fish oils include saturated fatty acids like myristic, palmitic and
stearic, monounsaturated fatty acids –palmitoleic, oleic, 11-eicosenoic and 11-docosenoic acid.
The polyunsaturated fatty acids are docosahexaenoic acid (DHA, 22:ῳ6) and eicosapentaenoic
acid (EPA 22:5ῳ3). These polyunsaturated fatty acids can have 5 or 6 double bonds making
them susceptible to lipid oxidation resulting in rancidity. The process of rancidity results in
release of many chemicals. Some of the products include mutagens, promoters and carcinogens
like fatty acid hydroxides, hydroxides, endoperoxides, cholesterol and fatty acid epoxides,
enals, aldehydes and free radicals. The polyunsaturated fatty acids need stabilization to avoid
deterioration. Natural antioxidants can be used as one way of stabilizing the oxidising fatty
acids in fish muscle.
It is this high level of polyunsaturated fatty acids which make fish susceptible to spoilage
through oxidation with the resulting products affecting texture, flavor, colour and nutritional
value (Gardner, 1979). Lipid oxidation takes place in both fresh and dried fish products (Oduor-
Odote & Obiero, 2010). There is normally a balance through numerous complex systems that
control pro-oxidant and antioxidant factors. This balance is lost during processing and storage
and lipid oxidation sets in. It depends on handling time and levels of oxidants in the fish tissue
(Alghazeer et al, 2008; Pereira de Abreu et al, 2011).
Lipid oxidation involves a reaction of free fatty acids with oxygen resulting in removal of a
hydrogen atom from one of the double bonds in the fatty acids. The resultant product is a radical
which attacks more fatty acids forming more radicals in the form of unstable hydroperoxides
and peroxidases. These are the primary products of lipid oxidation and they combine finally to
produce volatile or non-volatile stable compounds like aldehydes including malondialdehyde,
pentanal, hexanal some of which influence odour and flavours contributing to rancidity. The

13
aldehyde groups can also react with sulfydryl groups of proteins, nucleic acids and related
amino acids influencing muscle toughness (Esterbauer, 1982; Hoberman & San George, 1988;
Addis, 1986; Gerrard and Brown, 2002; Nair, Cooper, Vietti, and Turner, 1986).).
The classical mechanism of lipid oxidation involves three phases known as the initiation phase
where the free radicals are formed then the propagation phase where more radical are formed
from the free fatty acids and the termination phase as illustrated below:
Initiation: RH + O2 = R. +. OH
Propagation: ROO. + RH = R. + ROOH
ROOH = RO. + OH.
Termination: R. + R. = RR
R. + ROO. = ROOR
ROO. + ROO. = ROOR + O2
RH in this case is any unsaturated fatty acid,
R. is a free radical produced by extracting a labile or reactive hydrogen from a carbon atom
next to a double bond, ROO. is a peroxyl radical and OH. a hydroxyl radical. ROOH is a
hydroperoxide (Frankel 2005).
Most studies on lipid oxidation in fish muscle have been carried out during chilled or frozen
storage, microwave cooking or conventional cooking methods (Yarnpakdee et al, 2012; Cho et
al., 1989; Regulska-Ilow and Ilow, 2002; Gimenez et al 2011). Balogun (1988) carried out a
study on lipid characteristics during sun drying of freshwater Clupeids. There are no reported
studies on lipid oxidation during the process of solar drying of fish. This is important because
lipid oxidation can contribute to flavor and off-odour of fish (Yarnpakdee et al, 2012; Selli et
al, 2009; Azad Shah et al, 2009).
Studies of lipid oxidation during solar drying will help to establish the fate of the
polyunsaturated fatty acids that normally provide health benefits, in solar dried fish.

14
1.11.2 Evaluation of lipid oxidation
PV and TBARS are the main indicators commonly determined for lipid oxidation although there
are others like anisidine, free fatty levels which are also used. (Giménez et al, 2011).
1.11.2.1 Peroxide Value (PV)
The hydroperoxides formed during lipid oxidation is measured as peroxide value. The
maximum limit for peroxide value for fresh fish oil is 7-8mEq /Kg (Boran et al, 2006).
Once formation of secondary oxidation products starts, using peroxide value as an indicator
alone may not give reliable results but is to be used with other indices (Gimenez et al 2011,
Weber et al, 2006). It is not known what levels of peroxide value will be during solar drying
and storage of solar dried fish. The limit of PV for fish oil is 8meq O2/kg of oil (Boran et al,
2006).
1.11.2.2 Thiobarbituric Acid Reactive Substances (TBARS)
Over time, the hydroperoxides decompose to form secondary and more stable products like
aldehydes which contribute to rancidity. One of the products is malondialdehyde (MDA) which
is measured as TBARS though other secondary compounds that may not have necessarily have
originated from lipid oxidation are also measured. The aldehydes like glutaraldehye and
malondialdehyde with difunctional aldehydic groups can react with the nucleophiles and
sulfhydryl groups of proteins and nucleophilic acids as well as related amino acids resulting in
increased toughness and change in functionality. The stable secondary products influence
texture, flavor and odour. In fish oil, the limit for TBARS which is measured as mg
malondialdehyde/kg is 7 to 8 (Gimenez et al, 2011; Boran et al, 2006; Aghazeer et al, 2008;
Esterbauer, 1982; Hoberman & San George, 1988, Shahidi, 1998).
Thus, lipid peroxidation products like peroxides and malondialdehyde were studied to monitor
oxidative rancidity during solar drying and storage of solar dried fish.

15
1.11.3. Interaction of lipid oxidation products with proteins
During storage of dried fish and just like in fresh frozen fish storage, degradation due to lipid
oxidation continues to occur (Oduor-Odote and Obiero, 2009; Badii and Howell, 2001). Lipid
oxidation results in products that affect texture and in case large quantities of lipid oxidation
products like peroxides are accumulated, they can be toxic when eaten (Barber & Berheim,
1967). Biochemicals in foods that are prone to lipid oxidation damage, are proteins and amino
acids. Lipid hydroperoxides interact with protein/amino acids in a complex manner due to
hydroperoxides and the secondary products that decompose thereafter. Proteins on exposure to
peroxidized lipid form hydrophobic associations/and or hydrogen bonds. The secondary
products also produced from peroxides also bind to protein (Sessa and Rackis, 1977; Erickson
et al 1976). Aldehydes, one of the main secondary products bind to hydrophobic sites in the
protein. The lipid-protein complex is due to electrostatic and hydrophobic interaction. Some
aldehydes bind amino groups by making Schiff base adducts (Gardner, 1979).
Other modifications to protein structure due to lipid hydroperoxides and secondary products
include radical reactions producing protein radicals, protein-protein and lipid-protein bonds,
protein and amino acid destruction, activated oxygen and oxidation, reaction with secondary
products like malondialdehyde among others (Gardner, 1979, Auborg 1999, Frankel 1998). It
is this cross-linking of oxidized lipids with proteins that contributes to protein denaturation
ending up by affecting nutritional and organoleptic properties (Tironi et al 2010).
1.11.4 Protein structure
After water, protein makes up the second largest component, about 20% of fish fillet. During
thermal processing, protein denaturation contributes to quality changes in fish muscle. Protein
macromolecules are composed of about 20 amino acids, which comprise essential and non-
essential amino acids that are needed for health and growth. Two essential amino acids,
methionine and lysine are generally found in high concentrations in fish amino acids
(Lehninger, 2008).
Each amino acid has an amino, a carboxyl and an R group (Figure 1.5). The different properties
of amino acids are derived from the R group side chain. They influence properties like
solubility, reactivity of proteins with other nutrients and compounds. The amino acids, which

16
are the main subunits of proteins include leucine, isoleucine, valine, glycine, proline, alanine
and methionine and are in the category of nonpolar aliphatic amino acids. Phenylalanine,
tyrosine and tryptophan are the aromatic fatty acids. Serine, threonine, cysteine, asparagine and
glutamine are the polar uncharged amino acids while the positively charge amino acids are
lysine, arginine and histidine. Amino acids that are negatively charged are aspartatic and
glutamatic acid (Lehninger, 2008).
H H O
H―N―C―C―OH
R
Figure 1.5: Structure of amino acid
Proteins comprise primary, secondary, tertiary and quaternary structure (Damodaran 2008).
The primary structure of the protein is a linear sequence of amino acids in a polypeptide chain
(Lehninger, 2008). The amino acids are covalently attached by peptide bonds. One amino group
from one amino acid links with the carboxyl group from another amino acid to make a peptide
bond with the removal of one molecule of water (Figure 1, 6).
There are two forms of secondary structure of proteins namely the α -helix and β-sheets
(Damodaran 2008). The α-helix is a coiled structure. Each oxygen of the carbonyl group forms
a hydrogen bond with amide-hydrogen of the amino acid further down, to make the polypeptide
chain stable. They also make it rod-like with the R groups or the side chains pointing outwards
from the chain (Lehninger 2008).
The second secondary structure is the β-sheet that resembles a corrugated ribbon like sheet
structure. The hydrogen bonds in the β-sheet occur between atoms of two separate sheets, not
in the same strand. In a sheet, the beta strands can be found facing the same way or the opposite
way (Lehninger, 2008). The third structural arrangement is the tertiary structure. This is a three-
dimensional arrangement of a polypeptide chain which contains helices, beta sheet and random
coil structures. The structure is held together by non-covalent hydrogen, electrostatic and
hydrophobic bonds and covalent disulphide linkages. The quaternary structure is made up of

17
two or more polypeptide chains arranged in a three-dimensional complex. Proteins can further
exist as dimers, trimers and tetramer subunits (Nelson 2008) e.g. myoglobin.
H H O H H O
H―N―C―C―OH + H―N―C―C―OH
R1 R2
→H2O
H O O
H―N―CH―C― N―CH―C―OH
R1 H R2
Figure 1.6: Peptide bond
1.12. Rheological properties
During the drying of fish protein structure is altered simply by loss of water. When the dried
fish is stored, biochemical changes occur that are attributed to lipid and oxidation and protein
denaturation. These changes are both physical and biochemical. The physical changes can be
measured by studying rheological and thermal properties mainly of protein.
1.12.1 Protein denaturation during processing
Denaturation is modification or unfolding of protein and is produced by heating, freezing,
chemicals and shear. For most proteins, denaturation can be considered as an irreversible
endothermic transition. The heat denaturation involves the cooperative or non-cooperative
transition of a protein from its folded to unfolded state due to the breakdown of secondary and
tertiary protein structures. The first stage of denaturation involves non-covalent bonds and is

18
reversible. At higher temperatures, covalent linkages like disulphide bonds lead to aggregation
and irreversible protein denaturation (Comfort 1995); Howell and Saeed, 1999). This process
is also known as gelation. Gelation of proteins occurs when polypeptide chains uncoil and then
interact at specific sites to form a cross-linked network
The intentional unfolding and the interaction of protein molecules with aqueous medium and
induced aggregation in cooking governs the structure, flavour and texture and other qualities of
the food products. It also contributes to the nutritional qualities and to the physical stability of
the foods during storage. However, in preserved fish and fillets texture changes due to protein
denaturation are undesirable as they lead to toughening of the fish muscle due to crosslinking
of the myofibrillar proteins.
1.12.2 Rheological properties of proteins
Rheological studies can help understand what happens during processing and storage of
proteins. Rheology, from the Greek word rheos is defined as the science of flow and
deformation of materials governed by the force, deformation and time. Viscosity, which is
resistance to flow, is used to describe the consistency of fluid materials. Elasticity is usually
associated with the properties of solids and structure. Water has the lowest viscosity and a
rubber ball is perfectly elastic. However, food materials are viscoelastic, neither completely
liquid or elastic but with properties in between the two (Saeed and Howell, 2004).
Four main terminologies in rheology; viscocity, elasticity, viscoelasticity and elastoviscosity
are used to explain the flowing or deforming behaviour of matter over a time period. In viscous
material the applied energy is dissipated into the sample as heat while an elastic material stores
the given energy in the form of elastic potential energy (Comfort, 1995).
G’ (the storage modulus) and G’’ (loss modulus) which are calculated from the strain/stress
amplitude and phase lag as a function of time are used to determine the viscoelasticity properties
of the materials. G; can be referred to as the elastic property while G’’ denotes the viscous
property. An ideal liquid and perfect solid will have phase angle at 90o and 0o respectively.
When the phase angle is between 0-90o C, it is considered a viscoelastic material. However, for
substances with gel forming ability, phase angle at 45oC should not be used as a transition phase
from viscous to elastic material. Instead, the point where the substrate changes from viscous to
elastic material, the so called “gelation point or “cross over point” is obtained when log G’’=

19
Log G’. Not every substance with a gelling ability will have a gelation point. G’ (storage
modulus) has in some studies been found to be higher than G’’ viscous modulus meaning higher
elastic properties or already a gel /solid like (meaning the protein structure was capable of
storing energy rather than letting it be dissipated as heat). The gelation or crossover point for
fresh fish protein components like myosin are between 15 to 40oC (Badii and Howell 2002).
Gelation properties contribute to protein functionality. The onset of G’ in a rheogram rising to
a particular temperature determines the degree of protein unfolding whereas a lower gelling
temperature indicates less energy is required to unfold proteins prior to aggregation. Proteins
which are already unfolded will enter G’ at lower temperatures. For a protein to gel, it must
first denature (unfold) and then cross-link to a three dimensional structure; but on high heating
the denatured proteins can aggregate. Freezing and storage affect gelling properties of fish
protein (Comfort, 1995; Badii and Howell, 2001). During storage of dried fish, toughening can
take place and the ability of the protein to then contribute to gel strength. in the manufacture of
meat products, for example is decreased. Loss of gelling ability is related to the denaturation
and aggregation of myofibrillar proteins.
1.12.3 Thermodynamic properties
The heat effects of denaturation and aggregation of proteins are usually small and have opposite
signs namely heat absorption (endothermic) and heat release (exothermic), respectively.
Differential Scanning Calorimetry (DSC) helps to characterize the thermodynamic and
conformational changes in proteins subjected to a range of temperatures. DSC helps to study
thermal properties of muscle proteins during heat processing and storage and to see the effect
of other nutrients on proteins (Thorarinsdottir et al, 2002).
The DSC scans produced from thermal denaturation of proteins are described in terms of peak
temperatures (Tm) and enthalpy changes. The denaturation enthalpy change is expressed as ∆H.
There can be either endothermic or exothermic reactions that correlate with the remaining
ordered three-dimensional content of a protein. The thermally induced changes that cause
protein denaturation are recorded as a differential heatflow. This is what is displayed as a peak
in the thermogram (Skipnes et al, 2008).
The DSC therefore detects structural melting or unfolding of the molecule due to heating.
During the process of transition of protein from its native conformation to the denatured one,

20
there is rupture of inter and intramolecular bonds with the process occurring in a cooperative
manner.
An endothermic reaction has significant uptake of heat that is recorded in the thermogram. Once
the thermogram is analysed, two parameters can be determined namely the peak transition
temperature or denaturation temperature or maximum temperature (Tmax) and enthalpy change
∆H. There is a correlation between ∆H and amount of ordered secondary atructure. The ∆H
value is derived from endothermic reactions like breakdown of hydrogen bonds. Exothermic
reaction is indicative of protein aggregation and hydrophobic interactions (Skipness et al 2008).
Protein undergoes reversible denaturation by cooling. Changes in enthalpy can be related to
denaturation. A sharp transition peak i.e. denaturation in a narrow temperature gap is denoted
as highly cooperative. Myosin is made up of 6 cooperative domains with transition temperatures
ranging from 43 oC and. If the transition peak is broad, then it means there is loss of
cooperativity via dissociation of oligomers.
When ∆H is reduced, it signifies some loss of protein structure with temperature, in this case
drying. Muscle comprises three types of protein namely actin, myosin and sarcoplasmic
proteins. They however also show different endotherms depending on the part of the body. This
variation could be due to differences in relative quantity of constituent protein, the basic
structure of the protein and interaction of constituent proteins. In a study for cod, the
thermogram showed between 3 to 8 denaturation peaks when scanning from 0 to 110 oC and
these transitions match specific proteins. The first protein to be denatured is myosin at Tm 40-
44 oC (enthalpy values from 44 to 820 KJ/Mol), sarcoplasmic proteins 55-60 oC, actin at 60-76
oC and collagen combined at 42-44oC (Skipness et al 2008; Badii and Howell 2002). The
transitions for fresh and dried fish are different. Tmax shows the highest temperature required
for denaturation. Increases in denaturation temperature with storage can denote aggregation and
a structure that is stable and denatures in a cooperative way.
If protein structure is unfolded, the temperature of denaturation and ∆ H is lowered (Howell and
Saeed, 1999). The presence of antioxidants may stabilize the protein and can cause lowering of
the denaturation temperature. Phenolic compounds may suppress thermal denaturation of
protein probably by reducing the number of hydrogen bonds that are disrupted. Hydrogen bonds
influence denaturation temperature and ∆H (Howell and Saeed, 1999). A decrease in ∆H also
shows partial denaturation. If there is a marked increase in temperature of denaturation, it is
possible that the heated protein formed a complex and stable structure.

21
Interaction of phenols with denatured protein before DSC analysis may be responsible for low
∆H values which can be observed in certain cases. Hydrogen bonds responsible for phenol-
protein binding may break during the heating, contributing to an endothermic peak and the
overall heat enthalpy value. High ∆ H means that the protein is resuming its normal stable
conformation with an increase in denaturation temperature. It is however possible that protein-
phenol complexing may be by hydrophobic interactions. When hydrophobic interactions
decrease, the ∆H would also decrease. The exact nature of phenolic-protein interactions is not
known.
1.13 Antioxidants
Oxidation damages nutritional and organoleptic properties of oily foods. Lipid oxidation occurs
via the initiation stage in the presence of oxygen or metal ion or enzymes and hydrogen is
abstracted near the methylene bond (Frankel, 2005). This is followed by the free radical
propagation stage and finally the interacting of radicals to terminate the autooxidation. The
primary products are lipid hydroperoxides, which are very unstable and degrade to secondary
oxidation products (aldehydes, ketones, alcohols, hydrocarbons) that affect food quality. As a
means of preservation, antioxidants can scavenge free radicals; quench singlet oxygen; have
chain-breaking reducing action; chelate metals or inhibit specific oxidative enzymes.
Antioxidants act by mixed and cooperative mechanisms (Craft et al, 2012).
Depending on their mechanism of action antioxidants are classified as primary or secondary,
(Reische et al., 1998). Primary antioxidants are chain breaking antioxidants that scavenge free
radical that delay or inhibit the initiation step or interrupt the propagation of autoxidation.
Primary antioxidants in foods include tocopherols, butylated hydroxyanisole (BHA), butylated
hydroxytoulene (BHT), propyl gallate (PG) and tertiary-butyl hydroquinone (TBHQ).
Secondary antioxidants like citric acid, lecithin, ascorbic acid and tartaric acid (Zuta et al, 2007)
act as metal chelators, provide hydrogen to primary oxidants and break down hydroperoxides
formed during propagation step. They act on singlet oxygen and absorb ultraviolet radiation.
Secondary antioxidants work synergistically with primary antioxidants to improve antioxidant
activity (Reische et al 1998).

22
There are restrictions in utilization of synthetic antioxidants such as BHT, BHA, and TBQH as
they are not considered safe for food use and customers currently prefer “natural products” (e.g.
ascorbic acid, α-tocopherol or phenolic compounds) from both terrestrial and lately aquatic
plants (Zuta et al, 2007).
Brown algae is a good source of compounds with antioxidative action, and is found in different
regions of the world like Indonesia, Japan, Canary Islands, Norway, the Brittany coast, the
Aegean Sea, Korea, Iceland, Saudi Arabia, Thailand, Mexico, Ireland, Brazil, Hawaii and New
Zealand. Most of the compounds are phenolic with different antioxidant activities (Balboa et
al, 2013). The fucoidan fraction content and structure in macroalgae depends on the extraction
and the depolymerization procedure that alters the antioxidant activity.
A simple and reliable in vitro antioxidant activity tests normally via quenching free radicals by
hydrogen donation, the ability to transfer one electron and other assays (Balboa et al, 2013). In
vitro antioxidant capacity has been used to compare different compounds, but not their
performance in food systems. The complex behaviour is influenced by the substrate, solubility
and phase distribution of the antioxidant and its interaction with the nutrients and physical and
atmospheric conditions (Decker, 1998).
The onset and rate of ipid oxidation in fish can be delayed by the addition of antioxidants
(Pereira de Abreu et al, 2011). Due to possible toxicity and side effects (Safer and Al-
Nughamish, 1999) of commercial synthetic antioxidants, such as butylated hydroxyanisole
(BHA) and butylated hydroxytoluene (BHT) there are strict regulations for their use in certain
countries. Therefore, interest in natural products has increased rapidly, particularly those from
aquatic plants.
1.14 Natural antioxidants
A diverse range of products like tea, wines, beer, rosemary, oregano, spices, herbs, clove, blue
berries, mustard can neutralize free radicals and subsequent reactions that minimize loss of
quality (Pereira de Abreu et al, 2011). Turmeric, macroalgae and plant macrophytes like water
hyacinth can be used as a source of natural antioxidants (Stankovich, 2004; Shanab and Shalaby,
2012; Balboa et al, 2013; Chan et al, 2009) and were adopted in the present study.

23
1.14.1 Curcuma longa
Curcuma longa L. is of Indian origin and belongs to the Zingibareceae family. This plant is
tropical and is grown globally including South East China. The ground rhizomes of Curcuma
longa L called turmeric, and its active constituent, curcumin, are used as a spice and colouring
in curry powders and other condiments. Turmeric is extracted from the root of the turmeric
plant by boiling, drying and finally grinding to a powder. A more concentrated form can be
produced by solvent extraction of the active ingredients curcuminoids. The concentrate, also
known as curcumin is an orange yellow crystalline powder that is soluble in oil (Stankovich,
2004). The health properties of turmeric may be due to anti-oxidant, anti-cancer and anti-
inflammatory properties (Stankovich, 2004; Chan et al, 2009). A study of the different parts of
the plant indicated that rhizomes contained a higher amount of phenols and could scavenge
radicals more efficiently than the leaves of C. longa; however, the leaves had superior metal
chelating ability.
1.14. 2 Euchema denticulatum
There are more flora and fauna in the marine aquatic environment acting as a new source of a
number of new compounds with unique structures (Balboa et al, 2013; Blunt et al, 2012). These
compounds have biological activities useful in the cosmetics, pharmacy, food and
biotechnology industries. Some of the flora, like certain macroalgae, live in stressful aquatic
conditions that require them to deal with free radicals and other oxidants by producing
secondary metabolites that protect against oxidative stress (Balboa et al, 2013). Based on
pigmentation alone, seaweeds (Figure 1.7) are classified into 3 groups – brown (Phaeophceae),
red (Rhodophceae) and green (Chlorophyceae) and all contain active antioxidants at different
levels (Balboa et al, 2013).

24
Figure 1.7: Seaweed farming and harvesting in the South coast of Kenya
Red and brown algae are known to be rich in various bioactive compounds also with antioxidant
activity. Some of the bioactive compounds have been identified from methanol extract fractions
including catechin, flavonols, flavonol glycosides and phlorotannins. These compounds have
unique structures believed to contribute towards their strong antioxidant activity, for example
the polyphenol phenol rings that acts as an electron trap for free radicals (Zakaria et al, 2011).
Despite the diversity of seaweeds along the Kenyan coast, no studies have been reported on
their antioxidant activity. Euchema denticulatum is now farmed in Kenya and is a reliable
source of raw material. Thus far, only ecological and culture studies have been documented on
this species in Kenya. Thus, this study can provide further useful bioactivity data and possibly
increase shelf life of fish and other foods when used as a source of antioxidants. Further, it
would also help to promote the consumption of algae as a food products rich in polyphenolic
antioxidants.
1.14.3 Water hyacinth
One of the alien aquatic plants in Kenya is the water hyacinth Eichhornia crasipes (Mart)
Solms. Its origin can be traced back to the Amazon, Brazil and it is spread all over South
America, the tropics and sub tropics. In 2010, its presence was registered in 62 countries
(Shalaby, 2012; Gao and Bo, 2004; Shanab). The water hyacinth forms dense monocultures

25
over water and disrupts the food chain and ecosystem structure (Dandelot et al, 2008). In Lake
Victoria, Kenya (Figure 1.8), it has influenced fishing and fishermen lifestyles even blocking
routes for fishing vessels. The water hyacinth inhibits growth of certain microalgae in the same
environment (Dandelot et al, 2008) due to allelopathy (Awad, 2008; Jin et al, 2003). Just like
the macro algae, the water hyacinth produces certain metabolites and green algae and
germination of seeds and growth of seedlings can be inhibited by crude allelochemical extracts
from E. carassipes (Awad, 2008; Jin et al, 2003).
Figure 1.8: Water hyacinth in Lake Victoria blocking maritime transport and fishing areas
As mentioned earlier, the human body and food is protected from adverse effects of ROS by
free radical scavengers or antioxidants (Matsukawa et al, 1997). There natural antioxidants are
preferred as there are reservations about using synthetic ones (www.intechpen.com; Grillo and
Dulout, 1995). Phenolics, flavonoids, glutathione have been identified in the water hyacinth
fractions. Water hyacinth therefore just like other marine organisms has shown presence of
bioactive compounds with antioxidant activity. The flavonoids identified by phytochemical
studies in water hyacinth may be responsible for antioxidant activity and they also have high
bioavailability (Abd El-Baky et al, 2008).
1.14.4 Mechanism of antioxidant activity
To limit lipid oxidation, both synthetic and natural antioxidants can be used. The antioxidants
control lipid oxidation by binding competitively with oxygen and retarding the initiation step.
The antioxidants also minimise propagation of free radicals by binding or distruction and form

26
more stable forms of non-reactive antioxidant radicals. They also inhibit catalysts and stabilize
hydroperoxides. When the antioxidants break the oxidative chain reaction by reacting with the
fatty acid peroxy radicals to form stable antioxidants, the end products include non-reactive
antioxidant radicals (Gardner, 1979, Howell and Saeed 1999, Jayanthi and Lalitha, 2012).
Phenolic substances used as antioxidants can react with proteins in a manner that reduces ∆H
values. In complex food systems ∆H is influenced by the environment and presence of other
proteins and nutrients. The hydroxyl groups of the phenolic compounds hydrogen bond with
protein groups exposed by heat denaturation. This reaction may accompany the prevailing
protein-protein aggregation as the proteins denature and increase the exothermic contribution
thereby reducing the enthalpy change DSC values.
1.15 Packaging and Storage
An area which is ignored in the dry chain Kenyan fishery is packaging; it is part of the dry fish
value chain that extends shelf life of a product. Packaging facilitates distribution and display of
the product information and provides consumer appeal (Bykowski and Dutkiewicz 1996).
Packaging in the fishery industry encompasses a wide range of products from moulded
polystyrene containers, paper, laminated cartons with polyethylene or aluminum foil, sheets of
metal, metal foil and plastics including nylon polythene in retail. The packaging for fish
reduces odour and makes it convenient to carry with other purchases (Bykowski and Dutkiewicz
1996).
From a food safety point of view, packaging prevents contamination of food and enhances food
preservation by maintaining the atmosphere in a controlled or modified atmosphere package or
a vacuum package or by preventing rehydration of a dried food. Packaging acts as a barrier for
microbial agents, moisture and oxygen that would further cause deterioration of fish during
storage therefore helps extend shelf life (FAO 2014). Packaging provides an opportunity in the
fish value chain for the product information to be displayed. Fish is highly nutritious with the
polyunsaturated fatty acids and proteins playing a key role in health. Nutritional information,
may boost consumer confidence, improve sales to benefit fish traders.
Modified atmosphere packaging, controlled atmosphere packaging, reduced oxygen packaging
and vacuum packaging have gained attention in the recent past (Hun, 2005; Robertson, 2013
Taheri and Motalebi, 2012). The most effective and widespread packaging method in use

27
currently is vacuum packaging that has been tried in the dry fish chain industry (Erkan, 2016;
Ogongo et al, 2015;Ganguly and Kumar, 2014) where there is an increasing demand for high
quality fish by consumers and targeted export markets. The fisheries sector in Kenya needs to
be part of the improved fish value chain and implement packaging of dried fish products for
improved quality and income for better food security and reduction of post-harvest losses.
One problem encountered after solar drying of fish is appropriate storage conditions. In many
cases in Kenya, the dried fish is stored in jute sacks or baskets or just kept in the open. Storage
in these conditions is unsatisfactory because biochemical and microbiological changes occur
and affect quality (Verma et al, 1995; Sarkardei and Howell, 2007; Oduor-Odote and Obiero,
2009).
Little work has been done on storage of solar dried fish as most focus has always been on frozen
fish with packaging and lately in the presence of certain antioxidants (Rodríguez et al (2009);
Manju et al, 2007). Packaging under vacuum or modified atmosphere conditions is one of the
major developments in food and fish packaging. Vacuum packaging delays spoilage while
maintaining high quality, assures safety and reduces economic loss of fishery products (Goppal
et al, 1999; Manju et al, 2007).) To date there are no studies reported on biochemical changes
with emphasis on lipid oxidation during storage of solar dried Siganids in Kenya. When fish
muscle is dried and stored, it absorbs water because of its hygroscopic nature and leads to
biochemical deterioration. Thus, improved storage of dried fish products using normal
polythene (thin layer, plane films) and vacuum packaging compared with non-packaged fish
were investigated.
1.16 Conclusion
Countries have adopted drying as one measure of preservation of food and with the abundance of
sunlight in Kenya, a solar tunnel dryer to produce a quality assured solar dried fish product and
other products like vegetables can be adopted. Information on fish solar dryers and drying is to be
developed in this study.
This study therefore investigated the design and fabrication of a solar tunnel hybrid dryer to dry
Siganus fish in Kenya continuously in all weather conditions; its effectiveness in reducing the

28
microbiological load and biochemical quality changes, effect of natural antioxidants during
storage, carbon footprint and the collection of data for use in HACCP development of solar
dried Siganid fish.
1.17 Aims and objectives
1.17.1 Aim
The aim of this study was to design and fabricate a hybrid windmill solar-tunnel dryer and to
evaluate the nutritional quality, quality costs, shelf life and safety including carbon footprint of
the solar dried Siganus sutor.
1.17.2 The objectives
(i) Design and fabrication of a hybrid wind mill solar tunnel dryer in Kipini, Kenya
(ii) Evaluation of drying characteristics of Siganid fish product
(iii) Investigation of the microbiological changes and biochemical (protein and lipid
oxidation) of solar dried Siganids during storage with or without natural antioxidants
(iv) Evaluation of rheological and thermodynamic properties of solar dried Siganids
during storage
(v) Development of a quality management guide for HACCP and carbon footprint for
solar dried Siganids

29
CHAPTER 2

30
CHAPTER 2
2.0 Construction and modelling the drying of fish in the hybrid windmill solar-tunnel
dryer
2.1. Introduction
The aim of this study was to design a dryer for artisanal fisherfolk to use in villages on the
Kenyan coast. Fishing is a major form of livelihood and traditionally fish is dried on rocks and
sand which is unhygienic as it is prone to infestation and is dirty. As refrigeration is very
expensive and many villages do not have adequate electricity, the aim was to build a dryer that
would use solar heating during the day. At night and during the rainy season, to facilitate
continuous drying, wind energy can be converted to electricity using a windmill on the coast.
These sustainable forms of energy supplies are cheap and more accessible in remote villages
and can make drying of fish and other produce possible in a safe hygienic way. The performance
of the dryer will however be compared with existing drying models
Modelling is a tool for establishing the ability/availability of use of scientific tools and methods
to predict what happens in real life scenarios. It is not possible to measure the temperature of
the sun, because no one has ever reached the sun. Models have been developed to predict what
is happening in the sun. In the same breadth, it may not always be possible to open a drying
system and measure how the material is behaving. This opening interferes with the environment
in the drying system. It is necessary to be able to predict all the parameters of the drying
material and its environment, if we are to carry out commercial production as opposed to
experimental procedures. This is useful in design of systems, where it is possible to use a
certain model to predict what will happen, as a system is developed. It is also useful in
monitoring the performance of systems, because any deviation from the expected behaviour as
predicted by the model could be monitored and if a part of a system is failing, corrective action
can be taken. The model for use in simulation can be developed from scratch or one can use an
existing model. In this layer drying, several researchers have developed different models to
predict the loss of moisture by a drying material under thin layer conditions. Thus, in most
cases, some researchers in drying have opted to establish which of the models would best
describe the drying of a certain material under certain drying conditions.

31
The process of establishing which model best describes or suits the drying of a certain material
under certain drying conditions requires that a model is used to simulate data, and the data is
compared with experimental or actual data from a certain drying environment. Thus in this
case, 18 models are used to generate data. The data generated by each model is compared with
the actual data using drying coefficient (R2), Root Mean Square Error (RMSE) and as tools
for evaluating the comparative performance of the model against actual data. The requirement
is that the model with the highest value of R2, and the least values of RMSE and is the best
model. This is the criteria used in determining the best performing model for the dryer.
2.2. Materials and methods
2.2.1 Dryer construction at Kenya Marine and Fisheries Research Institute (KMFRI)
The dryer was designed and constructed as described below. The components were the solar
collector, the drying chamber, the hot air chamber, the roof of the dryer, a photovoltaic system,
a windmill with a wind generator, storage batteries, charge controllers, solar panels, a DC coil,
water recirculation pump, solar panels, solar heating, panels for water, insulated water reservoir
tank, copper tubing and wiring and plumbing accessories.
2.2.1.1 Solar Collector
The solar collector was constructed as the main direct heat generation section of the dryer. The
collector had 3 parts namely drying chamber, hot air chamber and the dome shaped roof.
The body of the collector was 9.75 m long, 0.9 m high and 1.2 m wide. The upper part was
covered by the dome shaped roof and the lower part was made of insulation block made of
metal tube frames and wooden blocks(board).
2.2.1.2 The body of the collector
2.2.1.3 The frame
The main frame was constructed by welding using 5.08 cm (2 inch) 2.54 cm by (1 inch) hollow
black metal tubes and 5.08 cm (2 inch) angle bars (Figure 2.1). The angle bars provided support

32
for the floor boards and side boards. They were joined to give a total length of 9.75m (32 feet)
long divided into 4 partitions of 2.4 m (8 feet) by 1.2 m (4 feet each excluding the inlet and
outlet chutes. A 2.54 cm (1inch) by 0.96 cm ( 3/8th inch) angle bar was welded at the base of
the main frame of the dryer to support the side boards to be introduced.
Figure 2.1: Construction of the main frame of collector for the hybrid windmill solar tunnel dryer with the boards and
aluminium sheets
2.2.1.4 The boards
The insulation boards were made of two 3 mm triply sandwiching 50 mm styropol. The top
triply was laminated with a 0.3 mm alluminium sheet and a 3mm triply at the bottom laminated
with a 32 gauge galvanized sheet (Figure 2.1). The sides were bound by a 2.5 mm by 5 mm
timber. The walls of the dryer were covered with insulated blocks made of two 3 mm plywood
sandwitching a 20 mm styropol and the inside triply was laminated with a 0.3 mm aluminium
sheet on the inside and the outside triply was laminated with a 0.3 mm galvanized sheet on the
outside. The blocks were were bound using a 25 mm angle bar and 2.54 cm (1 inch) flat

33
2.2.1.5 The drying and hot air chamber
The wall of the drying chamber had a height of 0.8 m, 2.4 m length by 1.2 m width with
provisions for the drying trays (Figure 2.2). The hot air chamber is basically for heating the
ambient air mainly by the solar collector. The chamber was 2.13 m long 1.2 m width and 0.9 m
high (including the stands). The upper part was covered by the dome shaped roof and the lower
part was covered by an insulation board at the base and walls made of two 3 mm triply
sandwiching 50 mm styropol. The inner triply was laminated with a 0.3 mm alluminium sheet
and a 3 mm triply at the outer laminated with a 32 gauge galvanized sheet. The sides were bound
by an angle bar of 3.50 cm (1⅜ inch) by 0.32 cm ( ⅛ inch).
Figure 2.2: a) The collector and hot air chamber b) Drying chamber
The drying chamber was fabricated in the same way as the hot air chamber and was at the
extreme end of the dryer and had a height of 0.8 m with provisions for the drying trays. At one
end of the drying chamber was attached the solar collector and at the other end was the chimney
allowing for wet air exhaust. The chamber allowed for two drying trays. To enhance the heat
distribution in the drying chamber, provision was made to allow for air exhaust at the bottom
and upper part of the dryer.
2.2.1.6 The roof of the dryer
Materials: Flat bar of 3.8 cm by 0.42 cm 1/6th inch (1 ½ inch by 1/6 inch ), galvanized wire
gauge 20, bolts and nuts M10 7.62 cm long (3 inches), drill bit M10, timber 5.08 cm by 2.54
cm (2 inches by 1 inch) 19.5 m (64 feet) each 2.44 m long(8 feet); timber of 2.54 cm by 2.54
cm (1inch by 1inch) 21.9 m each 2.43 m long (72 feet each 8 ft long), tough bond or Contac

34
glue (HENKEL) 4 litres, wire nails 5.08 cm (2 inch), quantity 1 kg, U V stabilized polythene
200 µ gauge (AMIRAN), silicon tube (black), 5 pieces, roofing nails.
Roof design
The main frame of the roof was made of flat bars reinforced with galvanized wire. The roof was
made into a dome shape to enhance drainage during the rainy season. As a first step, the width
of solar dryer collector area was measured to help determine the mid- point or the ridge. The
ridge or the apex of the dome was 10.0 cm (4 inches) high.
The width of the dome shaped roof was measured by taking the total length across from one
side of the dome roof to the other side and considering the 10 cm (4 inch) height of the apex.
An extra 10 cm (4 inches) and 5 cm (2 inches) on each side) was added to the total width of
the dome shaped roof. This was equivalent to the total length of the flat bar used to make the
roof of the dryer (Figure 2.3). The width of the entire dryer roof therefore consisted of full
length from one side of the dryer to the other including the apex; a total of 2 ½ bars of 5.5 m
(18 feet) length each were used
Figure 2.3: The collector roof of the dryer: Before (a) and after (b) roof installation
The flat bars were cut into desired length using a hacksaw (Raider Ultra). A drill machine
(Makita from Germany) with drill bit M10 was used to make holes that fit M10 bolts and nuts
7.6 cm (3 inches) long on both ends of each flat bar. The flat bars were fastened on to the wall
of the dryer to form the dome shaped roof and painted with red oxide metal paint as an undercoat
to avoid rust, followed by black board paint. Some pieces of 5 cm (2 inches) by 2.5 cm (1 inch)
timber measuring 10 cm (4 inches) in length were cut and firmly fixed on the existing stands of
the dryer to provide support to the 5 cm by 2.5 cm (2 inches by 1inch) timber rail which ran
lengthwise and all-round the upper layer of the wall of the dryer and just at the base of the dome

35
dryer roof. The timber measuring 5.08 cm by 2.54 cm (2 inch by 1 inch ) timber was fixed to
the wall of the dryer using 5.08 cm (2 inch) wire nails. The timber was painted black using
black board paint. The galvanized wire (20 gauge) was then looped over the flat bars at intervals
of 0.3 m (1 foot) each throughout the entire length of the collector.
The stabilized UV polythene (200 µm gauge, AMIRAN Kenya) was then laid on top of the
frames made of the pieces of flat bar and galvanized wire to prevent the UV polythene from
sagging. The overlapping UV polythene was then rolled on to 2.54 cm by 2.54 cm (1 inch by 1
inch) timber and Contac glue was used to further firmly fix the polythene on to the 2.54 cm by
2.54 cm timber (1 inch by 1 inch ). The 1 by 1 timber with the polythene rolled was then then
fixed onto the 5.08 cm by 2.54 cm (2 inch by 1inch ) timber rail that was running lengthwise
and all-round the dryer using iron sheet roofing nails to help provide base support for the UV
polythene. Any open spaces below the roof or in the dryer were sealed with silicon (Pattex,
Smart Universal in 280 ml tubes) using a standard silicon gun to make the chamber air tight and
to prevent any heat loss. The entire wall of the dryer was then painted black using black board
paint to maximize heat absorption.
2.2.1.7 The lower chute
The lower end chute measured 60 cm by 124.5 cm at the dryer connector and narrows to a 50
cm vertical square end after a length of 1 m at the chute connector. It was made of 0.2 cm
mild steel sheets painted silvery on the inside and black on the outside.
2.2.3 Installation of photo voltaic part
2.2.3.1 Power Source
The electrical power required by the dryer is for running the two 12V DC fans at day time. The
power was obtained from a 100 W solar panel and was stored in 100 Ah deep cycle battery.
Figure 2.4 shows the circuit layout for the power system. The power circuit ensured that the
fans could be operated independently and simultaneously. Provision was also made for other
power needs like lighting. The charging of the battery was controlled by a 30 A charge

36
controller. Figure 2.5 shows the circuit layout for the power system. The following are the
considerations that are followed in operating the control panel in the power source:
▪ The power switches should always be maintained off whenever the dryer is not in use.
▪ However, the connection between the battery and the solar module should always be on.
▪ The electrolyte level in the battery should be checked before operation to ensure that it
has.
Figure 2.4: Circuit layout of the power supply system
▪ The LED indicator on the charge controller (Figure 2.5) has the following colorations,
which should be noted, to indicate the level of charge (voltage) in the power system: Red
for low charge, amber for medium charge and green for fully charged capacity. If the LED
indicator is red, this indicates low charge capacity in the battery. It is thus prudent to use
the solar panel in directly running the fans. Hence switch A is maintained open. If the
LED indicator is amber in colour, it means that the level of charge in the battery is at a
medial level. So, it is the prerogative of the operator depending on the availability of
sunshine to either use the solar panel or the battery to run the power to the fans. In case of
low sunshine, it is recommended that the battery be used while in cases of maximum
sunshine it is advisable to save the battery. If the LED indicator is green in colour, it means
that the operator can use either the battery or the solar module to run both fans since there
is adequate power supply.
▪ When no drying is in progress, switches B and C should be maintained open while switch
A is closed to facilitate the charging of the battery.
▪ At times of a low drying load inlet fan is the one to be operational, thus switch A and B
should be open. This facilitates the charging of the battery in conjunction with the
inducement of air into the collector tunnel to dry the fish.
100W
PV Module40W 40WFAN FAN
+
-
20V
+
-
+
-
SCSBSA
+ V112V
1k1k

37
▪ The operator should ensure that the panel is free from dust accumulation before the system
is started. This ensures that there is efficient conversion of solar rays into electrical power.
▪ The outlet plug from the control panel to the dryer should be fitted into the outlet socket
(See Figure 2.5) to facilitate transfer of power from the control panel to the dryer unit.
The control panel can then be switched on.
2.2.3.2 DC heating coil
The DC heater (ELAC, South Africa) was placed in the area before the drying chamber. It
comprises of a DC breaker for protection, a thermostat for temperature regulation, a 400 W DC
element and a blow fan (Figure 2.6). The heater operates on a 12 Volts DC supply. The
thermostat is used to set and regulate the amount of heat dissipated by the heater. Once the set
temperature has been attained, the thermal switch turns off the heater until the temperature drops
below the set value. The cycle is repeated indefinitely.
Figure 2.6: DC coil glowing with heat in drying chamber of the hybrid windmill solar tunnel dryer in Kipini, Kenya
Charge
controller
Switch A
Switch C
Switch B
Socket to
dryer
Figure 2.5: Locations of switches A, B and C and the charge controller .

38
2.2.4 The windmill system
This consists of wind generator, wind controller, battery bank, inverter, associated controls and
mounting.
2.2.4.1 The mast
This is a heavily fortified galvanized steel tower of approximately 10 m height on which the
wind generator is mounted (Figure 2.7).
2.2.4.2 The wind generator
The wind generator makes a rotary motion when it is windy to generate a 3-phase power supply
which is then passed on to the wind controller. The wind controller in turn converts the AC
power from wind into DC power which is suitable for battery charging. It also assists in
regulating battery charging to protect the battery from overcharging.
Figure 2.7: The wind generator about to be hoisted and the windmill in operation for the hybrid windmill solar tunnel dryer in
Kipin, Kenya
2.2.4.3 The battery bank
The battery bank (Figure 2.8) acts as the power storage and supply current to the inverters, fans
and the D.C coil. The inverter provides alternating current (A.C) to serve the circulation pump
and the community

39
Figure 2.8: The battery bank and inverter for the hybrid windmill solar tunnel dryer in Kipini, Kenya
The solar panels substitute the battery charging during day time. A charge controller protects
the batteries from overcharging. The associated controls include isolating switches for different
sub circuits and a changeover switch for selecting either wind power or solar power.
To facilitate DC current transmission a 10.0 mm² armoured cable was laid from the wind
generator to the power control unit built near the solar tunnel dryer. Electrical wiring to the fans
and the D.C coil in the drier were shortened thus reducing voltage drop. The whole dryer system
is shown in Figure 2.9.
Figure 2.9: The drying system of the hybrid windmill solar tunnel dryer in Kipini showing the tunnel dryer, drying chamber,
windmill and hot water system

40
AC power was also supplied to some houses of the local community members to provide
lighting (Figure 2.10).
Figure 2.10: Community house provided with electricity from the hybrid windmill solar tunnel dryer in Kipini
The community members mainly female were trained on how to use the dryer and on how to
utilize the dryer to dry other products like mangoes during seasons when fish catches are low
(Figure 2.11).
Figure 2.11: Members of Kipini BMU drying fish and other farm produce like mangoes during low fishing season in the
hybrid windmill solar tunnel dryer in Kipini, Kenya
2.2.5 Drying of Siganids and drying characteristics
2.2.5.1 The preparation of salted and unsalted the fish samples
Siganid fish (Tafi) was purchased from the Shimoni fish landing site in the south coast of
Kenya, which is 100 km from KMFRI offices in Mombasa. The fish were eviscerated,
thoroughly washed and stored in ice boxes with ice then taken to KMFRI offices where they
were kept overnight, before being further transported to Kipini drying site, 240 km on the North

41
Coast of Mombasa. At Kipini, the fish were filleted and washed thoroughly, before being cut
into samples, approximately 5 mm thick. Three pieces of fish were selected for the
determination of initial moisture content of the fish before drying. A minimum of 270 pieces
were prepared and divided into two sets of samples, each containing at least 135 pieces. One
sample batch was soaked in 5% brine (sodium chloride) and the other in 0% concentration
(water), for 12 hours. In addition, two fish samples were prepared by eviscerating and filleting
of fish. One of the sample was brined while the other was soaked in water, for 12 hours. These
two samples were used to measure the weight loss of the fish as drying progressed (Oduor-
Odote et al 2015)
2.2.5.2 The fish drying process
After sampling for initial moisture content, the rest of the fish were spread in the same tray such
that no sample was placed on top of another, which is typical of thin layer drying. The
arrangement of the samples was such that air that has been used to dry a sample, would not be
used to dry the next sample. The trays were then placed in the dryer for the fish samples to dry.
The drying process was monitored by weighing the two samples every 2 hours using a cell
powered electronic balance (Decker, USA) at two-hour intervals from the start of the
experiment. This was continued until there was no noticeable change in weight of these samples,
when the experiment was stopped.
To analyse the drying process, samples were selected randomly from each treatment at the start
of drying, and subsequently at two-hour intervals. The samples were picked in triplicate at any
sampling time. Since there was no equipment for detailed analysis of the samples at the
experimental site, the samples were weighed to determine their wet weight (ww). They were
then placed and wrapped in properly labelled pieces of aluminium foil, and placed in airtight
seal-lock plastic bags, which were subsequently placed in ice boxes to reduce biological activity
in the samples. The sampling was repeated at 2-hour intervals, until the end of the experiment.
The samples were then taken to the Kenya Marine Fisheries Research Institute (KMFRI)
laboratories (300km) in Mombasa, where they were placed in an air-oven at a temperature of
105oC for 24 hours and moisture determined according to AOAC methods (1990). Upon
removal of the samples from the oven, they were cooled in a desiccator, dry weights, Wd
corresponding to the recorded wet weights Ww, were recorded. The dry basis moisture content

42
M for each sample was determined using equation 1. Based on the Handerson and Pabis thin
layer drying model and according to observations by Kingsly et al. (2007) and Uluko et al.
(2006) for material drying under varying range of relative humidity, which is typical of solar
drying, the moisture ratio (MR) was determined using equation 2. In this equation Mo, k and t
are the initial moisture content on dry basis (kg/kg, d.b), the drying rate constant recorded per
second and the drying time in seconds, respectively. Based on the analysis, moisture ratio drying
curves were developed.
d
dw
W
WWM
−= (1)
kt
o
AeM
MMR −== (2)
The partial differential equation for moisture diffusion can be written as in equation 3, in which
Df is the effective diffusivity. In addition, the solution to equation 3, for thin layer drying of
fish in a tray is as given in equation 4. In which d is half thickness of the drying fish (Vasić et
al., 2012).
MDt
Mf =
(3)
( )
−−
−=
=
tDd
nn
MR f
n
2
2
2
02
12exp12
18
(4)
In typical drying processes, the value of t is large (Sacilik and Unal, 2005), the first term of the
series shown in equation 4 obtained by considering only first term of the series n = 1 and
neglecting the higher term is then used to evaluate moisture ratio as shown in equation 5
(Mudgal and Pande, 2007; Hassini, 2006). Then based on equations 2 and 5, the effective
diffusivity of the Siganid fish can be evaluated as shown in equation 6.
−= tD
dMR f
2
2exp
8
(5)
2
=
dkD f
(6)

43
2.2.5.3 Modelling thin layer drying of fish
The actual moisture ratio data obtained from the experiment was fitted to thin layer drying
models to get the best model fitting the experimental drying data. In total, 18 models (Table 1)
were considered as cited by Barbosa et al. (2007), Gunhan et al. (2005) and Alibas (2012). In
order to obtain the best model based on the two sets of data, the solver function in excel
spreadsheet (MS Excel 2008TM) was used to optimise the sum of the difference of the squares
between the simulated and actual data, for a minimum value. The values obtained were taken
through the various statistical measures of goodness of fit. In Table 2.1, the parameters a, ao, b,
c, g and h are coefficients, n is drying exponent, k, ko, k1, k2 are drying rate coefficients specific
to each equation, t is drying time and L is the thickness of the drying sample
Table 2.1: Mathematical thin layer drying models used to model the drying of fish in the hybrid windmill solar tunnel dryer in
Kipini, Kenya
S/No Model Name Equation
1 Lewis MR = exp( -kt)
2 Page MR = exp(-ktn)
3 Modified page MR = exp(-kt)n
4 Handerson and Pabis MR = a exp(-kt)
5 Yagcioglu et al (Logarithmic) MR = a exp( - kt)
6 Two-term MR = a exp(-k1t) + b exp(-k2t)
7 Two term exponential MR = a exp(-kt)+(1-a) exp(-kat)
8 Diffusional approach MR = a exp(-kt)+(1-a)exp(-kbt)
9 Verma et al MR = a exp(-kt)+(1-a) exp(-gt)
10 Modified Handerson and Pabis MR = a exp(-kt)+b exp(-gt)+c exp(-ht)
11
Simplified Fick’s diffusion Equation MR = a exp {-ct/L2}
12 Modified page equation-II MR = a exp{-c(t/L)2}
13 Midilli and Kucuk MR = a exp(-ktn) + bt
14 Weibul Distribution MR = a - b exp (-ktn)
15 Logistic MR = a0 / 1+(exp(-kt))
16 Jena and Das MR = a exp (-kt + b√t)+c
17 Demir et al. MR = a exp(-kt)n+c
18 Alibas MR = a exp (-ktn+bc)+c
Source: Barbosa et al. (2007), Gunhan et al. (2005) and Alibas (2012)

44
2.2.5.4 Measures of performance of the models
If yi is an observed value, and has an associated modelled value fi then, the mean of the
observed data, ӯ, for a total of N number of observations, is given by equation 7.
=
=N
i
iyN
y1
1 (7)
In addition, the coefficient of determination, R2, can be used to test the linear relationship
between measured and modelled values, as computed in equation 8.
( ) ( )
( )
=
==
−
−−−
=N
i
i
N
i
ii
N
i
i
yy
fyyy
R
1
2
1
2
1
2
2 (8)
The root mean square error, RMSE always positive represented as “zero” in an ideal case,
provides information on the short-term performance and may be computed from equation 9.
( )
−=
=
N
i
ii yfN
RMSE1
21 (9)
The reduced chi-square, may be calculated as in equation 10, where n is the number of
constants in the equation. The lower the values of the reduced the better is the goodness of
fit.
( )
nN
fyN
i
ii
−
−
=
=1
2
2 (10)
These parameters were used in the evaluation of the goodness of fit of the thin layer drying
models to the drying data.

45
2.3 Results and discussion
2.3.1 Performance of the fabricated dryer in the drying of fish
The relationship between the moisture content of salted and unsalted Siganid fish and drying
time as well as dryer and ambient temperature is presented in Figure 2.12. The figure shows
that the moisture content for the drying Siganid fish under the two treatments reduced as the
drying time increased. The figure further shows that the moisture loss was exponential.
This trend has also been reported by Guhnan et al. (2005), Alibas (2012) and Kituu et al. (2014).
As illustrated by Figure 2.12, the reduction in moisture content for the fish under the two
treatments shows similar trends. However, the figure shows that the moisture ratios for the
unsalted fish reduced relatively fast compared to the salted fish, which agrees with the
observations made by Graivier et al. (2006) and Jittinandana (2002).
The reduced drying associated with the salting of fish could be attributed to the binding of
moisture by salt in the fish flesh. On the other hand, a two way statistical Student’s t- test did
not show the existence of any significant difference between the moisture contents of the salted
and unsalted fish during drying (tstat=-1.4832, tcrit, 5%=2.0686).
20
30
40
50
60
70
0.0
0.2
0.4
0.6
0.8
1.0
1.2
0 4 8 12 16 20 24 28 32 36 40 44
Tem
pera
ture
(oC
)
Moi
stur
e ra
tio (
dim
entio
nles
s)
Drying time (hrs)
Salted Unsalted Amb. temp Drying chamber temp
Figure 2.12: Variation of moisture ratio, solar dryer and ambient temperatures during drying of Siganid fillet in the hybrid
windmill solar tunnel dryer in Kipini, Kenya.(Amb = Ambient temperature, Drying chamber temp= Drying chamber
temperature)

46
As observed from Figure 2.12, the harnessing of energy by solar tunnel dryer can be
demonstrated by the high temperatures observed in the drying chamber, compared to the
ambient temperatures. The figure further shows both the ambient and drying chamber
temperatures increased, particularly the latter. However, despite the higher temperatures
developed in the drying chamber, a two-way statistical analysis did not show the existence of
significant difference between the ambient and drying chamber temperatures over the entire
drying period which was a cloudy day (tstat=9.6689×10⁻¹⁶, tcrit, 5%=2.0687). In addition, the
mean temperatures in the drying chamber were not high enough to cause protein denaturation
of the fish proteins.
Figure 2.13 presents the variation of ambient and plenum chamber relative humidity during the
drying period. The Figure shows a high ambient relative humidity, above 25%, throughout the
drying period. This is characteristic of relative humidity along the Kenyan coast, due to the
high water vapour in the atmosphere. The high levels of ambient relative humidity must have
reduced the drying rate of fish and this can lead to prolonged drying periods, and consequently
to spoilage of fish. In addition, for the first 18 drying hours, the ambient and drying chamber
relative humidity values were almost indistinct.
20
30
40
50
60
70
80
90
100
20
30
40
50
60
70
0 10 20 30 40
Rel
ativ
e h
um
idit
y (%
)
Tem
per
atu
re(o
C)
Drying time (hrs)
Ta Td Rha Rhd
Figure 2.13: Variation of ambient and drying chamber temperatures and relative humidity with drying time in drying of Siganid
fillet in the hybrid windmill solar tunnel dryer in Kipini, Kenya (Ta=Ambient temperature, Td= Dryer temperature, Rha=
Ambient relative humidity and Rhd=Relative humidity inside the dryer
Since humidity is related to air temperature, this behaviour is attributed to the ambient and
drying chamber temperatures. The temperatures were low, demonstrated similar trends, and
were almost indistinct within the stated drying period. However, beyond the 18th drying hour,
the ambient temperatures increased, and subsequently, the drying chamber temperature
increased. However, the increase in drying chamber temperature was much more than the
increase in ambient temperature, which demonstrated energy harnessing by dryer. The increase

47
in the temperatures must have resulted in reduction of the ambient and plenum chamber relative
humidity values, and hence improving the ability of the system to dry the fish to a better quality.
This is because lower air humidity results in increased moisture absorption potential (Mujaffar
and Sankat, 2005). A two-way statistical Student’s t-test showed a significant difference
between ambient and drying chamber relative humidity (tstat=7.2543, tcrit, 5%=2.0687).
This further augments the view that the solar dryer was able to harness solar energy for drying.
The high solar dryer temperatures must have resulted in significant reduction in the relative
humidity in the dryer compared to the ambient humidity resulting in increased drying potential
for the solar tunnel dryer. This agrees with the observation by Sahoo (2012) who noted that
relative humidity reduces exponentially as air temperature increases. The safe moisture content
for fish brined in 0 to 15% salt are 0.15 and 0.35 kg/kg, on a dry basis (db) respectively (Brugay
et al, 2003). The final moisture content of 0.2kg/kg, db was shelf stable for dried fish. The
drying of the fish to stable values of moisture content was due to higher chamber temperatures
in the dryer, which must have resulted in better drying conditions for the Siganid fish.
Figure 2.12 shows the relationship between moisture ratio and drying time for the brined and
non-brined Siganid fish. The drying equations with respective R2 values are as shown in
equations 11-12. In these equations, MRs and MRus are the moisture content values for salted
and unsalted fish samples, respectively. It is seen from the results that there was an exponential
decrease in moisture ratio with drying time and a strong correlation existed between moisture
ratio and drying time with high R2 (0.7192-0.8733). The drying rate constant (k) values ranged
from 0.037-0.05 per hour for the salted and unsalted Siganid fish. However, the values
decreased with increase in brine concentration. This implies that an increase in salt
concentration binds water to the fish flesh, and this makes it unavailable for drying.
7192.0),05.0exp(676.1 =−= 2
us R tMR (11)
8733.0),037.0exp(3697.1 =−= 2
s R tMR (12)
Based on the equation 6, the drying rate constants and the thickness of the materials, values of
the effective diffusivity (Df) were 6.53 x 10⁻¹² and 6.63x 10⁻¹² m2/s for the salted and unsalted
Siganid fish, respectively.

48
The Diffusivity is calculated in reference to equations 2 and 6 which are considered to be similar.
Therefore A in equation 2 is equated to 8/π2 in equation 5. Note that equation 2 can be rewritten as
𝑀𝑅 = 𝐴𝑒𝑥𝑝(−𝑘𝑡)
Therefore the terms in the last brackets can be written as
𝑀𝑅 = 𝐴𝑒𝑥𝑝(−𝑘𝑡) =8
𝜋2𝑒𝑥𝑝 (−(
𝜋
𝑑)2𝐷𝑓𝑡)
From this equation it clear that
𝑘 = (𝜋
𝑑)2𝐷𝑓
Or
𝐷𝑓 =𝑘𝑑2
𝜋2
The value of k is determined by developing equations from the graphs. These equations are
given as equations 11 and 12. From these equations, the values of A and k for both salted and
unsalted conditions were determined as the values before the t in the exponential (exp) terms.
The parameter d in equation 4, 5 and 6 is given as half of the thickness of the fish. In section
2.2.5.1. it is indicated that the fish samples were cut into pieces of approximately 5mm
thickness. Thus d would take the value of 2.5mm or 2.5×10⁻³m. Thus with the values of k
and d known, then Df could be determined.
These values further augment the observation that the unsalted samples dried much faster than
the salted samples. The low values of R2 of 0.7192 and 0.8733 for unsalted and salted fish,
respectively, indicated that the Lewis model may not be the best model that describes the drying
of Siganid fish in the hybrid windmill -solar tunnel dryer. It was therefore necessary to evaluate
the thin layer drying model that best describes the drying of Siganid fish in this dryer.
2.3.2 Modelling of the drying of fish in the dryer
The performance parameters of the various thin layer drying models in Table 2.1 were as shown
in Table 2.2 with actual values. The various magnitudes of the performance parameters used
to test the performance of the models are shown in the table. Based on R2, RMSE and reduced
2, the table further shows that different models performed differently, in modelling the drying

49
of fish in this dryer. Based on the performance criteria, where the best performing model would
have the highest value of R2, and least values of RMSE and reduced 2, for salted fish, models
2, 9, 12 and 16 had the highest R2 values at 0.9665, 0.9432, 0.9665 and 0.9154, respectively.
Similarly, using RMSE, the same models had values the least values at 0.0539, 0.0691, 0.0539
and 0.0843, respectively. Thus, based on R2 and RMSE, models 2 and 12 were the best
performing models. In addition, based on 2, the models had the best performance at 0.0032,
0.0055, 0.0033 and 0.0081, respectively.
The page model is of the form
𝑀𝑅 = exp(−𝑘𝑡)𝑛 5
This equation can be rewritten as
𝑀𝑅 =1
exp(𝑘𝑡)𝑛 6
This implies that for the same value of t, a material with high value of k would have lower
values of MR. This implies that the higher the value of k, the lower the rate of loss of moisture.
This accounts for the reason as to why the unsalted fish has a lower value of k = 4.78×10⁻⁶hr-1,
and losses moisture faster than the salted material with a higher value of 1.0573×10⁻⁴ hr-1.
Thus, the best model for the drying of the salted fish in the hybrid windmill solar tunnel dryer
was model 2, with the highest R2, and the least RMSE and reduced 2. The trend was similarly
observed for unsalted fish, in which the models 2, 9, 12 and 16 had the highest values of R2
(0.9434, 0.9228, 0.9434 and 0.8940, respectively), lowest values of RMSE (0.0840, 0.0980,
0.0840 and 0.1148, respectively) and 2 (0.0077, 0.0110, 0.0081 and 0.0151, respectively).
Since model 2, the Page model, had the highest of R2 and least RMSE and reduced 2 in the
drying of unsalted fish in the hybrid windmill solar tunnel dryer, it was considered the model
that describes the drying of unsalted Siganid fish in this dryer. Thus, it can be inferred that
model 2, the Page model, best describes the drying of salted (5%) and unsalted Siganid fish
drying in the hybrid windmill-solar tunnel dryer. A two-way statistical analysis did not show a
significant difference between modelled and actual moisture ratio for salted (tstat=8.0267×10⁻²,
tcrit, 5%=2.0687) and for unsalted (tstat=2.8740×10⁻⁵, tcrit, 5%=2.0687) at 5% level of significance.
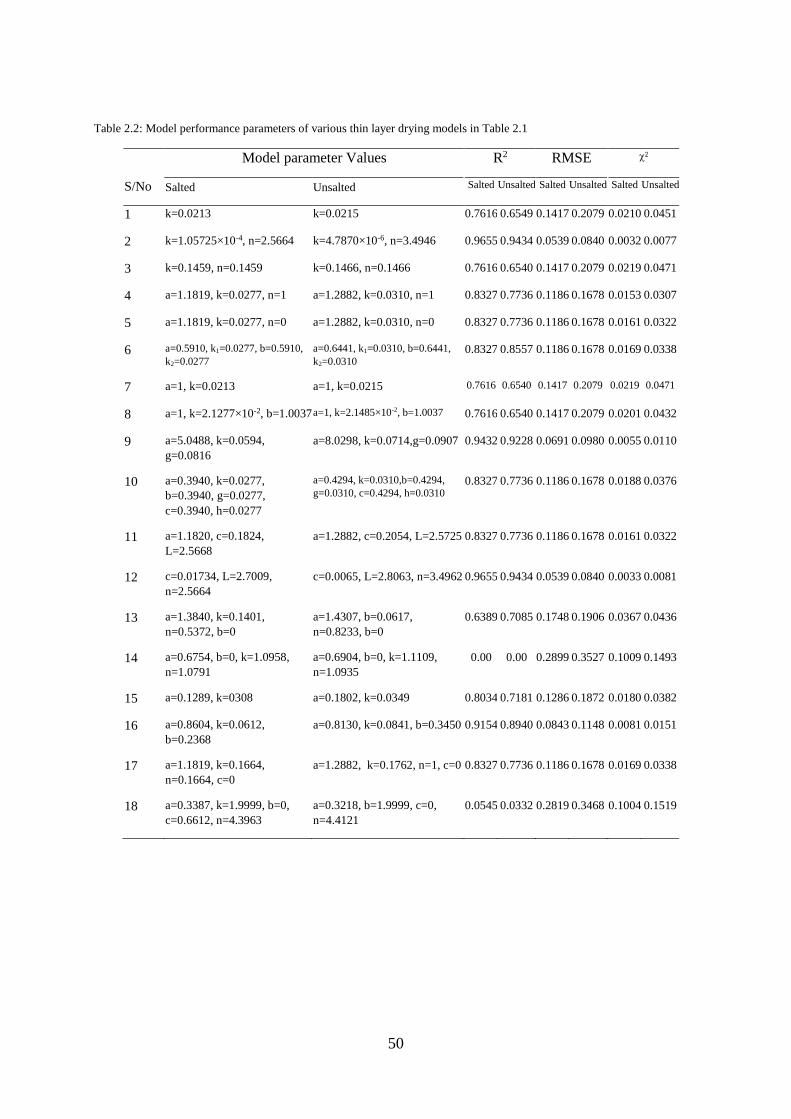
50
Table 2.2: Model performance parameters of various thin layer drying models in Table 2.1
Model parameter Values R2 RMSE 2
S/No Salted Unsalted Salted Unsalted Salted Unsalted Salted Unsalted
1 k=0.0213 k=0.0215 0.7616 0.6549 0.1417 0.2079 0.0210 0.0451
2 k=1.05725×10⁻⁴, n=2.5664 k=4.7870×10⁻⁶, n=3.4946 0.9655 0.9434 0.0539 0.0840 0.0032 0.0077
3 k=0.1459, n=0.1459 k=0.1466, n=0.1466 0.7616 0.6540 0.1417 0.2079 0.0219 0.0471
4 a=1.1819, k=0.0277, n=1 a=1.2882, k=0.0310, n=1 0.8327 0.7736 0.1186 0.1678 0.0153 0.0307
5 a=1.1819, k=0.0277, n=0 a=1.2882, k=0.0310, n=0 0.8327 0.7736 0.1186 0.1678 0.0161 0.0322
6 a=0.5910, k1=0.0277, b=0.5910,
k2=0.0277 a=0.6441, k1=0.0310, b=0.6441,
k2=0.0310 0.8327 0.8557 0.1186 0.1678 0.0169 0.0338
7 a=1, k=0.0213 a=1, k=0.0215 0.7616 0.6540 0.1417 0.2079 0.0219 0.0471
8 a=1, k=2.1277×10⁻², b=1.0037 a=1, k=2.1485×10⁻², b=1.0037 0.7616 0.6540 0.1417 0.2079 0.0201 0.0432
9 a=5.0488, k=0.0594,
g=0.0816
a=8.0298, k=0.0714,g=0.0907 0.9432 0.9228 0.0691 0.0980 0.0055 0.0110
10 a=0.3940, k=0.0277,
b=0.3940, g=0.0277,
c=0.3940, h=0.0277
a=0.4294, k=0.0310,b=0.4294,
g=0.0310, c=0.4294, h=0.0310 0.8327 0.7736 0.1186 0.1678 0.0188 0.0376
11 a=1.1820, c=0.1824,
L=2.5668
a=1.2882, c=0.2054, L=2.5725 0.8327 0.7736 0.1186 0.1678 0.0161 0.0322
12 c=0.01734, L=2.7009,
n=2.5664
c=0.0065, L=2.8063, n=3.4962 0.9655 0.9434 0.0539 0.0840 0.0033 0.0081
13 a=1.3840, k=0.1401,
n=0.5372, b=0
a=1.4307, b=0.0617,
n=0.8233, b=0
0.6389 0.7085 0.1748 0.1906 0.0367 0.0436
14 a=0.6754, b=0, k=1.0958,
n=1.0791
a=0.6904, b=0, k=1.1109,
n=1.0935
0.00 0.00 0.2899 0.3527 0.1009 0.1493
15 a=0.1289, k=0308 a=0.1802, k=0.0349 0.8034 0.7181 0.1286 0.1872 0.0180 0.0382
16 a=0.8604, k=0.0612,
b=0.2368
a=0.8130, k=0.0841, b=0.3450 0.9154 0.8940 0.0843 0.1148 0.0081 0.0151
17 a=1.1819, k=0.1664,
n=0.1664, c=0
a=1.2882, k=0.1762, n=1, c=0 0.8327 0.7736 0.1186 0.1678 0.0169 0.0338
18 a=0.3387, k=1.9999, b=0,
c=0.6612, n=4.3963
a=0.3218, b=1.9999, c=0,
n=4.4121
0.0545 0.0332 0.2819 0.3468 0.1004 0.1519

51
2.3.3 Drying temperatures in the hybrid windmill solar tunnel dryer at night
The drying temperatures recorded were as shown in table 2.3 and figure 2.14; they indicated
that a higher temperature inside the dryer were recorded.
Table 2.3: Humidity, temperature and wind speed at ambient conditions and inside the the hybrid windmill solar tunnel dryer
system at night
Conditions
Dryer condition
Ambient air temperatures,
humidity and wind speed
Time Temp Humidity W/Speed Temp Humidity W/Speed
All systems on, cloudy
weather
9.00 am 30.3 81.6 0 28.8 75.2 2.5
Conditions 10.00am 35.9 54.1 0.4 30.4 67.6 0.8
11.00am 39.2 47.3 0.3 32.1 67.1 1.1
12.00 am 39.2 51.2 0.4 31 68.9 2
1.00pm 38.3 64.4 0.6 29.3 64.4 0.5
2.00pm 33.6 66.2 0.6 31 71 2.2
3.00pm 30.9 66.9 0.3 28.9 76 2.6
4.00pm 29.6 75.9 0.4 27.8 75.9 0.9
5.00pm 27 78.3 0.2 27.1 81.1 0.5
6.00pm 26 82.6 0.4 26.4 79.7 0.9
Only the heater is on 7.00pm 27.3 76.9 0.6 26.6 77.7 1.4
8.00pm 30.8 72.5 0.8 26.4 78.6 2.4
8.15pm 34.2 66.6 0.8 26 81.2 2
8.30pm 34.8 60.5 1.1 25.6 84.3 1.9
8.45pm 35.2 51.3 1.2 25.2 80 2.5
9.00pm 29.9 73.3 1.5 25 86 2.3
Heater switched off 9.15pm 28.6 73.9 0.9 24 85.1 2.8
9.30pm 26.6 76.8 1.6 23.3 86.6 3
It is noticed that when the heating coil was in use at night, the temperatures in the drying
chamber from 7 pm to 9 pm ranged between 27.3 oC and 35.2 oC which can allow drying as
opposed to the range of 24 oC to 25 oC in ambient air.

52
Figure 2.14: Changes in temperature and humidity with time during the drying of Siganus sutor using integrated windmill
solar tunnel dryer.
2.4 Conclusions
The results of this study indicate that the hybrid windmill solar tunnel dryer is capable of
harnessing solar energy compared with open sun conditions, as the ambient temperatures were
always lower than the plenum chamber temperatures, despite the temperatures not showing any
statistical difference (tstat=9.6689×10⁻¹⁶, tcrit, 5%=2.0687). In addition, it showed that the
moisture content of fish reduced with drying time, and the reduction was exponential (Figure
2.12), both under salted and unsalted conditions. Based on the Handerson and Pabis model, the
drying rate constant for the salted and unsalted fish was 0.0371 and 0.0377 hr-1, respectively,
while the values of the effective diffusivity (Df) were found to be 6.53 x 10⁻¹² and 6.63x 10⁻¹²
m2/s for the salted and unsalted fish, respectively.
The Page model was established as the best model that describes thin layer drying of Siganus
sutor fish in the integrated wind-solar tunnel dryer.
Drying temperatures of 35 oC achieved at night can facilitate drying and prevent spoilage and
the final moisture content attained was 19.98% suitable for shelf-life storage.
0
5
10
15
20
25
30
35
40
0
10
20
30
40
50
60
70
80
90
100
7.00pm 8.00pm 8.15pm 8.30pm 8.45pm 9.00pm 9.15pm 9.30pm
Tem
p. (
0 C)
Hu
mid
ity
leve
l (%
)
Drying time
Dryer Humidity Ambient Humidity Ambient Temp Dryer Temp

53
CHAPTER 3

54
CHAPTER 3
3.0 Biochemical, Microbiological and Quality of Siganus Sutor fillets
3.1. Introduction
The quality of raw fish can substantially influence the dried product quality. The fish quality
changes further during processing by solar tunnel drying and subsequent storage. The objective
of this chapter was to assess the effect of delayed processing on biochemical microbiological
and quality changes of Siganus sutor fillets starting from catch, during handling and processing
and storage using the fabricated solar tunnel dryer (Chapter 2).
The main biochemical and nutritional changes monitored were water activity and moisture,
which affect biochemical and microbiological properties; pH; lipid oxidation parameters
peroxide value and thiobarbituric acid related substances (TBARS) that cause rancidity and
production of toxic substances and TVB-N which alters the product quality. The influence of
raw material quality (fresh or stored) on the solar tunnel dried product yield and productivity
costs was also assessed as it affects eating quality, creates wastage and increases cost to the fish
processor. This was done over a 4 hr delayed processing period. Finally, the influence of
delayed icing over 10 hrs on the drying and biochemical properties was investigated to
understand the changes and improve the quality of the final dried product. The microbiological
quality and safety of the products were also assessed in freshly landed fish and solar dried fish
together with the assessment of the bacterial quality of the ice and water used for chilling fish.
3.2. Materials and Methods
3.2.1 Influence of processing time on fillet yield and quality
3.2.1.1 Fish handling
The study was conducted between 27-30th of November 2013 in Kipini, North coast of Kenya.
Arrangements were made with selected fishermen going to sea to sex and gut the Siganus sutor
fish (Rabbit fish or Tafi) immediately after capture and group them based on time of capture

55
and size. Upon landing and prior to the study, fish were kept temporarily iced. The fish were
then inspected further to confirm gutting. They were immediately washed and put on the
processing table and separated into three batches.
Each batch was assessed for freshness to determine the quality of freshness by observing the
gills, the skin and the eyes. The % yield was determined while filleting the Siganids before
being transferred to the clean cooler box. One batch was filleted immediately by experienced
personnel and was used as fillets at time 0. The second batch was filleted after 2 hours and the
third batch after 4 hours and were recorded as time 2 and time 4 respectively. All the fillets
were chilled immediately after filleting to reduce autolysis and bacterial activities. Samples
were randomly picked for yield (cost) estimation, microbial and biochemical analysis following
designed sampling protocols described below. Fresh samples for microbiological analysis were
taken and transported to the laboratory immediately for analysis 240 km away to Kenya Marine
Fisheries Research Institute (KMFRI), Mombasa.
3.2.1.2 Influence of Raw Material Quality on Process Yield
Organoleptic assessment of fresh Rabbit fish was performed to group fish in different quality
grades using the Quality Index Method (QIM) scheme developed for Siganids as shown in Table
3.1. From a previous study, a score of beyond 15 out of a maximum of 21, had been used as
unfit for human consumption (Odoli et al 2013). Based on this, 4 quality groups can be
categorized as score ranging from 0-3, 4-7, 8-11 and 12-15 as shown in Table 3.1(Odoli et al
2013)

56
Table 3.1: Quality Index Scores for Siganids
Quality parameter Description
Sco
re
Sample
codes
Skin
Colour/
appearance
Fresh, bright metallic 0
Dull metallic 1
Dull yellowish near the abdomen 2
Mucus Clear, no clotting 0
Milky, clotted 1
Yellow and clotted 2
Odour Fresh sea weed 0
Neutral, musty 1
Hey, sour 2
Rotten, ammonic 3
Texture In rigor 0
Finger mark disappears 1
Soft and Leaves mark 2
Eyes Cornea Clear 0
Milky 1
Pupils
Clear & back 0
Opaque 1
Grey 2
Form Convex 0
Flat 1
Sunken 2
Gills Colour/
appearance
Bright light red 0
Becoming discoloured/light brown 1
Grey-brown, brown, grey, green 2
Mucus Transparent/clear 0
Milky, clotted 1
Brown, clotted 2
Odour Fresh seaweed 0
Neutral/musty 1
Sour, mouldy 2
Rotten 3
Quality index (0-21)
A quality method for dried fish, based on organoleptic assessments, is yet to be developed. The
organoleptic quality of Siganids freshness were assessed by observing the skin, gills and eyes
at time 0 (initial time) time 2 (after 2 hrs) and time 4 (after 4 hrs) of delayed time to drying.

57
Three quality categories were identified based on storage time at ambient temperature; for
purposes of this study, the ones that were sampled at 0 hr were referred to as grade 1, those
sampled after 2 hr storage as grade 2 and grade 3 for those sampled after 4 hrs. The fish were
held in ice at sea so these grades are valid for very fish Siganids. Each quality level had five
pieces of fish later referred to as replicates. Upon grading, the respective costs were determined
based on the time taken for filleting the replicates and yield based on the fillets weight as a
percentage of the whole fish weight.
3.2.2. Biochemical analysis during delayed processing
Samples were kept iced in a cooler box for 3 days prior to transportation to the laboratory. The
parameters tested included Water activity, Moisture, pH, peroxide value (PV), total volatile
base nitrogen (TVB-N), thiobarbituric acid number (TBARs).
3.2.2.1 Water Activity (aw)
Water activity in the three categories of fish in delayed icing for 0, 2 and 4 hrs which for
purposes of this study were called grade 1, 2 and 3 were measured using water activity meter
(DECAGON-USA) and the results recorded accordingly.
3.2.2.2 Moisture content
Moisture content was analyzed using AOAC 1990 method of analysis.
Approximately 5.0 grams of sample was weighed and recorded accordingly in a pre-weighed
aluminum foil and then placed in an air oven to dry at 105oC for 24 hrs. The sample was
removed and re- weighed again, and the weights recorded accordingly. Moisture content was
calculated as follows:
Moisture content X (%wb) =
Moisture content (%db) = X100

58
3.2.2.3 pH
Changes in pH of the Siganid fish samples were measured for each batch using a pH meter
Make: HANNA; Model No. Hi 9025
3.2.2.4 Peroxide Value
The peroxide value is the amount in ml of 0.002 M sodium thiosulphate solution needed to
titrate the iodine released from potassium iodide as a result of the activity of the peroxides
contained in 1 g of fat. The principle of the method involves taking a sample for analysis in an
acetic acid and chloroform solution, titrating it with a potassium iodide solution, and titrating
the iodine released using a sodium thiosulphate solution (Regulska-Ilow, 2002).
PV was determined according to Alghazeer et al, (2008). Air was expelled from a conical flask
by using nitrogen gas prior to start of the experiment. Fish oil (0.5 g) was weighed into the flask
then 10 ml chloroform and 15 ml acetic acid was added. 1 ml of fresh saturated potassium iodide
was then added. The flask was sealed and swirled gently to mix the solution for 1 min then
placed in a dark cupboard for 1 min. Subsequently about 1 ml of starch solution was added. The
coloured solution was titrated with 0.002 N (M) sodium thiosulphate solution. A control sample
without fish oil was also analyzed. Peroxide value was calculated as below and results expressed
as MilliEquivalents O2/kg follows:
PV= (PV titre – PV blank) x N x 1000
Weight of fat used.
3.2.2.5 TBARS
Thiobarbituric acid value (TBARS) was determined as according to Pearsons (1981) as follows;
The sample (10 g) was macerated with 50 ml distilled water for 2 minutes and then washed into
a distillation flask with 47.5 ml distilled water. 2.5 ml of 4 M HCl was then added to the solution.
Antifoaming glass beads were put in the heating flask to reduce overflow of solution. The
solution was heated using an electric mantle and a distillation unit to allow the collection of
distillate. The distillate (50 ml) was then collected and 5 ml of the distillate was transferred into
a glass stoppered tube using a pipette in triplicate. To each 5 ml solution, 5 ml of TBA reagent
was added shaken and boiled for 35 minutes, cooled for 10 minutes. The optical density was
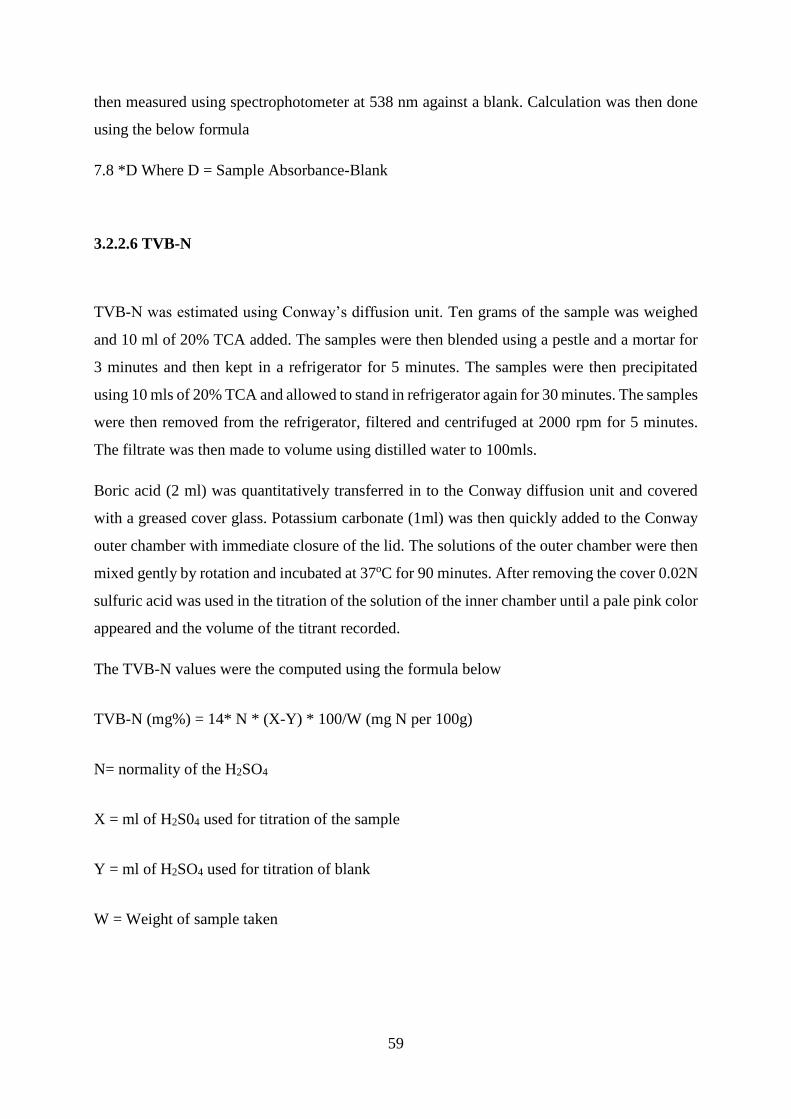
59
then measured using spectrophotometer at 538 nm against a blank. Calculation was then done
using the below formula
7.8 *D Where D = Sample Absorbance-Blank
3.2.2.6 TVB-N
TVB-N was estimated using Conway’s diffusion unit. Ten grams of the sample was weighed
and 10 ml of 20% TCA added. The samples were then blended using a pestle and a mortar for
3 minutes and then kept in a refrigerator for 5 minutes. The samples were then precipitated
using 10 mls of 20% TCA and allowed to stand in refrigerator again for 30 minutes. The samples
were then removed from the refrigerator, filtered and centrifuged at 2000 rpm for 5 minutes.
The filtrate was then made to volume using distilled water to 100mls.
Boric acid (2 ml) was quantitatively transferred in to the Conway diffusion unit and covered
with a greased cover glass. Potassium carbonate (1ml) was then quickly added to the Conway
outer chamber with immediate closure of the lid. The solutions of the outer chamber were then
mixed gently by rotation and incubated at 37oC for 90 minutes. After removing the cover 0.02N
sulfuric acid was used in the titration of the solution of the inner chamber until a pale pink color
appeared and the volume of the titrant recorded.
The TVB-N values were the computed using the formula below
TVB-N (mg%) = 14* N * (X-Y) * 100/W (mg N per 100g)
N= normality of the H2SO4
X = ml of H2S04 used for titration of the sample
Y = ml of H2SO4 used for titration of blank
W = Weight of sample taken

60
3.2.3 Biochemical changes during solar drying
3.2.3.1 Fish handling
Fresh Siganids (Tafi) were obtained and treated as in section 3.1.1 above. The icing was delayed
for 0, 2, 4, 6, 8 and 10 hrs and quality index used according to Table 3.1 to establish quality.
Fresh samples for microbiological analysis were transported to the laboratory immediately for
analysis.
3.2.3.2 Drying
The hybrid windmill solar tunnel dryer fabricated in Kipini was used to dry the fillets (Chapter
2). The samples were removed from the cooler box and put on the trays at an inclined angle to
drain excess water and were transferred into the dryers after 30 minutes and placed in the solar
dryer trays in 6 different batches according to the time of delay before start of drying. The delay
in time was 0, 2, 4, 6, 8 and 10 hrs delayed processing. Each batch was monitored for weight
loss by taking measurements of triplicate samples every 2 hrs.
Physical parameters like temperature and humidity inside the dryer were also taken every 2 hrs
as the drying continued using temperature-humidity DECKER (USA) data logger.
The drying was ended when there was no further change in weight with time hence no further
weight loss. The samples for moisture loss analysis were then separately wrapped in aluminum
foil in batches, put in the transportation containers and transferred to the laboratory for analysis.
The fish dried here was only for biochemical and microbiological parameters during drying and
storage.
3.2.3.3. Biochemical parameters during drying
Samples for the determination of water activity, moisture content, pH, PV, TBARS, TVB-N
were taken and carefully wrapped in aluminum foil and then put in seal-lock polythene bags
and kept in an icebox for analysis in the laboratory.

61
3.2.4 Microbiological analysis
3.2.4.1 Sample collection and preparation for analyses
The Siganus fish species samples for analysis were taken from the same batch for quality
analysis in section 3.2.3 above. The fresh fish samples were aseptically wrapped in sterile
aluminium foil, labeled, stored in ice in a cooler box, and immediately transported to KMFRI
laboratory within 5 hours of purchase for microbiological analyses. At the end of 3 days of solar
drying, dried fish samples were also aseptically collected and taken to the laboratory for storage
and analysis. Processing water and storage ice was also analyzed for bacteriological loads using
the most probable number (MPN) method.
3.2.4.2 Isolation and enumeration of bacteria
Spoilage Specific Organisms (SSO’s) which cause sulphide food spoilage were cultured by
inoculation of 1ml of the final dilution of the same homogenate on selective iron sulphite agar
(ISA) plates and subsequent incubation at 25°C for 5 days. The media used for the enumeration
of food spoilage microorganisms contain sulphite reductase enzyme in their cytoplasm. The
enzyme catalyzes the intracellular metabolism of sulphites into hydrogen sulphide (H2S) which
contributes prominently to the off-oduor associated wish sulphide fish spoilage. Consequently,
the bacteria are identified as black colonies on the ISA plates. The black coloration is a result
of the formation of a precipitate yielded by the reaction between an iron (III) salt (a constituent
of the ISA) and the produced sulphide.The Siganid fish samples were homogenized in the
laboratory and 25 g of fish tissue used for Total Viable Bacteriological Counts (TPC) using the
spread plate technique as described by Lakshmanan et al., (2002). The total viable counts for
the Specific Spoilage Organisms (SSO) were determined by spread plating of the sample
aliquots on iron sulphite agar (ISA) then by aerobic incubation at 25 °C for 5 days. H2S
producing bacteria were determined by counting black colonies on ISA and expressed as CFU
g-1.
3.2.4.3 Storage of fish for microbiological analysis
The samples were stored in a similar manner as for biochemical analysis in section 3.1.1 in
three different ways. One set of samples was kept in an ordinary polythene bag and sealed using
a sealing machine, one kept in open dishes and the third one vacuum packed using vacuum

62
packer. Sampling was done after every 14 days for one month to assess the shelf life of each,
by analyzing the biochemical and microbiological as well physical parameters used as
indicators of spoilage. Temperature and humidity were also monitored daily in the laboratory
to determine the changes in the condition of ambient air surrounding the Siganid fish during the
storage.
3.3 Results and discussion
3.3.1 Quality scores during delayed icing for 0-4 hrs category
There are various ways of evaluating fish quality but sensory techniques still remain the most
reliable and easy to use (Ólafsdottir et al, 1997). The sensory methods used commonly involve
presenting raw and cooked fish to trained panelists to quantitatively evaluate, using preset
objective terms and numerical scales. This Quantitative Descriptive Method (QDA) has found
wide application in seafood evaluation (Johnsen and Kelly, 1990; Gines et al 2004). The QDA,
however, is limited because the panelists must be properly trained to give a thorough description
of quality (Nelsen and Green, 2007).
Currently, Quality Index is used that has advantages because it addresses the unique
characteristics of spoilage patterns and indicators of each species (Nelson and Green, 2007).
Therefore there is no general quality index scheme and has to be specific for each fish species.
The parameters evaluated like eyes, gills, appearance, odour, and texture are specific. In Quality
Index Method (QIM) system, there is a linear relationship between Quality Index and storage
time; this make it possible to estimate the remaining shelf life (Nelson and Green, 2007). When
using QIM there is little need for sample preparation because the whole raw fish is evaluated.
Moreover, the training needs for the panelists are not as elaborate as in the QDA system (Nelson
and Green 2007). QIM can be used in farms, making it easy to carry out quality evaluations
(Martinsdóttir et al 2001). In this study, the QIM method for Siganus sutor (Odoli et al, 2013)
fish was used to evaluate quality.
Most fish that is dried in Kenya have either started to spoil or incurred delays in processing;
this leads to low yield if the fish are to be filleted and higher costs because the filleting takes a
longer time. The QIM system is used to assure product quality before processing starts. In this
study the QIM was used to evaluate quality of Siganid fillets during delayed processing.

63
The quality scores were based on the QI scheme. The results were then computed as shown in
Figure 3.1. The scoring scale was designed in QIM format such that score 0 meant the freshest,
score 1 was slightly fresh while score 3 meant the least fresh. The results show that the freshness
quality of the fish assessed decreased with time and those assessed after 4 hours had the poorest
quality. From the score, the fish were still of good quality after 4 hr delayed processing with a
QI maximum of 1.2 for the gills.
Figure 3.1: Quality assessment of fresh Siganids during ambient storage at 0hr, 2 hr and 4 hr delayed processing
3.3.2. Influence of Raw Material Quality on Process Yield and Labour Productivity
3.3.2.1 Quality index during delayed icing for 0- 4 hr category
The quality index (QI) was reported based on average of 5 fish per trial (grade) and showed a
linear relationship with time of storage by delayed icing. For purposes of this study only, the
freshest fish sampled at 0hrs after landing was named grade 1, the one sampled after 2 hrs grade
2 and the one sampled after 4 hrs grade 3. According to Figure 3.2 there was a strong
correlation of R2 = 0.9735 observed with the groups that were significantly different (p <0.05).
The noted difference showed premium quality grade 1 scoring lower than good quality grade 2
and marginal quality grade 3 accordingly.
0
0.2
0.4
0.6
0.8
1
1.2
Grade 1 (0 Hrs) Grade 2 (2Hrs) Grade 3 (4 Hrs)
Skin
Eyes
Gills

64
The results indicated that attributes gradually deteriorated with time and obeyed the QIM
scheme; fresh fish just after catch was given lower scores which increased with time, coming
close to a maximum score at the end of shelf life (Martinsdottir et al., 2001). It is therefore
worth noting that the QIM was successfully used to categorize samples into quality grades. Five
pieces of fish used in the current study was in accordance with the guidelines for evaluation of
freshness of whole fish (Martinsdottir et al. 2001). A minimum of three (large fish) to 10 (small
fish) random samples is recommended in the guidelines as this should be taken to cover the
biological differences in spoilage rate of fish. All the quality grades were within the
consumption limits as the QI for the analyzed fish had a maximum score of 21 whereas, grade
three that was scored higher had QI of 6.
Figure 3.2: Quality index (Max QI=21) of Siganus sutor freshness grades. Averages (±SD) over each quality grade analyzed
(average score, N=5). 1= stored for 0 hours; 2= stored for 2 hours; 3= stored for 4 hours.
3.3.2.2 Individual quality parameters in QIM scheme
The average scores for the individual quality descriptors varied considerably within the groups
(Figure 3.3). However, subsequent quality grouping recorded consistently higher scores except
form of the eyes. Figure 3.3 further depicts that skin mucus and skin odour should be excluded
from the scheme as they were either difficult to evaluate or did not reflect on quality for Siganid
fish and recorded minor changes in the groups (Sveinsdottiret al, 2003).
y = 2.8x - 2.1333R² = 0.9735
0
1
2
3
4
5
6
7
8
1 2 3
Qu
alit
y In
de
x sc
ore
Fish quality grade at the begining of processing

65
Figure 3.3: Average score for individual quality descriptors (attributes) of Siganus sutor evaluated with QIM scheme Rabbit
fish (N=5). 1= stored for 0 hours; 2= stored for 2 hours; 3= stored for 4 hours.
3.3.2.3 Influence of raw material quality on yield and labour
The most basic value addition to fish is filleting for convenience eating and culinary
preparations. In Kenya, filleted fish costs 6 to 8 times more than the price of whole fish because
of convenience and cultural resistance to fish eating as some communities simply do not eat
fish because of appearance, hard labour of scaling. In contrast, fillets are easy to cook and store.
Species, sex, type, and structural anatomy of the fish determine yield, type and quality of fillets
obtained (Rora et al, 2001).
Maintaining freshness of fish fillets by applying controls like HACCP at landing, reception and
during processing is necessary for optimum quality costs (Zagaramundi et al, 2004; 2007).
Quality of fish fillets is influenced by physical, biochemical and biological condition of the fish
(Zugarramurdi et al, 2004). The quality is expressed in texture changes. The factors responsible
for the quality of the texture includes age of the fish, size, fat content, amount and properties of
proteins, connective tissue and stress handling (Coppes-Petricorena 2010) The post-harvest
factors that are also important include rate and extent of decline in pH, status of rigor mortis,
extent and rate of breakdown of myofibrils and connective tissue due to proteolysis, nucleotide
degradation, temperature and time of storage of the fish (Kiessling et al, 2004). Fresh fish
muscle firmness decreases in the initial storage period because of protein hydrolysis and
deterioration of the tissue (Kiessling et al, 2004).
Traditionally filleting is carried out at after the onset of rigor mortis thougt it is important to
consider state of freshness and storage costs. It is not easy to control the onset of rigor in an
0
0.5
1
1.5
2
2.5
3Sc
ore
Individual descriptors
1
2
3
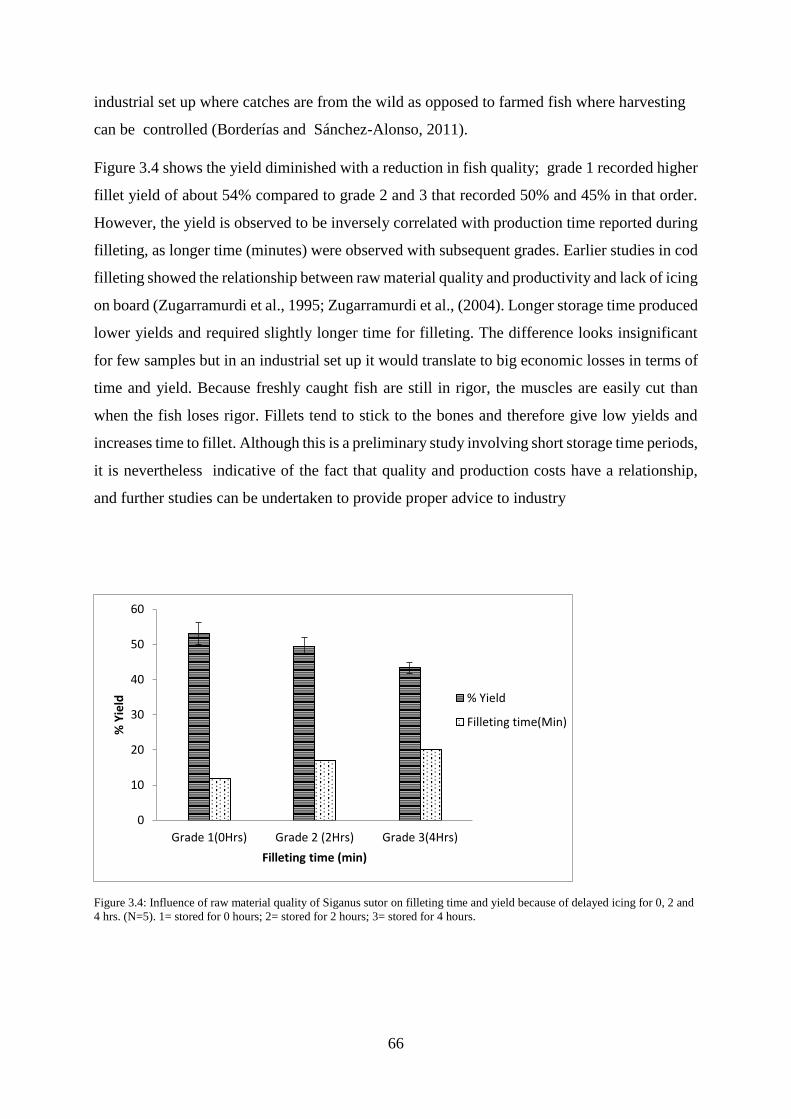
66
industrial set up where catches are from the wild as opposed to farmed fish where harvesting
can be controlled (Borderías and Sánchez-Alonso, 2011).
Figure 3.4 shows the yield diminished with a reduction in fish quality; grade 1 recorded higher
fillet yield of about 54% compared to grade 2 and 3 that recorded 50% and 45% in that order.
However, the yield is observed to be inversely correlated with production time reported during
filleting, as longer time (minutes) were observed with subsequent grades. Earlier studies in cod
filleting showed the relationship between raw material quality and productivity and lack of icing
on board (Zugarramurdi et al., 1995; Zugarramurdi et al., (2004). Longer storage time produced
lower yields and required slightly longer time for filleting. The difference looks insignificant
for few samples but in an industrial set up it would translate to big economic losses in terms of
time and yield. Because freshly caught fish are still in rigor, the muscles are easily cut than
when the fish loses rigor. Fillets tend to stick to the bones and therefore give low yields and
increases time to fillet. Although this is a preliminary study involving short storage time periods,
it is nevertheless indicative of the fact that quality and production costs have a relationship,
and further studies can be undertaken to provide proper advice to industry
Figure 3.4: Influence of raw material quality of Siganus sutor on filleting time and yield because of delayed icing for 0, 2 and
4 hrs. (N=5). 1= stored for 0 hours; 2= stored for 2 hours; 3= stored for 4 hours.
0
10
20
30
40
50
60
Grade 1(0Hrs) Grade 2 (2Hrs) Grade 3(4Hrs)
% Y
ield
Filleting time (min)
% Yield
Filleting time(Min)

67
3.3.3. Biochemical parameters during delayed processing for 0-4 hr category
Table 3.2 shows the results for the biochemical parameters during delayed processing for 0, 2
and 4 hrs.
Table 3.2: Biochemical changes during delayed processing at 0, 2 and 4 hrs
Gra
de
3
% MOISTURE
CONTENT
WATER
ACTIVITY
PH TVB-N
T
M
A
N
PV TBARS
Va
lue
Sta
nd
ard
Dev
iati
on
Va
lue
Sta
nd
ard
Dev
iati
on
Va
lue
Sta
nd
ard
Dev
iati
on
Va
lue
Sta
nd
ard
Dev
iati
on
Va
lue
Sta
nd
ard
Dev
iati
on
Va
lue
Sta
nd
ard
Dev
iati
on
0
hrs
73.5 0.0522 0.88 0.0050 6.65 0.0141 13.8 0.1939 nd 21.65 0.7127 0.367 0.0055
2
hrs
73.8 0.4023 0.88 0.0000 6.54 0.0141 27.8 0.0025 nd 89.11 0.5530 2.098 0.0055
4
hrs
74.8 0.2879 0.88 0.0100 6.5 0.0071 42.0 0.1995 nd 106.12 0.8250 3.011 0.0552
Nd (not detected)
During the 4-hour delayed icing period there was increase in TVB-N, PV and TBARS. pH
decreased and TMA was not detected.
3.3.3.1 Water activity
Water activity is related to microorganisms that cause spoilage of fish (Abbas et al, 2009). Upon
death of fish, bacteria gain entry into the fish body through the gills into the blood vessels and
also through the belly cavity lining and eventually through the skin. When bacteria get access
to the flesh, they grow rapidly producing off-odour and flavours (Johnson et al 1994). The main
factors that contribute to fresh fish spoilage in the whole complex process of inter-related
systems are protein degradation leading to formation of products like hypoxanthine,
trimethylamine, hydrogen sulphide; development of oxidative rancidity with the formation of
ketones, aldehydes and esters and the action of microorganisms (Gram et al, 2002). Spoilage of
fish eventually influences flavours, odours, colours or texture of the fish, leading to fish loss
which is an economic burden (Abbas et al, 2009).
It is now established that water activity is a key factor that influences the spoilage process in
fish (Abbas et al, 2009) and is used in many cases as a Critical Control Point for HACCP. The

68
water activity correlates with bacterial growth (Scott, 1957) and the growth of bacteria is
inhibited at specific water activity values. Water activity of 0.85 is considered a safe level for
pathogen growth (Abbas et al, 2009). In fresh products the water activity is high. In the standard
definition, water activity is a measure of the water available in a food that microorganisms can
use for growth. The microorganisms include bacteria, yeast and mould.
The optimum water activity limits or slows down fat oxidation, enzymatic reactions and protein
denaturation therefore maintains product quality and extends shelf-life (Abbas et al, 2009; Wolf
et al, 1984). Water is a solvent for chemicals and for microbial and enzymatic reactions.
Therefore, water activity is a measure of the availability of water to participate in such reactions.
There was no change in water activity levels as seen in Table 3.2 in the initial storage periods
for fish stored from 0 to 4 hrs. The water activity value of 0. 88 was however high and adequate
to support microbial growth. This is what is seen from the increase in TVB-N levels in the same
period because microbial growth is affected when water activity is below 0.85 (Abbas et al,
2009). Dehydration of foods helps to extend shelf life by reduction in water activity (aw). Low
water activity inhibits microbial growth.
3.3.3.2 pH
Microorganism have a minimum and optimum pH for growth. pH change is because of various
deterioration processes in the fish after harvesting. These processes include biochemical,
autolytic and microbiological breakdown mechanisms. Spoilage mechanisms or processes can
occur independently or concurrently, and the relative importance will vary with the fish species
(size, lipid content, maturation stage); environmental conditions (feeding activity and
availability, microbial load), slaughter method, catch method, post-mortem handling, storage
and conditions of processing (Viji et al, 2009; Isabel et al, 2009).
pH is one of the physico-chemical parameters used as an indicator to assess degree of freshness
or spoilage in fish (Huss 1988). In freshly caught fish, pH values of 6.0 to 6.5 are reported and
pH values 6.8 to 7.0 are acceptable, although there are some fish that can have alkaline meat
just after being caught. The pH value therefore, cannot be used as the only indicator for fish
freshness (Huss, 1998; Viji et al, 2015; Huss 1995; Kose and Erdem (2001). In the post-mortem
period, breakdown of nitrogenous compounds may increase pH, while oxidation of lipids, and
metabolism of glycogen is responsible for reduction in pH (Huss, 1995). The pH can decrease

69
or increase in fresh fish (Viji, 2015). A decrease is attributed to accumulation of lactic acid by
anaerobic glycolysis and release of inorganic phosphates by degradation of ATP. An increase
in pH is due to the breakdown of nitrogenous compound containing products leading to an
increase in amines and other volatile bases (Binsi et al, 2007). The physical properties of a fish
muscle is affected by a post mortem reduction in pH. This is because with a drop in pH, there
is a reduction in the net surface charge on the muscle proteins. This causes partial denaturation
and loss of some water holding capacity (Huss, 1995).
In this part of the study, changes were in the range of 6.65 for fish sampled at 0 hr and 6.5 after
4 hrs (Table 3.2); pH ranges were within the norm. The low pH levels are as a result of stress
at the time of death which causes depletion in energy reserves especially glycogen being
converted to lactate. It could also be due to increased production of free fatty acids during
hydrolysis of fats (Özogul et al 2005). The Siganids are sometimes caught using basket traps
which are left overnight. The fish in these traps struggle for a long time trying to escape from
the trap, hence metabolizing glycogen to lactic acid, leading to a lower pH.
3.3.3.3 Peroxide Value
Peroxide value measures the amount of hydroperoxides. In this study, during the 0 to 4 hr delay
in icing period, PV increased from 21.65 mEqO2/kg at 0 hr to 106 mEqO2/kg after 4 hr. A value
of 20 mEqO2/kg is proposed as the maximum limit for fish oil but there is no maximum standard
value agreed for PV as higher PV values have been obtained (Alghazeer et al, 2008), even in
this study without detection of spoilage. The PV levels confirm that one indicator alone may
not be used to draw conclusions on deterioration, therefore more parameters are usually
analyzed.
3.3.3.4 TBARS
In this study, the TBARS increased from 0.367 mg malondialdehyde /kg at 0 hr to 3.011 mg
malondialdehyde/kg after 4hr of delayed processing storage (Table 3.2). The delayed
processing showed a linear increase with time from 0 to 4 hrs. TBARS are formed from unstable
hydroperoxides during lipid oxidation and contribute to rancidity. The increase in TBARS
corresponded to the formation of hydroperoxides which was slower in breakdown than
formation of TBARS. The value of TBARS in this short storage period was less than the upper
limit set for most fish oils of 7 to 8 mg malonaldehyde /kg (Gimenez et al, 2011; Boran et al,
2006) and 27 mg malondialdehyde for fish mackerel (Özogul et al 2005).

70
3.3.3.5 TVB-N
Microbial growth responsible for spoilage of fish, produces several compounds including
biogenic amines like histamine, cadeverine, and putrescine. The other products include organic
acids, aldehydes, sulphides and ketones. They have unpleasant odours and off-flavours
(Dalgaard et al, 2006). Total volatile basic nitrogen (TVB-N) include ammonia and amines that
are formed during degradation of protein and non -protein nitogeneous compounds. The
hydrolytic enzymes from micro-organisms catalyse this process (Manat et al, 2005).
Trimethlylamine (TMA) is found in marine organisms in varying concentrations and their levels
also depend on the species and the environment. The precursor is Trimethylamine Oxide
(TMAO). TMA is formed as a result of bacterial breakdown of TMAO (Huss 1995). Other
products formed are dimethyl amine (DMA) and formaldehyde. The analysis of TMA does not
give information on early autolytic changes in spoilage but will give changes due to spoilage
later (Huss 1988) The upper limit for human consumption for TMA is 10-15 mg N TMA/100g
(Huss, 1988). Some workers have not found it useful as an indicator of spoilage (Magnusson
and Martinsdottir, 1995; Smith et al. (1980b). In this study, more focus is on TVB-N.
The TVB-N values in the fresh fish are 4 to 20 mg N/100g (Huss, 1998). In this study, the initial
TVB-N values at the beginning in the 0 to 4 hr storage period was 13.8 mg N/100g. In a separate
set of Siganid fish, processed in the 10 hr delay category, the TVB-N values were 4.15mg
N/100g at the beginning before the start of the drying process; this is within the limits for fresh
fish (Huss 1995).
TheTVB-N levels rose from 13.8 to 42 mg N per 100 g of fish muscle from 0 hr to 4 hr of
delayed processing (Table 3.2). TVB-N release depends on bacteria decomposition of fish flesh.
Freshly caught fish have TVB-N values of 5 mg and 20 mg N per 100 g of muscle and 30-35
mg N per 100g of muscle is the level of acceptability for iced stored fish in cold regions (Ozogul
et al 2005 and Huss 1998) although in warm water fish, this could be higher. Parameters for

71
fish quality are influenced by many other factors so one indicator cannot be used (Huss, 1995;
Viji et al, 2009; Isabel et al, 2009).
3.3.3.6 Conclusions on delayed icing on 0-4 hr category
It was concluded that the raw material quality had a direct impact on yield and production costs
of Siganus sutor. There was an increase in filleting time and lower filleting yield during delayed
processing. The levels of PV, TBARS, TVB-N, TMA increased during delayed processing as a
sign of quality deterioration. The pH values reduced during delayed processing. Further studies
could be done to document all production costs. There is a need to further link the developed
QIM scheme for Siganus sutor to precisely characterized quality with storage time.
3.3.4 Drying Siganid fish during delayed processing (0, 2, 4, 6, 8 and 10 hr delayed
processing)
3.3.4.1 Moisture content in fish samples
Moisture content is important for storage of fish and the levels of moisture also help to
determine the end of drying. The targeted moisture content at the end of drying is 15% to
prevent mould growth. Bacterial growth is prevented at moisture content less than 25% (Bala
and Mondol, 2001). In the present study, moisture content was primarily used to determine the
end of the drying process although it was also used as an indicator in monitoring storage of the
dried Siganid fish. The fish that were dried after delayed processing for 0, 2, 4, 6, 8 and 10 hr
all dried to 15 % moisture which is the shelf stable target for dried fish. Whereas water activity
is the preferred method for monitoring fish storage, moisture content measurements can
complement water activity.
The drying trends for Siganus sutor fish are shown in Figure 3.5. At the beginning of drying,
the % moisture dropped from 72.77±1.08 to 14.6±0.07 (for fish processed after delayed icing
of 0hr. The moisture dropped from 72.93±5.02 for the fish processed after 2 hr of delayed icing
to 14.75±0.95. After 4 hr of delayed icing, the moisture content in the Siganid fish dropped
from 72.35±1.15 to 16.88±0.22. In the fish that was processed after 6 hr of delayed icing, the
moisture content dropped from 71.66±1.39 to 12.00±1.30. The moisture content in the fish that

72
was dried after delayed icing dropped from 73.43±1.76 to 15.53±1.84. In the fish that was
processed after 10 hr delayed icing, the moisture dropped from 73.69±0.40 to 13.64±0.47. The
fish therefore were all dry to about 15 % which is the shelf stable moisture content that does not
favour bacterial or mould growth.
Figure 3.5: Changes in moisture content during drying of Siganids after delayed icing of 0, 2, 4, 6, 8 and 10 hr
3.3.5 Biochemical changes during drying (0, 2, 4, 6, 8 and 10 hr delayed processing)
3.3.5.1 Water activity in fish samples undergoing delayed filleting
Fish samples subjected to delayed filleting (0, 2, 4, 6, 8 and 10 hr) were just named as 0hr, 2hr,
4hr, 6hr, 8hr and 10hr. The water activity during drying was reduced irrespective of delayed
icing before drying at 0, 2, 4, 6, 8 or 10 hr (Figure 3.6). The fish that was filleted at 0 hr in this
lot, had a faster loss in water activity than the one that was filleted last after 10 hr delayed
processing. The drying was for 3 days. Water activity is the available water for microbial growth
and is unbound water. In fish stored for 0 hr before drying, the water activity dropped to a much
lower level (0.6) which is good for storage (Abbas et al, 2009). That means that the fish, after
0
10
20
30
40
50
60
70
80
90
0 hrs 2 hrs 4hrs 6 hrs 8 hrs 10hrs
12hrs
14hrs
16hrs
18hrs
20hrs
22hrs
24hrs
26hrs
28hrs
Net drying time (hrs)
0 DHrs
2 DHrs
4 DHrs
6 DHrs
8 DHrs
10 DHrs

73
achieving a lower water activity level, could have a longer shelf-life. This still supports the
importance of processing fish when still fresh. There could be biochemical and microbiological
reactions retaining the water or not making it available in stale fish and not releasing it during
drying, as fast as in the fresh fish; this viewpoint can be further investigated.
3.3.5.2 pH
During and after the process of drying, the pH values for the fish processed after 0 and 2 hr
were lower than those processed after 6, 8 and 10 hrs (Figure 3.7). The pH was up to 6.8 for the
fish processed after 0 and 2 hr of delayed processing while those processed after delayed
filleting for 4, 6, 8 and 10 hr was up to 8.9. The pH values for fish processed after 4, 6 8 and 10
hr were higher because as the delay continued, bacteria also metabolized various substrates in
the fish to produce volatile basic compounds that are alkaline, hence resulting in the increased
pH (Huss, 1995; and Susanto et al, 2011, Makawa et al, 2014).
3.3.5.3 Peroxide value
During the process of drying, the peroxide value was highest in the fish processed after 10 h
and lowest in the fish processed after 0 hr (Figure 3.8). The PV was as low as 31.74 mEqO2/kg
at 0hr and reduced to 10.16 mEqO2/Kg when drying in the solar tunnel dryer ended after 3 days.
In the fish that was processed after 10hr of delayed processing the PV was initially at 65.57 and
dropped to 20.37 mEqO2/Kg. The lower PV was because the hydroperoxides are unstable at
higher temperatures and break down further (Frankel 2005) to volatile and none volatile
compounds and secondary products with limits being 20mEq O2/kg (Weber et al 2008, Haque
et al 2013).
3.3.5.4 TBARS
TBARS decreased during drying (Figure 3.9). The level of TBARS at the beginning of drying
for fish stored for 0 hr before processing was 2.13 mg malondialdehyde per Kg and this reduced
to 0.29 mg malondialdehyde per Kg at the end of drying on the 3rd day. For fish processed after
2 hr, the TBARS reduced from 2.40 mg malondialdehyde per Kg to 0.49 mg malondialdehyde
per Kg and for the fish dried after 4 hr of delayed processing the TBARS reduced from 3.95 mg
malondialdehyde per Kg at the start to 1.72 mg malondialdehyde per Kg at the end of drying
on the 3rd day. The TBARS in the fish processed after 6, 8 and 10 hr the TBARS were 30.04,
43.87 and 68.64 mg malondialdehyde per kg respectively. This reduced to 7.8 mg

74
malondialdehyde per Kg for delayed processing after 6 hr, 15.6 mg malondialdehyde per Kg
for delayed processing after 8 hr and 32.86 mg malondialdehyde per Kg after delayed
processing of 10 hr.
The increase in TBARS at 0, 2, 4, 6, 8 and 10 hr at the beginning is due to the initial formation
of hydroperoxides which break down to aldehydes and related compounds. However, during
the process of drying, the TBARS decreased either due to breakdown to volatile tertiary
compounds like hexanal and also due to formation of adducts with proteins (Weber et al 2008;
Özogul et al 2005; Frankel 2005), which can cause toughening of fish. The limits for TBARS
in fish oil is 7 to 8 mg MDA/kg but this may not apply to solar dried fish because the fish at the
end of drying and at the beginning of storage is still suitable for human consumption despite
the higher levels of TBARS.
3.3.5.5 TVB-N and TMA
At the end of the drying period, for the fish in the 0 hr delayed processing category, the TVB-
N dropped to 0.8mg N/100 g. The TVB-N values also dropped after drying in the fish that was
subjected to delayed icing after 2, 4, 6, 8 and 10 hr delayed processing period. The TVB-N
values were 5.5 mg N/100g, 4.98mg/100 g. 8.3 mg N/100 g, 6.09 mg N/100 g, 11.1 mg N/100
g and 14.5 mg N/100 g. Low levels of TVB-N at the beginning of drying have been reported by
Erkan (2016) prior to storage. This result means that solar drying reduced the levels of TVB-N
during drying. During the first few hrs of drying however, there was an increase in TVB-N
before the drop (Figure 3.10). This increase followed by a drop in TVB-N after solar drying in
Siganid fish is reported for the first time. The volatile compounds could be lost during drying
due to a drop in bacteria levels and high temperatures in the dryer. There is a need to further
understand the levels for TVB-N in dried Siganids before storage. There was a delay in the
formation of TMA levels which continued to drop during drying in the 10 hr delayed processing
category (Figure 3.11). In the delayed processing period for 0 to 4 hr, TMA was undetected.
The formation of TVB-N and TMA were formed by different pathways.
Bacterial growth continued until the available nutrients were depleted. Increased TVB due to
increase in microbial loads has been reported (Anderson, 2008; Orban et al 2011). The TVB-N
values finally reached lower values at the end of drying. The trend was slightly different for
TMA-N in that there was no peak increase before a decrease, although there was still a net
reduction in TMA-N at the end of the drying period. TMA was not detected in the fish fillets

75
that were filleted after 0, 2 and 4 hours for delayed processing and did not show any TMA
throughout the drying period. The TMA levels started to be noticed in the fish that was
processed after 6, 8 and 10 hr delayed processing. In the fish that was processed after 6, 8 or 10
hr delayed icing, the TMA was 0.16, 0.83 and 2.23 respectively at 0 hr; this decreased to 0.02,
0.05 and 0.02 respectively after 28 hr net drying period.
It is important to note the levels of TMA in the fish at the start of drying, irrespective of the
delay were still within the allowable limits of spoilage of 5mg TMA/100g (Orban et al 2011).
The pathways and rates for formation of TMA and TVB-N could be different involving different
types of bacteria with different capacities to form volatile bases (Orban et al 2011) though at
the end both were reduced after the drying process.
Figure 3.6: Changes in water activity during the actual solar drying of Siganid fish fillet after delayed icing for 0, 2, 4, 6, 8
and 10 hrs in the hybrid windmill solar tunnel dryer in Kipini, Kenya.
0.4
0.5
0.6
0.7
0.8
0.9
1
1.1
0 5 10 15 20 25 30
aw le
vels
Net drying time (Hrs)
0hr
2hrs
4hrs
8hrs
10hrs
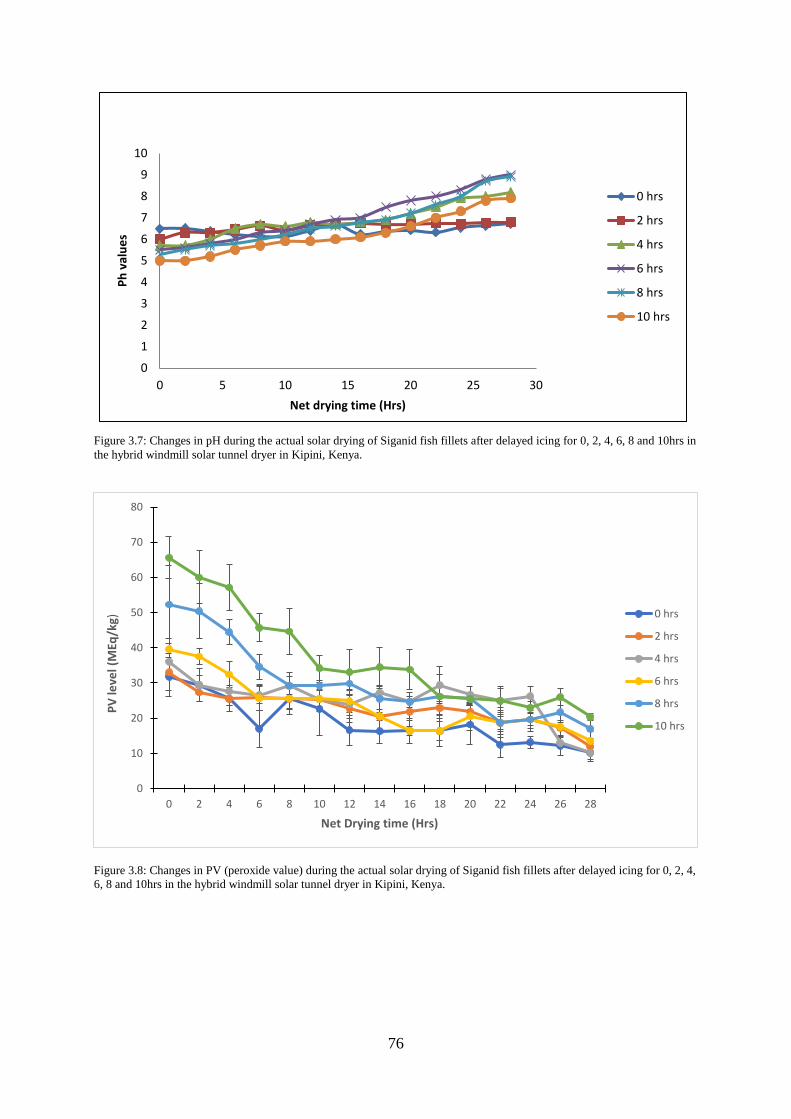
76
Figure 3.7: Changes in pH during the actual solar drying of Siganid fish fillets after delayed icing for 0, 2, 4, 6, 8 and 10hrs in
the hybrid windmill solar tunnel dryer in Kipini, Kenya.
Figure 3.8: Changes in PV (peroxide value) during the actual solar drying of Siganid fish fillets after delayed icing for 0, 2, 4,
6, 8 and 10hrs in the hybrid windmill solar tunnel dryer in Kipini, Kenya.
0
1
2
3
4
5
6
7
8
9
10
0 5 10 15 20 25 30
Ph
val
ue
s
Net drying time (Hrs)
0 hrs
2 hrs
4 hrs
6 hrs
8 hrs
10 hrs
0
10
20
30
40
50
60
70
80
0 2 4 6 8 10 12 14 16 18 20 22 24 26 28
PV
leve
l (M
Eq/k
g)
Net Drying time (Hrs)
0 hrs
2 hrs
4 hrs
6 hrs
8 hrs
10 hrs

77
Figure 3.9: Changes in TBARS during the actual solar drying of Siganid fish fillets after delayed icing for 0, 2, 4, 6, 8 and
10hrs in the hybrid windmill solar tunnel dryer in Kipini, Kenya.
Figure 3.10: Changes in TVB-N during the actual solar drying of Siganid fish fillets after delayed icing for 0, 2, 4, 6, 8 and
10hrs in the hybrid windmill solar tunnel dryer in Kipini, Kenya.
0.00
10.00
20.00
30.00
40.00
50.00
60.00
70.00
80.00
0 2 4 6 8 10 12 14 16 18 20 22 24 26 28
TBA
Rs
leve
l (m
g/kg
)
Net drying time (Hrs)
0 hrs
2 hrs
4 hrs
6 hrs
8 hrs
10 hrs
0.00
0.50
1.00
1.50
2.00
2.50
3.00
0 2 4 6 8 10 12 14 16 18 20 22 24 26 28
TVB
-N le
vels
(m
g/kg
)
Ney drying time (Hrs)
0 hrs
2 hrs
4 hrs
6 hrs
8 hrs
10 hrs

78
Figure 3.11: Changes in TMA during the actual solar drying of Siganid fish fillets after delayed icing for 0, 2, 4, 6, 8 and
10hrs in the hybrid windmill solar tunnel dryer in Kipini, Kenya
3.3.5.6 Conclusions
PV and TBARS decreased during drying because of unstable nature of hydroperoxides and
aldehydes breaking down to secondary and tertiary products and further, interacting with
proteins. TVB-N and TMA decreased owing to reduced bacterial action. The pH increased
during drying. Drying reduced/altered the biochemical spoilage indicators to a minimum before
storage commenced.
3.3.6 Biochemical changes during storage of solar dried fish only at 0 h of delayed icing
The fish were stored on open benches in the lab to simulate the storage conditions in a traditional
set-up, the second batch was stored in normal polythene bags (wraps) used daily in the markets
as an improvement which is cheap and hygienic, and the third batch of Siganid fillets was stored
after vacuum packaging using a vacuum packer with pouches in the laboratory (Figure 3.12).
Only the fish that were processed at 0 hr were used for storage trials.
0
0.5
1
1.5
2
2.5
0 5 10 15 20 25 30
TMA
-N L
eve
ls(m
g/K
g)
Net drying time (Hrs)
0 hrs
2 hrs
4 hrs
6 hrs
8 hrs
10 hrs

79
i ii iii
Figure 3.12: Solar dried Siganid fillet stored in the open (i) in normal polythene packaging (ii) and vacuum packaging (iii)
3.3.6.1 Moisture during storage
In the fish stored in the open, the moisture content increased from 15.15% at the start of storage
to 21.46% after 75 days of storage (Figure 3.13).
For fish that was stored in normal polythene packaging bags, the increase in moisture was from
15.15 to 19. 26%. In fish stored in vacuum packaging, there was a minimal increase in moisture
from 15.15% to 16.5%.
Moisture content above 25% can support bacterial growth and mould growth can take place at
moisture content above 16%. The fish was still within safe limits for microbial attack despite
an increase in moisture content. The absorption of moisture is due to the hygroscopic nature of
the fish muscle. The role of vacuum packing is key in ensuring moisture does not increase
during storage.

80
Figure 3.13: Changes in %moisture content (wet basis) of solar dried Siganid fish fillets during storage in the open air, in
normal polythene packaging and vacuum packaging
3.3.6.2 Water activity
The water activity in the fish fillet that was dried without delayed processing was monitored
during storage, either in the open air (no packaging), polythene bags or in vacuum packaging
(Figure 3.14). The water activity at the beginning of storage for the Siganid fish stored in the
open was 0.74 and it increased to 0.81 after 75 days of storage (Figure 3.14). The water activity
in the Siganid fish stored in normal packaging increased from 0.74 to 0.75 and was still 0.74 at
the end of storage. There was no increase in water activity for the fish stored in vacuum
packaging, which showed a slight decrease to 0.72 after 75 days of storage.
Vacuum packing was responsible for keeping the water activity low (Kumar, P and Ganguly S,
2011). Dried fish can be stored safely for up to 180 days (Farid et al, 2014). Water activities
below 0.8 for beef products are common and are equivalent to about 23% moisture. The water
activity achieved in this study during storage is still below the threshold of 0.8 hence the fish is
still safe for consumption. There is however a complex relationship between moisture content
and water activity. Moisture content is useful when looking at the time to end the drying process.
0.000
5.000
10.000
15.000
20.000
25.000
Day 0 Day 15 Day 30 Day 45 Day 60 Day 75
Mo
istu
re C
on
ten
t (%
)
Storage period (Days)
Open air storage Normal packaging Vacuum packaging

81
Water activity provides information for evaluating spoilage on storage. It is not always correct
to assume that a higher moisture content will mean a higher water activity (Karel, 1975; Potter
1968; Oduor-Odote et al, 2010).
3.3.6.3 pH
The pH during storage of the Siganid fillets was 6.83 at day 0 for the fish stored in the open.
This decreased to 5.6 at the end of storage (Figure 3.15). The drop was by 1.32 pH units
equivalent to 18%. In the fish stored in normal packaging the pH dropped from 6.83 to 6.05
representing an overall drop of 11.42 % while for the fish stored in vacuum, the drop was from
6.83 to 6.15 equivalent to 9.9%.
Changes in pH occur during storage but is normally faster in ambient storage equivalent to open
storage. Although pH has been used to measure fish deterioration, the variation in pH is due to
many factors like chemical composition, storage conditions in relation to air among others
(Susanto et al, 2011).
Under normal circumstances, the pH is expected to drop, then increase again during storage.
(Farid 2014). In this case the pH decreased. This means that there was some activity during
storage that could be due to a factor other than glycogen and its effect was higher in the fish
stored in the open than in packaged fish. The hydrolysis of lipids to fatty acids could be another
reason for the decrease in pH. During storage of fish muscle in ambient conditions, El-Deen
and El-Shemery (2010) noticed a decrease in pH. Also, dissolution of CO2 into the packaging
bags may lead to a drop in pH (McMekeen et al, 1982).
3.3.6.4 PV
The peroxide value was monitored during a75 day storage period in the fish that was processed
at 0 hr, without delayed icing. The fish fillets were stored in the open, normal polythene bags
and vacuum packaging. The peroxide value at the start of storage was 3.44 mEqO2/kg for fish
stored in the open and increased to 130 mEqO2/kg after 75 days of storage (Figure 3.16). In the
fish stored in polythene packaging, the PV increased from 3.44 at the start to 78.94 mEq O2/kg
and for fish stored in vacuum packaging the PV increased from 3.44 to 35.0 mEq O2/kg after

82
75 days storage. The PV value continued to rise during storage of Siganids suggesting that the
propagation of free radicals and primary products of lipid oxidation continued up to 75 of
storage. The oxidation was increased by 3722% from the starting value for fish stored in the
open, 2194% for fish stored in polythene and 917% for fish stored in vacuum packaging. Lipid
oxidation is influenced by light and oxygen. The higher value of PV in the fish stored in the
open and those stored in normal polythene could be because of both light and oxygen while the
increase in PV in the vacuum-packed fish could be due to light mainly because the packaging
was permeable to light. PV normally rise, peak and then drop due the formation of secondary
and finally tertiary products, as many studies have shown (Ghlaly et al 2010). Other studies
have also shown a continuous rise in PV of fish oil without peaking, and then dropping during
storage (Boran et al, 2006). PV limits for fresh fish oil is 20mEqO2/kg (Jinadassa 2014). Due
to the rise and fall of values as the primary products break down to secondary products, more
than one indicator should be used to monitor spoilage.
3.3.6.5 TBARS
TBARS decreased throughout the storage period (Figure 3.17). The TBARS decreased from
5.65 mg malondialdehyde per kg at day 0 to 1.98 mg malondialdehyde per kg of fish stored in
the open, 2.42 mg malondialdehyde per kg for fish stored in polythene packaging and 3.08 mg
malondialdehyde per kg for fish stored in vacuum packs. There was a 64% drop in TBARS in
open storage, 60% drop in polythene storage and 45% drop for fish stored in vacuum packs.
TBARS are formed because of hydroperoxide breakdown from lipid oxidation with the
formation of secondary products like aldehydes. The limit for TBARS is 5 mg
malonaldehyde/kg for good quality fresh fish although fish can be consumed even when
TBARS are 8.0 mg MDA/kg (Shallam et al 2007).
The fish for storage was therefore within consumption range for humans. The decrease in the
level of TBARS is due to breakdown to tertiary products and interaction and cross-linking
between aldehydes like malonaldehyde with proteins particularly tyrosine, lysine and
tryptophan amino acids (Saeed and Howell, 2002, Saeed et al, 1999, Shallam et al, 2007). The
rate of formation of PV can also be higher than TBARS as the latter break down and interact
with other compounds.

83
3.3.6.6 TVB-N
TVB-N was monitored during storage of the Siganid fillet. The fish used was the fresh one that
was stored for 0 hr in the 10hr delayed processing category. All were mixed randomly and fresh
TVB-N values taken. The fish fillets were packed in 3 different packaging categories. The first
batch was one left in the open, the second batch was stored in normal polythene bags and the
third one was vacuum packed. The storage was for 75 days.
The level of TVB-N was 2.78 mg N per 100 g at the beginning of storage in the fish kept in the
open and increased to 27.75 mg N per 100 g after 75 days of storage equivalent to 899% increase
(Figure 3.18). In the fish packed using normal packaging, the TVB-N value increased from the
baseline of 2.78 to 16.6 mg N per 100 g after 75 days of storage equivalent to an increase of
497%. The fish stored in vacuum packs and stored for 75 days the TVB-N increased from 2.78
to 8.83 mg N per 100g equivalent to 217.6%. The TVB-N levels were all within the limits
allowed for fresh fish though the limits for dried fish has not been established. The allowable
limits set by the EC 95/149 is 35 mg TVB-N per 100g. Similar studies have given TVB-N
values of 17 to 33 mg N /100g for dried fish (Pavakar et al, 2013; Jinadasa 2014).
The lowest increase in TVB-N was in the fish stored in vacuum and the highest increase was
for those stored in the open. TVB-N is considered a fish spoilage indicator rather than a fish
freshness indicator. These levels apply to fresh fish (Orban et al, 2011). The TVB-N value is
categorized in quality classes with TVB-N up to 25 mg N per 100g considered “high quality”
up to 30 mg N per 100 g considered “good quality” and between 30-35 mg N per 100g falling
in “level of acceptability” and above 35 mg N per 100g considered “spoilt” (Jinadassa 2014).
Random checks for TVB-N levels for dried fish in different markets reveal a wide variation
with values as high as 53.4 mg N per 100 g going up to 98 mg N per 100 g being recorded
(Prakash et al, 2001; Yamanaka et al 1986.; Jamila and Ranjitha 2009). There are no reported
studies on dried fish indicator parameters for Siganids. This study is however very useful to dry
chain fish processors to obtain data for spoilage of dried fish deterioration and to adopt proper
storage conditions. The vacuum packaging acts as a barrier preventing spoilage agents like
moisture, and bacteria from penetrating and reaching the fish

84
3.3.3.7 Temperature
Temperature is important during storage of dried fish because less than optimum temperatures
can influence microbial growth and favour lipid oxidation. In this study, the temperature during
storage of fish ranged from 30.4oC at the beginning of storage to 23oC at the end of storage
(Figure 3.19). This was due to weather changes over time. Temperature during storage of dried
fish is as critical as temperature considerations in preservation of fresh fish. The temperatures
of storage influence bacterial growth (Jinadassa 2014). Temperatures of between 5oC and 60oC
can easily favour microbial growth so storage under such conditions can lead to deterioration
of fish. In the case of dried fish, the ones that are stored at temperatures indicated above (23-
30oC) can result in microbial propagation if other conditions are right. Vacuum packaging will
help under such circumstances.
Figure 3.14: Changes in water activity of solar dried Siganid fish fillets during storage in the open air, in normal polythene
packaging and vacuum packaging.
0.4
0.45
0.5
0.55
0.6
0.65
0.7
0.75
0.8
0.85
0 15 30 45 60 75
Wat
er
acti
vity
(a W
)
Storage period (days)
Open air storage
Normal polythenepackaging
Vacuum packaging

85
Figure 3.15: Changes in pH of solar dried Siganid fish fillets during storage in the open air, in normal polythene packaging
and vacuum packaging.
Figure 3.16: Changes in PV (peroxide value) of solar dried Siganid fish fillets during storage in the open air, in normal
polythene packaging and vacuum packaging.
0
1
2
3
4
5
6
7
8
0 15 30 45 60 75
pH
Storage period
Vacuum packaging
normal polythenepackaging
Open air storage
0
20
40
60
80
100
120
140
0 20 40 60 80
PV
leve
ls (
mEq
Oxy
gen
/Kg)
Number of storage days
Vacuum packaging
Normal polythene packaging
Open air storage

86
Figure 3.17: Changes in TBARS of solar dried Siganid fish fillets during storage in the open air, in normal polythene
packaging and vacuum packaging.
Figure 3.18: Changes in TVB-N of solar dried Siganid fish fillets during storage in the open air, in normal polythene
packaging and vacuum packaging.
0
1
2
3
4
5
6
0 20 40 60 80
TBA
RS
mg/
MD
A p
er
Kg)
Days of storage
Vacuum packaging
Normal polythene packaging
Open air storage
0
5
10
15
20
25
30
0 20 40 60 80
TVB
-N (
mgN
pe
r 1
00
g)
Days of storage
Vacuum packaging
Normal polythene packaging
Open air packaging

87
Figure 3.19: Changes in temperature surroundings of solar dried Siganid fish fillets during storage in the open air, in normal
polythene packaging and vacuum packaging.
3.3.6.8 Conclusions
The moisture content increase was lowest in the vacuum packed stored fish. Peroxide value
increased the least in the vacuum-packed fish. TBARS decreased during storage and the
decrease was lowest in the vacuum-packed fish. TVB-N was also the lowest in the vacuum
packed stored fish. The pH decreased during storage. Water activity increased minimally in the
vacuum packed stored fish during the storage period. It is important to note that spoilage
indicators for dried fish cannot be limited to one parameter, but many should be assessed.
Packaging particularly vacuum packaging of dried fish products should be introduced in
Kenyan laws in the Fisheries Act. However, further studies on the growth of anaerobic bacteria
is needed.
3.3.7 Microbiological analysis and evaluation
The spoilage rate of post-harvest fish (Siganus spp) samples was tested. Temporal variation of
microbial loads (total viable plate counts and spoilage specific microorganism counts) was
used as an indicator of the spoilage rates with varied periods of delayed icing. These results
0
5
10
15
20
25
30
35
0 15 30 45 60 75
Tem
pe
ratu
re (
oC
)
Storage period (days)
Vacuum packaging
Normal polythene packaging
Open air storage

88
justify the need to dry harvested fish to minimize the rate of microbial division, thus
preserving the quality of the fish and minimizing losses attributable to microbial fish spoilage.
3.3.7.1 Bacterial load of freshly harvested versus solar dried fish
Figure 3.20: Total Plate Counts: Fresh vs Solar Dried Fish
The total plate counts for fresh fish ranged from 9.0 x 10⁵ (immediately after harvest) to 2.50 x
106 (10 hours after harvest) while those for solar dried fish ranged from 8.50 x 10⁵ to 4.70 x 10⁵
colony forming units per gram of sample (Fig 3.20).
Drying reduced the spoilage specific organism loads from 6.0 x 10⁵ – 2.90 x 10⁶ cfu g-1 for
freshly harvested fish to 8.0 x 10⁴ – 9.90 x 10⁵ cfu g-1 after drying (Fig 3.21). The maximum
plate and spoilage specific counts prior to drying were slightly higher than the permitted food-
safe limits (105). This was attributed to the conditions of the fishing areas and the time taken
before preservation.
The significant reduction of microbial counts after drying illustrated its role in retarding
spoilage thus emphasizing its relevance to minimizing post-harvest losses.
0 hrs 2 hrs 4 hrs 6 hrs 8 hrs 10 hrs
TPC (Fresh Fish) 900,000 1,580,000 1,000,000 1,500,000 2,200,000 2,500,000
TPC (Solar Dried Fish) 850,000 550,000 480,000 500,000 490,000 470,000
0
500,000
1,000,000
1,500,000
2,000,000
2,500,000
3,000,000
Cfu
g-1
Hours After Harvest
TPC's : Fresh vs Solar Dried Fish

89
Figure 3.21: Spoilage Specific Organisms: Fresh vs Solar Dried Fish
3.3.7.2 Storage-specific, temporal variation in bacterial loads of solar dried fish
Solar dried samples were analyzed for the temporal variation (0, 14 and 28 days) in bacterial
loads with exposure to different storage conditions (ambient, polythene bags and vacuum
packaging). Table 3.3 illustrates the loads of total plate counts and spoilage specific organism
counts obtained from samples of solar dried fish at Day 0. This was the baseline for further tests
on day 14 and 28 under different storage conditions.
Table 3.3: Bacterial Counts for Solar Dried Fish (Day 0)
Sampling
Time
TPC (Mean Total Viable Colony
Counts) [Cfu g-1]
SSO (Mean Total Viable Colony
Counts) [Cfu g-1]
0 hours 550,000 (5.50 x 10⁵) 480,000 (4.80 x 10⁵)
2 hours 530,000 (5.30 x 10⁵) 480,000 (4.80 x 10⁵)
4 hours 480,000 (4.80 x 10⁵) 470,000 (4.70 x 10⁵)
6 hours 490,000 (4.90 x 10⁵) 350,000 (3.50 x 10⁵)
8 hours 470,000 (4.70 x 10⁵) 270,000 (2.70 x 10⁵)
10 hours 193,000 (1.93 x 10⁵) 93,000 (0.93 x 10⁵)
RANGE 1.93 x 10⁵ – 5.50 x 10⁵ 0.93 x 10⁵ – 4.80 x 10⁵
Cfu g-1 = Colony forming units per gram of fish flesh
0 hours 2 hours 4 hours 6 hours 8 hours 10 hours
SSO (Fresh Fish) 600,000 1,750,000 2,100,000 2,400,000 2,700,000 2,900,000
SSO (Solar Dried Fish) 880,000 990,000 900,000 850,000 770,000 550,000
0
500,000
1,000,000
1,500,000
2,000,000
2,500,000
3,000,000
3,500,000
Cfu
g-1
Hours After Harvest
SSO's : Fresh vs Solar Dried Fish

90
Figure 3.22: Temporal variation in bacterial loads of solar dried fish stored differently
0 hrs 2 hrs 4 hrs 6 hrs 8 hrs 10 hrs
Day 0 550,000 530,000 480,000 490,000 470,000 193,000
Day 14 850,000 700,000 610,000 595,000 490,000 491,000
Day 28 500,000 421,000 350,000 299,000 220,000 189,000
0
100,000
200,000
300,000
400,000
500,000
600,000
700,000
800,000
900,000
CF
U /
GR
AM
TPC's : Open Storage
0 hrs 2 hrs 4 hrs 6 hrs 8 hrs 10 hrs
Day 0 480,000 480,000 470,000 350,000 270,000 93,000
Day 14 680,000 480,000 444,000 400,000 320,000 293,000
Day 28 430,000 408,000 337,000 209,000 212,000 143,000
0
100,000
200,000
300,000
400,000
500,000
600,000
700,000
CF
U/G
RA
M
SSO's: Open Storage
0 hrs 2 hrs 4 hrs 6 hrs 8 hrs 10 hrs
Day 0 480,000 480,000 470,000 350,000 270,000 93,000
Day 14 580,000 480,000 434,000 410,000 220,000 263,000
Day 28 445,000 438,000 367,000 389,000 278,000 150,000
0
100,000
200,000
300,000
400,000
500,000
600,000
CF
U/G
RA
M
SSO'S Polythene Packaging
0 hrs 2 hrs 4 hrs 6 hrs 8 hrs10hrs
Day 0 550,000 530,000 480,000 490,000 470,000 193,000
Day 14 500,000 481,000 450,000 300,000 225,000 199,000
Day 28 510,000 420,000 338,000 340,000 278,000 154,000
0
100,000
200,000
300,000
400,000
500,000
600,000
CF
U/G
RA
M
TPC's: Vacuum Packaging
0 hrs 2 hrs 4 hrs 6 hrs 8 hrs 10 hrs
Day 0 480,000 480,000 470,000 350,000 270,000 93,000
Day 14 480,000 480,000 404,000 299,000 220,000 123,000
Day 28 405,000 418,000 330,000 332,000 258,000 100,000
0
100,000
200,000
300,000
400,000
500,000
600,000
CF
U/G
RA
M
SSO's : Vacuum Packaging
0 hrs 2 hrs 4 hrs 6 hrs 8 hrs 10 hrs
Day 0 550,000 530,000 480,000 490,000 470,000 193,000
Day 14 630,000 501,000 490,000 500,000 325,000 311,000
Day 28 550,000 427,000 340,000 399,000 280,000 200,000
0
100,000
200,000
300,000
400,000
500,000
600,000
700,000
CF
U/G
RA
M
TPC's: Polythene Packaging

91
3.3.7.3 The bacteriological quality assessment of ice and processing water
The most probable number (MPN) method was used for the estimation of the bacterial load in
both the processing (i.e., washing) water as well as the ice used in preservation during delayed
processing.
The estimated Most Probable Number of the bacterial load in the processing water was >2,400
(Table 3.4). The MPN of the bacterial load in the washing water was rather high suggesting
there was cross contamination of the fish samples during processing. This is the water available
in the field.
Table 3.4: The MPN of the bacterial load in the processing (i.e. washing) water during delayed icing
Month Jan, 2013
MPN Values >2,400
MPN = Most Probable Number
The estimated Most Probable Number of the bacterial load in the preservation ice during the
project period was found to be 49 (Table 3.5). This number was lower and suggested that there
was no cross contamination resulting from the preservation ice.
Table 3.5: The MPN of the bacterial load in the preservation ice during the project Period
Month Jan, 2013
MPN Values 49
MPN = Most Probable Number
3.4 Discussion-Microbiology evaluation and conclusions
Bacterial growth is a cause of fish spoilage, apart from causing disease. Bacterial numbers can
be used as an indicator of fish quality. In this study the total number of bacterial count for the
freshly landed Siganus ranged from 0.90 x 10⁶–2.50 x 10⁶ cfu g-1 of fish flesh for the TPC
analysis whereas SSO ranged between 0.60 x 10⁶ – 2.90 x 10⁶. These levels were however
higher than the maximum limits recommended by both the International Standards Organization
(ISO-4833) and the Food and Agricultural Organization (FAO) of 5 x 10⁵(ICMSF, 1980;
FAO/WHO, 1976, 1978; WHO, 1974; and Codex, 1977). This variance in accepted limit

92
numbers has in fact made the developed countries such as Denmark and United States of
America (USA) to set their own accepted maximum limits in a gram of flesh at 1 x 10⁵ (100,000)
and 5 x 10⁵ (500,000) respectively. However, the observed count numbers were within the
accepted limits mentioned by the Sudanese Standards and Metrology Organization (SSMO) of
5×10⁵ – 106cfug-1 for fresh fish products (SDS 357). The numbers were also in the normal range
of between 102 – 107cfug-1 of fish flesh (Liston, 1980).
The existing wide range of bacterial flora counts on freshly caught fish, according to Shewan
(1977), depends on the environment rather than the fish species. Thus, the considerable high
microbial loads obtained from the freshly landed fish samples could possibly be due to poor
handling by the fishermen at sea or the processors with different hygienic profile having regular
skin contacts with the fishes. This aspect of cross contamination was effectively corroborated
by the observed higher MPN values observed in the washing water during the study. Another
possible explanation could be the unhygienic sanitary environment of the fish source (ocean)
and the fishing vessel.
In cases of solar drying, the bacterial load counts were on average, within the normal ranges
stipulated by ISO-4833 standards (Codex, 1977). However, the mean counts were highest (8.50
x 105cfug-1) for TPC and (9.90 x 10⁵cfu g-1) for SSO. Thus, the low microbial counts obtained
from the dried fish samples could be attributed to the low moisture content due to drying that
made it difficult for microorganisms to grow.
This scenario changed, however, during storage and the counted numbers slightly increased
with the majority still being in the range of 105. This slight change in the bacterial counts could
be due to the hygroscopic nature of the samples which provided the microorganisms with
moisture for growth. This hypothesis was confirmed when the values reduced after the
fourteenth day of storage because of moisture reduction due to packaging. Thus, a general
reduction in the bacterial counts was observed with all forms of packaging for the stored solar
dried fish samples. This study was used to develop the HACCP.

93
3.5 Conclusions
• The raw material quality has a direct impact on yield and production costs of Siganus
sutor. There was an increase in filleting time and lower filleting yield during delayed
processing.
• The levels of PV, TBARS, TVB-N, and TMA increased during delayed processing as
a sign of quality deterioration. The pH values reduced during delayed processing.
• Further studies could be done to document all production costs. There is need to further
link the developed QIM scheme for Siganus sutor to precisely characterize quality with
storage time.
• During actual solar drying, PV and TBARS decreased because of unstable nature of
hydroperoxides and aldehydes interacting with proteins and TVB-N and TMA
decreased owing to less bacterial action.
• Solar tunnel drying reduced biochemical spoilage indicators to a minimum before
storage starts.
• During storage of the solar dried fish fillet for 75 days, the moisture content and water
activity change was at a minimum in the vacuum-packed fish compared to those in
normal polythene and packaging and those kept in the open.
• Peroxide value, a lipid oxidation indicator increased the least in the vacuum packed
Siganid fish fillet compared to those stored in the open and in normal polythene.
• TBARS, another lipid oxidation indicator and TVB-N decreased during storage and the
decrease was lowest in the vacuum-packed fish compared to those stored in normal
polythene and in the open.
• Vacuum packaging of fish products should be recommended in the Kenyan Fisheries
Act.

94
CHAPTER 4

95
CHAPTER 4
4.0 Lipid oxidation in solar dried fish with and without antioxidants
4.1 Introduction
Sea fish have high nutritional value due to readily digestible protein, mineral and vitamins and
high levels of polyunsaturated fatty acids. These are the omega 3 group of fatty acids namely
eicosapentaenoic acid (EPA) and docosohexaenoic acid (DHA) (Ackmann, 1999).
Based on epidemiological studies, a marine rich diet containing fish is of benefit to the
consumer because of the presence of peptides and the highly unsaturated fatty acids that have
been associated with lowering the risk of cardiovascular diseases including lowered plasma
lipids and decreased blood pressure (Shekelle et al, 1985, Kromhout et al (1985)
However, whether fish is preserved by frozen storage or drying, there is still deterioration of
the fish muscle due to the oxidation of polyunsaturated fatty acids (Taheri and Motallebi, 2012).
The high rate of deterioration of the polyunsaturated fatty acids by lipid oxidation requires
control. Lipid oxidation products are harmful if accumulated in a large quantity and consumed.
The lipid oxidation products also cause protein denaturation which will affect texture and
nutritional value of the fish proteins negatively (Saeed and Howell, 1999).
Lipid oxidation in fish tissues is controlled by an efficient antioxidant system. This is made up
of α-tocopherol or vitamin E which stabilizes the oxidation of the high content of unsaturated
fatty acids when fish is still alive (Decker et al, 2000; Jia et al, 1996). The efficiency of the
antioxidant mechanism in the post mortem or post-harvest state is lost due to the consumption
of the intrinsic antioxidant in the oxidative processes and there is no source of fresh antioxidants
(Petillo et al 1998).
Post-harvest lipid oxidation control in fish requires utilization of antioxidants. The available
antioxidants in the market are synthetic ones like butylated hydroxytoluene (BHT), butylated
hydroxyanisole (BHA) and BHQ which are facing resistance in the market because they are
suspected to be carcinogenic. There is increasing interest in the identification of plant extracts
that can retard or minimize lipid oxidation in lipid containing foods (Sanchez-Alonzo et al,
2007) and for use in vivo. Fish with a high content of polyunsaturated fatty acids is highly

96
susceptible to lipid oxidation, resulting in rancidity and undesirable changes in flavor, texture,
colour and nutritional value (Alghazeer et al, 2008; Pereira de Abreu et al, 2011).
Successful utilization of antioxidants from natural sources will highly depend on constant
supply of raw material for sustainability. There are aquatic plants in Kenya that are abundant in
supply and are rich in natural antioxidants especially phenolic compounds that can be useful
sources of antioxidants. The water hyacinth which is an alien aquatic plant has been tested for
phenolic compounds that have antioxidant activity (Shanab and Salaby, 2012; Lalitha and
Jayanthi, 2012; Surendrarai et al 2013).
At the south coast of Kenya, the seaweed -Eucheuma denticulatum and Kappahyccus alverezi
(cottoni) are now farmed with the whole seaweed harvested, dried and sold to middlemen at
low prices because it is not processed further into value added products (Bolton et al, 2007.;
Wakibia et al, 2011, KMFRI Bulletin 2018). Seaweeds contain other higher value products like
polysaccharide stabilizers including carrageenan and alginates, bioactive compounds and lately
phenolic antioxidants (Matanjun et al, 2008; Moubayed et al, 2017). Turmeric has been used
in foods over time for flavor and coloration of foods and is reported to have strong antioxidant
properties (Priya and Prabhu, 2006).
Fish drying is a preservation method that is used to control postharvest losses in fish, however,
the dried fish undergo further deterioration during storage due to lipid oxidation. The lipid
oxidation products affect the texture and cause denaturation of protein thus lowering the eating
quality and nutritional value.
4.1 Materials and Methods
The sources of the natural antioxidants used were water hyacinth, seaweeds (Euchema
denticulatum) and turmeric. Butylated hydroxy anisole (BHA) were used as synthetic
antioxidant controls and were purchased from Sigma.
The methods described are those used to determine total phenolics and antioxidant activity.
4.1.1 Preparation of plant antioxidant samples
The seaweeds (Euchema denticulatum) were purchased from Kibuyuni in the south coast of
Kenya from local women community members involved in seaweed farming. The plants were

97
transported to the laboratory in KMFRI 2 hr drive away (90 km). They were washed thoroughly
in freshwater and rinsed by letting them hang to drip for 1 hour. They were then cut into smaller
pieces and placed in an oven set at 45oC to dry to a constant weight. The drying period took 3
days. The dried seaweed samples were reduced to fine powder using a kitchen blender. The
ground samples were placed in polythene bags and kept in a freezer at -20oC until analysis.
Turmeric samples were purchased from the local market in Mombasa, brought to KMFRI,
chopped into smaller pieces and dried in an oven at 45oC for 4 days to a constant weight. The
dried turmeric samples were homogenized into fine powder using a kitchen blender, placed in
polythene seal lock bags and stored freezer at -20oC until analysis.
Water hyacinth was collected from Lake Victoria in Kisumu and separated into roots, stem and
leaves. Each of these parts was dried in an oven at 45oC for 3 days to a constant weight still in
Kisumu. The separated parts were placed in black polythene bags, then placed in an insulated
Styrofoam box and transported by air to Mombasa. The samples were then transferred to a deep
freezer set at -20oC till analysis.
4.1.2 Extraction of plant polyphenols
Portions (100 g) of each of the 3 plants (seaweed, turmeric and water hyacinth) were each
separately hydrolyzed with a solution of 3% H2SO4 (de Abreu et al, 2011) for 15 min at 130oC
at a liquid/solid ratio of 8:1 g/g. The residue was de-lignified with 6.5% NaOH for 1 hr at 130
oC, at a liquid solid ratio of 10:1 g/g. From the above liquid phase, phenolic compounds were
obtained (ratio water phase/organic phase, 1:3), using ethyl acetate. A vertical evaporator was
used to separate the organic phase.
4.1.3 Total phenolic content (TPC)
4.1.3.1 Sample preparation for TPC.
TPC was determined using Folin-Ciocalteu assay according to Henríquez et al, (2010). Ten
grams of each of the dried and ground samples were mixed with 70% acetone. The mixture was
homogenized for 1 min and shaken in a water bath at 20 oC for 1 hr. Three 1.5 ml aliquots were
centrifuged at 2500 x g for 15 min at 4oC. The supernatants was retained for analysis (1st
extraction). After that the residue was re-extracted under similar conditions and the supernatant

98
was kept for analysis (2nd extraction). TPC levels in each supernatant, (1st and 2nd extraction)
were measured. The total of the 1st and 2nd extraction for all TPC results were recorded.
4.1.3.2 Total Phenolic Content (TPC) determination
Folin-Ciocalteu reagent was reduced by phenolic compounds, to form a blue complex. Each
extract (0.5 ml) and 3 ml of distilled water and 0.25 ml Folin-Ciocalteu reagent were mixed.
Next 0.75 ml of saturated sodium carbonate and 0.95 ml of distilled water was added to the
mixture and left for 30 min at 37oC. The absorbance was read by spectrophotometry at 765 nm.
The phenolic content was calculated from a gallic acid standard curve and expressed as
milligrams of gallic acid equivalents per gram of fresh weight (mg GAE/g FW).
4.1.3.3 Application of the antioxidant samples in fish muscle and storage trials
Fish (Siganids) samples were purchased from local fishermen and iced immediately. All fish
were purchased fresh and their quality assured. The sources of antioxidants were turmeric, water
hyacinth, seaweed and commercial BHA.
Fish samples were filleted, and skin removed. The filleted samples weighing 25 kg were then
divided into five equal portions each weighing 5 kg. Each portion was then placed on a stainless-
steel tray. The portions of 5kg each were separately treated with 2.5% w/v of seaweed, 2.5%
w/v of water hyacinth, 2.5% w/v turmeric; and 1.0 % w/v of BHA solutions in distilled water
with the latter acting as the control (Table 4.1). The fillets with the extracts were each placed in
a plastic container with ice overnight for drying the following day.

99
Table 4.1: Incorporation of the natural antioxidant extracts from water hyacinth, seaweed, turmeric and BHA (positive
control) in the Siganid fillet for drying then storage.
Treatment Details Drying Storage
Turmeric • Purchased from market, dried
in oven, ground to fine mesh
• 75g taken and mixed in 3000
mls water
• 5kg Fillet then soaked in the
mixture and left to settle for
12 hours (overnight)
• Fillet removed and placed on
drying trays of the dryer at an
angle for 30 mins to drip
• Removed and transferred to
the drying chamber of solar
hybrid windmill dryer
a) Drying continued
and weight loss
taken every 2 hours
until a constant
weigh obtained.
b) Samples wrapped
in aluminium foil
each time of
sampling and placed
in ice.
c) Temperature,
water activity
determined.
d) Data collected for
drying
characteristics
End of drying,
samples transferred
to the lab in KMFRI
for storage in (i)
Open air (ii)
Ordinary polythene
(iii) Vacuum packs
Samples being
analysed for shelf-
life evaluation
Water
hyacinth • Collected from Lake Victoria
in Kisumu
• Dried in an oven at 45oC then
ground to fine mesh like
turmeric
• 75g of dried ground water
hyacinth mixed with 3000
mls water in plastic container
• 5kg Fillet was soaked in the
mixture and left to settle for
12 hours (overnight)
• Fillet removed and placed on
drying trays of the dryer at an
angle for 30 mins to drip
• Removed and transferred to
the drying chamber of solar
hybrid windmill dryer
Seaweed • Collected from seaweed farm
in Gazi, south coast of Kenya
• Dried in an oven at 45oC for
3 days
• Ground into a fine mesh
• 75g of dried ground seaweed
mixed with 3000mls water in
plastic container
• 5kg Fillet then soaked in the
mixture and left to settle for 2
hours
• Fillet removed and placed on
drying trays of the dryer at an
angle for 30 mins to drip
• Removed and transferred to
the drying chamber of solar
hybrid windmill dryer

100
BHA • Purchased from Sigma
• 10g of Butylated
hydoxyanisole mixed well in
1000 mls of water in a plastic
container
• 5 kg fish fillets were
immersed in the mixture for
12 hours, removed, placed on
trays to drip for 30 min. and
then transferred to the drying
chamber of solar hybrid
windmill dryer
CONTROL • 5 kg fish fillets were
immersed in water mixture
for 12 hours, removed, placed
on trays to drip for 30 min.
and then transferred to the
drying chamber of solar
hybrid windmill dryer
After drying, the fish fillets were placed in the drying trays outside the dryer to cool and were
wrapped in aluminium foil, labelled and kept in polythene bags and transferred to the laboratory
in KMFRI, 240 km away for storage trials. The parameters analysed during the 90 day storage
were TBARs, PV, total phenolic content and % inhibition of free radical formation.
4.2 Results and discussion
Table 4.2 and Figure 4.1 show that water hyacinth leaves and turmeric have a higher phenolic
content that reflect greater antioxidant activity. In this study however, the water-soluble extracts
were used for turmeric, water hyacinth and seaweeds.
Table 4.2: Total phenolic content in water hyacinth stem, leaves and roots and in seaweeds and Turmeric as plant sources for
natural antioxidants
Sample Concentration in µg/ml
Hyacinth stem (E. crassipes) 0.026
Hyacinth leaves 0.028
Hyacinth roots 0.018
Sea weed (Euchema) 0.006
Tumeric (C. longa) 0.027

101
Figure 4.1: Total phenolic content in graphic form for extracts of water hyacinth, turmeric and seaweed
4.3 Storage trial results with antioxidants incorporated in fish muscle
4.3.1 Lipid oxidation indicators during storage of dried siganids
Lipid oxidation was measured as peroxide value (PV) and expressed as as MilliEquivalents
O2/kg and thiobarbituric acid reducing substances (TBARS) expressed as mg malondialdehyde
/kg.
4.3.1.1 Peroxide value in fresh and stored Siganids
On day 0, the PV values in treated Siganid muscle were control 0.05±0.02 MilliEquivalents
O2/kg, BHA 0.066±0.003 MilliEquivalents O2/kg; seaweed 0.006±0.011 MilliEquivalents
O2/kg, turmeric 0.06±0.02 MilliEquivalents O2/kg and water hyacinth 0.04±0.001
MilliEquivalents O2/kg (Figure 4.2).
After 90 days of storage of treated Siganid muscle, the PV in the control was 1.83±0.98
MilliEquivalents O2/kg, BHA 0.14 ±0.03 MilliEquivalents O2/kg; seaweed 0.39±0.18
MilliEquivalents O2/kg; turmeric 0.23 ±0.11 MilliEquivalents O2/kg and in the water hyacinth
treated muscle the PV was 0.40±0.15 MilliEquivalents O2/kg. The control had higher levels of
PV after 90 days of storage compared to the muscle treated with BHA and antioxidant extracts
from turmeric, seaweed and water hyacinth indicating the protection offered against lipid
peroxidation in dried stored Siganids. The PV levels increased by 97.16% between day 0 and
0
0.005
0.01
0.015
0.02
0.025
0.03
0.035
Seaweed Hyacinth roots Hyacinth leaves Hyacinth stem Turmeric
Co
nc.
(µg/
mL)
Type of plant materials

102
day 90 in the control. The increase in PV in treated Siganid muscle between day 0 and 90 was
BHA 58.84%; turmeric 73.92%, seaweed 85.08% and water hyacinth 89.09%. In order of %
increase of PV, BHA ˂Turmeric˂Seaweed˂Water hycinth˂Control.
The PV increased steadily in all treatments until day 60. Between day 0 and day 30, there is
suppressed increase in PV in all the treatments reaching a maximum of 0.05 MilliEquivalents
O2/kg for BHA treated, 0.06 ±0.03 MilliEquivalents O2/kg for turmeric treated, 0.07±0.02
MilliEquivalents O2/kg and 0.07 ±0.004 MilliEquivalents O2/kg for hyacinth treated Siganid
muscle. The increase in PV in the control was significantly different on day 15 compared to day
0 (p<0.05) Table 4.3. In the BHA, turmeric, seaweed and water hyacinth treated Siganid muscle
there was no significant difference in PV (p<0.05) between day 0 and 30. The antioxidants
suppressed PV until day 30.
Figure 4.2: Change in peroxide value (PV) levels during 90 day storage of Siganid fillets treated with BHA (1% w/v in distilled
water), seaweed (2.5% w/v in distilled water), turmeric (2.5% w/v in distilled water) and water hyacinth (2.5% w/v in distilled
water without antioxidants.
4.3.1.2 TBARS
The TBARS value was 0.0±0.006 mg MDA/kg in the control at the start of storage on day 0
(Figure 4.3). The level of TBARS was 0.034± 0.001 mg MDA/kg on day 30 and increased to
0.64±0.011 mg MDA/kg on day 90 of storage. In the BHA treated Siganid muscle the level of
TBARS was 0.027±0.000 mg MDA/kg on day 0, decreased to 0.0012±0.000 mg MDA/kg on
day 30 and then increased to 0.051±0.006 mg MDA/kg on day 90. The TBARS in the turmeric
treated Siganid muscle was 0.086±0.006 mg MDA/kg on day 0 and decreased to 0.002 ± 0.002
mg MDA/kg on day 30 and increased to 0.113±0.006 mg MDA/kg on day 90. In the seaweed
treated Siganid muscle the TBARS value on day 0 was 0.086±0.006 mg MDA/kg. This
0
0.2
0.4
0.6
0.8
1
1.2
1.4
1.6
1.8
2
Day0 Day 15 Day 30 Day 60 Day 90
Per
oxi
de
Val
ue
(meq
/Kg)
Storage days
Control
BHA
Seaweed
Tumeric
Hyacinth

103
decreased to 0.002±0.001 mg MDA/kg on day 30 and then it increased to 0.183± 0.006 mg
MDA/kg. In the water hyacinth treated Siganid muscle, TBARS levels were 0.090 ±0.011 mg
MDA/kg on day 0, decreased to 0.0016± 0.0006 mg MDA/kg on day 30 and increased to
0.2067± 0.0055 mg MDA/kg on day 90. Between day 30 and day 60 there was a large increase
in TBARS in the control from 0.0343 to 0.4173±0.011 mg MDA/kg equivalent to 91.7%
compared with a lower increase observed in the BHA, turmeric, seaweed and water hyacinth
treated Siganid muscle.
The TBARS for BHA treated muscle was 0.0017±0.006 mg MDA/kg in day 30 and increased
to 0.03± 0.016 mg MDA/kg on day 60 which was the lowest level of TBARS observed
indicating that BHA was the most effective antioxidant. In the turmeric treated Siganid muscle
the TBARS increased from 0.0016± to 0.031±0.006 mg MDA/kg in day 60, followed by
seaweed treated muscle where the TBARS increased from 0.0016±0.0005 on day 30 to
0.039±0.0055 mg MDA/kg on day 60; water hyacinth treated Siganid muscle where TBARS
values were was 0.0016±0.0005 on day 30 and increased to 0.035±0.00 mg MDA/kg on day
60. The TBARS in the control and BHA treatment were significantly different on day 0, 15, 30
and 60 of storage (p<0.05).
In turmeric, seaweed and water hyacinth treated Siganid muscle the level of TBARS reduced
and were significantly different between day 0 and day 15 only. The decrease in TBARS values
in the first 30 days may be due to the cycling effect as peroxides (primary products) form and
are converted to secondary products TBARS. After 30 days storage TBARS in treated samples
increased significantly (p<0.05) in all samples as most peroxides are converted to TBARS. .
However, both peroxides and TBARS continued to increase up to 90 days of storage in the
untreated control samples. The protection offered by the treatments can be related to the
phenolic contents of turmeric, seaweed and water hyacinth as described below.

104
Figure 4.3: Change in TBARS levels during 90 day storage of Siganid fillets treated with BHA (1% w/v in distilled water),
seaweed (2.5% w/v in distilled water), turmeric (2.5% w/v in distilled water) and water hyacinth (2.5% w/v in distilled water)
water soluble antioxidant extracts. The control sample was treated with distilled water without antioxidants.
4.3.1.3 Total phenolic content in Siganid muscle
The total phenolic content in the control (fish muscle) was 0.002 µg/ml ±0.000 on day 0 and
0.0014 µg/ml± 0.001 µg/ml on day 90 (Figure 4.4). The highest phenolic content was in Siganid
fish muscle treated with BHA at 0.012 µg/ml±0.001 on day 0 which decreased to 0.006
µg/ml±0.000 in day 90 of storage (45.70%). In turmeric treated fish, the TPC was 0.0082
µg/ml±0.0004 on day 0 which decreased to 0.004 µg/ml± 0.0001 on day 90 (52.38%). The total
phenolic content in seaweeds was 0.005µg/ml±0.000 on day 0 that decreased to
0.003µg/ml±0.000 on day 90 (44.32%).
In the case of water hyacinth the decrease in total phenolic content was from 0.004
µg/ml±0.0004 to 0.00004µg/ml on day 90 (42.84%). There was a significant difference
(p<0.05) in reduction of TPC on day 30 in the control (table 4.3) compared to day 0. In the
BHA treated muscle there was no significant difference (p<0.05) in TPC in the first 30 days of
storage. There was a significant difference by day 15 (p<0.05) in the turmeric treated Siganid
fish muscle while in seaweed and water hyacinth treatments there was no significant difference
during storage in the first 30 days (Table 4.3). The TPC in turmeric was twice the amount found
in seaweed and water hyacinth at the beginning and during storage which reflected the higher
antioxidant effect of turmeric. The TPC was lowest in the water hyacinth during storage and
they showed the highest PV and TBARS values during storage.
-0.1
0
0.1
0.2
0.3
0.4
0.5
0.6
0.7
Day 0 Day 15 Day 30 Day 60 Day 90
TBA
(M
DA
mg/
g)
Storage Days
Control
BHA
Seaweed
Tumeric
Hyacinth

105
Figure 4.4: Change in total phenolic content levels during 90 day storage of Siganid fillets treated with BHA (1% w/v in
distilled water), seaweed (2.5% w/v in distilled water), turmeric (2.5% w/v in distilled water ) and water hyacinth (2.5% w/v in
distilled water without antioxidants
4.3.1.4 % Inhibition of free radical formation during storage
The % free radical inhibition was lowest in the control at 16.24 % ± 0.50 followed by seaweed
treated Siganid muscle at 31.70 % ±1.28, water hyacinth at 43.67±1.65 %, turmeric at
61.4046±0.14% and BHA at 88.01±0.79% on day 0 (Figure 4.5). The % inhibition decreased
in all the 4 treatments and on day 90 it was still highest in the BHA treated muscle at
72.92%±0.21, 33.72±0.21 in turmeric treated muscle, 11.49±3.50 in seaweed and 11.77±0.21
in water hyacinth treated muscle.
The % inhibition of free radical formation during storage was lowest in control and highest in
BHA treated Siganid followed by turmeric and water hyacinth and seaweed (Figure 4.5). The
effectiveness of antioxidants is shown in table 4.3 over the 30-day period. The % inhibition
was significantly different on day 15 in the control compared to day 0 of storage (Table 4.3). In
the BHA, turmeric and seaweed treated siganid muscle, the reduction in % inhibition was
significant (p<0.5) on days 0, 15 and 30. In the water hyacinth treated Siganid muscle the %
inhibition was significantly different on day 15 compared to control and seaweed treated
Siganid.
0
0.002
0.004
0.006
0.008
0.01
0.012
0.014
Day 0 Day 15 Day 30 Day 60 Day 90
Tota
l Ph
eno
lic C
on
t.(u
g/m
l)
Storage days
TPC
Control
BHA
Seaweed
Tumeric
Hyacinth
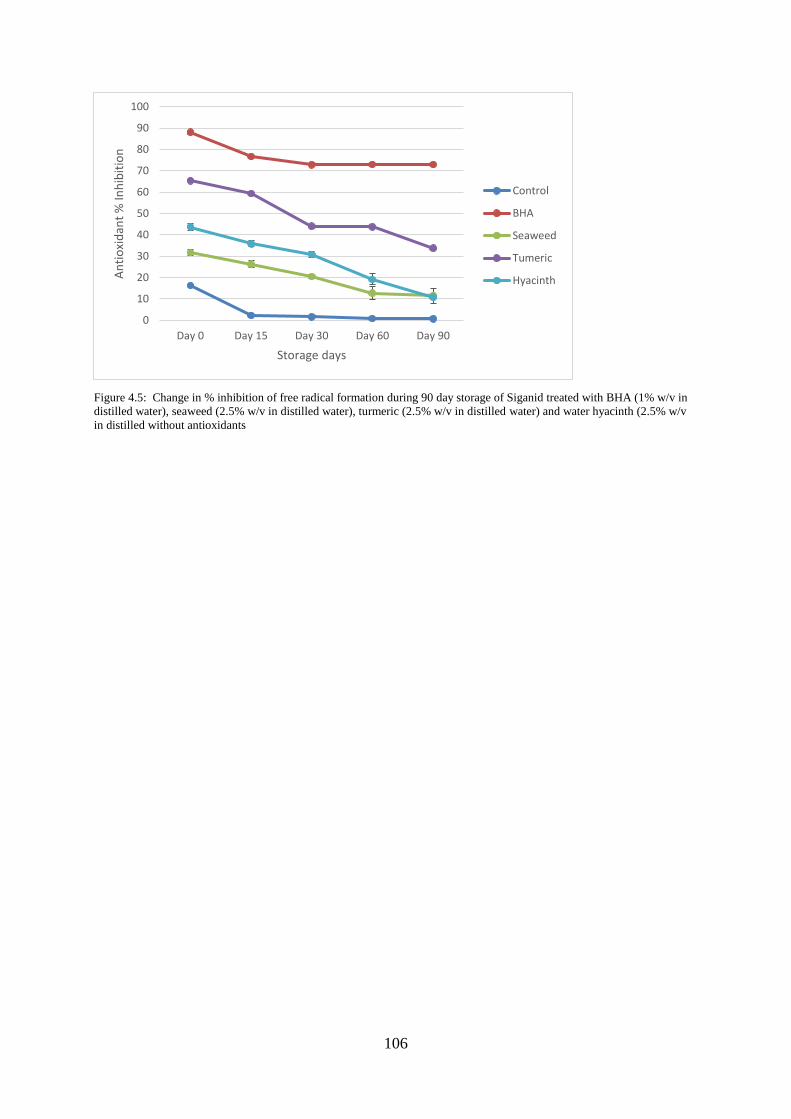
106
Figure 4.5: Change in % inhibition of free radical formation during 90 day storage of Siganid treated with BHA (1% w/v in
distilled water), seaweed (2.5% w/v in distilled water), turmeric (2.5% w/v in distilled water) and water hyacinth (2.5% w/v
in distilled without antioxidants
0
10
20
30
40
50
60
70
80
90
100
Day 0 Day 15 Day 30 Day 60 Day 90
An
tio
xid
ant
% In
hib
itio
n
Storage days
Control
BHA
Seaweed
Tumeric
Hyacinth

107
Table 4.3: Statistical analysis for TBARS, PV, TPC and % Inhibition of Siganid fillets treated with BHA (1% w/v in distilled
water), seaweed (2.5% w/v in distilled water), turmeric (2.5% w/v in distilled water) and water hyacinth (2.5% w/v in
distilled water soluble antioxidant extracts. The control sample was treated with distilled water without antioxidants.
Treatment Parameters Day 0 Day 15 Day 30
CONTROL
TBARs 0.2808 ± 0.0055a 0.1599 ± 0.0331b 0.0343 ± 0.0006c
PV 0.0519 ± 0.0229a 0.1359 ± 0.0704b 0.2908 ± 0.0331b
TPC 0.0018 ± 0.0000a 0.0018 ± 0.0000a 0.0017 ± 0.0000b
Inhibition% 16.245 ± 0.5010a 2.3410 ± 0.1380b 1.5280 ± 0.5150b
BHA
TBARs 0.0273 ± 0.0000a 0.0039 ± 0.0000b 0.0016 ± 0.0010c
PV 0.0571 ± 0.0028a 0.0545 ± 0.0225a 0.0518 ± 0.0007a
TPC 0.0117±0.0006a 0.0105 ± 0.0005a 0.0101 ± 0.0003a
Inhibition% 88.006 ± 0.7870a 76.634 ± 0.2070b 72.853 ± 0.5150c
TURMERIC
TBARs 0.0858 ± 0.0055a 0.0078 ± 0.0055b 0.0016 ± 0.0017b
PV 0.0591 ± 0.0211a 0.0755 ± 0.0522a 0.0618 ± 0.0026a
TPC 0.0082 ± 0.0004a 0.0074 ± 0.0002b 0.0065 ± 0.0000b
Inhibition% 65.385 ± 0.1430a 59.317 ± 0.2760b 44.032 ± 0.7200c
SEAWEED
TBARs 0.0858 ± 0.0055a 0.0078 ± 0.0055b 0.0016 ± 0.0006b
PV 0.0576 ± 0.0115a 0.05778 ± 0.019a 0.0695 ± 0.0177a
TPC 0.0046 ± 0.0004a 0.0042 ± 0.0003a 0.0041 ± 0.0004a
Inhibition% 31.680 ± 1.2850a 26.195±1.5570b 20.451 ± 0.9260c
WATER
HYACINTH
TBARs 0.0897 ± 0.0110a 0.0078 ± 0.0055b 0.0016 ± 0.0006b
PV 0.0437 ± 0.0018a 0.0521 ± 0.0135a 0.0689 ± 0.0044a
TPC 0.0041 ± 0.0004a 0.0040 ± 0.0003a 0.0037 ± 0.0004a
Inhibition% 43.674 ± 1.6460a 35.805 ± 1.3800b 30.859 ± 1.2350b
Different superscript (a b c) across the table indicates significance difference using Tukeys
Pairwise comparison ANOVA.
4.4 Discussion
The control Siganid fillets showed the highest levels of peroxides, TBARS and free radical
formation over a storage period of 90 days. Fish fillets treated with synthetic BHA indicated
the best antioxidant activity as shown by significantly lower lipid oxidation products due to its
high polyphenol content. The concentration of BHA was however high as it is used in very
small quantities in foods. Here it was 10 g per 1000 mls. BHA is a known antioxidant and was

108
used as a positive control. The natural antioxidant plant materials used to treat the Siganid fillets
were not as effective as BHA, but significantly reduced lipid oxidation compared to the control,
Turmeric was more effective in reducing lipid oxidation compared with seaweed and water
hyacinth; this was probably due to their relatively high polyphenol content.
The increase in PV to day 60 and eventual drop was due to propagation of free radicals and
formation of peroxides initially followed by TBARS secondary and tertiary products.
It is likely that the polyphenolic antioxidants caused a delay in oxidation but with time, owing
to light penetration of packaging material and heat, and depletion of antioxidant level, the
process of propagation in lipid oxidation increased towards the end of the storage period. The
increase in PV is slightly higher in seaweed and water hyacinth treated Siganid muscle as their
concentration of antioxidants was lower than in turmeric and BHA. Between day 0 and 30, the
total phenolic content in the muscle was lower in the seaweed and water hyacinth throughout
the storage followed by turmeric and BHA (Figure 4. 4) which had higher phenolic compounds.
The natural intrinsic phenolic content in control was the lowest and reflected the high oxidation
level. The total phenolic content was low in day 0 to 30 for water hyacinth and seaweed giving
a concomitant rise in PV. Finally, the total phenolic content continued to drop meaning its
electron donor capacity was decreasing and reducing antioxidant activity that suppressed
oxidation. The control was 0.29mEq/kg on day 30. This means that the natural antioxidants
from turmeric, seaweed and water hyacinth exerted some antioxidant activity in these early
stages of storage. The natural antioxidants of turmeric, seaweed and water hyacinth have
antioxidant activity, but their effectiveness varied. BHA, the synthetic antioxidant at the
concentrations used was effective.
The reduction in the TBARS in days 0 to 30 corresponds to reduction in total phenolic content
in that period. However, the total phenolic content decreased further in days 60 to 90 with an
increase in TBARS in the control followed at a lower rate in treatments with BHA, turmeric,
seaweeds and water hyacinth. Inhibition of free radical formation was also related to the
strength of the antioxidants. In this study BHA has a higher % inhibition than turmeric and
seaweed in the 30-day storage period and these were in turn higher in % inhibition than control
and water hyacinth. The total phenolic content was highest in BHA treated Siganid muscle and
this was related to its higher antioxidant activity.
All treatments were more effective than the control in suppressing lipid oxidation.

109
Antioxidants can reduce lipid oxidation by competitively binding active forms of oxygen,
interfering with the initiation and propagation steps, binding free radicals and break the chain
by stabilizing peroxides and form antioxidant radicals that are too unreactive for further
reactions or form non-radical products (Halliwell and Gutteridge, 1995).
The natural antioxidants used in this study and synthetic antioxidant BHA all contain phenolic
groups. The mechanism of action of phenolic groups relies on the resonance stabilisation of the
phenoxy radicals that occurs at the ortho and para position on the aromatic ring. In addition, it
can be influenced by the size of the substituting group. Further, many phenolic compounds
contain carbonylic and carboxylic groups that can chelate metals and thereby inhibit lipid
oxidation and rancidity (Howell and Saeed, 1999).
Synthetic phenolic compounds like BHA and BHT have been widely used; however, there is a
concern that they may be toxic or carcigonegic. Therefore, natural antioxidants like turmeric,
gallic acid and plant extracts like water hyacinth and seaweeds can provide effective
alternatives.
4.4.1 Conclusions
The natural antioxidants in water hyacinth, seaweeds, turmeric suppressed lipid oxidation just
like the synthetic antioxidant- BHA. The Total Phenolic content (TPC) in turmeric was twice
the amount found in seaweed and water hyacinth at the beginning and during storage which
reflected the higher antioxidant effect of turmeric. The TPC was lowest in the water hyacinth
during storage and they showed the highest PV and TBARS values during storage. The order
of strength of the antioxidants was BHA>Turmeric>Seaweeds>Water hyacinth. BHA, used in
lower concentrations in most foods was at a much higher concentration in this study and because
synthetic antioxidants are now considered unsafe, it is advantageous to replace them with
natural antioxidant sources like water hyacinth, turmeric and seaweed plant phenolics.

110
CHAPTER 5

111
CHAPTER 5
5.0 Physicochemical properties of stored Siganid fish muscle treated with natural
antioxidants
5.1. Introduction
There is an increase in the consumption of aquatic products preserved by hot air drying. Most
drying methods cause quality changes in fish protein amino acid residues which result in the
modification of structural, digestibility and functional properties of the protein (Deng et al.,
2014).
It is important to maintain functionality of myofibrillar proteins in muscle foods to enhance the
eating quality of meat products. It is also essential to better understand the thermal stability
of fish proteins particularly the myofibrillar proteins during processing including drying
(Ahmed et al 2009). Loss of functionality of proteins is caused by degradation and denaturation
of proteins resulting in texture changes.
The texture of meat products is also influenced by the major protein actomyosin which plays
an important role during heat processing. (Skipnes et al 2008; Ahmed et al 2009). The process
of heat gelation involves the solubility of the myofibrillar proteins in salt solution, denaturation
of protein molecules on heating and thirdly aggregation of proteins by non-covalent
electrostatic, hydrophobic and hydrogen bonds and covalent disulfide linkages (Esturk and Park
2014, Stones and Stanley, 1992; Lefevre et al, 1999). Most changes in protein properties during
drying take place in myosin and actin which denatures at temperatures of 43 to 60 oC (Dang et
al 2014, Skipness et al 2008) Changes in protein structure during heat processing and
subsequent storage can be monitored by measurement of thermodynamic properties by
differential scanning calorimetry and viscoelastic properties by large and small deformation
rheology. Proteins are modified by thermal processing and further changes may occur during
storage due to the oxidation of proteins and lipids.
In this study, the effect of four antioxidants on the structural and physicochemical properties of
dried fish muscle during storage at ambient temperature, were investigated. First, the
viscoelastic properties were measured as the elastic modulus G’ and viscous modulus G’’ by
112
small deformation rheology. Secondly, the thermodynamic properties including transition
temperature (Tm) and enthalpy change ΔH were obtained from differential scanning
calorimetry scans.
5.2. Materials and methods
5.2.1. Materials
The rabbit fish ‘Siganus sutor or Siganids (warm water species found in the Western Indian
Ocean region) were caught by artisanal fishermen, iced, gutted, then dried in the hybrid
windmill solar tunnel dryer located in Kipini as described in Chapter 2.
Antioxidants water hyacinth (Eichronia), seaweeds (Eucheuma), turmeric (Curcuma) and
synthetic antioxidant BHA were obtained from Mombasa, Shimoni and Kisumu as described in
Chapter 4.
5.2.2. Fish muscle preparation
The solar dried fish, with or without natural antioxidants, were cut into small pieces with a
kitchen knife and transferred to a blender where the muscle tissue was homogenized to a fine
powder. The samples were transferred to seal-lock bags, labelled and transported by air to the
University of Surrey where they were stored in a freezer at -80oC until analysis.
5.2.3. Rheological properties
Small deformation rheological studies were performed on a rheometer (Rheometrics -Dynamic
stress rheometer Model SR 200, made in the USA).
5.2.3.1 Setting up the rheometer for analysis
The pressure gauge of the rheometer was set to 60. Water was filled in the cooling unit for the
rheometer and the temperature allowed to rise to 45oC. The rheometer was then switched on
and the probe was unlocked and rotated. The rheometer was then calibrated by resetting the
calibration button to 0 (zero) and the knob rotated to create a gap of -2.000 mm. The probe was
lowered again, and the reading recorded when it was approximately 2.000. The computer was
switched on and the rheology software opened. The temperature on the computer was set at

113
20oC and the start button on the screen activated. Next, the function Edit geometry was activated
in the window and the calibration value of approximately 2 found earlier entered in the
appropriate box. The options icon was activated, followed by “Tool Cal” and the calibration
process started. When calibration ended, “OK” was clicked then “OK” clicked again. At the
end of calibration, the probe was taken back to the upper position before lowering at the start
of the testing. The sample for analysis was prepared.
5.2.3.2 Sample loading on rheometer
Solar dried ground muscle (4 g) was weighed into a beaker and 8 mls of deionized water added
(the weight was based on initial protein and moisture content) to make a paste. The sample was
then spread on the plate making it as thin as possible. The Rheometer probe knob was switched
on to lower the clean probe. Silicone oil was applied around the plate edge to prevent drying
out of the sample during heating. The rheometer was run for about 1.5 hrs. The rheology
reading on the computer screen was saved in the folder to give the excel version of the G and
G’’ readings.
5.2.4 Thermodynamic properties
Differential Scanning Calorimetry (DSC VII) is a unique technique that measures the
thermodynamic properties of materials particularly the transition temperature and enthalpy
change with time and temperature. DSC is a thermal analysis instrument that measures the
temperature and heat flow related to transitions of materials. On heating, DSC indicates the
amount of heat that is radiated or absorbed by the sample, based on a temperature difference
between the reference material and the sample. Both the sample and reference in sealed
containers or pans are in contact with a thermoelectric disk which transfers heat from the
surrounding furnace to the pans at a linear heating rate.
5.2.4.1 Sample preparation
The sample containers (pans) were cleaned and handled with tissue or tweezers throughout the
experiment. Based on the moisture and protein content estimates on the solar dried fish, 0.25g
of fish muscle was weighed in a plastic weighing boat and using a micropipette, 0.75ml of
deionized water added. The samples were transferred carefully to the weighing pans for sample
(S). An equal amount of water was carefully transferred to the reference pan (R). The pans
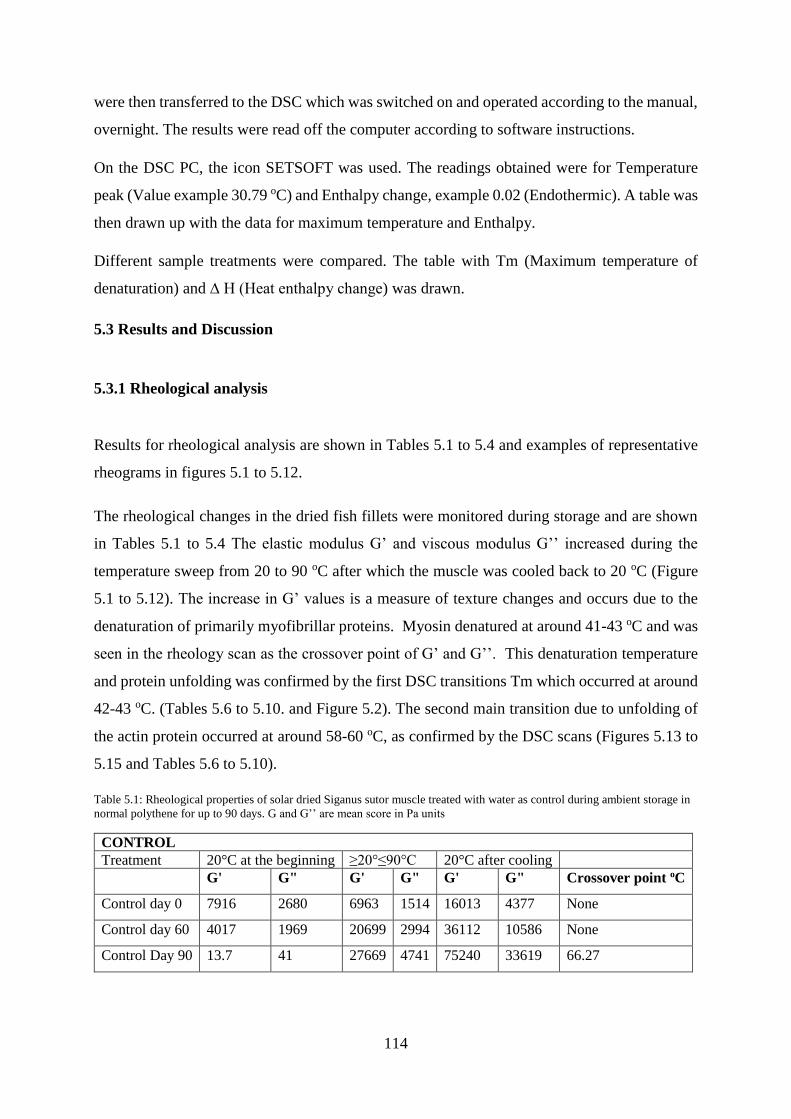
114
were then transferred to the DSC which was switched on and operated according to the manual,
overnight. The results were read off the computer according to software instructions.
On the DSC PC, the icon SETSOFT was used. The readings obtained were for Temperature
peak (Value example 30.79 oC) and Enthalpy change, example 0.02 (Endothermic). A table was
then drawn up with the data for maximum temperature and Enthalpy.
Different sample treatments were compared. The table with Tm (Maximum temperature of
denaturation) and ∆ H (Heat enthalpy change) was drawn.
5.3 Results and Discussion
5.3.1 Rheological analysis
Results for rheological analysis are shown in Tables 5.1 to 5.4 and examples of representative
rheograms in figures 5.1 to 5.12.
The rheological changes in the dried fish fillets were monitored during storage and are shown
in Tables 5.1 to 5.4 The elastic modulus G’ and viscous modulus G’’ increased during the
temperature sweep from 20 to 90 oC after which the muscle was cooled back to 20 oC (Figure
5.1 to 5.12). The increase in G’ values is a measure of texture changes and occurs due to the
denaturation of primarily myofibrillar proteins. Myosin denatured at around 41-43 oC and was
seen in the rheology scan as the crossover point of G’ and G’’. This denaturation temperature
and protein unfolding was confirmed by the first DSC transitions Tm which occurred at around
42-43 oC. (Tables 5.6 to 5.10. and Figure 5.2). The second main transition due to unfolding of
the actin protein occurred at around 58-60 oC, as confirmed by the DSC scans (Figures 5.13 to
5.15 and Tables 5.6 to 5.10).
Table 5.1: Rheological properties of solar dried Siganus sutor muscle treated with water as control during ambient storage in
normal polythene for up to 90 days. G and G’’ are mean score in Pa units
CONTROL
Treatment 20°C at the beginning ≥20°≤90°C 20°C after cooling
G' G" G' G" G' G" Crossover point oC
Control day 0 7916 2680 6963 1514 16013 4377 None
Control day 60 4017 1969 20699 2994 36112 10586 None
Control Day 90 13.7 41 27669 4741 75240 33619 66.27

115
Table 5.2: Rheological properties of solar dried Siganus sutor muscle treated with natural antioxidant water extracts of water
hyacinth (Eichronia) during ambient storage in normal polythene for up to 90 days. G and G’’ are mean score in Pa units
WATER HYACINTH
Treatment 20°C at the
beginning
≥20°≤90°C 20°C after
cooling
G' G" G' G" G' G" Crossover point oC
Control day 0 7916 2680 6963 1513 16013 4377 None
Water hyacinth Day 0 522 750 22915 3161 43453 14380 21.55
Water hyacinth Day 15 494 787 22739 3304 36741 11285 42.54
Control day 60 4017 1969 20699 2994 36112 10586 None
Water hyacinth Day 60 3117 1317 6671 1535 12220 3572 0.00
Table 5.3: Rheological properties of solar dried Siganus sutor muscle treated with natural antioxidant water extracts of
seaweed (Eucheuma) during ambient storage in normal polythene for up to 90 days. G and G’’ are mean score in Pa units
SEAWEED
Treatment 20°C at the beginning ≥20°≤90°C 20°C after cooling
G' G" G' G" G' G" Crossover point oC
Control day 0 7916 2680 6963 1513 16013 4377 None
Seaweed Day 0 6190 3331 9266 2452 44807 16436 67.86
Control day 60 4017 1969 20699 2994 36112 10586 None
Seaweed day 60 1505 670 10.6 101 18428 6634 71.22
Control day 90 13.7 40.7 27669 4741 75241 33619 66.27
Seaweed day 90 65505 18881 25046 3415 38720 12324 0.00
Table 5.4: Rheological properties of solar dried Siganus sutor muscle treated with natural antioxidant water extracts of
Turmeric (Curcuma) during ambient storage in normal polythene for up to 90 days. G and G’’ are mean score in Pa units
TURMERIC
Treatment 20°C at the
beginning
≥20°≤90°C 20°C after
cooling
G' G" G' G" G' G" Crossover point oC
Control day 0 7916 2680 6963 1513 16013 4377 None
Turmeric Day
0
87.83 57.84 281.56 592 6483 2513 75.38
Control day 60 4017 1969 20699 2994 36112 10586 None
Turmeric day
60
919 1192 26639 4427 69470 26444 51.92
Control day 90 13.77 40.73 27669 4741 75241 33619 66.27
Turmeric day
90
49.90 58.96 10715 1869 23985 8706 52.56

116
Table 5.5: Rheological properties of solar dried Siganus sutor muscle treated with synthetic antioxidant BHA during ambient
storage in normal polythene for up to 90 days. G and G’’ are mean score in Pa units
BHA
Treatment 20°C at the beginning ≥20°≤90°C 20°C after cooling
G' G" G' G" G' G" Crossover point oC
Control day 0 7916 2680 6963 1513 16013 4377 None
BHA Day 0 12.02 45.97 10883 2357 40555 13511 76.83
Control day 60 4017 1969 20699 2994 36112 10586 None
BHA day 60 11.39 41.11 14812 2504 37447 13464 65.61
Control day 90 13.77 40.73 27669 4741 75240 33619 66.27
BHA day 90 1124 563.4 31014 4655 70557 27383 49.94
Further heating to 90 oC on the rheometer resulted in a rapid increase in G’ values and caused
gelation via covalent bonds, but mainly covalent links like disulphide bonds. Upon cooling to
20 oC the G’ and G’’ values increased gradually due to the formation of non-covalent
hydrophobic and electrostatic interactions.
The rheological and DSC methods allowed the monitoring of changes that occurred in storage
of the dried fish. G’ values after heating and cooling of the untreated dried fish increased with
time of storage from 16013 Pa at day 0 to 36112 Pa after 60 days and 75240 Pa after 90 days
(Table 5.1). Increases in G’ values have been reported for cod (Badii and Howell, 2001) and
Atlantic mackerel fish (Saeed and Howell, 2002) stored at -20 oC mainly due to the denaturation
of the myofibrillar proteins. For both studies it was shown that the addition of antioxidants like
vitamin C, vitamin E and butylated hydroxytoluene (BHT) reduced the rate of increase of G’
values, keeping the fillet close to the original control in terms of texture and biochemical
composition. This trend was also evident in the present study on stored solar dried Siganid fish.
5.3.2 Addition of antioxidants
In this study the effect of antioxidants namely water hyacinth, turmeric, seaweed and BHA, on
the muscle integrity and texture during storage for 0, 15, 60 and 90 days was investigated in
terms of the rheological and thermodynamic properties. Results for the rheological temperature
sweep scans for solar dried fish samples in the presence of antioxidants are reported in Tables
5.1 to 5.5.
The addition of all antioxidants lowered the G’ values, which reflects desirable texture qualities
that are closer to the control dried fish at 0 day. Water hyacinth gave the lowest values after

117
heating and cooling to 20 oC, followed by turmeric, seaweed and BHA, which were all lower
than for the control stored for a similar length of time. The thermodynamic properties Tm and
enthalpy change values did not alter significantly with storage (Figures 5.13 to 5.15).
For water hyacinth the G’ values at day 0, 15 and 60 days were 43453, 36112 and 12220 Pa
respectively (Table 5.2). The DSC scan for water hyacinth showed that Tm decreased slightly
but not significantly. The enthalpy change remained the same as the control initially but
decreased after 60 days of storage, indicating denaturation of the proteins on prolonged storage
(Table 5.7, Figures 5.13 and 5.14).
Similarly, G’ values of fish fillets stored with turmeric were 36112, after 60 days and 23985 Pa
after 90 days (Table 5,4) and were significantly lower than the control samples after storage
(Table 5.1). The Tm for myosin and actin did not change significantly, although the enthalpy
change decreased after 60 days, indicating denaturation (Table 5.9, Figures 5.13 to 5.15).
Similarly, seaweed addition (Table 5.3) to the dried fillets resulted in 36, 112 Pa after 60 days
and 23985 Pa after 90 days indicated lower values than the controls without antioxidants (Table
5.1). In the presence of seaweed, the Tm for the myosin peak increased with storage time
indicating changes in myosin possible through seaweed –myosin interaction or lipid-protein
interactions. The Tm for actin was like that of the control. The enthalpy change was also
reduced with storage for 60 days indicating denaturation during storage (Table 5.8 Figure 5.13
to 5.15).
The positive control BHA had high values 37447 and 70557 Pa at 60 and 90 days (Table 5.5)
which were higher than those for the other samples and closer to the control without antioxidant
(Table 5.1). The Tmax for myosin and actin increased with time of storage in the presence of
BHA. After 60 days the enthalpy change was reduced compared to the control (Table 5.10,
Figure 5.14 and 5.15).

118
Figure 5.1: Small deformation rheology temperature sweep (20oC to 90oC and cooled back to 20oC) showing G’ and G’’ values
for stored (day 0) solar dried Siganid fillets the control sample was treated with distilled water without antioxidants.
Figure 5.2: Small deformation rheology temperature sweep (20oC to 90oC and cooled back to 20oC) showing G’ and G’’ values
for stored (day 60) solar dried Siganid fillets treated with water hyacinth (2.5 % w/v in distilled water). The control sample was
treated with distilled water without antioxidants
10.0 20.0 30.0 40.0 50.0 60.0 70.0 80.0 90.0 100.0
102
103
104
105
Temp [°C]
G
' (
)
[
Pa
]
G
" (
)
[
Pa
]
Siganid Control Day 0 repeat
10.0 20.0 30.0 40.0 50.0 60.0 70.0 80.0 90.0 100.0
103
104
105
Temp [°C]
G
' (
)
[P
a]
G
" (
)
[P
a]
Siganid Water hyacinth Day 60b repeat

119
Figure 5.3: Small deformation rheology temperature sweep (20oC to 90oC and cooled back to 20oC) showing G’ and G’’ values
for stored (day 90) solar dried Siganid fillets. The control sample was treated with distilled water without antioxidants.
Figure 5.4: Figure 5.4 Small deformation rheology temperature sweep (20oC to 90oC and cooled back to 20oC) showing G’ and
G’’ values for stored (day 0) solar dried Siganid fillets treated with water hyacinth (2.5 % w/v in distilled water). The control
sample was treated with water without antioxidants.
10.0 20.0 30.0 40.0 50.0 60.0 70.0 80.0 90.0 100.0
100
101
102
103
104
105
Temp [°C]
G
' ()
[P
a]
G
" (
)
[P
a]
Siganid Control Day 90 repeat
10.0 20.0 30.0 40.0 50.0 60.0 70.0 80.0 90.0 100.0
101
102
103
104
105
Temp [°C]
G
' ()
[P
a]
G
" (
)
[P
a]
Sigand Waterhyacinth Day 0c

120
Figure 5.5: Small deformation rheology temperature sweep (20oC to 90oC and cooled back to 20oC) showing G’ and G’’ values
for stored (day 60) solar dried Siganid fillets treated with water hyacinth (2.5 % w/v in distilled water). The control sample was
treated with distilled water without antioxidants.
Figure 5.6: Small deformation rheology temperature sweep (20oC to 90oC and cooled back to 20oC) showing G’ and G’’ values
for stored (day 0) solar dried Siganid fillets treated with seaweed (2.5 % w/v in distilled water). The control sample was treated
with distilled water without antioxidants.
10.0 20.0 30.0 40.0 50.0 60.0 70.0 80.0 90.0 100.0
102
103
104
105
Temp [°C]
G
' ()
[P
a]
G
" (
)
[P
a]
Siganid in Water Hyacinth Day 60
10.0 20.0 30.0 40.0 50.0 60.0 70.0 80.0 90.0 100.0
100
101
102
103
104
105
Temp [°C]
G
' (
)
[
Pa]
G
" (
)
[
Pa]
Siganid in Seaweed Day 0c

121
Figure 5.7: Small deformation rheology temperature sweep (20oC to 90oC and cooled back to 20oC) showing G’ and G’’ values
for stored (day 60) solar dried Siganid fillets treated with seaweed (2.5 % w/v in distilled water). The control sample was
treated with distilled water without antioxidants.
Figure 5.8: Small deformation rheology temperature sweep (20oC to 90oC and cooled back to 20oC) showing G’ and G’’ values
for stored (day 90) solar dried Siganid fillets treated with seaweed (2.5 % w/v in distilled water). The control sample was
treated with distilled water without antioxidants.
10.0 20.0 30.0 40.0 50.0 60.0 70.0 80.0 90.0 100.0
100
101
102
103
104
105
Temp [°C]
G
' ()
[P
a]
G
" (
)
[P
a]
Siganid Seaweed Day 60 arepeat
10.020.0 30.0 40.0 50.0 60.0 70.0 80.0 90.0
100.0
103
104
105
Temp [°C]
G
' ()
[Pa
]
G
" (
)
[Pa
]
Siganid in Seaweed Day 90b

122
Figure 5.10: Small deformation rheology temperature sweep (20oC to 90oC and cooled back to 20oC) showing G’ and G’’
values for stored (day 90) solar dried Siganid fillets treated with Turmeric (2.5 % w/v in distilled water). The control sample
was treated with distilled water without antioxidants.
10.0 20.0 30.0 40.0 50.0 60.0 70.0 80.0 90.0 100.0
101
102
103
104
105
Temp [°C]
G
' ()
[P
a]
G
" (
)
[P
a]
Siganid in Tumeric Day 90c
10.0 20.0 30.0 40.0 50.0 60.0 70.0 80.0 90.0 100.0
10-3
10-2
10-1
100
101
102
103
104
Temp [°C]
G
' ()
[
Pa
]
G
" (
)
[
Pa
]Siganid in Tumeric Day 0c
Figure 5.9: Small deformation rheology temperature sweep (20oC to 90oC and cooled back to 20oC) showing G’ and G’’
values for stored (day 0) solar dried Siganid fillets treated with Turmeric (2.5 % w/v in distilled water). The control
sample was treated with distilled water without antioxidants.

123
Figure 5.11: Small deformation rheology temperature sweep (20oC to 90oC and cooled back to 20oC) showing G’ and G’’
values for stored (day 0) solar dried Siganid fillets treated with BHA (1% w/v in distilled water). The control sample was treated
with distilled water without antioxidants.
Figure 5.12: Small deformation rheology temperature sweep (20oC to 90oC and cooled back to 20oC) showing G’ and G’’
values for stored (day 90) solar dried Siganid fillets treated with BHA (1% w/v in distilled water). The control sample was
treated with distilled water without antioxidants.
10.0 20.0 30.0 40.0 50.0 60.0 70.0 80.0 90.0 100.0
10-1
100
101
102
103
104
105
Temp [°C]
G
' ()
[
Pa]
G
" (
)
[
Pa]
Siganid in BHA Day 0a
10.0 20.0 30.0 40.0 50.0 60.0 70.0 80.0 90.0 100.0
100
101
102
103
104
105
Temp [°C]
G
' ()
[
Pa]
G
" (
)
[
Pa]
Siganid in BHA Day 90a

124
5.3.3 Differential Scanning Calorimetry (DSC) Analysis
The results for DSC analysis are as shown in figures 5.13 to 5.15 and tables 5.2 to 5.6
Figure 5.13: Differential Scanning Calorimetry thermogram for fish muscle showing denaturation temperature (Tmax) and heat
enthalpy change values (∆H) for stored (day 0) solar dried Siganid fillets treated with BHA (1% w/v in distilled water), seaweed
(2.5% w/v in distilled water), turmeric (2.5% w/v in distilled water) and water hyacinth (2.5% w/v in distilled water) water
soluble antioxidant extracts. The control sample was treated with distilled water without antioxidants.

125
Figure 5.14: Differential Scanning Calorimetry thermogram for fish muscle showing denaturation temperature (Tmax) and
heat enthalpy change values (∆H) for stored (day 60) solar dried Siganid fillets treated with BHA (1% w/v in distilled water),
seaweed (2.5% w/v in distilled water), turmeric (2.5% w/v in distilled water) and water hyacinth (2.5% w/v in distilled water)
water soluble antioxidant extracts. The control sample was treated with distilled water without antioxidants.
Figure 5.15: Differential Scanning Calorimetry thermogram for fish muscle showing denaturation temperature (Tmax) and heat
enthalpy change values (∆H) for stored (day 90) solar dried Siganid fillets treated with BHA (1% w/v in distilled water),
seaweed (2.5% w/v in distilled water), turmeric (2.5% w/v in distilled water) and water hyacinth (2.5% w/v in distilled water)
water soluble antioxidant extracts. The control sample was treated with distilled water without antioxidants.
-0.5
-0.4
-0.3
-0.2
-0.1
0
0.1
0.2
0.00 10.00 20.00 30.00 40.00 50.00 60.00 70.00 80.00 90.00 100.00
Furn
ace
Tem
p o
C
Heat Flow/mW
Control Day 90 #Heat Flow /mW BHA Day 90 #Heat Flow /mW
Seaweed Day 90 #Heat Flow /mW Water hyacinth day 60 #Heat Flow /mW
Tumeric day 90 #Heat Flow /mW

126
Table 5.6: Transition denaturation temperatures Tonset, Tmax oC and Heat enthalpy change (∆H) for myosin and actin proteins
obtained by differential scanning calorimetry (DSC) for stored solar dried Siganid fish muscle (control)
Myosin Actin
Treatment Denaturation
temperature oC
Enthalpy ∆H
Denaturation
temperature oC
Enthalpy ∆H
(Tonset) (Tmax) Endothermic
Effect/J/g
(Tonset) (Tmax) Endothermic Effect/J/g
Control Day 0 42.17 44.91 0.11 50.46 57.52 0.27
Control Day 15 43.21 45.72 0.20 52.31 59.93 0.30
Control Day 60 42.97 45.09 0.07 52.58 60.53 0.24
Control Day 90 43.63 46.81 0.44 53.47 59.25 0.09
Table 5.7: Transition denaturation temperatures Tonset, Tmax oC and Heat enthalpy change (∆H) for myosin and actin proteins
obtained by differential scanning calorimetry of stored solar dried Siganid fish muscle treated with water extracts of water
hyacinth as an as antioxidants. Comparisons only with control for each treatment
Myosin actin
Treatment First transition
Denaturation
temperature oC
Enthalpy ∆H
Second
transition
Denaturation
temperature oC
Enthalpy ∆H
(Tonset) (Tmax) Endothermic
effect/J/g
(Tonset) (Tmax) Endothermic
effect/J/g
Control Day 0 42.17 44.91 0.11 50.46 57.53 0.27
Water hyacinth Day 0 41.00 43.66 0.06 53.98 57.58 0.03
Control Day 15 43.21 45.72 0.20 52.31 59.93 0.30
Water hyacinth Day 15 41.13 45.04 0.05 55.93 57.67 0.02
Control Day 60 42.97 45.09 0.07 52.58 60.54 0.24
Water hyacinth Day 60 41.70 44.03 0.12 56.68 57.56 0.07
Table 5.8: Transitions denaturation temperatures Tonset, Tmax oC and Heat enthalpy change (∆H) for myosin and actin proteins
by differential scanning calorimetry (DSC) of stored solar dried Siganid fish muscle treated with water extracts of seaweed
(Eucheuma) as antioxidants. Comparisons only with control for each treatment
Treatment Myosin First Transition
Denaturation
temperature oC
Enthalpy
change ∆H
Actin Second transition
Denaturation
temperature oC
Enthalpy
change ∆H
(Tonset) (Tmax) Endothermic
effect/J/g
(Tonset) (Tmax) Endothermic
effect/J/g
Control Day 0 42.17 44.91 0.11 50.46 57.53 0.27
Seaweed Day 0 40.45 42.05 0.05 58.07 60.71 0.04
Control Day 60 42.97 45.09 0.07 52.58 60.54 0.24
Seaweed Day 60 40.55 43.35 0.10 58.15 59.95 0.03
Control Day 90 43.63 46.81 0.44 53.47 59.25 0.09
Seaweed Day 90 48.65 48.89 0.001 55.69 58.41 0.004

127
Table 5.9: Transition denaturation temperatures Tonset, Tmax oC and Heat enthalpy change (∆H) of myosin and actin protein
s by differential scanning calorimetry (DSC) of stored solar dried Siganid fish muscle treated with water extracts of Turmeric
as antioxidants. Comparisons only with control for each treatment
Treatment Myosin transition
Denaturation
temperature oC
Enthalpy
change ∆H
Actin transition
Denaturation
temperature oC
Enthalpy
change ∆H
(Tonset) (Tmax) Endothermic
effect/J/g
(Tonset) (Tmax) Endothermic
effect/J/g
Control Day 0 42.17 44.91 0.11 50.46 57.53 0.27
Turmeric Day 0 42.48 44.57 0.11 54.61 57.36 0.10
Control Day 60 42.97 45.09 0.07 52.58 60.54 0.24
Turmeric Day 60 41.15 43.80 0.17 56.40 58.68 0.03
Control Day 90 43.63 46.81 0.44 53.47 59.25 0.09
Turmeric Day 90 41.42 43.72 0.23 54.80 57.85 0.06
Table 5.10: Transition denaturation temperatures Tonset, Tmax oC and Heat enthalpy (∆H) of myosin and actin proteins by
differential scanning calorimetry (DSC) of stored solar dried Siganid fish muscle treated with BHA as antioxidant.
Comparisons only with control for each treatment
Treatment Myosin Transition
Denaturation
temperature oC
Enthalpy
change ∆H
Actin transition
Denaturation
temperature oC
Enthalpy
change ∆H
(Tonset) (Tmax) Endothermic
effect/J/g
(Tonset) (Tmax) Endothermic
effect/J/g
Control Day 0 42.17 44.91 0.11 50.46 57.53 0.27
BHA Day 0 43.99 47.12 0.45 53.62 58.54 0.07
Control Day 60 42.97 45.09 0.07 52.58 60.54 0.24
BHA Day 60 44.55 47.46 0.59 55.30 58.88 0.02
Control Day 90 43.63 46.81 0.44 53.47 59.26 0.09
BHA Day 90 43.45 46.36 0.20 58.34 59.07 0.13
5.4 Discussion
This study shows that antioxidants particularly the natural antioxidants water hyacinth,
followed by turmeric and seaweed can be used to minimize texture changes during the storage
of dried fish. Fish particularly fatty fish comprises triglycerides (75%) and phospholipids (25%)
Most fish oils contain saturated fatty acids and an abundance of polyunsaturated fatty acids like
docosapentaenoic acid (DHA) and eicosapentaenoic acid (EPA). Whilst the PUFAs are
implicated in lowering atherosclerosis and lowering blood cholesterol, these unsaturated fatty
acids and cholesterol are readily oxidized leading to rancidity and formation of chemicals
including mutagens and carcinogens such as hydroxides, endoperoxides and epoxides
(Halliwell and Gutteridge, 1995) (See chapter 3).

128
Lipid peroxidation is initiated in the presence of oxygen and metal ions, when hydrogen is
abstracted from a methylene group in the PUFA by a reactive species. The primary products of
lipid oxidation are peroxides which are converted to secondary products like aldehydes
(TBARS). The free radicals and aldehydes produced during lipid peroxidation can combine
with each other or more likely with protein molecules to end the chain reaction. This can cause
severe denaturation of proteins and undesirable changes in nutritional properties including loss
of amino acids, protein cross-linking and DNA damage. (Saeed, Fawthrop and Howell, 1999).
Aldehydes can react with amino groups forming intramolecular bonds and cross-links with
other protein molecules (Saeed et al., 1999) and provided evidence by ESR spectroscopy that
lipid oxidation damages proteins through the transfer of free radicals to amino acids and proteins
to form protein free radicals. These radicals can react with each other, for example tyrosine
free radicals can react to form dityrosine (Saeed et al., 2006). It is this cross-linking that causes
aggregation in proteins and toughening of fish muscle during processing like drying and
freezing and on storage.
It is well known that antioxidants can minimize lipid oxidation via several mechanisms
including binding oxygen, chelating metal ions, binding free radicals or stabilizing
hydroperoxides. The antioxidants used in this study were water hyacinth, turmeric and seaweed
which contain polyphenols, as well as a synthetic BHA with phenolic rings. These phenolic
groups are known to bind free radicals especially through their aromatic ring structure which
stabilizes the lipid free radicals by resonance (Halliwell, 1994). In addition, metal chelation is
possible by hydroxyl groups in the phenolic compounds.
5.5 Conclusions
Because synthetic antioxidants are now considered unsafe, it is advantageous to replace them
with natural foods like water hyacinth, turmeric and seaweed plant phenolics.
These natural antioxidants minimized lipid oxidation in solar dried fish during storage and
thereby reduced protein oxidation and cross-linking, leading to lower G’ values and reduced
toughening compared to dried fish without antioxidants.

129
CHAPTER 6

130
CHAPTER 6
6.0 Carbon footprint for solar dried fish
6.1. Introduction
In fisheries worldwide, there is technological advancement from catch to processing to obtain
good quality fish (Parker and Tydmers, 2015, Gosh et al 2014). The whole value chain starts
from the construction of vessels through to maintenance, provision and loss of fishing gear,
how combustion fuel is used during fishing, transportation of catch to various markets, as well
as further processing like drying and waste discharge at sea. All these processes have an impact
on the environment and one of the ways of quantifying this is through Life Cycle Assessment
(LCA) or “Eco balance” (Gosh et al, 2014; Okoko et al 2017). Whereas focus in the fisheries
has been on the stocks and utilization, it is important to note that the extraction and processing
of the resource has impacts on the environment which has not received much attention in the
past.
In LCA, the environment impact is studied from “cradle to the grave”. This simply means from
the resource extraction, up to the disposal of the product and to production of the waste. A
simpler form of estimation of LCA is through the carbon footprint. The advantage of the carbon
footprint is that it produces a single numerical index of environmental performance that can be
readily understood; it contributes to the ecological footprint and is defined as “the total amount
of carbon dioxide and other greenhouse gases emitted over the full life cycle of a product”. The
unit of measurement of the carbon footprint is “equivalent tonnes of CO2”.
Although fisheries is not a major contributor of the carbon footprint, (Shubhadeep et al 2014),
it is estimated that on average the ratio of CO2 emissions for marine fisheries is about 3
teragrams (1012 ) million tonnes of fuel combustion. Carbon footprints are related to climate
change and its impacts (Okoko et al 2017) and it is therefore important to identify the carbon
footprint of different unit processes.
In the marine fisheries, the carbon footprint is traced through three phases:

131
i) The first phase is the pre-harvest phase which consists of construction of vessels all through
to maintenance of the vessels and provision of fishing gear.
ii) The second phase is the harvest phase whose components are traditional, mechanized and
motorized craft.
iii) The third phase is the post-harvest phase which includes fish transportation and processing.
The selected functional unit used is 1 kg of fish to the consumer. Studies have shown that it is
the harvest phase that consumes the highest amount of energy and with the highest emission of
CO2 (Gosh et al 2014). In the near future, carbon footprint of aquatic products mainly fish, will
be integrated in assessments just like in eco-labelling. This is because the process of “catch” to
“product” is growing in fuel consumption and equipment needs. The distances now covered by
fleet to catch fish, the production of fish through aquaculture where feeds contribute to high
consumption of fuel will lead to the need for monitoring of the carbon footprint in the fishery
industry. This is also applicable to the labelling of the products (Madin & Macreadie, 2015).
Refrigeration and fishing distance also consume substantial energy and therefore the carbon
footprint is bound to be high. In Kenya, long distance fishing vessels are common in Kenyan
territorial waters. Farmed Tilapia and mackerel are now imported in Kenya frozen from China.
All these require high energy expenditure not comprehensively recorded in Kenya. These is a
lack of incorporating these high carbon footprints into the assessment of their sustainability by
eco-labels, sustainability certification or seafood consumer sustainability guides ((Madin &
Macreadie, 2015).
Dried fish is a common cuisine in Kenya and the sun is the main source of energy for the drying
process (Oduor-Odote, 2010). In the dried fish chain however the pre-harvest energetics and
carbon footprint (vessel construction, maintenance and gears), harvesting (mechanized and
motorized) and the post-harvest stages especially transportation and marketing to waste
management are the sources of carbon footprint. Cooling and refrigeration are the main
consumers of fuel and emissions are reduced to a minimum, making drying a process that has
a lower carbon footprint (Gosh et al 2014). Whereas the standard LCA involves reporting on
goal and scope, life cycle inventory, life cycle assessment and interpretation of results, this
study focused only on Greenhouse Gas Emissions (GHG)/Global Warming Potential (GWP).
This study gives an opportunity to understand and estimate the contribution of solar dried fish
to climate change by determining the carbon footprint. Data from fuel consumption and
subsequent CO2 emission may help to understand the reasons for rising fishing costs and prices.

132
This information may be used in future to help formulate policy on regulation of fishing efforts,
fuel subsidies, and addressing climate change mitigation. The data around the functional unit
of 1 kg solar dried Siganid encompasses all the major industrial activities required to catch,
process, and deliver the solar dried product to the consumer. The estimation of Carbon and
Carbon emission from fuel (diesel) is calculated by converting the diesel consumed using the
standard conversion factor that 1 litre of fuel (diesel) produces 10.7 kWh of heat, and the C
emitted from 1 KWh of heat is 0.68 kg and for CO2 is 0.25 kg.
6.2 Materials and Methods
The first step was to define the goal and scope according to (ISO 14041 2006), the life cycle
inventory, the life cycle assessment and the interpretation of results. The goal of the study was
to produce solar dried fillets of Siganids and determine the carbon footprint. The study was
carried out to determine the environmental impact of solar dried Siganid fillet from harvesting
to final product using the hybrid windmill-solar tunnel dryer. The information is useful to
stakeholders who will be able to label and show indicative CO2 equivalent on their products.
The functional unit was the CO2 equivalent from dried Siganid unit/kg and quantity, quality
and period formed the basis. The results were expressed in terms of 1 Kg of dried product
(filleted unit). The method calculated the CO2 emissions of all processes until the dried product
was obtained from ‘cradle to gate’-meaning from harvest at sea to final processed product like
the solar dried fillet Other sources of carbon such as markets, transportation, were not
considered. The boundaries of this production system started with fishing or raw material
extraction (cradle) and ended at the production of 1kg of dried product (gate) of filleted solar
dried fish. The ISO -14040-14042 standards were used for environmental impact studies as
reference with MS Excel software. The sources of data were from existing databases, any
reports and previous studies on raw materials. The system studied here only included fish
production at the processor level and related processes like fishing and basic equipment
manufacturing.
The Siganids were purchased from Kipini landing upon landing using motorized and non-
motorized canoes. They were gutted, filleted and kept in ice. The fish were then transferred to
the drying trays of the hybrid windmill solar tunnel dryer (Chapter 2).

133
Data was collected within the system boundaries (Figure 6.1) and relevant environmental inputs
and outputs then analysed later.
Figure 6.1: System boundary for solar dried Siganids (RM is Raw Material).
CO2 foot printing uses database values for CO2 emissions of combustion and utilisation of fossil
fuels. The data base values are presented in Annexes 1 to 9 and Tables 6.1 and 6.2. The values
were derived from peer reviewed data and are primarily for fossil fuel combustion and energy
generation outputs. A generic tool for carbon footprint was developed to include easy access
data primarily targeting low technological end process chains and enabling some newer
technologies for dried fish products. Provisions are made for data that can be entered in the
current study or in the industry in future for studies with a wider scope.
Any data that was not available and not expected to contribute to carbon footprint to a large
extent was left out because many inputs and outputs do not have GHG-emissions. This was not
a full LCA which would require additional data inputs. Economic allocation was used in this
tool since this makes an adequate distinction in sea food derived products, and sea food waste
derived products. The designed tool consisted of four separate steps/ data entry steps to
complete the full product life cycle: These are
1) Raw material sections for data on actual harvesting
2) Landing or sorting on board
3) Transport of raw material to the processing facility
4) Processing; energy input of filleting; processing and losses in processing

134
The data was collected during harvesting of fish (cradle), landing and sorting on board, transport
of raw material to the processing facility and processing which includes energy use during
filleting and losses during processing (gate). The data for energy consumption and fishing data
was obtained through interviews with fishermen and recorded in pre-prepared and designed
data sheets (Annexes 1-6). The specific forms which were used under field conditions are
presented in Annexes 7- 9. The tool was based on MS Excel calculations.
The targeted moisture content for solar dried fish was 10-20% (Chapter 3). The full capacity of
the hybrid windmill solar tunnel dryer was 150 kg and considering that fish is about 70%
moisture, 60% decrease in moisture content was required to get the final 10-20 % moisture.
This required 30 to 40 sun hours on a sunny day for fish 1 inch or less thick, weighing between
300 to 500 g,
To achieve the targeted moisture content, 120 kg water had to be evaporated. The area of the
collector surface of the dryer and area which was exposed to the sun was 9m x 2.5m = 22.5 m².
The energy collection per day was therefore 22.5 x 5.3 kWh/m² = 2 107 J/m² day (assuming
100% efficiency). This gives a maximum daily drying capacity of 120 kWh or 430 MJ. This is
equal to the evaporation of about 170 - 200 kg water daily. With an efficiency of about 65% it
is possible to dry the fish in one day.
The drying temperatures in the drying cabinet varied between 40 ºC to 55 ºC sometimes
reaching 60 ºC. On a good sunny day, when all the fans were working, the humidity ranged
between 22-50% Some leakages, cloud cover etc. made drying time extend to 3 days to achieve
the moisture content of 10-20%. All the data which were needed for carbon footprint could not
be addressed from the data sourced. Where available, data from the site was collected and
reported in annexes 1- 9 which are quite elaborate and whose use is for more data collection in
future. The reference data for CO2 emissions and combustions of fossil fuels was obtained from
summaries of peer reviewed journals, reports and other publications (SKAO 2014). Data
collection for carbon footprint analysis took the form of live interviews with the fishermen
involved in going to sea. A structured form was used to collect the data as per Annexes 1 to 9.
The data around the functional unit of 1 kg solar dried Siganid encompassed all the major
industrial activities required to catch, process, and deliver the solar dried product to the
consumer. The estimation of Carbon and Carbon emission from fuel (diesel) was calculated by
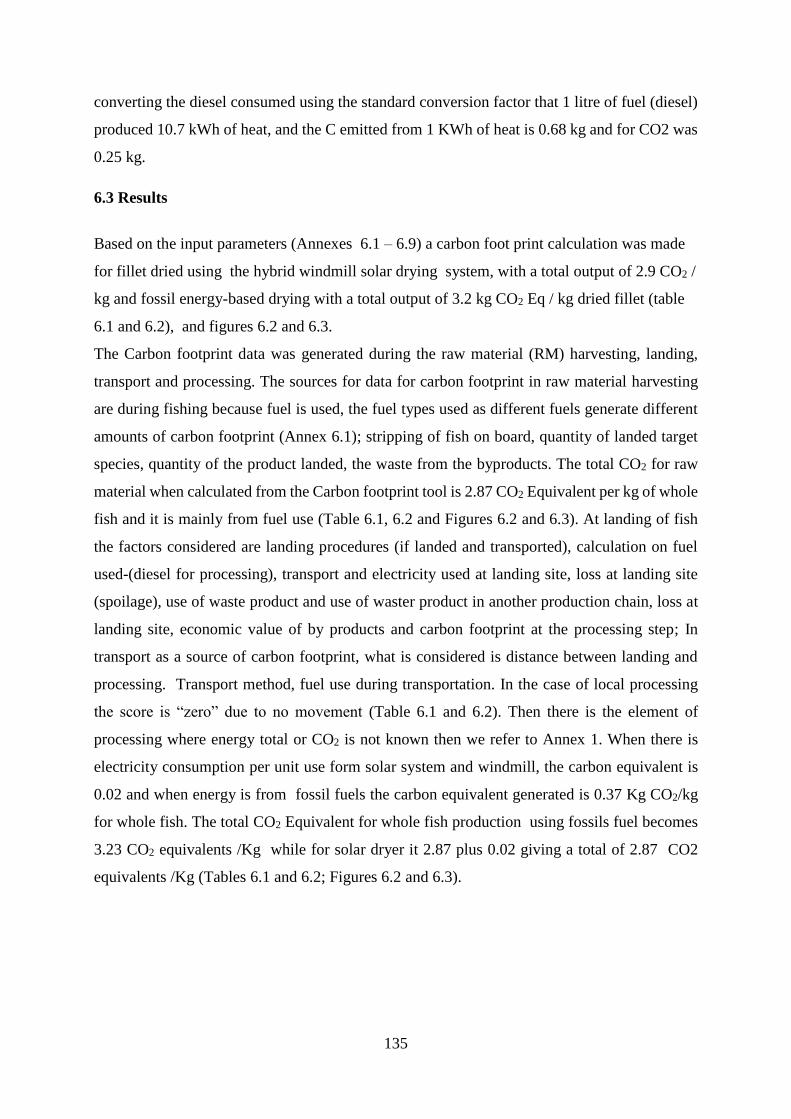
135
converting the diesel consumed using the standard conversion factor that 1 litre of fuel (diesel)
produced 10.7 kWh of heat, and the C emitted from 1 KWh of heat is 0.68 kg and for CO2 was
0.25 kg.
6.3 Results
Based on the input parameters (Annexes 6.1 – 6.9) a carbon foot print calculation was made
for fillet dried using the hybrid windmill solar drying system, with a total output of 2.9 CO2 /
kg and fossil energy-based drying with a total output of 3.2 kg CO2 Eq / kg dried fillet (table
6.1 and 6.2), and figures 6.2 and 6.3.
The Carbon footprint data was generated during the raw material (RM) harvesting, landing,
transport and processing. The sources for data for carbon footprint in raw material harvesting
are during fishing because fuel is used, the fuel types used as different fuels generate different
amounts of carbon footprint (Annex 6.1); stripping of fish on board, quantity of landed target
species, quantity of the product landed, the waste from the byproducts. The total CO2 for raw
material when calculated from the Carbon footprint tool is 2.87 CO2 Equivalent per kg of whole
fish and it is mainly from fuel use (Table 6.1, 6.2 and Figures 6.2 and 6.3). At landing of fish
the factors considered are landing procedures (if landed and transported), calculation on fuel
used-(diesel for processing), transport and electricity used at landing site, loss at landing site
(spoilage), use of waste product and use of waster product in another production chain, loss at
landing site, economic value of by products and carbon footprint at the processing step; In
transport as a source of carbon footprint, what is considered is distance between landing and
processing. Transport method, fuel use during transportation. In the case of local processing
the score is “zero” due to no movement (Table 6.1 and 6.2). Then there is the element of
processing where energy total or CO2 is not known then we refer to Annex 1. When there is
electricity consumption per unit use form solar system and windmill, the carbon equivalent is
0.02 and when energy is from fossil fuels the carbon equivalent generated is 0.37 Kg CO2/kg
for whole fish. The total CO2 Equivalent for whole fish production using fossils fuel becomes
3.23 CO2 equivalents /Kg while for solar dryer it 2.87 plus 0.02 giving a total of 2.87 CO2
equivalents /Kg (Tables 6.1 and 6.2; Figures 6.2 and 6.3).

136
Table 6.1: Carbon footprint contribution in different steps of the production chain. Represented are the solar assisted dried
fish process, and the drying process using fuel-based energy inputs.
Production step Production unit CO2 Eq/kg
fillet dried
Solar
Assisted
CO2 Eq/kg
fillet dried
Fossil fuel
based
Raw material Total CO2 footprint raw
material fisheries 2.87 2.87
Landing total Total CO2 footprint at
landing 0.00 0.00
Total Transport Landing to processing Total transport to
processing 0.000 0.000
Total Processing Total processing 0.02 0.37
Total product Total product 2.89 3.23
Table 6.2: Carbon footprint contribution in different steps of the production chain. Represented are the solar assisted dried
fish process, and the drying process using fuel-based energy inputs.
CO2 Eq/kg fillet dried
Fossil fuel based
CO2 Eq/kg fillet dried
Solar Assisted
Raw material Fuel use fishing 2.87 2.87
Landing Calculated based on total fuel /
landed product 0.00 0.00
Landing Calculated based on total energy
/ landed product 0.00 0.00
Landing Spoilage 0.00 0.00
Transport Additional fuel consumption do
to cooling, freezing 0.00 0.00
Transport Additional fuel consumption do
to cooling, freezing 0.00 0.00
Processing Use of electricity from solar
energy 0.00 0.02
Processing Use of electricity from wind
energy 0.00 0.00
Processing Use of electricity from fossil
sources 0.37 0.00
Processing Use of fuel per unit 0.00 0.00
Processing Use of coolant per unit 0.00 0.00
Total 3.23 2.89
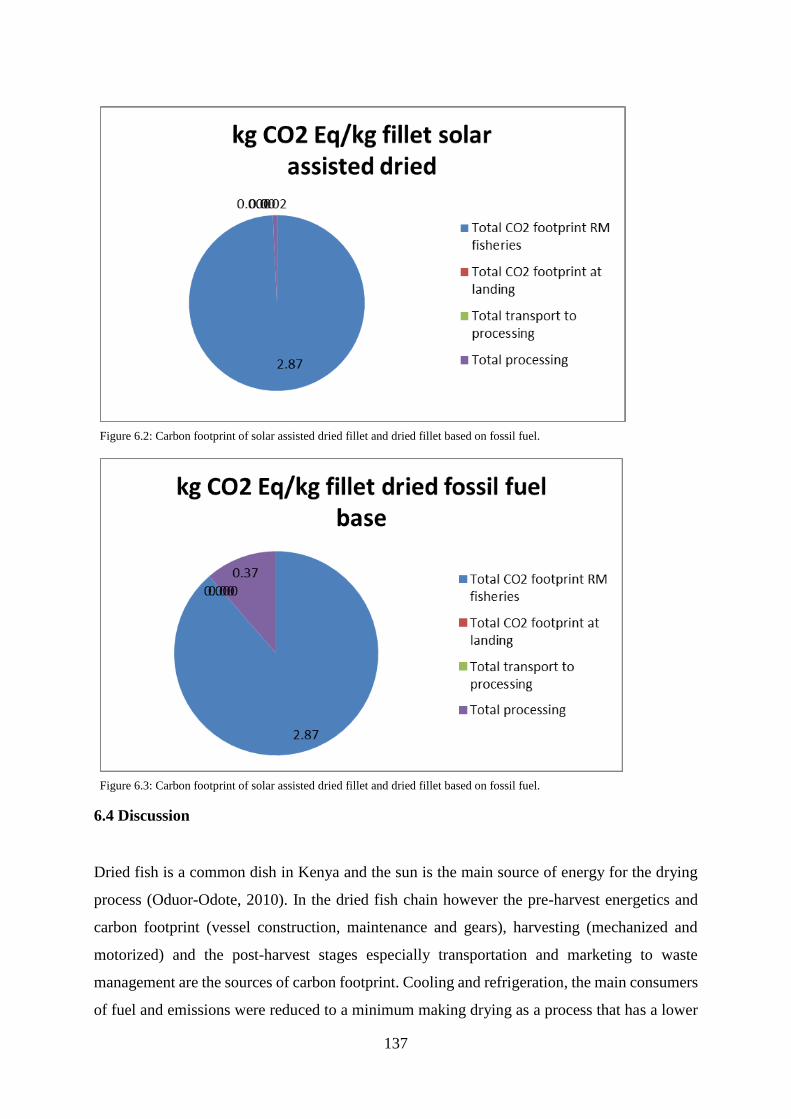
137
6.4 Discussion
Dried fish is a common dish in Kenya and the sun is the main source of energy for the drying
process (Oduor-Odote, 2010). In the dried fish chain however the pre-harvest energetics and
carbon footprint (vessel construction, maintenance and gears), harvesting (mechanized and
motorized) and the post-harvest stages especially transportation and marketing to waste
management are the sources of carbon footprint. Cooling and refrigeration, the main consumers
of fuel and emissions were reduced to a minimum making drying as a process that has a lower
Figure 6.2: Carbon footprint of solar assisted dried fillet and dried fillet based on fossil fuel.
Figure 6.3: Carbon footprint of solar assisted dried fillet and dried fillet based on fossil fuel.
138
carbon footprint (Gosh et al 2014). Whereas the standard LCA involves reporting on goal and
scope, life cycle inventory, life cycle assessment and interpretation of results, this study focused
only on Greenhouse Gas Emissions (GHG)/Global Warming Potential (GWP). This study gave
an opportunity to understand and estimate the contribution of solar dried fish to climate change
by assessing the carbon footprint. Data from fuel consumption and subsequent CO2 emission
could help gain insight into increasing fishing costs and prices. This may be used in future to
help formulate policy on regulation of fishing efforts, fuel subsidies, and giving proposals on
suitable climate change mitigation measures.
6.5 Conclusions
The carbon dioxide emissions were low in this study due to low energy use (direct solar energy).
The main emissions were caused by fisheries activities. However, due to the low fuel use in the
fisheries practice (use of dhows) the total energy use is very low. The chosen processing chains
were low in carbon emissions in comparison to other production cycles. The main reason for
low carbon emissions was due to the primary production of the species as they do not have a
high energy input for fishing, due to the artisanal conditions.
Due to the substantial influence of the primary production of the species, it is advisable to
perform additional environmental impacts in different case studies. These dried fish case studies
are relatively low in energy consumption. Considering that dried fish is also a preferred cuisine
in many countries, paying more focus to it and emphasising on eco-friendly processing methods
like the hybrid windmill solar tunnel will help reduce carbon footprint and improve food and
energy security.

139
CHAPTER 7

140
CHAPTER 7
7.0 Quality safety tool -Generic HACCP for solar dried fish
7.1 Introduction
The success in the fishery processing and marketing industry relies on the safety of the product.
The entire process of safety includes risk assessment and management as opposed to inspection
of the product once it is about to reach the market or when it is already in the market. Inspection
of products (Huss et al 2004) though useful in the earlier years for food safety are costly and
retrospective and results may take several days to come out after the product has been sold. It
means therefore that there are lower chances of detecting a food safety hazard.
Methods that control the hazard before they happen are therefore more important. Hazard
Analysis Critical Control Point (HACCP) is one such method. HACCP has been developed for
various fresh fish products. Before HACCP, Food Safety Assurance and Quality Control
systems were the methods used. Food safety assurance involved removal, prevention or
minimization of a hazard to acceptable levels whereas quality control systems were used after
the product was manufactured or produced when a safety analysis for defects was carried out
(Sperber 2005). However, the above methods could not detect hazards that do not occur often.
The HACCP system had advantages because it was a more preventive system (Quinn &
Marriot, 2002). It is now agreed internationally that the HACCP approach should be the one to
use for food safety (Codex Committee on Food Hygiene, 1993; Codex Committee on food
hygiene 2009; NACMCF 1997; EU Regulations 852/2004 2004; USDA (1996); Synder 1991;
National Seafood Alliance 2011). There are 7 principles (steps) or tasks that guide food safety
approach. They are listed as follows:
1. Conduct a Hazard Analysis & Risk Assessment (RA)
2. Identify Critical Control Points
3. Establish Target Levels (TLs) and Critical limits (CLs) for each CCP
4. Establish monitoring methods at each CCP
5. Identify Corrective Actions
6. Identify verification procedures
7. Organise a record keeping system

141
Steps that should be taken prior to HACCP include Good Manufacturing Practices and
Sanitation Control Procedures.
In the fishery industry, HACCP has been developed for fresh fish products. Attempts have been
made to develop generic HACCPs in the smoked fish industry. In the solar dried this is the first
attempt to develop an HACCP system. Solar dryers so far fabricated in Kenya by KMFRI in
collaboration with JKUAT have produced dried fish of superior quality compared with those
available in the Kenyan markets. However, no quality handling standards are in place for dried
fish in Kenya. As quality assurance of the final dried product is important for the market, an
HACCP plan was designed for processing of solar dried fish in Kenya
7.2 Materials and Methods
The objective of the HACCP was defined, and the application and standard definitions were
outlined. The people responsible for implementation of the HACCP and their roles were
recorded, the possible hazards were defined, and the nature of the products described as well
as the product usage. The HACCP plan was then put in place.
7.2.1 Defining the objectives
As the hazard analysis and monitoring scheme was carried out for solar dried fish, the possible
microbiological, physical and chemical food safety hazards, CCP’s and CP’s per process step
were determined.
7.2.2.1 Application
All process steps from purchasing to sales (from reception to transport to the consumer)
including production, quality and engineering support were described.
7.2.2.2 Definitions (taken from the literature and references cited)
Hazard: ‘’A biological, chemical or physical contamination or conditions leading thereto, that
makes a food product unsafe for consumption’’ (from CAC, 2009).
Risk: ‘’A risk is a function of the probability of an adverse health effect and the severity of that
effect, consequential to a hazard in food(s) ‘’ (from Sumner et al., 2004).

142
Hazard analysis: The process of listing and assessing hazards and which conditions cause
them, identifying hazards that influence food safety, and therefore need to be incorporated in
the HACCP plan.
CCP: Critical control point. Important points, step or procedures which require specific control
measure to lower potential public health hazards to a very low level.
Control measures: Each action or activity used to remove hazards or limit them to an
acceptable minimal level.
GCM/GM: General (Control) Measures to control a specific part of the plan.
CP: Control point.
7.2.2.3 Responsibility
The quality manager of hygiene is responsible for the approving each procedure and enact the
following: Re-assess any changes in product or production process in consultation with others
in the HACCP or production team and review the flow diagram and hazards.
• Be the contact point for liaising with food safety regulatory bodies.
7.2.2.4 Possible Hazards
All the delivered raw material and dispatched final product had to be at or below regulatory
safe limits. Hazards can be divided into three areas:
Physical hazards
Physical hazards include fishhooks, wood splinters, metals, stones, glass etc. which are small
enough to be visible but hard/sharp enough to hurt consumers.
In the processing facility we take measures to reduce the chances of contamination to as low
as possible by receiving the raw material from certified suppliers/ trusted suppliers. Other
mitigations measures are discussed later
Microbiological hazards
Microbiological hazards comprise living and dead organisms which are hazardous and are
either intrinsic or extrinsic of the product. To ensure that the control of the microbial safety
level, bacteriological, yeast and mould tests are carried out on:

143
Mycotoxins:
Poisons produced by fungi which may be because of toxin production by mould in inadequately
dried fish stored at a relatively high-water activity. Of great concern are aflatoxin, ochratoxin
and deoxynivalenol.
Chemical Hazard
These are chemical components which are hazardous for the consumer. Included are substances
which are formed (from the product) by poor treatment of the product and non-product
substance such as cleaning products, migration of packaging etc. Poisons can also include the
presence of higher concentrations of PCBs, dioxin and heavy metals in fish products.
Allergens:
These are components which can lead to allergic reactions and all the consequences thereof.
These could be reactions from consumption of fish and products from fish, soya and products
based on soya and celery and products based on celery.
7.2.2.5 Products
Product description
Split/filleted Siganids locally known as “Tafi’’ were solar dried. The fish was processed from
fresh fish through solar drying to a reduced water activity while maintaining organoleptic
quality and longer shelf life of 6 months in a cool dry place.
The solar dried Siganid fillet was processed and packaged by the Kipini Tuna fisherfolk of
Kipini BMU. The Siganid fish was caught in the Western Indian Ocean region (WIO region)
Product usage
The hybrid windmill solar tunnel dryer produced dried fish product for consumption. The
dried fish product should be soaked and boiled prior to use. The directions for use are on every
packaged product.
7.2.2.6 HACCP team
The HACCP team is assembled. There are regular meetings to discuss defects, new products,
process changes, hazards, improvements, facility audits, internal complaints are handled.
Meetings considering validation, risks, monitoring and verification with regulatory agencies
are recommended to be done.

144
Table 7.1: The HACCP team composition
Participants Contribution
QA/QC in charge Monthly summary report, defects per line at any
processing batch.
Verification and evaluation once per year
Production in charge Line report (production report, defects)
Overall manager Chairman, strong support for QA/QC in HACCP
7.2.2.7 Verification
The following points are considered in the yearly quality report:
a. All procedures be kept safely by the guardian (QA)
b. Completeness of forms checked yearly
c. Analysis of recalls and internal and external complaints
d. Reviewing specific and general control measures, defects and corrective measures
for confirmation and effective monitoring of critical control measures
e. Consistency of the existing documentation

145
Receiving of raw
material (Siganid) )&
Lethrinids): CP1
Washing in basins/tubs (batch process) in
water at room temperature (25 ºC) for few
minutes
Gutting, Filleting & or scouring is done
manually, for few minutes
7.2.2.8 Flow chart for solar dried fish
The flow chart for the solar dried Siganid fish i shown in Figure 7.1
Washing in immersion basins/tubs with water
overflow
Soaking in brine (0.01ppm) and or in marinate
(as desired) for 1 hour: CP2
Drip for 30 minutes on inclined trays
Arranging the trays individually in the solar
drier chambers and allow drying for 3 days:
CCP1
Allow to cool to ambient temperature for 30
minutes:
Labeling & Packing in cardboard boxes: CP3
Storing of finished product
Waste water
Waste water
Waste
Water
Gutting, filleting
& scouring
Packaging &
labeling
Water
Water
Salt & marinate
s
Figure 7.1: Schematic flow sheet for solar dried Siganids

146
7.4 Discussion
There has been a lot of emphasis on safety of fresh fish. Kenya took the matter seriously and
started adopting HACCP when in 1997 the EU banned fish exports from Kenya (Abila, 2003).
There have been no efforts however to introduce or adapt HACCP for the dried fish chain in
Kenya. This is because dried fish is made from left over fish that has started to spoil and it is a
belief that dried fish has “no moisture” hence safe because it dry and therefore should not
deteriorate.
Dried fish on the contrary has been shown here to undergo deterioration through lipid
oxidation and measures like vacuum packaging and using fresh product for drying improves
quality. According to FAO (2004) and in this study, critical control points is when the drying
process is delayed which can create room for bacterial growth and in handling equipment which
may reintroduce pathogens the quality of the initial product notwithstanding. In general, dried
fish products are considered shelf stable. Consequently, they are often stored and distributed
unrefrigerated.
The characteristic of a dried fish product, which makes it shelf stable, is their low water activity
(aw). Water activity measures of ‘free water’ in a food that is available for the growth of
microorganisms, including pathogens. Below water activity of 0.85 the growth and toxin
production of all pathogens like Staphylococcus aureus and Clostridium botulinum is prevented
and this is important for a shelf-stable dried product (FDA, 2001, Abbas et al, 2009). At higher
water activities the product should be stored refrigerated. The flow chart for solar drying of
rabbit fish is presented in Figure 7.1 and an overview of the HACCP plan is given in Table 7.1.
In practice, HACCP systems can be adapted, as necessary. The timescale for adaptation differs
from procedures such as monitoring of CCPs and equipment used for this. An example of
timescales and frequencies to perform procedures is presented in Table 7.2.
Another issue that is of interest is the international trade of fish products. Standardization of
the HACCP concept may be required soon in Kenya. Therefore, aspects like management
responsibility and compatibility between HACCP and other Quality Systems commonly used
must be considered.
For harmonization of HACCP systems, a new International Standard, ISO 22000, is available
which was published on 1 September 2005, as an Internal Standard for food safety management

147
to ensure safe food supply chains worldwide (Frost, 2005). A generic Risk analysis handbook
for solar dried Siganids is proposed in (Tables 7.3 to 7.10) and is being used together with
HACCP to help eliminate hazards thereby reducing critical control points. Risk analysis
focuses on Pre-requisite Programmes (PRPs) eliminating unnecessary risks prior to and during
processing. The scores to possible hazards are indicated in the Hazards handbook.
This was a scientific way of assigning scores to probable hazards in the drying chain. Overall,
it is used to identify whether the step in the chain is a CCP or a CP or just a PRP (Prerequisite
Program). Normally non CCP are management issues that do not need very close monitoring;
however, they can become CP or CCP with neglect.
(The letters P, C M in Tables 7.3 to 7.10 stand for the nature of the different hazards. P stands
for physical, C chemical and M is Microbiological). P x E = R in the table are P: Probability of
risk, E is Exposure and R is the risk as a result of P and E (Jacxsens et al, (2009). If R is low
the Risk is low.
7.5 Conclusions
Starting quality of fish before drying helps ensure safety and quality of the products. Risk
analysis and establishment of HACCP in the dry fish will boost the consumer confidence in
the dry fish chain and create a wider market. Assurance of adequate drying to low moisture
activity and subsequent hygienic and sanitized handling reduces risk in the dry fish chain. Even
though the final product is cooked, maintenance of proper handling and hygiene is crucial for
business, income stability for wider product circulation.

148
Table 7.2: Overview HACCP plan Solar Dried Siganid fillet (Tafi or Rabbit fish) STEP IN THE
PROCESS HAZARD SOURCE PREVENTIVE
MEASURES CCPS CRITERIA MONITORING CORRECTIVE
ACTIONS VERIFICATION RECORDS
m M What How Frequency Who
RECEIVING OR BUYING
FISH
1
Biological: Spoilage, Pathogens
Improper storage prior to sale
Purchase from qualified or certified supplier
Presence of document/ certificate
Here, m=M Here, m=M Assess whether or not document/ certificate is present
Establish whether or not document/ certificate is available upon receipt of fish
Document or certificate for each purchased lot
Quality manager
Select another supplier
Document from supplier with data from laboratory analysis
Monitoring records
Chemical: Heavy metals, POPs
Environment
Document/ certificate is available
Document/ certificate is available
Document/ certificate of supplier
Physical: Foreign objects
Adulteration on board or at supplier
Procedures
Work instructions
STORAGE OF BOUGHT
FISH
2
Biological: Spoilage, Pathogens
Improper storage
Instruction on proper use of flake ice
Control of time and T during storage
1 day 2 days Presence of sufficient flake ice
Visual inspection
At beginning and en of a shift
Quality manager
Add flake ice Assess that employees know and understand work instructions
Monitoring records
No pest control
Pest control Sufficient flake ice present
T of the room 1oC
T of the room 2oC
Measure T of storage room & storage time fish
Thermometer Measure T twice a day
Train employees
Procedures
Chemical: Heavy metals, POPs
N/A
Work instructions
Physical: Foreign objects
Filth, foreign bodies present
Cleaning of storage facilities
Prerequisite program
GUTTING AND
FILLETING
3
Biological: Spoilage, Pathogens
Water used, premises and tools used for gutting and filleting
Water of safe and sanitary quality
Control of time and T during gutting and filleting
25 min for filleting
30 min for filleting
Inspect that employees follow work instructions
A laminated work instruction is available
Establish at the start of each shift that instructions are available
Quality manager
Train employees
Assess that employees know and understand work instructions
Monitoring records
Each fillet immediately in bag and stored in ice
Each fillet immediately in bag and stored in ice
Measure T of fish at start of processing
Procedures
Chemical: Heavy metals, POPs
Work instructions
Physical: Foreign objects
Filth, foreign bodies present
Cleaning of storage facilities
Prerequisite program
STEP IN THE PROCESS
HAZARD SOURCE PREVENTIVE MEASURES
CCPS CRITERIA MONITORING CORRECTIVE ACTIONS
VERIFICATION RECORDS STEP IN THE
PROCESS
HAZARD SOURCE PREVENTIVE MEASURES
4

149
SOAKING OF FILETS IN BRINE OR MARINATE
Biological: Spoilage, Pathogens
Water Proper work instructions
Time and amount of salt or marinate used
Here, m=M Here, m=M Inspect that employees follow work instructions
A laminated work instruction is available
Establish at the start of each shift that instructions are available
Quality manager
Train employees
Measure salt content
Monitoring records
Chemical: Heavy metals, POPs
*N/A Employees follow instructions
Employees follow instructions
Measure salt content at the start of a shift
Start of a shift Procedures
Physical: Foreign objects
Filth, foreign bodies present
Cleaning of storage facilities
Prerequisite program
Once a week Work
instructions
SOLAR DRYING OF
FISH
5
Biological: Spoilage,Pathogens
Molds Control of drying process by use of working instructions
Employees use work instructions
Here, m=M Here, m=M Inspect that employees follow work instructions
A laminated work instruction is available
Establish at the start of each shift that instructions are available
Quality manager
Train employees
Verify the drying is controlled with respect to temperature, time and air velocity
Monitoring records
Chemical: Heavy metals, POPs
*N/A
Employees follow instructions
Employees follow instructions
Procedures
Physical: Foreign objects
Filth, foreign bodies present
Cleaning of storage facilities
Prerequisite program
Work instructions
STORAGE OF DRIED
FISH
6
Biological: Spoilage,Pathogens
Improper packaging material, no pest control
Purchase from qualified or certified supplier
Presence of document/ certificate
Here, m=M Here, m=M Assess whether or not document/ certificate is present
Establish whether or not document/ certificate is available upon receipt of packaging material
Document or certificate for each purchased lot
Quality manager
Select another supplier
Document from supplier with data from laboratory analysis by supplier
Monitoring records
Chemical: Heavy metals, POPs
*N/A
Certificate is available
Certificate is available
Procedures
Physical: Foreign objects
Filth, foreign bodies present
Cleaning of storage facilities
Prerequisite program
In cool dry place T< 20oC
In cool dry place T< 25oC
Work instructions
* N/A: NOT APPLICABLE

150
Table 7.3: Verification Stages and Their Minimum Frequency in a HACCP Plan (from Sperber, 1998)
Verification Procedures Minimum Frequency
Verification schedule Annually
Prerequisite program verification In the beginning and annually thereafter
Validation of critical limits and HACCP system Before and during HACCP system
implementation
Revalidation of HACCP plan Annually or upon significant change
Observation and interview of CCP monitor Quarterly/monitor/CCP
CCP monitoring record review Daily
Equipment calibration According to HACCP plan
Other records review Monthly
HACCP system verification Annually

151
Table 7.4: HACCP-Hand book- Receiving of raw material
HACCP-HANDBOOK Page: 1
NAME Company RISK ANALYSIS TABLE HACCP – Step 7 & 8 Date: 06/2018
Product: Solar dried fish Flow chart: TUNA FISHER-FOLK
PROCESS STEP: Receiving of raw material
Concerning Potential danger Type Preventive measure P x E = R CCP CP PRP
1. Insufficient microbiological quality: total count
too high; presence of pathogens
2. Presence of heavy metals
3. Presence of foreign objects
4. Chemical hazards (POPs)
M
C
P
C
• Purchase from pre-qualified suppliers and
incoming raw material quality control
• Purchase from pre-qualified suppliers and
incoming raw material quality control
• Purchase from pre-qualified suppliers and
incoming raw material quality control
• Purchase from pre-qualified suppliers and
incoming raw material quality control
2 3 4
2 2 3
1 3 3
2 2 3
-
-
-
-
1
-
-
-
-
9
9
9
Concerning Remarks/Motivation
Hazard 1
Hazard 2
Hazard 3
Hazard 4
Drying is a step further in the process that will eliminate vegetative micro-organisms, weekly some samples are analysed on the microbial quality on
Salmonella spp., and Listeria monocytogenes
Controlling heavy metals in the company itself is almost impossible and gives little additional information. The suppliers are expected to comply with set limits
of heavy metals and therefore controlled by PRP.
Slitting, scouring and filleting are steps further in the process that can help in elimination of foreign objects like fishing hook through visual inspection.
Fish will be purchased from suppliers who demonstrate fishing in permitted grounds.

152
Table 7.5: HACCP-Hand book- Washing in basins and tubs
HACCP-HANDBOOK Page: 2
NAME Company RISK ANALYSIS TABLE HACCP – Step 7 & 8 Date: 06/2018
Product: Solar dried fish Flow chart: TUNA FISHEFOLK KIPINI
PROCESS STEP: Washing in basins/tubs
Concerning Potential danger Type Preventive measure P x E = R CCP CP PRP
1. Microbial and chemical contamination
through insufficient water quality
2. Additional contamination through
insufficiently cleaned and disinfected
tanks
3. Chemical contamination through
residuals of cleaning and disinfecting
agents
M/C
M
C
• Portable water is used. Regular water
quality checks
• Proper cleaning and disinfection procedures
• Approved food grade disinfectants used.
2 2 3
1 2 2
1 2 2
-
-
-
-
-
-
3
1
1
Concerning Remarks/Motivation
A drying process is included in the process. This process can destroy vegetative and other pathogens due to reduced water activity, but more
resistant microbes will survive resulting in an insufficient microbial quality.

153
Table 7.6: HACCP-Hand book- Gutting, scouring and filleting
HACCP-HANDBOOK Page: 3
NAME Company RISK ANALYSIS TABLE HACCP – Step 7 & 8 Date: 06/2018
Product: Solar dried fish Flow chart: TUNA FISHERFOLK
PROCESS STEP: Gutting, Scouring & or Filleting
Concerning Potential danger Type Preventive measure P x E = R CCP CP PRP
Microbiological quality: total count too high;
multiplication of pathogens
M Gutting, scouring and/or filleting to be done within 30
minutes per batch
1 2 2 - - 14
Concerning Remarks/Motivation
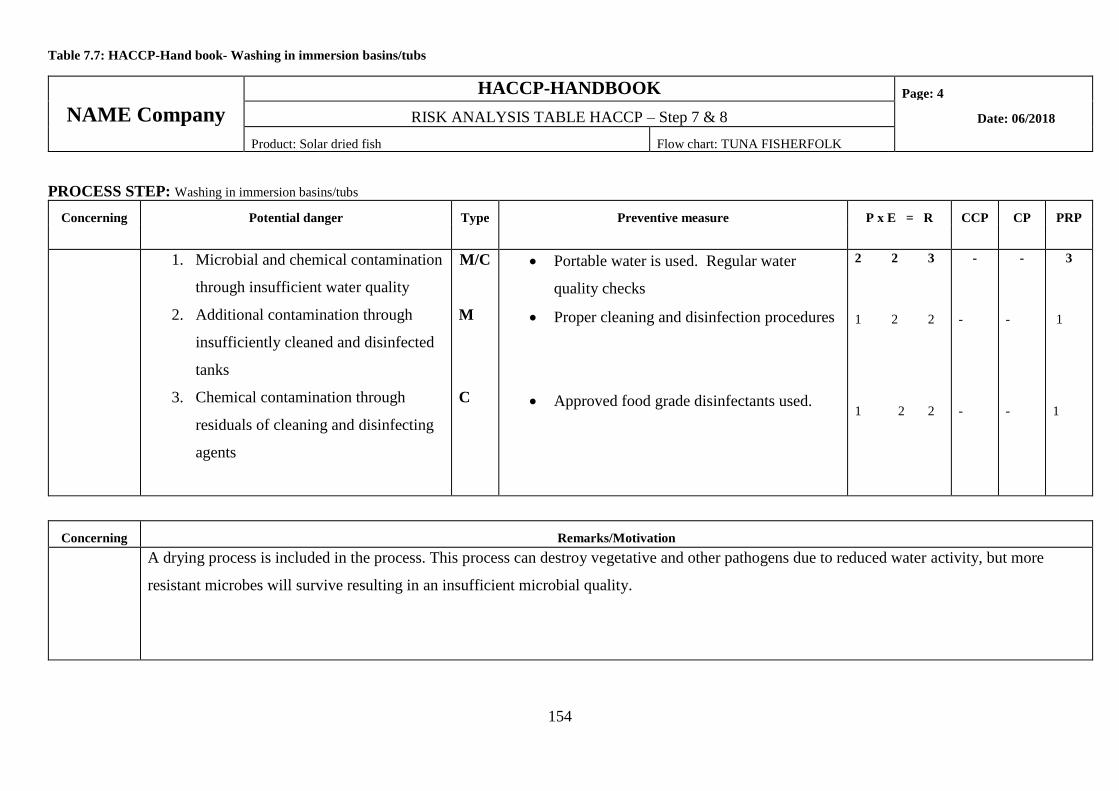
154
Table 7.7: HACCP-Hand book- Washing in immersion basins/tubs
HACCP-HANDBOOK Page: 4
NAME Company RISK ANALYSIS TABLE HACCP – Step 7 & 8 Date: 06/2018
Product: Solar dried fish Flow chart: TUNA FISHERFOLK
PROCESS STEP: Washing in immersion basins/tubs
Concerning Potential danger Type Preventive measure P x E = R CCP CP PRP
1. Microbial and chemical contamination
through insufficient water quality
2. Additional contamination through
insufficiently cleaned and disinfected
tanks
3. Chemical contamination through
residuals of cleaning and disinfecting
agents
M/C
M
C
• Portable water is used. Regular water
quality checks
• Proper cleaning and disinfection procedures
• Approved food grade disinfectants used.
2 2 3
1 2 2
1 2 2
-
-
-
-
-
-
3
1
1
Concerning Remarks/Motivation
A drying process is included in the process. This process can destroy vegetative and other pathogens due to reduced water activity, but more
resistant microbes will survive resulting in an insufficient microbial quality.

155
Table 7.8: HACCP-Hand book- Soaking in brine or marinating
HACCP-HANDBOOK Page: 5
NAME Company RISK ANALYSIS TABLE HACCP – Step 7 & 8 Date: 06/2018
Product: Solar dried fish Flow chart: TUNA FISHERFOLK
PROCESS STEP: Soaking in brine and or marinating
Concerning Potential danger Type Preventive measure P x E = R CCP CP PRP
1. Microbial growth due to insufficient
brining
2. Allergens from marinate especially
soy
M
C
Time and adequate salt used
Right concentrations of the marinates used and clear
packaging information
2 3 4
3 2 4
-
-
2
3
-
-
Concerning Remarks/Motivation
Hazard 1
Hazard 2
Insufficient brining may lead to growth of halophilic microbes
In case of wrong concentration (marinates), subsequent process cannot eliminate the allergens.

156
Table 7.9: HACCP-Hand book- Dripping
HACCP-HANDBOOK Page: 6
NAME Company RISK ANALYSIS TABLE HACCP – Step 7 & 8 Date: 06/2018
Product: Solar dried fish Flow chart: TUNA FISHERFOLK
PROCESS STEP: Dripping
Concerning Potential danger Type Preventive measure P x E = R CCP CP PRP
1. Additional contamination through
insufficiently cleaned and disinfected
racks & cross contamination through
drip
M • Work instruction: Avoid mounting of
dripping racks on top of another
1 2 2 - - 14
Concerning Remarks/Motivation

157
Table 7.10: HACCP-Hand book- Drying
HACCP-HANDBOOK Page: 7
NAME Company RISK ANALYSIS TABLE HACCP – Step 7 & 8 Date: 06/2018
Product: Solar dried fish Flow chart: TUNA FISHERFOLK
PROCESS STEP: Drying
Concerning Potential danger Type Preventive measure P x E = R CCP CP PRP
1. Microbial growth M • Controlled temperature and humidity 3 3 5 1 - -
Concerning Remarks/Motivation
Insufficient drying will give optimal growing conditions for pathogenic microorganisms. This also marks the end of a major processing stage for microbial control as
subsequent stages relies on the product quality and safety at this stage

158
Table 7.11: HACCP-Hand book- Labelling and packaging in cardboard boxes
HACCP-HANDBOOK Page: 8
NAME Company RISK ANALYSIS TABLE HACCP – Step 7 & 8 Date: 06/2018
Product: Solar dried fish Flow chart: TUNA FISHERFOLK
PROCESS STEP: Labelling & Packing in cardboard boxes
Concerning Potential danger Type Preventive measure P x E = R CCP CP PRP
1. If the integrity of the packaging
materials is breached dried fish can
gain moist and thereby result in an
increase in water activity
2. Migration of printing ink from
packages
M
C
• Packaging from pre-qualified suppliers
• Correct handling and packaging procedures
followed.
• Packaging from pre-qualified suppliers and
proof of certificate of analysis
2 2 3
1 2 2
-
-
4
-
-
9
Concerning Remarks/Motivation

CHAPTER 8

160
CHAPTER 8
8.0 DISCUSSION
8.1 Introduction
Food security is an important issue globally and particularly in sub-Saharan Africa due to a
shortage of food, water and energy supplies; these shortages are predicted to increase with
population increase. It is necessary to improve methods of processing and utilize all the by catch
and by-products in fisheries and agriculture. Fisheries is the major livelihood of coastal people in
Kenya. Therefore the objectives of this study were to improve the preservation of fish by sun
drying in a fabricated hybrid windmill solar tunnel dryer, to monitoring the quality during drying
and storage, to reduce lipid oxidation using natural antioxidants and to examine the effect of
antioxidants on the rheological and thermal properties of protein during storage; to monitor the
carbon footprint during processing and to produce HACCP guidelines and measure quality cost.
8.2 The hybrid windmill solar tunnel dryer
In this study, hybrid windmill solar tunnel dryer was fabricated successfully, and its performance
was measured by drying salted and unsalted fish, using solar energy during the day and wind
energy at night and on cloudy days. The moisture content of salted and unsalted Siganid fish
reduced exponentially as the drying time increased. A similar trend was reported by Guhnan et al.
(2005), Alibas (2012) and Kituu et al. (2014). The moisture ratios for the unsalted fish reduced
relatively fast compared to the salted fish, which agrees with the observations made by Graivier et
al. (2006) and Jittinandana (2002). The reduced drying associated with the salting of fish could
be attributed to the binding of moisture by salt in the fish flesh.
The ambient humidity was high throughout the drying period which is common along the Kenyan
coast and is a cause of the slower drying rate and prolonged drying period considering the cloudy
atmosphere that was prevailed. Drying during the first 18 hours showed that the ambient and drying

161
chamber relative humidity values were almost indistinct. However, beyond the 18th drying hour,
the ambient temperatures increased, and subsequently, the drying chamber temperature increased.
However, the increase in drying chamber temperature was much more than the increase in ambient
temperature, which demonstrated better energy harnessing by the dryer hence improving the ability
of the system to dry the fish to a better quality. This is because lower air humidity results in
increased moisture absorption potential (Mujaffar and Sankat, 2005). A two-way statistical
Student’s t-test showed a significant difference between ambient and drying chamber relative
humidity (tstat=7.2543, tcrit, 5%=2.0687).
The high solar dryer temperatures resulted in significant reduction in the relative humidity in the
dryer compared to the ambient humidity resulting in increased drying potential. This is in
agreement with the observation by Sahoo (2012) who noted that relative humidity reduced
exponentially as air temperature increased. The safe moisture content for fish brined in 0 to 15%
salt are 0.15 and 0.35 kg/kg, d.b respectively (Brugay et al, 2003). The final moisture content of
0.2kg/kg, db was shelf stable for dried fish. The drying of the fish to stable values of moisture
content was due to higher chamber temperatures in the dryer.
The drying rate constant (k) values ranged from 0.037-0.05 per hour for the salted and unsalted
Siganid fish. However, the values decreased with increase in brine concentration. This implies
that an increase in salt concentration binds water to the fish flesh, and this makes it unavailable for
drying. Based on the equation 6 (Chapter 2), the drying rate constants and the thickness of the
materials, values of the effective diffusivity (Df) were 6.53 x 10⁻¹² and 6.63x 10⁻¹² m2/s for the
salted and unsalted Siganid fish, respectively. These values further augment the observation that
the unsalted samples dried much faster than the salted samples.
The best model for the describing the drying of the salted (5%) and unsalted Siganid fish in the
hybrid windmill solar tunnel dryer was model 2, the Page model (table 2.2) which had the highest
R2, and the least RMSE and reduced 2, A two way statistical analysis did not show a significant
difference between modelled and actual moisture ratio for salted (tstat=8.0267×10⁻², tcrit, 5%=2.0687)
and for unsalted (tstat=2.8740×10⁻⁵, tcrit, 5%=2.0687) at 5% level of significance.

162
8.3 Quality, Biochemical and Microbiological Properties of Siganus Sutor fillets
8.3.1 Quality scores during delayed icing
The quality scores were based on the QI scheme. The scoring scale was designed in QIM format
such that score 0 meant the freshest, score 1 was slightly fresh while score 3 meant the least fresh.
The results showed that the freshness quality of the fish assessed decreased with time and those
assessed after 4 hours had the poorest quality. From the score, the fish were still of good quality
after 4 hr delayed processing with a QI maximum of 1.2 for the gills.
8.3.1.1 Quality index
There was a strong correlation of R2 = 0.9735 observed that were significantly different (p <0.05).
The noted difference showed premium quality grade 1 scoring lower than good quality grade 2
and marginal quality grade 3 accordingly.
The results indicated that attributes gradually deteriorated with time and obeyed the QIM scheme;
fresh fish just after catch was given lower scores which increased with time, coming close to a
maximum score at the end of shelf life (Martinsdottiret al., 2001). It is therefore worth noting that
the QIM was successfully used to categorize samples into quality grades. Five pieces of fish used
in the current study was in accordance with the guidelines for evaluation of freshness of whole fish
(Martinsdottiret al. 2001). A minimum of three (large fish) to 10 (small fish) random samples is
recommended in the guidelines as this should be taken to cover the biological differences in
spoilage rate of fish. All the quality grades were within the consumption limits as the QI for the
analyzed fish had a maximum score of 21 whereas, grade three that was scored higher had QI of
6.
8.3.1.2 Individual quality parameters in QIM scheme
The average scores for the individual quality descriptors varied considerably within the groups
However, subsequent quality grouping recorded consistently higher scores throughout except for
eyes form. Figure 3.3 further depicts that skin mucus and skin odour should be excluded from the
163
scheme as they were either difficult to evaluate or did not reflect on quality for Siganid fish and
recorded minor changes in the groups (Sveinsdottiret al, 2003).
8.3.1.3 Influence of raw material quality on yield and labour productivity
The yield diminished with reduction in fish quality as grade 1 recorded higher fillet yield of about
54% compared to grade 2 and 3 that were 50% and 45% respectively. However, the yield was
inversely correlated with production time reported during filleting as longer time (minutes) were
observed with poorer grades. Earlier studies in cod filleting showed the relationship between raw
material quality and productivity and lack of icing on board (Zugarramurdi et al., 1995;
Zugarramurdi et al., 2004). Longer storage time produced lower yields and required slightly longer
time for filleting. The difference looks insignificant for few samples but in an industrial set up it
would translate to big economic losses in terms of time and yield. Because freshly caught fish is
still in rigor, the muscles are easily cut than when the fish loses rigor. Fillets tend to stick to the
bones and therefore give low yields and increases time to fillet.
8.3.2. Biochemical parameters during delayed processing
During the 4-hour delayed icing period there was increase in T-VBN, PV and TBARS. pH
decreased and TMAO was not detected.
8.3.3 Water activity and pH
The water activity was constant at values of 0.88 for the three grades meaning that the delayed
processing of grade 2 and 3 did not have effect on water activity. Dehydration of foods helps to
extend shelf life by reduction in water activity (aw) as a low water activity inhibits microbial growth
and enzymatic reactions. The pH ranges of 6.03 to 7.1 have been recorded for most fresh fish. The
low pH levels are because of stress at the time of death which causes depletion in energy reserves
especially glycogen being converted to lactate. It could also be due to increased production of free
fatty acids during hydrolysis of fats (Özogul et al 2005).

164
8.3.4 Lipid oxidation
Peroxide Value (PV) increased during the 4 hr delayed processing period from 21.65 mEqO2/kg
at 0 hr to 106 mEqO2/kg after 4 hr. Peroxide value measures the breakdown of hydroperoxides,
the primary lipid oxidation products. A value of 20mEqO2/kg is proposed as the maximum limit
for fish oil but there is no maximum standard value agreed for PV as higher PV values have been
obtained (Alghazeer et al, 2008), even in this study without detection of spoilage. There are no
levels for dried fish reported.
The secondary lipid oxidation products TBARS increased from 0.367 mg malondialdehyde /kg at
0 hr to 3.011 mg malondialdehyde/kg after 4hr of delayed processing storage. The delayed
processing showed a linear increase with time from 0 to 4 hours. TBARS are formed from unstable
hydroperoxides during lipid oxidation and contribute to rancidity. The increase in TBARS
corresponded to the formation of hydroperoxides which was slower in breakdown than formation
of TBARS. The value of TBARS in this short storage period was less than the upper limit set for
most fish oils of 7 to 8 (Gimenez et al, 2011; Boran et al, 2006) and 27 mg malondialdehyde for
mackerel fish (Özogul et al 2005).
8.3.5 TVB-N
The T-VBN levels rose from 13.8 to 42 mg N per 100 g of fish muscle from 0 to 4 hr of delayed
processing. T-VBN release depends on bacteria decomposition of fish flesh. Freshly caught fish
have TVB-N values of 5 and 20 mg N per 100g of muscle and 30-3 mg N per 100 g of muscle is
the level of acceptability for iced stored fish in cold regions (Ozogul et al 2005 and Huss 1998)
although in warm water fish, this could be higher.
Raw material quality had a direct impact on yield and production costs of Siganus sutor. There
was an increase in filleting time and lower filleting yield during delayed processing. The levels of
PV, TBARS, TVB-N, TMA increased during delayed processing as a sign of quality deterioration.
The pH values reduced during delayed processing. Further studies could be done to document all
production costs. There is a need to further link the developed QIM scheme for Siganus sutor to
precisely characterized quality with storage time.

165
8.4 Drying characteristics during delayed processing (0, 2, 4, 6, 8 and 10 hr delayed
processing)
This was covered in chapter 2. The main interest was to dry the fish for storage to acceptable
moisture content of 15%
8.4.1 Moisture content in fish samples
Despite delayed icing, all the fish were dried to about 15% moisture, which is the shelf stable
moisture content that does not favour bacterial or mould growth.
8.4.2 Biochemical changes during drying (0, 2, 4, 6, 8 and 10 hr delayed processing)
8.4.2.1 Water activity and pH in fish samples undergoing delayed filleting
The water activity reduced during drying although the fish that was filleted at 0 h, had a faster loss
in water activity than the one that was filleted last after 10 h delayed processing. Water activity is
the available water for microbial growth and is unbound water. In fish stored for 0 hr the water
available for microbial growth is more readily available and is lost easily than fish undergoing
delayed processing.
The pH values for the fish processed after 0 h and 2 h were lower than those processed after 6, 8
and 10 hr. The pH values were higher because as the delay continued, bacteria also metabolized
various substrates in the fish to produce volatile basic compounds that are alkaline, hence the
increased pH (Huss, 1995; and Susanto et al, 2011, Makawa et al, 2014).
8.4.2.2 Peroxide value and TBARS
Peroxide value was highest in the fish processed after 10 h and lowest in the fish processed after
0 h (Figure 3.8). The lower PV at the end of drying was because the hydroperoxides are unstable
at higher temperatures and break down further (Frankel 2005) to volatile and none volatile
compounds and secondary products with limits being 20mEq O2/kg (Weber et al 2008, Haque et
al 2013). No limits are known for PV in solar dried fish.
166
TBARS
The increase in TBARS at 0, 2, 4, 6, 8 and 10 h at the beginning was due to the initial formation
of hydroperoxides which break down to aldehydes and related compounds. However, during the
process of drying, the TBARS decreased either due to presence of more volatile tertiary
compounds and due to formation of adducts with proteins (Weber et al 2008; Özogul et al 2005;
Frankel 2005), which can cause toughening of fish. The limits for TBARS in fish oil is 7 to 8 mg
MDA/kg but this may not apply to solar dried fish because the fish at the end of drying and at the
beginning of storage is still suitable for human consumption despite the higher levels of TBARS.
8.4.2.3 TVB-N and TMA
There was an increase in both TVB-N and TMA during delayed processing at time 0, 2, 4, 6, 8 and
10 hr at the start of drying for the fresh samples. As the drying continued, the trends from TVB-N
and TMA-N were different though the net effect was a reduction in TVB-N and TMA-N levels.
The lower TVB-N values can be explained by lower microbial loads in the fish throughout the
initial drying periods. The peak period when the TVB-N is highest is due to microbial effects with
bacteria causing the release of TVB-N up to a maximum when the population of bacteria start to
go down again. There seemed to be a maximum increase in TVB-N between 12 to 16 hr of the net
drying period. This was the period preceding the fish having been stored overnight to resume
drying the following day. Bacterial growth would continue to occur. Increased TVB due to
increase in microbial loads has been reported (Anderson, 2008; Orban et al 2011). The TVB-N
values finally reached lower values at the end of drying.
The trend is slightly different for TMA-N in that there was no peak increase before a decrease
although there was still a net reduction in TMA-N at the end of the drying period. The TMA levels
were not detected in the fish fillet that were filleted after 0, 2 and 4 hours for delayed processing
and did not show any TMA throughout the drying period. The TMA levels started to be noticed in
the fish that was processed after 6, 8 and 10 hr delayed processing.
It is important to note the levels of TMA in the fish at the start of drying irrespective of the delay
are still within the allowable limits of spoilage of 5mg TMA/100g (Orban et al 2011). The

167
pathways and rates for formation of TMA and TVB-N could be different involving different types
of bacteria with different capacities to form volatile bases (Orban et al 2011) though at the end
both are reduced after the drying process.
8.5 Biochemical changes during storage of solar dried fish only at 0 h of delayed icing
8.5.1 Moisture during storage
Moisture content above 25% can support bacterial growth and mould growth can take place at
moisture content above 16%. The fish was still within safe limits for microbial attack despite an
increase in moisture content. The absorption of moisture is due to the hygroscopic nature of the
fish muscle.
8.5.2 Water activity
Water activities below 0.8 for beef products are common and are equivalent to about 23%
moisture. The water activity achieved in this study during storage is still below the threshold of
0.8 hence the fish is still safe for consumption. There is however a complex relationship between
moisture content and water activity. Moisture content is useful when looking at the time to end
drying. Water activity is for information on storage. It is not always correct to assume that a higher
moisture content will mean a higher water activity (Karel, 1975; Potter 1968; Oduor-Odote et al,
2010).
8.5.3 pH
The pH during storage of the Siganid fillet pH dropped in all forms of storage though it was lowest
in vacuum packed. Changes in pH occur during storage but is normally faster in ambient storage
i.e. equivalent to open storage. Although pH has been used to measure fish deterioration, the
variation in pH is due to many factors like chemical composition, storage conditions in relation to
air among others (Susanto et al, 2011).

168
Under normal circumstances, the pH is expected to drop then increase again during storage. In this
case the pH decreased. This means that there is still some activity during storage that could be
another factor other than glycogen and its effect is higher in the fish stored in the open than in
packaged fish. The hydrolysis of lipid to fatty acids could be another reason for decrease in pH.
During storage of fish meat in ambient conditions, El-Deen and El-Shemery (2010) noticed a
decrease in pH.
8.5.4 Lipid oxidation
Hydroperoxides, determined as peroxide value (PV) rose during storage of Siganids (Figure 3.16)
suggested that the propagation process on lipid oxidation was continuing until day 75 of storage.
Lipid oxidation is influenced by light and oxygen. The higher value of PV in the fish stored in the
open and those stored in normal polythene could be because of both light and oxygen while the
increase in PV in the vacuum-packed fish could be due to light mainly because the packaging is
permeable to light. Whereas PV normally rises, and peaks then drops due the formation of
secondary products, as many studies have shown (Ghlaly et al 2010), other studies have also shown
a continuous rise in PV of fish oil without peaking, and then dropping during storage (Boran et al,
2006). PV limits for fresh fish oil is 20mEqO2/kg (Jinadassa 2014). Thus, one spoilage indicator
cannot be used to conclude spoilage.
Secondary lipid oxidation products like malonaldehyde (TBARS) decreased during drying (Figure
3.9) and throughout the storage period (Figure 3.17). The limit for TBARS is 5 mg
malonaldehyde/kg for good quality fresh fish and fish can be consumed even when TBARS are
8.0 mg MDA/kg (Shallam et al 2007). The fish for storage was therefore within consumption range
for humans. The decrease in the level of TBARS is due to malonaldehyde breakdown to tertiary
products as well as cross-linking with proteins particularly tyrosine, lysine and tryptophan amino
acids (Saeed and Howell, 2002, Saeed et al, 1999, Shallam et al, 2007). The rate of formation of
PV can also be higher than TBARS as the latter break down and interact with other compounds.

169
8.5.5 TVB-N
The level of TVB-N levels were all within the limits allowed for fresh fish though the limits for
dried fish has not been developed. The allowable limits set by the EC 95/149 is 35mg TVB-N per
100g. Similar studies have given TVB-N values of 17 to 33 mg N /100g for dried fish (Pavakar et
al, 2013; Jinadasa, 2014). The lowest increase in TVB-N was in the fish stored in a vacuum and
the highest increase was for those stored in the open (Figure 3.20). TVB-N is considered a fish
spoilage indicator rather than a fish freshness indicator. These levels apply to fresh fish (Orban et
al, 2011). The TVB-N value is categorized in quality classes with TVB-N up to 25mg/100g
considered “high quality” up to 30 mg/100 g considered “good quality” between 30-35 mg/kg
falling in “level of acceptability” and above 35 mg/kg considered “spoilt” (Jinadassa 2014). There
are no reported studies on dried fish indicator parameters for Siganids. This study is however very
useful to dry chain fish processors to obtain data for spoilage of dried fish deterioration and to
adopt proper storage conditions.
8.5.6 Temperature
The temperature during storage of fish ranged from 30.4oC at the beginning of storage to 23oC at
the end of storage (Figure 3.19), due to weather changes over time. Temperature during storage of
dried fish is as critical as temperature considerations in preservation of fresh fish as it influences
bacterial growth (Jinadassa 2014). Temperatures of between 5oC and 60oC can easily favour
microbial growth so storage under such conditions can lead to deterioration of fish. In the case of
dried fish, the ones that are stored at temperatures (23-30oC can result in microbial growth if other
conditions are right. Vacuum packaging will help under such circumstances.
8.5.7 Microbiological analysis and evaluation
Bacterial growth is a cause of fish spoilage apart from causing of disease. Bacterial numbers can
be used as an indicator of fish quality. In this study the total number of bacterial count for the
freshly landed Siganus ranged from 0.90 x 10⁶–2.50 x 10⁶ cfu g-1 of fish flesh for the TPC analysis
whereas the levels of Specific Spoilage Organisms (SSO) ranged between 0.60 x 10⁶ – 2.90 x 10⁶.
These levels were however higher than the maximum limits recommended by both the
International Standards Organization (ISO-4833) and the Food and Agricultural Organization

170
(FAO) of 5 x 10⁵(ICMSF, 1980; FAO/WHO, 1976, 1978; WHO, 1974; and Codex, 1977). This
variance in accepted limit numbers has in fact made the developed countries such as Denmark and
United States of America (USA) to set their own accepted maximum limits in a gram of flesh at 1
x 105 (100,000) and 5 x 10⁵ (500,000) respectively. However, these observed count numbers were
within the accepted limits mentioned by the Sudanese Standards and Metrology Organization
(SSMO) of 5×10⁵ – 106cfug-1 for fresh fish products (SDS 357). The numbers were also in the
normal ranges stated by Liston (1980) of between 102 – 107cfug-1 of fish flesh.
The existing wide range of bacterial flora counts on freshly caught fish, according to Shewan
(1977), depends on the environment rather than the fish species. Thus, the considerable high
microbial loads obtained from the freshly landed fish samples could possibly be due to poor
handling by the fishermen at sea or the processors of different hygienic profile having regular skin
contacts with the fishes. This aspect of cross contamination was effectively confirmed by the
observed higher MPN values observed in the washing water during the study. Another possible
explanation could be the unhygienic sanitary environment of the fish source (ocean) and the fishing
vessel.
In cases of solar drying, the bacterial load counts were on average, within the normal ranges
stipulated by ISO-4833 standards (Codex, 1977). However, the mean counts were found highest
(8.50 x 10⁵cfug-1) for TPC and (9.90 x 10⁵cfu g-1) for SSO. Thus, the low microbial counts obtained
from the dry fish samples could be attributed to the low moisture content impacted by drying.
However, during storage the counted numbers slightly increased with the majority still being in
the range of 105, probably due to the hygroscopic nature of the samples which provided the
microorganisms with moisture for growth. The hypothesis was confirmed when the values reduced
at the fourteenth days of storage because of moisture reduction due to packaging. Thus, a general
reduction in the bacterial counts was observed with all forms of packaging for the stored solar
dried fish samples. This study was used to develop the HACCP.

171
8.6 Lipid oxidation in solar dried fish with and without antioxidants
Synthetic phenolic compounds like BHA and BHT have been widely used as antioxidants;
however, there is a concern that they may be toxic. Therefore, natural antioxidants, like turmeric
and plant extracts like water hyacinth and seaweeds, provide alternatives that were assessed in this
study.
The control Siganid fillets showed the highest levels of peroxides, TBARS and free radical
formation over a storage period of 90 days. Fish fillets treated with synthetic BHA (positive
control) afforded the best antioxidant activity as shown by significantly lower lipid oxidation
products due to its high polyphenol content. The concentration of BHA in this study was higher
than would normally be used in food products. The natural antioxidant plant materials used to treat
the Siganid fillets were not as effective as BHA, but significantly reduced lipid oxidation compared
to the control, Turmeric was more effective in reducing lipid oxidation compared with seaweed
and water hyacinth; this was in line with the total polyphenol content, the highest being in turmeric
and lowest in water hyacinth.
The increase in PV to day 60 and eventual drop was due to propagation of free radicals and
formation of peroxides initially followed by TBARS secondary and tertiary products. It is likely
that the polyphenolic antioxidants caused a delay in oxidation but with time, owing to light and
heat, and depletion of antioxidant level, the process of propagation in lipid oxidation increased
towards the end of the storage period. Between day 0 and 30, the total phenolic content in the
muscle was lower in the seaweed and water hyacinth throughout the storage followed by turmeric
and BHA (Figure 4.2) which had higher phenolic compounds. After 30 to 90 days, the fall in
polyphenol content in fish muscle was accompanied by a concomitant rise in peroxides and
TBARS. The control was 0.29mEq/kg on day 30. This means that the natural antioxidants from
turmeric, seaweed and water hyacinth exerted some antioxidant activity in these early stages of
storage.
Antioxidants can reduce lipid oxidation by competitively binding active forms of oxygen,
interfering with the initiation and propagation steps, binding free radicals and break the chain by
stabilizing peroxides and form antioxidant radicals that are too unreactive to form non-radical

172
products (Halliwell and Gutteridge, 1995). The mechanism of action of phenolic groups in the
antioxidants used relies on the resonance stabilisation of the phenoxy radicals that occurs at the
ortho and para position on the aromatic ring. In addition, it can be influenced by the size of the
substituting group. Further, many phenolic compounds contain carbonylic and hydroxyl groups
that can chelate metals and thereby inhibit lipid oxidation and rancidity (Howell and Saeed, 1999).
8.7 Rheological and thermal properties
This study showed that antioxidants particularly the natural antioxidants water hyacinth, followed
by turmeric and seaweed can be used to minimize texture changes during the storage of dried fish.
Fish particularly fatty fish comprises triglycerides (75%) and phospholipids (25%) Most fish oils
contain saturated fatty acids and an abundance of polyunsaturated fatty acids like docosahexaenoic
acid (DHA) and eicosapentaenoic acid (EPA). Whilst the PUFAs are implicated in lowering
atherosclerosis and lowering blood cholesterol, unsaturated fatty acids and cholesterol are readily
oxidized leading to rancidity and formation of chemicals including mutagens and carcinogens such
as hydroxides, endoperoxides and epoxides (Halliwell and Gutteridge, 1995) (See chapter 3).
Lipid peroxidation is initiated in the presence of oxygen and metal ions, when hydrogen is
abstracted from a methylene group in the PUFA by a reactive species. The primary products of
lipid oxidation are peroxides which are converted to secondary products like aldehydes (TBARS).
The free radicals and aldehydes produced during lipid peroxidation can combine with each other
or more likely with protein molecules to end the chain reaction. This can cause severe denaturation
of proteins and undesirable changes in nutritional properties including loss of amino acids, protein
cross-linking and DNA damage (Saeed, Fawthrop and Howell, 1999). Aldehydes can react with
amino groups forming intramolecular bonds and cross-links with other protein molecules (Saeed
et al., 1999). Saeed et al (1999) provided evidence by ESR spectroscopy that lipid oxidation
damages proteins through the transfer of free radicals to amino acids and proteins to form protein
free radicals. These radicals can react with each other for example tyrosine free radicals can react
to form dityrosine (Saeed et al., 2006). It is this cross-linking that causes aggregation in proteins
and toughening of fish muscle during processing like drying and freezing and on storage.

173
8.8 Carbon footprint and quality tool during drying of Siganid fish in the Hybrid Windmill
Solar Tunnel Dryer
Dried fish is a common dish in Kenya and the sun is the main source of energy for the drying
process (Oduor-Odote, 2010). In the dried fish chain however the pre-harvest energetics and
carbon footprint (vessel construction, maintenance and gears), harvesting (mechanized and
motorized) and the post-harvest stages especially transportation and marketing to waste
management are the sources of carbon footprint. Cooling and refrigeration the main consumers of
fuel and emissions is reduced to a minimum making drying as a process that has a lower carbon
footprint (Gosh et al 2014). Whereas the standard LCA involves reporting on goal and scope, life
cycle inventory, life cycle assessment and interpretation of results, this study focused only on
Greenhouse Gas Emissions (GHG)/Global Warming Potential (GWP).
This study gave an opportunity to understand and estimate the contribution of solar dried fish to
climate change by determining the carbon footprint. Data from fuel consumption and subsequent
CO2 emission could help gain insight into increasing fishing costs and prices. This may be used in
future to help formulate policy on regulation of fishing efforts, fuel subsidies, and giving proposals
on suitable climate change mitigation measures. The data around the functional unit of 1 kg solar
dried Siganid encompassed all the major industrial activities required to catch, process, and deliver
the solar dried product to the consumer. The estimation of carbon and carbon emission from fuel
(diesel) was calculated by converting the diesel consumed using the standard conversion factor
that 1 litre of fuel (diesel) produced 10.7 kWh of heat, and the C emitted from 1 KWh of heat is
0.68 kg and for CO2 was 0.25 kg.
The carbon dioxide emissions were low in this study due to hand labour, and low energy use (direct
solar energy). The main emissions were caused by fisheries activities. However, due to the low
fuel use in the fisheries practice (use of dhow boats) and artisanal conditions, the total energy use
is very low. Therefore, the chosen processing chains were low in carbon emissions in comparison
to other production cycles. Due to the substantial influence of the primary production of the
species, it is advisable to perform additional environmental impacts in different case studies.
Considering that dried fish is also a preferred cuisine in many countries, paying more attention to

174
it and emphasising on eco-friendly processing methods like the hybrid windmill solar tunnel will
help reduce carbon footprint and improve food and energy security.
8.9 Quality safety tool -HACCP for solar dried fish
In practice, HACCP systems can be adapted, as necessary. The timescale for adaptation differs
from procedures such as monitoring of CCPs and equipment used for this. An example of
timescales and frequencies to perform procedures is presented in Table 7.2. In general, dried fish
products are considered shelf stable. Consequently, they are often stored and distributed
unrefrigerated. The characteristic of a dried fish product, which makes it shelf stable, is their low
water activity (aw). Below water activity of 0.85 the growth and toxin production of all pathogens
like Staphylococcus aureus and Clostridium botulinum is prevented which is important for a shelf-
stable dried product (FDA, 2001). Since the final product is cooked, only process guidelines are
necessary.
Another issue that is of interest is the international trade of fish products. Standardization of the
HACCP concept may be required in the near future in Kenya. Therefore, aspects like management
responsibility and compatibility between HACCP and other Quality Systems commonly used must
be considered. For harmonization of HACCP systems, a new International Standard, ISO 22000,
is available which was published on 1 September 2005, as an Internal Standard for food safety
management to ensure safe food supply chains worldwide (Frost, 2005).
8.10 CONCLUSIONS
8.10.1 Hybrid windmill solar tunnel dryer
• The results of this study indicate that the hybrid windmill solar tunnel dryer is capable of
harnessing solar energy compared with open sun conditions, as the ambient temperatures
were always lower than the plenum chamber temperatures.
• The Page model was established as the best model that describes thin layer drying of
Siganus Sutor fish in the integrated wind-solar tunnel dryer.

175
• During drying, the moisture content of fish reduced with drying time, and the reduction
was exponential both under salted and unsalted conditions.
• Drying temperatures of 35oC achieved at night can prevent spoilage and facilitate drying.
8.10.2 Raw material quality
• The raw material quality has a direct impact on yield and production costs of Siganus
sutor. There was an increase in filleting time and lower filleting yield during delayed
processing.
• The levels of PV, TBARS, TVB-N, TMA increased during delayed processing as a sign
of quality deterioration. The pH values reduced during delayed processing.
• Further studies could be done to document all production costs. There is need to further
link the developed QIM scheme for Siganus sutor to precisely characterize quality with
storage time.
• Solar tunnel drying reduced biochemical spoilage indicators to a minimum before storage
starts. During actual solar drying, PV and TBARS decreased because of unstable nature of
hydroperoxides and aldehydes interacting with proteins and TVB-N and TMA decreased
owing to less bacterial action.
• During storage of the solar dried fish fillet for 75 days, the moisture content, water activity
change and bacterial load was at a minimum in the vacuum-packed fish compared to those
in normal polythene and packaging and those kept in the open. Peroxide value and TBARS
lipid oxidation indicators were lowest in the vacuum packed Siganid fish fillet compared
to those stored in the open and in normal polythene. Vacuum packaging of fish products
should be recommended in the Kenyan Fisheries Act.

176
8.10.3 Effect of natural antioxidants on lipid oxidation
• The natural antioxidants in water hyacinth, seaweeds, turmeric suppressed lipid oxidation
but not as effective as the synthetic antioxidant- BHA.
• The Total Phenolic content (TPC) in turmeric was twice the amount found in seaweed and
water hyacinth at the beginning and during storage which reflected the higher antioxidant
effect of turmeric. The TPC was lowest in the water hyacinth during storage and they
showed the highest PV and TBARS values during storage.
• The order of strength of the antioxidants was BHA>Tumeric>Seaweeds>Water hyacinth.
BHA, used in lower concentrations in most foods was at a much higher concentration in
this study and because synthetic antioxidants are now considered unsafe, it is advantageous
to replace them with natural antioxidant sources like water hyacinth, turmeric and seaweed
plant phenolics.
8.10.4 Rheological and thermodynamic properties of dried fish
• These natural antioxidants minimized lipid oxidation in solar dried fish during storage and
thereby reduced protein oxidation and cross-linking, leading to lower G’ values and
reduced toughening compared to dried fish without antioxidants.
• The natural antioxidants lowered heat enthalpy ∆H meaning they had an effect on protein
cross-linking.
8.10.5 Carbon Footprint and quality tool – HACCP
• The carbon dioxide emissions were low in this study due to hand labour, and low energy
use (direct solar energy). The main emissions were caused by fisheries activities. However,
due to the low fuel use in the fisheries practice (use of dhows) the total energy use is very
low.
• The drying system used in the study led to shelf stable low water activity products.

177
• The Hazards identified either as critical points or critical control points in the study are not
effective because the final product is cooked eliminating all hazards.
8.11 FURTHER WORK
Solar/windmill drying technology
Drying in the fisheries sector has been a key preservation method for centuries and can be used to
control post-harvest losses especially with further improvements. The hybrid windmill tunnel
dryer was introduced to help with fish drying during the wet and damp weather conditions and at
night. The dryer has shown that drying is possible in the rainy season; however the challenge now
is to increase the drying capacity of the dryer to over 1 ton.
This increase in drying capacity will require higher power output which can be achieved with the
aid of extra solar panels. Further, it would be advantageous to connect this hybrid windmill dryer
to an ice maker so that the fish processing can benefit from readily available ice for hygienically
processing fish.
The dryer should not to be limited to drying of fish only but its application should be extended to
dry other farm produce. High value microalgae like Spirulina are candidates for uniform drying
and with their high price in the market, Return On Investment on the dryer will be faster. It is
possible to achieve all the above benefits whilst using renewable energy, and helping to protect the
environment.
Quality of fish
The quality of dried fish has to be as high as that for fresh fish products to provide safe nutritious
food and enable fisher-folk to earn a higher income.
Further work is required to ascertain the quality characteristics of dried fish products. As
undertaken for fresh fish production, where the Quality Index Method has been introduced for
ascertaining quality, a method is needed to help characterize the quality of dried fish. Both the
levels of biochemical and physico-chemical indicators of spoilage in dried fish are required to be
assessed. Levels of peroxides, TBARS and TVB-N are acceptable indicators to monitor because
during drying a lot of changes take place, some surpassing the traditional levels.

178
Vacuum packaging for dried fish was found to be very useful for maintaining quality during drying
and storage of fish. However, further work needs to be undertaken to assess the risks from
anaerobic bacteria in vacuum packaged fish that will lead to adoption of appropriate packaging by
the Government of Kenya.
Training and awareness of quality maintenance of the product is crucial, so that safety is
guaranteed at all levels in the value chain. It should be emphasized that quality assessment should
be based on losses that may be incurred resulting from a poor quality starting product.
Control of lipid oxidation
Postharvest losses in fish particularly deterioration of proteins and lipids are responsible for low
value of fish and economic losses that need to be ameliorated.
The present studies on aquatic plants as a source of natural antioxidants were successful for
limiting lipid oxidation. However, more work needs to be done to optimize the levels of natural
antioxidants and to consider using synergistic combinations with cinnamon extracts to better
control lipid oxidation during fish storage. Abundant raw material sources of natural antioxidants
like water hyacinth and seaweeds (some being farmed) can be used to produce higher value
products like antioxidants or bioactive peptides to give better economic returns and to support
industrialization, health and job creation.
Carbon footprint
The environmentally cleaner technologies in the fisheries industry can help to reduce the carbon
footprint, but adopting these technologies requires further work.
Using cleaner technology in food production is important as it affects climate change positively.
Eco-labelling is now considered important and details on packaging showing how much carbon is
emitted in the Life Cycle of the product will be introduced in a matter of time. Therefore extensive
and in depth knowledge of new technologies and processes of production that are environmentally
friendly is highly necessary to acquire. Further information on the carbon footprint and other
greenhouse gas emitting processes cannot be over emphasized
179
Product safety-HACCP/Risk Analysis
Product safety through well documented procedures boosts consumer confidence and should be
focused on in the dry fisheries chain. Proper labelling with scientifically based information on
expiry dates of dried fish products will help move products faster in the market because consumers
have become very aware of quality of products they purchase. Therefore risk analysis and HACCP
to be used for each product is necessary in order to guarantee product safety.

180
9.0 REFERENCES
Abbas, K.A.; Saleh A.M.; Mohamed, A and Lasekan, O (2009). The relationship between water
activity and fish spoilage during cold storage: A review. Journal of Food, Agriculture &
Environment Vol.7 (3&4): 86-90.
Abd El-Baky, H.H.; El Baz, F.K and El Baroty, G.S (2008).Evaluation of Marine Alga Ulvalactuna
L as source of Natural Preservative Ingredient. American Eurasian Journal of Agriculture and
Environmental Science 3 (3):434-444.
Abdullahi, S.A., Abolude, D.S. and Ega, R.A. 2001. Nutrient quality of four oven dried freshwater
catfish species in Northern Nigeria. J. Tropical Biosciences, 1(1): 70-76.
Addis, P. B. (1986). Occurrence of lipid oxidation products in foods. Food and Chemical
Toxicology, 24, 1021–1030.
Ackman, R. G. (1999). In R. G. Ackman (Ed.), Marine biogenic lipids, fats and oils. Boca Raton,
FL: CRC Press.
Alasalvar C., Taylor, A.K.D and Shahidi, F (2005). Comparison of Volatiles of cultured and wild
sea bream (Spartusaurata) during storage in ice by dynamic headspace analysis/gas
chromatography-mass spectrometry. Journal of Agricultural and Food Chemistry. 53: 2616-2622.
Alghazeer R.; Saeed, S and Howell, N. K (2008) Aldehyde formation in frozen mackerel
(Scomberscombrus) in the presence and absence of instant green tea. Food Chemistry 108:801-
810.
Alibas I. (2012). “Selection of the best suitable thin-layer drying mathematical model for vacuum
dried red chili pepper”. Journal of Biological and Environmental Sciences. 6(17), 161-170.
Ahmed A.T.A.; Mustafa, G and Rahman H. (1979). Solar drying of Silver Jew Fish
Johniusargentetus (Houttuyn) in Polythene Tent Dryer. Bangladesh Journal of Biological Sciences
8 (1) pp.23-30.
Ahmed AM, Nasu T., Huy D.Q., Tomasika Y., Kawahara S. and Muguruma M (2009). Effects of
microbial transmutase on the natural actomyosin cross-linking in chicken and beef. Meat science
82:170-178.
Anderson A.K (2008). Biogenic and volatile amine-related qualities of three popular fish species
sold at Kuwait fish markets. Food Chemistry 107:761-767.

181
AOAC (1990). Official Methods Of Analysis: Association Of Official Analytical Chemists
International, Airlington, U.S.A. pp 931. 341-342; 449.
AOCS (1999). Official methods and recommended practices of the American Oil Chemists
Society. D. Firestone (Ed) Champaign: AOCS Press.
Abolagba, O.J and O.O. Melle (2008) Chemical Composition and Keeping Quality of Scaly Fish
Tilapia, Oreochromis niloticus Smoked with Two Energy Sources. African Journal of General
Agriculture Vol 4 No. 2 113-117.
Abolagba, O.J. & Uwagbai, E.C. (2011). A Comparative Analysis of the Microbial Load of
Smoke-Dried Fishes (Ethmalosa Fimbriata and Pseudotolithus Elongatus) Sold in Oba and
Koko Markets in Edo and Delta States, Nigeria at Different Seasons. Australian Journal of
Basic and Applied Sciences, 5 (5): 544-550.
Auborg S.P. (1999). Recent advances in assessment of marine lipid oxidation by using
fluorescence. Journal of the American Oil Chemists’ Society, 76 (4).409-419.
Awad H.E.A (2008) Ecology and adaptation of Water hyacinth in the Nile delta Ecosystem. MSc
Thesis. Botany Department, Faculty of Science, Cairo University pp116.
Azad Shah AKM., Tokunaga, C., Kurihara H and Takashi K (2009). Changes in lipids and their
contribution to the taste of migaki-nishin (dried herring fillet) during drying. Food Chemistry 115:
1011-1018.
Badii, F and Howell, N.K (2002). A comparison of biochemical changes in cod (Gardusmorhua)
and haddock (Melanogammusaeglefinus) during frozen storage. Journal of the Science of Food
and Agriculture, 82: 87-97.
Badii, F and Howell, N.K. (2003). Elucidation of the effect of formaldehyde and lipids on collagen
from frozen cod by Raman spectroscopy and differential scanning calorimetry. J. Agric. Food
Chemistry, 51, 1440-1446.
Badii F and Howell NK (2002): Changes in the Texture and Structure of Cod and Haddock Fillets
during frozen Storage. Food Hydrocolloids 16: 313-319.
Badii, F and Howell, N.K. (2002). Effect of antioxidants, citrate and cryoprotectants on protein
solubility and texture of frozen cod (Gadus morhua). Journal of Agricultural Food Chemistry, 50,
2053-2061. IF 3.107.

182
Badii, F and Howell, N.K. (2002) A comparison of biochemical changes in cod (Gadus morhua)
and haddock (Melanogrammus aeglefinus) during frozen storage. J. Sci. Food Agric. 82, 87-97.
Bala B.K..; Woods, J.L. (1995). Optimization of a Natural Convection Solar Drying System.
Energy 20 (4). Pp. 285-294.
Bala, B.K. (1997). Drying and Storage of Cereal Grains. Oxford& IBH Publishing Company. Pvt
Ltd. India.
Bala, B.K. (1998). Solar Drying Systems: Simulations and Optimisation. Agrotech publishing
Academy. India.
Bala, B.K. (2000). Solar Drying of fruits & Fish. Report. Dept of Farm Power and Machinery.
Bangladesh Agricultural University, Mymensingh, 2202. Bangladesh.
Bala, B.K.; Mondol, M.R.A (2001). Experimental Investigation on Solar Drying of Fish Using
Solar Tunnel Dryer. Drying Technology 19 (2). 427-436.
Balboa E.N.; Conde, E.; Moure, A.; Falque, E and Domingguez H (2013).In vitro antioxidant
properties of crude extracts and compounds from brown algae. Food Chemistry 138:1764-1785.
Balogun A.M (1988). Effect of sun drying on the proximate composition and lipid characteristics
of two freshwater clupeids. Food Chemistry 27 Issue 1:1-11.
Barbosa, F. F., E. C. Melo, R. H. S. Santos, R. P. da Rocha, A. P. Martinazzo, L. L. Radünz, L.
M. N. Gracia (2007). “Evaluation of mathematical models for prediction of thin-layer drying of
Brazilian lemon-scented verbena leaves (lippia alba (mill) n.e. brown)”. Revista Brasileira de
Produtos Agroindustriais, Campina Grande 9(1), 73-82.
Barber, AA. And Bernheim F (1967). In advances in Gerontological Research. Vol 2. Strehler BL
Ed. Academic Press NY p355
Battacharya, A.B.; Sajilata, M.G and Singhal, R.S (2008). Lipid profiles of foods fried in thermally
polymerized palm oil. Food Chemistry 109: 808-812.
Bhaske, K.; Pavankumar, S.A,; Shareef, M.M.; Ramamohan, Y and Shetty, T (2002).
Dinitrophenolderivatization of proteolytic products and its application in the assay of protease(s)
activity. Journal of Neuroscience methods 120 (2):155-161.

183
Binsi, P.K.; Shamasundar, B.A and Dileep, A, O (2007) Physico-chemical and Functional
Properties of Proteins from Green Mussel (Perna viridis) during ice storage. Journal of Science of
Food and Agriculture 87:245–254.
Bligh, E.G and Dyer, W.J (1959). A rapid method of total lipid extraction and purification.
Canadian Journal of Biochemistry and Physiology 37:911-917.
Blunt, J.W, Copp, B.R.; Keyzers, R.A.; Munro, M.H.G and Princep, M.R (2013).Marine Natural
Products. Natural Products Reports. 29:144-222.
Bolton J. J.; Oyieke H.A and Gwada P (2007). The seaweeds of Kenya: Checklist, History of
Seaweed Study, Coastal Environment, and Analysis of Seaweed Diversity and Biogeography.
South African Journal of Botany 73 (2007) 76–88.
Boran, G.; Karacam, H and Boran, M (2006). Changes in the quality of fish oils due to storage
temperature and time. Food Chemistry 98: 693-698.
Borderías J.A and Sánchez-Alonso I (2011). First Processing Steps and the Quality of Wild and
Farmed Fish. Journal of Food Science Vol 7 No.1 R1-5
Brugay, S., O. Anibal, J.O. Olokor, S.I. Ovie, B.M.B. Ladu, A. KK. Bakala and E. Bagamboula,
(2003). “Fish drying: An Adaptable Technology”. http: //www. sflp.org/eng
Bykowski, P.; Dutkiewicz, D (1996). Freshwater fish processing and equipment in small plants.
FAO Fisheries Circular. No. 905. Rome, FAO. 1996. 59p.
CAC (Codex Alimentarius Commission) (2012): Code of practice for fish and fishery products.
2nd ed. Food and Agriculture Organization / World Health Organization, Rome, Italy, 242 pp.
Careche, M.; Herrero, A.M.; Rodrìguez-Casado, A.; Del Mazo, M.L and Carmona, P (1999).
Structural changes of Hake (Merlucciusmerluccius L) fillets: Effects of freezing and frozen
storage. Journal of Agricultural and Food Chemistry 47 (3):952-959.
Castro P.; Padron P.C.J; Cansino CCM. Velazquez, S.E and De Larriva RM (2006). Total Volatile
Base Nitrogen and its use to assess freshness in European seabass stored in ice. Food Control
17:245-248.
Chavan, B.R, Yakupitiyage A, Kumar S and Rakshit SK (2008). Experimental Investigation on
Biochemical, Microbioal and Sensory Properties of Mackerel (Rastrilliger kangurta) dried by
solar-biomass hybrid cabinet dryer. Journal of Food Agriculture and Environment Vol 6 (3&4):
167-171.

184
Chan, EWC.; Lim Y.Y.; Wong,.S.K; Lim, K.K..; Tan, S.P; Lianto F.S and Yong M.Y (2009).
Effects of different drying methods on the antioxidant properties of leaves and tea of ginger
species. Food Chemistry 113: 166-172.
Cho SY.; Endo Y and Fujimoto K (1989). Oxidative Deteriorationof Lipids in Salted and Dried
Sardine during Storage at 5°C. Nippon Suisan Gakkaishi 55 (3) 541-544.
Codex (Codex Alimentarius Commission). (1977). Draft Code of Practice for Shrimps or Prawns.
(Document CX/FFP7/7). FAO, Rome.
Codex Committee on Food Hygiene (1993): Codex guidelines for the application of the hazard
analysis critical control point (HACCP) system: adopted by the 20th session of the joint
FAO/WHO Codex Alimentarius Commission. Food Control, 5, 210-213.
Codex Committee on Food Hygiene (2009): Recommended international code of practice- general
principles of food hygiene. In Food Hygiene Basic Texts. Fourth Edition, Food and Agriculture
Organisation of the United Nations, World Health Organization and Food and Agriculture
Organization of the United Nations, Rome, Italy, pp. 3-34.
Coppes-petricorena, Z. (2010). Texture measurements in fish and fish products In Alasalvar, C.,
Miyashita, K., Shahidi, F. & Wanasundara, U. (eds) Handbook of Seafood Quality, Safety and
Health Applications, pp. 576: Wiley-Blackwell, UK
Craft, B.D.; Kerrihard, A.L.; Amarowicz, R and Pegg, R.B (2012). Phenol based antioxidants and
the in vitro methods used for their assessment. Comprehensive reviews in Food Science and Food
Safety. 11:148-173.
Curran, C.A. and Trim, D.S. (1982). FAO Fisheries Technical Report No. 268. pp 146-157.
Dalgaard P, Madsen HL, Samieian N, Emborg J (2006) Biogenic amine formation and microbial
spoilage in chilled garfish (Belone belone)—effect of modified atmosphere packaging and
previous frozen storage. J Appl Microbiol 101(1):80–95.
Davies, M.J and Dean, R.T (1997). Radical-mediated protein oxidation. New York: Oxford
University Press Inc.
Dandelot S.; Robles, C, Pech, N.; Cazaubon, A and Veriaque, R (2008). Allelopathic potential of
two invasive alien Ludwiga spp. Aquatic botany 88: 311-316.

185
Decker, E. A.; Livisay, S. A.; Zhou, S (2000). Mechanisms of endogenous skeletal muscle
antioxidants: Chemical and physical aspects. In Antioxidants in Muscle Foods; Decker, E. A.,
Faustman, C., Lopez-Bote, C. J., Eds.; Wiley-Interscience, John Wiley & Sons: New York, 2000;
pp 25-60.
Decker, E.A. (1998). Strategies for Manipulating the Prooxidative/Antioxidative balance of foods
to maximize oxidative stability. Trends in Food Science and Technology, 231: 495-498.
Defra 2010. www Defra.govt.uk/food-farm/food). Accessed on 19th December 2011.
De Koning, A.J and Mol, T.H. (1991). Quanitatiove quality tests for frozen fish. Soluble protein
and free fatty acid content as quality criteria for hake (Merluccuscapensis) stored at -18oC. Journal
of the Science of Food and Agriculture. 54 (3)449-458.
Deng, Y,; Luo Y.; Wang Y.; Yue, J.; Liu z.; Zhong Y (2014). Drying induced protein and
microstructure damage of squid fillets affected moisture distribution and rehydration ability during
rehydration. Journal of Food Engineering 123: 23-31.
Doe, P.E.; Ahmed, M.; Muslemuddin, M.; and Sachithanthan, K. (1977). A Polythene Tent Dryer
for Improved Sun-drying of Fish. Food Technology In Australia. Nov. pp. 437-441.
Dhaouadi, A.; Monser, L.; Sadok, S and Adhoum N (2006). Validation of a flow-injection gas
diffusion method for total volatile basic nitrogen determination in seafood products. Food
Chemistry 103:1049-1053.
Damodaran, S 2008. Amino acids, peptides and proteins. Chapter 5 In Fennema’s Food Chemistry.
Edited by S. Damodaran, KL Parkin and OR Fennema. Fourth Edition. CRC Press, Boca Raton,
USA.
Dorbaganes, C. and Màrquez-Ruiz (2003). Oxidized fats infoods. Current Opinion in Clinical
Nutrition and Metabolic Care 6 (2) 157-163.
Ellman, G.L. (1959). Tissue Sulfydryl groups. Archives of Biochemistry and Biophysics. 82:70-
77.
El-Deen, G and El-Shamery MR (2010). Egypt Academy Journal of Biological Scences. Studies
on contamination and quality of fresh fish meats during storage. 2(2) 65-74.
Elepano A.R.; Satairapan, K.T (2001). A solar-Biomass Dryer for Pineapple. 51stPhillipine Society
of Agricultural Engineers National Convention. Cebu Plaza Hotel, Cebu City, 23rd to 27th April,
2001.

186
Erkan, N (2016). The Effect of Active and Vacuum Packaging on the Quality of Turkish
Traditional Salted Dried Fish “Çiroz”. Journal of Food and Health Science. Turkey.
El-Shiatry, M.A; Mǘller, J.; Mǘhlbauer, W. 1991. Drying Fruits and Vegetables With Solar Energy
in Egypt.Agricultural Mechanization in Asia, Africa and Latin America. (22) 2 pp. 61-64
Endo, Y.; Li Mo C.; Tagiri-Endo, M and Fujimoto, K (2003). A modified method for the estimation
of total carbonyl compounds in heated and frying oils using 1-Butanol as a solvent. Journal of Oleo
Science Vol. 52 No. 7: 353-358.
Ericksson, C.E.; Lundgren B.; Vallentin K (1976). Chemical Senses Flavour 2: 3.
Esterbauer, H. (1982). Aldehydic products of lipid peroxidation. In: Free Radicals, Lipid
peroxidation and cancer. McBrien, D.C.H, and Slater P.F. (Eds). pp 101-128. Academic Press
London.
Esterbauer, H., Zollner, H.&Schaur, R. J. (1990). Aldehydes formed by lipid peroxidation:
Mechanisms of formation, occurrence and determination. In C.Vigo (Ed.), Lipid oxidation (pp.
239–283). Boca Raton: CRC Press.
Esturk O and Park JW (2014). Comparative study on degradation, aggregation and rhrological
properties of actomyosin from Cold, temperate and warm water fish species. Turkish Journal of
fisheries and Aquatic Sciences 14: 67-75.
EC Regulation 852/2004: Regulation (EC) No 852/2004 of the European Parliament and of the
Council of 29 April 2004 on the hygiene of foodstuff. Official Journal of the European Union L
139/1 and L 226/3.
Eymard, S.; Baron, C.P and Jacobsen, C (2009). Oxidation of lipid and protein in horse mackerel
(Trachurustrachrus) mince and washed minces during processing storage. Food Chemistry 114:
57-65.
Eyo, A. A. (2001). Fish processing Technology in the Tropics. Published by National Institute for
Freshwater Fisheries Research (NIFFR), P.M.B. 6006, New Bussa, Niger State. pp: 37-39, 130-
138-153-160-164.
FAO http://www.fao.org/news/story/en/item/20568/icode/ 1.02 billion people hungry One sixth
of humanity undernourished - more than ever before. 19 June 2009, Rome,

187
http://www.fao.org/news/story/en/item/36446/icode/14 January 2011, Rome ¬The first global
guidelines for bycatch management and reduction of fishing discards.
FAO/WHO (Food and Agriculture Organization / World Health Organization). (1976).
Recommended International Code of Practice for Fresh Fish. (Document CAC/RCP 9-1976).
FAD, Rome.
FAO/WHO (Food and Agriculture Organization / World Health Organization). (1978).
FAO 2007. FAO: State of the World's Fisheries: The Food and Agriculture Organization of the
United Nations has released the 2006 State of the World's Fisheries.
International Code of Hygienic Practice for Molluscan Shellfish. (Document CAC/RCP 18-
1978).
FAO (2014): Appropriate Fish Packaging Solutions for Developing Countries.
FAO/WHO, Rome.Fisheries Department Annual Report (2000). Department of Fisheries,
Ministry of Livestock and Fisheries. Kenya.
Farid,FB.; Latifa,G.A.; Mosarrat, N.N and Mohajira, B (2014). Effect of Sun-drying on Proximate
Composition and pH of Shoal fish (C. striatus; Bloch, 1801) treated with Salt and Salt-turmeric
Storage at Room Temperature (270 - 300C).
FDA (2001): Pathogen growth & toxin formation as a result of inadequate drying. Ch. 14. In Fish
and Fishery Products Hazards and Controls Guidance, 3rd Ed. p. 191-200. Food and Drug
Administration, Center for Food Safety and Applied Nutrition, Office of Seafood, Washington,
DC.
Fisheries frame survey report (2016). A survey of the Kenyan Marine Waters. State Department
of Fisheries and Blue Economy.
Fisheries. Stroud Series, FAO Fisheries Technical Paper - T340, 143 p.
Frost, R (2005): ISO 22000 is the first in family of food safety management system standards. ISO
Management Systems, November-December, 16-19. http://www.iso.org/iso/iso-
22000_food_safety.pdf.
Froese, R. and D. Pauly. Editors. (2004). FishBase. World Wide Web electronic publication.
www.fishbase.org

188
Frankel, E.N. (2005). Lipid Oxidation. Bridgewater, England. The Oily Press
Ghaly A.E.; Dave D.; Budge S and Brooks M.S. (2001). Fish spoilage mechanisms and
preservation techniques-A Review. American Journal of Applied Sciences 7(7) 859-877.
Gopal, T. K. S., Joseph, J and Balachandran, K. K. (1999). Development of fish products
employing hurdle technology. In Preservation of food by hurdle technology (pp. 93–103). Mysore:
DFRL.
Gerrard, A. J., & Brown, K. P. (2002). Protein cross-linking in food: Mechanisms, consequences,
applications. International Congress Series, 1245, 211–215.
Gimènez, B.; Gómez-Guillén, M.C.; Pérez-Mateos, M.; Monter, P.and Màrquez-Ruiz, G (2011).
Evaluation of Lipid Oxidation in Horse Mackerel Patties Covered with Borage-Containing Film
during Frozen Storage. Food Chemistry 124 1393- 1403.
Gao L and Bo, L (2004). The study of a specious invasive plant, water hyacinth
(Eichorniacrassipes): Achievements and Challenges. ActaPhytoecologica-Sinica 28 (6):735-752.
T.K. Basu, N.J Temple and M.L. Garg. CAB International, Oxford, UK. pp 43-54.
Gardner, H.W (1979). Lipid Hydroperoxide Reactivity with Proteins and Amino Acids: A Review.
Journal of Agricultural and Food Chemistry. Vol 27, No.2.
Ghaly A.E.; Dave D.; Budge, S and Brooks M.S. (2010). Fish spoilage mechanisms and
preservation techniques. A Review. American Journal of Applied Sciences 7(7) 859-877.
Ghosh S.; Hanumantha Rao M. V.; Satish Kumar, M; Uma Mahesh, V.; Muktha, M. and Zacharia,
P. U. (2014). Carbon footprint of marine fisheries: life cycle analysis from Visakhapatnam. Current
Science Vol 107. No 3: 515-521.
Gines, R., Valdimarsdottir, T., Sveinsdottir, K. & Thorarensen, H. (2004). Effect of rearing
temperature and strain on sensory characteristics, texture, colour and fat in Artic char (Salvelinus
alpinus). Food Quality and Preference, 15, 177–185.
Graivier, N., Pinotti A, Califona A and N. Zaritzky (2006). “Diffusion of sodium chloride in fork
tissue”, Journal of Food Engineering, Vol 77, Issue 4, Dec 2006, pp 910-918, Science Direct,
Elsevier Publishers.

189
Gram, L and Dalgaard, P. 2002. Fish spoilage bacteria-Problems and solutions. Current Opinion
in Biotechnology 13:262–266.
Grillo, C.A, Dulout, F.N (1995). Cytogenetic Evaluation of ButylatedToluene.Mutagenesis. Res.
345:73-78.
Gülcin, I.; Berashvili D and Gepdiremen, A. (2005).Antiradical and antioxidant activity of total
anthocyanins from Perillapankinensisdecne. Journal of Ethnopharmacology Vol. 101:287-293.
Gunhan, T., V. Demir, E. Havioglu and A. Hepbasli (2005). “Mathematical modelling of drying
of bay leaves”. Energy Conversion and Management 46 (2005) 1667–1679.
Halliwell, B and Gutteridge, J M C (1995). Free radicals in Biology and Medicine, 2nd edition
Clarendon Press, Oxford.
Haque, E.; Kamruzzaman, M.; Islam, S Md.; Sarwar, T.; Rahman, S.S and Karim R Md (2013).
Assessment and comparison of quality of solar tunnel dried Bombay duck and Silver pomfret with
traditional sun dried samples. International Journal of Nutrition and Food Sciences. 2 (4) 187-194.
Harris, E. 1993. Fish Farming in the Lake Basin, Kenya. University of Sussex, Brighton, UK.
Hassini. L. (2006). “Estimation of the moisture diffusion coefficient of potato during hot-air
drying”. Drying Equipment Sub Association, China General Machinery Drying Equipment
Association, Beijing China.
Hermansson, A.M (1979). Aggregation and denaturation involved in gel formation. In A. PourEl
(Ed). Functionality and protein structure. Washington, D.C: American Chemical Society.
Hoberman, H.D. and San George, R.C (1988). Reaction of tobacco smoke aldehydes with
humamhaemoglobin. Journal of Biochemical Toxicology. 3: 105-119.
Horril, C. and Kamau, I. Eds (2001). Proceedings of the East African Marine Ecoregion Visioning
Workshop, 21st -24th April, 2001, Mombasa, Kenya. 86pp
Howell, N.K. and Saeed, S. (1999). The effect of antioxidants on the production of lipid oxidation
products and transfer of free radicals in oxidised lipid-protein systems. In: Antioxidants in Human
Health and Disease. Ed. T.K. Basu, N J Temple and M.L. Garg. CAB International, Oxford, UK.
pp 43-54.

190
Hun, H.J (2005). Innovations in Food Packaging. Elsevier Academic Press. California, USA.
Huss, H.H., Ababouch, L. and Gram, L. (2004): Assessment and management of seafood safety
and quality- FAO Fisheries Technical Paper 444. FAO, Rome, Italy, 230 pp.
Huss, H.H (1998). Fresh Fish: Quality and Quality Changes. FAO, Rome. 132 pp.
Jones, L. and Cooke. L. (1981). A review of the Rabbitfishes. FAMA 10/81.
Jayanthi P and Lalitha P (2012). DPPH Scavenging Asaay of the Solvent Extracts and Fractionates
of Eichhornia crassipes (Mart) Solms. Journal of Pharmarcy Research 5(2)946-948.
Jia, T.; Kelleher, S. D.; Hultin, H. O.; Petillo, D.; Maney, R.; Krzynowek, J (1996). Comparison
of quality loss and changes in the glutathione antioxidant system in stored mackerel and bluefish
muscle. Journal of Agricultural Food Chemistry 44, 1195-1201.
Jinadassa, BKKK (2014). Determination of quality of marine fishes based on total volatike base
nitrogen (TVB-N). Nature and Science 12 (5).
Isabel M.; Jose, M.; Gallardo, M and Aubourg, S. P (2009). Quality Preservation in Chilled and
Frozen Fish Products by Employment of Slurry Ice and Natural Antioxidants. International
Journal of Food Science and Technology 44: 1467–1479.
ICMSF. (1978). Microorganisms in Foods. 1. Their Significance and Methods of Enumeration,
2nd Ed. University of Toronto Press, Toronto.
ISO (International Organization for Standardization). (1981). Microbiology – General Guidance
on Methods for the Detection of Salmonella. International Standard 6579. ISO, Geneva
ISO 14041 (1998).
Jamila P and Ranjitha G (2009). Qualities of commercially and experimentally sun-dried fin fish
Scomberoides tol. African Journal of Food Science 3: 299-302.
Jin Z.H.; Zhuang, Y.Y, Dai, S.G and Li, T.L (2003). Isolation and Identification of extracts of
Eichhorniacrassipes and their allelopathic effects on algae. Bulletin of Environmental
Contamination and Toxicology.
Jittinandana, S., P. B. Kenney, S.D. Slider, Kiser R.A. (2002). “Effect of brine concentration and
brining time on quality of smoked rainbow trout fillets”, Journal of Food Science 67(6) 2095–
2099.

191
Johnsen, P.B. and Kelly, C.A (1990). A technique for the quantitative sensory evaluation of farm-
raised catfish. Journal of Sensory Studies, 4, 189–199.
Loughran M and Diamond D (2000). Monitoring of volatile bases in fish sample headspace using
an acidochromic dye. Food Chemistry. 69: 97-103.
Kawai, T. (1996). Fish flavor. Critical Reviews in Food science and Nutrition. 36: 257-298.
Karel M.; Fennema O and Lund D (1975). Physical Principals of Food Preservation. Marcel
Dekker Publ. 1975.
KMFRI Bulletin 2018: Boost for Seaweed farmers as state roots for increased investment.
Kenya Vision 2030; The Government of Kenya.
Kiessling, A., Espe, M., Ruohonen, K. & Mørkøre, T. (2004). Texture, gaping and colour of fresh
and frozen Atlantic salmon flesh as affected by pre-slaughter iso-eugenol or CO2 anaesthesia.
Aquaculture, 236 (1-4): 645-657.
KMFRI, State of Fisheries Report (2018).
Köse, S and Erdem, M.E. (2001). Quality Changes of Whiting (Merlangius merlangus euxinus, N.
1840) Stored at Ambient and Refrigerated Temperatures. Turkish Journal of Fisheries and Aquatic
Sciences. 1 59-65.
Lefevre F.; Culioli J; Jonadel-Monier S and Ouali, A (199). Muscle polymorphism and gelling
properties of myofibrillar proteins from poultry, mammals and fish. In: Y.L Ziong, CT, Ho F.;
Shahidi (Eds). Quality attributes of Muscle foods. Kluwer Academic/Plenum publishers, New
York 365-391.
Lehninger, A (2008). Principles of Biochemstry. Nelson, DL and Cox MN (Eds). 5th Edition.
Liston, J. (1980). Microbiology in fishery science. In: Advances in Fish Science and Technology.
Ed. JJ Connell, Fishing News Books. Farnham, Surrey, U.K p 138 – 157.
Kingsly R.P, Goyal R.K, Manikantau M.R, and S. M. Ilyas (2007). “Effects of pre-treatments and
drying air temperature on drying behaviour of peach slices”, International Journal of Food Science
and Technology No 42 pp 65-69.

192
Kituu, G. M., C. L. Kanali, D. Shitanda and J. T. Mailutha (2014). “Effect of genetic algorithm
optimised solar tunnel dryer on the quality attributes of dried fish”. In press: Journal of Aquatic
Food Product Technology.
Kromhout, D., Bosschieter, E.B and Coulander, C (1985). The inverse relation between fish
consumption and 20 year mortality from coronary heart disease. New English Journal of Medicine
312, 1205-1209.
Levine, R.L.; Williams, J.A.; Stadtman, E.R. and Shacter, E (1994). Carbonyl assays for
determination of oxidatively modified proteins. Method in Enzymology, 233: 346-357.
Lindsay, R. C (1990).Fish Flavors. Food Review International 6, 437-455. Marsili, R., Ed.
Techniques for Analyzing Food Aroma; Marcel Dekker Inc.: New York, 1997.
Madin, MPE and Macreadie P (2015). Incoperating carbon footprints into seafood sustainability
certification and ecolabels. Marine Policy 57. 178-181.
Magnússon, H. and Martinsdóttir, E (1995). Storage quality of fresh and frozen-thawed fish in ice.
Journal of Food Science, 60(2): 273-278.
Makawa Z.; Kapute F.; Valeta J (2014). Effect of delayed processing on nutrient composition, pH
and organoleptic quality of pond raised Tilapia (Oreochromis shiranus) stored at ambent
temperature. Africa Journal of Food, Agriculture and Nutrition Development. 14. No 3.
Manat C, Soottawat B, Wonnop V, Cameron F (2005) Changes of pigments and color in sardine
(Sardinella gibbosa) and mackerel(Rastrelliger kanagurta) muscle during iced storage. Food
Chem 93(4):607–617 J Food Sci Technol (September 2018) 55(9):3647–3656.
Manju S.; Leema, J.; Srinivasa Gopal T.K.; Rivashanka, CN; Lalitha KV (2007). Effect of Sodium
Acetate Dip Treatment and Vacuum Packaging on Chemical, Microbiological, Textural and
Sensory Changes of Pearls pot (Etropus suratensis) during Chill Storage. Food Chemistry 102. 27-
35.
Màrquez-Ruiz, G.; Jorge, N.; Martin-Polvillo, M and Dobargnes, M.C (1996). Rapid, quantitative
determination of polar compounds in fats and oils by solid-phase extraction and exclusion
chromatography using monoesterin as internal standard. Journal of Chromatography A. 749: 55-
60.

193
Màrquez-Ruiz, G and Dobarganes, M.C. (2005). Analysis of non-volatile oxidation compounds
by high performance size exclusion chromatography. In Analysis of Lipid Oxidation A. Kamal-
Eldin and J. Porkorny (Eds.). pp 40-69. Champaign, IL, USA:American Oil chemists Society.
Martinsdóttir, E., Sveinsdottir, K., Luten, J.B., Schelvis-Smit, R., Hyldig, G. (2001). Reference
manual for the fish sector: sensory evaluation of fish freshness. QIM Eurofish. P.O. Box. 68, 1970
AB IJumiden, The Netherlands.
Matanjun, P.; Mohamed S.; Mustapha N.M.; Muhammad K & Ming CH (2008). Antioxidant
Activities and Phenolics Content of Eight Species of Seaweeds from North Borneo. Journal of
Applied Phycology 20: 367-373.
Martìn-Polvillo, M.; Màrquez-Ruiz, Gand Dobarganes, M.C.(2004). Oxidative stability of
sunflower oils differing in unsaturation degree during long term storage at room temperature.
Journal of American Oil Chemists’ Society 81: 577-583.
Matsukawa, R.; Dubinsky, Z.; Kishimoto, E.; Masaki, K.; Masuda, Y.; Takeuchi.T.; Chihara, M.;
Yamamoto, Y, Niki E and Karube, I (1997). A comparison of screening methods for antioxidant
for antioxidant activity in seaweeds. Journal of Applied Phycology 9: 29-35.
McMeekin, T.A., Hulse, L and Bremner H.A (1982). Spoilage Association of Vacuum-Packed
Sand flathead (Platycephalus bassensis) fillets. Food Australia., 34: 278-282.
Milo, C.; GroschW, (1995). Detection ofodor defects in boiled cod and trout by gas
chromatography olfactometryof headspace samples. Journal of Agricultural Food Chemistry. 43,
459-462.
Milo, C.; Grosch, W. Changes in the odorants of boiled salmon and cod as affected by the
storage of the raw material. Journal of Agricultural Food Chemistry 44, 4, 2366-2371.
Moubayed N.M.S.; Jawad Al Houri, H.; Al Khulaifi M.M and Al Farraj D.A (2017).
Antimicrobial, Antioxidant Properties and Chemical Composition of Seaweeds Collected from
Saudi Arabia (Red Sea and Arabian Gulf). Saudi Journal of Biological Sciences. 24: 162-169.
Mudgal V.D. and V.K. Pande (2007). "Dehydration characteristics of cauliflower". International
Journal of Food Engineering, 3(6).
Mujaffar, S and Sankat, C.K. (2005). The Air Drying Behaviour of Shark Fillets
Canadian Biosystems Engineering Vol. 47. 3.11-3.21.
194
Muhlbauer, W.; Esper, A.; Mǘller,J.; (1993). Solar Energy in Agriculture, ISES Solar World
Congess. Budapest, August 23-27.1913.
Nair, V., Cooper,C. S.,Vietti, D. E., & Turner, G. A.(1986). The chemistry of lipid peroxidation
metabolites: Cross-linking reactions of malondialdehyde. Lipids,21, 10.
NACMCF (National Advisory Committee on Microbiological Criteria for Foods) (1997): Hazard
Analysis and Critical Control Point Principles and Application Guidelines. Journal of Food
Protection, 61, 762-775.
National Seafood HACCP Alliance (2011): Hazard Analysis and Critical Control Point- training
curriculum 5th Edition, Florida Sea Grant, Florida, USA, 240 pp.
Nelson D L. and. Cox M M 2004 Amino Acids, Peptides and Proteins. Chapter 3 In Lehninger
Principles of Biochemistry. Fourth Edition. Publishers WH Freeman & Company.
Newell BS (1959) The hydrography of the East African coastal current. Part II. Fish Publication
London No.12. 18pp.
Nielsen, D and Green D (2007). Developing a Quality Index Grading Tool for Hybrid Striped Bass
(Morone saxatilis - Morone chrysops) based on the Quality Index Method. International Journal
of Food Science and Technology 2007, 42, 86–94
Odoli C.O.; Oduor-Odote, PM.; Ohowa,B and Onyango S.O (2013). Evaluation of Fish Handling
Techniques Employed by Artisanal Fishers on Quality of Lethrinids and Siganids Fish Genera at
Landing Time along the Kenyan Coast using Sensory and Microbiological Methods” Africa
Journal of Food, Agriculture and Nutrition Development. Vol 13 No.5.
Oduor-Odote P.M. (2008a). Drying characteristics and quality changes of Chorinemustol (Pandu)
dried in a solar tunnel dryer and in an improved traditional rack in Gazi area of the South coast of
Kenya. A Technical report. Kenya Marine and Fisheries Research Institute P.O. Box 81651
Mombasa Kenya. Submitted to Lighthouse foundation, Germany.
Oduor-Odote P.M. (2009). Up scaling of Improved Fish Processing by Smoking and Solar Drying
to Shimoni in the Kenyan south coast for Food Security, Poverty Alleviation and Biodiversity
Conservation: STATUS REPORT. Submitted to: The Lighthouse foundation, Germany 17pp.
Oduor-Odote, PM,;Obiero, M.O (2009) Lipid Oxidation and Organoleptic Response During Shelf
Storage of Some Smoked Marine Fish in Kenya. African Journal of Food, Agriculture, Nutrition
and Development, Vol. 9, No. 3, 2009, pp. 885-900.

195
Ogongo, B.O.; Oduor-Odote, P.M.; Mlanda M (2015). Effects of Vacuum-packaging on the
Microbiological, Chemical, Textural and Sensory Changes of the Solar Rack Dried Sardines
During Chill Storage. Bacteriology Journal 5 (1): 25-39, 2015.
Okoko, A.; Reinhard , J.; Wymann von Dach S.; Zah , R; Kiteme, B.; Owuor, S and
Ehrensperger, A (2017) The carbon footprints of alternative value chains for biomass energy for
cooking in Kenya and Tanzania. Sustainable technology enenergies and assessments. 22 : 124-133
Oduor-Odote, PM.; Shitanda D and Obiero, M (2010). Drying characteristics and some quality
attributes of Rastrineobolaargentea (Omena) and Stolephorusdelicatulus (Kimarawali). African
Journal of Food Agriculture and Nutrition Vol 10 No.8.
Ólafsdottir, G., Martinsdóttir, E and Oehlenschläger, J (1997). Methods to evaluate fish freshness
in research and industry. Trendsin Food Science and Technology, 8, 258–265.
Oluwaniyi, O.O .; Dosumu, O.O and Awolola, G.V (2010). Effect of local processing methods
(boiling, frying and roasting) on the amino acid composition of four marine fishes commonly
consumed in Nigeria. Food Chemistry 123: 1000-1006.
Opande, G.O,; Onyango J.C and Wagai S.O (2004). Lake Victoria: The water hyacinth (Eichhornia
crassipes) [MART SOLMS), its socio-economic effects, control measures and resurgence in the
Winam Gulf. Limnologica 34:105-109.
Opstvedt, J.; Miller, R.; Hardy R.W and Spinelli, J (1984). Heat-induced changes in sulfhydryl
groups and disulfide bonds in fish protein and their effect on protein and amino acid digestibility
in rainbow trout (Salmogairneri). Journal of Agricultural Food Chemistry. 32:23-935.
Orban E.; Nevigato, T.; Di Lena G.; Masci, M.; Casini, I.; Caproni, R and Rampacci, M (2011).
Total volatile basic nitrogen and trimethylamine nitrogen levels during ice storage of European
Hake (Merliccius merluccius): A seasonal and size differentiation. Food Chemistry 128: 679-682.
Özogul Y.; Ozyurt G.; Ozogul F.; Kuley, E.; Polat A (2005). Freshness assessment of European
eel Anguilla anguila by sensory, chemical and microbiological methods. Food Chemistry 92: 745-
751.
Parker, RWR and Tyedmers PH (2015): Fuel Consumption of Global Fishing Fleets: Current
understandings and knowledge gaps. Fish Fish 16: 684-696. Doi:10.1111/faf.12087
Pearson’s Chemical Analysis of Foods (1981) Egan H.; Kirk, R.S.; Sawyer, R and Pearson D.
Edinburgh, New York. Churchill Livindtone, 1981.

196
Perera de Abreu, D.A.; Losada, P.P.; Maroto, J and Cruz, J.M. (2011).Lipid damage during storage
of Atlantic halibut (Hippglossushippoglossus) in active packaging film containing antioxidants.
Food Chemistry 126: 315-320.
Petillo, D.; Hultin, H. O.; Krzynowek, J.; Autio, W. R (1998). Kinetics of antioxidant loss in
Mackerel light and dark muscle. Journal of Agricultural Food Chemistry 46, 4128-4137.
Pravakar P.; Mansur A.M.; Asadujjam M (2013). Quality and safety aspects of three sun-dried
marine fish species: Chinese pomfret (Stromateus chinensis), Bombay duck (Harpodon nehereus)
and Ribbonfish (Trichirius haumela). World Journal of Zoology 8(4): 381-387.
Priya D’Souza H and Prabhu H.R (2006). In Vitro Inhibition of Lipid Peroxidation in Fish by
Turmeric (Curcuma Longa). Indian Journal of Clinical Biochemistry. 21 (2) 138-141.
Potter N.N (1968). Food Science. The AVI Publishing Co., Inc. 1968.
Prakash, S.; Jeyasanta,I, Reiba C and Jamila P (2001). Microbial Quality of Salted and Sun-
Dried Sea Foods of Tuticorin Dry Fish Market, Southeast Coast of India. International Journal of
Microbiological Research 2 (2): 188-195.
Quinn, B.P. and Marriott, N.G. (2002): HACCP plan development and assessment: a review.
Journal of Muscle Foods, 13, 313-330.
Rakesh Jadhav, Anil Kumar Anal (2018) Experimental investigation on biochemical, microbial
and sensory properties of Nile tilapia (Oreochromis niloticus) treated with moringa (Moringa
oleifera) leaves powder. Journal of Food Science and technology. 55: (9) 36473656
Rahman M.S.; Al-Belushi R.Q.; Guizani, M.; Al -Saidi G.S and Soussi, B (2009). Fat oxidation in
freeze dried grouper during storage at different temperatures and moisture contents Food
Chemistry 114: 12571264.
Rao, C. C. P.; Basu, P and Prasad, M.M. (1987). Studies on Solar Tent Dryer for Drying Fish.
Seminar on Diversification of Post Harvest Technology in Low Cost Fish. Cochin, 10 –11 March.
Society of Fisheries Technology. India.
Refsgaard, H.H.F.; Haahr, A.M and Jensen. B (1999). Isolation and quantification of volatiles by
dynamic headspace sampling and mass spectrometry. Journal of Agriculture and Food Chemistry
47: 1114-1118.

197
Reza S, Bapary, A.J. and Islam, N. (2009). Optimization of marine fish drying using a solar tunnel
dryer. Journal of Food Processing and Preservation 33, 47-59.
Raghunath, R.M.; Thazhakote, V.S.; Kunhythyil , A and Koodanchery, D (1995). Biochemical
and Nutritional changes in fish proteins during drying. Journal of the Science of food and
agriculture. Vol 67. Issue 2. 197-204.
Regulska-Ilow B and Ilow R (2002). Comparison of the Effects of Microwave Cooking and
Conventional Cooking Methods on the Composition of fatty acids and Fat Quality Indicators in
Herring (2002). Nahrung/Food No.6 383-388.
Reische, D.; Lillard, W.D.A and Eitenmiller, R.R. (1998). Antioxidants. In Food Lipids:
Chemistry, Nutrition and Biotechnology C.C. Akoh and D. Min (Eds.), (pp 423-448): Marcel
Decker, New York.
Robertson, GL (2013). Food Packaging. Principles and Practice. 3rd Edition. CRC Press. Taylor
and Francis Group.
Ruidavets, JB.; V. Bongard.; J.Dallongeville.; D. Arveiler.; P. Ducimetière.; B. Perret.; C. Simon.;
P.Amouyel and J. Ferrieres (2007). High Consumption of Grain, Fish, Dairy Products and
Combinations of these are associated with a Low Prevalence of Metabolic Syndrome. Journal of
Epidiemology and Community Health 61:810-817.
Rodríguez, A.; Trigo, M.; Perez, R.; Cruz, j.M.; Paseiro P and Auborg, S (2009). Czech Journal of
Food Science. Vol. 27. Special Issue S182-S184.
Saeed, S, Gillies, D, Wagner, G and Howell, N. K. (2006). ESR and NMR spectroscopy studies on
formation of dityrosine in emulsions containing oxidised methyl linoleate. Food and Chemical
Toxicology 44, 1385-1392.
Saeed, S and Howell, N.K. (2004). Rheological and differential scanning calorimetry studies on
structural and textural changes in frozen Atlantic mackerel (Scomber scombrus). J Sci. Food Agric. 84,
1216-1222.
Saeed, S., Fawthrop, S.A. and Howell, N.K. (1999). Electron spin resonance (ESR) study on free-radical
transfer in food lipid-protein interaction. J Sci Food Agric. 79, 1809-1816.
Saeed, S and Howell, N.K. (2002). Effect of lipid oxidation and frozen storage on muscle proteins of
Atantic mackerel (Scomber scombrus). J Sci Food Agric. 82, 579-586.

198
Sankat, C.K and Mujaffar, S. (2004). Sun and Solar Cabinet Drying of Salted Shark
Fillets. Proceedings of the 14th International Drying Symposium (105) - 2004. SaoPaulo,
Brazil. 22-25th August Vol. C p 1584-1591.
Sablani, S.S.; Rahman, M.S.; Haffar, I.; Mahgoub, O.; Al-Marzouki, A.S.; Al-Ruzeiqi,
M.H.; Al-Habsi, N.H.; Al-Baloshi, R.H. (2003). Drying Rates and Quality
Parameters of Fish Sardines Processed Using Solar Dryers. Agricultural and Marine
Sciences 8 (2): 79-86.
Sacilik, K., G. Unal (2005). Dehydration characteristics of Kastamonu garlic slices. Biosystems
Engineering 92 (2), 207–215.
Safer,A.M and Al-NughamishA.J (1999).Histology and Histopathology, 14(2), 391–406.
Sahoo M. (2012). “An approach to LabVIEW based temperature and relative humidity monitoring
system”. ACEEE Int. J. on Control System and Instrumentation, 3(2), 42-45.
Sànchez-Alonso, I.; Jimenez Escrig A, Carixto-Saura S and Borderias A (2007). Effect of grape
antioxidant dietry fibre on the prevention of lipid oxidation in minced fish. Evaluation of different
methodologies. Food Chemistry 101: 372-378.
Sànchez-Alonso, I.; Carmona, P and Careche, M (2012). Vibrational spectroscopic analysis of
hake (Merlucciusmerluccius L.) lipids during frozen storage. Food Chemistry 132: 160-167.
Sarkardei, S and Howell, NK. (2007). Effects of natural antioxidants on stored freeze-dried food
product formulated using Horse Mackerel (Trachurus trachurus). IJFST , 43, 309-315.
Sarkardei, S. and Howell, N.K. 2007. The effects of freeze-drying and storage on the FT-Raman
spectra of Atlantic mackerel (Scomberscombrus) and horse mackerel (Trachurustrachurus). Food
Chemistry 103: 62-70.
Scott, W. J (1957). Water relations of food spoilage microorganisms. Water activity and its
estimation in food systems. In Rockland, L. B. and Stewart, G. F. (eds). Water Activity: Influences
on Food Quality. Academic Press, New York, pp.1-61.
Selli, S.; Prost , C.andSerot,T. (2009). Odour-active and Off-flavour components in Rainbow trout
(Oncorhynchusmykiss) extracts obtained by micro-wave assisted distillation-solvent extraction.
Food Chemistry 114 317-322.

199
Sessa, DJ and Rackis JJ (1977). Journal of American Oil Chemical Society 54: 468.
SKAO 2014, CO2-prestation ladder, Generic Handbook, version 2.2).
Shafazila T.S. and Lee, P.T. (2011).Inhibition of Lipid Peroxidation by Extract and Fractions of
Dendrobium Sonia “Red Bom”.2nd International Conference on Biotechnology and Food Science.
IPCBEE Vo. 7: 10-22.
Shahidi, F (1998). Food flavours: Formation, Analysis and Packaging influences. Amsterdam:
Elsevier.
Shahidi, F and Miraliakkbari, H (2004). Omega -3 (n-3) fatty acids in health and disease: Part 1-
Cardiovascular disease and cancer. Journal of Medicinal Food, 7. 387-401.
Shallam, KI.; Ahmed AM,; Elgazaar M.M and Elday E.A (2007). Chemical quality and sesory
attributes of marinated Pacific saury (Collabis saira) during vacuum packaged storage at 4oC. Food
Chemistry 102: 1061-1070.
Shanab S.M.M and Shalaby E.A (2012).Biological activities and anticorrosion efficiency of water
hyacinth (Eichhorniacarissepes). Journal of Medicinal Plants research Vol.6 (23) 3950-3962.
Shewan, J.M. (1977). The bacteriology of fresh and spoiling fish and the biochemical changes
induced by bacterial action. In Proceedings of the Conference on the Handling, Processing and
Marketing of Tropical Fish, 51-66. Tropical Products Institute, London.
Simopoulos, A (1997). Nutritional aspects of fish. In: Seafood from Producer to Consumer,
Integrated approach to quality (Edited by J. Luten, T. Börenssen and J. Oehlenshläger). Publ
Elsevier Science. London, UK. pp 589-607
Shekelle, R. B., Missel, L and Oglesby, P. (1985) Fish Consumption and Mortality from
Cardiovascular Disease. New English Journal of Medicine.313: 820-22.
Shitanda, D.; Oduor-Odote, P.M.; Mukolwe M (2008). Sand base solar tunnel dryer for drying
fish- An operational manual. Booklet.
Skipness D,; Plancken I,; Leoy VA.; Hendrickx, M.E (2007). Kinetics of heat denaturation of
protein from farmed Atlantic Cod (Gardus morhua). Journal of Food Engineering 85: 51-58.

200
Sohn, J.H.; Taki, Y.; Ushio, H.; Kohata,T.; Shioya, IandOshima, T (2005). Lipid Oxidations in
Ordinary and dark Muscles of Fish: Influences of Rancid Off-odour Development and colour
darkening of yellowtail flesh during ice storage. Journal of Food Science, 70 490-496.
Sperber W.H. (1998): Future developments in food safety and HACCP. Food Control, 9, 129-130.
Sperber W.H. (2005): HACCP does not work from farm to table. Food Control, 16, 511-514.
Sanchez-Alonso, I.; Jimenez-Escrig, A,; Saura-Calixto, F.; Borderıas, A.J (2007). Effect of
grape antioxidant dietary fibre on the prevention of lipid oxidation in minced fish: Evaluation by
different methodologies. Food Chemistry 101: 372-378
Stansby M.E. (1982). Properties of fish oils and their application to handling of fish and nutitional
and industrial use. In Chemistry and biochemistry of marine food products R.E. Martin, G.J. Flick,
C.E. Hebard and D.R. Ward (Eds.), pp 75-92. Westport, Conn:Avi Publishing Co.
Stankovich, I. ( 2004). Chemical and Technical Assessment (CTA).61st JECFA Meeting.FAO and
WHO. Rome 10th to 19th June 2003 p 1-8.
Stewart, J.C (1980). Colorimetric determination of phospholipids with ammonium
ferrothiocynate. Analytical Biochemistry, 104: 10-14.
Stone, AP and Stanley DW (1992). Mechanisms of fish muscle gelation. Food Research
International, 25: 381-388.
Sumner, J., Ross, T. and Ababouch, L. (2004): Application of risk assessment in the fish industry.
FAO, Rome, Italy, 77 pp.
Surendraraj, A,.; Sabeena, F and Anandan, R (2013). Antioxidant potential of water hyacinth
(Eichornia crassipes): In vitro antioxidant activity and phenolic composition. Journal of Aquatic
Food Product Technology Vol 22. Issue 1: 11-26.
Sveinsdottir K, Hyldig G, Martinsdottir E, Jorgensen B, Kristbergsson K (2003). Quality Index
Method (QIM) scheme developed for farmed Atlandic salmon (Salmo salar). Food Quality and
Preference. 14: 237-245.
Smith, J. G. M., Hardy, R., Thomson, A. B., Young, K.W. and Parsons E.(1980). Some
observations on the ambient and chill storage of blue whiting (Micromesistius poutassou). J.J.
Connell (Ed.), Advances in Fish Science and Technology, Fishing News Books Ltd., England,
299-302.

201
SSMO (SDS 357). Aerobic plate count (APC) for fresh or frozen fish and its products. Fishing
Products and Seafood’s. Sudanese Standards and Metrology Organization.
Susanto,E.; Augustini, W.T.; Ritanto, P.E.; Dewi, N.E and Saswati F (2011). Changes in oxidation
and reduction potential (Eh) and pH of tropical fish during storage. Journal of coastal development.
Vol 14 No.3. 223-234.
Røra AMB, Morkore T, Einen R. 2001. Primary processing (evisceration and filleting). In:
Kestin SC, Warriss PD, editors. Farmed fish quality. Oxford, England: Fishing News Book.
Blackwell Science Ltd. p 249–60.
Taheri S and Motallebi A.A (2012). Influence of Vacuum Packaging and Long-Term Storage on
Some Quality Parameters of Cobia (Rachycentron canadum) Fillets During Frozen Storage.
American-Eurasian Journal of Agricultural and Environmental Sciences 12 (4): 541-547.
Thorarinsdottir, KA.; Arason, S.; Geirsdottir, M.; Bogason, SG.; Kristbergson, K (2002). Changes
in myofibrillar protein during processing of salted cod (Gardus mohua) as determined by
electrophoresis and differential scanning calorimetry. Food chemistry 77. 377-385.
Tironi, VA.; Mabel CT and Anon, MC (2010). Quality loss during the frozen storage of sea salmon
(Pseudopercis semifassciata). Effect of Rosemary (Rosmarinus officialis L.) extract. Food Science
and Technology 43: 263-272.
Torry advisory note No.92 (2001): “Non sensory assessment of fish quality”
Unlüsayin, M.; Kaleli, S and Gulyavuz, H (2001).The determination of flesh productivity and
protein components of some fish species after hot smoking. Journal of the Science of Food and
Agriculture 81: 661-664.
Uluko H , C.L Kanali, J.T Mailutha and D. Shitanda (2006). “A finite element model for the
analysis of temperature and moisture distribution in a solar grain dryer” The Kenya Journal Of
Mechanical Engineering, 2(2): 47-56’.
USDA (US Department of Agriculture, Food Safety and Inspection Service) (1996): 9 CFR
Pathogen reduction; hazard analysis and critical control point (HACCP) systems: final rule.
Vasić Miloš, Željko Grbavčić and Zagorka Radojević (2012). “Methods of determination for
effective diffusion coefficient during convective drying of clay products”. Clay Minerals in Nature
– Their Characterization, Modification and Application. InTech Open Science.

202
Verma, J.K.; Srikar, L.N.; Sudhakara, N.S and Sarma, J. (1995). Effects of frozen storage on lipid
freshness parameters and some functional properties of oil sardine (Sardinellalongiceps) mince.
Food Research International, Vol. 28 No.1 87-90.
Viji, P.; Tanuja S.; Ninan G.; Lalitha, K.V,; Zynudheen, A.A.; Binsi, P.K and Srinivasagopal,
T.K (2015). Biochemical, Textural, Microbiological and Sensory Attributes of Gutted and
Ungutted Sutchi Catfish (Pangasianodon hypophthalmus) stored in ice. Journal of Food Science
and Technology. 52(6):3312–3321.
Wakibia J.G.; Ochiewo J and Bolton J.J. (2011). Economic Analysis of Eucheumoid Algae
Farming in Kenya. Western Indian Ocean Journal of Marine Sciences. Vol. 10, No. 1, pp. 13-24.
Wambiji N, Ohtomi J, Fulanda B, Kimani E, Kalundu N and Hossain MY (2008) Morphometric
Relationship and Condition Factor of Three Siganid Fishes; Siganus stellatus (Forsskål, 1775), S.
canaliculatus (Park, 1797) and S. sutor (Valenciennes, 1835) in Southern Coast of Kenya. South
Pacific Studies 29, (1): 33-46.
White P.J (1995). Methods to assess quality and stability of oils and fat containing foods (Katheen
Warner and N.A. Michael Eskin) AOCS Publishing 1995 ISBN:978-0-935315-58-5.
Wolf, W., Spiess, W. E. L., Jung, G., Weisser, H., Bizot, H. and Duckworth, R.B. 1984. The water
sorption isotherms of bacteria growth. Results of collaborative study. Journal of Food Engineering
3:51–73.
Wu, T and Mao, L. (2008). Influences of hot air drying and microwave drying on nutritional and
odorous properties of grass carp (Ctenopharyngodonidellus). Food Chemistry 110: 647-653.
www.intechopen.com Phytochemicals as Nutraceuticals. Global Approaches to Their Role in
Nutrition and Health.
Xiong, Y.L (2000). Protein oxidation and implications for muscle food quality. In E. Decker, C.
Faustman and C.J. Lopez-Bote (Eds). Antioxidants in Muscle foods (pp 85-112). New York: John
Wiley and Sons, Inc.
Yamanaka HK.; Shimakura, K. Kiomi, Kikuchi T (1986). Changes in non-volatile Amine content
of the meat of Sardine and Saury Pike during storage. Nippon Suisan Gaakkaishi 52: 127-130.

203
Yarnpakdee, S.; Benjajul S.; Nalinanon S and Kristinsson H.G. (2012). Lipid Oxidation and Fishy
Odour Development in Protein Hydrolysate from Tilapia (Oreochromisniloticus) muscle as
affected by freshness and antioxidants. Food Chemistry 132 1781-1788.
Yongsawatdigul, J and Park, J.W. (2003). Thermal denaturation of threadfin bream actomysin.
Food Chemistry 83: 409-416.
Iyer, T.S.G., Damle, S.P., Garg, D.K., Nambiar, V.N. and Vasu, N.M. 1986. Quality of fish in
retail markets of Bombay. Fishery Technology 13: 78-83.
Zahid, M.A., Akhter, N., Jahan,N.; Azam, M.N.K. and Naharj N (2011). A Comparative Study
on Quality Assessment of Traditional and Conventional Dried Fishes of Chapila (Gudusia
Chapra) and Punti (Puntius Sarana) Innovations and Development Strategy 5(3):47-56.
Zakaria A.N.; Ibrahim, D.; Sulaiman, S.F and Supardy A.N (2011).Assessment of antioxidant
activity, total phenolic content and in vitro toxicity of Malaysian red seaweed,
Acanthophoraspicifera.Journal of Chemical and Pharmaceutical research. 3:3:182-191.
Zang, B and Deng S (2012). Quality Assessment of Scomber japonicus during different
Temperature Storage: Biochemical, textural and volatile flavor properties. International
conference on artificial intelligence and soft computing. Lect Notes Inf Technol 1:1155–1161.
Zugarramurdi, Aurora, María A. Parin & Hector M. Lupín. 1995. Economic engineering applied
to the fishery industry. FAO Fisheries Technical Fisheries Paper 351. Rome, Italy, Food and
Agriculture Organization of the United Nations.
Zugarramurdi, A., Parin, M. A., Gadaleta L., Carrizo G., & Lupin, H. M. (2004). The effect of
improving raw material quality on product quality and operating costs: a comparative study for
lean and fatty fish. Journal of Food Control 15:503–509.
Zugarramurdi, A., Parin, M. A., Gadaleta L., & Lupin, H. M. (2007). A quality cost model for food
processing plants. Journal of Food Engineering 83:414–421.
Zuta, P.C.; Simpson, B.K.; Zhao, X and Leclerc, L (2007) The effect of α-tocopherol on the
oxidation of mackerel oil. Food Chemistry 100 (800-807).

204
10.0 PUBLICATIONS AND PATENT REGISTRATION
1. Odote, P. M. O.; G. M. Kituu.; M. Obiero.; R.Ruwa and N.K.Howell (2015). “Performance
evaluation of hybrid thin layer solar tunnel-windmill dryer in the drying of brined and non-brined
Tafi (Siganus sutor) Fish. AgreInt. CGIR Vol. 17 No. 1. Pp 273-283
2. Oduor-Odote Peter; Shamasundar A.; Booman AC.; Howell NK.; Nunes M and Zagarramurdi
A (2016): Effect of Raw Material Quality on Quality and Yield of Dried Fish Products.
International Journal of Food Processing Technology 3: 54-61
3. “Hybrid windmill-solar-tunnel dryer” by Oduor-Odote Peter Michael, Douglas Shitanda &
Gareth Kituu. Category: Utility Model.NUMBER 152. Ref: KE/U/2016/660

205
11.0 ANNEXES
Annex 1: Reference for Carbon footprint was collected from literature used in Tables 6.1 and 6.2
(from SKAO 2014, CO2-prestation ladder, Generic Handbook, version 2.2)
Activity Activity specification Activity details Value Unit
Energy
carriers
Other than transport class
A
Gasoline / Petrol 2.78 kg CO2 Eq / liter
Energy
carriers
Other than transport class
A
Diesel 3.135 kg CO2 Eq / liter
Energy
carriers
Other than transport class
A
LPG 1.86 kg CO2 Eq / liter
Energy
carriers
Other than transport class
A
Fuel oil 3.185 kg CO2 Eq / liter
Energy
carriers
Other than transport class
A
Bio-ethanol 1.6 kg CO2 Eq / liter
Energy
carriers
Other than transport class
B
Crude oil 3.735 kg CO2 Eq / kg
Energy
carriers
Other than transport class
B
Orimulsion 2.61 kg CO2 Eq / kg
Energy
carriers
Other than transport class
B
Earth gas condensate 3.4 kg CO2 Eq / kg
Energy
carriers
Other than transport class
B
Petroleum 3.71 kg CO2 Eq / kg
Energy
carriers
Other than transport class
B
Ethane 3.425 kg CO2 Eq / kg
Energy
carriers
Other than transport class
B
Nafta's 3.85 kg CO2 Eq / kg
Energy
carriers
Other than transport class
B
Bitumen 3.975 kg CO2 Eq / kg
Energy
carriers
Other than transport class
B
Lubrication oils 3.62 kg CO2 Eq / kg
Energy
carriers
Other than transport class
B
Petroleum cokes 4.05 kg CO2 Eq / kg
Energy
carriers
Other than transport class
B
Refinary raw material 3.92 kg CO2 Eq / kg
Energy
carriers
Other than transport class
B
Refinary gas 3.655 kg CO2 Eq / kg
Energy
carriers
Other than transport class
B
Chemical residual gas 3.655 kg CO2 Eq / kg
Energy
carriers
Other than transport class
B
Other oils 3.515 kg CO2 Eq / kg
Energy
carriers
Other than transport class
B
Peet 1.19 kg CO2 Eq / kg
Energy
carriers
Other than transport class
B
Charcoal brikets 2.315 kg CO2 Eq / kg
Energy
carriers
Other than transport class
C
Earth gas condensate 1.825 kg CO2 Eq / kg
Energy
carriers
Other than transport class
C
Biogas 0.4 kg CO2 / Nm3 unit
Energy
carriers
Other than transport class
C
Biogas (co-fermentation-
mais-fertilizer)
1.3 kg CO2 / Nm3 unit
Energy
carriers
Other than transport class
C
Methane 2 kg CO2 / Nm3 unit

206
Energy
carriers
Other than transport class
C
Propane 1.53 kg CO2 / Nm3 unit
Energy
carriers
Electric energy Coal – Power central 0.82 kg CO2Eq / kWh
Energy
carriers
Electric energy Biomass – cofiring with
coal
0.74 kg CO2Eq / kWh
Energy
carriers
Electric energy Gas – combined cycle 0.49 kg CO2Eq / kWh
Energy
carriers
Electric energy Biomass – dedicated 0.23 kg CO2Eq / kWh
Energy
carriers
Electric energy Solar PV – utility scale 0.048 kg CO2Eq / kWh
Energy
carriers
Electric energy Solar PV – rooftop 0.041 kg CO2Eq / kWh
Energy
carriers
Electric energy Geothermal 0.038 kg CO2Eq / kWh
Energy
carriers
Electric energy Solar power concentrated 0.027 kg CO2Eq / kWh
Energy
carriers
Electric energy Hydropower 0.024 kg CO2Eq / kWh
Energy
carriers
Electric energy Wind offshore 0.012 kg CO2Eq / kWh
Energy
carriers
Electric energy Nuclear 0.012 kg CO2Eq / kWh
Energy
carriers
Electric energy Wind onshore 0.011 kg CO2Eq / kWh
Energy
carriers
Electric energy Average supply 0.455 kg CO2Eq / kWh
Energy
carriers
Heat delivery Steam and gas central 11.3 kg CO2/GJ
Energy
carriers
Heat delivery Coal central 18.5 kg CO2/GJ
Energy
carriers
Heat delivery AV / others 20 kg CO2/GJ
Energy
carriers
Heat delivery Gas engine WKK 70.3 kg CO2/GJ
Energy
carriers
Heat delivery Geothermic 3 kg CO2/GJ
Transport Transport class A Gasoline / Petrol 2.78 kg CO2 Eq / liter
Transport Transport class A Diesel 3.135 kg CO2 Eq / liter
Transport Transport class A LPG 1.86 kg CO2 Eq / liter
Transport Transport class A Fuel oil 3.185 kg CO2 Eq / liter
Transport Transport class A Bio-ethanol 1.6 kg CO2 Eq / liter
Transport Transport Class B Delivery truck 0.63 kg CO2Eq/tonkm
Transport Transport Class B Truck 3.5 - 10 ton 0.48 kg CO2Eq/tonkm
Transport Transport Class B Truck 10 - 20 ton 0.3 kg CO2Eq/tonkm
Transport Transport Class B Truck >20 ton 0.13 kg CO2Eq/tonkm
Transport Transport Class B Tractor and trailer 0.095 kg CO2Eq/tonkm
Transport Transport Class B Train elektric 0.02 kg CO2Eq/tonkm
Transport Transport Class B Train diesel 0.025 kg CO2Eq/tonkm
Transport Transport Class B Train combination 0.022 kg CO2Eq/tonkm
Transport Transport Class B River ship 32 TEU 0.065 kg CO2Eq/tonkm

207
Transport Transport Class B River ship 96 TEU 0.075 kg CO2Eq/tonkm
Transport Transport Class B River ship 200 TEU 0.06 kg CO2Eq/tonkm
Transport Transport Class B River ship 470 TEU 0.05 kg CO2Eq/tonkm
Transport Transport Class B Seaship 150 TEU 0.085 kg CO2Eq/tonkm
Transport Transport Class B Seaship 580 TEU 0.045 kg CO2Eq/tonkm
Transport Transport Class B Seaship 4000 TEU 0.023 kg CO2Eq/tonkm
Coulant R22 1.81 kg CO2Eq / kg
Coulant R404a 3.92 kg CO2Eq / kg
Coulant R507 3.985 kg CO2Eq / kg
Coulant R407c 1.775 kg CO2Eq / kg
Coulant R410a 2.09 kg CO2Eq / kg
Coulant R134a 1.43 kg CO2Eq / kg
Annex 2: Environmental CO2 footprint records for solar drying of Siganids in Kipini
Type of data Parameter Choice option or
pre-set value
Value Data type and unit
CO2Eq energy
used for fishing
(IF KNOWN)
If KNOWN from literature
otherwise input Diesel use
0 IF not known 0 CO2eq/kg or another
unit
Is literature available?
N Y/N
Total energy
used for fishing
(IF KNOWN)
If KNOWN otherwise fossil
energy use
0 IF not known 0 MJ/kg or another
unit
Is literature available?
N Y/N
Type of fossil energy used Diesel 3.135 CO2 Eq/l combusted
Type of fossil energy used Petrol 2.78
Fuel use for the
fishing trip
Amount of fuel used for one
fishing trip
12 liters
Type of fisheries Short description type of
fisheries
The snapper fishery
from the north bank.
The handlines used
for fish. This fishery
replaced the Siganid
fishery during the
fishing season
Landings in Kg
Vessel type Indication of vessel type (to be
used in general database)
Motorized Dhows
are used for this
fishery
Number of
motorized vessels
Type of fuel
used
crude oil, diesel,
gasoline/petrol
Petrol is used
Total volume of
fish landed
What is the total volume of
landed mixed fish
Snapper/Siganid 175 kg or tonnes per
landing
Potential
reference
document
What reference document can
be provided for verification?
BMU records None BMU records
Fuel use for fishing to landing
(total catch)
0.07 litre /kg landed
mixed fish

208
Duration of
average fishing
trip
Total duration of the fishing
trip
7hrs number of hrs or
days
Stripping on
board
Is the product stripped on
board?
The products lands
gutted
Y Yes
Is stripping waste discarded on
board? (Y/N)
Y Discarded
Is the product cooled on
board?
Y
How is the product cooled?
Icing
Registration
capacity
How are catches registered (or
what is possible)
Registered by BMU per
catch/per
vessel
Per catch or per
vessel
Is the product filleted on
board?
N N
Are by products (frames, head,
tails) discarded?
N N/A
What is the mass of discarded
by-products (exl. Stripping)
N/A kg or tonnes per
landing What is the Percentage of
discarded by-products (exl.
Stripping)
N/A % Discarded
product (frames)
Landed target
Product species
Name product and mass Siganid 100 Mass or % (per
catch or total fleet)
Landed By-
products whole
fish
Name product and mass
0 Mass (per catch or
total fleet)
Landed By-
product other
Name product and mass
0 Mass (per catch or
total fleet)
Landed Waste
(stripping)
Name product and mass
0 Mass (per catch or
total fleet)
Total landed
catch
Total landed catch (Sum of the
above)
Landed product How is economic value
available?
Indication or
documented
Landed target
Product species
Name product (0 if not used)
100 Economic value
(Currency/kg or
total fleet)
Landed By-
products whole
fish
Name product (0 if not used)
0 Economic value
(Currency/kg or
total fleet)
Landed By-
product other
Name product (0 if not used)
0 Economic value
(Currency/kg or
total fleet)
Landed Waste
(stripping)
Name product (0 if not used)
0 Economic value
(Currency/kg or
total fleet)

209
Annex 3: Environmental CO2 footprint records for Landing Solar Dried Siganids in Kipini
Type of data Parameter Choice option or
pre-set value
Value Data type and unit
Landing procedure What is the landing procedure Manual transport
Short Landing procedure (landing,
sorting, storing) prior to
transport
Landing no sorting
Description
Fuel use landing to
processing, excl.
transport
Calculated based on total fuel
/ processed product
If no data 0. 0 l/kg fish
Volume Landed
mass
Volume Landed mass
700 Kg or tonnes
Used fuel for
landing mass
Used fuel for landing mass If 0 type 0.0001 0.001 liters
Fuel use landing Used fuel for landing mass
1.4E-06 l /kg fish Type of fuel used Diesel 3.135 CO2 Eq /l
Electricity use
landing
Total energy use for landing
0.0000 kWh
Total energy use for landing
0.0E+00 kWh / kg fish
Type of energy used for
landing
Average supply 0.455 CO2 Eq / kWh
Loss at landing stage What is the amount of
spoilage/losses at landing
0 %
What type of losses are there
None Short description
Loss at landing stage Is the waste product used in
another production chain?
No Y/N
Are losses processed, sold or
used?
No Processed, sold or
used
Loss at landing stage Economic value target
products whole fish entering
the facility
Snappers/Siganid
gutted
100 Economic value
(/kg)
Loss at landing stage Economic value losses
product if sold
0 Economic value
(/kg)
Annex 4: Environmental footprint records for CO2 for transport fish to the solar Dryer in Kipini
Type of data Parameter Choice option or
pre-set value
Value Data type and unit
Transport landing
to processing
Transport distance landing to
processing
Processed in Kipini 0 km
Is this an average distance or
specific example?
average average, most or
specific example What is the average distance?
0 km
Fuel used for transport Truck 3.5 - 10 ton 0.00048 kg CO2 Eq / kmkg
Transport method What is the transport
method(Lorry/car/foot/motor)
None Specify
Chilled Is the product chilled during
this stage?
Ice Specify

210
Frozen Is the product frozen during
this stage
0
Average time
prior to processing
How long is the product stored
prior to transport
1 Days in cooler
Type of cooling
system
What type of cooling system is
used
Ice box Specify
Any other
transport issues
Describe if expected
relevant How much more energy is
consumed for freezing, cooling
0 % extra fuel
consumption

211
Annex 5: Environmental footprint records for CO2 during solar drying of Siganid fish in Kipini
Type of data Parameter Choice
option or
pre-set
value
Value Data type and unit
CO2Eq energy
use IF
KNOWN
Is the CO2 output of processing
known? Eg. earlier studies
No Yes or No
What is CO2 output of processing?
0 CO2 Eq/kg raw material
Other unit
Total energy
use IF
KNOWN
Is the Energy use of processing
known? Eg. earlier studies
No Yes or No
What is the CO2 output of
processing?
0 kWh/kg raw material
Measurable
size
What is the minimum size or batch
on which electricity data is
available
day Batch, day production,
month production, year
production Is this measured in finished product
or raw material (filet, stripped or
whole)?
raw material Raw material
What is the production volume in
this period?
100 kg
Electricity use How much electricity is used for
this batch, year, or other unit of
production
6.48 kWh per unit of
production (kg)
Type of
electricity is
used
What type of fossil energy source is
used?
Solar PV
– rooftop
0.041 Green, solar, net,
Energy use (if
not electrical)
How much energy is used for this
batch, year, or other unit of
production
0.0648 kWh / kg production
How much own energy is generated
50 % Solar energy on total
energy consumption How much own energy is generated
50 % Wind energy on total
energy consumption
Type of
heating
electricity
What type of electricity is used? Average
supply
0.455 Eg. Diesel generator
Electricity use
per unit
Use of electricity from solar energy
0.0324 kWh / kg production
Electricity use
per unit
Use of electricity from wind energy
0.0324 kWh / kg production
Electricity use
per unit
Use of electricity from fossil
sources
0 kWh / kg production
Fuel use How much fuel is used for this
batch, year, or other unit of
production
0.0 Liters

212
How much fuel is used for this
batch, year, or other unit of
production
0.0 Liters/kg raw material
Type of fuel
used
What type of fuel is used?
Diesel, gasoline/petrol
Use of coolant Amount of coolant total
0.0 Total amount (liters) Volume of produced fish using this
amount
100 Total mass (kg)
How much coolant is used (per
tonne of production).
0.0 l/kg raw material
Type of
coolant
What type of coolant is used?
R22
Loss at
processing
Percentage of loss during
processing
0 % of loss due to spoilage
Type of spoilage?
Deterioratio
n
What type of spoilage is it
(spillage, deterioration)
Loss at
processing
What is done with the spoilage?
Waste Waste/processing
Loss at
processing
Is the waste product used in another
production chain?
No Y / N
Processed
Product
Name product (0 if not used) Name
product
100 Economic value (/kg or
total fleet)
Processed By-
products
Name product (0 if not used) Name
product
10 Economic value (/kg or
total fleet)
Processed By-
product other
Name product (0 if not used) Name
product
10 Economic value (/kg or
total fleet)
Processed
Waste
(stripping)
Name product (0 if not used) Name
product
0 Economic value (/kg or
total fleet)
Annex 6: Environmental footprint records for CO2 for fossil fuel during solar drying of Siganid
fish in Kipini
Type of data Parameter Choice
option or
pre-set
value
Value Data type and unit
CO2Eq energy
use IF
KNOWN
Is the CO2 output of processing
known? Eg. earlier studies
No Yes or No
What is CO2 output of processing?
0 CO2 Eq/kg raw material
Other unit
Total energy
use IF
KNOWN
Is the Energy use of processing
known? Eg. earlier studies
No Yes or No
What is the CO2 output of
processing?
0 kWh/kg raw material

213
Measurable
size
What is the minimum size or batch
on which electricity data is
available
day Batch, day production,
month production, year
production Is this measured in finished product
or raw material (filet, stripped or
whole)?
raw material Raw material
What is the production volume in
this period?
100 kg
Electricity use How much electricity is used for
this batch, year, or other unit of
production
6.48 kWh per unit of
production (kg)
Type of
electricity is
used
What type of fossil energy source is
used?
Solar PV
– rooftop
0.041 Green, solar, net,
Energy use (if
not electrical)
How much energy is used for this
batch, year, or other unit of
production
0.0648 kWh / kg production
How much own energy is generated
0 % Solar energy on total
energy consumption How much own energy is generated
0 % Wind energy on total
energy consumption
Type of
heating
electricity
What type of electricity is used? Average
supply
0.455 Eg. Diesel generator
Electricity use
per unit
Use of electricity from solar energy
0 kWh / kg production
Electricity use
per unit
Use of electricity from wind energy
0 kWh / kg production
Electricity use
per unit
Use of electricity from fossil
sources
0.0648 kWh / kg production
Fuel use How much fuel is used for this
batch, year, or other unit of
production
0.0 Liters
How much fuel is used for this
batch, year, or other unit of
production
0.0 Liters/kg raw material
Type of fuel
used
What type of fuel is used?
Diesel, gasoline/petrol
Use of coolant Amount of coolant total
0.0 Total amount (liters) Volume of produced fish using this
amount
100 Total mass (kg)
How much coolant is used (per
tonne of production).
0.0 l/kg raw material
Type of
coolant
What type of coolant is used?
R22
Loss at
processing
Percentage of loss during
processing
0 % of loss due to spoilage

214
Type of spoilage?
Deterioratio
n
What type of spoilage is it
(spillage, deterioration)
Loss at
processing
What is done with the spoilage?
Waste Waste/processing
Loss at
processing
Is the waste product used in another
production chain?
No Y / N
Processed
Product
Name product (0 if not used) Name
product
100 Economic value (/kg or
total fleet)
Processed By-
products
Name product (0 if not used) Name
product
10 Economic value (/kg or
total fleet)
Processed By-
product other
Name product (0 if not used) Name
product
10 Economic value (/kg or
total fleet)
Processed
Waste
(stripping)
Name product (0 if not used) Name
product
0 Economic value (/kg or
total fleet)
Annex 7: Environmental footprint records for CO2 during filleting of solar dried Siganids in Kipini
Type of data Parameter Choice
option or
pre-set
value
Value Data type and unit
Fillet factor % fillet / fish 60 %
By Product1 What by-product is resulting Frames Product name
By Product1 Volume product (as a percentage of
raw material)
30 Mass % of raw material
By poduct2 What by-product is resulting Skin and
bones
Product name
By poduct2 Volume product (as a percentage of
raw material)
10 Mass % of raw material
Product
characteristics
What % of moisture is in the product
before critical processing step
80 % Water in product
Dried product
characteristics
What % of moisture is in the product
after processing step (e.g. Drying)
10 % Waste in frozen or dried
product
Annex 8: Environmental footprint records CO2 calculations for solar assisted drying in Kipini
Value
choices
Value unit CO2
Eq
/unit
unit CO2 Eq /
kg
CO2Eq
energy use
Fishing IF
KNOWN
If KNOWN
from
literature
otherwise
input Diesel
use
Choose
in
databas
e
0 CO2eq/kg 0 CO2 Eq/kg
fish
0

215
If NOT
KNOWN
use unit->
Fuel use
fishing
Fuel use for
fishing to
landing
0.38 0.069 litre /kg
landed
mixed fish
Fue type
used
Type of
fuel used
Diesel 3.135 CO2 Eq/l
combusted
0.21
Stripping
on board
Y/N Y Yes or No
Ratio
Landed
target
Product
species
Name
product
100 Mass or %
(per catch
or total
fleet)
100.0
0
Landed
By-
products
whole fish
Name
product
0 Mass (per
catch or
total fleet)
0.00
Landed
By-product
other
Name
product
0 Mass (per
catch or
total fleet)
0.00
Landed
Waste
(stripping)
Name
product
0 Mass (per
catch or
total fleet)
0.00
Ratio
Target
product
1.00
Ratio
Landed
target
Product
species
Name
product
100 Economic
value (/kg
or total
fleet)
10000 Calculated
Contributio
n ratio
1.00
Landed
By-
products
whole fish
Name
product
0 Economic
value (/kg
or total
fleet)
0 Calculated
Contributio
n ratio
0.00
Landed
By-product
other
Name
product
0 Economic
value (/kg
or total
fleet)
0 Calculated
Contributio
n ratio
0.00
Landed
Waste
(stripping)
Name
product
0 Economic
value (/kg
or total
fleet)
0 Calculated
Contributio
n ratio
0.00
Total
economic
+mass
10000
Total CO2
footprint
RM
fisheries
0.21 CO2Eq
per kg
target
species

216
Landing
procedure
Landing
procedure
(only
landed and
transported
?)
0
Diesel use
landing to
processing,
excl.
transport
Calculated
based on
total fuel /
landed
product
1.42857E
-06
l/kg fish 3.135 kg CO2 Eq /
liter
4.47857E
-06
Electricity
use landing
Calculated
based on
total energy
/ landed
product
0 kWh/kg
fish
0.455 kg CO2Eq /
kWh
0
Loss at
landingstag
e
Spoilage 0 %
Loss at
landingstag
e
What is
done with
the
spoilage?
None If waste no
calculation
in J35
Loss at
landingstag
e
Is the waste
product
used in
another
production
chain?
No
Total CO2
footprint
landing
without
correction
0.000
Loss at
landingstag
e
Economic
value of
target
species at
this stage
100 Economic
value (/kg)
100
Loss at
landingstag
e
Economic
value of by
product at
this stage
0 Economic
value (/kg)
0
Processing
step
What
process step
is done?
No Total
economic +
mass
100
Total CO2
footprint
at landing
0.00 CO2 Eq /
kg target
species

217
Transport
landing to
processing
0 km
Transport
method
Fuel use for
transport
Truck 3.5
- 10 ton
0.000
5
kg
CO2Eq/kmk
g
0.0000
Energy use
transport
Is cooling,
freezing
applied
during
transport?
Ice Y/N
Energy use
transport
Additional
fuel
consumptio
n does to
cooling,
freezing
0 % extra
fuel
consumptio
n
0
Total
transport
to
processing
0.0000
CO2Eq
energy use
IF
KNOWN
If KNOWN
otherwise
unit
0 CO2 Eq/kg 0 CO2 Eq/kg 0 CO2/kg
processed
product
Total
energy use
IF
KNOWN
If KNOWN
otherwise
unit
0 MJ/kg 0.00
Electricity
use per unit
Use of
electricity
from solar
energy
0.0324 kWh/ kg
production
0.00 CO2 / kg
productio
n
Electricity
use per unit
Use of
electricity
from wind
energy
0.0324 kWh/ kg
production
0.000 CO2 / kg
productio
n
Electricity
use per unit
Use of
electricity
from fossil
sources
0 kWh/ kg
production
0.000 CO2 / kg
productio
n
Fuel use
per unit
Use of fuel
per unit
0.000000
1
l/kg raw
material
0.00 CO2 / kg
productio
n
Coolant
use per unit
Use of
coolant per
unit
0.000001 l/kg raw
material
0.00 CO2 / kg
productio
n

218
Processed
target
product
Name
product
100 Economic
value (/kg)
60 Calculated
Contributio
n ratio
0.94
Processed
By-
product1
Name
product
10 Economic
value (/kg)
3 Calculated
Contributio
n ratio
0.05
Processed
By-product
2
Name
product
10 Economic
value (/kg)
1 Calculated
Contributio
n ratio
0.02
Total
economic
+mass
64
Total
processing
0.00 kg
CO2Eq /
kg
0.22
Annex 9: Environmental footprint records CO2 calculations fuel based drying Kipini Value unit CO2
Eq
/unit
unit CO2 Eq /
kg
Raw
material
CO2Eq
energy use
Fishing IF
KNOWN
If KNOWN
from literature
otherwise input
Diesel use
0 CO2eq/kg 0 CO2 Eq/kg
fish
0
If NOT
KNOWN use
unit->
Fuel use
fishing
Fuel use for
fishing to
landing
0.069 litre /kg
landed
mixed fish
Fue ltype
used
Type of fuel
used
Diesel 3.135 CO2 Eq/l
combusted
0.21
Stripping on
board
Y Yes or No
Ratio
Landed
target
Product
species
Name product 100 Mass or %
(per catch or
total fleet)
100.00
Landed By-
products
whole fish
Name product 0 Mass (per
catch or
total fleet)
0.00
Landed By-
product
other
Name product 0 Mass (per
catch or
total fleet)
0.00

219
Landed
Waste
(stripping)
Name product 0 Mass (per
catch or
total fleet)
0.00
Ratio Target
product
1.00
Ratio
Landed
target
Product
species
Name product 100 Economic
value (/kg or
total fleet)
10000 Calculated
Contribution
ratio
1.00
Landed By-
products
whole fish
Name product 0 Economic
value (/kg or
total fleet)
0 Calculated
Contribution
ratio
0.00
Landed By-
product
other
Name product 0 Economic
value (/kg or
total fleet)
0 Calculated
Contribution
ratio
0.00
Landed
Waste
(stripping)
Name product 0 Economic
value (/kg or
total fleet)
0 Calculated
Contribution
ratio
0.00
Total
economic
+mass
10000
Raw
material
Total CO2
footprint
RM
fisheries
0.21
Landing Landing
procedure
Landing
procedure (only
landed and
transported?)
0
Diesel use
landing to
processing,
excl.
transport
Calculated
based on total
fuel / landed
product
1.42857E-
06
l/kg fish 3.135 kg CO2 Eq /
liter
4.47857E-
06
Electricity
use landing
Calculated
based on total
energy / landed
product
0 kWh/kg fish 0.455 kg CO2Eq /
kWh
0
Loss at
landingstag
e
Spoilage 0 %
Loss at
landingstag
e
What is done
with the
spoilage?
None If waste no
calculation
in J35
Loss at
landingstag
e
Is the waste
product used in
another
production
chain?
No

220
Total CO2
footprint
landing
without
correction
0.000
Loss at
landingstage Economic value
of target species
at this stage
100 Economic
value (/kg)
100
Loss at
landingstag
e
Economic value
of by product at
this stage
0 Economic
value (/kg)
0
Processing
step
What process
step is done?
No Total
economic +
mass
100
Landing
total
Total CO2
footprint at
landing
0.00
Transport Transport
landing to
processing
0 km
Transport
method
Fuel use for
transport
Truck 3.5
- 10 ton
0.0005 kg
CO2Eq/kmkg
0.0000
Energy use
transport
Is cooling,
freezing applied
during
transport?
Ice Y/N
Energy use
transport
Additional fuel
consumption
does to cooling,
freezing
0 % extra fuel
consumption
0
Total
Transport
Landing
to
processing
Total
transport
to
processing
0.0000
Processin
g
CO2Eq
energy use
IF KNOWN
If KNOWN
otherwise unit
0 CO2 Eq/kg 0 CO2 Eq/kg 0
Total
energy use
IF KNOWN
If KNOWN
otherwise unit
0 MJ/kg 0.00
Electricity
use per unit
Use of
electricity from
solar energy
0 kWh/ kg
production
0.00

221
Electricity
use per unit
Use of
electricity from
wind energy
0 kWh/ kg
production
0.000
Electricity
use per unit
Use of
electricity from
fossil sources
0.0648 kWh/ kg
production
0.02764
Fuel use per
unit
Use of fuel per
unit
0.0000001 l/kg raw
material
0.00
Coolant use
per unit
Use of coolant
per unit
0.000001 l/kg raw
material
0.00
Processed
target
product
Name product 100 Economic
value (/kg)
60 Calculated
Contribution
ratio
0.94
Processed
By-
product1
Name product 10 Economic
value (/kg)
3 Calculated
Contribution
ratio
0.05
Processed
By-product
2
Name product 10 Economic
value (/kg)
1 Calculated
Contribution
ratio
0.02
Total
economic
+mass
64
Total
Processin
g
Total
processing
0.03
TOTAL
product
base
0.24