A Refined Architecture for Terminological Systems: Terminology = Schema + Views

Effect of fertiliser formulation and bioaugmentation on biodegradation and leaching
of crude oils and refined products in soils
F. Coulona*, K.J. Brassingtona, R. Bazinb, P.E. Linnetb, K.A. Thomasb, T.R. Mitchellb,
G. Lethbridgeb, J.W.N. Smithb and S.J.T. Pollarda
a Cranfield University, School Applied Sciences, Cranfield, Bedfordshire, MK43 0AL, UK; b Shell Global Solutions (UK), Shell Technology Centre Thornton, PO Box 1, Chester, CH1 3SH, UK.
*Corresponding author: Tel: +44 (0) 1234 754 981; Fax: +44 (0) 1234 754036; E-mail:
1

Abstract
The effects of soil characteristics and oil types as well as the efficacy of two fertiliser formulations
and three bioaugmentation packages in improving the bioremediation of oil-contaminated soils were
assessed as a means of ex-situ treatment selection and optimisation through seven laboratory
microcosm studies. The influence of bioremediation on leaching of oil from the soil was also
investigated. The studies demonstrated the benefits of biostimulation to overcome nutrient limitation,
as most of the soils were nutrient depleted. The application of both liquid and pelleted slow-release
N and P fertilizers increased both the hydrocarbon biodegradation rates (by a factor of 1.4 to 2.9) and
the percentage of hydrocarbon mass degraded (by > 30% after 12 weeks and 80% after 37 weeks),
when compared to the unamended soils. Slow release fertilisers can be particularly useful when
multiple liquid applications are not practical or cost effective. Bioaugmentation products containing
inoculum plus fertilizer also increased biodegradation by 20% to 37% compared to unamended
biotic controls; however there was no clear evidence of additional benefits due to the inocula
compared to fertiliser alone. Therefore biostimulation is seen as the most cost effective
bioremediation strategy for contaminated soils with the levels of crude oil and refined products used
in this study. However, site-specific considerations remain essential for establishing the treatability
for oil-contaminated soils.
Keywords: bioremediation, fertiliser, bioaugmentation, crude oil, refined petroleum products,
microcosm.
2

1. Introduction
It has been estimated that there are around 292,000 hectares of land affected by contamination in England
and Wales, associated with a wide range of former contaminative uses [1]. Some of these sites may
present an unacceptable risk to human health and/or the environment, for which there is a requirement for
remediation [2]. Civil engineering-based remediation methods have commonly been used within the UK.
However, the implementation of the Landfill Directive [3], which includes requirements for the pre-
treatment of wastes and separation of ‘hazardous’ and ‘non-hazardous’ waste streams, together with a
desire for more sustainable remediation [4], is influencing remediation practice.
Petroleum hydrocarbons continue to be a widely utilised global resource. Their use has resulted in
accidental spillage and leakage [2,5]. Bioremediation has a long and broadly successful history of
application in the UK [6,7,8] for hydrocarbons and other biodegradable contaminants. Regulatory
approvals for on-site bioremediation are now facilitated by the provision of well-organised and
compelling data (and other accompanying evidence) from pilot trials to support professional regulatory
judgements on the capacity of an oil impacted soil to respond to engineered bioremediation [9].
Judgement is required, for example, on (i) the compositional characteristics of the oil and thus the
behaviour (e.g., solubility, volatility, sorption) or recalcitrance of the source term; (ii) the feasibility of
bioremediation, given initial concentrations of hydrocarbon compounds in the soil (the source term); (iii)
the likely rate of biotransformation, given the proposed engineering process and any novel amendments
and/or bulking agents claimed to quicken biotransformation; (iv) the possible residual hydrocarbon
composition and concentration following treatment, in the context of acceptable residual concentrations
of each component; (v) the time available for bioremediation in the context of the site operations and/or
redevelopment timescale; (vi) the likely release of volatile biotransformation products, such as odours or
hazardous vapours (e.g., [10]), during bioremediation particularly in residential areas; and (vii) the
sustainability of bioremediation in comparison to other remediation options [4,11].
This paper describes a series of seven laboratory microcosm bioremediation studies that were performed
3

over several years to investigate controls and influences on bioremediation effectiveness. They are
evaluated to extract information relating to issues of feasibility and optimisation of bioremediation
strategies for soils contaminated with crude oil and refined oil products. Such an analysis serves as a
valuable guide to those responsible for selecting and approving bioremediation options. Our discussion
therefore seeks to highlight the types of judgements required to evaluate bioremediation strategies for oil-
contaminated soils.
2. Materials and Methods
An overview of the experimental setup of the seven microcosm experiments is provided in Table1.
2.1 Tests done prior to bioremediation studies
2.1.1 Soil characteristics
For all soils, moisture content, pH, water holding capacity (WHC), particle size, organic carbon, nitrate,
phosphate, and ammonium content were determined. The methods used were as follows. Moisture
content was measured by reweighing duplicate samples of 20 g soil wet weight after drying at 105 °C for
24 hours [12]. Soil pH was measured in a distilled water slurry (1 part soil: 2 parts water) after a 30
minute equilibration period [12]. Maximum water holding capacity (WHC) was determined in duplicate
by flooding the wet weight equivalent of 100 g dry soil in a filter funnel and allowing it to drain overnight
[12]. Particle size analysis was performed by combination of wet sieving (sand) and sedimentation (silt
and clay) as described by Gee and Bauder [13]. Organic carbon content was analysed by potassium
dichromate oxidation as described by Schnitzer [14]. Soil (10 g) was extracted in 0.5 M potassium
bicarbonate (adjusted to pH 8.5) and analysed by high performance ion chromatography (HPIC) for
nitrate [15] and phosphate [16] and colourimetrically for ammonium [17].
4

2.1.2 Rate and extent of degradation of nine types of oils in soil microcosms (Experiment A)
The rate and extent of degradation of nine different oils was assessed in soil microcosms under equivalent
conditions (Table 2). The oils selected represent the broad range of oils encountered at integrated
refineries and were typical of contaminant-source terms considered for bioremediation.
The soil was collected from an uncontaminated site and was air dried and homogenised by screening
through a 2-mm sieve. The soil was mixed in a 1:1 ratio with sharp building sand to improve drainage.
Triplicate microcosms were then established in sterile 50 ml serum bottles containing 10 g of soil aliquots
mixed with 100 mg of the respective oil. Microcosms were established for each time point so that they
could be destructively sampled. The water content of the soil was adjusted to 50 % WHC using a fertiliser
solution containing 25.7 g l-1 NH4NO3 and 21.4 g l-1 KH2PO4 dissolved in sterile water, applied to achieve
a C:N:P ratio of 100:10:1. Triplicate controls were also established using 1 ml of mercuric chloride
(HgCl2) solution at 2% w/w (equivalent to 2 mg HgCl2 g-1 soil ) to re-hydrate the soil instead of fertiliser
solution (to assess the abiotic losses). All microcosms were incubated aerobically at 20 °C in darkness at
high humidity, for a total of 30 weeks and sampled at 0, 2, 4, 6, 8, 12, 20 and 30 weeks for total
petroleum hydrocarbons (TPH) analysis as described in the section 2.4.
2.1.3 Determining the levels of mercuric chloride required for effective soil sterilisation and the
non-inhibitory levels of fertiliser required for bioremediation (Experiment B)
Bioremediation experiments often include use of killed control to assess non-biological losses. Typical
soil sterilising agents used in laboratory microcosms are sodium azide (NaN3) and HgCl2 [18,19]. The
latter is preferred for long-term (months/years) experiments because the former breaks down and loses
efficacy over a period of weeks [20]. However, the choice of sterilising agent concentration is often
arbitrarily taken from values in the literature and may fail to completely eliminate microbial activity,
thereby rendering the killed control invalid [19]. In addition the efficacy of the killed controls is rarely
assessed. In the same manner, fertiliser application is usually based on the theoretical C:N:P ratio
100:10:1 of a microbial cell [21,22] but rarely really takes into account the fact that excessive fertiliser
5

application can be inhibitory due to toxic or osmotic effects. Thus there is a need for a rapid measurement
method to optimise the application of both mercuric chloride and fertiliser. Feasibility of using soil
oxygen uptake as a rapid measurement tool was tested on three different soils collected from the shallow
soil layers (30 cm depth) of three petroleum sites. Stones and large pieces of plant debris were removed
through a 2 mm sieve. The soil samples were stored at 4 °C and at the water content occurring in the field
to keep the losses of microbial biomass to a minimum until conducting oxygen uptake measurement. The
physicochemical characteristics of the soils are presented in Table 3.
The effect of HgCl2 concentration and volume application was initially investigated using a loam soil (10
g) amended with a glucose solution (5 mg g-1 dry soil) 24 hours prior to the addition of 1.7 ml HgCl2
solution (HgCl2 concentration ranging from 0.01 % w/v to 5 % w/v). Glucose was chosen as a rapidly
degradable carbon source to enable the efficacy of HgCl2 to be assessed quickly (in hours/days as
opposed to days/weeks for oil). Further it is reasonable to assume that if HgCl2 inhibits glucose
degradation, oil degradation will be inhibited too.
Subsequent tests on the contaminated soils were carried out on duplicate soil samples (10 g) without
glucose amendment. Samples were dosed with 5% w/v HgCl2 at inputs of 0.01, 0.02, 0.03, 0.06, 0.1, 0.2,
0.3 and 0.4 ml g-1 dry soil which were equivalent to 0.5, 1, 1.5, 3, 5, 10, 15 and 20 mg HgCl2 g-1 dry soil,
respectively. The goal was to determine the dose of HgCl2 solution at 5% (w/v) required for inhibiting
microbial activity in the three soils investigated.
A second set of duplicate soil samples (10 g) was amended with nine fertiliser solution concentrations to
assess the soil tolerance to an excessive fertiliser application (Table 4). Each soil sample was then
incubated overnight at room temperature. The oxygen uptake rate was then monitored over several hours
by differential manometry on a Gilson respirometer.
2.1.4 Determining the effect of bulking agents on bioremediation (Experiment C)
Bulking agents such as straw, bark chips, and compost are frequently employed to improve aeration,
drainage and the physical handleability of contaminated soils that are deemed candidates for
6

bioremediation. Here a sandy clay loam soil was homogenised and mixed with sharp sand as previously
described in section 2.1. Duplicate microcosms were established in shallow trays using 2.5 kg of soil, into
which Brent Crude oil was mixed to achieve a final concentration of 9,400 mg-TPH kg-1. Four microcosm
conditions were established as follows: (i) soil mixture + 225 ml of 5% (w/v) HgCl2 equivalent to 4.5 mg
HgCl2 g-1 dry soil (to assess abiotic losses); (ii) un-amended soil mixture (to assess intrinsic
biodegradation); (iii) soil mixture + sterilised wet chopped straw (250 g) and fertiliser powder (1 g) (to
assess the effect of the bulking agent), and; (iv) soil mixture + sterilised wet pine bark (250 g) and
fertiliser powder (1 g) (to assess the effect of the bulking agent). The fertiliser powder used consisted of
NH4NO3 and NaH2PO4 in a 4:1 ratio and was applied to achieve a C: N: P ratio of 100:10:1 (please note
that we have not reported the studies in chronological order and this one was done before Experiment B
where we became aware of the inhibitory effect of high levels of fertiliser). All the trays were adjusted to
50 % WHC using 225 ml sterile water and incubated aerobically in darkness at 25 °C, for 84 weeks with
sampling at week 0, 4, 8, 12, 24, 48, and 84 for soil physicochemical and hydrocarbon analyses.
2.2 Bioremediation trial studies
2.2.1 Biostimulation trials: determining the efficacy of two fertiliser formulations (liquid and
pelleted slow release fertiliser) in improving the biodegradation of two oily wastes and the extent
of leaching of the oily wastes (Experiment D and E)
The efficacy of two different types of fertiliser formulations in improving the biodegradation of two oily
wastes was assessed using duplicate microcosm experiments. The oily-waste samples were oil based mud
(OBM) and tank bottom sludge (TBS) collected from an oil storage tank. Before use, both oily wastes
were mixed with dry wood chips (1:1 ratio) to aid oxygen transfer and drainage. The microcosms were
then established in sterile shallow glass trays using 1 kg of the OBM or TBS mixture. Four experimental
treatments were set up as follows: (i) oiled mixture + 91 ml of 5 % w/v HgCl2 equivalent to 4.5 mg HgCl2
g-1 soil (killed abiotic control); (ii) oiled mixture + 91 ml sterile distilled water (intrinsic biodegradation);
(iii) oiled mixture + liquid fertiliser, and; (iv) oiled mixture + pelleted slow-release fertiliser and sterile
7
water. The liquid fertiliser solution used contained 1.5 g l-1 NH4NO3, 0.25 g l-1 KH2PO4 and, 0.25 g l-1
K2HPO4 which was applied at a C:N:P ratio of 100:1:0.1 and adjusted to a pH 7. This ratio was used as
preliminary experiments showed that the oil degradation rate declined at C:N:P ratios greater than the
range 100:1:0.1 to 100:1:0.2 (data not shown). Pelleted slow-release fertiliser was applied to achieve a C:
N: P ratio of 100:2:0.2. This ratio was the closest equivalent to the liquid fertiliser application rate that
could be achieved due to the size of the pellets and the scale of the experiment. The microcosms were
incubated aerobically at 25 °C in darkness for a total of 12 weeks and sampled at 0, 2, 4, 8 and 12 weeks
for soil physicochemical and hydrocarbon analyses.
Leaching tests on the two oily wastes were also performed to evaluate the amount of benzene, toluene,
ethyl benzene and xylenes (BTEX) that may leach from the oily wastes, both prior to and after 12 weeks
of bioremediation (Experiment E). Tests were performed in duplicate by mixing and shaking the oily
wastes with ultra pure water containing 5 % w/w HgCl2 in completely filled (no headspace) 50 ml Teflon
centrifuge tubes for 72 hours followed by centrifugation at 3000 rpm for 15 minutes. The leachate was
analysed for BTEX by purge and trap gas chromatography. Measurement was performed in duplicate.
2.2.2 Bioaugmentation trials: the efficacy of three commercial packages to promote the
bioremediation of hydrocarbon-contaminated soils (Experiment F)
The efficacy of three commercial bioaugmentation packages (α, β and γ) was assessed for their ability to
promote the bioremediation of hydrocarbon-contaminated soils in microcosm experiments. The
bioaugmentation package characteristics were as follows: (α) microbial inoculum + mineral nutrient
solution + natural surfactant of plant origin; (β) microbial inoculum + mixture of biodegradable
surfactants (nonylphenol ethoxylates and alkoxylated linear alcohols) and (γ) microbial inoculum +
mineral nutrient solution + biocatalyst solution. Each of the bioaugmentation packages were used
according to the manufacturer’s instruction. Duplicate microcosms were established in 500 ml sterile
glass jar containing 350 g (dry weight) of either a sandy soil freshly contaminated with diesel (+ package
α) or a sandy soil contaminated with weathered crude oil (+ packages β and γ). The WHC of the soils was
8

adjusted to 65 %. The following duplicate controls using the same conditions were also established: (i)
killed control (soil + 31.5 ml of 5 % (w/v) HgCl2 which equalled to 4.5 mg HgCl2 g-1 soil, to determine
whether any abiotic degradation was occurring), (ii) soil + 31.5 ml distilled sterile water (to determine
intrinsic biodegradation) and (iii) soil + fertiliser solution (to compare with biostimulation approach). The
liquid fertiliser consisted of 23.8 g l-1 NH4NO3, 2.3 g l-1 KH2PO4 and 2.1 g l-1 K2HPO4, applied at a C:N:P
ratio 100:1:0.1. Microcosms were incubated aerobically at 15 °C in the dark for 52, 64 and 150 weeks for
packages α, β and γ, respectively. Microcosms were sampled for soil physicochemical and hydrocarbon
analyses at 0, 3, 5, 10, 14, 23, 34 and 52 weeks for package α; 0, 3, 6, 10, 27, 42, 52 and 64 for package β;
and 0, 3, 6, 12, 18, 29, 32, 40, 50, 56, 62, 79, 90, 100, 112, 131 and 150 weeks for package γ.
2.2.3 Bioremediation studies on soil contaminated with crude oil (Experiment G)
The extent to which crude oil contaminated soil could be cleaned by bioremediation was investigated in
microcosms established in 500 ml sterile glass jars containing 350 g of a contaminated sandy soil with
crude oil (44 000 ± 932 mg-TPH kg-1 dry soil) amended with 21 ml of either 5% w/v HgCl2 which
equalled to 3 mg HgCl2 g-1 dry soil (killed control), sterile distilled water (intrinsic bioremediation), or
fertiliser solution composed of NH4NO3 (23.8 g l-1), KH2PO4 (2.1 g l-1) and K2HPO4 (2.1 g l-1)
(biostimulation) equivalent to a C:N:P ratio of 100:1.7:0.17. This ratio was used as we observed that the
oil degradation rate declined at C:N:P ratios greater than 100:1:0.2 (data not shown).
The volume added of 21 ml corresponded to the amount of water required to bring the soil from its
content on collection to 50% of field capacity. Since all three treatments must have the same soil water
content, this figure also determined the volume of liquid in which any fertiliser or HgCl2 addition could
be made.
The soil pH and water saturation were adjusted to 6.8 and 64%. Each treatment was set up in triplicate.
TPH concentration, pH and microbial activity (respiration) were determined for each treatment on a
regular basis up to 37 weeks of bioremediation. Further samplings were made at week 50, 69, 84, 95, 116,
157, 175 and 196 where only chemical analysis was carried out to assess the extent of biodegradation.
9

2.4 Chemical analyses
The studies reported here were performed over an extended time-scale (3 months to 4 years; Table 1). As
a result, several different extraction and analysis techniques were used (Table 5). Generally the samples
were extracted either by Soxhlet (acetone: hexane, 1:1) or ultrasonic extraction (Freon™-113).
Depending on the experiment, the extracts were then used to gravimetrically determine the content of
total petroleum hydrocarbons (TPH), aliphatic, aromatics and ‘oil and grease’ fractions. TPH content was
analysed using infra-red spectroscopy (IR) and/or gas chromatography with flame ionisation detection
(GC-FID). GC-FID was used to characterise the oil at the start and end of the experiment and IR used
throughout to monitor degradation.
The Soxhlet extracted samples were extracted in standard Soxhlet apparatus using 300 ml acetone:
hexane in a 1:1 ratio for 16 hours. The ultrasonically extracted samples were chemically pre-dried with 10
g of anhydrous sodium sulphate (thermally treated overnight at 120 °C and stored in a desiccator prior to
use) and ultrasonically extracted using Freon™-113 (20 ml) for 30 minutes in a Decon™ FS200
sonication bath. Samples were thoroughly mixed and allowed to settle overnight in the dark. The extracts
were then shaken for 1 hour and left to settle before the solvent was decanted. This process was then
repeated a further two to four times depending upon the sample. Polar compounds were removed using
Florisil™ (30-60 mesh, previously heat treated at 500 °C stored in a desiccator and activated prior to use
by the addition of 6 % w/w distilled water). The aliphatic and aromatic fractions were separated using
column chromatography after the drying and re-dissolving of the Freon extract in hexane. Where required
samples were blown down to dryness under a gentle stream of nitrogen prior to gravimetric analysis or re-
dissolving into an appropriate solvent for further analysis.
The TPH content was analysed in all samples by Fourier transform infrared (FTIR) spectroscopy on
Freon extracts using a Perkin Elmer 881 IR scanning spectrophotometer. Samples were scanned at
wavenumbers between 3200 and 2700 cm-1 against a solvent blank. The peak heights at wavenumbers
2960, 2930 and 2860 cm-1 were summed and the concentration of the TPH was determined by reference to
a standard curve prepared with diesel ranging from 0 to 500 μg ml-1.
The TPH, aliphatic and aromatic extracts were analysed by gas chromatography using a HP 5890A GC-
10

FID fitted with a HP 7673 autosampler. The column used was a Chrompack™ fused silica capillary
column (30 m x 0.32 mm x 0.12μm), onto which 1μl of sample was injected in split ratio mode (17:1) at
250 °C. Different temperature programmes were used for the aliphatic and aromatic fractions. The initial
oven temperature for the aliphatic programme was 80 °C held for 5 minutes before being raised to 300 °C
at a rate of 5 °C per minute then held for 15 minutes. The initial oven temperature for the aromatic
programme was 90 °C held for 5 minutes before being raised at a rate of 5 °C per minute to 160 °C, then
raised to 300 °C at a rate of 10 °C per minute, and held for 17 minutes. Mixed n-alkanes and polycyclic
aromatic hydrocarbons (PAHs) were analysed concomitantly for calibration purposes.
2.5 Monitoring
During the experimental period of all the microcosms, the soil water evaporation was adjusted by the
addition of sterile water. The pH, ammonium, nitrate, phosphate and moisture content were determined as
described in section 2.1. Soil respiration was monitored at 25 °C by differential manometry on a Gilson
respirometer.
3. Results and Discussion
3.1 Rate and extent of degradation of various oils in soil microcosms
After 30 weeks 70-82% of the crude, diesel and gas oils, 57% of the lubricating oil and 45% of the
Brightstock had disappeared (Table 2). There was negligible disappearance of the heavy dewaxed base oil
and Ondina 68 marine oil (9%) (Table 2). The fact that some disappearance was also observed in the
killed controls for some of the oils which would not have been expected to volatilise much under the
incubation conditions (diesel, the gas oils and lube oil), indicates that the killed controls were not 100%
effective and that some biodegradation had taken place in the abiotic controls. It is therefore reasonable to
conclude that most of the disappearance observed for these light-medium, medium and heavier oils was
due to biodegradation. It is likely however that some of the losses from the light crudes were due to
volatilisation, but how much cannot be ascertained, because the losses from the ineffective killed controls
11
would have been due to a combination of biodegradation and volatilisation. However, it is well-known
that low to medium molecular weight petroleum hydrocarbons are readily biodegradable [23,24], so it is
reasonable to consider the losses from the two light crudes to be a good indication of their
biodegradability when compared to the other oils in this study.
These results confirm those of others, namely that lighter oils degrade faster and more extensively than
heavier oils [2,23,25,26]. Such studies have indicated that the extent of oil biodegradation is affected most
by the oil type rather than aging processes (biotic or abiotic weathering and incorporation of contaminants
deep into soil pores) of the source term [27]. Thus even weathered light oil (e.g. gasoline or diesel) is
likely to be relatively easier to bioremediate than fresh (unweathered) heavy oil (e.g. lube oil).
3.2 Determining the levels of mercuric chloride for soil sterilisation and the fertiliser tolerance of
soils prior to bioremediation studies
As a result of the uncertainty over the efficacy of the killed controls and hence the interpretation of the
results in the Experiment A, the effect of HgCl2 concentrations and volume application for soil
sterilisation was investigated. Similarly the effect of fertiliser application was investigated as information
on excessive fertiliser application is rarely discussed in bioremediation studies.
In both cases optimising concentration and volume application is likely to be one of the key factors in the
efficacy of any addition, since the larger the volume the easier it will be to uniformly distribute the added
chemicals. However, balance between adding enough volume to ensure homogenous distribution without
over wetting a soil will vary from soil to soil and may even vary between different batches collected at
different times of the year. Therefore measurement of oxygen uptake as a rapid measurement method for
estimating microbial activity in soil has been used to optimise the levels of HgCl2 and N and P fertilisers
used in bioremediation experiments.
The preliminary experiment using glucose amended loamy soil showed that oxygen consumption was
completely inhibited at HgCl2 concentration ≥ 1% w/v equivalent to 1.7 mg HgCl2 g-1 dry soil (Figure
1a). Therefore all subsequent experiments were conducted using a 5% w/v HgCl2 solution (close to
12

saturation) to ensure excess inhibitor. While HgCl2 solubility is reported as 7.4% w/v in water at 20 °C
[28], it is worthy to note that we found HgCl2 was often falling out in solution at 7% w/v and therefore not
practical for use in the killed control.
The dose of HgCl2 solution at 5% (w/v) required to completely inhibit oxygen consumption in the
amended loamy soil was ≥ 0.6 ml which equals to 3 mg HgCl2 g-1 dry soil (Figure 1b). The same
approach taken with the three unamended soils showed that oxygen consumption of the sandy soil was
easily inhibited with a volume application of 0.3 ml of 5% HgCl2 solution equivalent to 1.5 mg HgCl2 g-1
dry soil (Figure 1b). In contrast, it was not possible to completely inhibit the oxygen consumption in the
loam and peat soil (Figure 1b). The discrepancy between the glucose amended and unamended loam
results suggests that the use of glucose amendment to speed up the test cannot be recommended.
The peaty soil which had the highest organic carbon content (12%) proved to be the most resistant to
HgCl2 with 10 % of the oxygen uptake activity remaining after treatment (Figure 1b). Long-term
bioremediation experiments (20 weeks) indicated that no satisfactory killed controls could be obtained
with soil having a high native organic carbon content (data not shown). Previous studies demonstrated
that HgCl2 sterilisation generally results in minimal changes in soil properties compared with other
techniques [18,19] and may maintain a sterile environment for a long time [20,29]. Our results further
demonstrated that the concentration of HgCl2 into the soil should be as high as possible especially when
the soil had appreciable native soil organic carbon content (SOC). Since large amount of HgCl2 couldn’t
be added, the highest concentration of HgCl2 solution (here 5% w/v) was used and the volume added was
as much as 50% of the soil’s water holding capacity allowed. In addition it is strongly recommended that
verification of the efficacy of the killed controls should be carried out for the duration of the experiment
by subjecting sub-samples of the killed controls to respirometry testing. Shall it be not the case, there is
not much that can be done but in our experience this approach is effective for most soils from industrial
sites, as they have inherently low native SOC levels. While the peaty soils are problematic they are rarely
encountered at industrial sites. This approach was used for all the subsequent studies reported in this
paper.
The response of the three soils to fertiliser application rates was similar but their sensitivity to higher
13

application rates varied (Figure 2). Oxygen consumption was stimulated in all soils when fertiliser was
applied at low concentration indicating that the addition of nutrients (N/P) was effective in stimulating
microbial activity and alleviating the N and/or P supply limitations. The maximum fertiliser loadings
tolerated by the three soils (based on a C:N:P ratio of 100:10:1) before the oxygen consumption started to
decline were 0.2, 0.8 and 3 mg g-1 dry soil, equivalent to soil water concentrations of 1.2, 2.1 and 5 g l-1
respectively for the sandy, loamy and peaty soil (Figure 2 and Table 3). Since all soils were brought to
60% of their field capacity, they all contained different amounts of water per gram dry weight basis. The
field capacity of the peaty soil was 1.7 and 4.8 times greater than of the loamy and sandy soil,
respectively (Table 3). Consequently for a given fertiliser application rate, the concentration of N and P in
the sandy soil was approximately 3 and 5 times greater than in the loamy and peaty soils, respectively
(Table 4). This explains why the peaty soil was the least sensitive and the sandy soil was the most
sensitive to high fertiliser application. This finding further suggests that the optimisation of fertiliser
application should be assessed based on the resulting concentration in soil solution rather than the
theoretical N & P demand based on the typical 100:10:1 C:N:P ratio of a microbial cell grown in
laboratory culture. The latter assumes that hydrocarbon degradation results in cell growth, but this needs
not be the case.
Inhibition of oxygen consumption ranged from 40-70%, indicating that some microbial activity and
therefore hydrocarbon degradation was possible at these higher fertiliser application rates, albeit at a
lower rate than the lower fertiliser concentrations.
Overall the effects of HgCl2 and fertiliser on microbial activity in soil can be rapidly assessed (within 24
hours) by comparing the oxygen consumption rates of the soil in presence or absence of the chemicals
prior to setting up long-term bioremediation experiments. This approach therefore enabled an informed
selection of inhibitor and fertiliser levels for the subsequent bioremediation experiments and increased the
chances of running successful long-term bioremediation.
14

3.3 Influence of bulking agent type on bioremediation efficiency
Bulking agents have frequently been used during bioremediation to improve soil structure, break up and
mix the soil, lower the bulk density and increase porosity to facilitate better transfer of oxygen, water and
nutrients into the soil and enhance removal of oily products [30-31]. Bulking agents also increase the
surface area of contaminated soil exposed to microbial processes by increasing the surface to volume ratio
[31,32].
Here the use of bulking agents was expected to enhance bioremediation, as others have demonstrated.
However, no additional beneficial effects attributable to the addition of straw or pine bark was observed
compared to biostimulation alone after 84 weeks (Figure 3). This result may be due to the fact that the
soil was initially mixed with sharp building sand which was sufficient to improve drainage and oxygen
transfer. Another possible explanation for the lack of effect of the bulking agents may be that the oil
became bound to the bulking agents and consequently less available for biodegradation. Pine bark was the
least effective at enhancing degradation of the aromatic fraction (Figure 3). Presumably pine bark had a
high lignin content, which being an aromatic polymer of random phenylpropane subunits can strongly
absorb aromatic compounds and make them unavailable for bioremediation. Namkoong et al. [34] also
reported that bulking agents can represent a preferential carbon source and can be degraded in preference
to target compounds, which may account for the reduced degradation seen here.
3.4 Biostimulation treatments: comparison of liquid and pelleted slow release fertilisers efficacy
Oil-contaminated soils naturally contain a high level of carbon as an energy source for microbial growth,
but often require the addition of N and P containing fertilisers to alleviate N and P limitation [23]. Here,
the application of nitrogen and phosphorous contained in the two types of fertilisers rapidly stimulated the
microbial activity of all oily waste microcosms (data not shown). This was evidenced by the increase of
oxygen consumption which peaked in the region of 80-100 mg oxygen kg-1 OBM h-1 after 4 days and
thereafter slowly declined to 40 mg kg-1 OBM h-1 as the readily degradable carbon sources in the wood
chips were degraded and possibly other factors became limiting. In contrast, the respiration rates in the
15

TBS fertilised microcosms increased rapidly and stabilised in the region of 120-160 mg oxygen kg-1 TBS
h-1 after 10 days.
Gas chromatography analysis further confirmed that TPH reduction in all fertilised treatments was due to
biodegradation as considerable reduction in the numbers and concentration of the resolvable hydrocarbon
peaks was observed as well as a dramatic reduction in the C17:pristane (T0 = 0.71 and T8weeks = 0.04; 95%
degradation) and C18:phytane (T0 =3.4 and T8 weeks = 0.14; 96% degradation) ratios. In contrast, TPH
reduction in the killed controls and unfertilised microcosms (Figure 4) was primarily due to volatilisation
and sorption as no changes in the n-alkanes/isoprenoid ratios were observed.
In the first two weeks, the TPH content of TBS and OBM were reduced by 50% (28 000 to 14 000 mg kg-
1) and 34% (90 000 to 60 000 mg kg-1), respectively in all fertilised treatments (Figure 4). However the
TPH degradation rate of TBS and OBM was 1.3 and 2 times higher respectively when the pelleted slow
release fertiliser was used instead of the liquid fertiliser. Subsequently biodegradation appeared to cease
in the liquid fertiliser treated microcosms (week 8) but still continued at a much slower rate in the pelleted
slow release fertiliser treated microcosms such that the TPH concentration of TBS and OBM declined to
7500 and 26 000 mg kg-1, respectively after 12 weeks. This result suggests that the pelleted slow release
fertiliser can be advantageous over the liquid fertiliser as all required nutrients can be added at the start of
bioremediation and be effective several weeks compared to just few weeks for liquid formulation. In
addition liquid fertiliser has to be added at lower doses and more frequently to prevent fertiliser toxicity to
the oil degrading microorganism, soil over wetting and leaching losses which can potentially result in
groundwater contamination with nitrate.
As the degradation halted in the liquid fertiliser treated microcosms, more fertiliser was added at week 8.
However, no major increase in TPH biodegradation compared to the slow release fertiliser microcosms
was observed between week 8 and 12 (Figure 4), indicating that the slow TPH decline after the first
month represents the degradation of the less readily biodegradable hydrocarbons in TBS and OBM, rather
than a N or P limitation. The extent of hydrocarbon biodegradation is strongly dependent on the nature of
the contaminant, the soil chemistry and the partitioning of specific compounds into the aqueous phase
where the biological uptake occurs readily [5,31,35,36,37]. In some cases, bioavailability is relatively
16

unimportant, while in others it may be critical. Therefore the influence of site-specific compound
bioavailability on bioremediation of hydrocarbon products must be considered.
3.5 Influence of bioremediation on leaching
Although the water solubility of most petroleum hydrocarbons is very low, a small number (e.g. BTEX)
do possess sufficient solubility in water to potentially cause a risk to groundwater and surface water as a
result of leaching [38,39]. BTEX compounds are readily biodegradable, so bioremediation can be a very
effective means of managing the risk to groundwater and surface waters, by removing these leachable
hydrocarbons from the contaminated matrix.
Prior to bioremediation, the leachate of the OBM contained 20 - 100 µg l-1 of individual BTEX
compounds and the leachate of the TBS contained 90 - 240 µg l-1 of individual BTEX compounds (Figure
5). Mixing the OBM and TBS with wood chips had no significant effect on leachable toluene,
ethylbenzene and xylenes, but benzene in both leachates was reduced in the presence of wood chips. This
reduction could either have been due to volatilisation of the benzene while the OBM and TBS were mixed
with the wood chips or sorption of the benzene by the wood chips. The fact that benzene is somewhat
more volatile than TEX, but is less prone to sorption to organic matter [40] suggests that volatilisation is
the most likely explanation. The apparent lack of significant sorption of BTEX compounds to the wood
chips is contrary to what other workers have reported [32] and may reflect the lack of sufficient contact
time between adding the wood chips and mixing them with the OBM and TBS prior to solvent extraction
which took less than 15 minutes.
After 12 weeks of bioremediation BTEX concentrations in the leachate of the fertilised treatments were <
1 µg l-1 with one exception where toluene in the TBS leachate was 5 µg l-1 (Figure 6). Reduction of BTEX
in the leachate was also observed in the killed controls (although not to the same extent as in the fertilised
live treatments). Since respiration measurements demonstrated that the killed controls were effectively
sterilised, the reductions in leachable BTEX in the killed controls were due to volatilisation, sorption or a
17

combination of the two over the 12 weeks incubation period. These results confirm those of Chaîneau et
al. [41], namely that bioremediation is very effective at managing the risk of leaching to groundwater
posed by soils containing petroleum hydrocarbons with appreciable solubility in water.
3.6 Bioaugmentation trials: benefits and limitations
Some workers have claimed that in some situations an indigenous microbial population may not be
sufficient for bioremediation of a soil and as such it may be necessary to add cultured hydrocarbon
degrader organisms [42]. Proprietary inocula either immobilised on a carrier with or without an
accompanying surfactant, or used on their own can be used to augment the indigenous microbial
community in contaminated soils. Claims have been made for shifting the microbial community structure
to a consortium more able to transform the hydrocarbon substrate, or able to degrade hydrocarbons more
quickly [29,43,44].
In the present study the bioaugmentation packages improved bioremediation performance compared to
natural attenuation processes alone, but gave no additional benefit compared to application of a fertiliser
solution alone (Figure 7). Indeed, the fertiliser treatment (biostimulation) performed even better than the
bioaugmentation packages β and γ used with a weathered oil-contaminated sandy soil. In the case of
bioaugmentation package α, it was similarly effective as fertiliser alone on the sandy soil freshly
contaminated with diesel. Therefore, any claimed benefit of bioaugmentation package is debateable as the
positive effect seems to be due to the fertiliser component of the package rather than the microbial
inoculum. In addition, no adjustment of the concentration and rate of mineral nutrients applied with the
bioaugmentation packages can be made and consequently be optimised according to the initial soil
conditions.
Microbial consortium addition has also been shown to have little effect on increasing degradation of
petroleum hydrocarbons [30,45] and in some cases may impede bioremediation efficiency [46]. Indeed, a
view that is now being expressed by many as a general rule is that addition of microbial cultures is
ineffective at enhancing biodegradation as in most cases the indigenous microbial population is better
18
adapted to the soil conditions and may perform better than a foreign consortium [45,47,48] which is
supported by the results of the current investigation.
3.7 The limits to bioremediation of soil contaminated with crude oil
One of the key questions of remediation technologies for the clean-up of contaminated land is the final
concentration of contaminants that can be reached. Here the performance of biostimulation as a means of
cleaning soil contaminated with crude oil has been evaluated over an extended time period (196 weeks).
Gas chromatography analysis of the hydrocarbons extracted by Soxhlet showed that the crude oil
components ranged between C12 and C26. The absence of heavier hydrocarbons and the presence of many
resolvable hydrocarbons indicated that the oil contamination was amenable to treatment by
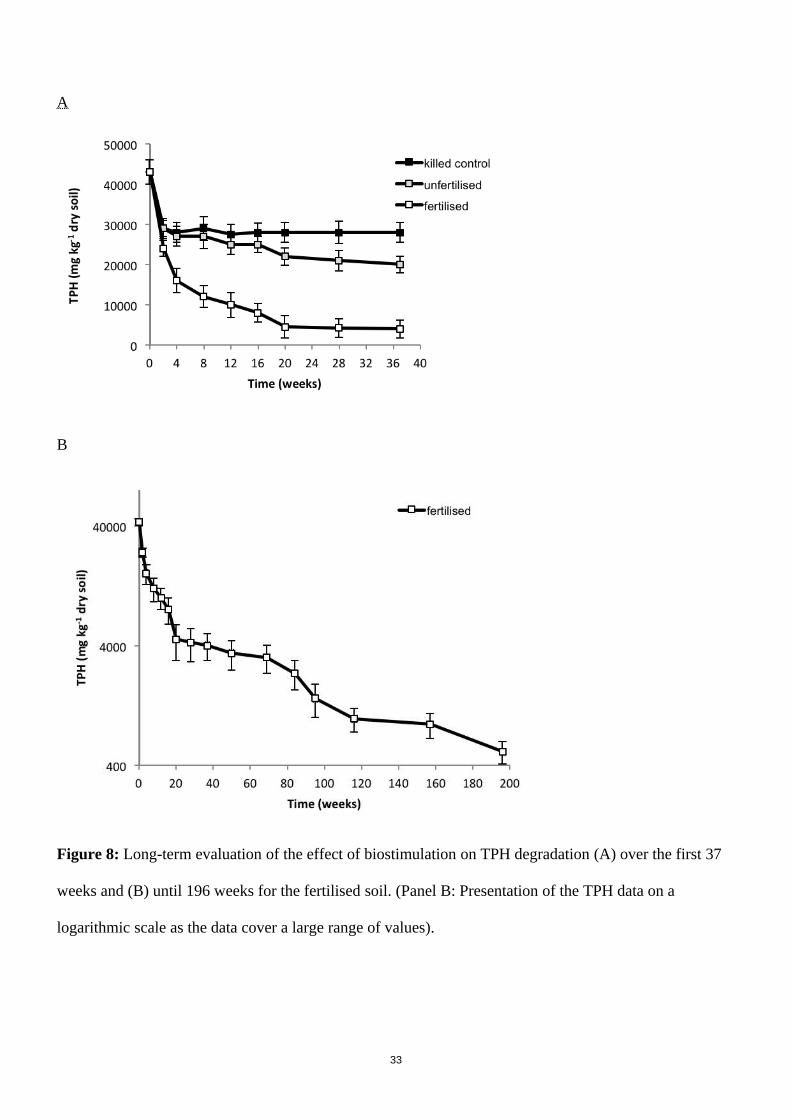
bioremediation and a high degree of clean-up could be expected. After an initial rapid decline in TPH
concentration during the first two weeks (from 43 000 to 29 000 mg kg-1) in the unamended and killed
microcosms, there were little changes in the amount of TPH measured in the two treatments after 37
weeks (Figure 8). Microbial respiration confirmed the effectiveness of the killed controls thus the initial
loss was mainly attributed to volatilisation. GC traces of the aliphatic and aromatic fractions of the
unamended microcosms at week 37 also showed that bioremediation was minimal in the absence of
fertiliser. This result clearly demonstrated that the soil was severely limited by a shortage of available N
and P.
Following the addition of fertiliser the TPH declined from 43 000 to 4000 mg kg-1 over 37 weeks (Figure
8a). As evidenced by the killed control, 72% of the TPH decrease was attributed to biodegradation.
Bioremediation appeared to have come to a halt after 37 weeks despite GC traces indicating that there
was still some potentially biodegradable material left in the soil. The soil analysis further indicated that it
was unlikely that bioremediation was limited by adverse pH or by mineral nutrient limitations (data not
shown). It was therefore possible that hydrocarbon biodegradation was still taking place in the soil but at
a much lower rate, such that it would only be detected over a longer timescale. The regular measurements
of TPH by gas chromatography confirmed this hypothesis as the residual TPH concentration was 520 mg
19

kg-1 after 196 weeks (Figure 8b). By extrapolating the data, an average degradation rate of the oil in the
fertilised soil was estimated to be 150 mg-TPH kg-1 day-1 until 37 weeks which was 1.7 times higher than
in the unamended soil (88 mg-TPH kg-1 day-1) and then decreased to 4 mg-TPH kg-1 day-1 until week 196.
It is possible that some of the remaining 520 mg TPH kg-1 contained a fraction recalcitrant to
biodegradation due to reduced bioavailability [24]. The decrease of the bioavailability may result from:
incorporation of the hydrocarbons into the soil natural organic material due to the chemical oxidation
reactions; slow diffusion into very small pores; sorption onto natural organic matter; or formation of
semi-rigid films around non aqueous-phase liquids causing a high resistance to the mass transfer [49].
Bioavailability can be a significant contributory factor determining the extent of mass reduction
achievable by bioremediation. However, the objective of bioremediation should not be mass reduction
per se, but risk reduction / management. Hydrocarbon residues in soil which are not bioavailable are
unlikely to pose a significant risk to human health or the environment.
4. Conclusions
Overall the studies suggest that the success of bioremediation, considering both biostimulation and
bioaugmentation approaches, remains largely dependent on the form of oil present and the soil structure
characteristics. The individual studies presented identified:
(1) For the majority of the contaminated soils investigated addition of mineral nutrients played an
essential role, without which significant bioremediation did not occur in a number of cases.
(2) Pelleted slow-release fertilisers were shown to be an effective alternative to liquid fertilisers.
(3) Stimulation of indigenous hydrocarbon-degrading populations by the addition of N and P
containing fertilisers was a highly effective means of achieving bioremediation of oil-
contaminated soils.
(4) Bioaugmentation of soil with hydrocarbon-degrading microorganisms in the form of
commercially available packages had no significant effect on the rate and extent of degradation
of any of the crude oils or refined petroleum products used in this study.
20

(5) Bioremediation is highly effective at degrading the more water soluble components in oil and
thereby reducing leaching of water soluble hydrocarbons (e.g. BTEX) from the contaminated
soils to groundwater.
Clearly, the design of an efficient bioremediation process always requires a careful site assessment taking
into account the physical, chemical and biological properties of the contaminated sites in order to
establish appropriate response and recovery methods.
Acknowledgements
This work was funded under a former Department of Trade and Industry – Research Council ‘Bioremediation
LINK’ grant and supported by a consortium of industrial partners (PROMISE). KJB was funded by an EPSRC
CASE Award supported by the former FIRSTFARADAY (Environmental Sustainability KTN) partnership. FC
was supported by BBSRC Grant BB/B512432/1. The views expressed are the authors’ alone and may not reflect
the views or policies of their employing organisations.
References
[1] Contaminated Land: Application In Real Environment, A decade of change for UKs land-use:
Economic growth through sustainable regeneration. CLAIRE, London. 2010. Available at:
http://www.claire.co.uk/
[2] M.G. Towell, J. Bellarby, G.I. Paton, F. Coulon, S.J.T. Pollard, K.T. Semple, Mineralisation of target
hydrocarbons in three contaminated soils from former refinery facilities, Environ. Pollut. 159 (2011),
pp. 515-523.
[3] Council of the European Union, Directive on the landfill of waste (99/31/EC) OJ L182, (1999), pp. 1-
19
[4] P. Bardos, B. Bone, R. Boyle, D. Ellis, F. Evans, N.D. Harries, and J.W.N. Smith, Applying
sustainable development principles to contaminated land management using the SuRF-UK framework,
Remediation 21 (2011), pp. 77-100.
21

[5] S. J. T. Pollard, S. E. Hrudey, and P. M. Fedorak, Bioremediation of Petroleum- and Creosote-
Contaminated Soils: a Review of Constraints, Waste Manage. Res. 12 (1994), pp.173-194.
[6] Environment Agency, Survey of remedial techniques for land contamination in England and Wales, R
& D Technical Report P401, Environment Agency, Almondsbury, Bristol, UK, 2000.
[7] Environment Agency, Remedial Treatment Action Data Sheets, Agency Management Systems
Document: Data Sheet No. DS-01, Environment Agency, Almondsbury, Bristol, UK, 2002.
[8] K.J. Brassington, R.L. Hough, G.I. Paton, K.T. Semple, G.C. Risdon, J. Crossley, I. Hay, K. Askari,
and S.J.T. Pollard, Weathered hydrocarbon wastes – a risk management primer. Crit. Rev. Environ.
Sci. Technol. 37 (2007), pp. 199-232.
[9] E.E. Diploick, D.P. Mardlin, K.S. Killham, and G.I. Paton, Predicting bioremediation of
hydrocarbons: laboratory to field scale. Environ. Pollut. 6 (2009), pp. 1831-1840.
[10] G.E. Devaull, Estimation of volatile emissions during the excavation of soil or waste, Environ. Sci.
Technol. 35 (2001), pp. 3974-3980.
[11] Sustainable Remediation Forum (SURF), Integrating sustainable principles, practices, and metrics
into remediation projects. Remediation J. 19 (2009), pp. 5–114.
[12] C.A. Black, Methods of Soil Analysis Part 1. Physical and Mineralogical Properties, American
Society of Agronomy, Madison, Wisconsin, USA, 1965.
[13] G.W. Gee and J.W. Bauder, Particle size analysis, in Methods of soil analysis, Part 1. Physical and
mineralogical methods, 2nd ed., A. Klute, ed., American Society of Agronomy, Madison Wisconsin,
USA, 1986, pp. 383-411.
[14] M. Schnitzer, Organic matter characterisation, in Methods of soil analysis, Part 2 – Chemical and
Microbiological Properties, A.L. Page, ed., American Society of Agronomy, Madison, Wisconsin,
USA, 1982, pp. 581-594.
[15] J.M. Brenner and C.S. Mulvaney, Total nitrogen, in Methods of soil analysis, Part 2 – Chemical and
Microbiological Properties, A.L. Page, ed., American Society of Agronomy, Madison, Wisconsin,
USA, 1982, pp. 595-624.
22
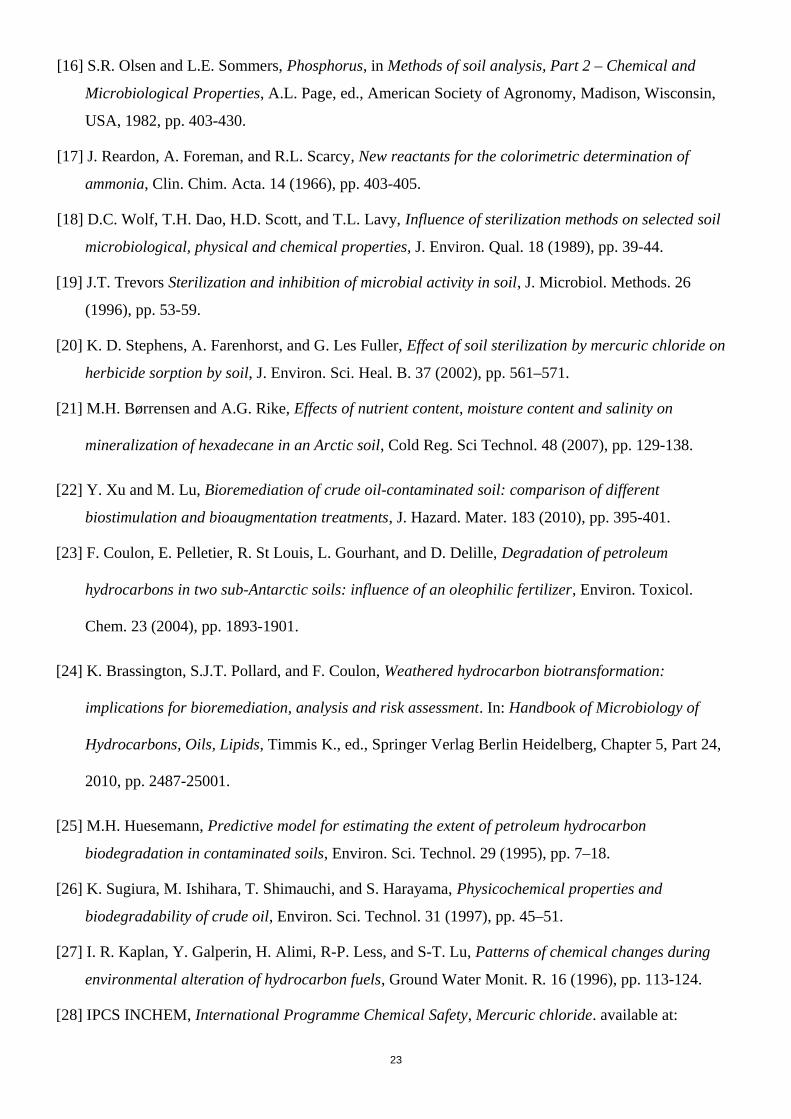
[16] S.R. Olsen and L.E. Sommers, Phosphorus, in Methods of soil analysis, Part 2 – Chemical and
Microbiological Properties, A.L. Page, ed., American Society of Agronomy, Madison, Wisconsin,
USA, 1982, pp. 403-430.
[17] J. Reardon, A. Foreman, and R.L. Scarcy, New reactants for the colorimetric determination of
ammonia, Clin. Chim. Acta. 14 (1966), pp. 403-405.
[18] D.C. Wolf, T.H. Dao, H.D. Scott, and T.L. Lavy, Influence of sterilization methods on selected soil
microbiological, physical and chemical properties, J. Environ. Qual. 18 (1989), pp. 39-44.
[19] J.T. Trevors Sterilization and inhibition of microbial activity in soil, J. Microbiol. Methods. 26
(1996), pp. 53-59.
[20] K. D. Stephens, A. Farenhorst, and G. Les Fuller, Effect of soil sterilization by mercuric chloride on
herbicide sorption by soil, J. Environ. Sci. Heal. B. 37 (2002), pp. 561–571.
[21] M.H. Børrensen and A.G. Rike, Effects of nutrient content, moisture content and salinity on
mineralization of hexadecane in an Arctic soil, Cold Reg. Sci Technol. 48 (2007), pp. 129-138.
[22] Y. Xu and M. Lu, Bioremediation of crude oil-contaminated soil: comparison of different
biostimulation and bioaugmentation treatments, J. Hazard. Mater. 183 (2010), pp. 395-401.
[23] F. Coulon, E. Pelletier, R. St Louis, L. Gourhant, and D. Delille, Degradation of petroleum
hydrocarbons in two sub-Antarctic soils: influence of an oleophilic fertilizer, Environ. Toxicol.
Chem. 23 (2004), pp. 1893-1901.
[24] K. Brassington, S.J.T. Pollard, and F. Coulon, Weathered hydrocarbon biotransformation:
implications for bioremediation, analysis and risk assessment. In: Handbook of Microbiology of
Hydrocarbons, Oils, Lipids, Timmis K., ed., Springer Verlag Berlin Heidelberg, Chapter 5, Part 24,
2010, pp. 2487-25001.
[25] M.H. Huesemann, Predictive model for estimating the extent of petroleum hydrocarbon
biodegradation in contaminated soils, Environ. Sci. Technol. 29 (1995), pp. 7–18.
[26] K. Sugiura, M. Ishihara, T. Shimauchi, and S. Harayama, Physicochemical properties and
biodegradability of crude oil, Environ. Sci. Technol. 31 (1997), pp. 45–51.
[27] I. R. Kaplan, Y. Galperin, H. Alimi, R-P. Less, and S-T. Lu, Patterns of chemical changes during
environmental alteration of hydrocarbon fuels, Ground Water Monit. R. 16 (1996), pp. 113-124.
[28] IPCS INCHEM, International Programme Chemical Safety, Mercuric chloride. available at:
23

http://www.inchem.org/documents/icsc/icsc/eics0979.htm
[29] L. Tuominen, T. Kairesalo, and H. Hartikainen, Comparison of methods for inhibiting bacterial
activity in sediment, Appl. Environ. Microbial. 60 (1994), pp. 3454-3457.
[30] W. R. JR Giles, K.D. Kriel, and J. R. Stewart, Characterization and bioremediation of a weathered
oil sludge, Environ. Geosci. 8 (2001), pp. 110-122.
[31] N.G. Rojas-Avelizapa, T.G. Roldan-Carrillo, J.M. Arce-Ortega, M.E. Ramirez-Islas, H.G. Zegarra-
Martinez, and L.C. Fernandez-Linares, Enhancement of hydrocarbon removal in a clay and drilling-
waste polluted soil, Soil Sediment Contam. 15 (2006), pp. 417-428.
[32] R.L. Rhykerd, B. Crews, K.J. Mclnnes, and R.W. Weaver, Impact of bulking agents, forced aeration,
and tillage on remediation of oil-contaminated soil, Bioresour. Technol. 67 (1999), pp. 279-285.
[33] D.E. Wellman, A.L. Ulery, M.P. Barcellona, and S. Duerr-Auster, Animal waste-enhanced
degradation of hydrocarbon-contaminated soil, Soil Sediment Contam. 10 (2001), pp. 511-523.
[34] W. Namkoong, E-Y. Hwang, J-S. Park, and J-Y. Choi, Bioremediation of diesel contaminated soil
with composting, Environ Pollut. 119 (2002), pp. 23-31.
[35] F. Coulon, E. Pelletier, L. Gourhant, and D. Delille, Effects of nutrient and temperature on
degradation of petroleum hydrocarbons in contaminated sub-Antarctic soil, Chemosphere 58 (2005),
pp. 1439-1448.
[36] K.T. Semple, A.W.J. Morris, and G.I. Paton, Bioavailability of hydrophobic organic contaminants in
soils: fundamental concepts and techniques for analysis. Eur. J. Soil Sci. 54 (2003), pp. 809–818.
[37] F. Coulon, and D. Delille, Influence of substratum on the degradation process in diesel polluted sub-
Antarctic soils (Crozet Archipelago), Polar Biol. 29 (2006), pp. 806-812.
[38] M.O. Rivett, G.P. Wealthall, R.A. Dearden, and T.A. McAlary, Review of unsaturated zone
transport and attenuation of volatile organic compound (VOC) plumes leached from shallow source
zones, J. Contam. Hydrol. 123 (2011), pp. 130-156.
[39] J. Salanitro, P.B. Dorn, M.H. Huesemann, K.O. Moore, I.A. Rhodes, L. Ricejackson, T.E. Vipond,
M.M. Western, H.L. Wisniewski, Crude oil hydrocarbon bioremediation and soil ecotoxicity
Assessment, Environ. Sci. Technol. 31 (1997), pp. 1769-1776.
[40] R.G. Zytner, Sorption of benzene, toluene, ethylbenzene and xylenes to various media, J. Hazard.
Mater. 38 (1994), pp. 113-126.
[41] C.H. Chaîneau, C. Yepremian, J.F. Vidake, J. Cucrux, and D. Ballerini, Bioremediation of a crude
24
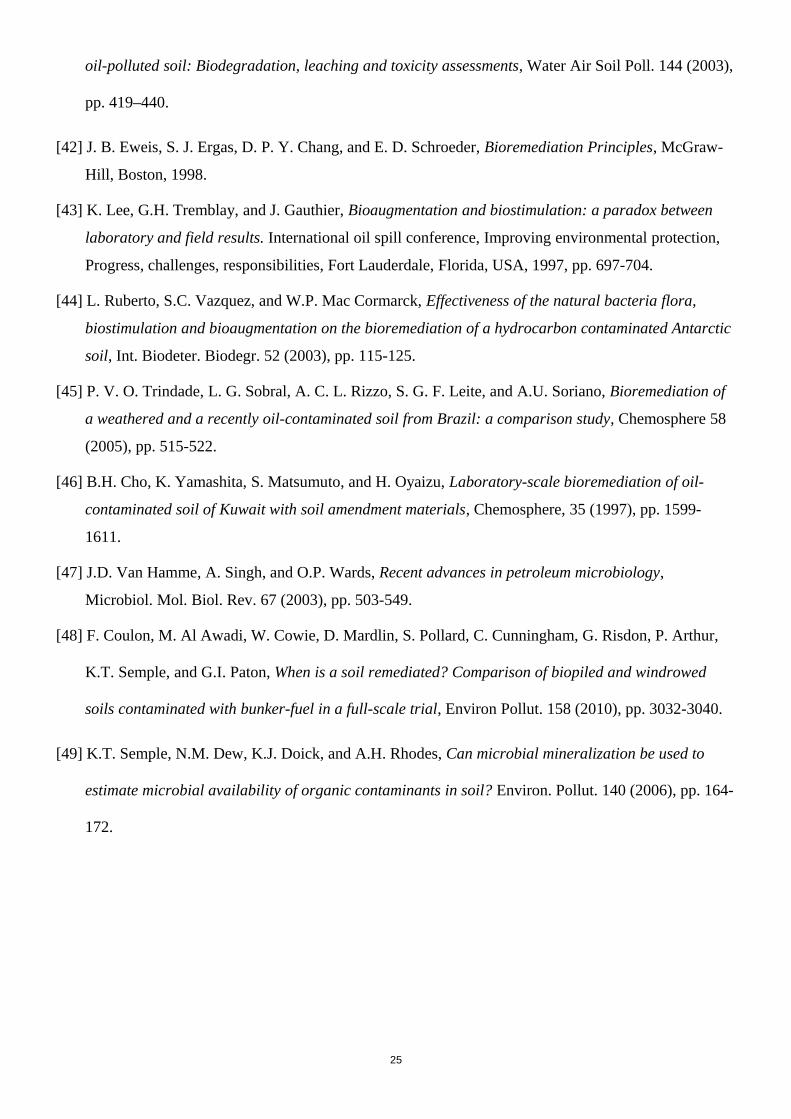
oil-polluted soil: Biodegradation, leaching and toxicity assessments, Water Air Soil Poll. 144 (2003),
pp. 419–440.
[42] J. B. Eweis, S. J. Ergas, D. P. Y. Chang, and E. D. Schroeder, Bioremediation Principles, McGraw-
Hill, Boston, 1998.
[43] K. Lee, G.H. Tremblay, and J. Gauthier, Bioaugmentation and biostimulation: a paradox between
laboratory and field results. International oil spill conference, Improving environmental protection,
Progress, challenges, responsibilities, Fort Lauderdale, Florida, USA, 1997, pp. 697-704.
[44] L. Ruberto, S.C. Vazquez, and W.P. Mac Cormarck, Effectiveness of the natural bacteria flora,
biostimulation and bioaugmentation on the bioremediation of a hydrocarbon contaminated Antarctic
soil, Int. Biodeter. Biodegr. 52 (2003), pp. 115-125.
[45] P. V. O. Trindade, L. G. Sobral, A. C. L. Rizzo, S. G. F. Leite, and A.U. Soriano, Bioremediation of
a weathered and a recently oil-contaminated soil from Brazil: a comparison study, Chemosphere 58
(2005), pp. 515-522.
[46] B.H. Cho, K. Yamashita, S. Matsumuto, and H. Oyaizu, Laboratory-scale bioremediation of oil-
contaminated soil of Kuwait with soil amendment materials, Chemosphere, 35 (1997), pp. 1599-
1611.
[47] J.D. Van Hamme, A. Singh, and O.P. Wards, Recent advances in petroleum microbiology,
Microbiol. Mol. Biol. Rev. 67 (2003), pp. 503-549.
[48] F. Coulon, M. Al Awadi, W. Cowie, D. Mardlin, S. Pollard, C. Cunningham, G. Risdon, P. Arthur,
K.T. Semple, and G.I. Paton, When is a soil remediated? Comparison of biopiled and windrowed
soils contaminated with bunker-fuel in a full-scale trial, Environ Pollut. 158 (2010), pp. 3032-3040.
[49] K.T. Semple, N.M. Dew, K.J. Doick, and A.H. Rhodes, Can microbial mineralization be used to
estimate microbial availability of organic contaminants in soil? Environ. Pollut. 140 (2006), pp. 164-
172.
25

A
0
5
10
15
20
25
0 0.017 0.043 0.085 0.17 0.43 0.85 1.7 4.3 8.5
Oxygen consumption (µg g
-1 h-
1 )
Mercuric chloride concentration
(0.01) (0.025) (0.05) (0.1) (0.25) (0.5) (1) (2.5) (5) % w/v
mg g-1 soil
B
0
5
10
15
20
25
0 0.1 0.2 0.3 0.6 1 2 3 4
oxygen consumption (µg
g-1 soil h
-1 )
volume of mercuric chloride and equivalent concentration in soil
glucose amended loamy soil
peaty soil
loamy soil
sandy soil
(0.5) (1) (1.5) (3) (5) (10) (15) (20) mg g -1 soilml
Figure 1: Effect of mercuric chloride concentration on soil microbial respiration after 24 hours.(a.
preliminary test on 10 g loamy soil amended with glucose to assess quickly HgCl2 concentration required
to inhibit microbial respiration; b. determination of the volume of 5% w/v HgCl2 solution required to
inhibit microbial respiration in oil contaminated soils)
26

Figure 2: Effect of fertiliser application rates on the microbial respiration in three oil-contaminated soils
after 24 hours. (The concentration of fertiliser in soil was the theoretical amount required for complete
bioremediation of the oil assuming a C:N:P ratio of 100:10:1; Table 3).
27

Figure 3: Influence of the bulking agents on TPH, aliphatic and aromatic fractions degradation after 84
weeks of bioremediation. (The initial concentration of TPH, aliphatic and aromatic fractions was 9400,
7140 and 1970 mg kg-1, respectively).
0
500
1000
1500
2000
Fertiliser Fertiliser + Pine bark Fertiliser + Straw
TPH mg kg-1
TPHAliphatic fractionAromatic fraction
28

A
B
Figure 4: Comparison of the efficacy of the liquid fertiliser vs. the pelleted slow release fertiliser on TPH
biodegradation from (a) oil based mud (OBM), and (b) tank bottom sludge (TBS) over a 12 week period.
(The liquid fertiliser was reapplied after week 8 as the TPH degradation was observed to plateau).
29

Figure 5: Leaching of BTEX from OBM and TBS with and without wood chips prior remediation
30

Figure 6: Leaching of BTEX from OBM (A) and TBS (B) after 12 weeks of bioremediation. (T0 =
concentration of individual BTEX compounds from the oily wastes mixed with wood chips before
bioremediation).
A
0
2
4
6
8
10
12
14
Benzene Toluene Ethyl benzene m- & p-Xylene o-Xylene
Concentration (µg l-1)
Killed control
Biotic controlLiquid fertiliser
Pelleted fertiliser
T0 = 10
T0 = 90
T0 = 18
T0 = 73
T0 = 80
B
0
5
10
15
20
25
Benzene Toluene Ethyl benzene m- & p Xylene- o-Xylene
Concentration (µg l-1)
Killed control
Biotic control
Liquid fertiliser
Pelleted fertiliser
T0 = 112
T0 = 164
T0 = 86
T0 = 90
T0 = 102
31
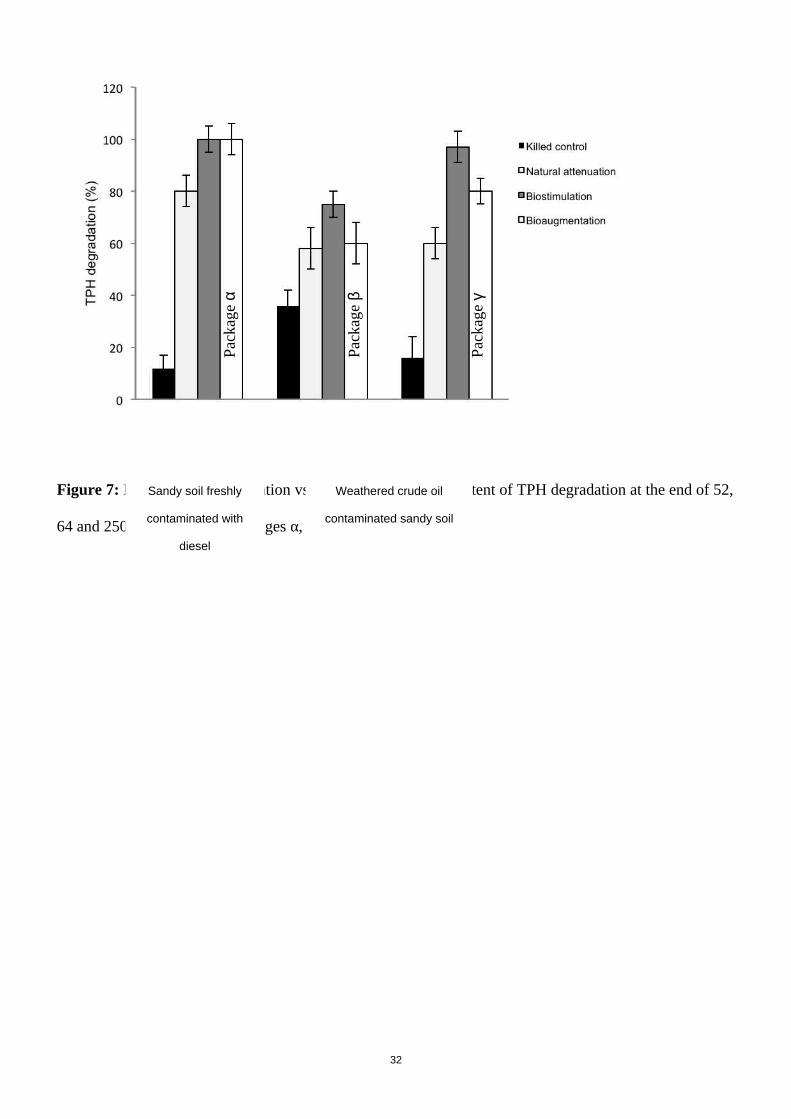
Figure 7: Effect of bioaugmentation vs. biostimulation on the extent of TPH degradation at the end of 52,
64 and 250 week trials for packages α, β and γ, respectively.
32
Sandy soil freshly
contaminated with
diesel
Weathered crude oil
contaminated sandy soil
Pac
kage
α
Pac
kage
β
Pac
kage
γ
A
B
Figure 8: Long-term evaluation of the effect of biostimulation on TPH degradation (A) over the first 37
weeks and (B) until 196 weeks for the fertilised soil. (Panel B: Presentation of the TPH data on a
logarithmic scale as the data cover a large range of values).
33

Table 1: Outline of the experimental set up of the seven microcosm experiments
Investigation Duration (weeks)
TreatmentsControls Fertiliser
Bulking agent AugmentationAbiotic Biotic Liquid Pelleted
Oil type A
Uncontaminated soil spiked with one of nine different oils
30 ✓ ✓1:1 ratio with sharp building sand for all treatments
Mercuric chloride and fertiliser levels
BSandy, loam and peaty soils
24 hours ✓ ✓ ✓
Bulking agent CSandy loam soil spiked with Brent crude oil
84 ✓ ✓ ✓
Fertiliser treatment bulked with either sterilised straw or pine bark
Fertiliser type D OBM & TBS 12 ✓ ✓ ✓ ✓Dry wood chips in 1:1 ratio for all treatments
Leaching E OBM & TBS 12 ✓ ✓ ✓ ✓Dry wood chips in 1:1 ratio for all treatments
Bioaugmentation F
Two weathered and one freshly oil contaminated soils with crude oil and diesel, respectively
52*, 64** and 150***
✓ ✓ ✓
Three different commercial bioaugmentation packages (α∗, β∗∗ and γ∗∗∗)
Bioremediation end-point
GSandy soil contaminated with crude oil
37 (extended to 196 weeks
for chemical analysis)
✓ ✓ ✓
OBM: oil based mud; TBS: tank bottom sludge
34

Table 2: Characteristics, removal rates and percentage removal of nine different oil types (Experiment A)
Sample DescriptionOil
TypeRemoval rates (mg kg-1 day-1) Removal (%)#
2 weeks 6 weeks 20 weeks 20 weeks 30 weeks
1. Diesel oil Commercial grade summer diesel available from retail filling station
Light - medium
295 107 39 61 [30] 82 [36]
2. Brunei crude oilLight crude oil, suitable for production of gasoline and middle distillates
light 107 51 30 54 [22] 77 [34]
3. Brent crude oilLight crude oil, suitable for production of gasoline and middle distillates
light 277 120 45 72 [29] 80 [32]
4. Gas oil A Burmah-Castrol/CONCAWE standard, light oil for biodegradation testing method development (CAS 64741-90-8)
Light - medium
304 176 66 74 [35] 82 [40]
5. XHVI gas oil Comparatively biodegradable, light oil for biodegradation testing method development (lube 2613)
Light - medium
223 113 50 68 [15] 70 [25]
6 Lubricating oil Automotive multi grade engine oil (Castrol GTX)
medium 188 79 31 56 [12] 57 [30]
7. 150 SN Dewaxed finished base oil
A Burmah-Castrol/CONCAWE standard, middle range lubricant base oil
medium-heavy
<1 30 4 9 [<1] 9 [<1]
8. 1200 SN Brightstock A Burmah-Castrol/CONCAWE standard heavy, de-asphalted distillation residue (CAS 64741-95-3)
heavy 68 110 32 42 [8] 45 [10]
9. Ondina 68 A marine oil of very low biodegradability (ST 85/128).
heavy <1 15 4 9 [<1] 9 [<1]
35

# Numbers in brackets denotes % removal attributed to abiotic loss
36

Table 3: Physicochemical characterisation of the soils
Sandy soil Silty-clay-loam Peaty soilSand (%) 93 20 29Silt (%) 4 54 33Clay (%) 3 26 38Organic carbon (%) 0.3 3.4 22Total nitrogen (%) 0.2 2.4 12pH 8.2 6.2 7.3Water content on collection (ml g-1) 0.07 0.17 0.54Field capacity (ml g-1) 0.23 0.67 1.12TPH (mg kg-1) 7042 7187 6550
37

Table 4: Concentration of fertiliser components in soils (w/w) and soil solution (w/v) based on a C:N:P ratio of 100:10:1
Oil concentration in soil (mg carbon equivalent g-1 soil)
Fertiliser concentrationmg g-1 soil d.w.
Fertiliser concentration in soil solution (g l-1)
Sandy soil Silty-clay-loam Peaty soil
N P N+P N P N+P N P N+P N P N+P100 29 5 34 204.3 35.7 240 71.5 12.5 84 42.7 7.5 5050 14 3 17 102.2 17.9 120 35.8 6.25 42 21.4 3.75 2525 7 1 8 51.1 8.95 60 17.9 3.12 21 10.7 1.88 1310 3 0.5 3 20.4 3.57 24 7.15 1.25 8 4.27 0.75 55 1.4 0.3 2 10.2 1.79 12 3.58 0.63 4 2.14 0.38 2.5
2.5 0.7 0.1 0.8 5.11 0.90 6 1.79 0.31 2 1.07 0.19 1.31 0.3 0.05 0.3 2.04 0.36 2.4 0.72 0.13 0.9 0.43 0.08 0.5
0.5 0.14 0.02 0.2 1.02 0.18 1.2 0.36 0.06 0.4 0.21 0.04 0.250.25 0.07 0.01 0.1 0.51 0.09 6 0.18 0.03 0.2 0.11 0.02 0.13
N: NH4NO3; P: KH2PO4 plus K2HPO4
38

Table 5: Extraction and analysis techniques employed for each microcosm study
Experiment
Sample preparation Analysis
Extraction Cleaning Class FractionationGC-FID* IR*
P/T- GC Soxhlet Ultrasonic Florisil Column chromatography
A ✓ ✓ ✓ ✓ ✓C ✓ ✓ ✓ ✓ ✓ ✓D ✓ ✓ ✓ ✓ ✓E ✓F ✓ ✓ ✓ ✓G ✓ ✓ ✓ ✓
GC-FID: gas chromatography coupled to flame ionisation detector; IR: Infra red spectroscopy; P/T GC: purge and trap coupled to gas chromatography
39
Copyright © 2022 FDOKUMEN