Accuracy of quantitative reconstructions in SPECT/CT imaging

Journal of King Saud University (Science) (2009) 21, 145–150
King Saud University
Journal of King Saud University
(Science)www.ksu.edu.sa
www.sciencedirect.com
ORIGINAL ARTICLE
Effect of energy window width on planer and SPECT
image uniformity
Mohamed Anwar K. Abdelhalim a,*, Rizk Abdel-Moneim Rizk b, Hamed I. Farag c,
Sameh Mustafa Reda c
a Department of Physics and Astronomy, College of Science, King Saud University, Saudi Arabiab Department of Physics, Faculty of Science, Helwan University, Egyptc Radiotherapy and Nuclear Medicine Department, National Cancer Institute, Cairo University, Egypt
Received 6 February 2009; accepted 24 June 2009Available online 5 August 2009
*
10
Pe
do
KEYWORDS
Diagnostic imaging;
Radiopharmaceutical;
SPECT;
Physical parameter;
Gamma camera
Corresponding author.
18-3647 ª 2009 King Sa
er-review under responsibilit
i:10.1016/j.jksus.2009.06.001
Production and h
ud Uni
y of King
osting by E
Abstract To detect radiopharmaceutical distribution in patient organs and avoid interpretation
mistakes, due to the protocol errors, a gamma camera must work in optimum conditions. One such
error is camera non-uniformity. Baron and Chouraqui [Baron, J.M., Chouraqui, P., 1996. Myocar-
dial single-photon emission computed tomographic quality assurance. J. Nucl. Cordial. 3(2), 157–
166] have reported the need to ensure consistently high image quality and accuracy using an opti-
mally chosen standardized protocol. It has been reported that single photon emission computed
tomography (SPECT) significantly improved contrast over the planer image and has the ability to
separate overlapping structures [Critchly, M., 1993. Nuclear Medicine Pocket Handbook, Amer-
sham International Plc, pp. 6–7]. Window width of energy is considered as one of the most important
physical parameters affecting the quality of planer and SPECT images. Thus, the effect of widow
widths of energy 5%, 10%, 15%, 20% and 25% on planer and SPECT images were investigated
using a Tc-99m source at 140 keV. Tc-99m is the most common isotope in nuclear medicine and
has one well-defined peakT in comparison with thallium, which has three peaks. In the present study,
it was evident that energy windowwidth played a prominent role in flood images uniformity using the
Tc-99m source. The calculated integral uniformity percentage (IU%) and differential uniformity per-
centage (DU%) values of center field of view (CFOV) and useful field of view (UFOV) were markedly
changed with a change of energy window width. The optimum energy window width was in the range
from 15% to 20%. Moreover, the effect of window widths of energy 5%, 10%, 15%, 20% and 25%
on SPECT image on a heart phantom with an artificial defect performed at the anterior wall of the
versity. All rights reserved.
Saud University.
lsevier
146 M.A.K. Abdelhalim et al.
heart was investigated. The SPECT images were clinically examined by a physician who reported a
different diagnosis for each energy window width due to vertical long axis cuts, which, in turn, were
due to the change in the collected counts. We concluded that the optimum energy window width was
also in the range 15–20% for the Tc-99m isotope, which confirmed previous planer results.
ª 2009 King Saud University. All rights reserved.
1. Introduction
In nuclear medicine imaging techniques, to obtain information
on physiological function and radiopharmaceutical distribu-tion in an organ of interest, the patient is injected with a suit-able radioactive isotope emitting gamma rays that can bedetected by a gamma camera. The scintillation gamma camera
is combined with a computer for analyzing and displaying therecorded images (Critchly, 1993). Gamma cameras are used inSPECT imaging where several static images from different an-
gles are recorded SPECT imaging is preferable than planerimaging because it displays the images in three directions,where the camera detects the distribution of the injected radio-
pharmaceutical from varying angles around the patient’s bodyat fixed intervals (Iskandrian and Heo, 1987). For SPECT sys-tems, the important acquisition is the area between spatial res-olution and sensitivity. Camera systems with two or more
heads surrounding the patient with more detectors have offeredgreater optimal spatial resolution and sensitivity characteristicsthan those available with a single-head system. Guidelines for
quality control (QC) testing and the choice of tests to be per-formed at certain intervals are given PP in the literature(Graham, 1995). Performance measurements of scintillation
cameras and other tests include pixel size calibration, linearitymeasurements, rotational sensitivity, mechanical alignment,energy distribution and counting rate capabilities (Groch and
Erwin, 2000, 2001). The common sources of artifacts werenon-uniformity in gamma-camera detectors, center of rotationerrors, misaligned cameras on multi-detector scanner systems,errors in image reconstruction, patient motion and radiotracer
uptake in non-target organs and attenuation. The best way toavoid these artifacts is to pay very close attention to the techni-cal factors of image acquisition, as well as processing away
from attenuation factors (Cerqueira and Matsuoka, 1988).Completed clinical studies must be checked for unacceptablepatient movement and incomplete views (DePuey, 1994). Bar-
on and Chouraqui (1996) have reported the need for ensuringconsistently high image quality and accuracy using on opti-mally standardized protocol. The effects of center-of-rotation(COR) shift on contrast and spatial resolution of SPECT sys-
tems (Saw, 1986) and shift of rotating camera-based SPECTsystem on the tomography of images (IAEA, 1991) have beenreported. SPECT, using a rotating gamma camera, also needs
accurate calibration of the electromechanical components,the detection system and reconstruction software (Agostiniet al., 1987). Advances in gamma-camera design over the last
10 years have improved all aspects of image quality, particu-larly for tomographic imaging (Groch and Erwin, 2000,2001). Advances in gamma-camera design have improved all
aspects of image quality, particularly for tomographic imaging(Groch and Erwin, 2000, 2001). Liu et al. (1999) evaluated theintegral uniformity (IU), differential uniformity (DU) and cor-rected relative standard deviation (CRSD). The most sensitive
indicator of gamma-camera performance is uniformity, be-cause it is performed on a daily basis as well as being the prin-ciple tool in evaluating the status of the camera. Most artifacts
related to integrity of the detector head, computer system andhard-copy device can be detected on the uniformity image. Thedetermination of the action level of gamma-camera non-unifor-mity is difficult as the reproducibilities of quality control mea-
surements, as well as the service adjustments, are usuallyunknown. Liu et al. (1999) have evaluated the reproducibilityof integral uniformity (IU), differential uniformity (DU) and
corrected relative standard deviation (CRSD). Nuclear medi-cine imaging has not reached the level of standardization andautomation, due to the large number of physical parameters
affecting image uniformity, since each individual parametermust be chosen or been aware of before commencing imaging.Moreover, there is a limited number of reports in this particular
field of study as controversy still surrounds the relevance of en-ergy window width on planer and SPECT image uniformity.Thus, as a step toward obtaining a through understanding ofthe relevance of energy window width on all aspects of image
quality, particularly tomographic imaging is required. In thisstudy, we examined the effect of energy window width usinga gamma camera on planer and SPECT images uniformity.
2. Materials and methods
2.1. Gamma camera
The gamma camera used in the present study is a dual-head,variable angle system, model E camera, manufactured by Sie-mens (USA), and installed in the National Cancer Institute(Cairo, Egypt). It consists of a gantry with detectors (including
remote hand control units and a display panel mounted on topof the gantry), detectors, collimators, collimator servers, p.
2.2. Tc-99m generator
It produces a sterile solution of Tc-99m as sodium pertechne-tate. This solution is eluted using 0.9% sterile and endotoxin-
free solution of sodium chloride from an alumina chromatog-raphy column. The Mo-99 (TB1n2B = 66.02 h) parent of Tc-99m (TB1n2B = 6.02 h) is adsorbed. The eluant, which consists
of nearly pure sodium pertechnetate, is then ready for combin-ing with an agent to form the radiopharmaceutical.
2.3. Dose calibrator
It consists of an ionization chamber (model VIk-304) andAVDC-304 control unit. It has a fixed setting for the well-
known isotopes, Tc-99m, Tl-201, I-131, etc. Both the ioniza-tion chamber and control unit are microprocessors, whichcommunicate with each other using a communication link.
The control unit commands the chamber to perform the

Figure 1 Relationship of energy of Tc-99m (keV) versus the
relative number of counts.
Effect of energy window width on planer and SPECT image uniformity 147
actions. Calibration factors for most isotopes can be set on thecontrol unit and are sent to the ionization chamber. The cali-bration factor for each isotope is used through the micropro-
cessor of the dose calibrator to calculate proper activity.
2.4. Preparation of a point
Ball of cotton with Tc-99m activity in the rage of 74–111 kBqis placed in a small plastic cone to obtain a small concentratedsource, to avoid scattering and enable concentrating the radio-
activity in a small and uniform size. A small piece of cotton(approximately 3 mm in diameter) is placed into the vial. Then,drops of Tc-99m are placed on the cotton.
2.5. Performing intrinsic flood uniformity calibration
The system updates the intrinsic correction data applied to pa-
tient studies only if at least 50 million counts are collected. ForSPECT images with 64 · 64 or 128 · 128 matrices, floods of 50million counts are sufficient to correct images. The patient po-
sition monitor (PPM) is used to verify that the count rate isapproximately the same at each detector. The pallet positionis adjusted until the count rate between the detectors falls with-
in the range of 5%. Non-uniformity is measured from thecounts stored in the individual pixel values, is recoded by thecomputer and calculated as follows:
2.6. The integral uniformity (IU) %
The difference between the higher and the lower pixel value:
IUð%Þ ¼ 100ðMax�MinÞ=ðMaxþMinÞ;
where Max is the maximum pixel count and Min is the mini-mum pixel count.
2.7. The differential uniformity (DU) %
The difference between two adjacent pixels:
DUð%Þ ¼ 100ðhi� lowÞ=ðhiþ lowÞ;
where hi is the max % pixel counts, and low is the min % pixelcounts, for all rows and columns within a localized line of pix-
els; (hi–low) is the largest deviation.
2.8. Effect of energy window width % on uniformity
This study was designed to investigate the relationship betweenIU% and DU% of CFOV and UFOV and window widths ofenergy 5%, 10%, 15%, 20% and 25%. Off-peak shift of
energy was at 0% during the experiment with the windowcentered at the middle of the peak. The analyzer is openedto adjust off peak and the energy window width at 5%.
2.9. Acquisition parameters
2.9.1. Camera information
Matrix size 256 · 256, magnification 1.0, off peak 0% andcount rate 50 kcuts/s.
2.9.2. Scan information
The collected counts are 50,000,000 counts.
2.10. Effect of energy window width % on SPECT image using aheart phantom
The outer cavity of a heart phantom was filled with approxi-mately 56 kBq Tc-99m. The heart phantom was fixed inside
a lung phantom and was filled with water. The cover platewas placed on the phantom, was tighten, and pressure wasgently applied by hand to the plate and was carefully screwed
in the cover plate screws. The phantom was filled through thefiller holes from the top cover plate using syringe; water wasinjected into the phantom until the solution level nears the cov-
er plate. All the filler plugs were screwed and left one. Thephantom was tilted so that the remaining air bubbles weremoved toward the open filler hole, water was steadily injectedinto the open hole until the phantom was completely filled and
lastly was screwed in the final filler plug.This study was done using a heart phantom in multi-
SPECT acquisitions, at five different window widths of energy
5%, 10%, 15%, 20% and 25% with the same parameters ineach acquisition. The heart lung phantom was prepared asbefore, the phantom was placed on the patient bed as a patient,
all the acquisition parameters were fixed, and then the acquisi-tion of SPECT was started. The energy window widths as 5%,10%, 15% 20% and 25% were used, and then the previoussteps were repeated.
2.10.1. Camera information
The used parameters were matrix size 64 · 64, magnification1.45, window widths of energy 5%, 10%, 15% 20% and
25% and count rate 50 kcuts/s. We have used matrix sizes of64 · 64 or 128 · 128, which in SPECT studies is in accordanceto the international recommendation for saving computermemory, decreasing the time of collecting counts and obtain-
ing the best quality images. Moreover, the time of investigationthe patient was limited and very short, �15 min; throughoutthis period the patient should be fixed without any motion to
eliminate image artifacts.
2.10.2. Scan information
The used parameters were rotation-type step and shoot, orbit-type body contour, number of views per scan: 32 and detectors
configuration: 90o.
3. Results
Fig. 1 represents the relationship between the energy of Tc-99m (keV) and the relative number of counts.
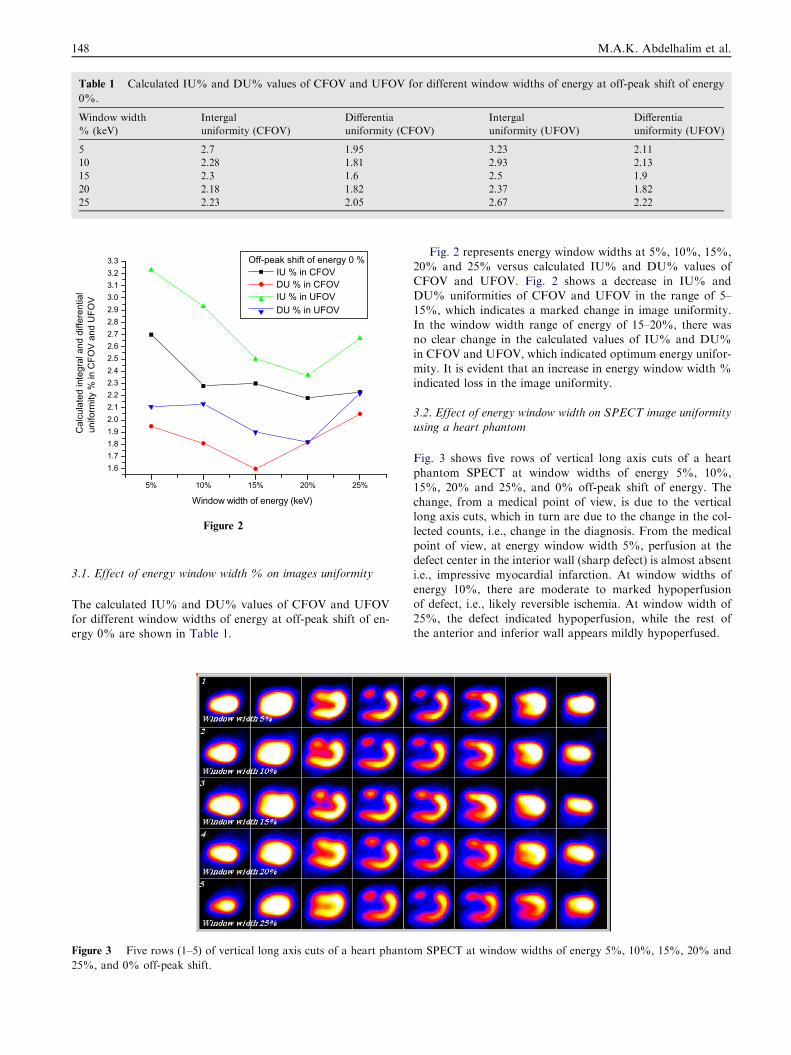
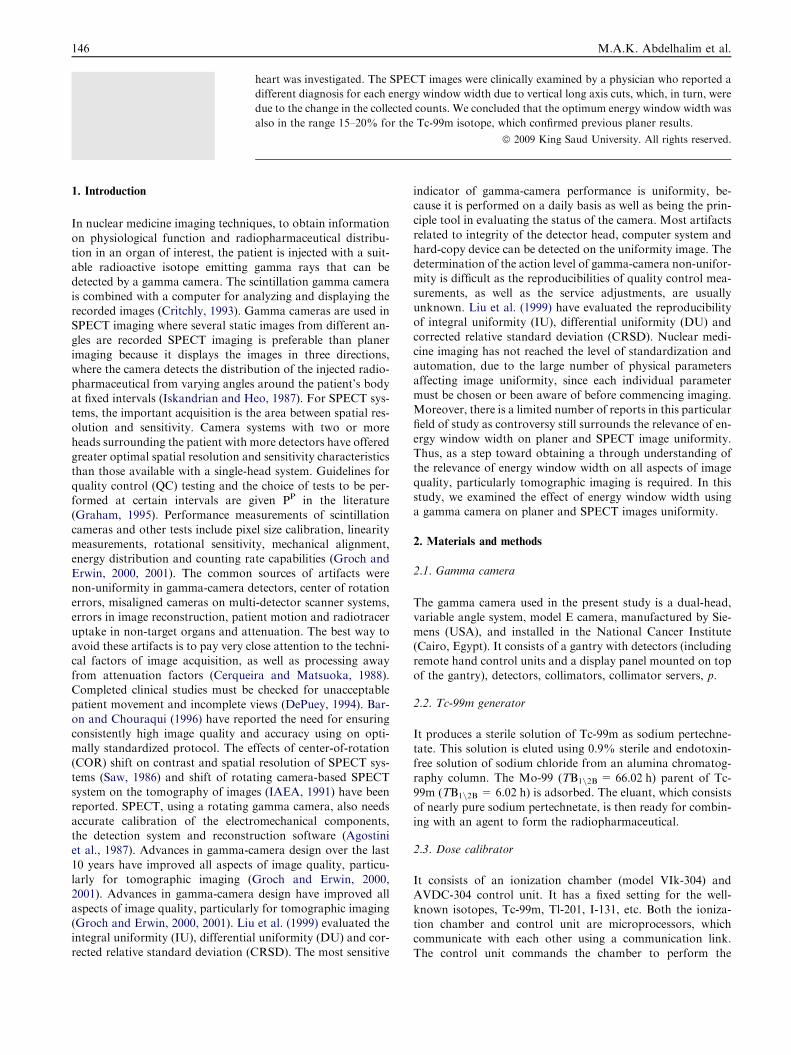
Table 1 Calculated IU% and DU% values of CFOV and UFOV for different window widths of energy at off-peak shift of energy
0%.
Window width
% (keV)
Intergal
uniformity (CFOV)
Differentia
uniformity (CFOV)
Intergal
uniformity (UFOV)
Differentia
uniformity (UFOV)
5 2.7 1.95 3.23 2.11
10 2.28 1.81 2.93 2.13
15 2.3 1.6 2.5 1.9
20 2.18 1.82 2.37 1.82
25 2.23 2.05 2.67 2.22
5% 10% 15% 20% 25%
1.61.71.81.92.02.12.22.32.42.52.62.72.82.93.03.13.23.3
Cal
cula
ted
inte
gral
and
diff
eren
tial
unifo
rmity
% in
CFO
V an
d U
FOV
Window width of energy (keV)
Off-peak shift of energy 0 % IU % in CFOV DU % in CFOV IU % in UFOV DU % in UFOV
Figure 2
148 M.A.K. Abdelhalim et al.
3.1. Effect of energy window width % on images uniformity
The calculated IU% and DU% values of CFOV and UFOVfor different window widths of energy at off-peak shift of en-ergy 0% are shown in Table 1.
Figure 3 Five rows (1–5) of vertical long axis cuts of a heart phanto
25%, and 0% off-peak shift.
Fig. 2 represents energy window widths at 5%, 10%, 15%,20% and 25% versus calculated IU% and DU% values of
CFOV and UFOV. Fig. 2 shows a decrease in IU% andDU% uniformities of CFOV and UFOV in the range of 5–15%, which indicates a marked change in image uniformity.
In the window width range of energy of 15–20%, there wasno clear change in the calculated values of IU% and DU%in CFOV and UFOV, which indicated optimum energy unifor-
mity. It is evident that an increase in energy window width %indicated loss in the image uniformity.
3.2. Effect of energy window width on SPECT image uniformityusing a heart phantom
Fig. 3 shows five rows of vertical long axis cuts of a heart
phantom SPECT at window widths of energy 5%, 10%,15%, 20% and 25%, and 0% off-peak shift of energy. Thechange, from a medical point of view, is due to the verticallong axis cuts, which in turn are due to the change in the col-
lected counts, i.e., change in the diagnosis. From the medicalpoint of view, at energy window width 5%, perfusion at thedefect center in the interior wall (sharp defect) is almost absent
i.e., impressive myocardial infarction. At window widths ofenergy 10%, there are moderate to marked hypoperfusionof defect, i.e., likely reversible ischemia. At window width of
25%, the defect indicated hypoperfusion, while the rest ofthe anterior and inferior wall appears mildly hypoperfused.
m SPECT at window widths of energy 5%, 10%, 15%, 20% and

Effect of energy window width on planer and SPECT image uniformity 149
4. Discussion
The most sensitive indicator of gamma-camera performance isuniformity, because it is carried out on a daily basis. Moreover,
it is the principle tool in evaluating the status of a gamma cam-era. Most artifacts, related to the effect of integrity of the detec-tor head, computer system and hard-copy device on image
uniformity, have been investigated (Groch and Erwin, 2000,2001). The common sources of artifacts are non-uniformity ingamma-camera detectors, center of rotation errors, misaligned
cameras on multi-detector scanner systems, errors in imagereconstruction, patient motion and radiotracer uptake in non-target organs and attenuation (Young et al., 1990). In the presentstudy, we investigated the effect of widow widths of energy 5%,
10%, 15%, 20% and 25% on Planer and SPECT images using aTc-99m source at energy 140 keV. IU% and DU% of CFOVand UFOV and window widths of energy 5%, 10%, 15%,
20% and 25% were calculated. Off-peak shift of energy was at0% during all experiments with the window centered at the mid-dle of the peak.We conclude that the calculated IU% andDU%
of CFOV and UFOV showed changes at window widths 5%,10% and 25%, which indicatedmarked changes in image unifor-mity. For window width of energy 15–20%, there was no clear
change in the calculated values of IU% and DU% of CFOVand UFOV, which indicated optimum energy uniformity. More-over, energy window width P25% indicated loss in imageuniformity. It is evident that energy window width plays a prom-
inent role in flood image uniformity using a Tc-99m source.To elucidate the effects of energy windowwidth%on SPECT
images, a heart phantom with an artificial defect in the anterior
wall of the heart at five different window widths of energy 5%,10%, 15%, 20% and 25% with the same parameters in eachacquisition was investigated. SPECT images were clinically inter-
preted by a physician who reported different diagnosis for eachenergy window width due to changes in perfusion. Among pos-sible significant factors not dealt with in the present study, an
investigation of the effects of thallium-201 on planner andSPECT image uniformity is recommended, as thallium-201, atleast in Europe, is still a frequently used tracer for heart studies.
References
Agostini, A., De Zatta, G., Bagliani, G., Tarolo, G.L., 1987. Proposal
for a quality control procedure for rotating gamma camera
tomographic systems. Radiol. Med. 74 (1–2), 109–115.
Baron, J.M., Chouraqui, P., 1996. Myocardial single-photon emission
computed tomographic quality assurance. J. Nucl. Cordial. 3 (2),
157–166.
Cerqueira, M.D., Matsuoka, D., 1988. The influence of collimators
on SPECT center of rotation measurements; artifact
generation and acceptance testing. J. Nucl. Med. 29 (8),
1393–1397.
Critchly, M., 1993. In: Nuclear Medicine Pocket Handbook.
Amersham International Plc, pp. 6–7.
DePuey, E.G., 1994. How to detect and avoid myocardial perfusion
SPECT artifacts. J. Nucl. Med. 35 (4), 699–702.
Graham, L.S., 1995. Quality control for SPECT systems. Radiograph-
ics 15 (6), 1471–1481.
Groch, M.W., Erwin, W.D., 2000. SPECT in year 2000; basic
principles. J. Nucl. Med. Technol. 28 (4), 233–244.
Groch, M.W., Erwin, W.D., 2001. Single-photon emission computed
tomography. Instrumentation and quality control. J. Nucl. Med.
Technol. 29, 12–18.
IAEA, 1991. Quality control of nuclear medicine instrumentation.
Iskandrian, A.S., Heo, J., 1987. Thallium imaging with single
photon emission computed tomography. Am. Heart J. 114 (4),
852–865.
Liu, Y.H., Sinusas, A.J., DeMan, P., Zaret, B.L., Wackers, F.J., 1999.
Quantification of SPECT myocardial perfusion images; methodol-
ogy and validation of the Yale_CQ method. J. Nucl. Cardiol. 6 (2),
190–204.
Saw, C.B., 1986. Effects of centre-of-rotation shift on contrast and
spatial resolution of the SPECT system. Nucl. Med. Commun. 7
(5), 373–379.
Young, K.C., Kourisk, Awdeh, M., Abdel-Dayem, H.M., 1990.
Reproducibility and action levels for gamma camera uniformity.
Nucl. Med. Commun. 11 (2), 95–101.
Further reading
Early, P.J., 1995. Text Book of Nuclear Medicine Technology, 4th ed.
Mosby, London, pp. 180–248.
NEMA, 1994. Performance Measurements of Scintillation Cameras,
Standards Publication 1.
O’Connor, M.K., 1996. Instrument and computer-related problems
and artifacts in nuclear medicine. Semin. Nucl. Med. 26 (4), 256–
277.
Sorenson, J.A., Phelps, M.E., 1987. Physics in Nuclear Medicine,
second ed. Grune and Stratton, New York.
Spies, S.M., 2000. Oral communications. An example of an initial bone
scan using the Starbrite TM crystal system.
Wallis, J.W., 1995. Increased sensitivity through use of overlapping
180 degrees orbits in clinical myocardial perfusion imaging. Eur. J.
Nucl. Med. 22 (6), 543–547.

150 M.A.K. Abdelhalim et al.
Copyright © 2022 FDOKUMEN