pressure non-uniformity in heterogeneous foods - RUcore
130
PRESSURE NON-UNIFORMITY IN HETEROGENEOUS FOODS DURING HIGH PRESSURE PROCESSING BY JOSÉ ANTONIO MALDONADO UGAZ A dissertation submitted to the Graduate School-New Brunswick Rutgers, The State University of New Jersey In partial fulfillment of the requirements for the degree of Doctor of Philosophy Graduate Program in Food Science Written under the direction of Dr. Mukund V. Karwe And approved by ___________________________________________ ____________________________________________ ____________________________________________ ____________________________________________ New Brunswick, New Jersey May 2015
-
Upload
khangminh22 -
Category
Documents
-
view
0 -
download
0
Transcript of pressure non-uniformity in heterogeneous foods - RUcore

PRESSURE NON-UNIFORMITY IN HETEROGENEOUS FOODS
DURING HIGH PRESSURE PROCESSING
BY
JOSÉ ANTONIO MALDONADO UGAZ
A dissertation submitted to the
Graduate School-New Brunswick
Rutgers, The State University of New Jersey
In partial fulfillment of the requirements
for the degree of
Doctor of Philosophy
Graduate Program in Food Science
Written under the direction of
Dr. Mukund V. Karwe
And approved by
___________________________________________
____________________________________________
____________________________________________
____________________________________________
New Brunswick, New Jersey
May 2015

ii
ABSTRACT OF THE DISSERTATION
Pressure Non-Uniformity in Heterogeneous Foods during High
Pressure Processing
by JOSÉ ANTONIO MALDONADO UGAZ
Dissertation Director:
Mukund V. Karwe, Ph.D.
High Pressure Processing (HPP) has gained acceptance as a technology that
improves the safety of food products with minimal changes on its organoleptic
properties. It is generally assumed that the internal pressure distribution in foods during
HPP is uniform. This may not be true for solids with hard inclusions, like meats with
bones or for particulate foods, which could compromise their safety and shelf-life.
Numerical simulations of stress distribution in a solid with a hard inclusion showed
existence of pressure and shear stress gradients. Our work aimed at determining if these
gradients would affect microbial inactivation. Additionally we attempted to develop a
pressure sensor and a method to monitor microbial inactivation in real-time.

iii
Model systems consisting of a gel with a wood rod inclusion, embedded glass
wool, or plaster particles were inoculated with Listeria innocua or Saccharomyces
cerevisiae and subjected to HPP. A FRET system composed of DPH and Nile red was
investigated as a possible pressure sensor. Propidium iodide was used to monitor the
inactivation of Enterobacter aerogenes.
No differences were found in the inactivation of bacteria at different positions in
the gel with wood inclusion. However, 2% glass wool decreased the inactivation of
bacteria by 1 log cfu/g compared to pure gel. Higher inclusion volumes caused further
drops in the inactivation levels. The yeast inactivation decreased by 1 log cfu/g with 2%
plaster, but at 27% it reverted to the levels of the pure gel. It was determined that stress
gradients formed very close to the inclusions, and that pressure and shear would affect
each organism differently.
The FRET system was not an adequate pressure sensor. Membrane rupturing
was detected during pressurization and holding but not during depressurization. A
larger-than-expected drop in fluorescence was observed after cycles at higher pressure
and longer times. This drop couldn’t be explained by volume expansion alone, and the
drop was not instantaneous. We suspect this drop in fluorescence came from reversible
disassociation of ribosomes, occurring after cell wall and membranes rupture.
Our research has begun to elucidate the mechanisms of microbial inactivation by
HPP, which could help in designing more effective processes.

iv
Acknowledgments
This research project wouldn´t have been possible without the involvement of
several people. First, I would like to deeply thank Dr. Mukund Karwe for his support,
mentorship, and patience during the last seven years of my M.S. and Ph.D. studies. It
was a pleasure working in his lab and learning under his guidance (especially when he
demanded a little bit of extra effort), and I am sure that he’ll be extremely successful in
his new position as Dean of International Programs at SEBS, Rutgers. I would also like to
thank Dr. Abilash Nair and Yuta Miyazawa for carrying out the numerical simulations
that provided a theoretical foundation to our work, and Dr. Donald Schaffner and Dr.
Alberto Cuitiño for always providing input from their expertise in Food Microbiology and
Solid Mechanics, respectively, which were fundamental for designing our experiments
and interpreting the results. And I would like to thank Dr. Donald Schaffner, Dr. Kit Yam,
and Dr. Alberto Cuitiño for serving on my thesis committee.
I would also like to acknowledge Dr. Maria Corradini and Dr. Gil-Soo Han for their
input in designing the fluorescence measurement experiments during high pressure
processing. I would also like to thank Dave Petrenka, Bill Sumal, and Frank Caira, who
were extremely knowledgeable and helpful in repairing and giving maintenance to our
high pressure units.
Also, I would like to acknowledge the National Institute of Food and Agriculture
(NIFA) of the U.S. Department of Agriculture (USDA) for funding this project under
award Nº 2009-65503-05799.

v
Finally, I thank all my family and friends for their support during the last seven
years. I want to thank my lab mates – past and present – Meenakshi, Deepti, Swetha,
Shalaka, Gabriella, Vidya, Nidhi, Tanya, Siddhi, Yijing, Neha, Soundharya, Lin, Noopur,
Tina, Isha, Gabriel, Anand, Li, Rajay, Karthik, Siddharth, Ender, and Kiran, for their
encouragement, input, and for creating an amazing work environment (even when
grabbing my stuff in the lab!). I want to specially thank my parents, Patricia and Pacho,
and my sister, María Fe, for their constant support and encouragement. Without it, it
would have been impossible to work successfully abroad. And I want to thanks Lisa, for
her support and being there for me in the last stage of this project.

vi
Table of Contents
Abstract ....................................................................................................................ii
Acknowledgments................................................................................................... iv
Table of Contents .................................................................................................... vi
List of Tables ........................................................................................................... ix
List of Figures ........................................................................................................... x
1. Introduction .................................................................................................. 1
1.1. High Pressure Processing ....................................................................... 1
1.2. Heat transfer during high pressure processing ..................................... 5
1.3. Mass transfer during high pressure processing .................................. 13
1.4. Effect of high pressure on bioactive compounds ................................ 17
1.5. Effect of high pressure on microorganisms ......................................... 19
1.6. Hydrostatic pressure as a component of stress .................................. 27
2. Rationale and Hypothesis ........................................................................... 36
2.1. Rationale .............................................................................................. 36
2.2. Theoretical Background ....................................................................... 37
2.3. Hypotheses .......................................................................................... 43
2.4. Objectives ............................................................................................ 44
3. Preliminary Experiments ............................................................................. 46
3.1. Materials and Methods ....................................................................... 46

vii
3.1.a. High Pressure Processing Equipment .............................................. 46
3.1.b. Experiments in a Real Food System ................................................. 48
3.1.c. Experiments with a Gel Model System ............................................ 50
3.2. Results and Discussion ......................................................................... 51
4. Non-Uniformity of Microbial Inactivation in Gel Model Systems during High
Pressure Processing .................................................................................... 54
4.1. Literature Review ................................................................................ 55
4.2. Materials and Methods ....................................................................... 56
4.2.a. Microbial Suspension ....................................................................... 56
4.2.b. Samples Preparation and Microbial Ennumeration......................... 56
4.2.c. High Pressure Processing ................................................................. 60
4.2.d. Microbial Enumeration .................................................................... 60
4.2.e. Material Characterization ................................................................ 61
4.2.f. Statistical Analysis ............................................................................ 64
4.3. Results and Discussion ......................................................................... 65
4.3.a. Material Characterizations ............................................................... 65
4.3.b. Microbial inactivation ...................................................................... 66
5. Development of a Fluorescent Pressure Sensor and In situ Studies of
Microbial Inactivation during High Pressure Processing ............................ 79
5.1. Literature Review ................................................................................ 80
5.1.a. Mechanism of Förster Resonance Energy Transfer (FRET) .............. 80

viii
5.1.b. Use of Fluorescent Dyes in Cell Inactivation Studies ....................... 81
5.2. Materials and Methods ....................................................................... 81
5.2.a. High Pressure Processing ................................................................. 81
5.2.b. Development of a Pressure Sensor .................................................. 83
5.2.c. In situ Studies of Microbial Inactivation during HPP ....................... 84
5.3. Results and Discussion ......................................................................... 86
5.3.a. Development of a Pressure Sensor .................................................. 86
5.3.b. In situ Studies of Microbial Inactivation during HPP ....................... 89
6. Conclusions ............................................................................................... 101
7. Future Work .............................................................................................. 103
8. Acknowledgments of Previous Publications ............................................. 105
9. Bibliography .............................................................................................. 106

ix
List of Tables
Table 1-1: Temperature increase during HPP of selected substances ................... 8
Table 1-2: Values of Poisson's ratio for some materials ....................................... 33
Table 4-1: ANOVA for reduction of L. innocua at different positions in the model
system with one inclusion. ................................................................................... 67
Table 4-2: ANOVA of reduction of Listeria innocua in the gelatin-agar gel with
glass wool model system. ..................................................................................... 69
Table 4-3: ANOVA of reduction of Saccharomyces cerevisiae in the gelatin-agar
gel with glass wool model system. ....................................................................... 69
Table 4-4: ANOVA of Listeria innocua reduction in agar gel with plaster particles
model system. ....................................................................................................... 71
Table 4-5: ANOVA of Saccharomyces cerevisiae reduction in agar gel with plaster
particles model system. ........................................................................................ 71
Table 4-6: ANOVA of Listeria innocua reduction in water and agar gels with
CaSO4. .................................................................................................................... 72
Table 5-1: Change in volume of water between atmospheric pressure and high
pressures. .............................................................................................................. 96
Table 5-2: Microbial reductions achieved at each stage of the processes. .......... 96

x
List of Figures
Figure 1.1: A typical high pressure vertical vessel with peripheral components
(Courtesy: Elmhurst Research, Inc.) ........................................................................ 2
Figure 1.2: Diagram of pressure (blue line) and temperature (red line) during
HPP. ......................................................................................................................... 3
Figure 1.3: Density and heat capacity of pure water at 25 ºC between 50 and 700
MPa (Harvey et al., 2010) ....................................................................................... 7
Figure 1.4: Isotherms in water and s.steel vertical vessel at Ti = 368 K, P = 700
MPa, Tinlet = 298 K, Q = 860,000 W/m3 for (0 ≤ t ≤ 180 s), (a) without insulation,
& (b) with insulation (12.7 mm thick) at the end of pressurization (180 s)
(Khurana, 2012) .................................................................................................... 12
Figure 1.5: Coefficient of variance in a 10 L vertical vessel during high pressure
processing at 700 MPa with initial temperature of 95 ºC (Khurana, 2012). ........ 13
Figure 1.6: Quercetin infused in frozen-thawed cranberries at atmospheric
conditions and during high pressure processing (Mahadevan and Karwe, 2011).
............................................................................................................................... 15
Figure 1.7: Zp values of frozen-thawed cranberries before and after high
pressure processing (Mahadevan and Karwe, 2011). .......................................... 16
Figure 1.8: Microstructure of frozen-thawed cranberry flesh before (left) and
after (right) high pressure processing (Mahadevan and Karwe, 2011). ............... 16
Figure 1.9: Diagram of a bacteria cell (Madigan et al., 2006). ............................. 26

xi
Figure 1.10: Electron microscope image of Sacharomyces cerevisiae (yeast)
(Madigan et al., 2006). .......................................................................................... 26
Figure 1.11: Stress Components in a Cartesian coordinate system ..................... 29
Figure 1.12: Solid under uniaxial stress ................................................................ 31
Figure 1.13: Solid under shear stress. Solid lines are the original shape, dashed
lines are the deformed shape during application of shear stress. ....................... 34
Figure 2.1: (A) Heterogeneous solid under high pressure; (B) independent
compression of the materials; and (C) materials bound at the interface ............ 38
Figure 2.2: Schematic of the two-dimensional axi-symmetric model used for
numerical simulation. The vertical dashed line in red is the line of axi-symmetry
of the model, while the horizontal red dashed line represents the plane of model
symmetry. ............................................................................................................. 39
Figure 2.3: Axi-symmetric finite element analysis mesh. The hard insert was
between 0 to 8 mm radius (r) and the soft material was between 8 and 38 mm
(a=38 mm). ............................................................................................................ 41
Figure 2.4: Numerical simulation of pressure stress (left) and shear stress (right).
The shaded grey region represents the location of the hard inclusion................ 42
Figure 2.5: Effects of (a) pressure stress, and (b) shear stress on the geometry of
a solid .................................................................................................................... 44
Figure 3.1: 10 L High pressure vessel (steel cylinder) and control panel. ............ 47
Figure 3.2: Scheme of the inoculation procedure for turkey and chicken
drumsticks ............................................................................................................. 48

xii
Figure 3.3: Chicken drumstick after HPP. The green regions indicate the
Salmonella inoculum ............................................................................................. 49
Figure 3.4: Schematic of the first model system. The blue ovals indicate the
inoculation locations. ............................................................................................ 51
Figure 3.5: Survival of Salmonella at different positions in the turkey drumstick
after high pressure processing (n=4). The dashed line indicates the limit of
detection. .............................................................................................................. 52
Figure 3.6: Survival of Salmonella at different positions in the gel model system
after high pressure processing (n=9). The dotted line indicates the limit of
detection. .............................................................................................................. 52
Figure 4.1: Model system of gelatin-agar gel in a bottle around a wood inclusion.
The ovals indicate the sampling locations. ........................................................... 57
Figure 4.2: Gelatin-agar gel model system with a single inclusion, inside the
plastic jar (left) and outside the jar (right). ........................................................... 58
Figure 4.3: Gelatin-agar gel with dispersed glass wool inclusions ....................... 58
Figure 4.4: Agar gel with dispersed plaster of Paris particles. .............................. 59
Figure 4.5: 26 mL high pressure vessel on the Carver press (left); detail of the
LVDT sensor (right). ............................................................................................... 62
Figure 4.6: Bulk modulus (K) at high pressure of the different materials used in
the model systems. Different letter subscripts indicate significant difference
(α=0.05) between means using t-test. .................................................................. 65

xiii
Figure 4.7: Microscope image at 100x magnification of the agar gel + 2% plaster
of Paris model system. Circles indicate plaster particles. ..................................... 66
Figure 4.8: Reduction of Listeria innocua at different positions in the gelatin-gel
with a single wood inclusion model system (n=4). ............................................... 67
Figure 4.9: Microbial reduction in the model system of gelatin-agar gel with glass
wool fibers (n=4). Statistical analysis done between results for the same
organism. .............................................................................................................. 68
Figure 4.10: Microbial reduction in the model system of agar gel with plaster
particles (Listeria: n=4, Saccharomyces: n=7). Statistical analysis done between
results for the same organism. ............................................................................. 70
Figure 4.11: Reduction of Listeria innocua after high pressure processing in water
and agar gel with calcium sulfate (n=4 for water, n=7 for water + CaSO4 and agar,
n=4 for agar + CaSO4). ........................................................................................... 72
Figure 4.12: Schematic of the likely yeast cell compression and deformation
during high pressure processing. .......................................................................... 77
Figure 5.1: Tabletop high pressure system, with spectrometer and LED lamp
(bottom left).......................................................................................................... 82
Figure 5.2: Schematic of sapphire windows in high pressure vessel (not on scale).
............................................................................................................................... 83
Figure 5.3: Spectrum of different concentrations of Nile red at atmospheric
pressure. ............................................................................................................... 87
Figure 5.4: Fluorescence peak emissions (643 nm) of Nile red. ........................... 87

xiv
Figure 5.5: Fluorescence intensity at 643 nm during pressurization of 4 µM Nile
red and 12 µM DPH, with excitation at 545 nm. .................................................. 88
Figure 5.6: Emission intensity at 622 nm during a process consisting of:
a)Pressurization to 207 MPa (30 kpsi) and hold time of 3 min; b)instant
depressurization and held at atmospheric pressure for 2 min; c)pressurization to
276 MPa (40 kpsi) and hold time of 3 min; d)instant depressurization and held at
atmospheric pressure for 2 min; e)pressurization to 345 MPa (50 kpsi) and hold
time of 3 min; f)instant depressurization and held at atmospheric pressure for 2
min. ....................................................................................................................... 90
Figure 5.7: Relative change of emission intensity at 622 nm after
depressurization of each of the three pressure holding stages on Figure 5.6. .... 91
Figure 5.8: Emission intensity at 622 nm during a process consisting of:
a)Pressurization to 276 MPa (40 kpsi) and hold time of 45 s; b)instant
depressurization and held at atmospheric pressure for 2 min; c)pressurization to
276 MPa (40 kpsi) and hold time of 4 min; d)instant depressurization and held at
atmospheric pressure for 2 min; e)pressurization to 207 MPa (30 kpsi) and hold
time of 2 min; f)instant depressurization and held at atmospheric pressure for 3
min. ....................................................................................................................... 92
Figure 5.9: Relative change of emission intensity at 622 nm after
depressurization of each of the three pressure holding stages on Figure 5.8. .... 93
Figure 5.10: Emission intensity at 622 nm during a process consisting of:
a)pressurization to 207 MPa (30 kpsi) and hold time of 7 min; b)pressurization to

xv
276 MPa (40 kpsi) and hold time of 6 min; d)instant depressurization and held at
atmospheric pressure for 3 min............................................................................ 94
Figure 5.11: Relative change of emission intensity at 622 nm after
depressurization of in the process on Figure 5.10. .............................................. 95

1
1. Introduction
This section includes some of the basic concepts of high pressure processing and
its application in food processing. Sections 1.1, 1.5, and 1.6 are directly related to the
work done in this project and are important to understand how the hydrostatic pressure
applied on the surface of the food items generates internal stress in food materials, and
how microorganisms react to high pressure.
1.1. High Pressure Processing
High pressure processing (HPP) is a non-thermal processing technology that has
been proven capable of extending the shelf life and increasing the safety of food
products (Rendueles et al., 2011). Besides irradiation, it is the most advanced alternative
physical processing technology, as commercially viable high pressure processes have
already become available within the last 20 years (Hendrickx and Knorr, 2002). Some of
the commercial high pressure processed food products include sliced ham, oysters,
clams, guacamole, fruit juices, fruit purees, ready-to-eat meals, dips and salsas.
HPP of food products is done mostly in batch processes. Figure 1.1 shows a
typical high pressure processing set up. During HPP, the product is placed inside a
processing vessel, which is filled with the pressure transmitting medium (usually water),
pressurized either by pumping more pressure transmitting medium into the vessel or by
using a piston to apply pressure. Once the target pressure is achieved, it is held for a

2
predefined period of time and then released very suddenly (Sun, 2005), as shown in
Figure 1.2. Along with pressure, the temperature of the pressurizing medium and of the
food items also increase during pressurization. Due to this temperature increase, a
gradient with the vessel volume is established during the holding time, causing the
temperature of the medium and of the food product to drop slightly as heat transfer to
the vessel wall takes place. Therefore, after the pressure release, the temperature of
the medium and food drops to values below the initial temperature, due to cooling
associated with decompression.
Figure 1.1: A typical high pressure vertical vessel with peripheral
components (Courtesy: Elmhurst Research, Inc.)

3
Figure 1.2: Diagram of pressure (blue line) and temperature (red line)
during HPP.
One of the main advantages of HPP over thermal pasteurization, from the
processing point of view, is that the pressure is considered to be transmitted uniformly
and quasi-instantaneously throughout the sample, regardless of size, shape or packaging
(Rendueles et al., 2011; Doona and Feeherry, 2007; Brennan, 2006; Barbosa-Canovas et
al., 2005; Sun, 2005). According to the reviewed literature, there are no limitations to
the validity of these principles.
One of the main goals of HPP is to reduce the number of microorganisms in food
products (Doona and Feeherry, 2007), in order to increase the safety and extend the
shelf life of the products. HPP has been shown to cause relatively large reductions of
vegetative cells in many different food products. For example, a 7 log cfu/mL reduction
of Staphylococcus aureus was observed in apricot juice after HPP at 350 MPa for 5 min
Pre
ssu
re, T
em
pe
ratu
re
Time
Pressurization Hold time
Depressurization

4
at 30 ºC (Bayındırlı et al., 2006), and a 7 log cfu/mL reduction of Listeria Monocytogenes
was achieved in orange juice after HPP at 600 MPa for 5 minutes (Dogan and Erkmen,
2004). In other cases the achieved reduction has been much lower, such as 2.6 log cfu/g
of E. Coli O103:H25 in dry-fermented sausage after 600 MPa for 10 minutes (Omer et
al., 2010), 2 log cfu/g of total aerobic mesophiles in clams after 545 MPa for 4 minutes
(Narwankar et al., 2011), 1.9 log cfu/g of a Salmonella enterica cocktail in peanut butter
after 600 MPa for 18 minutes (D'Souza et al., 2012), and 2.25 log cfu/g of Salmonella
Braenderup in whole and cut tomatoes after 550 MPa for 2 minutes (Maitland et al.,
2011). All these results indicate that the microbial inactivation levels are highly
dependent on the pressure and time of the process as well as the food matrix and the
target microorganism. Small differences in the applied pressure can have large effects
on the inactivation levels; for example, Koseki and Yamamoto (2007) measured a
difference of 3 log CFU/g between the inactivation of E. coli ATCC 25922 at 300 MPa and
250 MPa at 15 ºC in peptone water suspension.
The temperature of the process also plays a role in the microbial inactivation
(Buzrul et al., 2008b; Teo et al., 2001). Extensive research has been done on
characterizing the heat transfer between the food items, pressurizing medium, and steel
vessel and how it influences temperature non-uniformity during processing (Khurana,
2012; Zhang, 2011; Khurana and Karwe, 2009; Denys et al., 2000a; Denys et al., 2000b).
This will be discussed in more detail in the next section.

5
Other applications for HPP of foods that have been researched include enhanced
diffusivity of compounds into food matrices (Mahadevan and Karwe, 2011; Rastogi et
al., 2000; Rastogi and Niranjan, 1998) and the effect on bioactive compounds (Rawson
et al., 2011; Oey et al., 2008a; Oey et al., 2008b).
1.2. Heat transfer during high pressure processing
High pressure processing of foods is usually classified as a non-thermal
technology; however it is necessary to be applied in combination with other treatments,
usually heating, in order to achieve meaningful inactivation of bacterial and fungal
spores. For example, Sale et al. (1970) carried out studies on spores of several species of
Bacillus and achieved reductions no higher than 2 log cfu/mL of suspension after high
pressure processing at 20 ºC for 1 hour and pressures between 100 and 800 MPa. On
the other hand, Ananta et al. (2001) were able to achieve reductions of 6 log cfu/g of
Bacillus stearothermophilus spores ATCC 7953 in mashed broccoli after high pressure
process at 600 MPa and 120 ºC for 20 minutes.
The studies on the interaction between pressure and temperature in spores
inactivation led to a petition to the FDA for the commercial use of pressure-assisted
thermal sterilization (PATS) (Balasubramaniam, 2009). In the case of PATS, high pressure
is only used as a means to reach the regular commercial sterilization temperatures,
more rapidly and uniformly, through adiabatic compression heating. Farid (2006) filed a

6
patent application for a process in which thermal expansion due to heating in a closed
container is used to generate pressure and apply heat to a food product, with the
effects due to both pressure and temperature considered for microbial reduction.
Since the thermal effects are important in high pressure processing, especially
when it is aimed at the inactivation of spores, it is of interest to know and control the
temperature at which high pressure processing takes place and any temperature
gradients that may arise during processing. Thermodynamics dictates that the
temperature of most compressible substances will increase or decrease during
compression or decompression, respectively. The temperature change when pressure is
applied to a substance is given by:
dT
dP=
TαP
ρCp ( 1 )
where T is the temperature (K), P is the pressure (Pa), αP is the thermal expansion
coefficient (K-1), ρ is the density (kg/m3), and Cp is the isobaric heat capacity (J/kg·K).
The inconvenience with using this equation is that density, heat capacity and thermal
expansion coefficient are pressure and temperature dependent (Barbosa-Canovas et al.,
2005). Figure 1.3 shows how density and heat capacity of water are pressure
dependent, and is based on the NIST-ASME standard reference database 10 version 2.22
(Harvey et al., 2010). Table 1-1 summarizes some of the findings of Buzrul et al. (2008a)
and Rasanayagam et al. (2003), who determined the temperature increase (adiabatic
compression heating) of several liquids during high pressure processing. In both cases

7
the initial temperature and pressure of the material, and the pressurization rate, were
shown to influence the temperature increase rate.
Figure 1.3: Density and heat capacity of pure water at 25 ºC between 50
MPa and 700 MPa (Harvey et al., 2010)
3.75
3.8
3.85
3.9
3.95
4
4.05
4.1
1000
1020
1040
1060
1080
1100
1120
1140
1160
1180
1200
0 100 200 300 400 500 600 700 800
He
at C
apac
ity
(kJ/
kg K
)
De
nsi
ty (
kg/m
3 )
Pressure (MPa)
Density Heat Capacity

8
Table 1-1: Temperature increase during HPP of selected substances
Substance Temperature increase
(ºC / 100 MPa)
Water1 2.8
Orange juice1 2.8
Skim milk1 3.1
Salmon fish2 3 ± 0.1
Whole milk1 3.3
Ethylene glycol1 3.7
Crude beef fat2 4.4 ± 0.8
Propylene glycol2 5.1 ± 0.5
Soybean oil2 6.3 ± 0.4
Olive oil2 7.2 ± 0.2
Ethanol1 8.2
1 From Buzrul et al. (2008a). 2 From Rasanayagam et al. (2003).
Pressure increases during the pressurization stage, and so does the temperature
due to adiabatic compression heating. The pressure is then held constant for a specific
amount of time in order to achieve the desired goal, followed fast decompression, as
previously shown in Figure 1.2. Although the pressure inside the vessel remains
constant during the pressure hold time, the average temperature normally decreases.
As the temperature increases during pressurization due to adiabatic compression, a
temperature gradient is established between the pressure transmitting medium and the
colder vessel walls causing heat loss resulting in a temperature drop during the pressure
hold step and a lower final temperature compared to the initial value.

9
Besides the heat transfer between the pressure transmitting medium and the
vessel, there will also be temperature gradients between the different food components
and between the food and the water; based on the adiabatic compression heating
values of various components. Different components will reach different temperatures
after pressurization, resulting in a complex and transient heat transfer process during
the hold time. Zhang (2011) carried out numerical simulations to investigate the effects
of food properties and packaging design in the temperature distribution during high
pressure processing. Also, experimental evidence has been obtained that suggested that
the temperature gradients established in a high pressure vessel would generate
variability in reaction kinetics for enzyme and microbial inactivation (Hartmann and
Delgado, 2003; Hartmann et al., 2003; Hartmann and Delgado, 2002; Denys et al.,
2000b). This also indicates a potential use of certain enzymes as indicators of
temperature uniformity in high pressure processing.
Several studies have been carried out aiming to model the temperature
distribution during the pressure hold time. Hartmann (2002) carried out simulations on
a 4 mL vessel, and determined that the pressurization rate strongly influences the
temperature gradients developed inside the vessel, for example, a maximum difference
of 8 ºC between two points inside the vessel at the end of the pressurization time was
observed for a pressurization rate of 20 MPa/s while only a 6 ºC difference was
observed for a pressurization rate of 10 MPa/s, for an initial temperature of 21 ºC and
500 MPa of pressure. They also determined that free convection would dominate the
particle motions in the initial portion of the holding time, which was confirmed by Abdul

10
Ghani and Farid (2007) by simulating the temperature distribution in water and in a
mixture of beef fat pieces and water at 25 ºC and 500 MPa of pressure. In this last study,
it was also determined that the fat pieces would reach higher temperatures than the
water, which is expected given that the adiabatic compression heating value of fat is
higher than water. Pehl et al. (2002) studied the effect of viscosity on temperature
gradients, and determined that a solution of 50% sucrose would develop gradients six
times higher than those developed in water due to the higher viscosity. Khurana and
Karwe (2009) conducted simulations of high pressure processing at different initial
temperatures of the water, and determined that the temperature gradients would be
higher at higher initial temperatures. Khurana (2012) studied the effect of different
positions for the water inlet used to pressurize the vessel and different vessel
orientations; it was determined that water inlet from the bottom would lead to more
temperature uniformity in vertical vessels and that, in general, horizontal vessels would
have a more uniform temperature distribution than vertical vessels.
A few studies have also been carried out aiming to reduce the temperature non-
uniformity in the process. Knoerzer et al. (2007) studied the effect of a PTFE carrier
inside the vessel for a process at 600 MPa and an initial temperature of 90 ºC, and
determined that its insulating effect with respect to the vessel walls would increase the
temperature uniformity, allowing for 94.6% of the carrier volume to achieve a 12 log
cfu/g reduction of Clostridium botulinum spores; without the carrier no significant
reduction was achieved. In subsequent studies, Knoerzer et al. (2010a) developed a
software to optimize the wall thickness of a polymeric carrier in a high pressure unit,

11
aiming to maximize the heat retention and uniformity. Knoerzer et al. (2010b)
developed and approach to screen for insulating materials with adiabatic compression
heating values different than water, which would allow to better preserve the
temperature inside the carrier as the carrier walls would also heat during pressurization.
Khurana (2012) simulated the effects of a 12.7 mm PTFE insulation layer between the
vessel wall and the pressurizing medium in a 10 L vertical vessel and in a 350 L
horizontal vessel; the results for the vertical vessel are shown in Figure 1.4. A significant
increase in temperature retention and uniformity was also observed in the horizontal
vessel with an insulation layer.

12
Figure 1.4: Isotherms in water and s.steel vertical vessel at Ti = 368 K, P =
700 MPa, Tinlet = 298 K, Q = 860,000 W/m3 for (0 ≤ t ≤ 180 s), (a)
without insulation, & (b) with insulation (12.7 mm thick) at the end of
pressurization (180 s) (Khurana, 2012)
Pressure cycling has also been investigated as a method to increase the lethality
of the process. In pressure cycling, instead of having a hold time at a constant high
pressure, the pressure chamber would be depressurized and pressurized again, with
very short periods of pressure hold and almost no lag in between the cycles. Pressure
cycling has been found to be effective in enhancing microbial inactivation; Bradley et al.
(2000), for example, found that pressure cycling increased the inactivation of lambda
phage, a pathogen found in blood. Because the temperature after pressure release is
lower than the initial temperature (see Figure 1.2), each cycle would start at a slightly

13
lower temperature than the previous one. Khurana (2012) investigated the temperature
non uniformities during pressure cycling, and found that each cycle would have a slightly
higher non uniformity compared to the previous one, as shown in Figure 1.5. The
temperature non-uniformity was expressed in terms of coefficient of variation (COV).
Figure 1.5: Coefficient of variance in a 10 L vertical vessel during high
pressure processing at 700 MPa with initial temperature of 95 ºC
(Khurana, 2012).
1.3. Mass transfer during high pressure processing
High pressure induced mass transfer has been explored as an enhancement over
regular osmotic dehydration processes. Osmotic dehydration, which is a diffusion-based
process, has been traditionally used in the food industry for partial removal of water

14
from fruits and vegetables and simultaneous infusion of small solute molecules such as
sugar and salt, by immersing in concentrated solutions. Due to the difference between
the internal and the external osmotic pressures, water diffuses out from the vegetable
into solution while solute molecules from the concentrated solution diffuse into the
food matrix. This is usually a slow mass transfer process that can take several hours or
even days. High pressure processing has been shown to disrupt the cell membranes of
the substrate, which may allow a much faster mass transfer process and therefore
dramatically reducing the time needed.
One of the earliest works on cell permeabilization using high pressure processing
was done by Dornenburg and Knorr (1993), who studied the recovery of pigments from
plant cells. Rastogi and Niranjan (1998) observed that high pressure processing would
increase the diffusivity of water and sugar by a factor of four and two, respectively,
compared to untreated samples of pineapples. Rastogi et al. (2000) observed similar
effects in potato cylinders, this time in the diffusivity of NaCl. They reported the use of
the cell permeabilization index (Zp) to characterize the effect of high pressure on the cell
membranes, as follows:
𝑍𝑝 =(
𝜎ℎ𝑖
𝜎ℎ𝑡 )∙𝜎𝑙
𝑡−𝜎𝑙𝑖
𝜎ℎ𝑖 −𝜎𝑙
𝑖 ( 2 )
where σ is the electrical conductivity measured before processing (superscript i) or after
processing (superscript t), at a low frequency (subscript l) or high frequency (subscript

15
h). The frequency values are dependent on the substrate. The value of Zp varies
between 0 for an intact cell system, and 1 for a completely disrupted cell system.
Additional work on enhancement of mass transfer with high pressure was done
by Mahadevan and Karwe (2011), who observed that the infusion of quercetin into
cranberries during high pressure processing was independent of the pressure applied
between the range of 100 MPa to 500 MPa and that Zp alone was not a good predictor
of enhanced mass transfer coefficient, as high pressure would not increase the Zp value
for frozen-thawed cranberries and yet, higher amounts of quercetin were infused into
these cranberries. Figure 1.6 and Figure 1.7 show the infusion of quercetin and Zp values
measured in this study. Figure 1.8 shows the loss of cellular structure after high pressure
processing of frozen-thawed cranberries.
Figure 1.6: Quercetin infused in frozen-thawed cranberries at
atmospheric conditions and during high pressure processing (Mahadevan
and Karwe, 2011).

16
Figure 1.7: Zp values of frozen-thawed cranberries before and after high
pressure processing (Mahadevan and Karwe, 2011).
Figure 1.8: Microstructure of frozen-thawed cranberry flesh before (left)
and after (right) high pressure processing (Mahadevan and Karwe, 2011).
The enhancement of mass transfer due to high pressure processing, at this point,
has not attracted nearly as much attention as microbial inactivation, either by pressure
alone or by the combination of pressure and heat. All the studies published so far point

17
out that the rate of mass transfer is greatly increased, and that this increase is
dependent on the substrate and the solute. So far there is no general agreement on the
mechanism by which high pressure enhances mass transfer.
1.4. Effect of high pressure on bioactive compounds
High pressure processing is a non-thermal technology that is promoted as to
better preserve the fresh-like aspects of food products compared to regular thermal
processing (Evolution Fresh, 2014); therefore it is of interest to determine if food
bioactive compounds, especially those found in fruits, are retained after processing. This
topic has attracted the attention of numerous researchers, and several studies and
review papers (Rawson et al., 2011; Oey et al., 2008a; Oey et al., 2008b) have been
published on this topic.
In general, high pressure processing is considered to have little effect on
covalent bonds (Rastogi et al., 2007). Nonetheless, it influences the equilibrium of a
reaction by favoring the direction in which the volume is reduced, either toward the
products for reactions with negative reaction volumes, that is, when the volume of the
products is lower than the volume of the reactants, or towards the reactants for
reactions with positive reaction volume. Klärner et al. (1998) identified several
cyclization reactions of 1-alkenes with negative reaction volumes; these could
potentially affect the retention of bioactive compounds in fruits.

18
De Ancos et al. (2000) studied the carotenoid profile of persimmon fruits after
high pressure and found significantly less degradation compared to thermal processing.
In some specific pigments they observed an increase, and hypothesized that it could be
due to disruption of cellular organelles or modification of the proteins that bound the
carotenoids, which could enhance the release. Doblado et al. (2007) measured the
vitamin C content and trolox-equivalent antioxidant capacity of high pressure processed
germinated cowpeas, and observed an inverse correlation between them and pressure.
Unlike these two studies, Fernández García et al. (2001) observed no decrease in
antioxidant capacity, vitamin C or carotene content in orange, lemon and carrot juices,
after high pressure processing.
Some insights on nutrient loss were obtained by Yen and Lin (1996). They
measured vitamin C retention in thermally processed and high pressure processed
guava purees, and observed a lower decrease right after processing for high pressured
processed puree but faster degradation during storage. This suggests that high pressure
retained vitamin C better than thermal processing, but at the same time the lower
enzyme inactivation levels could have contributed to vitamin C loss during storage.
Thakkar (2012) measured the ORAC antioxidant capacity, total phenolics and ellagic acid
content of Muscadine grape juice after thermal pasteurization and a microbiologically
equivalent high pressure processing, and found no difference between the treatments
or with the unprocessed sample. After 8 weeks of storage at ambient temperature, the
ellagic content in the high pressure processed sample had increased possibly due to
hydrolysis of ellagitannins by enzymes not inactivated during processing.

19
The effects of thermal and high pressure processing on the antimutagenic
activity of plant compounds have also been of interest. Butz et al. (1997) screened 14
fruits and vegetables using the Ames test and IQ carcinogen, and divided them in three
groups: (i) resistant to both heat and pressure, like grapefruit and strawberry; (ii)
resistant to pressure but not heat, like carrots, cauliflower, kohlrabi, leek, and spinach;
and (iii) sensitive only to very high pressures, like beet and tomatoes. The effects of
fermentation and high pressure extraction on the antimutagenic activity of deodeok and
Korean barberry were studied (He et al., 2010; Lee et al., 2010). It was determined that
high pressure extraction achieved the highest antimutagenic activities for fermented
samples.
It is evident that more research is needed in this topic, especially if “healthier
product” claims are desired for high pressure processed products so consumers would
be willing to pay a premium price.
1.5. Effect of high pressure on microorganisms
As pointed out earlier in section 1.1, the processing parameters (pressure,
holding time and sometimes temperature) required for the inactivation of different
species of microorganisms are very diverse, which means that different bacteria will
have different tolerance to pressure. In general, Gram negative bacteria are less
resistant than Gram positive ones to pressure (Gould, 1995), likely because of the
thicker and more rigid cell wall of the later compared to the former ones.

20
Modeling of microbial inactivation kinetics during high pressure processing often
uses the parameters zp and Dp adapted from kinetics of thermal inactivation, namely D
and z values. Pavuluri and Kaur (2014) observed a log-linear kinetic for inactivation of E.
Coli in black tiger shrimp between 300 MPa and 600 MPa for 3 min to 15 min and were
able to calculate reliable values for Dp and zp. Van Opstal et al. (2005) modeled E. coli
inactivation in carrot juice also using those parameters; from their published data it can
be determined that a decrease of 20 MPa at 20 ºC could increase the decimal reduction
time by 25%. Zook et al. (1999) observed that the decimal reduction time of S. cerevisiae
in orange juice at 20 ºC increased from 18 s to 50 s when the pressure decreased from
500 MPa to 450 MPa. However, in other cases, high pressure processing curves show
tails, indicating that the inactivation by pressure it is not first order and rendering the
concepts of Dp and zp not useful (Earnshaw, 1995).
High pressure processing is often combined with other processing technologies
in order to increase the inactivation or achieve levels of inactivation not possible by
pressure alone (especially spores inactivation). A combination of high pressure and heat
is perhaps the most studied combination technology; as mentioned before, heating is
necessary if spores inactivation is needed; however, it is possible for pressure and
temperature to be antagonistic. Ludwig et al. (1992) found that treatments for 10 min at
400 MPa and 5 ºC and 500 MPa at 25 ºC caused similar inactivation levels in E. coli.
Antagonistic effects between pressure and heat have been observed in the inactivation
of food enzymes. Van den Broeck et al. (2000) observed that above 900 MPa, pressure
and temperature had an antagonistic effect on the inactivation of orange

21
pectinesterase. In the case of carrot pectin methylesterase, Ly-Nguyen et al. (2003)
observed antagonistic effects below 300 MPa and above 50 ºC. Heremans (1995)
observed, from the phase diagram of denaturation of proteins, that pressure stabilizes
the protein against temperature denaturation at high temperature, and that at room
temperature it was temperature that stabilized the protein against pressure
denaturation, which would explain these last two results. Additionally, it could explain
why pressure and temperature could be antagonistic in some cases in microbial
inactivation, if it were due to protein denaturation. Hayman et al. (2008a) observed
that the synthesis of heat shock proteins increased the pressure resistance of Listeria
monocytogenes, which could also explain some of the antagonistic effects.
Other combination technologies that have been studied include high pressure
and chemical preservatives, which have been used to inactivate Salmonella and E. coli in
apple and orange juices (Whitney, 2005), and Listeria monocytogenes in sausages
(Chung et al., 2005). The combination of high pressure and sonication has also been
studied, Abid et al. (2014) found that a sequential treatment of ultrasonication at 25 kHz
and 70% amplitude and then HPP at 450 MPa for 10 min increased the inactivation of
enzymes and caused full inactivation of aerobic mesophilic bacteria, yeasts and molds.
The growth stage of the organism and the temperature at which it grew have
been found to have an effect in the inactivation levels from HPP. Isaacs and Chilton
(1995) found that E. coli had approximately 5.5 log CFU/mL higher survival rate in
stationary phase compared to mid-log phase after treatment at 200 MPa for 7 minutes.

22
Hayman et al. (2007) determined that Listeria monocytogenes grown at 15 ºC was
significantly more pressure sensitive compared to cells grown at 4 ºC, 25 ºC, 35 ºC, and
43 ºC (which were the most resistant). They also determined that cells in mid-stationary
phase were significantly more resistant than cells in exponential phase.
As mentioned before, numerous studies have been done on the inactivation of
different bacterial species in foods, using different pressure, time, and temperature
combinations. On the other hand, there are very few studies dealing with the
mechanism by which high pressure inactivates microorganisms; one of the main reasons
for this is the difficulty of carrying out in situ studies, that is, studying microbial cells in
real time while they are being pressurized or depressurized, and not just before and
after processing. The application of high pressure to cells triggers a series of events in
the cells, not all of them necessarily lethal. Among the events studied, membrane
damage has been observed in numerous studies and it has been suggested to be an
important trigger of cell death during high pressure processing (Michiels et al., 2008).
Perrier-Cornet et al. (1995) observed a permanent decrease by 10% of the
volume of yeast cells after depressurization in an HPP cycle at 250 MPa for 15 min.
Benito et al. (1999) studied the pressure resistance of different strains of E. coli 0157:H7
isolated from different outbreaks, and were able to determine that the more pressure
sensitive strains also absorbed ethidium bromide and propidium iodide (fluorescent
dyes) at a faster rate after high pressure processing compared to more pressure
resistant strains, suggesting that the susceptible strains had sustained more membrane

23
damage. Additionally, the study indicated that the strains more resistant to pressure
were also more resistant to acid, oxidative, and osmotic stresses. In another study,
Perrier-Cornet et al. (1999) were able to differentiate the inactivated cells from the
surviving cells after high pressure processing, and found a much larger volume reduction
after decompression in the inactivated cells (35% volume loss) than in the surviving cells
(10% volume loss). They also observed leakage of sodium, glycerol, calcium and
potassium ions from the cells to the medium. Manas and Mackey (2004) observed a
leakage of proteins and RNA in E. coli cells after the application of 200 MPa of pressure.
Hartmann and Delgado (2004) carried out numerical simulations of stress
distribution of yeast cells during HPP, and concluded that Von Mises (shear) stress
would develop at the cell wall and possibly disrupt it, but in the interior of the cell the
stresses would be mostly hydrostatic; the effect on cell membrane was not included in
this study. Although they did not experimentally verify their results, they found
agreement with the experimental results obtained by Perrier-Cornet et al. (1999). In a
relatively recent study, Black et al. (2007) determined that the minerals and ions
associated with the casein micelles (calcium, magnesium, citrate, and phosphate)
increased the pressure resistance of Listeria innocua, and hypothesized that the
buffering capacity from phosphate and citrate ions, and membrane protection from
calcium and magnesium would be the cause of this.
It has been observed that environmental conditions can affect the physical
properties of the cell walls of bacteria, which could relate to their resistance to pressure

24
treatments. Thwaites and Mendelson (1985) and Thwaites and Surana (1991) studied
the effect of different relative humidity levels on the cell wall of Bacillus subtilis, and
observed that the Young’s modulus and tensile strength of the cell wall decreased as the
relative humidity increased; that is, at dryer conditions, the cell walls were less
susceptible to be deformed or broken. Similar conclusions were reached by Nikiyan et
al. (2010) for Bacillus cereus and E. coli, especially at RH levels below 84% for E. coli and
below 65% for Bacillus cereus. This could explain the extreme resistance to pressure of
several Salmonella strains in peanut butter, a very low moisture food, even though they
were sensitive to pressure in peptone water suspensions (D'Souza et al., 2012). In
addition to cell wall strengthening, dehydration has also been shown to hinder the
denaturation of proteins due to high pressure (Oliveira et al., 1994), which could also
explain the pressure resistance of Salmonella in peanut butter. Similar conclusion was
reached by Hayman et al. (2008b), who observed an increase in the survival of Listeria
monocytogenes and a decrease in the denaturation of lactate dehydrogenase at water
activity values below 0.83 after high pressure processing.
Besides the physical rupture of the membrane, other changes that have been
observed include permeabilization (that is, increased transfer of material from the
cytoplasm to the medium) and inactivation of the F0F1 proton translocating ATPase
(Michiels et al., 2008). A review on the available literature regarding the effects of high
pressure on biological molecules was published by Cheftel (1995); ATPase inactivation,
conformation changes in macromolecules, ionic dissociation and pH changes in water,

25
changes in melting point and crystal structure were listed among the mechanisms
studied that could be related to cell death.
Pressure has also been observed to cause dissociation of ribosomes (reversible
at low pressures and irreversible at high pressures), inactivation of RNA polymerase and
DNA gyrase (an enzyme involved in DNA replication), and condensation of the
nucleotide (Michiels et al., 2008). In a study with Leuconostoc mesenteroides, Kaletunç
et al. (2004) determined that ribosomal denaturation was the main cause of cell death,
but also observed the formation of blisters in the surface of cells, suggesting additional
membrane damage. Isaacs and Chilton (1995) found areas devoid of ribosomes in
Listeria monocytogenes after exposure to 250 MPa and enlarged fibrillar regions of DNA.
Mentré and Hoa (2001) pointed out that high pressure has a stabilizing effect on DNA
hydrogen bonds; this could hinder DNA transcription and therefore block the synthesis
of vital proteins for the cell. Pope et al. (1975) measured the pressure sensitivity of
protein synthesis in cells, and found them to be different between E. coli, Pseudomonas
fluorescens and Pseudomonas bathycetes. They also concluded that the sensitivity
changed with temperature. Wong and Heremans (1988) observed irreversible changes
in the structure of chymotrypsinogen enzyme, due the reduction of α-helix and β-sheet
substructures and the increase of random coil and turn conformations. They also
observed that the pressure at which the denaturation started was higher when the
pressurization rate was decreased. Additionally, Isaacs and Chilton (1995) found that the
activity of isocitrate dehydrogenase, an enzyme from the respiratory cycle, had
decreased by 75% after 2 minutes at 400 MPa in E. coli, which correlated with the

26
survival rate of the bacteria. Figure 1.9 and Figure 1.10 show the structures of a bacteria
cell and yeast cell, respectively, to help understand the location of the elements
discussed above. The cell sizes are 1 µm to 3 µm for bacteria and about 8 µm for yeast
(Madigan et al., 2006).
Figure 1.9: Diagram of a bacteria cell (Madigan et al., 2006).
Figure 1.10: Electron microscope image of Sacharomyces cerevisiae
(yeast) (Madigan et al., 2006).

27
The published studies on high pressure effects on bacterial spores have not given
a clear reason as to why they are so resistant to pressure (Reineke et al., 2011). Nguyen
Thi Minh et al. (2011) studied the effects of sporulation of Bacillus subtilis at different
conditions, such as temperature, pH, and calcium content, and determined that they
influenced the resistance of the spores to both high temperature and pressure. A similar
study was done by Olivier et al. (2012) with other Bacillus species; however they found a
negative correlation between developed temperature and pressure resistance at
different sporulation temperatures, and found no trend between added minerals and
resistance to pressure. Reineke et al. (2011), also working with Bacillus subtilis, were
able to determine that the inactivation of spores during high pressure and temperature
treatments first triggered the spore germination before inactivation took place.
It is clear that more research is needed on this topic, especially if high pressure
processing is to be used to achieve commercial sterility in low-acid foods. Fortunately,
the research on pressure tolerance of microorganisms to high pressure processing is
also of interest to other disciplines, such as marine biology and astrobiology (and
Sharma, 2011; Moeller et al., 2008; Nicholson et al., 2000), from which food science
could benefit.
1.6. Hydrostatic pressure as a component of stress
When a solid object is in contact with other solids or fluids, it will be subjected to
external forces or surface tractions, either concentrated at a point or distributed

28
throughout the surface (such as hydrostatic pressure), which will be transmitted from
the surface to the interior of the solid. If an infinitesimally small area within the solid
were isolated, the ratio of the force (F) to the surface area (ΔA) would be the stress
vector (t):
𝑡 = lim∆𝐴→0
(𝐹
∆𝐴) ( 3 )
(Solecki and Conant, 2003).
If we were to isolate an infinitesimal volume element from that same body
under external stress, we could find the stress vector for each of the faces of the
element. Figure 1.11 shows such an element, with the vectors Sx, Sy, and Sz being the
resultants of the stress vectors applied on both sides perpendicular to the x, y, z axes,
respectively. Furthermore, we can decompose each of those vectors into three
components (since we’re using a Cartesian coordinate system); one of them
perpendicular to the face and two of them parallel to the face. The stress components
perpendicular to the face are known as normal stress (σ) and the components parallel to
the face are known as shear stress (τ) (Popov et al., 1976). The first subscript indicates
the originating stress vector; the second subscript indicates the direction to which the
component is parallel to.

29
Figure 1.11: Stress Components in a Cartesian coordinate system
The decomposition of the stress vectors into their orthogonal components would
be:
𝑆𝑥 = 𝜎𝑥𝑥𝐢 + 𝜏𝑥𝑦𝐣 + 𝜏𝑥𝑧𝐤 ( 4 )
𝑆𝑦 = 𝜎𝑦𝑦𝐣 + 𝜏𝑦𝑥𝐢 + 𝜏𝑦𝑧𝐤 ( 5 )
𝑆𝑧 = 𝜎𝑧𝑧𝐤 + 𝜏𝑧𝑥𝐢 + 𝜏𝑧𝑦𝐣 ( 6 )
All these components can be arranged in a square matrix, called the stress
matrix or stress tensor (σ), which is used in mathematical modeling and numerical
methods. The main diagonal of the matrix contains the normal stresses, and the
remaining elements are the shear stresses.
𝜎 = [
𝜎𝑥𝑥 𝜏𝑥𝑦 𝜏𝑥𝑧
𝜏𝑦𝑥 𝜎𝑦𝑦 𝜏𝑦𝑧
𝜏𝑧𝑥 𝜏𝑧𝑦 𝜎𝑧𝑧
] ( 7 )
Since it is difficult to easily interpret the physical significance of the components
of the stress-tensor, several invariant scalar measures of the stress-tensor have been
zy
x
Sz
Sy
Sx
σxx
τxz
τxy

30
defined in-order to quickly characterize the nature of the force distribution within a
solid. The most significant of these measures are the hydrostatic pressure component
(P), which is intimately related to volume change of a specimen, and the effective stress
deviator also known as the Von Mises stress (σVM), responsible for shape changes
(Bower, 2010; Solecki and Conant, 2003). They are calculated as follows:
𝑃 =1
3(𝜎𝑥𝑥 + 𝜎𝑦𝑦 + 𝜎𝑧𝑧) ( 8 )
𝜎𝑉𝑀 = √(𝜎𝑥𝑥−𝜎𝑦𝑦)2
+(𝜎𝑦𝑦−𝜎𝑧𝑧)2
+(𝜎𝑧𝑧−𝜎𝑥𝑥)2+6(𝜏𝑥𝑦2+𝜏𝑦𝑧
2+𝜏𝑧𝑥2)
2 ( 9 )
Both of these quantities are invariants of the stress tensor, which means they
remain constant even if the coordinate system changes. This makes them very useful for
finite element analysis, when the coordinate system of one element may not necessarily
coincide with the coordinate system used for another element.
The relationship between stress and deformation or strain is represented using
several elastic moduli. Figure 1.12 shows a solid in which stress is applied in a single
direction; this causes it to compress along the y direction and to expand in the z and x
directions.

31
Figure 1.12: Solid under uniaxial stress
In this case the relationship between the stress applied in the y direction and the
strain in that same direction (εyy, the change of length divided by the original length)
would be represented as:
𝜎𝑦𝑦 = 𝐸 ∙ 𝜀𝑦𝑦 ( 10 )
𝜀𝑦𝑦 =1
𝐸𝜎𝑦𝑦 ( 11 )
Where E is the Young’s modulus or modulus of elasticity. This equation is true for
linearly elastic materials, in which the value of Young’s modulus remains constant for
the range of stress being studied and the material bounces back to its original
conformation after the stress is removed (Boudjema et al., 2003). Although usually an
example of a body under tension stress (which intuitively would cause the body to
extend in that direction) is used to define the Young’s modulus, nothing in the literature
prevents that definition from applying to a body under compression stress (which would
cause the body to compress in that one direction). We do expect that the ranges for
linearity of equation (8) under tension and compression stress to be different.
σyy
σ
yy

32
The expansion in the other directions is known as the Poisson’s effect. It has
been experimentally observed that it is related to the compression in the direction in
which the stress is applied.
𝜀𝑥𝑥 = −𝜈 ∙ 𝜀𝑦𝑦 ( 12 )
𝜀𝑧𝑧 = −𝜈 ∙ 𝜀𝑦𝑦 ( 13 )
In a system under normal stress in the 3 directions, the resultant deformations in
the x, y, and z direction would be written as:
𝜀𝑥𝑥 =1
𝐸(𝜎𝑥𝑥 − 𝜈(𝜎𝑦𝑦 + 𝜎𝑧𝑧)) ( 14 )
𝜀𝑦𝑦 =1
𝐸(𝜎𝑦𝑦 − 𝜈(𝜎𝑥𝑥 + 𝜎𝑧𝑧)) ( 15 )
𝜀𝑧𝑧 =1
𝐸(𝜎𝑧𝑧 − 𝜈(𝜎𝑥𝑥 + 𝜎𝑦𝑦)) ( 16 )
The overall deformation would be:
𝜀𝑥𝑥 + 𝜀𝑦𝑦 + 𝜀𝑧𝑧 =1
𝐸(𝜎𝑥𝑥 + 𝜎𝑦𝑦 + 𝜎𝑧𝑧)(1 − 2𝜈) ( 17 )
This equation establishes an upper limit of 0.5 for the value of the Poisson’s ratio ; a
material with such property would be incompressible, since the overall deformation
would be 0. However, it is important to mention that the above analysis is only valid for
isotropic materials, that is, when the values of the elastic constants (in this case, the
Young’s modulus) are the same in all directions. Table 1-2 lists the Poisson’s ratio values
for some materials.

33
Table 1-2: Values of Poisson's ratio for some materials
Material Poisson’s Ratio
Aluminum 0.33
Copper 0.36
Lead 0.40 – 0.45
Stainless steel 0.283
Cork ~0.0
Concrete 0.1 – 0.21
Teflon 0.399
Dentine 0.29
Nylon 0.4
Rubber ~0.5
(Gercek, 2007; Solecki and Conant, 2003)
Figure 1.13 shows a solid being deformed by a shear stress. In this case there is
only shape change, as shear stresses do not cause normal strains; also, there is no
Poisson effect for shear (γ) (Solecki and Conant, 2003).

34
Figure 1.13: Solid under shear stress. Solid lines are the original shape,
dashed lines are the deformed shape during application of shear stress.
Similar to the deformation caused by uniaxial stress, the shear strain is related to
shear stress by the shear modulus (G). Since there is no Poisson’s effect, the equations
are much simpler:
𝛾𝑧𝑦 =1
𝐺𝜏𝑧𝑦 ( 18 )
Similar equations can be established for the other shear strains.
Finally, when a solid is subject to hydrostatic pressure (P), it will undergo change
in volume (V). This can be quantified in isotropic materials using a property called bulk
modulus (K):
∆𝑉
𝑉= −
1
𝐾∆𝑃 ( 19 )
The inverse of bulk modulus (1/K) is called as compressibility.
γzy
τzy

35
Under hydrostatic pressure, the normal stresses have the same magnitude:
𝑃 = 𝜎𝑥𝑥 = 𝜎𝑦𝑦 = 𝜎𝑧𝑧 ( 20 )
Numerically, the value of this hydrostatic pressure is the same as the hydrostatic stress
component defined in the previous section.
The values of Young’s modulus, Poisson’s ratio, shear modulus, and bulk
modulus are interrelated in isotropic materials. Once two of these constants are
determined, the other two can be calculated using the following equations:
𝐺 =𝐸
2(1+𝜈) ( 21 )
𝐾 =𝐸
3(1−2𝜈) ( 22 )
(Popov et al., 1976)
According to equation (22), incompressible materials (ν = 0.5), would also have an
infinite bulk modulus.

36
2. Rationale and Hypothesis
2.1. Rationale
A review of some of the literature published on high pressure processing reveals
that many researchers accept that pressure is transmitted uniformly across foods during
high pressure processing due to the isostatic rule or Pascal’s law, even though this law
was established for fluids and not for solids. The only work that questioned this principle
in high pressure processing was done by Minerich and Labuza (2003). They inserted a
copper powder tablet at the center of a ham piece that was later high pressure
processed, and by measuring the compression of the tablet they determined that the
pressure at the center of the ham was 9 MPa lower than the applied pressure.
However, the confidence interval of the correlation between pressure and compression
of the sensor was ±16 MPa, so even though the internal pressure was determined to be
significantly different from the applied hydrostatic pressure on the surface, the
measured difference was within the error of the measurement of an individual sensor.
Also, no explanation of why the pressure would decrease from surface to center was
provided in this paper. This research was referred by Rastogi et al. (2007); curiously in
that same review paper the author also stated that pressure is uniform inside food
items during HPP, which indicates that the idea of pressure non-uniformity is not
accepted by the Food Science community.

37
2.2. Theoretical Background
From the point of view of solid mechanics, when hydrostatic pressure is applied
to a solid material, including food items, the material will compress; the relationship
between the applied pressure and the compression of a given material is given by the
bulk modulus (see section 1-6). If the food item were composed of two or more
materials, each component would be compressed to a different volume depending on
their individual bulk modulus. Figure 2.1A represents a simple heterogeneous solid
under high pressure, in which the bulk modulus of the inclusion is much higher than the
bulk modulus of the soft external material. When pressure is applied, both materials will
compress, however the compression of the whole system would not happen as
represented in Figure 2.1B. Because of the friction/adherence between the hard
inclusion and soft material, the soft material would not slide but instead its boundary
region would adhere to the hard inclusion, as shown in Figure 2.1C. Additionally, this
friction force at the interface would generate shear stress, since it is a parallel force
applied on the boundary surface.

38
Figure 2.1: (A) Heterogeneous solid under high pressure; (B) independent
compression of the materials; and (C) materials bound at the interface
The magnitude of shear stress that develops depends on the difference between
the bulk modulus values of the two materials; a higher difference would cause higher
difference in the volume compression (ΔV/V from equation (19)). Because the
compression of the soft material at the boundary has to match the compression of the
hard material for them to remain attached, this would generate shape change or shear
deformation; since the soft material is continuous, this shear deformation in the
boundary with the hard inclusion would generate a shear deformation gradient across
the whole solid, represented by γB at every different position. Using equation (18), the
shear deformation would in turn generate shear stress (τB = G · γB).
In order to maintain the strain energy density (which depends on the strain
tensor, that includes both pressure and shear strain) constant throughout the material
A
B C

39
and comply with law of conservation of energy, the pressure stress needs to decrease
accordingly to the generated shear stress, therefore forming a pressure gradient from
the surface to the hard inclusion. The decrease in pressure stress needed to
accommodate for the generated shear stress depends on the constitutive model of the
material; neo-Hookean being one of these models (Bower, 2010).
Numerical simulations of stress distribution for a cylindrical soft material (a 3%
agar gel) with a hard inclusion in the central axis when 300 MPa of hydrostatic pressure
was applied on the surface were carried out by Dr. Abilash Nair and Dr. Alberto Cuitiño,
in the Mechanical and Aerospace Engineering Department, Rutgers University. Figure
2.2 shows the geometry used in the simulations.
Figure 2.2: Schematic of the two-dimensional axi-symmetric model used
for numerical simulation. The vertical dashed line in red is the line of axi-
symmetry of the model, while the horizontal red dashed line represents
the plane of model symmetry.

40
The Young’s modulus of the hard material was 20 GPa and the Poisson’s ratio
was 0.3 (Ross, 2010). The compressibility of the soft material was measured using the
procedure detailed in section 4.2.d, and additionally different values of Poisson’s ratio
were considered. The following Neo-Hookean model was used:
𝑃 = 𝐾𝜕𝑈
𝜕𝐽+
𝐺
𝐽(
𝑏𝑖𝑖
3− 1) ( 23 )
𝜕𝑈
𝜕𝐽=
𝑙𝑛𝐽
𝐽3.5 ( 24 )
Where P is the hydrostatic pressure stress, K and G are the bulk modulus and
shear modulus of the material (G was calculated from the bulk modulus and Poisson’s
ratio), bii is the trace of the left Cauchy-Green tensor (bii=λ12 + λ2
2 + λ32, where λ is the
stretch of the element along the principal axes, that is, the ratio of the length of the
deformed element to the length of the un-deformed element along the coordinate
system in which the element does not rotate while undergoing deformation), J is the
ratio of volume change of the material (ΔV/V), and ∂U/∂J is a function for the
compression of the material, obtained from regression done on the compression data of
a 3% agar gel. The K∂U/∂J term in eq. (24) represents the volume change and the G/J
term the shape change.
As the value of Poisson’s ratio was decreased from very close to 0.5 and the
bulk modulus was kept constant, the Young’s modulus and shear modulus increased.
Figure 2.3 shows the mesh used to carry out the numerical simulations, obtained from
the geometry in Figure 2.2. The stress profiles are shown in Figure 2.4. This means that

41
bacterial cells located along the radius of the solid would experience different
combinations of pressure and shear; depending on how they are affected by each kind
of stress, the inactivation values could be non-uniform.
Figure 2.3: Axi-symmetric finite element analysis mesh. The hard insert
was between 0 to 8 mm radius (r) and the soft material was between 8
and 38 mm (a=38 mm).
r (mm)

42
Figure 2.4: Numerical simulation of pressure stress (left) and shear stress
(right). The shaded grey region represents the location of the hard
inclusion.
Previous research has shown that microbial inactivation is highly sensitivity to
the applied hydrostatic pressure (see sections 1-1 and 1-5). However, there is very little
research published on the inactivation due to shear stress, especially static shear and at
room temperature. Bulut et al. (1999), observed a non-trivial effect of shear and
thermal forces on the inactivation of Microbacterium lacticum during extrusion, and
concluded that shear forces played a bigger role in inactivation compared to heat.
However, this was for dynamic shear (there is flow during extrusion) and not for static
shear, which is the type of shear expected to develop in high pressure processing
(where there would not be flow of material). Additionally, Peterson et al. (2012) studied
the damage of bacterial cells during centrifugation, due to shearing between the cells
they had been compacted in a pellet. However, mechanical shear wasn’t quantified in
this research.

43
2.3. Hypothesis
A pressure gradient will develop in heterogeneous solid foods during high
pressure processing, with the internal pressure being lower than the hydrostatic
pressure applied on the surface of the food product. At the same time, a shear stress
gradient will develop inside the food item. These two gradients would cause non-
uniformity in microbial inactivation.
As established in the previous section, a stress gradient would be established
from the surface of the solid to the interface with a hard inclusion, where the
hydrostatic pressure component would decrease towards to the inclusion and the shear
stress component would increase from the interface. Depending on the location of a
microorganism in the solid, it may be subjected to a different combination of pressure
and shear stresses. Since pressure stress decreases the volume of a solid maintaining
the shape constant and shear stress deforms the solid maintaining the volume constant,
it is expected that each will cause failure of the microbial membrane, but not necessarily
at the same magnitudes. The combination of the effects may be synergistic or
antagonistic. Figure 2.5 shows the effects of pressure stress and shear stress on the
geometry of a solid.

44
Figure 2.5: Effects of (a) pressure stress, and (b) shear stress on the
geometry of a solid
2.4. Objectives
There were two main objectives and two minor objectives in this research
project. They were:
1. Quantify the microbial inactivation in different locations in a model system
composed of a soft gel with a hard inclusion at the center after high pressure
processing.
2. Measure microbial inactivation in model systems with dispersed small hard
inclusions after high pressure processing.
3. Design a pressure sensor that could quantify pressure inside solids during
high pressure processing.
4. Monitor microbial inactivation in real time during high pressure processing.
(b)
(a)

45
Microbial inactivation was used as an indicator of pressure non-uniformity, a
difference in inactivation in the model systems could be attributed to the development
of stress profiles. Additionally, work was done to use a fluorescence system as a
pressure indicator that could potentially be used inside a solid, and this derived into the
use of a fluorescent dye to monitor microbial inactivation during high pressure
processing.

46
3. Preliminary Experiments
This chapter briefly covers the experiments done in the early stages of this
project, using real food systems (raw chicken drumsticks, raw turkey drumsticks, and
smoked turkey drumsticks) to measure microbial inactivation during HPP. It also covers
the first model system designed, consisting of an agar, xanthan gum and guar gum gel
with a wood inclusion, inoculated in different locations before the gel was fully set.
These results were not useful in drawing conclusions for the project.
The experiments with the meat systems gave very inconsistent results, and
established the need to use a model system where the geometry and mechanical
properties could be kept constant. The first model system designed, where the
inoculation was done at specific location, was not the best alternative, as it was difficult
to control the exact location of the inoculum. Additionally, it was determined that the
attenuated Salmonella strain that was being used was too sensitive to pressure, many of
the results with the model system had to be discarded for deviating too much from the
rest.
3.1. Materials and Methods
3.1.a. High Pressure Processing Equipment
High pressure processing was carried in a 10 L high pressure vessel (Elmhurst
Systems, Albany, NY). Figure 3.1 shows the vessel steel cylinder surrounded by the yolk

47
that prevents the vessel closure from coming off, as well as the control panel used to
program the pressure cycles. Pressurization was achieved with a 20 HP intensifier pump
designed to achieve a maximum pressure of 690 MPa, but at the time the project was
carried out it wasn’t used above 600 MPa. Water at room temperature was used as
pressurization medium in all experiments, and temperature never surpassed 40 ºC.
Figure 3.1: 10 L High pressure vessel (steel cylinder) and control panel, at
Rutgers University.

48
3.1.b. Experiments in a Real Food System
An attenuated Salmonella enterica strain was grown for 24 h at 37 ºC in trypicase
soy broth (Becton, Dickinson and Company, NJ) with 1.5% sodium alginate (KIMICA,
Japan). Before using the Salmonella suspension, one droplet of food grade color was
added, to be able to find the inoculated region afterwards. Food samples of meat with
bone, either raw or chicken dumsticks or smoked turkey legs were inoculated by
injecting between 0.2 mL to 0.5 mL of culture at different locations relative to the bone
(either next to the bone, almost at the surface of the sample, or between the surface
and the bone). Immediately afterwards, a volume equal to the inoculum of a 30% CaCl2
solution (Fisher Scientific, NJ) was injected at the same location to gel the Salmonella
inoculum and prevent it from flowing inside the sample. Figure 3.2 shows a schematic of
the inoculation procedure.
Figure 3.2: Scheme of the inoculation procedure for turkey and chicken
drumsticks

49
The samples were vacuum packed and high pressure processed at 310 MPa or
345 MPa for 5 min. After processing, 10 g of meat containing the inoculum, which was
visually identified because of the dye added to the bacterial suspension, was recovered
and homogenized with 90 mL of 0.1% peptone water. Plating was done in XLT4 agar
(Becton, Dickinson and Company, NJ), plates were left at 37 ºC for 24 h before
enumeration. Figure 3.3 shows the recovery of the inoculated meat from a raw chicken
drumstick after high pressure processing.
Figure 3.3: Chicken drumstick after HPP. The green regions indicate the
Salmonella inoculum

50
3.1.c. Experiments with a Gel Model System
A model system composed of 1% agar, 0.5% xanthan gum, and 0.5% guar gum
(TIC Gums, MD) was formed around a wooden dowel of 1 cm of diameter in a 125 mL
plastic bottle, to simulate a drumstick with the bone at the center. The combination of
agar, xanthan gum, and guar gum produced a firm but flexible gel, that would have high
viscosity when liquid and set relatively quickly as to prevent the spreading of the
inoculum.
A small opening was cut out in the bottom at the center of clean polyethylene
plastic jars (Fisher Scientific, NJ) of 125 mL capacity. A 1 cm diameter wooden dowel was
inserted through the opening. The space between the jar and the dowel was sealed with
melted glue. The polymer suspension of 1% agar, 0.5% xanthan gum, and 0.5% guar gum
was heated to 90 ºC, cooled down to 40 ºC at room temperature, and then poured into
the bottle. Immediately afterwards (before the solid gel was formed), 0.2 mL of colored
Salmonella suspension (grown in trypticase soy broth, without sodium alginate) was
inoculated at different locations using a long pipette tip, according to the diagram in
Figure 3.4. The bottles were placed in an ice bath for 15 min for the gel to set quickly so
the inoculum stayed in place, and then placed at room temperature to finish setting
before high pressure processing.

51
Figure 3.4: Schematic of the first model system. The blue ovals indicate
the inoculation locations.
High pressure processing of the model system was carried out at 276 MPa for 3
minutes. Afterwards, 10 g of gel containing the inoculated region were extracted and
homogenized in 0.1% peptone water solution. Appropriate dilutions were made before
platting in XLT4 media to enumerate the survivors.
3.2. Results and Discussion
Figure 3.5 and Figure 3.6 show the survival of Salmonella at different positions in
the turkey drumstick and the model system, respectively, after high pressure
processing. Even though there were significant differences observed in the survival of
the bacteria, only the difference between the survival at the surface of the gel and at
the other two locations was higher than 0.5 log CFU/g. The thickness of the meat was
between 20 mm and 50 mm.

52
Figure 3.5: Survival of Salmonella at different positions in the turkey
drumstick after high pressure processing (n=4). The dashed line indicates
the limit of detection.
Figure 3.6: Survival of Salmonella at different positions in the gel model
system after high pressure processing (n=9). The dotted line indicates the
limit of detection.
0
1
2
3
4
5
6
7
8
Control 1 mm from the bone 5 mm from the bone 5 mm from the surface
Salm
on
ella
re
cove
ry (
log
cfu
/g)
0
1
2
3
4
5
6
7
Control Internal Midpoint External
Salm
on
ella
re
vove
ry (
log
cfu
/g)

53
Many experiments were excluded from these results, and none of the
experiments with chicken drumsticks were even included, because the results were very
inconsistent. Additionally, the results with the gel model system were too close to the
detection limit, which made them unreliable (a small variation in the number of colonies
counted would have a big impact on the log cfu/g value). The Salmonella strain used
was too sensitive to high pressure, so the small variations from one HPP run to another,
even at the same conditions, could give highly variable results. It was determined not to
work with a real food system (turkey or chicken), and also that the model system had to
be redesigned and an organism other than Salmonella should be used.

54
4. Non-Uniformity of Microbial Inactivation in Gel Model
Systems during High Pressure Processing
This chapter covers the experiments of microbial inactivation in model systems
formulated with a mixture of gelatin and agar or only agar, using a single wood cylinder,
or glass wool, or plaster of Paris particles as inclusions. The inclusions were expected to
generate different stresses profiles inside the gels. The overall inactivation in the sample
was measured in the gels with multiple inclusions, in the gel with one inclusion the
inactivation at different positions was measured.
The results showed that the dispersed glass wool or plaster particles affected the
microbial inactivation. In the case of Listeria innocua (bacteria), the inactivation
decreased at increasing amounts of inclusion. In the case of Saccharomyces cerevisiae
(yeast), the inactivation decreased at lower amounts of inclusions but at higher amounts
it was the same as without the inclusions. No inactivation profiles were observed in the
system with a single wood inclusion. This very likely implies that non-uniform stress
profiles were developed in the regions very close to the inclusions, so the effect on the
microbial inactivation was only detected with the glass wool or plaster particles because
of the much higher interface area. It also suggests that different organisms react
differently to combinations of pressure and shear, and that in the case of yeast,
pressure and shear can be antagonistic towards microbial inactivation.

55
4.1. Literature Review
The only previous work done on pressure non-uniformity during high pressure
processing was from Minerich and Labuza (2003). They inserted copper powder tablets
in the center of cooked ham, high pressure processed them between 400 MPa and 600
MPa, and measured the compression of the tablets afterwards. The compression of the
copper powder tablets was correlated with the applied pressure using the Heckel
equation:
ln (1
Φ) = 𝐾𝑃 + 𝐴 ( 25 )
Where Φ is the material porosity, P is the applied pressure, K and A are constants.
They found that the average calculated pressure inside the ham was 9 MPa
lower than the hydrostatic pressure applied on the surface of the hams. Although the
average internal pressure was significantly lower (P<0.017) than the applied pressure
(also quantified using a copper powder tablet), the confidence interval of each
individual sensor was ±16 MPa, reducing the reliability of the results. Due to this
variability we opted for not using copper powder tables as pressure sensors, besides the
fact that we would need to disrupt the solid system in order to insert them.

56
4.2. Materials and Methods
4.2.a. Microbial Suspension
Listeria innocua ATCC 33090 was grown in BHI broth (BD, MD, USA) with 3%
glucose added at 37ºC for 8 h, until it reached approximately 9 log CFU/mL in the early
stationary phase. Saccharomyces cerevisiae was grown in YPD broth (BD, MD, USA) in
agitation at 30ºC for 28 h, until it reached approximately 8 log CFU/mL.
4.2.b. Samples Preparation and Microbial Ennumeration
Gelatin gels were prepared by heating an 18% gelatin 80 bloom (Gelatin
Innovations, IL, USA) and 2% agar suspension to 90 ºC. Agar gels were prepared by
boiling a 3% agar (RS-100, TIC Gums, MD, USA) suspension. The suspensions were
allowed to cool down to 45 ºC before adding 1 mL of microbial suspension per 100 g. A
single wood cylinder (obtained from a local hardware store) or glass wool (Corning Inc.
Life Sciences, MA, USA) of 8 µm diameter and 2,520 kg/m3 absolute density were used
as inclusions for the gelatin-agar gel, and plaster of Paris (DAP Products, Inc., MD, USA)
with 2,690 kg/m3 absolute density was used as inclusions for the 3% agar gel. Gels
without inclusions were also prepared.
After inoculation, the samples were transferred to 125 mL plastic jars and left in
the fridge for approximately 36 h before high pressure processing. For the samples that
contained a single large inclusion, the wooden cylinder was inserted from the bottom

57
through the center axis to the jar up to 10 mm before the top. The liquid sample was
transferred in and allowed to set around the inclusion. Figure 4.1 shows the design of
this model system and the locations where it was sampled after processing; Figure 4.2
shows the model system after being prepared. The gelatin-agar gel with glass wool is
shown in Figure 4.3, and the agar gel with plaster of Paris particles is shown in Figure
4.4.
Figure 4.1: Model system of gelatin-agar gel in a bottle around a wood
inclusion. The ovals indicate the sampling locations.

58
Figure 4.2: Gelatin-agar gel model system with a single inclusion, inside
the plastic jar (left) and outside the jar (right).
Figure 4.3: Gelatin-agar gel with dispersed glass wool inclusions

59
Figure 4.4: Agar gel with dispersed plaster of Paris particles.
Additionally, because plaster of Paris is composed primarily of CaSO4 and
calcium had been shown to protect Listeria innocua from inactivation due to high
pressure processing (Black et al., 2007), the reduction of Listeria innocua in water and in
3% agar gel with calcium sulfate dehydrate (Sigma-Aldrich Co. LLC, St. Louis, MO) at its
solubility level of 0.24% were also measured. The solubility level was chosen because
the protective effect was observed with solubilized calcium ions. Water and agar gels
were used to evaluate the independent effects of calcium and if the agar gel matrix
would have an additional effect.
Calcium sulfate was added to distilled water and agar suspension. They were
boiled and cooled down to 45 ºC before being inoculated with 1 mL of Listeria innocua
or Saccharomyces cerevisiae suspension per 100 mL of water or agar gel. After
inoculation, the samples were transferred to 125 mL plastic jars and left in the fridge for
approximately 36 h before high pressure processing, similar to the gel samples. Control
samples without calcium sulfate were also prepared.

60
4.2.c. High Pressure Processing
High pressure processing of the gel samples was carried out using the high
pressure vessel described in section 3.1.a. Preliminary experiments were carried out to
determine a pressure/holding time combination that would achieve partial inactivation
of Listeria innocua and Saccharomyces cerevisiae in the pure 18% gelatin + 2% agar gel
model system, so that any potential pressure profiles developed in the samples could be
detected by differences in microbial inactivation. The conditions selected were 303 MPa
(44 kpsi) for 6 min for Listeria innocua and 276 MPa (40 kpsi) for 2 min for
Saccharomyces cerevisiae.
4.2.d. Microbial Enumeration
After high pressure processing, 1 g of gel were taken from each of the three
positions shown in Figure 4.2 of the gelatin-agar gel with a single wood inclusion, and
also from an unprocessed gel without an inclusion. The gel samples were transferred to
a 7 oz. sterile plastic bag and homogenized by hand-massaging with 9 mL of peptone
water. In the case of the gelatin-agar gels with glass wool, 20 g of gel were sampled
from the center of the jar and transferred to a large sterile filter bag with 180 mL of
peptone water. The samples were homogenized for 4 min using a mechanical
stomacher. A similar procedure was followed for the 3% agar gels, with the only
difference being that the gels with plaster of Paris inclusions were homogenized with
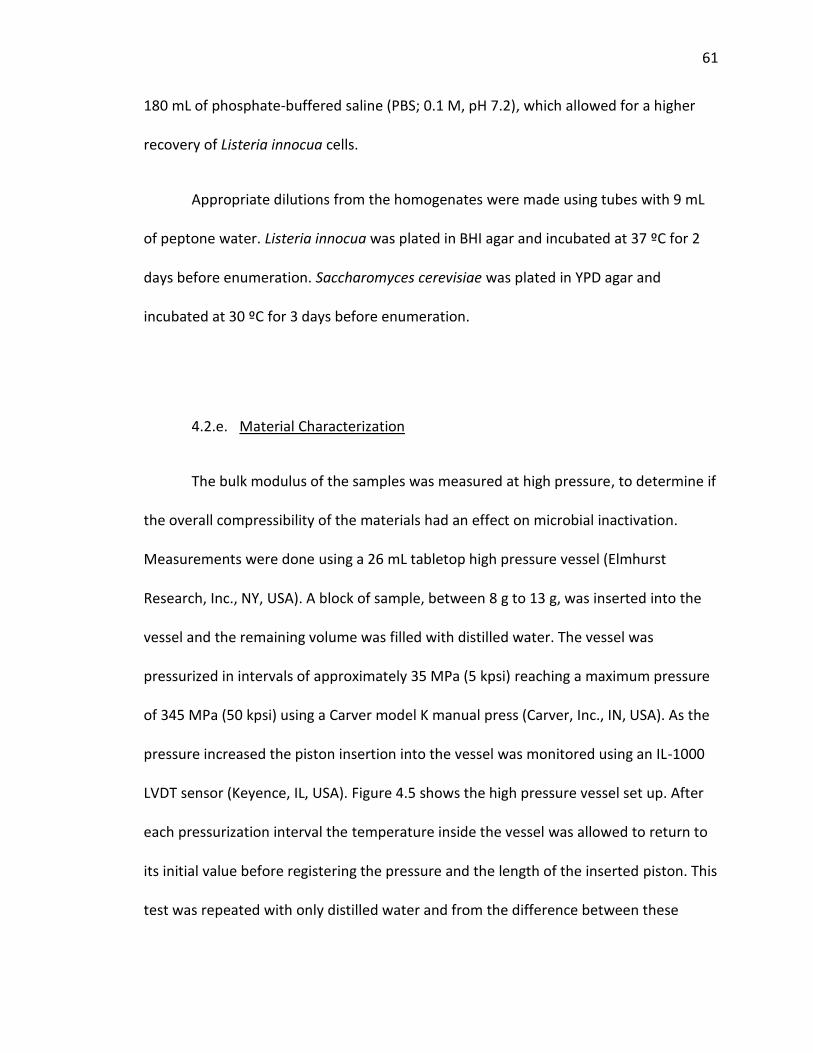
61
180 mL of phosphate-buffered saline (PBS; 0.1 M, pH 7.2), which allowed for a higher
recovery of Listeria innocua cells.
Appropriate dilutions from the homogenates were made using tubes with 9 mL
of peptone water. Listeria innocua was plated in BHI agar and incubated at 37 ºC for 2
days before enumeration. Saccharomyces cerevisiae was plated in YPD agar and
incubated at 30 ºC for 3 days before enumeration.
4.2.e. Material Characterization
The bulk modulus of the samples was measured at high pressure, to determine if
the overall compressibility of the materials had an effect on microbial inactivation.
Measurements were done using a 26 mL tabletop high pressure vessel (Elmhurst
Research, Inc., NY, USA). A block of sample, between 8 g to 13 g, was inserted into the
vessel and the remaining volume was filled with distilled water. The vessel was
pressurized in intervals of approximately 35 MPa (5 kpsi) reaching a maximum pressure
of 345 MPa (50 kpsi) using a Carver model K manual press (Carver, Inc., IN, USA). As the
pressure increased the piston insertion into the vessel was monitored using an IL-1000
LVDT sensor (Keyence, IL, USA). Figure 4.5 shows the high pressure vessel set up. After
each pressurization interval the temperature inside the vessel was allowed to return to
its initial value before registering the pressure and the length of the inserted piston. This
test was repeated with only distilled water and from the difference between these

62
experimental results and the NIST data for water density at different pressures a
correction factor was calculated to account for compression of seals and other parts
inside the vessel.
Figure 4.5: 26 mL high pressure vessel on the Carver press (left); detail of
the LVDT sensor (right, in the red oval).
Equation (26) was used to calculate the volume of sample at each pressure:
𝑉𝑆,𝑃 = (𝑉𝑆,0 + 𝑉𝑊,0) − 𝜋𝐷2
4∆ℎ − 𝑉𝑊,𝑃 − 𝑓(𝑃) ( 26 )
Where VS,P is the volume of the sample at each pressure, VS,0 is the volume of the
sample at atmospheric pressure, VW,0 is the volume of the mass of water added at
atmospheric pressure, VW,P is the volume of the mass of water added at each pressure

63
obtained from NIST data (Harvey et al., 2010), D is the diameter of the piston, Δh is the
length of the piston inserted (measured as the change in distance between the LVDT
sensor and the platform of the press), and f(P) is a volume correction factor obtained
from comparing the experimental compression of water and the NIST data.
The correction factor was inserted in equation (26) after observing that the
measured values of density of water at high pressure were consistently higher than the
values published by NIST. This discrepancy very likely originated from components
inside the pressure vessel that were also compressing at high pressure, like seals or the
pressure sensor. Since the method used to measure the bulk modulus at high pressure
assumes that the volume of inserted piston corresponds to the compression of water
and sample, the additional compression of these vessel elements would offset the
calculated volumes of the water and sample at high pressure by making them appear to
be lower than what they really are. If this calculated volume was then used to calculate
the density at high pressure, it would appear to be higher than what it really was. In
order to calculate the correction factor, the procedure to measure bulk modulus was
followed using only water. Afterwards, the correction factor was calculated by
determining what should have been the measured volume at each pressure so the
density had matched the one published by NIST. A regression line was obtained in order
to determine the correction values to use in the measurements of bulk modulus of the
samples. This procedure was followed every day before the measurements of bulk
modulus of samples, to account for yielding of the seals.

64
The bulk modulus (K) was obtained from linear regression between the
hydrostatic pressure and the samples volumes, using equation (27):
𝑃 = 𝐾 ∙ 𝑙𝑛 (𝑉𝑆,0
𝑉𝑆,𝑃) ( 27 )
The samples were also observed under an Olympus CX41 (Olympus Corporation,
Tokyo, Japan) optical microscope () to determine an approximate size of the plaster of
Paris inclusions.
4.2.f. Statistical Analysis
Analysis of variance (ANOVA) was carried out using Excel 2013 (Microsoft,
Redmond, VA) for Windows 64-bits with Daniel’s XL Toolbox add-in, version 6.53 (Daniel
Kraus, Würzburg, Germany). A significance value of α=0.05 was used for the analysis.
Bonferroni-Holm or Student’s t-test post hoc tests with α=0.05 were used for paired
comparison if ANOVA had shown significant difference between three or more factors.
Error bars in the figures represent standard error. Linear regression was also done with
Excel 2013.

65
4.3. Results and Discussion
4.3.a. Material Characterizations
The bulk modulus of the different materials used in the model systems is shown
in Figure 4.6. As expected, the materials with lower water content had higher bulk
modulus. The gel model system made with 18% gelatin and 2% agar was significantly
less compressible than the one made with 3% agar. The addition of glass wool to the
gelatin-agar gel model system did not change the overall compressibility of the material.
In general, the bulk modulus of the agar gel model system increased with higher volume
fractions of plaster of Paris, and the agar gel with 27% (v/v) plaster had similar
compressibility as the gelatin-agar gels.
Figure 4.6: Bulk modulus (K) at high pressure of the different materials
used in the model systems. Different letter subscripts indicate significant
difference (α=0.05) between means using t-test.
0
1
2
3
4
5
Agar 3% Agar 3% + 2%plaster
Agar 3% + 13%plaster
Agar 3% + 27%plaster
Gelatin 18% +Agar 2%
Gelatin 18% +Agar 2% + 2%
glass wool
Bu
lk M
od
ulu
s (G
Pa)
a b
c
dd d

66
A microscope image of the 3% agar gel with 2% (v/v) plaster of Paris is shown in
Figure 4.7. The microscope field of view at 100x magnification was determined to be
700 µm, and the size of the observed plaster particles ranged from 4 µm to 40 µm.
Figure 4.7: Microscope image at 100x magnification of the agar gel + 2%
plaster of Paris model system. Circles indicate plaster particles.
4.3.b. Microbial inactivation
The inactivation of Listeria innocua after high pressure processing at 303 MPa for
6 min in different locations inside the gelatin-agar with a single wood inclusion model
system is shown in Figure 4.8. No significant difference (P=0.46) was found between the
three results, as shown in Table 4-1.

67
Figure 4.8: Reduction of Listeria innocua at different positions in the
gelatin-gel with a single wood inclusion model system (n=4).
Table 4-1: ANOVA for reduction of L. innocua at different positions in the model system
with one inclusion.
Source of
Variation SS df MS F P-value F crit
Between
Groups 0.254115 2 0.127058 0.847611 0.459978 4.256495
Within Groups 1.349108 9 0.149901
Total 1.603223 11
The inactivation of Listeria innocua and Saccharomyces cerevisiae inside the
gelatin-agar model system with glass wool inclusions after high pressure processing at
0
0.5
1
1.5
2
2.5
3
3.5
4
Internal Middle External
Re
du
ctio
n lo
g cf
u/g
aa
a

68
303 MPa (44 kpsi) for 6 min and 276 MPa (40 kpsi) for 2 min, respectively, are shown in
Figure 4.9. Unlike the previous experiment, the hard inclusions (glass wool fibers) were
dispersed all over the gel, so the gels were sampled only once and at the center. The
glass wool caused a significantly lower (α=0.05) inactivation level for both organisms
compared to the sample without the inclusions. The ANOVA results are in Table 4-2 and
Table 4-3, and the results of the Bonferroni-Holm post-hoc test (α=0.05) are in the letter
subscripts in Figure 4.9. The experiment with glass wool at 6% (v/v) was only repeated
twice and only with Listeria innocua, due to the difficulties in pouring the melted gel in
the void space left by the glass wool in the plastic jar. Because of this limitation, the
model system of agar gel with plaster of Paris particles was designed.
Figure 4.9: Microbial reduction in the model system of gelatin-agar gel
with glass wool fibers (n=4). Statistical analysis done between results for
the same organism.
0
0.5
1
1.5
2
2.5
3
3.5
4
Listeria innocua Saccharomyces cerevisiae
Re
du
ctio
n lo
g cf
u/g
Gel Gel and glass wool 2% Gel and glass wool 6%
a
b
c
a*
b*

69
Table 4-2: ANOVA of reduction of Listeria innocua in the gelatin-agar gel with glass wool
model system.
Source of Variation SS df MS F P-value F crit
Between Groups 4.389644 2 2.194822 14.88451 0.002013 4.45897
Within Groups 1.179655 8 0.147457
Total 5.569299 10
Table 4-3: ANOVA of reduction of Saccharomyces cerevisiae in the gelatin-agar gel with
glass wool model system.
Source of Variation SS df MS F P-value F crit
Between Groups 1.529433 1 1.529433 14.44305 0.008964 5.987378
Within Groups 0.635364 6 0.105894
Total 2.164798 7
The 3% (w/w) agar gel was able to hold in suspension between 2% (v/v) and 27%
(v/v) of plaster of Paris particles. The results of Listeria innocua and Saccharomyces
cerevisiae reduction after HPP treatments similar as above (303 MPa x 6 min for Listeria
and 276 MPa x 2 min for Saccharomyces) are shown in Figure 4.10. A significantly lower
(α=0.05) inactivation was observed in the gel with 2% plaster compared to the gel
without inclusions; a similar trend as with the glass wool inclusions. In the case of
Listeria innocua, the inactivation significantly decreased (α=0.05) with 13% and 27% of

70
plaster compared to 2% plaster (however, no significant difference was observed
between the two samples with higher amount of plaster). In the case of Saccharomyces
cerevisiae, the inactivation in the samples with 13% and 27% of plaster returned to the
levels of the sample without inclusion, no significant difference (α=0.05) between them
was observed. The results of ANOVA are shown in Table 4-4 and Table 4-5, and the
results of the Bonferroni-Holm post-hoc test (α=0.05) are in the letter subscripts in
Figure 4.10.
Figure 4.10: Microbial reduction in the model system of agar gel with
plaster particles (Listeria: n=4, Saccharomyces: n=7). Statistical analysis
done between results for the same organism.
0
0.5
1
1.5
2
2.5
3
3.5
4
4.5
Listeria innocua Saccharomyces cerevisiae
Re
du
ctio
n lo
g cf
u/g
Agar Agar + 2% plaster Agar + 13% plaster Agar + 27% plaster
a
b
c c
a*
b*
a*a*

71
Table 4-4: ANOVA of Listeria innocua reduction in agar gel with plaster particles model
system.
Source of Variation SS df MS F P-value F crit
Between Groups 37.11071 3 12.37024 104.958 7.81E-10 3.343889
Within Groups 1.650024 14 0.117859
Total 38.76073 17
Table 4-5: ANOVA of Saccharomyces cerevisiae reduction in agar gel with plaster
particles model system.
Source of Variation SS df MS F P-value F crit
Between Groups 5.008844 3 1.669615 8.48137 0.000696 3.072467
Within Groups 4.133992 21 0.196857
Total 9.142836 24
The effects of CaSO4 on the reduction of Listeria innocua after high pressure
processing (303 MPa x 6 min, same conditions as the previous experiments) are shown
in Figure 4.11. A significantly lower inactivation (α=0.05) was observed in water with
0.24% CaSO4 compared to pure water, however no difference was observed in the agar
gel with and without CaSO4. The results of the ANOVA are shown in Table 4-6, and and
the results of the Bonferroni-Holm post-hoc test (α=0.05) are in the letter subscripts in
Figure 4.11.

72
Figure 4.11: Reduction of Listeria innocua after high pressure processing
in water and agar gel with calcium sulfate (n=4 for water, n=7 for water +
CaSO4 and agar, n=4 for agar + CaSO4).
Table 4-6: ANOVA of Listeria innocua reduction in water and agar gels with CaSO4.
Source of Variation SS df MS F P-value F crit
Between Groups 17.11073 3 5.703578 12.5137 5.51E-05 3.049125
Within Groups 10.02731 22 0.455787
Total 27.13804 25
Comparing the bulk modulus of the model system materials (Figure 4.6) with the
achieved microbial inactivation (Figure 4.9 and Figure 4.10), we can infer that the overall
compressibility of the materials did not influence microbial inactivation. For example, no
significant difference was found in the bulk modulus of the gelatin gel with and without
0
1
2
3
4
5
6
7
Water Water + CaSO4 Agar Agar + CaSO4
Re
du
ctio
n (
log
cfu
/g)
a
bb
b

73
glass wool fibers, however the inactivation of Listeria innocua and Saccharomyces
cerevisiae was significantly difference between those two materials (α=0.05).
Additionally, no significant difference was observed between the inactivation of Listeria
innocua in the gelatin-agar gel and agar gel without inclusions (P=0.216, from a t-test),
although the bulk modulus of the materials were significantly different. In the case of
Sacharomyces cerevisiae, a significant difference was observed between the inactivation
in the above materials, but the probability value was on the high end (P=0.024).
The results shown in Figure 4.8 would indicate that no stress profile was
established in the model system during high pressure processing, given that there was
no difference in the inactivation at different distances from the hard inclusion at the
center. However, it is possible that the stress profile only formed in regions very close to
the inclusion, and that even the cells from the location sampled close to the inclusion
were too far away from it (bacteria cells are approximately 1.5 µm in diameter, if the
samples location was an average of 5 mm away from the inclusion, that would still be 3
orders of magnitude larger, an equivalent to 1 Km in human perspective). The results
from the gel with glass wool model system support this idea, as both Listeria innocua
and Saccharomyces cerevisiae had significantly lower inactivation when 2% (v/v) glass
wool were added to the gel (Figure 4.9). By replacing the single 10 mm diameter wood
inclusion with 2% (v/v) of 8 µm diameter glass wool fibers, the interface area increased
500 times, so the effect of cells surviving when located very close to the hard inclusions
was detectable.

74
The results with the agar gel with plaster particles model system also supported
the idea that a stress profile formed very close to the inclusions. Using plaster of Paris
particles allowed a wide range of volume fraction of hard inclusions in the gel. In the
case of Listeria innocua, as the volume of plaster increased from 0% to 2%, and to 13%
and 27%, the inactivation decreased (Figure 4.10). No significant difference in the
inactivation was found between 13% and 27% plaster, likely because doubling the
amount of particles didn´t make a difference detectable in the log scale used to quantify
the surviving microorganisms. In case of Saccharomyces cerevisiae, also shown in Figure
4.10, the microbial reduction significantly decreased between 0% and 2% of plaster, but
it went back up to values similar to the gel without inclusions when 13% and 27% were
added.
Based on the results from the numerical simulation of stress distribution in a soft
material with one inclusion, shown in Figure 2.4, in the regions close to the inclusions
the hydrostatic pressure stress would be at its minimum and shear stress would form. In
the regions further away from the inclusions the pressure stress should increase and the
shear stress would decrease, and even further away the pressure stress would be
almost equal to the applied hydrostatic pressure and the shear stress would be almost
zero. In the model system of agar gel with plaster, when the amount of plaster particles
was increased to 13% and 27% it is very likely that the regions on high shear – low
pressure were increased, compared to the agar gel with 2% plaster where the regions of
medium shear – medium pressure should have been more prevalent.

75
Depending on the susceptibility of a specific organism to pressure or shear, or to
their interaction, the effect on inactivation would be different. The inactivation of
Listeria innocua decreased upon increase of the number of inclusions, both glass wool
fiber and plaster particles, so it is likely that the cell wasn’t affected by the shear stress
formed around the inclusions. In the case of Saccharomyces cerevisiae, it is likely that
the combination of pressure and shear was antagonistic for microbial inactivation, so
reduction was at its lowest with 2% plaster. When the amount of plaster increased and
more yeast cells were exposed to higher shear stress and lower pressure, the average
inactivation was similar as the material without any inclusions.
Buckling is a phenomenon that takes place, among many scenarios, in thin
shells under load (Tasi, 1966; Seaman, 1962), and it is expected that it would happen
with microbial cells under high pressure. The Young’s modulus of Saccharomyces
cerevisiae cell wall has been measured and models have been developed and validated
with the assumption that it is incompressible (Stenson et al., 2011; Stenson et al., 2009;
Smith et al., 2000a; Smith et al., 2000b). Assuming a Young’s modulus of 112 MPa, the
lowest value indicated by these authors, and a Poisson’s ratio of 0.499, consistent with
the assumption of an incompressible material, the bulk modulus of the yeast cell wall
would be 18.7 GPa according to equation (22). Since the cell cytoplasm main component
is water, its bulk modulus would be close to 3.3 GPa (calculated using NIST data for
water a high pressure). Given the differences in compressibility between the yeast cell
wall and cytoplasm, it is very likely that the yeasts buckle during high pressure

76
processing. Additionally, buckling has already been observed in carrot cells after 300
MPa for 2 min (Trejo Araya et al., 2007).
The development of shear stress in addition to pressure would reduce buckling.
Figure 4.12 shows the different scenarios of yeast cell compression and deformation
during high pressure processing. If no buckling would take place, the cell wall and
cytoplasm would separate, so that scenario is not possible. If only pressure was applied
the cell wall would need to buckle and loose its globular shape so the internal surface
area of the cell wall matches the surface area of the cytoplasm while maintaining the
volume reductions due to pressure. If shear was applied in addition to pressure, the cell
would lose its globular shape due to shear deformation and the need to buckle so the
internal cell wall surface and cytoplasm surface match would be less.

77
Figure 4.12: Schematic of the possible yeast cell compression and
deformation scenarios during high pressure processing.
Therefore, if buckling was involved in the inactivation by cell wall rupture of
Saccharomyces cerevisiae cells during high pressure processing, very possible given that
the models developed by Huang et al. (2008) predicted the development of cracks
around local deformations in the cell wall of E. coli, the development of shear stress in
the vicinity of the plaster particles would reduce it. This would explain why the
reduction in the model system with only 2% plaster particles was the lowest. When the
amount of plaster particles increased, the effects of the high shear – low pressure
developed next to the plaster particles could have damaged the cell wall of the yeasts
No buckling
Buckling
Buckling and deformation (due to shear stress)
Native yeast cell

78
but in a different way and increased the microbial inactivation. The absence of this
effect on Listeria innocua could be explained because it is natively further away from
being sphere-like (Listeria is a rod-shaped organism), so the effect of cell wall buckling
should have a lower participation on overall inactivation.

79
5. Development of a Fluorescent Pressure Sensor and In situ
Studies of Microbial Inactivation during High Pressure
Processing
This chapter describes the experiments aiming to develop a pressure sensor
based on the increase of Förster resonance energy transfer (FRET) between two
chromophores as they get closer due to the compression caused by the pressure.
Additionally, it includes the work done to obtain real-time data of microbial inactivation
during high pressure processing. In both cases the experiments were done in the small
tabletop high pressure vessel, which had sapphire windows that allowed to make
spectrophotometric measurements during processing.
The FRET pair chosen was Nile red and diphenylhexatriene (DPH), which has
been shown to give fluorescence in an aqueous solution with lipid particles.
Unfortunately no emission from Nile red was detected upon excitation of the DPH at
390 nm, so the experiment was unsuccessful. The microbial inactivation was monitored
through propidium iodide fluorescence, using Enterobacter aerogenes. We were able to
determine that no appreciable inactivation happened during depressurization, and that
it is likely that reversible disassociation of ribosomes took place inside the cells after the
cell membrane was compromised due to pressure.

80
5.1. Literature Review
5.1.a. Mechanism of Förster Resonance Energy Transfer (FRET)
FRET involves the non-radiative transfer of energy from an excited chromophore
(called donor) to another chromophore (called acceptor) by long-range dipole-dipole
coupling (Clegg, 1995; Förster, 1948). The efficiency of energy transfer (E) is given by:
𝐸 =1
1+(𝑅
𝑅0)
6 ( 28 )
where R is the distance between the acceptor and donor molecules pair, and R0 is the
distance at which 50% of the energy is transferred (constant for the pair). The transfer
results in a decrease in the fluorescence emission of the donor and an increase in the
fluorescence emission of the acceptor, which are used to determine E, which in turn can
be used to measure R (Ha, 2001). Wu and Brand (1994) compiled a list of 70 FRET pairs
with their R0 value.
FRET is widely used in the study of biological systems, some of the applications
include DNA rulers, staphylococcal nuclease, biotin-streptavidin, GCN4 peptides, α-
tropomyosin, S15 binding RNA junction, Tetrahymena ribozyme, calmodulin, and Rep
helicase (Ha, 2001).

81
5.1.b. Use of Fluorescent Dyes in Cell Inactivation Studies
Fluorescent dyes, propidium iodide among them, have been extensively used as
fast methods to measure microbial inactivation using flow cytometry. Propidium iodide
penetrates unviable cells with damaged or permeabilized membrane (Boulos et al.,
1999; Nebe-von Caron et al., 1998) and binds to nucleic acids (DNA or RNA) increasing
its fluorescence signal 20 or 30 times, with an emission peak at around 620 nm
(invitrogen, 2006). Propidium iodide has been used to study the relationship between
membrane fluidity and inactivation due to HPP in Lactobacillus plantarum (Smelt et al.,
1994), to assess the inactivation in different strains of E. coli 0157 due to HPP (Benito et
al., 1999), and to study the membrane rupturing in Listeria monocytogenes after HPP
(Ritz et al., 2001). It was also used to conclude that pressure inactivation was mostly due
to membrane damage but thermal inactivation was not necessarily due to it in
Lactobacillus rhamnosus (Ananta and Knorr, 2009). Additionally, it was used to assess
membrane integrity of mammalian skeletal muscle fibers during high pressure
treatment using in-situ fluorescence microscopy (Friedrich et al., 2006).
5.2. Materials and Methods
5.2.a. High Pressure Processing
A 26 mL capacity tabletop high pressure vessel (Elmhurst Research, Albany, NY),
that can reach a maximum pressure of 800 MPa. The vessel has three sapphire windows

82
with non-reflective coating (Kyocera Industrial Ceramics Corp., Kyoto, Japan) of 10 mm
diameter and 12.5 mm length, which allow for optical access for excitation and
fluorescence emission through fiber optic probes. The vessel was pressurized by
inserting a piston, using a manual model K (Carver, Wabash, IN) hydraulic press. The
pressurization rate was approximately 103 MPa/min (15 kpsi/min). Fluorescence was
measured with a SILVER-Nova 200 TEC BW16 (StellarNet, Inc., Tampa, FL) spectrometer
with 10,000 ms integration time (the accumulation time of light input before the
spectrometer provided the spectrum output). Excitation was done with a SL-1
(StellarNet, Inc., Tampa, FL) LED lamp. Figure 5.1 shows the high pressure vessel on the
press, with the spectrometer and LED lamp connected to the sapphire windows through
optical fiber cables. Figure 5.2 shows a schematic of the sapphire windows in the high
pressure vessel.
Figure 5.1: Tabletop high pressure system, with spectrometer and LED
lamp (bottom left).

83
Figure 5.2: Schematic of sapphire windows in high pressure vessel (not on
scale).
5.2.b. Development of a Pressure Sensor
The FRET system studied by Jain and Das (2006), using Nile red and
diphenylhexatriene (DPH) as acceptor and donor, respectively, in a lipid environment
was adapted. Upon compression of the system due to hydrostatic pressure, it was
expected that the average distance between the donor and acceptor would be reduced
and therefore the energy transfer after excitation of the donor would increase, as
pointed out in equation 26.
The lipid system was formed by homogenizing a 2% mineral oil (Foodtown, NJ)
and 0.1% sodium lauryl sulfate (Spectrum Chemical MFG Corp, New Brunswick, NJ) using
a Polytron PT 1600E (Kinematica, Schweiz, Switzerland) high shear homogenizer for 1

84
min at 10,000 RPM. The FRET system was formed with 4 µM of Nile red and 4 µM of
DPH, using stock solutions of 1 mM Nile red in methanol and 500 µM DPH in
tetrahydrofuran. Pressurization was done from atmospheric pressure to 172 MPa (25
kpsi). Emission spectrum was recorded on intervals of 34 MPa (5 kpsi). Excitation of DPH
was done at 390 nm.
Additionally, fluorescence of Nile red alone in the lipid system was measured, to
be able to account for the effects of the increase in dye concentration due to
compression during pressurization. Concentrations from 1.2 µM to 7.2 µM were tested.
Excitation of Nile red was done at 545 nm.
Finally, the effects of pressurization on fluorescence of Nile red were measured
using 4 µM of Nile red and 12 µM of DPH in the lipid system, which was pressurized up
to 276 MPa (40 kpsi). Excitation of Nile red was done at 545 nm.
5.2.c. In situ Studies of Microbial Inactivation during HPP
Nalidixic acid-resistant Enterobacter aerogenes (Gram negative bacteria) was
grown in 25 mL of trypticase soy broth (Becton, Dickinson and Company, NJ, USA) with
50 mg/L of nalidixic acid, for approximately 20 h at 37 ºC, which assured the cells were
in stationary phase. The cultures were centrifuged at 6,000 x g for 10 min in a Sorvall
Legend X1R (ThermoFisher Scientific, Waltham, MA) and the supernatant replaced with
phosphate-buffered saline (PBS; 0.1 M, pH 7.2). After washing, the suspension

85
contained approximately 8.5 log cfu/mL of viable bacteria. 15 µg/mL of propidium
iodide was added to the Enterobacter aerogenes suspension prior to HPP, using a 500
µg/mL stock solution previously prepared and kept under refrigeration and protected
from the light. Enumeration after processing was done in trypticase soy agar (Becton,
Dickinson and Company, NJ, USA) with 50 mg/L of nalidixic acid; the suspensions used
for enumeration did not have propidium iodide added.
Additionally, Listeria innocua ATCC 3390 and Saccharomyces cerevisiae were
grown in BHI broth for 20 h at 37 ºC and YPD broth for 28 h at 37 ºC under agitation,
respectively, and washed at 6,000 x g for 10 min or 1,500 x g for 2 min and suspended in
PBS. 15 µg/mL of propidium iodide was also added before HPP.
Three different pressurization processes were applied. The first process had 3
min cycles at 207 MPa, 267 MPa and 345 MPa with 2 min holding at atmospheric
pressure between cycles. The second had 45 s and 4 min cycles at 267 MPa and a cycle
at 207 MPa for 2 min with 2 min holding at atmospheric pressure between cycles. The
third process had a cycle of 7 min at 207 MPa directly followed by 6 min at 267 MPa.
Excitation was done at 490 nm and fluorescence emission was monitored at 622 nm.

86
5.3. Results and Discussion
5.3.a. Development of a Pressure Sensor
Fluorescence was not detected from the FRET system when excited at 390 nm,
at atmospheric pressure or at high pressure. The most likely reason was that the energy
transfer between DPH and Nile red was too small, which in turn caused a very weak
emission from Nile red which wasn’t detectable by our set up. Due to the thickness of
the pressure vessel (see Figure 5.2) and the small size of the fiber optic probe (5 mm in
diameter), only a very small fraction of the light from inside the vessel would be able to
escape and be transferred to the sprectrophotometer.
Nile red produced fluorescence when excited at 545 nm, both at atmospheric
pressure and at high pressure. Figure 5.3 shows the fluorescence spectrum of different
concentrations of Nile red at atmospheric pressure, with peak emission at 643 nm. The
emission intensities are plotted in Figure 5.4, showing a linear correlation between
emission and concentration.

87
Figure 5.3: Spectrum of different concentrations of Nile red at
atmospheric pressure.
Figure 5.4: Fluorescence peak emissions (643 nm) of Nile red.
Figure 5.5 shows the fluorescence intensity at 643 nm of 4 µM Nile red and 12
µM DPH as a function of pressure. Excitation of Nile red was done at 545 nm, so no
0
10,000
20,000
30,000
40,000
50,000
60,000
400 450 500 550 600 650 700 750 800
Flu
ore
sce
nce
Inte
nsi
ty
Wavelenth (nm)
1.2 μM 2.4 μM 3.6 μM 4.8 μM 7.2 μM
y = 3480.8x + 6858.8R² = 0.9846
0
5,000
10,000
15,000
20,000
25,000
30,000
35,000
0 1 2 3 4 5 6 7 8
Flu
ore
sce
nce
Inte
nsi
ty
Concentration (μM)

88
effect is expected from DPH. Even though it was expected that the fluorescence would
increase due to the increase in concentration of Nile red after volume reduction due to
pressurization, fluorescence actually decreased.
Figure 5.5: Fluorescence intensity at 643 nm during pressurization of 4 µM
Nile red and 12 µM DPH, with excitation at 545 nm.
The decrease in fluorescence of Nile red during pressurization is likely due to
phase change in the mineral oil, which would expel the Nile red and prevent it from
emitting fluorescence. So even if the FRET system between Nile red and DPH would
have given a signal from inside the pressure vessel, the dependency of Nile red on the
stability of lipids makes it unsuitable as a pressure sensor.
8,000
8,500
9,000
9,500
10,000
10,500
11,000
11,500
12,000
0 50 100 150 200 250 300
Max
imu
m e
mis
sio
n
Pressure (MPa)

89
5.3.b. In situ Studies of Microbial Inactivation during HPP
Figure 5.6, Figure 5.8, and Figure 5.10 show the fluorescence intensity at 622 nm
during the three different high pressure processes for Enterobacter aerogenes
suspensions with propidium iodide; while Figure 5.7, Figure 5.9, and Figure 5.11 show
each of the relative changes of emission intensity during depressurization, calculated as
1 − [𝐸𝐼𝑖 − 𝐸𝐼]/𝐸𝐼 (so it would be easier to compare with the relative volume change of
water, expressed as the change of density from atmospheric pressure to each pressure).
In the blank samples, without propidium iodide, no emission was detected at 622 nm.
As expected, at higher pressures the emission intensity increased at a higher rate.
During pressure hold time, the emission intensity also increased. As mentioned
previously, propidium iodide fluorescence emission corresponded to damage of the
external membranes and inactivation of bacterial cells (Boulos et al., 1999; Nebe-von
Caron et al., 1998). After the second cycle at 267 MPa for 3 min shown in Figure 5.6, in
which additional bacterial inactivation was achieved, the third cycle at 345 MPa for 3
min did not cause additional increase in fluorescence intensity; only a small increase
between 267 MPa and at 345 MPa was detected, which was attributed to the increase
in concentration of propidium iodide due to pressurization. The fluorescence intensities
after depressurization in the second and third cycles were the same.

90
Figure 5.6: Emission intensity at 622 nm during a process consisting of:
a)Pressurization to 207 MPa (30 kpsi) and hold time of 3 min; b)instant
depressurization and held at atmospheric pressure for 2 min;
c)pressurization to 276 MPa (40 kpsi) and hold time of 3 min; d)instant
depressurization and held at atmospheric pressure for 2 min;
e)pressurization to 345 MPa (50 kpsi) and hold time of 3 min; f)instant
depressurization and held at atmospheric pressure for 2 min.
0
50
100
150
200
250
300
350
400
0
1,000
2,000
3,000
4,000
5,000
6,000
7,000
8,000
0 200 400 600 800 1000 1200 1400
Pre
ssu
re (
MP
a)
Emis
sio
n a
t 6
22
nm
Time (s)
Emission at 622 nm Pressure (MPa)
a
b
c
d
e
f

91
Figure 5.7: Relative change of emission intensity at 622 nm after
depressurization of each of the three pressure holding stages on Figure
5.6.
0.7
0.75
0.8
0.85
0.9
0.95
1
0 20 40 60 80 100 120
Re
lati
ve e
mis
sio
n a
t 6
22
nm
Time (s)
From 207 MPa From 276 MPa From 345 MPa

92
Figure 5.8: Emission intensity at 622 nm during a process consisting of:
a)Pressurization to 276 MPa (40 kpsi) and hold time of 45 s; b)instant
depressurization and held at atmospheric pressure for 2 min;
c)pressurization to 276 MPa (40 kpsi) and hold time of 4 min; d)instant
depressurization and held at atmospheric pressure for 2 min;
e)pressurization to 207 MPa (30 kpsi) and hold time of 2 min; f)instant
depressurization and held at atmospheric pressure for 3 min.
0
50
100
150
200
250
300
0
1,000
2,000
3,000
4,000
5,000
6,000
7,000
8,000
0 200 400 600 800 1000 1200 1400
Pre
ssu
re (
MP
a)
Emis
sio
n a
t 6
22
nm
Time (s)
Emission at 622 nm Pressure (MPa)
ab
c d ef

93
Figure 5.9: Relative change of emission intensity at 622 nm after
depressurization of each of the three pressure holding stages on Figure
5.8.
0.7
0.75
0.8
0.85
0.9
0.95
1
0 20 40 60 80 100 120
Re
lati
ve e
mis
sio
n a
t 6
22
nm
Time (s)
From 276 MPa x 45 s From 276 MPa x 4 min From 207 MPa x 2 min

94
Figure 5.10: Emission intensity at 622 nm during a process consisting of:
a)pressurization to 207 MPa (30 kpsi) and hold time of 7 min;
b)pressurization to 276 MPa (40 kpsi) and hold time of 6 min; c)instant
depressurization and held at atmospheric pressure for 3 min.
0
50
100
150
200
250
300
350
400
0
1,000
2,000
3,000
4,000
5,000
6,000
7,000
8,000
0 200 400 600 800 1000 1200
Pre
ssu
re (
MP
a)
Emis
sio
n a
t 6
22
nm
Time (s)
Emission at 622 nm Pressure (MPa)

95
Figure 5.11: Relative change of emission intensity at 622 nm after
depressurization of in the process on Figure 5.10.
The emission intensity decreased after depressurization, but it was not
instantaneous in any of the cases. Moreover, except for the first decompression cycles
corresponding to 207 MPa for 5 min and 276 MPa for 45 s from Figure 5.6 and Figure
5.8, respectively, the decrease in emission intensity was higher than expected, based
purely on the decrease in concentration due to volumetric expansion. Since water is the
predominant component, it is expected that the compressibility of our system will
closely resemble that of water. Table 5-1 shows the volume change of water upon
decompression based on the data published by NIST (Harvey et al., 2010).
0.7
0.75
0.8
0.85
0.9
0.95
1
0 20 40 60 80 100 120 140 160 180 200
Re
lati
ve e
mis
sio
n a
t 6
22
nm
Time (s)

96
Table 5-1: Change in volume of water between atmospheric pressure and high
pressures.
Pressure (MPa) Relative change in volume
207 7.5%
276 9.6%
345 11.4%
The processing conditions were chosen to allow for only partial microbial
inactivation and in many cases for fluorescence intensities below the plateau value, to
allow for detection of further changes during depressurization or subsequent steps.
Table 5-2 shows the microbial reduction achieved at each independent stage of the
process. In all cases it was negligible, however it is important to mention that microbial
reduction was expressed in log scale while the increase of emission would be linearly
proportional to the damaged cells.
Table 5-2: Microbial reductions achieved at each stage of the processes.
Process Reduction (log cfu/mL)
276 MPa x 45 s 0.43 ± 0.008
207 MPa x 7 min 0.14 ± 0.014
207 MPa x 3 min 0.08 ± 0.044

97
No increase of emission was detected with Listeria innocua or Saccharomyces
cerevisiae, even though the processing conditions had shown in previous experiments
(see section 4) to achieve reductions higher than 1 log cfu/mL. We think this was
because the Gram + cell wall of Listeria inoocua allowed very little dye to migrate. In
case of Saccharomyces cerevisiae, it has been suggested that inactivation of yeast due to
pressure is not related to external membrane rupture (Brul et al., 2000), but it also
could be because overall available nucleic acid concentration compared to bacterial
suspensions caused lower signals not detectable by our instruments.
The effects of the pressurization and hold time stages have been studied
(McClements et al., 2001; Mussa et al., 1998; Basak and Ramaswamy, 1996), as well as
the effect of pressurization and depressurization rates (Syed et al., 2013; Chapleau et
al., 2006; Rademacher et al., 2002), but so far the effects of the depressurization stage
in HPP had not been isolated. By measuring the fluorescence of propidium iodide during
HPP we can pinpoint the moment when microbial inactivation took place. As shown in
Figure 5.6, Figure 5.8, and Figure 5.10, the emission of propidium iodide increased
during pressurization and hold time in all our processes, but not during
depressurization. Figure 5.8 shows a process where the first cycle (267 MPa for 45 s)
was specifically set up to achieve only partial inactivation; still the first decompression
did not increase the fluorescence emission, which only happened in the second cycle.
Therefore, no inactivation took place during the depressurization stage.

98
Moreover, in most of the cycles the fluorescence of propidium iodide actually
decreased after depressurization and during the time the microbial suspensions were
held at atmospheric pressure in between cycles or at the end of the processes, as seen
in Figures Figure 5.7, Figure 5.9, and Figure 5.11. If this decrease in fluorescence would
have originated only from the decrease in propidium iodide concentration due to
volumetric expansion during decompression, the change in relative fluorescence
emission in the figures would have been similar to the change in volume of water at the
given pressures in Table 5-1, but they were actually higher than that. For example, after
the second cycle at 276 MPa in Figure 5.7, the average loss of emission after the value
stabilized was 18.4% while the change in water volume was only 9.6%. In Figure 5.11 the
change is more dramatic, after 7 min at 207 MPa and 6 min at 267 MPa the average loss
of emission was 27.3% while the change in water volume after decompression still was
9.6%.
As mentioned previously, propidium iodide fluorescence originates from binding
with nucleic acids. Therefore, the unusual reduction in fluorescence after
depressurization would have to be caused by propidium iodide separating from DNA or
RNA at atmospheric pressure. Mentré and Hoa (2001) pointed out that high pressure
has a stabilizing effect on DNA hydrogen bonds. Krzyżaniak et al. (1994) studied the
conformation changes of RNA at 600 MPa and 800 MPa and determined that it could be
getting aggregated or condensed. Therefore it is unlikely that pressure would favor
DNA/RNA - propidium iodide binding so that after depressurization they separate and
give a lower fluorescence.

99
We think that the cause of the unexpected change in fluorescence is ribosome
disassociation. Infante et al. (1982) studied the thermodynamics of reversible E. coli
ribosome disassociation between 20 MPa and 120 MPa. Gross et al. (1993) observed
disassociation starting at 60 MPa in ribosomal preparations. Lu et al. (1997) observed
loss on rat ribosome activity immediately after HPP, but it was recovered after an
incubation period. Niven et al. (1999) detected conformation changes in E. coli
ribosomes between 50 MPa and 250 MPa, and suggested that cell death during HPP was
related to protein synthesis inhibition. If the ribosomes of Enterobacter aerogenes were
also reversibly disassociating at high pressure, that would open additional sites for their
RNA to interact with propidium iodide and increase the fluorescence signal. Upon
depressurization, when the ribosome subunits associating back, the some of the bound
propidium iodide would be expelled and the fluorescence would decrease beyond the
expected value due to volume expansion. This would also explain why it happened over
a period of time and not instantaneously.
One additional observation that comes from our data is that ribosome
disassociation would take place after membrane rupture. That would explain why after
processes at higher pressure and longer times, such 207 MPa for 7 min and 276 MPa for
6 min shown in Figure 5.11, the difference between the fluorescence decrease after
decompression and the water volume change higher (27.3% vs. 9.6%) compared to a
shorter process like 276 MPa for 45 s in Figure 5.9 where the difference was much
smaller (10% vs. 9.6%). Additionally, pressure cycling would be affecting ribosome
disassociation, which would explain why the fluorescence decrease after the third cycle

100
in Figure 5.9 (207 MPa for 2 min) was 16.6% and the decrease after the first cycle in
Figure 5.7 (207 MPa for 3 min) was 7.6%. The volume change of water at 207 MPa is
7.5% (Table 5-1). This could develop into an interesting area of research, looking at the
effect of the wait time between pressure cycles.
Another possible interpretation of the decrease in fluorescence would be that
some cells were able to pump propidium iodide out after decompression. Pagán and
Mackey (2000) observed propidium iodide uptake by E. coli cells in stationary phase
during HPP but not when exposed to the dye after processing, suggesting that the cells
were able to reseal their membrane. However, this also indicates that the dye wasn’t
actively pumped out by the cells, some of which were viable and some not.

101
6. Conclusions
The data supports the hypothesis that, when subjected to external hydrostatic
pressure during high pressure processing, pressure and shear stress gradients form
inside heterogeneous solid foods that would affect microbial inactivation. However, the
gradients were not as extensive as originally thought. They were restricted to the close
vicinities of the hard inclusions, very likely only a few micrometers away from the
interface between the soft material and the hard inclusion. These findings would be
important for the high pressure processing of heterogeneous solid foods where the
amount of inclusions could vary, as the process should be designed for the worst
possible scenario in which the volume of hard inclusions offer the maximum protection
to the microorganisms.
The differences in the changes of inactivation of Listeria innocua and
Saccharomyces cerevisiae suggest that these organisms respond differently to pressure
and shear stress. While the inactivation of Listeria decreased monotonically when the
volume fraction of hard inclusions increased, the inactivation of Saccharomyces first
decreased and then increased when a higher volume fraction was incorporated. This
suggests that pressure and shear have an antagonistic effect in the inactivation of
Saccharomyces, possibly because shear would reduce the development of buckling and
alleviate stress in the globular yeast cell wall.
The FRET system composed of Nile red and DPH was shown to be unsuitable as a
pressure sensor. Besides the inability of our equipment to detect any emission from Nile

102
red after exciting DPH at 390 nm, the fluorescence of Nile red was also shown to be
affected by the pressure, likely because of phase change in the lipids which would expel
Nile red and reduce the fluorescence.
Cell wall and membrane rupture was detected in Enterobacter aerogenes during
pressurization and hold time, but not during depressurization. Moreover, a higher than
expected decrease in fluorescence after depressurization indicates that ribosomes
would be disassociating at high pressure and associating back 20 s to 60 s after
depressurization, from pressures between 207 MPa and 345 MPa. It is also likely that
the ribosomes disassociation took place after membrane rupture.

103
7. Future Work
Numerical simulations of the stress distribution in the model systems with
plaster of Paris inclusions during high pressure processing are needed to confirm if
adding more inclusions would change the distribution of stress non-uniform regions
from medium shear – medium pressure to high shear – low pressure. This could support
the explanation made in this project on why the change in Listeria innocua and
Saccharomyces cerevisiae reduction is different between the model system of agar gel
with different volumes of plaster particles.
The development of a procedure to apply pure static shear on a material would
allow to study the independent effects of pressure and shear on microbial inactivation
and expand the findings in this project, which only studied the effects of pressure stress
alone and the combination of pressure and shear stress.
The measurement of Poisson’s ratio at high pressure would provide valuable
data to develop a model to more accurately describe the stress distribution in materials
with hard inclusions during high pressure processing. This project has shown that shear
stress would develop and pressure would decrease around the inclusions, but the
gradients or the extension of the non-uniformity regions were not quantified due to the
unavailability of a second mechanical property of the material.
Further studies are required to confirm if ribosome disassociation is responsible
for the decrease in fluorescence after the pressure had been released. It would be

104
necessary to extract the ribosomes and suspend them without damaging their structure,
and measure their fluorescence with propidium iodide during high pressure processing.
Additionally, modifications in the equipment could be made to increase the sensitivity of
the method and measure fluorescence of more resistant organisms, such as Gram
positive bacteria. Finally, a study of the effect of the wait time between cycles in
pressure cycling could be made and relate to the observed decrease in fluorescence
several seconds after pressure release.

105
8. Acknowledgments of Previous Publications
The Introduction section of this thesis is partially taken from our previously
published book chapter: Karwe, M. V., Maldonado, J. and Mahadevan, S. 2014. High
Pressure Processing: Current Status, in Conventional and Advanced Food Processing
Technologies (ed S. Bhattacharya), John Wiley & Sons, Ltd, Chichester, UK. doi:
10.1002/9781118406281.ch24.
The Theoretical Background (section 2.2) of this thesis is partially taken from our
manuscript submitted for publication: Nair, A., Maldonado, J. A., Miyazawa, Y., Cuitiño,
A., Schaffner, D. W., Karwe, M. V. Numerical Simulation of Stress Distribution in
Heterogeneous Solids during High Pressure Processing. Journal of Food Engineering,
submitted on November 12.

106
9. Bibliography
1. Abdul Ghani A.G., Farid M.M. 2007. Numerical Simulation of Solid–Liquid Food Mixture in a High Pressure Processing Unit Using Computational Fluid Dynamics. Journal of Food Engineering 80(4):1031-42.
2. Abid M., Jabbar S., Hu B., Hashim M.M., Wu T., Wu Z., Khan M.A., Zeng X. 2014. Synergistic Impact of Sonication and High Hydrostatic Pressure on Microbial and Enzymatic Inactivation of Apple Juice. LWT - Food Science and Technology 59(1):70-6.
3. Ananta E., Heinz V., Schlüter O., Knorr D. 2001. Kinetic Studies on High-Pressure Inactivation of Bacillus Stearothermophilus Spores Suspended in Food Matrices. Innovative Food Science & Emerging Technologies 2(4):261-72.
4. Ananta E., Knorr D. 2009. Comparison of Inactivation Pathways of Thermal or High Pressure Inactivated Lactobacillus Rhamnosus Atcc 53103 by Flow Cytometry Analysis. Food Microbiology 26(5):542-6.
5. Balasubramaniam V.M.B. 2009. Opportunities and Challenges in Pressure-Assisted Thermal Sterilization of Low-Acid Foods. International Forum on Emerging Technologies in Food Processing. University of Illinois (Urbana-Champaign), USA.
6. Barbosa-Canovas G.V., Tapia M.a.S., Cano M.P. 2005. Novel Food Processing Technologies. Boca Raton: CRC Press.
7. Basak S., Ramaswamy H.S. 1996. Ultra High Pressure Treatment of Orange Juice: A Kinetic Study on Inactivation of Pectin Methyl Esterase. Food Research International 29(7):601-7.
8. Bayındırlı A., Alpas H., Bozoğlu F., Hızal M. 2006. Efficiency of High Pressure Treatment on Inactivation of Pathogenic Microorganisms and Enzymes in Apple, Orange, Apricot and Sour Cherry Juices. Food Control 17(1):52-8.
9. Benito A., Ventoura G., Casadei M., Robinson T., Mackey B. 1999. Variation in Resistance of Natural Isolates Ofescherichia Coli O157 to High Hydrostatic Pressure, Mild Heat, and Other Stresses. Applied and environmental microbiology 65(4):1564-9.
10. Black E.P., Huppertz T., Fitzgerald G.F., Kelly A.L. 2007. Baroprotection of Vegetative Bacteria by Milk Constituents: A Study of Listeria Innocua. Int. Dairy J. 17(2):104-10.
11. Boudjema M., Santos I.B., McCall K.R., Guyer R.A., Boitnott G.N. 2003. Linear and Nonlinear Modulus Surfaces in Stress Space, from Stress-Strain Measurements on Berea Sandstone. Nonlin. Processes Geophys. 10(6):589-97.
12. Boulos L., Prévost M., Barbeau B., Coallier J., Desjardins R. 1999. Live/Dead® Baclight™: Application of a New Rapid Staining Method for Direct Enumeration of Viable and Total Bacteria in Drinking Water. Journal of Microbiological Methods 37(1):77-86.
13. Bower A.F. 2010. Applied Mechanics of Solids. Boca Raton: CRC Press.

107
14. Bradley D.W., Hess R.A., Tao F., Sciaba-Lentz L., Remaley A.T., Laugharn J.A., Jr., Manak M. 2000. Pressure Cycling Technology: A Novel Approach to Virus Inactivation in Plasma. Transfusion 40(2):193-200.
15. Brennan J.G. 2006. Food Processing Handbook. Weinheim: Wiley-VCH. 16. Brul S., Rommens A.J.M., Verrips C.T. 2000. Mechanistic Studies on the Inactivation
of Saccharomyces Cerevisiae by High Pressure. Innovative Food Science & Emerging Technologies 1(2):99-108.
17. Bulut S., Waites W.M., Mitchell J.R. 1999. Effects of Combined Shear and Thermal Forces on Destruction of Microbacterium Lacticum. Applied and environmental microbiology 65(10):4464-9.
18. Butz P., Edenharder R., Fister H., Tauscher B. 1997. The Influence of High Pressure Processing on Antimutagenic Activities of Fruit and Vegetable Juices. Food Research International 30(3–4):287-91.
19. Buzrul S., Alpas H., Largeteau A., Bozoglu F., Demazeau G. 2008a. Compression Heating of Selected Pressure Transmitting Fluids and Liquid Foods During High Hydrostatic Pressure Treatment. Journal of Food Engineering 85(3):466-72.
20. Buzrul S., Alpas H., Largeteau A., Demazeau G. 2008b. Inactivation of Escherichia Coli and Listeria Innocua in Kiwifruit and Pineapple Juices by High Hydrostatic Pressure. International Journal of Food Microbiology 124(3):275-8.
21. Chapleau N., Ritz M., Delépine S., Jugiau F., Federighi M., de Lamballerie M. 2006. Influence of Kinetic Parameters of High Pressure Processing on Bacterial Inactivation in a Buffer System. International Journal of Food Microbiology 106(3):324-30.
22. Cheftel J.C. 1995. Review : High-Pressure, Microbial Inactivation and Food Preservation / Revisión: Alta-Presión, Inactivación Microbiológica Y Conservación De Alimentos. Food Science and Technology International 1(2-3):75-90.
23. Chung Y.K., Vurma M., Turek E.J., Chism G.W., Yousef A.E. 2005. Inactivation of Barotolerant Listeria Monocytogenes in Sausage by Combination of High-Pressure Processing and Food-Grade Additives. J Food Prot 68(4):744-50.
24. Clegg R.M. 1995. Fluorescence Resonance Energy Transfer. Current Opinion in Biotechnology 6(1):103-10.
25. D'Souza T., Karwe M., Schaffner D.W. 2012. Effect of High Hydrostatic Pressure and Pressure Cycling on a Pathogenic Salmonella Enterica Serovar Cocktail Inoculated into Creamy Peanut Butter. Journal of Food Protection® 75(1):169-73.
26. De Ancos B., Gonzalez E., Cano M.P. 2000. Effect of High-Pressure Treatment on the Carotenoid Composition and the Radical Scavenging Activity of Persimmon Fruit Purees. Journal of Agricultural and Food Chemistry 48(8):3542-8.
27. Denys S., Ludikhuyze L.R., Van Loey A.M., Hendrickx M.E. 2000a. Modeling Conductive Heat Transfer and Process Uniformity During Batch High-Pressure Processing of Foods. Biotechnology Progress 16(1):92-101.
28. Denys S., Van Loey A.M., Hendrickx M.E. 2000b. A Modeling Approach for Evaluating Process Uniformity During Batch High Hydrostatic Pressure Processing: Combination of a Numerical Heat Transfer Model and Enzyme Inactivation Kinetics. Innovative Food Science & Emerging Technologies 1(1):5-19.

108
29. Doblado R., Frías J., Vidal-Valverde C. 2007. Changes in Vitamin C Content and Antioxidant Capacity of Raw and Germinated Cowpea (Vigna Sinensis Var. Carilla) Seeds Induced by High Pressure Treatment. Food Chemistry 101(3):918-23.
30. Dogan C., Erkmen O. 2004. High Pressure Inactivation Kinetics of Listeria Monocytogenes Inactivation in Broth, Milk, and Peach and Orange Juices. Journal of Food Engineering 62(1):47-52.
31. Doona C.J., Feeherry F.E. 2007. High Pressure Processing of Foods, 1st ed. Ames, Iowa, Chicago: Blackwell Pub., IFT Press.
32. Dornenburg H., Knorr D. 1993. Cellular Permeabilization of Cultured Plant-Tissues by High Electric-Field Pulses or Ultra High-Pressure for the Recovery If Secondary Metabolites. Food Biotechnol. 7(1):35-48.
33. Earnshaw R.G. 1995. High Pressure Microbial Inactivation Kinetics. In: Ledward D.A., Johnston D.E., Earnshaw R.G., Hasting A.P.M., editors. High Pressure Processing of Foods. Loughborough: Nottingham University Press. p. viii, 208 p.
34. Farid M.M., inventor; Auckland Uniservices Limited, assignee. 2006. Pressure Assisted Thermal Sterilisation or Pasteurisation Method and Apparatus. USA patent.
35. Fernández García A., Butz P., Bognàr A., Tauscher B. 2001. Antioxidative Capacity, Nutrient Content and Sensory Quality of Orange Juice and an Orange-Lemon-Carrot Juice Product after High Pressure Treatment and Storage in Different Packaging. Eur Food Res Technol 213(4-5):290-6.
36. Förster T. 1948. Zwischenmolekulare Energiewanderung Und Fluoreszenz. Annalen der Physik 437(1-2):55-75.
37. Friedrich O., Kress K.R., Hartmann M., Frey B., Sommer K., Ludwig H., Fink R.H.A. 2006. Prolonged High-Pressure Treatments in Mammalian Skeletal Muscle Result in Loss of Functional Sodium Channels and Altered Calcium Channel Kinetics. Cell Biochem Biophys 45(1):71-83.
38. Gercek H. 2007. Poisson's Ratio Values for Rocks. International Journal of Rock Mechanics and Mining Sciences 44(1):1-13.
39. Gould G.W. 1995. The Microbe as a High Pressure Target. In: Ledward D.A., Johnston D.E., Earnshaw R.G., Hasting A.P.M., editors. High Pressure Processing of Foods. Loughborough: Nottingham University Press. p. viii, 208 p.
40. Gross M., Lehle K., Jaenicke R., Nierhaus K.H. 1993. Pressure-Induced Dissociation of Ribosomes and Elongation Cycle Intermediates. European Journal of Biochemistry 218(2):463-8.
41. Ha T. 2001. Single-Molecule Fluorescence Resonance Energy Transfer. Methods 25(1):78-86.
42. Hartmann C. 2002. Numerical Simulation of Thermodynamic and Fluid-Dynamic Processes During the High-Pressure Treatment of Fluid Food Systems. Innovative Food Science and Emerging Technologies 3(1):11-8.
43. Hartmann C., Delgado A. 2002. Numerical Simulation of Convective and Diffusive Transport Effects on a High-Pressure-Induced Inactivation Process. Biotechnology and bioengineering 79(1):94-104.

109
44. Hartmann C., Delgado A. 2003. The Influence of Transport Phenomena During High-Pressure Processing of Packed Food on the Uniformity of Enzyme Inactivation. Biotechnology and bioengineering 82(6):725-35.
45. Hartmann C., Delgado A. 2004. Numerical Simulation of the Mechanics of a Yeast Cell under High Hydrostatic Pressure. Journal of biomechanics 37(7):977-87.
46. Hartmann C., Delgado A., Szymczyk J. 2003. Convective and Diffusive Transport Effects in a High Pressure Induced Inactivation Process of Packed Food. Journal of Food Engineering 59(1):33-44.
47. Harvey A.H., Peskin A.P., Klein S.A. 2010. Nist/Asme Steam Properties Database. 2.2 ed: National Institute of Standards and Technology.
48. Hayman M.M., Anantheswaran R.C., Knabel S.J. 2007. The Effects of Growth Temperature and Growth Phase on the Inactivation of Listeria Monocytogenes in Whole Milk Subject to High Pressure Processing. Int J Food Microbiol 115(2):220-6.
49. Hayman M.M., Anantheswaran R.C., Knabel S.J. 2008a. Heat Shock Induces Barotolerance in Listeria Monocytogenes. J Food Prot 71(2):426-30.
50. Hayman M.M., Kouassi G.K., Anantheswaran R.C., Floros J.D., Knabel S.J. 2008b. Effect of Water Activity on Inactivation of Listeria Monocytogenes and Lactate Dehydrogenase During High Pressure Processing. Int J Food Microbiol 124(1):21-6.
51. He X., Kim S.S., Park S.J., Seong D.H., Yoon W.B., Lee H.Y., Park D.S., Ahn J. 2010. Combined Effects of Probiotic Fermentation and High-Pressure Extraction on the Antioxidant, Antimicrobial, and Antimutagenic Activities of Deodeok (Codonopsis Lanceolata). J Agric Food Chem 58(3):1719-25.
52. Hendrickx M.E.G., Knorr D.W. 2002. Ultra High Pressure Treatments of Foods. New York: Kluwer Academic/Plenum Publishers.
53. Heremans K. 1995. High Pressure Effects on Biomolecules. In: Ledward D.A., Johnston D.E., Earnshaw R.G., Hasting A.P.M., editors. High Pressure Processing of Foods. Loughborough: Nottingham University Press. p. viii, 208 p.
54. Huang K.C., Mukhopadhyay R., Wen B., Gitai Z., Wingreen N.S. 2008. Cell Shape and Cell-Wall Organization in Gram-Negative Bacteria. Proceedings of the National Academy of Sciences 105(49):19282-7.
55. Infante A.A., Demple B., Chaires J.B. 1982. Analysis of the Escherichia Coli Ribosome-Ribosomal Subunit Equilibrium Using Pressure-Induced Dissociation. The Journal of biological chemistry 257(1):80-7.
56. invitrogen. 2006. Propidium Iodide Nucleic Acid Stain. In: invitrogen, editor. Molecular Probes.
57. Isaacs N.S., Chilton P. 1995. Studies on the Inactivation by High Pressure of Micro-Organisms. In: Ledward D.A., Johnston D.E., Earnshaw R.G., Hasting A.P.M., editors. High Pressure Processing of Foods. Loughborough: Nottingham University Press. p. viii, 208 p.
58. Jain B., Das K. 2006. Fluorescence Resonance Energy Transfer between Dph and Nile Red in a Lipid Bilayer. Chemical Physics Letters 433(1–3):170-4.
59. Kaletunç G., Lee J., Alpas H., Bozoglu F. 2004. Evaluation of Structural Changes Induced by High Hydrostatic Pressure in Leuconostoc Mesenteroides. Applied and environmental microbiology 70(2):1116-22.

110
60. Khurana M. 2012. Temperature Distribution in Vertical and Horizontal High Pressure Vessels and Its Impact on Food Safety. Rutgers University. Graduate School--New Brunswick.,. p. xxiii, 201 p.
61. Khurana M., Karwe M.V. 2009. Numerical Prediction of Temperature Distribution and Measurement of Temperature in a High Hydrostatic Pressure Food Processor. Food Bioprocess Technol 2(3):279-90.
62. Klärner F.-G., Diedrich M.K., Dierkes G., Gehrke J.-S. 1998. Organic Reactions at High Pressure. The Effect of Pressure on Cyclizations and Homolytic Bond Cleavage. In: Isaacs N.S., editor. High Pressure Food Science, Bioscience and Chemistry. Cambridge, UK: The Royal Society of Chemistry. p. 3-11.
63. Knoerzer K., Buckow R., Chapman B., Juliano P., Versteeg C. 2010a. Carrier Optimisation in a Pilot-Scale High Pressure Sterilisation Plant – an Iterative Cfd Approach Employing an Integrated Temperature Distributor (Itd). Journal of Food Engineering 97(2):199-207.
64. Knoerzer K., Buckow R., Versteeg C. 2010b. Adiabatic Compression Heating Coefficients for High-Pressure Processing – a Study of Some Insulating Polymer Materials. Journal of Food Engineering 98(1):110-9.
65. Knoerzer K., Juliano P., Gladman S., Versteeg C., Fryer P.J. 2007. A Computational Model for Temperature and Sterility Distributions in a Pilot-Scale High-Pressure High-Temperature Process. AIChE Journal 53(11):2996-3010.
66. Koseki S., Yamamoto K. 2007. A Novel Approach to Predicting Microbial Inactivation Kinetics During High Pressure Processing. International Journal of Food Microbiology 116(2):275-82.
67. Krzyżaniak A., Barciszewski J., Fürste J.P., Bald R., Erdmann V.A., Salański P., Jurczak J. 1994. A-Z-Rna Conformational Changes Effected by High Pressure. International Journal of Biological Macromolecules 16(3):159-62.
68. Lee H.Y., He X., Ahn J. 2010. Enhancement of Antimicrobial and Antimutagenic Activities of Korean Barberry (Berberis Koreana Palib.) by the Combined Process of High-Pressure Extraction with Probiotic Fermentation. Journal of the science of food and agriculture 90(14):2399-404.
69. Lu B., Li Q., Liu W.-Y., Ruan K.-c. 1997. Effects of Hydrostatic Pressure on the Activity of Rat Ribosome and Cell-Free Translation System. IUBMB Life 43(3):499-506.
70. Ludwig H., Bieler C., Hallbauer K., Wilhelm S. 1992. Inactivation of Microorganisms by Hydrostatic Pressure. In: C. Balny R.H., K. Heremans, P. Masson, editor. High Pressure and Biotechnology: Colloque INSERM/John Libbey Eurotext Ltd. p. 25-32.
71. Ly-Nguyen B., Van Loey A.M., Smout C., ErenÖzcan S., Fachin D., Verlent I., Truong S.V., Duvetter T., Hendrickx M.E. 2003. Mild-Heat and High-Pressure Inactivation of Carrot Pectin Methylesterase: A Kinetic Study. Journal of Food Science 68(4):1377-83.
72. Madigan M.T., Martinko J.M., Brock T.D. 2006. Brock Biology of Microorganisms, 11th ed. Upper Saddle River, NJ: Pearson Prentice Hall.
73. Mahadevan S., Karwe M.V. 2011. Enhanced Infusion under High Pressure: New Insights. International Congress on Engineering and Food. Athens, Greece.

111
74. Maitland J.E., Boyer R.R., Eifert J.D., Williams R.C. 2011. High Hydrostatic Pressure Processing Reduces Salmonella Enterica Serovars in Diced and Whole Tomatoes. International Journal of Food Microbiology 149(2):113-7.
75. Manas P., Mackey B.M. 2004. Morphological and Physiological Changes Induced by High Hydrostatic Pressure in Exponential- and Stationary-Phase Cells of Escherichia Coli: Relationship with Cell Death. Applied and environmental microbiology 70(3):1545-54.
76. McClements J.M., Patterson M.F., Linton M. 2001. The Effect of Growth Stage and Growth Temperature on High Hydrostatic Pressure Inactivation of Some Psychrotrophic Bacteria in Milk. J Food Prot 64(4):514-22.
77. Mentré P., Hoa G.H.B. 2001. Effects of High Hydrostatic Pressures on Living Cells: A Consequence of the Properties of Macromolecules and Macromolecule-Associated Water. International Review of Cytology: Academic Press. p. 1-84.
78. Michiels C., Bartlett D.H., Aertsen A. 2008. High-Pressure Microbiology. Washington, DC: ASM Press.
79. Minerich P.L., Labuza T.P. 2003. Development of a Pressure Indicator for High Hydrostatic Pressure Processing of Foods. Innovative Food Science & Emerging Technologies 4(3):235-43.
80. Moeller R., Horneck G., Rabbow E., Reitz G., Meyer C., Hornemann U., Stöffler D. 2008. Role of DNA Protection and Repair in Resistance of Bacillus Subtilis Spores to Ultrahigh Shock Pressures Simulating Hypervelocity Impacts. Applied and environmental microbiology 74(21):6682-9.
81. Mussa D.M., Ramaswamy H.S., Smith J.P. 1998. High Pressure (Hp) Destruction Kinetics of Listeria Monocytogenes Scott a in Raw Milk. Food Research International 31(5):343-50.
82. Narwankar S.P., Flimlin G.E., Schaffner D.W., Tepper B.J., Karwe M.V. 2011. Microbial Safety and Consumer Acceptability of High-Pressure Processed Hard Clams (Mercenaria Mercenaria). Journal of Food Science 76(6):M375-M80.
83. Nebe-von Caron G., Stephens P., Badley R.A. 1998. Assessment of Bacterial Viability Status by Flow Cytometry and Single Cell Sorting. Journal of applied microbiology 84(6):988-98.
84. Nguyen Thi Minh H., Durand A., Loison P., Perrier-Cornet J.M., Gervais P. 2011. Effect of Sporulation Conditions on the Resistance of Bacillus Subtilis Spores to Heat and High Pressure. Applied microbiology and biotechnology 90(4):1409-17.
85. Nicholson W.L., Munakata N., Horneck G., Melosh H.J., Setlow P. 2000. Resistance of Bacillus Endospores to Extreme Terrestrial and Extraterrestrial Environments. Microbiology and Molecular Biology Reviews 64(3):548-72.
86. Nikiyan H., Vasilchenko A., Deryabin D. 2010. Humidity-Dependent Bacterial Cells Functional Morphometry Investigations Using Atomic Force Microscope. International Journal of Microbiology 2010.
87. Niven G.W., Miles C.A., Mackey B.M. 1999. The Effects of Hydrostatic Pressure on Ribosome Conformation in Escherichia Coli: And in Vivo Study Using Differential Scanning Calorimetry. Microbiology (Reading, England) 145 ( Pt 2):419-25.

112
88. Oey I., Lille M., Van Loey A., Hendrickx M. 2008a. Effect of High-Pressure Processing on Colour, Texture and Flavour of Fruit- and Vegetable-Based Food Products: A Review. Trends in Food Science & Technology 19(6):320-8.
89. Oey I., Van der Plancken I., Van Loey A., Hendrickx M. 2008b. Does High Pressure Processing Influence Nutritional Aspects of Plant Based Food Systems? Trends in Food Science & Technology 19(6):300-8.
90. Oliveira A.C., Gaspar L.P., Da Poian A.T., Silva J.L. 1994. Arc Repressor Will Not Denature under Pressure in the Absence of Water. Journal of molecular biology 240(3):184-7.
91. Olivier S.A., Bull M.K., Chapman B. 2012. Bacillus Spp. Spores Produced at Lower Temperatures Are More Resistant to High Pressure Thermal Processes but Mineralization Does Not Predict Relative Resistance. Innovative Food Science & Emerging Technologies 16(0):96-101.
92. Omer M.K., Alvseike O., Holck A., Axelsson L., Prieto M., Skjerve E., Heir E. 2010. Application of High Pressure Processing to Reduce Verotoxigenic E. Coli in Two Types of Dry-Fermented Sausage. Meat Science 86(4):1005-9.
93. Pagán R., Mackey B. 2000. Relationship between Membrane Damage and Cell Death in Pressure-Treated Escherichia Coli Cells: Differences between Exponential- and Stationary-Phase Cells and Variation among Strains. Applied and environmental microbiology 66(7):2829-34.
94. Pavuluri S.R., Kaur B.P. 2014. High Pressure Inactivation Kinetics of Escherichia Coli in Black Tiger Shrimp (Penaeus Monodon). International Conference on Biological, Civil and Environmental Engineering (BCEE-2014). Dubai, UAE. p. 167-9.
95. Pehl M., Werner F., Delgado A. 2002. Experimental Investigation on Thermofluiddynamical Processes in Pressurized Substances. In: Rikimaru H., editor. Progress in Biotechnology: Elsevier. p. 429-35.
96. Perrier-Cornet J.M., Hayert M., Gervais P. 1999. Yeast Cell Mortality Related to a High-Pressure Shift: Occurrence of Cell Membrane Permeabilization. Journal of applied microbiology 87(1):1-7.
97. Perrier-Cornet J.M., Marechal P.A., Gervais P. 1995. A New Design Intended to Relate High Pressure Treatment to Yeast Cell Mass Transfer. Journal of biotechnology 41(1):49-58.
98. Peterson B.W., Sharma P.K., van der Mei H.C., Busscher H.J. 2012. Bacterial Cell Surface Damage Due to Centrifugal Compaction. Applied and environmental microbiology 78(1):120-5.
99. Pope D.H., Smith W.P., Swartz R.W., Landau J.V. 1975. Role of Bacterial Ribosomes in Barotolerance. Journal of bacteriology 121(2):664-9.
100. Popov E.P., Nagarajan S., Lu Z.A. 1976. Mechanics of Materials, 2d ed. Englewood Cliffs, N.J.: Prentice-Hall.
101. Rademacher B., Werner F., Pehl M. 2002. Effect of the Pressurizing Ramp on the Inactivation of Listeria Innocua Considering Thermofluiddynamical Processes. Innovative Food Science & Emerging Technologies 3(1):19-24.

113
102. Rasanayagam V., Balasubramaniam V.M., Ting E., Sizer C.E., Bush C., Anderson C. 2003. Compression Heating of Selected Fatty Food Materials During High-Pressure Processing. Journal of Food Science 68(1):254-9.
103. Rastogi N.K., Angersbach A., Knorr D. 2000. Synergistic Effect of High Hydrostatic Pressure Pretreatment and Osmotic Stress on Mass Transfer During Osmotic Dehydration. Journal of Food Engineering 45(1):25-31.
104. Rastogi N.K., Niranjan K. 1998. Enhanced Mass Transfer During Osmotic Dehydration of High Pressure Treated Pineapple. Journal of Food Science 63(3):508-11.
105. Rastogi N.K., Raghavarao K.S., Balasubramaniam V.M., Niranjan K., Knorr D. 2007. Opportunities and Challenges in High Pressure Processing of Foods. Crit Rev Food Sci Nutr 47(1):69-112.
106. Rawson A., Patras A., Tiwari B.K., Noci F., Koutchma T., Brunton N. 2011. Effect of Thermal and Non Thermal Processing Technologies on the Bioactive Content of Exotic Fruits and Their Products: Review of Recent Advances. Food Research International 44(7):1875-87.
107. Reineke K., Mathys A., Knorr D. 2011. The Impact of High Pressure and Temperature on Bacterial Spores: Inactivation Mechanisms of Bacillus Subtilis above 500 Mpa. J Food Sci 76(3):M189-97.
108. Rendueles E., Omer M.K., Alvseike O., Alonso-Calleja C., Capita R., Prieto M. 2011. Microbiological Food Safety Assessment of High Hydrostatic Pressure Processing: A review. LWT - Food Science and Technology 44(5):1251-60.
109. Ritz M., Tholozan J.L., Federighi M., Pilet M.F. 2001. Morphological and Physiological Characterization of Listeria Monocytogenes Subjected to High Hydrostatic Pressure. Applied and environmental microbiology 67(5):2240-7.
110. Ross R. 2010. Wood Handbook: Wood as an Engineering Material. General technical report FPL; GTR-190. Madison, WI: U.S. Dept. of Agriculture, Forest Service, Forest Products Laboratory.
111. Sale A.J.H., Gould G.W., Hamilton W.A. 1970. Inactivation of Bacterial Spores by Hydrostatic Pressure. Journal of General Microbiology 60(3):323-34.
112. Seaman L. 1962. The Nature of Buckling in Thin Spherical Shells. Monograph Series: Watertown Arsenal Laboratories.
113. Sharma A. 2011. Microbial Adaptation to High Pressures-from Denial to a New Paradigm Shift. AGU Fall Meeting Abstracts 1:04.
114. Smelt J.P.P.M., Rijke A.G.F., Hayhurst A. 1994. Possible Mechanism of High Pressure Inactivation of Microorganisms. High Pressure Research 12(4-6):199-203.
115. Smith A.E., Moxham K.E., Middelberg A.P.J. 2000a. Wall Material Properties of Yeast Cells: Part Ii. Analysis. Chemical Engineering Science 55(11):2043-53.
116. Smith A.E., Zhang Z., Thomas C.R., Moxham K.E., Middelberg A.P.J. 2000b. The Mechanical Properties of Saccharomyces Cerevisiae. Proceedings of the National Academy of Sciences of the United States of America 97(18):9871-4.
117. Solecki R., Conant R.J. 2003. Advanced Mechanics of Materials. New York: Oxford University Press.

114
118. Stenson J.D., Hartley P., Wang C., Thomas C.R. 2011. Determining the Mechanical Properties of Yeast Cell Walls. Biotechnology Progress 27(2):505-12.
119. Stenson J.D., Thomas C.R., Hartley P. 2009. Modelling the Mechanical Properties of Yeast Cells. Chemical Engineering Science 64(8):1892-903.
120. Sun D.-W. 2005. Emerging Technologies for Food Processing. Amsterdam ; Boston: Elsevier Academic Press.
121. Syed Q.A., Buffa M., Guamis B., Saldo J. 2013. Lethality and Injuring the Effect of Compression and Decompression Rates of High Hydrostatic Pressure on Escherichia Coli O157:H7 in Different Matrices. High Pressure Research 33(1):64-72.
122. Tasi J. 1966. Effect of Heterogeneity on the Stability of Composite Cylindrical Shells under Axial Compression. AIAA Journal 4(6):1058-62.
123. Teo A.Y.L., Ravishankar S., Sizer C.E. 2001. Effect of Low-Temperature, High-Pressure Treatment on the Survival of Escherichia Coli O157:H7 and Salmonella in Unpasteurized Fruit Juices. Journal of Food Protection 64(8):1122-7.
124. Thakkar S.D. 2012. Effect of Processing on the Antioxidant Activity and Other Quality Parameters of Muscadine Grape Juice. [M.S.]: Rutgers University Available from: 1520048.
125. Thwaites J.J., Mendelson N.H. 1985. Biomechanics of Bacterial Walls: Studies of Bacterial Thread Made from Bacillus Subtilis. Proceedings of the National Academy of Sciences of the United States of America 82(7):2163-7.
126. Thwaites J.J., Surana U.C. 1991. Mechanical Properties of Bacillus Subtilis Cell Walls: Effects of Removing Residual Culture Medium. Journal of bacteriology 173(1):197-203.
127. Trejo Araya X.I., Hendrickx M., Verlinden B.E., Van Buggenhout S., Smale N.J., Stewart C., John Mawson A. 2007. Understanding Texture Changes of High Pressure Processed Fresh Carrots: A Microstructural and Biochemical Approach. Journal of Food Engineering 80(3):873-84.
128. Van den Broeck I., Ludikhuyze L.R., Van Loey A.M., Hendrickx M.E. 2000. Inactivation of Orange Pectinesterase by Combined High-Pressure and -Temperature Treatments: A Kinetic Study. Journal of Agricultural and Food Chemistry 48(5):1960-70.
129. Van Opstal I., Vanmuysen S.C., Wuytack E.Y., Masschalck B., Michiels C.W. 2005. Inactivation of Escherichia Coli by High Hydrostatic Pressure at Different Temperatures in Buffer and Carrot Juice. Int J Food Microbiol 98(2):13-.
130. Whitney B.M. 2005. Efficacy of High Pressure Processing in Combination with Chemical Preservatives for the Reduction of Escherichia Coli O157:H7 and Salmonella in Apple Juice and Orange Juice. [M.S.]. Blacksburg, Virginia: Virginia Polytechnic Institute and State University.
131. Wong P.T.T., Heremans K. 1988. Pressure Effects on Protein Secondary Structure and Hydrogen Deuterium Exchange in Chymotrypsinogen: A Fourier Transform Infrared Spectroscopic Study. Biochimica et Biophysica Acta (BBA) - Protein Structure and Molecular Enzymology 956(1):1-9.

115
132. Wu P.G., Brand L. 1994. Resonance Energy Transfer: Methods and Applications. Analytical Biochemistry 218(1):1-13.
133. Yen G.-C., Lin H.-T. 1996. Comparison of High Pressure Treatment and Thermal Pasteurization Effects on the Quality and Shelf Life of Guava Puree. International Journal of Food Science & Technology 31(2):205-13.
134. Zhang L. 2011. Effect of Package Dimensions and Food Product Properties on Non-Uniformity of Microbial Inactivation During High-Pressure High-Temperature (Hpht) Process a Numerical Study. Rutgers University. Graduate School--New Brunswick.,. p. xvi, 102 p.
135. Zook C.D., Parish M.E., Braddock R.J., Balaban M.O. 1999. High Pressure Inactivation Kinetics of Saccharomyces Cerevisiae Ascospores in Orange and Apple Juices. Journal of Food Science 64(3):533-5.