Effect of energy window width on planer and SPECT image uniformity
Upload
khangminh22Category
view
0download
0
RESEARCH ARTICLE Open Access
Genomic regions underlying uniformity ofyearling weight in Nellore cattle evaluatedunder different response variablesLaiza Helena de Souza Iung1, Herman Arend Mulder2, Haroldo Henrique de Rezende Neves3
and Roberto Carvalheiro1*
Abstract
Background: In livestock, residual variance has been studied because of the interest to improve uniformity ofproduction. Several studies have provided evidence that residual variance is partially under genetic control;however, few investigations have elucidated genes that control it. The aim of this study was to identify genomicregions associated with within-family residual variance of yearling weight (YW; N = 423) in Nellore bulls with highdensity SNP data, using different response variables. For this, solutions from double hierarchical generalized linearmodels (DHGLM) were used to provide the response variables, as follows: a DGHLM assuming non-null geneticcorrelation between mean and residual variance (rmv≠ 0) to obtain deregressed EBV for mean (dEBVm) and residualvariance (dEBVv); and a DHGLM assuming rmv = 0 to obtain two alternative response variables for residual variance,dEBVv_r0 and log-transformed variance of estimated residuals (ln_σ2e).Results: The dEBVm and dEBVv were highly correlated, resulting in common regions associated with mean andresidual variance of YW. However, higher effects on variance than the mean showed that these regions had effectson the variance beyond scale effects. More independent association results between mean and residual variancewere obtained when null rmv was assumed. While 13 and 4 single nucleotide polymorphisms (SNPs) showed astrong association (Bayes Factor > 20) with dEBVv and ln_σ2e, respectively, only suggestive signals were found for
dEBVv_r0. All overlapping 1-Mb windows among top 20 between dEBVm and dEBVv were previously associated withgrowth traits. The potential candidate genes for uniformity are involved in metabolism, stress, inflammatory andimmune responses, mineralization, neuronal activity and bone formation.
Conclusions: It is necessary to use a strategy like assuming null rmv to obtain genomic regions associated withuniformity that are not associated with the mean. Genes involved not only in metabolism, but also stress,inflammatory and immune responses, mineralization, neuronal activity and bone formation were the mostpromising biological candidates for uniformity of YW. Although no clear evidence of using a specific responsevariable was found, we recommend consider different response variables to study uniformity to increase evidenceon candidate regions and biological mechanisms behind it.
Keywords: Beef cattle, DHGLM, Genetic heterogeneity of residual variance, Growth traits, GWAS, Micro-environmental sensitivity
* Correspondence: [email protected] of Agricultural and Veterinarian Sciences, São Paulo State University(Unesp), Via de Acesso Prof. Paulo Donato Castelane, S/N, Vila Industrial,FCAV/UNESP, Jaboticabal, São Paulo 14884-900, BrazilFull list of author information is available at the end of the article
© The Author(s). 2018 Open Access This article is distributed under the terms of the Creative Commons Attribution 4.0International License (http://creativecommons.org/licenses/by/4.0/), which permits unrestricted use, distribution, andreproduction in any medium, provided you give appropriate credit to the original author(s) and the source, provide a link tothe Creative Commons license, and indicate if changes were made. The Creative Commons Public Domain Dedication waiver(http://creativecommons.org/publicdomain/zero/1.0/) applies to the data made available in this article, unless otherwise stated.
Iung et al. BMC Genomics (2018) 19:619 https://doi.org/10.1186/s12864-018-5003-4
BackgroundUniformity is becoming increasingly important amonglivestock species. In meat production systems, this ismore evident by the increasing adoption of economic in-centives by slaughterhouses to stimulate farmers to de-liver animals that meet specific carcass standards. Ifuniformity is partly under genetic control, genetic selec-tion could be used to improve uniformity of animals.Genetic control of uniformity can be the result of howgenotypes respond differently towards unknownmicro-environmental factors [1, 2]. Such a phenomenonis called genetic heterogeneity of residual variance orgenetic variance in micro-environmental sensitivity. Upto now, several studies support the existence of a geneticcomponent on residual variance and draw attention forits potential to improve uniformity through selection(e.g. [3–6]). Unraveling the genetic basis of heterogeneityof residual variance through genome-wide associationstudies (GWAS) will help to understand the biology be-hind it and increase selection response by identifyingcandidate genes affecting uniformity and including themin genomic prediction.Few GWAS for uniformity traits have been performed
in livestock and there is no consensus about the mostappropriate phenotype to be used in such studies.Phenotypic standard deviation and coefficient of vari-ation was used to address uniformity of egg weight inchickens by Wolc et al. [7] and birth weight in pigs byWang et al. [8, 9]. Residual variance per individual fromdouble hierarchical generalized linear model (DHGLM;obtained according to Rönnegård et al. [10]) were usedas response variable by Mulder et al. [11] to identify gen-omic regions related to residual variance of somatic cellscore in dairy cattle. Estimated breeding values (EBV)from a DHGLM, using an extension developed by Fellekiet al. [12], were deregressed (dEBV) and used to identifygenomic regions associated with variability of litter sizein pigs by Sell-Kubiak et al. [13]. Such variety of pheno-types used as response variables can be explained be-cause uniformity can be measured in different waysdepending on trait and data structure. Statistical analysisrequires either the within-individual variance based onrepeated observation per animal or the within-familyvariance based on large offspring groups per family. Fur-thermore, the availability of genotypes influences thechoice for the response variable as well. The choice fordEBV in the study by Sell-Kubiak et al. [13] was madebecause of availability of genotypes on boars with manyphenotyped offspring and sows with genotypes and phe-notypes for litter size. In the case of Mulder et al. [11],genotypes were only available on cows with manyphenotypic observations on experimental farms.In beef cattle, growth traits are often used as selection
criteria in breeding programs due to its economic
impact in meat production. Several genes and genomicregions influencing the mean of these traits have beenidentified (e.g. [14–16]). In addition, the existence of agenetic component on residual variance of growth traitswas previously observed [17–19]. However, no furtherinvestigations have been carried out to study the geneticmechanisms underlying uniformity of growth traits.Thus, the aim of this study was to identify genomic re-gions associated with within-family residual variance ofyearling weight (YW) in Nellore cattle through GWAS,using different response variables, and candidate genesto better understand the biology behind genetic controlof uniformity.
ResultsOur aim was to identify genomic regions (1-Mb win-dows among the top 20 that explained the largest pro-portion of genetic variance shared between responsevariables and 1-Mb windows with SNPs that showed astrong association by BF) associated with within-familyresidual variance of YW in Nellore cattle, using differentresponse variables in GWAS. For this, we used solutionsfrom DHGLM assuming: i) non-null genetic correlationbetween mean and residual variance of YW (rmv ≠ 0) toobtain deregressed EBV for mean (dEBVm) and residualvariance (dEBVv); and ii) rmv = 0 to obtain dEBVv_r0 andlog-transformed variance of estimated residuals (ln_σ2e).
The Pearson’s correlations between the different re-sponse variables and the number of common 1-Mb win-dows (among the top 20 that explained the largestproportion of genetic variance in the association studies)among them are shown in Table 1. As expected, dEBVm
was highly correlated with dEBVv, 0.90, given the highand positive rmv (0.76; [19]). As a result, eight out of thetop 20 windows were shared between dEBVm anddEBVv: chromosome (Chr) 1 (92 Mb; Chr1_92), 3(Chr3_42 and Chr3_45), 13 (Chr13_59), 14 (Chr14_24 to26) and 16 (Chr16_21) (Table 2). The dEBVm was also
Table 1 Number of common 1-Mb windowsa (above diagonal)and Pearson’s correlation (below diagonal) between responsevariables
dEBVm dEBVv dEBVv_r0 ln_σ2edEBVm 8 0 0
dEBVv 0.90 (0.02) 1 1
dEBVv_r0 0.19 (0.05) 0.53 (0.04) 2
ln_σ2e −0.01 (0.05) 0.08 (0.05) 0.24 (0.05)a Considering only the top 20 windows that explained the largest proportionof genetic variance for each response variable; dEBVm and dEBVv: deregressedEBV for mean and residual variance of yearling weight, respectively; dEBVv_r0and ln_σ2e: deregressed EBV for residual variance and log-transformed variance
of estimated residuals, respectively, both assuming null genetic correlationbetween mean and residual variance. Standard errors are presentedbetween brackets
Iung et al. BMC Genomics (2018) 19:619 Page 2 of 13

positively correlated with dEBVv_r0, 0.19, but no overlapwas found among the top 20 windows.The response variables for residual variance of YW
had low to moderate correlations with each other (Table1). The largest correlation was observed between dEBVv
and dEBVv_r0 (0.53), which shared one window amongthe top 20, Chr12_5. On the other hand, the smallestcorrelation was between dEBVv and ln_σ2e (0.08), which
also shared only one window among the top 20,Chr22_52. The dEBVv_r0 and ln_σ2e showed a correlation
of 0.24 and had two common regions among the top 20:Chr6_105 and Chr9_8.Based on the GWAS results, 40, 13 and 4 single nu-
cleotide polymorphisms (SNPs) showed a strong associ-ation (BF > 20) with dEBVm, dEBVv and ln_ σ2e ,
respectively (Fig. 1 and Additional file 1). Box plots ofdEBVv and ln_ σ2e by genotype of the markers with
higher BF were presented to give an overview about thesignals that these SNPs are capturing (Fig. 2). In bothcases, the first homozygous genotype (0) was more uni-form, with lower mean and lower dispersion of the cor-responding response variable, compared to the othergenotypes, although AA was less frequent in relation toAB and BB. Only a few suggestive association signals (2;BF > 3) were found for dEBVv_r0. All these SNPs are lo-cated within the top 20 1-Mb windows that explainedthe largest proportion of genetic variance in each re-sponse variable. The top 20 windows explained together34.6, 32.6, 4.4 and 20.0% of the genetic variance ofdEBVm, dEBVv, dEBVv_r0 and ln_σ2e (data not shown).
The remaining part of genetic variance was explained bythe remaining windows, those not included in the top20. The range of the proportion of variance explained byindividual windows and their sum suggest that uniform-ity of YW behaves as a polygenic trait determined byseveral genes, as well as its mean.Within the common windows shared by dEBVm and
dEBVv, genes and QTL regions were mapped (Table 2).
Several candidate genes for growth traits in beef cattlewere identified on chromosome 14 (RB1CC1, NPBWR1,PLAG1 and PENK). Such findings highlight that most ofthe effects captured by dEBVv can be due to the strongrmv and could be potentially scale effects [19].In order to prove that these common regions can
really affect the variance beyond a simple scale effect, weapplied a similar procedure as described in Wolc et al.[7]. For this, only the common SNP with the highest BFin each window was considered. The absolute effect ofthese SNPs on dEBVm and dEBVv were divided by themean of YW and mean of σ2e , respectively. If SNP wouldhave an effect on mean and variance due to scaling, thenthe standardized effects should be the same or higher onmean. However, all SNPs showed a greater standardizedeffect on dEBVv than dEBVm indicating that these re-gions affect the residual variance beyond a simple scaleeffect. These results suggest that even with a high andstrong rmv it is possible to find regions determiningmean growth and its variability simultaneously, whilethe effects on the variance are larger than can be ex-plained by a simple scale effect.In the shared windows by dEBVv_r0 and ln_ σ2e ,
Chr6_105 and Chr9_8, genes involved in metabolism(NUDT9, SPARCL1 and MAN2B2), mineralization(DMP1 and DSPP) and neuronal activity (PPP2R2C,JAKMIP1 and ADGRB3) were considered potential can-didates for uniformity (Table 3). No gene was identifiedwithin Chr12_5, shared by dEBVv and dEBVv_r0. How-ever, several promising genes were found on Chr22_52shared by dEBVv and ln_σ2e ; among them, genes related
to metabolism (e.g. DPYD, AK7, GMPPB, AMT andGLUD1), stress (IP6K2 and UCN2) and inflammatoryand immune responses (UBA7, RNF123, MST1 andRHOA) (Table 3).For uniformity, promising genes related to metabol-
ism: ATP6V1B2 (Chr8), LPL (Chr8), OSBPL8 (Chr5) andGLI2 (Chr2); immune response: GLIPR1 (Chr5), neur-onal plasticity: LZTS1 (Chr8) and stress response:
Table 2 Common 1-Mb windows shared by deregressed EBV for mean (dEBVm) and residual variance (dEBVv)Windowsa % Varb Candidate gene and/or QTL regionc Referenced
dEBVm dEBVv
Chr1_92 2.57 0.51 Chr1_70.2:94.6, Chr1_87.2:98.9 [20, 21]
Chr3_42 2.89 1.54 Chr3_41 [15]
Chr3_45 1.00 1.65 Chr3_41 [15]
Chr13_59 1.07 0.60 Chr13_58, GNAS [15, 101]
Chr14_24:26 3.76 3.07 RB1CC1, NPBWR1, PLAG1, PENK [14–16, 23–27]
Chr16_21 1.26 5.13 Chr16_8.4:34, Chr16_10.6:22.5, Chr16_19.4:40 [21, 22]
In bold are the windows harboring strong associations (Bayes Factor > 20) for both response variablesa Represented by chromosome (Chr) and physical position (in Mb) (Chr_Mb and Chr_Mb:Mb)b Proportion of genetic variance explained by each 1-Mb windowc Ensembl Database UMD3.1 and QTLdb database (represented by Chr_Mb and Chr_Mb:Mb)d Previous studies reporting QTL regions and/or candidate genes related with growth traits that are next or within the windows found in this study
Iung et al. BMC Genomics (2018) 19:619 Page 3 of 13
SLC18A1 (Chr8), HIF1A (Chr10), BBS10 (Chr5) andCLASP1 (Chr2) were observed in the windows of theSNPs that showed strong association with ln_ σ2e(Table 4). For dEBVv, most of the genes in the regionsharboring SNPs that showed strong association were re-lated to metabolism: DPYD (Chr3), BTG1 (Chr5), AK7(Chr21), ADIRF (Chr28), GLUD1 (Chr28), IP6K1,GMPPB, APEH, AMT, USP4, USP19, IMPDH2, NDU-FAF3, SLC25A20, PRKAR2A, UQCRC1, PFKFB4 andSHISA5 all located on Chr22 (Table 5). In addition,
genes involved in stress response: BDKRB2 and BDKRB1(Chr21), and IP6K2 and UCN2 (Chr22); inflammatoryand immune responses: EEA1 (Chr5), TCL1A andTCL1B (Chr21), UBA7, RNF123, MST1 and RHOA allon Chr11; neuronal plasticity: PLPPR4 and PLPPR5(Chr3); and bone formation: BMPR1A (Chr28) were alsofound (Table 5). In summary, most of the regions associ-ated with residual variance of YW harbor interestingcandidate genes related to metabolism, stress, inflamma-tory and immune responses, mineralization, neuronalactivity and bone formation.
Fig. 1 Manhattan plot for the mean (dEBVm) and residual variance (dEBVv, dEBVv_r0, ln_σ2e) of yearling weight. dEBVm and dEBVv: deregressed EBV
for mean and residual variance, respectively; dEBVv_r0 and ln_σ2e: deregressed EBV for residual variance and log-transformed variance of estimated
residuals, respectively, both obtained from solutions of a DHGLM assuming null genetic correlation between mean and residual variance. Thehorizontal blue and red lines represent Bayes Factor of 3 (suggestive) and 20 (strong), respectively
Iung et al. BMC Genomics (2018) 19:619 Page 4 of 13
DiscussionIn this study, we identified genomic regions associated withwithin-family residual variance of YW in Nellore cattle byusing different response variables (dEBVv, dEBVv_r0 and ln_σ2e ). Thirteen and four strong associations (BF > 20) were
observed using dEBVv and ln_σ2e, respectively. Overlapping
windows among the top 20 that explained most of the gen-etic variance were observed between dEBVv and the otherresponse variables including dEBVm. The dEBVv shared 8out of the top 20 windows with dEBVm, one with dEBVv_r0
and another one with ln_σ2e . Potential candidate genes re-
lated to metabolism (carbohydrate, energy, lipid, nucleotideand amino acid), stress, inflammatory and immune re-sponses, mineralization, neuronal activity and bone forma-tion were found for ln_σ2e and dEBVv.
Common regions between dEBVm and dEBVv
All common regions shared by dEBVm and dEBVv con-tained previously found QTL, associated with birth,yearling and carcass weight in other breeds [15, 20–22].The region found on chromosome 14 (24 to 26 Mb) wasassociated with growth, feed efficiency and carcass quality
traits in beef cattle and several candidate genes were re-ported [14–16, 23–27]. According to these studies, pleio-morphic adenoma gene 1 (PLAG1) seems to be themajor gene due to its role in regulating insulin-likegrowth factors (IGF; [28]). However, some of thesegenes, like RB1-inducible coiled-coil 1 (RB1CC1),neuropeptides B/W receptor 1 (NPBWR1) and proen-kephalin (PENK), are also involved in processes thatcan contribute to determine uniformity of growthtraits, like YW. RB1CC1 is involved in cell growthand differentiation, senescence, apoptosis and autoph-agy, and was one of the genes differentially expressedin heat stressed chickens [29, 30]. NPBWR1 modu-lates feeding behavior and energy homeostasis andPENK is responsible for producing enkephalins in re-sponse to stress [31, 32]. Based on these findings andthe fact that these shared regions between dEBVm
and dEBVv showed effects beyond scale effects, wecan conclude that the same gene can affect both,mean and its variability.
Promising genes associated with ln_σ2e, dEBVv and dEBVv_r0
Genes involved in metabolism (ATP6V1B2, LPL, OSBPL8and GLI2), immune response (GLIPR1), neuronal plasticity
Fig. 2 Box plots for the dEBVv and ln_σ2e according to rs133244984 and rs134778206 genotypes, respectively
Table 3 Overlapped 1-Mb windows between response variables for uniformity (dEBVv, dEBVv_r0 and ln_σ2e)
Windowsa Shared by % Variance Explainedb (BFc) Candidate Genesd
dEBVv dEBVv_r0 ln_σ2e dEBVv dEBVv_r0 ln_σ2eChr12_5 X X 1.69 (23.48) 0.19 (1.99) –
Chr22_52 X X 1.73 (33.97) 0.72 (18.37) UBA7, IP6K1, GMPPB, RNF123, MST1, APEH, AMT, RHOA, USP4, USP19, IMPDH2,NDUFAF3, SLC25A20, PRKAR2A, IP6K2, UQCRC1, UCN2, PFKFB4, SHISA5
Chr6_105 X X 0.29 (2.94) 0.91 (12.74) NUDT9, SPARCL1, DSPP, DMP1, MAN2B2, PPP2R2C, JAKMIP1
Chr9_8 X X 0.28 (3.05) 0.67 (13.08) ADGRB3
dEBVv: deregressed EBV for residual variance of yearling weight; dEBVv_r0 and ln_σ2e: deregressed EBV for residual variance and log-transformed variance of
estimated residuals, respectively, both assuming null genetic correlation between mean and residual variancea Represented by chromosome (Chr) and physical position (in Mb) (i.e. Chr_Mb)b Proportion of genetic variance in each 1-Mb windowc Single nucleotide polymorphism (SNP) with the highest Bayes Factor (BF) within each 1-Mb windowd Ensembl Database UMD3.1. See the complete gene list in each window in Additional file 1
Iung et al. BMC Genomics (2018) 19:619 Page 5 of 13
(LZTS1) and stress response (SLC18A1, HIF1A and BBS10and CLASP1) were considered the most promising bio-logical candidates for uniformity using ln_σ2e . For dEBVv,
genes related to metabolism (DPYD, BTG1, AK7, ADIRF,GLUD1, IP6K1, GMPPB, APEH, AMT, USP4, USP19,IMPDH2, NDUFAF3, SLC25A20, PRKAR2A, UQCRC1,PFKFB4 and SHISA5), stress response (BDKRB2,BDKRB1, IP6K2 and UCN2), inflammatory and immuneresponses (TCL1A, TCL1B, UBA7, RNF123, MST1 andRHOA), neuronal plasticity (PLPPR4 and PLPPR5) andbone formation (BMPR1A) were identified as potentialcandidates. Such findings support partially the hypothesisthat most likely the mean of a trait and its uniformityshare processes, like those related to metabolism. How-ever, uniformity may be a trait which is even more com-plex and may be controlled by several processes andmechanisms beyond metabolism, in order to reachhomeostasis and maintain the body in balance.
Among the metabolism-related genes for ln_ σ2e ,
ATPase, H+ transporting, V1 subunit B2 (ATP6V1B2)encodes a component of the vacuolar ATPase(V-ATPase), which is activated according to the energylevel, like during glucose starvation [33]. Previously, theATP6V1B2 gene was found to be associated with feed ef-ficiency traits in beef cattle [34]. Lipoprotein lipase(LPL) and oxysterol binding protein-like 8 (OSBPL8)genes are involved in lipid metabolism. LPL is respon-sible for hydrolysis of circulating triglycerides and verylow-density lipoprotein [35]. Associations between LPLand growth and carcass quality traits were also reportedpreviously [36–39]. OSBPL8 modulates lipid homeostasisthrough sterol regulatory element binding proteins(SREBPs; [40]). In addition, glioma-associated oncogenefamily zinc finger 2 (GLI2) gene is a transcription factorof the Hedgehog (Hh) signaling pathway, which is in-volved in muscle development mainly during embryonic
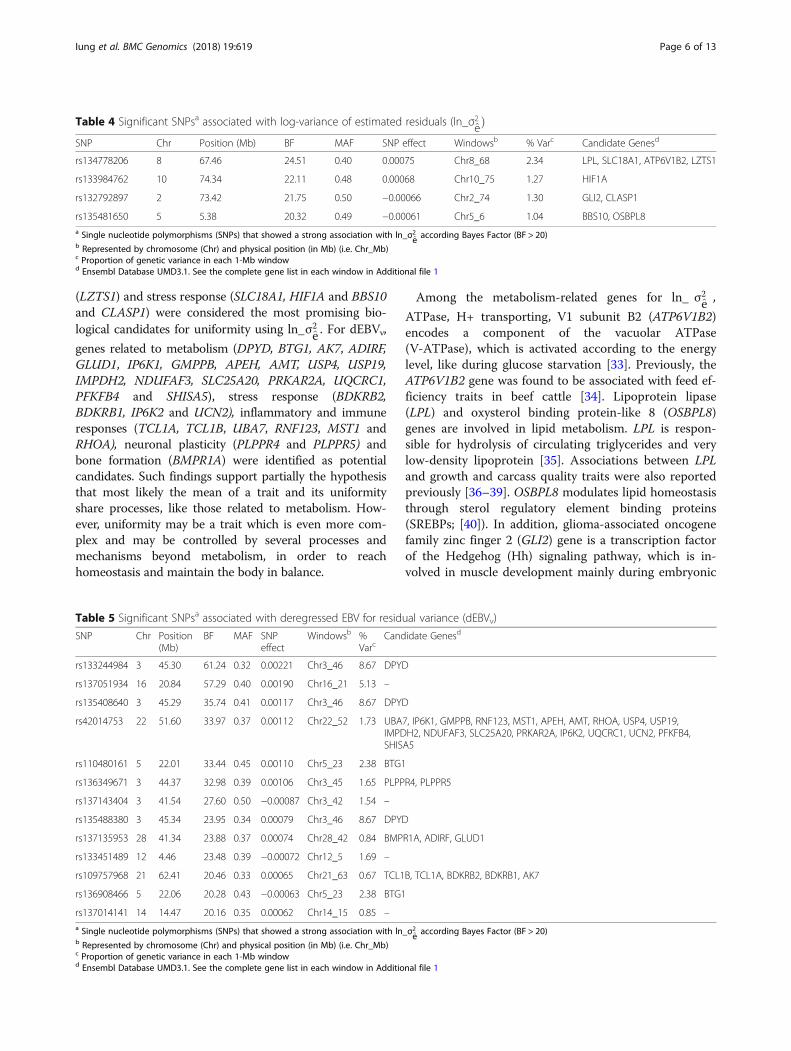
Table 4 Significant SNPsa associated with log-variance of estimated residuals (ln_σ2eÞSNP Chr Position (Mb) BF MAF SNP effect Windowsb % Varc Candidate Genesd
rs134778206 8 67.46 24.51 0.40 0.00075 Chr8_68 2.34 LPL, SLC18A1, ATP6V1B2, LZTS1
rs133984762 10 74.34 22.11 0.48 0.00068 Chr10_75 1.27 HIF1A
rs132792897 2 73.42 21.75 0.50 −0.00066 Chr2_74 1.30 GLI2, CLASP1
rs135481650 5 5.38 20.32 0.49 −0.00061 Chr5_6 1.04 BBS10, OSBPL8a Single nucleotide polymorphisms (SNPs) that showed a strong association with ln_σ2e according Bayes Factor (BF > 20)b Represented by chromosome (Chr) and physical position (in Mb) (i.e. Chr_Mb)c Proportion of genetic variance in each 1-Mb windowd Ensembl Database UMD3.1. See the complete gene list in each window in Additional file 1
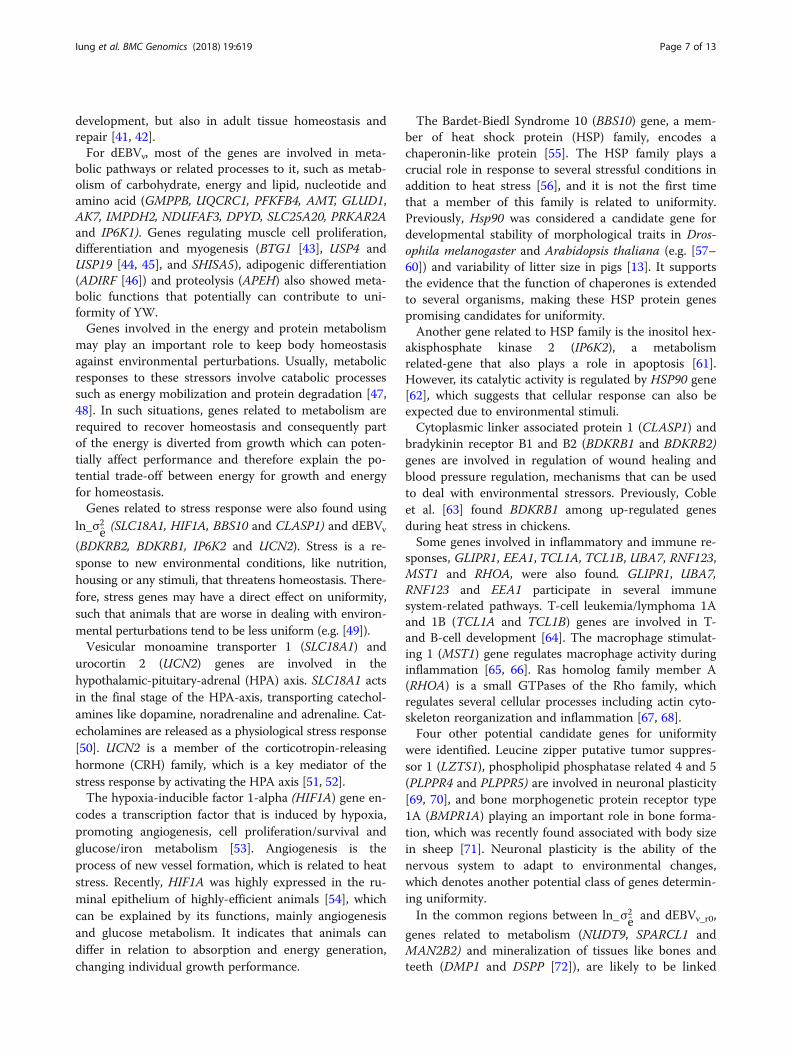
Table 5 Significant SNPsa associated with deregressed EBV for residual variance (dEBVv)
SNP Chr Position(Mb)
BF MAF SNPeffect
Windowsb %Varc
Candidate Genesd
rs133244984 3 45.30 61.24 0.32 0.00221 Chr3_46 8.67 DPYD
rs137051934 16 20.84 57.29 0.40 0.00190 Chr16_21 5.13 –
rs135408640 3 45.29 35.74 0.41 0.00117 Chr3_46 8.67 DPYD
rs42014753 22 51.60 33.97 0.37 0.00112 Chr22_52 1.73 UBA7, IP6K1, GMPPB, RNF123, MST1, APEH, AMT, RHOA, USP4, USP19,IMPDH2, NDUFAF3, SLC25A20, PRKAR2A, IP6K2, UQCRC1, UCN2, PFKFB4,SHISA5
rs110480161 5 22.01 33.44 0.45 0.00110 Chr5_23 2.38 BTG1
rs136349671 3 44.37 32.98 0.39 0.00106 Chr3_45 1.65 PLPPR4, PLPPR5
rs137143404 3 41.54 27.60 0.50 −0.00087 Chr3_42 1.54 –
rs135488380 3 45.34 23.95 0.34 0.00079 Chr3_46 8.67 DPYD
rs137135953 28 41.34 23.88 0.37 0.00074 Chr28_42 0.84 BMPR1A, ADIRF, GLUD1
rs133451489 12 4.46 23.48 0.39 −0.00072 Chr12_5 1.69 –
rs109757968 21 62.41 20.46 0.33 0.00065 Chr21_63 0.67 TCL1B, TCL1A, BDKRB2, BDKRB1, AK7
rs136908466 5 22.06 20.28 0.43 −0.00063 Chr5_23 2.38 BTG1
rs137014141 14 14.47 20.16 0.35 0.00062 Chr14_15 0.85 –a Single nucleotide polymorphisms (SNPs) that showed a strong association with ln_σ2e according Bayes Factor (BF > 20)b Represented by chromosome (Chr) and physical position (in Mb) (i.e. Chr_Mb)c Proportion of genetic variance in each 1-Mb windowd Ensembl Database UMD3.1. See the complete gene list in each window in Additional file 1
Iung et al. BMC Genomics (2018) 19:619 Page 6 of 13
development, but also in adult tissue homeostasis andrepair [41, 42].For dEBVv, most of the genes are involved in meta-
bolic pathways or related processes to it, such as metab-olism of carbohydrate, energy and lipid, nucleotide andamino acid (GMPPB, UQCRC1, PFKFB4, AMT, GLUD1,AK7, IMPDH2, NDUFAF3, DPYD, SLC25A20, PRKAR2Aand IP6K1). Genes regulating muscle cell proliferation,differentiation and myogenesis (BTG1 [43], USP4 andUSP19 [44, 45], and SHISA5), adipogenic differentiation(ADIRF [46]) and proteolysis (APEH) also showed meta-bolic functions that potentially can contribute to uni-formity of YW.Genes involved in the energy and protein metabolism
may play an important role to keep body homeostasisagainst environmental perturbations. Usually, metabolicresponses to these stressors involve catabolic processessuch as energy mobilization and protein degradation [47,48]. In such situations, genes related to metabolism arerequired to recover homeostasis and consequently partof the energy is diverted from growth which can poten-tially affect performance and therefore explain the po-tential trade-off between energy for growth and energyfor homeostasis.Genes related to stress response were also found using
ln_σ2e (SLC18A1, HIF1A, BBS10 and CLASP1) and dEBVv
(BDKRB2, BDKRB1, IP6K2 and UCN2). Stress is a re-sponse to new environmental conditions, like nutrition,housing or any stimuli, that threatens homeostasis. There-fore, stress genes may have a direct effect on uniformity,such that animals that are worse in dealing with environ-mental perturbations tend to be less uniform (e.g. [49]).Vesicular monoamine transporter 1 (SLC18A1) and
urocortin 2 (UCN2) genes are involved in thehypothalamic-pituitary-adrenal (HPA) axis. SLC18A1 actsin the final stage of the HPA-axis, transporting catechol-amines like dopamine, noradrenaline and adrenaline. Cat-echolamines are released as a physiological stress response[50]. UCN2 is a member of the corticotropin-releasinghormone (CRH) family, which is a key mediator of thestress response by activating the HPA axis [51, 52].The hypoxia-inducible factor 1-alpha (HIF1A) gene en-
codes a transcription factor that is induced by hypoxia,promoting angiogenesis, cell proliferation/survival andglucose/iron metabolism [53]. Angiogenesis is theprocess of new vessel formation, which is related to heatstress. Recently, HIF1A was highly expressed in the ru-minal epithelium of highly-efficient animals [54], whichcan be explained by its functions, mainly angiogenesisand glucose metabolism. It indicates that animals candiffer in relation to absorption and energy generation,changing individual growth performance.
The Bardet-Biedl Syndrome 10 (BBS10) gene, a mem-ber of heat shock protein (HSP) family, encodes achaperonin-like protein [55]. The HSP family plays acrucial role in response to several stressful conditions inaddition to heat stress [56], and it is not the first timethat a member of this family is related to uniformity.Previously, Hsp90 was considered a candidate gene fordevelopmental stability of morphological traits in Dros-ophila melanogaster and Arabidopsis thaliana (e.g. [57–60]) and variability of litter size in pigs [13]. It supportsthe evidence that the function of chaperones is extendedto several organisms, making these HSP protein genespromising candidates for uniformity.Another gene related to HSP family is the inositol hex-
akisphosphate kinase 2 (IP6K2), a metabolismrelated-gene that also plays a role in apoptosis [61].However, its catalytic activity is regulated by HSP90 gene[62], which suggests that cellular response can also beexpected due to environmental stimuli.Cytoplasmic linker associated protein 1 (CLASP1) and
bradykinin receptor B1 and B2 (BDKRB1 and BDKRB2)genes are involved in regulation of wound healing andblood pressure regulation, mechanisms that can be usedto deal with environmental stressors. Previously, Cobleet al. [63] found BDKRB1 among up-regulated genesduring heat stress in chickens.Some genes involved in inflammatory and immune re-
sponses, GLIPR1, EEA1, TCL1A, TCL1B, UBA7, RNF123,MST1 and RHOA, were also found. GLIPR1, UBA7,RNF123 and EEA1 participate in several immunesystem-related pathways. T-cell leukemia/lymphoma 1Aand 1B (TCL1A and TCL1B) genes are involved in T-and B-cell development [64]. The macrophage stimulat-ing 1 (MST1) gene regulates macrophage activity duringinflammation [65, 66]. Ras homolog family member A(RHOA) is a small GTPases of the Rho family, whichregulates several cellular processes including actin cyto-skeleton reorganization and inflammation [67, 68].Four other potential candidate genes for uniformity
were identified. Leucine zipper putative tumor suppres-sor 1 (LZTS1), phospholipid phosphatase related 4 and 5(PLPPR4 and PLPPR5) are involved in neuronal plasticity[69, 70], and bone morphogenetic protein receptor type1A (BMPR1A) playing an important role in bone forma-tion, which was recently found associated with body sizein sheep [71]. Neuronal plasticity is the ability of thenervous system to adapt to environmental changes,which denotes another potential class of genes determin-ing uniformity.In the common regions between ln_σ2e and dEBVv_r0,
genes related to metabolism (NUDT9, SPARCL1 andMAN2B2) and mineralization of tissues like bones andteeth (DMP1 and DSPP [72]), are likely to be linked
Iung et al. BMC Genomics (2018) 19:619 Page 7 of 13
to uniformity on Chr6_105. It is not unusual to findcommon genes related to stature, height and bodyweight in beef cattle (e.g. [14, 73–75]). Such findingshighlight the strong relationship between height andweight, partially explained by common regulatorymechanisms.Additionally, both common regions (Chr6_105 and
9_8) contain genes with neuronal functions: PPP2R2C,JAKMIP1 and ADGRB3. Protein phosphatase 2, regula-tory subunit B, gamma (PPP2R2C) and adhesion Gprotein-coupled receptor B3 (ADGRB3) were previouslyrelated to learning and memory (synaptic plasticity) andsynaptogenesis in mice [76, 77]. Janus kinase andmicrotubule-interacting protein 1 (JAKMIP1) was associ-ated with social behavior in mice through its function onneuronal translation and was related to T cell-mediatedcytotoxicity [78, 79]. These results together with dEBVv
and ln_σ2e provide evidence that the nervous system is
also modulated according to environmental perturba-tions. Previously, studies reporting such neuronal plasti-city in response to changes in nutrition and temperaturewere observed in Drosophila [80–82]. Therefore, to-gether with other tissues, the nervous system seems tobe a potential modulator of the mechanisms underlyinguniformity.
Response variablesThe high correlation between dEBVm and dEBVv re-sulted in 8 common regions affecting simultaneouslymean and residual variance. Such findings are in linewith Wolc et al. [7] who found correlations ranging from0.54 to 0.74 and a region explaining a large proportionof the genetic variance of the mean and standard devi-ation (SD) of egg weight at different ages. The authorsnoted that it was not a simple scale effect, because theeffect of the QTL on mean egg weight (measured be-tween 26 and 28 weeks of age) was about 4% of themean egg weight and on SD egg weight at the same agewas about 5% of the mean SD. More recently,Sell-Kubiak et al. [13] also reported a high genetic cor-relation, 0.49, between litter size and its variation, butno overlapped regions were found.The dEBVv not only captured common effects with
the mean of YW but also its residual variance by sharingregions (among top 20 by variance explained) withdEBVv_r0 and ln_ σ2e , Chr12_5 and Chr22_52, respect-
ively. These results suggest that the mean and uniform-ity of YW are partially under different genetic control.Though some of the genes found on chromosome 22and most of those in common between dEBVm anddEBVv are involved in metabolism (e.g. PLAG1, DPYD,AK7, GMPPB, AMT and GLUD1), a process most prob-ably related to both, mean and uniformity.
The weak correlations among dEBVm and the responsevariables that assumed null rmv emphasize the role ofthe latter to find genomic regions that are specificallyaffecting residual variance and not the mean of YW.Generally, data transformation is used as the main toolto reduce mean-variance relationship in studies on uni-formity (e.g. [83–85]). This is the first study on uniform-ity reporting null rmv as a strategy to deal with scaleeffects and showing the differences in terms of associ-ated regions when comparing to GWAS using dEBVv
when non-null rmv was assumed.Knowing the importance of considering potential scale
effects and confounding between mean and residualvariance, the next step is to discuss the suitability of thedifferent response variables to be used in a GWAS foruniformity. Based on our results, we recommend consid-ering the following aspects regarding the response vari-able and data structure. Firstly, we need to take intoaccount the nature of the trait because small geneticvariance and low heritabilities are often found for uni-formity. Previously we estimated a heritability for re-sidual variance of YW even smaller (0.007; [19]) thanhas been reported for similar traits in other livestockpopulations [86]. Probably this also may have contrib-uted to the small (or none) number of SNPs thatreached the significance threshold (BF > 20) when weanalyzed the response variables for residual variance. Inthis context, irrespective of the response variable, alarger sample size is required to increase the power ofGWAS [87].Secondly, we used two different procedures to obtain
response variables to perform GWAS for uniformity.The first one was the deregressed EBV; deregression,which removes both the contribution of parents and theshrinkage present in the EBV. On the other hand, thesecond one resulted in a measure, ln_σ2e , with less ad-
justments compared to deregression. However, somenon-genetic effects, such as the contemporary group(CG) effect on the variance may have affected thewithin-family variance estimate ln_ σ2e , while they are
accounted for when we used dEBV since non-genetic ef-fects, were fitted in the DHGLM in the residual variancepart of the model. In addition, the assumptions of nulland non-null rmv were assumed to measure the influenceof the mean and/or potential scale effects on the residualvariance. Therefore, analyzing each response variable, wecan conclude that: i) dEBVv was greatly affected by themean; ii) dEBVv_r0 had low accuracy by assuming nullrmv, which requires a large amount of phenotypic infor-mation and/or genotyped sires; and iii) ln_σ2e was less
related to the mean and less regressed compared todEBV, but it may include some non-genetic effects, likeCG. It is clear that all three approaches have advantages
Iung et al. BMC Genomics (2018) 19:619 Page 8 of 13
and disadvantages. Given the fact that ln_ σ2e is likely
more independent to the mean than dEBVv, there maybe in this case a small preference for this response vari-able as it behaved also better in the Markov chain MonteCarlo (MCMC). Furthermore, considering different re-sponse variables can be beneficial, windows that appearin multiple approaches may have a higher credibility andmay help in understanding the role of genes affectingthe mean, the residual variance or both and whethergenes controlling the variance beyond scale effects.
ConclusionsUsing solutions from a DHGLM that assumed null gen-etic correlation between mean and residual variance wasa suitable strategy to identify genomic regions affectinguniformity less dependent on the mean. Thirteen andfour SNPs were associated with dEBVv_r0 and ln_ σ2e ,
respectively, and additional common regions wereobserved among the responses variables. In all these re-gions, promising biological candidate genes for uniform-ity of YW were related not only with metabolic genes,but also stress, inflammatory and immune responses,mineralization, neuronal activity and bone formation.No strong evidence was found in favor of using a spe-cific response variable for GWAS, while using differentresponse variables was beneficial from the biologicalpoint of view, since more evidence on candidate regionscan be found.
MethodsThe phenotypic data used in this study are described inIung et al. [19]. Here, genotypic information from 423influential Nellore sires from the Alliance Nellore data-base with a large number of evaluated progeny wereavailable. The number of progeny per sire consideredfor the study ranged from 50 to 10,180, with an averageof 411 (see distribution of progeny per sire inAdditional file 2). In total, 194,628 yearling weightmeasurements from the progeny were used to estimatethe response variables used in the GWAS.
Response variables in the association studiesAll responses variables used solutions or residuals fromDHGLM fitted in our previous study [19]. The DHGLMis an iterative approach that estimates simultaneouslygenetic parameters for the mean and residual variance.In our previous study a sire DHGLM was used as
follows:yψ
� �¼ X 0
0 Xv
� �bbv
� �þ Z 0
0 Zv
� �ssv
� �þ e
ev
� �,
where y and ψ are vectors of response variables for themean and residual variance models (denoted with thesubscript v), respectively, b and bv are vectors of fixedeffects and covariates (contemporary group, linear and
quadratic effects of animal age, nested within sex), s andsv are vectors of random sire genetic effects, e and evare vectors of random residual effects, X, Xv, Z and Zv
are corresponding incidence matrices. This approachwas chosen because of its better predictability comparedto a two-step approach, as previously stated by Iung etal. [19]. Mean of YW was evaluated through dEBVm
obtained following the deregression procedure proposedby Garrick et al. [88] and using EBV of the mean fromDHGLM [12]. For the residual variance of YW, differentresponse variables were analyzed: i) dEBVv: deregressedEBV of the residual variance from a DHGLM assumingnon-null genetic correlation between mean and residualvariance (rmv ≠ 0); ii) dEBVv_r0: deregressed EBV of theresidual variance from a DHGLM assuming rmv = 0; andiii) ln_σ2e , log-transformed variance of estimated resid-
uals for each sire family, using residuals from the meanmodel of a DHGLM also assuming rmv = 0. Thelog-transformation was used to reduce mean-variancerelationship and correct for non-normality of the re-sidual variances. Fitting the DHGLM assuming null rmv
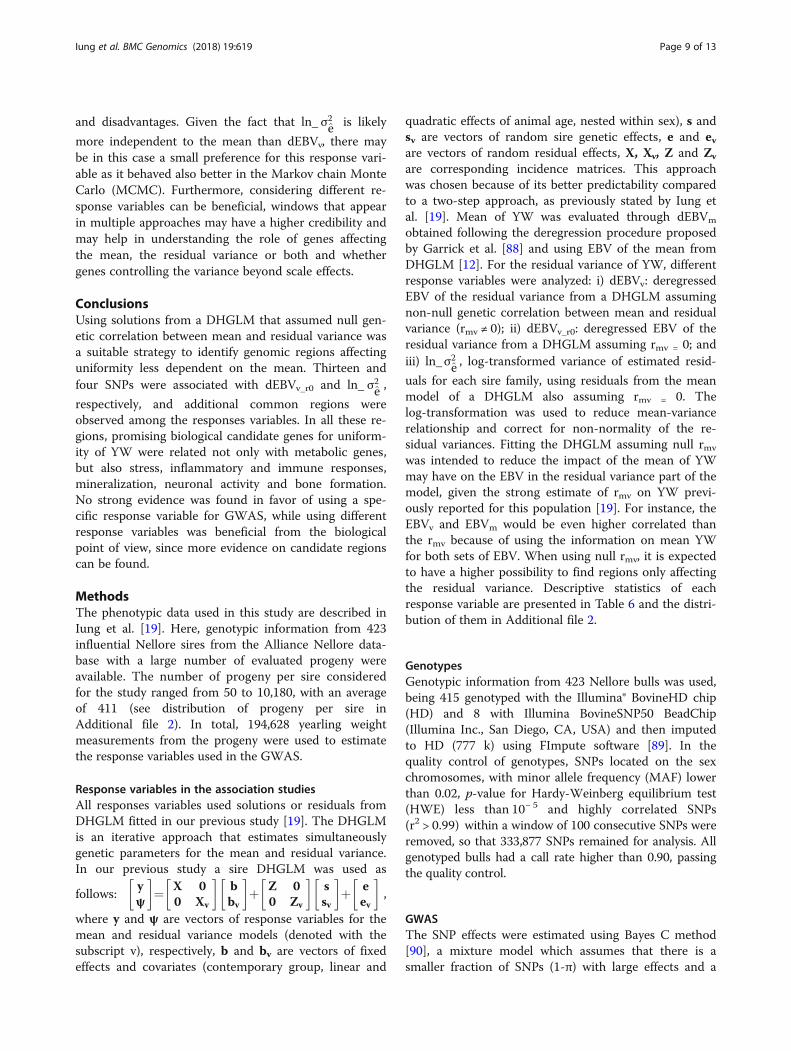
was intended to reduce the impact of the mean of YWmay have on the EBV in the residual variance part of themodel, given the strong estimate of rmv on YW previ-ously reported for this population [19]. For instance, theEBVv and EBVm would be even higher correlated thanthe rmv because of using the information on mean YWfor both sets of EBV. When using null rmv, it is expectedto have a higher possibility to find regions only affectingthe residual variance. Descriptive statistics of eachresponse variable are presented in Table 6 and the distri-bution of them in Additional file 2.
GenotypesGenotypic information from 423 Nellore bulls was used,being 415 genotyped with the Illumina® BovineHD chip(HD) and 8 with Illumina BovineSNP50 BeadChip(Illumina Inc., San Diego, CA, USA) and then imputedto HD (777 k) using FImpute software [89]. In thequality control of genotypes, SNPs located on the sexchromosomes, with minor allele frequency (MAF) lowerthan 0.02, p-value for Hardy-Weinberg equilibrium test(HWE) less than 10− 5 and highly correlated SNPs(r2 > 0.99) within a window of 100 consecutive SNPs wereremoved, so that 333,877 SNPs remained for analysis. Allgenotyped bulls had a call rate higher than 0.90, passingthe quality control.
GWASThe SNP effects were estimated using Bayes C method[90], a mixture model which assumes that there is asmaller fraction of SNPs (1-π) with large effects and a
Iung et al. BMC Genomics (2018) 19:619 Page 9 of 13
large proportion (π) with zero or near zero effects onthe trait, as follows:
y ¼ 1μþXNi¼1
ziaiδi þ e
where y is the vector of response variables (dEBVm,dEBVv, dEBVv_r0 and ln_σ2e), μ is the overall mean, 1 is avector of ones, zi is the vector of genotypes of the ani-mals for the ith SNP, ai is the allele substitution effect ofthe ith SNP, δi is an indicator variable set to 1 if the ith
SNP has an non-zero effect on the trait and to 0 other-wise, e is the vector of random residual effects and N isthe number of SNPs. It was assumed ai ~ N(0, σ2a ) and e~ N(0, Rσ2e ), where σ2a is the variance of SNP effects, σ2eis the residual variance and R is a diagonal matrix whoseelements account for heterogeneous residual varianceacross observations. When dEBV was the response vari-able, the diagonal elements of R were derived followingGarrick et al. [88], whereas when ln_ σ2e was the re-
sponse, such elements were equal to the reciprocal ofthe number of progeny of each sire. The R-accountedfor differences in sampling variance due to differentnumbers of progeny per sire, even observing low corre-lations between the number of progeny per sire and eachresponse variable (0.021 to 0.145). In addition, scaledinverse chi-squared prior distributions with v degrees offreedom and scale parameter S were assumed for σ2a andσ2e . In our study, π was fixed at 0.999, which means that0.1% of the SNPs fitted in the model, i.e. about 334, havean effect on the trait. Such a criterion was assumedaiming to obtain stronger signals of candidate QTL andalso due to the limiting number of genotypes.The analyses were performed using the GS3 software
[91]. Chains of 550,000 and 250,000 iterations, afterdiscarding the first 150,000 and 50,000 as burn-in, weregenerated for analyses pertaining to the three responsevariables for residual variance and mean of YW,
respectively, saving samples every 50 iterations in bothcases. Convergence was assessed through Geweke test[92] using CODA R package [93].The significance of each association was evaluated
through the Bayes Factor (BF):
BF ¼p
1−p
� �
π1−π
� �
where p and π are the posterior and prior probability ofa SNP being included in the model, i.e. having a non-zero effect, respectively. Suggestive and strong evidenceswere assigned to SNPs with BF greater than 3 and 20,respectively [94, 95]. In addition, the proportion of gen-etic variance explained by SNPs within non-overlapping1-Mb windows were calculated. A window size of 1-Mbwas chosen since SNPs within this distance presentmoderate to high (> 0.2) pairwise linkage disequilibrium(LD; measured by r2) (see Additional file 3). In total,SNPs were allocated to 2522 windows, with an average(SD) of 132 (42) SNPs. The top 20 windows thatexplained the largest proportion of genetic variance werecompared between responses variables.
Functional annotationThe shared 1-Mb windows (among the top 20 thatexplained the largest proportion of genetic variance)between response variables and windows with SNPs thatshowed a strong association (BF > 20) were screened toidentify potential candidate genes using EnsemblGenome Browser (http://www.ensembl.org), UMD3.1bovine genome assembly [96]. Previously reported QTLregions overlapping such windows were identified fromCattle QTLdb [97]. Functional enrichment based onGene Ontology (GO) terms and pathway analysis usingBlast2GO PRO and Reactome [98, 99], respectively, wasperformed on these regions in order to help us to deter-mine potential candidate genes for uniformity. Only thepromising candidate genes, according to their function,pathway or related biological process, were discussedhere (the complete gene list and annotations are shownin Additional file 1). The LD maps within each 1-Mbwindow discussed here were obtained using the R packageLDheatmap [100] (Additional file 3).
Additional files
Additional file 1: Complete list of the genes located within 1-Mbwindows harboring SNPs with strong association by trait. Gene Ontology(GO) terms and pathways of each gene were obtained using Blast2GOand Reactome. (XLSX 99 kb)
Additional file 2: Distribution of number of progeny per sire andresponses variables. (DOCX 242 kb)
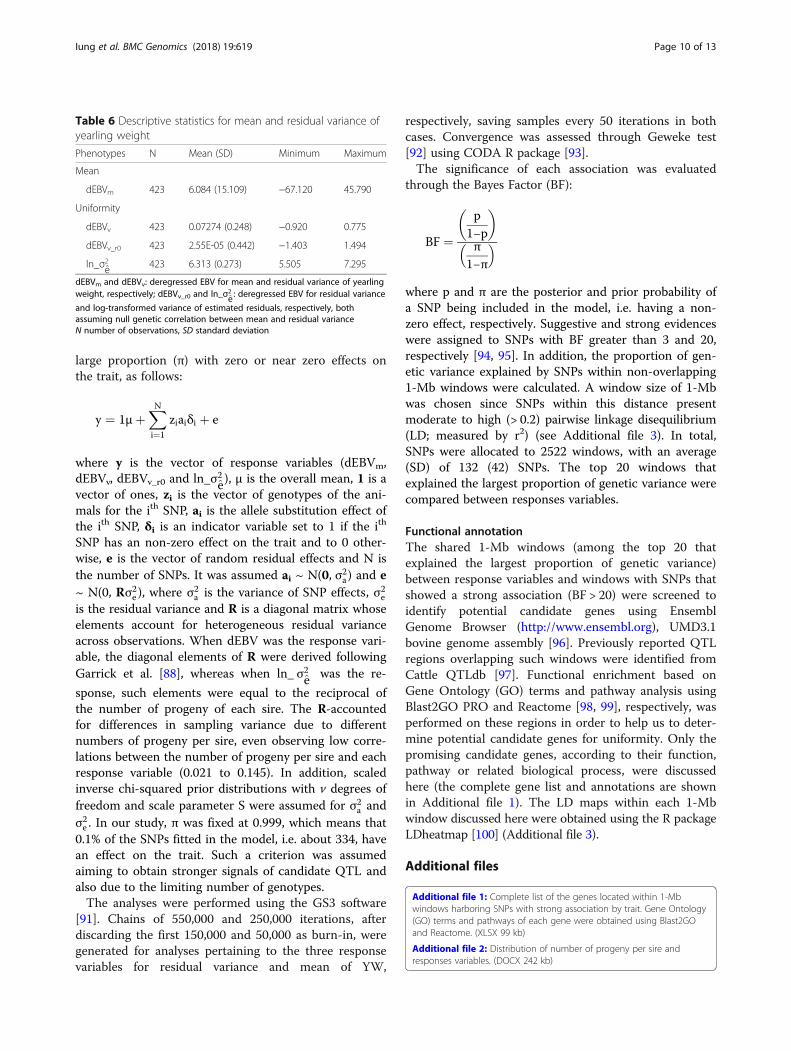
Table 6 Descriptive statistics for mean and residual variance ofyearling weight
Phenotypes N Mean (SD) Minimum Maximum
Mean
dEBVm 423 6.084 (15.109) −67.120 45.790
Uniformity
dEBVv 423 0.07274 (0.248) −0.920 0.775
dEBVv_r0 423 2.55E-05 (0.442) −1.403 1.494
ln_σ2e 423 6.313 (0.273) 5.505 7.295
dEBVm and dEBVv: deregressed EBV for mean and residual variance of yearlingweight, respectively; dEBVv_r0 and ln_σ2e: deregressed EBV for residual variance
and log-transformed variance of estimated residuals, respectively, bothassuming null genetic correlation between mean and residual varianceN number of observations, SD standard deviation
Iung et al. BMC Genomics (2018) 19:619 Page 10 of 13

Additional file 3: Manhattan plot and linkage disequilibrium (LD) mapin each 1-Mb window discussed in our study. (PDF 419 kb)
AbbreviationsBF: Bayes factor; Chr: Chromosome; dEBV: Deregressed EBV; DHGLM: Doublehierarchical generalized linear model; EBV: Estimated breeding value;GWAS: Genome-wide association study; HWE: Hardy-Weinberg equilibrium;ln_σ2e: log-transformed variance of estimated residuals; MAF: Minor allelefrequency; Mb: Mega bases; QTL: Quantitative trait loci; SNP: Singlenucleotide polymorphism; YW: Yearling weight
AcknowledgementsWe thank GenSys for providing phenotypic and genotypic data. TomBerghof and Camila Urbano Braz are gratefully acknowledged for their helpwith the functional analysis and determination of potential candidate genes.
FundingNational Council for Scientific and Technological Development (CNPq; grantnumber: 308636/2014–7) and Coordination for the Improvement of HigherEducation Personnel (CAPES, PDSE: 88881.131673/2016–01) for providingfellowships to LHSI.
Availability of data and materialsAll the data supporting the results of this article are included within thearticle. The phenotypic and genotypic data cannot be shared because ofbeing part of commercial breeding programs.
Authors’ contributionsRC conceived the study. RC and HAM led the coordination of the study.LHSI, HAM, HHRN and RC designed the study. LHSI and HHRN wereresponsible for phenotypic and genotypic data edition and statisticalanalysis. LHSI led the manuscript preparation. All authors interpreted theresults, contributed to edit the manuscript and approved the final version.
Ethics approvalAnimal Care and Use Committee approval was not required for this studybecause the data were obtained from an existing database. No permissionswere required for the use of the samples in this study.
Consent for publicationNot applicable.
Competing interestsThe authors declare that they have no competing interests.
Publisher’s NoteSpringer Nature remains neutral with regard to jurisdictional claims inpublished maps and institutional affiliations.
Author details1School of Agricultural and Veterinarian Sciences, São Paulo State University(Unesp), Via de Acesso Prof. Paulo Donato Castelane, S/N, Vila Industrial,FCAV/UNESP, Jaboticabal, São Paulo 14884-900, Brazil. 2WageningenUniversity & Research Animal Breeding and Genomics, P.O. Box 338, 6700 AHWageningen, The Netherlands. 3GenSys Consultores Associados S/S Ltda,Porto Alegre, RS 90680-000, Brazil.
Received: 24 January 2018 Accepted: 8 August 2018
References1. Falconer DS, Mackay TFC. Introduction to quantitative genetics. Pearson:
Essex; 1996.2. Mulder HA, Rönnegård L, Fikse WF, Veerkamp RF, Strandberg E. Estimation
of genetic variance for macro- and micro-environmental sensitivity usingdouble hierarchical generalized linear models. Genet Sel Evol. 2013;45:23.
3. Vandenplas J, Bastin C, Gengler N, Mulder HA. Genetic variance in micro-environmental sensitivity for milk and milk quality in Walloon Holsteincattle. J Dairy Sci. 2013;96:5977–90.
4. Sell-Kubiak E, Bijma P, Knol EF, Mulder HA. Comparison of methods to studyuniformity of traits: application to birth weight in pigs. J Anim Sci. 2015;93:900–11.
5. Marjanovic J, Mulder HA, Khaw HL, Bijma P. Genetic parameters foruniformity of harvest weight and body size traits in the GIFT strain of Niletilapia. Genet Sel Evol. 2016;48:41.
6. Mulder HA, Visscher J, Fablet J. Estimating the purebred-crossbred geneticcorrelation for uniformity of eggshell color in laying hens. Genet Sel Evol.2016;48:39.
7. Wolc A, Arango J, Settar P, Fulton JE, O’Sullivan NP, Preisinger R, et al.Genome-wide association analysis and genetic architecture of egg weightand egg uniformity in layer chickens. Anim Genet. 2012;43:87–96.
8. Wang X, Liu X, Deng D, Yu M, Li X. Genetic determinants of pig birthweight variability. BMC Genet. 2016;17:41.
9. Wang Y, Ding X, Tan Z, Ning C, Xing K, Yang T, et al. Genome-wideassociation study of piglet uniformity and farrowing interval. Front Genet.2017;8:1–9.
10. Rönnegård L, Felleki M, Fikse F, Mulder HA, Strandberg E. Geneticheterogeneity of residual variance - estimation of variance components usingdouble hierarchical generalized linear models. Genet Sel Evol. 2010;42:8.
11. Mulder HA, Crump RE, Calus MPL, Veerkamp RF. Unraveling the geneticarchitecture of environmental variance of somatic cell score using high-density single nucleotide polymorphism and cow data from experimentalfarms. J Dairy Sci. 2013;96:7306–17.
12. Felleki M, Lee D, Lee Y, Gilmour AR, Rönnegård L. Estimation of breedingvalues for mean and dispersion, their variance and correlation using doublehierarchical generalized linear models. Genet Res. 2012;94:307–17.
13. Sell-Kubiak E, Duijvesteijn N, Lopes MS, Janss LLG, Knol EF, Bijma P, et al.Genome-wide association study reveals novel loci for litter size and itsvariability in a large white pig population. BMC Genomics. 2015;16:1049.
14. Utsunomiya YT, do Carmo AS, Carvalheiro R, HHR N, Matos MC, Zavarez LB,et al. Genome-wide association study for birth weight in Nellore cattlepoints to previously described orthologous genes affecting human andbovine height. BMC Genet. 2013;14:52.
15. Saatchi M, Schnabel RD, Taylor JF, Garrick DJ. Large-effect pleiotropic orclosely linked QTL segregate within and across ten US cattle breeds. BMCGenomics. 2014;15:442.
16. Seabury CM, Oldeschulte DL, Saatchi M, Beever JE, Decker JE, Halley YA,et al. Genome-wide association study for feed efficiency and growth traitsin U.S. beef cattle. BMC Genomics. 2017;18:386.
17. Neves HHR, Carvalheiro R, Roso VM, Queiroz SA. Genetic variability ofresidual variance of production traits in Nellore beef cattle. Livest Sci. 2011;142:164–9.
18. Neves HHR, Carvalheiro R, Queiroz SA. Genetic and environmentalheterogeneity of residual variance of weight traits in Nellore beef cattle.Genet Sel Evol. 2012;44:19.
19. Iung LHS, Neves HHR, Mulder HA, Carvalheiro R. Genetic control of residualvariance of yearling weight in Nellore beef cattle. J Anim Sci. 2017;95:1425–33.
20. Casas E, Shackelford SD, Keele JW, Koohmaraie M, Smith TPL, Stone RT.Detection of quantitative trait loci for growth and carcass composition incattle. J Anim Sci. 2003;81:2976–83.
21. McClure MC, Morsci NS, Schnabel RD, Kim JW, Yao P, Rolf MM, et al. Agenome scan for quantitative trait loci influencing carcass, post-natalgrowth and reproductive traits in commercial Angus cattle. Anim Genet.2010;41:597–607.
22. Casas E, Keele JW, Shackelford SD, Koohmaraie M, Stone RT. Identification ofquantitative trait loci for growth and carcass composition in cattle. AnimGenet. 2004;35:2–6.
23. Lindholm-Perry AK, Kuehn LA, Smith TPL, Ferrell CL, Jenkins TG, Freetly HC,et al. A region on BTA14 that includes the positional candidate genesLYPLA1, XKR4 and TMEM68 is associated with feed intake and growthphenotypes in cattle. Anim Genet. 2012;43:216–9.
24. Júnior GAF, Costa RB, de Camargo GMF, Carvalheiro R, Rosa GJM, Baldi F,et al. Genome scan for postmortem carcass traits in Nellore cattle. J AnimSci. 2016;94:4087–95.
25. Magalhães AFB, de Camargo GMF, Fernandes GA, Gordo DGM, Tonussi RL,Costa RB, et al. Genome-wide association study of meat quality traits inNellore cattle. PLoS One. 2016;11:e0157845.
26. Silva RMO, Stafuzza NB, Fragomeni BO, de Camargo GMF, Ceacero TM,Cyrillo JNSG, et al. Genome-wide association study for carcass traits in anexperimental nelore cattle population. PLoS One. 2017;12:e0169860.
Iung et al. BMC Genomics (2018) 19:619 Page 11 of 13
27. Ramayo-Caldas Y, Fortes MRS, Hudson NJ, Porto-Neto LR, Bolormaa S,Barendse W, et al. A marker-derived gene network reveals the regulatoryrole of PPARGC1A, HNF4G, and FOXP3 in intramuscular fat deposition ofbeef cattle. J Anim Sci. 2014;92:2832–45.
28. Voz ML, Agten NS, Van de Ven WJM, Kas K. PLAG1, the main translocationtarget in pleomorphic adenoma of the salivary glands, is a positiveregulator of IGF-II. Cancer Res. 2000;60:106–13.
29. Nishimura I, Chano T, Kita H, Matsusue Y, Okabe H. RB1CC1 proteinsuppresses type II collagen synthesis in chondrocytes and causes dwarfism.J Biol Chem. 2011;286:43925–32.
30. Luo QB, Song XY, Ji CL, Zhang XQ, Zhang DX. Exploring the molecularmechanism of acute heat stress exposure in broiler chickens using geneexpression profiling. Gene. 2014;546:200–5.
31. Li H, Kentish SJ, Wittert GA, Page AJ. The role of neuropeptide W in energyhomeostasis. Acta Physiol. 2018;222:e12884.
32. Bali A, Randhawa PK, Jaggi AS. Stress and opioids: role of opioids inmodulating stress-related behavior and effect of stress on morphineconditioned place preference. Neurosci Biobehav Rev. 2015;51:138–50.
33. Zhang CS, Jiang B, Li M, Zhu M, Peng Y, Zhang YL, et al. The lysosomal v-ATPase-ragulator complex is a common activator for AMPK and mTORC1, acting as aswitch between catabolism and anabolism. Cell Metab. 2014;20:526–40.
34. Abo-Ismail MK, Kelly MJ, Squires EJ, Swanson KC, Bauck S, Miller SP.Identification of single nucleotide polymorphisms in genes involved indigestive and metabolic processes associated with feed efficiency andperformance traits in beef cattle. J Anim Sci. 2013;91:2512–29.
35. Mead JR, Irvine SA, Ramji DP. Lipoprotein lipase: structure, function,regulation, and role in disease. J Mol Med (Berl). 2002;80:753–69.
36. Wang XP, Luoreng ZM, Li F, Wang JR, Li N, Li SH. Genetic polymorphisms oflipoprotein lipase gene and their associations with growth traits in Xiangxicattle. Mol Biol Rep. 2012;39:10331–8.
37. Oh D, La B, Lee Y, Byun Y, Lee J, Yeo G, et al. Identification of novel singlenucleotide polymorphisms (SNPs) of the lipoprotein lipase (LPL) gene associatedwith fatty acid composition in Korean cattle. Mol Biol Rep. 2013;40:3155–63.
38. Ding XZ, Liang CN, Guo X, Xing CF, Bao PJ, Chu M, et al. A novel singlenucleotide polymorphism in exon 7 of LPL gene and its association withcarcass traits and visceral fat deposition in yak (Bos grunniens) steers.Mol Biol Rep. 2012;39:669–73.
39. Gui L, Jia C, Zhang Y, Zhao C, Zan L. Association studies on the bovinelipoprotein lipase gene polymorphism with growth and carcass qualitytraits in Qinchuan cattle. Mol Cell Probes. 2016;30:61–5.
40. Zhou T, Li S, Zhong W, Vihervaara T, Béaslas O, Perttilä J, et al. Osbp-relatedprotein 8 (ORP8) regulates plasma and liver tissue lipid levels and interactswith the nucleoporin Nup62. PLoS One. 2011;6:e21078.
41. Straface G, Aprahamian T, Flex A, Gaetani E, Biscetti F, Smith RC, et al. Sonichedgehog regulates angiogenesis and myogenesis during post-natalskeletal muscle regeneration. J Cell Mol Med. 2009;13:2424–35.
42. Petrova R, Joyner AL. Roles for hedgehog signaling in adult organhomeostasis and repair. Development. 2014;141:3445–57.
43. Rodier A, Rochard P, Berthet C, Rouault JP, Casas F, Daury L, et al.Identification of functional domains involved in BTG1 cell localization.Oncogene. 2001;20:2691–703.
44. Il YS, Kim KK. Ubiquitin-specific protease 4 (USP4) suppresses myoblastdifferentiation by down regulating MyoD activity in a catalytic-independentmanner. Cell Signal. 2017;35:48–60.
45. Wing SS. Deubiquitinating enzymes in skeletal muscle atrophy - an essentialrole for USP19. Int J Biochem Cell Biol. 2016;79:462–8.
46. Ni Y, Ji C, Wang B, Qiu J, Wang J, Guo X. A novel pro-adipogenesis factorabundant in adipose tissues and over-expressed in obesity acts upstream ofPPARγ and C/EBPα. J Bioenerg Biomembr. 2013;45:219–28.
47. Brockman RP, Laarveld B. Hormonal regulation of metabolism in ruminants;a review. Livest Prod Sci. 1986;14:313–34.
48. Belhadj Slimen I, Najar T, Ghram A, Abdrrabba M. Heat stress effects onlivestock: molecular, cellular and metabolic aspects, a review. J Anim PhysiolAnim Nutr. 2016;100:401–12.
49. Blackshaw JK, Blackshaw AW. Heat stress in cattle and the effect of shadeon production and behaviour: a review. Aust J Exp Agric. 1994;34:285–95.
50. Möstl E, Palme R. Hormones as indicators of stress. Domest AnimEndocrinol. 2002;23:67–74.
51. Vale W, Spiess J, Rivier C, Rivier J. Characterization of a 41-residue ovinehypothalamic peptide that stimulates secretion of corticotropin and beta-endorphin. Science. 1981;213:1394–7.
52. Bale TL, Vale WW. CRF AND CRF R ECEPTORS: role in stress responsivity andother behaviors. Annu Rev Pharmacol Toxicol. 2004;44:525–57.
53. Lee J-W, Bae S-H, Jeong J-W, Kim S-H, Kim K-W. Hypoxia-inducible factor(HIF-1)alpha: its protein stability and biological functions. Exp Mol Med.2004;36:1–12.
54. Elolimy AA, McCann JC, Shike DW, Loor JJ. 443 Residual feed intake in beefcattle and its association with ruminal epithelium gene expression. J AnimSci. 2017;95:217–8.
55. Kampinga HH, Hageman J, Vos MJ, Kubota H, Tanguay RM, Bruford EA, et al.Guidelines for the nomenclature of the human heat shock proteins. CellStress Chaperones. 2009;14:105–11.
56. Sørensen JG, Kristensen TN, Loeschcke V. The evolutionary and ecologicalrole of heat shock proteins. Ecol Lett. 2003;6:1025–37.
57. Queitsch C, Sangster TA, Lindquist S. Hsp90 as a capacitor of phenotypicvariation. Nature. 2002;417:618–24.
58. Rutherford S, Hirate Y, Swalla BJ. The Hsp90 capacitor, developmentalremodeling, and evolution: the robustness of gene networks and the curiousEvolvability of metamorphosis. Crit Rev Biochem Mol Biol. 2007;42:355–72.
59. Sangster TA, Bahrami A, Wilczek A, Watanabe E, Schellenberg K, McLellan C,et al. Phenotypic diversity and altered environmental plasticity inArabidopsis thaliana with reduced Hsp90 levels. PLoS One. 2007;2:e648.
60. Sangster TA, Salathia N, Undurraga S, Milo R, Schellenberg K, Lindquist S,et al. HSP90 affects the expression of genetic variation and developmentalstability in quantitative traits. Proc Natl Acad Sci U S A. 2008;105:2963–8.
61. Morrison BH, Bauer JA, Kalvakolanu DV, Lindner DJ. Inositol Hexakisphosphatekinase 2 mediates growth suppressive and apoptotic effects of interferon-β inovarian carcinoma cells. J Biol Chem. 2001;276:24965–70.
62. Chakraborty A, Koldobskiy MA, Sixt KM, Juluri KR, Mustafa AK, Snowman AM,et al. HSP90 regulates cell survival via inositol hexakisphosphate kinase-2.Proc Natl Acad Sci U S A. 2008;105:1134–9.
63. Coble DJ, Fleming D, Persia ME, Ashwell CM, Rothschild MF, Schmidt CJ,et al. RNA-seq analysis of broiler liver transcriptome reveals novel responsesto high ambient temperature. BMC Genomics. 2014;15:1–12.
64. Kang SM, Narducci MG, Lazzeri C, Mongiovì AM, Caprini E, Bresin A, et al.Impaired T- and B-cell development in Tcl1-deficient mice. Blood. 2005;105:1288–94.
65. Leonard JE, Johnson DE, Felsen RB, Tanney LE, Royston I, Dillman RO.Establishment of a human B-cell tumor in athymic mice. Cancer Res. 1987;47:2899–902.
66. Skeel A, Leonard EJ. Action and target cell specificity of humanmacrophage-stimulating protein (MSP). J Immunol. 1994;152:4618–23.
67. Hall A. Rho GTPases and the actin cytoskeleton. Science. 1998;279:509–14.68. Singh R, Wang B, Shirvaikar A, Khan S, Kamat S, Schelling JR, et al. The IL-1
receptor and rho directly associate to drive cell activation in inflammation.J Clin Invest. 1999;103:1561–70.
69. Konno D. The postsynaptic density and dendritic raft localization of PSD-Zip70, which contains an N-myristoylation sequence and leucine-zippermotifs. J Cell Sci. 2002;115:4695–706.
70. Savaskan NE, Bräuer AU, Nitsch R. Molecular cloning and expressionregulation of PRG-3, a new member of the plasticity-related gene family.Eur J Neurosci. 2004;19:212–20.
71. Kominakis A, Hager-Theodorides AL, Zoidis E, Saridaki A, Antonakos G,Tsiamis G. Combined GWAS and “guilt by association”-based prioritizationanalysis identifies functional candidate genes for body size in sheep. GenetSel Evol BioMed Central. 2017;49:1–16.
72. Fisher LW, Fedarko NS. Six genes expressed in bones and teeth encode thecurrent members of the SIBLING family of proteins. Connect Tissue Res.2003;44(Suppl1):33–40.
73. Nishimura S, Watanabe T, Mizoshita K, Tatsuda K, Fujita T, Watanabe N, et al.Genome-wide association study identified three major QTL for carcassweight including the PLAG1-CHCHD7 QTN for stature in Japanese blackcattle. BMC Genet. 2012;13:40.
74. Cao XK, Zhan ZY, Huang YZ, Lan XY, Lei CZ, Qi XL, et al. Variants andhaplotypes within MEF2C gene influence stature of chinese native cattleincluding body dimensions and weight. Livest Sci. 2016;185:106–9.
75. Han YJ, Chen Y, Liu Y, Liu XL. Sequence variants of the LCORL gene and itsassociation with growth and carcass traits in Qinchuan cattle in China. JGenet. 2017;96:9–17.
76. Backx L, Vermeesch J, Pijkels E, de Ravel T, Seuntjens E, Van Esch H.PPP2R2C, a gene disrupted in autosomal dominant intellectual disability. EurJ Med Genet. 2010;53:239–43.
Iung et al. BMC Genomics (2018) 19:619 Page 12 of 13
77. Sigoillot SM, Iyer K, Binda F, González-Calvo I, Talleur M, Vodjdani G, et al.The secreted protein C1QL1 and its receptor BAI3 control the synapticconnectivity of excitatory inputs converging on cerebellar purkinje cells.Cell Rep. 2015;10:820–32.
78. Penney J, Tsai LH. JAKMIP1: translating the message for social behavior.Neuron. 2015;88:1070–2.
79. Libri V, Schulte D, van Stijn A, Ragimbeau J, Rogge L, Pellegrini S. Jakmip1 isexpressed upon T cell differentiation and has an inhibitory function incytotoxic T lymphocytes. J Immunol. 2008;181:5847–56.
80. Lin S, Marin EC, Yang CP, Kao CF, Apenteng BA, Huang Y, et al. Extremes oflineage plasticity in the drosophila brain. Curr Biol. 2013;23:1908–13.
81. Lanet E, Gould AP, Maurange C. Protection of neuronal diversity at theexpense of neuronal numbers during nutrient restriction in the Drosophilavisual system. Cell Rep. 2013;3:587–94.
82. Mellert DJ, Williamson WR, Shirangi TR, Card GM, Truman JW. Genetic andenvironmental control of neurodevelopmental robustness in Drosophila.PLoS One. 2016;11:e0155957.
83. Yang Y, Christensen OF, Sorensen D. Analysis of a genetically structuredvariance heterogeneity model using the box–cox transformation. Genet Res.2011;93:33–46.
84. Sonesson AK, Ødegård J, Rönnegård L. Genetic heterogeneity of within-family variance of body weight in Atlantic salmon (Salmo salar). Genet SelEvol. 2013;45:41.
85. Sae-Lim P, Kause A, Janhunen M, Vehviläinen H, Koskinen H, Gjerde B, et al.Genetic (co) variance of rainbow trout (Oncorhynchus mykiss) body weightand its uniformity across production environments. Genet Sel Evol. 2015;47:46.
86. Hill WG, Mulder HA. Genetic analysis of environmental variation. Genet Res.2010;92:381–95.
87. Spencer CCA, Su Z, Donnelly P, Marchini J. Designing genome-wideassociation studies: sample size, power, imputation, and the choice ofgenotyping chip. PLoS Genet. 2009;5:e1000477.
88. Garrick DJ, Taylor JF, Fernando RL. Deregressing estimated breeding valuesand weighting information for genomic regression analyses. Genet Sel Evol.2009;41:55.
89. Sargolzaei M, Chesnais JP, Schenkel FS. A new approach for efficientgenotype imputation using information from relatives. BMC Genomics.2014;15:478.
90. Habier D, Fernando RL, Kizilkaya K, Garrick DJ. Extension of the bayesianalphabet for genomic selection. BMC Bioinformatics. 2011;12:186.
91. Legarra A, Ricard A, Filangi O. GS3: Genomic Selection, Gibbs Sampling,Gauss Seidel (and BayesCπ). 2014; http://snp.toulouse.inra.fr/~alegarra/manualgs3_last.pdf.
92. Geweke J. Evaluating the accuracy of sampling-based approaches to thecalculation of posterior moments. Bayesian Stat 4. 1992;8:169–93.
93. Plummer M, Best N, Cowles K, Vines K. CODA: convergence diagnostics andoutput analysis for MCMC. R News. 2006;6:7–11.
94. Kass RE, Raftery AE. Bayes factors. J Am Stat Assoc. 1995;90:773.95. Vidal O, Noguera JL, Amills M, Varona L, Gil M, Jiménez N, et al. Identification of
carcass and meat quality quantitative trait loci in a landrace pig populationselected for growth and leanness. J Anim Sci. 2005;83:293–300.
96. Zimin AV, Delcher AL, Florea L, Kelley DR, Schatz MC, Puiu D, et al. A whole-genome assembly of the domestic cow. Bos taurus Genome Biol. 2009;10:R42.
97. Hu ZL, Park CA, Wu XL, Reecy JM. Animal QTLdb: an improved databasetool for livestock animal QTL/association data dissemination in the post-genome era. Nucleic Acids Res. 2013;41:871–9.
98. Conesa A, Götz S, García-Gómez JM, Terol J, Talón M, Robles M. Blast2GO:a universal tool for annotation, visualization and analysis in functionalgenomics research. Bioinformatics. 2005;21:3674–6.
99. Croft D, Mundo A, Haw R, Milacic M, Weiser J, Wu G, et al. The Reactomepathway knowledgebase. Nucleic Acids Res. 2014;42:D472–7.
100. Shin J-H, Blay S, McNeney B, Graham J. LDheatmap: an R function forgraphical display of pairwise linkage disequilibria between single nucleotidepolymorphisms. J Stat Softw. 2006;16:1–10.
101. Sikora KM, Magee DA, Berkowicz EW, Berry DP, Howard DJ, Mullen MP, et al.DNA sequence polymorphisms within the bovine guanine nucleotide-binding protein Gs subunit alpha (Gsα)-encoding (GNAS) genomicimprinting domain are associated with performance traits. BMC Genet.2011;12:4.
Iung et al. BMC Genomics (2018) 19:619 Page 13 of 13
Copyright © 2022 FDOKUMEN