Effect of Codec Performance on Video QoE for ... - DiVA portal
65
Master Thesis Electrical Engineering August 2014 Effect of Codec Performance on Video QoE for videos encoded with Xvid, H.264 and WebM/VP8 Raj Kiran Addu and Vinod Kumar Potuvardanam School of Computing Blekinge Institute of Technology SE-371 79 Karlskrona Sweden
-
Upload
khangminh22 -
Category
Documents
-
view
0 -
download
0
Transcript of Effect of Codec Performance on Video QoE for ... - DiVA portal

Master ThesisElectrical EngineeringAugust 2014
Effect of Codec Performance on Video QoEfor videos encoded with Xvid, H.264 and
WebM/VP8
Raj Kiran Addu and Vinod Kumar Potuvardanam
School of Computing
Blekinge Institute of Technology
SE-371 79 Karlskrona
Sweden

This thesis is submitted to the School of Computing at Blekinge Institute of Technology
in partial fulfillment of the requirements for the degree of Master of Science in Electrical
Engineering. The thesis is equivalent to 20 weeks of full time studies.
This master thesis is typeset using LATEX
Contact Information:
Author(1):Raj Kiran AdduAddress:Karlskrona, Sweden.E-mail: [email protected]
Author(2):Vinod Kumar PotuvardanamAddress:Karlskrona, Sweden.E-mail: [email protected]
University advisor:Tahir Nawaz MinhasSchool of Computing
University Examiner:Dr. Patrik ArlosSchool of Computing
School of ComputingBlekinge Institute of Technology Internet : www.bth.se/comSE-371 79 Karlskrona Phone : +46 455 38 50 00Sweden Fax : +46 455 38 50 57

Abstract
In recent years, there has been a significant growth in multimedia servicessuch as mobile video streaming, Video-on-Demand and video conferencing.This has led to the development of various video coding techniques, aimingto deliver high quality video while using available bandwidth efficiently. Thisupsurge in the usage of video applications has also resulted in making end-users more quality-conscious. In order to meet the users’ expectations, theQuality of Experience (QoE) studies has gained utmost importance fromboth researchers and service providers.
This thesis aims to compare the performance of H.264/AVC, Xvid andWebM/VP8 video codecs in wired and wireless networks. The codec perfor-mance is evaluated for different packet loss and delay variation values. Theevaluation of codec performance is done using both subjective and objectiveassessment methods.
In subjective assessment method, the evaluation of video codec perfor-mance is done using ITU-T recommended Absolute Category Rating (ACR)method. Using this method the perceptual video quality ratings are takenfrom the users, which are then averaged to obtain Mean Opinion Score. Theseobtained scores are used to analyze the performance of encoded videos withrespect to users’ perception.
In addition to subjective assessment method, the quality of encoded videois also measured using objective assessment method. The objective metricSSIM (Structural Similarity) is used to evaluate the performance of encodedvideos.
Based on the results, it was found that for lower packet loss and delayvariation values H.264 showed better results when compared to Xvid andWebM/VP8 whereas, WebM/VP8 outperformed Xvid and H.264 for higherpacket loss and delay variation values. On the whole, H.264 and WebM/VP8performed better than Xvid. It was also found that all three video codecsperformed better in wired network when compared to the wireless network.
Keywords: Quality of Experience, SSIM, H.264, WebM/VP8, Xvid.

Acknowledgments
We would like to thank our mentor and supervisor, Tahir Nawaz Min-has for his valuable support and guidance throughout our thesis work. Weare grateful to him for his continuous advice and encouragement throughoutthe thesis.
We would like to specially thank Dr. Patrik Arlos for his advice andsupport during every stage of the thesis.
We are thankful to our parents for their unceasing support and encour-agement. We are thankful to our beloved friends for their help and supportand we would also like to thank one and all who helped directly or indirectlyfor the completion of this thesis.
Raj Kiran AdduVinod Kumar Potuvardanam
August, 2014
ii

Contents
Abstract i
Acknowledgments ii
List of Figures v
List of Tables vi
List of Abbreviations vii
1 Introduction 11.1 Motivation . . . . . . . . . . . . . . . . . . . . . . . . . . . . 21.2 Aims and Objectives . . . . . . . . . . . . . . . . . . . . . . . 31.3 Research Question . . . . . . . . . . . . . . . . . . . . . . . . 31.4 Research Methodology . . . . . . . . . . . . . . . . . . . . . . 41.5 Thesis Outline . . . . . . . . . . . . . . . . . . . . . . . . . . 5
2 Technical Background 62.1 Quality of Experience . . . . . . . . . . . . . . . . . . . . . . 62.2 Video Streaming . . . . . . . . . . . . . . . . . . . . . . . . . 62.3 Video Compression . . . . . . . . . . . . . . . . . . . . . . . . 72.4 Video Codecs . . . . . . . . . . . . . . . . . . . . . . . . . . . 72.5 H.264 . . . . . . . . . . . . . . . . . . . . . . . . . . . . . . . 82.6 Xvid . . . . . . . . . . . . . . . . . . . . . . . . . . . . . . . . 92.7 WebM . . . . . . . . . . . . . . . . . . . . . . . . . . . . . . . 92.8 Video Transmission . . . . . . . . . . . . . . . . . . . . . . . . 10
2.8.1 Transmission Control Protocol (TCP) . . . . . . . . . 102.9 Video Quality Assessment . . . . . . . . . . . . . . . . . . . . 11
2.9.1 Objective Video Quality Assessment . . . . . . . . . . 112.9.2 Subjective Video Quality Assessment . . . . . . . . . . 12
2.10 Related Works . . . . . . . . . . . . . . . . . . . . . . . . . . 12
3 Experimental Design 143.1 Video Parameters . . . . . . . . . . . . . . . . . . . . . . . . . 143.2 Network Emulation . . . . . . . . . . . . . . . . . . . . . . . . 183.3 Packet Loss and Delay Variation . . . . . . . . . . . . . . . . 183.4 Experiment Test bed . . . . . . . . . . . . . . . . . . . . . . . 19
3.4.1 Wired Network Scenario . . . . . . . . . . . . . . . . . 19
iii

3.4.2 Wireless Network Scenario . . . . . . . . . . . . . . . . 203.4.3 Technical Components . . . . . . . . . . . . . . . . . . 223.4.4 Experimental Procedure . . . . . . . . . . . . . . . . . 23
3.5 Data Collection . . . . . . . . . . . . . . . . . . . . . . . . . . 243.6 Assessment Methodology . . . . . . . . . . . . . . . . . . . . 24
4 RESULTS AND DISCUSSION 294.1 Subjective Video Quality Assessment . . . . . . . . . . . . . . 29
4.1.1 Comparison of H.264, Xvid and WebM/VP8 in Wiredand Wireless Networks . . . . . . . . . . . . . . . . . . 30
4.1.2 Overall Comparison of Video Codec Performance inWired and Wireless Networks . . . . . . . . . . . . . . 34
4.2 Objective Video Quality Assessment . . . . . . . . . . . . . . 354.2.1 Comparison of H.264, Xvid and WebM/VP8 in Wired
and Wireless Network . . . . . . . . . . . . . . . . . . 364.2.2 Overall Comparison of Video Codec Performance in
Wired and Wireless Networks . . . . . . . . . . . . . . 394.3 Network Trace Analysis using Application Throughput . . . . 40
5 CONCLUSIONS 435.1 Conclusions . . . . . . . . . . . . . . . . . . . . . . . . . . . . 435.2 Future Work . . . . . . . . . . . . . . . . . . . . . . . . . . . 44
Appendix 45
Bibliography 50
iv

List of Figures
2.1 Full Reference Video Quality Assessment . . . . . . . . . . . 11
3.1 Wired Experimental Test-bed . . . . . . . . . . . . . . . . . . 193.2 Wireless Experimental Test-bed . . . . . . . . . . . . . . . . . 213.3 ACR 5 Method . . . . . . . . . . . . . . . . . . . . . . . . . . 263.4 MOS Questionaire Screen Shot . . . . . . . . . . . . . . . . . 273.5 MOS-Tool Screen Shot . . . . . . . . . . . . . . . . . . . . . . 28
4.1 Average MOS Ratings for Packet Loss in Wired Network . . 314.2 Average MOS Ratings for Packet Loss in Wireless Network . 324.3 Average MOS Ratings for Packet Delay Variation in Wired
Network . . . . . . . . . . . . . . . . . . . . . . . . . . . . . . 334.4 Average MOS Ratings for Packet Delay Variation in Wireless
Network . . . . . . . . . . . . . . . . . . . . . . . . . . . . . . 334.5 Network Based Comparison for Packet Loss with respective
MOS Ratings . . . . . . . . . . . . . . . . . . . . . . . . . . . 344.6 Network Based Comparison for Packet Delay Variation with
respective MOS Ratings . . . . . . . . . . . . . . . . . . . . . 354.7 SSIM for Packet Loss in Wired Network . . . . . . . . . . . . 364.8 SSIM for Packet Loss in Wireless Network . . . . . . . . . . . 374.9 SSIM for Packet Delay Variation in Wired Network . . . . . . 384.10 SSIM for Packet Delay Variation in Wireless Network . . . . 384.11 SSIM based comparison for Packet Loss in Wired and Wireless
Network . . . . . . . . . . . . . . . . . . . . . . . . . . . . . . 394.12 SSIM based comparison for Packet Delay Variation in Wired
and Wireless Network . . . . . . . . . . . . . . . . . . . . . . 404.13 Application throughput for Packet Loss in Wireless Network 414.14 Application throughput for Packet Delay Variation in Wireless
Network . . . . . . . . . . . . . . . . . . . . . . . . . . . . . . 42
v

List of Tables
3.1 Overview of the video content . . . . . . . . . . . . . . . . . . 153.2 Video Parameters for H.264 . . . . . . . . . . . . . . . . . . . 173.3 Video Parameters for Xvid . . . . . . . . . . . . . . . . . . . 173.4 Video Parameters for WebM . . . . . . . . . . . . . . . . . . . 173.5 Technical specifications (Wired Setup) . . . . . . . . . . . . . 203.6 Technical specifications (Wireless Setup) . . . . . . . . . . . . 21
vi

List of Abbreviations
ACR Absolute Category Rating
AVC Advanced Video Coding
DAG Data Acquisition Generation
DPMI Distributed Passive Measurement Infrastructure
FIFO First In First Out
FPS Frames Per Second
FR Full-Reference
GOP Group Of Pictures
HD High Definition
HTTP Hypertext Transfer Protocol
ITU-R International Telecommunication Unit, Radio Communications Sector
ITU-T International Telecommunication Unit, Telecommunications Sector
MArC Measurement Area Controller
MOS Mean Opinion Score
MP4 MPEG-1 Audio Layer-4
MP Measurement Point
MPEG Moving Pictures Expert Group
MSE Mean Squared Error
NR No-Reference
NTP Network Time Protocol
PEVQ Perceptual Evaluation of Video Quality
vii

PSNR Peak Signal-To-Noise Ratio
QoE Quality of Experience
QoS Quality of Service
QoE Quality of Experience
QVGA Quarter Video Graphics Array
RR Reduced-Reference
SI Spatial Information
SSIM Structural Similarity
TCP Transmission Control Protocol
TI Temporal Information
TS Traffic Shaper
VLC Video Lan Client
VoD Video on Demand
VQEG Video Quality Experts Group
VCEG Video Coding Experts Group
VQA Video Quality Assessment
viii

Chapter 1
Introduction
In recent years, video streaming has gained immense popularity. There hasbeen a huge development and research in the field of video streaming. Thishas led to an increase in the use of multimedia applications and services overthe Internet. According to the latest available statistics, globally the inter-net video traffic is predicted to be approximately 69 percent of all consumerinternet traffic in the year 2017, which would be a drastic increase from 57percent in 2012 [1]. Especially, the Video-on-demand traffic is estimated totriple by 2017 which shall be equivalent to 6 billion DVDs per month [2].Also, two-thirds of the global mobile data traffic will be video by 2017, whichwould be about 66 percent of world mobile data traffic. Thus accounting fora 16 fold increase of mobile video between 2012 and 2017. This popularityand availability of video services make the user quality-conscious. The serviceproviders should satisfy and fulfill the user satisfaction or Quality of Expe-rience constraints in order to lead the multimedia market. This fast-risingdemand is getting attention of network providers as well as research commu-nities to prioritize the concept of Quality of Experience (QoE) along withQuality of Service (QoS) in order to improve services. Generally, the end-user is more interested in the quality of video rather than quality of service,which makes the concept of Quality of Experience much more important forthe network service providers to stay ahead of their competitors.
In video streaming, QoE is influenced by various factors such as videocompression, video transmission and video reconstruction [3]. Video com-pression is a technology that is used to compress the videos from raw format,so that they can be streamed via network without consuming more band-width and resources. The modern video encoders and decoders are used forvideo compression in order to deliver the video without compromising onquality while consuming less bandwidth and resources. These video encodersand decoders use video codecs to achieve optimum compressed videos thatcan be delivered via network. There are various videos codecs that have beendeveloped by various organizations and open source groups such as Theora,Dirac, Xvid, DivX, H.264 and VP8. Some of the most widely used videocodecs amongst them are H.264/AVC [4], Xvid [5] and WebM/VP8 [6].
1

Chapter 1. Introduction 2
Another aspect that plays a key role in video streaming is the video trans-mission. The impact on the quality of streamed video also depends on thetype of network used for transmission of videos. The transport layer proto-cols have a noticeable impact on the quality of streamed videos. Generally,the video streaming services are based on HTTP and TCP, in which the videoplayer is embedded to the web browser [7]. Many popular video providerssuch as Youtube [8], Vimeo [9] and Dailymotion [10] use HTTP video stream-ing. Many studies have evaluated the user perceived quality for HTTP basedapplications [11], [12]. However, the knowledge of performance and quality ofexperience of HTTP video streaming is still limited, especially in the aspectof perception of video quality and its factors.
In this thesis, we study how network parameters such as packet loss anddelay variation have an impact on the user perception of video quality withrespect to video codecs H.264/AVC, Xvid and WebM/VP8. The experimen-tation is performed using wired and wireless emulated network scenarios.The required network conditions for the test environment are created us-ing NetEM [13]. The NetEM is used, rather than other emulators such asKauNet and NISTNet. In [14], [15], the authors have shown that perfor-mance of NetEm is more reliable when compared to NISTNet and KauNet.The Video-on-Demand streaming is performed, where videos with differenttemporal and spatial aspects are streamed with varying network parameterssuch as packet loss and delay variation. Here, Flumotion is used as a stream-ing server and VLC player is used on the client side. The HyperText TransferProtocol (HTTP) over TCP is used for video streaming over the emulatednetworks namely wired network and wireless network.
Further, the investigation of the users perception is done for the impact ofdelay variation and packet loss on the video Quality of Experience for differ-ent video sequences encoded with H.264/AVC, Xvid and WebM/VP8. Theassessment of videos is done in two fold. Firstly, the objective assessment ofvideos were made using Structural Similarity (SSIM) index as a performancemeasurement metric. Secondly, the subjective assessment of videos wereperformed adhering to the International Telecommunication Union (ITU)recommendations P.910 [16].
1.1 Motivation
Advances in video coding technology along with rapid developments and im-provements in the field of video streaming are enabling an increasing numberof video applications. Due to this rise in video applications, there is anincreased attention towards evaluation of video codec performance. Manyvideo codec comparisons have been performed by various groups, but theywere mostly based on either objective measures of video assessment or sub-jective measures of video assessment. However, the studies of video qualityassessment for different video codecs on wired and wireless network is limited.

Chapter 1. Introduction 3
It is interesting to know how different codecs behave or perform in wirednetwork and wireless network scenarios. Especially, when the network is af-fected by various delay variation and packet loss conditions. In this thesis, wetry to figure out the performance of the three video codecs in wired and wire-less network scenarios. A series of experiments are conducted to investigatethe performance of video codecs. However, neither objective nor subjectivetests alone gives a complete picture about the video quality. That is why, wehave used two assessment methods, namely objective and subjective in ourresearch work. These findings shall contribute to the video streaming serviceproviders to get an understanding of the video codec behavior with respectto different networks.
1.2 Aims and Objectives
The main aim of this research is to study the impact of network parameterson the codec performance with respect to Quality of Experience (QoE). Thisresearch work is divided into following objectives:
� To get an understanding on the video quality of experience for encodedvideos that are streamed over wired and wireless network scenarios.
� To investigate how these three codecs perform in wired and wirelessnetwork scenarios.
� To get an understanding on various video codecs, encoding techniquesand network emulators.
� To analyze the results obtained from the experiment for effect of packetloss and delay variation using objective assessment method.
� To analyze user Quality of Experience by using Mean Opinion Score.
1.3 Research Question
The research questions that are addressed in this thesis are as follows:
1. How does the user perceive the quality of videos encoded by threecodecs in the presence of packet loss and packet delay variation? This
research question is further broken down into three sub-questions:
(a) How does the user perceive the quality of video encoded with Xvidin the presence of packet loss and packet delay variation?
(b) How does the user perceive the quality of video encoded with H.264in the presence of packet loss and packet delay variation?

Chapter 1. Introduction 4
(c) How does the user perceive the quality of video encoded by Web-M/VP8 in the presence of packet loss and packet delay variation?
2. How does the user perceive the quality of encoded videos that arestreamed over wired and wireless networks?
1.4 Research Methodology
To answer the above research questions, both qualitative and quantitativeapproaches have been used. In the early stage of our research, a literaturestudy has been performed which gave us an insight to the previous worksdone by other researchers in the video streaming research area. This liter-ature study provided us with information on video compression technology,video codec functionality, video quality assessment methods, emulated ex-perimental setup and network scenarios. Based on the literature study, therequired components and parameters of the experimental environment wereselected.
After the completion of literature study, an emulated experimental en-vironment was created and the experimentations were performed for twonetwork scenarios, namely wired network and wireless network. During theexperiment, packet loss and delay variation were introduced using a trafficshaper in a controlled environment. The selection of video sequences for theexperiment were done based on their temporal and spatial characteristics.These selected videos were encoded and then streamed from server to client.The resulting videos were stored in the local database so that they could beused later in the assessment stage.
In the later stage, the evaluation of resultant videos was done using ob-jective and subjective assessment methods. Firstly, the objective assessmentof videos were performed based on the structural similarity (SSIM). Andthen the subjective assessment of videos was performed. In which the userperceptions were obtained by conducting a user rating survey of the videos,where videos with different parameters were shown to the subjects. The userperceptions were collected and analyzed as per the International Telecom-munication Union recommendations [16] using subjective analysis methods.The single stimulus ACR methodology was used to perform subjective assess-ment of videos. As we wanted to measure users’ perception of video qualityfor video sequences with different distortions with regard to three codecsH.264, Xvid, WebM/VP8. Also, ACR method is a recommended method forconducting assessment tests as per several studies [17], [18]. Finally, the re-sults were calculated and presented by using the five-level quality scale meanopinion score (MOS) and conventional statistical methods.
RQs 1-2 are preliminarily answered by experiments and analysis of theresults, where the network based impact of the video codec performance ofthe three specific codecs on video Quality of experience (QoE) is unveiled.

Chapter 1. Introduction 5
1.5 Thesis Outline
The remainder of the thesis is organized as follows. Chapter 2 describes thetechnical background on video streaming and video quality assessment. Theconcept of compression as well as detailing about video codecs and networkscenarios are presented. An elaboration on how the video quality assessmentis done by using objective and subjective methods is given. A brief descriptionof widely used statistical methods such as MOS is also given. Chapter 3describes the measurement environment. The test scenarios and parametersused are detailed explicitly. Chapter 4 details about the analysis and results.Finally, Chapter 5 summarizes the conclusion and future work of the thesis

Chapter 2
Technical Background
In this chapter, the basic concepts used in the evaluation of video codeccomparison are introduced. An overview of video streaming, video compres-sion and video codecs are provided. Later the main aspects related to videotransmission and network scenario is presented. Finally, the concept of videoquality assessment is demystified with a brief introduction.
2.1 Quality of Experience
Generally QoE refers to the perceived quality of service by the end-user. Asper ITU-T, it is defined [19] as ”The overall acceptability of an applicationor service, as perceived subjectively by the end-user”. It is also defined [20]as ”Degree of delight of the user of a service. In the context of communica-tion services, it is influenced by content, network, device, application, userexpectations and goals and context of use”. It considers complete end-to-endsystem effects such as effects of network, infrastructure of services and client.It also considers the end user’s satisfaction and acceptability to the servicesprovided. The end user satisfaction involves various psychological factorssuch as user’s mood, emotions and state of mind while using the service. In[21], the author states about the QoE parameters importance when comparedto QoS parameters.
2.2 Video Streaming
Video streaming refers to the process of videos being transferred from asource to one or more destinations. The video is usually streamed from serverto clients. The video streaming is basically comprised of two fundamentalactivities:
1. Creation of digital content using compression techniques.
2. Content transmission over the network.
The creation of digital content is done using compression techniques, asit is expensive to transmit a raw video over the network. Streaming a raw
6

Chapter 2. Technical Background 7
video over the network consumes more network resources as well as storageresources [7]. Thus video compression plays a key role in the process of videostreaming.
2.3 Video Compression
Video compression refers to the process, where the raw video is compressedusing various compression based algorithms and mechanisms. This is donein order to reduce the size of the videos, so as to ensure transmission ofvideos over a network without consuming more network resources. Gener-ally, in wired or wireless networks, an uncompressed video consumes morebandwidth and storage. Thus, increasing the end user cost with respect tobandwidth and data transmission capacity in the network. In order to max-imize bandwidth utilization of the network while transmission of videos, it isindispensable to use video compression [22].
The video compression is done in two ways, namely lossless compressionand lossy compression. Lossless compression is a technique in which no in-formation is lost. The lossless compression technique can reduce the size ofthe video to a small extent. The videos compressed using lossless techniquesare not suitable to be streamed over a network due to their large size. Thus,for greater compression of videos one must use lossy compression technique.Lossy compression is a technique that compresses a video by discarding in-formation. Thus, in lossy compression, some information is lost which leadsto reduction in the size of video along with degradation of video quality. Themain goal of video compression is to maintain a fine balance between videoquality and size of the video. To serve this purpose, various video codecshave been developed [23].
2.4 Video Codecs
Video compression involves two components, namely (Co)der and (Dec)oder,which is combinedly called as CODEC. Video codec is a software programcapable of encoding and decoding. It compresses the raw video into a small-sized video that can be easily transmitted over network without consumingmore bandwidth resources. Video codec is used to compress a video filewhere as an audio codec is used to compress an audio file. Due to increase invideo communication nowadays, many efficient video coding techniques havebeen developed to provide high quality video streams using the availablebandwidth [24].

Chapter 2. Technical Background 8
2.5 H.264
H.264 is a video compression technology that was jointly developed and stan-dardized by ITU-T Video Coding Experts Group (VCEG) and ISO/IECMoving Picture Experts Group (MPEG). It is also known as MPEG4 part10 or AVC (Advanced Video Coding). It is quite complex and flexible. Ithas been developed to cover a wide range of video streaming services frommobile video streaming to hi-definition video streaming or broadcasts.
H.264 compresses the video more effectively, when compared to previousH.26x standards. It has some optimized features such as utilization of tem-poral and spatial correlation, usage of entropy coder, which were taken fromprevious encoding standards. Some of the important features of H.264 videocodec are as follows [4]:
� It uses a 4x4 spatial block transform instead of 8x8 DCT as found inolder video codecs.
� An additional Hadamard transform (2x2 on chroma and 4x4 on luma)can be usually performed to obtain more compression in smooth re-gions.
� Quarter sample motion vector accuracy.
� In-the-loop deblocking filtering.
� It houses latest enhanced entropy coding method namely Context Adap-tive Variable Length Coding (CAVLC) and Context Adaptive BinaryArithmetic Coding (CABAC).
� Complex spatial prediction for intra frame compression has been intro-duced in H.264.
� Multiple reference frames, allowing up to 16 reference pictures to beused unlike previous standards where 1 or 2 reference frames were used.
� Network Abstraction Layer (NAL) which facilitates simple and effectivevideo streaming over networks.
Special attention has been given by the developers to improve the ro-bustness to data losses during video transmission [24]. H.264 codec has threetypes of frames namely I-frame, P-frame, and B-frame. I-frame (Intra-frame)is independent and does not reference any other frames. P-frame (Predictedframe) is decoded predictively from the closest previous reference frame thatcan be either I-frame or P-frame. P frames are more compressible whencompared to I frames. Finally, B-frame (Bi-directional frame) depends onboth past and future frames for decoding and is the most compressed frameamongst the three frames. Therefore, I-frame is the most important framewhen compared to other two frames.
H.264/AVC standard defines mainly three encoding profiles which arefrequently used namely Main profile, Baseline profile and High profile. Thebaseline profile has less amount of video data compared to other profiles due

Chapter 2. Technical Background 9
to lower quality versions of the video. Baseline profile is suitable for videoconferencing. Whereas the main profile and high profile are suitable for highend video broadcast and video storage [4]. These profiles are classified inlevels indicating the limits of various parameters, namely video resolution,coding bit rate, max decoding speed and max frame size. These profiles andlevels are used as limits to encode/decode videos which targets respectiveclasses of video communication applications.
2.6 Xvid
Xvid is an open source implementation of MPEG-4 video standard. Xvid isone of the popular MPEG-4 codecs used for non-commercial purpose [25].It is used in fields such as Digital Television and interactive multimedia ap-plications. It provides high data compression while maintaining good videoquality. The MPEG-4 compression is based on visual-objects coding [26].The Xvid codec uses discrete cosine to transform functions developed by theIndependent JPEG group. It provides a flexibility in coding techniques andvisual data types which include synthetic and hybrid visual data, still imagesand arbitrary shaped regions. Similar to MPEG-4 AVC, Xvid also has a widerange of profiles and levels for encoding videos with various parameters forvideo streaming purposes [27].
2.7 WebM
VP8 [28] is an open source video codec which was initially developed byOn2 technologies and released by Google. It was developed for serving videoon web with high quality. It consists of Intra frame and inter frame whichare similar to I-frame and P-frame of H.264 respectively. An intra-frame isthe key frame which is independent and has no reference to other frames.Whereas, an inter frame is dependent on previous frames, including intraframe to decode. However, lack of B-frames is the most important differ-ence between VP8 and MPEG-4. Generally, VP8 is comparable with H.264Baseline. Some of the prominent features are as follows [6]:
� High performance sub-pixel interpolation.
� Adaptive in-loop deblocking filtering.
� Frame level adaptive entropy coding.
� Flexible reference frames.
� Efficient intra and inter prediction.
� 4x4 block based discrete cosine transform (DCT) for all luma andchroma residual signal.

Chapter 2. Technical Background 10
2.8 Video Transmission
The streaming protocols are designed to provide data transmission, networkaddressing and service between the server and the client. The transportprotocols are used for the purpose of establishing communication betweenstreaming servers and clients. At the transport layer, two major techniquesare used, namely TCP based video streaming and UDP based video stream-ing. Currently, TCP is the most widely used transport protocol in the inter-net. The TCP or transmission control protocol is a byte stream, connectionoriented and reliable delivery transport layer protocol [7].
TCP is said to be reliable due to its mechanisms such as checksums,re-transmissions and sequencing. In the context of video streaming, thereare benefits of using TCP due to its congestion control mechanism and flowcontrol mechanism. On the other hand, TCP introduces undesirable trans-mission delays due to its re-transmission capabilities. Many video stream-ing services such as YouTube, Vimeo and Dailymotion are usually based onHTTP over TCP streaming methods [29]. HTTP has some advantages suchas data integrity, omnipresence and firewall friendliness. Moreover the au-thors in [30], suggests the usage of TCP for optimum performance in videostreaming especially when the available network bandwidth is twice to thatof video rate.
2.8.1 Transmission Control Protocol (TCP)
TCP is a connection oriented and reliable transport layer protocol that usesa three-way handshake method to establish and maintain a session betweensender and receiver. The three-way handshake method is described as follows:
� Initially, the client sends a synchronization packet (SYN) to the server,requesting the server to synchronize its sequence numbers with that ofthe client.
� Then the server responds by sending an acknowledgement (ACK) alongwith a SYN. Here, SYN is a request for client to synchronize its sequencenumbers with that of the server.
� Finally, the client acknowledges the servers request by sending an ac-knowledgement (ACK) to the server.
TCP also employs a congestion control mechanism that adjusts the trans-mission rate by limiting each TCP connection to its fair share of networkbandwidth. The TCP congestion control regulates the sending rate whichforces the sender to transmit at a lower rate [29].
Chapter 2. Technical Background 11
2.9 Video Quality Assessment
With the increase in the usage of various video based applications, has led toa fierce competition between service providers and also between developers toprovide better quality than each other. This has given rise to the importanceof assessment of video quality. Basically, the video quality assessment is donein two methods:
1. Objective video quality assessment method based on mathematical cal-culations.
2. Subjective video quality assessment method based on tests performedby users.
2.9.1 Objective Video Quality Assessment
There is a growing interest in the development of objective video qualityassessment methods to provide instantaneous measurement of video quality.The subjective video quality assessment methods are usually time consum-ing, exhaustive and expensive. The Video Quality Experts Group (VQEG)validates the objective video quality metric models that result in ITU rec-ommendations and standards of objective quality models [31]. The objectivevideo quality assessment methods are classified into 3 classes namely FullReference (FR), Reduced Reference (RR) and No-Reference (NR).
Generally, full-reference methods are mostly used for objective video qual-ity assessments. A full-reference method is used when the original referencevideo is available for comparison. Some of the widely used objective qualitymetrics are SSIM, PEVQ, PSNR and MSE [32]
Figure 2.1: Full Reference Video Quality Assessment
SSIM (Structural Similarity)
SSIM is a widely used objective video quality assessment method which com-pares luminance, contrast and structural similarity between original referencevideo and processed video. SSIM uses a different approach than that of othermetric such as PSNR. It is based on the idea that human visual perceptionis adapted for extracting structural information from the video [33]. Thestructures of objects in a particular scene are not influenced by luminance

Chapter 2. Technical Background 12
and contrast. Thus, the measurement of structural similarity is aimed to givea better correlation with respect to subjective user perception.
The structural similarity index can be calculated as follows:
SSIM(x, y) =(2μxμy + c1)(2σxy + c2)
(μ2x + μ2
y + c1)(σ2x + σ2
y + c2)(2.1)
Where μy and μy are estimates of the mean of x and mean of y respectively.σ2x and σ2
y are estimates of variance of x and variance of y respectively.σxy is the co-variance of x and y.c1 and c2 are constants.
The value of SSIM is between -1 and 1 and gets the best value of 1.According to Wang [33], the correlation between SSIM and subjective scoresare good.
2.9.2 Subjective Video Quality Assessment
The subjective video quality assessment method is the most reliable videoquality measurement method to evaluate the video service. It is the assess-ment of video quality as perceived by the user. In QoE the subjective resultsare different from user to user [34]. Human perception involves various as-pects of human psychology and various factors such as illumination, visionability and other viewing conditions.
MOS stands for Mean Opinion Score which is a metric obtained from theuser ratings given by the subjects for the video quality perceived by them.
2.10 Related Works
In this section the relevant research work done in the field of video QoEand video codecs is discussed. Several studies have been presented with thequality of experience (QoE) with respect to the videos. In paper [35], theauthors presented a conceptual model of QoE, which considers both measur-able and non-measurable parameters in quality evaluations. They have usedtheir model to measure QoE in mobile scenarios.
In [21] authors have proposed a QoE assessment model for video streamingservice using QoS parameters in wired and wireless network through whichthe network operators can correspond to poor quality by monitoring theQoE of video streaming service. Additionally, in paper [36] authors addressthe video quality correlation with respect to QoE and QoS. In this study, ageneric formula has been proposed in which QoE and QoS parameters areconnected through an exponential relationship which has been validated forstreaming servers. In paper [37], authors explain the technical aspects suchas application and network level QoS and non-technical aspects such as user

Chapter 2. Technical Background 13
experience. The importance of the relationship between QoE and technicalparameters to manage the user perceived quality is explained.
In [38] authors have subjectively assessed the video quality of H.263,H.264 and Xvid for mobile devices. They have investigated the effects ofcodecs with respect to different combinations of bitrates and video contentin mobile networks. Alternatively, In [28] authors have compared two codecsnamely H.264 and VP8 in which they have measured the objective videoquality of videos with different encoding related parameters.
The transport layer protocols have a noticeable impact on the quality ofstreamed video. The studies [39] depict the importance of transport layerprotocols in assessing the video quality. In [40] authors have analyzed theperformance of latest video codecs such as H.264/AVC, H.264/SVC, andVP8 over IEEE 802.11 wireless network. They have shown that reducingthe coded video data, considering the queue size, implementation of errorrecovery features have facilitated a robust transmission over WLANs. Theyhave compared the performance of the above video codecs on various mappingschemes.
In [23] the authors have compared the rate distortion performance of fivevideo codecs in terms of peak signal to noise ratio (PSNR) and just noticeabledifference. In [41] the authors have compared two video codecs namely H.264and VP8 in terms of video bit rate-distortion performance and video networktraffic variability. Here, the authors have used different long video sequencesfor comparing performance of video codecs. Studies [42], [43] have analyzeduser’s perception for streamed videos and the impact of packet loss and effectof various artifacts have also been analyzed.
In [44], authors have evaluated the sensitivity of mobile video to packetloss and packet delay. They have revealed that mobile video (H.264 baseline)is very sensitive to packet loss and packet delay variation. In [45], authorshave made a comparative study of objective and subjective video qualityfor the codec H.323 in which they found that jitter had the biggest effectwhen loss, delay and jitter has been introduced to the same video sequence.In [46], authors have investigated the effect of artifacts on user perceivedquality where the video quality assessment is done by analyzing the effects ofartifacts and packet loss. Moreover, in [47], [48] the authors have investigatedthe impact of video freezes and video jump on user perception.
Although many works have investigated the performance comparison ofvideo codecs, those comparisons were mostly limited to the comparison of var-ious encoding based parameters with respect to either subjective or objectivemetrics. In this thesis work, we evaluate and compare the performance ofthree video codecs using objective and subjective assessment methods. Thevideos encoded with selected codecs are streamed in wired and wireless net-work in the presence of packet loss and delay variation. This enables us tocompare the performance of codecs in wired and wireless networks.

Chapter 3
Experimental Design
This chapter discusses about the measurement environment. The technicalaspects of the experiment design are discussed as well as the experimentalsetup and configurations under which the measurements were collected areepitomized.
3.1 Video Parameters
This section describes the video parameters that are selected for the experi-mentation.
Video Content Selection
The video sequences are selected from the standard video pool, such that theirtemporal and spatial properties are consistent. All the test sequences havedifferent motion activities, where videos differ in their Temporal Information(TI) and Spatial Information (SI) characteristics. As per the suggestionsof ITU-T [16], it is suggested to consider distinct video sequences to evalu-ate the video codec performance which is directly dependent on the TI andSI characteristics. For example, videos with high motion activities responddifferently to the coding paradigms of the video codecs when compared tovideos with slow motion activities.
The selected video sequences are taken from a commonly used repositorythat is used for video quality assessment studies as suggested by SimoneEt al. [49]. These video sequences are widely used in the video testingcommunity because of their varied content with regard to the spatial andtemporal aspects. The selected video sequences are described in the Table3.1.
The selected set of test sequences for the experiment which are describedin the Table 3.1, covers a wide range of video contents in terms of motionand spatial details.
14

Chapter 3. Experimental Design 15
Table 3.1: Overview of the video content
Video Name Numberof frames
Duration(Seconds)
Description
Crew 300 10 A group of crew memberswalking through the corridorwaving. The camera movesaccording to the motion of thegroup.
Foreman 300 10 The face of a foreman speak-ing is shown. The camerashakes a little and then at theend the camera moves towardsthe building under construc-tion.
News 300 10 The scene consists of two newsreaders in the front with lowmovement and two dancersperforming in the backgroundwith high movement.
Football 260 8 A high motion video sequenceof a game where the camerafollows the ball.
Hall-Monitor 300 10 Two persons walk in an of-fice corridor in the oppositedirection, where one person iscarrying a briefcase and an-other person carries a TV.The Background has no ac-tivity and the focus is on themovement of the two subjects.
Video Resolution
The video resolution selected for the experimentation is QVGA (320 x 240)which is larger (higher resolution) than QCIF, but smaller than CIF. TheQuarter Video Graphics Array (QVGA) is a common resolution for modernphone displays. The QVGA resolution is used in modern mobiles as this lowresolution mode requires less data storage capacity than other higher resolu-tions and offers more detail than the standard QCIF resolution (177 x 144)which was used in previous video studies for mobile [44]. This resolutionwas chosen for the experiment, as a wide range of mobile phones (Eg. HTC,Nokia, Sony Ericsson, iPhone) support this display resolution.

Chapter 3. Experimental Design 16
Video Frame Rate and Bit Rate
Frame rate is basically the rate at which the video system projects or displaysthe images (frames) per second. It is measured in frames per second (fps).The frame rate used for this experiment is 30 fps as this is commonly used invarious video assessment related studies [44] and also supported by variousmodern mobile phones.
The bit rate basically refers to the amount of information (number ofbits) that the video will process in a given period of time. The bit ratechosen for the experimentation is 768 Kbps. This value is commonly used formobile devices and also commonly used in various video assessment studiesfor mobile [44].
Video Sequence Duration
As per ITU-T [16], the length of each video sequence used for our experimentis between eight and ten seconds. According to [34], short sequences areconsidered more stable in terms of spatio-temporal properties and also lead tovalid and consistent results. The results obtained are termed to be consistentas the subjects rate the video based on its quality and do not get immersedin the content. As for longer videos there is a chance that users focus mayshift towards the content rather than video quality.
Video Codec
The video sequences for the experiment have been encoded using FFmpeg[50] (available in APPENDIX A), which is a cross platform tool.
H.264
The video sequences are encoded using H.264 baseline profile, level 1.3 in ourthesis work. As these settings are recommended for mobile video [44] [5].FFmpeg has been used for this purpose. The video parameters as shown inTable 3.2 are used to encode the video.
Xvid
The video sequences are encoded using the Xvid simple profile in our thesiswork. FFmpeg has been used for this purpose. The video parameters asshown in Table 3.3 are used to encode the video.
WebM/VP8
The video sequences are encoded using VP8 codec using FFmpeg. The videoparameters as shown in Table 3.4 are used to encode the video.
All the below encoding parameters have been kept constant for the wholeexperimentation.

Chapter 3. Experimental Design 17
Table 3.2: Video Parameters for H.264
Video Sequences Crew, Foreman, News, Football, Hall-Monitor.
Video Codec H.264/AVC baseline profile, level 1.3
Resolution QVGA (320x240)
Bit rate 768kbps
Frame-rate 30fps
Aspect Ratio 4:3
Container MP4
Encoder FFmpeg (libx264)
Table 3.3: Video Parameters for Xvid
Video Sequences Crew, Foreman, News, Football, Hall-Monitor.
Video Codec Xvid simple profile
Resolution QVGA (320x240)
Bit rate 768kbps
Frame-rate 30fps
Aspect Ratio 4:3
Container MP4
Encoder FFmpeg (libxvid)
Table 3.4: Video Parameters for WebM
Video Sequences Crew, Foreman, News, Football, Hall-Monitor.
Video Codec WebM/VP8
Resolution QVGA (320x240)
Bit rate 768kbps
Frame-rate 30fps
Aspect Ratio 4:3
Container MP4
Encoder FFmpeg (libvpx)

Chapter 3. Experimental Design 18
3.2 Network Emulation
The network emulation is useful in scenarios where the traffic needs to beshaped by delay, packet loss and packet reordering. Network emulation isused to eliminate certain factors found in real networks such as, traffic in-terference and variation in load. Generally, an emulated network is used bythe research community in performance measurement studies because of itsfeatures like reproducibility and controllability. The traffic shapers are usedto emulate the network by varying parameters like delay, jitter and packetloss.
The NetEm traffic shaper has been chosen in our thesis for network emu-lation, to vary performance parameters like delay variation and packet loss.NetEm belongs to Traffic Control (TC) bandwidth provisioning package oflinux [13]. In [14], [15] authors have assessed the performance of NetEm tobe more reliable than other traffic shapers namely NIST Net and KauNet.NetEm uses FIFO Queuing Mechanism to make decision policy of packets tobe sent based on given input parameters. The input parameters are giventhrough a command line interface tool tc traffic control.
3.3 Packet Loss and Delay Variation
The packet loss refers to the number of packets that fail to reach the destina-tion when being transmitted across the network. Packet loss has noticeableeffects in various applications such as video streaming and video conferenc-ing. The packet loss is basically calculated in terms of percentage (%) ofpackets lost from the overall transmitted packets.
The packet loss values used in our thesis are 0%, 2.5%, 5%, 10%, and 15%.In general, 1% packet loss means for every hundred packets transmitted therewill be a drop of one packet. And also a similar range of values has beenused in various studies [44], [51].
Delay variation is commonly used due to its inherent variability in ar-rival times of individual packets. The packets arrive to the destination withrandom time distortion where the time between packets at destination variesfrom that of time between packets at source [44]. The delay and delay varia-tion values are expressed as D ±Δ D, where D is the fixed delay and ΔD isthe variable delay. The ITU-T G.114 [52] suggests that the delay must notexceed the 150ms limit for one-way transmission time. The above mentionedstudy defines the use of 150ms as a good and acceptable delay value.
The fixed delay (D) and variable delay (Δ D) values considered for ourthesis are 150ms and {±50ms, ±90ms, ±110ms, ±130ms, ±150ms} respec-tively.
In our thesis the shaping values were chosen from the literature studyand laboratory testing. Initially, tests were performed for various values
Chapter 3. Experimental Design 19
of packet loss and delay variation. Finally, values where the MOS ratingschanged significantly were selected for the experimentation.
3.4 Experiment Test bed
This section describes the experimental scenarios used in our thesis and alsoelucidates the technical components of the setup along with the experimentalprocedure.
3.4.1 Wired Network Scenario
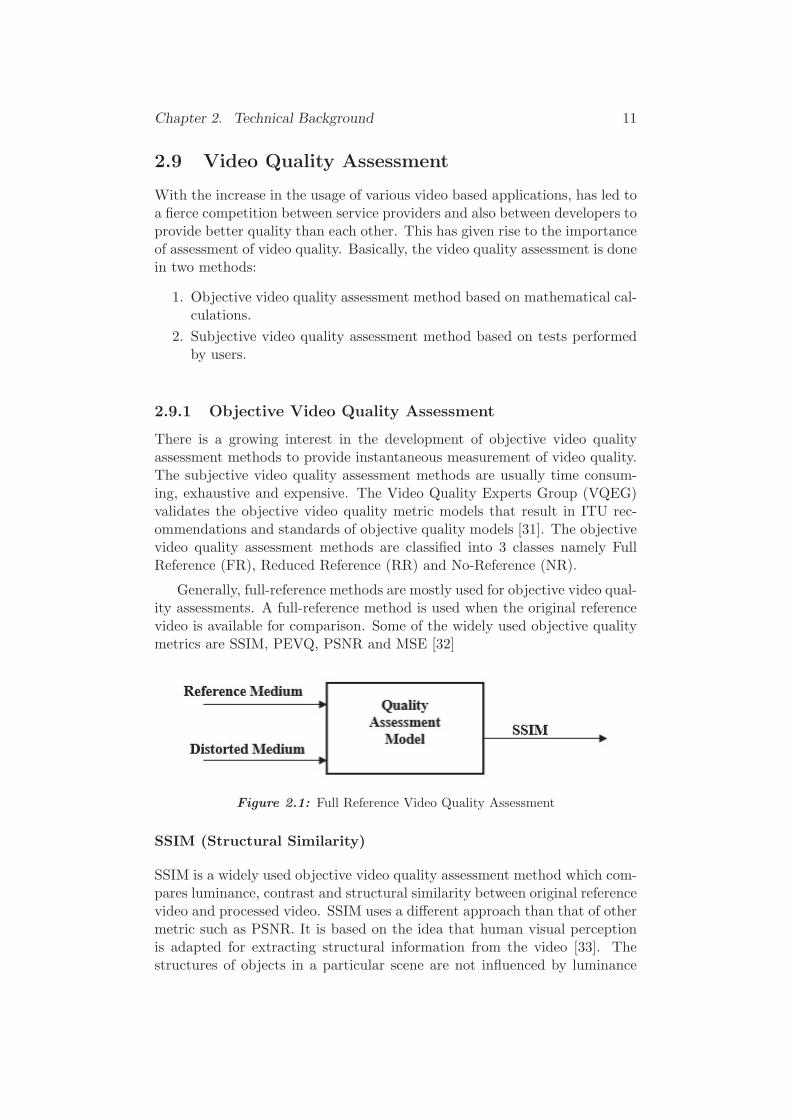
The wired experimental test bed depicted in Figure 3.1 is used to carry outthe experiments. It consists of two Flumotion streaming servers (SA andSB), two traffic shapers (TS A and TS B) and two client systems (CA andCB). All these components are connected to the MArC via Measurementpoint (MP). All the systems are connected as shown in the below test bed.Two independent full duplex test networks have been used in the wired setupwhere each network consists of a set of server, traffic shaper, client and MP.The two independent test networks are illustrated using different color codingin Figure 3.1. The traffic shapers acts as bridges between server and clientin their respective networks.
The test network also includes Measurement points (MP) equipped withDAG 3.6E cards which captures the packets using wiretaps as shown in thetest bed. The MArC is used to control the measurements and the test networkis controlled by a controller (XPS) as shown in Figure 3.1.
Figure 3.1: Wired Experimental Test-bed

Chapter 3. Experimental Design 20
The technical specifications of the components of the wired experimentaltest bed are shown in the following Table 3.5.
Table 3.5: Technical specifications (Wired Setup)
Devices Technical Specifications Description
Server A HP MicroTower AMD AthlonX64, CPU @ 2.7GHz,2048MBDDR3 SDRAM, Ubuntu-12.04
Flumotion VoD Server
Server B HP MicroTower AMD AthlonX64, CPU @ 2.7GHz,2048MBDDR3 SDRAM, Ubuntu-12.04
Flumotion VoD Server
Shaper A Dell Optiplex, Pentium-IVProcessor, Ubuntu-12.04
NetEm
Shaper B Dell Optiplex, Pentium-IVProcessor, Ubuntu-12.04
NetEm
Client A HP MicroTower AMD AthlonX64, CPU @ 2.7GHz,2048MBDDR3 SDRAM, Ubuntu-12.04
VLC-2.0.6 Client
Client B HP MicroTower AMD AthlonX64, CPU @ 2.7GHz,2048MBDDR3 SDRAM, Ubuntu-12.04
VLC-2.0.6 Client
3.4.2 Wireless Network Scenario
The wireless experimental test bed depicted in Figure 3.1 is used to carry outthe experiments. It consists of a Flumotion streaming server (S), a NetEmtraffic shaper (TS), a VLC client (C) and RF shielded test enclosure alongwith WLAN AP. All these components of test bed are connected to the MArCvia measurement point as shown in Figure 3.2. A full duplex WLAN testnetwork has been established using a WLAN AP (Access Point). The WLANAP is enclosed in an RF shielded test enclosure in order to avoid externalinterference in the network. The traffic shaper acts as a bridge between serverand client, where the client system receives the videos streamed from servervia the shaper in a wireless network.
Similar to wired scenario, the test network consists of Measurement point(MP) equipped with DAG 3.6E cards which captures the packets using wire-taps as shown in the test bed. The MArC is used to control the Measurementsand the whole test network is controlled by a controller (XPS) as shown inFigure 3.2.

Chapter 3. Experimental Design 21
Figure 3.2: Wireless Experimental Test-bed
The technical specifications of the components of the wireless experimen-tal test bed are shown in the following Table 3.6.
Table 3.6: Technical specifications (Wireless Setup)
Devices Technical Specification Description
Server HP MicroTower AMD AthlonX64, CPU @ 2.7GHz,2048MBDDR3 SDRAM, Ubuntu-12.04
Flumotion VoDServer
Shaper Dell Optiplex, Pentium-IVProcessor, Ubuntu-12.04
NetEm
Client HP MicroTower AMD AthlonX64, CPU @ 2.7GHz,2048MBDDR3 SDRAM, Ubuntu-12.04
VLC-2.0.6 Client
RF ShieldedTest Enclosure
Ramsey STE3000FAV It was used toavoid external sig-nal interference.
WLAN D-link DAP-1522, Firmware1.21
Wireless Accesspoint.
USB NetworkAdapter
D-link DWA-160, Firmwarev1.70(E)
Used to connectthe Access pointand host

Chapter 3. Experimental Design 22
3.4.3 Technical Components
Further description of the main technical components of the experiment iselucidated in this section.
Measurement Point
Measurement point (MP) is used to passively capture the packets from theoutput of the traffic shaper (TS) to the Client (C). It is a Linux based systemequipped with Endace (Digital Acquisition and Generation) DAG 3.6E cards.The MP captures the traffic passively with the help of wiretaps. Here, thewiretaps tap the packets, duplicates it and passes it to MP. The filtering oftraffic is done according to the filter rules given by the Measurement AreaController (MArC). The DAG cards are synchronized with respect to timeusing NTP (Network Time Protocol) server and Global Positioning System(GPS) to achieve time stamp accuracy of 60ns [53].
MArC
MArC (Measurement Area Controller) is the main controller of the measure-ment area which controls the Measurement points (MPs). It controls theMPs by applying a set of filtering rules, according to which the tapping orcapturing of traffic is done [54].
Consumer
Consumer is a system that runs on a Linux based environment. It stores theduplicated packets captured by the DAG cards. It consists of Libcaputilswhich is used to convert the binary traces obtained from measuring pointinto text format. In our experiment, the role of the consumer is to copy theobtained traces from local storage to network storage (Database).
Server
Flumotion is an open-source based streaming server. It is a streaming plat-form that is based on the multimedia framework GStreamer [55]. It supportsall the leading audio and video codecs such as H.264, VP8, Xvid, AAC, OggTheora, Ogg Vorbis and WMA. The Flumotion server offers good perfor-mance, stability and quality. The Flumotion server consists of two compo-nents, namely manager and worker. The user interface connects the managerwhich controls the workers.
In our thesis Flumotion streaming server (version 0.10.1) has been chosento be used as a video-on-demand (VoD) server. The VoD server streams thecontent (video files) present on the hard drive and the client can request thecontent from the streaming server any time. The server is installed on aLinux based operating system (Ubuntu 12.04LTS), which is an HP desktopwith AMD CPU @ 2.7GHz 2048 MB DDR3 SDRAM.

Chapter 3. Experimental Design 23
Shaper
NetEm traffic shaper has been used to emulate the required network condi-tions. It has been used to introduce desired packet loss and delay variationparameters in the network. The following tc commands have been used tocreate the required network conditions.
1. Packet Loss
# tc qdisc add dev ethW root netem loss X%# tc qdisc change dev ethW root netem loss X%where W is the Ethernet card number and X is the desired packet lossvalue in %.
2. Packet Delay Variation
# tc qdisc add dev ethW root netem delay Yms Zms# tc qdisc change dev ethW root netem delay Yms Zmswhere W is the Ethernet card number, Y is the fixed delay values in[ms] and Z is the delay variation in [ms].
The NetEm traffic shaper runs on a Linux based operating system (Ubuntu12.04LTS), which is a Dell optiplex desktop with Pentium IV processor. Thepacket loss values used for the experiment are 0%, 2.5%, 5%, 10% and 15%respectively, and the delay (D) and delay variation (ΔD) values are D ±ΔD= 150ms ± {50ms, 90ms, 110ms, 130ms, 150ms}.
Client
The client is a Linux based desktop computer which runs on Ubuntu 12.04operating system. The VLC media player version 2.0.6 is installed on theclient side which plays the streamed videos and saves the video files to thenetwork storage.
The Jitter buffer of VLC player is set to zero value to see the immediateeffect of network impairments [44]. In our thesis, VLC player is used toreceive HTTP/TCP stream from the server and to save the received videosequences to the local database. The VLC player does not support packetreordering, if the packets arrive late, they will be discarded. VLC player hasbeen used through command line interface to save the streamed videos.
3.4.4 Experimental Procedure
The emulated networks are established as shown in Figure 3.1 and Figure3.2 respectively to conduct the experiments in a controlled environment.The VoD streaming server (Flumotion) is responsible to stream the encodedvideos via HTTP/TCP connection to the client (VLC player). The video

Chapter 3. Experimental Design 24
sequences are streamed from the server to the client via traffic shaper whichis placed between server and client. The traffic shaper (Netem) is used tocontrol the packet loss and variable delay shaping of traffic from server toclient in the network. It introduces the desired packet loss and delay vari-ation values in the network. The video files received at the client side aresaved in the network storage.
Distributed Passive Measurement Infrastructure (DPMI) [53] is used,which is connected to the test network. During the experiment, the net-work traffic between Traffic shaper and the client is passively captured bythe measurement points using wiretaps. The packet traces tapped by themeasurement point are stored into the network storage.
A vast series of experiments were conducted to investigate the video per-formance through an automated setup (available in APPENDIX B) whichwas controlled by the controller which ran on Perl control script. In theexperimentation, for each shaping parameter the video has been streamedfor a series of forty times in order to achieve acceptable data. The streamedvideos (with artifacts) are saved on the client host and corresponding networktraces are captured at MP. The different videos collected at the client sidefor varying packet loss and delay variation are video sequences for differentvideo codecs. The videos collected at the client side are further assessed usingobjective video quality assessment and subjective video quality assessmentas described in section 3.6. Apart from objective and subjective assessment,the network level analysis is done for the selected videos. The respectivestored network traces were selected and analyzed using a network analysistool namely Captcp tool [56].
3.5 Data Collection
A limited number of videos were selected from the vast dataset obtained atthe client side. The selection of videos was done on the basis of SSIM valuesobtained for the whole video dataset. Firstly, SSIM was calculated for eachand every video. Then one video was stelected from the set of forty videosfor each shaping parameter. The criterion used was that the SSIM value ofthe video to be selected must be near or equal to the average SSIM of a setof 40 videos (for each shaping value). Thus, the selected videos were used forsubjective evaluation where these selected video set has been shown to theusers to obtain the respective MOS ratings of the videos.
3.6 Assessment Methodology
This section presents the assessment methodology used in our thesis to in-vestigate the performance of the video codecs. The assessment methodologyis performed according to three different perspectives as shown below:

Chapter 3. Experimental Design 25
1. Objective video quality assessment
2. Subjective video quality assessment
3. Network level analysis
Objective Video Quality Assessment
Though subjective video assessment is a reliable means of video quality eval-uation based on the perceived quality, they lack in terms of time consump-tion and expenditure. Thus, objective video quality assessment methods areused. The Objective video assessment method is based on mathematical cal-culations. These metrics produce the video quality scores that reflect theperceived video quality. These objective values are compared to the degreeof closeness with the subjective user perceptions.
In our thesis SSIM (Structural similarity) metric has been chosen for theobjective assessment of video quality. SSIM is based on the Human VisualSystem (HVS), which measures the structural similarity at frame level. SSIMprediction is known for its degree of closeness with respect to subjective videoquality, as it follows a different approach when compared to other objectivemetrics. SSIM considers the quality degradations in the frames dependingon the structural similarity of the two compared frames.
In our thesis, Evalvid2.7 has been used for objective video quality assess-ment. Evalvid is a framework and a tool-set used for assessment of quality ofvideos transmitted over a network [57]. It is a tool developed specifically forresearchers who want to evaluate the video quality. It supports various videocodecs such as H.263, MPEG-4, H.264, Xvid and VP8. It supports standardmetrics such as PSNR and SSIM.
Evalvid has been used to generate the SSIM Values for the video sequencescollected from the client. The Generated SSIM ratings for the videos are usedfor the analysis of video quality. The SSIM Scores obtained are correlatedwith subjective MOS ratings.
As neither Objective method nor subjective method alone can give acomplete picture of video quality, thus both the methods are necessary to beincluded in the video assessment process in order to get reliable results [58].
Subjective Video Quality Assessment
The subjective video quality assessment is used to serve as a benchmarkfor the performance evaluation of objective video quality assessment. Theperceptual video quality predicted by the objective assessment is comparedfor the degree of closeness with the perceptual quality obtained from thesubjective video quality assessment.
As per the ITU-T recommendations, we have used the ACR 5-grade scale(ACR5). ACR is the method where the test sequences are presented one at

Chapter 3. Experimental Design 26
a time as shown in Figure 3.3. It uses a 5-grade Scale where each video israted on a scale of 5 (1- Bad, 2-Poor, 3-Fair, 4-Good, 5- Excellent). Also in[18], the authors have rated ACR5 method as the most suitable method forquality assessment of mobile video services.
Figure 3.3: ACR 5 Method
The subjective quality assessment test has been performed for the mobilevideos. The subjective quality assessment sessions were conducted in theUser perception Lab conforming to the specifications of the ITU-T [59] atthe premises of Blekinge Institute of Technology, Karlskrona, Sweden. Theuser study was conducted using 39 participants of which 65% were maleand 35% were female. The number of subjects were chosen based on therecommendations of ITU-T [16], according to which the sample size is notrecommended to be more than 40 members. Also, author in [60] asserts touse a sample of 25-30 individuals for statistical purpose.
As per the recommendations of ITU-T, the general viewing conditionswere strictly regulated. The participants were seated with a viewing distanceof 1-8 H in a room with background illumination of 20 lux. All the testconditions as specified by [16] were strictly maintained.
A subjective video quality assessment tool was developed for our thesisas shown in Figure 3.4 and 3.5. The tool was designed to have a graphicalinterface (Front end) to the users using which the users could view the videosequences and give their desired rating for the video quality. When the userclicks on the opinion score and submits the rating, the corresponding valuesare automatically stored in the database (Back end). The collected valuesfrom the database were used for the subjective assessment of the videos. Thetool was specifically designed adhering to the recommendations of ITU-T[16], to implement ACR 5 subjective assessment method for videos.
The assessment session was divided into two phases, where initially theparticipants were given a brief introduction of the subjective assessment testand usage of the subjective assessment tool. Then they were asked to fill theonline questionnaire at the beginning of assessment session and then in thenext phase the videos were shown to users where they would rate the videosbased on their perception of the video quality on a 5-grade scale.

Chapter 3. Experimental Design 27
Finally, the perceptual video quality ratings obtained from the subjectswere averaged to obtain the Mean Opinion Score (MOS).
Figure 3.4: MOS Questionaire Screen Shot

Chapter 3. Experimental Design 28
Figure 3.5: MOS-Tool Screen Shot
Network Level Analysis:
In addition to objective level and subjective level assessment, we have ana-lyzed the traffic over network level to calculate throughput and also to verifythe applied delay variation and packet loss values. The measurement pointwith the help of wiretaps is used to passively capture the packets from theclient-server communication on the network level. These network traces arestored locally on the consumer system with a cap format. The network leveltraces (cap files) obtained from the MP (Measurement Point) for selectedvideos are converted into Pcap, using Cap2pcap and those obtained Pcapfiles are analyzed using a network analysis tool, namely Captcp (APPENDIXD). Captcp is an extensive TCP based network protocol analyzer.
In the network level analysis, the application throughput is calculatedand analyzed. The analysis is done for all the three video codecs in wirelessnetwork scenario. This throughput comparison gives us insights on how thevideo codecs are performing at network level in wireless network scenarios.

Chapter 4
RESULTS AND DISCUSSION
This chapter explains the detailed description of the obtained results. Theseresults are based on the experiments conducted as described in the previouschapter. The collected data from subjective and objective video quality as-sessments are investigated for the effect of packet loss and delay variation.
4.1 Subjective Video Quality Assessment
The only reliable method to assess the video quality as perceived by a humanobserver is to ask human subjects for their opinion, which is termed as Sub-jective Video Quality Assessment (VQA). Subjective VQA is impractical formost applications due to the human involvement in the process. However,subjective VQA studies provide valuable data to assess the performance ofobjective or automatic methods of quality assessment. The Subjective VQAis used to compare the visual impression of video sequences based on theperception of users. The results in the following sections show the subjectivevideo quality of three codecs in wired and wireless networks.
As per the ITU-T recommendations, the MOS user interface requiredfor the thesis work has been developed on the Windows platform using C#.NET (available in APPENDIX E). Using this interface, the videos selectedfor user perception tests based on the SSIM values were shown to the usersin a perception lab at BTH, Karlskrona. The respective user ratings werecollected and stored in the database. To ensure perfect playback, we haveused high performance systems with low applications and services installed,to avoid latencies due to slow access to Hard Disk.
The video sequences were rated on a 5 grade scale Excellent (5), Good(4), Fair (3), Poor (2) and Bad (1). Each video was assessed by 39 humansubjects, but only data of 33 subjects were used. Since, Six human subjectswithin the original sample had to be discarded due to insufficient compliancewith the test procedure. Also, some amongst the six discarded users gavestrange ratings, such as least MOS ratings for original videos and highestMOS ratings for videos with high packet loss and packet delay variation
29

Chapter 4. RESULTS AND DISCUSSION 30
values. The average of collected MOS ratings was calculated for each videoand the Mean MOS values of five videos (Crew, Foreman, News, Footballand Hall-Monitor) for each codec, at each shaping value is calculated andthe resulting graphs are plotted.
Based on the recommendation BT. 500 subjective assessment in the qual-ity of television pictures, of the International Telecommunications Union Ra-dio communications Sector (ITU-R) [59], the mean was calculated. The meanis defined as:
Xjk =1
N
N∑
i=1
Xijk (4.1)
4.1.1 Comparison of H.264, Xvid and WebM/VP8 in Wiredand Wireless Networks
Packet Loss
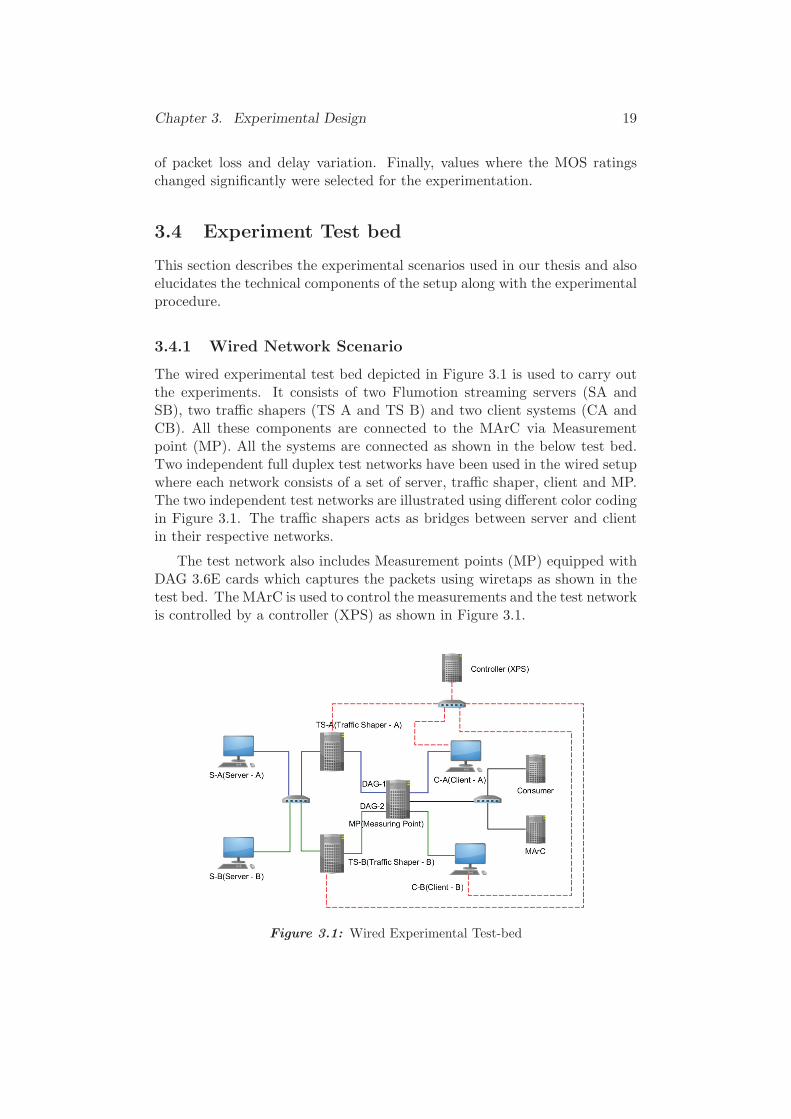
For all the videos, subjects feel that videos have better quality at low packetloss values. It is observed that as the packet loss value increases, the qualityof video degrades steeply. The videos streamed without artifacts was gradedwith a MOS rating that lies between excellent (5) and good (4). This showsthat the viewers in some cases are reluctant to score the videos as excellent.This behavior was also found in other studies [61].
Figure 4.1 represents the behavior of H.264, Xvid and WebM with re-spect to different packet loss values in the wired network scenario and Figure4.2 represents the behavior of H.264, Xvid and WebM with respect to differ-ent packet loss values in wireless network scenario. For wired and wirelessnetworks, the average MOS ratings of three codecs are plotted against re-spective packet loss values. In wired and wireless network scenarios, it canbe observed that at 0% and 2.5% packet loss, user ratings for all the videosare high as there are no human perceptible artifacts in the videos. At 5%and 10% packet loss values the user MOS ratings for H.264 are higher thanWebM and Xvid. But at 15% packet loss value, WebM has been rated higherthan H.264 and Xvid. And for 5%, 10% and 15% packet loss values, Xvidhas the least MOS rating when compared to WebM and H.264. These obser-vations reveal that, subjects felt H.264 encoded videos had better quality atlower packet loss values and WebM encoded videos had better resistance forhigher packet loss values. However the Xvid encoded videos also had similarquality in comparison with H.264 and WebM for low packet loss values, butthese videos are feeble for moderate and high network disturbances.
Chapter 4. RESULTS AND DISCUSSION 31
Figure 4.1: Average MOS Ratings for Packet Loss in Wired Network

Chapter 4. RESULTS AND DISCUSSION 32
Figure 4.2: Average MOS Ratings for Packet Loss in Wireless Network
Packet Delay Variation
Figure 4.3 represents the behavior of H.264, Xvid and WebM/VP8 with re-spect to different packet delay variation values in the wired network scenarioand Figure 4.4 represents the behavior of H.264, Xvid and WebM/VP8 withrespect to different packet delay variation values in wireless network scenario.It can be observed that at 150±50 and 150±90, H.264 has MOS ratings inbetween good (4) and fair (3) whereas, WebM and Xvid are in between fair(3) and bad (2). At 150±110, 150±130 and 150±150 the WebM has bet-ter MOS ratings than H.264 and Xvid. This shows a similar trend to thatof packet loss where the subjects feel that H.264 encoded videos has betterquality at lower packet delay variation values and WebM encoded videos hasbetter resistance for higher packet delay variation values. However, the Xvidencoded videos are feeble to network disturbances.

Chapter 4. RESULTS AND DISCUSSION 33
Figure 4.3: Average MOS Ratings for Packet Delay Variation in Wired Network
Figure 4.4: Average MOS Ratings for Packet Delay Variation in Wireless Network

Chapter 4. RESULTS AND DISCUSSION 34
4.1.2 Overall Comparison of Video Codec Performance inWired and Wireless Networks
The MOS for the packet loss and delay variation was plotted for Wiredand Wireless networks in Figure 4.5 and Figure 4.6 respectively. From thesegraphs, we can notice that the results are almost similar for wired and wirelessnetworks. The difference found is that the MOS ratings for videos streamed inwired network has a slightly higher MOS rating than that of videos streamedin a wireless network. Also, we can notice that the difference between wiredMOS ratings and corresponding wireless MOS ratings are almost same at0% and 2.5% packet loss, as there are no human perceptible artifacts in thestreamed videos.
Figure 4.5: Network Based Comparison for Packet Loss with respective MOSRatings

Chapter 4. RESULTS AND DISCUSSION 35
Figure 4.6: Network Based Comparison for Packet Delay Variation with respectiveMOS Ratings
4.2 Objective Video Quality Assessment
The performance of a perceptual video quality metric depends on its correla-tion with subjective results. The objective assessment is used for comparingthe degree of closeness with the perceptual quality obtained from subjectivemethods. The SSIM is used as a performance metric for objective video qual-ity assessment. SSIM index or structural similarity index is a popular methodthat is used for measuring the similarity between two still images [33], [62]and extended to video in [63]. The SSIM index was applied frame-by-frameon the luminance component of the video and the overall SSIM index for thevideo was computed as the average of the frame level quality scores. TheEvalvid [64] tool has been used to get the SSIM index values (provided inAPPENDIX C) of each frame in the video.

Chapter 4. RESULTS AND DISCUSSION 36
4.2.1 Comparison of H.264, Xvid and WebM/VP8 in Wiredand Wireless Network
Packet Loss
Figure 4.7 represents the behavior of H.264, Xvid and WebM/VP8 with re-spect to different packet loss values in the wired network scenario and Figure4.8 represents the behavior of H.264, Xvid and WebM/VP8 with respectto different packet loss values in wireless network scenario. For wired andwireless networks streamed videos, the average SSIM value of three codecsis plotted against respective packet loss values. In wired network it can beobserved that at 0% and 2.5% packet loss, the SSIM values for all the videosare high i.e., 1 as there are no artifacts in the videos. But at 2.5% packet lossin wireless network, there is a slight degradation in the SSIM value. At 5%packet loss values the SSIM value of H.264 is higher than WebM and Xvid.But at 10% and 15% packet loss values, WebM has higher SSIM value thanH.264 and Xvid. And for 5%, 10% and 15% packet loss values, Xvid hasthe least SSIM value when compared to WebM and H.264. We noticed thatSSIM of WebM was changed very slightly as it has single stuck with changein duration.
Figure 4.7: SSIM for Packet Loss in Wired Network

Chapter 4. RESULTS AND DISCUSSION 37
Figure 4.8: SSIM for Packet Loss in Wireless Network
Packet Delay Variation
Figure 4.9 and 4.10 shows the plotted results of SSIM for delay variation inwired and wireless network, respectively. In wired and wireless networks, at150±50ms H.264 and WebM have higher value than Xvid. As the distortionin the network increases, the WebM has higher SSIM value than H.264 andXvid.

Chapter 4. RESULTS AND DISCUSSION 38
Figure 4.9: SSIM for Packet Delay Variation in Wired Network
Figure 4.10: SSIM for Packet Delay Variation in Wireless Network

Chapter 4. RESULTS AND DISCUSSION 39
4.2.2 Overall Comparison of Video Codec Performance inWired and Wireless Networks
Packet Loss
The SSIM value for the packet loss and delay variation was plotted for Wiredand Wireless networks in Figure 4.11 and Figure 4.12 respectively. Fromthese graphs we can notice that the results are almost similar for wired andwireless networks. The dierence found is that the SSIM ratings for videosstreamed in wired network has a slightly higher rating than that of videosstreamed in wireless network. These graphs reports that, behavior of resultsobtained from the MOS ratings (Subjective) are similar to the behavior ofresults from the SSIM values (Objective), except at wireless packet loss 2.5%,delay variation 150±50ms and 150±90ms. The dissimilarity for these valuesis because the SSIM was calculated at frame level by a machine where everydistortion can be notified, but coming to MOS the videos which are movingpictures, were rated by humans where some distortion cannot be notified. Asthose minor distortions are not perceptible to the human eye and also theperception of each human is undefined.
Figure 4.11: SSIM based comparison for Packet Loss in Wired and Wireless Net-work

Chapter 4. RESULTS AND DISCUSSION 40
Figure 4.12: SSIM based comparison for Packet Delay Variation in Wired andWireless Network
4.3 Network Trace Analysis using Application Through-put
The application throughput or goodput is the rate of successful bits receivedat application level. During the experiment we captured the network pack-ets with the help of measuring point as described in previous chapter. Wehave then analyzed these packets with captcp tool to get the applicationthroughput.
Figure 4.13 and 4.14 represents the behavior of application throughput ofthe network for videos streamed with respect to different packet loss and delayvariation values in wireless network. From the graphs we can observe that asthe packet loss or delay variation values increases the throughput decreases,but the behavior of throughput was not coordinated with the behavior ofsubjective or objective video quality assessment results. The reason is, Ingeneral low throughput resembles low network quality due to missing packetsbut in video perception the conventional network metric such as throughputmay not judge the quality of video in a network, because in a network thequality of a video depends on many factors such as coding rate, type of codecand content of video [65], [66] and rather than the number of frames missed,

Chapter 4. RESULTS AND DISCUSSION 41
which type of frame was missed i.e., an I-frame or P-frame or B-frame hasmore effect on the video quality.
Figure 4.13: Application throughput for Packet Loss in Wireless Network

Chapter 4. RESULTS AND DISCUSSION 42
Figure 4.14: Application throughput for Packet Delay Variation in Wireless Net-work

Chapter 5
CONCLUSIONS
5.1 Conclusions
In this thesis work we investigated the video quality of experience of videosencoded with H.264, WebM and Xvid. The experimental results of our thesiswork show the performance analysis of H.264, Xvid and WebM/VP8 encodedvideo sequences based on subjective assessment and objective assessmentmethodologies.
An emulated network setup was created in order to obtain streamed videosequences for video quality assessment. The video sequences were introducedwith varying packet loss and delay variation values in the experimentation.The videos thus obtained were evaluated using subjective and objective as-sessment methodology. In subjective video quality assessment, the user expe-rience survey has been performed. In the survey, the users perception of thevideo quality with respect to video impairments were collected. The collectedperceptual video quality ratings from users were averaged to obtain the MeanOpinion Score (MOS). In objective quality assessment, the SSIM (StructuralSimilarity) performance metric has been used to calculate the video qualityscores. The SSIM video quality scores have been generated using Evalvidtool. The obtained video quality scores are compared with that of subjectiveMOS values to get an understanding on the video quality.
Our first research question deals with the impact of packet loss and delayvariation on the user perceived quality of the videos encoded using H.264,Xvid and WebM. This research question was divided into three sub-questions.
The research question RQ1.1, deals with how the user perceives the videoquality with respect to packet loss and delay variation for the videos encodedusing the Xvid video codec. We can observe that as the packet loss valuesincrease the user perception ratings decreases. In case of low packet lossvalues Xvid is rated between good and excellent, As the packet loss increases,Xvid is given least ratings when compared to that of H.264 and WebM/VP8.Where as in the case of delay variation, Xvid is rated between fair and goodfor low delay variations and for higher delay variation the ratings decrease
43

Chapter 5. CONCLUSIONS 44
too drastically when compared with the other two codecs.
The research question RQ1.2, sought to understand how users perceivethe video quality in the presence of packet loss and delay variation for videosencoded using H.264. The subjective ratings for H.264 varies significantly.H.264 performs better for lower loss values when compared to higher packetloss values. H.264 also has been rated between good and excellent for lowerpacket loss values, but as the packet loss value increases the user ratingsdecreases but are higher than that of Xvid. In the case of delay variationH.264 gets higher ratings for lower values of delay variation, when comparedto other two codecs. And for higher values of delay variation, H.264 perfor-mance is higher than that of Xvid but is lower than WebM/VP8.
The research question RQ1.3, sought to understand how users perceivethe video quality for WebM/VP8 encoded video in the presence of packet lossand delay variation. For low packet loss values, WebM/VP8 performs similarto that of other two codecs, but for higher packet loss values WebM/VP8comparatively performs best amongst the three codecs.
Our second research question deals with the impact of packet loss anddelay variation for streamed videos in two different networks. This researchquestion, sought to understand how the user perceives the quality of encodedvideos that are streamed over wired network and wireless network. The userperception ratings for videos that were streamed over wired network weregiven higher ratings than that of wireless network for higher packet loss anddelay variation values. Whereas, for lower packet loss and delay variationvalues, wired network performed similar to that of wireless network.
Apart from subjective results, the results obtained from the objective as-sessment were used to compare the degree of closeness with the subjectiveresults. The results obtained from the objective assessment were mostly sim-ilar to that of subjective results. The findings from our thesis work revealthat H.264 exhibits better performance for lower values of delay variationand WebM performs better than other two codecs at higher values of de-lay variation. Whereas for low packet loss values the three codecs showedsimilar performance. And as the packet loss value increased, H.264 initiallyshowed better performance than other two. But at higher values of packetloss, WebM/VP8 showed better performance than the other two codecs. Fur-thermore, our findings provide support that video codecs also have an impacton Quality of Experience.
5.2 Future Work
Further research needs to be done based on the comparison of GOP structuresof these video codecs. The comparison of video codecs can be extended todifferent video streaming protocols. The network based comparison of codecscan be extended to codecs such as H.265 and VP9.

Appendix
APPENDIX A
Encoding commands
H264ffmpeg -i <input.y4m> -vcodec libx264 -b:v 768000 -r 30 -profile:v baseline-level:v 1.3 -s 320X240 -aspect 4:3 -f output.mp4 <encoded.mp4>
Xvidffmpeg -i <input.y4m> -vcodec libxvid -b:v 768000 -r 30 -s 320X240 -aspect4:3 -f mp4 <output.mp4>
Webmffmpeg -i <input.y4m > -vcodec libvpx -b:v 768000 -r 30 -s 320X240 -aspect4:3 -f webm <output.webm>
45

Appendix 46
APPENDIX B
Perl script for VLC automation

Appendix 47
APPENDIX C
SSIM Commands

Appendix 48
APPENDIX D
Captcp Command
captcp statictis <file.pcap> > outputfile.txt

Appendix 49
APPENDIX E
.NET Application for User InterfaceThe MOS user interface required for the thesis work has been developed
on the Windows platform using C# .NET and the pre-compiled .NET codefor MOS user interface is available at
https://github.com/vipo12-raa12-100041/MOS-User_Interface-for-Windows/

Bibliography
[1] “Cisco Visual Networking Index: Forecast and Methodology,2012-2017 [Visual Networking Index (VNI)] - Cisco Systems.”http://www.cisco.com/en/US/solutions/collateral/ns341/
ns525/ns537/ns705/ns827/white_paper_c11-481360_ns827_
Networking_Solutions_White_Paper.html. [Online; Accessed:09-Nov-2013].
[2] “Cisco Visual Networking Index: Global Mobile Data Traffic ForecastUpdate, 2012-2017 - Cisco Systems,” [Online; Accessed: 18-Nov-2013].
[3] T. N. Minhas and M. Fiedler, “Quality of experience hourglass model,”in Computing, Management and Telecommunications (ComManTel),2013 International Conference on, pp. 87–92, IEEE, 2013.
[4] “H.264 : Advanced video coding for generic audiovisual services.”http://www.itu.int/rec/T-REC-H.264-201304-I/en. [Online; Ac-cessed: 23-Sep-2013].
[5] O. Nemcic, M. Vranjes, and S. Rimac-Drlje, “Comparison of h. 264/avcand mpeg-4 part 2 coded video,” in ELMAR, 2007, pp. 41–44, IEEE,2007.
[6] J. Bankoski and P. Wilkins, “Yaowu xu;,” technical overview of vp8,an open source video codec for the web,”,” in Multimedia and Expo(ICME), 2011 IEEE International Conference on, pp. 1–6.
[7] A. C. Begen, T. Akgul, and M. Baugher, “Watching video over the web:Part 1: Streaming protocols,” Internet Computing, IEEE, vol. 15, no. 2,pp. 54–63, 2011.
[8] “YouTube.” http://www.youtube.com/. [Online; Accessed: 06-Oct-2013].
[9] “Choose the Vimeo membership thats right for you.” http://www.
vimeo.com. [Online; Accessed: 14-Oct-2013].
[10] “Dailymotion.” http://www.dailymotion.com/. [Online; Accessed: 26-Oct-2013].
50

Bibliography 51
[11] J. Shaikh, M. Fiedler, D. Collange, P. Arlos, and T. N. Minhas, “In-ferring user-perceived performance of network by monitoring tcp inter-ruptions,” Network Protocols and Algorithms, vol. 4, no. 2, pp. 49–67,2012.
[12] R. K. Mok, E. W. Chan, and R. K. Chang, “Measuring the qualityof experience of http video streaming,” in Integrated Network Manage-ment (IM), 2011 IFIP/IEEE International Symposium on, pp. 485–492,IEEE, 2011.
[13] S. Hemminger et al., “Network emulation with netem,” in Linux ConfAu, pp. 18–23, Citeseer, 2005.
[14] T. N. Minhas, M. Fiedler, J. Shaikh, and P. Arlos, “Evaluation ofthroughput performance of traffic shapers,” inWireless Communicationsand Mobile Computing Conference (IWCMC), 2011 7th International,pp. 1596–1600, IEEE, 2011.
[15] J. Shaikh, T. N. Minhas, P. Arlos, and M. Fiedler, “Evaluation of delayperformance of traffic shapers,” in Security and Communication Net-works (IWSCN), 2010 2nd International Workshop on, pp. 1–8, IEEE,2010.
[16] P. ITU-T RECOMMENDATION, “Subjective video quality assessmentmethods for multimedia applications,” 1999.
[17] “Methods for subjective determination of transmission quality.”http://www.itu.int/rec/dologin_pub.asp?lang=e&id=T-REC-P.
800-199608-I!!PDF-E&type=items, 1996. [Online; Accessed: 13-Nov-2013].
[18] T. Tominaga, T. Hayashi, J. Okamoto, and A. Takahashi, “Performancecomparisons of subjective quality assessment methods for mobile video,”in Quality of Multimedia Experience (QoMEX), 2010 Second Interna-tional Workshop on, pp. 82–87, IEEE, 2010.
[19] “ITU-T FG IPTV Focus group on IPTV standardization: Def-inition of quality of experience (QoE).” http://ties.itu.
int/ftp/public/itu-t/fgiptv/readonly/PreviousMeetings/
20070122MountainView/il/T05-FG.IPTV-IL-0050-E.htm. [Online;Accessed: 06-Sep-2013].
[20] P. Le Callet, S. Moller, A. Perkis, et al., “Qualinet white paper ondefinitions of quality of experience,” European Network on Quality ofExperience in Multimedia Systems and Services (COST Action IC 1003),2012.

Bibliography 52
[21] H. J. Kim, D. G. Yun, H.-S. Kim, K. S. Cho, and S. G. Choi, “Qoe assess-ment model for video streaming service using qos parameters in wired-wireless network,” in Advanced Communication Technology (ICACT),2012 14th International Conference on, pp. 459–464, IEEE, 2012.
[22] K. J. Ma, R. Bartos, S. Bhatia, and R. Nair, “Mobile video deliverywith http,” Communications Magazine, IEEE, vol. 49, no. 4, pp. 166–175, 2011.
[23] P. Lambert, W. De Neve, P. De Neve, I. Moerman, P. Demeester, andR. Van de Walle, “Rate-distortion performance of h. 264/avc comparedto state-of-the-art video codecs,” Circuits and Systems for Video Tech-nology, IEEE Transactions on, vol. 16, no. 1, pp. 134–140, 2006.
[24] I. E. Richardson, H. 264 and MPEG-4 video compression: video codingfor next-generation multimedia. John Wiley & Sons, 2004.
[25] “Xvid.org: General Info .” http://www.xvid.org/General-Info.19.
0.html. [Online; Accessed: 09-Oct-2013].
[26] J. Lloret, M. Garcia, A. J. Ferrer, and M. Morant, “Hdtv compres-sion for storage and transmission over internet,” in Proceedings of the5th WSEAS international conference on Data networks, communicationsand computers, pp. 57–62, World Scientific and Engineering Academyand Society (WSEAS), 2006.
[27] R. Koenen, “Profiles and levels in mpeg-4: Approach and overview,”Signal Processing: Image Communication, vol. 15, no. 4, pp. 463–478,2000.
[28] C. Feller, J. Wuenschmann, T. Roll, and A. Rothermel, “The vp8video codec-overview and comparison to h. 264/avc,” in ConsumerElectronics-Berlin (ICCE-Berlin), 2011 IEEE International Conferenceon, pp. 57–61, IEEE, 2011.
[29] A. Biernacki and K. Tutschku, “Performance of http video streamingunder different network conditions,” Multimedia Tools and Applications,pp. 1–24, 2013.
[30] B. Wang, J. Kurose, P. Shenoy, and D. Towsley, “Multimedia streamingvia tcp: an analytic performance study,” in Proceedings of the 12th an-nual ACM international conference on Multimedia, pp. 908–915, ACM,2004.
[31] K. Brunnstrom, D. Hands, F. Speranza, and A. Webster, “Vqeg val-idation and itu standardization of objective perceptual video qualitymetrics [standards in a nutshell],” Signal Processing Magazine, IEEE,vol. 26, no. 3, pp. 96–101, 2009.

Bibliography 53
[32] S. Chikkerur, V. Sundaram, M. Reisslein, and L. J. Karam, “Objectivevideo quality assessment methods: A classification, review, and perfor-mance comparison,” Broadcasting, IEEE Transactions on, vol. 57, no. 2,pp. 165–182, 2011.
[33] Z. Wang, A. C. Bovik, H. R. Sheikh, and E. P. Simoncelli, “Image qualityassessment: from error visibility to structural similarity,” Image Process-ing, IEEE Transactions on, vol. 13, no. 4, pp. 600–612, 2004.
[34] P. Frohlich, S. Egger, R. Schatz, M. Muhlegger, K. Masuch, andB. Gardlo, “Qoe in 10 seconds: Are short video clip lengths sufficient forquality of experience assessment?,” in Quality of Multimedia Experience(QoMEX), 2012 Fourth International Workshop on, pp. 242–247, IEEE,2012.
[35] A. Perkis, S. Munkeby, and O. I. Hillestad, “A model for measuringquality of experience,” in Signal Processing Symposium, 2006. NORSIG2006. Proceedings of the 7th Nordic, pp. 198–201, IEEE, 2006.
[36] M. Fiedler, T. Hossfeld, and P. Tran-Gia, “A generic quantitative rela-tionship between quality of experience and quality of service,” Network,IEEE, vol. 24, no. 2, pp. 36–41, 2010.
[37] T. Hosfeld, M. Fiedler, and T. Zinner, “The qoe provisioning-delivery-hysteresis and its importance for service provisioning in the future in-ternet,” in Next Generation Internet (NGI), 2011 7th EURO-NGI Con-ference on, pp. 1–8, IEEE, 2011.
[38] S. Jumisko-Pyykko and J. Hakkinen, “Evaluation of subjective videoquality of mobile devices,” in Proceedings of the 13th annual ACM in-ternational conference on Multimedia, pp. 535–538, ACM, 2005.
[39] A. C. Dalal, A. K. Bouchard, S. Cantor, Y. Guo, and A. Johnson, “As-sessing qoe of on-demand tcp video streams in real time,” in Communi-cations (ICC), 2012 IEEE International Conference on, pp. 1165–1170,IEEE, 2012.
[40] Y. Yoon, M. Kim, S. Lee, B. Lee, S. J. Hyun, and K. Lee, “Perfor-mance analysis of h. 264/avc, h. 264/svc, and vp8 over ieee 802.11 wire-less networks,” in Computers and Communications (ISCC), 2012 IEEESymposium on, pp. 000151–000156, IEEE, 2012.
[41] P. Seeling, F. H. Fitzek, G. Ertli, A. Pulipaka, and M. Reisslein, “Videonetwork traffic and quality comparison of vp8 and h. 264 svc,” in Pro-ceedings of the 3rd workshop on Mobile video delivery, pp. 33–38, ACM,2010.
[42] Q. Dai and R. Lehnert, “Impact of packet loss on the perceived videoquality,” in Evolving Internet (INTERNET), 2010 Second InternationalConference on, pp. 206–209, IEEE, 2010.
Bibliography 54
[43] M. Venkataraman, M. Chatterjee, and S. Chattopadhyay, “Evaluat-ing quality of experience for streaming video in real time,” in GlobalTelecommunications Conference, 2009. GLOBECOM 2009. IEEE,pp. 1–6, IEEE, 2009.
[44] T. N. Minhas, O. Gonzalez Lagunas, P. Arlos, and M. Fiedler, “Mobilevideo sensitivity to packet loss and packet delay variation in terms ofqoe,” in Packet Video Workshop (PV), 2012 19th International, pp. 83–88, IEEE, 2012.
[45] P. Calyam, M. Sridharan, W. Mandrawa, and P. Schopis, “Performancemeasurement and analysis of h. 323 traffic,” in Passive and Active Net-work Measurement, pp. 137–146, Springer, 2004.
[46] S.-J. Kim, C.-B. Chae, and J.-S. Lee, “Quality perception of coding arti-facts and packet loss in networked video communications,” in GlobecomWorkshops (GC Wkshps), 2012 IEEE, pp. 1357–1361, IEEE, 2012.
[47] T. Minhas, M. Shahid, A. Rossholm, B. Lovstrom, H.-J. Zepernick, andM. Fiedler, “Assessment of the rating performance of itu-t recommendedvideo quality metrics in the context of video freezes,” in Telecommu-nication Networks and Applications Conference (ATNAC), 2013 Aus-tralasian, pp. 207–212, IEEE, 2013.
[48] T. N. Minhas and M. Fiedler, “Impact of disturbance locations on videoquality of experience,” Quality of Experience for Multimedia ContentSharing, EuroITV, 2011.
[49] F. De Simone, M. Tagliasacchi, M. Naccari, S. Tubaro, and T. Ebrahimi,“A h. 264/avc video database for the evaluation of quality metrics,” inAcoustics Speech and Signal Processing (ICASSP), 2010 IEEE Interna-tional Conference on, pp. 2430–2433, IEEE, 2010.
[50] “FFMPEG Documentation.” https://www.ffmpeg.org/
documentation.html. [Online; Accessed: 15-Sep-2013].
[51] T. N. Minhas, “Network impact on quality of experience of mobilevideo,” Blekinge Institute of Technology, 2012.
[52] I. Recommendation, “114, one-way transmission time,” InternationalTelecommunication Union, 1996.
[53] P. Arlos, M. Fiedler, and A. A. Nilsson, “A distributed passive mea-surement infrastructure,” in Passive and Active Network Measurement,pp. 215–227, Springer, 2005.
[54] P. Arlos, On the quality of computer network measurements. 2005.
[55] “Flumotion: open source streaming media server.” http://www.
flumotion.net/. [Online; Accessed: 16-Dec-2013].

Bibliography 55
[56] “CAPTCP - TCP Analyzer.” http://research.protocollabs.com/
captcp/index.html. [Online; Accessed: 18-Nov-2013].
[57] J. Klaue, B. Rathke, and A. Wolisz, “Evalvid–a framework for videotransmission and quality evaluation,” in Computer Performance Evalu-ation. Modelling Techniques and Tools, pp. 255–272, Springer, 2003.
[58] J. Bistrom, “Comparing video codec evaluation methods for handhelddigital tv,” in T-111.590 Research Seminar on Digital Media, 2005.
[59] I. Recommendation, “500-11, methodology for the subjective assessmentof the quality of television pictures,” International TelecommunicationUnion, Geneva, Switzerland, vol. 4, pp. 53–56, 2002.
[60] D. Howell, Statistical methods for psychology. Cengage Learning, 2012.
[61] M. H. Pinson, S. Wolf, and G. Cermak, “Hdtv subjective quality ofh. 264 vs. mpeg-2, with and without packet loss,” Broadcasting, IEEETransactions on, vol. 56, no. 1, pp. 86–91, 2010.
[62] Z. Wang and A. C. Bovik, “A universal image quality index,” SignalProcessing Letters, IEEE, vol. 9, no. 3, pp. 81–84, 2002.
[63] Z. Wang, L. Lu, and A. C. Bovik, “Video quality assessment based onstructural distortion measurement,” Signal processing: Image commu-nication, vol. 19, no. 2, pp. 121–132, 2004.
[64] V. R. Jonnalagadda and V. Musti, “Evaluation of video quality of ex-perience using evalvid,” Electrical Engineering, 2012.
[65] A. Salim and T. O’Farrell, “A novel strategy for data rate adaptationin ieee 802.11 g in the case of video streaming,” in Computer and Com-munication Engineering, 2008. ICCCE 2008. International Conferenceon, pp. 812–817, IEEE, 2008.
[66] R. MacKenzie, T. O’Farrell, and S. Abukharis, “Comparison of through-put with a perceived video quality metric as performance indicators ofstreamed video in ieee 802.11 g,”