Reflections on Using YouTube as an Archive from an African ...
Upload
khangminh22Category
view
1download
0
YouTube QoE Evaluation Tool for Android Wireless Terminals
Gerardo Gómez1, Lorenzo Hortigüela2, Quiliano Pérez2, Javier Lorca2, Raquel
García2, Mari Carmen Aguayo-Torres1
1Department of Communications Engineering, University of Malaga, 29071 Malaga, Spain
2Telefonica I+D, 28006 Madrid, Spain
E-mail addresses: [email protected], [email protected], [email protected], [email protected], [email protected],
Correspondence should be addressed to Gerardo Gómez, [email protected]
Keywords – Quality of Experience, Mean Opinion Score, YouTube, Android
Abstract – In this paper, we present an Android application which is able to evaluate and
analyze the perceived Quality of Experience (QoE) for YouTube service in wireless
terminals. To achieve this goal, the application carries out measurements of objective
Quality of Service (QoS) parameters, which are then mapped onto subjective QoE (in
terms of Mean Opinion Score, MOS) by means of a utility function. Our application also
informs the user about potential causes that lead to a low MOS as well as provides some
hints to improve it. After each YouTube session, the users may optionally qualify the
session through an online opinion survey. This information has been used in a pilot
experience to correlate the theoretical QoE model with real user feedback. Results from
such an experience have shown that the theoretical model (taken from the literature)
provides slightly more pessimistic results compared to user feedback. Users seem to be
more indulgent with wireless connections, increasing the MOS from the opinion survey in
about 20% compared to the theoretical model, which was obtained from wired scenarios.

1. Introduction
Real-time entertainment services (comprised mostly of streaming video and audio) are
becoming one of the dominant web-based services in telecommunications networks. In
particular, YouTube service is currently the largest single source of real-time entertainment
traffic and the third most visited Internet site (preceded by Google and Facebook). It has
emerged to account for more Internet traffic than any other service. Mobile networks have
the highest proportion of real-time entertainment traffic. Nowadays, YouTube leads the
way, accounting for 20-25% of total traffic in mobile networks. Additionally, 27.8% of all
YouTube traffic (first half 2012) has been consumed on a Smartphone or tablet [1].
The combination of increasing device capabilities, high-resolution content and longer
video duration (largely due to live content) means that YouTube’s growth will continue for
the foreseeable future. Driven by higher bitrates and enhanced capabilities of mobile
devices, the trend is also going towards High Definition (HD) video, which considerably
enhances quality demand. That is the reason mobile networks operators are following this
trend, as it will be hugely influential on network requirements and subscriber Quality of
Experience (QoE).
The QoE has been usually evaluated through subjective tests carried out on the users in
order to assess their degree of satisfaction with Mean Opinion Score (MOS) indicator [3].
This type of approach is obviously quite expensive, as well as annoying to the user. That is
why in recent years new methods have been used to estimate the QoE based on certain
performance indicators associated with services. The evaluation methodology used by
most network operators to obtain statistical QoE is based on field testing. These tests often
use mobile handsets as a modem, with laptop computers that perform the tests and keep
statistics. However, this process is expensive in terms of resources and staff, and also it

does not use the entire protocol stack implemented in the terminal. These drawbacks are
solved by integrating QoE analyzers in the mobile terminal itself so that measurements of
statistics are specific to each terminal. Thus, additional measurements can be collected
(along the protocol stack) to allow for enhanced analysis of the performance of each
service. Furthermore, if mobile terminals are able to report the measurements to a central
server, the QoE assessment process is simplified significantly.
Recently, a number of works have focused on developing subjective QoE evaluation
frameworks for mobile users. For instance, an implementation of a QoE measurement
framework on the Android platform is presented in [4][5], although results are limited to a
laboratory environment. The works in [6][7] present a framework for measuring the QoE
for distorted videos in terms of Peak Signal-to-Noise Ratio (PSNR) or a modified metric
called cPSNR, respectively. A QoE framework for multimedia services (named as QoM)
for run time quality evaluation of video streaming services is presented in [8]; this
approach is based on the influence of QoE factors, various network and application level
QoS parameters, although no evaluation of the proposed framework in a context of real
wireless network has been performed. In [11], the problem of YouTube QoE monitoring
from an access provider's perspective is investigated, showing that it is possible to detect
application-level stalling events by using network-level passive probing only. The work in
[12] describes a tool which constantly monitors the YouTube application comfort, making
it possible to estimate the time when the YouTube player is stalling.
Other works are focused on specific YouTube models to compute the QoE. In [9][10],
different QoE YouTube models that take into account the key influence factors (such as
stalling events caused by network bottlenecks) in the quality perception are presented.
They quantify the impact of initial delays on the user perceived QoE by means of
subjective laboratory and crowdsourcing studies. Other works are devoted to estimate the

MOS for video services [14][4][22]; among them, the analysis presented in [22] provides a
utility function for HTTP video streaming as a function of three application performance
metrics: initial buffering time, mean rebuffering time and re-buffering frequency.
However, none of previous works have performed a deep validation of existing models
through real tests over different radio technologies. In this work we describe an Android
application that carries out measurements of objective Quality of Service (QoS) indicators
associated to YouTube service; this performance indicators are then mapped onto
subjective QoE (in terms of MOS). Our application also informs the user about possible
causes that lead to a low MOS as well as provides some hints to improve it. After each
YouTube session, the users may optionally qualify the session through an opinion survey.
This information has been used in a pilot experience to correlate the theoretical QoE model
with real user feedback.
The remainder of this paper is structured as follows. A description of the YouTube QoE
evaluation method is given in section 2, specifying its main performance indicators. In
section 3, we describe our Android application for YouTube QoE evaluation. The results
from a YouTube evaluation pilot experience are analyzed in section 4. Finally, some
concluding remarks are given in section 5.
2. YouTube QoE evaluation method
YouTube service employs progressive download technique, which enables the playback of
the video before the content downloaded is completely finished [13]. Old YouTube
delivery service for mobile terminals (through the mobile YouTube link
http://m.youtube.com) was based on conventional video streaming architecture, i.e. Real
Time Streaming Protocol (RTSP) and Real Time Protocol (RTP), being the latter
transported over User Datagram Protocol (UDP). However, current delivery service (both

for Smartphone and PCs) uses progressive video download via HyperText Transfer
Protocol (HTTP) over Transmission Control Protocol (TCP).
Nowadays, TCP is the preferred transport protocol for YouTube and other video servers
since the majority of video content delivery over the Internet is not live and most users’
bandwidth is usually greater than the video coding rate. The HTTP/TCP architecture also
solves the problem of access blockings carried out by many firewalls for unknown UDP
ports. Additionally, the continuous improvements in latency reduction and throughput
maximization achieved in new cellular technologies have allowed using TCP for
minimizing the impact of errors without reducing severely the effective throughput.
The video clip download process is started by the end user when a request (with a link to
the desired video clip) is sent to the YouTube web server (see Figure 1). When the client
web browser receives the YouTube web page, the embedded player initiates the required
signaling with the media server indicating the video to be played-out along with some
setup parameters [2]. Then, the server starts progressively sending the video data over an
HTTP response. The video data is then stored in a play-out buffer at the client side before
being displayed. Once the download has been started, there is no further client to server
signaling (unless the user interacts with the player).
The video data transfer from the media server to the client consists of two phases: initial
burst of data and throttling algorithm [2]. In the initial phase, the media server sends an
initial burst of data (whose size is determined by one of the setup parameters) at the
maximum available bandwidth. Then, the server starts the throttling algorithm, where the
data are sent at a constant rate (normally at the video clip encoding rate multiplied by the
throttle factor, also denoted in the setup parameters). In a network congestion episode, the
data that are not able to be delivered at this constant rate are buffered in the server and
released as soon as the congestion is alleviated. When this occurs, data are sent at the

maximum available bandwidth. Whenever the player’s buffer runs out of data, the
playback will be paused, leading to a rebuffering event.
Like quality of Internet services in general, Internet video streaming quality is mainly
depending on throughput. However, quality requirements in terms of throughput are more
demanding than those for other popular Internet applications as file download, web
browsing and messaging. The main differences are that throughput has to meet rather
precise requirements and that these requirements are stream-specific, i.e. if data are not
transmitted according to playing rate (corrected by the influence of initial buffering), a
rebuffering will likely occur and user QoE will drop down rapidly. It is therefore essential
not only to measure the download throughput, but also to check against the bitrate the
individual stream is encoded with.
There exist many quality metrics to characterize the video quality. Some of them are based
on comparing the received (and degraded) video with the original video (usually called
“reference”). Examples of this type of quality metrics are: Mean Square Error (MSE) [15],
Peak Signal to Noise Ratio (PSNR) [15], Video Structural Similarity (VSSIM) [16],
Perceptual Evaluation of Video Quality (PEVQ) [17] and Video Quality Metric (VQM)
[18]. This type of metrics is useful for obtaining objective metrics in controlled
experiments, but they are not applicable for online (real-time) procedures as the full
reference is not available. Furthermore, they are suited to measure the image quality
degradation, e.g., due to packet losses or compression algorithms. Since using TCP, packet
losses are recovered, this type of metrics is less useful for YouTube.
That is why other works are oriented to provide a model for estimating the video quality
without a reference. For instance, the work described in [19] presents a regression model to
estimate the visual perceptual quality in terms of MOS for MPEG-4 videos over wireless
networks. However, this algorithm requires an image reconstruction process to evaluate the

differences between the original and the resulting images (after network transmission),
which makes it not adequate for online quality estimations. In [20], the impact of delay and
delay variation on user’s perceived quality for video streaming is analyzed. However, it
does not consider other objective metrics such as resolution, frame rate, or packet losses,
which are also important for obtaining an accurate QoE estimation. In [21], a no-reference
subjective metric to evaluate the video quality is presented, which considers the frame rate
or the picture resolution, although their computation is complex to be used real-time.
Our implementation is based on the work presented in [22], which studied how the
network QoS affects the QoE of HTTP video streaming. In this work, they propose a
generic procedure to estimate the end-user’s perceived quality following three steps:
1) estimate (through modeling) or measure network QoS (e.g. throughput, round trip
time, loss rate, etc.);
2) convert network QoS metrics onto application QoS (application performance
metrics) by means of protocols’ modeling;
3) map application QoS onto end-user’s QoE (in terms of MOS).
It should be noticed that the first step might not be needed if the mobile terminal is
equipped with a customized YouTube’s client that directly monitors and reports the
application performance metrics. Otherwise, the mobile terminal shall be able to convert
the network QoS onto application QoS by specific protocol modeling. For instance, there
are different TCP performance models to estimate TCP throughput from network QoS
[23][24]. Afterwards, application performance metrics (Tinit, frebuf, Trebuf) can be estimated
at the receiver from performance indicators at lower layers (e.g. TCP throughput) as well
as other parameters like the video coding rate, video length, buffer size at the receiver or
the minimum buffer threshold that triggers a rebuffering event (see [22] for further details).

The model to estimate application QoS metrics from network QoS is valid under certain
assumptions: 1) the network bandwidth, Round Trip Time (RTT) and packet loss rate are
assumed to be constant during the video download; 2) the client does not interact with the
video during the playback, such as pausing and forward/backward.
The third step is performed by applying a utility function for HTTP video streaming as a
function of three application performance metrics:
• Initial buffering time (Tinit): time elapsed until certain buffer occupancy threshold
has been reached so the playback can start.
• Rebuffering frequency (frebuf): frequency of interruption events during the playback.
• Mean rebuffering time (Trebuf): average duration of a rebuffering event.
The final MOS expression can be computed as [22]:
QoSmodelMOS 4.23 0.0672 0.742 0.106= − ⋅ − ⋅ − ⋅ti fr TrL L L (1)
being Lti, Lfr and Ltr valued 1, 2 or 3 to represent the “low”, “medium”, and “high” levels of
Tinit, frebuf , and Trebuf, respectively. The concrete values used to quantize previous
application performance metrics can be found in [22]. From previous equation, it can be
seen that the quantized rebuffering frequency (frebuf) metric has the highest impact on the
end user’s QoE, compared to the initial buffering time (Tinit) and the rebuffering duration
(Trebuf). In this respect, it is reasonable to think that the perceived quality does not only
depend on the pause intensity (percentage of time in the pause state), since a higher
number of pauses (with lower pause durations) seems more annoying to the user.
3. Android application for YouTube QoE evaluation
The model for estimating YouTube QoE has been implemented as an Android application.
Our QoE tool is able to run in two different modes:
1) Intrusive mode: the application includes an embedded video player (based on
Media Player), thus having access to the content being consumed (through the
YouTube API).
2) Transparent mode: the application runs in background, so monitoring
functionalities are associated to YouTube sessions established either through the
native YouTube application or through the web browser.
Our Android application includes the following modules:
• Monitoring: this module is responsible for monitoring network QoS parameters as
well as other configuration parameters as required to estimate the application
performance monitoring (listed in previous section). It makes use of the Android
Networking and YouTube Data Application Programming Interface (API) to get a
number of parameters associated to the session.
• QoE estimation: in charge of (automatically) computing the QoE of a YouTube
session (in terms of MOS) from QoS parameters, according to Eq. (1).
• QoE advices: informs the user about possible causes that lead to a low MOS and
provides some hints to improve it.
• QoE user feedback: allows users to qualify the session through an opinion survey.
This information is used to correlate the QoE model with real user feedback.
• QoE reporting: this module is responsible for reporting all the performance
indicators to a QoE server for post-processing purposes.
A general overview of our YouTube QoE framework is depicted in Figure 2. In addition to
the MOS value automatically estimated by the application, users are requested to qualify
the session (video, audio and general feedback) manually in the same MOS scale (from 1
to 5). We have used both types of QoE evaluations to validate the theoretical model
proposed in [22], as well as to propose a modified function according to the results of our
pilot experience.
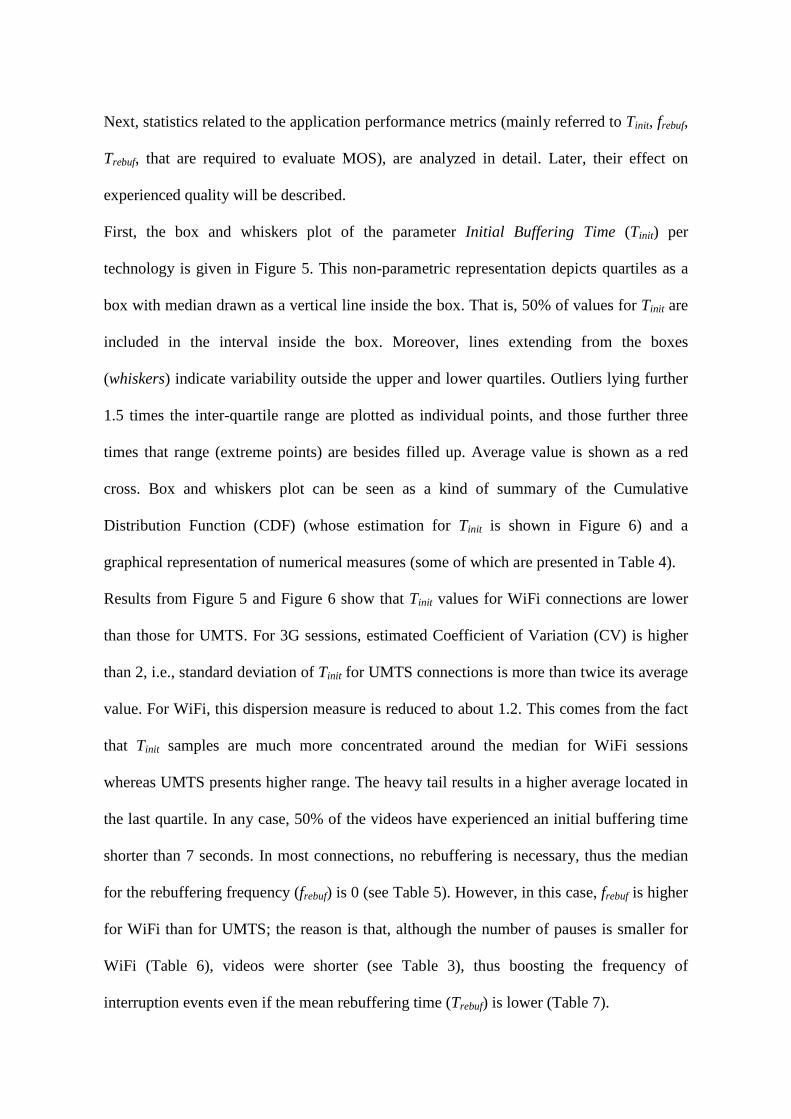
Figure 3 shows some snapshots of our Android QoE tool in its Intrusive mode version,
which includes the media player. Once the YouTube session is over, estimated quality
results are shown to the user and reported to the QoE server.
In order to estimate the QoE, the monitoring module must collect a set of performance
indicators to be subsequently mapped onto QoE. In addition to the three application
performance metrics (Tinit, frebuf, Trebuf) required to compute the MOS, the monitoring
module gathers other relevant information related to the mobile terminal, session
information (date, type of player, etc.), location of the measurements or network
information. All this information is reported, together with the estimated QoE and
subjective quality specified by the users, to the QoE server. The complete list of
parameters that are reported (from the terminal) to the QoE server are given in Table 1.
When our QoE tool runs in Intrusive mode (i.e. player embedded in the application), the
measurement of the three application performance metrics (Tinit, frebuf, Trebuf) is
straightforward, as the YouTube API provides access to this type of information.
However, in Transparent mode, the computation of these metrics is not so easy because it
has to be estimated from network level metrics, as detailed in [22]. In particular, the
following basic information is required: average TCP throughput, average playing rate and
player buffer size. However, this type of estimation has a limitation due to the fact that, as
throughput and playing rate may vary along the time, player’s buffer utilization depends on
the instantaneous throughput and play-out rate rather than their average values. Therefore,
this approach might lead to slightly optimistic results.

Regarding the QoE advices module, its role is to analyze possible causes that provide a low
QoE, and subsequently, provide particular advices to the user when certain conditions are
given. As an example, Table 2 shows potential causes of low QoE, their associated
evidences and advices.
4. YouTube QoE pilot experiment
A set of 17 users (engineers from Telefónica company) were selected to participate in a
pilot experiment, which consisted in periodically testing our YouTube QoE tool (installed
on different Android smartphones) during one month. Every YouTube native session were
transparently monitored and evaluated in two ways: 1) automatically by the application
(from QoE model previously described); 2) by the users through an online opinion survey.
A total number of 1435 YouTube sessions were evaluated during the pilot. The data
collected from each user device was sent to a server for post-processing purposes.
The pilot experience was carried out in Madrid (Spain), covering both rural and urban
environments (as shown in Figure 4 on the left). Different colors represent the associated
subjective quality (from the opinion survey) for a set of YouTube sessions. Such a survey
(related to the video quality, audio quality and overall quality) was requested to be filled
after each YouTube session. Figure 4 on the right show the probability density distribution
of the feedback associated to video, audio and general quality.
According to the statistics collected at the QoE server, the majority of videos consumed by
the users are short: near 90% of the videos shorter than 5 minutes and average duration 160
seconds (see Table 3). Regarding the video characteristics, users had free access to
YouTube repository, so wide a variety of videos with different average bitrates (from
75 kbps to 3 Mbps depending on the resolution and codec) have been downloaded.
Next, statistics related to the application performance metrics (mainly referred to Tinit, frebuf,
Trebuf, that are required to evaluate MOS), are analyzed in detail. Later, their effect on
experienced quality will be described.
First, the box and whiskers plot of the parameter Initial Buffering Time (Tinit) per
technology is given in Figure 5. This non-parametric representation depicts quartiles as a
box with median drawn as a vertical line inside the box. That is, 50% of values for Tinit are
included in the interval inside the box. Moreover, lines extending from the boxes
(whiskers) indicate variability outside the upper and lower quartiles. Outliers lying further
1.5 times the inter-quartile range are plotted as individual points, and those further three
times that range (extreme points) are besides filled up. Average value is shown as a red
cross. Box and whiskers plot can be seen as a kind of summary of the Cumulative
Distribution Function (CDF) (whose estimation for Tinit is shown in Figure 6) and a
graphical representation of numerical measures (some of which are presented in Table 4).
Results from Figure 5 and Figure 6 show that Tinit values for WiFi connections are lower
than those for UMTS. For 3G sessions, estimated Coefficient of Variation (CV) is higher
than 2, i.e., standard deviation of Tinit for UMTS connections is more than twice its average
value. For WiFi, this dispersion measure is reduced to about 1.2. This comes from the fact
that Tinit samples are much more concentrated around the median for WiFi sessions
whereas UMTS presents higher range. The heavy tail results in a higher average located in
the last quartile. In any case, 50% of the videos have experienced an initial buffering time
shorter than 7 seconds. In most connections, no rebuffering is necessary, thus the median
for the rebuffering frequency (frebuf) is 0 (see Table 5). However, in this case, frebuf is higher
for WiFi than for UMTS; the reason is that, although the number of pauses is smaller for
WiFi (Table 6), videos were shorter (see Table 3), thus boosting the frequency of
interruption events even if the mean rebuffering time (Trebuf) is lower (Table 7).

Now, we are exploring the effect of performance indicators in the reported MOS. Figure 7
shows the initial buffering time (Tinit) box and whisker plot per MOS. As shown in the
results, lower Tinit values are associated to higher MOS. Although a higher feedback
quality could be expected for WiFi than for UMTS, it can be observed that users do not
assign a significantly lower MOS for UMTS than for WiFi (see Figure 8 and Table 8) even
if, from an objective point of view, their performance is better (a summary of the three
studied performance indicators can be found in Tables 9, 10 and 11). That is, although
WiFi connections achieve much better QoS figures, MOS values are very similar to those
of 3G. The reason for that might be that subjective users’ expectations could be influenced
by the type of connection being used. Hence, users might penalize the QoE of WiFi
connections due to a higher expected quality.
Next, the appropriateness of the theoretical model in Eq. (1) is analyzed by evaluating the
correlation between the theoretical MOS and the MOS reported by users, resulting in a
correlation factor of 0.97, i.e. the coefficient of determination R2 for linear regression
through origin is 93.93%. Figure 9 on the left shows the difference between MOS results
provided by the theoretical model (see Eq. (1)) and MOS reported from the users’ opinion
survey. It can be observed that the QoE model provides an estimation which falls within
±0.5 of the reported scored in 23% of sessions. In general, the model in [22] provides more
pessimistic results than opinion of users as estimated MOS is lower than that reported for
about 68% of sessions. A simple modification results from taking a linear regression
between the modeled MOS and MOS as reported by users, yielding to:
mod QoSmodelMOS 1.1935 MOS= ⋅ (2)

Note that this measurement indicates that MOS is about 20% higher than that given in Eq.
(1). The reason could be that users could be more indulgent with wireless connections than
for wired scenarios under which the original model was obtained.
Due to regression properties, the average value for the difference between MOS as
obtained by (2) and that reported by users (that it, the residuals) is 0, although no symmetry
around 0 exists (see Figure 9 on the right). Differences between subgroups per technology
are not significant (estimated slope of 1.1995 for WiFi connections and 1.2089 for UMTS).
It was explored if a multivariant regression could improve those results. Only linear
regression was analyzed as a modification of numerical quantities as those proposed in
[25] cannot be easily included in the multivariant procedure. The adjusted R2 including all
available parameters results in 90.5%, only a bit lower (90.46%) if the total rebuffering
time is taken out from regression. As this value is lower than that obtained with (1), the
heuristical measurement quantization proposed in [22] increased in a 20% seems to be able
to predict well users expectations.
5. Conclusions
This work has presented a QoE evaluation tool for Android terminals that is able to
estimate the QoE (in terms of MOS) for YouTube service based on theoretical models. In
particular, this tool makes it possible to map network QoS onto the QoE of YouTube
sessions. Additionally, a QoE advices module analyzes possible causes that lead to low
QoE, and subsequently, provide particular advices to the user under certain conditions.
Our application has been tested on a pilot experience over 17 Android terminals during one
month. According to the statistics, most of the responses from the users’ survey match up
with theoretical estimations; however, the QoE model provides slightly more pessimistic
results than the opinion of the wireless users, probably as the model was initially generated

under wired scenarios. In that sense, we propose a modified utility function from taking a
linear regression between the theoretical MOS and the MOS reported by users.
In our opinion, it is critical that application developers provide access to the main Key
Performance Indicators (KPIs) associated to their services in order to ease the evaluation
and analysis of the QoE.
Acknowledgements
This work has been partially supported by the Spanish Government (TEC2010-18451).
References
[1] Sandvine Corporation. Global Internet Phenomena Report, 1H 2012. Available at:
http://www.sandvine.com/news/global_broadband_trends.asp
[2] P Ameigeiras, JJ Ramos-Munoz, J Navarro-Ortiz, JM Lopez-Soler. Analysis and
modeling of YouTube traffic. Transactions on Emerging Telecommunications
Technologies; 23(4): 360–377 (2012). doi: 10.1002/ett.2546
[3] A Díaz, P Merino, FJ Rivas. Customer-centric measurements on mobile phones.
Proceedings on 12th IEEE International Symposium on Consumer Electronics; 14-
16 (2008). doi: 10.1109/ISCE.2008.4559470
[4] I Ketykó, K De Moor, T De Pessemier, AJ Verdejo, K Vanhecke, W Joseph, L
Martens, L De Marez. QoE Measurement of Mobile YouTube Video Streaming.
MoViD'10 Proceedings of the 3rd workshop on Mobile video delivery; 27-32 (2010).
doi:10.1145/1878022.1878030
[5] K De Moor, I Ketykó, W Joseph, T Deryckere, L De Marez, L Martens. Proposed
Framework for Evaluating Quality of Experience in a Mobile, Testbed-oriented

Living Lab Setting. Mobile Networks and Applications; 15(3): 378-391 (2010). doi:
10.1007/s11036-010-0223-0
[6] A Alvarez, S Cabrero, XG Paneda, R Garcia, D Melendi, R Orea. A flexible QoE
framework for video streaming services. IEEE GLOBECOM Workshops; 1226-1230
(2011). doi: 10.1109/GLOCOMW.2011.6162377
[7] J Klaue, B Rathke, A Wolisz. Evalvid - A framework for video transmission and
quality evaluation. In Proceedings of 13th International Conference on Modelling
Techniques and Tools for Computer Performance Evaluation; 255-272 (2003). doi:
10.1007/978-3-540-45232-4_16
[8] K Laghari, TT Pham, H Nguyen, N Crespi. Qom: A new quality of experience
framework for multimedia services. In Proc. IEEE Symp. Computers and
Communications (ISCC); 851-856 (2012). doi: 10.1109/ISCC.2012.6249408
[9] T Hossfeld, M Seufert, M Hirth, T Zinner, P Tran-Gia, R Schatz. Quantification of
YouTube QoE via Crowdsourcing. IEEE International Symposium on Multimedia
(ISM); 494-499 (2011). doi: 10.1109/ISM.2011.87
[10] T Hossfeld, R Schatz, S Egger, M Fiedler, K Masuch, C Lorentzen. Initial Delay vs.
Interruptions: Between the Devil and the Deep Blue Sea. In Proc. of 4th
International Workshop on Quality of Mulitmedia Experience (QoMEX); 1-6 (2012).
doi: 10.1109/QoMEX.2012.6263849
[11] R Schatz, T Hoßfeld, P Casas. Passive YouTube QoE Monitoring for ISPs. In Proc.
of Sixth International Conference on Innovative Mobile and Internet Services in
Ubiquitous Computing (IMIS); 358 – 364 (2012). doi: 10.1109/IMIS.2012.12
[12] B Staehle, M Hirth, R Pries, F Wamser, D Staehle. YoMo: A YouTube Application.
Comfort Monitoring Tool. In Proc. of EuroITV Workshop QoE for Multimedia
Content Sharing (QoEMCS) (2010)

[13] P Gill, M Arlitt, Z Li, A Mahanti. YouTube Traffic Characterization: A View From
the Edge. In Proc. of the 7th ACM SIGCOMM conference on Internet measurement;
15-28 (2007). doi: 10.1145/1298306.1298310
[14] T Porter, X Peng. An objective approach to measuring video playback quality in
lossy networks using TCP. IEEE Communications Letters; 15(1): 76-78 (2011).
doi: 10.1109/LCOMM.2010.110310.101642
[15] RC Gonzalez, P Wintz. Digital image processing. 2nd edition. Addison-Wesley
Publishing Co. (1987)
[16] Z Wang, L Lu, AC Bovik. Video quality assessment based on structural distortion
measurement. Journal of Signal Processing: Image Communication; 19(2): 121-132
(2004). doi: 10.1016/S0923-5965(03)00076-6
[17] ITU-T. Recommendation J.247. Objective perceptual multimedia video quality
measurement in the presence of a full reference (2008)
[18] ITU-T. Recommendation J.144. Objective perceptual video quality measurement
techniques for digital cable television in the presence of a full reference (2004)
[19] A Khan, L Sun, E Ifeachor. Content-based video quality prediction for MPEG4 video
streaming over wireless networks. Journal of Multimedia; 4(4): 228-239 (2009).
doi: 10.4304/jmm.4.4.228-239
[20] VD Bhamidipati, S Kilari. Effect of delay/delay variable on QoE in video streaming.
M. Thesis, School of Computing at Blekinge Institute of Technology, Sweden (2010)
[21] L Janowski, P Romaniak. QoE as a function of frame rate and resolution changes. In
Proc. of the 3rd International Workshop on Future Multimedia Networking (FMN);
34-45 (2010). doi: 10.1007/978-3-642-13789-1_4
[22] RKP Mok, EWW Chan, RKC Chang. Measuring the Quality of Experience of HTTP
video streaming. In Proceedings of the 12th IFIP/IEEE International Symposium on

Integrated Network Management (IFIP/IEEE IM); 485-492 (2011).
doi: 10.1109/INM.2011.5990550
[23] J Padhye, V Firoiu, D Twosley, J Kurose. Modeling TCP Reno performance: a
simple model and its empirical validation. IEEE/ACM Transactions on
Networking; 8(2): 133-145 (2000). doi: 10.1109/90.842137
[24] D Zheng, GY Lazarou, R Hu. A Stochastic Model for Short-lived TCP Flows. In
Proceedings of the IEEE International Conference on Communications; 76-81
(2003). doi: 10.1109/ICC.2003.1204146
[25] M Fiedler, T Hossfeld, P Tran-Gia. A generic quantitative relationship between
quality of experience and quality of service. IEEE Network; 24(2): 36-41 (2010). doi:
10.1109/MNET.2010.5430142

Figure captions
Figure 1. Signaling flowchart of a YouTube session (via web browser).
Figure 2. YouTube QoE framework.
Figure 3. Snapshots of our Android QoE tool (Intrusive mode).
Figure 4. Geographical distribution of the users (left) and quality feedback distribution
(right).
Figure 5. Box and whiskers plots for the initial buffering time (in seconds) per technology.
Figure 6. Estimated CDF of the initial buffering time (Tinit).
Figure 7. Box and whisker plot for Tinit per reported MOS.
Figure 8. Box and whisker plot for MOS per used technology.
Figure 9. Histogram for the difference between the original QoS model (left) or modified
QoS model (right) and as reported by users

Tables
Table 1. List of parameters that are reported (from the terminal) to the QoE server.
Parameter Type Parameter Description Device ID IMEI International Mobile Equipment Identity (15 digit format).
Session information
ReproductionMode It indicates the application used for video reproduction: 1 - Embedded video player (based on Media Player) 2 - YouTube native application 3 - Web Browser
ReproductionTime Total reproduction time (in ms) including rebuffering and user originated pauses.
Date Date of the YouTube video session (AAAA-MM-DD). Hour Hour of the YouTube video session (HH:MM:SS).
Application Performance Metrics
InitialBufferingTime (Tinit)
Total time (in ms) since the user starts the session until the video is ready to be played.
RebufferingFrequency (frebuf)
Frequency of interruption events (not forced by the user) during the playback.
MeanRebufferingTime (Trebuf)
Average duration of a rebuffering event (in ms).
Location of the measurement
Latitude Expressed in sexagesimal degrees (-90, 90). Longitude Expressed in sexagesimal degrees (-180, 180). Altitude Expressed in meters above sea level. Accuracy Precision in meters of the location measurements. Time Moment at which the location measurement was done
(AAAA-MM-DD_HH:MM:SS format). Provider Method to perform location measurements: GPS or
Network-assisted.
Network information
ConnectionType Type of network data connection active for the session. Possible values: 0(WIFI), 1(GPRS), 2(EDGE), 3(UMTS), 4(CMDA), 5(EVDO_0), 6(EVDO_A), 7(1XRTT), 8(HSDPA), 9(HSUPA), 10(HSPA), 11(IDEN), 12(EVDO_B), 13(LTE), 14(EHRPD), 15(HSPAP)
LAC Location Area Code where the user is located. CellID Identifier of the cell providing service to the terminal. RSSI Received Signal Strength Indication (dBm) measured by
the terminal (for either WiFi or cellular connections).
Subjective Quality (feedback from users)
VideoQualityFeedback Subjective opinion regarding video quality (scale: 1 to 5). AudioQualityFeedback Subjective opinion regarding audio quality (scale: 1 to 5). GeneralFeedback General feedback from the user (scale: 1 to 5). AdditionalComments The user can add any additional comment.
Subjective Quality (estimated)
EstimatedVideoQuality Estimated video quality from QoE model (scale: 1 to 5)

Table 2. Examples of causes of low QoE and advices to users (QoE advices module). Cause Evidence Advice Low throughput High traffic load
IF many applications synchronizing ELSE IF many apps running ELSE Low Network Traffic and connected to a cellular network IF GSM / 3G Lock on 2G ELSE IF low RSSI & WiFi available ELSE IF low RSSI & WiFiSwitchedOn & WiFi Not Available ELSE IF low RSSI & Bluetooth Switched On Low Network Traffic and connected to WiFi IF WiFi Tethering is activated ELSE IF Bluetooth Switched On ELSE
Temporarily stop data synchronization Offer some apps/services to be switched off Switch to other technology (WiFi, Mobile) Activate 3G Switch to a WiFi connection Switch off WiFi to avoid interference Switch off Bluetooth to avoid interference Switch off WiFi Tethering Switch off Bluetooth Switch to a cellular network connection
Low memory Low Memory status flag is TRUE IF many apps/services running ELSE IF “hungry” app detected ELSE
Offer some apps/services to be switched off Offer to switch off “hungry” app Check for system updates
High CPU load CPU load is high during a period IF many apps/services running
Offer some apps/services to be switched off
Low CPU frequency forced
CPU freq low IF low battery level OR high battery temperature ELSE IF aggressive power save profile selected ELSE
Wait until battery gets in better conditions Select a performance oriented profile Check for system updates
Video requirements exceeds terminal capabilities
YouTube API video source and device HW information IF device capability < video req.
Try to select less demanding video files, switch off High Quality (HQ) option.
Low video quality in origin
YouTube API video source information IF low resolution/codingRate
Select another file of higher quality
Table 3. Summary for Reproduction Time (in minutes). Connection Type No. sessions Mean Median Standard
Deviation Min Max
UMTS 911 2.91 1.8 3.92 0.02 49.35 WiFi 524 2.19 1.14 2.89 0.0007 26.88 Total 1435 2.65 1,6 3.6 0.0007 49.35
Table 4. Summary for initial buffering time time (Tinit) in seconds.
Connection Type Mean Median Standard Deviation Min Max UMTS 15.24 7.604 31.8225 2.69 582.733 WiFi 7.94 6.014 9.69786 2.389 154.245 Total 12.5758 6.977 26.2543 2.389 582.733

Table 5. Summary for rebuffering frequency (frebuf) Connection Type Mean Median Standard Deviation Min Max
UMTS 1.88e-3 0 5.55e-3 0 46e-3 WiFi 1.05e-3 0 6.73e-3 0 0.11 Total 1.57e-3 0 6e-3 0 0.11
Table 6. Summary for number of pauses (Npauses) Connection Type Mean Median Standard Deviation Min Max
UMTS 0.54 0 2.43 0 31 WiFi 0.21 0 1.71 0 36 Total 0.42 0 2.20 0 36
Table 7. Summary for Mean Rebuffering Time (Trebuf) in seconds Connection Type Mean Median Standard Deviation Min Max
UMTS 19.1 0 143.2 0 2594 WiFi 2,46 0 28.75 0 632 Total 13,04 0 115.73 0 2594
Table 8. Percentage of reported MOS per technology Connection
Type MOS=1 MOS=2 MOS=3 MOS=4 MOS=5 Average Standard
Deviation UMTS 3.86 8.13 26.06 34.55 27.44 3.74 1.1 WiFi 3.4 7.46 24.41 46.78 21.02 3.81 0.87 Total 2.69 8.18 25.64 38.46 25.03 3.74 1
Table 9. Average, max and standard deviation values (in seconds) for Tinit as per technology and MOS.
Tini (s) UMTS WiFi Average Standard Deviation Ave Min Max Std Ave Min Max Std
MOS=1 98,44 6,05 439,2 99,91 - - - - 87,94 96,53 MOS=2 22,9 3,15 147 29,86 13,54 2,87 106 21,59 20,36 27,55 MOS=3 16,77 3,21 167 24,84 8,27 2,39 60,68 8,04 14,67 21,83 MOS=4 11,31 2,69 83,2 11,21 7,67 2,66 154,2 12,99 9,87 12,39 MOS=5 9,30 3,33 94,7 9,85 7,00 2,49 35,50 5,11 8,61 8,57
Table 10. Average, max and standard deviation values for frebuf as per technology and MOS (all min values are 0).
frebuf UMTS WiFi Average Standard Deviation Ave Max Std Ave Max Std
MOS=1 13e-3 0,03 8.7e-3 - - - 0.013 9e-3 MOS=2 3.6e-3 0.025 6.8e-3 1.4e-3 0.016 4.13e-3 2.8e-3 6e-3 MOS=3 4.3e-3 0.046 8.6e-3 2.1e-3 0.1 13e-3 3.5e-3 10.4e-3 MOS=4 1.2e-3 0.022 3.8e-3 6e-5 5.5e-3 5.4e-4 6.6e-4 2.9e-3 MOS=5 0 0 0 7e-5 4e-3 5.4e-4 2e-5 3.1e-4

Table 11. Average, max and standard deviation values (in seconds) for mean rebuffering time as per technology and MOS (all min values are 0).
Trebuf UMTS WiFi Average Standard Deviation Ave Max Std Ave Max Std
MOS=1 520.88 2593.56 768.38 - - - 494,84 756,9 MOS=2 28.26 372.42 71.18 4,28 53,03 12,73 19,75 58,56 MOS=3 11.25 164.127 32.97 0,99 59,21 7,02 7,56 27,13 MOS=4 2.71 98.056 11.68 0,11 9,07 0,92 1,54 8,78 MOS=5 0 0 0 0,23 14,07 1,79 0,07 1,00

Biographies
Gerardo Gómez received his B.Sc. and Ph.D degrees in Telecommunications Engineering
from the University of Málaga (Spain) in 1999 and 2009, respectively. From 2000 to 2005
he worked at Nokia Networks and Optimi Corporation (recently acquired by Ericsson),
leading the area of QoS for 2G and 3G cellular networks. Since 2005, he is an associate
professor at the University of Málaga. His research interests include the field of mobile
communications, especially QoS/QoE evaluation for multimedia services and radio
resource management strategies for LTE and LTE-Advanced.
Lorenzo Hortigüela is a Telecommunication engineer from E.T.S.I.T – UPM, specialized
in computer science. He has worked mainly in defense aerospace industry as military
avionics engineer and in wireless telecommunication industry as systems engineer. And he
also worked for public administration as a consultant in computer science and also as a
contract reviewer. Since 1996 he has worked for Telefónica I+D, always involved in
mobile network R&D. Recently, he worked at the area of PDI - Enabling Platforms (SLA)
as a computer technology specialist. Currently, he is working at the area of PTI - Capacity
& Traffic Analysis & Solutions, developing tools based on knowledge extraction, machine
learning and analytic prediction techniques.
Quiliano Perez is Physicist for the Complutense University of Madrid from 1986. In 1987
he started working in Telefónica I+D, in aspects related with reliability predictions, failure
analysis and components electronic testing, used in telecommunication systems. In 2011 he
was working in QoE issues for mobile broadband networks, analyzing and developing
tools and client applications to control and manage the QoS and QoE of mobile services.

Currently, he is working in GCTO (Global Chief Technology Office) of Telefónica,
analyzing and defining the requirements needed for residential cellular gateways.
Javier Lorca received his B.Sc. in Telecommunications in 1998 by the Universidad
Politécnica de Madrid. In 1999 he worked for Teldat on ciphering techniques, and since
2000 he is working in Telefónica I+D on several areas related with mobile
communications and physical layer performance, involving terminals specifications and
testing, link-level and system-level simulations of 3G/3.5G systems, LTE digital signal
processing, and LTE-Advanced. He is currently working on Quality of Experience in
wireless networks.
Raquel García received her B.Sc. Degree in Telecommunication Engineering in 1998 from
Madrid Polytechnics University. Between 1997 and 1998 she staged at the Digital
Communication Systems Department at the Technical University Hamburg-Harburg
(Germany), where she carried out her master thesis about multipath fading channel
modeling. In July 1998 she signed for Telefónica I+D, becoming part of the Radio
Communication Systems Department. Her carrier has oriented towards mobile
communications, especially on radio planning and optimization and QoE in LTE.
Mari Carmen Aguayo-Torres received the M.S. and Ph.D. degrees in Telecommunication
Engineering from the University of Malaga, Spain, in 1994 and 2001, respectively.
Currently, she is working at the Department of Communications Engineering, at the same
university. Her main research interests include adaptive modulation and coding for fading
channels, multi-user OFDM, SC-FDMA, cross-layer design and probabilistic QoS
guarantees for wireless communications.

Terminal (YouTube client)
YouTubeWeb Server
HTTP response (selected video)
HTTP request (GET video, setup parameters)
TCP connection establishment
TCP connection release
YouTubeMedia Server
HTTP response (video player & config. parameters)
HTTP request (GET url, video)
TCP connection establishment
TCP connection release
Figure 1

End user
Network
YouTube ServerUser
terminal
What is my
perception of
the services?
Android application
client agent
QoE Tool
Reporting
Data capture
Ø Service and terminal parameters
Ø Network parameters
Ø Radio parameters
Play
service
The user launches
application and
data are captured
q Excellent (5)
q Good (4)
q Acceptable (3)
q Bad (2)
q Very bad (1)
Opinion
survey
Advices and
info to user
Reports to
operator
QoE
Server
QoE estimated by
the application
QoE reported
from users
Figure 2
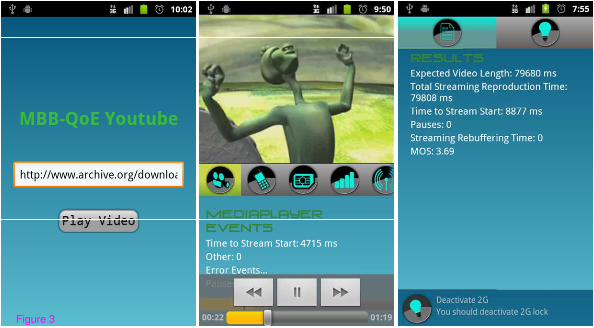
Figure 3

General Feedback
Video Quality Audio Quality General Feedback
0.50
0.45
0.40
0.35
0.30
0.25
0.20
0.15
0.10
0.05
0
1
2
3
4
5
Figure 4

8076
7ΛΘΛΩ ς
:Λ)Λ
Figure 5

7ΛΘΛΩ ς
&∋)
:Λ)Λ8076
Figure 6
8076
:Λ)Λ
7ΛΘΛΩ
026
026
026
026
026
Figure 7

026
:Λ)Λ
8076
Figure 8

0264Ρ6ΠΡΓΗΟ 026ΞςΗΥς
ΡΙςΗςςΛΡΘς
026ΠΡΓ 026ΞςΗΥς
ΡΙςΗςςΛΡΘς
Figure 9
Copyright © 2022 FDOKUMEN