An Autonomous QoE-Driven Network Management Framework
25
An Autonomous QoE-driven Network Management Framework Janne Sepp¨ anen a,* , Mart´ ın Varela a , Aggeliki Sgora a a VTT Technical Research Centre of Finland, PL 1100 Oulu 90571, Finland Abstract Recently, network researchers have taken a great interest in quality of experience (QoE) and in the new aspects it brings in the study of the link between network conditions and user satisfaction. Also, the realization that the information of users’ satisfaction can be directly applied in the network management in a real-time manner has resulted in a fair amount of publications. Although the systems and frameworks presented in these publications tackle the subject of QoE-driven management quite successfully, they often concentrate on certain applications or technologies. We present a generic QoE manage- ment framework, which is applicable to a broad range of systems. We also demonstrate an instantiation of this framework as a network access point management system for RTP-based video. This system is not only able to positively affect the perceived qual- ity of the multimedia application considered, but also to reduce over-prioritization and optimize resource usage. Keywords: Quality of experience, multimedia, over-the-top, management system, access point 1. Introduction Multimedia services, and in particular video, make up a large and ever-increasing portion of the total Internet traffic. The popularity of the so-called “Over-the-Top” (OTT) services, such as YouTube, Netflix, Hulu, and other Web-based video services has exploded and will continue to do so (e.g. with the adoption of WebRTC [1] for real-time browser-based communications), as has their importance to users and busi- ness. This fact, coupled with the availability of fast and cheap mobile connectivity and mobile devices capable of displaying high-definition content, poses a serious challenge to mobile operators, as users become accustomed to more resource-demanding services and demand better quality. In contrast to operator-run media services (such as IPTV, mobile TV, or IMS-based ones), where the operator has control over the whole chain of transmission, OTT services come from outside the operator’s network, and the operators * Corresponding author Email addresses: [email protected] (JanneSepp¨anen), [email protected] (Mart´ ın Varela), [email protected] (Aggeliki Sgora) Preprint submitted to Elsevier December 13, 2013
Transcript of An Autonomous QoE-Driven Network Management Framework

An Autonomous QoE-driven Network ManagementFramework
Janne Seppanena,∗, Martın Varelaa, Aggeliki Sgoraa
aVTT Technical Research Centre of Finland, PL 1100 Oulu 90571, Finland
Abstract
Recently, network researchers have taken a great interest in quality of experience (QoE)and in the new aspects it brings in the study of the link between network conditionsand user satisfaction. Also, the realization that the information of users’ satisfaction canbe directly applied in the network management in a real-time manner has resulted in afair amount of publications. Although the systems and frameworks presented in thesepublications tackle the subject of QoE-driven management quite successfully, they oftenconcentrate on certain applications or technologies. We present a generic QoE manage-ment framework, which is applicable to a broad range of systems. We also demonstratean instantiation of this framework as a network access point management system forRTP-based video. This system is not only able to positively affect the perceived qual-ity of the multimedia application considered, but also to reduce over-prioritization andoptimize resource usage.
Keywords: Quality of experience, multimedia, over-the-top, management system,access point
1. Introduction
Multimedia services, and in particular video, make up a large and ever-increasingportion of the total Internet traffic. The popularity of the so-called “Over-the-Top”(OTT) services, such as YouTube, Netflix, Hulu, and other Web-based video serviceshas exploded and will continue to do so (e.g. with the adoption of WebRTC [1] forreal-time browser-based communications), as has their importance to users and busi-ness. This fact, coupled with the availability of fast and cheap mobile connectivity andmobile devices capable of displaying high-definition content, poses a serious challengeto mobile operators, as users become accustomed to more resource-demanding servicesand demand better quality. In contrast to operator-run media services (such as IPTV,mobile TV, or IMS-based ones), where the operator has control over the whole chain oftransmission, OTT services come from outside the operator’s network, and the operators
∗Corresponding authorEmail addresses: [email protected] (Janne Seppanen), [email protected]
(Martın Varela), [email protected] (Aggeliki Sgora)
Preprint submitted to Elsevier December 13, 2013

have very little, if any, control over them (some content providers such as Netflix workwith operators to provide caching servers within the operator’s network, but this is notgenerally the case with all content providers).
The operator’s challenges are thus many; firstly, it has to deal with the increasingdemand on their infrastructure, notably so over the last hop (base stations and WiFihotspots, for example). Secondly, OTT video is most commonly delivered over HTTP,which makes it hard to separate from other web traffic. Finally, from the operator’spoint of view, OTT services are hard to monetize (the content providers get the revenueand the operator just sees an increased use of resources) and at the same time, if thequality of these services is not good enough for the users, the operator will face higheruser churn.
In this paper we address these challenges by providing traffic control mechanismsbased on a combination of Quality of Experience (QoE)1 estimations, and subscriberand application-based traffic differentiation. We present a framework to instrumentQoE-driven network management mechanisms, and in the context of this framework, weimplement a concrete prototype for QoE-driven control. We expand upon our previouswork [2] by incorporating network performance models, allowing the proposed approachto always make the right decision by predicting the possible outcomes, instead of justreacting to a drop in quality and hoping that the reaction will result in a positive change.The goal of the proposed work is to allow operators to properly address the needs oftheir users (in terms of QoE), while introducing subscriber differentiation as a means ofincreasing revenues and simplifying resource allocation (i.e. customers who pay more areprioritary). The proposed approach is able to a) identify the relevant media flows, b)estimate their current QoE, c) select the appropriate priority for the flows based on theirapplication type, subscriber class, current QoE for it and other media flows, and expectedQoE after the control mechanism kicks in (based on network performance models) andd) perform access control on new flows based on the current quality for existing flows,and the incoming flow’s application and subscriber class.
The rest of the paper is organized as follows. Section 2 provides an overview of relatedworks. Section 3 describes the proposed traffic management system. Sections 4 and 5present a prototype implementation of the system and a testbed where the prototypewas tested in. Section 6 presents its performance results. Finally, Section 7 presents ourconclusions and future research lines associated with this work.
2. Related Work
Although the majority of the research papers concerning QoE are related to QoEassessment and monitoring [3–6], QoE management has recently gained more attentionfrom the research community. Thus, different QoE management systems and frameworksfor different network technologies and applications may be found in the literature.
In [2] we proposed a simpler version of the approach proposed herein, whereby controldecisions were made based on current quality estimates. The main limitation of thisapproach (and motivation for this work) is the impossibility of making optimal decisionswithout a predictive performance model. In the general case, the mechanism proposed
1More specifically, perceived quality.
2
did result in an overall improvement in quality, but when load conditions become moreserious, the decisions made could potentially result in worse quality for all users.
Kafetzakis et al. [7] proposed the QoE4CLOUD, a QoE-driven multidimensionalframework for cloud environments, while Hoßfeld et al. [8] discussed challenges in QoEmanagement for cloud applications. Gomez et al. [9] proposed an architecture thatenables QoE-management in Long-Term Evolution (LTE) and LTE-Advanced (LTE-A)networks. Fajardo et al. [10] proposed a QoE-driven management system for VoIP over3G UMTS services. However, in the forthcoming era of seamless mobility, solutions eitherfor heterogeneous networks or independent from the network technology are needed.
Mu et al. [11] proposed a QoE management framework for end-to-end multimediaapplications called Quality of Experience (QoE)-aware Real-time Multimedia Manage-ment (QoE2M). The proposed framework is based on a combined control of video as-sessment, Quality of Service (QoS) and QoE-based mapping and adaptation procedures.In QoE2M, congestion periods are detected through resource allocation controllers thatgather information about the network status. Therefore, the QoE2M is able to adaptapplications according to network conditions or user’s device capabilities. However, de-spite this work proposing a dynamic approach and considering some QoE characteristicsof the application, it does not discuss implementation or validation issues [12].
Vakili and Gregoire [13] proposed a QoE management framework for video codedwith H264. The authors use subjective tests for measuring the level of video qualityperceived by end users to investigate the effect of different factors such as frame rateand quantization (QP) on video data bit rate and perceived video quality. Based on theresults obtained, the optimum video parameters are set given the network bandwidth andacceptable QoE level. They also introduce a straightforward technique to measure theminimum intermediate hop’s bandwidth in each path while sending video data. Basedon this estimation, the QoE control function will decide on the QP and the frame rateby which the video data should be sent to the other party. However, the applicability ofthis framework is limited due to the restrictions it sets on the type and size of videos (i.e.it supports only Quarter Common Intermediate Format (QCIF) resolution and mediummotion videos).
Kim et al. [14] proposed a new QoE management framework, called “in-servicefeedback QoE framework”. In this framework the end users give feedback instantaneouslywhenever service dissatisfaction occurs. By using the gathered feedback information fromdistributed end users, network parameters from routers, and application information fromservers can be analyzed collectively to find out the reason and location of faults. However,this work lacks implementation and validation details.
Agboma and Liotta [15] presented a QoE-based management framework for the con-struction of QoE models for different types of multimedia contents delivered onto typ-ical mobile devices. More specifically, the proposed framework is based on a statisticalmethod which correlates QoS parameters directly with estimates of perceived qualityand identifies the degree of influence of each QoS parameters on the user perception. Byusing this information the thresholds at which the user’s perception of the service qualitybecomes unacceptable are defined. However, the authors consider only how to maximizeend-user quality and they do not consider the impact of the network or how to optimizethe usage of network resources [16].
Lloret et al. [17] proposed a QoE management system for IPTV networks that isdesigned to be placed between the Internet Service Provider (ISP) architecture and the
3

consumer’s network. More specifically, the system is based on something called “QoEprocess” which gathers information from both architectures. By using this informationthe QoE process performs the appropriate tasks in the network to improve the QoEparameter and vary some features of the IP network to avoid network congestion and,therefore, packet losses. However, the admission control mechanism aims to provide acorrect IPTV service to the end users for every channel without considering the impactof network or how to maximize network resources.
Besides the QoE frameworks and architectures, several works proposing mechanismsfor efficient QoE management, such as admission control, scheduling, bandwidth man-agement and congestion control may also be found in the literature.
Piamrat et al.[18] proposed a QoE-driven admission control mechanism for IEEEwireless networks. In this research work the access point computes an average MeanOpinion Score (MOS) of all ongoing connections. If the MOS is higher than an acceptablelevel plus a threshold, then a new connection will be accepted; otherwise it will berejected.
Gallo et al. [19] presented an ontology for a QoE-framework. The proposed ontologyinvolves the user, application and network QoS aspects. Experimental work showed thatsemantic approach succeeds in the automatic QoE/QoS mapping and could be beneficialfor QoE-management.
In addition, in order to provide the maximum perceived quality to the user, severaladaptation techniques at the application layer have been proposed that automaticallythrottle the video quality to match the available resources in terms of bandwidth, cpu,etc. These techniques can be further classified into transcoded-based, scalable encoding-based and stream switching techniques [20]. Transcoded-based techniques imply theuse of a transcoder for assuring guaranteed QoE to the users [21, 22]. However, themain disadvantage of this approach is that it requires increased processing resources andprovides limited scalability, since the transcoding has to be done on a per-client basis[20].
In scalable encoding-based techniques, an encoded video is created by composingmultiples sub-streams derived from the original video [23, 24]. The main disadvantagesof this approach are [20]:
• It requires specialized servers implementing the adaptation logic.
• It is difficult to implement since it requires to be run on specialized servers andcontent cannot be cached in standard proxies.
• Since the adaptation logic depends on the codec employed, the content provider islimited to using only a limited set of codecs.
Stream switching techniques encode the raw video content in multiple streams withdifferent quality. However, despite this approach does not rely on particular functional-ities of the codec employed, it has the cost of increased storage requirements and thatadaptation is characterized by a coarser granularity since video bitrates can only belongto a discrete set of levels [20].
4
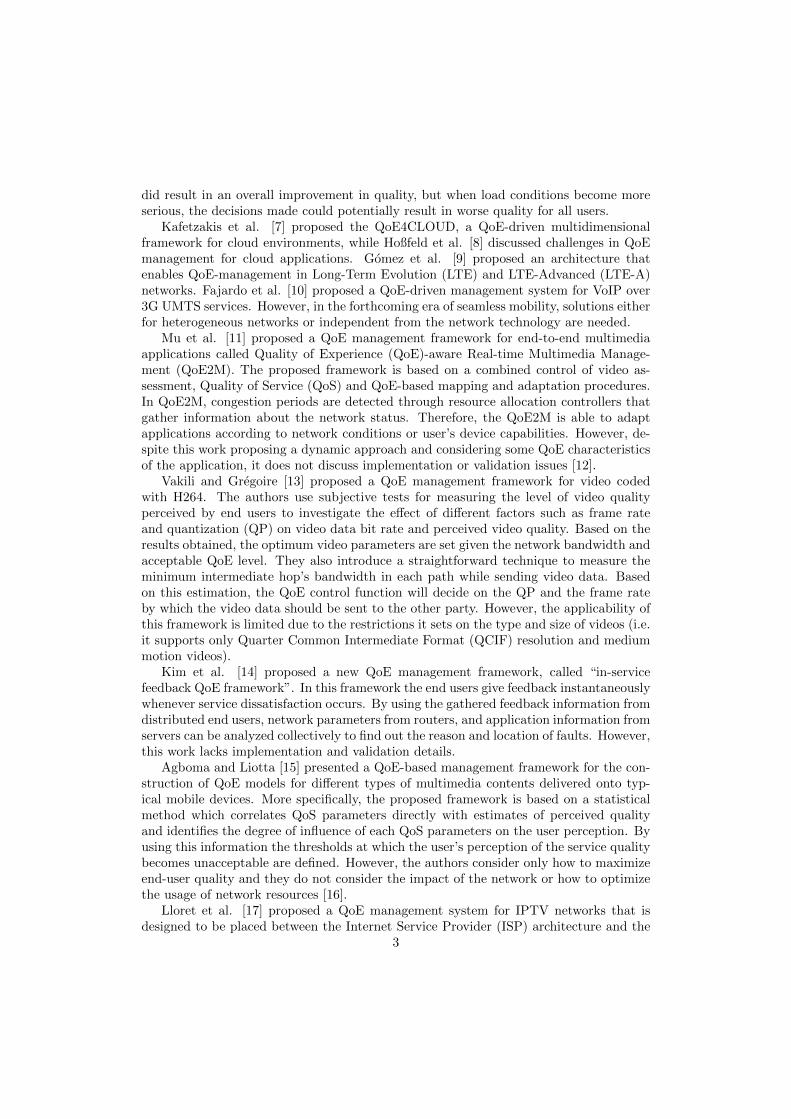
Figure 1: Customer Experience Management System Framework.
3. QoS/QoE Management System
The QoS/QoE management system presented in this paper is a part of a completecustomer experience management system (CEMS) framework, which it is illustrated inFigure 1. The CEMS framework contains three layers: data acquisition, monitoring,and control. In order to fully define the QoS/QoE management system, the presence ofthe data acquisition and monitoring levels is essential. However, they are only brieflydescribed in this paper, as the focus is on the control layer.
All raw data collection occurs on the data acquisition layer by probes or other meansof data collection. Passive probes are non-intrusive network monitoring agents, whichcollect data without causing additional traffic overhead on the network, and usually be-ing transparent to the other components of the network. Active probes, on the otherhand, send dedicated measurement packets to benchmark the network performance. Ameasurement layout usually consist of two or more probes performing independent mea-surements and possibly exchanging information among themselves. However, even single-point measurement layouts are possible; this usually results in a smaller set of measurableparameters (e.g. accurately estimating one-way delay with a single measurement pointis not feasible in general).
On the monitoring level, the raw data produced by the data acquisition layer is pro-cessed into knowledge about the state of the network, which is in turn passed to thecontrol level. The control level performs actions upon the network based on this knowl-edge. There are three important components on this level: control manager, interventionmanager and policies. These components are described in the following subsections.
5

3.1. Control Manager
This section presents the control manager (CM) component, which is responsible forproviding management decisions for the system. The CM is responsible for determiningthe state of the network and deciding the corrective actions to be performed by theintervention manager. There are three parameters which control the decision process ofthe control manager: policies, performance indicators and performance models, so theCM can be seen as a relation of the form:
CM :: PerfI× Policy × PerfM→ Decision
Policy incorporates the guides and bounds set by the operator of the network. With-out going into formal definitions, we consider policies as a set of network constraints onthe possible field of operation. In the case of ISPs, policies are likely to be based onservice level agreements policies (SLAP) and subscriber policies. Application policy isused more seldom but it is still important to this framework.
Policy = ApplicP | SubscP | SLAP | [Policy]
Performance indicators measure the current performance of the network. A commonset of performance metrics are the quality of service parameters (packet loss, jitter, de-lay etc.). Other parameters are also discretionary, e.g. connection establishment time,address allocation time and average response times for certain services. Quality of expe-rience indicators, such as mean opinion score (MOS), MOS estimations, peak-to-signalnoise ratio, mean-squared error etc. are defined under QoE indicators. Since these op-tions are not mutually exclusive, we define performance indicators to be a set of QoS,QoE and other metrics:
PerfI = QoSI | QoEI | OtherI | [PerfI]
Performance indicators express the current condition of the network, but we are alsointerested to know how control decisions affect the network QoS-parameters, and how achange in QoS-parameters in turn affects QoE. In the framework presented, these typeof mechanisms are called performance models. Performance models can be one or moreQoS or QoE models:
PerfM = QoSM | QoEM | [PerfM]
Performance models are a focal part of the control manager when optimizing otherparameters, such as costs, resource utilization and power consumption, simultaneouslyattempting to maximize QoE. These models, along with a possible addition of usagemodels, can be used to estimate QoE or QoS performance:
estimateQoE = PerfI×QoEM→ QoEI
estimateQoS = PerfI×QoSM→ QoSI
The control manager integrates the data provided by the three information sources(i.e. policies, performance models and performance indicators). This data is used inthe control decision module to make corrective actions on the network. The actions areexecuted by so-called intervention manager, which is presented in the next subsection.
6

Generally speaking, there is no restriction of what actions can or should be taken, butas the framework is designed for network-level operation, we limit the possible actionsto the following items:
Action = ProvisionA | ShapingA | MarkingA |AccessCtrlA | HandoverA | AlertA
The decisions are, in respective order, dynamic network resource provisioning, packetor traffic shaping, packet marking for later control, per-client or per-connection accesscontrol, horizontal and/or vertical handover and alerting the network operator. Thesecontrol mechanisms are also discussed in the next subsection.
The last element required for the control manager is the decision, which is simply alist of actions:
Decision = [Action]
In simple cases, the decision can be a single action. In the prototype presented inSection 4, however, we combine several actions in the decision process to deal withdifferent scenarios and to mitigate quality degradations.
3.2. QoE Intervention Manager
The intervention manager is a physical device on the network which incorporates thenecessary tools to actualize the decisions set by the control manager. This componentmay act upon all traffic traversing the point of control, traffic flows of certain users orapplications, or individual packets, depending on the given task. The remainder of thissubsection describes the actions defined in (3.1) in depth.
3.2.1. Dynamic Network Resource Provisioning
Dynamic network resource provisioning is the act of augmenting or re-distributingnetwork resources, either adaptively during congestion or statically for certain servicesor users. These mechanisms can be, for instance, traffic re-routing or bandwidth re-allocation.
3.2.2. Shaping
Traffic shaping enforces certain performance bounds on different types of traffic. Thefocus of this mechanism is to limit the throughput of certain users or services, e.g. peer-2-peer traffic. The same method can also be used to throttle down other traffic in orderto give better performance to certain users or services. In other words, shaping allowsthe establishment of traffic classes with different priorities. Also, an important aspect intraffic shaping is that if certain traffic is restricted to enter the outgoing link, the packetsof that traffic are queued instead of just being dropped, which results in an increase indelay instead of in packet losses (unless a buffer overflow occurs).
3.2.3. Access Control
If the control manager detects that the network doesn’t have enough capacity to meetany new resource requirements, access control (also known as admission control) is oneway to prevent traffic from congesting the network. Access control can be implementedon the user level by preventing users from accessing the network, which is common in
7

cellular and ATM (asynchronous transfer mode) networks. Another option is to allow allusers to access the network but terminate new traffic flows if these flows would deterioratethe quality of existing ones. This model is more suitable in non- service-specific packet-switched networks, as the behaviour of users cannot be predicted beforehand: users mayconsume a large portion of the network capacity and use very quality-strict applicationsas well as simply idle in the network. Access control can be used in conjunction withother mechanisms to gain flexibility to the management system.
3.2.4. Handover
If a section of the network edge becomes overloaded, new or existing connectionsto the access point can be handed to other access interface (this procedure is called a“handover”). Handovers may be distinguished into horizontal and vertical, dependinginto whether a handover occurs between a single type of network interface (e.g. betweentwo WiFi-hotspots) or a variety of different network technologies (e.g. from 4G to 3G)[25]. In this context the role of the QoE control manager is to make the decision of thebest network selection during a vertical handover. To achieve this goal different verticalhandover decision algorithms may be applied.
3.2.5. Marking and Alerting
Two actions which do not have a concrete impact on the network by themselves arepacket marking and alerting. Alerting simply means that the system notifies the networkoperator under specific conditions, for example if the network or a part of it becomesheavily encumbered. Marking is the act of modifying packets by adding a specific markin a protocol header. On the network layer, the differentiated service code point (DSCP)field is a good candidate for marking. There are also some technology-specific fields,like 802.11p or 3GPP QoS classes for mobile traffic. Other network components outsidethe system can be given instructions on how to deal with different markings. Naturallymarking and alerting are not effectively actions (as defined above) by themselves, butthey may lead to procedures outside of the system, so from this perspective they can beconsidered as such.
4. Prototype Implementation
Following the conceptual framework presented in Section 3, we developed an au-tonomous network access point management software, which is able to monitor andmanage traffic traversing from the Internet to end users’ devices. The system can beplaced at the edges of a 3G or 4G network before the radio channel, but because thesystem operates on the network layer and above, the underlying technology is not re-stricted in other way than requiring it to have an IP layer. This solution demonstratessome features of the framework, and gives a concrete example on how it can be broughtinto a concrete application.
An outline of the software design and its components are given in Figure 2, whichfollows the same layering principle as in Figure 1. The bottom level, network path,contains the physical path from the rest of the ISP’s network to the transfer media.The Control Manager and associated types described in Section 3.1 can be found in theControl and Monitoring levels in Figure 2. Clients connect to the Internet through this
8

Figure 2: An overview of the access point software.
path using various devices. This path is marked with solid arrows (packet traffic). Othersignaling between different software components are marked with dashed arrows (controldata). The goal is to monitor and manage the downlink connections of the clients usingseveral tools and methods in the access point. To improve scalability, the access pointsystem operates almost fully autonomously: access points can be deployed and suspendedindependently.
There are two components in the network path: the Linux socket buffer and scheduler.The Linux socket buffer is a double-linked list which contains the packets traversing fromthe network towards clients’ devices. This is the default network queuing componentin Linux operating systems, both in Desktop computers and embedded systems (e.g.routers). Then, we use a queuing discipline to implement our traffic control. Although aqueuing discipline resides on more than one level, the scheduler, which ultimately decidesthe dequeuing order of packets, can be placed in the network path. This is the componentwhich physically realizes the traffic control.
The scheduler used in this implementation is a part of the hierarchical token bucket(HTB) queueing discipline [26]. This discipline allows us to form traffic classes withdifferent real-time constraints. Also, this is the tool that the intervention manager usesto realize the control decisions. The use of this tool in this work is described further in
9

the next subsection.The next two levels in the system are the data acquisition and monitoring levels. All
probes and sources which collect raw data are located in data acquisition level, and thecomponents which refine the produced data into knowledge are located on the monitoringlevel. In this implementation, there are three data sources: a QoS-measurement probe,a traffic classification probe and a queuing discipline information collector. First, allincoming traffic is mirrored to the classifier probe, which sorts packets into flows iden-tified by source and destination IP addresses, ports and transport layer protocol. Theprobe also collects flow-based statistical information, which is passed to the classificationalgorithm on the next level. The task of this algorithm is to classify each flow basedon the acquired statistical information. The passive QoS-probe, on the other hand, isplaced on the egress point of the AP after the scheduler. This probe collects a fewQoS-parameters for quality assessment on the next level, namely packet loss rate andpacket loss burst size. This information is used by the quality assessment component toproduce a quality estimation for each relevant flow in real-time. The last component inthe data acquisition layer is queuing discipline info collector, which retrieves the queuingdiscipline class information for performance model algorithms. The performance modelalgorithms produce a quality estimate, which helps in the decision process to determinethe best course of action.
Starting from the general definition of the control manager defined in (3.1), the man-agement decisions are governed by policies, performance indicators and performancemodels:
CMap :: PerfIap × PerfMap × Policyap → Decisionap
The information provided by the classification algorithm is also required by the controlmanager, since it contains the information of each traffic flow. The following subsectionspresent the four elements in detail.
4.1. Policy
The policy of the designed system consists of application policies and subscriber poli-cies. Applications are divided into three categories based on their real-time constraints:interactive, streaming and bulk. Interactive traffic has high two-way real-time constraintsin bandwidth, jitter, packet loss and delay. This type of traffic is generated by, for in-stance, VoIP-calls, videoconferencing and online games. The second category in priority,streaming, incorporates one-way streaming applications, which are intolerant to packetloss, low bandwidth and jitter. Applications such as IPTV and video-on- demand ser-vices fall in this category. It should be noted though, that applications in the samecategory may feature different behaviour during quality degradations. For example, apacket loss in an RTP video stream causes visual quality degradations, but a packet lossin an HTTP-based streaming causes TCP retransmission to occur, which results in adecrease in goodput, which in turn may manifest itself as stalls and long buffering timeson the application layer, or a quality adaptation in the case of dynamic HTTP streamingsystems such as DASH. The last category contains all elastic traffic and traffic which goesbeyond the interest of the network operator. In this work we focused on over-the-top
10

multimedia, especially in RTP-based video streaming2.In addition to application differentiation, we also have an implementation of a cus-
tomer differentiation scheme. Users are divided into two classes in accordance to theirprior subscription agreement with the ISP: premium users and normal users. Premiumusers have purchased a more expensive subscription type, which provides them a high-end connection type with better service quality. Normal users are customers who rely onthe traditional “best effort” service quality. The goal is to make the premium subscrip-tion more appealing to “heavy users”, who would consume a large portion of ISP’s basestation capacity. Although we want to place premium users above normal users in ser-vice quality, less constrained applications cannot supersede or preempt more constrainedones. Therefore, we settle on the following traffic category (in a descending order inpriority):
1. Premium interactive media
2. Normal interactive media
3. Premium streaming media
4. Normal streaming media
5. Premium bulk traffic
6. Normal bulk traffic / Default class
The first four classes are QoE-managed. The lowest class is the default class whereall the traffic is initially directed to (with the exception of premium bulk traffic, which isalways directed to the second lowest class). It can be seen from the above that premiumtraffic always gets a higher priority in the same application class, but never over differentapplication classes.
The tools required for implementing our policy scheme are a traffic classifier and asubscriber database. As the former one, we used a machine- earning algorithm called two-phased traffic classification tool. This tool relies on statistical features of packet trafficin the identification process, and it can be trained to classify individual applications ortraffic which meets certain statistical criteria. The tool is described in detail in [27].The subscriber database was left outside of this implementation, and the subscriptioninformation was managed by the access point software instead.
4.2. Performance Indicator
Perceived quality can be expressed in several ways. In this work, we use MOS as away to express the estimated quality quantitatively as the average opinion of a groupof users. The scale of MOS is often a number between 1 and 5. For giving a verbalpresentation for the scale, we use degradation category rating (DCR) [28]. In this rating,a MOS value of 5 means that impairments in the given multimedia are “imperceptible”,while a score of 1 means that the impairments are “very annoying”.
In order to form a complete data path from the network to the CM, we need com-ponents on data acquisition level and monitoring level. We use the Qosmet tool [29] toperform single-point QoS-measurements in the access point with a passive probe. The
2Our scope limitation to RTP stems from the fact that, at the time of writing, we have a suitablequality model for RTP-based video, but not yet for HTTP-based streams. This does not, however, limitthe generality of the proposed solution.
11
probe collects information on the data acquisition level, which is then transferred to theQosmet controlling entity on the monitoring level.
Although the performance indicator of this system considers only QoE, we are usingQoS along with application-level information to estimate the quality of experience in real-time. For this purpose, we use a machine-learning algorithm called pseudo-subjectivequality assessment [30, 31]. The algorithm was trained to map a set of QoS and RTP-video stream parameters into a single MOS value. These parameters were packet loss rate,packet loss burst size, video resolution and the amount of movement in the video. Datacollected from a subjective video assessment campaign was used to teach the algorithmto map these parameters into a MOS value. We trained and validated the algorithmwith 98 training samples and 20 validation samples, and the validation showed that themethod correlates well with the subjective data, resulting with a correlation coefficientof 0.91. Further details about the quality model can be found in [32].
4.3. Performance Model
It is the scheduler’s responsibility to coordinate the traffic according to the QoErequirements. In our demonstration, we consider 6 different queues (i.e. four for eachQoE-managed traffic class, one for premium bulk traffic and one for default traffic class).Since the traffic pattern is bursty, we are interested not only in calculating the packetloss probability but also the mean loss burst size. This information is sufficient in ourimplementation to estimate of the perceived quality of RTP-based video streams. Thedifference between a performance model and performance indicator is that the indicatorexpresses the current flow-based QoE, while the performance model can be used to predictthe impact of changing the priority class of a flow. Thus, with the help of the performancemodel, we can make more intelligent decisions when controlling traffic. It is indeedthe addition of the network performance models that ensures that decisions are donecorrectly, instead of just assuming that changing the class of a stream will result in animproved overall quality, as we did in our previous work [2].
In our prototype implementation we expand upon previous work integrating tra-ditional network performance models with quality estimates [33], by representing thescheduling process as 6 different separate M/M/1/Ki queueing systems, where Ki de-notes the storage capacity of each queue. For simplicity, we assume that the arrival rateof each type i follows a Poisson process, denoted as λi and the service time of each typei is exponentially distributed with mean 1/µi. Thus, the load ρ generated by type i isgiven by
ρi = λi/µi. (1)
Also, the loss probability pLifor each traffic type i can be expressed as
pLi =
{ρKi (1−ρi)1−ρ(K+1)
i
ρi 6= 11
K+1 ρi = 1(2)
If we assume that a burst of losses for the traffic type i is ji, then the mean loss burstsize for the traffic type mlbi is equal to
mlbi =
∞∑j=1
(ρi
1 + ρi
)j−11
(1 + ρi)=
1
(1 + ρi)(3)
12
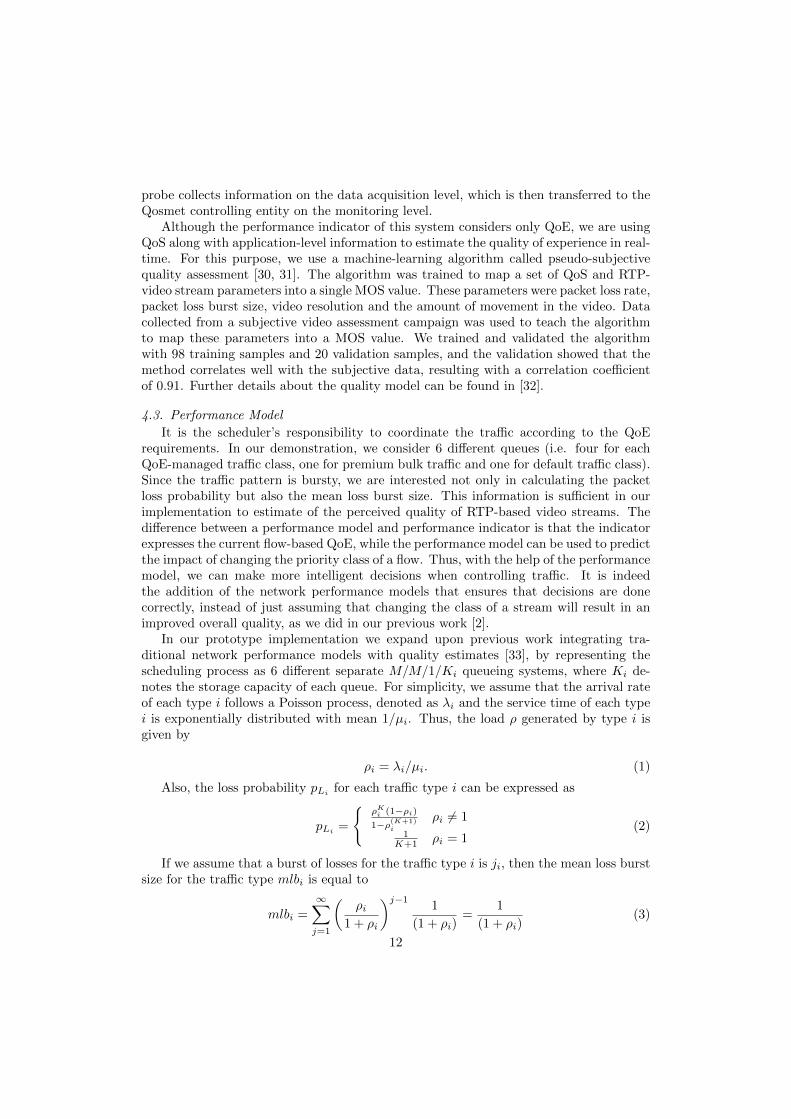
Figure 3: The queueing policy.
While this is a simplification of the way the HTB scheduler works, it is a reasonableone for the short timescales involved in the decision making process.
4.4. Decision
As defined in Section 3.1, a decision is a list of actions. There are three types of con-trol in this implementation: dynamic network provisioning, shaping and access control.Access control may only be performed when a new flow arrives. Also, each traffic classis treated differently from the management perspective, and this is when provisioningand shaping step in. Higher-priority classes gain a larger portion of the AP’s capacity,and they are also dequeued with a higher priority. If no flow is promoted to a higherclass, the AP operates in a “best-effort” manner. The network resources are managedby hierarchical token bucket algorithm [26], which distributes the available bandwidth tothe classes, while keeping utilization ratio high (that is, no bandwidth is ever left unusedas long as there are packets waiting for transmission). The shaping action incorporatesinter and intra-class scheduling: classes of higher priorities are always dequeued first, aslong as they have bandwidth available. Moreover, classes are also scheduled internally byusing the stochastic fairness queuing discipline. This queuing mechanism is described ina few online sources (e.g. [34, 35]). The complete queuing system is depicted in Figure 3.
When a new flow attempts to enter the AP, the control manager must make a decisionon whether the new flow can be supported or not, and thus if it can be permitted toenter. This decision is based on the application policy and the performance model. Theadmission control decision tree is depicted in Figure 4.
13

Figure 4: Access control decision process.
First, flows that are identified as bulk traffic are automatically permitted to enterthe AP. Since these flows are elastic, their resources can be re- allocated to other flowswhenever needed, so there is no reason to reject them. If the bulk traffic belongs to apremium user, the flow is permanently placed in the second lowest class. On the otherhand, if a flow belonging to a more constrained application class attempts to enter, theperformance model is used to predict the QoE this flow would receive either in the defaulttraffic class, or the higher class respective to the application type of the flow. There aretwo possible queues for each constrained flow, either the corresponding higher class ofthe flow (e.g. an interactive application flow generated by a premium user is promoted inthe highest class etc.) or the default queue. If it is determined that the quality in eitherone of these queues would be less than the admission threshold (which in this systemwas set to 4.0), the flow is rejected. In the other case we can conclude that the qualityof the flow can be maintained in a satisfactory level in the system in at least one queue,so the flow is permitted to access.
As stated, premium bulk traffic is placed in the second lowest class, and normal bulktraffic and all permitted constrained traffic is placed in the default class. Bulk traffic flowsstay in these classes permanently, but this is not the case with constrained applicationflows (i.e. streaming or interactive flows). Figure 5 depicts the decision process forconstrained flows, which is processed every one second for each flow. First we checkwhich class the constrained flow is currently in. If it is in the default class, it stays there
14

Figure 5: Per-flow QoE decision process.
until the estimated MOS of the flow drops below “bad” threshold (which was set to 3.0in this demonstration). Now we need to determine if the flow should be moved to thehigher class or keep it in the current class. For this task we use again the performancemodel. The estimated MOS-score is calculated for both queues, and the flow is movedto the higher queue if the predicted MOS value of this queue is greater than “good”threshold (which was set to 4.0). If, however, this is not true, then the system willcompare whether the predicted MOS is still above the bad threshold and also above thepredicted MOS of the default class. If these conditions are met, then moving the flow tothe higher class is still beneficial. If all these tests fail, then the best option is to take noaction and keep the flow in the default class.
The process of determining the best course of action for flows in higher classes issomewhat similar. But in order to avoid over-prioritization, which would result in toomany flows being promoted to higher classes, we must determine when the conditionsin the default class are viable for flow de- promotion. First, the system checks if thepredicted MOS of the default class is above the good threshold. If so, the flow can bemoved to the default class right away. In the other case, moving the flow back to the
15

Figure 6: Testbed
default class is still a good option if the predicted MOS of the default class is above theMOS of the higher class. With this decision tree, we can limit the amount of flows inthe higher classes so that the quality of these flows remain good. Otherwise flows couldoverload the higher queues during congestion periods.
5. Evaluation setup
The testbed used in this demonstration is illustrated in Figure 6. We used two clientcomputers to emulate up to 5 (using one end device for each client would have the sameresult, as the management software differentiates flows and subscription types, not enddevices). The access point software was implemented in a laptop (shown in the center ofthe figure). An external computer was used as a D-ITG and VLC media player server,which were used to transmit bulk traffic and video streams, respectively. The router wasused to implement NAT on the subnet, and the switch to allow connecting more than onedevice on the AP. It should be noted though that the software can be also implementedin a single Linux-enabled router as well.
For all the tests, we used the same reference video, which can be obtained freelyfrom [36]. The video features an MP4-encoded, 1280x546 resolution video stream with24 frames per second. For emulating TCP bulk traffic, we used a tool called DistributedInternet Traffic Generator (D-ITG) [37], which was set to generate 2048 packets persecond, each having a payload of 256 bytes. For emulating packet losses, we used a toolcalled netem, which is integrated to Linux iproute2 toolset [38] along with the queuingdisciplines needed to implement the desired behaviour.
We ran several tests in order to study the developed system. Completing a holistictest for this type of system would be extremely complex and so would be extracting thedesired information from it. We therefore chose several simpler scenarios to validate thedifferent aspects of the system’s functionality: we tested the differentiation between trafficclasses to observe how inter-class prioritization impacts the perceived quality. Then weran an intra-class test where normal and premium users have to share common resources.We then performed a more complex test where the AP had to resolve the distribution ofresources to a mix of different applications and users with different classes. We also tested
16

the admission control algorithm to validate that it didn’t allow the AP to become over-burdened. Finally, an important thing was to measure how fast the system could reactto a quality degradation, as the reaction time is a critical component in user satisfaction.Each test except the performance test was run in pairs; once without the managementsystem (i.e. a simple “best effort” FIFO-system) and once with the management system.These pairs were repeated 10-40 times depending on the test to acquire statisticallysignificant values showing that the system operates as demonstrated in the figures. Foreach test, we calculated standard deviations of MOS scores to show that the results areconsistent and reliable. The deviations are calculated for each video stream as follows:In a test run, samples are taken every second. Each sample is rounded to the nearestsecond and MOS values are windowed with 4 samples. For each second where there areat least 2 samples a standard deviation is calculated, and all samples are finally averagedto get a mean standard deviation.
6. Results
To show the impact of the developed QoE-driven access point management system, wepresent some testbed results in this section. First, we present two simple test cases wheretraffic and client differentiation are demonstrated. Then we introduce a performance testwhich measures the reaction time of the system. In the last two tests we show how theadmission control prevents traffic from over-burdening the AP, and how the system isable to balance the load of different traffic types in a more complex scenario.
The first test shows how the AP performs with and without the management systemduring congestion. Shown in Figure 7, the test was run using an RTP-video streamagainst background traffic. The RTP-stream was initiated at the beginning of the mea-surement, and background bulk traffic at 60 seconds marked by the vertical dashed line.The management system is disabled in run 1 and enabled in run 2. Without the man-agement system in run 1, the quality of the RTP stream begins to decline once thebackground traffic is initiated. Although the background traffic operates on TCP, whichfeatures congestion control mechanisms, the adaptation does not facilitate the situationfast enough, and the RTP- stream begins to suffer from packet loss and increased delay.In run 2, the drop in quality is detected by the management system, and the RTP- streamis promoted to a higher class. Now these two traffic types are given different bandwidthand dequeuing priorities, which results in an improved QoE of the RTP-stream. 15 Repe-titions of this test showed that the MOS value of the RTP-video increased approximately0.9 points on average (0.05 standard deviation), and the variance of MOS reduced from1.92 to 0.21, indicating that the quality didn’t only improve but also remained morestable during the test. One thing which should be noted from Figure 7b is that whilethe quality of the video stream increased significantly, there was hardly any differencein bulk throughput between these two test runs. This is most like due to the fact thatin both cases the bulk transfer suffers from packet losses due to rate adaptation, but inthe latter case the reaction is faster because of prioritization. It can be noted, especiallybetween 170 and 180 seconds, that the rate of the bulk transfer slows down faster whenthe management system is on, but the difference is marginal since the RTP video onlyrequires a slightly larger bandwidth to operate with good quality.
Another test was also executed which demonstrates the differentiation between userclasses instead of applications. In this test, two RTP-stream were initiated simultane-
17
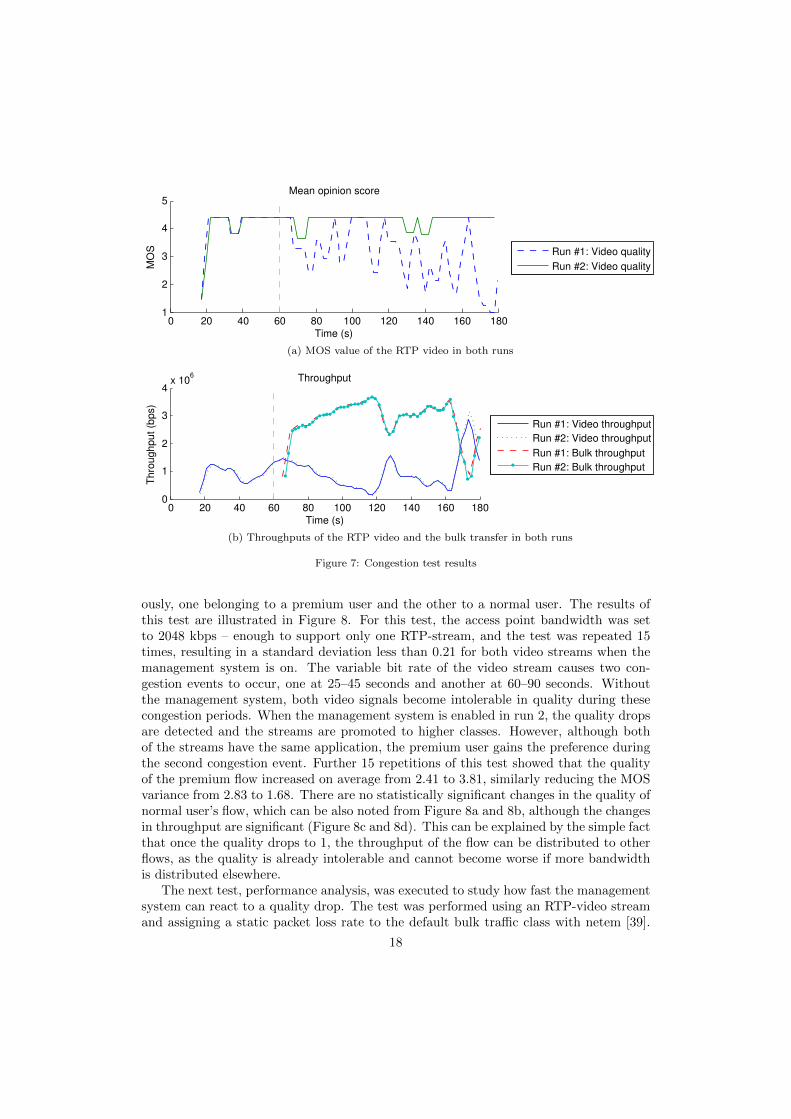
(a) MOS value of the RTP video in both runs
(b) Throughputs of the RTP video and the bulk transfer in both runs
Figure 7: Congestion test results
ously, one belonging to a premium user and the other to a normal user. The results ofthis test are illustrated in Figure 8. For this test, the access point bandwidth was setto 2048 kbps – enough to support only one RTP-stream, and the test was repeated 15times, resulting in a standard deviation less than 0.21 for both video streams when themanagement system is on. The variable bit rate of the video stream causes two con-gestion events to occur, one at 25–45 seconds and another at 60–90 seconds. Withoutthe management system, both video signals become intolerable in quality during thesecongestion periods. When the management system is enabled in run 2, the quality dropsare detected and the streams are promoted to higher classes. However, although bothof the streams have the same application, the premium user gains the preference duringthe second congestion event. Further 15 repetitions of this test showed that the qualityof the premium flow increased on average from 2.41 to 3.81, similarly reducing the MOSvariance from 2.83 to 1.68. There are no statistically significant changes in the quality ofnormal user’s flow, which can be also noted from Figure 8a and 8b, although the changesin throughput are significant (Figure 8c and 8d). This can be explained by the simple factthat once the quality drops to 1, the throughput of the flow can be distributed to otherflows, as the quality is already intolerable and cannot become worse if more bandwidthis distributed elsewhere.
The next test, performance analysis, was executed to study how fast the managementsystem can react to a quality drop. The test was performed using an RTP-video streamand assigning a static packet loss rate to the default bulk traffic class with netem [39].
18

(a) MOS value of the RTP videos in the first run
(b) MOS value of the RTP videos in the second run
(c) Throughputs of the RTP videos in the first run
(d) Throughputs of the RTP videos in the second run
Figure 8: Client priority test results
The test was repeated 40 times. It was discovered that the system detects quality de-teriorations in 2.8 (with 1.44 seconds of standard deviation) seconds on average and itcan restore the quality to an acceptable level (i.e. above 4.0) in 4.0 seconds on average(with 1.78 seconds of standard deviation). But during these tests we realized that thereaction time is much larger in a congestion event that in this test (as one can witnessfor example in Figure 8b). We studied the issue and found out that when the defaultclass consumes all the bandwidth of the AP, a flow which is promoted to a higher class
19

(a) MOS value of the videos when admission control is inactive
(b) MOS value of the videos when admission control is active
Figure 9: Admission control operation
does not instantly receive the bandwidth the class is supposed to gain. This results inheavy packet losses to the promoted flow for approximately 5 seconds, which deterioratesthe results somewhat acquired in congestion tests. This issue is related either to HTB orLinux iproute2 implementation, but we are still able to demonstrate the benefits of thesystem.
Although the AP management system improves the perceived quality of selected ap-plications, the system may fail nevertheless if there is simply not enough capacity tosupport all the flows. If we know beforehand that a new arriving flow cannot receive asatisfactory quality because of congestion, we can reject the entry of that flow immedi-ately. We have demonstrated how the admission control works in Figure 9. We repeatedthis test 10 also times to ensure consistency of the results. In 8 runs, the admissioncontrol permitted 2 flows to enter the AP, and in 2 runs 3 flows were permitted. Whenthe management system was off, the average MOS score of all video streams was 2.29with a standard deviation of 0.38, while the respectable values were 4.17 and 0.14 whenthe management system, and therefore admission control, was on.
Figure 9a depicts the situation where multiple RTP flows attempt to enter the accesspoint in 10-second intervals. Without admission control, these flows begin to suffer fromunacceptable quality quite soon, especially during peak bit rates. Figure 9b depicts thesame situation when the admission control is on. Only two flows are permitted to enterthe AP, as the admission control algorithm calculates that there is enough capacity tomaintain a satisfactory quality. However, at 190 seconds the bit rates of the videos
20

(a) MOS value of the videos when the management system is inactive
(b) MOS value of the videos when the management system is active
Figure 10: System demonstration with both types of clients
increase significantly, and the management system has to step in and differentiate theflows.
In order to use performance models in quality prediction, we need to know how muchcapacity the new arriving flow would consume. This is difficult to predict beforehand, butthere are several ways to make a good guess. One possibility is to perform DPI on packetssent during the handshake procedure to see what kind of data the flow will contain. Ifthe data is unavailable then one can make assumptions based on other information, suchas the URL field or the history of the client. We predicted the flow throughput basedon the average throughput of flows already in the AP, assuming that a new RTP flowwill consume approximately the same amount of throughput as all the other flows onaverage.
Finally, we introduce a test where both traffic and client differentiation is present. Inthis test, we have two premium and two normal users, each downloading an RTP video.Additionally, there is a TCP bulk transfer running in the background. This test was alsorun 10 times, resulting in an average standard deviation less than 0.27 in MOS scale.The benefit of having the management system is shown in Figure 10.
Figure 10a shows the basic scenario without any traffic management. Several flowsenter the AP and use approximately an even amount of resources. The TCP bulk transfer
21

adapts to the bandwidth requirements of these flows, which can be seen as a correlationbetween bulk throughput and video quality (i.e. videos enter a small bit rate phase,which improves the perceived quality and allows more capacity to the bulk transfer).Regardless, the quality of the video streams is unacceptable during higher bit rates.
The management system is enabled in Figure 10b, and an improvement can be seenfor streams belonging to premium users. At approximately 30 seconds, the managementsystem perform a promotion of premium flows to a higher class (but as stated earlier, theflow promotion during congestion can cause additional packet losses, hence the slightlyworse quality compared to normal users). At approximately 70 seconds, the system runsa check using performance models and notices that it cannot fully support the premiumflows if both of them reside in the higher class. Therefore, one of these flows is de-promoted back to the default class. Now, one of the flows receives the best possiblequality during congestion, while the other premium user will have a satisfactory videoquality. For the normal users, there is hardly any difference between having and nothaving the management system. From these results we can conclude, that the system isable not only to perform prioritization, but to intelligently optimize the loads of differentclasses, whenever feasible 3.
7. Conclusions
In this paper, we presented a generic QoS/QoE framework for enabling quality controlin packet-switched networks. We focused especially in the management component ofthis framework to show how data collected from a network can be refined into knowledgeof quality perceived by users, and how to take corrective measures when necessary. Wealso showcased this framework by introducing and demonstrating a network access pointmanagement software, built around the proposed framework’s architecture.
We executed several tests where RTP video streams were subject to quality-drivennetwork control. We evaluated the performance of the system and functionalities oftraffic differentiation, client differentiation, admission control and quality optimization.According to the results, the system performed as expected, and each of these testsresulted in improved quality for the relevant clients. Especially good results were observedfor customer differentiation, which is an important aspect to ISP’s; the tests showed thatit is possible to improve the perceived quality of premium users without sacrificing thequality of streams belonging to normal users.
Currently, the demonstrated AP management system supports quality-driven controlfor RTP streams only. This is due only to the availability of a suitable model for RTPvideo quality, and could trivially be extended by adding other models (e.g. for HTTP-based video streaming). Although more applications need to be supported, fortunatelythere is a need to support only applications which are most relevant to the ISP and cus-tomers. Namely, these are real-time multimedia applications like games, VoIP and video,since in these applications quality control is relevant. A particularly good applicationwould be HTTP video streaming, as it has recently become very popular among OTTcontent providers.
3Starting from approximately 120 seconds, all flows suffer from bad quality, because the video bitrate rises so much that there is not enough capacity to support even a single flow.
22

Another limitation in this work is the throughput estimation of new flows, as explainedin the admission control test. Regardless of how the estimation is done, with this kindof management system it is more important not to under-utilize the access point. Themanagement software can deal with large amounts of traffic, but it is more beneficial forthe user to know at the very beginning if the stream will be supported or not. This alsoenables the system to offer more bandwidth to non-constrained traffic when the AP isnot filled with high-priority traffic which constantly features intolerable quality. This iswhy admission control is essential although not seemingly necessary from the point ofquality management.
When congestion occurs, distributing the resources QoE-wise becomes an optimiza-tion problem. Customers may have different priorities, but so have applications. Whenthe perceived quality of one application drops below an acceptable level, the applica-tion can be considered useless and therefore all resources distributed to that applicationare, in a way, wasted. Traditional approaches of conflating application quality with thebandwidth allocated to it no longer apply; different multimedia applications require notonly capacity but also other guarantees in terms of delay, jitter and packet losses. Whenthese factors are combined human perception, optimization becomes even more difficult.A momentary good QoE doesn’t mean much to users if their application is operationalonly occasionally, as seen in the tests performed, but the quality also needs to remainstable. We introduced a framework and a system which is not only able to make a gooddecision for given time instant, but also to predict the outcome of different decisions andpick the most optimal one. The system is not only able to improve the quality of selectedstreams, but also to be conservative with the available resources and identify when theyare really needed.
Acknowledgments
The research behind this paper was conducted within the IPNQSIS (IP Network Mon-itoring for Quality of Service Intelligent Support), a Celtic Call 7 project and QuEEN,a Celtic Call 8 project. The authors would like to thank Tekes, the Finnish FundingAgency for Technology and Innovation, for financially supporting this research.
References
[1] A. Bergkvist, D. Burnett, C. Jennings, A. Narayanan, WebRTC 1.0: Real-time CommunicationBetween Browsers – WebRTC’s Editor’s Draft (Jan. 2013).URL http://dev.w3.org/2011/webrtc/editor/webrtc.html
[2] J. Seppanen, M. Varela, QoE-driven Network Management for Real-time Over-the-Top MultimediaServices, in: WCNC, IEEE, 2013, pp. 1621–1626.
[3] S. Jelassi, G. Rubino, H. Melvin, H. Youssef, G. Pujolle, Quality of Experience of VoIP Service:A Survey of Assessment Approaches and Open Issues, Communications Surveys Tutorials, IEEE14 (2) (2012) 491 –513.
[4] R. Serral-Gracia, E. Cerqueira, M. Curado, M. Yannuzzi, E. Monteiro, X. Masip-Bruin, AnOverview of Quality of Experience Measurement Challenges for Video Applications in IP Networks,in: E. Osipov, A. Kassler, T. Bohnert, X. Masip-Bruin (Eds.), Wired/Wireless Internet Commu-nications, Vol. 6074 of Lecture Notes in Computer Science, Springer Berlin Heidelberg, 2010, pp.252–263.
[5] W. Lin, C.-C. J. Kuo, Perceptual visual quality metrics: A survey, Journal of Visual Communicationand Image Representation 22 (4) (2011) 297 – 312.
23

[6] S. Chikkerur, V. Sundaram, M. Reisslein, L. Karam, Objective Video Quality Assessment Methods:A Classification, Review, and Performance Comparison, Broadcasting, IEEE Transactions on 57 (2)(2011) 165 –182.
[7] E. Kafetzakis, H. Koumaras, M. Kourtis, V. Koumaras, QoE4CLOUD: A QoE-driven multidimen-sional framework for cloud environments, in: Telecommunications and Multimedia (TEMU), 2012International Conference on, 2012, pp. 77 –82.
[8] T. Hoßfeld, R. Schatz, M. Varela, C. Timmerer, Challenges of QoE management for cloud applica-tions, Communications Magazine, IEEE 50 (4) (2012) 28 –36.
[9] G. Gomez, J. Lorca, R. Garcıa, Q. Perez, Towards a QoE-Driven Resource Control in LTE andLTE-A Networks, Journal of Computer Networks and Communications 2013 (2013) 1–15.
[10] J.-O. Fajardo, F. Liberal, I.-H. Mkwawa, L. Sun, H. Koumaras, QoE-driven dynamic managementproposals for 3G VoIP services, Computer Communications 33 (14) (2010) 1707 – 1724.
[11] M. Mu, E. Cerqueira, F. Boavida, A. Mauthe, Quality of experience management framework forreal time multimedia applications, Int. J. Internet Protoc. Technol. 4 (1) (2009) 54–64.
[12] F. Matos, A. Matos, P. Simoes, E. Monteiro, QoS adaptation in inter-domain services, in: IntegratedNetwork Management (IM), 2011 IFIP/IEEE International Symposium on, 2011, pp. 257 –264.
[13] A. Vakili, J.-C. Gregoire, QoE Management in a Video Conferencing Application, in: J. J. (JongHyuk) Park, V. C. Leung, C.-L. Wang, T. Shon (Eds.), Future Information Technology, Application,and Service, Vol. 164 of Lecture Notes in Electrical Engineering, Springer Netherlands, 2012, pp.191–201.
[14] H.-J. Kim, K.-H. Lee, J. Zhang, In-service Feedback QoE Framework, in: Communication Theory,Reliability, and Quality of Service (CTRQ), 2010 Third International Conference on, 2010, pp. 135–138.
[15] F. Agboma, A. Liotta, QoE-aware QoS management, in: Proceedings of the 6th InternationalConference on Advances in Mobile Computing and Multimedia, MoMM ’08, ACM, New York, NY,USA, 2008, pp. 111–116.
[16] A. Khan, L. Sun, E. Jammeh, E. Ifeachor, Quality of experience-driven adaptation scheme for videoapplications over wireless networks, Communications, IET 4 (11) (2010) 1337 –1347.
[17] J. Lloret, M. Garcia, M. Atenas, A. Canovas, A QoE management system to improve the IPTVnetwork, International Journal of Communication Systems 24 (1) (2011) 118–138.
[18] K. Piamrat, A. Ksentini, C. Viho, J.-M. Bonnin, QoE-Aware Admission Control for MultimediaApplications in IEEE 802.11 Wireless Networks, in: Vehicular Technology Conference, 2008. VTC2008-Fall. IEEE 68th, 2008, pp. 1–5.
[19] E. Gallo, M. Siller, J. Woods, An Ontology for the Quality of Experience framework, in: Systems,Man and Cybernetics, 2007. ISIC. IEEE International Conference on, 2007, pp. 1540 –1544.
[20] L. De Cicco, S. Mascolo, V. Palmisano, Feedback control for adaptive live video streaming, in:Proceedings of the second annual ACM conference on Multimedia systems, MMSys ’11, ACM, NewYork, NY, USA, 2011, pp. 145–156.
[21] J. Lloret, A. Canovas, J. Tomas, M. Atenas, A network management algorithm and protocol forimproving qoe in mobile iptv, Computer Communications 35 (15) (2012) 1855 – 1870.
[22] M. Atenas, A. Canovas, M. Garcia, J. Lloret, Iptv transcoding to avoid network congestion, in:Networking and Services (ICNS), 2010 Sixth International Conference on, 2010, pp. 36 –41.
[23] C. Krasic, J. Walpole, W.-c. Feng, Quality-adaptive media streaming by priority drop, in: Pro-ceedings of the 13th international workshop on Network and operating systems support for digitalaudio and video, NOSSDAV ’03, ACM, New York, NY, USA, 2003, pp. 112–121.
[24] P. Amon, H. Li, A. Hutter, D. Renzi, S. Battista, Scalable video coding and transcoding, in:Automation, Quality and Testing, Robotics, 2008. AQTR 2008. IEEE International Conference on,Vol. 1, 2008, pp. 336 –341.
[25] A. Sgora, D. Vergados, Handoff prioritization and decision schemes in wireless cellular networks: asurvey, Communications Surveys Tutorials, IEEE 11 (4) (2009) 57 –77.
[26] M. Devera, Htb home.URL http://luxik.cdi.cz/~devik/qos/htb
[27] M. Hirvonen, Two-phased network traffic classification method for quality of service management,Master’s thesis, University of Oulu, The Department of Electrical and Information Engineering(2009).
[28] ITU-T Recommendation P.800, Methods for subjective determination of transmission quality (Aug.1996).
[29] Converging Networks Laboratory, VTT, Qosmet - enabling passive qos measurements.URL http://www.cnl.fi/qosmet.html
24

[30] S. Mohamed, Automatic evaluation of real-time multimedia quality: a neural network approach,Ph.D. thesis, INRIA/IRISA, Univ. Rennes I (Jan. 2003).
[31] M. Varela, Pseudo-Subjective Quality Assessment of Multimedia Streams and its Applications inControl, Ph.D. thesis, INRIA/IRISA, univ. Rennes I, Rennes, France (Nov. 2005).
[32] T. Maki, D. Kukolj, D. Dordevic, M. Varela, A Reduced-Reference Parametric Model for Audiovi-sual Quality of IPTV Services, in: Proceedings of QoMEX 2013, Klagenfurt, Austria, 2013.
[33] G. Rubino, M. Varela, A New Approach for the Prediction of End-to-End Performance of Multime-dia Streams, in: First International Conference on Quantitative Evaluation of Systems (QEST’04),2004.
[34] M. Brown, Linux traffic control howto.URL http://linux-ip.net/articles/Traffic-Control-HOWTO
[35] B. Hubert, Linux advanced routing & traffic control howto.URL http://lartc.org/lartc.html
[36] Amsterdam Blender Institute, Sintel, the durian open movie project.URL http://www.sintel.org
[37] Universita degli Studi di Napoli “Federico II”, Dipartimento di Informatica e Sistemistica, D-itg,distributed internet traffic generator.URL http://www.grid.unina.it/software/ITG/
[38] The Linux Foundation, iproute2.URL http://www.linuxfoundation.org/collaborate/workgroups/networking/iproute2
[39] The Linux Foundation, netem.URL http://www.linuxfoundation.org/collaborate/workgroups/networking/netem
25