Improved heat stability by whey protein–surfactant interaction
Upload
independentCategory
view
0download
0
Journal of Food Engineering 147 (2015) 68–78
Contents lists available at ScienceDirect
Journal of Food Engineering
journal homepage: www.elsevier .com/locate / j foodeng
Effect of calcium content and flow regime on whey protein fouling andcleaning in a plate heat exchanger
http://dx.doi.org/10.1016/j.jfoodeng.2014.09.0200260-8774/� 2014 Elsevier Ltd. All rights reserved.
⇑ Corresponding author at: INRA, UR638, PIHM (Processus aux Interfaces etHygiène des Matériaux), BP 20039, 369, rue Jules Guesde, F-59651 Villeneuved’Ascq, France. Tel.: +33 (0)320 435 418; fax: +33 (0)320 435 426.
E-mail address: [email protected] (M. Khaldi).
M. Khaldi a,e,⇑, P. Blanpain-Avet a, R. Guérin a, G. Ronse a, L. Bouvier a, C. André a,d, S. Bornaz f,T. Croguennec b,c, R. Jeantet b,c, G. Delaplace a
a INRA, UR638, PIHM (Processus aux Interfaces et Hygiène des Matériaux), BP 20039, 369, rue Jules Guesde, F-59651 Villeneuve d’Ascq, Franceb AGROCAMPUS OUEST, UMR 1253, F-35042 Rennes, Francec INRA, UMR1253, F-35042 Rennes, Franced Laboratoire de Génie des procédés, HEI, F-59046 Lille, Francee Institut National Agronomique de Tunisie, 43, avenue Charles Nicolle, 1082 Tunis-Mahrajène, Tunisiaf Ecole Supérieure des Industries Alimentaires de Tunis, 58, avenue Alain Savary, 1003 Tunis-Cité El Khadra, Tunisia
a r t i c l e i n f o a b s t r a c t
Article history:Received 11 March 2014Received in revised form 9 September 2014Accepted 11 September 2014Available online 19 September 2014
Keywords:Protein foulingCleaningBeta-lactoglobulinCalcium concentrationHydrodynamicsPlate heat exchangerDimensional analysis
Fouling and cleaning with a whey protein concentrate solution in a plate heat exchanger were investi-gated with a varying calcium concentration (from 70 to 87.5 mg L�1) and under a wide range of hydro-dynamic conditions for a bulk fouling fluid temperature, ranging from 60 and 96 �C.
This work demonstrates that increasing the calcium concentration in whey protein concentrate con-tributes to the amount of fouling and affects the thermal conductivity of the deposit. It was also observedthat the fluid flow regime during fouling, impacts the deposit growth, modifies the structure of fouledlayers and has a significant consequence on cleaning behaviour.
Finally, a dimensional analysis together with experimental measurements, allowed a relationship to beestablished enabling prediction of the amount of dry mass deposited locally as a function of the knowncalcium content, Reynolds number and bulk fluid temperature.
� 2014 Elsevier Ltd. All rights reserved.
1. Introduction
In the food industry, thermal treatments are often carried out toreduce the microbial load of food products and to deactivateenzymes that would otherwise cause quality loss. The fouling ofheated surfaces, inherent to heat treatments, remains one of themajor issues in food industry, as this compromises product qualityand process efficiency (Visser and Jeurnink, 1997; Jun and Puri,2007; Mahdi et al., 2009).
Fouling with WPC solutions has been widely investigated overthe last twenty years both in PHEs, (Lalande et al., 1984; Daufinet al., 1987; Delplace et al., 1994; Jeurnink and de Kruif, 1995;Christian et al., 2002; Srichantra et al., 2006), or in tubular heatexchangers (THEs) (Delsing and Hiddink, 1983; Gotham et al.,1989; Jeurnink et al., 1989; Belmar-Beiny et al., 1993). Foulingdeposits consist of a layer of protein aggregates and minerals,
which are mostly calcium phosphate (Tissier and Lalande, 1986).The protein/mineral ratio in the deposits depends on temperature(Burton, 1968).
Protein fouling is mainly due to the protein aggregation result-ing from disulphide interchange reactions (�SH/SS) (Lalande et al.,1985; Shimada and Cheftel, 1989; Hoffmann and Van Mil, 1997).Beta-lactoglobulin (BLG) is recognized as the main protein respon-sible for fouling in milk and milk derivatives (Lalande et al., 1985;Lalande and Rene, 1988).
Lin et al. (2006) reported the effects of ionic calcium on reac-tions related to casein micelle stability, such as heat stability andsusceptibility to sediment formation and fouling. In the case ofWPC fouling, the literature also evokes calcium-dependent fouling,yet few quantitative data are available concerning the influence ofcalcium on the behaviour of whey protein fouling during longexperiments in a PHE. It has been recognized that calcium ionssubstantially affect the interactions between protein molecules(Schmidt et al., 1978) and have a strong impact on the BLG dena-turation/aggregation (Jeyarajah and Allen, 1994; O’Kennedy andMounsey, 2009; Petit et al., 2011). However, the specific interac-tion between Ca2+ and BLG at molecular level are still poorly

Nomenclature
A constant defined by Eq. (7) (–)Cca calcium concentration (kg m�3)Cpp, Cph specific heat for the product and hot water (J kg�1 K�1)dh hydraulic diameter (m)di internal diameter (m)e gap between two consecutive plates (m)FT logarithmic mean temperature difference correction
factor (–)kd, kr coefficients in Eq. (7) (–)_mp; _mh mass flow rates for the product and hot water (kg s�1)
Md amount of deposit (kg)Q flow rate (m3 s�1)R molar ratio within the fouling solution, equal to the cal-
cium concentration divided by the b-lactoglobulin con-centration (–)
Re Reynolds number (–)Rf fouling resistance (m2 �C W�1)S heat transfer area (m2)t time (s)�u average flow velocity (m s�1)Ug overall heat transfer coefficient (W m�2 K�1)
v average crossflow velocity of the fouling solution in thefouling step between two plates of the PHE (m s�1)
w width of the V7 plate (m)DP0 pressure drop for clean exchanger (mbars)DP instantaneous pressure drop (mbars)DhLMTD logarithmic mean temperature difference (K)l Newtonian viscosity (Pa s)q density (kg m�3)h temperature (K)
Subscripth hot wateri inleto outletj channel numberp product
AbbreviationsBLG beta-lactoglobulinPHE plate heat exchangerWPC whey protein concentrate
M. Khaldi et al. / Journal of Food Engineering 147 (2015) 68–78 69
understood (Simons et al., 2002). The presence of calcium ionsenhances the heat-induced aggregation of BLG (Sherwin andFoegeding, 1997), and the structure of aggregates was found todepend on a critical molar ratio of calcium to protein (Phan-Xuanet al., 2013).
It has been suggested that three parameters, or combinations ofthem, might be responsible for calcium-induced protein aggrega-tion (Simons et al., 2002). The first phenomenon is related to inter-molecular cross-linking of adjacent negatively-charged orcarboxylic groups by the formation of protein–Ca2+–protein com-plexes (Bryant and McClements, 1998; Hongsprabhas et al.,1999). The second is the intramolecular electrostatic shielding ofnegative charges on the protein, thereby favouring BLG aggrega-tion by hydrophobic bonds (Hongsprabhas and Barbut, 1997;Roefs and Peppelman, 2001). The third is an ion-induced confor-mational change, which leads to altered hydrophobic interactionsand aggregation at elevated temperatures (Kinsella andWhitehead, 1989; Wang and Damodaran, 1991). The latter indi-cates that calcium acts principally on BLG aggregation (Mulvihilland Donovan, 1987; Petit et al., 2011) by both increasing the sizeof aggregates (Allen and Smith, 2001; Schmitt et al., 2007) and low-ering the BLG denaturation temperature, which in turn, favoursaggregate formation (De Wit, 1990; Simmons et al., 2007). Its rolein BLG unfolding is limited to the reinforcement of the native BLGtertiary structure (Petit et al., 2011). However, it has been demon-strated that the role of Ca2+ in the formation of intermolecularbridges is unlikely (Xiong et al., 1993), and its action was limitedto screening BLG surface charges (Simons et al., 2002).
Interestingly, Phan-Xuan et al. (2013) reported that a criticalmolar ratio of calcium to protein (noted R) is needed to permitmicrogel formation. These are independent of the protein concen-tration for pH P 6.9. At R < 1, aggregates have the form of smallcurved strands, whilst at higher ratios, larger spherical particlesare formed. The critical ratio increases only slightly with decreas-ing heating temperature from 1–1.5 at 85 �C to 2–2.5 at 70 �C.The microgel suspensions are stable in a narrow range of R,although aggregating at higher calcium concentrations.
Alternatively, it has been shown that the deposit consists ofboth protein and calcium particles aggregates. This protein is
present on the surface, as well as in steel defects and inside thegrain boundaries. However, the calcium ions are mostly concen-trated in the upper side of the grain boundaries (Jimenez et al.,2013).
Although the residence time within the heat exchanger wouldhave an effect on the thermal denaturation kinetics of BLG, dataconcerning the effect of the flow regime upon the fouling behav-iour for long duration experiments (i.e. Reynolds numbers or shearstress values) are scarce. The only work that gives detailed resultson the effect of the Reynolds number on fouling by WPC in a THE isthat of Belmar-Beiny et al. (1993) for a fouling run of an hour. Theyshowed that the higher the Reynolds number (in the range 2000–7000) the smaller the deposit, which decreased steadily, even witha shear rate lower than those encountered in PHE.
There is therefore a lack of data whether confirmed or contro-versial concerning the dependence of the deposit fouling structureon the calcium content of the fouling fluid or on the Reynolds num-ber in a PHE. To fill the gap, the effect of both the calcium content(70–87.5 mg L�1 corresponding to R ranging from 6.8 to 8.5) andthe Reynolds number on fouling, with a WPC solution as a modelfluid, was investigated. WPC was chosen because it is widely usedas a functional food ingredient in food products. Consequently, itconstitutes a good model for other milk-based products. Theexperimental fouling study was performed using a whey proteinconcentrate in a well-defined geometry, namely a plate heatexchanger, for 330 min. In addition, cleaning trials were performedto investigate the effect of the deposit structure on the cleaningprocess.
2. Materials and methods
2.1. Fouling fluid
Whey protein powder from sweet whey (WPC 75, Armor Prote-ines, France) dissolved in controlled-quality water (1% w/w), wasused as the model fluid. The composition of the WPC powderwas mainly proteins (75% w/w), in which BLG and alpha-lactalbu-min represented 63% and 11% respectively, and lactose (10% w/w).
70 M. Khaldi et al. / Journal of Food Engineering 147 (2015) 68–78
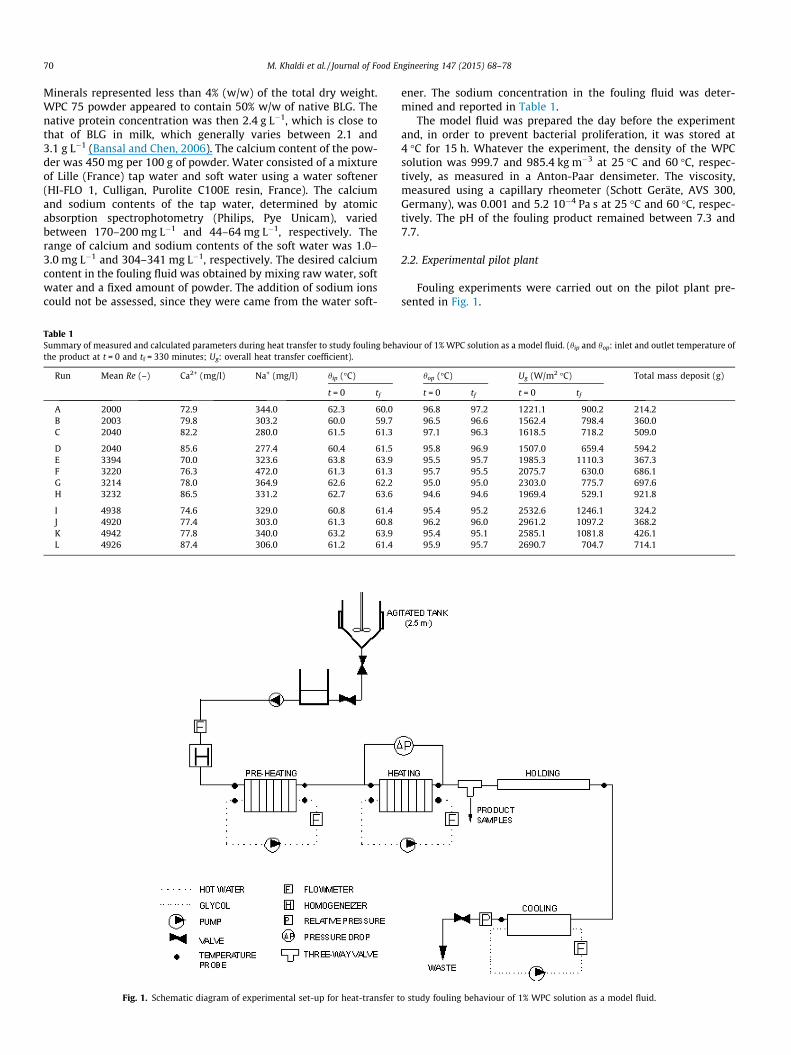
Minerals represented less than 4% (w/w) of the total dry weight.WPC 75 powder appeared to contain 50% w/w of native BLG. Thenative protein concentration was then 2.4 g L�1, which is close tothat of BLG in milk, which generally varies between 2.1 and3.1 g L�1 (Bansal and Chen, 2006). The calcium content of the pow-der was 450 mg per 100 g of powder. Water consisted of a mixtureof Lille (France) tap water and soft water using a water softener(HI-FLO 1, Culligan, Purolite C100E resin, France). The calciumand sodium contents of the tap water, determined by atomicabsorption spectrophotometry (Philips, Pye Unicam), variedbetween 170–200 mg L�1 and 44–64 mg L�1, respectively. Therange of calcium and sodium contents of the soft water was 1.0–3.0 mg L�1 and 304–341 mg L�1, respectively. The desired calciumcontent in the fouling fluid was obtained by mixing raw water, softwater and a fixed amount of powder. The addition of sodium ionscould not be assessed, since they were came from the water soft-
Table 1Summary of measured and calculated parameters during heat transfer to study fouling behathe product at t = 0 and tf = 330 minutes; Ug: overall heat transfer coefficient).
Run Mean Re (–) Ca2+ (mg/l) Na+ (mg/l) hip (�C)
t = 0 tf
A 2000 72.9 344.0 62.3 60.0B 2003 79.8 303.2 60.0 59.7C 2040 82.2 280.0 61.5 61.3
D 2040 85.6 277.4 60.4 61.5E 3394 70.0 323.6 63.8 63.9F 3220 76.3 472.0 61.3 61.3G 3214 78.0 364.9 62.6 62.2H 3232 86.5 331.2 62.7 63.6
I 4938 74.6 329.0 60.8 61.4J 4920 77.4 303.0 61.3 60.8K 4942 77.8 340.0 63.2 63.9L 4926 87.4 306.0 61.2 61.4
Fig. 1. Schematic diagram of experimental set-up for heat-transfer t
ener. The sodium concentration in the fouling fluid was deter-mined and reported in Table 1.
The model fluid was prepared the day before the experimentand, in order to prevent bacterial proliferation, it was stored at4 �C for 15 h. Whatever the experiment, the density of the WPCsolution was 999.7 and 985.4 kg m�3 at 25 �C and 60 �C, respec-tively, as measured in a Anton-Paar densimeter. The viscosity,measured using a capillary rheometer (Schott Geräte, AVS 300,Germany), was 0.001 and 5.2 10�4 Pa s at 25 �C and 60 �C, respec-tively. The pH of the fouling product remained between 7.3 and7.7.
2.2. Experimental pilot plant
Fouling experiments were carried out on the pilot plant pre-sented in Fig. 1.
viour of 1% WPC solution as a model fluid. (hip and hop: inlet and outlet temperature of
hop (�C) Ug (W/m2 �C) Total mass deposit (g)
t = 0 tf t = 0 tf
96.8 97.2 1221.1 900.2 214.296.5 96.6 1562.4 798.4 360.097.1 96.3 1618.5 718.2 509.0
95.8 96.9 1507.0 659.4 594.295.5 95.7 1985.3 1110.3 367.395.7 95.5 2075.7 630.0 686.195.0 95.0 2303.0 775.7 697.694.6 94.6 1969.4 529.1 921.8
95.4 95.2 2532.6 1246.1 324.296.2 96.0 2961.2 1097.2 368.295.4 95.1 2585.1 1081.8 426.195.9 95.7 2690.7 704.7 714.1
o study fouling behaviour of 1% WPC solution as a model fluid.
P0 P1 P12P11
FOULINGPRODUCTOUTLET
FOULINGPRODUCTINLET
HOT WATEROUTLET
HOT WATERINLET
Pi PLATE NUMBER
C1 C2 C3 C4 C5 C6
Ci CHANNEL NUMBER
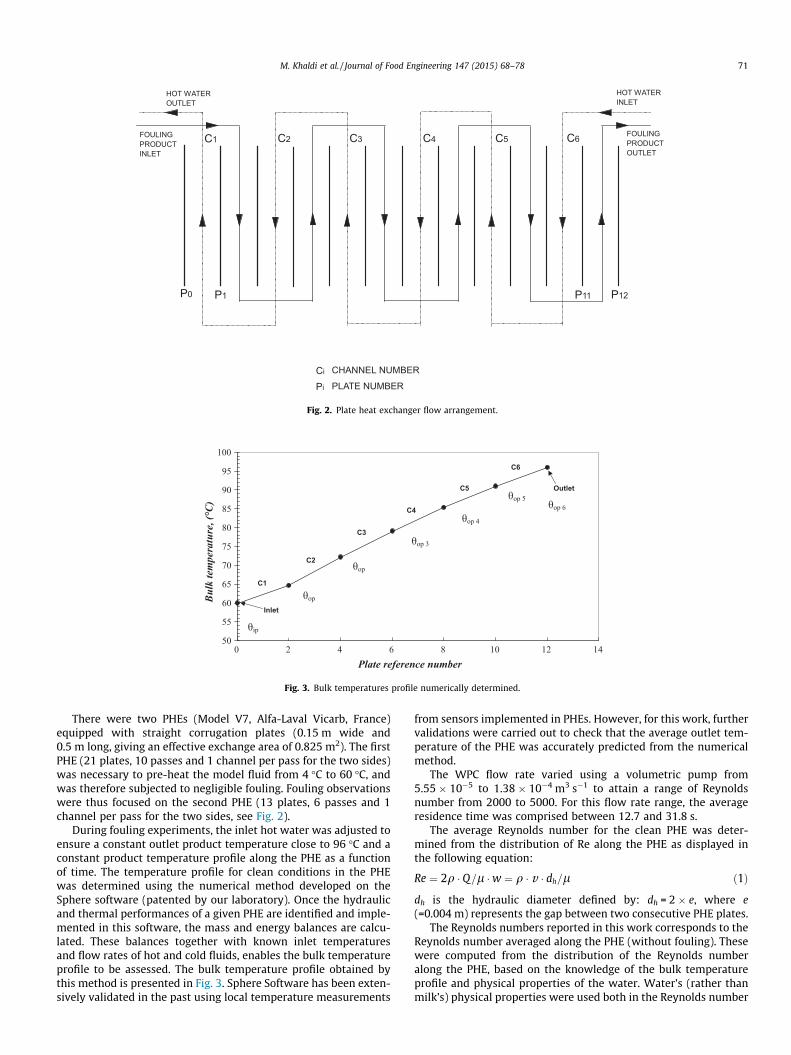
Fig. 2. Plate heat exchanger flow arrangement.
50
55
60
65
70
75
80
85
90
95
100
0 2 4 6 8 10 12 14Plate reference number
Bul
k te
mpe
ratu
re, (
°C)
C1
C2
C3
C4
C5
C6
Inlet
Outlet
θip
θop 1
θop 2
θop 3
θop 4
θop 5θop 6
Fig. 3. Bulk temperatures profile numerically determined.
M. Khaldi et al. / Journal of Food Engineering 147 (2015) 68–78 71
There were two PHEs (Model V7, Alfa-Laval Vicarb, France)equipped with straight corrugation plates (0.15 m wide and0.5 m long, giving an effective exchange area of 0.825 m2). The firstPHE (21 plates, 10 passes and 1 channel per pass for the two sides)was necessary to pre-heat the model fluid from 4 �C to 60 �C, andwas therefore subjected to negligible fouling. Fouling observationswere thus focused on the second PHE (13 plates, 6 passes and 1channel per pass for the two sides, see Fig. 2).
During fouling experiments, the inlet hot water was adjusted toensure a constant outlet product temperature close to 96 �C and aconstant product temperature profile along the PHE as a functionof time. The temperature profile for clean conditions in the PHEwas determined using the numerical method developed on theSphere software (patented by our laboratory). Once the hydraulicand thermal performances of a given PHE are identified and imple-mented in this software, the mass and energy balances are calcu-lated. These balances together with known inlet temperaturesand flow rates of hot and cold fluids, enables the bulk temperatureprofile to be assessed. The bulk temperature profile obtained bythis method is presented in Fig. 3. Sphere Software has been exten-sively validated in the past using local temperature measurements
from sensors implemented in PHEs. However, for this work, furthervalidations were carried out to check that the average outlet tem-perature of the PHE was accurately predicted from the numericalmethod.
The WPC flow rate varied using a volumetric pump from5.55 � 10�5 to 1.38 � 10�4 m3 s�1 to attain a range of Reynoldsnumber from 2000 to 5000. For this flow rate range, the averageresidence time was comprised between 12.7 and 31.8 s.
The average Reynolds number for the clean PHE was deter-mined from the distribution of Re along the PHE as displayed inthe following equation:
Re ¼ 2q � Q=l �w ¼ q � v � dh=l ð1Þ
dh is the hydraulic diameter defined by: dh = 2 � e, where e(=0.004 m) represents the gap between two consecutive PHE plates.
The Reynolds numbers reported in this work corresponds to theReynolds number averaged along the PHE (without fouling). Thesewere computed from the distribution of the Reynolds numberalong the PHE, based on the knowledge of the bulk temperatureprofile and physical properties of the water. Water’s (rather thanmilk’s) physical properties were used both in the Reynolds number

72 M. Khaldi et al. / Journal of Food Engineering 147 (2015) 68–78
averaged along the PHE calculation and for numerical simulation,due to very low concentration of the solution (1% w/w). Thismethod has previously been adopted by Delplace et al. (1997)and more recently by Petit et al. (2013). Fouling runs were per-formed at three different values of Reynolds number (Re = 2000,3200 and 5000) corresponding to different flow rates of proteinsolutions, 200 L/h, 320 and 500 L/h, respectively.
The superficial flow velocity was calculated using the averagecross section between two PHE plates. This was 0.092, 0.14 and0.23 m s�1 at Re = 2000, Re = 3200 and Re = 5000, respectively.
Despite this relatively narrow range of Reynolds number values,it will be shown later that a noticeable velocity effect could beobserved on the fouling phenomena.
The ratio between hot water and WPC solution flow rates waskept constant at 1.2. During all fouling runs, a constant back-pres-sure of 2.1 bars was applied to the PHE.
Temperatures and flow rates were measured with platinumresistance probes (Pt100, Fer Constantan) and electromagneticflowmeters (Krohne IFM, Germany), respectively. The expectedprecision for the measurements was ±0.2 �C for the temperaturemeasurements and ±1% of the full scale of the sensor for the flowrate measurements. All measurements were collected using a dataacquisition system (Agilent Technologies 34970A, USA).
2.3. Experimental fouling runs
Twelve fouling runs were conducted with various calcium con-centrations, ranging from 70.0 to 87.5 mg L�1, in the WPC solutions(Table 1). The calcium content was much lower than that of normalmilk. Only a small range of calcium content was investigated inorder to highlight the fact that a very slight chemical variationresults in a large variation in the fouling. The objective was to illus-trate that it is essential to assess this chemical parameter accu-rately, which to date, is not commonly evaluated even in thedevelopment of a model foulant fluid.
The PHE was brought to thermal equilibrium at the desired pro-cess temperature using reverse osmosis water. Then the feed wasswitched from reverse osmosis water to model fluid. The proteinsolution was not recirculated to avoid fouling from already-treatedmaterial. The experimental run was continued for 330 min. Afterthe experiment, the protein solution was replaced by water. Theextent of fouling was determined from the total weight of moistdeposits and the final fouling resistance. The system was disman-tled and the deposit mass inside the PHE was weighed using Met-tler apparatus with a precision of 0.1 g.
The locally deposited mass Md,j on each channel j (1 < j < 6) andthe total amount of deposit inside the PHE were reported.
The amount of fouling was also monitored by calculating thefouling resistance. A linear relationship was visible between theaverage fouling resistance Rf, defined by Eq. (2), and the foulingthickness, assuming that the deposit layers are covered uniformly.
1UgðtÞ
¼ 1Ugð0Þ
þ Rf ð2Þ
where Ug(0) and Ug(t) are the overall heat transfer coefficients at thebeginning of fouling runs (i.e. the overall heat transfer coefficientbefore the occurrence of fouling) and at time t (i.e., the overall heattransfer coefficient including the additional contribution of fouling).
The heat transfer coefficient was computed from the energybalance equation:
_mpCppðhop � hipÞ ¼ _mhCph
ðhih � hohÞ ¼ UgSDhLTDMFT ð3Þ
FT is a correction factor taking into account that a impure counter-current flow could exist inside the plate heat exchanger. Leulietet al. (1988) provide equations for PHEs using analogy with the shell
and tube correction factor. Their method was used for this work toevaluate the FT factor.
2.4. Cleaning
After being weighed, the PHE was remounted and cleaned usinga single-stage cleaner which consists of a 2% (w/w) caustic sodasolution at 85 �C. The standard cleaning procedure used was as fol-lows: (1) rinsing for 10 min with water at room temperature; (2)35 min in NaOH 2% at 85 �C and (3) 15 min rinsing with water atroom temperature.
Cleaning solutions were recirculated at 400 L h�1 until the pres-sure drop values reached the initial pressure drop. The extent ofcleaning was monitored using a pressure drop sensor (Sitrans P7MF4443, Siemens). In the case of the appearance of a swollen sec-ondary deposit, the flow rate was increased to accelerate thecleaning.
2.5. Dimensional analysis
For a fixed native BLG concentration of 2.4 g L�1 and a fixedfouling period (330 min), the amount of deposits in the PHE dueto fouling is a function of Re, temperature and mineral concentra-tion. The locally deposited mass Md,j on a plate, after 330 min offouling, was chosen as target variable depending on three sets ofparameters: (i) geometry (e0), (ii) physical properties (Cca, l, q)and (iii) process parameter (hop,j, hip, �u). hop,j refers to the tempera-ture of the product at the outlet of the channel j. hip refers to thetemperature of the product at the inlet of the first channel. There-fore we obtain the following relevance list:
Md;j;CCa; �u; e0;q;l; hop;j; hip� �
ð4Þ
The above list reports 8 parametric dimensional variables andfour dimensions. Therefore there are 8 � 4 = 4 dimensionless pi-numbers given by the transformation of the dimensional setmatrix as described by Szirtes (1998):
Md;j
qe30
;Re;CCa
q;hop;j
hip
� �ð5Þ
Thus, dimensional analysis of the deposited mass characteris-tics in a PHE leads to a process relationship between the four pi-numbers:
Md;j
qe30
¼ f Re;CCa
q;hop;j
hip
� �ð6Þ
where f is an unknown function. Experimental results, concerningthe amount of deposit in the last four channels for various Reynoldsnumbers (2000, 3200 and 5000), temperatures (77–97.1 �C) and cal-cium content (70.0–87.5 mg L�1), were used to identify theunknown function f. A set of 44 experimental points was obtainedto identify the process relationship.
3. Results and discussion
3.1. Characterization of the build-up of the protein fouling
Fig. 4 represents dry weights of deposit measurements in eachPHE channel (at the end of the experiment) at Re = 2000 for differ-ent calcium contents. Deposit distribution profiles at Re = 3200 andRe = 5000 being similar, only that of Re = 2000 has been displayed.
Low deposit amounts were observed in the first PHE channel.This could be explained by stating that sparse BLG denaturationoccurred in the first channel at 62.8 �C and then very little foulingtook place. This result is in agreement with observations made byLyster (1970), Dannenberg (1986), Bradley et al. (1989) and
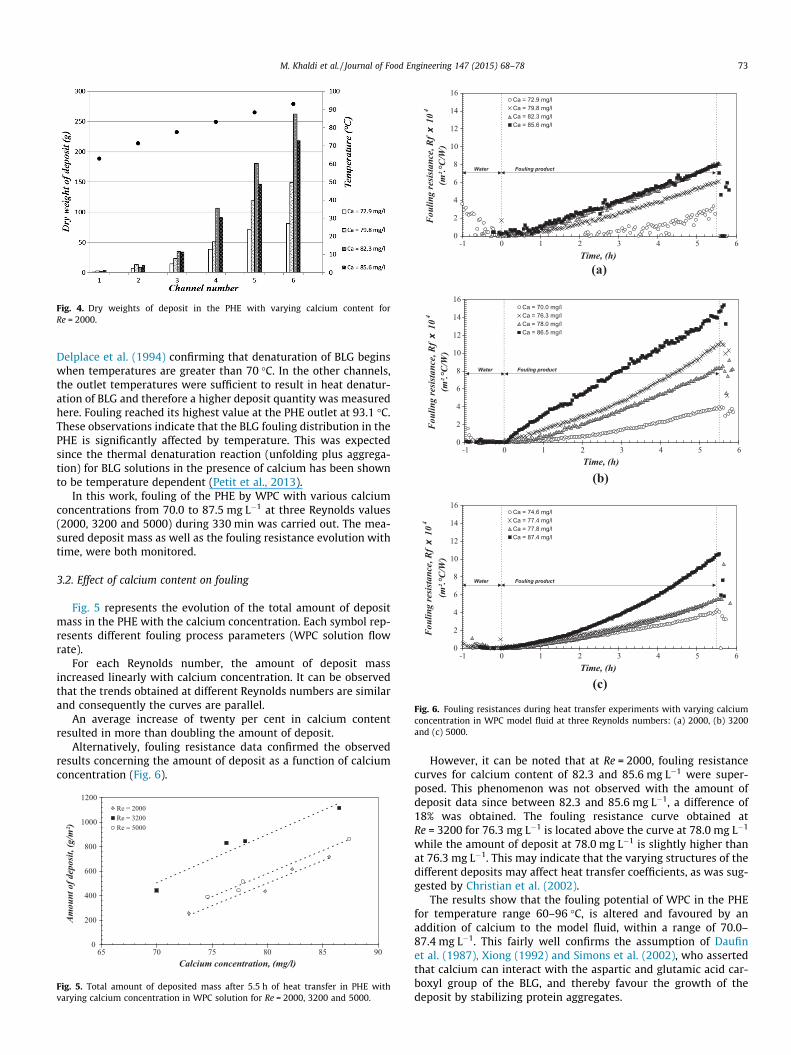
Fig. 4. Dry weights of deposit in the PHE with varying calcium content forRe = 2000.
0
2
4
6
8
10
12
14
16
-1 0 1 2 3 4 5 6Time, (h)
Fou
ling
resi
stan
ce, R
f x
10
4
(m².°
C/W
)
Ca = 72.9 mg/lCa = 79.8 mg/lCa = 82.3 mg/lCa = 85.6 mg/l
Water Fouling product
(a)
0
2
4
6
8
10
12
14
16
-1 0 1 2 3 4 5 6Time, (h)
Fou
ling
resi
stan
ce, R
f x
10
4
(m².°
C/W
)
Ca = 70.0 mg/lCa = 76.3 mg/lCa = 78.0 mg/lCa = 86.5 mg/l
Water Fouling product
(b)
0
2
4
6
8
10
12
14
16
-1 0 1 2 3 4 5 6Time, (h)
Fou
ling
resi
stan
ce, R
f x
10
4
(m².°
C/W
)
Ca = 74.6 mg/lCa = 77.4 mg/lCa = 77.8 mg/lCa = 87.4 mg/l
Water Fouling product
(c)
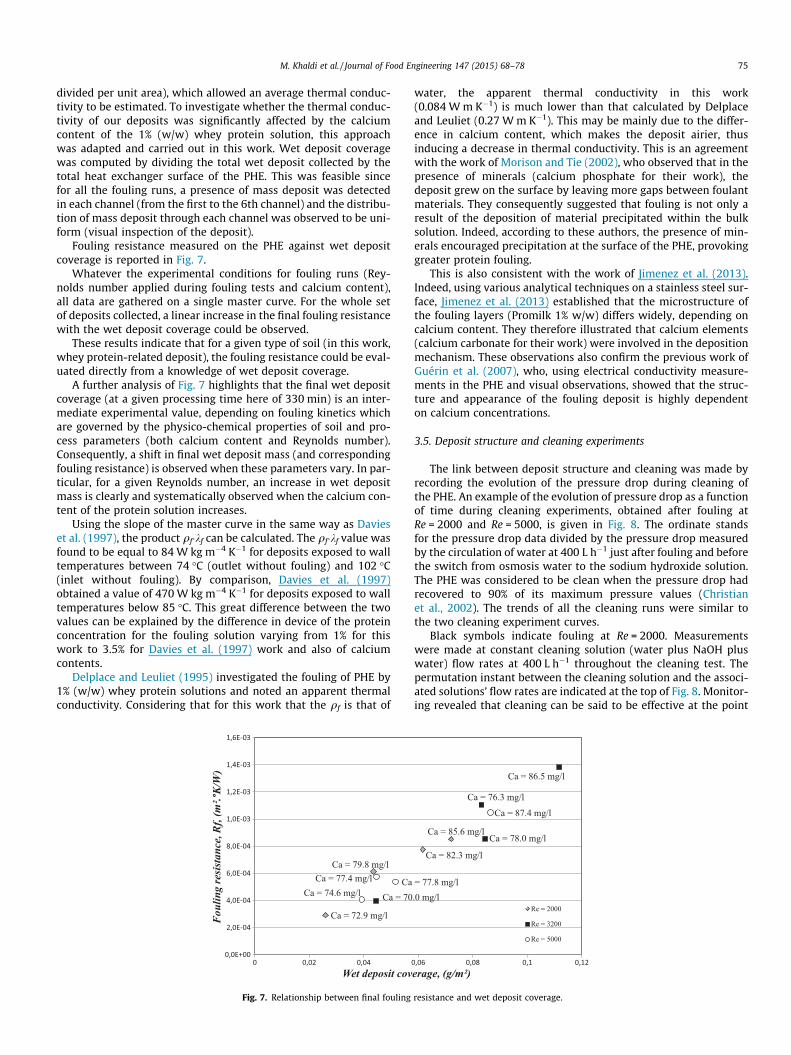
Fig. 6. Fouling resistances during heat transfer experiments with varying calciumconcentration in WPC model fluid at three Reynolds numbers: (a) 2000, (b) 3200and (c) 5000.
M. Khaldi et al. / Journal of Food Engineering 147 (2015) 68–78 73
Delplace et al. (1994) confirming that denaturation of BLG beginswhen temperatures are greater than 70 �C. In the other channels,the outlet temperatures were sufficient to result in heat denatur-ation of BLG and therefore a higher deposit quantity was measuredhere. Fouling reached its highest value at the PHE outlet at 93.1 �C.These observations indicate that the BLG fouling distribution in thePHE is significantly affected by temperature. This was expectedsince the thermal denaturation reaction (unfolding plus aggrega-tion) for BLG solutions in the presence of calcium has been shownto be temperature dependent (Petit et al., 2013).
In this work, fouling of the PHE by WPC with various calciumconcentrations from 70.0 to 87.5 mg L�1 at three Reynolds values(2000, 3200 and 5000) during 330 min was carried out. The mea-sured deposit mass as well as the fouling resistance evolution withtime, were both monitored.
3.2. Effect of calcium content on fouling
Fig. 5 represents the evolution of the total amount of depositmass in the PHE with the calcium concentration. Each symbol rep-resents different fouling process parameters (WPC solution flowrate).
For each Reynolds number, the amount of deposit massincreased linearly with calcium concentration. It can be observedthat the trends obtained at different Reynolds numbers are similarand consequently the curves are parallel.
An average increase of twenty per cent in calcium contentresulted in more than doubling the amount of deposit.
Alternatively, fouling resistance data confirmed the observedresults concerning the amount of deposit as a function of calciumconcentration (Fig. 6).
0
200
400
600
800
1000
1200
65 70 75 80 85 90Calcium concentration, (mg/l)
Am
ount
of d
epos
it, (g
/m²)
Re = 2000Re = 3200Re = 5000
Fig. 5. Total amount of deposited mass after 5.5 h of heat transfer in PHE withvarying calcium concentration in WPC solution for Re = 2000, 3200 and 5000.
However, it can be noted that at Re = 2000, fouling resistancecurves for calcium content of 82.3 and 85.6 mg L�1 were super-posed. This phenomenon was not observed with the amount ofdeposit data since between 82.3 and 85.6 mg L�1, a difference of18% was obtained. The fouling resistance curve obtained atRe = 3200 for 76.3 mg L�1 is located above the curve at 78.0 mg L�1
while the amount of deposit at 78.0 mg L�1 is slightly higher thanat 76.3 mg L�1. This may indicate that the varying structures of thedifferent deposits may affect heat transfer coefficients, as was sug-gested by Christian et al. (2002).
The results show that the fouling potential of WPC in the PHEfor temperature range 60–96 �C, is altered and favoured by anaddition of calcium to the model fluid, within a range of 70.0–87.4 mg L�1. This fairly well confirms the assumption of Daufinet al. (1987), Xiong (1992) and Simons et al. (2002), who assertedthat calcium can interact with the aspartic and glutamic acid car-boxyl group of the BLG, and thereby favour the growth of thedeposit by stabilizing protein aggregates.

74 M. Khaldi et al. / Journal of Food Engineering 147 (2015) 68–78
Calcium ions, essentially present in the deposit solid (Tissierand Lalande, 1986), are important in the growth of fouled layers(Xiong, 1992). This is because they form bridges between adsorbedproteins and those protein aggregates occurring in the bulk, conse-quently modifying the protein aggregation rate and leading to agreater cohesion between the protein aggregates which in turn,change the deposit structure (Phan-Xuan et al., 2013). Simmonset al. (2007) revealed an increase in deposition upon a Couette sur-face due to calcium ions (920 mg L�1) and a modification in theappearance of the deposit for a temperature range 75–90 �C. Inaddition, Pappas and Rothwell (1991) showed that BLG completelyaggregated to form compact structures when heated with calciumfrom 80 �C to 110 �C. The structure was less compact without cal-cium. Guérin et al. (2007) observed that fouled layers formed withlow calcium content, after fouling runs at Re 3200 using 1% WPC,had a soft spongy texture, whereas deposits formed at higher cal-cium contents were denser and elastic. In the presence of Ca2+, thefouling layer was very thick, white, not homogenous and veryrough in appearance (Jimenez et al., 2013). Simmons et al. (2007)also showed that increasing the levels of calcium had a dramaticeffect on the size of the aggregates produced, which decreasedwith increasing mineral concentration.
In the present work, results conflicting with those of Christianet al. (2002) were obtained. Indeed, these authors showed a reduc-tion in fouling with increasing calcium concentrations both in aPHE pasteurizer (62–114 �C/9.5 s) and a UHT section (126–138 �C/7 s). No evidence can be found to explain such a difference,since similar BLG concentrations of 0.3% and 0.45% w/w in WPCsolutions were used. It is interesting to note that Simmons et al.(2007) showed an increase in the aggregate size with increasingtemperature and this may explain the contradictory results. Thelarger-sized aggregates occurring at higher temperatures, may beswept along by the flow and may reduce the fouling deposit.
The difference in the results may also be explained by a discrep-ancy in the ionic strength, due to the calcium of the fouling solu-tion over pH range tested. The calcium ionic strength was muchgreater for Christian et al. (2002), varying from 10 to 120 mmol L�1
than in this study (3.5–4.4 mmol L�1). Indeed, Twoney et al. (1997)showed that increasing the ionic strength due to calcium, leads to alower unfolding temperature of the BLG, hence resulting in anincrease in the aggregation rate of the proteins in the bulk. More-over, for pH values > 5.1, which would correspond to the isoelectricpoint of the BLG, proteins have a negative net charge. Calcium ionsact as a counter-ion and neutralize the charge of the protein.Caussin and Bouhallab (2004) reported the existence of a thresholdconcentration of minerals for BLG gel formation. Below the concen-tration threshold, the protein aggregation is limited by electro-static repulsion (Phan-Xuan et al., 2013). This results in afilamentous network forming with low-density aggregates. Abovethe concentration threshold, attraction is intensive, leading to theformation of gels with granular structure composed of larger anddenser aggregates.
The above observations, as well as that of Twoney et al. (1997),Caussin and Bouhallab (2004) and Simmons et al. (2007) confirmthe influence of the calcium ions on the fouling behaviour ofWPC, i.e. the increase in the amount of deposit with increasing cal-cium concentration for a temperature range of 60–96 �C.
3.3. Effect of Reynolds number on WPC fouling
The amount of deposit as a function of calcium content for dif-ferent Reynolds number is shown in Fig. 5. The fouling resistancecurves obtained for the three Reynolds numbers are reported inFig. 6. It can be noted that the range of the ordinate axis was keptconstant to permit a better comparison. From Fig. 5, it is found thatthe amount of deposit at Re = 3200 over the complete calcium con-
tent range is higher than that of Re = 2000 or Re = 5000. The lowestamount of deposit was obtained at Re = 2000. These fouling resis-tance curves confirm the previous trend with reasonable accuracy.A peak in deposit amounts and fouling resistance was observed inthe PHE (60–96 �C) close to Re = 3200, whatever the calcium con-tent (70–87.5 mg L�1) of the WPC solution.
From Fig. 6, it can be seen that the velocity of protein solutionssignificantly impact the fouling rate and kinetics. Indeed, Fig. 6shows a change in Rf-time profiles from being chiefly linear atRe = 2000 and Re = 3200 to non-linear increase times atRe = 5000. This change in deposition kinetics provides additionalevidence that a transition in deposit nature occurs when velocityincreases within this range.
At this stage, it is very difficult to elucidate that mechanismresponsible for higher extents of fouling at an intermediate flowrate.
Shear stress level is known to be one of the parameters affectingthe kinetics of fouling mechanism, as first underlined by Kern andSeaton (1959).
Indeed, these authors hypothesized that the formation of a foul-ing layer is a consequence of the rate of aggregates entering andescaping. Simmons et al. (2007) joined these authors in underlin-ing that the final aggregate size in Couette apparatus for 75–90 �C, is a balance between aggregate strength, particle collisionrate and breakage; the latter two being a function of the shear field.According to Simmons et al. (2007), particle growth rate isenhanced by increasing shear rate. In contrast, Erabit et al.(2014) reported that there is no significant difference betweenthe distributions. According to the latter, at a shear rate of100 s�1 and a time range of 0–240 s, there is no breakage of aggre-gates in the suspensions formed by heat treatment.
In this work, the flow regime selected was turbulent. Therefore,it is difficult to assess a shear rate range. However, it is clear thatthe shear stress field increases with increasing Reynolds numbers,thereby modifying aggregate breakage and the probability of parti-cle collision.
Thus, the experimental increase in the amount of depositbetween Re = 2000 and Re = 3200 may presumably be explainedby a smaller aggregates size at a higher shear stress favouringthe calcium bindings between adsorbed proteins and proteinaggregates in the bulk upon carboxyl groups (Xiong, 1992), andconsequently favouring deposit growth.
In these conditions, it is likely that a more energetic particle col-lision (of unfolded protein species) with the deposit layer compactsthe deposit or initializes the breakage and re-entrainment of someof the fouled layer deposit, which would modify the density andappearance of the fouled layer structure. This may explain thedecrease in the amount of deposit and in the fouling resistancebetween Re = 3200 and Re = 5000. The threshold Reynolds numberfor this PHE would appear to fall between 3200 and 5000.
Visual observations of the deposit structure obtained at differ-ent Reynolds numbers confirm this hypothesis. The surface ofdeposits at the highest Re (5000) had a smooth appearance,whereas for the two other Reynolds numbers, it the structureappeared granular.
More fouling data at intermediate flow rates and evidence ofdeposit removal would be very useful in confirming thesehypotheses.
3.4. Fouling resistance versus wet deposit coverage: thermalconductivity of the deposit
Davies et al. (1997) investigated whey protein deposit proper-ties (3.5% w/w WPC) using heat flux sensors in a concentric-tubedevice. These authors plotted fouling resistance (after a foulingrun of 60 min) versus wet deposit coverage (wet deposit mass
M. Khaldi et al. / Journal of Food Engineering 147 (2015) 68–78 75
divided per unit area), which allowed an average thermal conduc-tivity to be estimated. To investigate whether the thermal conduc-tivity of our deposits was significantly affected by the calciumcontent of the 1% (w/w) whey protein solution, this approachwas adapted and carried out in this work. Wet deposit coveragewas computed by dividing the total wet deposit collected by thetotal heat exchanger surface of the PHE. This was feasible sincefor all the fouling runs, a presence of mass deposit was detectedin each channel (from the first to the 6th channel) and the distribu-tion of mass deposit through each channel was observed to be uni-form (visual inspection of the deposit).
Fouling resistance measured on the PHE against wet depositcoverage is reported in Fig. 7.
Whatever the experimental conditions for fouling runs (Rey-nolds number applied during fouling tests and calcium content),all data are gathered on a single master curve. For the whole setof deposits collected, a linear increase in the final fouling resistancewith the wet deposit coverage could be observed.
These results indicate that for a given type of soil (in this work,whey protein-related deposit), the fouling resistance could be eval-uated directly from a knowledge of wet deposit coverage.
A further analysis of Fig. 7 highlights that the final wet depositcoverage (at a given processing time here of 330 min) is an inter-mediate experimental value, depending on fouling kinetics whichare governed by the physico-chemical properties of soil and pro-cess parameters (both calcium content and Reynolds number).Consequently, a shift in final wet deposit mass (and correspondingfouling resistance) is observed when these parameters vary. In par-ticular, for a given Reynolds number, an increase in wet depositmass is clearly and systematically observed when the calcium con-tent of the protein solution increases.
Using the slope of the master curve in the same way as Davieset al. (1997), the product qf�kf can be calculated. The qf�kf value wasfound to be equal to 84 W kg m�4 K�1 for deposits exposed to walltemperatures between 74 �C (outlet without fouling) and 102 �C(inlet without fouling). By comparison, Davies et al. (1997)obtained a value of 470 W kg m�4 K�1 for deposits exposed to walltemperatures below 85 �C. This great difference between the twovalues can be explained by the difference in device of the proteinconcentration for the fouling solution varying from 1% for thiswork to 3.5% for Davies et al. (1997) work and also of calciumcontents.
Delplace and Leuliet (1995) investigated the fouling of PHE by1% (w/w) whey protein solutions and noted an apparent thermalconductivity. Considering that for this work that the qf is that of
Ca = 72.9 mg/l
Ca = 79.8 mg/l
Ca = 70Ca = 74.6 mg/lCa = 77.4 mg/l Ca
0,0E+00
2,0E-04
4,0E-04
6,0E-04
8,0E-04
1,0E-03
1,2E-03
1,4E-03
1,6E-03
0 0,02 0,04
Foulin
g re
sist
ance
, Rf,
(m².°
K/W
)
Wet deposit cov
Fig. 7. Relationship between final fouling
water, the apparent thermal conductivity in this work(0.084 W m K�1) is much lower than that calculated by Delplaceand Leuliet (0.27 W m K�1). This may be mainly due to the differ-ence in calcium content, which makes the deposit airier, thusinducing a decrease in thermal conductivity. This is an agreementwith the work of Morison and Tie (2002), who observed that in thepresence of minerals (calcium phosphate for their work), thedeposit grew on the surface by leaving more gaps between foulantmaterials. They consequently suggested that fouling is not only aresult of the deposition of material precipitated within the bulksolution. Indeed, according to these authors, the presence of min-erals encouraged precipitation at the surface of the PHE, provokinggreater protein fouling.
This is also consistent with the work of Jimenez et al. (2013).Indeed, using various analytical techniques on a stainless steel sur-face, Jimenez et al. (2013) established that the microstructure ofthe fouling layers (Promilk 1% w/w) differs widely, depending oncalcium content. They therefore illustrated that calcium elements(calcium carbonate for their work) were involved in the depositionmechanism. These observations also confirm the previous work ofGuérin et al. (2007), who, using electrical conductivity measure-ments in the PHE and visual observations, showed that the struc-ture and appearance of the fouling deposit is highly dependenton calcium concentrations.
3.5. Deposit structure and cleaning experiments
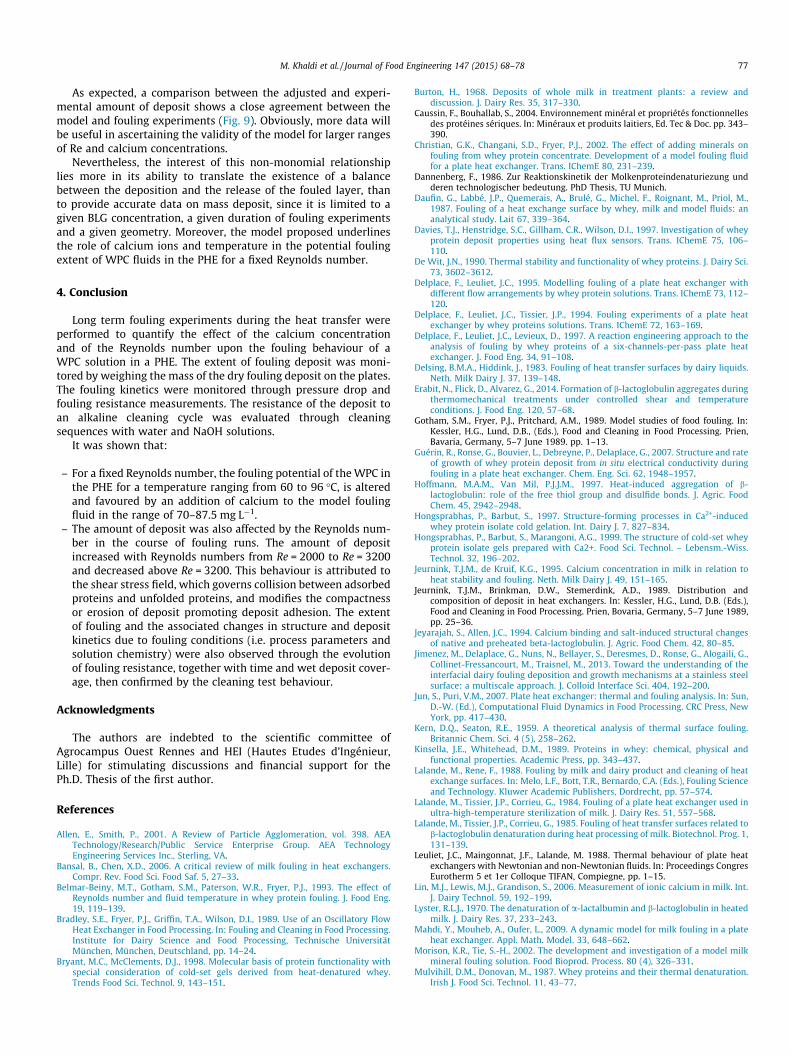
The link between deposit structure and cleaning was made byrecording the evolution of the pressure drop during cleaning ofthe PHE. An example of the evolution of pressure drop as a functionof time during cleaning experiments, obtained after fouling atRe = 2000 and Re = 5000, is given in Fig. 8. The ordinate standsfor the pressure drop data divided by the pressure drop measuredby the circulation of water at 400 L h�1 just after fouling and beforethe switch from osmosis water to the sodium hydroxide solution.The PHE was considered to be clean when the pressure drop hadrecovered to 90% of its maximum pressure values (Christianet al., 2002). The trends of all the cleaning runs were similar tothe two cleaning experiment curves.
Black symbols indicate fouling at Re = 2000. Measurementswere made at constant cleaning solution (water plus NaOH pluswater) flow rates at 400 L h�1 throughout the cleaning test. Thepermutation instant between the cleaning solution and the associ-ated solutions’ flow rates are indicated at the top of Fig. 8. Monitor-ing revealed that cleaning can be said to be effective at the point
Ca = 82.3 mg/l
Ca = 85.6 mg/l
.0 mg/l
Ca = 76.3 mg/l
Ca = 78.0 mg/l
Ca = 86.5 mg/l
= 77.8 mg/l
Ca = 87.4 mg/l
0,06 0,08 0,1 0,12
erage, (g/m²)
Re = 2000
Re = 3200
Re = 5000
resistance and wet deposit coverage.
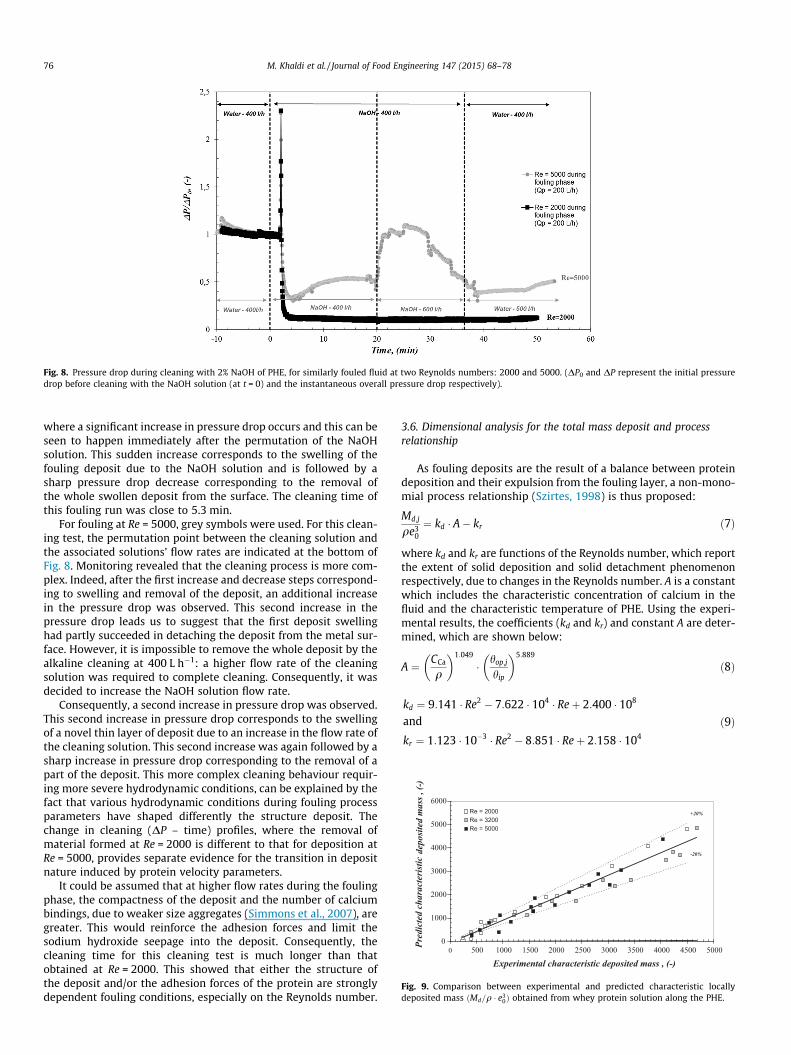
Fig. 8. Pressure drop during cleaning with 2% NaOH of PHE, for similarly fouled fluid at two Reynolds numbers: 2000 and 5000. (DP0 and DP represent the initial pressuredrop before cleaning with the NaOH solution (at t = 0) and the instantaneous overall pressure drop respectively).
0
1000
2000
3000
4000
5000
6000
0 500 1000 1500 2000 2500 3000 3500 4000 4500 5000
Experimental characteristic deposited mass , (-)
Pred
icte
d ch
aracte
rist
icde
posite
d m
ass ,
(-)
Re = 2000Re = 3200Re = 5000
+20%
-20%
Fig. 9. Comparison between experimental and predicted characteristic locallydeposited mass ðMd=q � e3
0Þ obtained from whey protein solution along the PHE.
76 M. Khaldi et al. / Journal of Food Engineering 147 (2015) 68–78
where a significant increase in pressure drop occurs and this can beseen to happen immediately after the permutation of the NaOHsolution. This sudden increase corresponds to the swelling of thefouling deposit due to the NaOH solution and is followed by asharp pressure drop decrease corresponding to the removal ofthe whole swollen deposit from the surface. The cleaning time ofthis fouling run was close to 5.3 min.
For fouling at Re = 5000, grey symbols were used. For this clean-ing test, the permutation point between the cleaning solution andthe associated solutions’ flow rates are indicated at the bottom ofFig. 8. Monitoring revealed that the cleaning process is more com-plex. Indeed, after the first increase and decrease steps correspond-ing to swelling and removal of the deposit, an additional increasein the pressure drop was observed. This second increase in thepressure drop leads us to suggest that the first deposit swellinghad partly succeeded in detaching the deposit from the metal sur-face. However, it is impossible to remove the whole deposit by thealkaline cleaning at 400 L h�1: a higher flow rate of the cleaningsolution was required to complete cleaning. Consequently, it wasdecided to increase the NaOH solution flow rate.
Consequently, a second increase in pressure drop was observed.This second increase in pressure drop corresponds to the swellingof a novel thin layer of deposit due to an increase in the flow rate ofthe cleaning solution. This second increase was again followed by asharp increase in pressure drop corresponding to the removal of apart of the deposit. This more complex cleaning behaviour requir-ing more severe hydrodynamic conditions, can be explained by thefact that various hydrodynamic conditions during fouling processparameters have shaped differently the structure deposit. Thechange in cleaning (DP – time) profiles, where the removal ofmaterial formed at Re = 2000 is different to that for deposition atRe = 5000, provides separate evidence for the transition in depositnature induced by protein velocity parameters.
It could be assumed that at higher flow rates during the foulingphase, the compactness of the deposit and the number of calciumbindings, due to weaker size aggregates (Simmons et al., 2007), aregreater. This would reinforce the adhesion forces and limit thesodium hydroxide seepage into the deposit. Consequently, thecleaning time for this cleaning test is much longer than thatobtained at Re = 2000. This showed that either the structure ofthe deposit and/or the adhesion forces of the protein are stronglydependent fouling conditions, especially on the Reynolds number.
3.6. Dimensional analysis for the total mass deposit and processrelationship
As fouling deposits are the result of a balance between proteindeposition and their expulsion from the fouling layer, a non-mono-mial process relationship (Szirtes, 1998) is thus proposed:
Md;j
qe30
¼ kd � A� kr ð7Þ
where kd and kr are functions of the Reynolds number, which reportthe extent of solid deposition and solid detachment phenomenonrespectively, due to changes in the Reynolds number. A is a constantwhich includes the characteristic concentration of calcium in thefluid and the characteristic temperature of PHE. Using the experi-mental results, the coefficients (kd and kr) and constant A are deter-mined, which are shown below:
A ¼ CCa
q
� �1:049
� hop;j
hip
� �5:889
ð8Þ
kd ¼ 9:141 � Re2 � 7:622 � 104 � Reþ 2:400 � 108
and
kr ¼ 1:123 � 10�3 � Re2 � 8:851 � Reþ 2:158 � 104
ð9Þ
M. Khaldi et al. / Journal of Food Engineering 147 (2015) 68–78 77
As expected, a comparison between the adjusted and experi-mental amount of deposit shows a close agreement between themodel and fouling experiments (Fig. 9). Obviously, more data willbe useful in ascertaining the validity of the model for larger rangesof Re and calcium concentrations.
Nevertheless, the interest of this non-monomial relationshiplies more in its ability to translate the existence of a balancebetween the deposition and the release of the fouled layer, thanto provide accurate data on mass deposit, since it is limited to agiven BLG concentration, a given duration of fouling experimentsand a given geometry. Moreover, the model proposed underlinesthe role of calcium ions and temperature in the potential foulingextent of WPC fluids in the PHE for a fixed Reynolds number.
4. Conclusion
Long term fouling experiments during the heat transfer wereperformed to quantify the effect of the calcium concentrationand of the Reynolds number upon the fouling behaviour of aWPC solution in a PHE. The extent of fouling deposit was moni-tored by weighing the mass of the dry fouling deposit on the plates.The fouling kinetics were monitored through pressure drop andfouling resistance measurements. The resistance of the deposit toan alkaline cleaning cycle was evaluated through cleaningsequences with water and NaOH solutions.
It was shown that:
– For a fixed Reynolds number, the fouling potential of the WPC inthe PHE for a temperature ranging from 60 to 96 �C, is alteredand favoured by an addition of calcium to the model foulingfluid in the range of 70–87.5 mg L�1.
– The amount of deposit was also affected by the Reynolds num-ber in the course of fouling runs. The amount of depositincreased with Reynolds numbers from Re = 2000 to Re = 3200and decreased above Re = 3200. This behaviour is attributed tothe shear stress field, which governs collision between adsorbedproteins and unfolded proteins, and modifies the compactnessor erosion of deposit promoting deposit adhesion. The extentof fouling and the associated changes in structure and depositkinetics due to fouling conditions (i.e. process parameters andsolution chemistry) were also observed through the evolutionof fouling resistance, together with time and wet deposit cover-age, then confirmed by the cleaning test behaviour.
Acknowledgments
The authors are indebted to the scientific committee ofAgrocampus Ouest Rennes and HEI (Hautes Etudes d’Ingénieur,Lille) for stimulating discussions and financial support for thePh.D. Thesis of the first author.
References
Allen, E., Smith, P., 2001. A Review of Particle Agglomeration, vol. 398. AEATechnology/Research/Public Service Enterprise Group. AEA TechnologyEngineering Services Inc., Sterling, VA.
Bansal, B., Chen, X.D., 2006. A critical review of milk fouling in heat exchangers.Compr. Rev. Food Sci. Food Saf. 5, 27–33.
Belmar-Beiny, M.T., Gotham, S.M., Paterson, W.R., Fryer, P.J., 1993. The effect ofReynolds number and fluid temperature in whey protein fouling. J. Food Eng.19, 119–139.
Bradley, S.E., Fryer, P.J., Griffin, T.A., Wilson, D.I., 1989. Use of an Oscillatory FlowHeat Exchanger in Food Processing. In: Fouling and Cleaning in Food Processing.Institute for Dairy Science and Food Processing, Technische UniversitätMünchen, München, Deutschland, pp. 14–24.
Bryant, M.C., McClements, D.J., 1998. Molecular basis of protein functionality withspecial consideration of cold-set gels derived from heat-denatured whey.Trends Food Sci. Technol. 9, 143–151.
Burton, H., 1968. Deposits of whole milk in treatment plants: a review anddiscussion. J. Dairy Res. 35, 317–330.
Caussin, F., Bouhallab, S., 2004. Environnement minéral et propriétés fonctionnellesdes protéines sériques. In: Minéraux et produits laitiers, Ed. Tec & Doc. pp. 343–390.
Christian, G.K., Changani, S.D., Fryer, P.J., 2002. The effect of adding minerals onfouling from whey protein concentrate. Development of a model fouling fluidfor a plate heat exchanger. Trans. IChemE 80, 231–239.
Dannenberg, F., 1986. Zur Reaktionskinetik der Molkenproteindenaturiezung undderen technologischer bedeutung. PhD Thesis, TU Munich.
Daufin, G., Labbé, J.P., Quemerais, A., Brulé, G., Michel, F., Roignant, M., Priol, M.,1987. Fouling of a heat exchange surface by whey, milk and model fluids: ananalytical study. Lait 67, 339–364.
Davies, T.J., Henstridge, S.C., Gillham, C.R., Wilson, D.I., 1997. Investigation of wheyprotein deposit properties using heat flux sensors. Trans. IChemE 75, 106–110.
De Wit, J.N., 1990. Thermal stability and functionality of whey proteins. J. Dairy Sci.73, 3602–3612.
Delplace, F., Leuliet, J.C., 1995. Modelling fouling of a plate heat exchanger withdifferent flow arrangements by whey protein solutions. Trans. IChemE 73, 112–120.
Delplace, F., Leuliet, J.C., Tissier, J.P., 1994. Fouling experiments of a plate heatexchanger by whey proteins solutions. Trans. IChemE 72, 163–169.
Delplace, F., Leuliet, J.C., Levieux, D., 1997. A reaction engineering approach to theanalysis of fouling by whey proteins of a six-channels-per-pass plate heatexchanger. J. Food Eng. 34, 91–108.
Delsing, B.M.A., Hiddink, J., 1983. Fouling of heat transfer surfaces by dairy liquids.Neth. Milk Dairy J. 37, 139–148.
Erabit, N., Flick, D., Alvarez, G., 2014. Formation of b-lactoglobulin aggregates duringthermomechanical treatments under controlled shear and temperatureconditions. J. Food Eng. 120, 57–68.
Gotham, S.M., Fryer, P.J., Pritchard, A.M., 1989. Model studies of food fouling. In:Kessler, H.G., Lund, D.B., (Eds.), Food and Cleaning in Food Processing. Prien,Bavaria, Germany, 5–7 June 1989. pp. 1–13.
Guérin, R., Ronse, G., Bouvier, L., Debreyne, P., Delaplace, G., 2007. Structure and rateof growth of whey protein deposit from in situ electrical conductivity duringfouling in a plate heat exchanger. Chem. Eng. Sci. 62, 1948–1957.
Hoffmann, M.A.M., Van Mil, P.J.J.M., 1997. Heat-induced aggregation of b-lactoglobulin: role of the free thiol group and disulfide bonds. J. Agric. FoodChem. 45, 2942–2948.
Hongsprabhas, P., Barbut, S., 1997. Structure-forming processes in Ca2+-inducedwhey protein isolate cold gelation. Int. Dairy J. 7, 827–834.
Hongsprabhas, P., Barbut, S., Marangoni, A.G., 1999. The structure of cold-set wheyprotein isolate gels prepared with Ca2+. Food Sci. Technol. – Lebensm.-Wiss.Technol. 32, 196–202.
Jeurnink, T.J.M., de Kruif, K.G., 1995. Calcium concentration in milk in relation toheat stability and fouling. Neth. Milk Dairy J. 49, 151–165.
Jeurnink, T.J.M., Brinkman, D.W., Stemerdink, A.D., 1989. Distribution andcomposition of deposit in heat exchangers. In: Kessler, H.G., Lund, D.B. (Eds.),Food and Cleaning in Food Processing. Prien, Bovaria, Germany, 5–7 June 1989,pp. 25–36.
Jeyarajah, S., Allen, J.C., 1994. Calcium binding and salt-induced structural changesof native and preheated beta-lactoglobulin. J. Agric. Food Chem. 42, 80–85.
Jimenez, M., Delaplace, G., Nuns, N., Bellayer, S., Deresmes, D., Ronse, G., Alogaili, G.,Collinet-Fressancourt, M., Traisnel, M., 2013. Toward the understanding of theinterfacial dairy fouling deposition and growth mechanisms at a stainless steelsurface: a multiscale approach. J. Colloid Interface Sci. 404, 192–200.
Jun, S., Puri, V.M., 2007. Plate heat exchanger: thermal and fouling analysis. In: Sun,D.-W. (Ed.), Computational Fluid Dynamics in Food Processing. CRC Press, NewYork, pp. 417–430.
Kern, D.Q., Seaton, R.E., 1959. A theoretical analysis of thermal surface fouling.Britannic Chem. Sci. 4 (5), 258–262.
Kinsella, J.E., Whitehead, D.M., 1989. Proteins in whey: chemical, physical andfunctional properties. Academic Press, pp. 343–437.
Lalande, M., Rene, F., 1988. Fouling by milk and dairy product and cleaning of heatexchange surfaces. In: Melo, L.F., Bott, T.R., Bernardo, C.A. (Eds.), Fouling Scienceand Technology. Kluwer Academic Publishers, Dordrecht, pp. 57–574.
Lalande, M., Tissier, J.P., Corrieu, G., 1984. Fouling of a plate heat exchanger used inultra-high-temperature sterilization of milk. J. Dairy Res. 51, 557–568.
Lalande, M., Tissier, J.P., Corrieu, G., 1985. Fouling of heat transfer surfaces related tob-lactoglobulin denaturation during heat processing of milk. Biotechnol. Prog. 1,131–139.
Leuliet, J.C., Maingonnat, J.F., Lalande, M. 1988. Thermal behaviour of plate heatexchangers with Newtonian and non-Newtonian fluids. In: Proceedings CongresEurotherm 5 et 1er Colloque TIFAN, Compiegne, pp. 1–15.
Lin, M.J., Lewis, M.J., Grandison, S., 2006. Measurement of ionic calcium in milk. Int.J. Dairy Technol. 59, 192–199.
Lyster, R.L.J., 1970. The denaturation of a-lactalbumin and b-lactoglobulin in heatedmilk. J. Dairy Res. 37, 233–243.
Mahdi, Y., Mouheb, A., Oufer, L., 2009. A dynamic model for milk fouling in a plateheat exchanger. Appl. Math. Model. 33, 648–662.
Morison, K.R., Tie, S.-H., 2002. The development and investigation of a model milkmineral fouling solution. Food Bioprod. Process. 80 (4), 326–331.
Mulvihill, D.M., Donovan, M., 1987. Whey proteins and their thermal denaturation.Irish J. Food Sci. Technol. 11, 43–77.

78 M. Khaldi et al. / Journal of Food Engineering 147 (2015) 68–78
O’Kennedy, B.T., Mounsey, J.S., 2009. The dominating effect of ionic strength of theheat-induced denaturation and aggregation of beta-lactoglobulin in simulatedmilk ultrafiltrate. Int. Dairy J. 19, 123–128.
Pappas, C.P., Rothwell, J., 1991. Mechanisms of protein fouling in heat exchangers.Food Chem. 42, 183–201.
Petit, J., Herbig, A.L., Moreau, A., Delaplace, G., 2011. Influence of calcium on b-lactoglobulin denaturation kinetics: implications in unfolding and aggregationmechanisms. J. Dairy Sci. 94 (12), 5794–5810.
Petit, J., Six, T., Moreau, A., Ronse, G., Delaplace, G., 2013. Beta-lactoglobulindenaturation, aggregation, and fouling in a plate heat exchanger: pilot-scaleexperiments and dimensional analysis. Chem. Eng. Sci. 101, 432–450.
Phan-Xuan, T., Durand, D., Nicolai, T., 2013. Tuning the structure of protein particlesand gels with calcium or sodium ions. Biomacromolecules 14, 1980–1989.
Roefs, S.P.F.M., Peppelman, H.A., 2001. Aggregation and gelation of whey proteins:specific effect of divalent cations? In: Dickinson, E., Miller, R. (Eds.), FoodColloids Fundamentals of Formulation. The Royal Society of Chemistry,Cambridge, pp. 358–368.
Schmidt, R.H., Illingworth, B.L., Ahmed, E.M., 1978. Heat induced gelation of peanutprotein/whey protein blends. J. Food Sci. 43, 613–621.
Schmitt, C., Bovay, C., Rouvet, M., Shojaei-Rami, S., Kolodziejczyk, E., 2007. Wheyprotein soluble aggregates from heating with NaCl: Physicochemical, interfacialand foaming properties. Langmuir 23, 4155–4166.
Sherwin, C.P., Foegeding, E.A., 1997. The effects of CaCl2 on aggregation of wheyproteins. Milchwissenschaft-Milk Sci. Int. 52 (2), 93–96.
Shimada, K., Cheftel, J.C., 1989. Sulfydryl group/disulfide bond interchange reactionsduring heat-induced gelation of whey protein isolate. J. Agric. Food Chem. 37,161–168.
Simmons, M.J.H., Jayaraman, P., Fryer, P.J., 2007. The effect of temperature and shearrate upon the aggregation of whey protein and its implication for milk fouling. J.Food Eng. 79, 517–528.
Simons, J.-W.F.A., Kosters, H.A., Visschers, R.W., de Jongh, H.H.J., 2002. Role ofcalcium as trigger in thermal beta-lactoglobulin aggregation. Arch. Biochem.Biophys. 406, 143–152.
Srichantra, A., Newstead, D.F., MCcarthy, O.J., Paterson, A.H.J., 2006. Effect ofpreheating on fouling of a pilot scale UHT sterilizing plant by recombined,reconstituted and fresh whole milks. Food Bioprod. Process. 84, 279–285.
Szirtes, T., 1998. Applied Dimensional Analysis and Modeling. McGraw-HillEducation, Europe.
Tissier, J.P., Lalande, M., 1986. Experimental device and methods for studying milkdeposit formation on heat exchange surfaces. Biotechnol. Prog. 2, 218–229.
Twoney, M., Keogh, M.K., Mehra, R.A.J., Okennedy, B.T., 1997. Gel characteristics ofb-lactoglobulin, whey protein concentrate and whey protein isolate. J. TextureStud. 28, 387–403.
Visser, J., Jeurnink, Th.J.M., 1997. Fouling of heat exchangers in the dairy industry.Exp. Therm. Fluid. Sci. 14, 407–424.
Wang, C.H., Damodaran, S., 1991. thermal gelation of globular-proteins – influenceof protein conformation on gel strength. J. Agric. Food Chem. 39, 433–438.
Xiong, Y.L., 1992. Influence of pH and ionic environment on thermal aggregation ofwhey proteins. J. Agric. Food Chem. 40, 380–384.
Xiong, Y.L., Dawson, K.A., Wan, L., 1993. Thermal aggregation of b-lactoglobulin:effect of pH, ionic environment and thiol reagent. J. Dairy Res. 76, 71–77.
Copyright © 2022 FDOKUMEN