Effect of branching characteristics of ethylene/1-butene copolymers on melt flow index
6
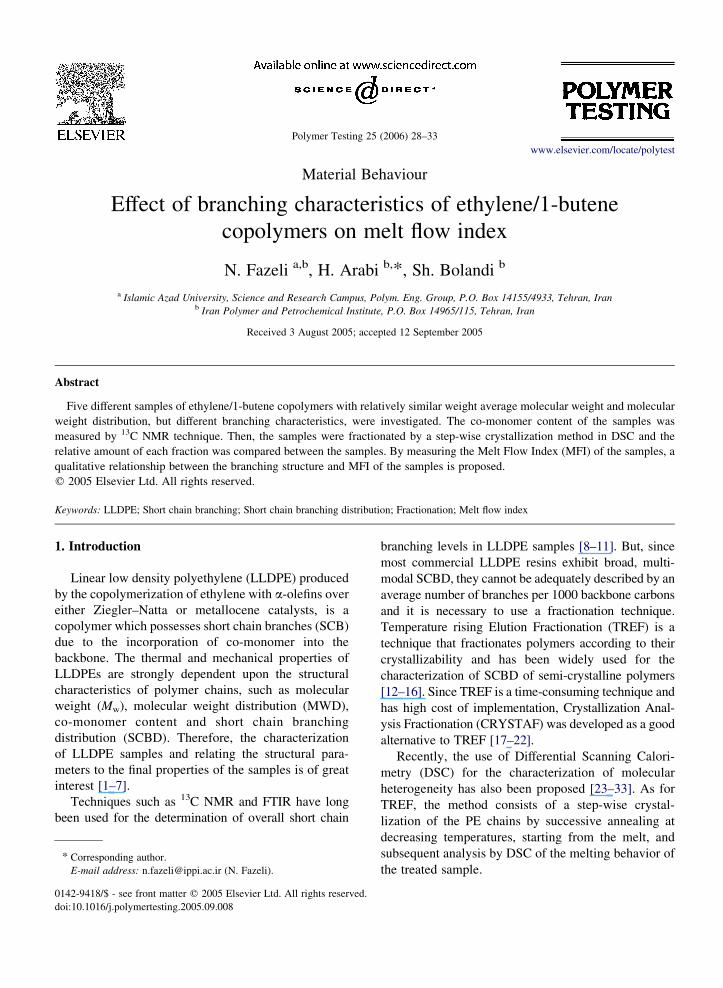
Material Behaviour Effect of branching characteristics of ethylene/1-butene copolymers on melt flow index N. Fazeli a,b , H. Arabi b, * , Sh. Bolandi b a Islamic Azad University, Science and Research Campus, Polym. Eng. Group, P.O. Box 14155/4933, Tehran, Iran b Iran Polymer and Petrochemical Institute, P.O. Box 14965/115, Tehran, Iran Received 3 August 2005; accepted 12 September 2005 Abstract Five different samples of ethylene/1-butene copolymers with relatively similar weight average molecular weight and molecular weight distribution, but different branching characteristics, were investigated. The co-monomer content of the samples was measured by 13 C NMR technique. Then, the samples were fractionated by a step-wise crystallization method in DSC and the relative amount of each fraction was compared between the samples. By measuring the Melt Flow Index (MFI) of the samples, a qualitative relationship between the branching structure and MFI of the samples is proposed. q 2005 Elsevier Ltd. All rights reserved. Keywords: LLDPE; Short chain branching; Short chain branching distribution; Fractionation; Melt flow index 1. Introduction Linear low density polyethylene (LLDPE) produced by the copolymerization of ethylene with a-olefins over either Ziegler–Natta or metallocene catalysts, is a copolymer which possesses short chain branches (SCB) due to the incorporation of co-monomer into the backbone. The thermal and mechanical properties of LLDPEs are strongly dependent upon the structural characteristics of polymer chains, such as molecular weight (M w ), molecular weight distribution (MWD), co-monomer content and short chain branching distribution (SCBD). Therefore, the characterization of LLDPE samples and relating the structural para- meters to the final properties of the samples is of great interest [1–7]. Techniques such as 13 C NMR and FTIR have long been used for the determination of overall short chain branching levels in LLDPE samples [8–11]. But, since most commercial LLDPE resins exhibit broad, multi- modal SCBD, they cannot be adequately described by an average number of branches per 1000 backbone carbons and it is necessary to use a fractionation technique. Temperature rising Elution Fractionation (TREF) is a technique that fractionates polymers according to their crystallizability and has been widely used for the characterization of SCBD of semi-crystalline polymers [12–16]. Since TREF is a time-consuming technique and has high cost of implementation, Crystallization Anal- ysis Fractionation (CRYSTAF) was developed as a good alternative to TREF [17–22]. Recently, the use of Differential Scanning Calori- metry (DSC) for the characterization of molecular heterogeneity has also been proposed [23–33]. As for TREF, the method consists of a step-wise crystal- lization of the PE chains by successive annealing at decreasing temperatures, starting from the melt, and subsequent analysis by DSC of the melting behavior of the treated sample. Polymer Testing 25 (2006) 28–33 www.elsevier.com/locate/polytest 0142-9418/$ - see front matter q 2005 Elsevier Ltd. All rights reserved. doi:10.1016/j.polymertesting.2005.09.008 * Corresponding author. E-mail address: [email protected] (N. Fazeli).
-
Upload
independent -
Category
Documents
-
view
2 -
download
0
Transcript of Effect of branching characteristics of ethylene/1-butene copolymers on melt flow index
Material Behaviour
Effect of branching characteristics of ethylene/1-butene
copolymers on melt flow index
N. Fazeli a,b, H. Arabi b,*, Sh. Bolandi b
a Islamic Azad University, Science and Research Campus, Polym. Eng. Group, P.O. Box 14155/4933, Tehran, Iranb Iran Polymer and Petrochemical Institute, P.O. Box 14965/115, Tehran, Iran
Received 3 August 2005; accepted 12 September 2005
Abstract
Five different samples of ethylene/1-butene copolymers with relatively similar weight average molecular weight and molecular
weight distribution, but different branching characteristics, were investigated. The co-monomer content of the samples was
measured by 13C NMR technique. Then, the samples were fractionated by a step-wise crystallization method in DSC and the
relative amount of each fraction was compared between the samples. By measuring the Melt Flow Index (MFI) of the samples, a
qualitative relationship between the branching structure and MFI of the samples is proposed.
q 2005 Elsevier Ltd. All rights reserved.
Keywords: LLDPE; Short chain branching; Short chain branching distribution; Fractionation; Melt flow index
1. Introduction
Linear low density polyethylene (LLDPE) produced
by the copolymerization of ethylene with a-olefins over
either Ziegler–Natta or metallocene catalysts, is a
copolymer which possesses short chain branches (SCB)
due to the incorporation of co-monomer into the
backbone. The thermal and mechanical properties of
LLDPEs are strongly dependent upon the structural
characteristics of polymer chains, such as molecular
weight (Mw), molecular weight distribution (MWD),
co-monomer content and short chain branching
distribution (SCBD). Therefore, the characterization
of LLDPE samples and relating the structural para-
meters to the final properties of the samples is of great
interest [1–7].
Techniques such as 13C NMR and FTIR have long
been used for the determination of overall short chain
0142-9418/$ - see front matter q 2005 Elsevier Ltd. All rights reserved.
doi:10.1016/j.polymertesting.2005.09.008
* Corresponding author.
E-mail address: [email protected] (N. Fazeli).
branching levels in LLDPE samples [8–11]. But, since
most commercial LLDPE resins exhibit broad, multi-
modal SCBD, they cannot be adequately described by an
average number of branches per 1000 backbone carbons
and it is necessary to use a fractionation technique.
Temperature rising Elution Fractionation (TREF) is a
technique that fractionates polymers according to their
crystallizability and has been widely used for the
characterization of SCBD of semi-crystalline polymers
[12–16]. Since TREF is a time-consuming technique and
has high cost of implementation, Crystallization Anal-
ysis Fractionation (CRYSTAF) was developed as a good
alternative to TREF [17–22].
Recently, the use of Differential Scanning Calori-
metry (DSC) for the characterization of molecular
heterogeneity has also been proposed [23–33]. As for
TREF, the method consists of a step-wise crystal-
lization of the PE chains by successive annealing at
decreasing temperatures, starting from the melt, and
subsequent analysis by DSC of the melting behavior of
the treated sample.
Polymer Testing 25 (2006) 28–33
www.elsevier.com/locate/polytest
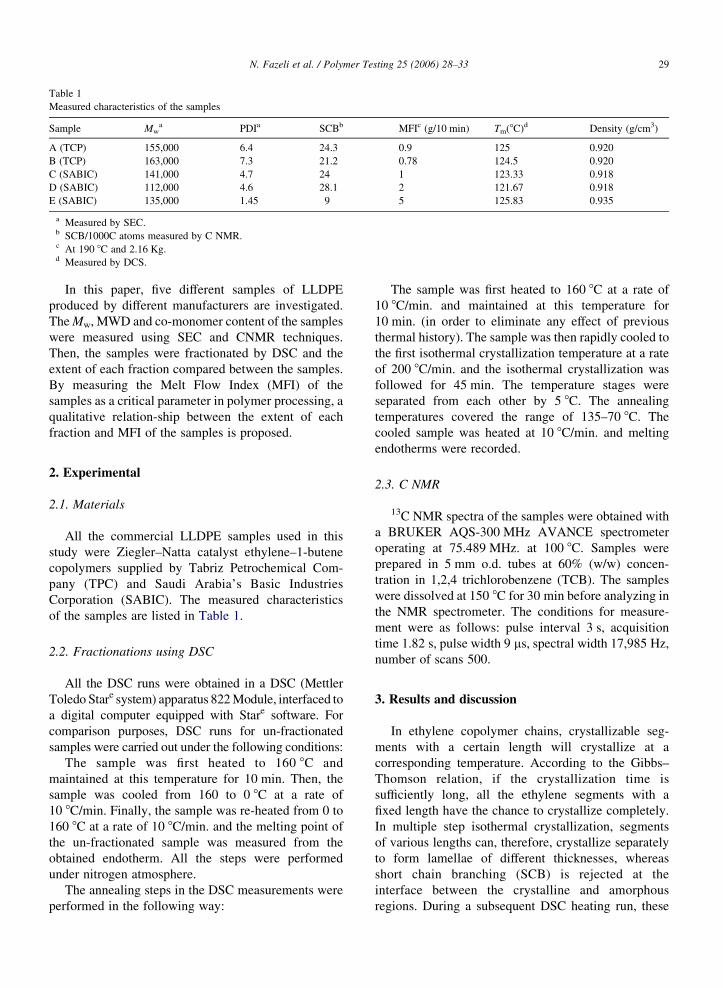
Table 1
Measured characteristics of the samples
Sample Mwa PDIa SCBb MFIc (g/10 min) Tm(8C)d Density (g/cm3)
A (TCP) 155,000 6.4 24.3 0.9 125 0.920
B (TCP) 163,000 7.3 21.2 0.78 124.5 0.920
C (SABIC) 141,000 4.7 24 1 123.33 0.918
D (SABIC) 112,000 4.6 28.1 2 121.67 0.918
E (SABIC) 135,000 1.45 9 5 125.83 0.935
a Measured by SEC.b SCB/1000C atoms measured by C NMR.c At 190 8C and 2.16 Kg.d Measured by DCS.
N. Fazeli et al. / Polymer Testing 25 (2006) 28–33 29
In this paper, five different samples of LLDPE
produced by different manufacturers are investigated.
The Mw, MWD and co-monomer content of the samples
were measured using SEC and CNMR techniques.
Then, the samples were fractionated by DSC and the
extent of each fraction compared between the samples.
By measuring the Melt Flow Index (MFI) of the
samples as a critical parameter in polymer processing, a
qualitative relation-ship between the extent of each
fraction and MFI of the samples is proposed.
2. Experimental
2.1. Materials
All the commercial LLDPE samples used in this
study were Ziegler–Natta catalyst ethylene–1-butene
copolymers supplied by Tabriz Petrochemical Com-
pany (TPC) and Saudi Arabia’s Basic Industries
Corporation (SABIC). The measured characteristics
of the samples are listed in Table 1.
2.2. Fractionations using DSC
All the DSC runs were obtained in a DSC (Mettler
Toledo Stare system) apparatus 822 Module, interfaced to
a digital computer equipped with Stare software. For
comparison purposes, DSC runs for un-fractionated
samples were carried out under the following conditions:
The sample was first heated to 160 8C and
maintained at this temperature for 10 min. Then, the
sample was cooled from 160 to 0 8C at a rate of
10 8C/min. Finally, the sample was re-heated from 0 to
160 8C at a rate of 10 8C/min. and the melting point of
the un-fractionated sample was measured from the
obtained endotherm. All the steps were performed
under nitrogen atmosphere.
The annealing steps in the DSC measurements were
performed in the following way:
The sample was first heated to 160 8C at a rate of
10 8C/min. and maintained at this temperature for
10 min. (in order to eliminate any effect of previous
thermal history). The sample was then rapidly cooled to
the first isothermal crystallization temperature at a rate
of 200 8C/min. and the isothermal crystallization was
followed for 45 min. The temperature stages were
separated from each other by 5 8C. The annealing
temperatures covered the range of 135–70 8C. The
cooled sample was heated at 10 8C/min. and melting
endotherms were recorded.
2.3. C NMR
13C NMR spectra of the samples were obtained with
a BRUKER AQS-300 MHz AVANCE spectrometer
operating at 75.489 MHz. at 100 8C. Samples were
prepared in 5 mm o.d. tubes at 60% (w/w) concen-
tration in 1,2,4 trichlorobenzene (TCB). The samples
were dissolved at 150 8C for 30 min before analyzing in
the NMR spectrometer. The conditions for measure-
ment were as follows: pulse interval 3 s, acquisition
time 1.82 s, pulse width 9 ms, spectral width 17,985 Hz,
number of scans 500.
3. Results and discussion
In ethylene copolymer chains, crystallizable seg-
ments with a certain length will crystallize at a
corresponding temperature. According to the Gibbs–
Thomson relation, if the crystallization time is
sufficiently long, all the ethylene segments with a
fixed length have the chance to crystallize completely.
In multiple step isothermal crystallization, segments
of various lengths can, therefore, crystallize separately
to form lamellae of different thicknesses, whereas
short chain branching (SCB) is rejected at the
interface between the crystalline and amorphous
regions. During a subsequent DSC heating run, these

Fig. 1. DSC thermograms of the samples.
N. Fazeli et al. / Polymer Testing 25 (2006) 28–3330
lamellae with different thicknesses melt at different
temperatures. Therefore, a DSC thermogram with
multiple melting peaks is obtained. Fig. 1 shows the
thermograms of the samples after segregation frac-
tionation in DSC.
According to the Gibbs–Thomson equation, it is
possible to determine the lamellar thickness of different
lamellae [1,2,28,32–35]:
Tm Z T8mð1 � 2de=DH:LcÞ
where Tm is the observed melting point, T8m is the
equilibrium melting point of an infinite polyethylene
crystal (418.7 8K), DH is the enthalpy of fusion per unit
volume (285!106 J/m3), de is the surface energy of a
polyethylene crystal (90!10K3 J/m2) and Lc is the
thickness of the lamellae with melting point Tm.
The distribution and type of SCB has a deep
influence on physical and mechanical properties of a
LLDPE sample. Using the above equation, Hosoda
et al. [23] has proposed the following relationship
between melting peaks and SCB for ethylene/1-butene
copolymers, which has also been used by other
0
2
4
6
8
10
12
SCB
% S
CB
C D A B E
34 31 28 25 22 19 16 13
Fig. 2. SCBD in samples after fractionation in DSC.
researchers [26,28,31]:
Tð8CÞ ZK1:6 � SCB C136
With the help of the above equation, the correspond-
ing SCB of each peak is determined in the DSC
thermograms. Then, by measuring the relative area
under the peaks, it was possible to compare the relative
amount of each fraction of the samples. As can be seen
in Fig. 2, the sample E (roto-molding grade) has the
lowest amount of branched chains so the highest
amount of linear ones. Moreover, in other samples,
which are all film blowing grade, the amounts of
branched chains in the two SABIC samples (C and D)
are higher than the TCP ones (A and B).
The Melt Flow Index (MFI) of the samples is
considered as a critical parameter in polymer proces-
sing and industrial designs. MFI of a PE resin refers to
the rate at which it extrudes from a capillary die under a
standard set of conditions. The MFI is reflected by the
average dimensions of the molecules in a resin and their
entanglements with one another so it depends on
molecular characteristics (Mw and MWD) and
NMR Data
R2 = 0.9991
0
1
2
3
4
5
6
0 5 10 15 20 25 30
br carbons/1ooo CH2
MF
I
Fig. 3. The variation of MFI against SCB/1000C (obtained by C NMR).

DSC Data
R2 = 0.9795
0
1
2
3
4
5
6
0 5 10 15 20 25 30
% branched chains
MF
I
Fig. 4. The variation of MFI against percent branched chains
(obtained from DSC).
R2 = 0.9256
0
1
2
3
4
5
6
0 0.2 0.4 0.6 0.8 1 1.2
amount of chains with SCB=28
MF
I
R2 =0.8885
0
1
2
3
4
5
6
0 0.5 1 1.5 2 2.5 3
Amount of chains with SCB=22
MF
I
R2 = 0.9943
0
1
2
3
4
5
6
0 4 8Amount of chains with SCB=16
MF
I
2 6
Fig. 5. The variation of MFI against the am
N. Fazeli et al. / Polymer Testing 25 (2006) 28–33 31
branching characteristics (SCB and SCBD) of the
sample. The MFI of the studied samples were measured
and are shown in Table 1. Since the weight average
molecular weight and molecular weight distribution of
the samples are relatively close together (except for the
sample E which has a narrow PDI), the difference in
MFI of the samples is related to their branching
characteristics.
In Fig. 3, the MFI of the samples is plotted against
their SCB/1000C atoms of the main chain (measured by
C NMR). As it can be seen, with increasing the degree
of branching (SCB/1000C), the MFI of the sample goes
R2 = 0.8851
0
1
2
3
4
5
6
0 0.5 1 1.5 2amount of chains with SCB=25
MF
I
R2 =0.9012
0
1
2
3
4
5
6
0 2 4
Amount of chains with SCB=19
MF
I
R2 =0.9912
0
1
2
3
4
5
6
0 4 10 12Amount of chains with SCB=13
MF
I
2 6 8
1 3 5
ount of a certain degree of branching.
N. Fazeli et al. / Polymer Testing 25 (2006) 28–3332
through a minimum. It seems that, before the minimum
point, the increase in SCB will cause more entangle-
ments between the chains (inter-molecular entangle-
ment) and therefore will impede the flow. However,
after the minimum point, increase in the SCB/1000C
will cause the chains to have a more compact molecular
profile (more intra-molecular entanglements instead of
inter-molecular ones), so the chains will cause less
hindrance to the flow of other chains. Such effect has
been seen in the viscosity of molten ultra high
molecular weight polyethylene, which may be greatly
reduced if it has been previously precipitated from
dilute solution [36]. Dissolving PE in a large excess of
solvent greatly reduces the overlap between adjacent
random coils, thereby decreasing the number of
intermolecular entanglements along the length of each
chain. When the PE chains are precipitated by a rapid
reduction of temperature they have insufficient time to
re-entangle. The net result is a material with relatively
few chain entanglements in comparison to melt
crystallized samples. Therefore, the viscosity is greatly
reduced (i.e. MFI is increased).
Predicting a quantitative relation between MFI and
the amount of branched chains is not possible because
there is still another parameter affecting on MFI and
that is SCBD, i.e. the amount of chains with a certain
degree of branching. This data can be obtained from
the area under each of the multiple peaks in the DSC
thermograms. In Fig. 4, the variation of MFI against
the whole amount of branched chains obtained from
DSC data is shown. As can be seen, the same result is
obtained: by increasing the amount of branched
chains (and decreasing the amount of linear chains),
the MFI of the sample goes down until a minimum is
reached. After that, further increase in the amount of
branched chains will cause the MFI to rise. If the area
under each of the multiple peaks in the DSC
thermograms is measured and plotted against MFI,
it is expected that the changes of MFI with the
amount of each fraction will go through a minimum.
By increasing the number of SCB, this minimum
should occur at lower amounts.
In Fig. 5, the variation of MFI against the amount of
a certain degree of branching is shown according to the
data obtained from DSC thermograms. As can be seen,
all the plots show a minimum and, as expected, by
increasing the degree of branching this minimum
occurs in fewer amounts. In other words, the degree
of branching (number of branching per 1000C atoms of
the main chain) and the amount of each fraction (the
number of chains which have the same degree of
branching) have the same effect on MFI.
4. Conclusions
With increasing of the degree of branching in
LLDPE samples, the MFI goes through a minimum.
Before the minimum point, the increase in SCB will
cause more entanglements between the chains (inter-
molecular entanglement) and, therefore, will impede
the flow. However, after the minimum point, increase in
the SCB will cause the chains to have a more compact
molecular profile (more intra-molecular entanglements
instead of inter-molecular ones), so the chains will
cause less hindrance to the flow of other chains. The
same effect will be observed when the amount of
branched chains with a certain degree of branching is
increased: the MFI will go down until a minimum is
reached. After that, further increase in the amount of
branched chains will cause the MFI to rise. In other
words, the degree of branching (number of branching
per 1000C atoms of main chain) and the amount of
branching (the number of chains which have the same
degree of branching), have the same effect on MFI. By
increasing the degree of branching, this minimum
occurs at lower amounts.
References
[1] M. Zhang, D.T. Lynch, S.E. Wanke, Effect of molecular
structure distribution on melting and crystallization behavior
of 1-butene/ethylene copolymers, Polymer 42 (2001) 3067.
[2] J.B.P. Soares, R.F. Abbott, J.D. Kim, Enviromental stress
cracking resistance of PE: the use of CRYSTAF and SEC to
establish structure–property relationships, J. Polym. Sci. 38
(2000) 1267 Part B.
[3] L.C. Simon, R.F. Desouza, J.B.P. Soares, R.S. Mauler, Effect
of molecular structure on dynamic mechanical properties of PE
obtained with nickel-diimine catalysts, Polymer 42 (2001)
4885.
[4] A.G. Simanke, G.B. Galland, R. Baumhardt, R. Quijada,
R.S. Mauler, Influence of the type and the comonomer contents
on the mechanical behavior of ethylene/a-olefin copolymers,
J. Appl. Polym. Sci. 74 (1999) 1194.
[5] C. Lipishan, J.B.P. Soares, A Penlidis. Mechanical properties of
ethylene/1-hexene copolymers with tailored short chain branch-
ing distributions, Polymer 43 (2002) 767.
[6] S. Hosoda, A Uemura. Effect of the structural distribution on the
mechanical properties of LLDPEs, Polymer J. 24 (9) (1992) 939.
[7] M.A. Kennedy, A.J. Peacock, M.D. Failla, J.C. Lucas,
L. Mandelkern, Tensile properties of crystalline polymers:
random copolymers of ethylene, Macromolecules 28 (1995)
1407.
[8] J.C. Randall, Carbon-13 NMR of ethylene-1-olefin copolymers:
Extension to the short-chain branch distribution in a low-density
polyethylene, J. Polym. Sci. 11 (1973) 275 (Part B).
[9] D.C. Bugada, A. Rudin, Branching in LDPE by CNMR, Eur.
Polym. J. 23 (10) (1987) 809.
[10] E.W. Hansen, R. Blom, O.M. Bade, NMR characterization of PE
with emphasis on internal consistency of peak intensities and
N. Fazeli et al. / Polymer Testing 25 (2006) 28–33 33
estimation of uncertainties in derived branch distribution
numbers, Polymer 38 (17) (1997) 4295.
[11] A. Jurkiewicz, N.W. Eilerts, E.T. Hsieh, CNMR characteriz-
ation of short chain branches of Nickel catalyzed PE,
Macromolecules 32 (17) (1999) 5471.
[12] L. Wild, T. Ryle, Crystallizability distributions in polymers: a
new analytical technique, Polym. Prepr. 18 (1977) 182.
[13] L. Wild, Temperature rising elution fractionation, Adv. Polym.
Sci. (1990) 1.
[14] D.L. Wilfong, Crystallization mechanisms for LLDPE and its
fractions, J. Polym. Sci., Part B 28 (1990) 861.
[15] G. Glockner, TREF: a review, J. Appl. Polym. Sci., Appl.
Polym. Symp. 45 (1990) 1.
[16] F. Defoor, G. Groeninckx, P. Schoulerden, B. Vanderheijden,
Molecular, thermal and morphological characterization of
narrowly branched fractions of 1-octene LLDPE: 1.Molecular
and thermal characterization, Polymer 33 (18) (1992) 3878.
[17] B. Monrabal, CRYSTAF: a new technique for the analysis of
branching distribution in polyolefins, J. Appl. Polym. Sci. 52
(1994) 491.
[18] B. Monrabal, CRYSTAF: Crystallization analysis fractionation.
A new approach to the composition analysis of semi-crystalline
polymers, Macromol. Symp. 110 (1996) 81.
[19] B. Monrabal, J. Blanco, J. Nieto, J.B.P. Soares, Characterization
of homogeneous ethylene/1-octene copolymers made with a
single-site catalyst. CRYSTAF analysis and calibration,
J. Polym. Sci., Part A 37 (1999) 89.
[20] L.J.D. Britto, J.B.P. Soares, A Penlidis, B Monrabal. Polyolefin
analysis by single-step crystallization fractionation, J. Polym.
Sci., Part B 37 (1999) 539.
[21] S. Anantawaraskul, J.B.P. Soares, P.M. Wood-adams,
B. Monrabal, Effect of Mw and average comonomer content
on the Crystaf of ethylene a-olefin copolymers, Polymer 44
(2003) 2393.
[22] S. Anantawaraskul, P.J.B. Soares, P.M. Wood-adams, Effect of
operation parameters on TREF and CRYSTAF, J. Polym. Sci.,
Part B 41 (2003) 1762.
[23] S. Hosoda, Structural distribution of LLDPEs, Polym. J. 20 (5)
(1988) 383.
[24] L. Wild, S. Chang, M.J. Shankernarayanan, Improved method
for compositional analysis of polyolefins by DSC, Polym. Prepr.
31 (1990) 270.
[25] E. Karbashewski, L. Kale, A. Rudin, W.J. Tchir, D.G. Cook,
J.O. Pronouost, Characterization of LLDPE by TREF and DSC,
J. Appl. Polym. Sci. 44 (1992) 425.
[26] E. Adisson, M. Ribeiro, A. Deffieux, M. Fontanille, Evaluation
of the heterogeneity in LLDPE co-monomer unit distribution by
DSC characterization of thermally treated samples, Polymer 33
(20) (1992) 4337.
[27] G. Balbontin, I. Camurati, T. Dallocco, A. Finotti, R. Franzese,
G. Vecellio, Determination of 1-butene distribution in LLDPE
by DSC analysis after thermal fractionated CRYSTALLIZA-
TION, Ang. Makromol. Chem. 219 (1994) 139.
[28] P. Starck, Studies of the comonomer distributions in LDPE
using TREF and stepwise crystallization by DSC, Polym. Int. 40
(1996) 111.
[29] M. Kim, P.J. Phillips, Nonisothermal melting and crystallization
studies of homogeneous ethylene/a-olefin random copolymers,
J. Appl. Polym. Sci. 70 (1998) 1893.
[30] M. Zhang, D.T. Lynch, S.E. Wanke, Characterization of
commercial LLDPE by TREF-DSC and TREF-SEC cross-
fractionation, J. Appl. Polym. Sci. 75 (2000) 960.
[31] F. Chen, R.A. Shanks, G. Amarasinghe, Crystallization of
single-site PE blends investigated by thermal fraction tech-
niques, Polymer 42 (2001) 4579.
[32] H. Teng, Y. Shi, X. Jin, Novel characterization of the crystalline
segment distribution and its effect on the crystallization of
branched PE by DSC, J. Polym. Sci., Part B 40 (2002) 2107.
[33] S. Hosoda, K. Kojima, M. Furuta, Morphological study of melt-
crystallized LLDPE by TEM, Makromol. Chem. 187 (1986)
1501.
[34] Z. Fan, Y. Wang, H. Bu, Influence of intermolecular
entanglements on crystallization behavior of ultra-high molar
mass PE, Polym. Eng. Sci. 43 (3) (2003) 607.
[35] B. Crist, E.S. Claudio, Isothermal crystallization of random
ethylene-butene copolymers: bimodal kinetics, Macromolecules
32 (1999) 8945.
[36] A.J. Peacock, Handbook of polyethylene, Marcel Dekker Inc.,
New York, NY, 2000.