Theory of block copolymers. I. Domain formation in AB block copolymers
Upload
khangminh22Category
view
0download
0
The University of Southern Mississippi The University of Southern Mississippi
The Aquila Digital Community The Aquila Digital Community
Dissertations
Fall 12-1-2015
Polyacrylonitrile Copolymers: Effects of Molecular Weight, Polyacrylonitrile Copolymers: Effects of Molecular Weight,
Polydispersity, Composition, and Sequencing on Thermal Ring-Polydispersity, Composition, and Sequencing on Thermal Ring-
Closing Stabilization Closing Stabilization
Jeremy D. Moskowitz University of Southern Mississippi
Follow this and additional works at: https://aquila.usm.edu/dissertations
Part of the Polymer and Organic Materials Commons, Structural Materials Commons, and the
Structures and Materials Commons
Recommended Citation Recommended Citation Moskowitz, Jeremy D., "Polyacrylonitrile Copolymers: Effects of Molecular Weight, Polydispersity, Composition, and Sequencing on Thermal Ring-Closing Stabilization" (2015). Dissertations. 173. https://aquila.usm.edu/dissertations/173
This Dissertation is brought to you for free and open access by The Aquila Digital Community. It has been accepted for inclusion in Dissertations by an authorized administrator of The Aquila Digital Community. For more information, please contact [email protected].
POLYACRYLONITRILE COPOLYMERS: EFFECTS OF MOLECULAR WEIGHT,
POLYDISPERSITY, COMPOSITION, AND SEQUENCING ON
THERMAL RING-CLOSING STABILIZATION
by
Jeremy Daniel Moskowitz
A Dissertation
Submitted to the Graduate School
and the School of Polymers and High Performance Materials
at The University of Southern Mississippi
in Partial Fulfillment of the Requirements
for the Degree of Doctor of Philosophy
December 2015
ii
ABSTRACT
POLYACRYLONITRILE COPOLYMERS: EFFECTS OF MOLECULAR WEIGHT,
POLYDISPERSITY, COMPOSITION, AND SEQUENCING ON
THERMAL RING-CLOSING STABILIZATION
by Jeremy Daniel Moskowitz
December 2015
Controlled polyacrylonitrile (PAN)-based carbon fiber precursors with defined
molecular weights, polydispersities, compositions, and architectures have been prepared
for their study on thermal ring-closing stabilization behavior. PAN and its copolymers of
number average molecular weights exceeding 170,000 g/mol were successfully
synthesized via low temperature reversible addition-fragmentation chain transfer (RAFT)
polymerization. RAFT polymerizations of PAN-based precursors were compared to
conventional free radical solution polymerizations with a focus on the effects of
molecular weight and polydispersity on structural evolution and cyclization efficiency.
When RAFT polymerization was extended to copolymers, it was found that RAFT
copolymers achieved greater cyclization intensities and improved thermal stability as
compared to analogous uncontrolled free radical copolymers. The greater thermal
stability was attributed to the more controlled polymerization method and the reduction
of chain transfer and small molecule defects.
New comonomers were introduced for PAN-based precursors and explored in
relation to traditional comonomers. N-isopropylacrylamide (NIPAM) was found to be a
promising comonomer by simultaneously serving as a mediator to thermal cyclization as
well as a plasticizer to facilitate processing and spinning. Utilizing RAFT polymerization

iii
in combination with a semibatch reaction technique the copolymer sequencing of p(AN-
co-NIPAM) was systematically investigated. Results suggest that adjusting the feed rate
of each comonomer affects the comonomer distribution along the backbone by offering
tunable cyclization behaviors.
Attempts were made to mediate tacticity of PAN to study effects of tacticity on
cyclization. A series of Lewis acids and fluoroalcohols were employed as additives in the
polymerization, but no changes in tacticity were observed.
A 98/2 p(acrylonitrile-co-NIPAM) fiber was prepared from conventional free
radical solution polymerization. The fiber morphology, characterized by Transmission
Electron Microscopy (TEM), displayed minimal defects at the nanoscale with a
characteristic ribbon-like wavy pattern. The degree of orientation in the fibers was found
to exceed that of a commercial-grade PAN-based precursor. The thermo-oxidative
stability of the lab-produced fiber shared similar characteristics to commercial fibers and
has set the benchmark for future designs of PAN-based carbon fiber precursors.

COPYRIGHT BY
JEREMY DANIEL MOSKOWITZ
2015
POLYACRYLONITRILE COPOLYMERS: EFFECTS OF MOLECULAR WEIGHT,
POLYDISPERSITY, COMPOSITION, AND SEQUENCING ON
THERMAL RING-CLOSING STABILIZATION
by
Jeremy Daniel Moskowitz
A Dissertation
Submitted to the Graduate School
and the School of Polymers and High Performance Materials
at The University of Southern Mississippi
in Partial Fulfillment of the Requirements
for the Degree of Doctor of Philosophy
Approved:
________________________________________________
Dr. Jeffrey Wiggins, Committee Chair
Associate Professor, School of Polymers and High Performance Materials
________________________________________________
Dr. Sarah Morgan, Committee Member
Associate Professor, School of Polymers and High Performance Materials
________________________________________________
Dr. Charles McCormick, Committee Member
Professor, School of Polymers and High Performance Materials
________________________________________________
Dr. Robson Storey, Committee Member
Professor, School of Polymers and High Performance Materials
________________________________________________
Dr. Derek Patton, Committee Member
Associate Professor, School of Polymers and High Performance Materials
________________________________________________
Dr. Karen S. Coats
Dean of the Graduate School
December 2015

vi
DEDICATION
This dissertation is dedicated to my family for their constant love and support. To
my parents, Barry and Tammy Moskowitz, for teaching me invaluable life lessons and
making me the person I am today. To my brothers and sisters, Josh, Kelsey, Jessica, and
Stan, for always being at my side providing advice, and leading the way. To Rachel, for
her motivation, pushing me to constantly better myself, and for believing in me and
loving me.
vii
ACKNOWLEDGMENTS
I would like to acknowledge my advisor, Dr. Jeffrey S. Wiggins, for providing me
the opportunities to grow as a professional. I am sincerely grateful for his selfless
devotion towards my success as a graduate student. Dr. Wiggins put me in the driver seat
from day one and allowed me to make the most of my graduate school experience. My
confidence as a polymer scientist emanated through his hands-off management style and
intellectual freedom. I would also like to acknowledge my committee members: Dr.
Derek Patton, Dr. Charles McCormick, Dr. Sarah Morgan, and Dr. Robson Storey, whom
all have given academic guidance and insight. I am thankful to Dr. Bronwyn Fox and her
research group and Dr. Matthew Weisenberger for their collaboration.
I would like to thank Dr. William Jarrett and David Delatte for their assistance
with laboratory instrumentation throughout the years. I am also appreciative of Dr.
Richard Liang and his research group at FSU to allow me to use their X-Ray Scattering
instrument. I would also like to recognize Jody Wiggins, Stephanie Patton, and Charlene
McMillin for all their help with lab supplies and organizing events. I would like to thank
industry partners Rob Maskell, Al Thomas, Longgui Tang, Matt Jackson, and Steve
Christensen for providing direction in my research.
I would like to thank my peers for making me a more well-rounded scientist and
teaching me throughout my graduate career: Brooks Abel, Chris Childers, Mark Early,
Phil Pickett, and Robert Peterson. Finally, I would like to acknowledge all of the current
and past members from Wiggins Research Group, in particular John Misasi and Brian
Greenhoe, for sticking together and making graduate school more enjoyable, and also my
undergraduates for their contributions in the lab: Jonathan, Cade, and Anthony.
viii
TABLE OF CONTENTS
ABSTRACT ......................................................................................................................... i
DEDICATION .................................................................................................................... v
ACKNOWLEDGMENTS ................................................................................................ vii
LIST OF ILLUSTRATIONS .............................................................................................. x
LIST OF TABLES ........................................................................................................... xvi
LIST OF SCHEMES...................................................................................................... xviii
CHAPTER
I. INTRODUCTION ................................................................................................ 1
Carbon Fiber Composites
Polyacrylonitrile (PAN)-Based Carbon Fiber Precursors
Processing of PAN-based Precursors
Polymer Precursor Properties and Their Effects on Carbon Fiber Processing
Controlled/Living Radical Polymerization (CLRP) of PAN
Copolymer Sequencing
Tacticity Control of PAN
Research Overview
II. MATERIALS, METHODS, AND PROCEDURES .......................................... 21
Materials
Synthesis of Polyacrylonitrile and its Copolymers
Methods of Characterization
III. HIGH MOLECULAR WEIGHT AND NARROW POLYDISPERSITY
POLYACRYLONITRILE VIA LOW TEMPERATURE RAFT
POLYMERIZATION ......................................................................................... 39
Abstract
Results and Discussion
Summary
IV. STABILIZATION OF POLYACRYLONITRILE: CONVENTIONAL FREE
RADICAL VERSUS CONTROLLED RAFT POLYMERIZATIONS ............. 62
ix
Abstract
Results and Discussion
Summary
V. AN INVESTIGATION OF N-ISOPROPYLACRLYAMIDE CONTAINING
PAN-COPOLYMERS AND THE STABILIZATION BEHAVIOR OF PAN-
BASED RAFT COPOLYMERS ........................................................................ 83
Abstract
Results and Discussion
Summary
VI. SEMI-BATCH RAFT POLYMERIZATION OF POLY(ACRYLONITRILE-
CO-N-ISOPROPYLACRYLAMIDE) AND ITS STABILIZATION
BEHAVIOR ..................................................................................................... 117
Abstract
Results and Discussion
Summary
VII. ATTEMPTS TO CONTROL TACTICITY IN POLYACRYLONITRILE .... 138
Abstract
Results and Discussion
Summary
VIII. SCALE-UP REACTIONS AND CARBON FIBER PROPERTIES ............... 145
Abstract
Results and Discussion
Summary
IX. CONCLUSIONS AND FUTURE WORK ....................................................... 155
APPENDIX ..................................................................................................................... 159
REFERENCES ............................................................................................................... 160

x
LIST OF ILLUSTRATIONS
Figure
1. Microstructure of PAN-derived carbon fiber: (A) skin region, (B) core region, (C)
hairpin defect, (D) wedge disclination. Reproduced by permission of the Society
of Chemical Indsutry/London from reference number 10. ..................................... 4
2. Ring strain for 8-membered cyclic sequence of nitrogen-containing rings. Gray
atoms are carbon, blue atoms are nitrogen, white atoms are hydrogen, and the
pink spheres represent lone electron pairs. ........................................................... 13
3. Structures of comonomers. ................................................................................... 22
4. Structures of the RAFT agents used. .................................................................... 23
5. NMR spectrum of cyano ethyl dodecyl trithiocarbonate (CEDT). ....................... 24
6. NMR spectrum of bisethylxanthate (BEX)........................................................... 25
7. NMR Spectrum of 4-cyano-4-((thioethoxy)sulfanyl) pentanoic acid (CTSPA). . 26
8. Structures of the initiators. .................................................................................... 27
9. Structures of Lewis acids and fluoroalcohols. ...................................................... 28
10. Representative NMR-spectra for timed intervals during RAFT polymerization of
AN with [AN]0:[CPDT]0:[V-70]0 = 10,000:1:0.67. .............................................. 30
11. Determination of dn/dc (0.084 mL/g) for PAN. ................................................... 32
12. Example of Origin 8.0 peak fitting for 2θ vs. Intensity of 5 mol% P(AN-co-AA)
copolymer. ............................................................................................................ 38
13. Transition state energy (ΔE) for various RAFT agent Z-groups. ......................... 41
14. (a) Kinetic plots, (b) polydispersity vs. conversion, and (c) Mn (SEC-MALLS) vs.
conversion plots for selected RAFT agents at 70 °C and [M]0:[CTA0]:[I]0 =
4,000:1:0.4. ........................................................................................................... 43
15. RI traces for the polymerization of AN using CPDT (A) and CTSPA (B) at 70 °C
with [M]0:[CTA]0:[I]0 = 4,000:1:0.4. .................................................................... 45
16. Mn (SEC-MALLS) vs. conversion for the CPDT-mediated RAFT polymerization
of AN at 70 °C at various [M]0:[CTA]0:[I]0 ratios. ............................................... 47
17. At higher temperatures polymer chains grow faster, but also have more chain
termination and branching events while at low temperatures chain termination and
chain branching are suppressed. ........................................................................... 50
xi
18. (a) Kinetic plots, (b) polydispersity vs. conversion, and (c) molecular weight
(SEC-MALLS) vs. conversion for selected RAFT agents at 30 °C and [M]
0:[CTA]0:[I]0 = 4,000:1:0.4. .................................................................................. 51
19. RI traces for the polymerization of AN using CPDT at 30 °C with
[M]0:[CTA]0:[I]0 = 4,000:1:0.4. ............................................................................ 52
20. (a) Kinetics plots as a function of reaction time, (b) molecular weight (SEC-
MALLS) vs. conversion for polymerization of AN with CPDT at
[M]0:[CTA]0:[I]0 = 4,000:1:0.4 for both 30 and 70 °C. ........................................ 54
21. (a) Kinetics plots and (b) molecular weight and polydispersity (SEC-MALLS) vs.
conversion for polymerization of AN with CPDT at [M]0:[CTA]0:[I]0 =
10,000:1:0.22. ....................................................................................................... 57
22. Progressive RI traces for the polymerization of AN using CPDT at 30 C with
[M]0:[CTA]0:[I]0 = 10,000:1:0.67. ........................................................................ 58
23. Molar absorptivity of CPDT. ................................................................................ 59
24. MALDI-TOF mass spectroscopy of PAN (Table 3, Entry 13c). .......................... 60
25. RI traces for the FR polymers (red) and RAFT polymers (blue). ......................... 64
26. The intrinsic viscosity of RAFT-2 in DMF at 25 °C. ........................................... 65
27. DSC curves of RAFT and FR PAN homopolymer samples at 5 °C/min. ............ 67
28. DSC curves for FR-3 at 2, 5, 10, and 20 °C/min. ................................................. 68
29. Plots of 1000/Tp vs. (a) ln(φ) according to the Ozawa method and (b) ln(φ/Tp2)
according to the Kissinger method. ...................................................................... 69
30. FTIR spectra of FR-2 heated at 225 °C for 5 hr in nitrogen (left) and zoomed in
around 2240 and 1590 cm-1 (right). Times shown are with respect to post ramp to
225 °C at 5 °C/min. ............................................................................................... 72
31. Real-time FTIR spectra recorded at 225 °C for 5 hr in nitrogen for (a) FR-1, (b)
FR-3, (c) RAFT-1, (d) RAFT-2, and (e) RAFT-3 (dotted lines represent IR bands
for nitrile (2240 cm-1) and imine (1590 cm-1) functionalities). ............................. 73
32. (a) Real-time unreacted nitrile content and (b) extent of stabilization as a function
of reaction time at 225 °C in N2. ........................................................................... 73
33. TGA plots of (a) untreated PAN polymers ramped at 10 °C/min to 600 °C in N2
and (b) polymers ramped at 10 °C/min in air and held at isotherms of 230, 245,
253, and 265 °C for 15 min each and then ramped at 10 °C/min to 600 °C in N2.
............................................................................................................................... 74
xii
34. DSC curves of pre-oxidized PAN treated at 225 °C in air for 30 min and 5 hr (a)
FR-2 and (b) RAFT-2. .......................................................................................... 75
35. Raman spectra of FR-2 polymer heat treated in air at 225 °C for 30 min and 5 hr
and also ramped to 800 °C in N2. .......................................................................... 77
36. Relative intensity (D-band/G-band) for Raman spectra of PAN polymers treated
to 225 °C in air for 30 min and for 5 hr and also ramped to 800 °C in N2. Error
bars represent one standard deviation from the mean of 5 spots measured and are
estimates of the uncertainty of the measurement. ................................................. 78
37. WAXS patterns for PAN samples at given heat treatment conditions in air. ....... 80
38. 2θ vs. intensity of (a) RAFT-2 and (b) FR-2 at 225 °C in air for various times. .. 80
39. DSC curves (5 °C/min ramp rate) of 95/5 PAN-based copolymers prepared by FR
polymerization. ..................................................................................................... 84
40. (a) Kinetic plot and (b) molecular weight vs. conversion for 98/2 p(AN-co-
NIPAM) CPDT-mediated RAFT Polymerization at 30 °C and [M]0:[CPDT]0:[I]0
= 10,000:1:0.67, in which [M]0 = [MAN]0 + [MNIPAM]0. ........................................ 90
41. (a) Kinetic plot and (b) molecular weight vs. conversion for 95/5 p(AN-co-AA)
CPDT-mediated RAFT Polymerization at 30 °C and [M]0:[CPDT]0:[I]0 =
10,000:1:0.67, in which [M]0 = [MAN]0 + [MAA]0................................................. 90
42. WAXS Patterns for RAFT Copolymers. .............................................................. 92
43. 2-theta vs. Intensity for (a) 2 mol% and (b) 5 mol% NIPAM, AA, and MMA
copolymers. ........................................................................................................... 93
44. DSCs of RAFT copolymers at 5 °C/min relative to PAN homopolymer at (a) 2
mol% and (b) 5 mol%. .......................................................................................... 95
45. Ozawa plots for RAFT copolymers for (a) 2 mol% and (b) 5 mol%. .................. 97
46. Real-time FTIR spectra of RAFT copolymers at 225 C in nitrogen for 2 mol % (a)
AM, (b) AA, (c) MA, (d), MMA, and (e) NIPAM (dotted lines represent IR bands
for nitrile (2240 cm-1) and imine (1590 cm-1) functionalities). ............................. 99
47. 2 mol% RAFT copolymers heated in FTIR at 225 °C for hours plotted for (a)
residual nitrile fraction and (b) extent of stabilization (Es). ................................ 100
48. 5 mol% RAFT copolymers heated in FTIR at 225 C for hours plotted for (a)
residual nitrile fraction and (b) extent of stabilization (Es). ................................ 101
49. Real-time FTIR spectra recorded in the presence of dried air at 225 C for PAN
copolymers with 2 mol% (a) AM, (b) AA, (c), NIPAM, and (d) homopolymer.103
xiii
50. 2 mol% RAFT copolymers treated in air and nitrogen at 225 °C for 5 hr plotted
for (a) residual nitrile fraction and (b) extent of stabilization. ............................ 104
51. FTIR salt plates of 2 mol% AA treated at 225 °C in nitrogen (left) and air (right).
............................................................................................................................. 104
52. TGA of RAFT (a) 2 mol % and (b) 5 mol% RAFT Copolymers in nitrogen at 10
°C/min. ................................................................................................................ 106
53. DSC curves for 2 mol% NIPAM RAFT copolymer pre-treated in air at 225 °C for
30 min and for 5 hr.............................................................................................. 107
54. Films of RAFT copolymers pre-treated in oxygen-rich atmosphere at 225 °C for
(a) 30 min and for (b) 5 hrs. Left to right: 2 mol% AA, 2 mol% AM, 2 mol%
NIPAM. ............................................................................................................... 108
55. ID/IG ratios for RAFT Copolymers treated at 225 °C in air for 5 hours. Error bars
represent +/- 1 standard deviation of 5 spots measured via Raman spectroscopy.
............................................................................................................................. 109
56. SEC chromatograms of 5 mol% RAFT and FR copolymers (AA and NIPAM). 111
57. DSC curves of 5 mol% RAFT and FR copolymers at 5 °C/min (AA and NIPAM).
............................................................................................................................. 112
58. TGA plots of 5 mol% RAFT and FR copolymers (AA and NIPAM) (a) ramped at
10 °C/min to 700 °C in N2 and (b) ramped at 10 °C/min in air and held at
isotherms of 230, 245, 253, and 265 °C for 15 min each and then ramped at 10
°C/min to 700 °C in N2. ...................................................................................... 114
59. TGA plots of NIPAM-containing copolymers ramped at 10 °C/min to 700 °C in
N2, Preox1: ramped at 10 °C/min in air and held at isotherms of 230, 245, 253,
and 265 °C for 15 min each and then ramped at 10 °C/min to 700 °C in N2, and
Preox2: ramped at 10 °C/min in air and held at isotherms of 245, 260, 268, and
280 °C for 15 min each and then ramped at 10 °C/min to 700 °C in N2............. 115
60. 1H-NMR of 95/5 P(AN-co-NIPAM). ................................................................. 120
61. Reactivity ratios determined by the (a) Fineman-Ross and (b) Kelen-Tüdos
methods. .............................................................................................................. 122
62. Composition profiles based on model predictions and experimental data for
P(AN-co-NIPAM) copolymers. .......................................................................... 123
63. Number fraction of triad sequences for p(AN-co-NIPAM) copolymer. ............. 124
64. Copolymer sequence of alternating PAN-based copolymers with (a)
compositional drift and (b) uniform distribution of comonomer. ....................... 126
65. Semibatch reaction setup. ................................................................................... 127
xiv
66. DSC exotherms of semibatch copolymers at a 5 °C/min ramp rate. .................. 131
67. Real-time FTIR spectra recorded at 225 °C for 5 hr in nitrogen for (a) SB-1, (b)
SB-2, (c) SB-3, and (d) Batch (dotted lines represent IR bands for nitrile (2240
cm-1) and imine (1590 cm-1) functionalities). ..................................................... 133
68. Residual nitrile fraction for semibatch copolymers treated at 225 °C for 5 hr in
nitrogen. .............................................................................................................. 133
69. Extent of stabilization for semibatch copolymers treated at 225 °C for 5 hr in
nitrogen. .............................................................................................................. 134
70. TGA curves for semibatch copolymers ramped at 10 °C/min in nitrogen to 700
°C. ....................................................................................................................... 135
71. TGA curves for semibatch copolymers treated in air at 230, 245, 253, and 265 °C
for 15 min each before ramping in nitrogen at 10 °C/min to 700 °C. ................ 136
72. Tacticity assignments of baseline PAN for the nitrile carbon via 13C-NMR (δ (ppm): 120.1, rr; 120.5, mr; 120.8, mm). ............................................................ 139
73. Tacticity assignments of baseline PAN for the methine carbon via 13C-NMR (δ (ppm): 27.2, mm; 27.9, mr; 28.4, rr). .................................................................. 139
74. Stereoregulating mechanisms of fluoroalcohols (top) and Lewis acids (bottom) (F
= fluoroalcohol, LA= Lewis acid). ..................................................................... 140
75. (a) Precipitation of scale up reaction and (b) fibrous material from the
precipitation. ....................................................................................................... 146
76. Fiber spool of 98/2 p(AN-co-NIPAM) copolymer. ............................................ 146
77. 1H-NMR of 98/2 p(AN-co-NIPAM) fiber sample. ............................................. 147
78. TEM image of cross-section of 98/2 p(AN-co-NIPAM) fiber treated up to 1450
°C. ....................................................................................................................... 149
79. TEM image of cross-section of 98/2 p(AN-co-NIPAM) fiber treated up to 1550
°C. ....................................................................................................................... 149
80. Optical microscopy of 98/2 p(AN-co-NIPAM) (a) white fiber precursor, (b) post
oxidative stabilization up to 280 °C, (c) heating to 1450 °C, and (d) heating to
1550 °C (yellow arrows indicate micro porous defects). .................................... 150
81. Azimuthal analysis by XRD for (a) 98/2 p(AN-co-NIPAM) precursor white fibers
and (b) BS white fiber. ........................................................................................ 151
82. DSC exotherms of white fiber precursors heated at 5 C/min. ............................ 152

xv
83. TGA plots of white fiber precursors (a) ramped at 10 °C/min to 700 °C in N2 and
(b) ramped at 10 °C/min in air and held at isotherms of 245, 260, 268, and 280 °C
for 15 min each and then ramped at 10 °C/min to 700 °C in N2. ....................... 153
xvi
LIST OF TABLES
Table
1. Conversion, Molecular Weight, and Polydispersity Data for the RAFT
Polymerization of AN Conducted at 70 °C........................................................... 48
2. Conversion, Molecular Weight, and Polydispersity Data for the RAFT
Polymerization of AN Conducted at 30 °C........................................................... 53
3. Conversion, Molecular Weight, and Polydispersity Data for the RAFT
Polymerization of AN Conducted at 30 °C and Higher [M]0:[CTA]0 Ratios ....... 55
4. Summary of RAFT and FR PAN Samples ........................................................... 64
5. Intrinsic Viscosity, [η], and Viscosity Average Molecular Weight, Mη, of RAFT
and FR PAN Homopolymers Determined by Ubbelohde Viscometer Method at 25
°C in DMF ............................................................................................................ 65
6. DSC Peak Maxima for RAFT and FR PAN Homopolymer Samples .................. 68
7. Activation Energies of RAFT and FR PAN Homopolymers................................ 70
8. Cyclization Index (CI) of RAFT and FR Homopolymers as a Function of Time at
225 °C in air .......................................................................................................... 76
9. Relative Intensities of D-band to G-band and Crystalline Domain Size (La (nm) =
4.4/(ID/IG)) Determined at Various heat Treatment Conditions............................ 79
10. WAXS Data Summarized for RAFT and FR PAN Homopolymer Samples........ 81
11. Activation Energies of Novel PAN-based (95/5) Copolymers by FR
Polymerization ...................................................................................................... 87
12. Summary of RAFT Copolymers ........................................................................... 88
13. Crystallite Thickness and Crystallinity of RAFT Copolymers ............................. 93
14. Activation Energies and Exotherm Behavior of RAFT Copolymers ................... 97
15. Final Residual Nitrile Fraction and Extent of Stabilization for RAFT Copolymers
Treated at 225 °C for 5 hours in Nitrogen .......................................................... 102
16. Cyclization Index of RAFT Copolymers Pre-Treated in O2-rich Atmosphere at
225 °C ................................................................................................................. 107
17. Summary of ID/IG Ratios and La Values of RAFT Copolymers ......................... 110
18. Molecular Weight and PDI of 5 mol% RAFT and FR Copolymers (AA and
NIPAM) .............................................................................................................. 111

xvii
19. Activation Energy and DSC Exotherm Behavior of 5 mol% RAFT and FR
Copolymers (AA and NIPAM) ........................................................................... 113
20. Comonomer Mole Fractions in the Feed and the Final Copolymer for AN and
NIPAM ................................................................................................................ 121
21. Reactivity Ratios for AN and NIPAM ................................................................ 122
22. Triad Sequences for 98/2 and 95/5 p(AN-co-NIPAM) Copolymers .................. 125
23. Number-Average Sequence Lengths for 98/2 and 95/5 p(AN-co-NIPAM)
Copolymers ......................................................................................................... 125
24. Semibatch Reaction Parameters. ......................................................................... 128
25. Molecular Weight and Polydispersity of Semibatch Copolymers ...................... 129
26. Peak Exotherm Behavior at 5 °C/min for Semibatch Copolymer. ..................... 131
27. Triad Tacticities of PAN polymers with Stereoregularity Additives .................. 141
28. Molecular Weights and Polydispersities of White Fiber Precursors .................. 148
29. Exotherm Behavior of White Fiber Precursors Heated at 5 °C/min ................... 152
xviii
LIST OF SCHEMES
Scheme
1. General reaction scheme for PAN conversion to graphitic carbon structures. ....... 7
2. (a) Radical cyclization of PAN and (b) and ionic cyclization of p(AN-co-AA). ... 8
3. Schematic of RAFT mechanism. I. Initiation by thermolysis or photoinitiation to
form radicals. II. Addition of the radical initiator to the chain transfer agent
(CTA) to form dynamic equilibrium with intermediate radical. III. Chain transfer
equilibrium with polymer chains. ......................................................................... 15
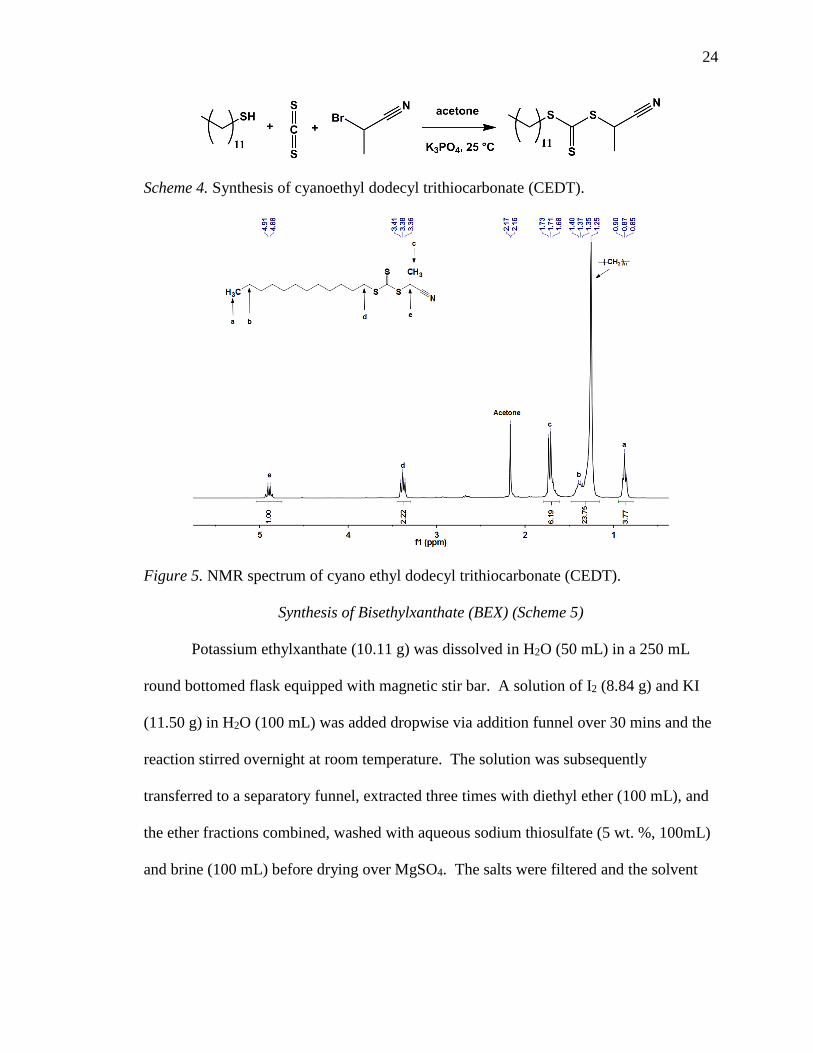
4. Synthesis of cyanoethyl dodecyl trithiocarbonate (CEDT). ................................. 24
5. Synthesis of bisethylxanthate (BEX). ................................................................... 25
6. Synthesis of 4-cyano-4-((thioethoxy)sulfanyl) pentanoic acid (CTSPA). ............ 26
7. General RAFT polymerization of acrylonitrile. .................................................... 40
8. Cyclization of p(AN-co-NIPAM). ........................................................................ 86
9. Synthesis of maleimides demonstrating the nucleophilicity of amine relative to
acid. ....................................................................................................................... 96
1
CHAPTER I
INTRODUCTION
Carbon Fiber Composites
Global research initiatives continue to push the limits of materials performance as
society strives for more fuel efficient automobiles, lighter aircrafts, higher performing
sports equipment, improved construction materials, alternative sources of energy and new
materials for general infrastructure. Fiber reinforced polymer matrix composites have
rapidly proliferated over the past several decades due to favorable strength to weight
ratios as compared to traditional materials such as wood, metals, and ceramics. Carbon
fiber reinforced polymers (CFRPs) represent the highest performance polymer-matrix
composites due to the high strength, high modulus, low density and economics of carbon
fibers. Additionally, CFRPs retain high tensile moduli and high strengths at elevated
temperatures and extreme environments, offer excellent electrical and thermal
conductivity, and display a relatively low coefficient of thermal expansion.1–3
To date, state-of-the-art carbon fibers have an ultimate tensile strength of around
7 GPa (1000 ksi), which greatly underestimates their theoretical potential.4,5 Advancing
carbon fiber properties has proven to be a difficult task because carbon fiber production is
quite complex including the design and synthesis of precursor polymers, the conversion
of these polymers into white fibers, and the ultimate conversion of white fiber into carbon
fiber. It is well accepted that ultimate carbon fiber performance relies on the appropriate
design of the precursor chemistry and structure.1,5
In the last five years research efforts have stimulated carbon fiber development
including those by the Department of Energy’s Institute for Advanced Composites

2
Manufacturing Initiative (IACMI) through the University of Tennessee and Oak Ridge
National Laboratories,6 the Deakin University/CSIRO Carbon Nexus, and TU Munich led
MAI Carbon. The overall goal is to better understand fundamental aspects which link
carbon fiber precursor morphology and chemical composition with ultimate carbon fiber
morphology and properties.
Polyacrylonitrile (PAN)-Based Carbon Fiber Precursors
Carbon Fiber Precursors
Thomas Edison was the first person to be credited for developing a carbon fiber
filament in 1878 by pyrolyzing cotton and bamboo fibers into carbon fibers for use in
incandescent lamps.5 During the mid- to late 20th century, carbon fiber production
received renewed interest for use as a high strength polymer reinforcement. Initially, the
military developed high-temperature resistant carbon fibers pyrolyzed from regenerated
cellulosic fibers (rayon) for use in missile applications.5 Polyacrylonitrile (PAN)-based
carbon fiber precursors were introduced in the 1960s and displayed fibers with a higher
carbon content leading to substantial improvements in strength and modulus.
Nowadays, carbon fiber precursors are derived from three sources: synthetic PAN
copolymers, coal or petroleum based mesophase-pitch, and regenerated cellulosic fibers.
Polyacrylonitrile (PAN)-containing copolymers are the leading precursor materials for
carbon fiber production, comprising approximately 90% of all production world-wide.7
PAN-based precursors yield the highest tensile strength due to a higher two dimensional
molecular orientation of graphitic sheets as compared to pitch- and cellulose-based
fibers.1,3,5,8 During the decade of 2000 to 2010, global carbon fiber consumption more
than doubled from 16,600 to over 35,000 tons per year.9 PAN-based carbon fibers are

3
generally recognized as “the most important and promising precursors for manufacture of
high strength carbon fibers.”5
Structure and Properties of PAN
Carbon fibers by definition contain a minimum of 92 wt. % carbon, while those
containing >99% carbon are termed graphite fibers.1,3 The covalently bonded carbon
atoms within these fibers are arranged in sp2 hybridized hexagonal patterns set in planes
of graphene sheets which stack via van der Waals and non-bonded interactions. Fibers
made from PAN precursors form turbostratic layered structures where the planes are
slightly off parallel and irregularly stacked. The irregular stacking results in larger
interlayer spacings than those of graphite.8 Johnson and coworkers published a
morphological model for the microstructure of PAN-based carbon fibers in 1987 based
on X-ray diffraction (XRD) and transmission electron microscopy (TEM) analysis
(Figure 1).10,11 This model suggests a ribbon-like outer sheath of graphene sheets
scattered with needle-shaped voids (1-2 nm) surrounding a core of highly disordered and
folded layer planes. Huang and Young confirmed a sheath-core structure using Raman
spectroscopy in 1995.12 Furthermore, Diefendorf and Tokarsky found that the modulus of
PAN-based fibers varies throughout its cross-section, which reinforces the concept of a
core-sheath morphology. Although the core-sheath morphology is generally accepted,
there are very few studies which correlate the PAN precursor composition to
morphological development.13,14
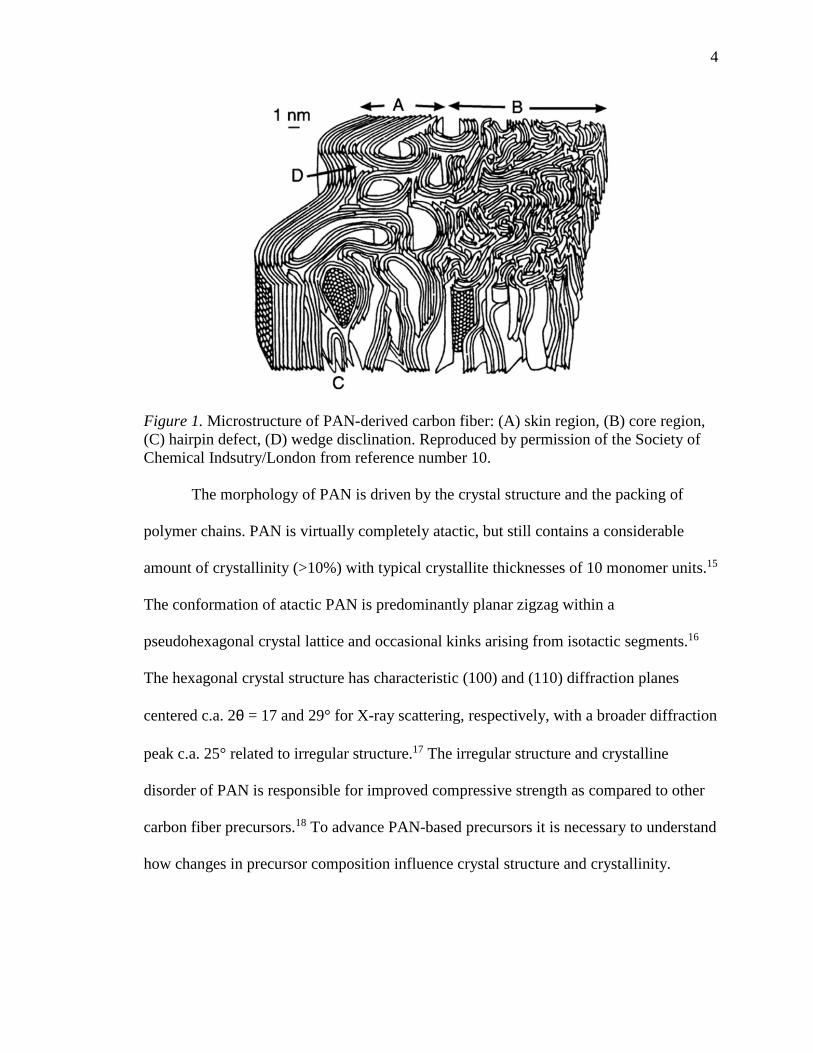
4
Figure 1. Microstructure of PAN-derived carbon fiber: (A) skin region, (B) core region,
(C) hairpin defect, (D) wedge disclination. Reproduced by permission of the Society of
Chemical Indsutry/London from reference number 10.
The morphology of PAN is driven by the crystal structure and the packing of
polymer chains. PAN is virtually completely atactic, but still contains a considerable
amount of crystallinity (>10%) with typical crystallite thicknesses of 10 monomer units.15
The conformation of atactic PAN is predominantly planar zigzag within a
pseudohexagonal crystal lattice and occasional kinks arising from isotactic segments.16
The hexagonal crystal structure has characteristic (100) and (110) diffraction planes
centered c.a. 2θ = 17 and 29° for X-ray scattering, respectively, with a broader diffraction
peak c.a. 25° related to irregular structure.17 The irregular structure and crystalline
disorder of PAN is responsible for improved compressive strength as compared to other
carbon fiber precursors.18 To advance PAN-based precursors it is necessary to understand
how changes in precursor composition influence crystal structure and crystallinity.
5
PAN-Based Copolymers
PAN homopolymer is seldom used for carbon fiber manufacturing due to its low
solubility and poor processability from strong interactions and close packing of polymer
chains.13,19 Typically, 3-10 wt. % of various comonomers are copolymerized with
acrylonitrile to improve solubility, spinnability, drawability, hydrophilicity, and assist in
the stabilization of the fibers during pyrolysis.3,8,20,21 Comonomers reduce interaction
forces between polymer chains, resulting in larger crystallite thicknesses (Lc) for
copolymers than PAN homopolymer.22
Generally, PAN-based precursors are designed with more than one comonomer.23
For example, the commercially available Bluestar® fiber contains 6% methyl
methacrylate and 1% itaconic acid.24 Acidic comonomers, such as acrylic acid (AA) and
itaconic acid (IA), facilitate cyclization and increase hydrophilicity of PAN,25,26 while
neutral comonomers like methyl acrylate (MA) and methyl methacrylate (MMA)
improve solubility and processability.19,27 However, comonomers also influence
polymerization kinetics, where unequal reactivities of each comonomer results in a
heterogeneous distribution of comonomers, or non-uniform sequencing, along the
chain.23 Typically, neutral comonomers possess higher reactivity than acidic comonomers
for terpolymers with acrylonitrile.28,29 If the amount of acidic comonomer in the feed
increases during polymerization, the molecular weight decreases and results in poor
carbon fiber performance. To overcome these challenges, a copolymer would be better
suited for PAN-based precursors than conventional terpolymers. Recently, novel
comonomers have been synthesized as itaconic acid derivatives to serve both the purpose
of acidic comonomer and neutral comonomer.26,29,30 Therefore, a great interest is

6
emerging in comonomer design and future copolymers that could replace the traditional
terpolymer precursors.
Processing of PAN-based Precursors
PAN-based precursors undergo a series of processing stages in the conversion of
PAN to carbon fiber including: spinning, drawing, thermo-oxidative stabilization, and
carbonization. Spinning and drawing are critical for establishing morphology of the fibers
through mass transfer of solvent to form the fiber skin as well as the molecular
orientation.8 Spinning and drawing heavily depend on the PAN precursor composition,
since composition dictates macromolecular regularity, crystal orientation, and
dimensional stability.31 Thermo-oxidative stabilization is also highly dependent on the
precursor structure and properties as will be discussed in the following section.
Carbonization occurs between 800 –1600 °C under nitrogen.7,8 During carbonization
hydrogen and heteroatoms are volatized into hydrogen gas, nitrogen gas, water, and
carbon compounds: methane, hydrogen cyanide, carbon monoxide, carbon dioxide, etc.
as large graphitic sheets are formed.8 Byproducts equate to over 40 wt.% of the starting
mass.7,8
Thermo-oxidative Stabilization of PAN-based Precursors
Thermo-oxidative stabilization or more simply, stabilization, is an essential and
time-consuming step, which forms the cyclic polyimine, or “ladder polymer”, and sets
the foundation for graphitic structures.7,32,33 Stabilization typically occurs between
200−300 °C in the presence of air.7,8 The time and temperature of stabilization can
greatly affect the mechanical properties of the resulting carbon fibers.34 It is suggested
that a greater degree of stabilization allows the polymers to withstand higher temperature
7
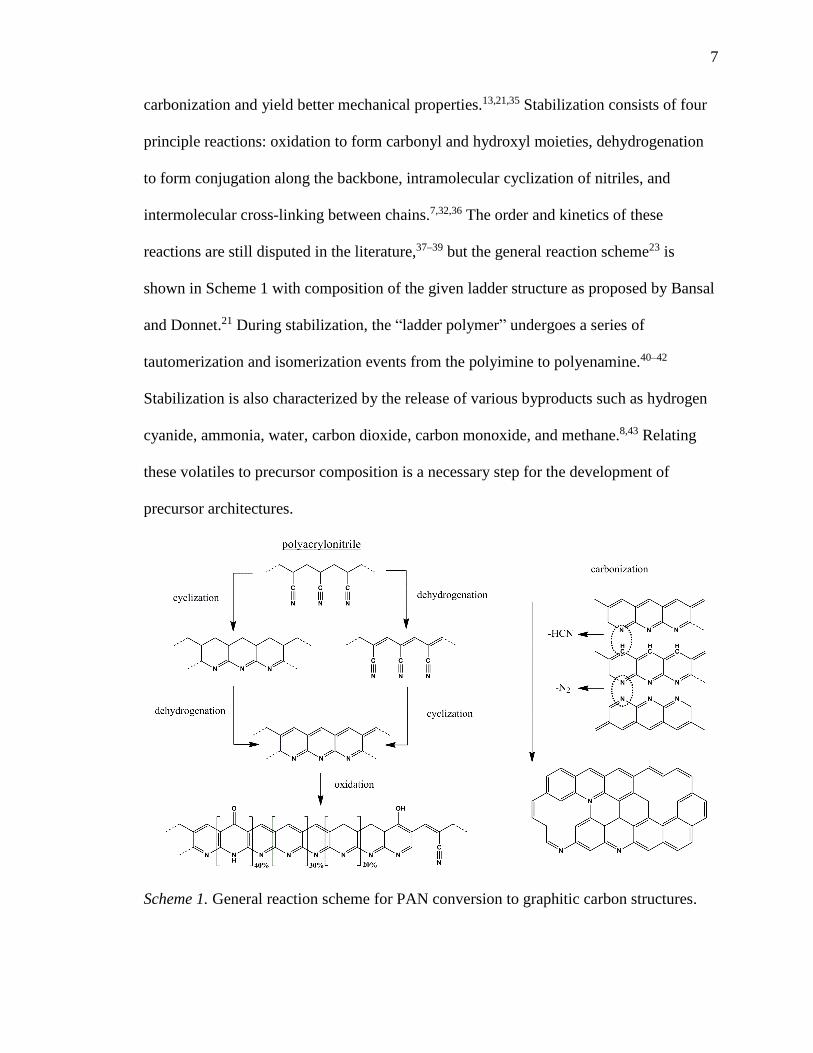
carbonization and yield better mechanical properties.13,21,35 Stabilization consists of four
principle reactions: oxidation to form carbonyl and hydroxyl moieties, dehydrogenation
to form conjugation along the backbone, intramolecular cyclization of nitriles, and
intermolecular cross-linking between chains.7,32,36 The order and kinetics of these
reactions are still disputed in the literature,37–39 but the general reaction scheme23 is
shown in Scheme 1 with composition of the given ladder structure as proposed by Bansal
and Donnet.21 During stabilization, the “ladder polymer” undergoes a series of
tautomerization and isomerization events from the polyimine to polyenamine.40–42
Stabilization is also characterized by the release of various byproducts such as hydrogen
cyanide, ammonia, water, carbon dioxide, carbon monoxide, and methane.8,43 Relating
these volatiles to precursor composition is a necessary step for the development of
precursor architectures.
Scheme 1. General reaction scheme for PAN conversion to graphitic carbon structures.
8
Oxidation typically complicates stabilization by incorporating many compounds
into the precursor structure such as ketones, nitrones, epoxides, and lactones.32 Oxygen
can either promote cyclization acting as a site for initiation,23,44 or it can retard
cyclization by scavenging radical intermediates.45,46 Thermal oxidation can also lead to
relaxation of internal stresses with a decrease in strain of bonds and angles, but it is
unclear whether the relaxation promotes or hinders cyclization.47
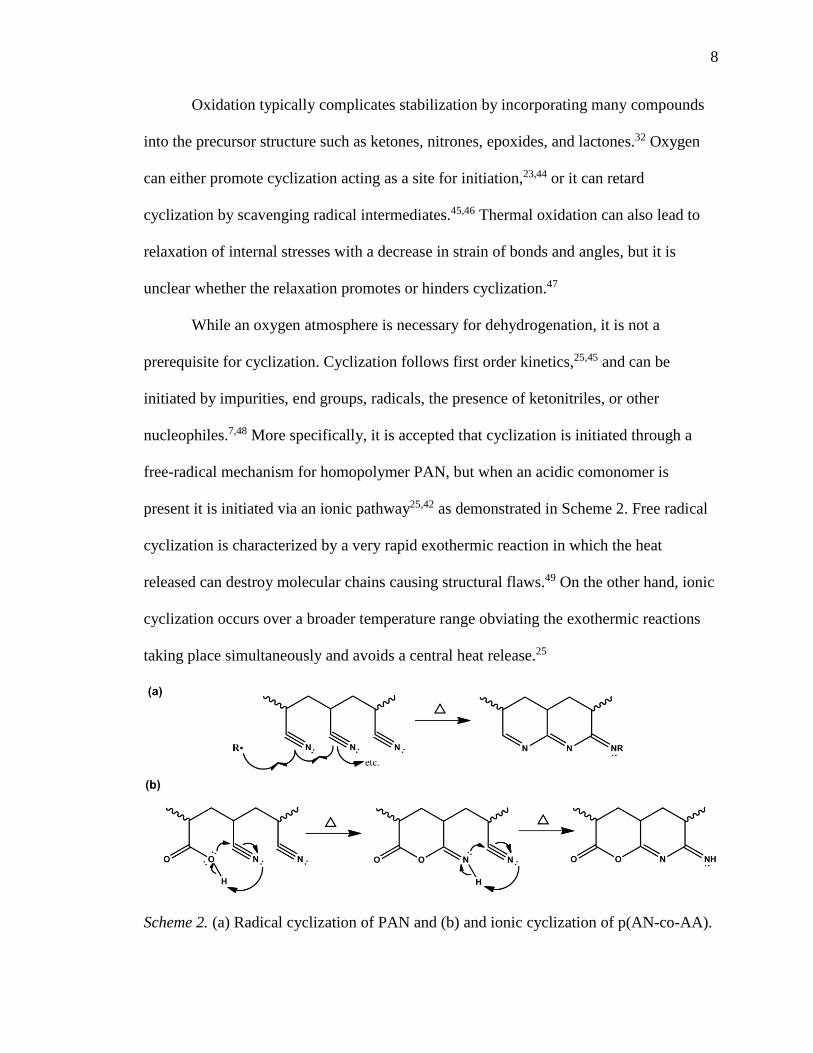
While an oxygen atmosphere is necessary for dehydrogenation, it is not a
prerequisite for cyclization. Cyclization follows first order kinetics,25,45 and can be
initiated by impurities, end groups, radicals, the presence of ketonitriles, or other
nucleophiles.7,48 More specifically, it is accepted that cyclization is initiated through a
free-radical mechanism for homopolymer PAN, but when an acidic comonomer is
present it is initiated via an ionic pathway25,42 as demonstrated in Scheme 2. Free radical
cyclization is characterized by a very rapid exothermic reaction in which the heat
released can destroy molecular chains causing structural flaws.49 On the other hand, ionic
cyclization occurs over a broader temperature range obviating the exothermic reactions
taking place simultaneously and avoids a central heat release.25
Scheme 2. (a) Radical cyclization of PAN and (b) and ionic cyclization of p(AN-co-AA).

9
Cyclization is arguably the most important reaction in the stabilization phase of
processing. Improving PAN-based carbon fibers hinges on the reduction of defects and
disclinations present during this step, which generally spread through carbonization. A
greater extent of cyclization would result in a higher carbon yield and fewer volatile
byproducts. Thus, a better understanding of how composition correlates to the extent of
cyclization will enable the future design of PAN-based precursors.
Polymer Precursor Properties and Their Effects on Carbon Fiber Processing
Effect of Molecular Weight and Polydispersity
Polymers are often identified by their molecular weight and molecular weight
distribution. Typical carbon fiber precursors range between 70,000−200,000 g/mol with
polydispersities (PDIs) (Mw/Mn) between 2−3.1 High molecular weight fractions can
cause issues during fiber spinning and filtration such as gelation and insolubility.23,50 In
the carbon fiber manufacturing process, molecular weight and its distribution govern final
carbon fiber properties.42,51–53 Increasing molecular weight leads to increased crystallite
size and smaller void sizes as well as changes in the fiber morphology such as circular to
bean-shaped cross sections and grooved surfaces along the skin.51,53 Moreover, increasing
molecular weight has been shown to influence which small volatiles are released during
thermo-oxidative stabilization of PAN-based precursors with higher molecular weights
releasing more hydrogen cyanide and lower molecular weights giving off more
ammonia.41
Although cyclization is recognized as one of the most important prerequisites for
high performing carbon fiber, little is known about the effect of molecular weight and its
distribution on the cyclization of PAN. Tsai et al. claim that cyclization onset temperature
10
increases with higher molecular weight, but samples in their study had high
polydispersity (>1.8).51 Chernikova et al. asserted the same finding for a series of low
molecular weight samples (< 3,000 g/mol), yet cyclization exotherms yielded several
unresolved and overlapping peaks.52 Other reports in the literature make similar claims,53
but lack hard evidence due to unreported polydispersities or conflicts within the data.
Thus, the literature would benefit from a comprehensive study on the effects of
cyclization wherein molecular weight and polydispersity are precisely controlled.
Effect of Polymerization Mechanism
Equally important to molecular weight is the polymerization mechanism. Since
the first report of PAN-based carbon fibers by Shindo in 1961,54 PAN precursors have
been polymerized primarily by solution and suspension polymerization, with solution
polymerization being most favorable due to immediate manufacture of spinning
dopes.23,55 The two main drawbacks to solution polymerized precursors are that monomer
conversion is typically only 50−70%, and that conventional solvent systems are
characterized by high transfer constants leading to undesirable side reactions during
polymerization.23 Bol’bit and coworkers demonstrated that emulsion polymerization at
low temperature (22 °C) led to a smaller proportion of long chain branches than solution
polymerization at higher temperature (50 – 60 °C), even though the solution-formed
polymer had a lower polydispersity.56 Long chain branches present in conventional free
radical solution polymers hinder reptational motion of the macromolecule. Therefore, the
polymerization mechanism can significantly influence precursor properties.
11
Effect of Crystallinity
Oxidation and cyclization are thought to initiate in the amorphous region, where
diffusion of small molecules are easier along with greater structural relaxation.7,31,32,57
Copolymer composition dictates crystallinity, wherein a greater content of comonomers
lead to a greater amorphous content. Comonomers facilitate oxygen uptake and provide
molecular passages due to their bulky size.25 However, an excessive amount of
comonomer can lead to structural defects in the polymer for cyclization,44 while
excessively high crystallinity can also lead to high stress during fiber stretching.58
Additionally, solvent effects are important to consider as residual solvents from
polymerization, such as N,N-dimethylformamide, can plasticize PAN and reduce the
crystallinity.59
Effect of Tacticity
Highly isotactic PAN (wherein the nitrile groups are in a meso configuration)
could be advantageous, from a positional point of view, for cyclization of adjacent nitrile
groups compared to other stereo structures.36,40,41,60,61 It was suggested that atactic PAN
forms primarily isolated pyridine units in early stages of stabilization as opposed to long
ladder sequences, whereas the formation of ladder structure could be expedited by
isotactic PAN.62 Stabilization of atactic PAN is presumed to lead to defects such as
olefinic and aliphatic units due to partial cyclization.59 Moreover, the hexagonal plane
layer that should form during carbonization of isotactic PAN should be larger than in
conventional atactic PAN, resulting in higher mechanical strength.60
Few studies evaluated the effect of tacticity on the cyclization mechanism of
PAN. Zhang et al. found that cyclization of isotactic PAN has a higher activation energy

12
than atactic PAN.17 Similarly, Burkanudeen et al. showed that cyclization of isotactic
PAN has a higher onset temperature and more gradual mass loss as compared to atactic
PAN.63 Yet, there are no known reports on how the tacticity plays a role in the final
properties of carbon fiber, nor is there evidence that supports greater extent of
stabilization for isotactic PAN.
Issues Regarding Past Research Methods
To date, most research on the cyclization of PAN-based precursors disregards
information about the polymerization mechanism or the chemical and physical properties
of the PAN precursor. Without answers to basic polymer properties and polymerization
history, the results of the experiments are left open-ended. Gribanov and Sazanov discuss
in detail the issues concerning the steric organization and long cyclic sequences of
pyridine.47 As a rule, only macrochains consisting of three to ten conjugated nitrogen-
containing rings can be obtained, and more typically only five to seven in real PAN
samples.47 In the past, researchers attributed the short sequences to the lack of tacticity,
but the authors explain that even in the case of 100% isotactic PAN (which is impossible)
the amount of ring strain in the nitrogen-containing cyclic sequences and non-uniform
electron density would limit their stability. The bond lengths of pyridine rings are non-
equivalent as compared to benzene. To demonstrate ring strain, a sequence of 8 nitrogen-
containing rings with the minimized energy (via Chem3D Pro Software) is shown in
Figure 2. As can be seen, the ladder structure concaves towards the side with nitrogen
atoms creating tension in the cyclic structure.

13
Figure 2. Ring strain for 8-membered cyclic sequence of nitrogen-containing rings. Gray
atoms are carbon, blue atoms are nitrogen, white atoms are hydrogen, and the pink
spheres represent lone electron pairs.
Moreover, the current literature base typically employs only a single thermal
analysis method when investigating extent of stabilization or stabilization kinetics.64
Recently, new methods for evaluating stabilization of PAN-based precursors have been
developed58,65,66 and combining these techniques would elucidate the effects of polymer
composition on stabilization behavior of PAN-based precursors.67 Thus, a controlled
study wherein the polymer properties are precisely identified in conjunction with
comprehensive thermal analytical techniques would elucidate behaviors of PAN
precursor stabilization.
Controlled/Living Radical Polymerization (CLRP) of PAN
With the advent of contemporary controlled/living radical polymerization (CLRP)
methods, several attempts have been reported to control the polymerization of AN and its
comonomers utilizing atom transfer radical polymerization (ATRP),68–71 activators
regenerated by the electron transfer (ARGET) ATRP,72 and reversible addition-
fragmentation chain transfer (RAFT) polymerization.50,52,73–78 Despite these efforts, there
has been limited success in obtaining high molecular weight PAN with low
polydispersities (PDIs). Controlling molecular weight and PDI of PAN is essential before

14
considering other precursor properties, such as comonomer selection and tacticity, to
avoid confounding variables.
Dong et al.72 utilized ARGET ATRP at long reaction times (>90 hours) to prepare
PAN with molecular weights above 200,000 g/mol (SEC-MALLS) with relatively high
PDIs of 1.45. Yet, at shorter reaction times (<90 hours) conversions remained below 60%
and molecular weights below 100,000 g/mol. Also, ATRP necessitates the use of a metal
catalyst, which can be difficult to remove and the residual metal ions are detrimental to
carbon fiber fabrication.78 Pan et al.79 recently reported on the photoinduced metal-free
ATRP of acrylonitrile, but the resulting polymers were of low molecular weight (<15,000
g/mol) and broad PDI (>1.5).
Alternatively, RAFT polymerization is a versatile CLRP technique with excellent
functional group tolerance80 and shows promise for the production of carbon fiber
precursor materials with controlled molecular weights and polydispersities. The general
mechanism for RAFT polymerization is shown in Scheme 3. RAFT polymerization of
PAN was first reported by Matyjaszewski et al. in 2003.73 In 2012, Niu et al.78 utilized a
bifunctional dithiocarbamate to achieve relatively high molecular weight (>100,000
g/mol) and low PDI (< 1.4) PAN using RAFT. More recently, Spörl et al.50,81
demonstrated high conversion (> 80%) of AN in less than 7 hr with the use of 2-cyano-2-
propyl dodecyltrithiocarbonate (CPDT) at 90 °C. However, references [50, 78, and 81]
report molecular weights relative to polymethylmethacrylate (PMMA) standards, which
overestimate the molecular weight of PAN.72 Additionally, these studies show non-linear
kinetics for reaction times beyond 8 hours. Moreover, it is not uncommon to observe

15
reduced conversions and molecular weights when acrylonitrile is copolymerized,50,76,77
and, therefore polymerization methods must be modified to overcome these challenges.
Scheme 3. Schematic of RAFT mechanism. I. Initiation by thermolysis or photoinitiation
to form radicals. II. Addition of the radical initiator to the chain transfer agent (CTA) to
form dynamic equilibrium with intermediate radical. III. Chain transfer equilibrium with
polymer chains.
Low Temperature Polymerization
It was first shown in 1995 by Kim et al.82 that the low decomposition temperature
initiator, 2,2’-azobis(2,4-dimethylvaleronitrile) (V-70), could be used to polymerize
acrylonitrile under conventional free-radical solution conditions at 30 °C. Higher
molecular weights were indicated by increased inherent viscosities as compared to those
initiated by 2,2’-azobis(isobutyronitrile) (AIBN) at 50 °C. Similarly, high conversions
and low polydispersities have been achieved during the room temperature RAFT
polymerizations of acrylamide, N,N-dimethylacrylamide, and N-isopropylacrylamide
using V-70 as the initiator.83,84 Additionally, Dong et al. demonstrated that lowering the
temperature of the ATRP of AN from 65 °C to 40 °C resulted in lower polydispersities.72
16
Thus, low temperature polymerizations could increase molecular weights and improve
control in the RAFT polymerization of acrylonitrile and its copolymers.
Copolymer Sequencing
Evident from previous discussion, copolymer sequencing may hold significant
value as the distribution of comonomer can affect crystallinity, thermal properties, and
final carbon fiber properties. As mentioned, the maximum sequence length of
heterocyclic, fused pyridine rings is about 5−7 rings. Also, ionic initiation of cyclization
is the preferred mechanism due to the slower liberation of heat release. In theory,
controlling the placement of comonomer to mediate cyclization by the ionic mechanism
while optimizing crystallinity and structural characteristics would improve the efficacy of
stabilization and increase the mechanical properties of carbon fibers. This concept was
first investigated by Tsai et al. in 1991,85 wherein methyl acrylate (MA), itaconic acid
(IA), and 2-ethyl hexyl acrylate (EHA) were introduced at controlled feed rates and
copolymerized with acrylonitrile. They found that slowing the feed rate of comonomer
resulted in decreased crystallite size and crystallinity while neutral comonomers (MA and
EHA) increased cyclization onset temperature and the acidic comonomer (IA) lowered
cyclization temperature.
Hou et al.86 used reactivity ratios for comonomers (IA, acrylic acid, and n-vinyl
pyrrolidone) and acrylonitrile to simulate number average sequence lengths of the
monomers. They found that the number average sequence length of acrylonitrile is
sensitive to the composition of the feed and small changes significantly impact the
precursor properties. For example, increasing IA content from 2 to 8 mol% results in a 4-
fold decrease in the average sequence length of acrylonitrile (62.8 to 16.8). Thus,

17
comonomer content cannot be neglected when considering sequence distribution of the
copolymer.
It is known that in batch copolymerization, varying reactivity ratios lead to
compositional drift and yield copolymers with a compositional gradient along the
backbone. CLRP techniques slow down the polymerization rate and thereby provide time
to design and control the chain structure by a semibatch approach. Recently, Luo and
Wang introduced the theory of a semibatch reaction design in conjunction with CLRP
techniques.87 In their study, they performed simulations of model semibatch reactions in
which an optimum feeding profile could result in a uniform distribution of comonomers
along the backbone. Successful demonstration of this theoretical method was then applied
to RAFT copolymers of styrene and butyl acrylate,88 as well as more exotic comonomer
distributions such as linear gradient, hyperbolic tangent gradient, and triblock gradient
profiles.89 These results validate the possibility of precisely controlled copolymer
architectures for PAN-based copolymers utilizing semibatch reactions in conjunction
with RAFT polymerization.
Tacticity Control of PAN
As mentioned, tacticity could play a significant role in the cyclization of PAN-
based precursors. There have been many attempts to synthesize isotactic PAN including:
anionic polymerization, γ-ray irradiation, and utilization of zeolites.90–92 The most
promising method for controlling tacticity on a large scale is the use of Lewis acids,
which have been employed in the synthesis of other vinyl polymers.93–100 Lewis acids are
proposed to mediate polymerization by a bidentate chelation with the pendant group in

18
the monomer and the growing chain end, and they are compatible with controlled radical
polymerization techniques.93–95
It is proposed that strong Lewis acids with a high coordination number and a
relatively large atomic radius induce isospecific chain growth.61,95 Metal triflates
[Mt(OTf)3; Mt=Y, Sc, Yb, etc.; OTf = OSO2CF3] can exhibit the necessary interactions
and strongly interact with pendant groups of the polymer terminus or the monomer.94
Aluminum chloride was shown to improve the isotacticity of PAN by about 7% when
synthesized by ATRP.71 In the same experiment, no polymer was obtained when Y(OTf)3
was used due to the Lewis acid interacting with the ligand. However, when Y(OTf)3 was
added to solution polymerization of N-isopropylacrylamide (NIPAM) at low temperature,
the isotacticity increased as much as 35%.61 MgCl2 in monomeric concentrations has
mediated isotactic chain growth by acting as a geometric host for the bulk polymerization
acrylonitrile.94
Alternatively, it is worth pursuing syndiotactic PAN for the fundamental purposes
of demonstrating tacticity effects on the cyclization mechanism. Isobutyraldehyde has
been reported as an effective stereoregulator of syndiotactic vinyl chloride,101 and has
been suggested as a possible stereoregulator for acrylonitrile.102 Also, fluoroalcohols have
been shown to mediate syndiotactic-specific chain growth for vinyl esters.103
Fluoroalcohols are proposed to create steric repulsion around the terminal chain end and
the pendant group of the incoming monomer, facilitating racemic addition.103
Moreover, RAFT polymerization is a robust controlled/living radical
polymerization method and exhibits tolerance to functionalities including alcohols,
amines, and acids.94 Currently, there is only one known report which employs RAFT
19
polymerization of acrylonitrile in the pursuit of tacticity changes, but only an 8% increase
in isotacticity was achieved.78
Research Overview
The purpose of this dissertation is to build a platform for which the deliberate
control of PAN-based precursors can be used for model studies relating precursor
composition directly to carbon fiber stabilization behavior and kinetics. The central
hypothesis being that higher control of PAN copolymer architecture such as comonomer
structure, comonomer sequencing, and tacticity, will lead to increased cyclization
efficiency and reduction in ladder structure disclinations. The motivation for this research
stems from the renewed academic interest in creating higher performing CFRPs. With the
advent of contemporary polymerization methods it is now possible to build and design
new PAN-based precursor architectures. Thus, linking precursor composition to
stabilization behaviors will lead to future generations of carbon fiber.
Currently, the literature focus is either on novel synthetic techniques or the
characterization of PAN-based copolymers, but seldom is research conducted on both.
Combining the controlled synthesis of PAN-based precursors with a widespread
characterization of their structure and thermal stabilization behavior will elucidate the
poorly understood effects of molecular weight, polydispersity, tacticity, and copolymer
composition on the cyclization and stabilization of PAN-based precursors.
Herein, a straightforward method for producing high molecular weight and low
polydispersity PAN via RAFT-mediated polymerization is demonstrated (Chapter III).
The stabilization behavior and structure of RAFT-mediated polymerization is compared
to conventional free radical polymerization of PAN (Chapter IV). The utilization of the

20
RAFT-mediated polymerization method is successfully extended to PAN-based
copolymers in Chapter V. Copolymers of acrylonitrile with N-isopropylacrylamide
(NIPAM), a new comonomer for the purpose of PAN-based carbon fiber precursors, were
evaluated as compared to traditional PAN-based copolymers. Chapter VI presents a
semibatch reaction procedure for the investigation of sequencing effects of NIPAM-
containing PAN copolymers. Steps toward mediating tacticity of PAN homopolymer are
introduced in Chapter VII. Finally, Chapter VIII explores the scale-up and spinning of a
PAN-co-NIPAM white fiber precursor and its morphology in relation to commercial
precursors.

21
CHAPTER II
MATERIALS, METHODS, AND PROCEDURES
Materials
Acrylonitrile (AN, 99%, 35-45 ppm monomethyl ether hydroquinone inhibitor
(MEHQ), Sigma-Aldrich Chemical Co.) was passed through a neutral aluminum oxide
(50-200 μm) column to remove the inhibitor immediately prior to use. Ethylene carbonate
(EC, 99%, Alfa Aesar), dimethylformamide (DMF, 99%, Fisher Chemical Co.),
dimethylsulfoxide (DMSO, 99%, Fisher Chemical Co.), and dimethylformamide were
used as received. Tetrahydrofuran (THF, 99%, 250 ppm BHT inhibitor, Sigma Aldrich
Chemical Co.) was vacuum distilled prior to use.
Selected Comonomers
Acrylic acid (AA, 99%, 180-200 ppm MEHQ inhibitor) was vacuum distilled to
remove inhibitor. Methyl acrylate (MA, 99% 100 ppm MEHQ inhibitor), N,N-
dimethylacrylamide (DMAM, 99%, 500 ppm MEHQ inhibitor), and methyl methacrylate
(MMA, 99%, 30 ppm MEHQ as inhibitor) were passed through a neutral aluminum oxide
(50-200 μm) column to remove the inhibitor immediately prior to use. N-
isopropylacrylamide (NIPAM, 99%), fumaronitrile (FAN, 98%), maleic anhydride
(MAD, 95%), isobornyl acrylate (IBA, 98.5%), acrylamide (AM, 98.5%, Acros Organics
Chemical Co.), and itaconic acid (IA, >99%) were used as received. All comonomers
were purchased from Sigma Aldrich Chemical Co. unless otherwise denoted and are
shown in Figure 3.

22
Figure 3. Structures of comonomers.
RAFT agents
2-cyano-2-propyl dodecyl trithiocarbonate (CPDT, 97%, Sigma Aldrich Chemical
Co.) and cyanomethyl dodecyl trithiocarbonate (CMDT, 98%, Sigma Aldrich Chemical
Co.) were used as received. Cyanoethyl dodecyl trithiocarbonate (CEDT) and 4-cyano-4-
((thioethoxy)sulfanyl)pentanoic acid (CTSPA) were synthesized according to literature
procedures as described below.104,105 Potassium ethyl xanthate (96%, Sigma-Aldirch
Chemical Co.), iodine (99.8%, Sigma-Aldrich Chemical Co.), potassium iodide (99+%,
Sigma-Aldrich Chemical Co.), anhydrous diethyl ether (Acros Organic), sodium
thiosulfate pentahydrate (99.5%, Fisher Scientific), anhydrous magnesium sulfate (Fisher
Scientific), 1-dodecanethiol (98%, Sigma Aldrich Chemical Co.), carbon disulfide
(99.9%, Sigma Aldrich Chemical Co.), potassium phosphate tribasic (98%, Sigma
Aldrich Chemical Co.), 2-bromopropionitrile (97%, Sigma Aldrich Chemical Co.), ethyl
acetate (99+% extra pure, Acros Organics), absolute ethanol (99.5+%, Acros Organics),

23
hexane (Acros Organics), and acetic acid (99.7%, Sigma-Aldrich Chemical Co.) were
used as received. The structures of the RAFT agents used are shown in Figure 4.
Figure 4. Structures of the RAFT agents used.
Synthesis of Cyanoethyl Dodecyl Trithiocarbonate (CEDT) (Scheme 4)
1-Dodecanethiol (1.76 g) and potassium phosphate tribasic (2.02 g) were
dissolved in acetone (23.5 mL) in a 50 mL round bottomed flask equipped with magnetic
stir bar. The solution was stirred at room temperature for 2 hours before carbon disulfide
(1.97 g) was added dropwise via addition funnel over 10 mins and the reaction stirred an
additional hour at room temperature. Then 2-bromopropionitrile (1.16 g) was added
dropwise over 5 minutes via addition funnel and the solution stirred overnight. The salts
were filtered and the solvent removed via rotary evaporation yielding a viscous yellow
oil. Purification via column chromatography (silica gel, 60:40 hexane:ethyl acetate Rf =
0.59) yielded the product as a slightly yellow, waxy solid. The nuclear magnetic
resonance (NMR) spectrum confirmed the structure of CEDT as shown in Figure 5.
24
Scheme 4. Synthesis of cyanoethyl dodecyl trithiocarbonate (CEDT).
Figure 5. NMR spectrum of cyano ethyl dodecyl trithiocarbonate (CEDT).
Synthesis of Bisethylxanthate (BEX) (Scheme 5)
Potassium ethylxanthate (10.11 g) was dissolved in H2O (50 mL) in a 250 mL
round bottomed flask equipped with magnetic stir bar. A solution of I2 (8.84 g) and KI
(11.50 g) in H2O (100 mL) was added dropwise via addition funnel over 30 mins and the
reaction stirred overnight at room temperature. The solution was subsequently
transferred to a separatory funnel, extracted three times with diethyl ether (100 mL), and
the ether fractions combined, washed with aqueous sodium thiosulfate (5 wt. %, 100mL)
and brine (100 mL) before drying over MgSO4. The salts were filtered and the solvent

25
removed via rotary evaporation yielding a viscous yellow oil. The NMR spectrum
confirmed the structure of BEX (Figure 6).
Scheme 5. Synthesis of bisethylxanthate (BEX).
Figure 6. NMR spectrum of bisethylxanthate (BEX).
Synthesis of CTSPA (Scheme 6)
Bisethylxanthate (3.10 g) and V-501 (5.37 g) were dissolved in a 1:1 (v:v)
mixture of ethyl acetate and absolute ethanol (200 mL) in a 3-necked round bottom flask
equipped with magnetic stir bar and reflux condenser. The solution was purged with
nitrogen for 40 mins and then heated to reflux overnight (18 h), upon which the reaction

26
was cooled to room temperature and the solvent removed via rotary evaporation.
Purification via column chromatography (silica gel, 60:39:1 hexane:ethyl acetate:acetic
acid, Rf = 0.3) yielded the product as a slightly yellow, waxy solid. The NMR spectrum
confirmed the structure of CTSPA (Figure 7).
Scheme 6. Synthesis of 4-cyano-4-((thioethoxy)sulfanyl) pentanoic acid (CTSPA).
Figure 7. NMR Spectrum of 4-cyano-4-((thioethoxy)sulfanyl) pentanoic acid (CTSPA).
Initiator Structures
Azobisisobutyronitrile (AIBN, 99%, Sigma-Aldrich Chemical Co.), 2,2'-
Azobis(4-methoxy-2.4-dimethyl valeronitrile) (V-70, Wako Pure Chemical Industries,
Ltd.), and 4,4’-asobis(4-cyanopentanoic acid) (V-501, 99%, Sigma-Aldrich Chemical
Co.) were used as received. The structures of the initiators used are shown in Figure 8.

27
Figure 8. Structures of the initiators.
Lewis Acids, Fluoroalcohols, and Tacticity Modifiers
Lewis acids and fluoroalcohols were purchased from Sigma Aldrich Chemical
Co. unless otherwise denoted. Isobutyraldehyde (99%, Acros Organics), 1,3-bis(2-
hydroxyhexaflouroisopropyl)benzene (BHFB, 97%, Matrix Scientific), Perfluoro-tert-
butyl alcohol (PHTB, 99%, Acros Organics), 1,1,1,3,3,3-hexafluoro-2-propanol (HFP,
99.9%, Acros Organics), yttrium (III) trifluoromethanesulfonate (Y(OTf)3, 98%),
ytterbium (III) trifluoromethanesulfonate (Yb(OTf)3, 99.99%), ytterbium chloride
(YbCl3, 99.99%, anhydrous powder), zinc chloride (ZnCl2, 99.999%), aluminum chloride
(AlCl3, 99.99%, anhydrous powder), and magnesium chloride (MgCl2, 98%) were used
as received. The structures of the Lewis acids and fluoroalcohols are shown in Figure 9.

28
Figure 9. Structures of Lewis acids and fluoroalcohols.
Synthesis of Polyacrylonitrile and its Copolymers
Conventional Free Radical Solution Polymerization
A typical solution radical polymerization was as follows: ethylene carbonate (32.0
g) , acrylonitrile (7.99 g, 151 mmol, 20 wt.%), and V-70 (9.5 mg, 0.031 mmol, stock
solution in tetrahydrofuran (THF) 20 mg/mL) were charged to a 100 mL round bottom
flask equipped with a magnetic stir bar. The reaction flask was capped with a rubber
stopper and cooled to 0 °C and subsequently purged with N2 for 60 min prior to heating
in an oil bath 30 °C for 8 hours. When AIBN or V-501 were used as the initiator the oil
bath was set to 65 °C and 70 °C, respectively (the initiator half-life temperatures), and
stock solutions of similar concentration were prepared in DMF. Polymer isolation was
achieved by precipitation into a 1 L bath of approximately 70:30 (v:v) deionized water
and methanol followed by isolation via filtration and drying for 30 minutes under
nitrogen. The polymer was then re-dissolved in DMF at 20 to 25 weight percent
polymer, and the solution poured over aluminum foil and allowed to spread into a film.
The film was coagulated by soaking in deionized water for 3-4 hour followed by a 24 hr

29
Soxhlet extraction in methanol to remove residual solvent. The polymer film was then
dried in a vacuum oven at 60 °C overnight.
RAFT Polymerization
A representative RAFT polymerization of [AN]0:[CPDT]0:[V-70]0 =
10,000:1:0.67 was as follows: ethylene carbonate (32.0 g) , acrylonitrile (7.99 g, 151
mmol, 20 wt.%), CPDT (5.2 mg, 0.015 mmol, stock solution in dimethylformamide
(DMF) 20 mg/mL), and V-70 (3.1 mg, 0.010 mmol, stock solution in tetrahydrofuran
(THF) 20 mg/mL) were charged into a 100 mL round bottom flask equipped with a
magnetic stir bar. The flask was capped with a rubber stopper and purged for 1 hour
under nitrogen gas being held in an ice bath before being transferred to an oil bath set to
30 °C for 24 to 48 hours. Polymers were precipitated in and dried in the same manner as
the uncontrolled free radical polymers. Theoretical number average molecular weights
were determined by Equation 1:106
MW
MW
theorn CTACTA
conversionMMM
0
0
,][
][
( 1 )
in which [M]0 and [CTA]0 are the initial monomer and chain-transfer agent
concentrations, respectively. MMW and CTAMW correspond to the molecular weights of the
monomer and chain-transfer agent, respectively.
Kinetics of RAFT Polymerization
At timed intervals, 1 mL aliquots were drawn and analyzed by 1H-NMR (DMSO-
d6) by comparing the relative integral areas of ethylene carbonate (δ (ppm): s, 4.50, CH2)
to the vinyl protons of AN (δ (ppm): d, 6.22; d, 6.36, CH2; quad, 6.00, CH) as shown in
Figure 10 for a polymerization with [AN]0:[CPDT]0:[V-70]0 = 10,000:1:0.67. Size

30
exclusion chromatography (SEC) (DMF 20 mM LiBr) was used to monitor molecular
weight progression and polydispersity during each polymerization.
Figure 10. Representative NMR-spectra for timed intervals during RAFT polymerization
of AN with [AN]0:[CPDT]0:[V-70]0 = 10,000:1:0.67.
Scale-Up Polymerizations
A representative scale-up copolymerization of 98/2 p(AN-co-NIPAM) at
[AN]0:[NIPAM]0:[CPDT]0:[V-70]0 = 9,800:200:1:0.67 was as follows: AN (80.00 g, 1.51
mol), NIPAM (3.34 g, 0.03 mol), CPDT (50.9 mg, 0.15 mmol, stock solution in
dimethylformamide (DMF) 20 mg/mL), V-70 (30.3 mg, 0.10 mmol) stock solution in
tetrahydrofuran (THF) 20 mg/mL) and ethylene carbonate (600 g, 80 wt%) were charged
into a 1 liter round bottom, 2-neck reactor equipped with a magnetic stir bar. For free
radical scale-up polymerizations, AIBN was utilized as the initiator and the reaction was
performed at 65 °C with a reflux condenser. The flask was capped with a rubber stopper
and purged for 1 hour under nitrogen gas being held in an ice bath before being

31
transferred to an oil bath set to 65 °C for 8 hr. The polymer was then precipitated in a 20
L bath of deionized water and allowed to dry. The polymer was then re-dissolved in
dimethylsulfoxide (DMSO) at c.a. 15 wt. % weight percent polymer and re-precipitated
in deionized water and soaked in methanol for 3-4 hours before drying in a vacuum oven
at 60 °C overnight.
Methods of Characterization
Oxidation Treatment
Selected polymer films (50 mg) were subjected to an oxidation treatment in a
Thermo Scientific Lindberg Blue M programmable oven by ramping to 225 °C at 5
°C/min air and holding at 225 °C for set time intervals.
Nuclear Magnetic Resonance (NMR) Spectroscopy
1H-NMR experiments were recorded with a Bruker Acend™ 600 MHz
spectrometer. 1H-NMR experiments were conducted at 30 °C with 5 wt% solutions in
DMSO-d6 using 32 scans and a 1 second relaxation delay. Monomer conversion was
followed throughout the reaction by tracking the relative monomer concentration (δ
(ppm): d, 6.22; d, 6.36; quad, 6.00) with respect to the ethylene carbonate (δ (ppm): s,
4.50). Quantitative 13C-NMR experiments (proton decoupler turned off) were also
recorded at 30 °C using 1280 scans and a 45 second relaxation delay. Tacticity could be
determined from the peak splitting of the methine carbon from PAN (c.a. 28 ppm) and
the nitrile carbon (c.a. 120 ppm).107
Size Exclusion Chromatography with Multi- Angle Laser Light Scattering (SEC-MALLS)
Number average molecular weight (Mn), weight average molecular weight (Mw),
and polydispersity index (PDI) of the polymer materials were measured using a GPC

32
system consisting of a Waters Alliance 2695 separation module, online multi-angle laser
light scattering (MALLS) detector fitted with a gallium arsenide laser (20 mW power)
operating at 690 nm (MiniDAWN Wyatt Technology Inc.), an interferometric
refractometer (Optilab DSP, Wyatt Technology Inc.), and two Agilent PLgel mixed-C
columns connected in series. HPLC grade N,N’-dimethylformamide (DMF) with 0.02 M
LiBr served as the mobile phase and was delivered at a flow rate of 0.5 mL/min while
operating at 60 °C. Sample concentrations were prepared at approximately 5 mg/mL with
an injection volume of 100 μL. The detector signals were simultaneously recorded using
ASTRA software (Wyatt Technology Inc.). The dn/dc for PAN (0.084 mL/g) in the
above eluent was determined offline from the slope of the refractive index vs. polymer
concentration plot generated from refractive index measurements made at 4 polymer
concentrations between 1 and 10 mg/mL (Figure 11). The measured dn/dc value was in
excellent agreement with the dn/dc value calculated from the response of the
interferometric refractometer, assuming 100% mass recovery (0.086 mL/g). Molecular
weights were also determined relative to polymethyl methacrylate (PMMA) standards.
Figure 11. Determination of dn/dc (0.084 mL/g) for PAN.

33
Ubbelohde Viscometry
Viscosity average molecular weight, Mη, was measured using the intrinsic
viscosity, [η], in accordance with the Mark-Houwink equation from the relationship
between molecular weight and viscosity (Eqn. 2):
MK ( 2 )
The Mark-Houwink parameters, K and α, are constants for a given system where K =
24.3*10-3 mL/g and α = 0.75 for polyacrylonitrile in DMF at 25 °C.108 To measure [η],
solutions of known concentration (c) were prepared and the flow times of the neat solvent
(t0) and solutions (t) were measured using an Ubbelohde viscometer. Flow times were
repeated in triplicate and five concentrations were prepared between 2 and 10 mg/mL.
The reduced viscosity, ηred (Eqn. 3), and the inherent viscosity, ηinh (Eqn. 4), are both
extrapolated to the zero concentration limits, where the average of the two ordinates is
taken as the intrinsic viscosity (Eqn. 5):
c
t
tt
red
0
0
( 3 )
c
tt
inh
0
ln
( 4 )
inhc
redc
average 00
lim,lim
( 5 )
UV-Vis Spectroscopy
UV-Vis spectra were recorded on a Perkin Elmer Lambda 35 spectrophotometer.
Samples were prepared using a stock solution of polymer in DMF in a glass quartz

34
cuvette. Excitation was carried out between 250−700 nm with a 0.5 nm slit width, 1 nm
resolution, and 480 nm/min scan speed.
Matrix-Assisted Laser Desorption/Ionization Time-of-Flight (MALDI-TOF) Spectroscopy
Matrix-assisted laser desorption/ionization time-of-flight mass spectrometry
(MALDI-TOF-MS) was performed using a Bruker Microflex LRF MALDI-TOF mass
spectrometer equipped with a nitrogen laser (337 nm) possessing a 60 Hz repetition rate
and a 50 µJ energy output. Polyacrylonitrile samples were prepared using a pre-mixed
droplet method. A 10 mg/mL solution of matrix (4-hydroxybenxylidenemalonitrile)
(4HBM) and THF, a 1 mg/mL solution of polyacrylonitrile and DMSO, and a 2 mg/mL
solution of silver trifluoroacetate (AgTFA) and 50/50 (v:v) mixture of acetonitrile and
water were all mixed in a volumetric ratio of 1:1:1 (10 µL of each). Following, a 1 µL
aliquot was deposited onto a stainless steel MALDI sample target for analysis. All spectra
were obtained in the positive ion mode utilizing the linear mode micro-channel plate
detector and are the sum of 1000 shots.
Differential Scanning Calorimetry (DSC)
DSC was performed on a TA Instruments DSC Q200 equipped with a nitrogen
purge gas. Heating ramp rates of 2, 5, 10, and 20 °C/min were employed from 30-320 °C.
Sample sizes ranged from 2-6 mg in hermetic aluminum pans.
Cyclization activation energy was determined from the Flynn-Wall-Ozawa
(FWO) and Kissinger methods, displayed in Equations 6 and 7, respectively, where Ea is
the activation energy, R is the universal gas constant, Tp is the peak exotherm
temperature in Kelvin, and φ is the temperature ramp rate in Kelvin. In both cases the
activation energy is calculated by a series of temperature ramps for these systems and
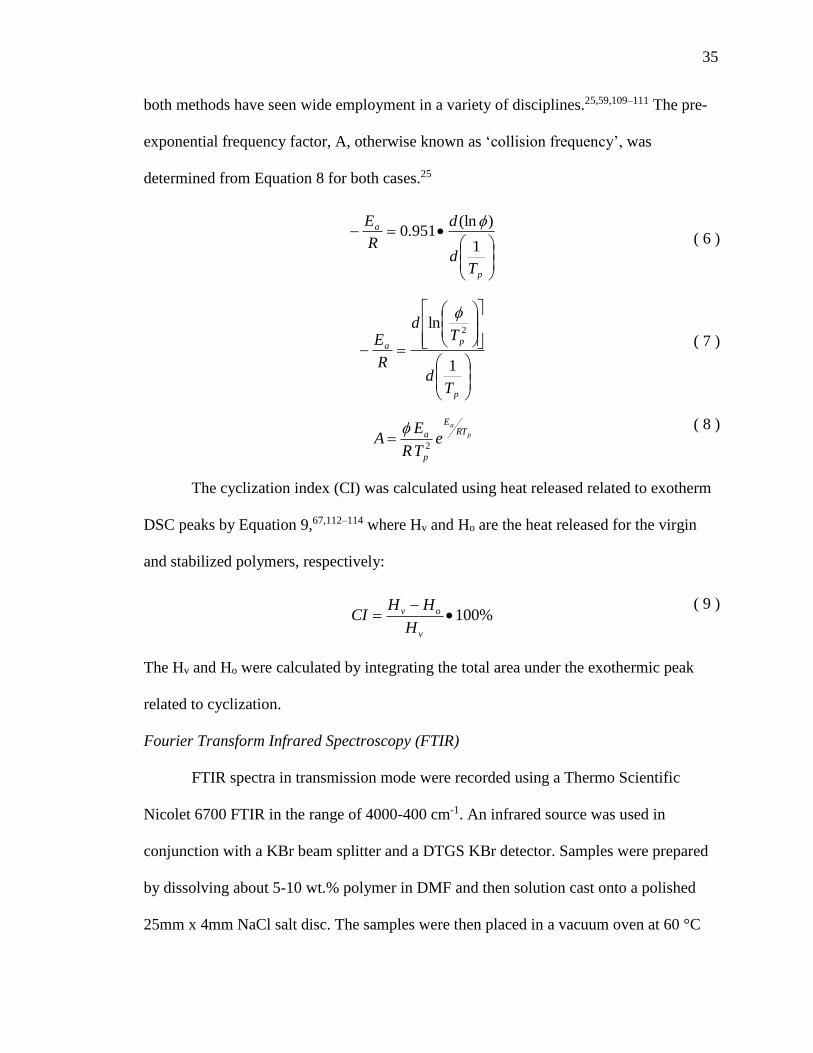
35
both methods have seen wide employment in a variety of disciplines.25,59,109–111 The pre-
exponential frequency factor, A, otherwise known as ‘collision frequency’, was
determined from Equation 8 for both cases.25
p
a
Td
d
R
E
1
)(ln951.0
( 6 )
p
pa
Td
Td
R
E
1
ln2
( 7 )
p
aRT
E
p
a eTR
EA
2
( 8 )
The cyclization index (CI) was calculated using heat released related to exotherm
DSC peaks by Equation 9,67,112–114 where Hv and Ho are the heat released for the virgin
and stabilized polymers, respectively:
%100
v
ov
H
HHCI
( 9 )
The Hv and Ho were calculated by integrating the total area under the exothermic peak
related to cyclization.
Fourier Transform Infrared Spectroscopy (FTIR)
FTIR spectra in transmission mode were recorded using a Thermo Scientific
Nicolet 6700 FTIR in the range of 4000-400 cm-1. An infrared source was used in
conjunction with a KBr beam splitter and a DTGS KBr detector. Samples were prepared
by dissolving about 5-10 wt.% polymer in DMF and then solution cast onto a polished
25mm x 4mm NaCl salt disc. The samples were then placed in a vacuum oven at 60 °C
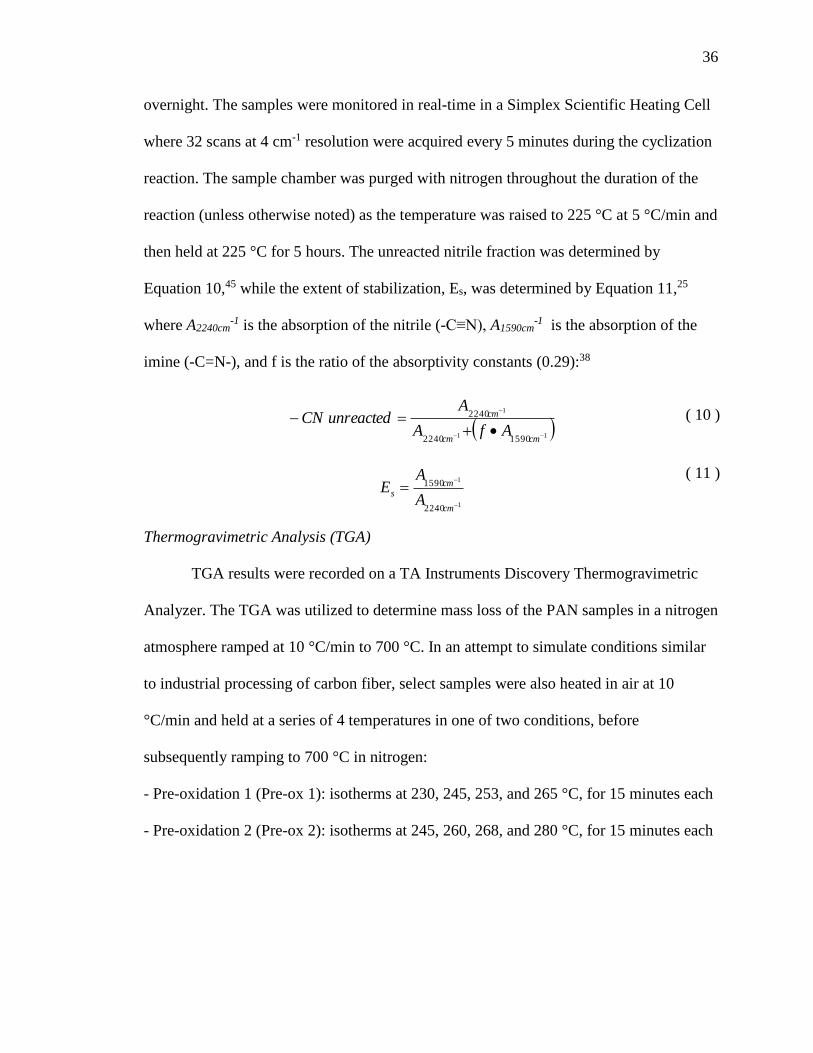
36
overnight. The samples were monitored in real-time in a Simplex Scientific Heating Cell
where 32 scans at 4 cm-1 resolution were acquired every 5 minutes during the cyclization
reaction. The sample chamber was purged with nitrogen throughout the duration of the
reaction (unless otherwise noted) as the temperature was raised to 225 °C at 5 °C/min and
then held at 225 °C for 5 hours. The unreacted nitrile fraction was determined by
Equation 10,45 while the extent of stabilization, Es, was determined by Equation 11,25
where A2240cm-1 is the absorption of the nitrile (-C≡N), A1590cm
-1 is the absorption of the
imine (-C=N-), and f is the ratio of the absorptivity constants (0.29):38
11
1
15902240
2240
cmcm
cm
AfA
AunreactedCN
( 10 )
1
1
2240
1590
cm
cms
A
AE
( 11 )
Thermogravimetric Analysis (TGA)
TGA results were recorded on a TA Instruments Discovery Thermogravimetric
Analyzer. The TGA was utilized to determine mass loss of the PAN samples in a nitrogen
atmosphere ramped at 10 °C/min to 700 °C. In an attempt to simulate conditions similar
to industrial processing of carbon fiber, select samples were also heated in air at 10
°C/min and held at a series of 4 temperatures in one of two conditions, before
subsequently ramping to 700 °C in nitrogen:
- Pre-oxidation 1 (Pre-ox 1): isotherms at 230, 245, 253, and 265 °C, for 15 minutes each
- Pre-oxidation 2 (Pre-ox 2): isotherms at 245, 260, 268, and 280 °C, for 15 minutes each
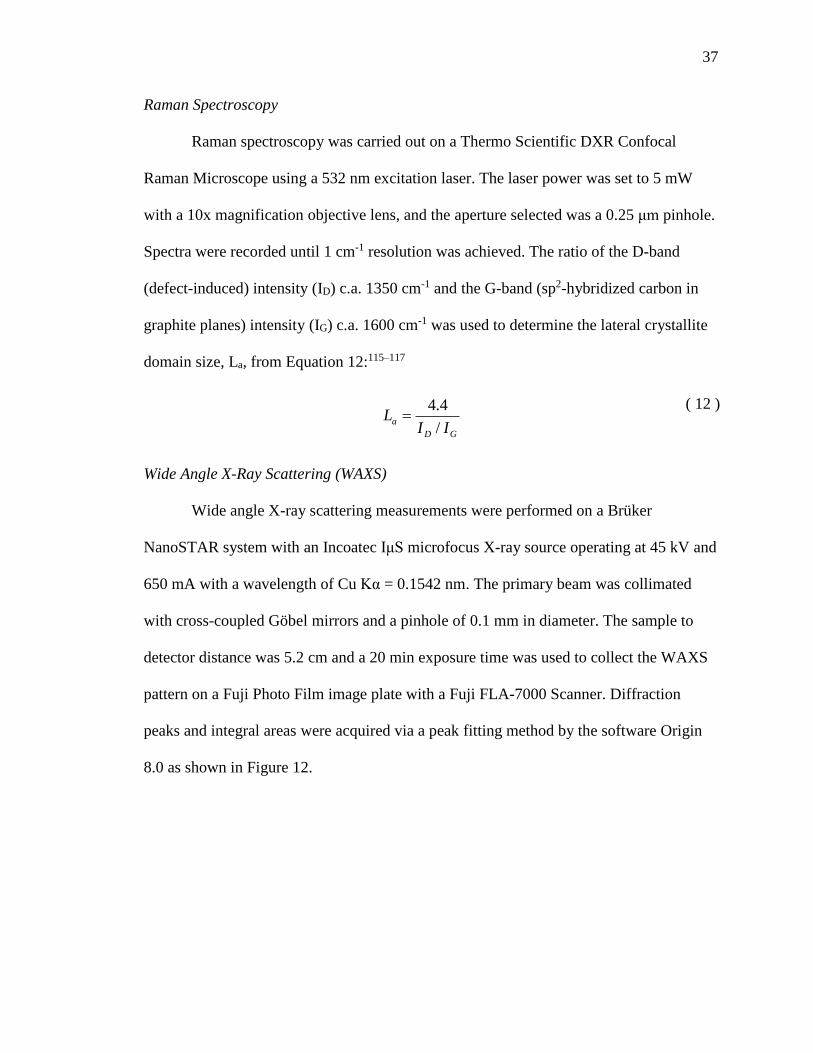
37
Raman Spectroscopy
Raman spectroscopy was carried out on a Thermo Scientific DXR Confocal
Raman Microscope using a 532 nm excitation laser. The laser power was set to 5 mW
with a 10x magnification objective lens, and the aperture selected was a 0.25 μm pinhole.
Spectra were recorded until 1 cm-1 resolution was achieved. The ratio of the D-band
(defect-induced) intensity (ID) c.a. 1350 cm-1 and the G-band (sp2-hybridized carbon in
graphite planes) intensity (IG) c.a. 1600 cm-1 was used to determine the lateral crystallite
domain size, La, from Equation 12:115–117
GD
aII
L/
4.4
( 12 )
Wide Angle X-Ray Scattering (WAXS)
Wide angle X-ray scattering measurements were performed on a Brüker
NanoSTAR system with an Incoatec IμS microfocus X-ray source operating at 45 kV and
650 mA with a wavelength of Cu Kα = 0.1542 nm. The primary beam was collimated
with cross-coupled Göbel mirrors and a pinhole of 0.1 mm in diameter. The sample to
detector distance was 5.2 cm and a 20 min exposure time was used to collect the WAXS
pattern on a Fuji Photo Film image plate with a Fuji FLA-7000 Scanner. Diffraction
peaks and integral areas were acquired via a peak fitting method by the software Origin
8.0 as shown in Figure 12.

38
Figure 12. Example of Origin 8.0 peak fitting for 2θ vs. Intensity of 5 mol% p(AN-co-
AA) copolymer.
The lateral crystallite thickness (Lc) of the pseudohexagonal crystal lattice118 was
determined by the Scherrer equation (Equation 13) for the (100) reflection at 2θ = 17°, in
which λ = 0.154 nm is the wavelength of CuKα X-ray, θ is the Bragg diffraction angle, B
is the full width at half maximum intensity in radians, and K is a constant and is equal to
0.9:119
cosB
KLc
( 13 )
The percent crystallinity (χc) was determined by the Bell and Dumbleton method120
(Equation 14), in which Ac and Aa are the integral areas of the crystalline zone around the
2θ = 17° and the amorphous zones, respectively:
%100
ac
cc
AA
A
( 14 )
The stabilization index (SI) was used to evaluate the quantitative changes in structural
order related to the formation of cyclic structure by Equation 15, in which I0 and Ii are the
intensities of the 2θ = 17° peak for the virgin and heat treated polymers, respectively:65
%100
0
0
I
IISI i
( 15 )
39
CHAPTER III
HIGH MOLECULAR WEIGHT AND NARROW POLYDISPERSITY
POLYACRYLONITRILE VIA LOW TEMPERATURE RAFT POLYMERIZATION
Abstract
High molecular weight polyacrylonitrile (PAN) with low polydispersity has been
successfully synthesized utilizing reversible addition-fragmentation chain transfer
(RAFT) polymerization. A comprehensive study was performed to understand the
influence of reaction temperature, RAFT agent structure, and [M]0:[CTA]0[I]0 on the
polymerization kinetics and the molecular weight as well as polydispersity. Enhanced
control is attributed to reduction of side reactions by conducting the polymerization at
lower temperature, and optimizing the radical exchange between active and dormant
states via appropriate selection of RAFT agent and initiator. A size exclusion
chromatograph equipped with a multi angle laser light scattering (SEC-MALLS) detector
allowed direct measurement of the absolute weight average molecular weight and
polydispersity of the resulting polymers. Ultimately, PAN of molecular weight ≈ 170,000
g/mol (SEC-MALLS) and Mw/Mn = 1.25 was obtained at 70% conversion. Such well
controlled polymers are excellent model precursors for further study of in situ carbon
fiber production of PAN-based carbon fibers.

40
Results and Discussion
Scheme 7. General RAFT polymerization of acrylonitrile.
The general RAFT polymerization of AN is outlined in Scheme 7. Ethylene
carbonate was utilized as the solvent to minimize chain transfer to solvent.76,121 The
effects of RAFT agent structure, [M]0:[CTA]0:[I]0, and polymerization temperature on
molecular weight, polydispersity, and polymerization rate were investigated. Judicious
selection of the RAFT agent is necessary to achieve successful polymerization control of
a given monomer. The free radical leaving R-group determines the fragmentation
efficiency,122 while the Z-group modifies the reactivity of the thiocarbonylthio compound
and the derived adduct radical.123 There are established classes based on R- and Z-groups
of suitable RAFT agents for select monomers80,124, and the homopolymerization of AN
has been conducted using dithiobenzoates73,74,76, trithiocarbonates50,74,81, as well as
dithiocarbamates78. However, to date there are no reported examples of xanthate-
mediated RAFT polymerizations of AN, which have radical stabilities between those of
trithiocarbonates and dithiocarbamates. Thus, we first investigated xanthate-mediated
RAFT polymerization of AN. Furthermore, we wanted to explore the effects of R-group,
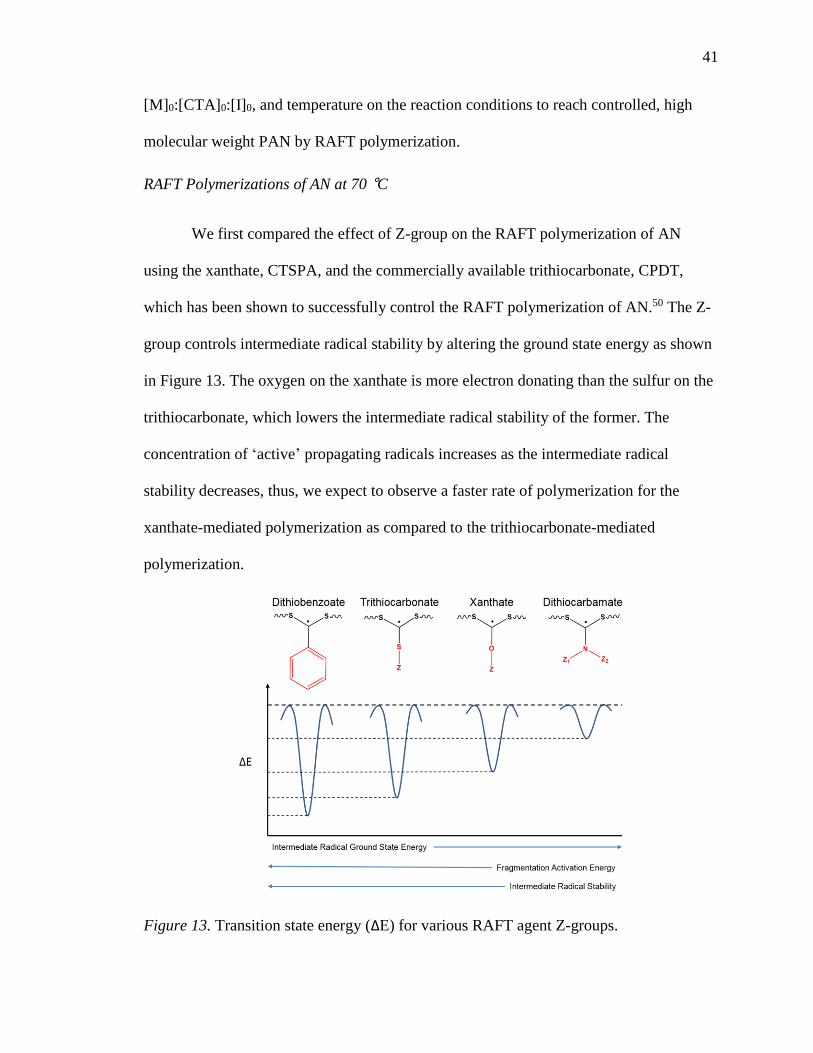
41
[M]0:[CTA]0:[I]0, and temperature on the reaction conditions to reach controlled, high
molecular weight PAN by RAFT polymerization.
RAFT Polymerizations of AN at 70 °C
We first compared the effect of Z-group on the RAFT polymerization of AN
using the xanthate, CTSPA, and the commercially available trithiocarbonate, CPDT,
which has been shown to successfully control the RAFT polymerization of AN.50 The Z-
group controls intermediate radical stability by altering the ground state energy as shown
in Figure 13. The oxygen on the xanthate is more electron donating than the sulfur on the
trithiocarbonate, which lowers the intermediate radical stability of the former. The
concentration of ‘active’ propagating radicals increases as the intermediate radical
stability decreases, thus, we expect to observe a faster rate of polymerization for the
xanthate-mediated polymerization as compared to the trithiocarbonate-mediated
polymerization.
Figure 13. Transition state energy (ΔE) for various RAFT agent Z-groups.

42
Figure 14 shows ln([M]0/[M]) vs. time (Figure 14a), polydispersity vs. conversion
(Figure 14b), and Mn vs. conversion (Figure 14c) plots for the CTSPA- and CPDT-
mediated polymerizations of AN in ethylene carbonate at 70 °C ([M]0:[CTA]0:[I]0 =
4,000:1:0.4).
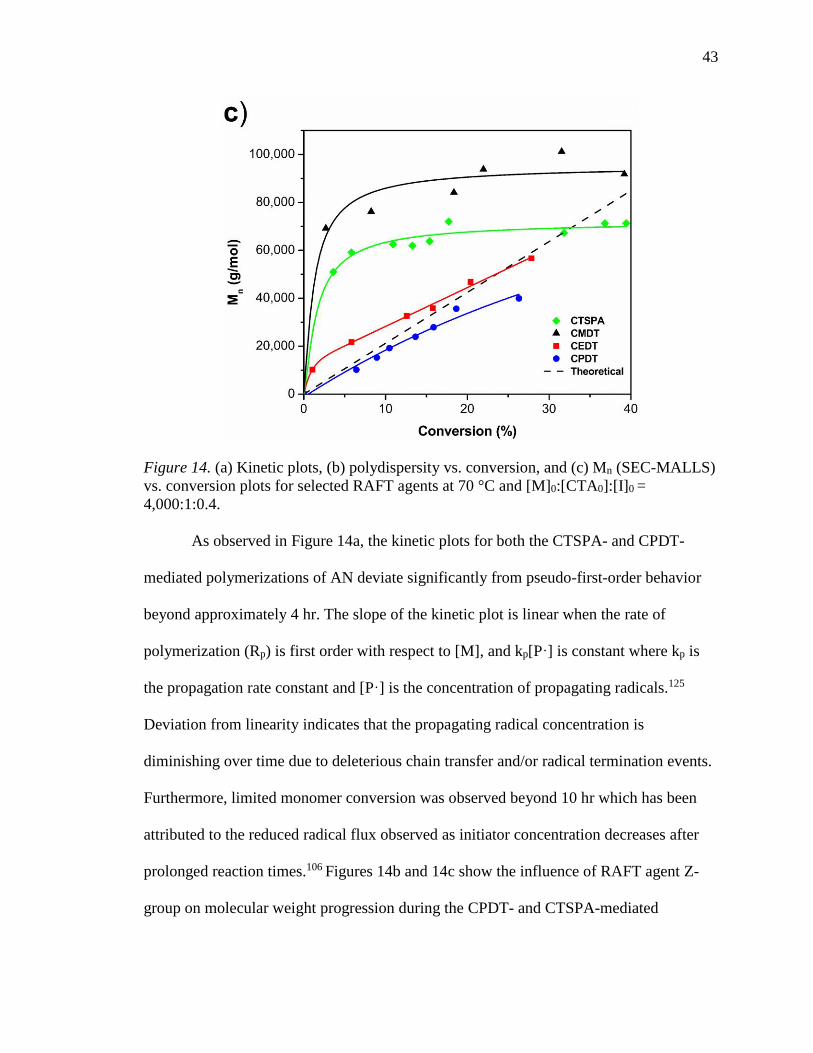
43
Figure 14. (a) Kinetic plots, (b) polydispersity vs. conversion, and (c) Mn (SEC-MALLS)
vs. conversion plots for selected RAFT agents at 70 °C and [M]0:[CTA0]:[I]0 =
4,000:1:0.4.
As observed in Figure 14a, the kinetic plots for both the CTSPA- and CPDT-
mediated polymerizations of AN deviate significantly from pseudo-first-order behavior
beyond approximately 4 hr. The slope of the kinetic plot is linear when the rate of
polymerization (Rp) is first order with respect to [M], and kp[P·] is constant where kp is
the propagation rate constant and [P·] is the concentration of propagating radicals.125
Deviation from linearity indicates that the propagating radical concentration is
diminishing over time due to deleterious chain transfer and/or radical termination events.
Furthermore, limited monomer conversion was observed beyond 10 hr which has been
attributed to the reduced radical flux observed as initiator concentration decreases after
prolonged reaction times.106 Figures 14b and 14c show the influence of RAFT agent Z-
group on molecular weight progression during the CPDT- and CTSPA-mediated
44
polymerizations of AN at 70 °C. The CPDT-mediated polymerization of AN showed a
linear progression in molecular weight with conversion while the experimentally
determined molecular weights (Mnexp) were in good agreement with the theoretical
molecular weights (Mntheory) calculated based upon monomer conversion (Figure 14c,
dashed line). In addition, the polydispersities remained low (PDI < 1.20) throughout the
CPDT-mediated polymerization of AN at 70 °C (Table 1. Entries 5a-c). In contrast, the
CTSPA-mediated polymerization of AN resulted in Mnexp values greatly exceeding the
Mntheory values at low monomer conversions while polydispersities increased as the
polymerization progressed (PDI > 1.50) (Table 1. Entries 1a-c). The poor control
exhibited during the CTSPA-mediated polymerization of AN is likely due to the lower
chain transfer constant of xanthates as compared to analogous trithiocarbonates, which
gives a higher probability for the propagating chain to add to monomer than for addition
back to the CTA.123 The difference in molecular weight control is further exhibited by
Figure 15, where the progressive refractive index (RI) traces from SEC analysis are
plotted for CPDT- (Figure 15a) and CTSPA- (Figure 15b) mediated polymerizations.
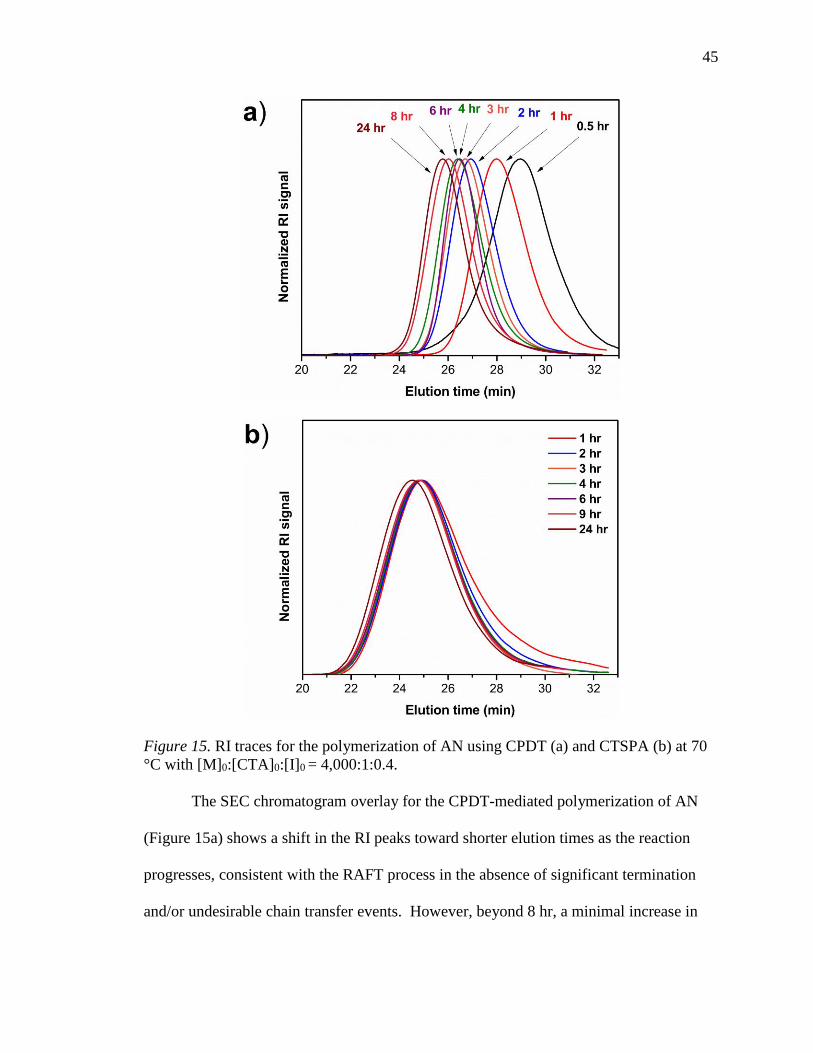
45
Figure 15. RI traces for the polymerization of AN using CPDT (a) and CTSPA (b) at 70
°C with [M]0:[CTA]0:[I]0 = 4,000:1:0.4.
The SEC chromatogram overlay for the CPDT-mediated polymerization of AN
(Figure 15a) shows a shift in the RI peaks toward shorter elution times as the reaction
progresses, consistent with the RAFT process in the absence of significant termination
and/or undesirable chain transfer events. However, beyond 8 hr, a minimal increase in
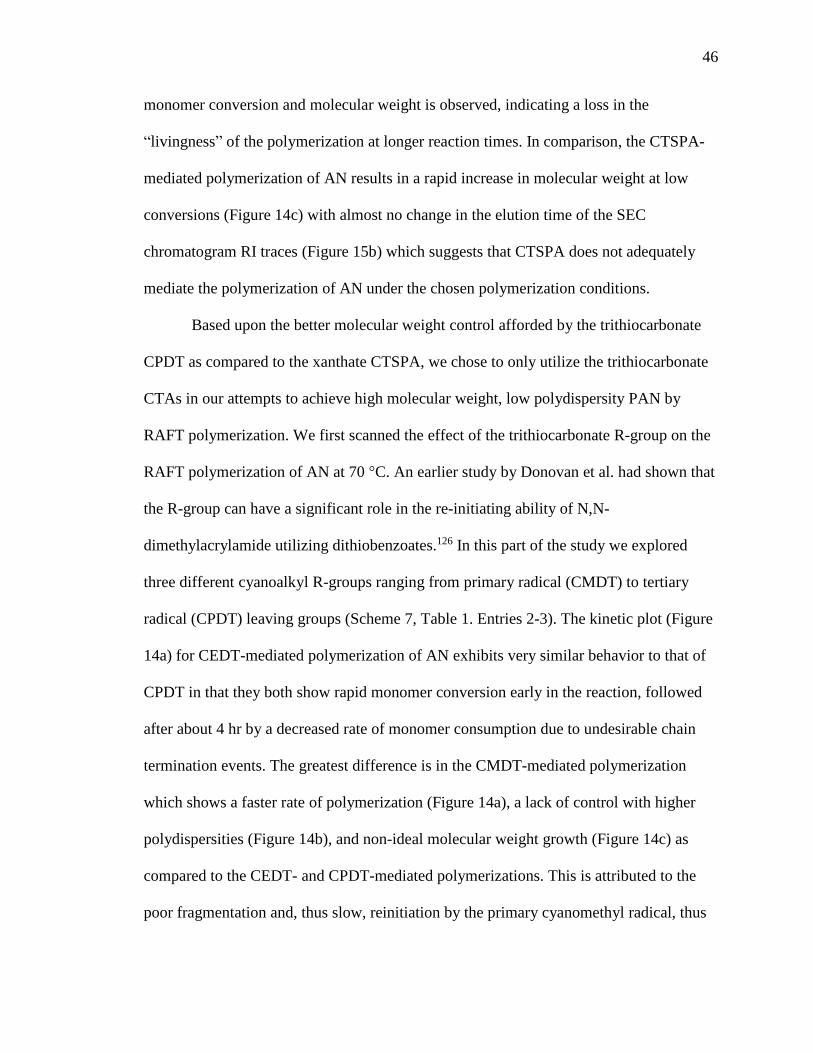
46
monomer conversion and molecular weight is observed, indicating a loss in the
“livingness” of the polymerization at longer reaction times. In comparison, the CTSPA-
mediated polymerization of AN results in a rapid increase in molecular weight at low
conversions (Figure 14c) with almost no change in the elution time of the SEC
chromatogram RI traces (Figure 15b) which suggests that CTSPA does not adequately
mediate the polymerization of AN under the chosen polymerization conditions.
Based upon the better molecular weight control afforded by the trithiocarbonate
CPDT as compared to the xanthate CTSPA, we chose to only utilize the trithiocarbonate
CTAs in our attempts to achieve high molecular weight, low polydispersity PAN by
RAFT polymerization. We first scanned the effect of the trithiocarbonate R-group on the
RAFT polymerization of AN at 70 °C. An earlier study by Donovan et al. had shown that
the R-group can have a significant role in the re-initiating ability of N,N-
dimethylacrylamide utilizing dithiobenzoates.126 In this part of the study we explored
three different cyanoalkyl R-groups ranging from primary radical (CMDT) to tertiary
radical (CPDT) leaving groups (Scheme 7, Table 1. Entries 2-3). The kinetic plot (Figure
14a) for CEDT-mediated polymerization of AN exhibits very similar behavior to that of
CPDT in that they both show rapid monomer conversion early in the reaction, followed
after about 4 hr by a decreased rate of monomer consumption due to undesirable chain
termination events. The greatest difference is in the CMDT-mediated polymerization
which shows a faster rate of polymerization (Figure 14a), a lack of control with higher
polydispersities (Figure 14b), and non-ideal molecular weight growth (Figure 14c) as
compared to the CEDT- and CPDT-mediated polymerizations. This is attributed to the
poor fragmentation and, thus slow, reinitiation by the primary cyanomethyl radical, thus
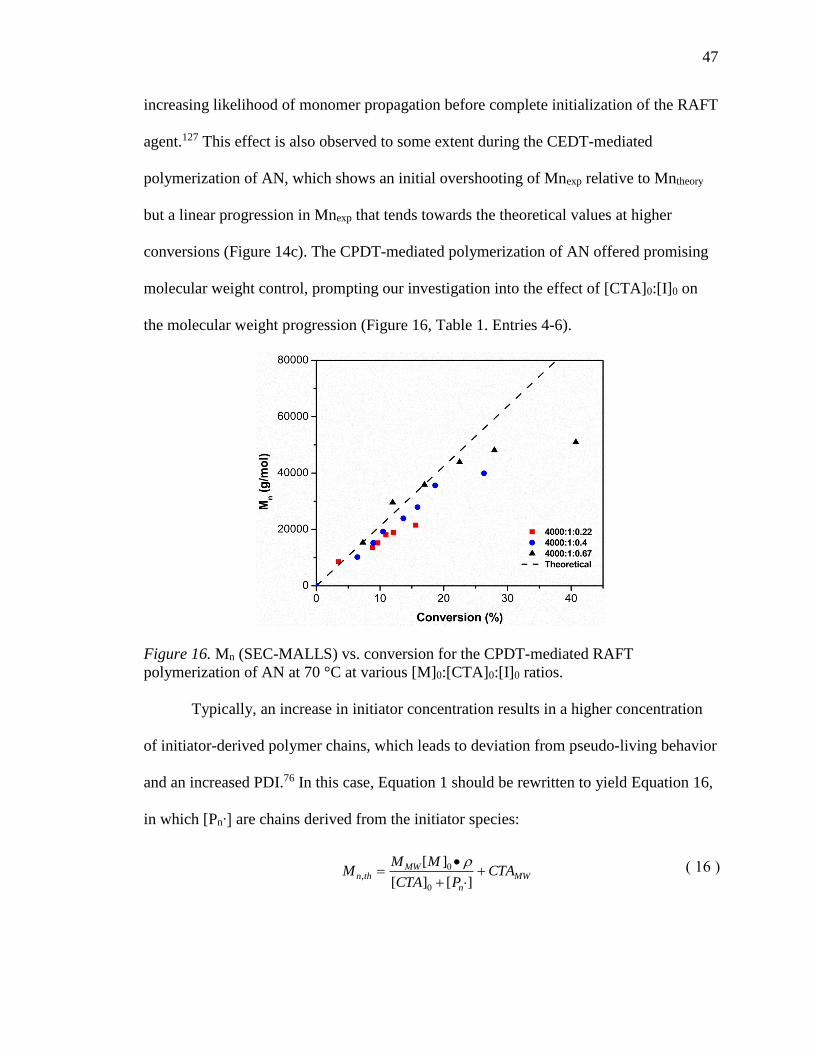
47
increasing likelihood of monomer propagation before complete initialization of the RAFT
agent.127 This effect is also observed to some extent during the CEDT-mediated
polymerization of AN, which shows an initial overshooting of Mnexp relative to Mntheory
but a linear progression in Mnexp that tends towards the theoretical values at higher
conversions (Figure 14c). The CPDT-mediated polymerization of AN offered promising
molecular weight control, prompting our investigation into the effect of [CTA]0:[I]0 on
the molecular weight progression (Figure 16, Table 1. Entries 4-6).
Figure 16. Mn (SEC-MALLS) vs. conversion for the CPDT-mediated RAFT
polymerization of AN at 70 °C at various [M]0:[CTA]0:[I]0 ratios.
Typically, an increase in initiator concentration results in a higher concentration
of initiator-derived polymer chains, which leads to deviation from pseudo-living behavior
and an increased PDI.76 In this case, Equation 1 should be rewritten to yield Equation 16,
in which [Pn∙] are chains derived from the initiator species:
MW
n
MWthn CTA
PCTA
MMM
][][
][
0
0,
( 16 )

48
[Pn∙] increases as [CTA]0:[I]0 decreases due the lower probability of initiator
adding to CTA and establishing the RAFT equilibrium. However, when the [CTA]0:[I]0 is
suitably large, [Pn∙] is expected to be negligible. Interestingly, increasing the [CTA]0:[I]0
to 1:0.67 under these reaction conditions resulted in minimal deviation from Mn,th while
conversion increased to over 40% after 24 hr. The results for polymerizations at 70 °C are
summarized in Table 1.
Table 1
Conversion, Molecular Weight, and Polydispersity Data for the RAFT Polymerization of
AN Conducted at 70 °C
Entrya RAFT
agent [M]0:[CTA]0:[I]0
Time
(hr)
Conv.b
(%)
Mn
(Theor.)c
Mn
(MALLS)d
Mn
(PMMA)e PDId
1a CTSPA 4 000:1:0.4 3 18 38 200 72 000 214 300 1.38
1b CTSPA 4 000:1:0.4 6 32 67 900 67 300 207 300 1.57
1c CTSPA 4 000:1:0.4 24 37 78 800 74 600 191 000 1.58
2a CMDT 4 000:1:0.4 3 22 46 400 93 800 365 800 1.46
2b CMDT 4 000:1:0.4 6 32 67 600 83 400 330 900 1.81
2c CMDT 4 000:1:0.4 24 36 76 700 77 300 310 200 1.42
3a CEDT 4 000:1:0.4 3 10 20 900 35 900 117 700 1.13
3b CEDT 4 000:1:0.4 6 20 43 600 46 800 144 300 1.14
3c CEDT 4 000:1:0.4 24 28 59 400 56 700 152 300 1.14
4a CPDT 4 000:1:0.22 3 9 19 500 15 200 47 400 1.24
4b CPDT 4 000:1:0.22 6 12 25 900 18 100 49 300 1.08
4c CPDT 4 000:1:0.22 24 16 33 200 21 500 54 300 1.10
5a CPDT 4 000:1:0.4 3 10 22 600 22 300 58 500 1.09
5b CPDT 4 000:1:0.4 6 16 34 000 27 900 81 300 1.08
5c CPDT 4 000:1:0.4 24 26 56 200 39 900 113 600 1.14

49
Table 1 (continued).
Entrya RAFT
agent [M]0:[CTA]0:[I]0
Time
(hr)
Conv.b
(%)
Mn
(Theor.)c
Mn
(MALLS)d
Mn
(PMMA)e PDId
6a CPDT 4000:1:0.67 3 12 25 800 29 600 81 700 1.12
6b CPDT 4000:1:0.67 6 22 48 100 43 900 117 500 1.08
6c CPDT 4000:1:0.67 24 41 86 800 51 000 143 500 1.18
aPolymers synthesized in ethylene carbonate at 20 wt.% monomer concentration under a nitrogen atmosphere with V-501 as the initiator.
bConversions were determined by 1H-NMR spectroscopy recorded in DMSO-d6. cTheoretical number average molecular weights were
calculated according to the following equation: Mn = (ρ·MWmon·[M]0/[CTA]0) + MWCTA where ρ is the fractional monomer conversion,
MWmon is the molecular weight of the monomer, and MWCTA is the molecular weight of the CTA. dNumber average molecular weight
(Mn) as determined by SEC (0.5 mL/min, 60 °C, Polymer Labs PL gel 5 μm mixed-C column, DMF with 0.02 M LiBr eluent) equipped
with RI and MALLS detectors. eMn relative to PMMA standards.
Evident from Table 1, the polymerization of AN mediated by CTAs CPDT and
CEDT exhibited lower PDIs than the polymerizations mediated by CTSPA and CMDT.
Also, the conversions for entries 1-5 remained below 40% after 24 hr of polymerization.
It was found that conversion and molecular weight could be increased by more than 10%
at the expense of increasing PDI (Entry 6). Molecular weights were reported relative to
PMMA standards for comparison with literature reported values due to the issues of
performing SEC on PAN.72
Thus far, our efforts to achieve high molecular weight and low PDI PAN by
varying the CTA structure and [M]0:[CTA]0:[I]0 were unsatisfactory. It has been shown
that conversion and molecular weight of conventional solution polymerization of AN can
be increased by utilizing lower temperature polymerizations.82,128 Moreover, other issues
commonly associated with polymerization of acrylamides, such as broad PDIs, have been

50
addressed with low temperature RAFT polymerization.83,84 Therefore, we explored the
effects of lowering the reaction temperature on achieving high molecular weights while
maintaining low PDI.
RAFT Polymerizations of AN at 30 °C
The kinetic chain length, ν, is expressed as Rp/Rt, where Rp is the rate of
propagation and Rt is the rate of termination. Rp decreases with decreasing temperature,
however, Rt typically decreases at a much faster rate than Rp.129 This suggests that even
with a slower propagation, the termination and chain transfer events should be even
further reduced as illustrated in Figure 17.129
Figure 17. At higher temperatures polymer chains grow faster, but also have more chain
termination and branching events while at low temperatures chain termination and chain
branching are suppressed.
The polymerization temperature of 30 °C was selected based on the
decomposition temperature of the initiator, V-70, which has the same initiator efficiency
as V-501 at 70 °C. The RAFT polymerization conditions for AN at 30 °C were otherwise
analogous to those at 70 °C. The kinetic plots, polydispersity vs. conversion, and Mn vs.
conversion plots at [M]0:[CTA]0:[I]0 = 4,000:1:0.22 are shown in Figure 18(a-c).
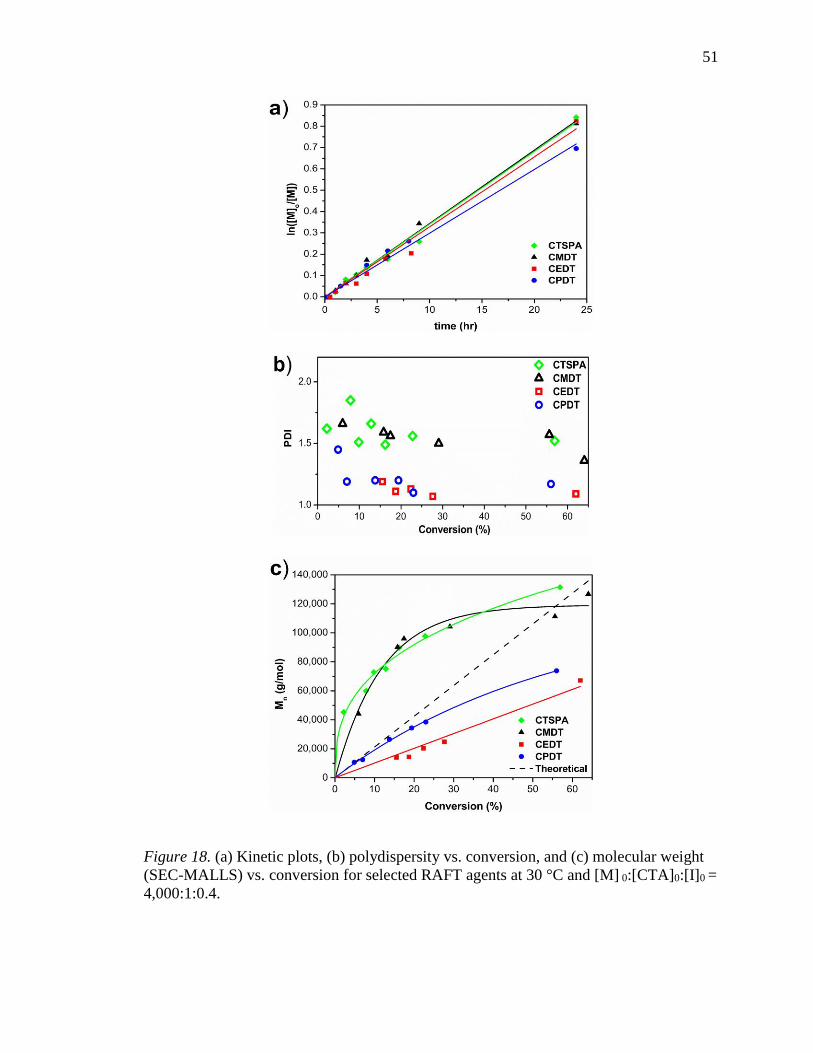
51
Figure 18. (a) Kinetic plots, (b) polydispersity vs. conversion, and (c) molecular weight
(SEC-MALLS) vs. conversion for selected RAFT agents at 30 °C and [M] 0:[CTA]0:[I]0 =
4,000:1:0.4.

52
As seen in Figure 18a, the kinetic plots for all CTAs exhibit a linear relationship,
which indicates a constant radical concentration, [P∙], throughout the duration of the
reaction. This suggests that chain termination reactions are reduced at 30 °C and that
monomer is still being consumed at long reaction times. Figures 18b and 18c are
consistent with the 70 °C results showing that CEDT and CPDT are the most effective
CTAs in controlling molecular weight and polydispersity. Most importantly, at 24 hr the
conversion reaches about 60% and molecular weight exceeds 60,000 g/mol at the given
[M]0:[CTA]0:[I]0. The RI traces for the CPDT-mediated polymerization of AN at 30 °C
are shown in Figure 19. SEC-RI traces are unimodal and continue to shift to lower elution
times with increasing conversion even for reaction times up to 24 hr. The CTAs and
[M]0:[CTA]0:[I]0 were varied the same as in Table 1 at 30 °C and the results are
summarized in Table 2.
Figure 19. RI traces for the polymerization of AN using CPDT at 30 °C with
[M]0:[CTA]0:[I]0 = 4,000:1:0.4.

53
Table 2
Conversion, Molecular Weight, and Polydispersity Data for the RAFT Polymerization of
AN Conducted at 30 °C
Entrya RAFT
agent [M]0:[CTA]0:[I]0
Time
(hr)
Conv.b
(%)
Mn
(Theor.)c
Mn
(MALLS)d
Mn
(PMMA)e PDId
7a CTSP
A
4 000:1:0.4 4 13 27 600 75 200 254 200 1.66
7b CTSP
A
4 000:1:0.4 6 16 34 000 89 700 273 700 1.49
7c CTSP
A
4 000:1:0.4 24 57 121 000 131 500 237 800 1.52
8a CMDT 4 000:1:0.4 4 16 33 600 90 200 309 500 1.59
8b CMDT 4 000:1:0.4 6 18 37 900 96 000 342 200 1.56
8c CMDT 4 000:1:0.4 24 64 136 200 126 600 318 070 1.36
9a CEDT 4 000:1:0.4 4 19 40 000 20 300 68 800 1.13
9b CEDT 4 000:1:0.4 6 28 59 000 24 900 54 600 1.07
9c CEDT 4 000:1:0.4 24 62 131 900 70 300 196 200 1.09
10a CPDT 4000:1:0.22 4 12 25 800 21 000 54 000 1.11
10b CPDT 4000:1:0.22 6 18 38 500 25 800 71 700 1.11
10c CPDT 4000:1:0.22 24 40 84 800 69 000 183 300 1.07
11a CPDT 4 000:1:0.4 4 14 29 300 27 700 69 000 1.47
11b CPDT 4 000:1:0.4 6 19 41 200 36 000 96 300 1.20
11c CPDT 4 000:1:0.4 24 57 121 300 73 900 201 900 1.17
12a CPDT 4000:1:0.67 4 19 41 100 34 400 93 600 1.08
12b CPDT 4000:1:0.67 6 24 50 900 43 300 128 100 1.11
12c CPDT 4000:1:0.67 24 63 134 200 84 800 301 500 1.24
aPolymers synthesized in ethylene carbonate at 20 wt.% monomer concentration under a nitrogen atmosphere with V-70 as the initiator.
bConversions were determined by 1H-NMR spectroscopy recorded in DMSO-d6. cTheoretical number average molecular weights were
calculated according to the following equation: Mn = (ρ·MWmon·[M]/[CTA]) + MWCTA where ρ is the fractional monomer conversion,
MWmon is the molecular weight of the monomer, and MWCTA is the molecular weight of the CTA. dNumber average molecular weight
(Mn) as determined by SEC (0.5 mL/min, 60 °C, Polymer Labs PL gel 5 μm mixed-C column, DMF with 0.02 M LiBr eluent) equipped
with RI and MALLS detectors. eMn relative to PMMA standards.
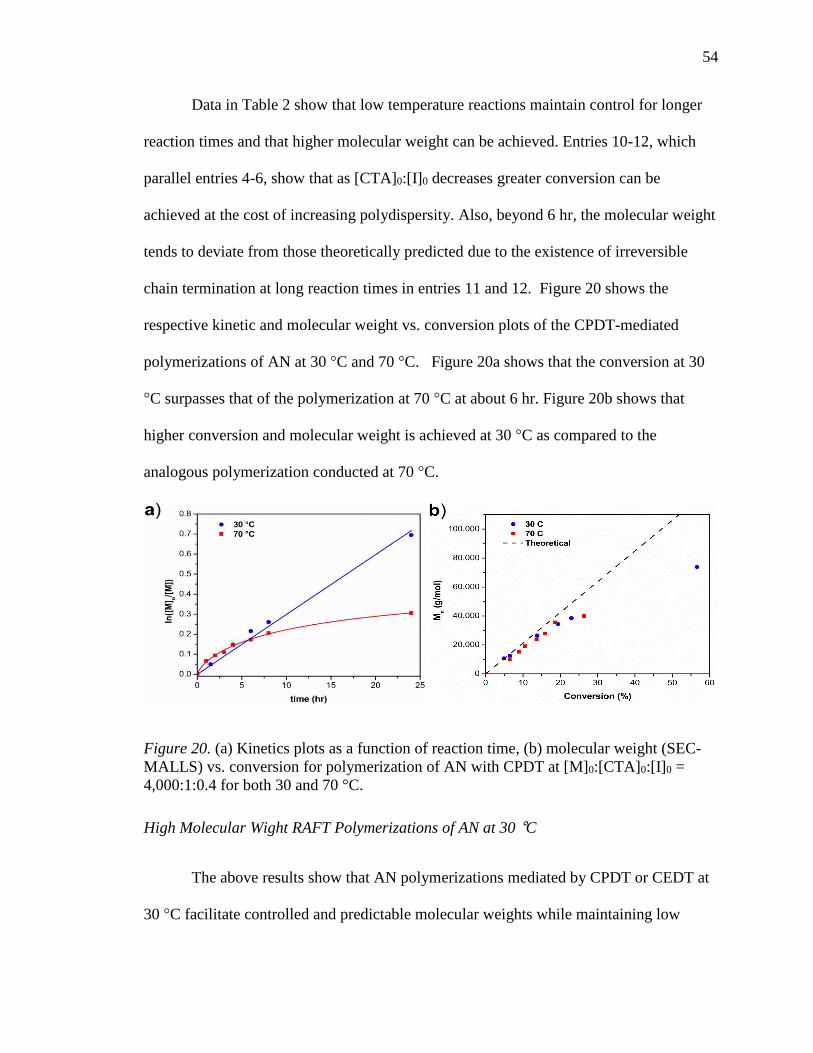
54
Data in Table 2 show that low temperature reactions maintain control for longer
reaction times and that higher molecular weight can be achieved. Entries 10-12, which
parallel entries 4-6, show that as [CTA]0:[I]0 decreases greater conversion can be
achieved at the cost of increasing polydispersity. Also, beyond 6 hr, the molecular weight
tends to deviate from those theoretically predicted due to the existence of irreversible
chain termination at long reaction times in entries 11 and 12. Figure 20 shows the
respective kinetic and molecular weight vs. conversion plots of the CPDT-mediated
polymerizations of AN at 30 °C and 70 °C. Figure 20a shows that the conversion at 30
°C surpasses that of the polymerization at 70 °C at about 6 hr. Figure 20b shows that
higher conversion and molecular weight is achieved at 30 °C as compared to the
analogous polymerization conducted at 70 °C.
Figure 20. (a) Kinetics plots as a function of reaction time, (b) molecular weight (SEC-
MALLS) vs. conversion for polymerization of AN with CPDT at [M]0:[CTA]0:[I]0 =
4,000:1:0.4 for both 30 and 70 °C.
High Molecular Wight RAFT Polymerizations of AN at 30 °C
The above results show that AN polymerizations mediated by CPDT or CEDT at
30 °C facilitate controlled and predictable molecular weights while maintaining low
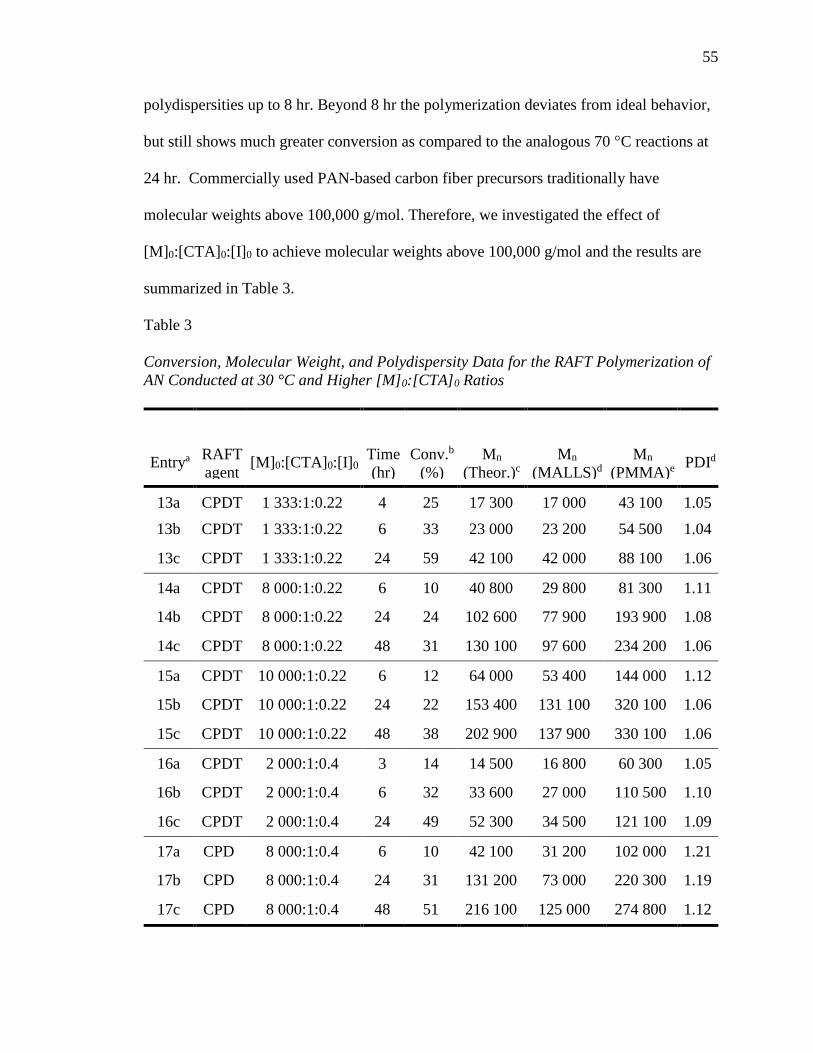
55
polydispersities up to 8 hr. Beyond 8 hr the polymerization deviates from ideal behavior,
but still shows much greater conversion as compared to the analogous 70 °C reactions at
24 hr. Commercially used PAN-based carbon fiber precursors traditionally have
molecular weights above 100,000 g/mol. Therefore, we investigated the effect of
[M]0:[CTA]0:[I]0 to achieve molecular weights above 100,000 g/mol and the results are
summarized in Table 3.
Table 3
Conversion, Molecular Weight, and Polydispersity Data for the RAFT Polymerization of
AN Conducted at 30 °C and Higher [M]0:[CTA]0 Ratios
Entrya RAFT
agent [M]0:[CTA]0:[I]0
Time
(hr)
Conv.b
(%)
Mn
(Theor.)c
Mn
(MALLS)d
Mn
(PMMA)e PDId
13a CPDT 1 333:1:0.22 4 25 17 300 17 000 43 100 1.05
13b CPDT 1 333:1:0.22 6 33 23 000 23 200 54 500 1.04
13c CPDT 1 333:1:0.22 24 59 42 100 42 000 88 100 1.06
14a CPDT 8 000:1:0.22 6 10 40 800 29 800 81 300 1.11
14b CPDT 8 000:1:0.22 24 24 102 600 77 900 193 900 1.08
14c CPDT 8 000:1:0.22 48 31 130 100 97 600 234 200 1.06
15a CPDT 10 000:1:0.22 6 12 64 000 53 400 144 000 1.12
15b CPDT 10 000:1:0.22 24 22 153 400 131 100 320 100 1.06
15c CPDT 10 000:1:0.22 48 38 202 900 137 900 330 100 1.06
16a CPDT 2 000:1:0.4 3 14 14 500 16 800 60 300 1.05
16b CPDT 2 000:1:0.4 6 32 33 600 27 000 110 500 1.10
16c CPDT 2 000:1:0.4 24 49 52 300 34 500 121 100 1.09
17a CPD
T
8 000:1:0.4 6 10 42 100 31 200 102 000 1.21
17b CPD
T
8 000:1:0.4 24 31 131 200 73 000 220 300 1.19
17c CPD
T
8 000:1:0.4 48 51 216 100 125 000 274 800 1.12
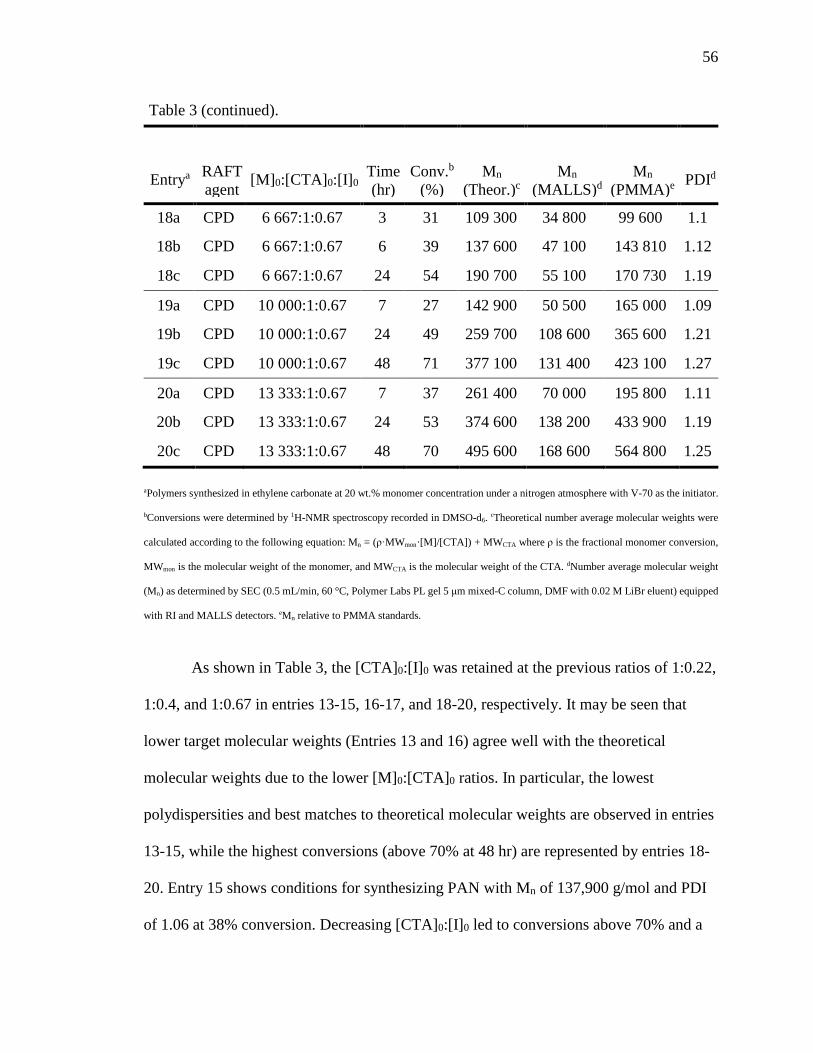
56
Table 3 (continued).
Entrya RAFT
agent [M]0:[CTA]0:[I]0
Time
(hr)
Conv.b
(%)
Mn
(Theor.)c
Mn
(MALLS)d
Mn
(PMMA)e PDId
18a CPD
T
6 667:1:0.67 3 31 109 300 34 800 99 600 1.1
18b CPD
T
6 667:1:0.67 6 39 137 600 47 100 143 810 1.12
18c CPD
T
6 667:1:0.67 24 54 190 700 55 100 170 730 1.19
19a CPD
T
10 000:1:0.67 7 27 142 900 50 500 165 000 1.09
19b CPD
T
10 000:1:0.67 24 49 259 700 108 600 365 600 1.21
19c CPD
T
10 000:1:0.67 48 71 377 100 131 400 423 100 1.27
20a CPD
T
13 333:1:0.67 7 37 261 400 70 000 195 800 1.11
20b CPD
T
13 333:1:0.67 24 53 374 600 138 200 433 900 1.19
20c CPD
T
13 333:1:0.67 48 70 495 600 168 600 564 800 1.25
aPolymers synthesized in ethylene carbonate at 20 wt.% monomer concentration under a nitrogen atmosphere with V-70 as the initiator.
bConversions were determined by 1H-NMR spectroscopy recorded in DMSO-d6. cTheoretical number average molecular weights were
calculated according to the following equation: Mn = (ρ·MWmon·[M]/[CTA]) + MWCTA where ρ is the fractional monomer conversion,
MWmon is the molecular weight of the monomer, and MWCTA is the molecular weight of the CTA. dNumber average molecular weight
(Mn) as determined by SEC (0.5 mL/min, 60 °C, Polymer Labs PL gel 5 μm mixed-C column, DMF with 0.02 M LiBr eluent) equipped
with RI and MALLS detectors. eMn relative to PMMA standards.
As shown in Table 3, the [CTA]0:[I]0 was retained at the previous ratios of 1:0.22,
1:0.4, and 1:0.67 in entries 13-15, 16-17, and 18-20, respectively. It may be seen that
lower target molecular weights (Entries 13 and 16) agree well with the theoretical
molecular weights due to the lower [M]0:[CTA]0 ratios. In particular, the lowest
polydispersities and best matches to theoretical molecular weights are observed in entries
13-15, while the highest conversions (above 70% at 48 hr) are represented by entries 18-
20. Entry 15 shows conditions for synthesizing PAN with Mn of 137,900 g/mol and PDI
of 1.06 at 38% conversion. Decreasing [CTA]0:[I]0 led to conversions above 70% and a

57
slight increase in PDI (1.27) with a similar Mn of 131,400 g/mol as seen in Entry 19.
These results demonstrate conditions for preparing high molecular weight and low PDI
PAN. As an example of these high [M]0:[CTA]0 polymerizations, the kinetic plot and
molecular weight vs. conversion plots are shown for entry 15 in Figure 21.
Figure 21. (a) Kinetics plots and (b) molecular weight and polydispersity (SEC-MALLS)
vs. conversion for polymerization of AN with CPDT at [M]0:[CTA]0:[I]0 = 10,000:1:0.22.
Figure 21a exhibits continued monomer conversion for up to 48 hr, which
suggests that radical concentration is preserved. Moreover, Figure 21b shows that ideal
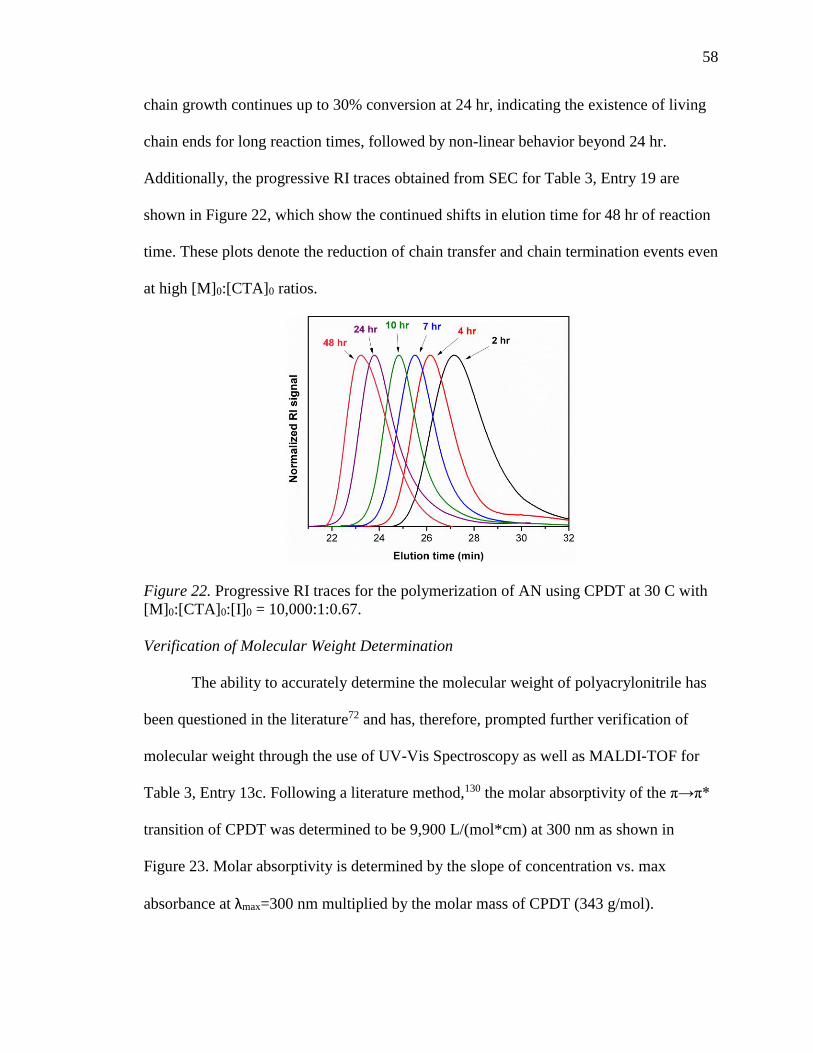
58
chain growth continues up to 30% conversion at 24 hr, indicating the existence of living
chain ends for long reaction times, followed by non-linear behavior beyond 24 hr.
Additionally, the progressive RI traces obtained from SEC for Table 3, Entry 19 are
shown in Figure 22, which show the continued shifts in elution time for 48 hr of reaction
time. These plots denote the reduction of chain transfer and chain termination events even
at high [M]0:[CTA]0 ratios.
Figure 22. Progressive RI traces for the polymerization of AN using CPDT at 30 C with
[M]0:[CTA]0:[I]0 = 10,000:1:0.67.
Verification of Molecular Weight Determination
The ability to accurately determine the molecular weight of polyacrylonitrile has
been questioned in the literature72 and has, therefore, prompted further verification of
molecular weight through the use of UV-Vis Spectroscopy as well as MALDI-TOF for
Table 3, Entry 13c. Following a literature method,130 the molar absorptivity of the π→π*
transition of CPDT was determined to be 9,900 L/(mol*cm) at 300 nm as shown in
Figure 23. Molar absorptivity is determined by the slope of concentration vs. max
absorbance at λmax=300 nm multiplied by the molar mass of CPDT (343 g/mol).
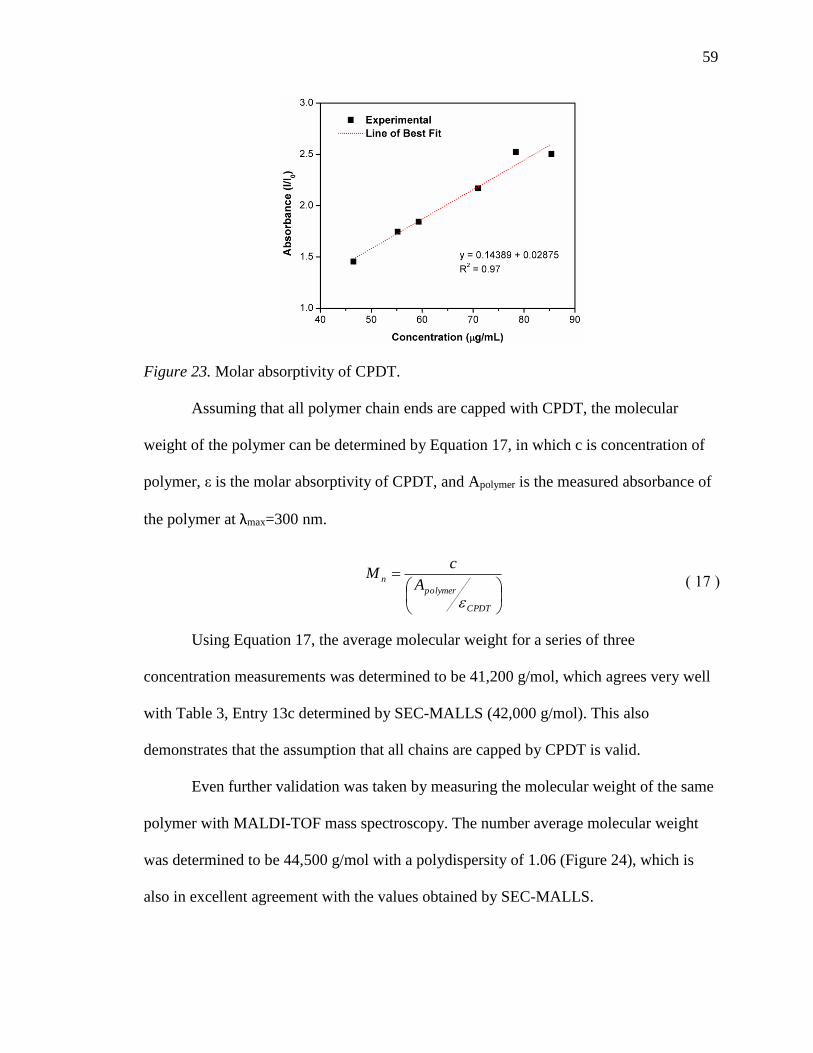
59
Figure 23. Molar absorptivity of CPDT.
Assuming that all polymer chain ends are capped with CPDT, the molecular
weight of the polymer can be determined by Equation 17, in which c is concentration of
polymer, ε is the molar absorptivity of CPDT, and Apolymer is the measured absorbance of
the polymer at λmax=300 nm.
CPDT
polymer
nA
cM
( 17 )
Using Equation 17, the average molecular weight for a series of three
concentration measurements was determined to be 41,200 g/mol, which agrees very well
with Table 3, Entry 13c determined by SEC-MALLS (42,000 g/mol). This also
demonstrates that the assumption that all chains are capped by CPDT is valid.
Even further validation was taken by measuring the molecular weight of the same
polymer with MALDI-TOF mass spectroscopy. The number average molecular weight
was determined to be 44,500 g/mol with a polydispersity of 1.06 (Figure 24), which is
also in excellent agreement with the values obtained by SEC-MALLS.
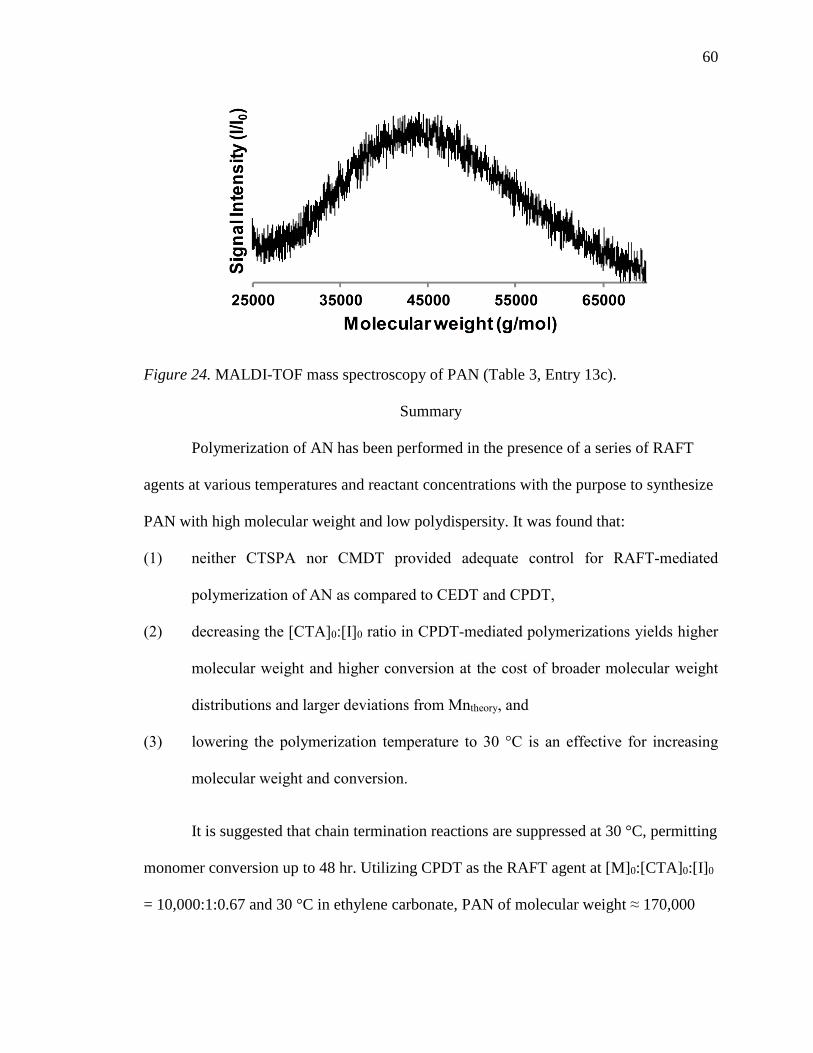
60
Figure 24. MALDI-TOF mass spectroscopy of PAN (Table 3, Entry 13c).
Summary
Polymerization of AN has been performed in the presence of a series of RAFT
agents at various temperatures and reactant concentrations with the purpose to synthesize
PAN with high molecular weight and low polydispersity. It was found that:
(1) neither CTSPA nor CMDT provided adequate control for RAFT-mediated
polymerization of AN as compared to CEDT and CPDT,
(2) decreasing the [CTA]0:[I]0 ratio in CPDT-mediated polymerizations yields higher
molecular weight and higher conversion at the cost of broader molecular weight
distributions and larger deviations from Mntheory, and
(3) lowering the polymerization temperature to 30 °C is an effective for increasing
molecular weight and conversion.
It is suggested that chain termination reactions are suppressed at 30 °C, permitting
monomer conversion up to 48 hr. Utilizing CPDT as the RAFT agent at [M]0:[CTA]0:[I]0
= 10,000:1:0.67 and 30 °C in ethylene carbonate, PAN of molecular weight ≈ 170,000

61
g/mol and Mw/Mn = 1.25 was obtained at 70% conversion. On the contrary, at
[M]0:[CTA]0:[I]0 = 10,000:1:0.22, PAN of molecular weight ≈ 137,000 g/mol and Mw/Mn
= 1.06 was obtained at 38% conversion.
62
CHAPTER IV
STABILIZATION OF POLYACRYLONITRILE: CONVENTIONAL FREE RADICAL
VERSUS CONTROLLED RAFT POLYMERIZATIONS
Abstract
Careful control of polyacrylonitrile (PAN) precursor properties and, in particular,
the polymerization method and ensuing molecular weight and molecular weight
distribution are important considerations for mitigating defects and enhancing
processability of carbon fibers. Herein, a comprehensive study was performed to
understand the influence of molecular weight, molecular weight distribution, and
polymerization method between reversible addition-fragmentation chain transfer (RAFT)
and conventional free radical (FR) solution polymerization on the cyclization behavior
and structural evolution of stabilized PAN. The kinetic parameters of activation energy
(Ea) and pre-exponential factor (A) were determined along with the cyclization index (CI)
by differential scanning calorimetry (DSC) and the extent of stabilization (Es) was
measured via fourier transform infrared spectroscopy (FTIR). Thermogravimetric
analysis (TGA) was used to determine the degradation differences in the polymers.
Structural characterization of graphitic content was determined by Raman spectroscopy
and crystallite properties and stabilization index (SI) by wide-angle X-ray scattering
(WAXS). Significantly, it was found that cyclization initiated at lower temperature as
well as proceeded at a more moderate pace for FR polymers as compared to RAFT
homopolymers.
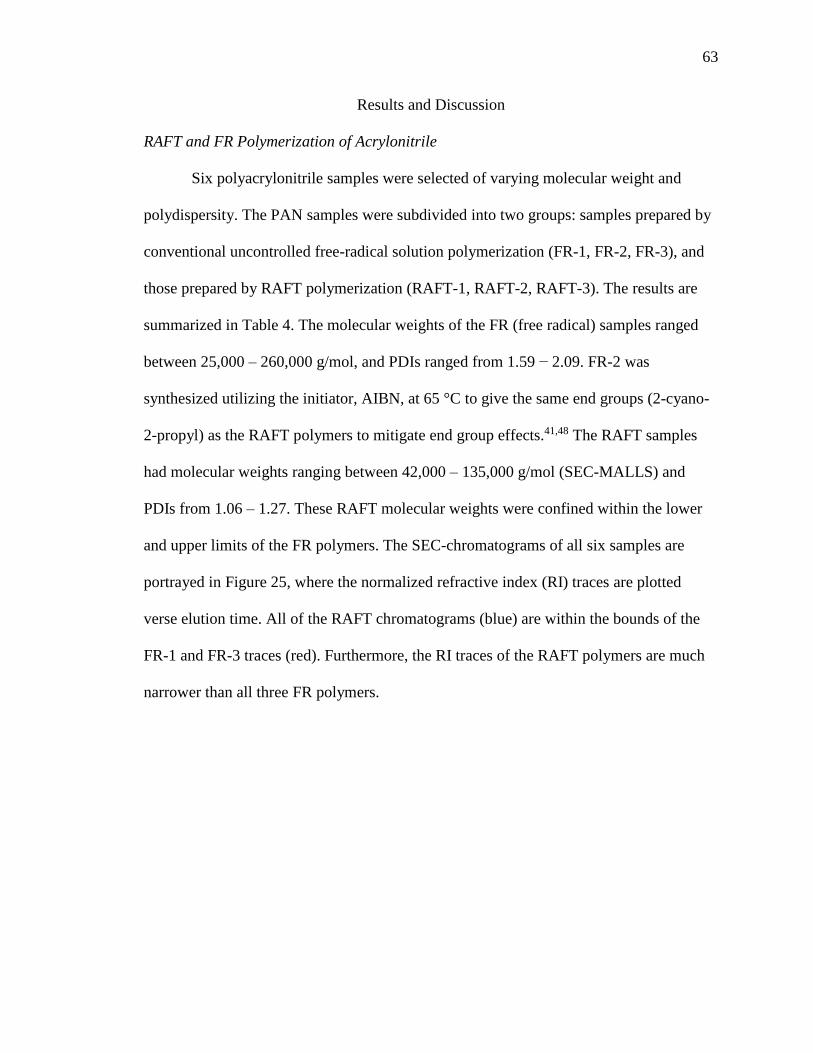
63
Results and Discussion
RAFT and FR Polymerization of Acrylonitrile
Six polyacrylonitrile samples were selected of varying molecular weight and
polydispersity. The PAN samples were subdivided into two groups: samples prepared by
conventional uncontrolled free-radical solution polymerization (FR-1, FR-2, FR-3), and
those prepared by RAFT polymerization (RAFT-1, RAFT-2, RAFT-3). The results are
summarized in Table 4. The molecular weights of the FR (free radical) samples ranged
between 25,000 – 260,000 g/mol, and PDIs ranged from 1.59 − 2.09. FR-2 was
synthesized utilizing the initiator, AIBN, at 65 °C to give the same end groups (2-cyano-
2-propyl) as the RAFT polymers to mitigate end group effects.41,48 The RAFT samples
had molecular weights ranging between 42,000 – 135,000 g/mol (SEC-MALLS) and
PDIs from 1.06 – 1.27. These RAFT molecular weights were confined within the lower
and upper limits of the FR polymers. The SEC-chromatograms of all six samples are
portrayed in Figure 25, where the normalized refractive index (RI) traces are plotted
verse elution time. All of the RAFT chromatograms (blue) are within the bounds of the
FR-1 and FR-3 traces (red). Furthermore, the RI traces of the RAFT polymers are much
narrower than all three FR polymers.
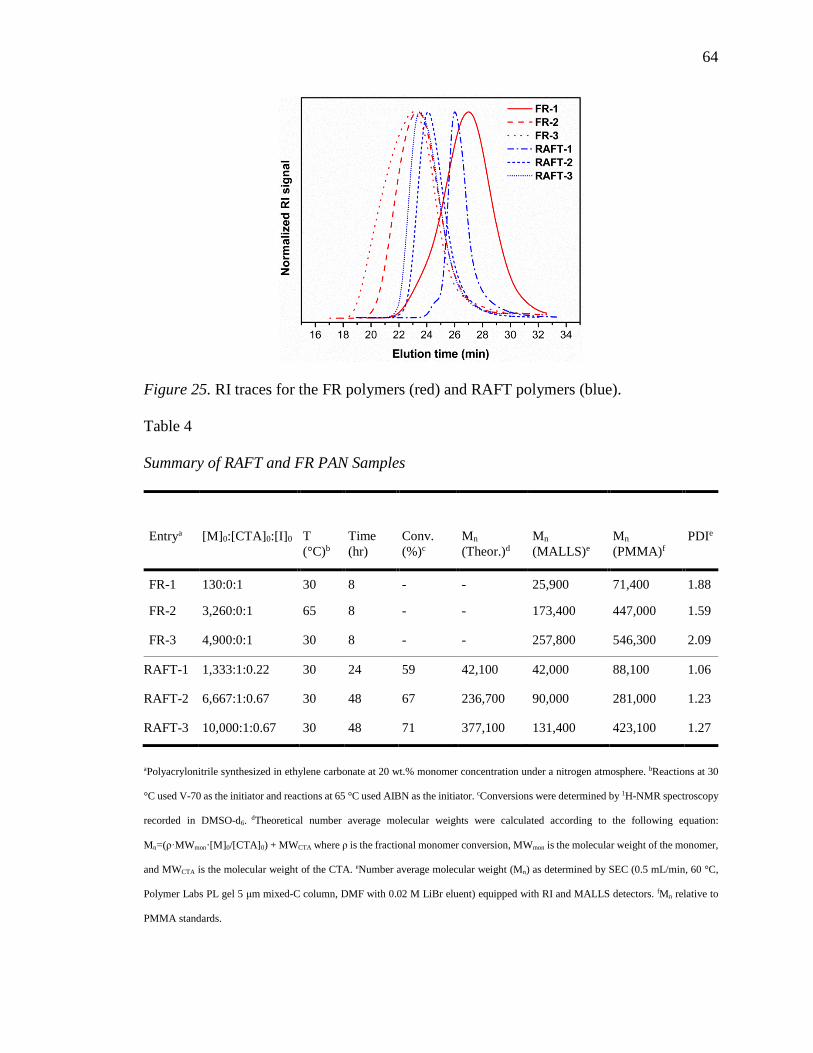
64
Figure 25. RI traces for the FR polymers (red) and RAFT polymers (blue).
Table 4
Summary of RAFT and FR PAN Samples
Entrya [M]0:[CTA]0:[I]0 T
(°C)b Time
(hr) Conv.
(%)c Mn
(Theor.)d Mn
(MALLS)e Mn
(PMMA)f PDIe
FR-1 130:0:1 30 8 - - 25,900 71,400 1.88
FR-2 3,260:0:1 65 8 - - 173,400 447,000 1.59
FR-3 4,900:0:1 30 8 - - 257,800 546,300 2.09
RAFT-1 1,333:1:0.22 30 24 59 42,100 42,000 88,100 1.06
RAFT-2 6,667:1:0.67 30 48 67 236,700 90,000 281,000 1.23
RAFT-3 10,000:1:0.67 30 48 71 377,100 131,400 423,100 1.27
aPolyacrylonitrile synthesized in ethylene carbonate at 20 wt.% monomer concentration under a nitrogen atmosphere. bReactions at 30
°C used V-70 as the initiator and reactions at 65 °C used AIBN as the initiator. cConversions were determined by 1H-NMR spectroscopy
recorded in DMSO-d6. dTheoretical number average molecular weights were calculated according to the following equation:
Mn=(ρ·MWmon·[M]0/[CTA]0) + MWCTA where ρ is the fractional monomer conversion, MWmon is the molecular weight of the monomer,
and MWCTA is the molecular weight of the CTA. eNumber average molecular weight (Mn) as determined by SEC (0.5 mL/min, 60 °C,
Polymer Labs PL gel 5 μm mixed-C column, DMF with 0.02 M LiBr eluent) equipped with RI and MALLS detectors. fMn relative to
PMMA standards.

65
To verify the molecular weight of the FR and RAFT polymers, we determined the
viscosity average molecular weight via intrinsic viscosity measurements (example shown
in Figure 26). The results are summarized in Table 5.
Figure 26. The intrinsic viscosity of RAFT-2 in DMF at 25 °C.
Table 5
Intrinsic Viscosity, [η], and Viscosity Average Molecular Weight, Mη, of RAFT and FR
PAN Homopolymers Determined by Ubbelohde Viscometer Method at 25 °C in DMF
Entry [η] (mL/g) Mη (g/mol)a
FR-1 63 35,700
FR-2 243 215,800
FR-3 500 563,500
RAFT-1 65 37,300
RAFT-2 172 136,300
RAFT-3 188 152,900
aViscosity average molecular weight was determined from the following equation: [η]=K ·Mηα where K and α are the Mark-Houwink
constants (K=0.0243 and α=0.75).
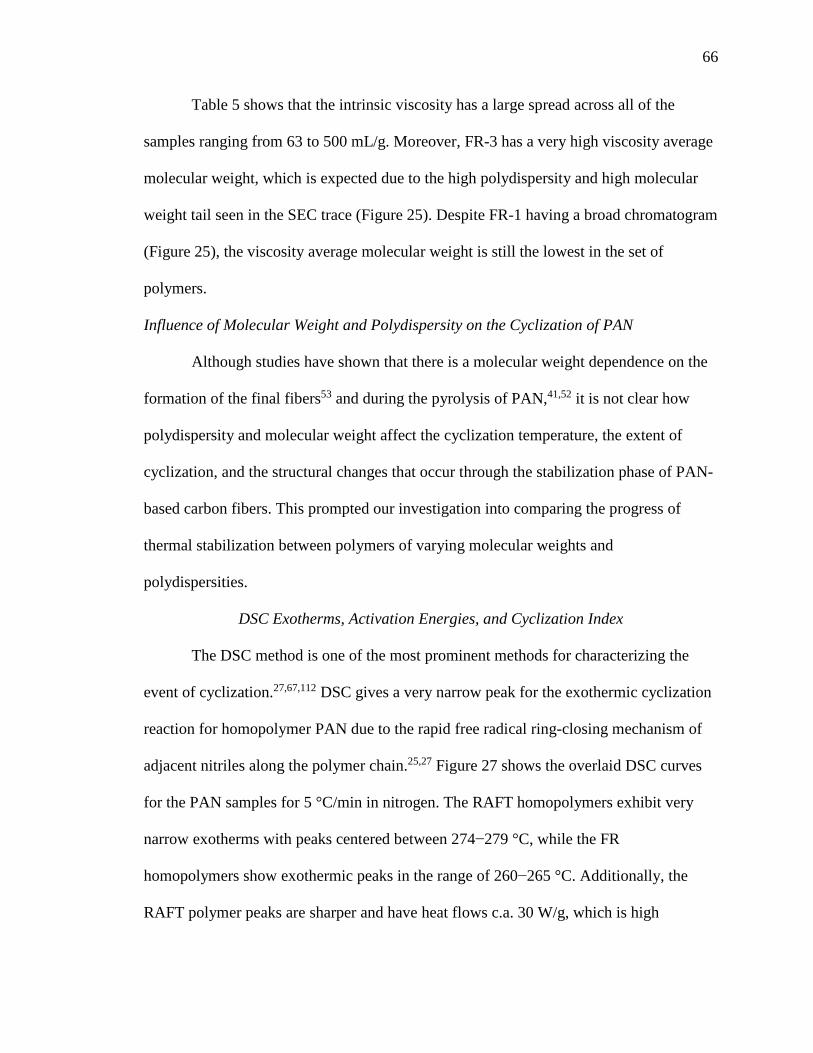
66
Table 5 shows that the intrinsic viscosity has a large spread across all of the
samples ranging from 63 to 500 mL/g. Moreover, FR-3 has a very high viscosity average
molecular weight, which is expected due to the high polydispersity and high molecular
weight tail seen in the SEC trace (Figure 25). Despite FR-1 having a broad chromatogram
(Figure 25), the viscosity average molecular weight is still the lowest in the set of
polymers.
Influence of Molecular Weight and Polydispersity on the Cyclization of PAN
Although studies have shown that there is a molecular weight dependence on the
formation of the final fibers53 and during the pyrolysis of PAN,41,52 it is not clear how
polydispersity and molecular weight affect the cyclization temperature, the extent of
cyclization, and the structural changes that occur through the stabilization phase of PAN-
based carbon fibers. This prompted our investigation into comparing the progress of
thermal stabilization between polymers of varying molecular weights and
polydispersities.
DSC Exotherms, Activation Energies, and Cyclization Index
The DSC method is one of the most prominent methods for characterizing the
event of cyclization.27,67,112 DSC gives a very narrow peak for the exothermic cyclization
reaction for homopolymer PAN due to the rapid free radical ring-closing mechanism of
adjacent nitriles along the polymer chain.25,27 Figure 27 shows the overlaid DSC curves
for the PAN samples for 5 °C/min in nitrogen. The RAFT homopolymers exhibit very
narrow exotherms with peaks centered between 274−279 °C, while the FR
homopolymers show exothermic peaks in the range of 260−265 °C. Additionally, the
RAFT polymer peaks are sharper and have heat flows c.a. 30 W/g, which is high
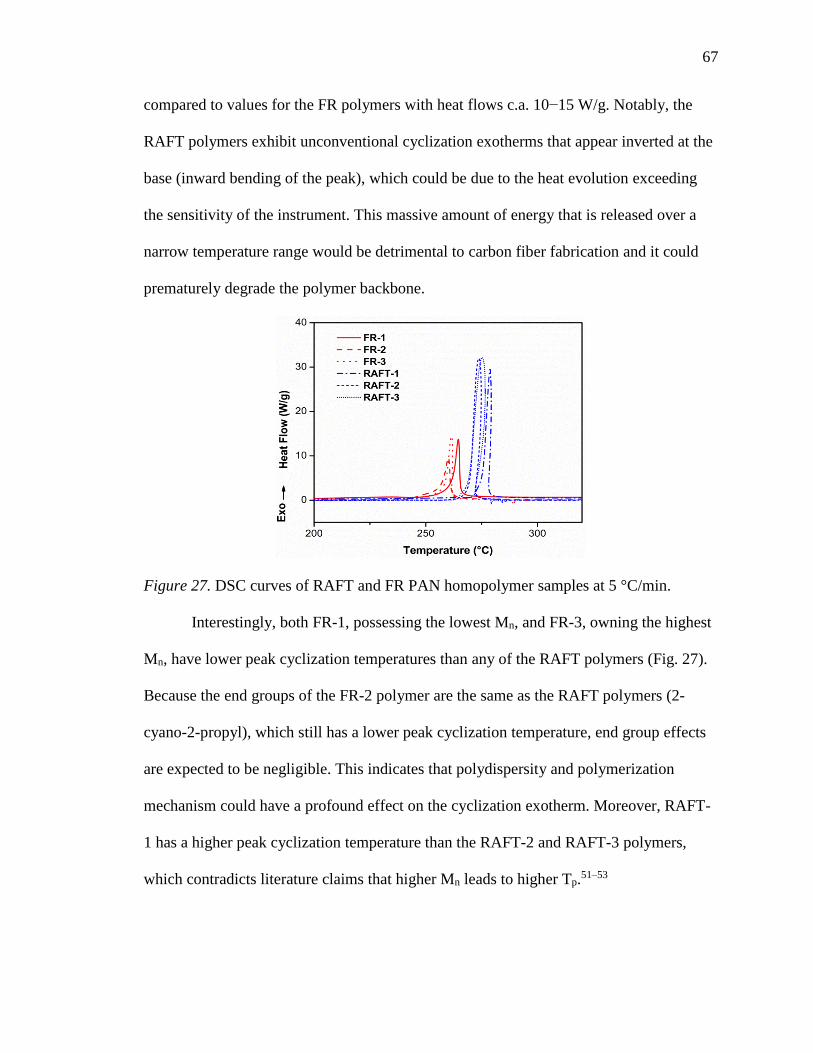
67
compared to values for the FR polymers with heat flows c.a. 10−15 W/g. Notably, the
RAFT polymers exhibit unconventional cyclization exotherms that appear inverted at the
base (inward bending of the peak), which could be due to the heat evolution exceeding
the sensitivity of the instrument. This massive amount of energy that is released over a
narrow temperature range would be detrimental to carbon fiber fabrication and it could
prematurely degrade the polymer backbone.
Figure 27. DSC curves of RAFT and FR PAN homopolymer samples at 5 °C/min.
Interestingly, both FR-1, possessing the lowest Mn, and FR-3, owning the highest
Mn, have lower peak cyclization temperatures than any of the RAFT polymers (Fig. 27).
Because the end groups of the FR-2 polymer are the same as the RAFT polymers (2-
cyano-2-propyl), which still has a lower peak cyclization temperature, end group effects
are expected to be negligible. This indicates that polydispersity and polymerization
mechanism could have a profound effect on the cyclization exotherm. Moreover, RAFT-
1 has a higher peak cyclization temperature than the RAFT-2 and RAFT-3 polymers,
which contradicts literature claims that higher Mn leads to higher Tp.51–53

68
To further examine this behavior, we determined the peak exotherm temperature
at several ramp rates (2, 5, 10, and 20 °C/min) (example in Figure 28) and the results are
listed in Table 6. The exotherm temperature increases with increasing ramp rate as shown
in Figure 28. We see that with increasing ramp rate the max heat flow increases. As
shown in Table 6, all peak exotherms are higher for the RAFT samples than the
analogous FR samples for a given ramp rate.
Figure 28. DSC curves for FR-3 at 2, 5, 10, and 20 °C/min.
Table 6
DSC Peak Maxima for RAFT and FR PAN Homopolymer Samples
Entry Peak Temperature (°C)
2 °C/min 5 °C/min 10 °C/min 20 °C/min
FR-1 252 265 272 286
FR-2 249 260 268 276
FR-3 257 261 278 289
RAFT-1 261 279 291 312
RAFT-2 262 274 288 310
RAFT-3 261 275 290 307

69
Applying the Ozawa and Kissinger equations, we can obtain activation energy.
The Ozawa and Kissinger plots are shown in Figure 29.
Figure 29. Plots of 1000/Tp vs. (a) ln(φ) according to the Ozawa method and (b) ln(φ/Tp2)
according to the Kissinger method.
Shown in Figure 29 the Ozawa and Kissinger slopes are steeper for the FR
polymers than the RAFT polymers. Yet, all of the fits for the RAFT polymers are shifted
to the left due to higher peak temperatures. The activation energies and pre-exponential
factors are compiled in Table 7 along with the summarized data from the 5 °C/min ramp
rate.

70
Table 7
Activation Energies of RAFT and FR PAN Homopolymers
Ozawa Methoda Kissinger Methodb 5 °C/min
Entry Ea (kJ/mol) A (sec-1) Ea (kJ/mol) A (sec-1) Tpc (°C)
Tp
Breadthd
(°C)
Intensitye
(J/g) Heat
Flowf
(W/g)
FR-1 158.3 1.32x10¹³ 157.6 1.11x10¹³ 265 15 512 13.5
FR-2 196.0 1.10x10¹⁷ 197.3 1.47x10¹⁷ 260 19 671 9.6
FR-3 150.6 2.76x10¹² 149.3 2.07x10¹² 261 13 589 13.7
RAFT-1 114.8 2.78x10⁸ 111.5 1.31x10⁸ 279 7 563 29.4
RAFT-2 115.9 4.59x10⁸ 112.7 2.18x10⁸ 274 6 591 31.9
RAFT-3 121.1 1.39x10⁹ 118.2 7.10x10⁸ 275 9 531 32.1
aActivation energy determined from Ozawa method. bActivation energy determined by Kissinger method. cThe peak exotherm
temperature was determined as the temperature with the maximum heat flow via DSC. dThe peak exotherm breadth was determined by
the onset and end of the peak exotherm temperature. eThe intensity was calculated by the integral area under the peak exotherm. fThe
heat flow was taken as the maximum heat flow at the peak temperature.
As shown in Table 7, the activation energies of the three polymers prepared by
RAFT polymerization are lower than the respective FR polymers. The exotherm
intensities for all six samples are similar. Interestingly, the collision frequency (A) is 4−9
orders of magnitude higher in the case of the polymers prepared by conventional free
radical polymerization. We can rationalize that FR polymers have more defect sites and
impurities from residual polymerization products that provide more opportunities for
cyclization to occur.7 Also, the frequency factor increases in order of molecular weight
for the RAFT polymers, which suggests that high molecular weight PAN has an

71
increased statistical probability of nitriles sterically orienting. Moreover, the RAFT
polymers exhibit peak breadths ranging from 6−9 °C compared to the FR polymers with
peak breadths between 13−19 °C. This could be directly related to the lower activation
energy of the RAFT polymers. We can reason that a low PDI with fewer impurities leads
to all of the chains initiating cyclization simultaneously. In general, the higher the A-
value then the lower the peak exotherm temperature, but the higher the Ea the broader the
exotherm for homopolymer PAN.
In-situ FTIR Analysis of Extent of Stabilization
Real-time FTIR spectra were recorded in a heating cell at 225 °C for 5 hours as
shown in Figure 30. The stabilization temperature of 225 °C was selected to be below the
peak exotherm temperature in order to observe quantitative differences in cyclization
rate. In general, stabilization leads to a decreased intensity of the narrow band at 2240
cm-1 related to the nitrile stretching and an increased intensity of the broad band centered
around 1590 cm-1 corresponding to vibrations of –C=C– and –C=N– linkages in the
aromatic rings.25,32,67 The other band assignments are as follows: 1452 cm-1 from the
polymer backbone (–CH2– bend), 1672 cm-1 due to oxygen uptake (–C=O– stretch) or
termination by disproportionation (–C=C– stretch), 2939 cm-1 from the polymer
backbone (–CH2– stretch), 3212 and 3360 cm-1 due to tautomerization and isomerization
of the imine into enamine and hanging amines41 (–NH– stretch). Additionally, a small
peak at about 2220 cm-1 forms, which could be due to the isomerization of the ladder
structure or dehydrogenation resulting in α,β-unsaturated nitrile groups.25,32 The noise c.a.
2300 cm-1 is presumed to be from carbon dioxide in the background.

72
Figure 30. FTIR spectra of FR-2 heated at 225 °C for 5 hr in nitrogen (left) and zoomed
in around 2240 and 1590 cm-1 (right). Times shown are with respect to post ramp to 225
°C at 5 °C/min.
The real-time FTIR spectra for the other samples are shown in Figure 31. Evident
from Figures 30, 31a, and 31b, the FR homopolymers exhibit the peak resembling imine
structure after 30 min, while this peak appears in the RAFT polymers after 1−2 hr
(Figures 31c-e). Furthermore, the FR-1 and FR-2 polymers have strong signals c.a. 3200
cm-1, resembling amine and alcohol formation, which are almost absent in the RAFT
polymers. The integrated signals for the nitrile and imine were recorded and the plots for
the determined unreacted nitrile content and Es are shown in Figure 32. In accordance
with the DSC results, the FR polymers begin cyclization prior to the RAFT polymers and
reach a greater extent of stabilization at 225 °C over the course of 5 hours as seen in
Figure 32. Specifically, RAFT-1 does not begin conversion of nitrile groups until about
45 min of heat treatment (Fig. 32a), while the FR polymers exhibit the greatest nitrile
conversions. Interestingly, FR-1 shows that Es increases quickly, but then seems to level
off over time (Fig. 32b). This could be due to the low molecular weight, but high PDI, of
this polymer, which could cause a slope change due to unequal reactivity of the varying
polymer chain sizes.

73
Figure 31. Real-time FTIR spectra recorded at 225 °C for 5 hr in nitrogen for (a) FR-1,
(b) FR-3, (c) RAFT-1, (d) RAFT-2, and (e) RAFT-3 (dotted lines represent IR bands for
nitrile (2240 cm-1) and imine (1590 cm-1) functionalities).
Figure 32. (a) Real-time unreacted nitrile content and (b) extent of stabilization as a
function of reaction time at 225 °C in N2.
TGA Analysis of Untreated and Pre-oxidized Polymers
The TGA plots for untreated and the simulated pre-oxidation stages are shown in
Figures 33a and 33b, respectively. The TGA plots can be divided into several parts:
74
(1) The plateau between 200−270 °C represents the cyclization period which
forms the ladder structure and should have minimal weight loss.27
(2) Rapid weight loss between 270−300 °C due to dehydrogenation and the heat
liberated from the cyclization, which is accompanied by release of small
volatiles.23
(3) Steady weight loss between 300−450 °C due to removal of small impurities as
volatile by-products that were residuals from the cyclized ladder structure
such as methane, ammonia, hydrogen cyanide, water, and carbon dioxide.7
(4) The plateau between 450−600 °C, which encompasses the stabilized structure
before further release of hydrogen cyanide, nitrogen, and hydrogen through
carbonization.41
Figure 33. TGA plots of (a) untreated PAN polymers ramped at 10 °C/min to 600 °C in
N2 and (b) polymers ramped at 10 °C/min in air and held at isotherms of 230, 245, 253,
and 265 °C for 15 min each and then ramped at 10 °C/min to 600 °C in N2.
Apparent in Figure 33a, the FR polymers begin weight loss (c.a. 270 °C) before
the RAFT polymers (c.a. 280 °C). Furthermore, the rapid weight loss between 270−300
°C of the RAFT polymers is steeper (> 20% mass loss) due to the greater heat flow

75
generated during cyclization as compared to the more gradual slope change of the FR
polymers, especially FR-3. The final plateaus (450−600 °C) coincide with the order of
molecular weight, which may suggest that higher molecular weights lead to greater
residual mass. Figure 33b demonstrates that a pre-oxidation treatment greatly increases
stability of the ladder structures and minimizes rapid mass loss post cyclization, while
nearly eliminating the effect of molecular weight.
Oxidative Stabilization and Structural Changes With Respect to Molecular Weight and
Polydispersity
To complement the differences in thermal cyclization and degradation we
investigated the structural changes that occur through oxidation of these polymers by heat
treating them at 225 °C in air for 30 min and for 5 hr. The degree of cyclization was
determined via the cyclization index (CI) by DSC.
Cyclization Index (CI) via DSC
Figure 34. DSC curves of pre-oxidized PAN treated at 225 °C in air for 30 min and 5 hr
(a) FR-2 and (b) RAFT-2.

76
Figure 34 shows an example of the DSC curves of the heat treated polymers. The
exotherm peaks shift to a higher temperature indicating a higher degree of stability in the
polymer architecture with a longer pre-oxidation time. The cyclization reaction is mostly
completed by 5 hr at 225 °C noted by the significant decline in exotherm intensity. The
CI was determined for each polymer at 30 min and 5 hr and the results are summarized in
Table 8. The CI is consistent with the previous data showing that cyclization progresses
more at 225 °C for the FR polymers. After 30 min of oxidation at 225 °C, FR polymers
reach 15-20% completion of cyclization, while RAFT polymers reach only 5-10%
completion.
Table 8
Cyclization Index (CI) of RAFT and FR Homopolymers as a Function of Time at 225 °C
in air
Entry CI (%)
30 min 5 hr
FR-1 18.5 88.6
FR-2 20.1 81.5
FR-3 16.0 87.8
RAFT-1 6.7 62.2
RAFT-2 8.1 63.1
RAFT-3 8.5 75.0
CI = 100*(Hv-Ho)/Hv, where Hv is the exotherm intensity of the untreated virgin polymer and Ho is the intensity of the pre-oxidized
polymer.

77
Raman D/G Ratios and Lateral Crystal Size
An example of the Raman spectra of FR-2 heat treated at 225 °C for 30 min and 5
hr in air along with the sample recovered from TGA analysis ramped to 800 °C in N2 for
FR-2 is depicted in Figure 35.
Figure 35. Raman spectra of FR-2 polymer heat treated in air at 225 °C for 30 min and 5
hr and also ramped to 800 °C in N2.
The band located c.a. 1600 cm-1 presents a main first order sp2-hybridized C−C
stretching mode (G mode, E2g2) while the band c.a. 1350 cm-1 is due to less ordered or
“defect induced” carbonaceous material (D mode).115–117 This D mode band is probably
due to carbon atoms in the immediate vicinity to the edge of a graphene layer or other
lattice disturbances.131 It is well known that the ratio between the intensity of the D-band
and the G-band is indicative of the degree of graphitization and alignment of the graphitic
planes, where the lower the ratio then the higher the amount of order in the
structure.116,117 In Figure 35, it is seen that the G-band increases relative to the D-band
from 30 min to 5 hr and then further when ramped to 800 °C. The ID/IG ratios of all the
polymer samples are shown in Figure 36.

78
Figure 36. Relative intensity (D-band/G-band) for Raman spectra of PAN polymers
treated to 225 °C in air for 30 min and for 5 hr and also ramped to 800 °C in N2. Error
bars represent one standard deviation from the mean of 5 spots measured and are
estimates of the uncertainty of the measurement.
From Figure 36, the greatest contrast between the D/G intensities of RAFT and
FR polymers is after 30 min of heat treatment at 225 °C, but for 5 hr at 225 °C and after a
ramp to 800 °C the ID/IG ratio seems to converge at a common value of about 1.15.
Knight and White developed an empirical formula that relates this ratio to the crystalline
domain size, La, of graphite (Chapter II, Equation 12).115 The ID/IG ratios and determined
La values are summarized in Table 8. The domain size is larger for the FR polymers after
30 min at 225 °C, but then all of the polymers meet at about 3.80 nm when ramped to 800
°C. This indicates that the FR polymers begin forming ordered graphitic structure before
the RAFT polymers, but ultimately the polymers reach a common structure of similar
size given the polymers are all polyacrylonitrile homopolymers.

79
Table 9
Relative Intensities of D-band to G-band and Crystalline Domain Size (La (nm) =
4.4/(ID/IG)) Determined at Various heat Treatment Conditions
Entry 30 min at 225 °C in air 5 hr at 225 °C in air Ramp to 800 °C in N2
ID/IG La (nm) ID/IG La (nm) ID/IG La (nm)
FR-1 1.51 2.91 1.26 3.49 1.14 3.86
FR-2 1.44 3.06 1.29 3.41 1.13 3.89
FR-3 1.56 2.82 1.32 3.33 1.18 3.73
RAFT-1 1.61 2.75 1.44 3.06 1.14 3.86
RAFT-2 1.90 2.32 1.41 3.12 1.15 3.83
RAFT-3 1.79 2.46 1.50 2.93 1.16 3.79
WAXS Diffraction Patterns and Crystallite Properties
The structural differences were also characterized by WAXS as shown in Figure
37. Remarkably, there are no evident structural differences between the untreated
polymers despite the vastly different stabilization characteristics. Apparent in Figure 37,
after 30 min of oxidation treatment, the peak c.a. 2θ = 17° (100) becomes more
pronounced as compared to the untreated polymers. In addition a new band appears,
which is attributed to the (110) planes.31 Sharper bands and the formation of new bands
with heat treatment are not uncommon in the literature.24,32,33 This phenomenon is a result
of thermal relaxation and an increase in flexibility of the molecular chain and a
consequent orientation of polymer chains into a higher crystalline order.33 Most obvious
from Figure 37 are the differences between the samples at 5 hr of pre-oxidation
treatment, which show that the scattering patterns in the FR samples become much more
diffuse, especially for FR-1 and FR-2.

80
Figure 37. WAXS patterns for PAN samples at given heat treatment conditions in air.
Examples of the 2θ vs. intensity plots for FR-2 and RAFT-2 are demonstrated in
Figure 38. From Figure 38, the formation of the new (110) band appears c.a. 2θ = 29°
peak after 30 min. After 5 hr, a broad halo appears between 15−30° after 5 hr, for the FR-
2 polymer (Figure 38a) indicating amorphitization of the crystal structure.
Figure 38. 2θ vs. intensity of (a) RAFT-2 and (b) FR-2 at 225 °C in air for various times.
The crystallite thicknesses, Lc, stabilization indices, SI, and crystallinities, χc, of
each polymer sample are compiled in Table 10. The Lc for all samples increases after 30
min of oxidation treatment, while the SI is shown to decrease after 30 min of heat

81
treatment. After 5 hr of oxidation at 225 °C, the Lc then decreases and the SI increases
dramatically, especially for FR polymers. Noted in Table 10, the FR polymers reach a
higher SI than the analogous RAFT polymers, consistent with thermal characterization.
Table 10
WAXS Data Summarized for RAFT and FR PAN Homopolymer Samples
Entry Untreated 30 min at 225 °C in air 5 hr at 225 °C in air
χc (%) Lc (nm) χc (%) Lc (nm) SI (%) χc (%) Lc (nm) SI (%)
FR-1 37.6 3.58 24.2 5.97 -27.4 10.5 2.48 53.3
FR-2 44.4 3.91 28.6 5.89 -33.1 18.2
3.80 39.8
FR-3 32.3 4.41 32.7 6.45 -4.64 21.1 5.28 27.9
RAFT-1 37.6 4.82 38.1 6.95 -25.7 23.4 5.66 19.4
RAFT-2 44.0 3.83 43.9 6.46 -28.1 29.0 5.66 -6.2
RAFT-3 34.3 3.67 33.0 6.26 -26.8 30.4 4.46 25.7
Summary
We have demonstrated the difference between stabilization behavior of PAN
homopolymers produced by conventional free radical polymerization and those by
controlled RAFT polymerization. Polymerization mechanism along with polydispersity
have apparent effects on both the onset and extent of cyclization in PAN. It appears that
narrow polydispersities via RAFT polymerization lead to (1) higher exotherm
temperatures, (2) faster liberation of heat released during the cyclization exotherm, and
(3) lower activation energy with narrow windows for cyclization. The initiation
temperature of cyclization for homopolymers strongly correlates to collision frequency
(A), with FR homopolymers having higher probability for cyclization to occur due to
82
more defects and radical sources. Meanwhile, RAFT homopolymers have lower
activation energies, which leads to narrower exotherm temperatures and greater evolution
of heat that prematurely degrades the polymers. The WAXS results complement these
thermal differences with greater stabilization indices and reduced crystallinities seen in
the FR polymers as compared to RAFT polymers post oxidation at 225 °C in air. These
findings will be useful when designing precursors for next generation carbon fibers with
RAFT polymerization methods.

83
CHAPTER V
AN INVESTIGATION OF N-ISOPROPYLACRLYAMIDE CONTAINING PAN-
COPOLYMERS AND THE STABILIZATION BEHAVIOR OF PAN-BASED RAFT
COPOLYMERS
Abstract
The viability of N-isopropylacrylamide (NIPAM) as a novel comonomer for
PAN-based precursors has been demonstrated. As compared to traditional comonomers
such as acrylic acid (AA), NIPAM-containing PAN copolymers reveal a similar extent of
stabilization and residual nitrile fraction through thermal Fourier transform infrared
(FTIR) spectroscopy studies. Differential scanning calorimetry (DSC) of NIPAM-
containing PAN copolymers exhibit monomodal exothermic peaks related to cyclization,
which are broad and reduced as compared to homopolymer PAN. Meanwhile, NIPAM as
a comonomer offers structural benefits similar to that of methacrylate (MA) and methyl
methacrylate (MMA), which disrupts the crystalline packing of PAN and should provide
better polymer processing for solubility, spinnability, and drawability as shown through
Raman spectroscopy and wide-angle X-ray scattering (WAXS).
This study is the first to demonstrate a route to preparing high molecular weight,
controlled PAN-based copolymers via reversible addition-fragmentation chain transfer
(RAFT) polymerization with molecular weights exceeding 165,000 g/mol (SEC-
MALLS) and polydispersity (Mw/Mn) < 1.35. The thermo-oxidative stabilization of
these high molecular weight, narrow polydispersity PAN-based RAFT copolymers are
extensively studied. Selected RAFT copolymers significantly show an increase in mass
retention during thermo-oxidative stabilization as compared to conventional free radical
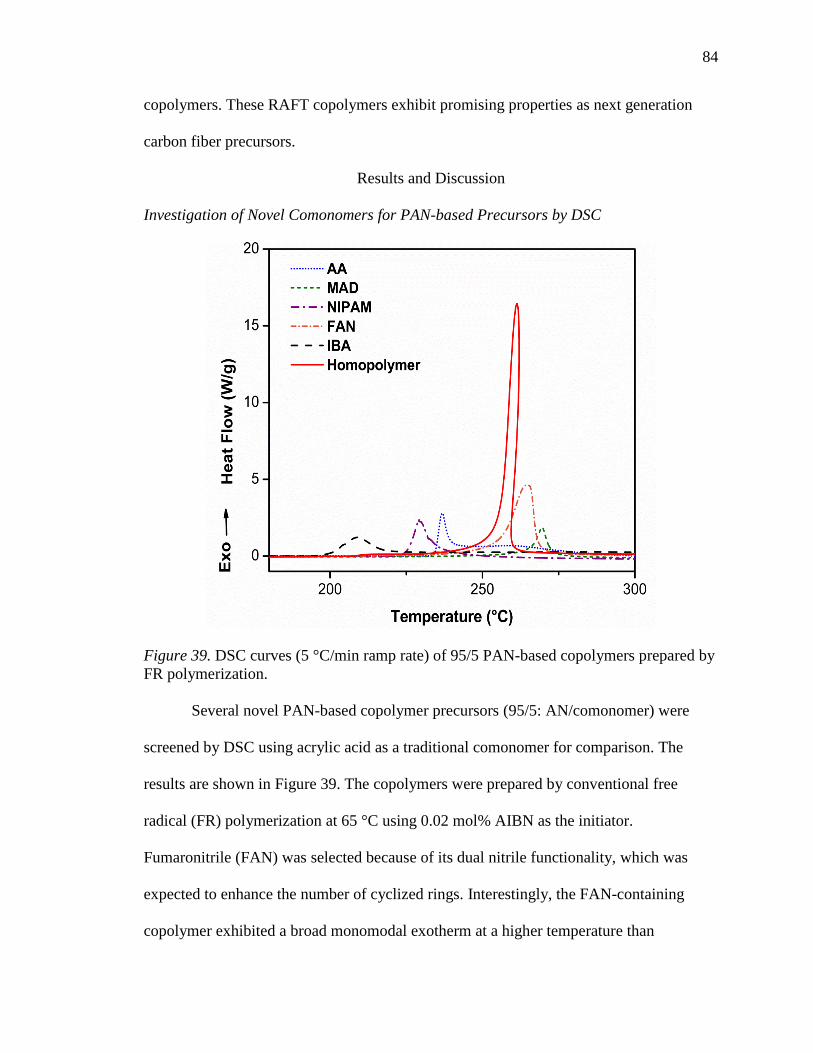
84
copolymers. These RAFT copolymers exhibit promising properties as next generation
carbon fiber precursors.
Results and Discussion
Investigation of Novel Comonomers for PAN-based Precursors by DSC
Figure 39. DSC curves (5 °C/min ramp rate) of 95/5 PAN-based copolymers prepared by
FR polymerization.
Several novel PAN-based copolymer precursors (95/5: AN/comonomer) were
screened by DSC using acrylic acid as a traditional comonomer for comparison. The
results are shown in Figure 39. The copolymers were prepared by conventional free
radical (FR) polymerization at 65 °C using 0.02 mol% AIBN as the initiator.
Fumaronitrile (FAN) was selected because of its dual nitrile functionality, which was
expected to enhance the number of cyclized rings. Interestingly, the FAN-containing
copolymer exhibited a broad monomodal exotherm at a higher temperature than

85
homopolymer, which suggests that cyclization is inhibited relative to homopolymer. This
could be caused by an increase in polarity of the nitrile groups and hydrogen bonding
between chains, which further stabilizes the semi-crystalline structure.132 Maleic
anhydride (MAD) was chosen on the basis that the anhydride would hydrolyze forming
two acid moieties similar to that of itaconic acid, which is a common comonomer in the
literature.25,26 The 95/5 MAD-copolymer also showed an unexpected temperature
increase in the cyclization exotherm, perhaps due to favoring the anhydride form over the
maleic acid form.
The only two copolymers to exhibit lower cyclization temperatures as compared
to the AA-containing copolymer were those containing isobornyl acrylate (IBA) and n-
isopropylacrylamide (NIPAM). It was expected that the isorbornyl acrylate with a very
bulky side group would increase the cyclization temperature, similar to other bulky
comonomers like methyl acrylate, which disrupts the crystalline packing and means for
free radical cyclization to occur.114,133 However, it is possible that IBA can provide chain
flexibility, allowing parallelization between chains.134 Also, IBA should increase the
amorphous content providing ease for diffusion of oxygen into the less dense regions of
the polymer, thus allowing oxidation to promote cyclization.7,31,57 Nonetheless, at 5 mol%
IBA, the reduction in exothermic peak intensity is dramatic and the extent of cyclization
was assumed to be negatively impacted by such a bulky comonomer.
On the other hand, NIPAM also lowered the peak exotherm temperature without
compromising the peak intensity presumably because of its ability to initiate ionic
cyclization by the amide group (Scheme 8). Moreover, NIPAM is a promising
comonomer selection because of its bulkiness to improve plasticity of the PAN precursor.
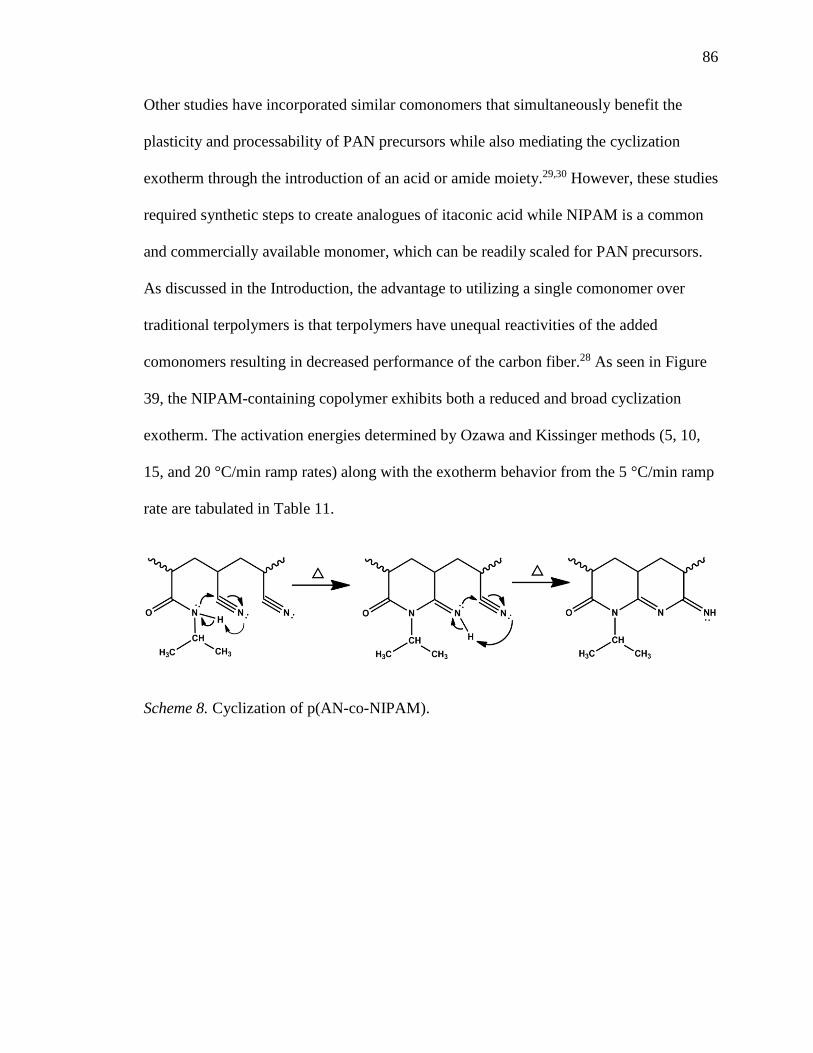
86
Other studies have incorporated similar comonomers that simultaneously benefit the
plasticity and processability of PAN precursors while also mediating the cyclization
exotherm through the introduction of an acid or amide moiety.29,30 However, these studies
required synthetic steps to create analogues of itaconic acid while NIPAM is a common
and commercially available monomer, which can be readily scaled for PAN precursors.
As discussed in the Introduction, the advantage to utilizing a single comonomer over
traditional terpolymers is that terpolymers have unequal reactivities of the added
comonomers resulting in decreased performance of the carbon fiber.28 As seen in Figure
39, the NIPAM-containing copolymer exhibits both a reduced and broad cyclization
exotherm. The activation energies determined by Ozawa and Kissinger methods (5, 10,
15, and 20 °C/min ramp rates) along with the exotherm behavior from the 5 °C/min ramp
rate are tabulated in Table 11.
Scheme 8. Cyclization of p(AN-co-NIPAM).
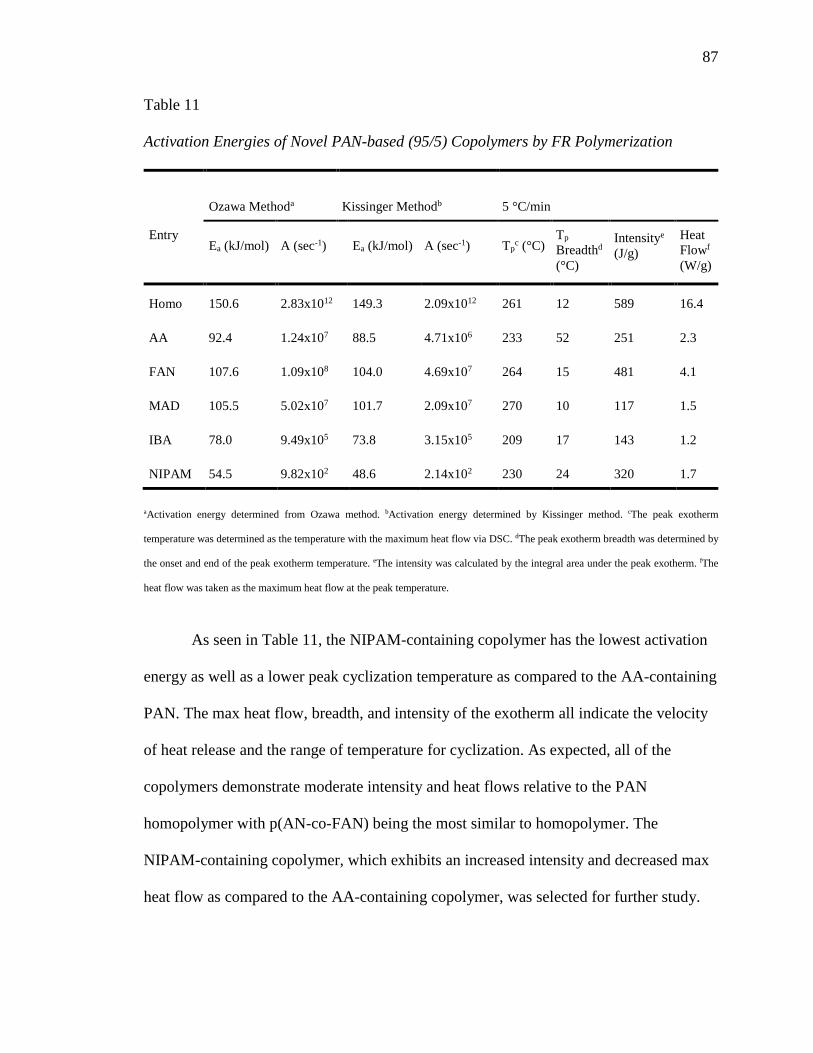
87
Table 11
Activation Energies of Novel PAN-based (95/5) Copolymers by FR Polymerization
Ozawa Methoda Kissinger Methodb 5 °C/min
Entry Ea (kJ/mol) A (sec-1) Ea (kJ/mol) A (sec-1) Tp
c (°C) Tp
Breadthd
(°C)
Intensitye
(J/g)
Heat
Flowf
(W/g)
Homo 150.6 2.83x10¹² 149.3 2.09x10¹² 261 12 589 16.4
AA 92.4 1.24x10⁷ 88.5 4.71x10⁶ 233 52 251 2.3
FAN 107.6 1.09x10⁸ 104.0 4.69x10⁷ 264 15 481 4.1
MAD 105.5 5.02x10⁷ 101.7 2.09x10⁷ 270 10 117 1.5
IBA 78.0 9.49x10⁵ 73.8 3.15x10⁵ 209 17 143 1.2
NIPAM 54.5 9.82x10² 48.6 2.14x10² 230 24 320 1.7
aActivation energy determined from Ozawa method. bActivation energy determined by Kissinger method. cThe peak exotherm
temperature was determined as the temperature with the maximum heat flow via DSC. dThe peak exotherm breadth was determined by
the onset and end of the peak exotherm temperature. eThe intensity was calculated by the integral area under the peak exotherm. fThe
heat flow was taken as the maximum heat flow at the peak temperature.
As seen in Table 11, the NIPAM-containing copolymer has the lowest activation
energy as well as a lower peak cyclization temperature as compared to the AA-containing
PAN. The max heat flow, breadth, and intensity of the exotherm all indicate the velocity
of heat release and the range of temperature for cyclization. As expected, all of the
copolymers demonstrate moderate intensity and heat flows relative to the PAN
homopolymer with p(AN-co-FAN) being the most similar to homopolymer. The
NIPAM-containing copolymer, which exhibits an increased intensity and decreased max
heat flow as compared to the AA-containing copolymer, was selected for further study.

88
Synthesis of PAN-Based RAFT Copolymers
Based on the above findings, we prepared RAFT copolymers (30 °C for 48 hr,
[Ma+Mb]0:[CPDT]0:[I]0 = 10,000:1:0.67) containing 2 and 5 mol% NIPAM in
comparison to similar and traditional comonomers for PAN-precursors: AA, methyl
acrylate (MA), methyl methacrylate (MMA), acrylamide (AM), dimethylacrylamide
(DMAM), and itaconic acid (IA). The conversions, molecular weights, polydispersities,
and compositions of the copolymers are summarized in Table 12. The results indicate that
the same low temperature CPDT-mediated polymerization conditions employed for
homopolymer resolve the low-conversion issues encountered with RAFT
copolymerizations of acrylonitrile.50,76,77
Table 12
Summary of RAFT Copolymers
Comonomera Comonomer content (%) Conv. (%)d Mn (Theor.)e Mn (MALLS)f PDIf
Feed Copolymerc
AA 2 1.9 71 379 300 168 400 1.33
NIPAM 2 3.4 65 352 700 142 100 1.38
AM 2 3.2 68 363 200 128 500 1.21
MA 2 5.1 64 343 800 130 800 1.22
MMA 2 6.9 58 313 200 138 700 1.21
DMAMg 2 - 63 340 000 162 100 1.41
IAg 2 - 41 224 000 53 300 1.18
AA 5 4.5 78 421 100 197 500 1.23
NIPAM 5 8.2 64 358 700 154 700 1.40

89
Table 12 (continued).
Comonomera Comonomer content (%) Conv. (%)d Mn (Theor.)e Mn (MALLS)f PDIf
Feed Copolymerc
AM 5 7.3 72 388 100 161 300 1.39
MA 5 6.8 65 355 600 139 700 1.36
MMA 5 12.0 66 360 800 118 400 1.17
DMAMg 5 - 57 315 600 188 700 1.27
IAg 5 - 30 170 900 45 400 1.26
Homopolymerb 0 0 71 377 100 131 400 1.27
aPolyacrylonitrile copolymers synthesized in ethylene carbonate at 20 wt.% monomer concentration under a nitrogen atmosphere at 30
°C using V-70 as the initiator and [M]0:[CPDT]0:[I]0 = 10,000:1:0.67, in which [M]0 = [MAN]0 + [MComonomer]0. Homopolymer PAN
repeated at same concentration of [M]0:[CPDT]0:[I]0 = 10,000:1:0.67. cCopolymer composition determined by 1H-NMR for MA, MMA,
and NIPAM-containing copolymers and by quantitative 13C-NMR for AA and AM- containing copolymers. dConversions were
determined by 1H-NMR spectroscopy recorded in DMSO-d6. eTheoretical number average molecular weights were calculated according
to the following equation: Mn=(ρ·MWmon·[M]/[CTA]) + MWCTA where ρ is the fractional monomer conversion, MWmon is the molecular
weight of the monomer, and MWCTA is the molecular weight of the CTA. fNumber average molecular weight (Mn) as determined by
SEC (0.5 mL/min, 60 °C, Polymer Labs PL gel 5 μm mixed-C column, DMF with 0.02 M LiBr eluent) equipped with RI and MALLS
detectors. gThese copolymers were removed from the following studies.
PAN-based copolymers of molecular weight > 165,000 g/mol with polydispersity
(Mw/Mn) < 1.35 at > 70% conversion were achieved. In the case of IA-containing
copolymers the molecular weight was much lower, which could be due to chain transfer
with IA. Due to the difficulty of drying and isolating 5 mol% DMAM copolymers and the
low conversions of IA-containing RAFT copolymers, DMAM and IA-containing
copolymers were removed for the remaining precursor studies.

90
As an example, the kinetic plots and conversion vs. molecular weight are shown
for 2 mol% NIPAM and 5 mol% AA copolymers in Figures 40 and 41. The kinetic plots
in Figures 40 and 41 show continued monomer conversion out to 48 hr and molecular
weights increase linearly with conversion.
Figure 40. (a) Kinetic plot and (b) molecular weight vs. conversion for 98/2 p(AN-co-
NIPAM) CPDT-mediated RAFT Polymerization at 30 °C and [M]0:[CPDT]0:[I]0 =
10,000:1:0.67, in which [M]0 = [MAN]0 + [MNIPAM]0.
Figure 41. (a) Kinetic plot and (b) molecular weight vs. conversion for 95/5 p(AN-co-
AA) CPDT-mediated RAFT Polymerization at 30 °C and [M]0:[CPDT]0:[I]0 =
10,000:1:0.67, in which [M]0 = [MAN]0 + [MAA]0.
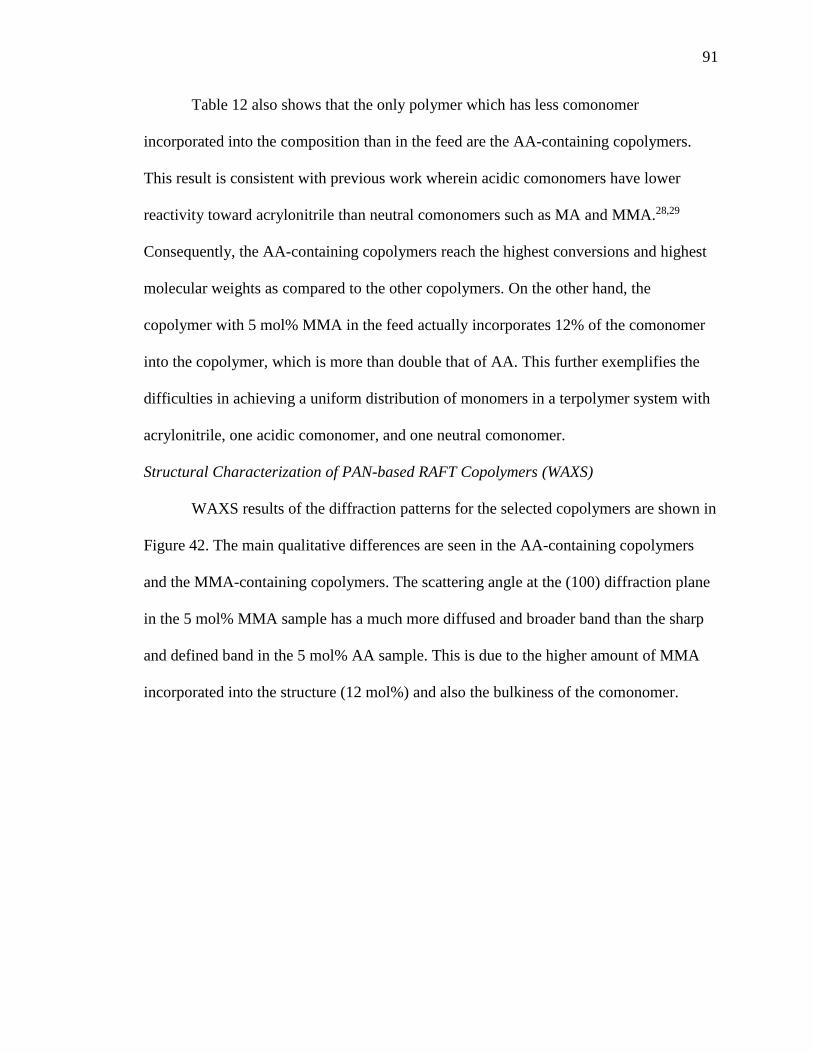
91
Table 12 also shows that the only polymer which has less comonomer
incorporated into the composition than in the feed are the AA-containing copolymers.
This result is consistent with previous work wherein acidic comonomers have lower
reactivity toward acrylonitrile than neutral comonomers such as MA and MMA.28,29
Consequently, the AA-containing copolymers reach the highest conversions and highest
molecular weights as compared to the other copolymers. On the other hand, the
copolymer with 5 mol% MMA in the feed actually incorporates 12% of the comonomer
into the copolymer, which is more than double that of AA. This further exemplifies the
difficulties in achieving a uniform distribution of monomers in a terpolymer system with
acrylonitrile, one acidic comonomer, and one neutral comonomer.
Structural Characterization of PAN-based RAFT Copolymers (WAXS)
WAXS results of the diffraction patterns for the selected copolymers are shown in
Figure 42. The main qualitative differences are seen in the AA-containing copolymers
and the MMA-containing copolymers. The scattering angle at the (100) diffraction plane
in the 5 mol% MMA sample has a much more diffused and broader band than the sharp
and defined band in the 5 mol% AA sample. This is due to the higher amount of MMA
incorporated into the structure (12 mol%) and also the bulkiness of the comonomer.

92
Figure 42. WAXS Patterns for RAFT Copolymers.
The 2-theta vs. intensity plots for 2 and 5 mol% AA, MMA, and NIPAM
copolymers are shown in Figures 43a and 43b, respectively. As shown if Figure 43a, the
2 mol% NIPAM copolymer has a similar (100) diffraction peak c.a. 2θ = 17° to the 2
mol% MMA copolymer, while the 2 mol% AA copolymer has a much narrower
crystalline peak. Meanwhile, the (100) peak in the 5 mol% MMA copolymer is much
broader probably due to the significantly high MMA content in the composition (12
mol%). All of the copolymers exhibit a characteristic broad reflection c.a. 2θ = 25°,
which has been previously reported in copolymer structures and ascribed to the (200)
plane relating to preliminary sheet-like structures.19,50,65 Also noted, the AA-containing
copolymers exhibit a weak diffraction peak c.a. 2θ = 29°, which is attributed to the (110)
diffraction plane17,34,65 and is absent in the NIPAM and MMA-containing copolymers.
The apparent crystallinities and crystallite thicknesses are summarized in Table 13.
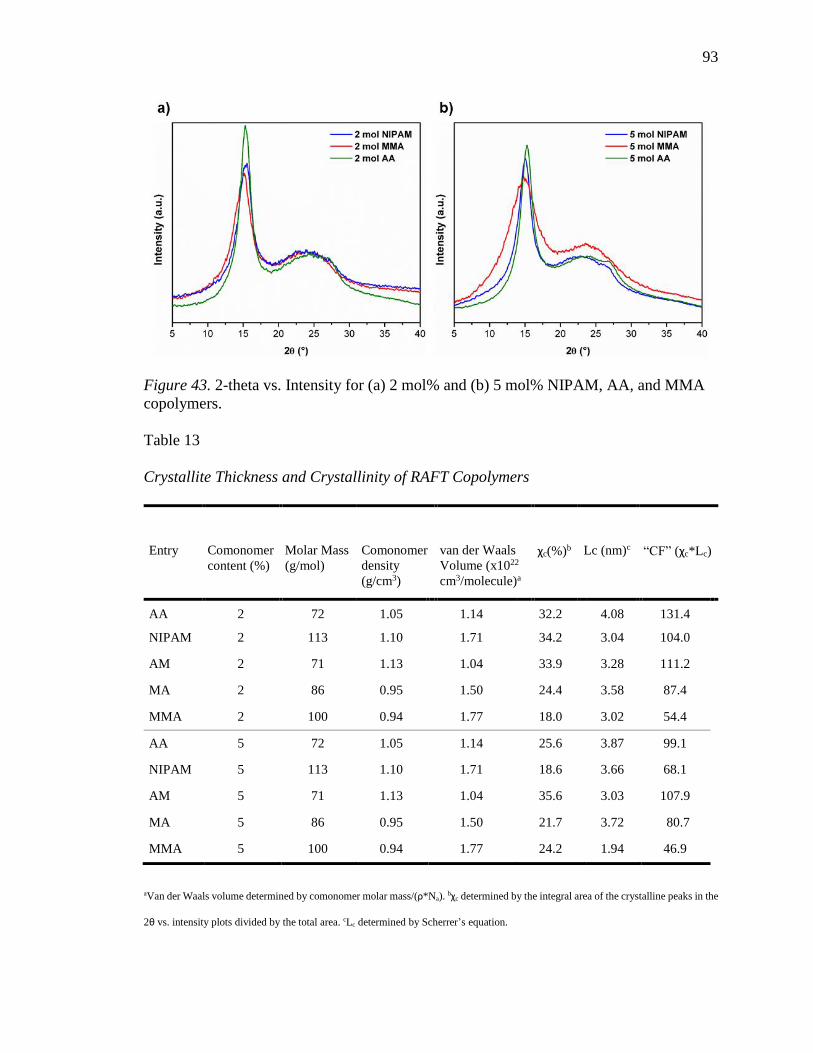
93
Figure 43. 2-theta vs. Intensity for (a) 2 mol% and (b) 5 mol% NIPAM, AA, and MMA
copolymers.
Table 13
Crystallite Thickness and Crystallinity of RAFT Copolymers
Entry Comonomer
content (%) Molar Mass
(g/mol) Comonomer
density
(g/cm3)
van der Waals
Volume (x1022
cm3/molecule)a
χc(%)b Lc (nm)c “CF” (χc*Lc)
AA 2 72 1.05 1.14 32.2 4.08 131.4
NIPAM 2 113 1.10 1.71 34.2 3.04 104.0
AM 2 71 1.13 1.04 33.9 3.28 111.2
MA 2 86 0.95 1.50 24.4 3.58 87.4
MMA 2 100 0.94 1.77 18.0 3.02 54.4
AA 5 72 1.05 1.14 25.6 3.87 99.1
NIPAM 5 113 1.10 1.71 18.6 3.66 68.1
AM 5 71 1.13 1.04 35.6 3.03 107.9
MA 5 86 0.95 1.50 21.7 3.72 80.7
MMA 5 100 0.94 1.77 24.2 1.94 46.9
aVan der Waals volume determined by comonomer molar mass/(ρ*Na). bχc determined by the integral area of the crystalline peaks in the
2θ vs. intensity plots divided by the total area. cLc determined by Scherrer’s equation.
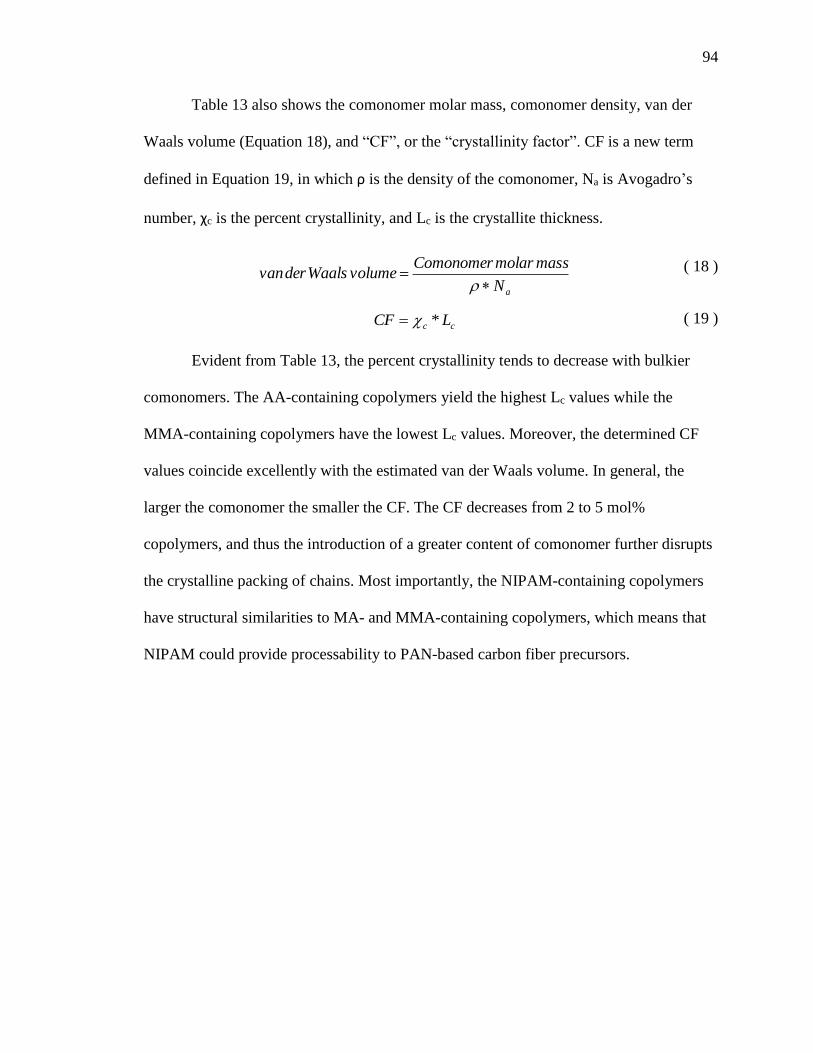
94
Table 13 also shows the comonomer molar mass, comonomer density, van der
Waals volume (Equation 18), and “CF”, or the “crystallinity factor”. CF is a new term
defined in Equation 19, in which ρ is the density of the comonomer, Na is Avogadro’s
number, χc is the percent crystallinity, and Lc is the crystallite thickness.
aN
massmolarComonomervolumeWaalsdervan
( 18 )
cc LCF * ( 19 )
Evident from Table 13, the percent crystallinity tends to decrease with bulkier
comonomers. The AA-containing copolymers yield the highest Lc values while the
MMA-containing copolymers have the lowest Lc values. Moreover, the determined CF
values coincide excellently with the estimated van der Waals volume. In general, the
larger the comonomer the smaller the CF. The CF decreases from 2 to 5 mol%
copolymers, and thus the introduction of a greater content of comonomer further disrupts
the crystalline packing of chains. Most importantly, the NIPAM-containing copolymers
have structural similarities to MA- and MMA-containing copolymers, which means that
NIPAM could provide processability to PAN-based carbon fiber precursors.
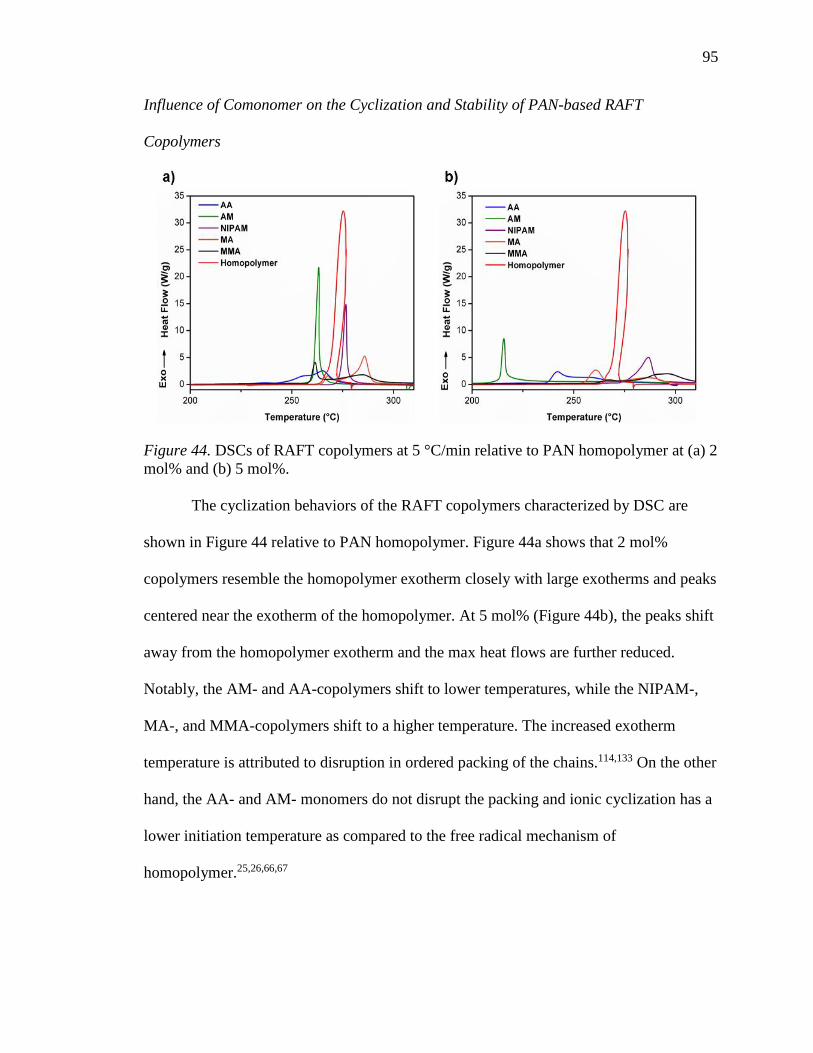
95
Influence of Comonomer on the Cyclization and Stability of PAN-based RAFT
Copolymers
Figure 44. DSCs of RAFT copolymers at 5 °C/min relative to PAN homopolymer at (a) 2
mol% and (b) 5 mol%.
The cyclization behaviors of the RAFT copolymers characterized by DSC are
shown in Figure 44 relative to PAN homopolymer. Figure 44a shows that 2 mol%
copolymers resemble the homopolymer exotherm closely with large exotherms and peaks
centered near the exotherm of the homopolymer. At 5 mol% (Figure 44b), the peaks shift
away from the homopolymer exotherm and the max heat flows are further reduced.
Notably, the AM- and AA-copolymers shift to lower temperatures, while the NIPAM-,
MA-, and MMA-copolymers shift to a higher temperature. The increased exotherm
temperature is attributed to disruption in ordered packing of the chains.114,133 On the other
hand, the AA- and AM- monomers do not disrupt the packing and ionic cyclization has a
lower initiation temperature as compared to the free radical mechanism of
homopolymer.25,26,66,67

96
Shown in Figure 44a and 44b, MMA, MA, and AA-copolymers exhibit bimodal
peaks. Typically, neutral comonomers display only one peak because they do not initiate
cyclization through the ionic pathway, however, we attribute the second peak to
hydrolyzed MMA and MA units along the backbone partaking in ionic cyclization.
Contrarily, the amide-containing copolymers were expected to have bimodal peaks, but
instead, the apparent monomodal peaks are more narrow and pronounced, which could be
due to the strong nucleophilicity of the of amide moiety. Amines are known to be
stronger nucleophiles as compared to acids as witnessed by the synthesis of maleimides
(Scheme 9).135 Additionally, fast cyclization rates for acrylamide have been reported
relative to methacrylic acid due to tautomerization of the α-proton on the amine initiating
cyclization in two directions, although this theory has not been verified.136,137
Scheme 9. Synthesis of maleimides demonstrating the nucleophilicity of the amine
relative to the acid.
The activation energies were determined by the Ozawa and Kissinger methods.
The Ozawa method fits for the AA-, AM-, and NIPAM- containing copolymers are
shown in Figure 45. For the purposes of this study, the copolymers with two DSC peaks
were split into separate peaks (peak 1 and peak 2). Interestingly, the slope of the 2 mol%
NIPAM copolymer parallels the 2 mol% AM copolymer, but the 5 mol% NIPAM
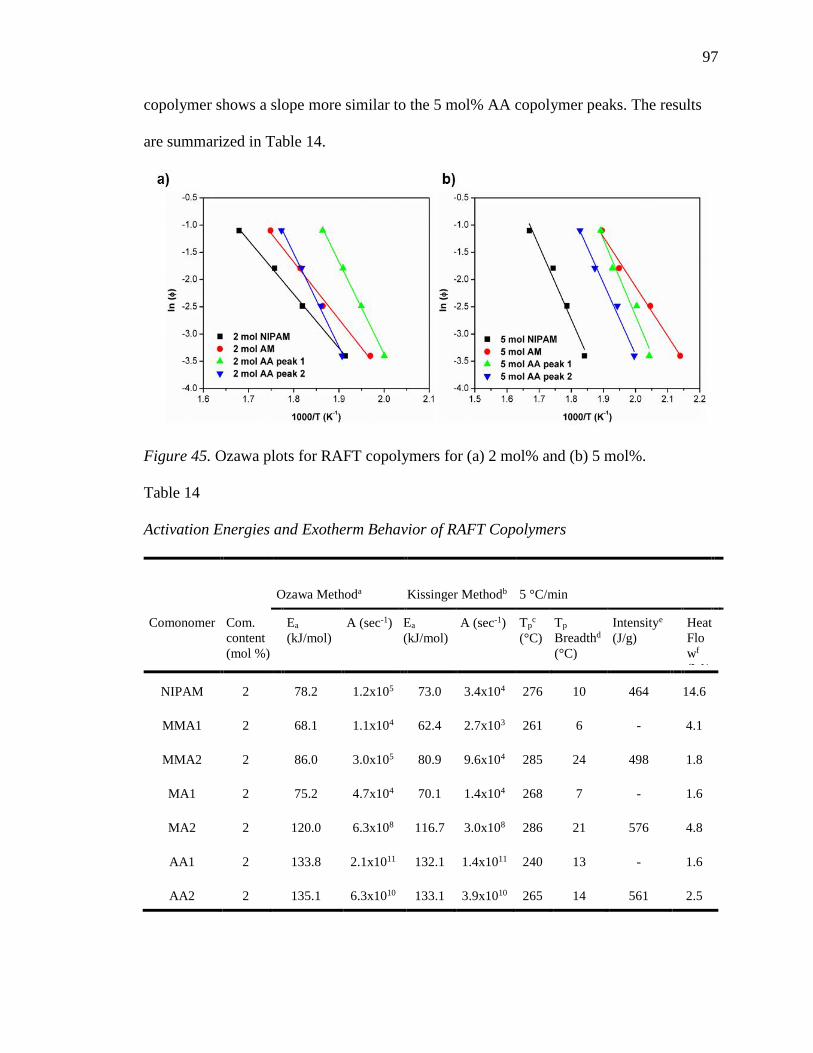
97
copolymer shows a slope more similar to the 5 mol% AA copolymer peaks. The results
are summarized in Table 14.
Figure 45. Ozawa plots for RAFT copolymers for (a) 2 mol% and (b) 5 mol%.
Table 14
Activation Energies and Exotherm Behavior of RAFT Copolymers
Ozawa Methoda Kissinger Methodb 5 °C/min
Comonomer Com.
content
(mol %)
Ea
(kJ/mol) A (sec-1) Ea
(kJ/mol) A (sec-1) Tp
c
(°C) Tp
Breadthd
(°C)
Intensitye
(J/g) Heat
Flo
wf
(W/
g) NIPAM 2 78.2 1.2x10⁵ 73.0 3.4x10⁴ 276 10 464 14.6
MMA1 2 68.1 1.1x10⁴ 62.4 2.7x10³ 261 6 - 4.1
MMA2 2 86.0 3.0x10⁵ 80.9 9.6x10⁴ 285 24 498 1.8
MA1 2 75.2 4.7x10⁴ 70.1 1.4x10⁴ 268 7 - 1.6
MA2 2 120.0 6.3x10⁸ 116.7 3.0x10⁸ 286 21 576 4.8
AA1 2 133.8 2.1x10¹¹ 132.1 1.4x10¹¹ 240 13 - 1.6
AA2 2 135.1 6.3x10¹⁰ 133.1 3.9x10¹⁰ 265 14 561 2.5

98
Table 14 (continued).
Ozawa Methoda Kissinger Methodb 5 °C/min
Comonomer Com.
content
(mol %)
Ea
(kJ/mol)
A (sec-1) Ea
(kJ/mol)
A (sec-1) Tpc
(°C)
Tp
Breadthd
(°C)
Intensitye
(J/g)
Heat
Flowf
(W/g)
AM 2 83.04 2.1x10⁶ 78.4 6.5x10⁵ 220 13 572 21.7
NIPAM 5 106.1 2.7x10⁷ 102.1 1.1x10⁷ 287 18 475 4.8
MMA1 5 79.4 1.3x10⁵ 74.4 4.0x10⁴ 267 9 - 0.9
MMA2 5 100.2 4.8x10⁶ 95.8 1.8x10⁶ 296 29 532 2.0
MA1 5 119.4 2.1x10⁹ 116.8 1.2x10⁹ 260 12 - 1.3
MA2 5 131.1 7.0x10⁹ 128.6 4.0x10⁹ 287 27 522 2.8
AA1 5 110.9 7.5x10⁸ 108.2 3.9x10⁸ 241 10 - 2.5
AA2 5 103.6 5.4x10⁷ 100.3 2.5x10⁷ 259 25 461 1.3
AM 5 71.9 1.5x10⁵ 67.4 4.5x10⁴ 216 10 459 8.3
Homo 0 121.1 1.4x10⁹ 118.2 7.10x10⁸ 275 9 531 32.1
aActivation energy determined from Ozawa method. bActivation energy determined by Kissinger method. cThe peak exotherm
temperature was determined as the temperature with the maximum heat flow via DSC. dThe peak exotherm breadth was determined by
the onset and end of the peak exotherm temperature. eThe intensity was calculated by the integral area under the peak exotherm. fThe
heat flow was taken as the maximum heat flow at the peak temperature.
As seen in Table 14, the NIPAM-containing RAFT copolymers have lower
activation energies than the RAFT PAN homopolymer. Additionally, all of the 5 mol%
copolymers show reduced heat flows compared to the analogous 2 mol% copolymers. In
general, the copolymers that exhibit two peaks yield a higher activation energy for the
latter of the two peaks. The first peak is attributed to the ionic mechanism, which is

99
expected to have a lower activation energy,25 while the second peak is ascribed to the free
radical mechanism. Notably, the AA- and acrylate-containing copolymers have broader
overall exotherms and reduced max heat flows as compared to the amide-containing
copolymers. Significantly, the NIPAM copolymers exhibits similar activation energy to
the traditional AA copolymers, despite the increased exotherm temperature of the
NIPAM copolymers. To further elucidate differences in the cyclization behavior of the
RAFT copolymers, the cyclization reaction was monitored by FTIR in a heating cell at
225 °C for 5 hours in nitrogen as shown in Figure 46 for the 2 mol% copolymers.
Figure 46. Real-time FTIR spectra of RAFT copolymers at 225 C in nitrogen for 2 mol
% (a) AM, (b) AA, (c) MA, (d), MMA, and (e) NIPAM (dotted lines represent IR bands
for nitrile (2240 cm-1) and imine (1590 cm-1) functionalities).
It is clear from Figure 46a that cyclization is fastest in the AM-containing
copolymers at 225 °C with the significant increase in the imine peak and reduction in the
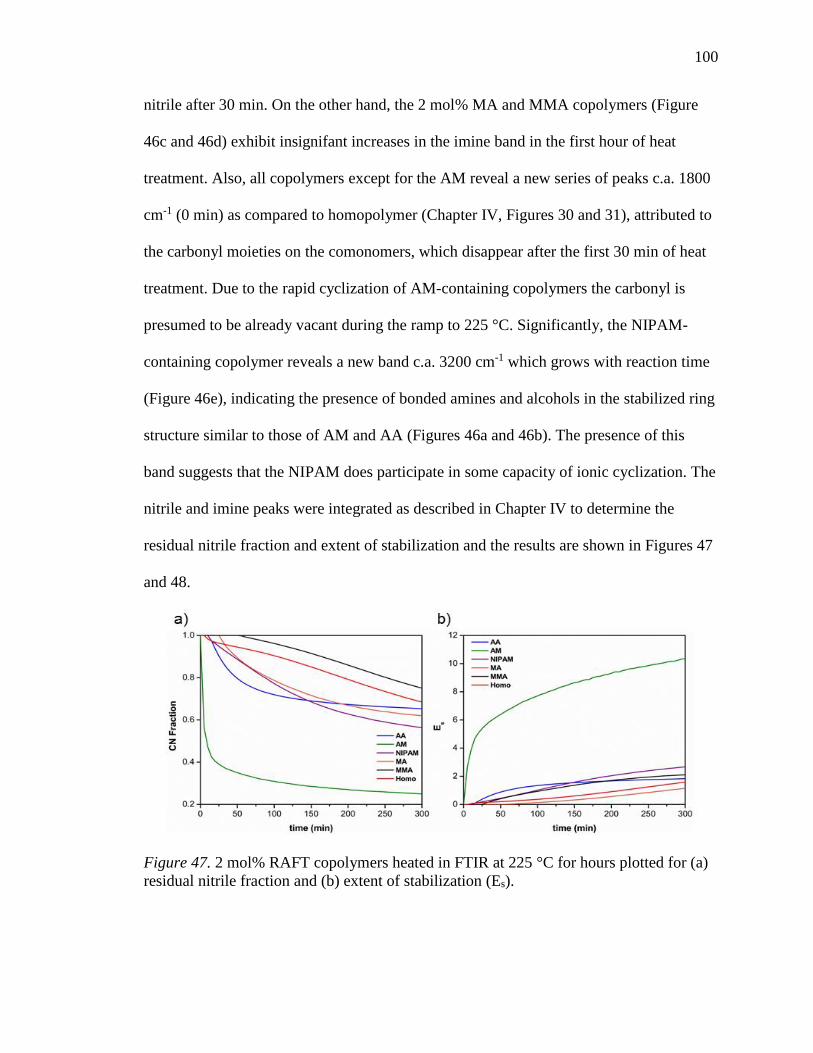
100
nitrile after 30 min. On the other hand, the 2 mol% MA and MMA copolymers (Figure
46c and 46d) exhibit insignifant increases in the imine band in the first hour of heat
treatment. Also, all copolymers except for the AM reveal a new series of peaks c.a. 1800
cm-1 (0 min) as compared to homopolymer (Chapter IV, Figures 30 and 31), attributed to
the carbonyl moieties on the comonomers, which disappear after the first 30 min of heat
treatment. Due to the rapid cyclization of AM-containing copolymers the carbonyl is
presumed to be already vacant during the ramp to 225 °C. Significantly, the NIPAM-
containing copolymer reveals a new band c.a. 3200 cm-1 which grows with reaction time
(Figure 46e), indicating the presence of bonded amines and alcohols in the stabilized ring
structure similar to those of AM and AA (Figures 46a and 46b). The presence of this
band suggests that the NIPAM does participate in some capacity of ionic cyclization. The
nitrile and imine peaks were integrated as described in Chapter IV to determine the
residual nitrile fraction and extent of stabilization and the results are shown in Figures 47
and 48.
Figure 47. 2 mol% RAFT copolymers heated in FTIR at 225 °C for hours plotted for (a)
residual nitrile fraction and (b) extent of stabilization (Es).
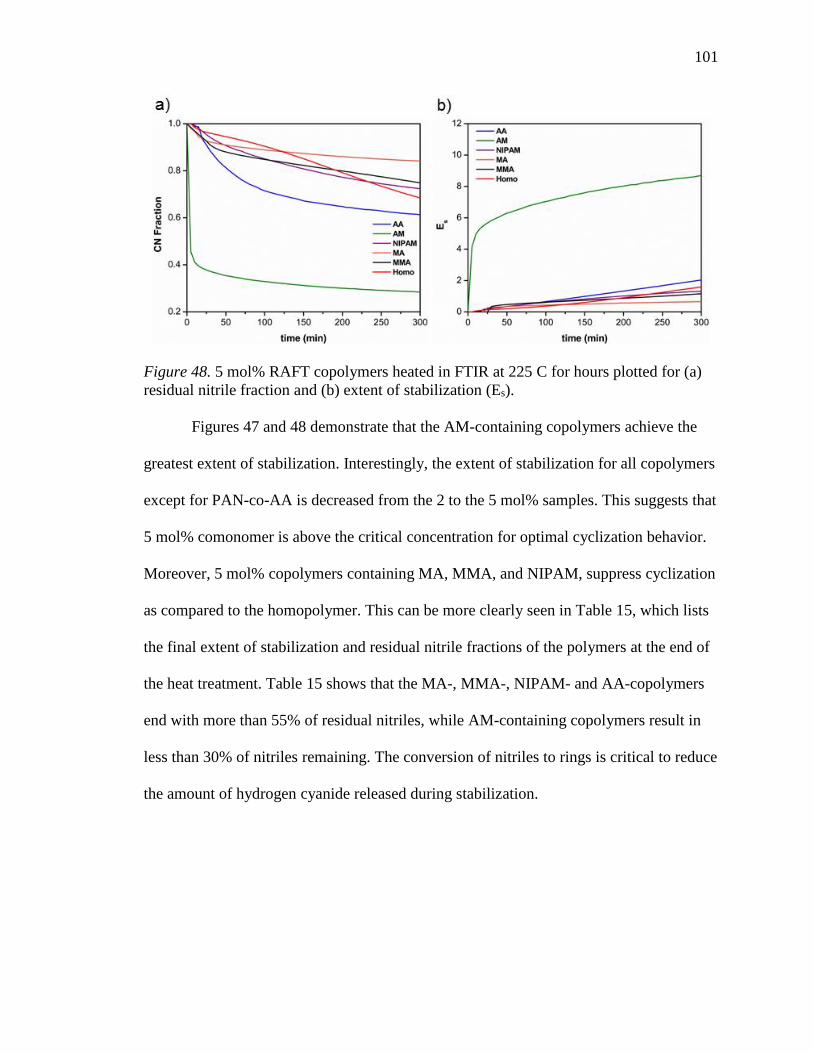
101
Figure 48. 5 mol% RAFT copolymers heated in FTIR at 225 C for hours plotted for (a)
residual nitrile fraction and (b) extent of stabilization (Es).
Figures 47 and 48 demonstrate that the AM-containing copolymers achieve the
greatest extent of stabilization. Interestingly, the extent of stabilization for all copolymers
except for PAN-co-AA is decreased from the 2 to the 5 mol% samples. This suggests that
5 mol% comonomer is above the critical concentration for optimal cyclization behavior.
Moreover, 5 mol% copolymers containing MA, MMA, and NIPAM, suppress cyclization
as compared to the homopolymer. This can be more clearly seen in Table 15, which lists
the final extent of stabilization and residual nitrile fractions of the polymers at the end of
the heat treatment. Table 15 shows that the MA-, MMA-, NIPAM- and AA-copolymers
end with more than 55% of residual nitriles, while AM-containing copolymers result in
less than 30% of nitriles remaining. The conversion of nitriles to rings is critical to reduce
the amount of hydrogen cyanide released during stabilization.

102
Table 15
Final Residual Nitrile Fraction and Extent of Stabilization for RAFT Copolymers Treated
at 225 °C for 5 hours in Nitrogen
Polymer Comonomer Content (%) Residual CN Fraction (%) Extent of Stabilization
NIPAM 2 56 2.67
MMA 2 75 2.11
MA 2 62 1.15
AA 2 65 1.83
AM 2 25 10.35
NIPAM 5 72 1.32
MMA 5 76 1.16
MA 5 84 0.65
AA 5 61 2.03
AM 5 28 8.69
Homopolymer 0 68 1.59
As Beltz and coworkers have shown that oxygen can affect cyclization reactions
during stabilization,45 we studied the cyclization reaction of the 2 mol% AA, AM, and
NIPAM copolymers in relation to homopolymer in the presence of dried air and the
results are shown in Figure 49. The oxygen atmosphere can promote cyclization, cross-
linking, and aromatization reactions, by introducing –OH, C=O, and some N–O groups.59
These groups are necessary for dehydrogenation along the polymer backbone by the
liberation of water molecules and can also act as initiating centers for cyclization.7,43,138
Shown in Figures 49a and 49b, the AM- and AA-copolymers form strong imine bands at
30 min of treatment in oxygen. Contrarily, oxygen can scavenge radicals, which inhibits
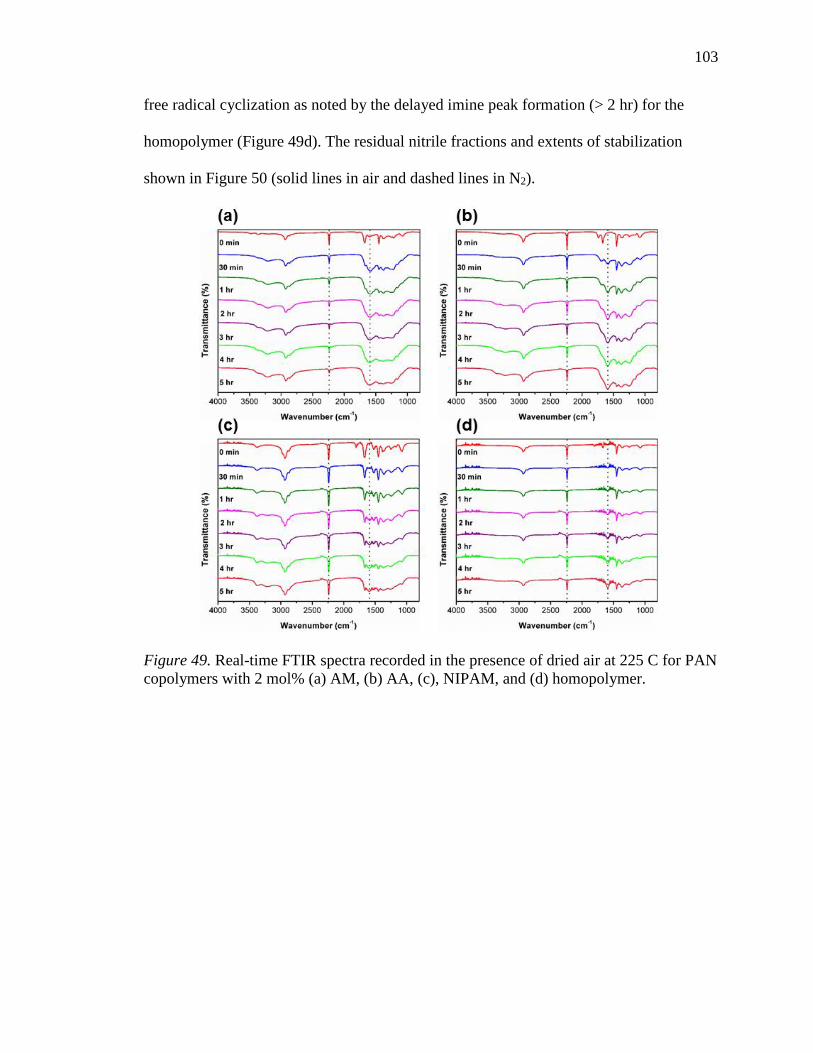
103
free radical cyclization as noted by the delayed imine peak formation (> 2 hr) for the
homopolymer (Figure 49d). The residual nitrile fractions and extents of stabilization
shown in Figure 50 (solid lines in air and dashed lines in N2).
Figure 49. Real-time FTIR spectra recorded in the presence of dried air at 225 C for PAN
copolymers with 2 mol% (a) AM, (b) AA, (c), NIPAM, and (d) homopolymer.
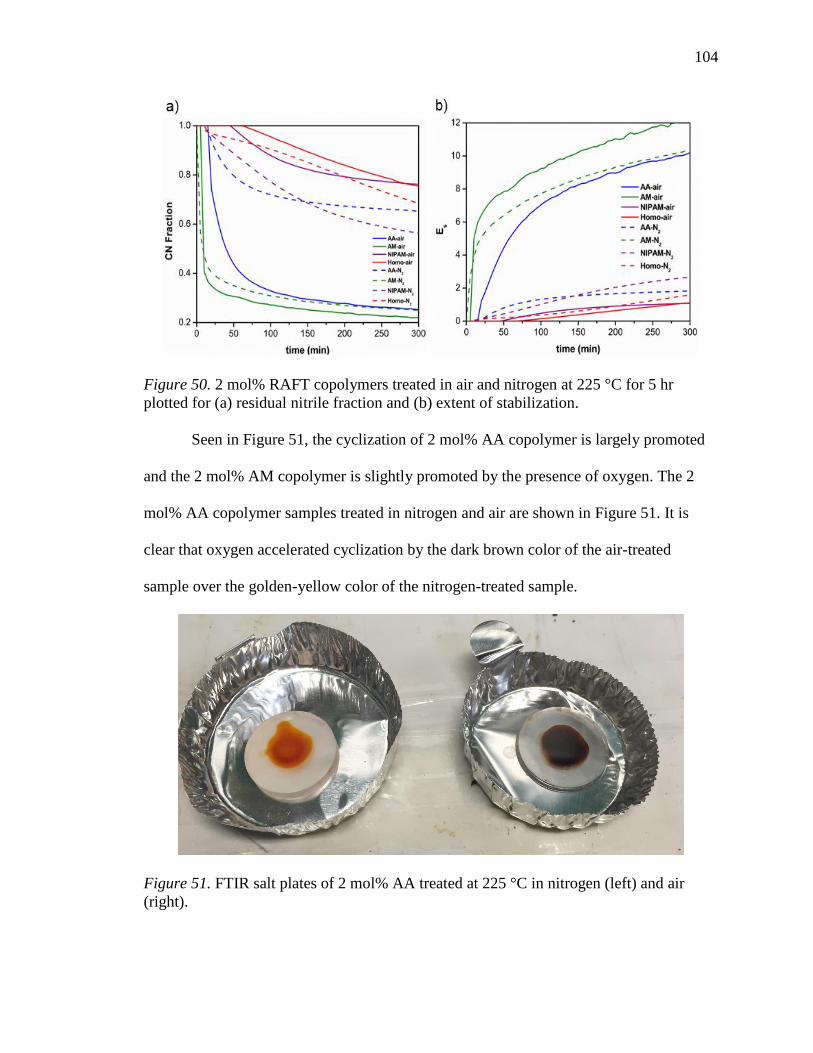
104
Figure 50. 2 mol% RAFT copolymers treated in air and nitrogen at 225 °C for 5 hr
plotted for (a) residual nitrile fraction and (b) extent of stabilization.
Seen in Figure 51, the cyclization of 2 mol% AA copolymer is largely promoted
and the 2 mol% AM copolymer is slightly promoted by the presence of oxygen. The 2
mol% AA copolymer samples treated in nitrogen and air are shown in Figure 51. It is
clear that oxygen accelerated cyclization by the dark brown color of the air-treated
sample over the golden-yellow color of the nitrogen-treated sample.
Figure 51. FTIR salt plates of 2 mol% AA treated at 225 °C in nitrogen (left) and air
(right).

105
On the other hand, the 2 mol% NIPAM copolymer and the homopolymer appear
to be inhibited by the presence of oxygen and both exhibit inhibition periods by the
presence of delayed onset of cyclization (Figure 50). The nitrile conversion of the 2
mol% NIPAM copolymer sample begins earlier than the homopolymer sample, but the
residual nitrile content after 5 hr is nearly equal to that of the homopolymer. This is also
noted by the nitrile band in the 2 mol% NIPAM sample (Figure 49c), which is still much
stronger than the AM- and AA-copolymers after 5 hr. Eluding to the Introduction,
cyclization typically occurs in the amorphous regions before the crystalline regions,32,57
which could also be the cause of earlier cyclization in the 2 mol% NIPAM sample
compared to homopolymer. Likewise, the bulky NIPAM should permit a greater uptake
of oxygen, which reduces the oxidation gradient throughout the polymer sample.
The mass retention of the RAFT copolymers treated at 10 °C/min in nitrogen to
700 °C by TGA are shown in Figure 52. In general, the 2 mol% copolymers have less
water bound to the surface as compared to the 5 mol% copolymers evident from the mass
loss around 100−150 °C. The onset of degradation c.a. 280 °C follows the DSC and FTIR
results by which the polymers that exotherm and form cyclized rings first also begin
degradation first. In particular, the NIPAM-containing copolymers yield a steep mass loss
between 300−350 °C and the TGA curve is absent of a “bump” c.a. 400 °C, which is
present in the rest of the copolymers. To further understand the differences in
degradation, TGA equipped with a mass spectrometer will be used in the future. All of
the copolymers retain a similar mass ratio (38−44%) at 700 °C.
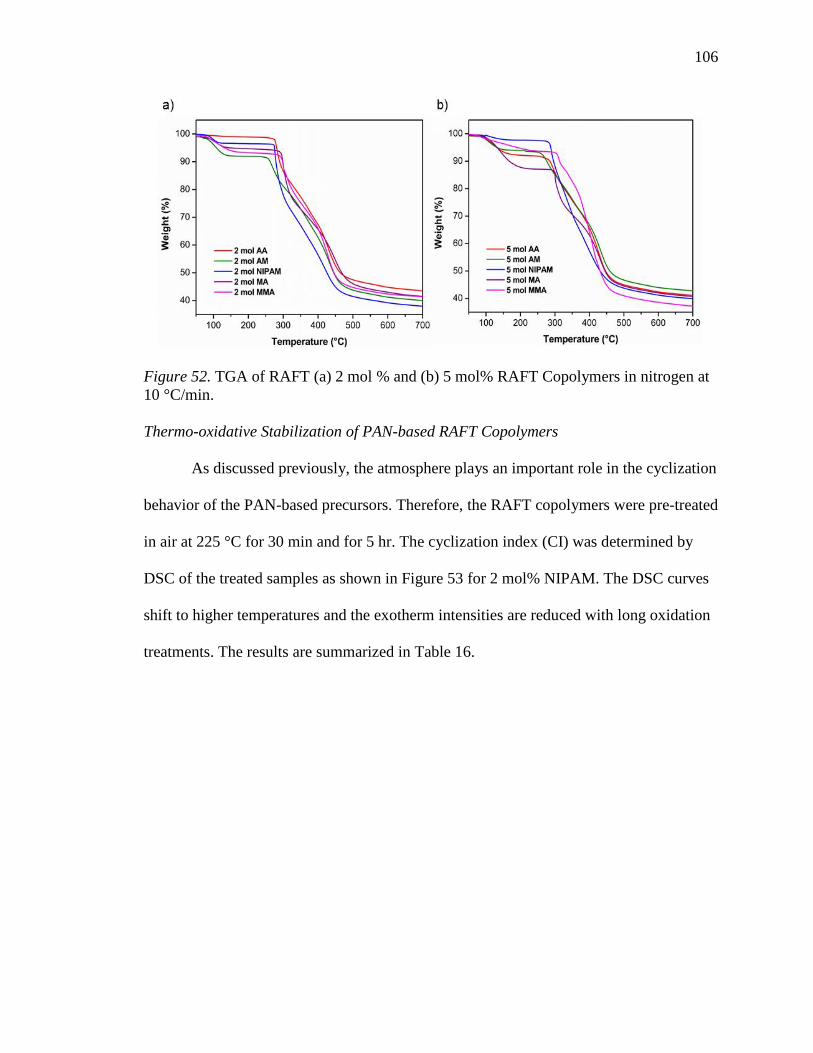
106
Figure 52. TGA of RAFT (a) 2 mol % and (b) 5 mol% RAFT Copolymers in nitrogen at
10 °C/min.
Thermo-oxidative Stabilization of PAN-based RAFT Copolymers
As discussed previously, the atmosphere plays an important role in the cyclization
behavior of the PAN-based precursors. Therefore, the RAFT copolymers were pre-treated
in air at 225 °C for 30 min and for 5 hr. The cyclization index (CI) was determined by
DSC of the treated samples as shown in Figure 53 for 2 mol% NIPAM. The DSC curves
shift to higher temperatures and the exotherm intensities are reduced with long oxidation
treatments. The results are summarized in Table 16.
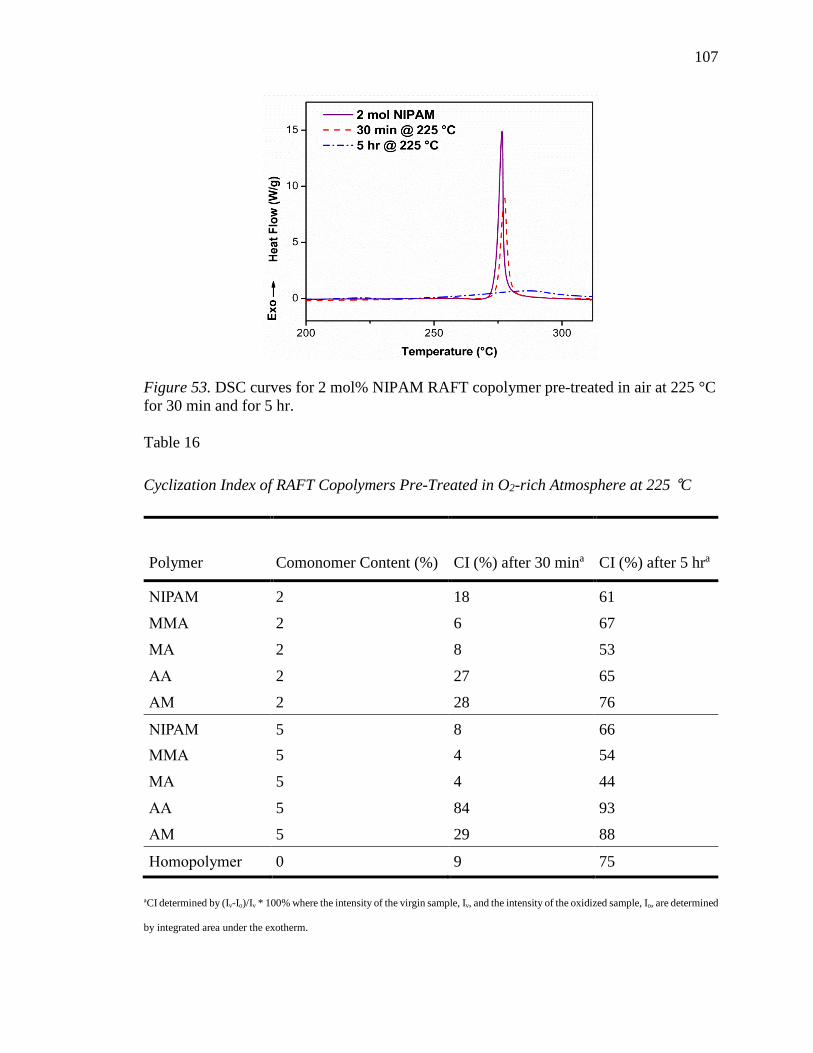
107
Figure 53. DSC curves for 2 mol% NIPAM RAFT copolymer pre-treated in air at 225 °C
for 30 min and for 5 hr.
Table 16
Cyclization Index of RAFT Copolymers Pre-Treated in O2-rich Atmosphere at 225 °C
Polymer Comonomer Content (%) CI (%) after 30 mina CI (%) after 5 hra
NIPAM 2 18 61
MMA 2 6 67
MA 2 8 53
AA 2 27 65
AM 2 28 76
NIPAM 5 8 66
MMA 5 4 54
MA 5 4 44
AA 5 84 93
AM 5 29 88
Homopolymer 0 9 75
aCI determined by (Iv-Io)/Iv * 100% where the intensity of the virgin sample, Iv, and the intensity of the oxidized sample, Io, are determined
by integrated area under the exotherm.

108
Table 16 shows that the CI index is greatest for the copolymers containing AA
and AM, and in particular the 5 mol% AA sample, which is almost completely cyclized
by 30 min of pre-treatment. The samples with MA, MMA, and 5 mol% NIPAM display
reduced CI values as compared to homopolymer, which is consistent with the previous
data as these comonomers have higher peak cyclization temperatures. Similar to the FTIR
results, the 2 mol% NIPAM copolymer appears to assist cyclization initially, but
ultimately reaches a lower CI than homopolymer. The heat treated films of 2 mol% AA,
AM, and NIPAM copolymers are shown in Figure 54. The 2 mol% AA and AM
copolymers are dark brown after 30 min and then black after 5 hours of heat treatment.
Meanwhile, the 2 mol% NIPAM takes on a beige color after 30 min and then dark brown
after 5 hours of heat treatment.
Figure 54. Films of RAFT copolymers pre-treated in oxygen-rich atmosphere at 225 °C
for (a) 30 min and for (b) 5 hrs. Left to right: 2 mol% AA, 2 mol% AM, 2 mol% NIPAM.
The pre-treated films were then characterized by Raman Spectroscopy as in
Chapter IV by analyzing the ratio of the intensity of the D- and G- bands. The D- and G-
bands could not be resolved for the NIPAM, MA, and MMA copolymers after 30 minutes
of treatment. Therefore, results for the 5 hours of treatment at 225 °C are presented in
Figure 55. The D/G intensity ratio is smallest for the copolymers with AA and AM and
then largest for the NIPAM-containing copolymers. Interestingly, the 2 and 5 mol%

109
copolymers show no statistical difference between the D/G intensity ratios. This means
that the crystalline planar size (La) is more dependent on comonomer selection rather than
comonomer content. Even if there is a greater degree of cyclization between the 2 and 5
mol% samples, the sizes of the graphitic basal planes are the same.
Figure 55. ID/IG ratios for RAFT Copolymers treated at 225 °C in air for 5 hours. Error
bars represent +/- 1 standard deviation of 5 spots measured via Raman spectroscopy.
The determined D/G intensity ratios and the calculated crystalline planar sizes are
summarized in Table 17. Notably, La is greater for all of RAFT copolymers at 225 °C for
5 hr than the homopolymer. Even though the copolymers with acrylates had lower CI
values than homopolymer, the sizes of the ladder structures are larger. In theory,
increased crystalline planar sizes would exhibit improved graphitization degree and
increased grain sizes, but it has been shown that increasing the La actually correlates to
reduced tensile strength in practice.139,140 This could be partially related to smaller
crystalline planes being easier to draw fibers and process the fibers. To understand this
phenomenon, more studies correlating precursor structure to end fiber need to be
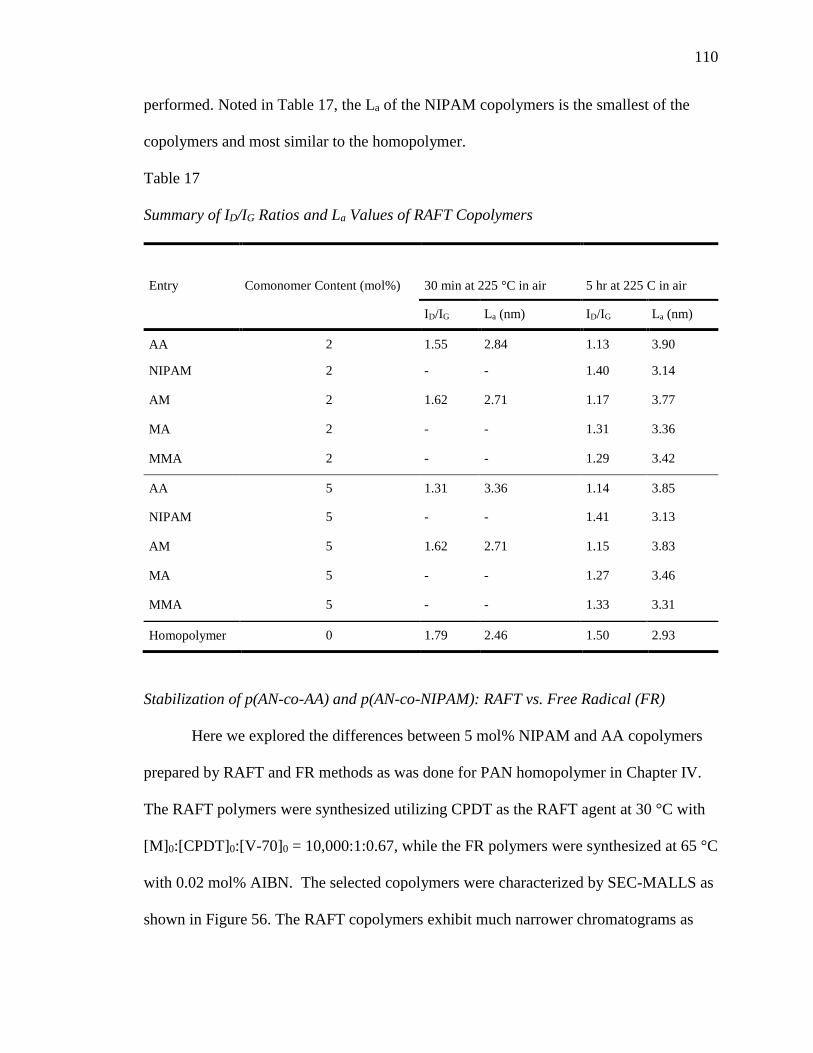
110
performed. Noted in Table 17, the La of the NIPAM copolymers is the smallest of the
copolymers and most similar to the homopolymer.
Table 17
Summary of ID/IG Ratios and La Values of RAFT Copolymers
Entry Comonomer Content (mol%) 30 min at 225 °C in air 5 hr at 225 C in air
ID/IG La (nm) ID/IG La (nm)
AA 2 1.55 2.84 1.13 3.90
NIPAM 2 - - 1.40 3.14
AM 2 1.62 2.71 1.17 3.77
MA 2 - - 1.31 3.36
MMA 2 - - 1.29 3.42
AA 5 1.31 3.36 1.14 3.85
NIPAM 5 - - 1.41 3.13
AM 5 1.62 2.71 1.15 3.83
MA 5 - - 1.27 3.46
MMA 5 - - 1.33 3.31
Homopolymer 0 1.79 2.46 1.50 2.93
Stabilization of p(AN-co-AA) and p(AN-co-NIPAM): RAFT vs. Free Radical (FR)
Here we explored the differences between 5 mol% NIPAM and AA copolymers
prepared by RAFT and FR methods as was done for PAN homopolymer in Chapter IV.
The RAFT polymers were synthesized utilizing CPDT as the RAFT agent at 30 °C with
[M]0:[CPDT]0:[V-70]0 = 10,000:1:0.67, while the FR polymers were synthesized at 65 °C
with 0.02 mol% AIBN. The selected copolymers were characterized by SEC-MALLS as
shown in Figure 56. The RAFT copolymers exhibit much narrower chromatograms as
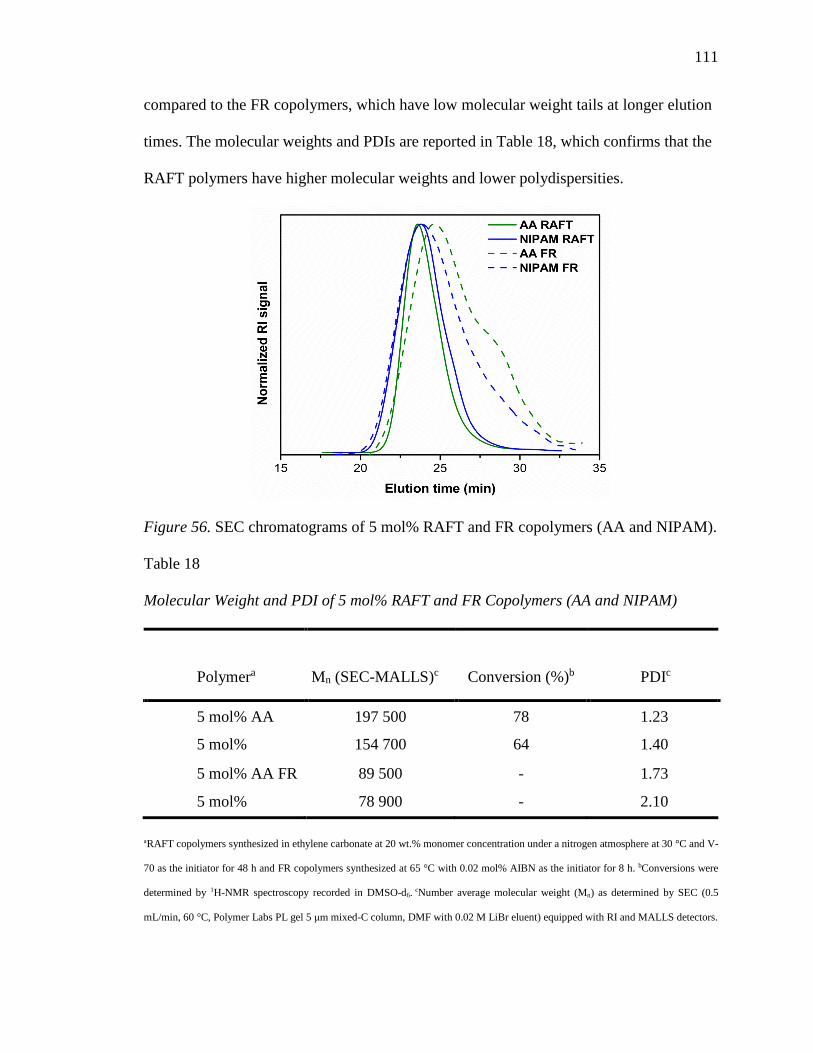
111
compared to the FR copolymers, which have low molecular weight tails at longer elution
times. The molecular weights and PDIs are reported in Table 18, which confirms that the
RAFT polymers have higher molecular weights and lower polydispersities.
Figure 56. SEC chromatograms of 5 mol% RAFT and FR copolymers (AA and NIPAM).
Table 18
Molecular Weight and PDI of 5 mol% RAFT and FR Copolymers (AA and NIPAM)
Polymera Mn (SEC-MALLS)c Conversion (%)b PDIc
5 mol% AA
RAFT
197 500 78 1.23
5 mol%
NIPAM RAFT
154 700 64 1.40
5 mol% AA FR 89 500 - 1.73
5 mol%
NIPAM FR
78 900 - 2.10
aRAFT copolymers synthesized in ethylene carbonate at 20 wt.% monomer concentration under a nitrogen atmosphere at 30 °C and V-
70 as the initiator for 48 h and FR copolymers synthesized at 65 °C with 0.02 mol% AIBN as the initiator for 8 h. bConversions were
determined by 1H-NMR spectroscopy recorded in DMSO-d6. cNumber average molecular weight (Mn) as determined by SEC (0.5
mL/min, 60 °C, Polymer Labs PL gel 5 μm mixed-C column, DMF with 0.02 M LiBr eluent) equipped with RI and MALLS detectors.

112
The PAN-based copolymers characterized by DSC are shown in Figure 57.
Consistent with FR homopolymers, the onset of the exotherm occurs at a lower
temperature for the FR copolymers. The FR copolymers should have more chain ends
and more defects for initiation of cyclization to occur as compared to the RAFT
copolymers. Additionally, the cyclization exotherms of the RAFT copolymers are
narrower with greater max heat flows, which was shown in the case of homopolymers.
The exotherm properties are summarized in Table 19. Unique from the homopolymers,
the RAFT copolymers display much greater intensities and higher activation energies
than the analogous FR copolymers. The increased intensity could be related to a higher
extent of reaction, which would suggest a more complete ladder structure.
Figure 57. DSC curves of 5 mol% RAFT and FR copolymers at 5 °C/min (AA and
NIPAM).

113
Table 19
Activation Energy and DSC Exotherm Behavior of 5 mol% RAFT and FR Copolymers
(AA and NIPAM)
Polymer
Ozawa Method Kissinger Method
Tp(°C)
Tp
Breadth
(°C)
Intensity
(J/g)
Max
Heat
Flow
(W/g)
Ea
(kJ/mol) A (s-1)
Ea
(kJ/mol) A (s-1)
NIPAM_RAFT 106.1 2.7x10⁷ 102.1 1.1x10⁷ 287 18 475 4.8
AA_RAFT* 110.9 7.5x10⁸ 108.2 3.9x10⁸ 241 35 461 2.5
NIPAM_FR 54.5 9.8x10² 48.6 2.1x10² 230 24 320 1.7
AA_FR* 92.4 1.2x10⁷ 88.5 4.7x10⁶ 233 52 251 2.3
*Only the peak maximum considered and not the shoulder peak.
The differences in mass retention through pyrolysis were characterized by TGA
as shown in Figure 58. The RAFT copolymers show a higher stability to degradation up
to about 280 °C, likely because there are fewer low molecular weight impurities (Figure
58a). Furthermore, the RAFT copolymers yield a higher mass retention at 600 °C. Unlike
the RAFT homopolymers, which have extreme heat flows and rapid mass loss, the RAFT
copolymers exhibit more gradual mass loss due to the alternative pathway for cyclization.
Thus, the greater mass retention of the RAFT copolymers post pyrolysis supports the idea
that RAFT copolymers lead to a greater extent of ladder structure formation as compared
to FR copolymers. More intriguingly, Figure 58b shows that mass loss between the
RAFT and FR copolymers is even more accentuated when the copolymers are pre-
oxidized. Between 350−400 °C (post cyclization), the FR copolymers lose about 10−20%
more mass than the RAFT copolymers.
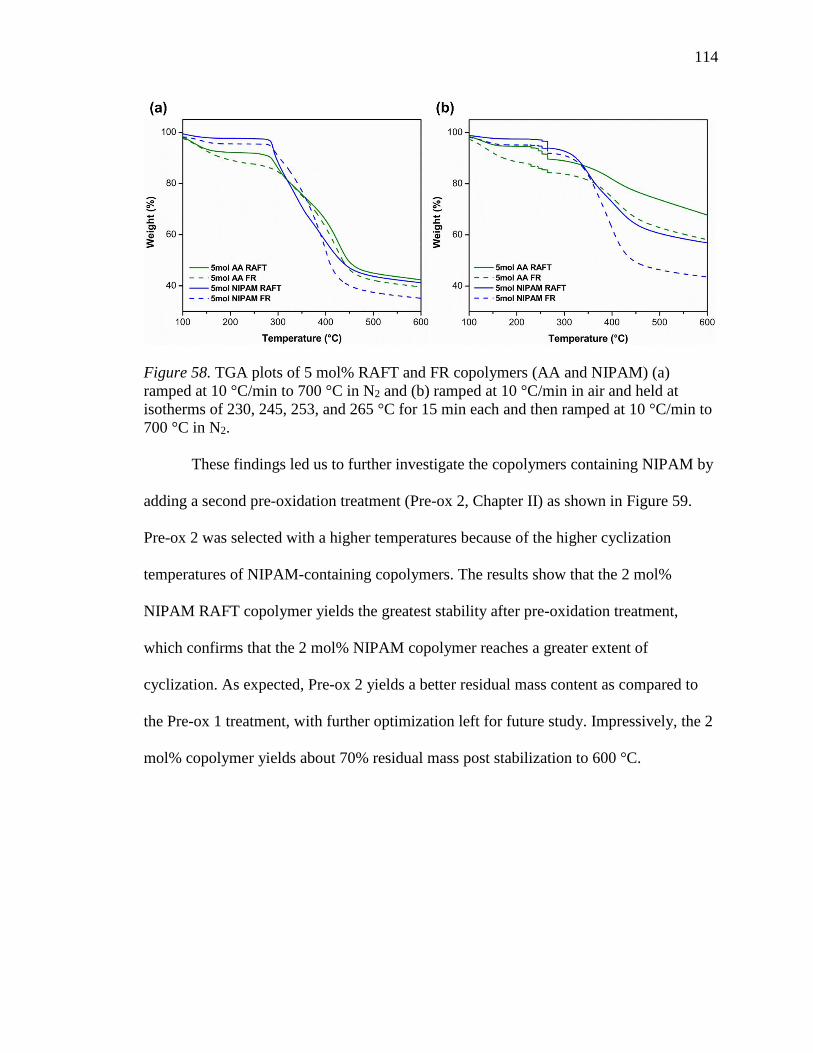
114
Figure 58. TGA plots of 5 mol% RAFT and FR copolymers (AA and NIPAM) (a)
ramped at 10 °C/min to 700 °C in N2 and (b) ramped at 10 °C/min in air and held at
isotherms of 230, 245, 253, and 265 °C for 15 min each and then ramped at 10 °C/min to
700 °C in N2.
These findings led us to further investigate the copolymers containing NIPAM by
adding a second pre-oxidation treatment (Pre-ox 2, Chapter II) as shown in Figure 59.
Pre-ox 2 was selected with a higher temperatures because of the higher cyclization
temperatures of NIPAM-containing copolymers. The results show that the 2 mol%
NIPAM RAFT copolymer yields the greatest stability after pre-oxidation treatment,
which confirms that the 2 mol% NIPAM copolymer reaches a greater extent of
cyclization. As expected, Pre-ox 2 yields a better residual mass content as compared to
the Pre-ox 1 treatment, with further optimization left for future study. Impressively, the 2
mol% copolymer yields about 70% residual mass post stabilization to 600 °C.

115
Figure 59. TGA plots of NIPAM-containing copolymers ramped at 10 °C/min to 700 °C
in N2, Preox1: ramped at 10 °C/min in air and held at isotherms of 230, 245, 253, and 265
°C for 15 min each and then ramped at 10 °C/min to 700 °C in N2, and Preox2: ramped at
10 °C/min in air and held at isotherms of 245, 260, 268, and 280 °C for 15 min each and
then ramped at 10 °C/min to 700 °C in N2.
Summary
NIPAM-containing copolymers posed several interesting characteristics
including: (1) monomodal DSC exotherms with reduced heat flow, (2) lower crystallinity
and smaller crystalline planar size compared to p(AN-co-AA), (3) as well as impressive
thermo-oxidative stability. The use of a single comonomer, such as NIPAM, that
provides both processability as well as an aid to the cyclization process would benefit
carbon fiber properties substantially over the use of a conventional terpolymer system.
Furthermore, the route used to synthesize the RAFT copolymers led to unprecedented

116
molecular weights above 160,000 g/mol (SEC-MALLS) with polydispersities (Mw/Mn) <
1.35. It was shown that these RAFT copolymers, with greater cyclization intensities than
the FR counterparts, led to a greater extent of cyclization by an increased mass yield post
thermo-oxidative stabilization and fewer small volatile byproducts.
117
CHAPTER VI
SEMI-BATCH RAFT POLYMERIZATION OF POLY(ACRYLONITRILE-CO-N-
ISOPROPYLACRYLAMIDE) AND ITS STABILIZATION BEHAVIOR
Abstract
Utilizing reversible addition-fragmentation chain transfer (RAFT) polymerization,
the composition profile of PAN-based copolymers becomes a tunable parameter in
preparing carbon fiber precursors. In this work, poly(acrylonitrile-co-N-
isopropylacrylamide) copolymers were prepared via a semi-batch process mediated by 2-
cyano-2-propyl dodecyl trithiocarbonate (CPDT). The monomer reactivity ratios were
determined by the Fineman-Ross (FR), Kelen-Tüdos (KT), and non-linear least squares
(NLLS) models. The number average sequence length of acrylonitrile (AN) was found to
be highly dependent on the comonomer content. NIPAM was introduced at a controlled
rate into a reaction vessel in attempts to facillitate comonomer distribution. These
semibatch copolymers were evaluated based on their ring-closing cyclization behavior,
which was characterized by differential scanning calorimetry (DSC), fourier transform
infrared spectroscopy (FTIR), and thermogravimetric analysis (TGA). Significantly, DSC
exotherms were reduced and cyclization occurred much faster reaching a greater thermal
stability when NIPAM was introduced at slow feed rates.
Results and Discussion
Copolymer Reactivity Ratios
Copolymers of acrylonitrile (AN) and n-isopropylacrylamide (NIPAM) were
prepared utilizing 2-cyano-2-propyl dodecyl trithiocarbonate (CPDT) in ethylene
carbonate at 30 °C, with [AN+NIPAM]0:[CTA]0:[I]0 = 10,000:1:0.67 and [AN+NIPAM]0

118
= 20 wt.%. The concentrations of NIPAM and AN were varied to determine the reactivity
ratios by three methods: the Fineman-Ross (FR),125 the Kelen-Tüdos (KT),141 and the
non-linear least squares (NLLS)142 methods. The Mayo-Lewis equation, or the
instantaneous copolymerization equation,125 is given in Equation 20:
2
1211
2
11
11
2
112111
)1()1(2
)1(),,(
frfffr
fffrrrfGF
( 20 )
where F1 is the mole fraction of monomer 1 in the final copolymer, f1 is the mole fraction
of monomer 1 in the feed, and r1 and r2 are the reactivity ratios of monomers 1 and 2,
respectively. The reactivity ratios are defined as:
21
222
12
111 ,
k
kr
k
kr ( 21 )
in which k11, k12, k22, and k21, are the rate constants for a monomer y to add to a chain
with terminal monomer x, kxy. The classical FR method is expressed as follows:
21 rHrG
( 22 )
where G and H are defined as:
YXHYYXG /,/)1( 2 ( 23 )
in which X and Y are the molar fraction ratios in the feed and in the final copolymer,
respectively:
2121 /,/ FFYffX
( 24 )
The plot of G versus H gives a straight line with the slope as r1 and the intercept
of the y-axis as r2.

119
The KT model defines new parameters to approximate a linear relationship from
the Mayo-Lewis equation as follows:
22
1 )(rr
r
( 25 )
where η and ξ are represented by:
)/(),/( HHHG ( 26 )
and α is a constant defined as:
2/1)( Mm HH ( 27 )
in which Hm and HM are the lowest and highest values calculated for H from the series of
measurements. The plot of η versus ξ gives a straight line with extrapolation to ξ = 1 as r1
and to 0 gives r2/α.
The NLLS method is the most accurate method, which fits Eqn. 28 to the
composition data seeking to minimize the difference between the fitting function and the
real data by iteratively changing the fitting parameters to find the global minimum in the
weighted sum of squares error defined by:142
2
1
211121
),,(),(
n
i
ii rrfGFrrSSE
( 28 )
where n is the number of data points and σ is the standard deviation of the error
distribution in the measured value of F1.
The copolymer compositions were determined by 1H-NMR as shown for a 5
mol% NIPAM copolymer in Figure 60.

120
Figure 60. 1H-NMR of 95/5 p(AN-co-NIPAM).
The polymer peaks (Figure 60, ‘b’) c.a. 2 ppm, corresponding to backbone
protons, were integrated and normalized to the methyl groups on the NIPAM monomer
(Figure 60, ‘a’) c.a. 1.1 ppm. The composition of the 5 mol% NIPAM copolymer was
then determined as follows:
87.3633,00.66 mnbma ( 29 )
where m is the normalized number of NIPAM units per a chain and n is the normalized
number of acrylonitrile units per a chain. Solving for m and n, the mole fraction of AN in
the copolymer, FAN, is given:
%100
mn
nFAN
( 30 )

121
The monomer mole fractions in the feed and in the final copolymer composition
under low conversion are reported in Table 20. Copolymer conversion was
experimentally limited by quenching the reaction in liquid nitrogen after 2 hours (≈ 10%
conversion) in order to prevent compositional drift associated with depletion of the more
reactive monomer with increasing conversion.143 Polymers were then purified by
precipitation into water (repeated twice) before being collected by filtration.
Table 20
Comonomer Mole Fractions in the Feed and the Final Copolymer for AN and NIPAM
fAN fNIPAM FAN FNIPAM
0.98 0.02 0.932 0.068
0.95 0.05 0.880 0.120
0.85 0.15 0.769 0.231
0.65 0.35 0.566 0.434
0.45 0.55 0.347 0.653
0.25 0.75 0.311 0.689
The reactivity ratios were then determined by the FR and KT methods as shown
in Figure 61. These results along with those determined by the NLLS method are
compiled in Table 21. The reactivity ratios calculated by these three methods are in good
agreement and the reactivity ratio of NIPAM is larger than that of AN, indicating that
NIPAM possesses higher reactivity than AN. The correlation coefficients (r2 values) are
all very close to 1, which suggests the fits correlate well with the experimental results.
However, both reactivity ratios are less than 1, which suggests that both monomers favor

122
cross-propagation leading to an alternating copolymer. Therefore, it is expected that the
NIPAM content will be richer in the copolymer than in the feed for polymers with 2−5
mol% NIPAM. The composition profiles predicted by the three methods are shown in
Figure 62.
Figure 61. Reactivity ratios determined by the (a) Fineman-Ross and (b) Kelen-Tüdos
methods.
Table 21
Reactivity Ratios for AN and NIPAM
Method rAN rNIPAM r2
(correlation coef.) NLLS 0.39 0.72 0.951
FR 0.26 0.47 0.947
KT 0.32 0.78 0.963
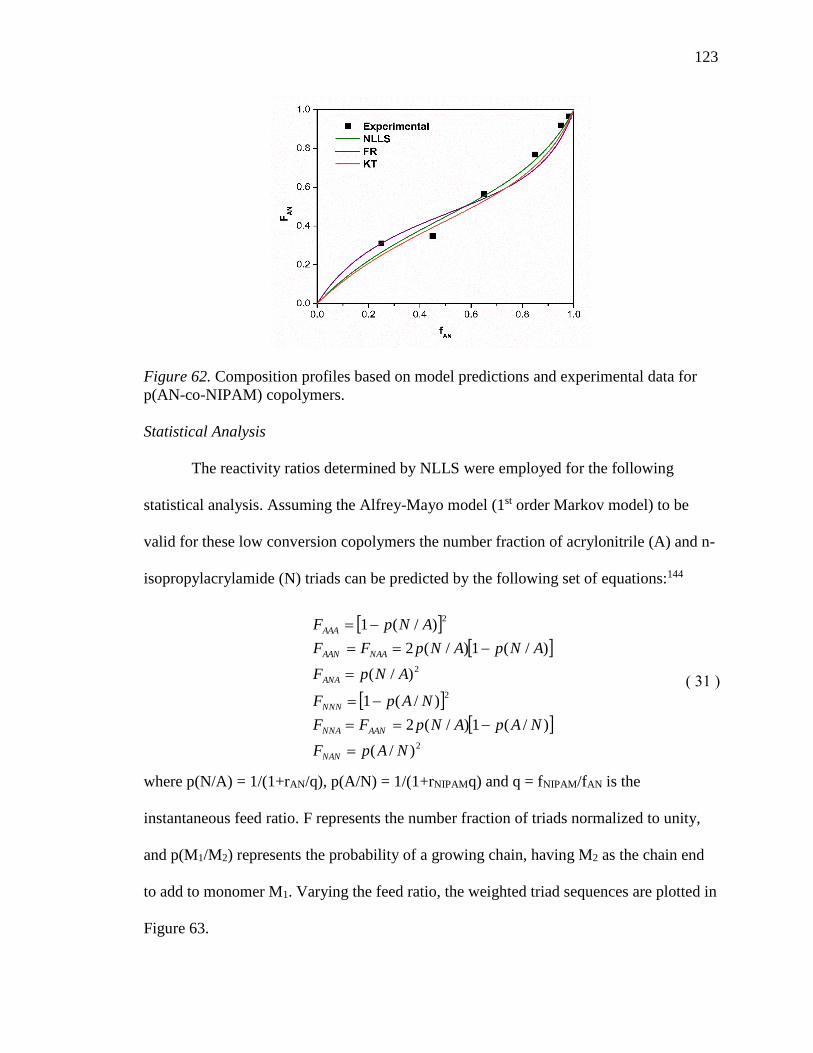
123
Figure 62. Composition profiles based on model predictions and experimental data for
p(AN-co-NIPAM) copolymers.
Statistical Analysis
The reactivity ratios determined by NLLS were employed for the following
statistical analysis. Assuming the Alfrey-Mayo model (1st order Markov model) to be
valid for these low conversion copolymers the number fraction of acrylonitrile (A) and n-
isopropylacrylamide (N) triads can be predicted by the following set of equations:144
2
2
2
2
)/(
)/(1)/(2
)/(1
)/(
)/(1)/(2
)/(1
NApF
NApANpFF
NApF
ANpF
ANpANpFF
ANpF
NAN
AANNNA
NNN
ANA
NAAAAN
AAA
( 31 )
where p(N/A) = 1/(1+rAN/q), p(A/N) = 1/(1+rNIPAMq) and q = fNIPAM/fAN is the
instantaneous feed ratio. F represents the number fraction of triads normalized to unity,
and p(M1/M2) represents the probability of a growing chain, having M2 as the chain end
to add to monomer M1. Varying the feed ratio, the weighted triad sequences are plotted in
Figure 63.
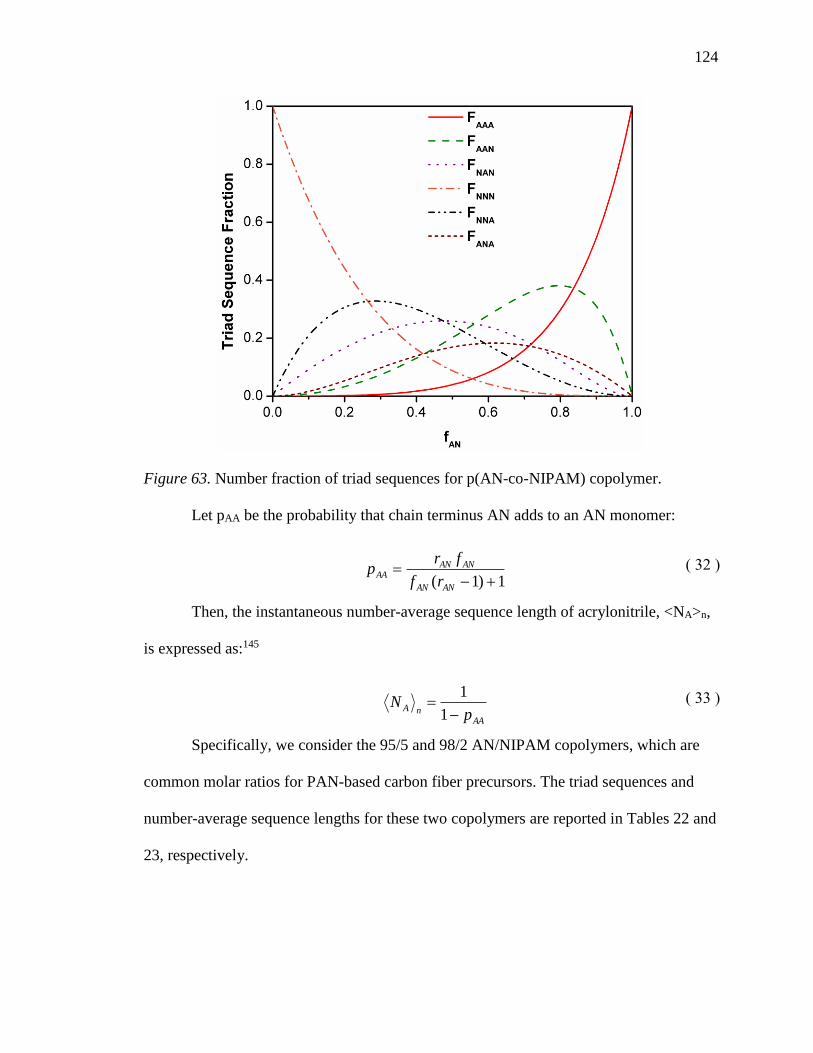
124
Figure 63. Number fraction of triad sequences for p(AN-co-NIPAM) copolymer.
Let pAA be the probability that chain terminus AN adds to an AN monomer:
1)1(
ANAN
ANANAA
rf
frp
( 32 )
Then, the instantaneous number-average sequence length of acrylonitrile, <NA>n,
is expressed as:145
AAnA
pN
1
1
( 33 )
Specifically, we consider the 95/5 and 98/2 AN/NIPAM copolymers, which are
common molar ratios for PAN-based carbon fiber precursors. The triad sequences and
number-average sequence lengths for these two copolymers are reported in Tables 22 and
23, respectively.
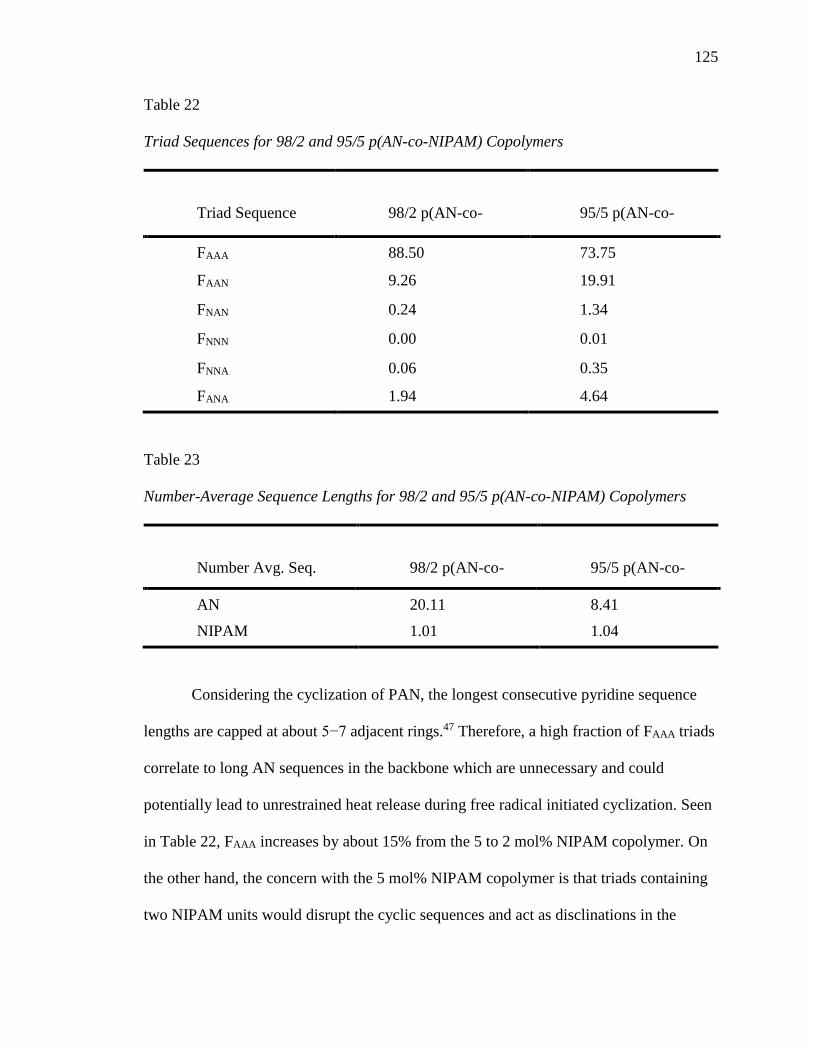
125
Table 22
Triad Sequences for 98/2 and 95/5 p(AN-co-NIPAM) Copolymers
Triad Sequence 98/2 p(AN-co-
NIPAM) (%)
95/5 p(AN-co-
NIPAM) (%) FAAA 88.50 73.75
FAAN 9.26 19.91
FNAN 0.24 1.34
FNNN 0.00 0.01
FNNA 0.06 0.35
FANA 1.94 4.64
Table 23
Number-Average Sequence Lengths for 98/2 and 95/5 p(AN-co-NIPAM) Copolymers
Number Avg. Seq.
Length
98/2 p(AN-co-
NIPAM)
95/5 p(AN-co-
NIPAM) AN 20.11 8.41
NIPAM 1.01 1.04
Considering the cyclization of PAN, the longest consecutive pyridine sequence
lengths are capped at about 5−7 adjacent rings.47 Therefore, a high fraction of FAAA triads
correlate to long AN sequences in the backbone which are unnecessary and could
potentially lead to unrestrained heat release during free radical initiated cyclization. Seen
in Table 22, FAAA increases by about 15% from the 5 to 2 mol% NIPAM copolymer. On
the other hand, the concern with the 5 mol% NIPAM copolymer is that triads containing
two NIPAM units would disrupt the cyclic sequences and act as disclinations in the
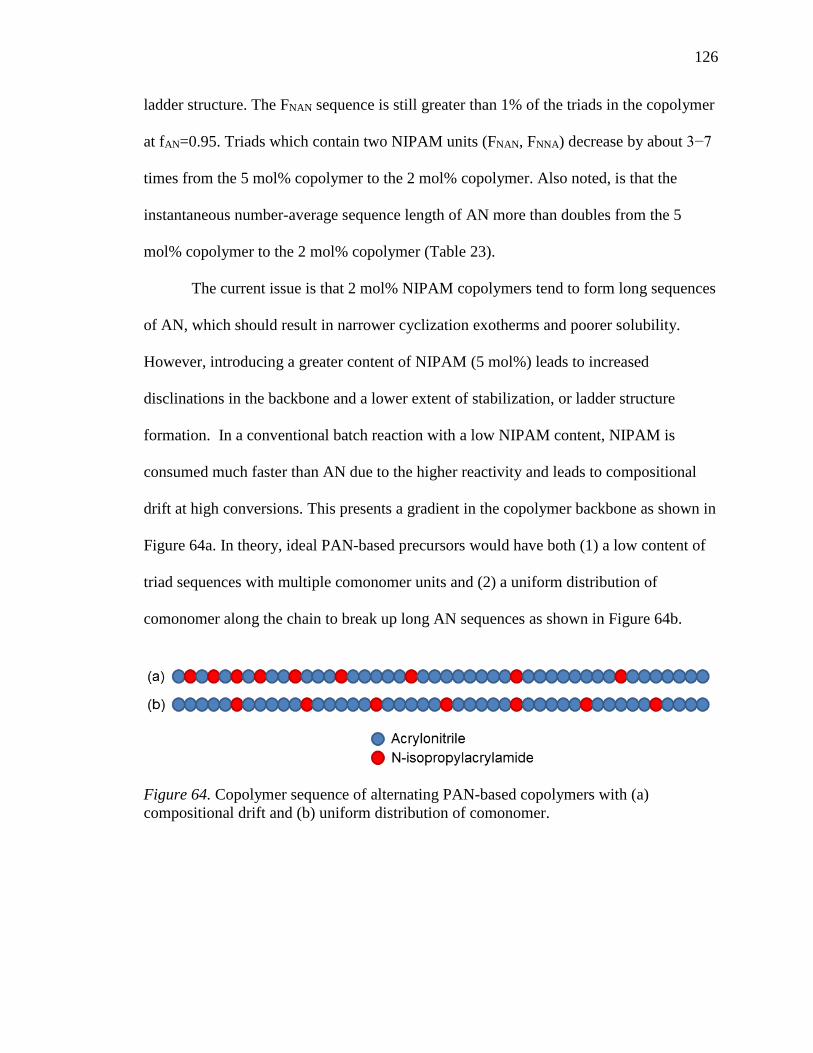
126
ladder structure. The FNAN sequence is still greater than 1% of the triads in the copolymer
at fAN=0.95. Triads which contain two NIPAM units (FNAN, FNNA) decrease by about 3−7
times from the 5 mol% copolymer to the 2 mol% copolymer. Also noted, is that the
instantaneous number-average sequence length of AN more than doubles from the 5
mol% copolymer to the 2 mol% copolymer (Table 23).
The current issue is that 2 mol% NIPAM copolymers tend to form long sequences
of AN, which should result in narrower cyclization exotherms and poorer solubility.
However, introducing a greater content of NIPAM (5 mol%) leads to increased
disclinations in the backbone and a lower extent of stabilization, or ladder structure
formation. In a conventional batch reaction with a low NIPAM content, NIPAM is
consumed much faster than AN due to the higher reactivity and leads to compositional
drift at high conversions. This presents a gradient in the copolymer backbone as shown in
Figure 64a. In theory, ideal PAN-based precursors would have both (1) a low content of
triad sequences with multiple comonomer units and (2) a uniform distribution of
comonomer along the chain to break up long AN sequences as shown in Figure 64b.
Figure 64. Copolymer sequence of alternating PAN-based copolymers with (a)
compositional drift and (b) uniform distribution of comonomer.
127
Semibatch reactions
Figure 65. Semibatch reaction setup.
Herein, we investigate whether starving the reaction of the more reactive NIPAM
results in a more uniform distribution along the copolymer backbone as evidenced by
changes in the cyclization behavior. Semibatch reactions were prepared as shown in
Figure 65. Following the same procedure as the batch reactions at 30 °C, V-70 (0.010
mmol, 3 mg), CPDT (0.015 mmol, 51 mg), and a predetermined concentration of each
monomer (20 wt. % solution) were added to a 100 mL round bottom flask. The reaction
vessel was purged with nitrogen for 1 hour at 0 °C and then transferred to an oil bath at
30 °C and continued purging throughout the duration of the reaction. Utilizing a syringe
pump, a 20 wt. % solution of NIPAM dissolved in a mixture of 50/50 (w:w) of ethylene
carbonate and DMF was injected at a predetermined rate into the reaction vessel. The
apparent “t0” concentration is defined as the initial concentration of NIPAM in the
reaction vessel, and “tf” is the final concentration after the syringe pump has completed
the injection. A total of three semibatch reactions (SB) and a control “Batch”
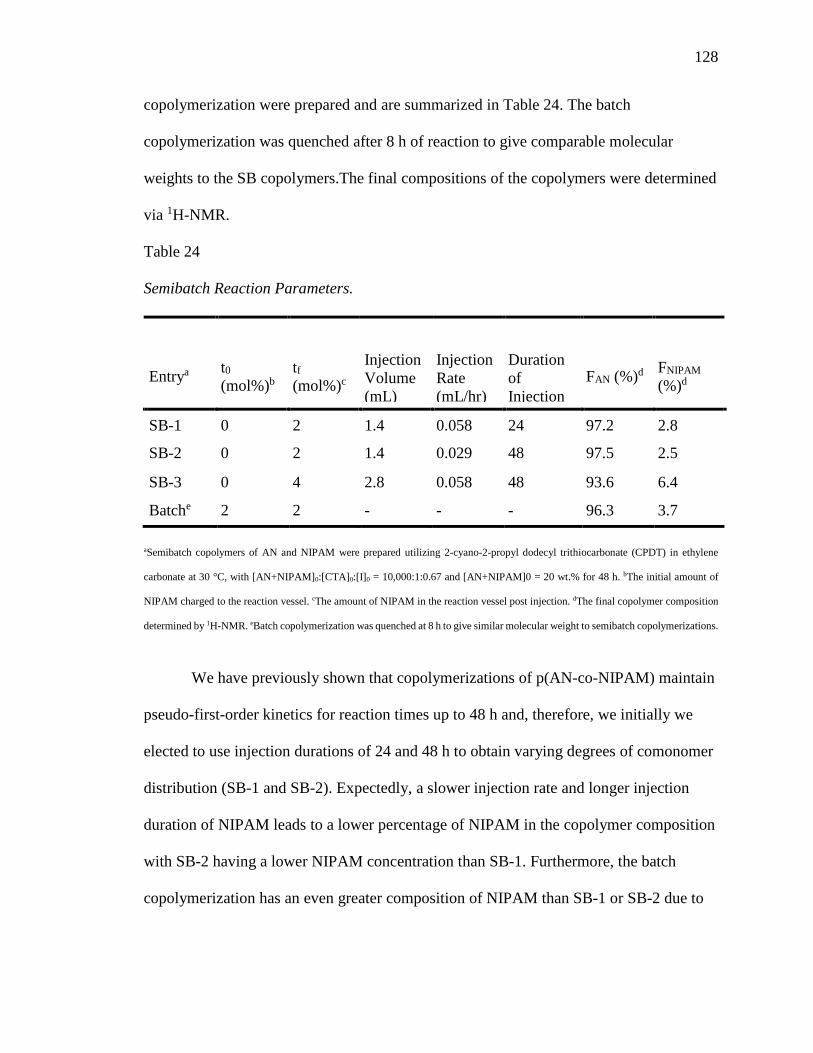
128
copolymerization were prepared and are summarized in Table 24. The batch
copolymerization was quenched after 8 h of reaction to give comparable molecular
weights to the SB copolymers.The final compositions of the copolymers were determined
via 1H-NMR.
Table 24
Semibatch Reaction Parameters.
Entrya t0
(mol%)b
tf
(mol%)c
Injection
Volume
(mL)
Injection
Rate
(mL/hr)
Duration
of
Injection
(hr)
FAN (%)d FNIPAM
(%)d
SB-1 0 2 1.4 0.058 24 97.2 2.8
SB-2 0 2 1.4 0.029 48 97.5 2.5
SB-3 0 4 2.8 0.058 48 93.6 6.4
Batche 2 2 - - - 96.3 3.7
aSemibatch copolymers of AN and NIPAM were prepared utilizing 2-cyano-2-propyl dodecyl trithiocarbonate (CPDT) in ethylene
carbonate at 30 °C, with [AN+NIPAM]0:[CTA]0:[I]0 = 10,000:1:0.67 and [AN+NIPAM]0 = 20 wt.% for 48 h. bThe initial amount of
NIPAM charged to the reaction vessel. cThe amount of NIPAM in the reaction vessel post injection. dThe final copolymer composition
determined by 1H-NMR. eBatch copolymerization was quenched at 8 h to give similar molecular weight to semibatch copolymerizations.
We have previously shown that copolymerizations of p(AN-co-NIPAM) maintain
pseudo-first-order kinetics for reaction times up to 48 h and, therefore, we initially we
elected to use injection durations of 24 and 48 h to obtain varying degrees of comonomer
distribution (SB-1 and SB-2). Expectedly, a slower injection rate and longer injection
duration of NIPAM leads to a lower percentage of NIPAM in the copolymer composition
with SB-2 having a lower NIPAM concentration than SB-1. Furthermore, the batch
copolymerization has an even greater composition of NIPAM than SB-1 or SB-2 due to
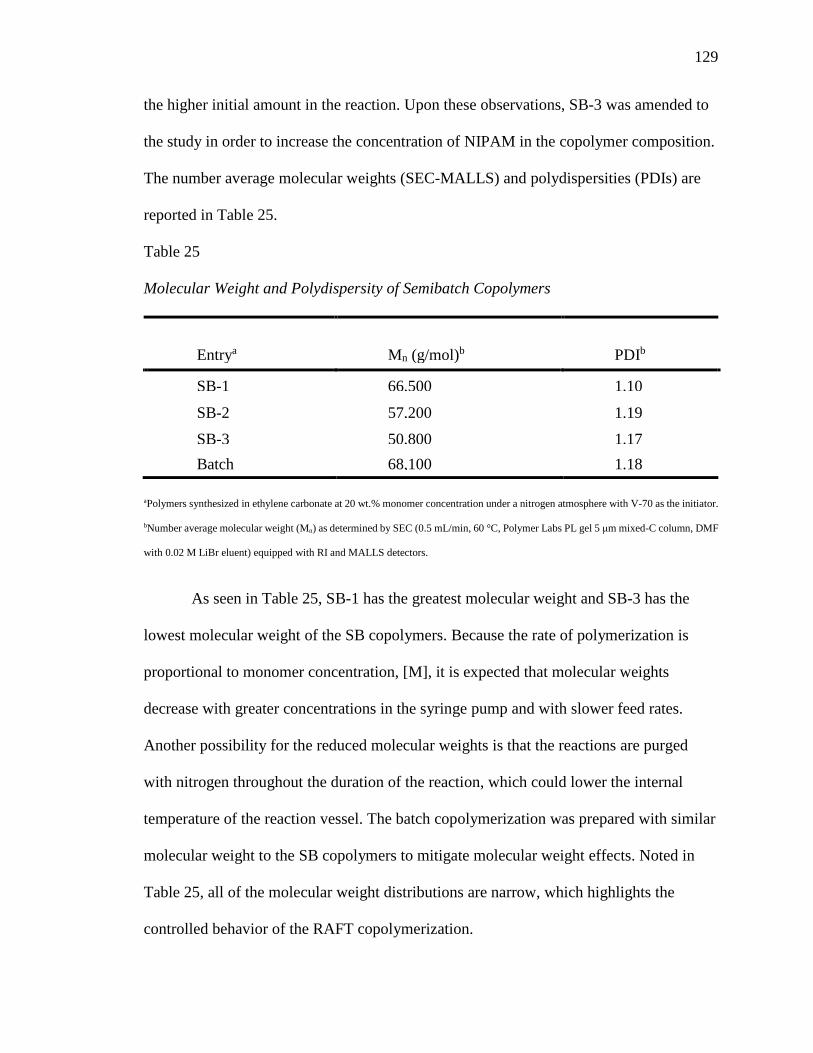
129
the higher initial amount in the reaction. Upon these observations, SB-3 was amended to
the study in order to increase the concentration of NIPAM in the copolymer composition.
The number average molecular weights (SEC-MALLS) and polydispersities (PDIs) are
reported in Table 25.
Table 25
Molecular Weight and Polydispersity of Semibatch Copolymers
Entrya Mn (g/mol)b PDIb
SB-1 66,500 1.10
SB-2 57,200 1.19
SB-3 50,800 1.17
Batch 68,100 1.18
aPolymers synthesized in ethylene carbonate at 20 wt.% monomer concentration under a nitrogen atmosphere with V-70 as the initiator.
bNumber average molecular weight (Mn) as determined by SEC (0.5 mL/min, 60 °C, Polymer Labs PL gel 5 μm mixed-C column, DMF
with 0.02 M LiBr eluent) equipped with RI and MALLS detectors.
As seen in Table 25, SB-1 has the greatest molecular weight and SB-3 has the
lowest molecular weight of the SB copolymers. Because the rate of polymerization is
proportional to monomer concentration, [M], it is expected that molecular weights
decrease with greater concentrations in the syringe pump and with slower feed rates.
Another possibility for the reduced molecular weights is that the reactions are purged
with nitrogen throughout the duration of the reaction, which could lower the internal
temperature of the reaction vessel. The batch copolymerization was prepared with similar
molecular weight to the SB copolymers to mitigate molecular weight effects. Noted in
Table 25, all of the molecular weight distributions are narrow, which highlights the
controlled behavior of the RAFT copolymerization.

130
Stabilization Behavior of Semibatch Copolymers
To evaluate the semibatch reactions, the efficacy of cyclization was investigated
via DSC, FTIR, and TGA. The results of the DSC exotherms at 5 °C/min are shown in
Figure 66. Most significantly, the semibatch copolymers have broader and reduced
exotherms as compared to the batch copolymer. SB-1 behaves most similar to the batch
copolymer perhaps due to the closest composition and the shorter feed duration. SB-3
also yields a decreased exotherm temperature and an even broader peak. Of particular
interest is SB-2, which contains the lowest concentration of NIPAM, displays a bimodal
DSC exotherm. Bimodal DSC exotherms are common for acidic copolymers wherein the
ionic cyclization pathway occurs at a lower temperature and then at a higher temperature
the free radical pathway is activated similar to PAN homopolymer.25 While the batch
copolymer initiates cyclization above 260 °C, all three of the SB copolymers initiate
cyclization below 245 °C, despite the final composition of NIPAM in the copolymer.
This result importantly suggests that cyclization temperature can be manipulated by
controlling the feed rate of NIPAM. We presume that controlling the feed of NIPAM
allows for a greater distribution of the comonomer throughout the copolymer, thereby
promoting a greater extent of ionic cyclization and lowering the exotherm temperature.
The properties of the exotherms at 5 °C/min are summarized in Table 26.

131
Figure 66. DSC exotherms of semibatch copolymers at a 5 °C/min ramp rate.
Table 26
Peak Exotherm Behavior at 5 °C/min for Semibatch Copolymer.
5 °C/min
Entry Tp (°C)a Tp Breadth (°C)b Intensity (J/g)c Heat Flow (W/g)d
SB-1 258 16 528 7.2
SB-2e 262, 274 29 537 2.5, 2.8
SB-3 251 32 482 3.3
Batch 266 7 487 17.4
aPeak temperature determined as the temperature for maximum heat flow. bThe breadth determined as the difference of the onset and
offset of the peak. cThe intensity is taken as the area under the curve. dThe maximum heat flow at the given peak temperature. eSB-2
displays bimodal peaks, breadth and intensity given as the sum of both peaks.
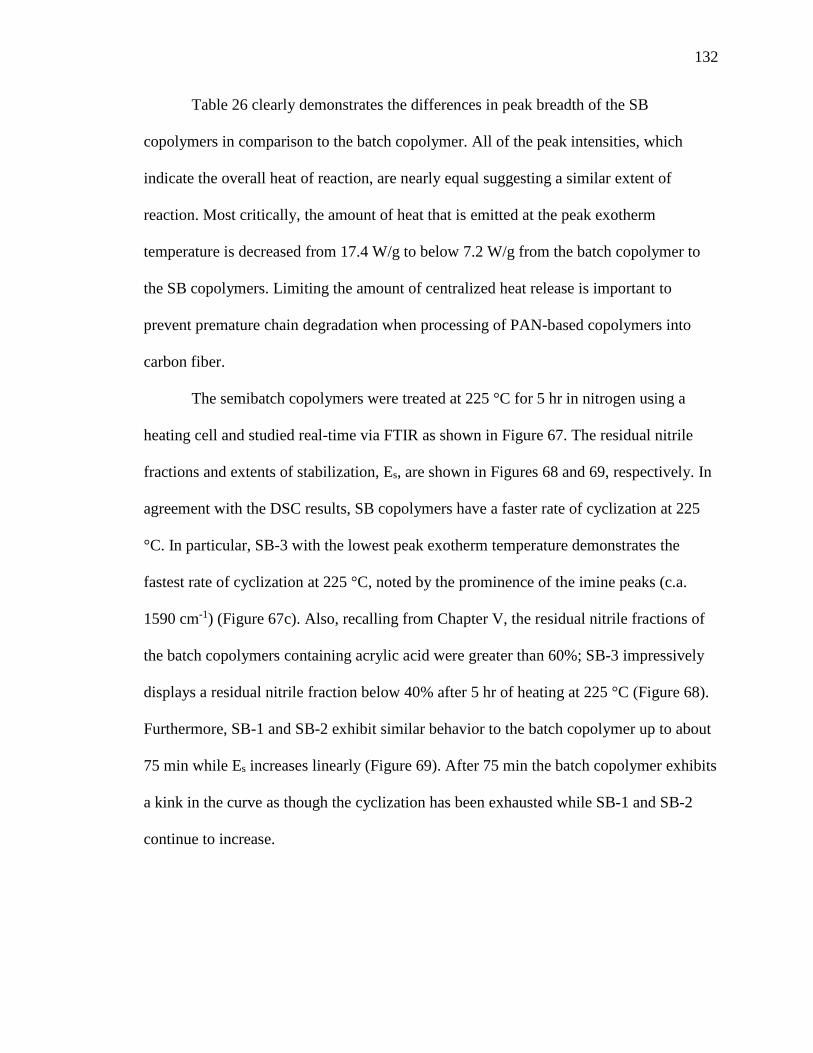
132
Table 26 clearly demonstrates the differences in peak breadth of the SB
copolymers in comparison to the batch copolymer. All of the peak intensities, which
indicate the overall heat of reaction, are nearly equal suggesting a similar extent of
reaction. Most critically, the amount of heat that is emitted at the peak exotherm
temperature is decreased from 17.4 W/g to below 7.2 W/g from the batch copolymer to
the SB copolymers. Limiting the amount of centralized heat release is important to
prevent premature chain degradation when processing of PAN-based copolymers into
carbon fiber.
The semibatch copolymers were treated at 225 °C for 5 hr in nitrogen using a
heating cell and studied real-time via FTIR as shown in Figure 67. The residual nitrile
fractions and extents of stabilization, Es, are shown in Figures 68 and 69, respectively. In
agreement with the DSC results, SB copolymers have a faster rate of cyclization at 225
°C. In particular, SB-3 with the lowest peak exotherm temperature demonstrates the
fastest rate of cyclization at 225 °C, noted by the prominence of the imine peaks (c.a.
1590 cm-1) (Figure 67c). Also, recalling from Chapter V, the residual nitrile fractions of
the batch copolymers containing acrylic acid were greater than 60%; SB-3 impressively
displays a residual nitrile fraction below 40% after 5 hr of heating at 225 °C (Figure 68).
Furthermore, SB-1 and SB-2 exhibit similar behavior to the batch copolymer up to about
75 min while Es increases linearly (Figure 69). After 75 min the batch copolymer exhibits
a kink in the curve as though the cyclization has been exhausted while SB-1 and SB-2
continue to increase.
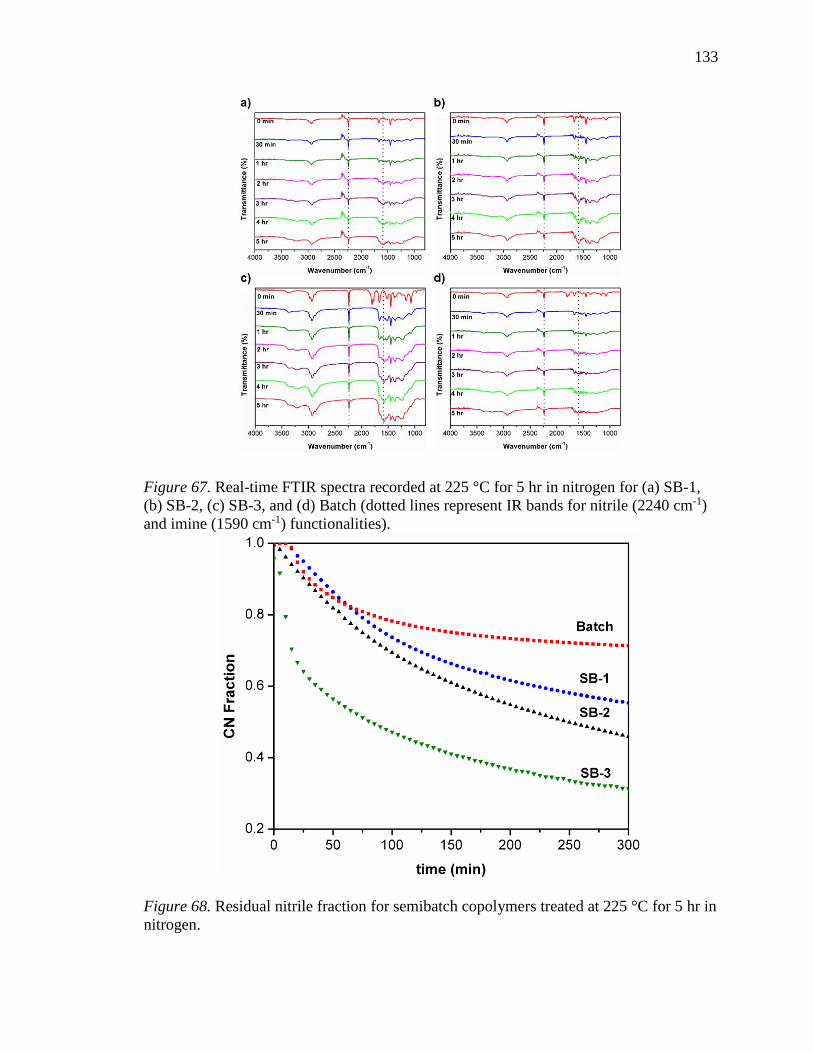
133
Figure 67. Real-time FTIR spectra recorded at 225 °C for 5 hr in nitrogen for (a) SB-1,
(b) SB-2, (c) SB-3, and (d) Batch (dotted lines represent IR bands for nitrile (2240 cm-1)
and imine (1590 cm-1) functionalities).
Figure 68. Residual nitrile fraction for semibatch copolymers treated at 225 °C for 5 hr in
nitrogen.

134
Figure 69. Extent of stabilization for semibatch copolymers treated at 225 °C for 5 hr in
nitrogen.
Thermal stabilities were studied via TGA by ramping in nitrogen at 10 °C/min as
shown in Figure 70. Post cyclization, all copolymers exhibit gradual mass loss c.a.
270−450 °C in the form of small molecule volatiles such as ammonia, hydrogen cyanide,
methane, water, carbon monoxide, and carbon dioxide.7,8,43 It is suggested that a more
complete ladder structure would result in fewer impurities, less small volatile formation,
and greater mass stability to during carbonization (temperatures above 800 °C). Evident
from Figure 70, SB-2 and SB-3 portray the greatest thermal stability by the lowest mass
loss up to 700 °C, while the batch copolymer results in the lowest mass retention at 700
°C. Furthermore, the SB-2 and SB-3 exhibit lower degradation temperature onsets and
more gradual mass loss between 300−350 °C, which is beneficial to carbon fiber
processing.

135
Figure 70. TGA curves for semibatch copolymers ramped at 10 °C/min in nitrogen to
700 °C.
The semibatch copolymers were evaluated by the Pre-ox 2 method as shown in
Figure 71. Interestingly, all of the copolymers result in a similar final mass percentage
after the thermo-oxidative temperature ramp to 700 °C. However, the SB-1 and SB-3
copolymers preserve a greater mass up to 350 °C, unlike SB-2 and the batch copolymer.
Post 350 °C, SB-1 and SB-3 copolymers begin to degrade and lose a significant mass
percentage. The SB-3 copolymer loses the greatest amount of mass above 400 °C, which
was characteristic of the higher compositions of the 5 mol% NIPAM copolymers in
Chapter V. Therefore, this mass loss is currently attributed to degradation of the NIPAM
units, but further study is required.

136
Figure 71. TGA curves for semibatch copolymers treated in air at 230, 245, 253, and 265
°C for 15 min each before ramping in nitrogen at 10 °C/min to 700 °C.
Summary
Reactivity ratios were successfully determined for p(AN-co-NIPAM) at 30 °C in
ethylene carbonate and in the presence of CPDT. The reactivity ratios reveal that NIPAM
has a higher reactivity as compared to AN, which results in compositional drift and
gradient copolymers. The effect of compositional drift and comonomer sequencing on the
cyclization were investigated by a semibatch RAFT copolymerization wherein NIPAM
was injected into the reaction vessel at predetermined rates. The cyclization was
characterized by DSC, FTIR, and TGA. It was found that the slower addition of NIPAM
and greater amounts of the NIPAM led to more reduced exotherm temperatures and
broader exotherm peaks. Furthermore, copolymers SB-2 and SB-3, with presumably the
greatest distribution of NIPAM along the backbone, present (1) the lowest peak onset
137
temperatures, (2) the fastest rates of cyclization, and (3) the greatest thermal stability in
nitrogen up to 700 °C. This study has significantly demonstrated the ability to tune PAN-
based copolymer stabilization behavior through the utilization of novel semibatch
reaction techniques in conjunction with RAFT polymerization.
138
CHAPTER VII
ATTEMPTS TO CONTROL TACTICITY IN POLYACRYLONITRILE
Abstract
The tacticity of polyacrylonitrile is proposed to influence cyclization behavior and
efficiency. In this study, several methods were employed in attempt to simultaneously
control the molecular weight and tacticity of PAN via RAFT polymerization in
conjunction with the use of isobutyraldehyde, fluoroalcohol solvents, and Lewis acid
additives. Herein, the triad tacticity of modified PAN samples were compared to a
baseline PAN sample (mm = 0.28, rr = 0.21, mr = 0.51), but no statistically significant
change in tacticity was observed.
Results and Discussion
Both isotactic and syndiotactic PAN should be considered when investigating
tacticity effects on cyclization. Previously, isotactic PAN has been reported to have a
higher activation energy17 and a higher cyclization initiation temperature63 than
conventional atactic PAN. Although these studies suggest tacticity dependence on the
cyclization of PAN, it is worth investigating tacticity effects in a controlled
polymerization system to avoid confounding variables. Additionally, there are no reports
on how syndiotactic PAN impacts cyclization efficiency. Thus, we also consider
syndiotactic-mediated polymerization of acrylonitrile.
The “baseline” PAN was synthesized in the presence of cyano-2-isopropyl
dodecyl trithiocarbonate (CPDT) at 30 °C with [M]0:[CPDT]0:[V-70]0=10,000:1:0.67,
and 20 wt. % monomer in ethylene carbonate. The triad tacticity was determined by
quantitative 13C-NMR as shown in Figures 72 and 73. Both the nitrile carbon (δ (ppm):

139
120.1, rr; 120.5, mr; 120.8, mm) and the methine carbon (δ (ppm): 27.2, mm; 27.9, mr;
28.4, rr) can be assessed, where ‘r’ and ‘m’ are racemic linkages and meso linkages,
respectively.107 For the purposes of this study, the methine carbons were used for
comparison of triad sequences.
Figure 72. Tacticity assignments of baseline PAN for the nitrile carbon via 13C-NMR (δ (ppm): 120.1, rr; 120.5, mr; 120.8, mm).
Figure 73. Tacticity assignments of baseline PAN for the methine carbon via 13C-NMR
(δ (ppm): 27.2, mm; 27.9, mr; 28.4, rr).
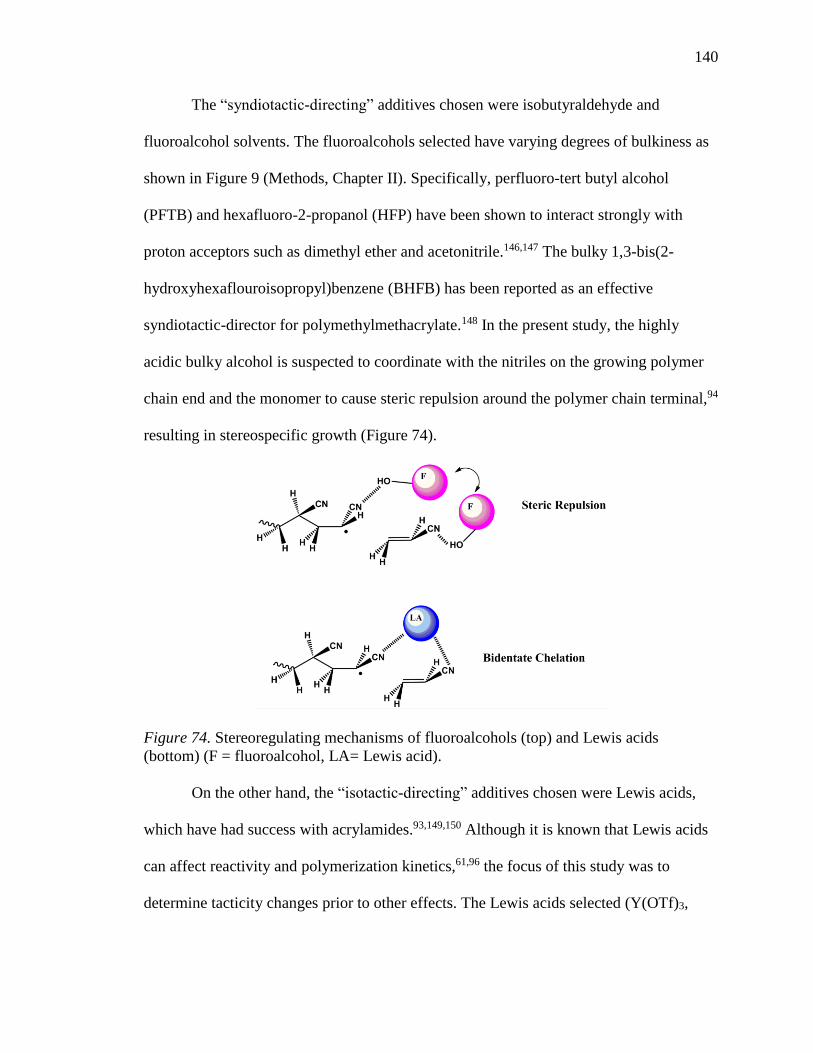
140
The “syndiotactic-directing” additives chosen were isobutyraldehyde and
fluoroalcohol solvents. The fluoroalcohols selected have varying degrees of bulkiness as
shown in Figure 9 (Methods, Chapter II). Specifically, perfluoro-tert butyl alcohol
(PFTB) and hexafluoro-2-propanol (HFP) have been shown to interact strongly with
proton acceptors such as dimethyl ether and acetonitrile.146,147 The bulky 1,3-bis(2-
hydroxyhexaflouroisopropyl)benzene (BHFB) has been reported as an effective
syndiotactic-director for polymethylmethacrylate.148 In the present study, the highly
acidic bulky alcohol is suspected to coordinate with the nitriles on the growing polymer
chain end and the monomer to cause steric repulsion around the polymer chain terminal,94
resulting in stereospecific growth (Figure 74).
Figure 74. Stereoregulating mechanisms of fluoroalcohols (top) and Lewis acids
(bottom) (F = fluoroalcohol, LA= Lewis acid).
On the other hand, the “isotactic-directing” additives chosen were Lewis acids,
which have had success with acrylamides.93,149,150 Although it is known that Lewis acids
can affect reactivity and polymerization kinetics,61,96 the focus of this study was to
determine tacticity changes prior to other effects. The Lewis acids selected (Y(OTf)3,

141
Yb(OTf)3, YbCl3, ZnCl2, AlCl3, and MgCl2) have varying degrees of acidity and atomic
radii. The literature suggests that larger atomic radii and stronger acids with a higher
coordination number are the most effective for acrylamide-based monomers.96,150 The
Lewis acids are expected to form a bidentate chelation with the nitriles on the growing
chain end and the incoming monomer to mediate meso-addition,94 resulting in isotactic
growth (Figure 74). To obey the bidentate chelation in acrylamides, only a catalytic
amount of Lewis acid was utilized.61 Alternatively, fairly large quantities of MgCl2 and
NiCl2 have been used for polyacrylonitrile, forming 1:1 complexes with the monomer in
a “solid state template-assisted” polymerization,60,63 which led us to consider larger
quantities of Lewis acids in the polymerizations. The triad tacticities of the
polymerizations with the added stereoregulators are summarized in Table 27.
Table 27
Triad Tacticities of PAN polymers with Stereoregularity Additives
Entrya Additive Concentration
[Additive]:[I]
rr (%)b mr (%)b mm (%)b
1. Control none none 21.3 50.7 28.0
2 Isobutyraldehyde 7,000:1 21.7 50.5 27.7
3c Isobutyraldehyde 7,000:1 22.1 50.6 27.3
4 HFP 15:1 22.1 51.0 26.9
5 HFP 150:1 20.8 51.3 27.9
6 HFP 2,700:1 21.8 50.7 27.5
7 PFTB 15:1 21.8 51.3 26.9
8 PFTB 250:1 21.5 51.8 26.7
9 BHFB 15:1 21.4 51.0 27.6

142
Table 27 (continued).
Entrya Additive Concentration
[Additive]:[I]
rr (%)b mr (%)b mm (%)b
10 BHFB 500:1 21.4 41.1 27.5
11 YbCl3 15:1 21.4 51.1 27.5
12 ZnCl2 15:1 21.4 51.8 26.9
13 ZnCl2 150:1 21.0 51.2 27.8
14 ZnCl2 500:1 21.1 51.2 27.7
15 ZnCl2 5,000:1 21.3 50.4 28.4
16 AlCl3 15:1 21.2 51.2 27.7
17 AlCl3 150:1 20.4 51.5 28.1
18d AlCl3 500:1 - - -
19d AlCl3 5,000:1 - - -
20 Y(OTf)3 15:1 20.6 51.8 27.7
21 Y(OTf)3 150:1 21.1 51.7 27.2
22 Y(OTf)3 750:1 20.4 52.2 27.4
23 Yb(OTf)3 15:1 20.9 51.3 27.8
24 Yb(OTf)3 150:1 22.5 49.7 27.8
25 Yb(OTf)3 500:1 21.1 51.1 27.8
26e ZnCl2 500:1 20.2 50.0 29.8
27e Yb(OTf)3 500:1 23.3 50.8 25.9
28e Y(OTf)3 500:1 - - -
29e AlCl3 500:1 - - -
30e MgCl2 500:1 - - -
aPolymers prepared at 30 °C in the presence of CPDT at a [M]0:[CPDT]0:[V-70]0 = 10,000:1:0.67 in ethylene carbonate. bTriad tacticities
determined via 13C-NMR in d6-DMSO by the peak splitting of the methine carbon. cConcentration of ethylene carbonate reduced to 70
wt.%. dEntries 18 and 19 turned yellow during polymerization and resulted in low polymer yield. eEntries 26-30 were conducted in bulk
with no ethylene carbonate.
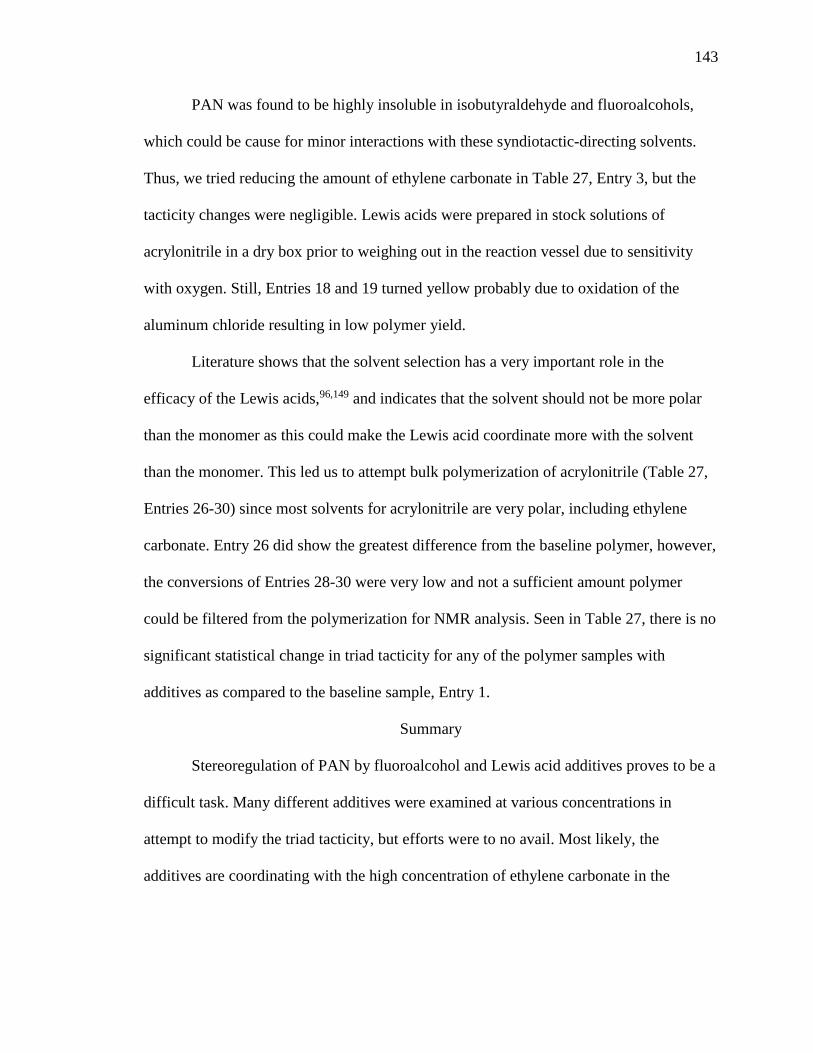
143
PAN was found to be highly insoluble in isobutyraldehyde and fluoroalcohols,
which could be cause for minor interactions with these syndiotactic-directing solvents.
Thus, we tried reducing the amount of ethylene carbonate in Table 27, Entry 3, but the
tacticity changes were negligible. Lewis acids were prepared in stock solutions of
acrylonitrile in a dry box prior to weighing out in the reaction vessel due to sensitivity
with oxygen. Still, Entries 18 and 19 turned yellow probably due to oxidation of the
aluminum chloride resulting in low polymer yield.
Literature shows that the solvent selection has a very important role in the
efficacy of the Lewis acids,96,149 and indicates that the solvent should not be more polar
than the monomer as this could make the Lewis acid coordinate more with the solvent
than the monomer. This led us to attempt bulk polymerization of acrylonitrile (Table 27,
Entries 26-30) since most solvents for acrylonitrile are very polar, including ethylene
carbonate. Entry 26 did show the greatest difference from the baseline polymer, however,
the conversions of Entries 28-30 were very low and not a sufficient amount polymer
could be filtered from the polymerization for NMR analysis. Seen in Table 27, there is no
significant statistical change in triad tacticity for any of the polymer samples with
additives as compared to the baseline sample, Entry 1.
Summary
Stereoregulation of PAN by fluoroalcohol and Lewis acid additives proves to be a
difficult task. Many different additives were examined at various concentrations in
attempt to modify the triad tacticity, but efforts were to no avail. Most likely, the
additives are coordinating with the high concentration of ethylene carbonate in the

144
polymerization. Less polar solvent substitutes for ethylene carbonate or bulk
polymerization may help to achieve tacticity changes in the RAFT polymerization of AN.
145
CHAPTER VIII
SCALE-UP REACTIONS AND CARBON FIBER PROPERTIES
Abstract
The conventional free radical solution copolymerization of 98 mol% acrylonitrile
(AN) and 2 mol% N-isopropylacrylamide (NIPAM) was successfully scaled and spun
into fiber filaments. The morphology of the precursor fibers were then characterized by
transmission electron microscopy (TEM), optical microscopy, and X-ray diffraction
(XRD). The thermal behavior was compared to commercial white fiber precursors by
thermogravimetric analysis (TGA) and differential scanning calorimetry (DSC). The
morphology and thermal properties of the produced fiber serve as a benchmark for the
future design of precursor compositions and architectures.
Results and Discussion
Scale Up Copolymerization and Fiber Spinning
The copolymerization of 98/2 p(AN-co-NIPAM) was prepared as described in
Chapter II. The polymer solution was poured into a separation funnel heated at 80 °C by
heating tape. The solution was then discharged at a steady flow into a 20 L container of
deionized water while being mechanically stirred as shown in Figure 75a. The polymer
was then washed and re-precipitated forming white fibrous material as shown in Figure
75b.

146
Figure 75. (a) Precipitation of scale up reaction and (b) fibrous material from the
precipitation.
The PAN-based copolymer was successfully spun into a fiber bundle by Dr.
Matthew Weisenberger from the University of Kentucky into a 500 count tow as shown
in Figure 76. Copolymer composition was determined via 1H-NMR NIPAM as shown in
Figure 77. The number of protons in the backbone associated with AN is calculated
[(87.10-3)/3]=28.03 and then the content of AN is [28.03/(28.03+1)]=96.6 mol% and
NIPAM content is 3.4 mol%.
Figure 76. Fiber spool of 98/2 p(AN-co-NIPAM) copolymer.
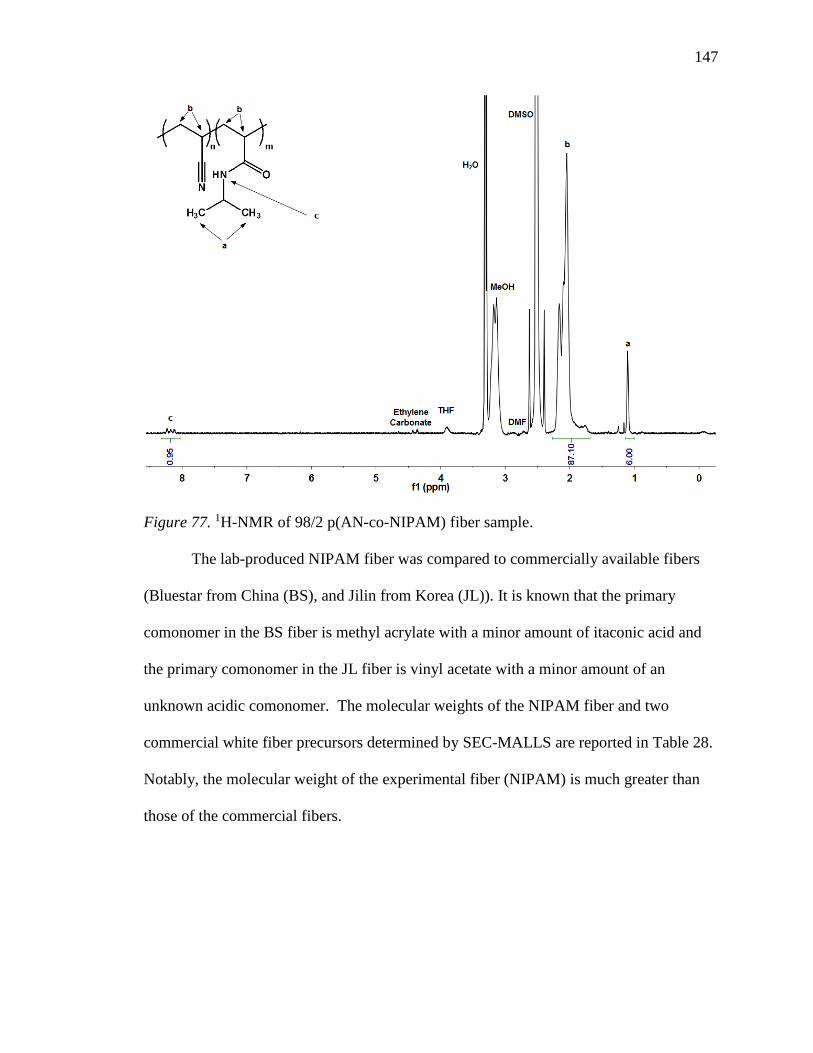
147
Figure 77. 1H-NMR of 98/2 p(AN-co-NIPAM) fiber sample.
The lab-produced NIPAM fiber was compared to commercially available fibers
(Bluestar from China (BS), and Jilin from Korea (JL)). It is known that the primary
comonomer in the BS fiber is methyl acrylate with a minor amount of itaconic acid and
the primary comonomer in the JL fiber is vinyl acetate with a minor amount of an
unknown acidic comonomer. The molecular weights of the NIPAM fiber and two
commercial white fiber precursors determined by SEC-MALLS are reported in Table 28.
Notably, the molecular weight of the experimental fiber (NIPAM) is much greater than
those of the commercial fibers.

148
Table 28
Molecular Weights and Polydispersities of White Fiber Precursors
Fiber Sample Mn (MALLS) g/mol PDI (Mw/Mn)
98/2 p(AN-co-NIPAM) (NIPAM) 147,400 1.71
Bluestar Chinese Fiber (BS) 74,400 1.48
Jilin Korean Fiber (JL) 87,200 1.93
Fiber Morphology
The NIPAM fiber precursor was converted to carbon fiber at Deakin University in
Geelong, Australia, in connection with the Carbon Fiber Nexus. The fiber was stabilized
in a series of oxidation ovens at 245, 260, 268, and 280 °C before passing through high
temperature ovens up to 1550 °C. Transmission Electron Microscopy (TEM) was
performed on cross-sections of the carbon fiber samples. TEM samples were prepared at
Deakin University (Dr. Bronwyn Fox’s research group) by embedding fiber bundles in a
copper wire and setting them with an epoxy matrix material. Samples were polished by a
precision ion polishing system at low volatage for 23 hr. High magnification TEM
images from the carbon fiber samples (Figures 78 and 79) demonstrate the characteristic
ribbon-like wavy planes of graphitic sheets as described in the model by Johnson and
coworkers.11 Surprisingly, the high magnification images show very few needle-shaped
voids or defects in the wavy patterns.

149
Figure 78. TEM image of cross-section of 98/2 p(AN-co-NIPAM) fiber treated up to
1450 °C.
Figure 79. TEM image of cross-section of 98/2 p(AN-co-NIPAM) fiber treated up to
1550 °C.

150
The optical microscopy images of the NIPAM fiber from white fiber through to
carbon fiber are shown in Figure 80. The fiber cross-sections are round and exhibit a
distribution of sizes with diameters ranging from about 5-10 μm in size. Also, some
fibers display micron sized pores, which are apparent from the white fiber through to the
carbon fiber. These defects could be residue from the polymerization or from the
spinning process. More work needs to be done to investigate the formation of these voids.
Most importantly, these experimental fibers are absent of the characteristic ‘core-shell’
morphology, or a gradient through the fiber cross-section.23 This could be beneficial to
carbon fiber performance.
Figure 80. Optical microscopy of 98/2 p(AN-co-NIPAM) (a) white fiber precursor, (b)
post oxidative stabilization up to 280 °C, (c) heating to 1450 °C, and (d) heating to 1550
°C (yellow arrows indicate micro porous defects).

151
The orientation a bundle of 20 monofilament white fibers were qualitatively
determined by azimuthal analysis using X-ray Diffraction (XRD) as compared to
commercial-grade BS fiber in Figure 81. The images display two concentric arcs, or
‘lobes’, at the top and bottom which denote the alignment of fibers with smaller arcs
indicating a greater orientation of fibers. As demonstrated in Figure 81, the NIPAM
fibers have narrower arcs, which resembles are greater alignment of the fibers as
compared to BS fibers. Alignment of the fibers is critical in maximizing carbon fiber
performance and yielding high strength materials.
Figure 81. Azimuthal analysis by XRD for (a) 98/2 p(AN-co-NIPAM) precursor white
fibers and (b) BS white fiber.
Thermal Properties
The cyclization exotherm behavior of the NIPAM fiber precursor was compared
to BS and JL commercial fibers through heat treatment in DSC at 5 °C/min as shown in
Figure 82. Evident from the DSC exotherms, the NIPAM fiber has a lower peak
exotherm temperature, but also a much narrower exotherm and a greater peak intensity.
The NIPAM fiber has a greater max heat flow relative to the commercial-grade fibers.
The exotherm behavior from DSC is summarized in Table 29.

152
Figure 82. DSC exotherms of white fiber precursors heated at 5 C/min.
Table 29
Exotherm Behavior of White Fiber Precursors Heated at 5 °C/min
Sample Peak Temp
(°C)
Peak Breadth
(°C)
Intensity
(J/g)
Max Heat Flow
(W/g)
NIPAM Fiber 260 14 473.9 8.85
BS Fiber 277 67 417.9 0.99
JL Fiber 280 63 422.8 1.33
Thermogravimetric analysis (TGA) was used to evaluate mass retention of the
fibers by heat treating up to 700 °C. The fibers were treated at 10 °C/min in nitrogen as
shown in Figure 83a and they were stabilized in air according to Pre-ox 2 (Chapter II)
before ramping in nitrogen at 10 °C/min in Figure 83b. As seen in Figure 83a, the
NIPAM precursor has a greater mass loss through the stabilization of the carbon fiber in

153
nitrogen. However, Figure 83b displays that the experimental NIPAM fiber resembles
very similar mass loss behavior to commercial-grade fiber precursors. This significantly
demonstrates the ability of a lab produced copolymer to exhibit behavior to industry
leading precursors. Using this simple copolymer composition as a benchmark, the
opportunity for advanced copolymer structures and utilization of RAFT polymerization
methods allows for further advancement of PAN-based carbon fiber precursors.
Figure 83. TGA plots of white fiber precursors (a) ramped at 10 °C/min to 700 °C in N2
and (b) ramped at 10 °C/min in air and held at isotherms of 245, 260, 268, and 280 °C for
15 min each and then ramped at 10 °C/min to 700 °C in N2.
Summary
Polyacrylonitrile with 2 mol% NIPAM was successfully spun into a white fiber
precursor. The fiber precursor morphology was characterized by TEM, XRD, and optical
microscopy. The fiber shows minimal defects and the absence of the typical core-shell
morphology of PAN-based carbon fibers. The nano-scale TEM images yield ribbon-like
wavy planes characteristic of the graphitic sheets. The orientation of the experimental
NIPAM-containing fibers are better than analogous commercial-grade BS fibers as
evidence by azimuthal analysis. The thermal properties show that the NIPAM fibers have

154
greater exotherm intensities and narrower temperatures as compared to commercial
fibers, but the mass retention is almost identical to commercial fibers when oxidatively
stabilized prior to pyrolysis. These findings will serve as the benchmark for future
designs and compositions of precursor architectures with more advanced RAFT
polymerizations.
155
CHAPTER IX
CONCLUSIONS AND FUTURE WORK
PAN-based precursors represent more than 90% of the market for carbon fibers,
yet, only a small fraction of the theoretical strength of an ideal carbon fiber has been
achieved since their inception in 1961. This is in part due to the lack of disseminated
research on these highly proprietized materials, but also due to the ability to link
precursor composition all the way through to carbon fiber in an academic setting.
Historically, reports on PAN-based precursors have ignored fundamental polymer
characteristics such as molecular weight and polydispersity and disregard polymerization
history. To fully understand the evolution of carbon fiber and the structure-property
relationships involved with carbon fiber performance, research efforts herein have taken a
focus on finely tuning PAN-based polymer properties to better understand how these
properties influence conversion towards carbon fiber.
In Chapter III, the RAFT polymerization of AN was systematically investigated to
reach high molecular weight with low polydispersity. High molecular weight (above
100,000 g/mol) is essential for mechanical performance of carbon fiber. Upon
exploration of low temperature CPDT-mediated polymerization, molecular weights
above 170,000 g/mol can be achieved or polydispersities below 1.1 depending on the
ratio of reactants. The reactions displayed continued monomer conversion for up to 48 hr,
which has been unprecedented in the literature. It is suggested that lowering
polymerization temperature from 70 to 30 °C decreases the relative number of chain
transfer and chain termination events with respect to propagation. Significantly, this
156
result was extended to PAN-based copolymers in Chapter V, where several RAFT
copolymers exhibited controlled behavior with high molecular weights.
The effects of molecular weight, polydispersity, and polymerization were then
explored through RAFT polymerization and conventional FR solution polymerization
(Chapter IV). The low polydispersity and control exhibited by RAFT polymers clearly
demonstrated differences to the FR polymers beyond molecular weight dependences. The
RAFT homopolymers led to higher exotherm temperatures and faster liberation of heat
during cyclization. When broadened to copolymers (Chapter V), it was found that RAFT
copolymers exhibit greater thermo-oxidative stability and enhanced exotherm intensities.
It is suggested that RAFT polymerization yields fewer defects to initiate cyclization, but
also retains more mass and a higher carbon yield post cyclization when a comonomer is
present.
A series of new comonomers were introduced in Chapter V, of which NIPAM
displayed characteristics resembling traditional comonomers. Particularly, NIPAM offers
benefits to both cyclization of PAN, but also the spinning and subsequent processing of
carbon fibers. The NIPAM-containing copolymers yield reduced heat flows in the
exothermic cyclization as compared to methyl methacrylate, lowered crystallinity as
compared to acrylic acid, and showed impressive thermo-oxidative stability. The use of a
single comonomer as compared to traditional terpolymers is beneficial for the production
of carbon fibers.
PAN-co-NIPAM copolymers were further investigated in Chapter VI, wherein the
reactivity ratios were determined and the sequencing of comonomers were altered by the
use of a syringe pump continuously injecting NIPAM into the reaction vessel. The

157
distribution of NIPAM along the backbone is theortically optimized when the NIPAM
unit is placed between every 8-10 acrylonitrile units. Yet in a batch reaction, NIPAM
being a more reactive comonomer is consumed faster than acrylonitrile leading to a
gradient of NIPAM in the copolymer composition. It was clearly demonstrated that
changes in the injection rate of NIPAM led to unique copolymer behavior suggesting that
cyclization can be tuned. When NIPAM was injected at a slow feed rate over 48 hr (SB-2
and SB-3), the peak onset temperature of cyclization shifted to a lower temperature,
faster rates of cyclization were realized, and greater thermal stability in nitrogen was
achieved.
Of great interest to the academic community is the effect of polymer tacticity on
the evolution of carbon fiber and its significance. Literature suggests that isotactic-PAN
should be ideal for promoting cyclization of pendant nitrile groups. Facile methods to
alter tacticity of PAN are necessary to explore the differences in cyclization. In Chapter
VII, Lewis acids as well as fluoroalcohols were explored extensively in hopes to
mediated isotactic or syndiotactic polymerization, respectively. However, it was found
that tacticity was largely unaffected by these additives, despite their reported success with
other polymer systems. It is recommended that future studies attempt bulk
polymerizations or substitute ethylene carbonate, which is probably coordinating with
these polar additives, with a less polar solvent.
Finally, Chapter VIII presents the scale-up of a conventional solution
copolymerization of 98/2 p(AN-co-NIPAM). The copolymer was successfully spun into a
500 count tow of white fiber. The fiber morphology and thermal behavior were compared
to commercial-grade carbon fiber precursors. The experimental fiber showed minimal

158
voids and defects along with greater orientation in respect to the commercial BS fiber.
The NIPAM-containing fiber did, however, display increased heat flows during
cyclization with lower cyclization temperatures. The NIPAM fiber ultimately showed
very similar thermo-oxidative stability and near-parallel behavior to the commercial
fibers, which benchmarks this copolymer composition with commercial-grade white fiber
properties. This copolymer composition can be used as a baseline for design of future
copolymer architectures and their scale-up towards carbon fiber.
In the future, scale-up reactions with RAFT copolymers would help bridge the
gap between morphology of RAFT and FR polymerization methods. Furthermore, new
comonomers with structures similar to NIPAM, but perhaps less acidic and less bulky,
would further obviate exothermic cyclization reactions. Also, characterization techniques
such as solid-state NMR and TGA equipped with mass-spectroscopy will help connect
copolymer composition and molecular weight dependences to degradation pathways.
Additionally, average hole size free volume and fractional free volume would be
interesting attributes to correlate to copolymer architecture via Positron Annhiliation
Lifetime spectroscopy (PALS) and Pressure Volume Temperature (PVT) change
experiments, respectively. Finally, optimizing thermo-oxidative stabilization protocols
for various copolymers through FTIR studies should increase the cyclization efficiency of
precursors.

159
APPENDIX
PERMISSION LETTER
8/12/2015
Dear Jeremy Moskowitz, I have a reply from SCI about the rights to the publication below:
ISBN for the conference proceedings: 0901001546, 9780901001542
S. C. BENNETT and D. J. JOHNSON, “Fifth London International Carbon and Graphite
Conference” (Society of Chemical Industry, London, 1978) p. 377. SCI has the rights to, S. C. BENNETT and D. J. JOHNSON, “Fifth London International Carbon and
Graphite Conference” (Society of Chemical Industry, London, 1978), and assuming that the
student wishes to use the table in a non-commercial publication (i.e. a thesis, journal paper, etc.)
there would be no fee associated with its re-use. However the following acknowledgement should
accompany the table where it appears in the text, “Reproduced by permission of the Society of Chemical Industry from reference number xxx”, the full reference to (in this case) the proceedings then being included at the relevant number in
the list of references. We are therefore happy to confirm permission is granted for you to use the material requested for
your thesis/dissertation subject to the usual acknowledgements and on the understanding that you
will reapply for permission if you wish to distribute or publish your thesis/dissertation
commercially. You must also duplicate the copyright notice that appears in the Wiley publication
in your use of the Material. Permission is granted solely for use in conjunction with the thesis, and the material may not be
posted online separately. Any third party material is expressly excluded from this permission. If any of the material you
wish to use appears within our work with credit to another source, authorisation from that source
must be obtained. Yours Sincerely, Rebecca Cook Permissions Assistant John Wiley & Sons Ltd The Atrium Southern Gate, Chichester West Sussex, PO19 8SQ
160
REFERENCES
(1) Chung, D. D. L. Carbon Fiber Composites; Butterworth-Heinemann: Newton,
MA, 1994.
(2) Callister, W. D. J.; Rethwisch, D. G. Fundamentals of Materials Science and
Engineering An Integrated Approach, Third.; John Wiley & Sons, Inc.: Hoboken,
NJ, 2008.
(3) Huang, X. Materials (Basel). 2009, 2 (4), 2369–2403.
(4) HexTow® IM10 Carbon Fiber; Stamford, CT, 2010.
(5) Chand, S. J. Mater. Sci. 2000, 5 (35), 1303–1313.
(6) Beatie, D. Carbon Fiber Future Directions: Geelong, Victoria, Australia, 2015.
(7) Rahaman, M.; Ismail, A.; Mustafa, A. Polym. Degrad. Stab. 2007, 92 (8), 1421–
1432.
(8) Edie, D. D. Carbon N. Y. 1998, 36 (4), 345–362.
(9) Roberts, T. The Carbon Fiber Industry: Global Strategic Market Evaluation 2006-
2010; Watford, UK, 2006.
(10) Bennett, S. C.; Johnson, D. J. In Fifth London International Carbon and Graphite
Conference; Society of Chemical Industry: London, 1978; p 377.
(11) Johnson, D. J. Appl. Phys. 1987, 20 (3), 286–291.
(12) Huang, Y.; Young, R. J. Carbon N. Y. 1995, 33 (2), 97–107.
(13) Wangxi, Z.; Jie, L.; Gang, W. Carbon N. Y. 2003, 41, 2805–2812.
(14) Jie, L.; Wangxi, Z. J. Appl. Polym. Sci. 2005, 97 (5), 2047–2053.
(15) Hobson, R. J.; Windle, A. H. Macromolecules 1993, 26, 6903–6907.
(16) Liu, X. D.; Ruland, W. Macromolecules 1993, 2 (3), 3030–3036.
(17) Zhang, L.; Dai, Y.; Kai, Y.; Jin, R.-G. Carbon Lett. 2011, 12 (4), 229–235.
(18) Dobb, M. G.; Guo, H.; Johnson, D. J.; Park, C. R. Carbon N. Y. 1995, 33, 1553–
1559.
(19) Ju, A.; Guang, S.; Xu, H. Carbon N. Y. 2013, 54, 323–335.
(20) Bajaj, P.; Paliwal, D. K.; Gupta, A. K. J. Appl. Polym. Sci. 1993, 49, 823–833.
(21) Bansal, R. C.; Donnet, J. B. In Comprehensive Polymer Science; Pergamom Press,
1990; pp 501–520.
(22) Wu, X. P.; Yang, Y. G.; Ling, L. C.; Li, Y. H.; He, F. New Carbon Mater. 2003,
18 (3), 196–202.
(23) Frank, E.; Steudle, L. M.; Ingildeev, D.; Spörl, J. M.; Buchmeiser, M. R. Angew.
Chem. Int. Ed. Engl. 2014, 53 (21), 5262–5298.
(24) Dunstan, B.; Fox, B. Carbon Nexus: A Strategic Overview; Geelong, Victoria,
Australia, 2014.
161
(25) Ouyang, Q.; Cheng, L.; Wang, H.; Li, K. Polym. Degrad. Stab. 2008, 93 (8),
1415–1421.
(26) Shlyakhtin, A. V.; Lemenovskii, D. a.; Nifant’ev, I. E. Mendeleev Commun. 2013,
23 (5), 277–278.
(27) Bajaj, P.; Sreekumar, T. V; Sen, K. Polymer (Guildf). 2001, 42 (4), 1707–1718.
(28) Chen, G. L.; Ju, A. Q.; Xu, H. Y.; Pan, D. Polym. Mater. Sci. Eng. 2010, 26, 146–
148.
(29) Ju, A.; Xu, H.; Ge, M. J. Therm. Anal. Calorim. 2013, 115 (2), 1037–1047.
(30) Ju, A.-Q.; Li, M.-J.; Luo, M.; Ge, M.-Q. Chinese Chem. Lett. 2014, 25 (9), 1275–
1278.
(31) Liu, J.; He, L.; Ma, S.; Liang, J.; Zhao, Y.; Fong, H. Polymer (Guildf). 2015, 61,
20–28.
(32) Dalton, S.; Heatley, F.; Budd, P. M. Polymer (Guildf). 1999, 40, 5531–5543.
(33) Gupta, A.; Harrison, I. R. Carbon N. Y. 1997, 35 (6), 809–818.
(34) Karacan, I.; Erdoğan, G. Fibers Polym. 2012, 13 (7), 855–863.
(35) Saha, B.; Schatz, G. C. J. Phys. Chem. B 2012, 116 (15), 4684–4692.
(36) Bashir, Z. Carbon N. Y. 1991, 29, 1081–1090.
(37) Xiao, S.; Cao, W.; Wang, B.; Xu, L.; Chen, B. J. Appl. Polym. Sci. 2013, 127 (4),
3198–3203.
(38) Collins, G. L.; Thomas, N. W.; Williams, G. E. Carbon N. Y. 1988, 26 (5), 671–
679.
(39) Xue, Y.; Liu, J.; Liang, J. J. Appl. Polym. Sci. 2013, 127 (1), 237–245.
(40) Coleman, M. M.; Sivy, G. T.; Painter, P. C.; Snyder, R. W.; Gordon, B. Carbon N.
Y. 1983, 21 (3), 255–267.
(41) Wilkie, C. A.; Xue, T. J.; Mckinney, M. A. Polym. Degrad. Stab. 1997, 58, 193–
202.
(42) Devasia, R.; Reghunadhan Nair, C. P.; Sadhana, R.; Babu, N. S.; Ninan, K. N. J.
Appl. Polym. Sci. 2006, 100 (4), 3055–3062.
(43) Fitzer, E.; Frohs, W.; Heine, M. Carbon N. Y. 1986, 24 (4), 387–395.
(44) Bhanu, V. A.; Rangarajan, P.; Wiles, K.; Bortner, M.; Sankarpandian, M.;
Godshall, D.; Glass, T. E.; Banthia, A. K.; Yang, J.; Wilkes, G.; Baird, D.;
Mcgrath, J. E. 2002, 43, 4841–4850.
(45) Beltz, L. A.; Gustafson, R. R. Carbon N. Y. 1996, 34 (5), 561–566.
(46) Kakida, H.; Tashiro, K. Polym. J. 1998, 30 (6), 463–469.
(47) Gribanov, A. V; Sazanov, Y. N. Russ. J. Appl. Chem. 2008, 81 (6), 919–932.
(48) Thompson, E. V. J. Polym. Sci. Part B Polym. Lett. 1966, 4 (5), 361–366.
162
(49) Ju, A.; Luo, M.; Zhang, K.; Ge, M. J. Therm. Anal. Calorim. 2014, 117 (1), 205–
215.
(50) Spörl, J. M.; Ota, A.; Beyer, R.; Lehr, T.; Müller, A.; Hermanutz, F.; Buchmeiser,
M. R. J. Polym. Sci. Part A Polym. Chem. 2014, 52, 1322–1333.
(51) Tsai, J. S.; Lin, C. H. J. Appl. Polym. Sci. 1991, 42 (11), 3045–3050.
(52) Chernikova, E.; Poteryaeva, Z.; Belyaev, S.; Nifant’ev, I.; Shlyakhtin, A.; Kostina,
Y.; Cherevan, A.; Efimov, M.; Bondarenko, G.; Sivtsov, E. Polym. Sci. Ser. B
2011, 53 (7-8), 391–403.
(53) Lin, X.; Wang, C.; Yu, M.; Lin, Z. Adv. Mater. Res. 2013, 781-784, 2609–2613.
(54) Shindo, A. Government Industrial Research Institute; Osaka, Japan, 1961; p
Report No. 317.
(55) Morgan, P. Carbon Fiber and Their Composites; Taylor & Francis, Ed.; CRC
Press: Boca Raton, 2005.
(56) Bol’bit, N. M.; Dubova, E. A.; Duflot, V. R.; Chevychelov, V. A. Polym. Sci. Ser.
A 2011, 53 (4), 289–295.
(57) Gupta, A.; Harrison, I. R. Carbon N. Y. 1996, 34 (11), 1427–1445.
(58) Yu, M.; Wang, C.; Bai, Y.; Wang, Y.; Xu, Y. Polym. Bull. 2006, 57 (5), 757–763.
(59) Avilés, M. A.; Ginés, J. M.; Rio, J. C.; Pascual, J. J. Therm. Anal. Calorim. 2002,
67, 177–188.
(60) Krishnan, G. S.; Burkanudeen, A.; Murali, N.; Phadnis, H. eXPRESS Polym. Lett.
2012, 6 (9), 729–738.
(61) Isobe, Y.; Fujioka, D.; Habaue, S.; Okamoto, Y. J. Am. Chem. Soc. 2001, 123 (29),
7180–7181.
(62) Wang, Y.; Xu, L.; Wang, M.; Pang, W.; Ge, X. Macromolecules 2014, 47 (12),
3901–3908.
(63) Burkanudeen, a.; Krishnan, G. S.; Murali, N. J. Therm. Anal. Calorim. 2012, 112
(3), 1261–1268.
(64) Xiao, S.; Lv, H.; Tong, Y.; Xu, L.; Chen, B. J. Appl. Polym. Sci. 2011.
(65) Yu, M. J.; Bai, Y. J.; Wang, C. G.; Xu, Y.; Guo, P. Z. Mater. Lett. 2007, 61 (11-
12), 2292–2294.
(66) Arbab, S.; Zeinolebadi, A. Polym. Degrad. Stab. 2013, 98 (12), 2537–2545.
(67) Arbab, S.; Mirbaha, H.; Zeinolebadi, A.; Nourpanah, P. J. Appl. Polym. Sci. 2014,
131 (11), 40343.
(68) Matyjaszewski, K.; Jo, S. M.; Paik, H.; Gaynor, S. G. Macromolecules 1997, 30
(20), 6398–6400.
(69) Matyjaszewski, K.; Jo, S. M.; Paik, H.; Shipp, D. A. Macromolecules 1999, 32
(20), 6431–6438.

163
(70) Lazzari, M.; Chiantore, O.; Mendichi, R.; López-Quintela, M. A. Macromol.
Chem. Phys. 2005, 206 (14), 1382–1388.
(71) Jiang, J.; Lu, X.; Lu, Y. J. Appl. Polym. Sci. 2010.
(72) Dong, H.; Tang, W.; Matyjaszewski, K. Macromolecules 2007, 40 (9), 2974–2977.
(73) Tang, C.; Kowalewski, T.; Matyjaszewski, K. Macromolecules 2003, 36 (23),
8587–8589.
(74) Liu, X.-H.; Zhang, G.-B.; Lu, X.-F.; Liu, J.-Y.; Pan, D.; Li, Y.-S. J. Polym. Sci.
Part A Polym. Chem. 2006, 44 (1), 490–498.
(75) An, Q. F.; Qian, J. W.; Gao, C. J. Chinese Chem. Lett. 2006, 17 (3), 365–368.
(76) Liu, X.; Li, Y.; Lin, Y.; Li, Y. J. Polym. Sci. Part A Polym. Chem. 2007, 45, 1272–
1281.
(77) Liu, X.; Zhang, G.; Li, B.; Bai, Y.; Pan, D.; Li, Y. Eur. Polym. J. 2008, 44 (4),
1200–1208.
(78) Niu, S.; Zhang, L.; Zhu, J.; Zhang, W.; Cheng, Z.; Zhu, X. J. Polym. Sci. Part A
Polym. Chem. 2012, 51 (5), 1197–1204.
(79) Pan, X.; Lamson, M.; Yan, J.; Matyjaszewski, K. ACS Macro Lett. 2015, 4 (2),
192–196.
(80) Moad, G.; Chiefari, J.; Chong, B. Y. K.; Krstina, J.; Mayadunne, R. T. A.; Postma,
A.; Rizzardo, E.; Thang, S. H. Polym. Int. 2000, 49 (January), 993–1001.
(81) Spörl, J.; Hermanutz, F.; Buchmeiser, M. Int. Fiber J. 2014, 28 (6), 24–27.
(82) Kim, B. C.; Ghil, M. S.; Min, B. G.; Kim, S. G.; Rhee, J. M. J. Korean Fiber Soc.
1995, 32 (11), 1056–1063.
(83) Convertine, A. J.; Ayres, N.; Scales, C. W.; Lowe, A. B.; Mccormick, C. L.
Biomacromolecules 2004, 5, 1177–1180.
(84) Convertine, A. J.; Lokitz, B. S.; Lowe, A. B.; Scales, C. W.; Myrick, L. J.;
McCormick, C. L. Macromol. Rapid Commun. 2005, 26 (10), 791–795.
(85) Tsai, J. S.; Lin, C. H. J. Mater. Sci. 1991, 26 (15), 3996–4000.
(86) Hou, C.; Sun, C.; Ying, L.; Wang, C. J. Appl. Polym. Sci. 2005, 96 (2), 483–488.
(87) Wang, R.; Luo, Y.; Li, B.; Sun, X.; Zhu, S. Macromol. Theory Simulations 2006,
15 (4), 356–368.
(88) Sun, X.; Luo, Y.; Wang, R.; Li, B.-G.; Liu, B.; Zhu, S. Macromolecules 2007, 40
(4), 849–859.
(89) Sun, X.; Luo, Y.; Wang, R.; Li, B.-G.; Zhu, S. AIChE J. 2008, 54 (4), 1073–1087.
(90) Kamide, K.; Ono, H.; Histani, K. Polymer (Guildf). 1992, 24 (9), 917–930.
(91) Takasu, T.; Shinozaki, S.; Yoshii, F.; Morishita, N.; Radiation, T. Polymer
(Guildf). 1995, 36 (12), 2343–2346.
(92) Jung, K. T.; Hwang, D. K.; Shul, Y. G.; Han, H. S.; Lee, W. S. Mater. Lett. 2002,
53 (March), 180–185.
164
(93) Lutz, J.-F.; Neugebauer, D.; Matyjaszewski, K. J. Am. Chem. Soc. 2003, 125 (23),
6986–6993.
(94) Satoh, K.; Kamigaito, M. Chem. Rev. 2009, 109 (11), 5120–5156.
(95) Kamigaito, M.; Satoh, K. Macromolecules 2008, 41 (2), 269–276.
(96) Ray, B.; Isobe, Y.; Matsumoto, K.; Habaue, S.; Okamoto, Y.; Kamigaito, M.;
Sawamoto, M. Macromolecules 2004, 37 (5), 1702–1710.
(97) Biswas, C. S.; Patel, V. K.; Vishwakarma, N. K.; Tiwari, V. K.; Maiti, B.; Maiti,
P.; Kamigaito, M.; Okamoto, Y.; Ray, B. Macromolecules 2011, 44 (14), 5822–
5824.
(98) Lutz, J.-F.; Jakubowski, W.; Matyjaszewski, K. Macromol. Rapid Commun. 2004,
25 (3), 486–492.
(99) Chong, Y. K.; Moad, G.; Rizzardo, E.; Skidmore, M. a.; Thang, S. H.
Macromolecules 2007, 40 (26), 9262–9271.
(100) Lutz, J.-F.; Kirci, B.; Matyjaszewski, K. Macromolecules 2003, 36 (9), 3136–
3145.
(101) Rosen, I.; Burleigh, P. H.; Gillespie, J. F. J. Polym. Sci. 1961, 54, 31.
(102) Rosen, I.; Burleigh, P. H. Polym. Sci. 1962, 62 (174), 160–163.
(103) Yamada, K.; Nakano, T.; Okamoto, Y. Macromolecules 1998, 31 (22), 7598–
7605.
(104) Skey, J.; O’Reilly, R. K. Chem. Commun. (Camb). 2008, No. 35, 4183–4185.
(105) Bouhadir, G.; Legrand, N.; Quiclet-sire, B.; Zard, S. Z. Tetrahedron Lett. 1998, 40,
277–280.
(106) Thomas, D. B.; Convertine, A. J.; Myrick, L. J.; Scales, C. W.; Smith, A. E.;
Lowe, A. B.; Vasilieva, Y. A.; Ayres, N.; McCormick, C. L. Macromolecules
2004, 37, 8941–8950.
(107) Katsuraya, K.; Hatanaka, K.; Matsuzaki, K.; Minagawa, M. Polym. Commun.
2001, 42, 6323–6326.
(108) Kurata, M.; Tsunashima, Y. Brandrup, J., Immergut, E. H., Eds.; Wiley: New
York, 1980; Vol. Vol III.
(109) Bajaj, P.; Sreekumar, T. V.; Sen, K.; Kumar, R.; Brar, A. S. J. Appl. Polym. Sci.
2003, 88 (5), 1211–1217.
(110) Lange, J.; Altmann, N.; Kelly, C. T.; Halley, P. J. Polymer (Guildf). 2000, 41 (15),
5949–5955.
(111) Kandelbauer, A.; Wuzella, G.; Mahendran, A.; Taudes, I.; Widsten, P. Chem. Eng.
J. 2009, 152 (2-3), 556–565.
(112) Tsai, J. S.; Hsu, H. J. Mater. Sci. Lett. 1992, 11, 1403–1405.
(113) Qin, X. H. J. Therm. Anal. Calorim. 2009, 99 (2), 571–575.
(114) Bang, Y. H.; Lee, S.; Cho, H. H. J. Appl. Polym. Sci. 1998, 68, 2205–2213.
165
(115) Knight, D. S.; White, W. B. J. Mater. Res. 1988.
(116) Kim, C.; Park, S.-H.; Cho, J.-I.; Lee, D.-Y.; Park, T.-J.; Lee, W.-J.; Yang, K.-S. J.
Raman Spectrosc. 2004, 35 (11), 928–933.
(117) Ko, T.; Chen, C. J. Appl. Polym. Sci. 1998, 71, 2219–2225.
(118) Gupta, A. K.; Singhal, R. P. J. Polym. Sci. Polym. Phys. Ed. 1983, 21 (11), 2243–
2262.
(119) Gupta, V. B.; Kumar, S. J. Appl. Polym. Sci. 1981, 26, 1885–1895.
(120) Hinrichsen, G. J. Polym. Sci. Part C Polym. Symp. 1972, 38 (1), 303–314.
(121) Wu, Q.-Y.; Chen, X.-N.; Wan, L.-S.; Xu, Z.-K. J. Phys. Chem. B 2012, 116, 8321–
8330.
(122) Chong, B. Y. K.; Krstina, J.; Le, T. P. T.; Moad, G.; Postma, A.; Rizzardo, E.;
Thang, S. H. Macromolecules 2003, 60, 2256–2272.
(123) Chiefari, J.; Mayadunne, R. T. A.; Moad, C. L.; Moad, G.; Rizzardo, E.; Postma,
A.; Skidmore, M. A.; Thang, S. H. Macromolecules 2003, 36, 2273–2283.
(124) Grajales, S.; Moad; Rizzardo; Thang; Jakubowski; Tsarevsky; McCarthy;
Matyjaszewski. Aldrich Mater. Sci. 2012.
(125) Moad, G.; Solomon, D. H. The Chemistry of Radical Polymerization, Second.;
Elsevier Ltd: Kidlington, Oxford, UK, 2006.
(126) Donovan, M. S.; Lowe, A. B.; Sumerlin, B. S.; McCormick, C. L. Macromolecules
2002, 35, 4123–4132.
(127) Dungen, E.; Matahwa, H.; Leary, J. B. M. C.; Sanderson, R. D.; Klumperman, B.
J. Polym. Sci. Part A Polym. Chem. 2008, 46, 2500–2509.
(128) Lyoo, W. S.; Ghim, H. Do; Yoon, W. S.; Lee, J.; Lee, H. S.; Ji, B. C. Eur. Polym.
J. 1999, 35 (4), 647–653.
(129) Fred W. Billmeyer, J. Textbook of Polymer Science, Third edit.; John Wiley &
Sons: New York, 1984.
(130) Skrabania, K.; Miasnikova, A.; Bivigou-Koumba, A. M.; Zehm, D.; Laschewsky,
A. Polym. Chem. 2011, 2 (9), 2074.
(131) Sadezky, A.; Muckenhuber, H.; Grothe, H.; Niessner, R.; Pöschl, U. Carbon N. Y.
2005, 43 (8), 1731–1742.
(132) Wang, Y.-X.; Wang, C.-G.; Wu, J.-W.; Jing, M. J. Appl. Polym. Sci. 2007, 106 (3),
1787–1792.
(133) Godshall, D.; Rangarajan, P.; Baird, D. G.; Wilkes, G. L.; Bhanu, V. a.; McGrath,
J. E. Polymer (Guildf). 2003, 44 (15), 4221–4228.
(134) Grobelny, J.; Sokot, M.; Turska, E. Polymer (Guildf). 1989, 30 (7), 1187–1196.
(135) Walker, M. A. J. Org. Chem. 1995, 60, 5352–5355.
(136) Sivy, G. T.; Coleman, M. M. Carbon N. Y. 1981, 19 (2), 123–126.
(137) Sivy, G. T.; Coleman, M. M. Carbon N. Y. 1981, 19 (2), 137–139.

166
(138) Perepelkin, K. E. Fibre Chem. 2003, 35 (6), 3–8.
(139) Wang, C.; Liu, I.; Chen, J.; Cheng, S.-H.; Cheng, S. High Module Carbon Fiber
and Method for Fabricating the Same. US 2011/0158895 A1, 2011.
(140) Chae, H. G.; Newcomb, B. a.; Gulgunje, P. V.; Liu, Y.; Gupta, K. K.; Kamath, M.
G.; Lyons, K. M.; Ghoshal, S.; Pramanik, C.; Giannuzzi, L.; Sahin, K.; Chasiotis,
I.; Kumar, S. Carbon N. Y. 2015, 3, 0–6.
(141) Tüdos, F.; Kelen, T.; Foldes-berezsnich, T.; Turcsanyi, B. J. Macromol. Sci.
Chem. A 1976, 10 (8), 1513–1540.
(142) Patton, D. L.; Page, K. a.; Hoff, E. a.; Fasolka, M. J.; Beers, K. L. Polym. Chem.
2012, 3 (5), 1174.
(143) Chee, K. K.; Ng, S. C. Macromolecules 1986, 19 (11), 2779–2787.
(144) Van Doremaele, G. H. J.; German, A. L.; de Vries, N. K.; van der Velden, G. P.
M. Macromolecules 1990, 23, 4206–4215.
(145) Çatalgil-Giz, H.; Giz, A.; Alb, a. M.; Öncül Koç, A.; Reed, W. F. Macromolecules
2002, 35 (17), 6557–6571.
(146) Schrems, O.; Oberhoffer, H. M.; Luck, W. A. P. J. Phys. Chem. 1984, 88, 4335.
(147) Luck, W. A. P.; Peil, S. J. J. Mol. Struct. 1990, 224, 185.
(148) Kamigato, M.; Satoh, K. J. Polym. Sci. Part A Polym. Chem. 2006, 44, 6147–
6158.
(149) Isobe, Y.; Suito, Y.; Habaue, S.; Okamoto, Y. J. Polym. Sci. Part A Polym. Chem.
2003, 41 (7), 1027–1033.
(150) Suito, Y.; Isobe, Y.; Habaue, S.; Okamoto, Y. J. Polym. Sci. Part A Polym. Chem.
2002, 40 (14), 2496–2500.
Copyright © 2022 FDOKUMEN