Surface and adhesion properties of poly(imide-siloxane) block copolymers
Upload
independentCategory
view
5download
0
Organoclay Nanocomposites from
Ethylene–Acrylic Acid Copolymers
Sara Filippi,1 Cristina Marazzato,1 Pierluigi Magagnini,*1 Liliya Minkova,2 Nadka Tzankova Dintcheva,3
Francesco P. La Mantia3
1 Dipartimento di Ingegneria Chimica, Chimica Industriale e Scienza dei Materiali, Universita degli Studi di Pisa,Via Diotisalvi 2, Pisa 56126, ItalyFax: (þ39) 050 511266; E-mail: [email protected]
2 Institute of Polymers, Bulgarian Academy of Sciences, Acad. G. Bontchev str., Sofia 1113, Bulgaria3 Dipartimento di Ingegneria Chimica dei Processi e dei Materiali, Viale delle Scienze, Universita degli Studi di Palermo,Palermo 90128, Italy
Received: May 26, 2006; Revised: July 17, 2006; Accepted: July 18, 2006; DOI: 10.1002/mame.200600217
Keywords: ethylene–acrylic acid copolymers; nanocomposites; organoclay
Introduction
A vast number of papers have been published in the last few
years on polymer/clay hybrids,[1–8] and an increasing number
of the most recent studies are dealt with the preparation and
characterisation of smectite–clay nanocomposites with poly-
olefinic matrices.[5,9–51] The expected improvement in one or
more of the properties of these commodity polymers, e.g.,
barrier, mechanical, fire resistance, etc., might, in fact, be
foreseen to balance the cost increase due to the nanofiller
(whose addition, if made by melt compounding, should not
require significant changes in the usual processing techni-
ques). The strong hydrophobicity of polyolefins, however,
makes their interaction with the silicate surface quite difficult,
even for clays organically modified by substitution of the
metal cations with e.g., quaternary ammonium ions containing
one or more long alkyl groups. In particular, for the composites
prepared by melt compounding from the different polyethy-
lene (PE) grades,[9–40] most studies have shown that no
significant intercalation is obtained, unless the PEs are blended
with appropriate oligomeric or polymeric compatibilisers.
The literature describing the use of copolymers of ethylene
with polar monomers, either as matrices or as compatibilisers
for PE/clay nanocomposites, is quite rich. In particular,
Summary: A study of the structure–property relationshipsfor nanocomposites prepared by melt compounding fromethylene–acrylic acid copolymers of varied composition andmolecular architecture, and organoclays modified withdifferent ammonium ions has been made by DSC, POM,SEM, TEM, WAXD, and rheological and mechanical tests.Within the series of clays investigated, the best levels ofdispersion were displayed by those organically modified withquaternary ammonium ions containing two long alkyl tails.The relevant nanocomposites were shown to possess mixedexfoliated and intercalated morphology. The spacing of theintercalated clay stacks, most of which comprise few silicatelayers, was found to be independent of clay loading, in therange of 2–50 phr, and to change with the molecular archi-tecture of the matrix polymer. An indication that the excesssurfactant present in some of the clays, and the organicmaterial added in others to expand the interlayer spacing,were expelled from the clay galleries during melt blendingand acted as plasticisers for the matrix polymer, was obtainedfrom WAXD and rheological characterisations. TEM micrograph of the nanocomposite of EAA1 with 11 phr
of 15A.
Macromol. Mater. Eng. 2006, 291, 1208–1225 � 2006 WILEY-VCH Verlag GmbH & Co. KGaA, Weinheim
1208 DOI: 10.1002/mame.200600217 Full Paper

several studies have been made on silicate hybrids prepared
from ethylene-vinyl acetate (EVA) copolymers, or their
blends with PE,[4,6] for applications requiring enhanced
barrier properties and flame resistance. The copolymers,
either commercial or synthesised on purpose, of ethylene
with maleic anhydride (MA) have also been investigated
extensively,[10–15,17,19–25,29,33,41–45,48] mainly because of
their effectiveness as compatibilisers for PE-based nano-
composites. Actually, most of the studies on nanocomposites
containing PE-g-MA, either as the matrix or the compatibil-
iser, report high levels of organoclay exfoliation, although the
results are not always consistent with respect to the minimum
concentration of MA in the copolymer and the optimal
compatibiliser-to-clay ratio.
It may be surprising that the copolymers of ethylene with
acrylic acid (AA) or methacrylic acid (MAA), though being
largely employed as adhesion promoters, blends compatibil-
isers etc., have received comparatively little attention inview
of the preparation of PE-based nanocomposites. Preston
et al.[46] described the synthesis of nanocomposites from
three different ethylene copolymers and found (by WAXD)
that the ethylene-co-methyl acrylate-co-acrylic acid terpol-
ymer gave rise to better intercalation, with an organically
modified bentonite, than the two others: EVA and poly-
[(ethylene)-co-(methyl acrylate)]. These authors concluded
that the AA units interact effectively with the clay surfaces.
In a very recent paper,[27] Fang and coworkers described the
synthesis of an HDPE-g-AA copolymer with 8.4 wt.-% AA
and its use for the preparation of nanocomposites with a
bentonite modified with trimethyloctadecylammonium ions.
On the basis of WAXD patterns and TEM micrographs, these
authors concluded that the nanocomposites are characterised
by good ‘exfoliation or intercalation’ and suggested, from
FTIR analyses, that chemical reactions occur between the
carboxyl groups of the HDPE-g-AA matrix and the clay.[27]
Finally, Chrissopoulou et al.[29] synthesised a diblock copo-
lymer of ethylene and MAA (PE-b-PMAA) and used it
as a compatibiliser for nanocomposites of HDPE with a
commercial organoclay (Cloisite1 20A, by Southern Clay
Products). They observed a gradual shift in the basal dif-
fraction peak of the clay from 2y¼ 3.158 to 2y¼ 2.458,accompanied by a significant decrease in intensity, as the
concentration of PE-b-PMAA in the polymer matrix was
increased up to 15 wt.-%. On the basis of diffractometric
data, these authors concluded that most probably, as the
amount of the PE-b-PMAA increases, the system attains a
mixed intercalated and exfoliated morphology, resulting
from intercalation of the copolymer chains into the galleries
of the MMT driven by the polarity of the carboxyl groups.[29]
Other studies[47,48] have dealt with nanocomposites from
ethylene-MAA (EMAA) ionomers. In particular, Hsiao
et al.[47] studied the hybrids prepared from EMAA ionomers,
containing�3.5 mol-% of MAA partly (80%) neutralised with
sodium or magnesium, and a commercial organoclay (Nano-
mer1 I30 E, by Nanocor Inc.). Through small-angle X-ray
scattering (SAXS) and TEM studies, they found that the
nanocomposite from the Na ionomer was predominantly
exfoliated, whereas that prepared from the Mg ionomer was
only slightly exfoliated and showed a distinct scattering
peak corresponding to a d001 spacing of �3 nm. A detailed
paper by Shah et al.[48] dealt with the behaviour of nano-
composites prepared by melt processing from a commercial
EMAA ionomer (Surlyn1 8945, du Pont; MAA content
5.6 mol-%; Na-neutralisation 39%) and a series of organo-
clays. They found that the extent of clay dispersion and the
mechanical properties varied appreciably with the chem-
istry of MMT modification. In particular, they demon-
strated, by TEM, WAXD, stress-strain and Izod-impact
measurements, that improved levels of clay exfoliation and
enhanced mechanical properties could be obtained by the
use of: (i) amine modifiers with more than one alkyl tail,
(ii) longer alkyl tails, (iii) amines containing 2-hydroxy-
ethyl rather than methyl groups and (iv) an excess amount of
the amine surfactant with respect to the cation exchange
capacity (CEC) of the pristine MMT.
In a previous communication from our laboratories,[51] a
preliminary X-ray and TEM investigation of the morphology
of nanocomposites from different ethylene-AA copolymers
(EAA) loaded with fixed amounts (5 phr) of organoclays
modified with different proportions of the same dimethyldi-
hydrogenated tallow quaternary ammonium surfactant has
been reported. All nanocomposites displayed mixed, interca-
lated and exfoliated morphology. Together with a population
of individual platelets, thin stacks of a few irregularly spaced
silicate layers were seen in the TEM images, whose average
periodicity was shown by WAXD to depend on the molecular
architecture of the matrix copolymers. In fact, a d001 spacing
of about 4 nm was measured for the branched EAA matrices,
whereas a considerably lower MMT expansion (d001ffi 3 nm)
was found with a linear HDPE-g-AA (HDAA) matrix. The
other investigated variables such as the polymer molar mass,
the AA concentration (in the range of 6.2–11 wt.-%) and the
excess of surfactant present in two of the investigated clays,
were shown to have negligible effect on morphology.
In this work, the morphological characterisation has been
extended to EAA and HDAA nanocomposites filled with a
series of commercial and experimental organoclays containing
different quaternary ammonium ion modifiers, and their ther-
mal, rheological and mechanical properties have been investi-
gated. Moreover, the effect of increasing the clay loading up to
50 phr has been studied in order to test the possibility of
obtaining concentrated nanoblends which might be promising
for use as compatibilisers for PE-based nanocomposites.
Experimental Part
Materials
The polymers used as matrices are indicated in Table 1,together with their sources and some of their properties. The
Organoclay Nanocomposites from Ethylene–Acrylic Acid Copolymers 1209
Macromol. Mater. Eng. 2006, 291, 1208–1225 www.mme-journal.de � 2006 WILEY-VCH Verlag GmbH & Co. KGaA, Weinheim

Escor1 (EAA) samples are random copolymers with a signi-ficant amount of long branches. Polybond1 (HDAA) is a linearcopolymer produced by grafting AA onto HDPE.
The organoclays used in this study are listed in Table 2 alongwith their sources, the milliequivalent exchange ratio (MER),the loss on ignition determined by thermogravimetric analysis(TGA) as the weight loss in air at 900 8C, and the d001 spacingdetermined by X-ray analysis. Most organoclays were suppliedby Southern Clay Products, Inc.; they were prepared by a cationexchange reaction between an Na-MMT with a CEC of0.926 meq�g�1 (Cloisite1–Naþ) and appropriate amine sur-factants. Additional organoclays were either supplied by SudChemie (Nanofil1 848 and Nanofil1 SE3000) or prepared inour laboratory from Cloisite1–Naþ (M3C18). The nomencla-ture used to describe the organic modifier’s structure is thatproposed by Shah et al.:[48] H for hydrogen, M for methyl, T fortallow (a blend of unsaturated alkyl groups with approximatecomposition: 65% C18; 30% C16; 5% C14); (HT) for hydro-genated tallow, (HE) for 2-hydroxy-ethyl.
Chemicals, e.g. octadecyltrimethylammomium bromide,and solvents were supplied by Aldrich.
Techniques
The M3C18 organoclay was synthesised as follows: 30 g ofCloisite1–Naþ was stirred for 2 h in 400 mL of a 50:50 v/vH2O/EtOH solution at 75 8C; 13.3 g of trimethyloctadecylam-
monium bromide, dissolved in 100 mL of a similar H2O/EtOHmixture, was added to the clay solution and the mixturewas mechanically stirred for 2 h at 75 8C and then sonicated for2 more hours at 60 8C. The precipitate was separated with asintered glass filter, and washed with warm H2O/EtOH solutionup to complete elimination of bromine ions in the filtrate(AgNO3 test). The organoclay was dried in a vacuum oven at40 8C for 24 h, milled in a mortar and sieved (200 mesh).
The composites were prepared by melt compounding in aBrabender Plasticorder static mixer of 50 mL capacity,preheated to 120 8C (150 8C for the HDAA-based composites).The rotor speed was maintained at 30 rpm for about 2.5 min andwas then increased gradually (in 30 s) to 60 rpm. The overallblending time was 10 min, unless otherwise stated. Dependingon the viscosity, the temperature rose by 10–20 8C above theset value, due to stress heating. Prior to charging into the mixer,the polymers were dried in a vacuum oven at 60 8C for at least24 h and stored in a desiccator; the organoclays were used asreceived. The polymer was premixed in a beaker with thechosen quantity of clay powder, which showed good adhesionto the pellets, and the mixture was fed into the mixing bowlwith caution in order to minimise any loss of powder. Theapplied torque and the blend temperature were recorded duringthe whole compounding period. At the end, the moltencomposites were extracted from the mixer and cooled naturallyin the atmosphere. Blank samples to be employed as referenceswere prepared by processing pure polymers with the same
Table 1. Polymers used for the nanocomposites preparation.a)
Sample name Commercial designation (manufacturer) AA content Density MFIb)
mol-% kg�m�3 dg�min�1
EAA1 Escor1 5100 (Exxon-Mobil Chemical) 4.6 940 8.0EAA2 Escor1 5000 (Exxon-Mobil Chemical) 2.5 931 8.0EAA3 Escor1 5001 (Exxon-Mobil Chemical) 2.5 931 2.0HDAA Polybond1 1009 (Crompton Corp.) 2.4 950 5.0
a) Manufacturer’s data.b) Melt flow index (ASTM D1238).
Table 2. Organoclays used in this work.
Clay Commercial designation (Supplier) Surfactant structure MERa) Organic contentb) d001b)
meq�g�1 % nm
6A Cloisite1 6A (South. Clay Prod.) M2(HT)2 1.40 45.2 3.4915A Cloisite1 15A (South. Clay Prod.) M2(HT)2 1.25 42.4 3.1020A Cloisite1 20A (South. Clay Prod.) M2(HT)2 0.95 38.5 2.53SE3000 Nanofil1 SE3000 (Sud Chemie) -c) -c) 54.5 3.5093A Cloisite1 93A (South. Clay Prod.) MH(HT)2 0.90 36.0 2.4730B Cloisite1 30B (South. Clay Prod.) M(HE)2T 0.90 30.0 1.84N848 Nanofil1 848 (Sud Chemie) H3C18 -c) 25.4 1.82M3C18 Experimental M3C18 1.22b) 30.4 1.96
a) Supplier’s data.b) Experimental data.c) Undisclosed.
1210 S. Filippi, C. Marazzato, P. Magagnini, L. Minkova, N. T. Dintcheva, F. P. La Mantia
Macromol. Mater. Eng. 2006, 291, 1208–1225 www.mme-journal.de � 2006 WILEY-VCH Verlag GmbH & Co. KGaA, Weinheim

procedure. The clay concentrations in the composites are givenin phr (grams of organoclay per hundred grams of polymermatrix).
DSC analyses were made under nitrogen, on samples of 5–8mg, with a Pyris Perkin Elmer apparatus calibrated withindium and tin standards. The scanning rate was 10 8C�min�1.The first heating scan was carried out from 20 to 190 8C and thistemperature was maintained for 5 min to exclude thermalhistory effects. The values of the temperatures and enthalpychanges associated with the crystallisation and the fusion of thesamples were recorded from the cooling and second heatingscans. The enthalpies were normalised to the polymer contentand the degrees of crystallinity were calculated from theexperimentalDHm figures with reference to the 293 J�g�1 valueof 100% crystalline PE.[52]
Thermogravimetric analyses were made with a Q500 TAInstruments balance using samples of about 10 mg. Tests werenormally made in air (60 mL�min�1), in a temperature rangebetween 30 and 900 8C, with a scanning rate of 10 8C�min�1.
Optical microscopic observations were made on a LeitzOrtholux polarizing microscope equipped with a Linkam TMS93 hot stage and a digital camera JVC TK-1085E. A smallfragment of the samples was placed on a thoroughly cleanedglass slide, melted at 190 8C on the microscope hot stage, andpressed with a cover slip to obtain a film of 80–100 mmthickness. Micrographs were taken both at 190 8C and at roomtemperature after cooling at a rate of 1 8C�min�1. The tem-peratures TcPOM corresponding to formation of the first bire-fringent crystals during the cooling cycle, as observed throughcrossed polarisers, were recorded. At least four Hv patterns ofsmall-angle light scattering (SALS) were recorded, at differentmagnifications, for each crystallised sample at room temper-ature, using the microscope in the diffraction mode with aBertran lens. The Hv patterns were used to calculate the ave-rage spherulite dimensions with the Stein equation.[53] Animage processing system (Scion Image) was used to analysethe patterns in order to determine the angle of the incident andscattered beams corresponding to maximum intensity.
Scanning electron microscopy (SEM) observations of cryo-fractured composite samples, coated with gold, were madewith a Jeol JSM-5600LV microscope.
Samples for WAXD analysis were prepared by compressionmoulding, using a laboratory Carver press preheated to a tem-perature of 190 8C (unless otherwise stated). The mouldconsisted of a 2-mm thick stainless steel plate, with four holesof 20-mm diameter, which was sandwiched within two stain-less steel plates covered with anti-adherent film. Four sampleswere prepared at a time; after moulding, they were let to coolslowly in the press. WAXD measurements were made in thereflection mode with a Siemens D500 Krystalloflex 810apparatus with an X-ray wavelength of 0.1542 nm at a scanrate of 1.08�min�1. The analyses were normally made on theouter surface (skin) of the compression moulded discs. How-ever, for some of the nanocomposites, the core morphologywas also analysed with the X-ray beam reflected off the surfacecreated by abrading the discs with a fine sandpaper until thethickness was reduced to �1 mm.
TEM observations were made with a ZEISS EM 900 micro-scope, at accelerating voltages of 50 and 80 KeV, in the Genovadivision of the Institute for Macromolecular Studies (ISMac)
of C.N.R. Samples for TEM analysis were taken either frompieces of the composites as received from the Brabender mixeror from the compression moulded discs used for WAXD.Ultrathin sections�50 nm thick were cut with a diamond knifeat a temperature of �130 8C (�145 8C for the HDAA nano-composites) using a Leica Ultracut UCT ultramicrotomeequipped with a Leica EM FCS cryosystem. Sections werecollected on the surface of a water–dimethylsulphoxide (60:40 v/v) bath cooled to �60 8C, taken on TEM grids and driedwith filter paper. The micrographs were digitised using a high-resolution plane scanner and the silicate lamellae were identi-fied on the magnified electronic images with lines drawnmanually. With the use of the Image-Pro1 Plus software, thedistances between adjacent lines were automatically recorded,thereby allowing the determination of the gallery height d2 andof the spacing d1 of the tactoids to be compared with the d001
figures measured by WAXD.Samples for rheological and mechanical analyses were
made by compression moulding with a Carver press preheatedto 190 8C. The rheological tests were carried out in shear flowusing a Rheometrics RDA II apparatus in the plate–plategeometry (the plate’s diameter was 25 mm) at 160 8C in thefrequency range of 0.1–500 rad�s�1, with 5% strain. Themechanical measurements were made with a universal Instronmachine mod. 4443, according to ASTM D882. Averagevalues were calculated for elastic modulus (E), yield strength(YS), tensile strength (TS) and elongation at break (EB) fromthe results of at least five measurements. The reproducibility ofthe results was within �5%.
Results and Discussion
Calorimetry and Polarised Optical Microscopy
The crystallisation temperature Tc, measured by DSC at
10 8C�min�1 (peak values), and TcPOM, measured by POM
at 1 8C�min�1 (first appearance of birefringent crystallites),
and the fusion temperatures Tm, measured by DSC at
10 8C�min�1 on the second heating scan (peak values), are
given in Table 3 for the polymers and some of their nano-
composites, together with the degrees of crystallinity calcu-
lated from the fusion enthalpies DHm and the average
spherulite sizes measured by SALS. The POM micrographs
of two representative copolymers and their nanocomposites
with 5 phr of 15A, taken under crossed polarisers on films
cooled to room temperature from 190 8C at 1 8C�min�1, are
shown in Figure 1, together with the relevant Hv patterns.
The crystallisation temperatures Tc of the branched EAA
copolymers are considerably lower than that (95–100 8C)
typical for LDPE homopolymers with comparable molec-
ular architecture. The Tc lowering, which is stronger for
EAA1, is clearly due to the presence of the AA comonomer
units disturbing the crystalline regularity. The linear AA-
grafted copolymer (HDAA) expectedly shows a much
higher Tc. The strong effects of both molecular architecture
and AA content are also demonstrated by the Tm data and,
even more, by the degrees of crystallinity calculated from
the fusion enthalpies DHm.
Organoclay Nanocomposites from Ethylene–Acrylic Acid Copolymers 1211
Macromol. Mater. Eng. 2006, 291, 1208–1225 www.mme-journal.de � 2006 WILEY-VCH Verlag GmbH & Co. KGaA, Weinheim

On the other hand, only slight differences were observed
between the Tc, Tm and DHm figures of the polymers and
those of the relevant nanocomposites. Since these data were
obtained from asymmetric DSC peaks with long tails on the
low temperature sides, they are probably affected by consi-
derable uncertainty and we believe that the recorded dif-
ferences should not be given much weight. On the basis of
the DSC data, therefore, one might feel inclined to infer
that the dispersed silicate particles have negligible effect
on the crystallisation of these copolymers. However, from
the TcPOM figures given in Table 3, an indication that the
presence of clay particles may lead to an increase in the
crystallisation temperature of the polymers can be drawn.
Moreover, as it is shown by the micrographs in Figure 1 and
the spherulite size data in Table 3, the definite increase in
crystalline nuclei concentration observed in the presence of
clay provides strong indication in favour of a heterogeneous
nucleating effect played by the dispersed inorganic parti-
cles. Non-isothermal and isothermal crystallisation studies
carried out on these materials by one of us have confirmed
that the nucleation rate is increased in the presence of clay
and that the spherulite growth changes from three-dimen-
sional to two-dimensional.[54]
Mesoscale Morphology
Traditionally,[4,6] three main types of composites have been
considered to develop when clays and polymers are blended:
(i) a phase-separated microcomposite, obtained when poly-
mer and clay are incompatible and the latter is dispersed
within the matrix as micron-sized agglomerates; (ii) an inter-
calated nanocomposite, formed when, thanks to appropriate
entropic and energetic factors causing strong interfacial inter-
actions between the polymer and the silicate, one or more
extended polymer chains penetrate the clay galleries and
swell the silicate layer stacks without causing complete des-
truction of periodicity; (iii) an exfoliated nanocomposite,
resulting from complete clay delamination and disordered
and uniform dispersion of individual silicate platelets within
the polymer matrix. However, in recent years, several papers
have appeared in which nanocomposites with mixed morpho-
logy (exfoliated and intercalated) have been described and an
increasing number of the examples of composites comprising
exfoliated and intercalated structures together with multilayer
tactoids or clay agglomerates at the micrometre length scale
have been given.[51,55–58] Thus, POM and SEM, whose utili-
sation was normally confined to investigations of the
crystallisation processes and crystalline morphology or to
studies of the anisotropic phases formed in nanocomposites
with high clay loadings,[21,28,32,41,58–63] may provide, toge-
ther with TEM, very useful information in view of a full-scale
description of nanocomposites morphology. In fact, X-ray
diffraction and TEM, which have been traditionally used to
elucidate the morphology of nanocomposites, may some-
times fail, for different reasons, to see micrometre-sized clay
particles eventually surviving, together with exfoliated layers
and/or intercalated stacks, e.g. after insufficient melt com-
pounding, if their population is rarefied.
Table 3. Thermal properties, degree of crystallinity and average spherulite radii of the polymers and of some of their nanocomposites.
Material Tc Tm DHm Crystallinity TcPOM Spherulitesize
8C 8C J�g�1 % 8C mm
EAA1 80.1 94.3 53 18 85.3 2.06EAA1þ 5 phr 15A 80.7 94.6 51 17 88.0 1.80EAA1þ 11 phr 15A 80.0 95.0 50 17 88.1 1.64EAA1þ 18 phr 15A 79.0 94.6 53 18 - -EAA1þ 50 phr 15A 78.6 93.8 54 18 - -EAA2 86.7 103.8 82 28 - -EAA2þ 5 phr 15A 86.7 102.2 84 29 - -EAA2þ 11 phr 15A 86.5 102.3 81 28 - -EAA3 89.3 104.5 73 25 94.0 2.75EAA3þ 5 phr 15A 89.3 105.1 71 24 97.0 2.69EAA3þ 11 phr 15A 88.7 105.5 74 25 96.5 2.28EAA3þ 5 phr 93A 88.8 104.8 74 25 95.0 2.23EAA3þ 5 phr 30B 89.1 104.5 74 25 94.9 2.11EAA3þ 5 phr N848 88.9 104.9 72 24 95.5 2.19EAA3þ 5 phr SE3000 89.8 103.8 71 24 97.1 1.89EAA3þ 5 phr M3C18 89.0 104.6 72 25 96.2 2.13HDAA 117.0 129.7 175 60 124.0 9.26HDAAþ 5 phr 15A 118.3 129.1 165 56 124.4 5.98HDAAþ 11 phr 15A 116.4 130.9 178 61 - -HDAAþ 18 phr 15A 116.1 129.7 185 63 - -HDAAþ 50 phr 15A 116.2 128.9 183 62 - -
1212 S. Filippi, C. Marazzato, P. Magagnini, L. Minkova, N. T. Dintcheva, F. P. La Mantia
Macromol. Mater. Eng. 2006, 291, 1208–1225 www.mme-journal.de � 2006 WILEY-VCH Verlag GmbH & Co. KGaA, Weinheim

In Figure 2, the micrographs taken under crossed
polarisers on molten films of some of the materials studied
in this work are shown. At least five specimens, taken out of
the bulk of each nanocomposite as obtained from melt
compounding, were analysed by POM and the micrograph
with the average morphological aspect was chosen for the
figure. Despite the relatively low magnification, in fact, the
micrographs taken on samples of the same material appea-
red sometimes not fully alike, thus showing that, at least
with some of the employed organoclays e.g., N848 and
M3C18, the dispersion at micrometre scale was not uniform.
Figure 2(a–c) illustrates the evolution of the mesoscale
morphology of the EAA1/15A nanocomposite with 5 phr
organoclay, during the melt compounding process. Some
clay agglomerates up to 50 mm in size, together with much
smaller tactoids of a few microns, are seen in the composite
prepared with a melt compounding time of only 5 min
[Figure 2(a)]. After 10 min [Figure 2(b)], and even more
after 45 min [Figure 2(c)], the large agglomerates disappear
and just a few small tactoids are still visible. Thus, the 10-
min compounding time, normally employed for preparing
the nanocomposites studied in this work, proved sufficient
to break the large agglomerates. It may be interesting to
observe that, as it will be shown later, the tactoids at the
micrometre scale still visible by POM in the EAA1 nano-
composite prepared with 5 phr of 15A and 10 min blending
[Figure 2(b)] are too few or too small to be revealed by
WAXD and, for statistical reasons, even by high-resolution
TEM.
The other micrographs in Figure 2(d–i) illustrate the
behaviour of some of the other organoclays. A comparison
of Figure 2(b), 2(d) and 2(e) suggests that the higher the
excess of the M2(HT)2 surfactant used for modifying the
MMT, the easier is the organoclay dispersion. As demons-
trated by the micrograph in Figure 2(i), the worst dispersion
behaviour was observed for the N848 organoclay, modified
with octadecylamine. The remaining organoclays (the
micrograph of the M3C18 nanocomposite is not shown in
Figure 2) displayed intermediate behaviour. In summary,
the different organoclays employed in this work for the
preparation of nanocomposites with an EAA1 matrix can
be ranked in the following order of increasing dispersion
effectiveness: N848<M3C18 < 30B < SE3000 < 93A�20A < 15A� 6A.
A few POM observations made on films of nanocom-
posites prepared with EAA2, EAA3 and HDAA as the
matrix polymers (not shown in Figure 2) confirmed this
trend.
Cryo-fractured surfaces of the composites were also
analysed by SEM to gain additional information on meso-
scale morphology (Figure 3). The nanocomposites display-
ing just a few small birefringent spots in their POM
micrographs failed to show the presence of clay agglom-
erates when viewed by SEM [cf. Figure 3(a)]. This was not
surprising because SEM can only see the clay particles on
Figure 1. Polarised optical micrographs of (a) EAA1, (b) EAA1with 5 phr of 15A, (c) HDAA and (d) HDAAwith 5 phr of 15A. Thesamples were cooled from 190 8C to room temperature at1 8C�min�1. The insets show the Hv patterns.
Organoclay Nanocomposites from Ethylene–Acrylic Acid Copolymers 1213
Macromol. Mater. Eng. 2006, 291, 1208–1225 www.mme-journal.de � 2006 WILEY-VCH Verlag GmbH & Co. KGaA, Weinheim

the fractured surface, whereas POM observations were
made in transmission on �100 mm thick films. However,
when the number of clay agglomerates or micron-sized
tactoids is sufficiently high, the probability that they re-
main exposed on the cryo-fractured surface increases. An
example is given in Figure 3(b) and 3(c), where the SEM
micrographs of the cryo-fractured surface of the EAA1
nanocomposite with 5 phr of 30B are shown. According to
the Cloisite1 30B data sheet, this organoclay contains,
together with 90 vol.-% of particles less than 13 mm in
size, about 10 vol.-% of larger agglomerates. Actually, in
Figure 3(b) and 3(c), several clay particles may be clearly
seen having dimensions up to several micrometres.
Morphology of the Nanocomposites with theM2(HT)2-Modified Clays
In a previous paper,[51] a preliminary discussion on the
morphology of some of the nanocomposites studied in this
work has been made. Through X-ray and TEM character-
isations, it was found that the addition (5 phr) of one of the
organoclays modified with the M2(HT)2 surfactant (6A and
15A) leads to nanocomposites containing a large number of
exfoliated silicate layers and stacks of 2–4 platelets with an
average periodicity of about 4 nm, for the branched EAA
matrices, and about 3 nm for the linear HDAA. It was also
found that solvent extraction of the excess of surfactant
from 15A does not lead to appreciable changes in the X-ray
patterns of the composites, suggesting that a mechanism of
polymer intercalation with concurrent counter-diffusion of
excess surfactant takes place during melt compounding.
The morphology studies carried out in this work confirm
these conclusions. However, the question of whether the
exfoliated/intercalated morphology revealed by WAXD
and TEM for the EAA/15A nanocomposites corresponds
to thermodynamic equilibrium or is the result of, e.g. insuf-
ficient kneading time, is still open. The kinetics of nano-
composites formation by melt compounding has been
studied quite extensively[21,57,64–66] and it has been found
that break-up of clay agglomerates may be considerably
expedited by shear forces, whereas exfoliation of silicate
layer stacks does probably occur through a peeling-off
mechanism driven mainly by chemical compatibility bet-
ween clay and polymer. In Figure 4, the X-ray patterns of
three samples of EAA1 nanocomposites with 5 phr of 15A
prepared with 5, 10 and 45 min blending times, and of a
fourth sample obtained by annealing for 2 h at 190 8C that
prepared with 10 min blending are shown. The POM
Figure 2. Polarised optical micrographs of molten composites containing 5 phr of different organoclays,taken at 190 8C; (a) EAA1/15A, prepared by 5 min compounding, (b) EAA1/15A, prepared by 10 mincompounding, (c) EAA1/15A, prepared by 45 min compounding, (d) EAA1/6A, (e) EAA1/20A, (f) EAA1/93A, (g) EAA1/SE3000, (h) EAA1/30B and (i) EAA1/N848.
1214 S. Filippi, C. Marazzato, P. Magagnini, L. Minkova, N. T. Dintcheva, F. P. La Mantia
Macromol. Mater. Eng. 2006, 291, 1208–1225 www.mme-journal.de � 2006 WILEY-VCH Verlag GmbH & Co. KGaA, Weinheim

characterisation described above had demonstrated that the
sample prepared with the shortest kneading time (5 min)
still contains large-sized agglomerates. However, the X-ray
analysis illustrated in Figure 4 fails to provide any clear
indication of the presence of unintercalated clay particles in
this sample. Moreover, the diffractograms in Figure 4 show
that the intercalated stacks revealed by the basal reflection
at 2yffi 2.28 do not disappear when kneading is continued
for 45 min or the sample is annealed for 2 h at 190 8C(the latter treatment apparently causes only a slight shift
of the peak towards wider angles, probably due to partial
decomposition). This suggests that, in the conditions of
melt compounding employed in this work, a thermody-
namic equilibrium between exfoliated and intercalated clay
layers is reached quite rapidly and is practically independ-
ent of the thermo-mechanical history, being solely deter-
mined by the interfacial interactions between the polymer
and the organically modified clay surface.
The effect of higher clay loadings, up to 50 phr, was
studied to gain information on the possibility of preparing
concentrated EAA/clay master blends to be used as com-
patibilisers for PE-based nanocomposites. The dependence
of morphology on clay concentration is illustrated in
Figure 5–7, where the X-ray patterns of the nanocompo-
sites EAA1/20A, EAA1/15A and HDAA/15A are shown. A
comparison of Figure 5 and 6 confirms quite clearly that the
EAA1 nanocomposites prepared from 20A and 15A
possess very similar morphology. In fact, for both materials,
an intercalated structure characterised by a d001 spacing of
about 4 nm, which is independent both of the clay concen-
tration and the original basal spacing of the organoclay
(2.53 and 3.10 nm, respectively, for 20A and 15A), is
revealed by X-ray analysis. Moreover, the patterns display a
dramatic increase in intensity of the basal reflection and of
the higher order peaks as the amount of clay is increased.
This supports the view that the morphology of these
nanocomposites is only dependent on the chemical struc-
ture of the copolymer and the surfactant used for clay
modification, whereas the excess of surfactant initially pre-
sent in the 15A organoclay is probably expelled during melt
compounding. However, a deeper inspection of the low-
angle reflections of these two sets of nanocomposites
Figure 3. SEM micrographs of (a) EAA1 with 5 phr 15A, (b) and(c) EAA1 with 5 phr 30B.
10987654321
2θ (deg)In
tens
ity (
a.u.
)
a)
d 001 = 4.0 nm
d)
c)
b)
Figure 4. X-ray patterns of EAA1 nanocomposites with 5 phr15A prepared by (a) 5 min compounding, (b) 10 min compound-ing, (c) 45 min compounding and (d) 10 min compounding and 2 hannealing at 190 8C.
Organoclay Nanocomposites from Ethylene–Acrylic Acid Copolymers 1215
Macromol. Mater. Eng. 2006, 291, 1208–1225 www.mme-journal.de � 2006 WILEY-VCH Verlag GmbH & Co. KGaA, Weinheim

indicates that for the 15A nanocomposites they are
considerably sharper, suggesting that the structural order
and the coherence length of the intercalated tactoids is
improved if polymer intercalation takes place in the pre-
sence of an excess of surfactant.
The X-ray patterns of the HDAA/15A nanocomposites
shown in Figure 7 confirm that the spacing of the inter-
calated structure is invariant with clay content. As already
pointed out,[51] for this polymer too the average periodicity
was found to be independent of whether 20A, 15A or 6A
were used as nanofillers. The appreciably smaller interlayer
spacing of the HDAA nanocomposites (about 3 nm) can
tentatively be attributed to the lesser lateral bulkiness of the
linear chains of this copolymer which causes smaller
expansion of the silicate layer stacks. Interestingly, the
shape of the low-angle reflections shown in Figure 5 and 7
suggests that the intercalated clay tactoids of the HDAA
nanocomposites are less ordered than those in the corres-
ponding EAA1 nanocomposites.
The crystalline structure of the pure polymer matrices is
revealed, in the wide angle region of the spectra shown in
Figure 5–7, by the typical 110 and 200 reflections of PE at
about 2y¼ 21.3 and 23.58, respectively. These reflections
are considerably more intense for HDAA than for the
branched EAA1, as expected on the basis of the higher
crystallinity of the former copolymer (cf. Table 3). There-
fore, the effect of increasing the organoclay amount, though
being qualitatively similar for the two polymers, is more
evident for the set of HDAA nanocomposites (Figure 7). It
may be observed that the position of the two reflections on
the 2y scale does not change, and this means that the clay
addition does not alter the crystalline structure of the
polymers. However, the dramatic reduction of the ratio I110/
I200 of the uncorrected intensities of the reflections, which is
seen to occur as the clay loading is increased, demonstrates
302520151050
2θ (deg)
Inte
nsity
(a.
u.)
EAA1 + x phr 20A
x = 50
x = 18
x = 11
x = 5
x = 0
d 001 = 4.0 nm
d 001 = 2.5 nm 20A
Figure 5. X-ray patterns of 20A and EAA1/20A nanocompo-sites with different clay contents.
302520151050
2θ (deg)
Inte
nsity
(a.
u.)
EAA1 + x phr 15A
x = 50
x = 18
x = 11
x = 5
x = 2
x = 0
d 001 = 4.0 nm
Figure 6. X-ray patterns of EAA1/15A nanocomposites withdifferent clay contents.
302520151050
2θ (deg)In
tens
ity (
a.u.
)
HDAA + x phr 15A
x = 50
x = 18
x = 11
x = 5
x = 0
d 001 = 3.2 nm
Figure 7. X-ray patterns HDAA/15A nanocomposites withdifferent clay contents.
1216 S. Filippi, C. Marazzato, P. Magagnini, L. Minkova, N. T. Dintcheva, F. P. La Mantia
Macromol. Mater. Eng. 2006, 291, 1208–1225 www.mme-journal.de � 2006 WILEY-VCH Verlag GmbH & Co. KGaA, Weinheim

that the polymer lamellae are strongly oriented parallel to
the faces of the compression moulded discs. This effect was
also observed for nanocomposites comprising different
functionalised PE matrices and was shown to be partic-
ularly evident for highly exfoliated samples cooled slowly
from the melt.[67,68] WAXD and SAXS studies carried out
on quenched and slowly cooled nanocomposites of HDPE-
g-MA with 5 and 11 phr of 15A showed[69,70] that the clay
platelets are oriented preferentially in the compression
moulding plane and cause a confined polymer crystallisa-
tion leading to highly oriented crystallites.
In order to see if there were any significant differences
between the morphologies of the skin and the core of
compression moulded nanocomposite samples, some of the
discs were milled down to a thickness of 1 mm, as described
in the Experimental Part, and the X-ray patterns were taken
on both the core and the outer surfaces. The results are
presented in Figure 8 for some of the EAA1/15A nano-
composites. It is clearly observed that the skin and core
patterns are always very similar and that the basal ref-
lections of the intercalated clay stacks are seen at the same
2y angles. In some instances, however, the intensities of the
clay reflections were found to be slightly lower in the core,
suggesting that, occasionally, the clay platelets may either
gather or become more oriented in the skin.
The TEM characterisation of the nanocomposites with
the M2(HT)2 clays carried out in this work confirmed the
information of the X-ray study and was also in agreement
with the preliminary conclusions drawn in our previous
paper.[51] In particular, the low magnification (7–20 K)
TEM micrographs of these materials, not shown, indicate
that the organoclays are dispersed at the nanometre level
within the matrix polymers, thus confirming the POM
results discussed above. The higher magnification (50–
85 K) images of the EAA1 and HDAA nanocomposites
with 5 and 11 phr of 15A, shown in Figure 9, display
individual clay platelets accompanied by stacks of a few
layers. In most specimens taken from the nanocomposites
as received from the Brabender mixer, almost no preferred
orientation of the platelets and the tactoids could be seen
[Figure 9(c)and 9(d)]. In the compression moulded WAXD
specimens, on the contrary, the clay layers were more or less
oriented in a preferred direction [Figure 9(a)]. The gallery
heights d2 and the spacings d1 of the tactoids were measured
on the digitised micrographs with an Image-Pro1 Plus
software. The average figures obtained (on several tens of
measurements) for the EAA1/15A nanocomposites were in
good agreement with the WAXD data: d1¼ 4.1–4.3 nm and
d2¼ 2.3–2.5 nm. The scattering of the data was fairly
strong, also because of the observed poor parallelism of the
platelets within each sheaf: individual d1 measurements
ranged from about 3 to over 5 nm. The d1 spacing measured
for the HDAA/15A nanocomposites varied between 3.6 and
4.6 nm, with a mean value of about 4.1 nm. Thus, as com-
pared to the d001 figures measured from the X-ray patterns
(about 3.2 nm), higher values were found from the TEM
images of these nanocomposites, and this can probably be
ascribed to the uneven morphology of the matrix which
hampers a clear identification of the edges of individual
platelets. Furthermore, the preparation of thin sections of
these materials required more severe conditions; indeed, it
was necessary to go down to �145 8C to obtain satisfactory
sections, whereas a temperature of �130 8C proved suffi-
cient for the EAA1-based materials.
Although the structure of the organic modifier of SE3000
is undisclosed, we briefly discuss the behaviour of the
relevant EAA1 nanocomposites in this paragraph because
their morphology is very similar to that of the nano-
composites containing the M2(HT)2 clays. The similarity is
clearly demonstrated by the WAXD patterns in Figure 10,
compared with e.g., those in Figure 6, as well as by the
TEM micrographs of the EAA1/SE3000 nanocomposites
(not shown), which are practically identical to those in
Figure 9(a) and 9(b). The observation that the d001 spacings
measured for all these nanocomposites are very similar,
although the organic content of SE3000 is considerably
larger than those of 20A, 15A and 6A, made us specu-
late that SE3000 might contain an unbounded organic
compound (excess surfactant, or else) which is expelled,
during the compounding process, through a counter-flow
10987654321
2θ (deg)
Inte
nsity
(a.
u.)
a)b)
c)d)
e)f)
Figure 8. X-ray patterns of EAA1/15A nanocomposites withdifferent clay contents; (a) and (b) 5 phr, (c) and (d) 11 phr, (e) and(f) 50 phr. The (a), (c) and (e) patterns were taken on the core, andthe (b), (d) and (f) patterns were taken on the skin of compressionmoulded samples.
Organoclay Nanocomposites from Ethylene–Acrylic Acid Copolymers 1217
Macromol. Mater. Eng. 2006, 291, 1208–1225 www.mme-journal.de � 2006 WILEY-VCH Verlag GmbH & Co. KGaA, Weinheim

mechanism similar to that suggested for the M2(HT)2 clays.
The FTIR spectrum of SE3000 is compared in Figure 11
with that of 20A. The main difference is represented by the
two absorbance peaks at about 1 245 and 1 740 cm�1,
visible in the spectrum of SE3000. Different solvents were
used to try to extract the unbounded organic material from
this organoclay. Ethyl alcohol, which proved effective for
the extraction of the excess surfactant from 15A,[51] showed
poor efficiency with SE3000. In contrast, a deep extraction
was obtained with chloroform, but the clay powder re-
covery, accomplished by centrifugation, was incomplete as
�20% of it remained in suspension. The organic content of
the residue, measured by TGA, was of 32.3%. Tetrahy-
drofuran (THF) showed intermediate extraction power and
allowed to isolate the extracted organic material in fairly
pure form by evaporation of the clear solution obtained by
filtration. The inset of Figure 11 contains the region bet-
ween 1 150 and 1 800 cm�1 of the FTIR spectra of 20A
(curve a), of the residue of the extraction with chloroform
(curve b) and of the organic material recovered from the
THF solution (curve c). These spectra demonstrate that the
two absorbance peaks at about 1 245 and 1 740 cm�1 of the
SE3000 are in fact due to an unbounded organic material
and that the latter is different from the surfactant used for
modifying the MMT by cation exchange. The FTIR spect-
rum of the THF extract (curve c) resembles closely that of
an EVA sample with 14 wt.-% vinyl acetate (curve d). The
similarity of the spectra (a) and (b) in the inset of Figure 11,
as well as that of the diffraction patterns of the nanocom-
posites prepared from SE300 and the M2(HT)2 clays, seems
to indicate that all these clays contain the same quaternary
ammonium ion modifier and that they differ from each other
for the organic substance employed to expand their struc-
ture: excess surfactant for the 6A and 15A, and a low molar
mass polymer with a structure similar to EVA, for the
SE3000. To further confirm that the unbounded organic
material present in the SE3000 is practically unessential in
view of the preparation of EAA1-based nanocomposites,
Figure 9. TEM micrographs of the nanocomposites of EAA1, (a) and (b), and HDAA, (c) and (d), with5 phr, (a) and (c), and 11 phr, (b) and (d), of 15A.
1218 S. Filippi, C. Marazzato, P. Magagnini, L. Minkova, N. T. Dintcheva, F. P. La Mantia
Macromol. Mater. Eng. 2006, 291, 1208–1225 www.mme-journal.de � 2006 WILEY-VCH Verlag GmbH & Co. KGaA, Weinheim

we used the residue of the extraction of SE3000 with
chloroform to prepare a new composite with EAA1 and
found that the relevant X-ray pattern (not shown for the sake
of brevity) was in fact perfectly similar to that of the EAA1/
SE3000 nanocomposite (Figure 10).
Morphology of the Nanocomposites Loaded withDifferent Organoclays
The X-ray patterns of the nanocomposites of EAA1 with
5 phr of 93A, 30B, N848 and M3C18 are presented in
Figure 12, together with those of the clays, and the TEM
micrographs are shown in Figure 13. The patterns of all
composites show distinct peaks indicative of the presence of
unexfoliated clay tactoids. However, the position of these
peaks changes markedly with the structure of the clay
modifier and differs from that found for the M2(HT)2
nanocomposites described above. The TEM images in
Figure 13 also point to appreciable differences in the degree
of dispersion of the four clays, and demonstrate that the
extent of exfoliation is, for all of them, considerably lower
than that observed for the M2(HT)2 clays.
The effect of substitution of one of the methyl groups of
the M2(HT)2 surfactant of the 20A with hydrogen is
illustrated by the WAXD pattern and the TEM micrograph
of the EAA1/93A composite shown in Figure 12 and 13(a).
The morphologies of the EAA1 composites with 93A and
20A are qualitatively similar: individual exfoliated clay
layers are accompanied by fairly small tactoids. However,
the level of exfoliation of 93A is considerably lower and the
degree of expansion of the layer stacks (d001ffi 2.8 nm) is
definitely smaller. The different behaviour of the two clays
may be attributed to the lower shielding ability of the
hydrogen atom of the tertiary ammonium ion of 93A, as
compared to the methyl group of the 20A, and to the conse-
quently lower compatibility of the former clay for the
largely aliphatic EAA1 copolymer.
The three other clays were organically modified with
surfactants containing only one long alkyl group. One-
tailed organoclays such as 30B and M3(HT) (the latter is
very similar to the M3C18 used here) had been shown by
others[25,48] to give rise to significant shifts of the basal
reflection to larger 2y upon mixing with LLDPE or with a
PE ionomer and the reason for this shift was not fully
understood. The earlier interpretation[71] in terms of degra-
dation with loss of surfactant caused by the high temper-
atures (250 8C) used to process nylon-based nanocomposites
was subsequently questioned, as the same behaviour was
observed in preparations carried out at 200 8C.[25] The thermal
decomposition of the alkylammonium ions of the 30B clay
taking place at temperatures of 220–250 8C was also studied
by Dharaiya and Jana,[72] who found that the shift of the X-ray
diffraction peak to wider angles is accompanied by a reduction
of the height of the absorbance band due to –OH stretching in
the region 3 000–3 500 cm�1 of the FTIR spectrum, and by a
significant decrease of the surface polarity, as determined by
contact angle measurements. Tidjani et al.[73] found that a shift
of the 30B peak towards higher 2y angles was only observed
when the clay was melt-blended in air with PP-g-MA, whereas
such shift did not occur when compounding was carried out in
a nitrogen flow, and attributed the effect to an oxidation
process.
The diffractograms in Figure 12 demonstrate that the
peak shift behaviour has in fact been observed also in this
work for the 30B and M3C18 clays. In fact, the d001 spacing
of 30B is lowered from 1.84 to 1.55 nm, and that of M3C18
from 1.96 to 1.52 nm, after melt compounding with EAA1.
As described in the Experimental Part, we carried out the
melt compounding in a nitrogen flow and the processing
temperatures were normally rather low (120–150 8C), al-
though higher temperatures (190 8C) were used for the
preparation of X-ray specimens by compression moulding.
In order to see whether the latter high-temperature treat-
ment could be responsible for the observed effect, addi-
tional specimens of both the EAA1/30B and EAA1/M3C18
nanocomposites were prepared by moulding at 120 8Ceither the products prepared with the usual compounding
procedure (120 8C and 60 rpm) and new samples prepared at
100 8C and 30 rpm. The EAA1/30B samples displayed X-
ray patterns identical to that shown in Figure 12, thus
demonstrating that the structural tightening of the 30B clay
takes place even under very mild processing conditions. In
contrast, in the X-ray spectra of the samples of EAA1/
M3C18 the peak was approximately at the same position
(2yffi 4.58) of the virgin organoclay, suggesting that M3C18
302520151050
2θ (deg)
Inte
nsity
(a.
u.)
EAA1 + x phr SE3000
x = 50
x = 18
x = 11
x = 5
x = 0
d 001 = 4.2 nm
d 001 = 3.5 nm SE3000
Figure 10. X-ray patterns of SE3000 and EAA1/SE3000 nano-composites with different clay contents.
Organoclay Nanocomposites from Ethylene–Acrylic Acid Copolymers 1219
Macromol. Mater. Eng. 2006, 291, 1208–1225 www.mme-journal.de � 2006 WILEY-VCH Verlag GmbH & Co. KGaA, Weinheim

is appreciably more stable than 30B and undergoes the
spacing shrinkage only when a high temperature (190 8C) is
used in the preparation of the compression moulded X-ray
specimens.
The thermal stability of the two clays was studied further
by treating virgin clay samples in a vacuum oven at 160 and
190 8C (i.e., the maximum temperatures possibly reached
during melt compounding and compression moulding,
respectively) and analysing them after different treatment
times. The results are shown in Figure 14 for the 30B
samples. The shape of the peak recorded after increasing
times suggests that a new reflection centred at about 2y¼5.78 (i.e., the position observed for the composites) appears
and gradually replaces that of the virgin 30 B clay at
2y¼ 4.88. However, when the 30B is thermally treated in a
vacuum oven the process appears to be much slower than
that taking place during melt-blending with the EAA1. In
fact, after 3 h at 160 8C, the new reflection is seen as a
shoulder on the wide-angle side of the original peak, and it
is only after a 3-h treatment at 190 8C that the shape of the
diffraction pattern actually becomes similar to that of the
EAA1/30B composite. Surprisingly, however, the TGA
weight loss of the 30B sample held 3 h at 190 8C was found
to be only 4% lower than that of the virgin clay, and the
FTIR spectrum revealed just a slight reduction of intensity
of the hydroxyl absorbance at 3 000–3 500 cm�1. As for the
M3C18 clay, on the contrary, no peak shift was observed
even after 3 h at 190 8C under vacuum, confirming that the
thermal stability of M3C18 is considerably higher than that
of 30B. The present results do not allow a definite under-
standing of the mechanism of the structural tightening of
these two clays. However, they show that, at any temper-
ature, the process is amazingly accelerated when the clays
are dispersed within a polymer matrix. To our knowledge,
this had not been recognised before.
The TEM micrographs of the EAA1/30B and EAA1/
M3C18 composites shown in Figure 13(b) and 13(c) demon-
strate that these are actually microcomposites. In agreement
5001000150020002500300035004000
Wavenumber (cm-1)
Tra
nsm
ittan
ce
1150135015501750
a
b
c
d
20A
SE3000
1245
1740
Figure 11. FTIR spectra of 20A and SE3000. The inset shows the 1 150–1 800 cm�1 regionof the FTIR spectra of (a) 20A, (b) residue of the extraction of SE3000 with chloroform,(c) organic material extracted from SE3000 with THF and (d) EVAwith 14 wt.-% vinyl acetate.
10987654321
2θ (deg)
Inte
nsity
(a.
u.)
93A
EAA1/93A
EAA1/30B
30B
EAA1/N848
N848
M3C18
EAA1/M3C18
Figure 12. X-ray patterns of the composites of EAA1 with 5 phrof 93A, 30B, N848 and M3C18, compared with those of the clays.
1220 S. Filippi, C. Marazzato, P. Magagnini, L. Minkova, N. T. Dintcheva, F. P. La Mantia
Macromol. Mater. Eng. 2006, 291, 1208–1225 www.mme-journal.de � 2006 WILEY-VCH Verlag GmbH & Co. KGaA, Weinheim
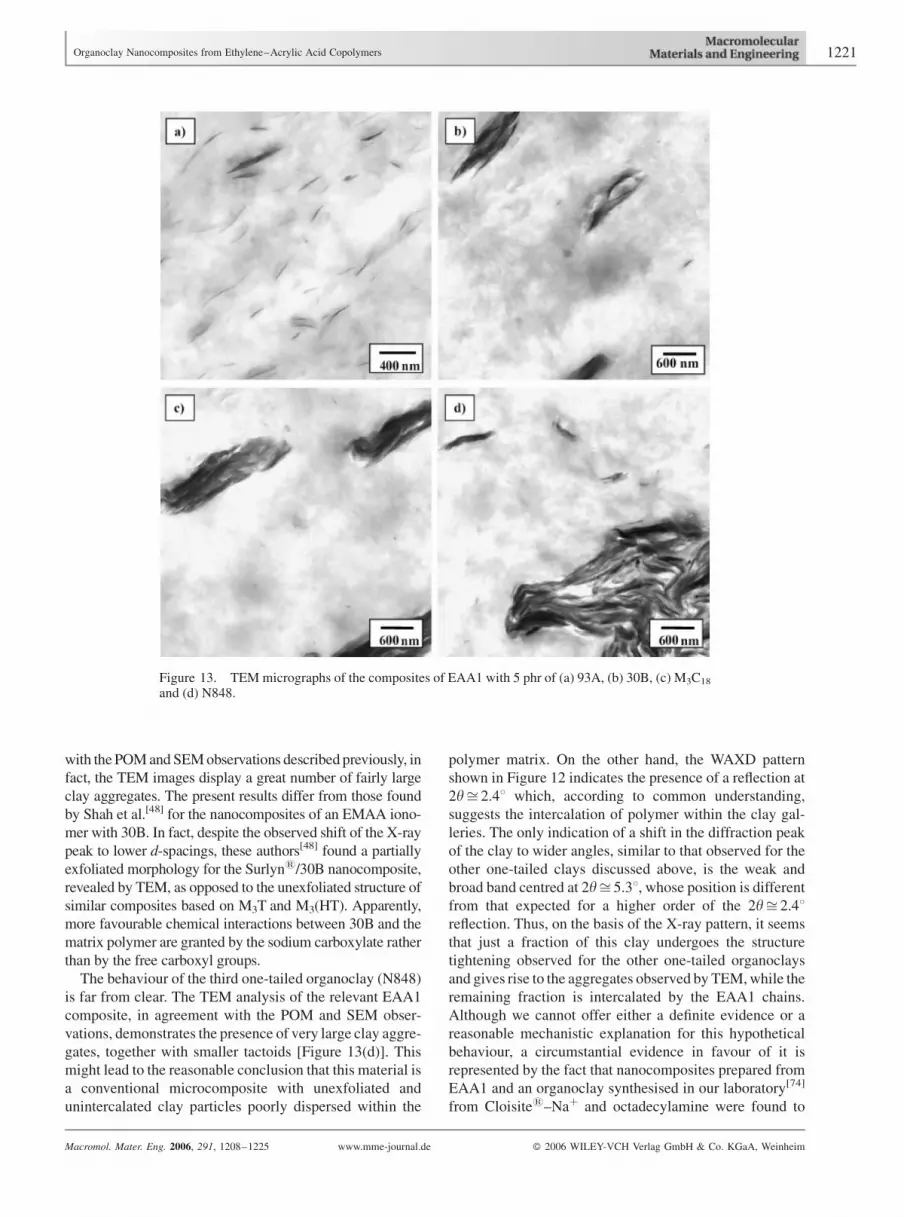
with the POM and SEM observations described previously, in
fact, the TEM images display a great number of fairly large
clay aggregates. The present results differ from those found
by Shah et al.[48] for the nanocomposites of an EMAA iono-
mer with 30B. In fact, despite the observed shift of the X-ray
peak to lower d-spacings, these authors[48] found a partially
exfoliated morphology for the Surlyn1/30B nanocomposite,
revealed by TEM, as opposed to the unexfoliated structure of
similar composites based on M3T and M3(HT). Apparently,
more favourable chemical interactions between 30B and the
matrix polymer are granted by the sodium carboxylate rather
than by the free carboxyl groups.
The behaviour of the third one-tailed organoclay (N848)
is far from clear. The TEM analysis of the relevant EAA1
composite, in agreement with the POM and SEM obser-
vations, demonstrates the presence of very large clay aggre-
gates, together with smaller tactoids [Figure 13(d)]. This
might lead to the reasonable conclusion that this material is
a conventional microcomposite with unexfoliated and
unintercalated clay particles poorly dispersed within the
polymer matrix. On the other hand, the WAXD pattern
shown in Figure 12 indicates the presence of a reflection at
2yffi 2.48 which, according to common understanding,
suggests the intercalation of polymer within the clay gal-
leries. The only indication of a shift in the diffraction peak
of the clay to wider angles, similar to that observed for the
other one-tailed clays discussed above, is the weak and
broad band centred at 2yffi 5.38, whose position is different
from that expected for a higher order of the 2yffi 2.48reflection. Thus, on the basis of the X-ray pattern, it seems
that just a fraction of this clay undergoes the structure
tightening observed for the other one-tailed organoclays
and gives rise to the aggregates observed by TEM, while the
remaining fraction is intercalated by the EAA1 chains.
Although we cannot offer either a definite evidence or a
reasonable mechanistic explanation for this hypothetical
behaviour, a circumstantial evidence in favour of it is
represented by the fact that nanocomposites prepared from
EAA1 and an organoclay synthesised in our laboratory[74]
from Cloisite1–Naþ and octadecylamine were found to
Figure 13. TEM micrographs of the composites of EAA1 with 5 phr of (a) 93A, (b) 30B, (c) M3C18
and (d) N848.
Organoclay Nanocomposites from Ethylene–Acrylic Acid Copolymers 1221
Macromol. Mater. Eng. 2006, 291, 1208–1225 www.mme-journal.de � 2006 WILEY-VCH Verlag GmbH & Co. KGaA, Weinheim

display X-ray patterns identical to that shown in Figure 12
for the EAA1/N848.
Rheology and Mechanical Testing
The effect of the addition of 5 or 11 phr of 15A into the four
copolymers on their rheological behaviour is illustrated in
Figure 15, where the dimensionless viscosity of the nano-
composites (i.e., the ratio, at any frequency, of their
viscosity to that of the matrix) is plotted versus frequency.
It may be observed that the viscosity of the nanocomposites
is generally higher than that of the matrix, especially at low
frequencies, and that the difference increases as the clay
concentration is increased. The non-Newtonian behaviour
of the materials is markedly enhanced in the presence of
clay, notably for concentrations higher than 5 phr. This is
typical for filled polymers, including nanocomposites. Only
for the EAA3/15A nanocomposite, Figure 15 shows that the
viscosity ratio becomes slightly lower than unity at frequ-
encies exceeding 100 rad�s�1. This might be due to the
excess of surfactant of the 15A clay, which was shown to
migrate into the matrix during melt-blending, thus playing a
plasticising role which is obviously more pronounced for
this higher molar mass copolymer. The curves in Figure 15
also show that the apparent viscosity ratio is higher for the
EAA1 composite, probably because of the higher AA
concentration in the matrix. The increase in viscosity
caused by the addition of 15A, however, is considerably
stronger for the linear HDAA copolymer. This is demon-
strated even more clearly by the curves of the nanocompo-
sites with 11 phr of 15A, whose low-frequency trend
suggests a pronounced solid-like behaviour. The latter be-
haviour was also clearly demonstrated by the curves of the
storage modulus (not shown) displaying strong slope
changes at low frequencies.
The effect of the different clays studied in this work on
the rheological behaviour of the composites is compared
with that of 15A in Figure 16, where the viscosity ratios
calculated for the EAA1 nanocomposites with 5 phr of clay
are shown. Clearly, none of the clays cause a viscosity
increase comparable with that observed for 15A. This was
not unexpected, considering the morphological character-
istics of the different composites. The modest viscosity
increase of the EAA1/SE3000 nanocomposite, whose
morphology was shown to resemble closely to that of the
M2(HT)2 clays, may probably be accounted for considering
that, as suggested before, an appreciable amount of un-
bounded organic material of the SE3000 clay is supposed to
migrate to the matrix polymer during blending, thus acting
as a plasticiser. The viscosity of the EAA1/30B composite
was found to be lower than that of the matrix in the whole
frequency range investigated. The only possible interpre-
tation we can tentatively offer for this finding is again
connected with matrix polymer plasticisation caused by the
organic material produced by the clay decomposition dis-
cussed above.
The mechanical properties of the pure polymers and of
some of their nanocomposites are reported in Table 4. The
TS and the EB of the three unfilled EAA copolymers are
very similar, whereas the E and the YS of EAA1 are lower
than the corresponding values of EAA2 and EAA3. The
reduced rigidity of EAA1 can be attributed to the higher
content of AA monomer units that lowers the degree of
crystallinity, as reported in Table 3. On the other hand, the
high crystallinity of HDAA is responsible for the higher
rigidity and lower ductility of this material.
The addition of clays enhances the rigidity of all the
matrices, as demonstrated by the increase in E and YS,
without significantly reducing the EB; the TS variations are
in general quite small. Among the nanocomposites with
5 phr of 15A, the strongest increase of E (about 60%) was
displayed by that with an EAA3 matrix. For this material,
the TS was almost unchanged while the EB was only about
15% lower than that of the pure matrix. The strongest
reduction of EB was recorded for the highly crystalline
HDAA/15A nanocomposite. The effect of nanofiller con-
tent on the mechanical properties is also illustrated in
Table 4 with reference to the EAA1 and HDAA nano-
composites with 15A. With both these matrices, an increase
10987654321
2θ (deg)
Inte
nsity
(a.
u.)
30B
160°C 1h
160°C 2h
160°C 3h
190°C 3h
190°C 2h
190°C 1h
EAA1/30B
d 001 = 1.55 nm
d 001 = 1.84 nm
Figure 14. X-ray patterns of 30B (lower curve) and of the EAA1composite with 5 phr of 30B (upper curve). The intermediatecurves are for 30B annealed at 160 or 190 8C for the indicatedtimes.
1222 S. Filippi, C. Marazzato, P. Magagnini, L. Minkova, N. T. Dintcheva, F. P. La Mantia
Macromol. Mater. Eng. 2006, 291, 1208–1225 www.mme-journal.de � 2006 WILEY-VCH Verlag GmbH & Co. KGaA, Weinheim

in nanofiller content leads to an appreciable increase in
modulus, whereas the TS and EB are lowered moderately.
The mechanical properties of the EAA1 composites
containing 5 phr of the different organoclays studied in this
work are also shown in Table 4. For all these materials, the YS
is higher than that of the matrix by 10–20% and the TS is
slightly lower. However, the dependence of these two
properties on the structure of the organic clay modifier is
rather irregular. Actually, in view of the multiplicity of para-
meters that may exert an influence on both morphology and
mechanical properties of these materials, such as interfacial
adhesion between clay and polymer, polymer crystallinity,
decomposition of the clay modifier, polymer plasticisation
due to organic materials released by the clay during proces-
sing etc., the available results are not sufficient for drawing
definite conclusions on the relationships between mechanical
properties and clay structure. The only indication provided by
the data in Table 4 is that the E values of the nanocomposites
are about 20% higher than that of the pure polymer (except for
the nanocomposite with the 93A clay, modified with a ternary
ammonium ion, whose E is about 30% higher) and that this
property seems to be scarcely influenced by the level of dis-
persion of the nanofiller. The latter morphological character-
istic, on the other hand, appears to have some effect, though
1
2
3
4
5
6
7
8
9
10001001010,1
Frequency (rad/s)
Vis
cosi
ty r
atio
EAA1/15A
EAA2/15A
EAA3/15A
HDAA/15A
11 phr
5 phr
Figure 15. Dimensionless viscosity (ratio of the apparent viscosity to that of thematrix polymer) of the EAA1, EAA2, EAA3 and HDAA nanocomposites with 5 and11 phr of 15A.
0,5
1,0
1,5
2,0
2,5
10001001010,1
Frequency (rad/s)
Vis
cosi
ty r
atio
15A93ASE3000N848M3C1830B
EAA1with 5 phr of:
Figure 16. Dimensionless viscosity (ratio of the apparent viscosity to that of thematrix polymer) of the EAA1 composites with 5 phr of different organoclays.
Organoclay Nanocomposites from Ethylene–Acrylic Acid Copolymers 1223
Macromol. Mater. Eng. 2006, 291, 1208–1225 www.mme-journal.de � 2006 WILEY-VCH Verlag GmbH & Co. KGaA, Weinheim

slight, on the EB values that are only lowered by about 10%
for the intercalated nanocomposites with good clay dis-
persion, such as those with 15A and SE3000, whereas they
decrease by about 20% for the other composites.
Conclusion
Ethylene–acrylic acid copolymers have been shown to
interact efficiently with organoclays containing quaternary
ammonium ion modifiers with two methyl groups and two
long alkyl tails (M2HT2). Mixed exfoliated and intercalated
morphologies were observed for these systems and were
shown to correspond to thermodynamic equilibrium. In
fact, an increase in the blending time from 5 to 45 min,
though improving the fragmentation of clay agglomerates,
had no effect on the gallery height of the silicate layer
stacks, as observed by X-ray diffraction. TEM observation
of the nanocomposites with M2HT2 clays revealed a popu-
lation of well-dispersed individual platelets and thin stacks
of a few irregularly spaced silicate layers. The average
spacing, measured from X-ray patterns, was found to
depend on the molecular architecture of the matrix polymer,
rather than on the concentration of AA units and the
molecular weight. The nanocomposites from the branched
EAA copolymers had a d-spacing of about 4 nm, indepen-
dent of that of the original clay (i.e., of the excess of
surfactant used for clay modification). The behaviour of the
linear HDAA graft copolymer is perfectly similar, but the
intercalated silicate stacks have smaller periodicity (about
3 nm), probably because the extended chains of this
copolymer have thinner lateral dimensions. The finding that
the clay stack expansion is not reduced as a result of an
increase in clay loading up to 50 phr suggests that these
EAA copolymers may be used as compatibilisers for PE-
based nanocomposites. Studies are in progress on the
characterisation of nanocomposites produced by dilution of
EAA/M2HT2 and HDAA/M2HT2 concentrated blends with
different PE grades.
Acknowledgements: Thanks are due to Exxon-Mobil Chemicaland Crompton Corp. for kindly providing samples of the polymersused in this work. The research was carried out within the PRIN2004 098403 project funded by the Italian Ministry of Education,University and Research (MIUR). The cooperation among theInstitutions was also supported by NATO (grant CBP.EAP.CLG981257). The authors express their gratitude towards ProfessorGiovanna Costa and Professor Barbara Valenti of the Institute forMacromolecular Studies (ISMac) of C.N.R., Genova, for theiraccurate reading of the text and insightful discussions. We are alsothankful to Dr. Alessandro Sola, Dr. Andrea Buti and Dr. ElenaMameli for their help in preparing the samples and carrying onseveral characterisation experiments.
[1] E. P. Giannelis, R. Krishnamoorti, E. Manias, Adv. Polym.Sci. 1999, 138, 107.
[2] P. C. LeBaron, Z. Wang, T. J. Pinnavaia, J. Appl. Clay Sci.1999, 15, 11.
[3] T. J. Pinnavaia, G. W. Beau, ‘‘Polymer-Clay Nanocompo-sites’’, Wiley, West Sussex 2000.
[4] M. Alexandre, P. Dubois, Mater. Sci. Eng. R 2000, 28, 1.[5] E. Manias, A. Touny, L. Wu, K. Strawhecker, B. Lu, T. C.
Chung, Chem. Mater. 2001, 13, 3516.[6] S. Sinha Ray, M. Okamoto,Prog. Polym. Sci. 2003, 28, 1539.[7] H. Fisher, Mater. Sci. Eng. 2003, 23, 763.[8] S. J. Ahmadi, Y. D. Huang, W. Li, J. Mater. Sci. 2004, 39,
1919.[9] H. G. Jeon, H. T. Jung, S. W. Lee, S. D. Hudson, Polym. Bull.
1998, 41, 107.[10] N. Hasegawa, H. Okamoto, M. Kawasumi, M. Kato, A.
Tsukigase, A. Usuki,Macromol. Mater. Eng. 2000, 280/281,76.
[11] K. H. Wang, M. H. Choi, C. M. Koo, Y. S. Choi, I. J. Chung,Polymer 2001, 42, 9819.
[12] M. Alexandre, P. Dubois, T. Sun, J. M. Garces, R. Jerome,Polymer 2002, 43, 2123.
[13] T. G. Gopakumar, J. A. Lee, M. Kontopoulou, J. S. Parent,Polymer 2002, 43, 5483.
[14] F. P. La Mantia, S. Lo Verso, N. Tzankova Dintcheva,Macromol. Mater. Eng. 2002, 287, 909.
[15] M. Kato, H. Okamoto, N. Hasegawa, A. Tsukigase, A.Usuki, Polym. Eng. Sci. 2003, 43, 1312.
[16] S. Wang, Y. Hu, Q. Zhongkai, Z. Wang, Z. Chen, W. Fan,Mater. Lett. 2003, 57, 2675.
[17] J. Zhang, C. A. Wilkie, Polym. Degrad. Stab. 2003, 80, 163.[18] C. Zhao, M. Feng, F. Gong, H. Qin, M. Yang, J. Appl. Polym.
Sci. 2004, 93, 676.[19] J. K. Pandey, R. P. Singh, e-Polymers 2004, no. 051.[20] W. Granelli, G. Camino, N. Tzankova Dintcheva, S. Lo
Verso, F. P. La Mantia, Macromol. Mater. Eng. 2004, 289,238.
[21] M. Mehrabzadeh, M. R. Kamal, Polym. Eng. Sci. 2004, 44,1152.
[22] H. Zhai, W. Xu, H. Guo, Z. Zhou, S. Shen, Q. Song, Eur.Polym. J. 2004, 40, 2539.
[23] G. Liang, J. Xu, S. Bao, W. Xu, J. Appl. Polym. Sci. 2004, 91,3974.
[24] G. Liang, J. Xu, W. Xu, J. Appl. Polym. Sci. 2004, 91, 3054.
Table 4. Mechanical properties of some composites.
Material E YS TS EB
MPa MPa MPa %
EAA1 96 9.5 19.5 460EAA1þ 5 phr 15A 115 11.2 17.9 416EAA1þ 11 phr 15A 138 13.2 15.6 386EAA1þ 5 phr 93A 127 11.2 18.2 382EAA1þ 5 phr SE3000 115 10.3 20.1 416EAA1þ 5 phr N848 118 10.4 19.2 396EAA1þ 5 phr M3C18 117 10.2 17.6 373EAA1þ 5 phr 30B 119 11.5 19.2 385EAA2 112 10.7 18.8 452EAA2þ 5 phr 15A 151 12.2 17.8 405EAA3 117 10.9 19.8 468EAA3þ 5 phr 15A 184 12.9 19.3 395HDAA 585 - 30.3 19.8HDAAþ 5 phr 15A 818 - 29.5 6.7HDAAþ 11 phr 15A 863 - 27.8 4.9
1224 S. Filippi, C. Marazzato, P. Magagnini, L. Minkova, N. T. Dintcheva, F. P. La Mantia
Macromol. Mater. Eng. 2006, 291, 1208–1225 www.mme-journal.de � 2006 WILEY-VCH Verlag GmbH & Co. KGaA, Weinheim

[25] S. Hotta, D. R. Paul, Polymer 2004, 45, 7639.[26] C. Zhao, H. Qin, F. Gong, M. Feng, S. Zhang, M. Yang,
Polym. Degrad. Stab. 2005, 87, 183.[27] Y. Xu, Z. Fang, L. Tong, J. Appl. Polym. Sci. 2005, 96, 2429.[28] D. J. Chaiko, A. A. Leyva, Chem. Mater. 2005, 17, 13.[29] K. Chrissopoulou, I. Altintzi, S. H. Anastasiadis, E. P.
Giannelis, M. Pitsikalis, N. Hadjichristidis, N. Theophilou,Polymer 2005, 46, 12440.
[30] J. Morawiec, A. Pawlak, M. Slouf, A. Galeski, E. Pior-kowska, N. Krasnikowa, Eur. Polym. J. 2005, 41, 1115.
[31] J. T. Xu, Q. Wang, Z. Q. Fan, Eur. Polym. J. 2005, 41, 3011.[32] S. C. Tjong, S. P. Bao, J. Polym. Sci., Part B: Polym. Phys.
2005, 43, 253.[33] A. Ranade, K. Nayak, D. Fairbrother, N. A. D’Souza,
Polymer 2005, 46, 7323.[34] M. A. Osman, J. E. P. Rupp, U. W. Suter, Polymer 2005, 46,
1653.[35] M. A. Osman, J. E. P. Rupp, U. W. Suter, Polymer 2005, 46,
8202.[36] M. A. Osman, J. E. P. Rupp, Macromol. Rapid Commun.
2005, 26, 880.[37] F. Bergaya, T. Mandalia, P. Amigouet, Colloid Polym. Sci.
2005, 283, 773.[38] M. Mainil, M. Alexandre, F. Monteverde, P. Dubois,
J. Nanosci. Nanotechnol. 2006, 6, 337.[39] L. Qiu, W. Chen, B. Qu, Polymer 2006, 47, 922.[40] D. J. Chaiko, e-Polymers 2006, no. 019.[41] C. M. Koo, H. T. Ham, S. O. Kim, K. H. Wang, I. J. Chung,
D. C. Kim, W. C. Zin, Macromolecules 2002, 35, 5116.[42] K. H. Wang, I. J. Chung, M. C. Jang, J. K. Keum, H. H. Song,
Macromolecules 2002, 35, 5529.[43] K. H. Wang, M. H. Choi, C. M. Koo, M. Xu, I. J. Chung,
M. C. Jang, S. W. Choi, H. H. Song, J. Polym. Sci., Part B:Polym. Phys. 2002, 40, 1454.
[44] K. H. Wang, C. M. Koo, I. J. Chung, J. Appl. Polym. Sci.2003, 89, 2131.
[45] C. M. Koo, S. O. Kim, I. J. Chung,Macromolecules 2003, 36,2748.
[46] C. M. L. Preston, G. Amarasinghe, J. L. Hopewell, R. A.Shanks, Z. Mathys, Polym. Degrad. Stab. 2004, 84, 533.
[47] M. Gelfer, H. H. Song, L. Liu, C. Avila-Orta, L. Yang, M. Si,B. S. Hsiao, B. Chu, M. Rafailovich, A. H. Tsou,Polym. Eng.Sci. 2002, 42, 1841.
[48] R. K. Shah, D. L. Hunter, D. R. Paul, Polymer 2005, 46,2646.
[49] J. A. Lee, M. Kontopoulou, J. S. Parent, Polymer 2004, 45,6595.
[50] J. W. Huang, C. C. Kang, T. H. Chen, J. Appl. Polym. Sci.2005, 97, 1051.
[51] P. Magagnini, S. Filippi, C. Marazzato, F. P. La Mantia,L. Minkova, e-Polymers 2005, no. 086.
[52] B. Wunderlich, G. Czornyj, Macromolecules 1977, 10, 906.[53] P. H. Geil, ‘‘Polymer Single Crystals’’, Interscience, New
York 1968.[54] Y. Peneva, L. Minkova, Polym. Test. 2006, 25, 366.[55] T. Liu, W. C. Tjiu, Y. Tong, C. He, S. S. Goh, T. S. Chung,
J. Appl. Polym. Sci. 2004, 94, 1236.[56] A. Dundigalla, S. Lin-Gibson, V. Ferreiro, M. M. Malwitz,
G. Schmidt, Macromol. Rapid Commun. 2005, 26, 143.[57] D. Homminga, B. Goderis, S. Hoffman, H. Reynaers,
G. Groeninckx, Polymer 2005, 46, 9941.[58] S. C. Tjong, S. P. Bao, G. D. Liang, J. Polym. Sci., Part B,
Polym. Phys. 2005, 43, 3112.[59] P. Maiti, P. H. Nam, M. Okamoto, T. Kotaka, N. Hasegawa,
A. Usuki, Polym. Eng. Sci. 2002, 42, 1864.[60] P. Maiti, P. H. Nam, M. Okamoto, N. Hasegawa, A. Usuki,
Macromolecules 2002, 35, 2042.[61] T. M. Wu, S. F. Hsu, J. Y. Wu, Polym. Eng. Sci. 2002, 42,
2295.[62] D. Gournis, G. Floudas, Chem. Mater. 2004, 16, 1686.[63] T. Jiang, Y. H. Wang, J. T. Yeh, Z. Q. Fan,Eur. Polym. J.2005,
41, 459.[64] R. A. Vaia, E. P. Giannelis, Macromolecules 1995, 28, 8080.[65] R. A. Vaia, K. D. Jandt, E. J. Kramer, E. P. Giannelis, Chem.
Mater. 1996, 8, 2628.[66] H. R. Dennis, D. L. Hunter, D. Chang, S. Kim, J. L. White,
J. W. Cho, D. R. Paul, Polymer 2001, 42, 9513.[67] A. Sola, Thesis, University of Pisa, 2005.[68] A. Buti, Thesis, University of Pisa, 2005.[69] A. Famulari, P. Arosio, S. V. Meille, S. Filippi, C. Marazzato,
P. Magagnini, Proceedings of XVII AIM Meeting, Naples,11–15 September 2005, p. 120.
[70] A. Famulari, S. Filippi, C. Marazzato, P. Magagnini, L.Minkova, P. Arosio, S. V. Meille, J. Macromol. Sci., Phys.,accepted.
[71] P. J. Yoon, D. L. Hunter, D. R. Paul, Polymer 2003, 44, 5323.[72] D. Dharaiya, S. C. Jana, Polymer 2005, 46, 10139.[73] A. Tidjani, O. Wald, M. M. Pohl, M. P. Hentsche, B. Schartel,
Polym. Degrad. Stab. 2003, 82, 133.[74] E. Mameli, Thesis, University of Pisa, 2006.
Organoclay Nanocomposites from Ethylene–Acrylic Acid Copolymers 1225
Macromol. Mater. Eng. 2006, 291, 1208–1225 www.mme-journal.de � 2006 WILEY-VCH Verlag GmbH & Co. KGaA, Weinheim
Copyright © 2022 FDOKUMEN