Adhesion formation after intracapsular myomectomy with or without adhesion barrier

European Polymer Journal 45 (2009) 57–69
Contents lists available at ScienceDirect
European Polymer Journal
journal homepage: www.elsevier .com/locate /europol j
OG
Y
Macromolecular Nanotechnology
Surface and adhesion properties of poly(imide-siloxane) block copolymers
I. Novák a,*, P. Sysel b, J. Zemek c, M. Špírková d, D. Velic e,f, M. Aranyosiová e,f, Š. Florián a,V. Pollák a, A. Kleinová a, F. Lednicky d, I. Janigová a
a Polymer Institute, Slovak Academy of Sciences, 842 36 Bratislava, Slovakiab Department of Polymers, Institute of Chemical Technology, 166 28 Prague 6, Czech Republicc Institute of Physics of the ASCR, v. v. i., 162 53 Prague 6, Czech Republicd Institute of Macromolecular Chemistry of The AS CR, v. v. i., 162 06 Prague 6, Czech Republice International Laser Center, Bratislava, Slovakiaf Department of Physical and Theoretical Chemistry, Faculty of Natural Sciences, Comenius University, 84 215 Bratislava, Slovakia
a r t i c l e i n f o
OLE
CULA
RN
AN
OTE
CHN
OL
Article history:Received 9 December 2007Received in revised form 23 September2008Accepted 26 September 2008Available online 17 October 2008
Keywords:Poly (imide-b-siloxane)AFMSIMSXPSWettabilityAdhesion
0014-3057/$ - see front matter � 2008 Elsevier Ltddoi:10.1016/j.eurpolymj.2008.09.041
* Corresponding author. Tel.:+421 2 5477 3308; faE-mail address: [email protected] (I. Novák).
ACR
OM
a b s t r a c t
Poly(imide-siloxane) (PIS) block copolymers were studied with respect to their structuresurface and adhesive properties relationship. The study of the morphology of PIS copoly-mers characterized by Scanning Electron Microscopy (SEM), Transmission Electron Micros-copy (TEM), and Atomic Force Microscopy (AFM) shows a growth of the surface roughnessby increase of the content of siloxane. With an increase of siloxane content AttenuatedTotal Reflection-Fourier Transform Infra Red (ATR-FTIR) spectroscopy detected a growthof the absorption bands near 1100 cm�1 characteristic for siloxane group, and a decreaseat 1700–1800 cm�1 corresponding to carbonyl groups of polyimide moieties. The X-rayPhotoelectron Spectroscopy (XPS) and Time-of-Flight-Secondary Ion Mass Spectroscopy(TOF-SIMS) analysis showed an excessive increase of Si on surface of the copolymer. Therelatively small amount of siloxane in PIS block copolymer, 10–20 wt.%, increased signifi-cantly the contact angle of water due to the surface hydrophobization of the copolymer andthe significant decrease of the surface energy of the PIS copolymer has been observed. Thepolar component of surface energy shows an intense decrease, whereas its dispersive com-ponent increases. The increase of the surface hydrophobicity reduced the peel as well asshear strengths of epoxy adhesive joints. The relationship between peel strength of adhe-sive joint to epoxy and polar fraction of PIS copolymer can be described by exponentialdecay dependence.
� 2008 Elsevier Ltd. All rights reserved.
M
1. IntroductionPolyimides present an important class of polymers, nec-essary in microelectronics, printed circuits construction,and aerospace investigation, mainly because their highthermal stability and good dielectric properties [1–4]. Inthe last years, several sorts of block polyimide basedcopolymers, namely poly(imide-siloxane) (PIS) blockcopolymers containing siloxane blocks in their polymerbackbone have been investigated [5–10]. In comparison
. All rights reserved.
x: +421 2 5477 5923.
with neat polyimides the PIS block copolymers possesssome improvements, e.g. enhanced solubility, low mois-ture sorption, and their surface reaches the higher degreeof hydrophobicity already at low content of polysiloxanein PIS copolymer [11]. This kind of the block copolymersare used as high-performance adhesives and coatings.The surface as well as adhesive properties of PIS blockcopolymers depends on the content and length of siloxaneblocks. The surface properties of PIS block copolymers arestrongly influenced by enrichment of the surface withsiloxane segments [12]. Micro phase separation of PISblock copolymers occurs due to the dissimilarity betweenthe chemical structures of siloxane, and imide blocks even
58 I. Novák et al. / European Polymer Journal 45 (2009) 57–69
MA
CRO
MO
LECU
LAR
NA
NO
TECH
NO
LOG
Y
at relatively low lengths of the blocks [13–15]. The imidesegments at room temperature are below their glassy tem-perature and their mobility is reduced. The glassy temper-ature of siloxane segments is below the room temperature,thus these segments enable to migrate to the copolymersurface area. Surface modifications of PIS copolymer dueto incorporation of the siloxane component are of particu-lar interest because of relatively small bulk concentrationsof siloxane blocks can result in rather significant surfaceenrichment of PIS block copolymer. In this contribution,the surface analysis of PIS block copolymers using variousmethods of investigation e.g. contact angle measurements,SEM, TEM, AFM, ATR-FTIR, XPS, TOF-SIMS was performed,and the strength of the adhesive joint to more polar poly-mer was studied. The surface and adhesive properties arediscussed in view of the varied composition of PIS copoly-mers. An attempt for the correlation between the surfaceproperties obtained by the various physical methods andadhesive properties of the PIS block copolymer has beencarried out.
2. Experimental
2.1. Chemicals
4,40-Oxydiphthalic anhydride (ODPA) (Chriskev, USA)was dried for 12 h at 160 �C in vacuum before using. 1,4-Bis(4-amino-1,1-dimethylbenzyl)benzene (BIS P) (Mitsui,Japan) was used without further purification. 2-Aminopyr-idine (2-AP) (Aldrich, Czech Republic) was recrystallizedfrom mixture chloroform–petroleum ether. Octa-methylcyclotetrasiloxane (D4) (Fluka, Czech Republic)was distilled in a vacuum over calcium hydride beforeuse. 1,3-Bis(3-aminopropyl)tetramethyldisiloxane (DSX)(ABCR, Germany) was used as received. N-Methyl-2-pyr-rolidone (NMP), 1,2-dichlorobenzene (DCB), and chloro-benzene (CB) (all Merck, Czech Republic) were distilledunder vacuum over phosphorus pentoxide and stored un-der nitrogen.
2.2. Syntheses
2-Aminoterminated ODPA-BIS P polyimides with con-trolled molecular weight were synthesized by solutionimidization (first step in NMP at room temperature for24 h, second step in NMP–BCB mixture at 180 �C) [8]. Thenumber-average molecular weights of products were inthe range Man = 2000–18,000 g mol�1 (by 1H NMR spec-troscopy). The a,x-bis(3-aminopropyl) polydimethylsilox-anes were prepared by anionic ring-opening equilibriumpolymerization of D4 initiated with potassium siloxanolatein the presence DSX [16]. Their molecular weights were inthe range Mn = 1000–5000 g mol�1 (by conductometrictitration with HCl). Polyimide–polysiloxane copolymerswere prepared via transimidization route [8] (in CB at120 �C for 3 h). Copolymers were characterized by 1HNMR in CDCl3 and by viscometry (in chloroform at25 �C). The copolymers were prepared with the theoreticalmolecular weight Mn = 40,000 g mol�1. Transparent foilswith thickness 25 ± 5 lm were prepared from 5 wt.% poly-
mer solution in chloroform by spreading onto a glass plateand evaporating the solvent slowly at room temperature.
2.3. Used polymers
Two-component epoxy adhesive consisting of epoxyoligomer (bisphenol-A diglycidylether) ChS Epoxy 531(produced by Spolchemie, Czech Republic) modified byreactive solvent (1,6-hexanediol-diglycidylether) (Sachem,USA), viscosity at 25 �C = 1.2 Pa.s and a curing agent (dieth-ylene triamine-based) Aminoamid DE 400 (Bohemiachem,Czech Republic) was used as a polymer matrix.
3. Measurement methods
3.1. SEM, TEM
Morphology of the samples was studied by methods ofelectron microscopy – SEM and TEM. The surfaces of pre-pared block copolymers were observed using JSM 6400(Jeol, Japan) microscope. The samples were sputter-coatedby a thin layer of carbon (approx. 4 lm) due to better con-trast of materials. The cryo-ultramicrotomed sections ofthe block copolymers were studied by JEOL 200 CX trans-mission electron microscope.
3.2. AFM
The surface morpholgy (height image) and local surfaceheterogeneities (phase image) were measured by AFM. Allmeasurements were performed under ambient conditionsusing a commercial atomic force microscope (NanoSco-peTM Dimension IIIa, MultiMode Digital Instruments,USA) equipped with the PPP-NCLR tapping-mode probe(NanosensorsTM Switzerland; spring constant 39 N m�1,resonant frequency �160 kHz). Surface properties of allfilms were measured on size of x and y axis from2–25 lm on different positions of the films in order to findout characteristic and significant surface features. Tapping-Mode AFM technique was used for all images. This tech-nique allows obtaining two- or three-dimensionalinformation of both height and material heterogeneitycontrast with high resolution when recording height andphase shifts simultaneously.
3.3. ATR-FTIR
The ATR-FTIR spectroscopy measurements of PIS blockcopolymer foils were performed with Nicolet Impact 400FTIR spectrometer (Nicolet, USA) having a resolution of4 cm�1, a scan range of 4000–400 cm�1, and a total of1024 scans per analysis. The KRS-5 crystal (thallium–bro-mide–iodide) has been used for FTIR-ATR measurements.
3.4. XPS
The XPS spectra were recorded with an angle-resolvedphotoelectron spectrometer ADES 400 (VG Scientific)equipped with Mg Ka and Al Ka excitation sources, and amovable hemispherical electron energy analyzer. The ana-
I. Novák et al. / European Polymer Journal 45 (2009) 57–69 59
MA
CRO
MO
LECU
LAR
NA
NO
TECH
NO
LOG
Y
lyzer was operated in the FAT mode at pass energy of100 eV. The C 1s, O 1s, N 1s, and Si 2p spectra were excitedby Al Ka radiation (1486.6 eV) at an angle of incidence of�70� and recorded along the surface normal (0�) and at+60�. Atomic concentrations of elements found in the ana-lyzed volume were determined from the above mentionedpeak areas after inelastic electron background subtraction[17] assuming a simple model of a homogeneous semi-infi-nite solid [18]. The areas were corrected for the measuredtransmission function of the spectrometer, which com-prises all instrumental factors influencing the measuredquantity [19], for the photoelectric cross-sections [20],and for the inelastic mean free paths [21] of photoelec-trons. Experimental uncertainties accompanied with XPSquantitative analysis were estimated to be 67%. The valuecovers overall uncertainties of the method that are mostlyintroduced by the background subtraction and the correc-tion procedure used for the calculation of concentrationsfrom intensities of spectral lines [22].
3.5. TOF-SIMS
TOF-SIMS technique provides detailed chemical infor-mation of the sample surface with high sensitivity up toppb. Basic principle of the TOF-SIMS method is that thesurface of the sample is bombarded with primary ions withhigh energy and emitted secondary ions are analyzed.Experiments were performed by using a TOF-SIMS IV(ION-TOF, Muenster, Germany) reflection type time-of-flight mass spectrometer equipped with a bismuth liquidmetal ion source. Pulsed 25 keV Bi+ ions with ion currentof 1 pA were used as primary ions. TOF-SIMS spectra weremeasured by scanning over the 200 � 200 lm2 analysisarea with total primary ion dose density below the staticlimit of 5�1012 ions cm�2.
3.6. Surface energy
The surface energy of PIS block copolymer was deter-mined via measurements of contact angles of a set of test-ing liquids (i.e. re-distilled water, ethylene glycol,formamide, methylene iodide, 1-bromo naphthalene)using SEE (Surface Energy Evaluation) system completedwith a web camera (Masaryk University, Czech Republic)and necessary PC software. The drop of the testing liquid(V = 3 ll) was placed with a micropipette (0–5 ll, Biohit,Finland) on the polymer surface, and a contact angle ofthe testing liquid was measured. The surface energies ofthe polymer were evaluated by Owens–Wendt–Rabel–Kaelble (OWRK) equation modified by the least squaresmethod [13]:
Table 1Surface energy, its acid–base components and polar fraction of testing liquids (OW
Testing liquid c [mJ m�2] xsp cLW [mJ m
Water 72.8 0.701 21.8Methylene iodide 50.8 0.045 48.5Formamide 58.2 0.321 38.6Ethylene glycol 48.3 0.393 30.41-Bromonaphthalene 44.4 0 43.4
ð1þ coshÞcLV
2¼ cd
LVcds
� �1=2 þ cpLVc
ps
� �1=2 ð1Þ
whereh = contact angle of testing liquid (deg),cLV = surface free energy (SFE) of the testing liquid
(mJ m�2),cd
LV , cpLV = dispersion component (DC), and polar compo-
nent (PC) of SFE of the testing liquid (mJ m�2),cd
s , cps = DC, and PC of SFE of the polymer (mJ m�2).
The ratio of polar contribution of surface energy of thepolymer to its total surface energy represents the polarfraction xs
p.The acid–base theory by van Oss, Good and Chaudhury
[14] was used for determination of dispersive, i.e. non-po-lar Lifsitz–Van der Waals cLW, acid c+, and base c� compo-nents of the polymer surface energy expressed by terms asacid component c+ (acceptor effect) and ci
� basic compo-nent (donor effect):
ð1þ coshiÞci ¼ 2 cLWi cLW
j
� �1=2þ cþi c�j� �1=2
þ c�i cþj� �
1=2� �
ð2Þ
where i refers to testing liquid and j refers to solid material.cLW indicates the total dispersive component reflecting Lif-sitz–Van der Waals interactions, c+ refers to the acid elec-tron-acceptor interactions, and ci
� reflects electron-donorinteractions according to Lewis.
The tabulated values of the surface energies of usedtesting liquids at 23 �C used for OWRK and acid–basecalculation of polymer surface energy are summarized inTable 1.
3.7. Peel strength of adhesive joint
The peel strength of adhesive joint (Ppeel) to polyacry-late was measured by 90� peeling of adhesive joint usinguniversal testing machine Instron 4301 (Instron, England)with 100 N measuring cell. The adhesive joints for peeltests were fixed in aluminum peeling circle. The width ofthe adhesive joint was 20 mm, and its length was160 mm. The adhesive joints were prepared from PIScopolymer foils bonding together using epoxy adhesive.The peel speed of the adhesive joint was 1.5 mm min�1.
3.8. Shear strength of adhesive joint
The single overlapped adhesive joints were preparedafter bonding of PIS copolymer foils together as well asto aluminum slabs with epoxy adhesive. The dimensionsof the PIS copolymer foils were 50 � 10 mm; the thickness
RK, acid–base method).
�2] cAB [mJ m�2] c+ [mJ m�2] c�[mJ m�2]
51.0 25.5 25.52.3 0.1 2.1
19.6 2.28 39.617.9 1.92 47.0
1.0 0.5 0.5
CCH3
CH3O
CO
CO
NCO
CO
N CCH3
CH3 O
CO
CO
NCO
CO
N
CCH3
CH3O
CO
CO
NN C
O
CO
N CCH3
CH3
N
O
CO
CO
NCO
CO
N
n
SiCH3
CH3
O Si OCH3
CH3
x
SiCH3
CH3n m
SiCH3
CH3
O Si OCH3
CH3
x
SiCH3
CH3
NH2 NH2+- NH2N
(CH2)3- -(CH2)3
(CH2)3- -(CH2)3
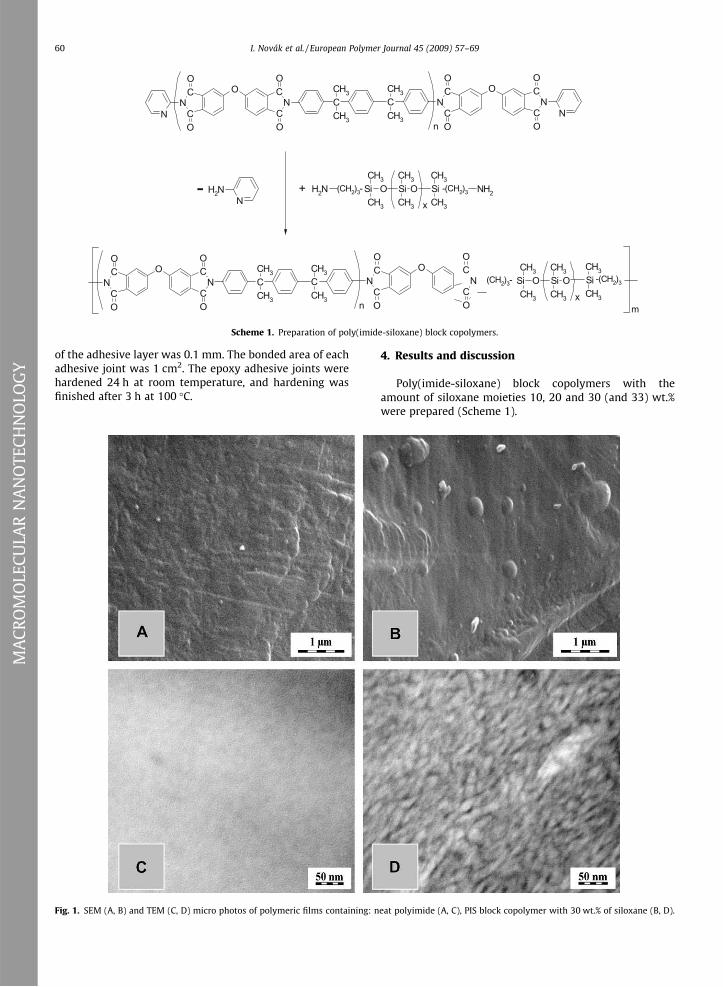
Scheme 1. Preparation of poly(imide-siloxane) block copolymers.
60 I. Novák et al. / European Polymer Journal 45 (2009) 57–69
MA
CRO
MO
LECU
LAR
NA
NO
TECH
NO
LOG
Y
of the adhesive layer was 0.1 mm. The bonded area of eachadhesive joint was 1 cm2. The epoxy adhesive joints werehardened 24 h at room temperature, and hardening wasfinished after 3 h at 100 �C.
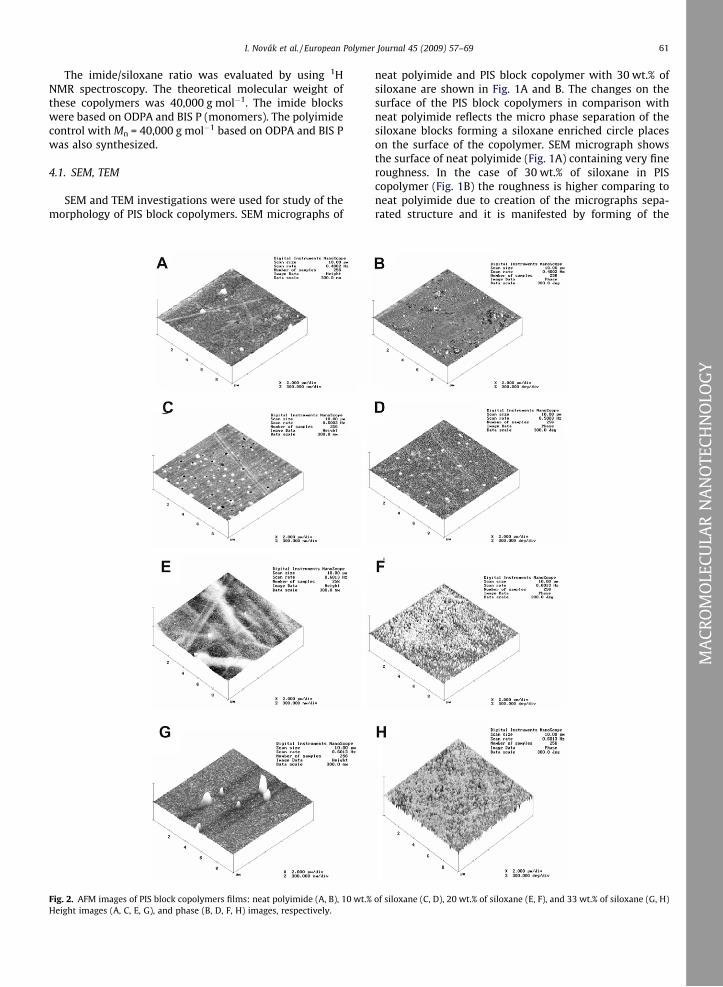
Fig. 1. SEM (A, B) and TEM (C, D) micro photos of polymeric films containing: n
4. Results and discussion
Poly(imide-siloxane) block copolymers with theamount of siloxane moieties 10, 20 and 30 (and 33) wt.%were prepared (Scheme 1).
eat polyimide (A, C), PIS block copolymer with 30 wt.% of siloxane (B, D).
I. Novák et al. / European Polymer Journal 45 (2009) 57–69 61
The imide/siloxane ratio was evaluated by using 1HNMR spectroscopy. The theoretical molecular weight ofthese copolymers was 40,000 g mol�1. The imide blockswere based on ODPA and BIS P (monomers). The polyimidecontrol with Mn = 40,000 g mol�1 based on ODPA and BIS Pwas also synthesized.
4.1. SEM, TEM
SEM and TEM investigations were used for study of themorphology of PIS block copolymers. SEM micrographs of
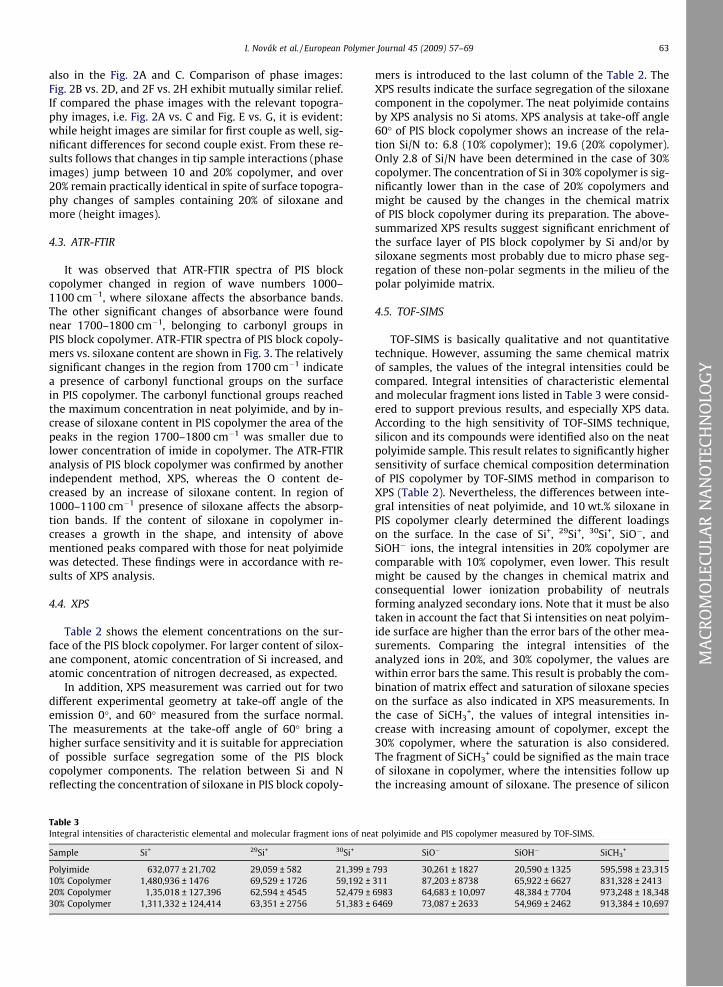
Fig. 2. AFM images of PIS block copolymers films: neat polyimide (A, B), 10 wt.%Height images (A, C, E, G), and phase (B, D, F, H) images, respectively.
neat polyimide and PIS block copolymer with 30 wt.% ofsiloxane are shown in Fig. 1A and B. The changes on thesurface of the PIS block copolymers in comparison withneat polyimide reflects the micro phase separation of thesiloxane blocks forming a siloxane enriched circle placeson the surface of the copolymer. SEM micrograph showsthe surface of neat polyimide (Fig. 1A) containing very fineroughness. In the case of 30 wt.% of siloxane in PIScopolymer (Fig. 1B) the roughness is higher comparing toneat polyimide due to creation of the micrographs sepa-rated structure and it is manifested by forming of the
of siloxane (C, D), 20 wt.% of siloxane (E, F), and 33 wt.% of siloxane (G, H)
MA
CRO
MO
LECU
LAR
NA
NO
TECH
NO
LOG
Y

62 I. Novák et al. / European Polymer Journal 45 (2009) 57–69
MA
CRO
MO
LECU
LAR
NA
NO
TECH
NO
LOG
Y
hemispherical formations on the surface of PIS blockcopolymer. TEM micrograph of neat polyimide (Fig. 1C) issingle-colored. The micrographs of the PIS block copolymercontaining 30 wt.% of siloxane is beclouded, whereas veryfine micro phase separated structure is observed. The blackcolor in TEM micrographs (Fig. 1D) belong to siloxaneblocks and white color to imide blocks in PIS block copoly-mer. TEM micrographs can be interpreted as a reflection ofthe conditions where polyimide constitutes the continuousphase and polysiloxane a dispersed one.
4.2. AFM
The AFM measurements of the PIS copolymers areshown in Fig. 2. AFM measurements of the surface topog-
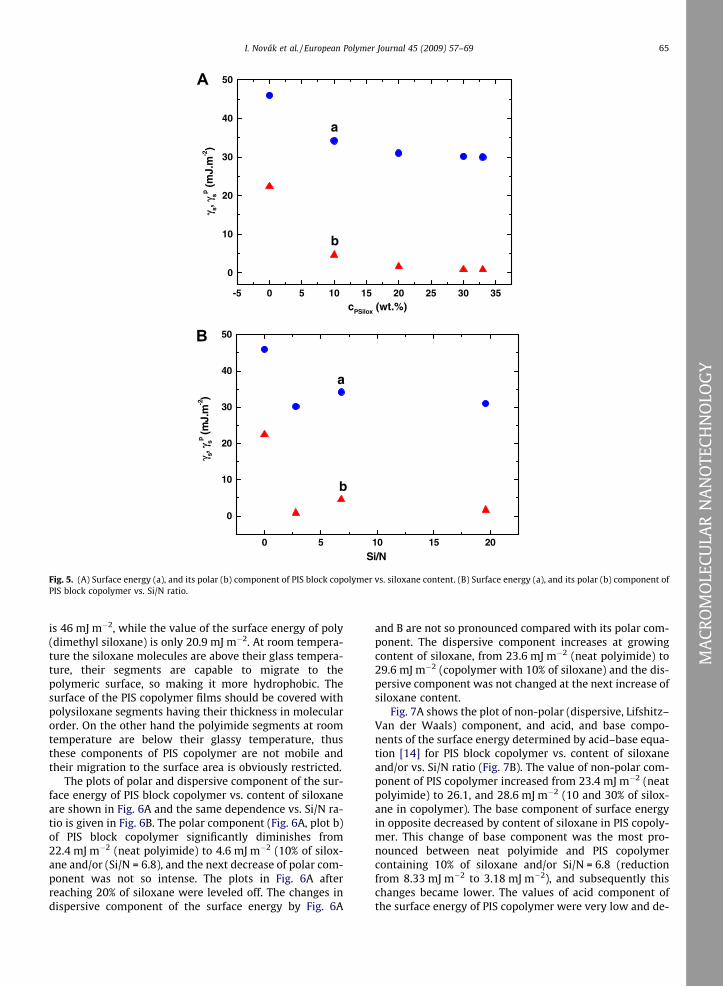
Fig. 3. ATR-FTIR spectra of PIS block copolymers vs. content of siloxane: a, nesiloxane. d, copolymer, 30 wt.% of siloxane.
Table 2Content of the element at the surface of PIS block copolymers measured by XPS.
Sample Emission angle [deg] Element co
C
Neat polyimide 0 82.2Neat polyimide 60 85.310% Copolymer 0 70.010% Copolymer 60 73.520% Copolymer 0 61.420% Copolymer 60 65.230% Copolymer 0 79.830% Copolymer 60 81.9
raphy (height image) and tip-sample interaction (phaseimage) of the samples containing 0–33 wt.% of siloxanemonomer revealed differences in both characteristics. Onlycharacteristic samples, i.e. 0, 10, 20, and 33 wt.% of siloxaneare shown in the Fig. 2; sample containing 30 wt.% of silox-ane is very similar in height and phase images to the sam-ple with 33 wt.% siloxane and thus it is not shown here.The comparison of height images: samples containing20% (Fig. 2E) and 30% (not shown here) have rugged andfunicular surface relief. On the other hand, surfaces of neatpolyimide (Fig. 2A), 10% copolymer (Fig. 2C) and 33%copolymer (Fig. 2D) contain individual formations on thesurfaces – ‘‘hills” of different size and height (tens–hun-dreds nm) and furthermore holes (tens of nm size) on10% sample. Moreover, funicular formations are shadowed
at polymide; b, copolymer, 10 wt.% of siloxane; c, copolymer, 20 wt.% of
ntent [at. %] Si/N
O N Si
13.6 4.3 – 012.1 2.5 – 017.4 3.3 9.3 2.814.9 1.5 10.2 6.821.2 2.0 15.4 7.718.3 0.8 15.7 19.614.0 3.2 3.0 0.912.2 1.6 4.4 2.8
I. Novák et al. / European Polymer Journal 45 (2009) 57–69 63
MA
CRO
MO
LECU
LAR
NA
NO
TECH
NO
LOG
Y
also in the Fig. 2A and C. Comparison of phase images:Fig. 2B vs. 2D, and 2F vs. 2H exhibit mutually similar relief.If compared the phase images with the relevant topogra-phy images, i.e. Fig. 2A vs. C and Fig. E vs. G, it is evident:while height images are similar for first couple as well, sig-nificant differences for second couple exist. From these re-sults follows that changes in tip sample interactions (phaseimages) jump between 10 and 20% copolymer, and over20% remain practically identical in spite of surface topogra-phy changes of samples containing 20% of siloxane andmore (height images).
4.3. ATR-FTIR
It was observed that ATR-FTIR spectra of PIS blockcopolymer changed in region of wave numbers 1000–1100 cm�1, where siloxane affects the absorbance bands.The other significant changes of absorbance were foundnear 1700–1800 cm�1, belonging to carbonyl groups inPIS block copolymer. ATR-FTIR spectra of PIS block copoly-mers vs. siloxane content are shown in Fig. 3. The relativelysignificant changes in the region from 1700 cm�1 indicatea presence of carbonyl functional groups on the surfacein PIS copolymer. The carbonyl functional groups reachedthe maximum concentration in neat polyimide, and by in-crease of siloxane content in PIS copolymer the area of thepeaks in the region 1700–1800 cm�1 was smaller due tolower concentration of imide in copolymer. The ATR-FTIRanalysis of PIS block copolymer was confirmed by anotherindependent method, XPS, whereas the O content de-creased by an increase of siloxane content. In region of1000–1100 cm�1 presence of siloxane affects the absorp-tion bands. If the content of siloxane in copolymer in-creases a growth in the shape, and intensity of abovementioned peaks compared with those for neat polyimidewas detected. These findings were in accordance with re-sults of XPS analysis.
4.4. XPS
Table 2 shows the element concentrations on the sur-face of the PIS block copolymer. For larger content of silox-ane component, atomic concentration of Si increased, andatomic concentration of nitrogen decreased, as expected.
In addition, XPS measurement was carried out for twodifferent experimental geometry at take-off angle of theemission 0�, and 60� measured from the surface normal.The measurements at the take-off angle of 60� bring ahigher surface sensitivity and it is suitable for appreciationof possible surface segregation some of the PIS blockcopolymer components. The relation between Si and Nreflecting the concentration of siloxane in PIS block copoly-
Table 3Integral intensities of characteristic elemental and molecular fragment ions of nea
Sample Si+ 29Si+ 30Si+
Polyimide 632,077 ± 21,702 29,059 ± 582 21,399 ±10% Copolymer 1,480,936 ± 1476 69,529 ± 1726 59,192 ±20% Copolymer 1,35,018 ± 127,396 62,594 ± 4545 52,479 ±30% Copolymer 1,311,332 ± 124,414 63,351 ± 2756 51,383 ±
mers is introduced to the last column of the Table 2. TheXPS results indicate the surface segregation of the siloxanecomponent in the copolymer. The neat polyimide containsby XPS analysis no Si atoms. XPS analysis at take-off angle60� of PIS block copolymer shows an increase of the rela-tion Si/N to: 6.8 (10% copolymer); 19.6 (20% copolymer).Only 2.8 of Si/N have been determined in the case of 30%copolymer. The concentration of Si in 30% copolymer is sig-nificantly lower than in the case of 20% copolymers andmight be caused by the changes in the chemical matrixof PIS block copolymer during its preparation. The above-summarized XPS results suggest significant enrichment ofthe surface layer of PIS block copolymer by Si and/or bysiloxane segments most probably due to micro phase seg-regation of these non-polar segments in the milieu of thepolar polyimide matrix.
4.5. TOF-SIMS
TOF-SIMS is basically qualitative and not quantitativetechnique. However, assuming the same chemical matrixof samples, the values of the integral intensities could becompared. Integral intensities of characteristic elementaland molecular fragment ions listed in Table 3 were consid-ered to support previous results, and especially XPS data.According to the high sensitivity of TOF-SIMS technique,silicon and its compounds were identified also on the neatpolyimide sample. This result relates to significantly highersensitivity of surface chemical composition determinationof PIS copolymer by TOF-SIMS method in comparison toXPS (Table 2). Nevertheless, the differences between inte-gral intensities of neat polyimide, and 10 wt.% siloxane inPIS copolymer clearly determined the different loadingson the surface. In the case of Si+, 29Si+, 30Si+, SiO�, andSiOH� ions, the integral intensities in 20% copolymer arecomparable with 10% copolymer, even lower. This resultmight be caused by the changes in chemical matrix andconsequential lower ionization probability of neutralsforming analyzed secondary ions. Note that it must be alsotaken in account the fact that Si intensities on neat polyim-ide surface are higher than the error bars of the other mea-surements. Comparing the integral intensities of theanalyzed ions in 20%, and 30% copolymer, the values arewithin error bars the same. This result is probably the com-bination of matrix effect and saturation of siloxane specieson the surface as also indicated in XPS measurements. Inthe case of SiCH3
+, the values of integral intensities in-crease with increasing amount of copolymer, except the30% copolymer, where the saturation is also considered.The fragment of SiCH3
+ could be signified as the main traceof siloxane in copolymer, where the intensities follow upthe increasing amount of siloxane. The presence of silicon
t polyimide and PIS copolymer measured by TOF-SIMS.
SiO� SiOH� SiCH3+
793 30,261 ± 1827 20,590 ± 1325 595,598 ± 23,315311 87,203 ± 8738 65,922 ± 6627 831,328 ± 24136983 64,683 ± 10,097 48,384 ± 7704 973,248 ± 18,3486469 73,087 ± 2633 54,969 ± 2462 913,384 ± 10,697

0 5 10 15 20 25 30 3570
75
80
85
90
95
100
105
θ H 2O (d
eg)
cPSilox (wt.%)
0 5 10 15 20
75
80
85
90
95
100
105
110
Si/N
θ H 2O (d
eg)
A
B
Fig. 4. (A) Contact angles of water vs. siloxane content in PIS block copolymer. (B) Contact angles of water vs. Si/N ratio in PIS copolymer.
64 I. Novák et al. / European Polymer Journal 45 (2009) 57–69
MA
CRO
MO
LECU
LAR
NA
NO
TECH
NO
LOG
Y
elements and molecular fragments in the sample of neatpolyimide suggest the high background contribution tomeasured integral intensities. Elements and simple mole-cules could originate also from sample contamination dur-ing processing. Concluding that the molecular ion SiCh3+
was clearly identified as siloxane fragment and the rele-vant intensities correspond to the siloxane loadings.
4.6. Contact angles, surface energy
Fig. 4A shows the contact angles of re-distilled waterdeposited on PIS block copolymer surface vs. content ofsiloxane in copolymer and/or vs. Si/N ratio (Fig. 4B). Thecontact angles of water by Fig. 4A and B increased bygrowth of siloxane content and/or Si/N ratio in copolymer.The contact angles of PIS block copolymer increase from76� for neat polyimide, to 95� for 10% of siloxane in copoly-mer (Si/N = 6.8) up to 102� for 30% of siloxane in copoly-mer. Since the surface energy of siloxane is very low ascompared to polyimide, the siloxane segments aspired tomigrate to the top of the surface to form a hydrophobic sil-icon-enriched layer. Micro phase separation in PIS block
copolymer occurs even at relatively low block lengthsdue to dissimilarity between the chemical structures ofthe siloxane, and imide blocks.
The dependencies of the surface energy, and its polarcomponent of PIS block copolymer determined by OWRK(Owens–Wendt–Rabel–Kaelble) method [13] vs. contentof siloxane in copolymer are shown in Fig. 5A and/or vs.Si/N ratio (Fig. 5B). The surface energy of PIS block copoly-mer decreases significantly with the concentration of silox-ane and/or Si/N ratio from 46.0 mJ m�2 (neat polyimide) to34.2 mJ m�2 (10% of siloxane and/or Si/N = 6.8), and to30.2 mJ m�2 (30% of siloxane). The polar component ofthe surface energy reached the value 22.4 mJ m�2 [neatpolyimide], which decreases with content of siloxane inPIS copolymer to 4.6 mJ m�2 (10% of siloxane) and0.8 mJ m�2 (30% of siloxane) The decline of the surface en-ergy, and its polar component of PIS block copolymer withraising siloxane content are very intense mainly between 0and 10 wt.% of siloxane in copolymer. In the case of furtherincrease of siloxane concentration (above 20% of siloxane),the surface energy of PIS copolymer and its polar compo-nent is leveled off. The surface energy of neat polyimide
-5 0 5 10 15 20 25 30 35
0
10
20
30
40
50
b
a
γ s,γ sp (
mJ.
m-2)
cPSilox (wt.%)
0 5 10 15 20
0
10
20
30
40
50
b
a
γ s,γ sp (m
J.m
-2)
Si/N
A
B
Fig. 5. (A) Surface energy (a), and its polar (b) component of PIS block copolymer vs. siloxane content. (B) Surface energy (a), and its polar (b) component ofPIS block copolymer vs. Si/N ratio.
I. Novák et al. / European Polymer Journal 45 (2009) 57–69 65
MA
CRO
MO
LECU
LAR
NA
NO
TECH
NO
LOG
Y
is 46 mJ m�2, while the value of the surface energy of poly(dimethyl siloxane) is only 20.9 mJ m�2. At room tempera-ture the siloxane molecules are above their glass tempera-ture, their segments are capable to migrate to thepolymeric surface, so making it more hydrophobic. Thesurface of the PIS copolymer films should be covered withpolysiloxane segments having their thickness in molecularorder. On the other hand the polyimide segments at roomtemperature are below their glassy temperature, thusthese components of PIS copolymer are not mobile andtheir migration to the surface area is obviously restricted.
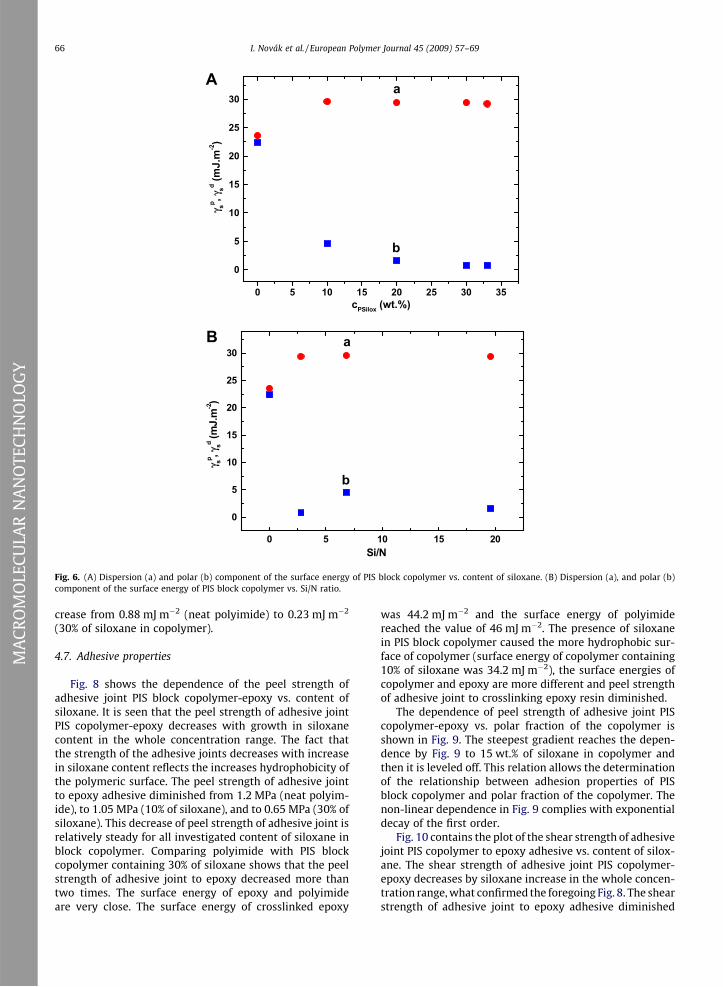
The plots of polar and dispersive component of the sur-face energy of PIS block copolymer vs. content of siloxaneare shown in Fig. 6A and the same dependence vs. Si/N ra-tio is given in Fig. 6B. The polar component (Fig. 6A, plot b)of PIS block copolymer significantly diminishes from22.4 mJ m�2 (neat polyimide) to 4.6 mJ m�2 (10% of silox-ane and/or (Si/N = 6.8), and the next decrease of polar com-ponent was not so intense. The plots in Fig. 6A afterreaching 20% of siloxane were leveled off. The changes indispersive component of the surface energy by Fig. 6A
and B are not so pronounced compared with its polar com-ponent. The dispersive component increases at growingcontent of siloxane, from 23.6 mJ m�2 (neat polyimide) to29.6 mJ m�2 (copolymer with 10% of siloxane) and the dis-persive component was not changed at the next increase ofsiloxane content.
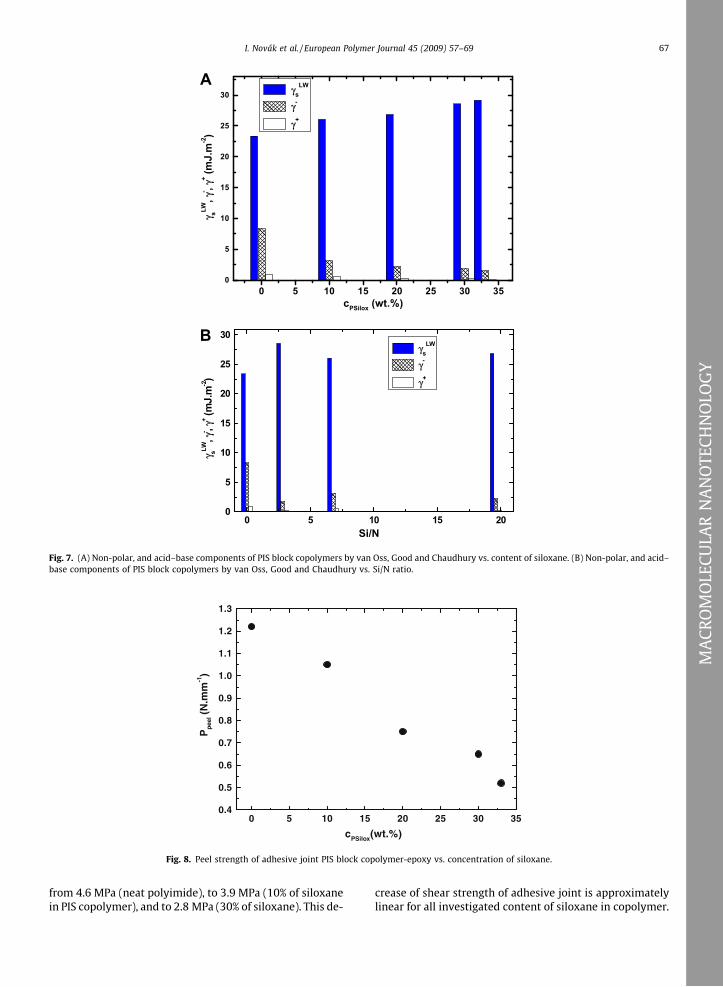
Fig. 7A shows the plot of non-polar (dispersive, Lifshitz–Van der Waals) component, and acid, and base compo-nents of the surface energy determined by acid–base equa-tion [14] for PIS block copolymer vs. content of siloxaneand/or vs. Si/N ratio (Fig. 7B). The value of non-polar com-ponent of PIS copolymer increased from 23.4 mJ m�2 (neatpolyimide) to 26.1, and 28.6 mJ m�2 (10 and 30% of silox-ane in copolymer). The base component of surface energyin opposite decreased by content of siloxane in PIS copoly-mer. This change of base component was the most pro-nounced between neat polyimide and PIS copolymercontaining 10% of siloxane and/or Si/N = 6.8 (reductionfrom 8.33 mJ m�2 to 3.18 mJ m�2), and subsequently thischanges became lower. The values of acid component ofthe surface energy of PIS copolymer were very low and de-
0 5 10 15 20 25 30 35
0
5
10
15
20
25
30
b
a
γ sp , γsd (m
J.m
-2)
cPSilox (wt.%)
0 5 10 15 20
0
5
10
15
20
25
30
b
a
γ sp ,γsd (m
J.m
-2)
Si/N
A
B
Fig. 6. (A) Dispersion (a) and polar (b) component of the surface energy of PIS block copolymer vs. content of siloxane. (B) Dispersion (a), and polar (b)component of the surface energy of PIS block copolymer vs. Si/N ratio.
66 I. Novák et al. / European Polymer Journal 45 (2009) 57–69
MA
CRO
MO
LECU
LAR
NA
NO
TECH
NO
LOG
Y
crease from 0.88 mJ m�2 (neat polyimide) to 0.23 mJ m�2
(30% of siloxane in copolymer).
4.7. Adhesive properties
Fig. 8 shows the dependence of the peel strength ofadhesive joint PIS block copolymer-epoxy vs. content ofsiloxane. It is seen that the peel strength of adhesive jointPIS copolymer-epoxy decreases with growth in siloxanecontent in the whole concentration range. The fact thatthe strength of the adhesive joints decreases with increasein siloxane content reflects the increases hydrophobicity ofthe polymeric surface. The peel strength of adhesive jointto epoxy adhesive diminished from 1.2 MPa (neat polyim-ide), to 1.05 MPa (10% of siloxane), and to 0.65 MPa (30% ofsiloxane). This decrease of peel strength of adhesive joint isrelatively steady for all investigated content of siloxane inblock copolymer. Comparing polyimide with PIS blockcopolymer containing 30% of siloxane shows that the peelstrength of adhesive joint to epoxy decreased more thantwo times. The surface energy of epoxy and polyimideare very close. The surface energy of crosslinked epoxy
was 44.2 mJ m�2 and the surface energy of polyimidereached the value of 46 mJ m�2. The presence of siloxanein PIS block copolymer caused the more hydrophobic sur-face of copolymer (surface energy of copolymer containing10% of siloxane was 34.2 mJ m�2), the surface energies ofcopolymer and epoxy are more different and peel strengthof adhesive joint to crosslinking epoxy resin diminished.
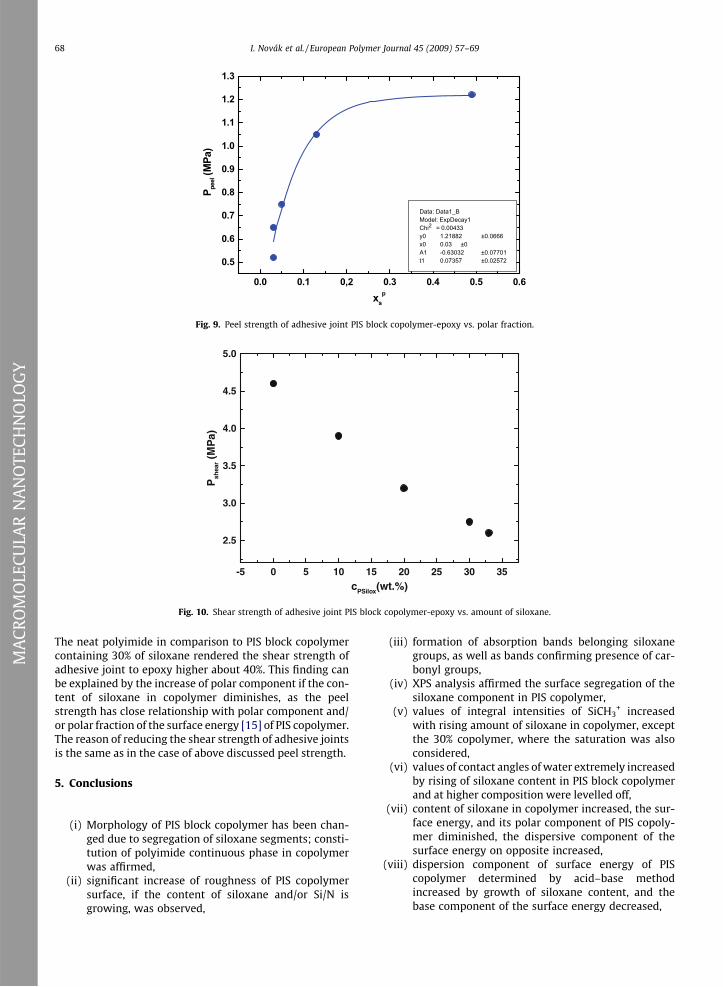
The dependence of peel strength of adhesive joint PIScopolymer-epoxy vs. polar fraction of the copolymer isshown in Fig. 9. The steepest gradient reaches the depen-dence by Fig. 9 to 15 wt.% of siloxane in copolymer andthen it is leveled off. This relation allows the determinationof the relationship between adhesion properties of PISblock copolymer and polar fraction of the copolymer. Thenon-linear dependence in Fig. 9 complies with exponentialdecay of the first order.
Fig. 10 contains the plot of the shear strength of adhesivejoint PIS copolymer to epoxy adhesive vs. content of silox-ane. The shear strength of adhesive joint PIS copolymer-epoxy decreases by siloxane increase in the whole concen-tration range, what confirmed the foregoing Fig. 8. The shearstrength of adhesive joint to epoxy adhesive diminished
0 5 10 15 20 25 30 350
5
10
15
20
25
30
γ sLW,γ
- ,γ+ (m
J.m
-2)
cPSilox (wt.%)
γsLW
γ-
γ+
0 5 10 15 200
5
10
15
20
25
30γs
LW
γ-
γ+
γ sLW,γ
- ,γ+ (m
J.m
-2)
Si/N
A
B
Fig. 7. (A) Non-polar, and acid–base components of PIS block copolymers by van Oss, Good and Chaudhury vs. content of siloxane. (B) Non-polar, and acid–base components of PIS block copolymers by van Oss, Good and Chaudhury vs. Si/N ratio.
0 5 10 15 20 25 30 350.4
0.5
0.6
0.7
0.8
0.9
1.0
1.1
1.2
1.3
Pp
eel (
N.m
m-1)
cPSilox(wt.%)
Fig. 8. Peel strength of adhesive joint PIS block copolymer-epoxy vs. concentration of siloxane.
I. Novák et al. / European Polymer Journal 45 (2009) 57–69 67
MA
CRO
MO
LECU
LAR
NA
NO
TECH
NO
LOG
Y
from 4.6 MPa (neat polyimide), to 3.9 MPa (10% of siloxanein PIS copolymer), and to 2.8 MPa (30% of siloxane). This de-
crease of shear strength of adhesive joint is approximatelylinear for all investigated content of siloxane in copolymer.
0.0 0.1 0,2 0.3 0.4 0.5 0.6
0.5
0.6
0.7
0.8
0.9
1.0
1.1
1.2
1.3
Data: Data1_BModel: ExpDecay1Chi2 = 0.00433y0 1.21882 ±0.0666x0 0.03 ±0A1 -0.63032 ±0.07701t1 0.07357 ±0.02572
P peel (
MPa
)
xsp
Fig. 9. Peel strength of adhesive joint PIS block copolymer-epoxy vs. polar fraction.
-5 0 5 10 15 20 25 30 35
2.5
3.0
3.5
4.0
4.5
5.0
Psh
ear (
MP
a)
cPSilox(wt.%)
Fig. 10. Shear strength of adhesive joint PIS block copolymer-epoxy vs. amount of siloxane.
68 I. Novák et al. / European Polymer Journal 45 (2009) 57–69
MA
CRO
MO
LECU
LAR
NA
NO
TECH
NO
LOG
Y
The neat polyimide in comparison to PIS block copolymercontaining 30% of siloxane rendered the shear strength ofadhesive joint to epoxy higher about 40%. This finding canbe explained by the increase of polar component if the con-tent of siloxane in copolymer diminishes, as the peelstrength has close relationship with polar component and/or polar fraction of the surface energy [15] of PIS copolymer.The reason of reducing the shear strength of adhesive jointsis the same as in the case of above discussed peel strength.
5. Conclusions
(i) Morphology of PIS block copolymer has been chan-ged due to segregation of siloxane segments; consti-tution of polyimide continuous phase in copolymerwas affirmed,
(ii) significant increase of roughness of PIS copolymersurface, if the content of siloxane and/or Si/N isgrowing, was observed,
(iii) formation of absorption bands belonging siloxanegroups, as well as bands confirming presence of car-bonyl groups,
(iv) XPS analysis affirmed the surface segregation of thesiloxane component in PIS copolymer,
(v) values of integral intensities of SiCH3+ increased
with rising amount of siloxane in copolymer, exceptthe 30% copolymer, where the saturation was alsoconsidered,
(vi) values of contact angles of water extremely increasedby rising of siloxane content in PIS block copolymerand at higher composition were levelled off,
(vii) content of siloxane in copolymer increased, the sur-face energy, and its polar component of PIS copoly-mer diminished, the dispersive component of thesurface energy on opposite increased,
(viii) dispersion component of surface energy of PIScopolymer determined by acid–base methodincreased by growth of siloxane content, and thebase component of the surface energy decreased,
I. Novák et al. / European Polymer Journal 45 (2009) 57–69 69
LOG
Y
(ix) content of siloxane in PIS copolymer rises up,strength of adhesive joint to epoxy decreased almostlinearly,
(x) relationship between peel strength of adhesive jointand polar fraction of PIS block copolymer was deter-mined and can be described by exponential decaydependence.
Acknowledgements
The research was supported by Slovak Scientific Agencyproject VEGA, No. 2/7103/27, by the research programMSM 6046137302 and GA CR 203/06/1086, as well as byprojects of the Grant Agency of the Academy of Sciencesof the Czech Republic (A400500505, IAA100100622) andby Institutional Research Plan No. AV0Z10100521 isacknowledged as well.
References
[1] Niklaus F, Enoksson P, Kälvesten E, Stemme G. J Micromech Microeng2001;11:100–7.
[2] Chan-Park MB, Tan SS. Int J Adhes Adhesives 2002;22:471–5.[3] Engel, Chen J, Liu C. J Micromech Microengn 2003;13:359–66.
O
[4] Ellison MM, Taylor LT. J Adhesion 1997;60:39–49.[5] Sysel P, Hobzova R, Sindelar V, Brus J. Polymer 2001;42:10079–85.[6] Smaihi M, Schrotter JC, Lesimple C, Prevost I, Guizard C. J Membr Sci
1999;161:157–70.[7] Liaw WC, Chen KP. J Appl Polym Sci 2007;105:809–20.[8] Sysel P, Oupicky D. Polym Intern 1996;40:275–9.[9] Yoon TH, McGrath JE. High Perform Polym 1992;4:203–14.
[10] Lu C, Wang Z, Liu F, Yan J, Gao L. J Appl Polym Sci 2006;100:124–32.[11] Sysel P, Hynek V, Sipek M. Collect Czech Chem Commun
1998;63:53–6.[12] McGrath JE, Dunson DL, Mecham SJ, Hedrick JL. Adv Polym Sci
1999;140:61–105.[13] Novák I, Števiar M, Chodák I, Krupa I, Nedelcev T, Špírková M, et al.
Polym Advan Technol 2007;18:97–105.[14] van Oss CJ, Good RJ, Chaudhury MK. Langmuir 1998;4:884;
van Oss CJ, Chaudhury MK, Good RJ. Chem Rev 1988;88:927;Lee LH. Fundamentals of adhesion. In: Lee LH, editor. NewYork: Plenum Press; 1991.
[15] Furukawa N, Yuasa Y, Omori F, Yamada Y. J Adhes 1996;59:281.[16] McGrath JE, Sormani PM, Elsbernd CS, Kilic S. Makromol Chem
Macromol Symp 1986;6:67–80.[17] Shirley DA. Phys Rev B 1972;5:4709.[18] Fadley CS, Baird RJ, Sickhaus W, Novakov T, Bergstrom SA. J Electron
Spectrosc Relat Phenom 1974;93:4.[19] Jiricek P. Czech J Phys 1994;44:261.[20] Band IM, Kharitonov IY, Trzhaskovskaya MB. Atomic Data Nucl Data
Tables 1979;23:443.[21] Tanuma S, Powell CJ, Penn DR. Surf Interface Anal 1993;20:77.[22] Moulder JF, Stickle WF, Sobol PE, Bomben KD. Handbook of X-ray
Photoelectron Spectroscopy. Eden Prairie MN: Perkin-Elmer Co.;1992.
MA
CRO
MO
LECU
LAR
NA
NO
TECH
N
Copyright © 2022 FDOKUMEN