Effect of a micro dielectric barrier discharge plasma actuator on quiescent flow
8
Published in IET Science, Measurement and Technology Received on 30th July 2013 Revised on 27th December 2013 Accepted on 20th January 2014 doi: 10.1049/iet-smt.2013.0131 ISSN 1751-8822 Effect of a micro dielectric barrier discharge plasma actuator on quiescent flow Elisa Pescini 1 , Maria Grazia De Giorgi 1 , Luca Francioso 2 , Aldebara Scioltia 1 , Antonio Ficarella 1 1 Department of Engineering for Innovation, University of Salento, Via per Monteroni, 73100 Lecce, Italy 2 CNR-IMM, Institute for Microelectronics and Microsystems, Via per Monteroni, 73100 Lecce, Italy E-mail: [email protected] Abstract: A dielectric barrier discharge plasma actuator (PA) was designed and manufactured with microscale dimensions using photolithographic process on fibre glass substrate. AC operation under sinusoidal voltage was investigated experimentally by means of electrical characterisation, smoke flow visualisations and particle image velocimetry. The performances of the micro PA were evaluated and compared with the ones of a macro PA found in this literature. The velocity induced by the micro PA was comparable with the macro PA one, but with lower applied voltage, electrical power dissipation and actuator size. This is particularly interesting for potential applications in turbomachinery. 1 Introduction In recent years active flow control devices, and in particular dielectric barrier discharge (DBD) plasma actuators (PAs), are studied to increase external aerodynamic efficiency and to improve the performances of fluid machineries. Compared with other active flow control systems, PAs are characterised by simple construction, lack of moving parts, high bandwidth excitation and ease of implementation. Owing to these features, they are very attractive in aeronautics for lift increase on a wing section [1], and in turbomachinery for pressure turbine blade [2, 3] and compressor cascade [4] separation control, tip clearance flow control [5] and compressor stability range extension [6]. The basic configuration of a PA usually consists of two electrodes separated by a dielectric layer: one electrode is exposed to the surrounding flow and is supplied with high-voltage AC excitation; the other one is encapsulated by a dielectric material and grounded. Under operation, the gas located above the dielectric becomes weakly ionised creating a cold plasma discharge above the encapsulated electrode. The plasma affects the flow by pumping momentum into the boundary layer region. It results in a body force vector acting on the external flow that induces a 1–4 m/s wall jet occurring at 0.5–1 mm above the actuator surface. PAs characterised by geometrical parameters ranging from few mm to few cm are defined as macro PAs, whereas those whose electrode width is <4 mm are referred to as micro PA [7]. For a given voltage/frequency input, the efficiency of the actuator in converting input electrical power to induced force is enhanced by decreasing the size of the exposed electrode and/or the gap between the electrodes and/or the dielectric thickness [7–9]. In [10], it was demonstrated that thinner exposed electrode leads to higher moment transfer to air. In [11, 12], the effect of the dielectric layer thickness was investigated. It was found that for a given input voltage, the actuator with the thinner dielectric layer produces induced velocity and body force larger than the thicker actuator. Computational codes demonstrated that, decreasing the electrode gap below 10 μm, there was a 10 − 100× increase in the induced force density [13, 14]. In this context, the design of miniaturised PAs [7–9] is very promising to improve the fluidic control authority and actuator efficiency. Therefore micro PAs are particularly interesting for potential applications in turbomachinery. As shown in [15], reduction of fan and compressor wake defect using PAs requires actuation strength higher than the one generated by conventional macro PAs [16–19]. Generally, the effect of PAs in fluid machineries is numerically evaluated. A successful control of flow separation requires a precise estimation of the magnitude and distribution of the force imparted from the PA, therefore its accurate evaluation is of great importance for the numerical prediction of the flow behaviour. The most common way of modelling numerically the PA effect on the flow, is to incorporate the plasma-induced body force into the Navier–Stokes momentum equation. Different models are available in this literature to evaluate the plasma-induced body force. One category includes chemical models, in which the equations for the electric field and those for the ionised air density variations are solved [20–22]. In general, the solution of these equations is computationally expensive since requires a very small spatial resolution. Therefore the focus of several studies is on algebraic models that provide a unique method for calculating the induced force, but generally involve www.ietdl.org IET Sci. Meas. Technol., pp. 1–8 doi: 10.1049/iet-smt.2013.0131 1 & The Institution of Engineering and Technology 2014
-
Upload
unisalento -
Category
Documents
-
view
0 -
download
0
Transcript of Effect of a micro dielectric barrier discharge plasma actuator on quiescent flow

www.ietdl.org
IE
d
Published in IET Science, Measurement and TechnologyReceived on 30th July 2013Revised on 27th December 2013Accepted on 20th January 2014doi: 10.1049/iet-smt.2013.0131
T Sci. Meas. Technol., pp. 1–8oi: 10.1049/iet-smt.2013.0131
ISSN 1751-8822
Effect of a micro dielectric barrier discharge plasmaactuator on quiescent flowElisa Pescini1, Maria Grazia De Giorgi1, Luca Francioso2, Aldebara Scioltia1,
Antonio Ficarella1
1Department of Engineering for Innovation, University of Salento, Via per Monteroni, 73100 Lecce, Italy2CNR-IMM, Institute for Microelectronics and Microsystems, Via per Monteroni, 73100 Lecce, Italy
E-mail: [email protected]
Abstract: A dielectric barrier discharge plasma actuator (PA) was designed and manufactured with microscale dimensions usingphotolithographic process on fibre glass substrate. AC operation under sinusoidal voltage was investigated experimentally bymeans of electrical characterisation, smoke flow visualisations and particle image velocimetry. The performances of the microPA were evaluated and compared with the ones of a macro PA found in this literature. The velocity induced by the micro PAwas comparable with the macro PA one, but with lower applied voltage, electrical power dissipation and actuator size. This isparticularly interesting for potential applications in turbomachinery.
1 Introduction
In recent years active flow control devices, and in particulardielectric barrier discharge (DBD) plasma actuators (PAs),are studied to increase external aerodynamic efficiency andto improve the performances of fluid machineries.Compared with other active flow control systems, PAs are
characterised by simple construction, lack of moving parts,high bandwidth excitation and ease of implementation.Owing to these features, they are very attractive in
aeronautics for lift increase on a wing section [1], and inturbomachinery for pressure turbine blade [2, 3] andcompressor cascade [4] separation control, tip clearanceflow control [5] and compressor stability range extension [6].The basic configuration of a PA usually consists of two
electrodes separated by a dielectric layer: one electrode isexposed to the surrounding flow and is supplied withhigh-voltage AC excitation; the other one is encapsulated bya dielectric material and grounded. Under operation, the gaslocated above the dielectric becomes weakly ionised creatinga cold plasma discharge above the encapsulated electrode.The plasma affects the flow by pumping momentum into theboundary layer region. It results in a body force vectoracting on the external flow that induces a 1–4 m/s wall jetoccurring at 0.5–1 mm above the actuator surface.PAs characterised by geometrical parameters ranging from
few mm to few cm are defined as macro PAs, whereasthose whose electrode width is <4 mm are referred to asmicro PA [7].For a given voltage/frequency input, the efficiency of the
actuator in converting input electrical power to inducedforce is enhanced by decreasing the size of the exposedelectrode and/or the gap between the electrodes and/or thedielectric thickness [7–9].
In [10], it was demonstrated that thinner exposed electrodeleads to higher moment transfer to air. In [11, 12], the effectof the dielectric layer thickness was investigated. It was foundthat for a given input voltage, the actuator with the thinnerdielectric layer produces induced velocity and body forcelarger than the thicker actuator. Computational codesdemonstrated that, decreasing the electrode gap below 10µm, there was a 10− 100× increase in the induced forcedensity [13, 14].In this context, the design of miniaturised PAs [7–9] is very
promising to improve the fluidic control authority andactuator efficiency. Therefore micro PAs are particularlyinteresting for potential applications in turbomachinery. Asshown in [15], reduction of fan and compressor wake defectusing PAs requires actuation strength higher than the onegenerated by conventional macro PAs [16–19].Generally, the effect of PAs in fluid machineries is
numerically evaluated. A successful control of flowseparation requires a precise estimation of the magnitudeand distribution of the force imparted from the PA,therefore its accurate evaluation is of great importance forthe numerical prediction of the flow behaviour.The most common way of modelling numerically the PA
effect on the flow, is to incorporate the plasma-inducedbody force into the Navier–Stokes momentum equation.Different models are available in this literature to evaluatethe plasma-induced body force. One category includeschemical models, in which the equations for the electricfield and those for the ionised air density variations aresolved [20–22]. In general, the solution of these equationsis computationally expensive since requires a very smallspatial resolution. Therefore the focus of several studies ison algebraic models that provide a unique method forcalculating the induced force, but generally involve
1& The Institution of Engineering and Technology 2014

Fig. 1 Geometrical parameters of the plasma actuator and flatplate where it is located
www.ietdl.org
assumptions on either the electric field or plasma chargedensity [15, 23–25]. A promising alternative to provide anaccurate body force term is the retroactive estimation of theinduced body force from an experimental database of theinduced velocity results [26–28].In this literature, wide experimental data are available on
macro PAs [11, 19, 26–29], but only few works can befound on micro PAs [7–9]. To this aim, the present workinvolved the manufacturing and characterisation of a microactuator in quiescent conditions. A dedicated activity wasdevoted to microelectronic technology adoption for
Fig. 2 Experimental setup and instrumentations
a Image of the facilityb Schematic view of the facility
2& The Institution of Engineering and Technology 2014
electrode fabrication on fibreglass FR4 substrates, togetherwith batch production of electrodes with photolithographictechnique. The performances of the micro PA wereevaluated and compared with the ones of a macro PA foundin this literature. Electrical properties (including appliedvoltage and the resulting current) were recorded in order toevaluate the electrical power dissipation. Flow visualisationsallowed investigating the flow behaviour and the actuationtransient state. Experimental data coming from particleimage velocimetry (PIV) measurements have been used forthe force estimation and will be useful for the developmentand validation of an empirical model for the prediction ofthe PA momentum transfer in numerical simulations.
2 Experimental arrangement
A cross-sectional schematic of the PA studied in this work isshown in Fig. 1. Both electrodes were realised with 35 µmthick electroplated copper, their streamwise (x) width w was1 mm and the electrode length L along the spanwisedirection (z) was 60 mm. The exposed (upper) andgrounded (lower) electrodes were separated by a fibreglassdielectric layer (which thickness k was 0.8 mm) and theywere shifted along the streamwise direction by a gap gequal to 250 µm.The PA was located in the middle of a square flat plate,
with a side length of 240 mm and a thickness of 5 mm.Measurements were performed in quiescent air condition, atatmospheric pressure and ambient temperature. To reducethe effect of any external disturbance on the measurements,
IET Sci. Meas. Technol., pp. 1–8doi: 10.1049/iet-smt.2013.0131

www.ietdl.org
the tests were conducted in a closed box, made of Plexiglas toprovide optical access. The box had the base coincident withthe flat plate and its height was 240 mm.In the following, we will consider as zero position thelocation at the end of the exposed electrode, moving in thedownstream direction (see Fig. 1).The power was provided by a high-voltage amplifier (Trek
40-15) fed with a waveform generator card (NI-USB 6343).The output of the amplifier was connected to the exposedelectrode and the opposite electrode was grounded.Experimental setup and measurement techniques arereported in Fig. 2.Throughout the experiments presented in this work, a
sinusoidal voltage waveform with amplitude (V0) equal to5 kV and frequency ( f ) equal to 1 and 2.5 kHz wasapplied. The two test cases are reported in Table 1.The applied voltage V(t) was measured with the voltage
output monitor built into the Trek amplifier [30] (accuracy ofthe voltage output monitor better than 0.1% of full scale[31]), whereas the current I(t) was obtained by measuring thevoltage drop across a sampling resistor (1000 Ω) [16], as thecurrent monitor built into the Trek amplifier was too limitedin accuracy (2% of full scale [31]) and bandwidth (DC to >5 kHz [31]). Note that for currents of few mA, which are
Fig. 3 Electrical characterisation, I(t)–V(t) characteristic curves
a Test case 1b Test case 2
Table 1 Test cases
Test Cases V0, kV f, kHz
1 5 12 5 2.5
IET Sci. Meas. Technol., pp. 1–8doi: 10.1049/iet-smt.2013.0131
those measured here (Fig. 3), the corresponding voltage dropis much smaller than the applied voltage and thus does notdisturb significantly the discharge behaviour. Both theamplifier output voltage monitor and the resistor terminalswere connected to an oscilloscope (Picocope 5204, accuracy± 3%) and the respective signals were recorded at a samplingrate set to 31.25 MHz.Flow images have been taken with the high-speed camera
Memrecam GX-3 in quiescent air at atmosphericconditions. A Laser 532 nm 50 mW mod. MGL-III-532 wasutilised to illuminate the visualisation plane (x− y) and thecamera was equipped with a Nikkor 60 mm f/2.8d A/Fobjective and an interference filter (λ = 532 nm). Incensesmoke was used as seeding particles and the recordingfrequency was set to 250 Hz.The flow field in the streamwise plane (x− y) was measured
with a Dantec (two-dimensional (2D)) PIV system. A 2D PIVconfiguration was chosen since the large span of the actuatorensures minimal 3D effects [29]. The system consisted of adedicated computer, a double pulse Nd:YAG laser (minimumpower 200 mJ/pulse standard) and a FlowSense EO 4 Mcamera with a 2048 × 2048 resolution. A SIGMA 105 mmF2.8 EX DG OS HSM Macro objective, set at an aperture of4 was used. The camera was equipped with an interferencefilter (λ = 532 nm) to eliminate the influence of the room lighton the recorded images. The camera captured a 20 × 20 mmarea, in particular 10 mm downstream the exposed electrode,10 mm upstream and 20 mm along the y-direction (Fig. 1).Camera calibration was performed with millimetre paper.The Plexiglas box was seeded with incense smoke. The
seeding was adjusted in order to have at least ten particlesin each interrogation area (IA). The duration between twosuccessive frames was set to obtain a particle displacement≤25% of the IA side length in both of the test conditions,which ensured that there was no signal dropout. PIV imagesprocessing was performed using Dantec Dynamic Studiov3.0.The recording frequency was set to 6 Hz and 200 setsof dual pictures were taken for each acquisition. Thesensibility to the number of acquired images has beenevaluated, in others to verify the convergence of theaverage velocity fields [29, 32].For assessing the ability of the incense smoke seeding
particles to follow the flow field, the Stokes number St wasevaluated. The Stokes number is a measure of particleinertia; it represents the ratio of the particle response time tothe characteristic flow timescale and is given by
St = rpd2pvCc
18ml(1)
where ρp is the particle density, dp is the particle diameter, v isa characteristic velocity scale of the flow, μ is the fluidviscosity, l is a characteristic length scale of the flow andCc the slip correction factor (or Cunningham’s correctionfactor) [33].As the seeding was produced by burning Chinese joss
sticks, it was estimated a particle diameter around 0.3 μmand a particle density of 1.06 g/cm3 [19, 34, 35]. It wasfound that at standard conditions (293 K and 101 kPa) theslip correction factor was around 1.554 [36, 37]. Therefore,assuming, a characteristic length equal to 2.25 mm and acharacteristic velocity set to the maximum velocitymeasured by PIV experiments, the Stokes number was ofthe order 10−4 for both test conditions. According to [38],St ≪ 0.1 returns an acceptable flow tracing accuracy witherrors below 1%.
3& The Institution of Engineering and Technology 2014
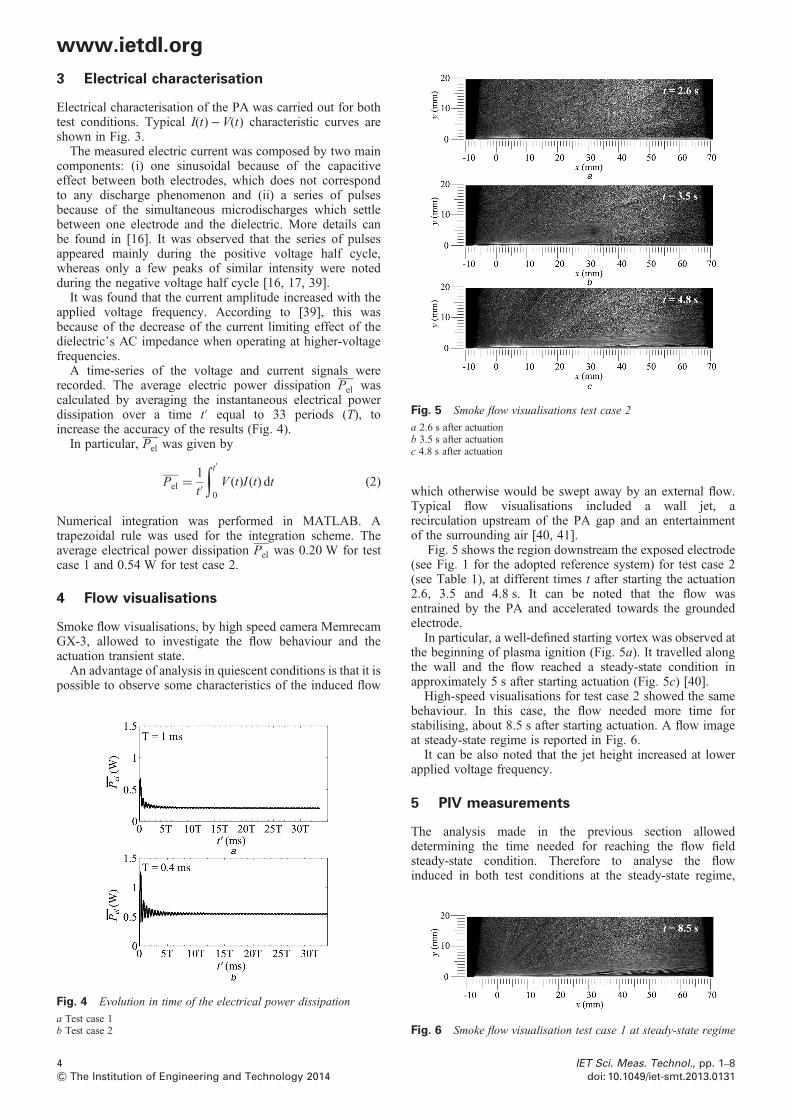
Fig. 5 Smoke flow visualisations test case 2
a 2.6 s after actuationb 3.5 s after actuationc 4.8 s after actuation
www.ietdl.org
3 Electrical characterisationElectrical characterisation of the PA was carried out for bothtest conditions. Typical I(t)− V(t) characteristic curves areshown in Fig. 3.The measured electric current was composed by two main
components: (i) one sinusoidal because of the capacitiveeffect between both electrodes, which does not correspondto any discharge phenomenon and (ii) a series of pulsesbecause of the simultaneous microdischarges which settlebetween one electrode and the dielectric. More details canbe found in [16]. It was observed that the series of pulsesappeared mainly during the positive voltage half cycle,whereas only a few peaks of similar intensity were notedduring the negative voltage half cycle [16, 17, 39].It was found that the current amplitude increased with the
applied voltage frequency. According to [39], this wasbecause of the decrease of the current limiting effect of thedielectric’s AC impedance when operating at higher-voltagefrequencies.A time-series of the voltage and current signals were
recorded. The average electric power dissipation Pel wascalculated by averaging the instantaneous electrical powerdissipation over a time t′ equal to 33 periods (T), toincrease the accuracy of the results (Fig. 4).In particular, Pel was given by
Pel =1
t′
∫t′0V (t)I (t) dt (2)
Numerical integration was performed in MATLAB. Atrapezoidal rule was used for the integration scheme. Theaverage electrical power dissipation Pel was 0.20 W for testcase 1 and 0.54 W for test case 2.
4 Flow visualisations
Smoke flow visualisations, by high speed camera MemrecamGX-3, allowed to investigate the flow behaviour and theactuation transient state.An advantage of analysis in quiescent conditions is that it is
possible to observe some characteristics of the induced flow
Fig. 4 Evolution in time of the electrical power dissipation
a Test case 1b Test case 2
4& The Institution of Engineering and Technology 2014
which otherwise would be swept away by an external flow.Typical flow visualisations included a wall jet, arecirculation upstream of the PA gap and an entertainmentof the surrounding air [40, 41].
Fig. 5 shows the region downstream the exposed electrode(see Fig. 1 for the adopted reference system) for test case 2(see Table 1), at different times t after starting the actuation2.6, 3.5 and 4.8 s. It can be noted that the flow wasentrained by the PA and accelerated towards the groundedelectrode.In particular, a well-defined starting vortex was observed at
the beginning of plasma ignition (Fig. 5a). It travelled alongthe wall and the flow reached a steady-state condition inapproximately 5 s after starting actuation (Fig. 5c) [40].High-speed visualisations for test case 2 showed the same
behaviour. In this case, the flow needed more time forstabilising, about 8.5 s after starting actuation. A flow imageat steady-state regime is reported in Fig. 6.It can be also noted that the jet height increased at lower
applied voltage frequency.
5 PIV measurements
The analysis made in the previous section alloweddetermining the time needed for reaching the flow fieldsteady-state condition. Therefore to analyse the flowinduced in both test conditions at the steady-state regime,
Fig. 6 Smoke flow visualisation test case 1 at steady-state regime
IET Sci. Meas. Technol., pp. 1–8doi: 10.1049/iet-smt.2013.0131
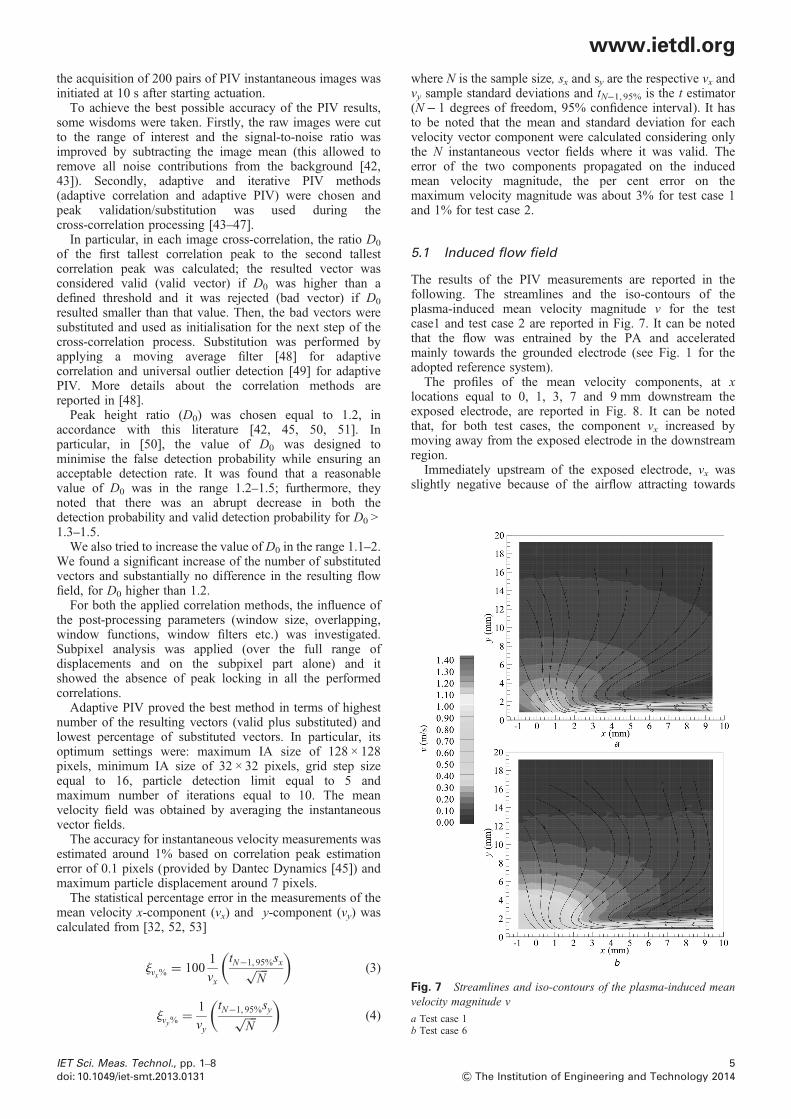
Fig. 7 Streamlines and iso-contours of the plasma-induced meanvelocity magnitude v
a Test case 1b Test case 6
www.ietdl.org
the acquisition of 200 pairs of PIV instantaneous images wasinitiated at 10 s after starting actuation.To achieve the best possible accuracy of the PIV results,some wisdoms were taken. Firstly, the raw images were cutto the range of interest and the signal-to-noise ratio wasimproved by subtracting the image mean (this allowed toremove all noise contributions from the background [42,43]). Secondly, adaptive and iterative PIV methods(adaptive correlation and adaptive PIV) were chosen andpeak validation/substitution was used during thecross-correlation processing [43–47].In particular, in each image cross-correlation, the ratio D0
of the first tallest correlation peak to the second tallestcorrelation peak was calculated; the resulted vector wasconsidered valid (valid vector) if D0 was higher than adefined threshold and it was rejected (bad vector) if D0
resulted smaller than that value. Then, the bad vectors weresubstituted and used as initialisation for the next step of thecross-correlation process. Substitution was performed byapplying a moving average filter [48] for adaptivecorrelation and universal outlier detection [49] for adaptivePIV. More details about the correlation methods arereported in [48].Peak height ratio (D0) was chosen equal to 1.2, in
accordance with this literature [42, 45, 50, 51]. Inparticular, in [50], the value of D0 was designed tominimise the false detection probability while ensuring anacceptable detection rate. It was found that a reasonablevalue of D0 was in the range 1.2–1.5; furthermore, theynoted that there was an abrupt decrease in both thedetection probability and valid detection probability for D0 >1.3–1.5.We also tried to increase the value of D0 in the range 1.1–2.
We found a significant increase of the number of substitutedvectors and substantially no difference in the resulting flowfield, for D0 higher than 1.2.For both the applied correlation methods, the influence of
the post-processing parameters (window size, overlapping,window functions, window filters etc.) was investigated.Subpixel analysis was applied (over the full range ofdisplacements and on the subpixel part alone) and itshowed the absence of peak locking in all the performedcorrelations.Adaptive PIV proved the best method in terms of highest
number of the resulting vectors (valid plus substituted) andlowest percentage of substituted vectors. In particular, itsoptimum settings were: maximum IA size of 128 × 128pixels, minimum IA size of 32 × 32 pixels, grid step sizeequal to 16, particle detection limit equal to 5 andmaximum number of iterations equal to 10. The meanvelocity field was obtained by averaging the instantaneousvector fields.The accuracy for instantaneous velocity measurements was
estimated around 1% based on correlation peak estimationerror of 0.1 pixels (provided by Dantec Dynamics [45]) andmaximum particle displacement around 7 pixels.The statistical percentage error in the measurements of the
mean velocity x-component (vx) and y-component (vy) wascalculated from [32, 52, 53]
jvx% = 1001
vx
tN−1, 95%sx���N
√( )
(3)
jvy% = 1
vy
tN−1, 95%sy���N
√( )
(4)
IET Sci. Meas. Technol., pp. 1–8doi: 10.1049/iet-smt.2013.0131
where N is the sample size, sx and sy are the respective vx andvy sample standard deviations and tN−1, 95% is the t estimator(N− 1 degrees of freedom, 95% confidence interval). It hasto be noted that the mean and standard deviation for eachvelocity vector component were calculated considering onlythe N instantaneous vector fields where it was valid. Theerror of the two components propagated on the inducedmean velocity magnitude, the per cent error on themaximum velocity magnitude was about 3% for test case 1and 1% for test case 2.
5.1 Induced flow field
The results of the PIV measurements are reported in thefollowing. The streamlines and the iso-contours of theplasma-induced mean velocity magnitude v for the testcase1 and test case 2 are reported in Fig. 7. It can be notedthat the flow was entrained by the PA and acceleratedmainly towards the grounded electrode (see Fig. 1 for theadopted reference system).The profiles of the mean velocity components, at x
locations equal to 0, 1, 3, 7 and 9 mm downstream theexposed electrode, are reported in Fig. 8. It can be notedthat, for both test cases, the component vx increased bymoving away from the exposed electrode in the downstreamregion.Immediately upstream of the exposed electrode, vx was
slightly negative because of the airflow attracting towards
5& The Institution of Engineering and Technology 2014

Fig. 8 Mean velocity profiles
a vx velocity profiles test case 1b vy velocity profiles test case 1c vx velocity profiles test case 2d vy velocity profiles test case 2
www.ietdl.org
the zero position. Moreover, for both test cases, thecomponent vy had a maximum value in close proximity tothe downstream edge of the exposed electrode; whereas itwas negligible outside of that region. This is evident also inthe streamlines of Fig 7.It is possible to note that going from test case 1 to test case
2, the plasma jet increased in velocity magnitude and spatialextent. An explanation could be that transferred chargeincreases at higher applied voltage frequencies; this bringsto more collisions between ions and gas and enhances theinduced velocity [7].In particular, in test case 1 the maximum velocity
magnitude vmax was obtained at x = 5.5 mm downstream theexposed electrode, whereas in test case 2 it was obtained atx = 7.7 mm. Therefore, by raising the voltage frequency, thejet extension increased.
Fig. 9 Control volume for the momentum balance equations
6& The Institution of Engineering and Technology 2014
5.2 Estimation of the body force
The time averaged velocity fields generated from the PIVmeasurement were used for the estimation of net forceinduced by the PA.As proposed in [27, 29, 32], the momentum balance
equation in integral form was used. It involved thedefinition of a control volume. At the boundaries of thedomain, the momentum flux was calculated and equilibriumwith the internal forces was assumed (see Fig. 9).In the flow visualisations, it was noted that after 8.5 s the
flow was steady in both test cases. Therefore, it was safe touse for the thrust estimation the PIV data given byaveraging the set of 200 images spanning from 10 s afterstarting actuation to 43 s and to assume time independence.A further assumption needed to be made: as the control
volume boundaries were far enough from the bulk of theplasma-induced body force (near the electrode edges)pressure could be considered uniform [27, 29, 32].Moreover, since the large span of the actuator ensures
minimal 3D effects [29], we could assume that there was anegligible variation of velocity along the spanwise direction(z). With the assumptions of time independence, constantpressure and incompressible 2D flow, the momentumbalance equation was applied to the control volume takingaccount of the no-slip condition at the wall. This impliedthat the momentum flux across the wall was zero.Said v is the outward-facing surface normal vector, the two
components of the net force induced per unit electrode length,
IET Sci. Meas. Technol., pp. 1–8doi: 10.1049/iet-smt.2013.0131
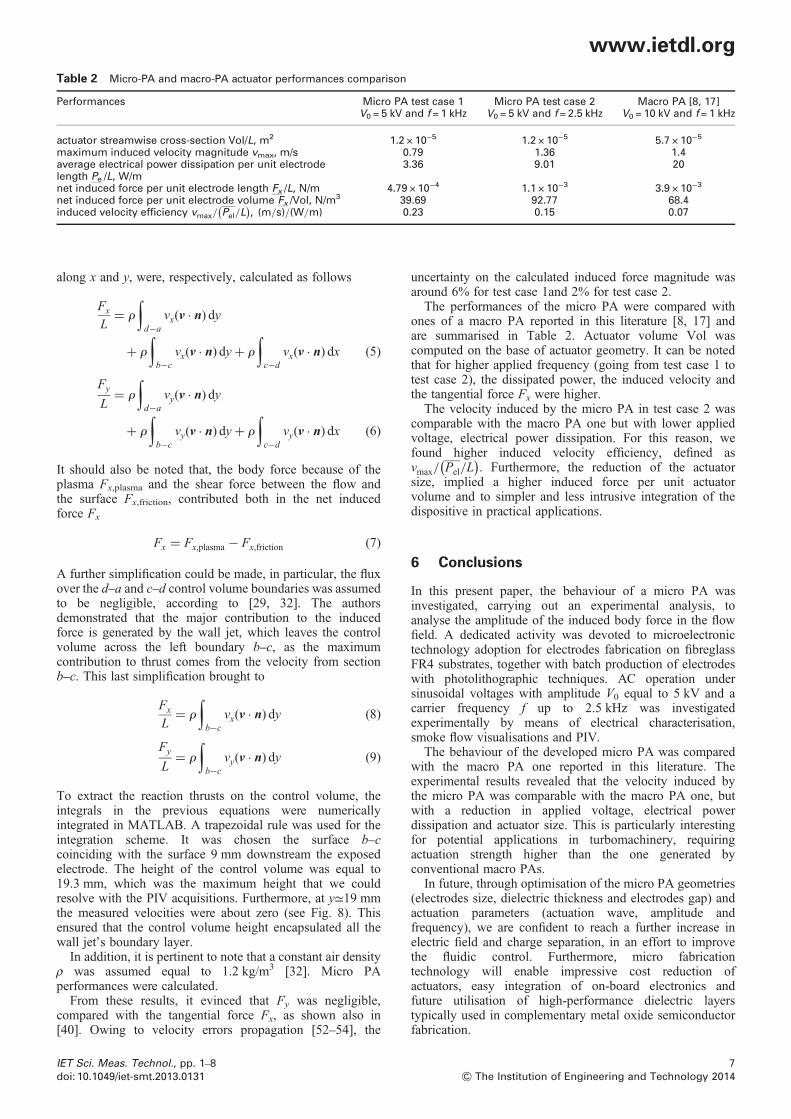
Table 2 Micro-PA and macro-PA actuator performances comparison
Performances Micro PA test case 1V0 = 5 kV and f = 1 kHz
Micro PA test case 2V0 = 5 kV and f = 2.5 kHz
Macro PA [8, 17]V0 = 10 kV and f = 1 kHz
actuator streamwise cross-section Vol/L, m2 1.2 × 10⁻⁵ 1.2 × 10⁻⁵ 5.7 × 10⁻⁵
maximum induced velocity magnitude vmax, m/s 0.79 1.36 1.4average electrical power dissipation per unit electrodelength Pe /L, W/m
3.36 9.01 20
net induced force per unit electrode length Fx /L, N/m 4.79 × 10⁻⁴ 1.1 × 10⁻³ 3.9 × 10⁻³
net induced force per unit electrode volume Fx /Vol, N/m3 39.69 92.77 68.4induced velocity efficiency vmax/ Pel/L
( ), (m/s)/(W/m) 0.23 0.15 0.07
www.ietdl.org
along x and y, were, respectively, calculated as follows
Fx
L= r
∫d−a
vx(v · n) dy
+ r
∫b−c
vx(v · n) dy+ r
∫c−d
vx(v · n) dx (5)
Fy
L= r
∫d−a
vy(v · n) dy
+ r
∫b−c
vy(v · n) dy+ r
∫c−d
vy(v · n) dx (6)
It should also be noted that, the body force because of theplasma Fx,plasma and the shear force between the flow andthe surface Fx,friction, contributed both in the net inducedforce Fx
Fx = Fx,plasma − Fx,friction (7)
A further simplification could be made, in particular, the fluxover the d–a and c–d control volume boundaries was assumedto be negligible, according to [29, 32]. The authorsdemonstrated that the major contribution to the inducedforce is generated by the wall jet, which leaves the controlvolume across the left boundary b–c, as the maximumcontribution to thrust comes from the velocity from sectionb–c. This last simplification brought to
Fx
L= r
∫b−c
vx(v · n) dy (8)
Fy
L= r
∫b−c
vy(v · n) dy (9)
To extract the reaction thrusts on the control volume, theintegrals in the previous equations were numericallyintegrated in MATLAB. A trapezoidal rule was used for theintegration scheme. It was chosen the surface b–ccoinciding with the surface 9 mm downstream the exposedelectrode. The height of the control volume was equal to19.3 mm, which was the maximum height that we couldresolve with the PIV acquisitions. Furthermore, at y≃19 mmthe measured velocities were about zero (see Fig. 8). Thisensured that the control volume height encapsulated all thewall jet’s boundary layer.In addition, it is pertinent to note that a constant air density
ρ was assumed equal to 1.2 kg/m3 [32]. Micro PAperformances were calculated.From these results, it evinced that Fy was negligible,
compared with the tangential force Fx, as shown also in[40]. Owing to velocity errors propagation [52–54], the
IET Sci. Meas. Technol., pp. 1–8doi: 10.1049/iet-smt.2013.0131
uncertainty on the calculated induced force magnitude wasaround 6% for test case 1and 2% for test case 2.The performances of the micro PA were compared with
ones of a macro PA reported in this literature [8, 17] andare summarised in Table 2. Actuator volume Vol wascomputed on the base of actuator geometry. It can be notedthat for higher applied frequency (going from test case 1 totest case 2), the dissipated power, the induced velocity andthe tangential force Fx were higher.The velocity induced by the micro PA in test case 2 was
comparable with the macro PA one but with lower appliedvoltage, electrical power dissipation. For this reason, wefound higher induced velocity efficiency, defined asvmax/ Pel/L
( ). Furthermore, the reduction of the actuator
size, implied a higher induced force per unit actuatorvolume and to simpler and less intrusive integration of thedispositive in practical applications.
6 Conclusions
In this present paper, the behaviour of a micro PA wasinvestigated, carrying out an experimental analysis, toanalyse the amplitude of the induced body force in the flowfield. A dedicated activity was devoted to microelectronictechnology adoption for electrodes fabrication on fibreglassFR4 substrates, together with batch production of electrodeswith photolithographic techniques. AC operation undersinusoidal voltages with amplitude V0 equal to 5 kV and acarrier frequency f up to 2.5 kHz was investigatedexperimentally by means of electrical characterisation,smoke flow visualisations and PIV.The behaviour of the developed micro PA was compared
with the macro PA one reported in this literature. Theexperimental results revealed that the velocity induced bythe micro PA was comparable with the macro PA one, butwith a reduction in applied voltage, electrical powerdissipation and actuator size. This is particularly interestingfor potential applications in turbomachinery, requiringactuation strength higher than the one generated byconventional macro PAs.In future, through optimisation of the micro PA geometries
(electrodes size, dielectric thickness and electrodes gap) andactuation parameters (actuation wave, amplitude andfrequency), we are confident to reach a further increase inelectric field and charge separation, in an effort to improvethe fluidic control. Furthermore, micro fabricationtechnology will enable impressive cost reduction ofactuators, easy integration of on-board electronics andfuture utilisation of high-performance dielectric layerstypically used in complementary metal oxide semiconductorfabrication.
7& The Institution of Engineering and Technology 2014

www.ietdl.org
7 References1 Corke, T.C., Mertz, P., Patel, M.: ‘Plasma flow control optimizedairfoil’. Proc. 44th AIAA Aerospace Sciences Meeting and Exhibit,Reno, Nevada, 9–12 January 2006
2 Huang, J., Corke, T.C., Thomas, F.: ‘Unsteady plasma actuators forseparation control of low-pressure turbine blades’, AIAA J., 2006, 44,(7), pp. 1477–1487
3 De Giorgi, M.G., Traficante, S., Ficarella, A.: ‘Performanceimprovement of turbomachinery using plasma actuators’. Proc. ASMETurbo Expo, 2011, 7, pp. 369–380
4 De Giorgi, M.G., Traficante, S., De Luca, C., Bello, D., Ficarella, A.:‘Active flow control techniques on a stator compressor cascade: acomparison between synthetic jet and plasma actuators’. Proc. ASMETurbo Expo, 2012, vol. 8, pp. 339–350
5 Van Ness, D.II, Corke, T., Morris, S.: ‘Turbine tip clearance flow controlusing plasma actuators’. Proc. 44th Aerospace Sciences Meeting andExhibit, Reno, Nevada, 9–12 January2006
6 Vo, H.D.: ‘Control of rotating stall in axial compressors using plasmaactuators’. Proc. 37th AIAA Fluid Dynamics Conf. Exhibit, Miami,FL, 25–28 June 2007
7 Okochi, S., Kasagi, N., Suzuki, Y., Ito, S.: ‘Development of microplasma actuator for flow control’. ExHFT-7, Krakow, Poland, 28June–03 July 2009
8 Zito, J.C., Durscher, R.J., Soni, J., Roy, S., Arnold, D.P.: ‘Flow andforce inducement using micron size dielectric barrier dischargeactuators’, Appl. Phys. Lett., 2012, 100, (19), pp. 193502–193502-4
9 Pescini, E., De Giorgi, M.G., Francioso, L., Ficarella, A.: ‘Microscaledielectroc barrier discharge plasma actuators’. Proc. Fourth ImekoTC19 Symp. Environmental and Measurement ProtectingEnvironment, Lecce, Italy, 3–4 June 2013
10 Eloe, C., NcLughin, T.E., VanDyken, R.D., Kachner, K.D.: ‘Mechanismand responses of a single dielectric barrier plasma actuator: geometriceffects’, AIAA J., 2004, 42, (3), pp. 595–604
11 Forte, M., Jolibois, J., Pons, J., Moreau, E., Touchard, G., Cazalens, M.:‘Optimization of a dielectric barrier discharge actuator by stationary andnon-stationary measurements of the induced flow velocity: applicationto airflow control’, Exp. Fluids, 2007, 43, (6), pp. 917–928
12 Thomas, F.O., Corke, T.C., Iqbal, M., Kozlov, A., Schatzman, D.:‘Optimization of dielectric barrier discharge plasma actuators foractive aerodynamic flow control’, AIAA J., 2009, 47, (9), pp. 2169–2178
13 Roy, S., Arnold, D., Lin, J., et al.: ‘Novel plasma actuators for energyefficiency’. DARPA-Princeton Workshop, 22–24 August 2011
14 Wang, C.-C., Roy, S.: ‘Microscale plasma actuators for improved thrustdensity’, J. Appl. Phys., 2009, 106, (1), pp. 013310–013310-7
15 Lemire, Vo, H.D.: ‘Reduction of fan and compressor wake defect usingplasma actuation for tonal noise reduction’, J. Turbomach., 2010, 133,(1), pp. 011017–011017-11
16 Pons, J., Moreau, E., Touchard, G.: ‘Asymmetric surface dielectricbarrier discharge in air at atmospheric pressure: electrical propertiesand induced airflow characteristics’, J. Phys. D, Appl. Phys., 2005, 38,(19), pp. 3635–3642
17 Abe, T., Takizawa, Y., Sato, S.: ‘Experimental study for momentumtransfer in a dielectric barrier discharge plasma actuator’, AIAA J.,2008, 46, (9), pp. 2248–2256
18 Enloe, C.L., Mclaughlin, T.E., Vandyken, R.D., Kachner, K.D.:‘Mechanisms and responses of a single dielectric barrier plasmaactuator: plasma morphology’, AIAA J., 2004, 42, (3), pp. 589–594
19 Balcon, N., Benard, N., Moreau, E.: ‘Formation process of the electricwind produced by a plasma actuator’, IEEE Trans. Dielectr. Electr.Insul., 2009, 16, (2), pp. 463–469
20 Boeuf, J.P., Lagmich, Y., Unfer, T., Callegari, T., Pitchford, L.:‘Electrohydrodynamic force in dielectric barrier discharge plasmaactuators’, J. Phys. D, Appl. Phys., 2007, 40, (3), pp. 652–662
21 Singh, K.P., Roy, S., Gaitonte, D.: ‘Modeling of dielectric barrierdischarge plasma actuator with atmospheric air chemistry’. 37th AIAAPlasmadynamics and Lasers Conf., San Francisco, CA, USA, 5–8June 2006
22 Singh, K.P., Roy, S.: ‘Modeling plasma actuators with air chemistry foreffective flow control’, J. Appl. Phys., 2007, 101, (12),pp. 123308–123308-8
23 Shyy, W., Jayaraman, B., Andersson, A.: ‘Modeling of glowdischarge-induced fluid dynamics’, J. Appl. Phys., 2002, 92, (11),pp. 6434–6443
24 Suzen, Y.B., Huang, P.G., Jacob, J.D.: ‘Numerical simulations ofplasma based flow control applications’. Proc. 35th Fluid DynamicsConf. Exhibit, Toronto, ON, Canada, 6–9 June 2005
25 Orlov, D.M., Corke, T.C., Patel, M.: ‘Electric circuit model foraerodynamic plasma actuator’. Proc. 44th AIAA Aerospace SciencesMeeting and Exhibit, Reno, Nevada, 9–12 January 2006
8& The Institution of Engineering and Technology 2014
26 Maden, I., Maduta, R., Krigeis, J., et al.: ‘ Experimental andcomputational study of the flow induced by a plasma actuator’,Int. J. Heat Fluid Flow, 2013, 41, pp. 80–89
27 Kotsonis, M., Ghaemi, S., Veldhuis, L., Scarano, F.: ‘Measurement ofthe body force field of plasma actuators’, J. Phys. D, Appl. Phys.,2011, 44, (4), pp. 045204–045204-11
28 Kotsonis, M., Ghaemi, S.: ‘Experimental and numerical characterizationof a plasma actuator in continuous and pulsed actuation’, Sens. ActuatorsA, Phys., 2012, 187, pp. 84–94
29 Kriegseis, J., Schwarz, C., Tropea, C., Grundmann:‘Velocity-information-based force-term estimation of dielectric-barrierdischarge plasma actuators’, J. Phys. D, Appl. Phys., 2013, 46,pp. 055202–055202-13
30 Ashpis, D.E., Laun, M.C., Griebeler, E.L.: ‘Progress towards accuratemeasurements of power consumptions of DBD plasma actuators’.NASA/TM-2012–217449
31 Treck: ‘Operator’s manual model 40/15 high voltage power amplifier’(Treck Inc., USA) 2009
32 Durscher, R., Roy, S.: ‘Evaluation of thrust measurement techniques fordielectric barrier discharge actuators’, Exp. Fluids, 2012, 53, (4),pp. 1165–1176
33 Yoon, S., Ross, J., Mench, M., Sharp, K.: ‘Gas-phase particle imagevelocimetry (PIV) for application’, J. Power Sources, 2006, 160, (2),pp. 1017–1025
34 Cheng, Y.S., Bechtold, E., Yu, C.C., Hung, I.F.: ‘Incense smoke:characterization and dynamics in indoor environments’, Aerosol Sci.Technol., 1995, 23, (3), pp. 271–281
35 See, S.W., Balasubramanian, R., Joshi, U.M.: ‘Physical characteristicsof nanoparticles emitted from incense smoke’, Sci. Technol. Adv.Mater., 2007, 8, (1–2), pp. 25–32
36 Hosokawa, M., Kiyoshi, N., Naito, M., Yokoyama, T.: ‘Nanoparticletechnology handbook’ (Elsevier, The Netherlands, 2007)
37 Hinds,W.C.: ‘Aerosol technology properties, behaviour, and measurementof airborne particles’ (John Willey & Sons, INC., USA, 1998)
38 Tropea, C., Yarin, A.L., Foss, J.F.: ‘Springer handbook of experimentalfluid mechanics’ (Springer, 2007)
39 Poon, D.: ‘Separation control using plasma actuators: experimentalstudies of plasma actuator performance’. Master thesis, University ofMinnesota, January, 2011
40 Whalley, R., Choi, K.-S.: ‘Starting, traveling, and colliding vortices:dielectric-barrier-discharge plasma in quiescent air’, Phys. Fluids,2010, 22, (9), pp. 091105–0911051-1
41 Estevadeordal, J., Gogineni, S.: ‘Low-speed flow control using dielectricbarrier discharge (DBD)’. AFRL-VA-WP-TR-2006-3211, 2006
42 Xue, Z., Charonko, J., Vlachos, P.: ‘Signal-to-noise ratio, error anduncertainty of PIV measurement’. PIV13; Tenth Int. Symp. ParticleImage Velocimetry, Delft, The Netherlands, 1–3 July 2013
43 Gui, L., Wereley, S.T.: ‘A correlation-based continuous window-shifttechnique to reduce the peak-locking effect in digital PIV imageevaluation’, Exp. Fluids, 2002, 32, (4), pp. 506–517
44 Lecuona, A., Nogueira, J., Rodriguez, P.A.: ‘Data validation,interpolation and signal to noise increase in iterative PIV methods’.11th Int. Symp. Applications of Laser Techniques to Fluid Mechanics,Lisboa, Portugal, 8–11 July 2012
45 Ergin, F.G., Watz, B.B., Erglis, K., Cebers, A.: ‘Planar velocity &concentration measurements in a magnetic micromixer with interfacefront detection’. Proc. Tenth Int. Symp. Particle Image Velocimetry,Delft, The Netherlands, 1–3 July 2013
46 Ergin, F.G., Watz, B.B., Erglis, K., Cebers, A.: ‘Reduction ofpeak-locking errors produced by Gaussian sub-pixel interpolation incross-correlation digital particle image velocimetry’, Meas. Sci.Technol., 2010, 21, (3), pp. 035402–035402-6
47 Jaunet, V.: ‘Technical note on the validation of PIV vector samples’.Skovlunde, 08-10-2012
48 Dynamics, D.: DymanucStudio User’s Guide, Version 3.40, 201349 Westerweel, J., Scarano, F.: ‘Universal outlier detection for PIV data’,
Exp. Fluids, 2005, 39, (6), pp. 1096–110050 Keane, R.D., Adrian, R.J.: ‘Optimization of particle image
velocimeters. I. Double pulsed systems’, Meas. Sci. Technol., 1990, 1,pp. 1202–1215
51 Keane, R.D., Adrian, R.J.: ‘Optimization of particle image velocimeters:II. Multiple pulsed systems’, Meas. Sci. Technol., 1991, 2, (10),pp. 963–974
52 Snedecor, G.W., Cochran, W.G.: ‘Statistical methods’ (Iowa StateUniversity Press, 1989, 8th edn.)
53 Coleman, H., Steele, W.: ‘Experimentation, validation; and uncertaintyanalysis for engineers’ (John Wiley & Sons, 2009, 3rd edn.)
54 Anthoine, J., Arts, T., Boerrigter, H.L., et al..: ‘Measurement techniquesin fluid dynamics an introduction’ (von Karman Institute for FluidDynamics, Rhode-St-Genèse, Belgium, 2009)
IET Sci. Meas. Technol., pp. 1–8doi: 10.1049/iet-smt.2013.0131