Edaphic controls on ecosystem-level carbon allocation in two contrasting Amazon forests
11
Edaphic controls on ecosystem-level carbon allocation in two contrasting Amazon forests Eliana M. Jiménez 1,2 , María Cristina Peñuela-Mora 1 , Carlos A. Sierra 2 , Jon Lloyd 3 , Oliver L. Phillips 4 , Flavio H. Moreno 5 , Diego Navarrete 6 , Adriana Prieto 7 , Agustín Rudas 7 , Esteban Álvarez 8 , Carlos A. Quesada 9 , Maria Angeles Grande-Ortíz 10 , Antonio García-Abril 10 , and Sandra Patiño 11 1 Research Group in Ecology of Tropical Terrestrial Ecosystems, Universidad Nacional de Colombia Sede Amazonas, Leticia, Colombia, 2 Max Planck Institute for Biogeochemistry, Jena, Germany, 3 Department of Life Sciences, Imperial College London, London, UK, 4 School of Geography, University of Leeds, Leeds, UK, 5 Research Group in Forests and Climate Change, Universidad Nacional de Colombia Sede Medellín, Medellín, Colombia, 6 College of Life and Environmental Sciences, University of Exeter, Exeter, UK, 7 Instituto de Ciencias Naturales, Universidad Nacional de Colombia Sede Bogotá, Bogotá, Colombia, 8 Research Group in Ecosystem Services and Climate Change, Jardín Botánico de Medellín, Medellín, Colombia, 9 Instituto Nacional de Pesquisas da Amazonia-CDAM, Manaus, Brazil, 10 ETSI de Montes, Universidad Politécnica de Madrid, Madrid, Spain, 11 Research Institute Alexander von Humboldt, Bogotá, Colombia Abstract Studies of carbon allocation in forests provide essential information for understanding spatial and temporal differences in carbon cycling that can inform models and predict possible responses to changes in climate. Amazon forests play a particularly signi ficant role in the global carbon balance, but there are still large uncertainties regarding abiotic controls on the rates of net primary production (NPP) and the allocation of photosynthetic products to different ecosystem components. We evaluated three different aspects of stand-level carbon allocation (biomass, NPP, and its partitioning) in two amazon forests on different soils (nutrient-rich clay soils versus nutrient-poor sandy soils) but otherwise growing under similar conditions. We found differences in carbon allocation patterns between these two forests, showing that the forest on clay soil had a higher aboveground and total biomass as well as a higher aboveground NPP than the sandy forest. However, differences between the two forest types in terms of total NPP were smaller, as a consequence of different patterns in the carbon allocation of aboveground and belowground components. The proportional allocation of NPP to new foliage was relatively similar between them. Our results of aboveground biomass increments and fine-root production suggest a possible trade-off between carbon allocation to fine roots versus aboveground compartments, as opposed to the most commonly assumed trade-off between total aboveground and belowground production. Despite these differences among forests in terms of carbon allocation, the leaf area index showed only small differences, suggesting that this index is more indicative of total NPP than its aboveground or belowground components. 1. Introduction Three different aspects of the forest carbon cycle—biomass, flux, and partitioning—are key to understanding forest ecosystem metabolism and accurately predicting the effects of global change on forest carbon cycling [Chapin et al., 2011]. Terrestrial ecosystem models require information on the partitioning of carbon among different forest compartments, but there are few studies that have actually measured all components of the forest carbon budget that allow accurate estimation of these partitioning coefficients [Litton et al., 2007]. Even in the world’ s most extensive tropical forest ecosystem, the Amazon forest, most previous studies have focused on quantifying biomass or net primary production with very few attempts at a more comprehensive analysis of carbon allocation [Girardin et al., 2010; Malhi et al., 2009]. Amazon forests are highly heterogeneous in terms of their structure and resource environment. Most soil groups are represented within the Amazon Basin with considerable variations in soil fertility and potential physical limitations to plant growth, even within the same soil order [Quesada et al., 2011]. Therefore, belowground resource availability may vary considerably across the basin, with potential consequences for resource acquisition, carbon allocation, and consequently ecosystem carbon balances. There have been important attempts to understand basin-wide patterns of biomass and net primary production controlled by the soil environment [Aragão et al., 2009; Malhi et al., 2009, 2004], but given that not only soils but also climate, plant community composition, and levels of human influence covary at the basin scale, it is difficult to discern patterns of carbon allocation as controlled by the soil environment alone. JIMÉNEZ ET AL. ©2014. American Geophysical Union. All Rights Reserved. 1 PUBLICATION S Journal of Geophysical Research: Biogeosciences RESEARCH ARTICLE 10.1002/2014JG002653 Key Points: • Carbon allocation was measured in two contrasting Amazon forests • Differences in carbon allocation components where not proportional between forests • Soils control a trade-off between allocation to fine roots versus aboveground parts Supporting Information: • Readme • Table S1 Correspondence to: C. A. Sierra, [email protected] Citation: Jiménez, E. M., et al. (2014), Edaphic controls on ecosystem-level carbon allocation in two contrasting Amazon forests, J. Geophys. Res. Biogeosci., 119, doi:10.1002/2014JG002653. Received 20 FEB 2014 Accepted 15 AUG 2014 Accepted article online 21 AUG 2014
Transcript of Edaphic controls on ecosystem-level carbon allocation in two contrasting Amazon forests

Edaphic controls on ecosystem-level carbonallocation in two contrasting Amazon forestsEliana M Jimeacutenez12 Mariacutea Cristina Pentildeuela-Mora1 Carlos A Sierra2 Jon Lloyd3 Oliver L Phillips4Flavio H Moreno5 Diego Navarrete6 Adriana Prieto7 Agustiacuten Rudas7 Esteban Aacutelvarez8Carlos A Quesada9 Maria Angeles Grande-Ortiacutez10 Antonio Garciacutea-Abril10 and Sandra Patintildeo11
1Research Group in Ecology of Tropical Terrestrial Ecosystems Universidad Nacional de Colombia Sede Amazonas LeticiaColombia 2Max Planck Institute for Biogeochemistry Jena Germany 3Department of Life Sciences Imperial CollegeLondon London UK 4School of Geography University of Leeds Leeds UK 5Research Group in Forests and Climate ChangeUniversidad Nacional de Colombia SedeMedelliacuten Medelliacuten Colombia 6College of Life and Environmental Sciences Universityof Exeter Exeter UK 7Instituto de Ciencias Naturales Universidad Nacional de Colombia Sede Bogotaacute Bogotaacute Colombia8Research Group in Ecosystem Services and Climate Change Jardiacuten Botaacutenico de Medelliacuten Medelliacuten Colombia 9InstitutoNacional de Pesquisas da Amazonia-CDAM Manaus Brazil 10ETSI de Montes Universidad Politeacutecnica de Madrid MadridSpain 11Research Institute Alexander von Humboldt Bogotaacute Colombia
Abstract Studies of carbon allocation in forests provide essential information for understanding spatial andtemporal differences in carbon cycling that can inform models and predict possible responses to changes inclimate Amazon forests play a particularly significant role in the global carbon balance but there are still largeuncertainties regarding abiotic controls on the rates of net primary production (NPP) and the allocation ofphotosynthetic products to different ecosystem components We evaluated three different aspects of stand-levelcarbon allocation (biomass NPP and its partitioning) in two amazon forests on different soils (nutrient-rich clay soilsversus nutrient-poor sandy soils) but otherwise growing under similar conditions We found differences in carbonallocation patterns between these two forests showing that the forest on clay soil had a higher abovegroundand total biomass as well as a higher aboveground NPP than the sandy forest However differences betweenthe two forest types in terms of total NPP were smaller as a consequence of different patterns in the carbonallocation of aboveground and belowground components The proportional allocation of NPP to new foliage wasrelatively similar between them Our results of aboveground biomass increments and fine-root production suggesta possible trade-off between carbon allocation to fine roots versus aboveground compartments as opposed tothe most commonly assumed trade-off between total aboveground and belowground production Despite thesedifferences among forests in terms of carbon allocation the leaf area index showed only small differencessuggesting that this index is more indicative of total NPP than its aboveground or belowground components
1 Introduction
Three different aspects of the forest carbon cyclemdashbiomass flux and partitioningmdashare key to understandingforest ecosystem metabolism and accurately predicting the effects of global change on forest carboncycling [Chapin et al 2011] Terrestrial ecosystemmodels require information on the partitioning of carbonamong different forest compartments but there are few studies that have actually measured all components ofthe forest carbon budget that allow accurate estimation of these partitioning coefficients [Litton et al 2007]Even in the worldrsquos most extensive tropical forest ecosystem the Amazon forest most previous studies havefocused on quantifying biomass or net primary production with very few attempts at a more comprehensiveanalysis of carbon allocation [Girardin et al 2010 Malhi et al 2009]
Amazon forests are highly heterogeneous in terms of their structure and resource environment Most soilgroups are represented within the Amazon Basin with considerable variations in soil fertility and potentialphysical limitations to plant growth even within the same soil order [Quesada et al 2011] Thereforebelowground resource availability may vary considerably across the basin with potential consequences forresource acquisition carbon allocation and consequently ecosystem carbon balances There have beenimportant attempts to understand basin-wide patterns of biomass and net primary production controlled bythe soil environment [Aragatildeo et al 2009Malhi et al 2009 2004] but given that not only soils but also climateplant community composition and levels of human influence covary at the basin scale it is difficult to discernpatterns of carbon allocation as controlled by the soil environment alone
JIMEacuteNEZ ET AL copy2014 American Geophysical Union All Rights Reserved 1
PUBLICATIONSJournal of Geophysical Research Biogeosciences
RESEARCH ARTICLE1010022014JG002653
Key Pointsbull Carbon allocation was measured intwo contrasting Amazon forests
bull Differences in carbon allocationcomponents where not proportionalbetween forests
bull Soils control a trade-off betweenallocation to fine roots versusaboveground parts
Supporting Informationbull Readmebull Table S1
Correspondence toC A Sierracsierrabgc-jenampgde
CitationJimeacutenez E M et al (2014) Edaphiccontrols on ecosystem-level carbonallocation in two contrasting Amazonforests J Geophys Res Biogeosci 119doi1010022014JG002653
Received 20 FEB 2014Accepted 15 AUG 2014Accepted article online 21 AUG 2014
Although the allocation of net primary production (NPP) to different aboveground and belowgroundcomponents might be expected to show systematic patterns that vary with soil resource availability reportsfor Amazon forests on contrasting soils (measured as soil available phosphorus [P]a) can display surprisinglysimilar NPP allocation strategies For example Aragatildeo et al [2009] showed that in both a phosphorus-richfertile site (an anthroposol terra preta forest) and a nutrient-depleted site (a white-sand forest) NPP partitioningwas ~05 to aboveground and belowground components Traditionally it has been assumed that carbonallocation belowground is higher in nutrient-poor or dry soils where plants need to invest more resources fornutrient and water uptake [Bloom et al 1985 Cannell and Dewar 1994] However it is unclear weather thesimilar pattern of carbon allocation observed in these two sites is driven by soil characteristics alone or whetherother confounding environmental variables are involved
Despite a lack of clear patterns and large uncertaintiesMalhi et al [2011] suggest a roughly equal three-waysplit of NPP for tropical forests as a whole with 34 plusmn 6 for foliage 39 plusmn 10 for wood and 27plusmn 11 for fineroots They suggested that the dominant allocation trade-off in Amazon forest may be a ldquofine root versuswoodrdquo [Dybzinski et al 2011] as opposed to the expected ldquoroot-shootrdquo trade-off
Current terrestrial ecosystem models vary widely in their prescribed NPP allocation schemes Allocationfractions for the dominant tropical plant functional types range from 10 to 45 for foliage 16ndash77 for woodand 4ndash39 for fine-root production [Malhi et al 2011] Although this variation encompasses the narrowerrange observed for Amazon forests [Aragatildeo et al 2009] 335 plusmn 15 for foliage 213 plusmn 22 for wood and314 plusmn 35 for fine-root production the NPP allocation schemes of some terrestrial ecosystemmodels are farremoved from those actually observed [Malhi et al 2011] In addition biomass ratios are often used asproxies to infer NPP partitioning in some terrestrial ecosystem models [Litton et al 2007 Malhi et al 2011Wolf et al 2011a] In contrast Litton et al [2007] showed that biomass cannot be used to infer either fluxor partitioning in forests because trees accumulate biomass in both long- and short-lived tissues and fluxand partitioning are not proportional to retention
To calculate NPP many ecosystem models also require estimates of leaf area index (LAI) [Malhi et al 2011]Nevertheless the relationship between the satellite-based indices of seasonal greenness and ecosystemproductivity remains an unresolved focus of debate [Davidson et al 2012] Thus although time series of LAIfrom remote sensing products can be of significant relevance to analyze fluctuations in light absorption thattranslate into temporal and spatial dynamics of carbon metabolism at different scales the fidelity of theseobservations and their means of extrapolation remain highly controversial [Medlyn 2011 Nemani et al 2003Saleska et al 2007 Samanta et al 2011 2010 Zhao and Running 2010] Similarly it is unclear whether spatialpatterns of LAI can account for changes in NPP and its partitioning in tropical forests
In this study we aimed to assess possible soil-related impacts on the three different aspects of carbonallocation (biomass net primary production and its partitioning) and in the leaf area index of two Amazon forestecosystems growing under the same climatic conditions but differing substantially in their soil resourceavailability (a nutrient-rich clay soil and a nutrient-poor soil onwhite sands) We expect that by studying adjacentforest growing under the same climatic conditions we can better discern the effects of edaphic factors oncarbon allocation For this purpose we hypothesize first that the proportions of the total biomass in differentvegetation parts (aboveground and belowground) differ considerably from the proportions of total net primaryproduction for the two forests studied consistent with the idea that biomass cannot be used to predict thecarbon flux allocated to different vegetation parts [Litton et al 2007] Second we hypothesize that fluxes areproportionally larger in the nutrient-rich clay site than in the nutrient-poor sandy site This hypothesis isconsistent with the idea presented by Litton et al [2007] of a ldquorising tide lifts all boatsrdquo ie allocation fluxesshould be proportionally higher in sites where total productivity is high Alternatively if fluxes are notproportionally larger for all vegetation parts in the clay soil forest we hypothesize similar allocation to foliage inboth forests consistent with the idea of a trade-off between root and wood production [Dybzinski et al 2011]
2 Materials and Methods21 Site Description
The study was conducted in the northwestern Amazon (Colombia) in two types of old-growth mature terrafirme forests with no signs of previous disturbance We established two 1 ha plots in a clay soil forest located in
Journal of Geophysical Research Biogeosciences 1010022014JG002653
JIMEacuteNEZ ET AL copy2014 American Geophysical Union All Rights Reserved 2
the Amacayacu National Natural Park (AGP-01 3deg43prime105PrimeSndash70deg18prime258PrimeWand AGP-02 3deg43prime202PrimeSndash70deg18prime258PrimeW)and a 1 ha plot in a white-sand forest at the Zafire Biological Station (ZAR-01 4deg0prime209PrimeSndash69deg53prime552PrimeW) There isnot true plot replication within each forest type The sites are between 105ndash110 and 130masl respectively
The two forest types are approximately 50 km apart and are under similar climatic conditions typical of aperhumid lowland equatorial climate Mean annual precipitation was 3342mm (plusmn320mm) with a monthly meanof 279mm (plusmn73mm) measured at the Vaacutesquez Cobo airport in Leticia (04deg11prime36PrimeSndash69deg56prime35PrimeW) for the period1973ndash2008 This region lacks amarked dry season (defined as rainfalllt 100mmmonth1 as inMalhi et al [2004])the driest month being July (164mm) and the wettest April (368mm) Mean annual temperature was 26degC(24ndash27degC minimum and maximum) for the same period and with a mean annual relative humidity of 86
The plots were established on contrasting soils a clay (plots AGP-01 and AGP-02 with 43 clay content) andsandy soil (plot ZAR-01 with 75 sand content) These soils are classified according to the World ReferenceBase as Endostagnic Plinthosol (Alumic Hyperdystric) and Ortsteinic Podzol (Oxyaquic) respectively Adetailed soil description of these plots is provided inQuesada et al [2011] (soil profiles for AGP-02 and ZAR-01therein) Physical and chemical characteristics of these soils are also discussed in Quesada et al [2010] Ingeneral the clay soils have higher [P]a nitrogen concentrations [N] and especially a higher effective cationexchange capacity (CEC) than the sandy soils ([P]a 254 versus 144mg kg1 [N] 016 versus 011 andCEC 62 versus 07 mmolc kg
1 respectively) In the clay soils the plinthic layer was considered relativelypermeable thus exerting only moderate constraints on drainage but the sandy soil (hydromorphic podzol)contains a hardpan at approximately 1m depth that causes periodic water stagnation in the layers above itThis hydromorphic podzol is in an advanced stage of soil development with most clay iron oxides andcations elluviated to a Bh horizon (hardpan layer) 1m below the surface [Sierra et al 2013]
As a result of differences in resource availability these two soil types are associated with a distinctive floraThe forest on sandy soils is known as ldquowhite-sand forestrdquo and it is dominated by few species that only grow onthis particular soil type [Fine et al 2010 2004 2006 Pentildeuela-Mora 2014 Stropp et al 2011 Tuomisto et al 2003]Furthermore the white-sand forests have substantially lower species richness than the forest on clay soilseven though the stem density is higher (889 stems ha1 with diameter at breast height dge 10 cm) than in theclay soil forest (618 stems ha1)
22 Carbon Allocation
We estimated the three different aspects of carbon allocation at the ecosystem level [Litton et al 2007]biomass flux (NPP) and NPP partitioning We considered NPP partitioning as the fractional NPP allocated tothe aboveground and belowground plant parts (similar as in Aragatildeo et al [2009]Malhi et al [2011] andWolfet al [2011b]) This definition of partitioning differs slightly from that proposed by Litton et al [2007] whopropose partitioning as a proportion of total gross primary production For clarity we refer always as NPPpartitioning in this manuscript Methods for the estimation of these three different aspects of carbon allocationare presented in the following sections221 Biomass2211 Aboveground BiomassAboveground biomass (AGB) was calculated from stem diameter measurements of all trees and palms withd ge 10 cm every year (2004 2005 and 2006) During these annual censuses we also registered dead stemsas well as the ingrowth of the new individuals that grew during the interval between the censuses andreached d minimum (10 cm)
Allometric biomass equations are required to estimate aboveground biomass from measurements of treediameters and heights however for this study site there are no local biomass equations Although manyequations are available in the literature it is risky to select a single one and disregard many equally likelybiomass equations [Picard et al 2012] There is uncertainty associated with the selection of a biomassequation which should be estimated and reported [Picard et al 2012 Zapata-Cuartas et al 2012]
We developed a methodology to account for the uncertainty related to the fact that there are no localbiomass equations for either of the two forest types AGB was calculated as the median of biomass estimatesfrom different allometric models selected from the literature For this selection of equations we consideredseveral criteria such as differences in biomass allometry and growth patterns of palms and trees [Brown 1997Clark et al 2001a] palms contributed about 9 and 5 of the stems per hectare in the clay soil forest and
Journal of Geophysical Research Biogeosciences 1010022014JG002653
JIMEacuteNEZ ET AL copy2014 American Geophysical Union All Rights Reserved 3
white-sand forest respectively Therefore we estimated AGB separately for trees and palms We selected 28models 25 were from harvested trees and three from palms (Table S1 in the supporting information) Othercriteria used were biomass estimation from whole tree or palm differences between height-diameterrelationships by geographic regions [Feldpausch et al 2011 2012] dminimum of harvested individuals (at least1 cm) and the type of forest (old growth terra firme and dense forests) For palms we chose equations of thesame species or with similar architectural characteristics Consequently most of the equations selected weregenerated from Amazon forests although we included other models broadly used in the literature For themodels that include wood density we used the database of Chave et al [2006] and also for the white-sandforest we used wood density values directly measured in this forest [Agudelo 2005]
The advantage of this approach as opposed to selecting one single biomass equation for the tropical biomeis that we can minimize bias and account for the uncertainty associated with selecting a biomass equationWe report this uncertainty with our biomass and NPP estimations (see error propagation section) and thereforeaccount for possible differences in allometric patterns at the local level2212 Belowground BiomassBelowground biomass (BGB) was defined as BGB= BGBfineroot + BGBcoarseroot where BGBfineroot is fine-rootbiomass and BGBcoarseroot the coarse-root biomass Although the importance of belowground carbon stocksin tropical forests is well recognized [Cairns et al 1997 Jackson et al 1996] allometric models to estimateBGBcoarseroot are rare Similar as for AGB there are not local allometric models to estimate BGBcoarseroot for oursites notwithstanding we found five allometric equations for trees and one for palms harvested from tropicalforests (Table S1) We therefore followed the same procedure used to calculate AGB using all availablemodels for BGBcoarseroot and taken the median of the predictions
The methodology to estimate BGBfineroot (root diameterle 2mm) is described in Jimeacutenez et al [2009] who used thesequential root coring method [Vogt et al 1998] to estimate fine-root mass at 02m depth of soil samples takenevery three to fourmonths fromSeptember 2004 toDecember 2006We used the average fine-rootmass observedduring the entire monitoring period to calculate stand-level fine-root biomass [Jimeacutenez et al 2009 Table 3]222 Net Primary ProductionIn practice the net primary production that can be estimated is defined as the total new organic matterproduced during a specified interval [Clark et al 2001a] ie the sum of the net increments in aboveground andbelowground live biomass plus losses We estimated net primary production as NPP=ANPPtotal + BNPProot where ANPPtotal is the total aboveground and BNPProot the belowground net primary production in roots[Clark et al 2001a Litton et al 2007] We assumed dry organic matter to be 50 carbon Other components ofNPP (see section 31) such as herbivory emissions of volatile organic compounds and root exudates werenot quantified here however their contribution to total NPP is marginal [Clark et al 2001b Sierra et al 2007]and of minor importance for comparisons among forest types2221 Total Aboveground Net Primary ProductionTotal aboveground net primary production (ANPPtotal) was estimated as ANPPtotal =ΔAGB+FLF where ΔAGB isthe aboveground biomass increment defined as the net increase in aboveground biomass as calculated fromthe allometric equations FLF is defined as fine litterfall or new foliage ie small twig and flowerfruit productionrate (assumed equal to the ldquosoft litterfallrdquo) [Clark et al 2001a] We estimated FLF using litter traps (25 traps perhectare with dimensions of 1m times 05m 1mmmesh with a concavity to allow enough material to accumulateand 1m above the forest floor) We collected fine litterfall (leaves flowers fruits twigs with diameterle 2 cmand indeterminatematerial) every 15days fromOctober 2005 until December 2006 The organicmatter collectedwas dried for 48h at 70degC and then weighed We calculated ΔAGB as the increments of surviving trees orpalms (difference between its estimated biomass at the beginning of the year and end of the year) plusincrements of ingrowth trees calculated as the difference between its estimated biomass at the end of the yearand the minimum d measured (10 cm) [Clark et al 2001a]
For the purpose of our analysis we assumed FLF to be indicative of NPP allocation to foliage assuming thatfoliage biomass is in steady state and foliage production is balanced by losses in the form of fine litterfallAccordingly we assumed ΔAGB as indicative of NPP partitioning to aboveground woody components2222 Belowground Net Primary ProductionWe estimated belowground net primary production as BNPProot = BNPPfineroot + BNPPcoarseroot whereBNPPfineroot is the new fine-root production and BNPPcoarseroot belowground coarse-wood production In
Journal of Geophysical Research Biogeosciences 1010022014JG002653
JIMEacuteNEZ ET AL copy2014 American Geophysical Union All Rights Reserved 4
some studies BNPPcoarseroot is assumed as 21plusmn3 of aboveground coarse-wood productivity [Aragatildeo et al2009 Malhi et al 2009] We estimate BNPPcoarseroot as the sum of the increments in coarse-root biomass ofsurviving trees or palms plus increments of ingrowthmdashsimilar as for ΔAGB due to our use of coarse-rootbiomass equations Ingrowth cores at 020m depth were used to estimate BNPPfineroot [Jimeacutenez et al 2009]being established 3 times in February and September of 2004 and in February of 2006 The ingrowth cores wereleft in situ for periods of 5ndash7 months for the first collection and subsequent samplings were done at 2ndash4months intervals In our analysis we calculated BNPPfineroot as the mean fine-root production of the threemeasurement intervals [Jimeacutenez et al 2009 Table 2]
23 Leaf Area Index
Leaf area index (LAI) was also measured during the same regular field trips using hemispherical photographs(26 points ha1) using a digital camera (Nikon Cool Pix 990) and a fish-eye converter (Nikon FC-E8) Imageswere recorded under overcast conditions with the camera placed on a tripod 1m above the ground followingthe same protocol (httpwwwrainfororgenmanuals) Photographs were analyzed using the HemiviewCanopy Analysis Software (Version 21 SR1 Delta-T Devices Ltd UK) following the recommendations of Keelingand Phillips [2007] for calculating LAI
24 Error Propagation and Statistical Analysis
We estimated uncertainties in estimated biomass and fluxes through error propagation Our measure ofuncertainty includes the uncertainty associated with the biomass estimates from different allometric models(allometric uncertainty Table S1) the spatial variation within the plots [Chave et al 2001] and the interannualvariability for the 3 yearsmeasured To estimate allometric uncertainty we determined AGB and BGBcoarseroot foreach allometric model calculating standard errors at the individual tree level Then we aggregated individualtrees by subunits (20m times 20m) to calculate biomass within these subplots to obtain spatial variabilityFor each forest we then calculated the mean biomass for all years propagating uncertainties measuredas standard errors at each step These standard errors were calculated as the square of the medianabsolute deviation divided by the square of sample size depending of the situation (n = 25 subunits per haor n= 3 years per forest) Errors were propagated as the sum or average of the squared standard errorsdepending on the operations performed on the means For statistical comparisons we used a Z or t test tocompare means depending on the size or types of samples compared We merged the two plots on claysoils (AGP-01 and AGP-02) in all analyses All calculations were performed in the R environment forstatistical computing [R Development Core Team 2012]
3 Results31 Biomass
We found differences between the two forests in terms of both their aboveground and belowgroundbiomass as well as in their total biomass (Table 1) Specifically AGB was twice as large for the clay soil forest(1202 plusmn 145Mg C ha1) than for the white-sand forest (601 plusmn 75Mg C ha1) BGB was also higher in theclay soil forest than in the white-sand forest estimated at 245 plusmn 42 and 164 plusmn 21Mg C ha1 respectivelyIn contrast BGBfineroot in the first 20 cm was 3 times larger in the white-sand forest than in the clay soil forest(55 plusmn 02 versus 17 plusmn 01Mg C ha1 respectively)
Overall total biomass was twice as large for the clay soil forest (1446plusmn150Mg C ha1) than for the white-sandforest (765plusmn 77Mg C ha1) Trees contributed 94 and 85 of total biomass in the clay soil forest and in thewhite-sand forest respectively Tree aboveground biomass alone accounted for 81 of total biomass in the claysoil forest and 73 in the white-sand forest Palms accounted for 5 and 8 of total biomass in the clay soil forestand the white-sand forest respectively Nevertheless uncertainties for palm biomass estimates were highsuggesting that palms should be considered an important component of total biomass that requires specificand more accurate methods for its estimation Fine roots contributed 1 and 7 to the total biomass for the claysoil forest and the white-sand forest respectively
32 Net Primary Production
We found differences in ANPPtotal and its components with FLF larger in the clay soil forest than in the white-sand forest (38 plusmn 03 versus 25 plusmn 03Mg C ha1 yr1 Table 2) For the clay soil forest ΔAGB was 3 times larger
Journal of Geophysical Research Biogeosciences 1010022014JG002653
JIMEacuteNEZ ET AL copy2014 American Geophysical Union All Rights Reserved 5
than for the white-sand forest (30 plusmn 04 versus 07 plusmn 01Mg C ha1 yr1) and consequently ANPPtotal wastwice as large for the clay soil forest than for the white-sand forest (67 plusmn 05 versus 32 plusmn 03Mg C ha1 yr1Table 2) For both forests fine litterfall production was the major contributor to total aboveground netprimary production accounting for 60 of ANPPtotal for the clay soil forest and 80 for the white-sand forest
We found differences in fine- and coarse-root production rates between forests (Table 2) with BNPPfineroot for thewhite-sand forest being twice that of the clay soil forest (30plusmn05 versus 15plusmn02Mg C ha1 yr1 [Jimeacutenez et al2009]) As a consequence BNPProot was higher in the white-sand forest than in the clay soil forest (31plusmn05 versus21plusmn02Mg C ha1 yr1 Table 2) Fine-root production was the major contributor to belowground net primaryproduction accounting for 96 of BNPProot for the white-sand forest and 70 of BNPProot for the clay soil forest
When adding the individual terms together we found that NPP was 29 larger in the clay soil forest(89 plusmn 05Mg C ha1 yr1) than in the white-sand forest (63 plusmn 06Mg C ha1 yr1) Aboveground andbelowground production varied largely between forests such that ANPPtotal in the white-sand forest wasless than half that in the clay soil forest while BNPProot of white-sand forest was higher than in the claysoil forest In both forests the productivity of fine material components (viz FLF and BNPPfineroot) waslarger than woody components (viz ΔAGB and BNPPcoarseroot) Additionally we found differences betweenmost aboveground and belowground NPP subcomponents within the forests
33 Net Primary Production Partitioning
The two forests exhibited different NPP partitioning between aboveground and belowground components(Table 2) For the clay soil forest they were 08 and 02 respectively while for the white-sand forest these ratioswere similar at approximately 05
Table 2 Aboveground and Belowground Subcomponents of Net Primary Productivity (NPP Mg C ha1 yr1)Partitioning With Respect to NPP (p Unitless) and Leaf Area Index (L m2 m2) in a Clay Soil Forest and a White-SandForest in the Northwestern Amazon Between the Years 2004 and 2006
Clay Soil Forest White-Sand Forest
Medianplusmn se p Medianplusmn se p
Fine litterfall (FLF) 375plusmn 030 06 042 248 plusmn 025 08 039Aboveground biomass increment (ΔAGB) 299plusmn 036 04 034 073 plusmn 008 02 012ANPPtotal 674 plusmn 047 10 076 321 plusmn 026 10 051Fine-root production (BNPPfineroot) 153 plusmn 016 07 017 298 plusmn 054 096 047Coarse root production (BNPPcoarseroot) 058 plusmn 011 03 007 013 plusmn 002 004 002Belowground NPP (BNPPtotal) 211 plusmn 019 10 024 311 plusmn 054 10 049NPP 885plusmn 051 631 plusmn 060L 445plusmn 006 425 plusmn 007
Table 1 Aboveground and Belowground Biomass (Dry Weight Mg C ha1) of Trees and Palms in a Clay Soil and aWhite-Sand Forest in the Northwestern Amazon (the Average of the Biomass Medians for 2004 2005 and 2006 Years plusmn StandardError) and Their Fraction to Total Biomass (f )
Clay Soil Forest White-Sand Forest
Component Growth Form Medianplusmn se f Medianplusmn se f
Aboveground biomass Trees 11493plusmn 1429 079 5570plusmn 707 073Palms 521 plusmn 211 004 444 plusmn 235 006Total 12015plusmn 1445 083 6014plusmn 745 079
Belowground biomass Treesa 2086plusmn 405 014 936 plusmn 176 012Palmsa 195 plusmn 100 001 155 plusmn 107 002
Fine-root mass 167 plusmn 009 001 547 plusmn 017 007Total 2448plusmn 417 017 1638plusmn 207 021
Biomass per growth formb Trees 13579plusmn 1486 094 6506plusmn 729 085Palms 716 plusmn 233 005 599 plusmn 258 008
Total biomass 14462plusmn 1504 1 7652plusmn 773 1
aCoarse root biomassbAboveground plus belowground biomass
Journal of Geophysical Research Biogeosciences 1010022014JG002653
JIMEacuteNEZ ET AL copy2014 American Geophysical Union All Rights Reserved 6
The partitioning of NPP to foliage was similar between forests (FLFNPP~04) but with the partitioning toaboveground biomass increment differing ΔAGB NPP being much higher in the clay soil forest (~03) than inthe white-sand forest (~01) However partitioning to fine-root production showed the opposite pattern beingmuch higher in the white-sand forest (BNPPfinerootNPP ~05) than in the clay soil forest (BNPPfinerootNPP ~02)This same pattern applies to total belowground net primary production with partitioning to belowgroundcomponents higher in thewhite-sand forest (BNPProotNPP~05) than in the clay soil forest (BNPProotNPP~02)
34 Leaf Area Index
Leaf area index (LAI) was slightly higher for the clay soil forest with 45 plusmn 01m2m2 than for the white-sandforest with 43 plusmn 01m2m2 (Table 2) and presented significant differences between forests (P= 0045t= 1697 df = 726)
4 Discussion
Analyses of forest ecosystems at local scales provide the opportunity to tease apart edaphic controls versusclimatic controls on the allocation of carbon The forests studied here are under the same climateconditions yet the different measures of carbon allocation we found varied as much as what has beenobserved across all sites studied to date within the Amazon Basin [Aragatildeo et al 2009 Chave et al 2010Malhi et al 2004 Quesada et al 2012] Given that our study sites did not present variation in climaticfactors (total precipitation and its seasonal distribution) and that carbon allocation was assessed with thesame methods and over the same time interval (2004ndash2006) the results suggest that edaphic factors likelyplay a strong role in determining NPP and allocation patterns These differences were observed for thethree aspects of carbon allocation biomass net primary production and NPP partitioning These arediscussed in detail in the next sections
41 Differences in Aboveground and Belowground Biomass
The values of aboveground and belowground biomass of the white-sand forest studied here were among thelowest of the range of values reported for Amazon forests The white-sand forest AGB (60Mg C ha1) waswithin the lowest values previously reported for other forests on podzols [Klinge and Herrera 1983]Meanwhile the clay soil forest AGB was close to the average for Amazon forests (143 plusmn 38Mg C ha1)(average and standard deviation calculated from Brown et al [1995 1989] Carvalho et al [1998] Chamberset al [2001] Chave et al [2001] Fearnside et al [1993] Keller et al [2001] Laurance et al [1999] Londontildeo[2011] Malhi et al [2006] Nascimento and Laurance [2002] Nogueira et al [2008] Overman et al [1990] andSaldarriaga et al [1988]) The BGB range for tropical forests (average of 40plusmn28Mg C ha1) showed a largevariability in Amazon forests (compiled from Chave et al [2001] Fearnside et al [1993] Keller et al [2001] Klingeand Herrera [1978] Nogueira et al [2008] Saldarriaga et al [1988] and Salomatildeo et al [1996]) varying fromthe white-sand forest studied here (16Mg C ha1) to two forests on podzols a Tall and Low Caatinga in SanCarlos del Rio Negro with 98 and 168Mg C ha1 respectively The value of BGB in the clay soil forest studiedhere was below the basin-scale average
Comparing the two sites there were large differences in total biomass between the forests (50) with evenlarger differences in terms of aboveground and belowground components analyzed separately AGB wasalmost a factor of 2 higher in the clay soil forest than in the white-sand forest and conversely fine-root massin the white-sand forest was more than a factor of 3 higher than in the clay soil forest
Our results suggest that differences in soils are playing an important role in the observed differences ofaboveground and belowground biomass as well as in its subcomponents as expressed by the differencesin aboveground and fine-root biomass observed between the forests These differences also suggestthat conclusions on the factors that contribute to differences in biomass allocation may be very differentdepending on whether the aboveground and belowground components are analyzed independently orin combination
42 Differences in Aboveground and Belowground Net Primary Production
The two forests exhibited differences in net primary production (NPP) They differed more in their totalbiomass than in their NPP and differences in the belowground pools mainly contributed to these differencesin biomass and NPP
Journal of Geophysical Research Biogeosciences 1010022014JG002653
JIMEacuteNEZ ET AL copy2014 American Geophysical Union All Rights Reserved 7
Total aboveground and belowground net primary production were within the lowest values reported forAmazon forests [Klinge and Herrera 1978 1983] The white-sand forest had a lower NPP than the clay soilforest both below the average for Amazon forests (12 plusmn 3Mg C ha1) Although both forests had lower totalbiomass and net primary production in comparison to other Amazon forests there were differences betweenthem highlighting the enormous site-to-site variation within the Amazon Basin
Consistent with our initial hypothesis we found that biomass ratios differed considerably than NPP fluxes tosimilar pools Differences in total biomass between forests were larger (50) compared to the differences inNPP (clay soil forest 29 higher than the white-sand forest NPP) However differences in net primaryproduction between forests are much larger when the aboveground and belowground components areanalyzed separately For example abovegroundwood production and fine-root production exhibited the largerdifferences ΔAGB was a factor of 3 larger in the clay soil forest than in the white-sand forest and BNPPfinerootwas twice as high in the white-sand forest than in the clay soil forest Similar as for biomass the observeddifferences in aboveground and belowground NPP between the two forests suggest that conclusions on thefactors that contribute to differences in NPP may be very different when the aboveground and belowgroundparts are analyzed separately than in combination
One important topic in carbon allocation analyses is to evaluate whether component fluxes are related [Aragatildeoet al 2009 Girardin et al 2010] ie if the increase in the total amount of NPP involve a proportional increase inthe aboveground and belowground flux components For Amazon forests it has been reported that largervalues of NPP typically involve larger values of both aboveground and belowground NPP [Litton et al 2007]Conversely and in contrast with our initial hypothesis the forests studied here showed that NPP was higherin the clay soil forest than in the white-sand forest but above and belowground production were not bothlarger by the same proportions While aboveground NPP was proportionally larger to total NPP in the clay soilforest belowground NPP was not
43 Biomass Ratios and Net Primary Production Partitioning
Biomass ratios have been used widely for total biomass estimations in the Amazon Basin especially for rootbiomass Some indirect assessments of total biomass at large spatial scales use an average of root biomassdirectly measured in the field or an overall mean for forests (17 by Brown and Lugo [1992] 19 by Jacksonet al [1996] and 24 by Cairns et al [1997]) Cuevas [2001] showed that belowground contributions forterra firme forests can vary from 9 to 25 while Klinge and Herrera [1983] registered by direct measurements awide belowground biomass range between 18 and 59 for podzols in San Carlos de Rio Negro The belowgroundcontribution to total biomass for our sites was 15 and 21 for clay soil forest and white-sand forestrespectively Taken together our observations and reports from the literature suggest that biomass ratiosare not constant in Amazon forests and the use of basin-scale ratios to predict the contribution ofbelowground biomass to total biomass may lead to significant errors
Furthermore biomass ratios have been used to infer either flux or partitioning of NPP in forests Our resultsshow that despite the differences in the total amount of biomass and net primary production both are higher inthe clay soil forest than in the white-sand forest the differences between them in the fractional distribution ofbiomass and the NPP partitioning of aboveground and belowground components were certainly markedThese results confirm those found by Litton et al [2007] who revealed that biomass was poorly related to carbonflux and to partitioning of photosynthetically derived carbon and should not be used to infer either LikewiseWolf et al [2011b] showed that stand biomass is weakly related to NPP partitioning and other factors thatimpact NPP such as soils or climate may have a stronger influence on partitioning than does biomass per se
Our estimations showed that the NPP fractions allocated to short-lived structures (foliage and fine roots)were the main contributors to aboveground and belowground components Consistent with our initialhypothesis we found that NPP partitioning to foliage was rather similar for both forests while NPPpartitioning to fine-roots and aboveground biomass was largely different (Table 2) These results are alsoconsistent with the idea that allocation to foliage is relatively constant across different forests but whatvaries most among sites is how the remaining NPP is allocated between wood and fine-root production[Wolf et al 2011b] This trade-off in NPP partitioning between wood and belowground production(wood to fine-roots) may be associated with differences in soil resources the main abiotic factor thatstrongly differs between our sites
Journal of Geophysical Research Biogeosciences 1010022014JG002653
JIMEacuteNEZ ET AL copy2014 American Geophysical Union All Rights Reserved 8
Although litterfall production and LAI have been also proposed as a good proxy for above and total NPP[Litton et al 2007Malhi et al 2004 2011Wolf et al 2011b] FLF and LAI in the two forests studied seem to beless sensitive indicators of differences in the total NPP and its components between them Differences infine-root production suggest that by measuring ANPPtotal alone total NPP can be underestimated by 20 and50 in the clay soil forest and the white-sand forest respectively
5 Conclusions
We found important edaphic controls on carbon allocation of two Amazon forests under similar climaticconditions on contrasting soils In particular we found
1 Biomass ratios between aboveground and belowground components differed from the partitioning oftotal NPP to aboveground and belowground components In general biomass ratios for the componentsdid not reflect the fraction of NPP allocated to them
2 Component fluxes in these forests were not related High values of total NPP in the clay soil forest did notcorrespond to high values for all NPP components Differences in the soil environment (nutrients andwater availability) are probably responsible for the large values of belowground NPP observed in thewhite-sand forest
3 Our results of aboveground biomass increments support the hypothesis of a possible trade-off betweencarbon allocation to fine roots versus aboveground wood growth as opposed to the most commonlyassumed trade-off between total aboveground and belowground production
4 The leaf area index showed slight differences between the two forests that could be indicative of differ-ences in total NPP but did not reflect differences in carbon allocation components Furthermoreour analysis may have important implications for ecosystem modeling In particular (1) land surfacemodels that require parameters on NPP partitioning but only use data on biomass fractions mayincur in important errors for predicting total NPP and component fluxes and (2) models in which NPPis proportional to LAI may miss important differences in internal ecosystem responses caused byedaphic factors
ReferencesAgudelo J (2005) Densidad de Madera en Cuatro Tipos de Bosque Localizados Sobre Suelos Contrastantes en la Regioacuten de Leticia Amazonia
Colombiana Universidad de los Andes Bogotaacute ColombiaAragatildeo L E O C et al (2009) Above- and below-ground net primary productivity across ten Amazonian forests on contrasting soils
Biogeosciences 6(12) 2759ndash2778Bloom A J F S Chapin III and H A Mooney (1985) Resource limitation in plantsmdashAn economic analogy Annu Rev Ecol Syst 16 363ndash392
doi1023072097053Brown I F L A Martinelli W W Thomas M Z Moreira C A Cid Ferreira and R A Victoria (1995) Uncertainty in the biomass of Amazonian
forests An example from Rondocircnia Brazil For Ecol Manage 75(1ndash3) 175ndash189 doi1010160378-1127(94)03512-UBrown S (1997) Estimating biomass and biomass change of tropical forests A primer in FAO Forestry Paper 55 pp Forest Resources
Assessment Publication RomeBrown S and A E Lugo (1992) Aboveground biomass estimates for tropical moist forests of the Brazilian Amazon Interciencia 17(1)
8ndash18Brown S A J R Gillespie and A E Lugo (1989) Biomass estimation methods for tropical forests with applications to forest inventory data
For Sci 35(4) 881ndash902Cairns M A S Brown E H Helmer and G A Baumgardner (1997) Root biomass allocation in the worldrsquos upland forests Oecologia 111(1)
1ndash11 doi101007s004420050201Cannell M G R and R C Dewar (1994) Carbon allocation in trees A review of concepts for modelling in Advances in Ecological Research
edited by M Begon and A H Fitter pp 59ndash104 Academic Press San Diego doi101016S0065-2504(08)60213-5Carvalho J A N Higuchi T M Arauacutejo and J C Santos (1998) Combustion completeness in a rainforest clearing experiment in Manaus
Brazil J Geophys Res 103 13195ndash13199 doi10102998JD00172Chambers J Q J D Santos R J Ribeiro and N Higuchi (2001) Tree damage allometric relationships and above-ground net primary
production in central Amazon forest For Ecol Manage 152(1ndash3) 73ndash84 doi101016S0378-1127(00)00591-0Chapin F S P A Matso and P M Vitousek (2011) Principles of Terrestrial Ecosystem Ecology 2nd ed Springer New YorkChave J B Rieacutera and M-A Dubois (2001) Estimation of Biomass in a neotropical forest of French Guiana Spatial and temporal variability
J Trop Ecol 17(1) 79ndash96Chave J H C Muller-Landau T R Baker T A Easdale H T Steege and C O Webb (2006) Regional and phylogenetic variation of wood
density across 2456 neotropical tree species Ecol Appl 16(6) 2356ndash2367Chave J et al (2010) Regional and seasonal patterns of litterfall in tropical South America Biogeosciences 7(1) 43ndash55 doi105194bg-7-43-2010Clark D A S Brown D W Kicklighter J Q Chambers J R Thomlinson and J Ni (2001a) Measuring net primary production in forests
Concepts and field methods Ecol Appl 11(2) 356ndash370 doi1018901051-0761(2001)011[0356mnppif]20co2Clark D A S Brown D W Kicklighter J Q Chambers J R Thomlinson J Ni and E A Holland (2001b) Net primary production in tropical
forests An evaluation and synthesis of existing field data Ecol Appl 11(2) 371ndash384
Journal of Geophysical Research Biogeosciences 1010022014JG002653
JIMEacuteNEZ ET AL copy2014 American Geophysical Union All Rights Reserved 9
AcknowledgmentsFinancial support for field work atAmacayacu National Natural Park wasprovided by several grants to RAINFORnotably from Max Planck Institute forBiogeochemistry (census of 2004 in AGPplots) from the European Union FP5PAN-AMAZONIA project (scholarships toEMJ and DN supporting fieldwork2005ndash2006) NERC (grant to OP fundingcensus in 2005 and 2006) and supportfrom the Gordon and Betty MooreFoundation (soil sampling at Zafire byCAQ) and the field work at ZafireBiological Station was supported by theResearch Group in Ecology of TropicalTerrestrial Ecosystems of the NationalUniversity of Colombia EMJ received afellowship from the Max Planck Institutefor Biogeochemistry and the GermanAcademic Exchange ServicemdashDAADmdashfor data analysis and writing Manypeople contributed to fieldwork anddata collection especially the teamfrom the Zafire Biological Station (IvanNintildeo Angel Pijachi Edilberto RiveraArcesio Pijachi and Eufrasia Kuyuedo)the Amacayacu National Natural Park(Alex Alfonso and Jaime Galvin) theIndigenous Communities ldquoComunidadde Palmerasrdquo (Eugenio Saacutenchez) andldquoComunidad de San Martiacutenrdquo (BenicioAmado and Simoacuten Amado) andHeriberto David (Herbarium ofUniversity of Antioquia)
Cuevas E (2001) Soil versus biological controls on nutrient cycling in Terra Firme Forests in The Biogeochemistry of the Amazon Basin editedby M E McClain R L Victoria and J E Richey Oxford Univ Press New York
Davidson E A et al (2012) The Amazon basin in transition Nature 481(7381) 321ndash328Dybzinski R C Farrior A Wolf P B Reich and S W Pacala (2011) Evolutionarily stable strategy carbon allocation to foliage wood and fine
roots in trees competing for light and nitrogen An analytically tractable individual-based model and quantitative comparisons to dataAm Nat 177(2) 153ndash166 doi101086657992
Fearnside P M N Leal and F M Fernandes (1993) Rainforest burning and the global carbon budget Biomass combustion efficiency andcharcoal formation in the Brazilian Amazon J Geophys Res 98 16733ndash16743 doi10102993JD01140
Feldpausch T R et al (2011) Height-diameter allometry of tropical forest trees Biogeosciences 8(5) 1081ndash1106 doi105194bg-8-1081-2011Feldpausch T R et al (2012) Tree height integrated into pantropical forest biomass estimates Biogeosciences 9(8) 3381ndash3403 doi105194
bg-9-3381-2012Fine P V A I Mesones and P D Coley (2004) Herbivores promote habitat specialization by trees in Amazonian forests Science 305(5684)
663ndash665 doi101126science1098982Fine P V A Z J Miller I Mesones S Irazuzta H M Appel M H H Stevens I Saumlaumlksjaumlrvi J C Schultz and P D Coley (2006) The growth-
defense trade-off and habitat specialization by plants in Amazonian forests Ecology 87(sp7) 150ndash162 doi1018900012-9658(2006)87[150tgtahs]20co2
Fine P V A R Garciacutea-Villacorta N C A Pitman I Mesones and S W Kembel (2010) A floristic study of the white-sand forests of Peru 1 AnnMo Bot Gard 97(3) 283ndash305 doi1034172008068
Girardin C A J et al (2010) Net primary productivity allocation and cycling of carbon along a tropical forest elevational transect in thePeruvian Andes Global Change Biol 16(12) 3176ndash3192 doi101111j1365-2486201002235x
Jackson R B J Canadell J R Ehleringer H A Mooney O E Sala and E D Schulze (1996) A global analysis of root distributions for terrestrialbiomes Oecologia 108(3) 389ndash411 doi101007BF00333714
Jimeacutenez E M F H Moreno M C Pentildeuela S Patintildeo and J Lloyd (2009) Fine root dynamics for forests on contrasting soils in the ColombianAmazon Biogeosciences 6 2809ndash2827
Keeling H C and O L Phillips (2007) The global relationship between forest productivity and biomass Global Ecol Biogeogr 16(5) 618ndash631doi101111j1466-8238200700314x
Keller M M Palace and G Hurtt (2001) Biomass estimation in the Tapajos National Forest Brazil Examination of sampling and allometricuncertainties For Ecol Manage 154(3) 371ndash382 doi101016S0378-1127(01)00509-6
Klinge H and R Herrera (1978) Biomass studies in Amazon Caatinga forest in Southern Venezuela 1 Standing crop of composite root massin selected stands Tropical Ecology 19 93ndash110
Klinge H and R Herrera (1983) Phytomass structure of natural plant communities on spodosols in southern Venezuela The tall AmazonCaatinga forest Vegetatio 53(2) 65ndash84 doi101007bf00043025
Laurance W F P M Fearnside S G Laurance P Delamonica T E Lovejoy J M Rankin-de Merona J Q Chambers and C Gascon (1999)Relationship between soils and Amazon forest biomass A landscape-scale study For Ecol Manage 118(1ndash3) 127ndash138 doi101016S0378-1127(98)00494-0
Litton C M J W Raich and M G Ryan (2007) Carbon allocation in forest ecosystems Global Change Biol 13(10) 2089ndash2109 doi101111j1365-2486200701420x
Londontildeo A C (2011) Flora and Dynamics of an Upland and a Floodplain Forest in Pentildea Roja Colombian Amazonia Universiteit vanAmsterdam Amsterdam
Malhi Y et al (2004) The above-ground coarse wood productivity of 104 Neotropical forest plots Global Change Biol 10(5) 563ndash591doi101111j1529-8817200300778x
Malhi Y et al (2006) The regional variation of aboveground live biomass in old-growth Amazonian forests Global Change Biol 12(7)1107ndash1138 doi101111j1365-2486200601120x
Malhi Y et al (2009) Comprehensive assessment of carbon productivity allocation and storage in three Amazonian forests Global ChangeBiol 15(5) 1255ndash1274 doi101111j1365-2486200801780x
Malhi Y C Doughty and D Galbraith (2011) The allocation of ecosystem net primary productivity in tropical forests Philos Trans R SocSer B 366(1582) 3225ndash3245 doi101098rstb20110062
Medlyn B E (2011) Comment on ldquoDrought-Induced Reduction in Global Terrestrial Net Primary Production from 2000 Through 2009rdquoScience 333(6046) 1093 doi101126science1199544
Nascimento H E M and W F Laurance (2002) Total aboveground biomass in central Amazonian rainforests A landscape-scale study ForEcol Manage 168(1ndash3) 311ndash321 doi101016S0378-1127(01)00749-6
Nemani R R C D Keeling H Hashimoto W M Jolly S C Piper C J Tucker R B Myneni and S W Running (2003) Climate-driven increasesin global terrestrial net primary production from 1982 to 1999 Science 300(5625) 1560ndash1563 doi101126science1082750
Nogueira E M P M Fearnside B W Nelson R I Barbosa and E W H Keizer (2008) Estimates of forest biomass in the Brazilian AmazonNew allometric equations and adjustments to biomass from wood-volume inventories For Ecol Manage 256(11) 1853ndash1867doi101016jforeco200807022
Overman J P M J G Saldarriaga and J Duivenvoorden (1990) Estimacioacuten de la biomasa aeacuterea en el bosque del medio Caquetaacute ColombiaColombia Amazoacutenica 4 135ndash274
Pentildeuela-Mora M C (2014) Understanding Colombian Amazonian white sand forests PhD dissertation Institute of Environmental BiologyUtrecht Univ Utrecht Netherlands
Picard N M Henry F Mortier C Trotta and L Saint-Andre (2012) Using bayesian model averaging to predict tree aboveground biomass intropical moist forests For Sci 58(1) 15ndash23
Quesada C A et al (2010) Variations in chemical and physical properties of Amazon forest soils in relation to their genesis Biogeosciences7(5) 1515ndash1541 doi105194bg-7-1515-2010
Quesada C A J Lloyd L O Anderson N M Fyllas M Schwarz and C I Czimczik (2011) Soils of Amazonia with particular reference to theRAINFOR sites Biogeosciences 8(6) 1415ndash1440 doi105194bg-8-1415-2011
Quesada C A et al (2012) Basin-wide variations in Amazon forest structure and function are mediated by both soils and climateBiogeosciences 9(6) 2203ndash2246 doi105194bg-9-2203-2012
R Development Core Team (2012) R A Language and Environment for Statistical Computing edited R Foundation for Statistical ComputingVienna Austria
Saldarriaga J G D C West M L Tharp and C Uhl (1988) Long-term chronosequence of forest succession in the upper Rio Negro ofColombia and Venezuela J Ecol 76(4) 938ndash958
Journal of Geophysical Research Biogeosciences 1010022014JG002653
JIMEacuteNEZ ET AL copy2014 American Geophysical Union All Rights Reserved 10
Saleska S R K Didan A R Huete and H R da Rocha (2007) Amazon Forests green-up during 2005 drought Science 318(5850) 612doi101126science1146663
Salomatildeo R D C Nepstad and I C Vieira (1996) Biomassa e estrutura de florestas tropicais e o efeito estufa Ciencia Hoje 21 38ndash47Samanta A S Ganguly H Hashimoto S Devadiga E Vermote Y Knyazikhin R R Nemani and R B Myneni (2010) Amazon forests did not
green-up during the 2005 drought Geophys Res Lett 37 L05401 doi1010292009GL042154Samanta A M H Costa E L Nunes S A Vieira L Xu and R B Myneni (2011) Comment on ldquoDrought-Induced Reduction in Global Terrestrial
Net Primary Production from 2000 Through 2009rdquo Science 333(6046) 1093 doi101126science1199048Sierra C A M E Harmon F H Moreno S A Orrego and J I Del Valle (2007) Spatial and temporal variability of net ecosystem production in a
tropical forest Testing the hypothesis of a significant carbon sink Global Change Biol 13(4) 838ndash853 doi101111j1365-2486200701336xSierra C A E M Jimeacutenez B Reu M C Pentildeuela A Thuille and C A Quesada (2013) Low vertical transfer rates of carbon inferred from
radiocarbon analysis in an Amazon Podzol Biogeosciences 10(6) 3455ndash3464 doi105194bg-10-3455-2013Stropp J P V D Sleen P A Assunccedilatildeo A L D Silva and H T Steege (2011) Tree communities of white-sand and terra-firme forests of the
upper Rio Negro Acta Amazonica 41 521ndash544Tuomisto H K Ruokolainen and M Yli-Halla (2003) Dispersal environment and floristic variation of western Amazonian forests Science
299(5604) 241ndash244 doi101126science1078037Vogt K D Vogt and J Bloomfield (1998) Analysis of some direct and indirect methods for estimating root biomass and production of
forests at an ecosystem level Plant Soil 200(1) 71ndash89 doi101023A1004313515294Wolf A P Ciais V Bellassen N Delbart C B Field and J A Berry (2011a) Forest biomass allometry in global land surface models Global
Biogeochem Cycles 25 GB3015 doi1010292010GB003917Wolf A C B Field and J A Berry (2011b) Allometric growth and allocation in forests A perspective from FLUXNET Ecol Appl 21(5)
1546ndash1556 doi10189010-12011Zapata-Cuartas M C A Sierra and L Alleman (2012) Probability distribution of allometric coefficients and bayesian estimation of above-
ground tree biomass For Ecol Manage 277 173ndash179Zhao M and S W Running (2010) Drought-induced reduction in global terrestrial net primary production from 2000 through 2009 Science
329(5994) 940ndash943 doi101126science1192666
Journal of Geophysical Research Biogeosciences 1010022014JG002653
JIMEacuteNEZ ET AL copy2014 American Geophysical Union All Rights Reserved 11
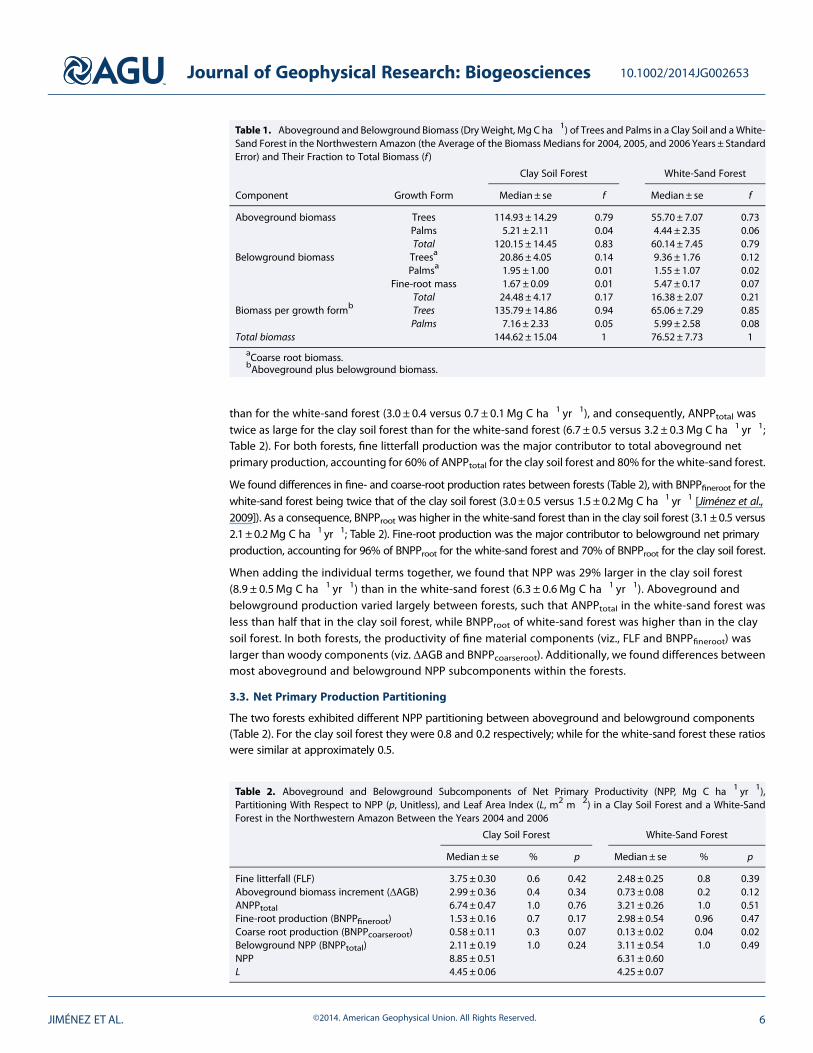
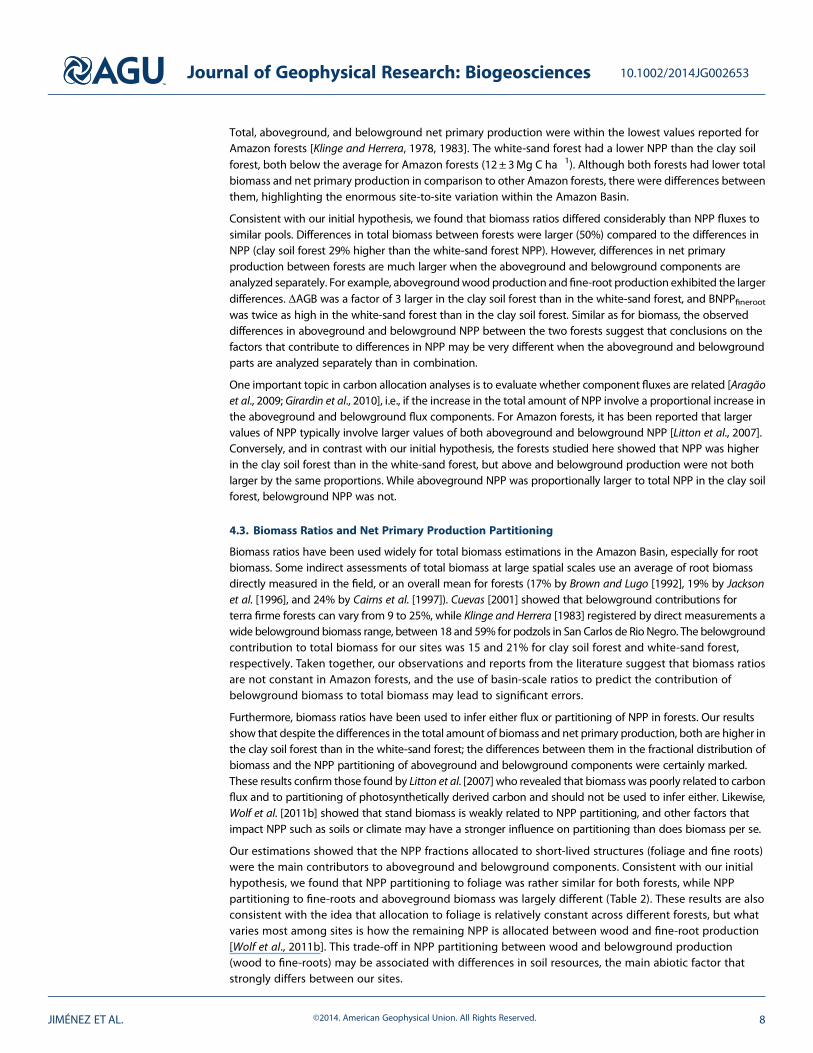