The Edaphic Factor and Patterns of Variation in Lasthenia californica (Asteraceae)
21
1576 American Journal of Botany 86(11): 1576–1596. 1999. THE EDAPHIC FACTOR AND PATTERNS OF VARIATION IN LASTHENIA CALIFORNICA (ASTERACEAE) 1 NISHANTA RAJAKARUNA AND BRUCE A. BOHM 2 Department of Botany, University of British Columbia, Vancouver, British Columbia, Canada V6T 1Z4 Transectional studies of Lasthenia californica in the Jasper Ridge Biological Preserve (Stanford University) have docu- mented the existence of two races (A and C) based upon flavonoid chemistry, achene morphology, allozymes, and flowering time differences. The two races coexist on a serpentine outcrop and have maintained a sharply defined pattern of distribution for a period of at least 15 yr. The present study has revealed significant differences in the physical and chemical features of the soils harboring the two races. Soils at the lower ends of the transects, where race A plants grow, have higher pH, cation exchange capacity, relative water content, total ionic strength, percentage clay, and sodium and magnesium concen- trations than do soils harboring race C plants at the upper ends of the transects. Soils supporting race C plants have higher calcium, potassium, and nickel concentrations and higher calcium:magnesium ratios. Plant tissue concentrations of ions were also significantly different in the two races. Race A plants accumulated sodium to concentrations three times those observed with race C plants. Plants from an additional 22 sites gave very similar results. Greenhouse studies indicated that the two races from Jasper Ridge show differential responses to ridge-top and ridge-bottom soils. Race A achenes germinated, grew to maturity, and set seed about equally in the two soils. Race C achenes germinated in both types of soils but showed significantly poorer growth and absolutely no flowering when found in the soils of race A plants. Differential responses to edaphic conditions on the ridge may contribute to the pattern of distribution observed over the years. It is suggested that race A plants are more tolerant of edaphic stress than race C plants and that physiological specialization may contribute to the present distribution of the two races throughout the species’ range. It is not yet possible to state which is the more significant factor in driving this specialization, the chemistry of the soil or its physical characteristics, or whether there is interaction between the two. This is the first study to present evidence for soil/plant variation within a serpentine site. The linking of sodium levels to racial differentiation within the serpentine habitat is also a new discovery. Key words: Asteraceae; edaphic races; Lasthenia; serpentine; sodium; soil chemistry; trace metals; water stress. Within a given climatic region, growth of vegetation is mainly determined by the character of the parent material, whether limestone, igneous rock, sand de- posit or clayey shale. Hans Jenny (1941) Plants with unusual or localized distribution patterns have always fascinated botanists. The study of such plants has provided much valuable information on the history and evolution of certain regions and their floras. Further, these systems often provide excellent opportu- nities to investigate aspects of evolutionary ecology and population dynamics characterizing these plant popula- tions. The study described in this paper involves an ex- 1 Manuscript received 15 October 1998; revision accepted 27 May 1999. The authors thank the Natural Sciences and Engineering Research Council (Canada) for support of this study; the administrative staff of the Jasper Ridge Biological Preserve of Stanford University for allow- ing us to collect plant and soil samples and for providing accommo- dations and laboratory facilities during our extended studies in the Pre- serve; Ji Yong Yang, Lesley R. Bohm, Binney Girdler, and NonaChiar- iello for assistance in the field; Anh-Toan Tran for technical assistance with the ICP and AA analyses; Tony Glass and Jeannette Whitton for useful comments and review of the manuscript; Les Lavkulich and Tim Ballard for providing much appreciated guidance and access to the soil chemistry laboratory facilities; and Gary Bradfield and Jack Maze for advice on statistical analyses. This work constitutes part of the Master of Science dissertation of the first-named author who thanks the Uni- versity of British Columbia for the award of a University Graduate Fellowship. 2 Author for correspondence (e-mail: [email protected]). amination of such a system: the influence of the edaphic factor on Lasthenia californica DC. ex Lindley (Astera- ceae: Helenieae) (Karis and Ryding, 1994) throughout much of its range in western North America. Lasthenia californica is the most widely distributed of the 17 species that comprise this mostly Californian ge- nus (one species, L. kunthii, occurs in Chile). This oblig- atory outcrossing, spring annual ranges from south-cen- tral Oregon throughout California, from the foothills of the Sierra Nevada to the coast, east into Arizona, and in northern Baja California. The distribution of the species may be limited by its preference for a Mediterranean-type climate, characterized by mild, wet winters and long, hot, dry summers. Lasthenia californica shows a high degree of morphological, cytological (Ornduff, 1966), and bio- chemical diversity (Bohm, Saleh, and Ornduff, 1974; Bohm et al., 1989; Desrochers and Bohm, 1993, 1995). Ornduff (1966) considered it to be the most variable tax- on in the genus. The species has wide ecological tolerance: it can be found on coastal bluffs, in open grasslands, oak wood- lands, alkali flats, chaparral, pastures, along roadsides, in desert habitats, and on serpentine outcrops. It seems rea- sonable to suggest that the serpentine outcrops may pro- vide one of the more extreme growth conditions for this species. However, in these environments, L. californica achieves dominance and is often restricted to the serpen- tine side of the serpentine and nonserpentine boundary. Thus, L. californica fits Kruckeberg’s third category of plant distributions on serpentine soils, species that are widespread on serpentine and nonserpentine soils but
Transcript of The Edaphic Factor and Patterns of Variation in Lasthenia californica (Asteraceae)

1576
American Journal of Botany 86(11): 1576–1596. 1999.
THE EDAPHIC FACTOR AND PATTERNS OF VARIATION
IN LASTHENIA CALIFORNICA (ASTERACEAE)1
NISHANTA RAJAKARUNA AND BRUCE A. BOHM2
Department of Botany, University of British Columbia, Vancouver, British Columbia, Canada V6T 1Z4
Transectional studies of Lasthenia californica in the Jasper Ridge Biological Preserve (Stanford University) have docu-mented the existence of two races (A and C) based upon flavonoid chemistry, achene morphology, allozymes, and floweringtime differences. The two races coexist on a serpentine outcrop and have maintained a sharply defined pattern of distributionfor a period of at least 15 yr. The present study has revealed significant differences in the physical and chemical featuresof the soils harboring the two races. Soils at the lower ends of the transects, where race A plants grow, have higher pH,cation exchange capacity, relative water content, total ionic strength, percentage clay, and sodium and magnesium concen-trations than do soils harboring race C plants at the upper ends of the transects. Soils supporting race C plants have highercalcium, potassium, and nickel concentrations and higher calcium:magnesium ratios. Plant tissue concentrations of ions werealso significantly different in the two races. Race A plants accumulated sodium to concentrations three times those observedwith race C plants. Plants from an additional 22 sites gave very similar results. Greenhouse studies indicated that the tworaces from Jasper Ridge show differential responses to ridge-top and ridge-bottom soils. Race A achenes germinated, grewto maturity, and set seed about equally in the two soils. Race C achenes germinated in both types of soils but showedsignificantly poorer growth and absolutely no flowering when found in the soils of race A plants. Differential responses toedaphic conditions on the ridge may contribute to the pattern of distribution observed over the years. It is suggested thatrace A plants are more tolerant of edaphic stress than race C plants and that physiological specialization may contribute tothe present distribution of the two races throughout the species’ range. It is not yet possible to state which is the moresignificant factor in driving this specialization, the chemistry of the soil or its physical characteristics, or whether there isinteraction between the two. This is the first study to present evidence for soil/plant variation within a serpentine site. Thelinking of sodium levels to racial differentiation within the serpentine habitat is also a new discovery.
Key words: Asteraceae; edaphic races; Lasthenia; serpentine; sodium; soil chemistry; trace metals; water stress.
Within a given climatic region, growth of vegetationis mainly determined by the character of the parentmaterial, whether limestone, igneous rock, sand de-posit or clayey shale.
Hans Jenny (1941)
Plants with unusual or localized distribution patternshave always fascinated botanists. The study of suchplants has provided much valuable information on thehistory and evolution of certain regions and their floras.Further, these systems often provide excellent opportu-nities to investigate aspects of evolutionary ecology andpopulation dynamics characterizing these plant popula-tions. The study described in this paper involves an ex-
1 Manuscript received 15 October 1998; revision accepted 27 May1999.
The authors thank the Natural Sciences and Engineering ResearchCouncil (Canada) for support of this study; the administrative staff ofthe Jasper Ridge Biological Preserve of Stanford University for allow-ing us to collect plant and soil samples and for providing accommo-dations and laboratory facilities during our extended studies in the Pre-serve; Ji Yong Yang, Lesley R. Bohm, Binney Girdler, and Nona Chiar-iello for assistance in the field; Anh-Toan Tran for technical assistancewith the ICP and AA analyses; Tony Glass and Jeannette Whitton foruseful comments and review of the manuscript; Les Lavkulich and TimBallard for providing much appreciated guidance and access to the soilchemistry laboratory facilities; and Gary Bradfield and Jack Maze foradvice on statistical analyses. This work constitutes part of the Masterof Science dissertation of the first-named author who thanks the Uni-versity of British Columbia for the award of a University GraduateFellowship.
2 Author for correspondence (e-mail: [email protected]).
amination of such a system: the influence of the edaphicfactor on Lasthenia californica DC. ex Lindley (Astera-ceae: Helenieae) (Karis and Ryding, 1994) throughoutmuch of its range in western North America.
Lasthenia californica is the most widely distributed ofthe 17 species that comprise this mostly Californian ge-nus (one species, L. kunthii, occurs in Chile). This oblig-atory outcrossing, spring annual ranges from south-cen-tral Oregon throughout California, from the foothills ofthe Sierra Nevada to the coast, east into Arizona, and innorthern Baja California. The distribution of the speciesmay be limited by its preference for a Mediterranean-typeclimate, characterized by mild, wet winters and long, hot,dry summers. Lasthenia californica shows a high degreeof morphological, cytological (Ornduff, 1966), and bio-chemical diversity (Bohm, Saleh, and Ornduff, 1974;Bohm et al., 1989; Desrochers and Bohm, 1993, 1995).Ornduff (1966) considered it to be the most variable tax-on in the genus.
The species has wide ecological tolerance: it can befound on coastal bluffs, in open grasslands, oak wood-lands, alkali flats, chaparral, pastures, along roadsides, indesert habitats, and on serpentine outcrops. It seems rea-sonable to suggest that the serpentine outcrops may pro-vide one of the more extreme growth conditions for thisspecies. However, in these environments, L. californicaachieves dominance and is often restricted to the serpen-tine side of the serpentine and nonserpentine boundary.Thus, L. californica fits Kruckeberg’s third category ofplant distributions on serpentine soils, species that arewidespread on serpentine and nonserpentine soils but

November 1999] 1577RAJAKARUNA AND BOHM—VARIATION IN LASTHENIA CALIFORNICA
Fig. 1. Distribution of race A and race C populations sampled be-tween 1996 and 1998.
show regional prominence on serpentine (Kruckeberg,1984).
The existence of flavonoid races in L. californica wasfirst noted in a study of individual plants along severaltransects established on a serpentine outcrop located inthe Jasper Ridge Biological Preserve of Stanford Uni-versity. Two principal pigment profiles were noted, raceA, characterized by the presence of flavonol diglycosidesulfates and the flavanone eriodictyol 7-O-glucoside, andrace C, which lacked both of those compound types.Moreover, race A plants were found only in the lowerthird of the transect, whereas race C plants occurred inthe upper two-thirds of the transect. Both races exhibiteda complex array of anthochlors (aurones and chalconeglycosides) as reported in the original description of theflavonoid chemistry of the genus (Bohm, Saleh, and Orn-duff, 1974). (A minor variant of race C, referred to inearlier papers as race B, contains luteolin 7-O-glucoside).The existence of chemical races in itself was not a novelobservation (see Bohm, 1987, for a discussion of flavo-noid races), but the maintenance of a more or less clear-cut line of demarcation between the two races over aperiod of years, six in the original study, did attract ourattention. Subsequent to those studies it has been ob-served that the geographical pattern within the study sitehas remained essentially unchanged for at least 15 yr(Desrochers and Bohm, 1993; Rajakaruna and Bohm, un-published data). It is of interest to note that the findingof differentiated populations within a serpentine site rep-resents a new phenomenon—other reports in the litera-ture being concerned with differences between speciespairs, one of which grows on serpentine and the relatedone on nonserpentine soil (Kruckeberg, 1951, 1954,1967, 1969, 1992, personal communication; Proctor andWoodell, 1975; Brooks, 1987; Mayer and Soltis, 1994).
The finding of flavonoid variation within the JasperRidge population prompted us to investigate other fea-tures of the system. Results of those investigations in-cluded the existence of clear-cut morphological and elec-trophoretic differences (Desrochers and Bohm, 1995):race A plants are characterized by the presence of a linearpappus, the B allele coding for NADHDH and fastermoving allozymes coding for 6PGD-1, whereas race Cplants are characterized by a lanceolate pappus, the Aallele coding for NADHDH and slower alleles coding for6PGD-1. Preliminary crossing studies between the tworaces were inconclusive owing to the small number ofcrosses that were performed. Current crossing studies in-dicate that the two plant races have only a limited ca-pacity to cross (data not included; Rajakaruna and Bohm,unpublished data). The absence or very low level of geneexchange and the observed differences in flowering timein the field of 7–10 d (Desrochers and Bohm, 1995; Ra-jakaruna and Bohm, unpublished data) suggest the exis-tence of a strong prezygotic breeding barrier.
Greenhouse experiments indicated that the flavonoidprofiles seen within populations of L. californica are ge-netically controlled. Thus, the flavonoid chemistry of anoffspring, with very few exceptions, matched that of itsmaternal parent (we have no way of determining pollensource at this time) (Bohm et al., 1989). The offspringreared from field-collected seed were germinated andmaintained in potting soil without apparent effect upon
the flavonoid profile. It appears, therefore, that differenc-es in the pigment profiles of the two races are not theimmediate result of substrate differences.
An extension of the flavonoid survey to include rep-resentatives from the entire range of L. californica estab-lished that the two races exhibit a reasonably clear-cutpattern of occurrence. Race C plants were found to occurpredominantly from southern Oregon through northernCalifornia to north-central California, whereas race Aplants were found predominantly in the southern parts ofCalifornia, Arizona, and in Baja California (Desrochers,1992; Desrochers and Bohm, 1993). A few mixed pop-ulations, including the population at Jasper Ridge, wereobserved in the central part of California. This distribu-tion is represented in Fig. 1.
Owing to the unusual partitioning of variation withinthe Jasper Ridge site, particularly with regard to its con-stancy over time, it was decided to investigate the pos-sible effects of soil chemistry on the expression of thephenotypes observed. The fundamental issue addressedin the present study, then, involves an examination offactors that might be involved in maintaining race Aplants in the lower part of the transect and race C plants

1578 [Vol. 86AMERICAN JOURNAL OF BOTANY
Fig. 2. Arrangement of transects on the serpentine outcrop at JasperRidge Biological Preserve.
in the upper part. In the following, we describe analysesof soil samples collected along several transects at theJasper Ridge site for elemental composition, electricalconductivity (ionic strength), pH, moisture content, andclay content. The capacity of individual plants to accu-mulate certain ions was also investigated. The study wasexpanded to include analyses of soils and individualplants from populations collected from known sites inOregon and from sites representing the range of the spe-cies in California. With those data in hand, several ex-periments were run in order to assess the effects of thedifferent soils involved on germination and growth ofplants representing the two races.
MATERIALS AND METHODS
Collection sites—Individual plants and soil samples were collectedalong six transects established in the Jasper Ridge Biological Preserveof Stanford University. The preserve is located west of Palo Alto, Cal-ifornia, San Mateo County, in the Santa Cruz Mountains. The collectionsite lies at an approximate elevation of 180 m. Approximate coordinatesof the Preserve are 378259 N and 12282.59 W. The area of interest is anextensive serpentine outcrop that runs in a west-northwesterly to east-southeasterly direction. A detailed classification of rock and soil asso-ciations on this outcrop has been provided by Armstrong and Huenneke(1992).
In April, 1996 plant and soil samples were collected along five tran-sects on the serpentine outcrop at the Jasper Ridge site. The arrangementof these transects is shown diagrammatically in Fig. 2. (Transects 2, 3,and 5 correspond to transects I, II, and IV in Desrochers and Bohm,1993.) The length of these transects range from 44 to 65 m. The northand south ends of the 100 m transect described by Armstrong and Huen-neke (1992) is, respectively, 150 m and 95 m west of our transect 3(Nona Chiariello, personal communication, Jasper Ridge Biological Pre-serve, Stanford University). One hundred twenty-three plant and soilsamples were collected at 2-m intervals along all of the transects. InApril, 1997 plants were collected along a new transect (transect 6), a50-m transect running parallel to the oak-grassland boundary betweenthe bottom ends of transects 2 and 5. An ;7% drop exists between thefire road and the oak-grassland boundary terminus of transect 3.
Twenty-two additional sites, listed in Table 1, were sampled in thisstudy, five from southern Oregon and 17 representing the range of thespecies in California. Site 11 is a population in the Jasper Ridge Pre-serve that lies at some distance (;1 km) from the study transects. Figure3 is a map of the area covered by these collections.
Field collections—Four to 10 plants were collected at each 2-m in-terval point along all transects. The plants are slightly pubescent, notglandular or sticky. Plants were cleaned of adhering soil/dust by gentleshaking in the field. Plants were placed separately in paper bags forlater determination of elemental composition of plant tissue. Severalflower heads from each individual plant were collected to obtainachenes for germination studies (placed in seed envelopes) as well asfor analysis of flavonoid profiles (placed in small glass vials).
Approximately 300 g of soil from the rooting zone of each collectionsite were dug and placed in plastic bags. All soil samples were collectedat 0–10 cm depth using a plastic hand trowel (thus avoiding possiblecontamination of soil samples by Cr or Ni from a stainless steel trowel).At several points along each transect samples were collected and placedin air-tight soil cans for determination of water content. For populationsother than Jasper Ridge, three samples were selected at ‘‘random.’’Again, 4–10 plants and ;300 g of soil were collected.
Analytical procedures—Plants—Whole plants were cleaned of ad-hering soil/dust by use of a gentle pressurized air stream in a fumehoodand dried for 24 h at 808C in a forced draft oven. Each sample was
then thoroughly ground using a Model CG 150 Sunbeam Cafe Mill.Trials were conducted using pine needles to see whether the stainlesssteel blades of the mill contributed traces of Cr to the ground plantmaterial. There was an ;1% increase in this metal using this grindingmethod. All analytical analyses for Cr were corrected by this value.Ground plant material was then extracted using 1 mol/L HNO3 and 2mol/L HCl (all procedures followed are described in the UBC SoilScience Laboratory Manual, 1981). Digested samples were then ana-lyzed for aluminum, calcium, chromium, copper, iron, magnesium, man-ganese, nickel, potassium, sodium, and zinc.
One-dimensional thin layer chromatography of flower extracts wasrun as described earlier (Derochers and Bohm, 1993).
Analytical procedures—Soils—All soil samples (except those usedfor moisture content analysis) were placed on plastic trays and air-driedat room temperature for ;1 wk. Each sample was then sieved (fume-hood) with a homemade wood-frame fitted with 2-mm nylon mesh.Gravel was removed from the remaining aggregate of soils and thencrushed using a wooden rolling pin. The resulting material was passedthrough the sieve, and the entire process was repeated until all soilaggregates had been crushed. Crushed soil samples were stored in plas-tic bags.
For the determination of moisture content (relative water content) soilsamples were weighed immediately upon opening the sealed metal cans
November 1999] 1579RAJAKARUNA AND BOHM—VARIATION IN LASTHENIA CALIFORNICA
TABLE 1. Locality information for samples of Lasthenia californica from Oregon and California.
Populationno. Locality information
1 Along Highway 234, 2.9 km west of intersection with Table Rock Rd., near Gold Hill, Jackson Co., OR.2 Roadside, Kirtland Rd., 0.5 km from intersection with Table Rock Rd., near water treatment plant, Jackson Co., OR.3 Across road from population No. 2, Jackson Co., OR.4 Summit of Table Rock, near southern end of mesa, Jackson Co., OR (andesite).5 Summit of Table Rock, near northern end of mesa, Jackson Co., OR (andesite).6 Pasture along Rt. 36, 1.7 km from intersection with Highway 99, near Red Bluff, Tehama Co., CA.7 Roadside along Paskenta/Covelo Rd., 5.1 km W of Paskenta Bridge, Paskenta, Tehama Co., CA.8 Hillside 4 km E of Paskenta Bridge, Paskenta/Covelo Rd., Paskenta, Tehama Co., CA (serpentine).9 Pasture on Highway 104, 13.9 km E of Clay, Sacramento Co, CA.
10 Roadside at railroad crossing and Highway 104, near Clay, Sacramento Co., CA.11 Rattle Snake Rock, north-facing slope, Jasper Ridge Biological Preserve, San Mateo Co., CA (serpentine).12 Pasture, 4 km E of population 9 on Rt. 104, Sacramento Co., CA.13 Pasture, 2.9 km E of population 9 on Rt. 104, Sacramento Co., CA.14 Pasture along Rt. 198, 4 km NW of County line of Monterey and Fresno Counties, Priest Valley, Monterey Co.,
CA.15 Pasture at intersection of Rt. 198 and Priest Valley Rd., Monterey Co., CA.16 Pasture at entrance to Palmer Ranch, off Priest Valley Rd., Monterey Co., CA.17 Along road to Palmer Ranch, off Priest Valley Rd., Monterey Co., CA.18 NE corner of Coalinga Springs Rd. and Rt. 198 Fresno Co., CA.19 Pasture, 1 km E of Coalinga Springs Rd. on Rt. 198, Fresno Co., CA.20 Hillside north of 16-Mile Road on trail to stream, ca. 4 km from Arroyo Seco campsites, Los Padres National For-
est, Monterey Co., CA.21 Along Tehachapi Willow Springs Rd., 3.3 km S of intersection Highline and Tehachapi Willow Springs Rd., Kern
Co., CA.22 Near population 21, Tehachapi, Kern Co., CA.
in which the samples had been placed in the field to determine wetmass. The samples were then dried at 1058C for 16 h and reweighed.
Soil color was determined by comparing appropriate samples usingthe Munsell Soil Color Charts (1992). Six soil samples from each raceof L. californica were subjected to the color test under both dry andwet conditions. Soil texture was determined by particle size analysisusing the Hydrometer Method and the computer program METLAB(UBC Soil Science Laboratory Manual, 1981).
Soil pH was determined using both water and calcium chloride so-lution. Ten grams of soil from each sample were mixed with 20 mLwater or 20 mL 0.01 mol/L calcium chloride solution. The suspensionswere stirred several times over a period of 30 min and allowed to standfor 1 h. After the particulate material had settled pH was measured usingan Orion (Boston, Massachusetts) Model 420A pH meter (Black et al.,1965; UBC Soil Science Laboratory Manual, 1981).
Cation exchange capacity (CEC) and exchangeable cations (Ca21, K1,Mg21, Na1) were determined by the ammonium acetate method at pH7.0 using 1 mol/L ammonium acetate and 1 mol/L potassium chlorideaccording to a procedure described by Black et al. (1965). Exchangeablealuminum was determined by extraction of soil samples with 1 mol/Lpotassium chloride following Page, Miller, and Keeney (1982). Totalnitrogen was determined by the Kjeldhal method. Concentrations ofexchangeable cations were determined by atomic absorption spectros-copy using a Perkin Elmer Corp. (Norwalk, Connecticut) Model 306instrument. Total CEC and total nitrogen were also determined using aLachat Instruments (Milwaukee, Wisconsin) Quick Chem automated ionanalyzer (Model 2300–000). Micronutrients, cadmium, chromium, co-balt, copper, iron, manganese, and zinc were extracted with dimethy-lenetriaminepentacetic acid (DTPA) using 0.005 mol/L DTPA, 0.01mol/L calcium chloride, and 0.1 mol/L triethylamine (TEA) adjusted topH 7.3 with dilute hydrochloric acid (Lindsay and Norvell, 1978). Con-centrations of extracted elements were determined by inductively cou-pled plasmaspectroscopy (ICP) using a Thermo Jarrell Ash (Waltham,Massachusetts) ICP 61 instrument.
Electrical conductivity (EC) of soil solutions was determined usingthe analytical method described by Kalra and Maynard (1991) exceptthat samples were extracted for 30 min rather than 4 h. Conductivity
measurements were made using a Type CDC 104 conductivity cell us-ing a Radiometer Type CDM 2 conductivity meter (Copenhagen, Den-mark). Ionic strength (I) was calculated using the equation described byAlva, Sumner, and Miller (1991).
Measurement of achene size—Mean length and width of achenes ofrace A and race C plants collected from the Jasper Ridge site weredetermined using standard measurement techniques. Achene masseswere determined using an analytical balance.
Germination and growth studies—Preliminary studies had shownthat achenes require at least a 3-mo period of after-ripening (dormancy)for optimal germination.
Approximately 3 kg of soil was collected from two spots on transect3, one near the top of transect and one near the bottom. These repre-sented sites where race C and race A plants, respectively, had beenidentified. Soils were air-dried for 1 wk and then crushed and sievedthrough a stainless steel (contamination by trace metals was not con-sidered significant for the growth experiments) standard mesh number4 sieve to obtain the ,4.75 mm fraction. Two hundred grams were thenplaced separately in plastic dishes (12.5 3 12.5 3 4.5 cm) and thor-oughly soaked with water to bring the soil to saturation (;200 mLrequired). Dishes were placed in a cold room (58C) in the dark for 1wk to stimulate germination of Lasthenia or other seed from the naturalseed bank. Dishes were then moved to the greenhouse and observedfor 1 wk. All germinants, mostly grasses, were removed. (No Lastheniaseedlings were observed.)
Once the soils were rid of possible germinants from the natural seedbank, soils were thoroughly watered once again. Thirty achenes fromrace A and race C plants were sown separately on four dishes eachcontaining the three soil types, race A type soil, race C type soil, andpotting soil (Terra Lite Soil Mix, W.R. Grace and Co. of Canada Ltd.,Ajax, Ontario, Canada). Dishes were returned to the cold room andarranged randomly and left in the dark for 1 wk. After the cold treat-ment, the dishes were moved to the greenhouse and monitored fromday 8 onwards. Germinants were scored on the basis of emergence ofradicle. From days 9 to 36 plant survival was scored daily on the basis

1580 [Vol. 86AMERICAN JOURNAL OF BOTANY
Fig. 3. Distribution of the populations sampled for soil and planttissue analyses.
of percentage of standing plants with healthy foliage. The final countwas done 60 d after sowing. Plants that were either dead or wilted werenot taken into the daily count. However, if a plant revived by the fol-lowing day it was included in the count of standing plants.
After each count each dish was given 100 mL tap water. Wateringwas done daily to day 11, then on days 15, 16, 20, 24, 28, 29, and 35.This watering regime was designed to provide periods of ‘‘mini-drought’’ characteristic of the natural conditions under which theseplants are often found. The temperature ranged between 708 and 908Fduring the growth period, daylength was ;14 h, and humidity wasmaintained at 70–80%.
Effects of soil treatments on plant growth involved measuring plantheight, number of leaves per plant, and percentage of plants that de-veloped inflorescences during the experimental period. Plant height andnumber of leaves were measured on 3-wk-old plants. Height was mea-sured from base of stem to the tip of the tallest leaf. The date of openingof the first inflorescence was recorded as well as the number of plantswith inflorescences on day 45 after germination.
Germination and growth experiments using soil solutions—Fifty-gram samples of the two natural soil types were each mixed with 50mL of distilled water, shaken for 30 min, and then centrifuged at 10000 rpm for 5 min using a Beckman J2–21M/E Centrifuge (Palo Alto,California). The supernatant from each was filtered through Whatman
Number 42 filter paper. Fifteen achenes of each race were sown onWhatman Number 42 filter paper placed in plastic petri dishes (100 315 mm) and soaked with the appropriate solution, type A soil extract,type C soil extract, and distilled water. Each treatment was replicatedfour times. After standing in the dark at 58C for 1 wk, the plates weremoved to a growth chamber and maintained at 258C during the 12-hday and 208C at night. A few drops of the appropriate solution wereadded to each dish daily. On day 8 achenes showing emergence of theradicle were scored.
Seed bank study—As noted, no Lasthenia californica plants wereobserved in the germination experiment described above. Seed bankstudies were extended to include larger samples of soil from the upperand lower termini of transects 2, 3, and 5. Samples were collected fromthe surface to ;5 cm depth and placed in large plastic trays (50 3 203 5 cm). Samples from each terminus were placed in two trays each.Trays were watered thoroughly and exposed to cold (58C) and dark for1 wk. Trays were then moved to the greenhouse, arranged randomly,and watered as needed. Observations were made on the composition ofgerminants for a period of 6 mo.
Observations on achene dispersal—Observations were made in thefield on possible distance of achene dispersal. Plants were either tappedgently or exposed to a gentle current of air to see how far achenesdislodged by these treatments disperse.
Statistical analyses—Plant tissue and soil analyses—The soil andplant data sets were tested for normality and homogeneity of varianceby using the Shapiro Wilks and the Levene tests, respectively. Once theassumptions of both normal distribution and equal variances were foundto be applicable to the data sets, one-way analysis of variance (ANO-VA) was used to determine whether means of soil and plant tissuevariables differed for race A and race C plants. Regression analyseswere used to examine functional relationships between soil concentra-tions of various elements and those element concentrations in plants.Discriminant function analyses (DFA) and principal components anal-ysis (PCA) were conducted to determine whether soil and plant tissuecharacteristics were reliable as indicators of the race of individualplants.
Germination and growth studies—The data sets were tested for nor-mality and homogeneity of variance as above. One-way analysis ofvariance was used to determine whether means of percentage germi-nation and various growth measures of the two races differed amongthe three soil treatments. Paired-sample t tests were used when meansof various growth measures had to be compared in a pairwise manner.
All tests were conducted using statistical packages SPSS (Norusis,1993) and SYSTAT:Statistics Version 5.2 (Wilkinson, Hill, and Vang,1992) running on IBM-compatible computers at the Department of Bot-any, UBC.
RESULTS
Flavonoid profiles—Examination of the flavonoid pro-files of individuals collected along all of the Jasper Ridgetransects confirmed the existence of two pigment raceswith the race A plants occupying the lower and race Cplants the upper reaches of the transects (Fig. 4). Thelines of demarcation of the races agreed with those re-ported in earlier studies (Bohm et al., 1989; Desrochersand Bohm, 1993). Thus, the pattern of distribution ofthese two pigment types at the Jasper Ridge site haveremained essentially unchanged for a period of at least15 yr. Examination of individual plants from the othersites visited in this study also confirmed the findings ofDesrochers and Bohm (1993).

November 1999] 1581RAJAKARUNA AND BOHM—VARIATION IN LASTHENIA CALIFORNICA
Fig. 4. Flavonoid pattern of plants collected along six transects atJasper Ridge Biological Preserve. For transects 1–5 distance 0 is at FireRoad. Transect 6 is along oak-grassland boundary.
TABLE 2. Mean 6 1 SE length, width, and mass of achenes of L. californica race A and race C plants collected at Jasper Ridge. Significancebased on a one-way analysis of variance.
Achene character N Race A Race C F
Length (mm)Width (mm)Mass of 20 achenes (mg)
1275025
1.84 6 0.0120.411 6 0.004
1.78 6 0.03
2.16 6 0.0180.312 6 0.004
1.34 6 0.03
P , 0.0001P , 0.0001P , 0.0001
Achene size—Measurements of the length, width, andmass of achenes of the two races of L. californica col-lected at the Jasper Ridge site showed significant differ-ences. Although longer, achenes of race C were shown
to be significantly narrower and to weigh less than thoseof race A plants. These data are presented in Table 2.
Soil color—The colors of the soils collected from Jas-per Ridge are noticeably different; soil from the uppercollection sites, which support race C plants, are darkbrown, whereas those from the lower sites, which supportrace A plants, are very dark greyish brown.
Soil analyses—The first set of analytical values for thesoil analyses allows a comparison between soils fromsites supporting race C plants (93 individuals) and soilssupporting race A plants (30 individuals). This data setrepresents all individuals sampled from all transects. Per-centage clay content, relative water content (RWC), cat-ion exchange capacity (CEC), pH, electrical conductivity(ionic strength), and exchangeable magnesium and sodi-um were significantly higher (all P , 0.0001) in soilsharboring race A plants (type A soils) than in soils har-boring race C plants (type C soil). Conversely, type Csoils had significantly higher mean values for exchange-able calcium and potassium, extractable nickle, and cal-cium:magnesium ratios. Table 3 presents relevant data forthese analyses.
Plant elemental analyses—Elemental composition ofindividual plants along all of the transects resulted in thedata set presented in Table 4. The individual plants ana-lyzed correspond to the sites for which soil data wereobtained as described immediately above. Means for totalaluminum, magnesium, sodium, and zinc were signifi-cantly higher in plant tissue of race A plants (P , 0.01),whereas means for calcium and potassium were signifi-cantly higher in plant tissue of race C plants (P , 0.02).The calcium:magnesium ratio was also significantly larg-er in race C plants than in race A plants (P , 0.0001).Chromium, copper, iron, and manganese showed no ob-vious patterns in their distribution.
Soil and plant tissue analyses along transect 3—Table5 presents results of analysis of soil samples taken at 2-m intervals along transect 3. The plant at metre 16 wasthe only representative of the subset of race C known asrace B. Note the transition from race C to race A plantsat the 46-m position. This transition between the twoplant types has remained constant for the duration ofstudies at the Jasper Ridge site (15 yr). Percentage mois-ture was determined at 12 points along the transect andpercentage clay content at six points. All other measureswere determined at all points along the transect. Table 6presents the results of elemental analyses of the plantscollected along transect 3. The points of collection cor-respond to those for the soil data presented in Table 5.
Values for soil characteristics along transect 3 are plot-

1582 [Vol. 86AMERICAN JOURNAL OF BOTANY
TABLE 3. Soil characteristics for Jasper Ridge. Concentration of elements given in ppm (mg/g soil).
Featurea Race Mean 6 1 SE F Range
RWC/100 g soil CA
25.2 6 0.838.8 6 2.9
P , 0.0001 17.6–32.526.6–49.6
CEC (mmol of charge/100 g soil)
CA
44.0 6 0.551.5 6 1.6
P , 0.0001 30.1–55.632.5–72.0
EC (mS/cm) CA
0.20 6 0.010.44 6 0.03
P , 0.0001 0.13–0.350.2–1.12
I (mmol/L) CA
2.24 6 0.115.19 6 0.49
P , 0.0001 1.4–3.992.23–16.16
Percentage clay CA
32.1 6 1.040.3 6 1.4
P , 0.0001 21.3–38.433.5–45.8
pH in H2O CA
6.63 6 0.026.85 6 0.03
P , 0.0001 6.2–7.06.5–7.1
pH in CaCl2 CA
5.85 6 0.026.16 6 0.04
P , 0.0001 5.5–6.25.8–6.6
Calcium CA
610.7 6 13.3507.8 6 20.4
P , 0.0001 382.5–982.5252.5–807.5
Calcium : magnesium CA
0.25 6 0.010.17 6 0.01
P , 0.0001 0.15–0.490.06–0.36
Potassium CA
165.0 6 6.7130.5 6 6.7
P , 0.0065 65.0–547.547.5–207.5
Magnesium CA
2485.2 6 46.53316.7 6 142.7
P , 0.0001 1300.0–3950.01750.0–4600.0
Sodium CA
23.3 6 0.5032.0 6 1.7
P , 0.0001 16.3–53.018.8–52.5
Nickel CA
128.0 6 2.7104.9 6 5.2
P , 0.0001 34.7–190.857.0–186.7
Total N % (4 samples) CA
0.182 6 0.0010.162 6 0.001
P . 0.05
Aluminum (4 samples) CA
0.25 6 0.120.47 6 0.22
P . 0.05
Iron CA
71.9 6 1.9876.2 6 5.05
P . 0.05 43.51–127.0146.57–158.89
Zinc CA
3.36 6 0.24.1 6 0.5
P . 0.05 1.18–4.761.05–9.94
Manganese CA
34.2 6 1.0233.5 6 2.21
P . 0.05 5.02–55.714.3–70.7
Chromium CA
0.1 6 0.00.12 6 0.05
P . 0.05 0.02–0.1240.03–1.66
Cobalt CA
1.55 6 0.071.30 6 0.13
P . 0.05 0.21–4.590.19–3.86
Copper CA
1.61 6 0.041.77 6 0.08
P . 0.05 0.22–2.340.90–3.14
Cadmium C, A Not detected
a RWC 5 relative water content, CEC 5 cation exchange capacity, EC 5 electrical conductivity, I 5 ionic strength.
ted as a function of distance along that transect in Fig.5a–i. These figures show values for pH, cation exchangecapacity (CEC), electrical conductivity, ionic strength,magnesium, sodium, calcium, the calcium:magnesium ra-tio, and potassium plotted against distance along the tran-sect. Figure 5a–f shows that various measures graduallyincrease as a function of distance along the transect, andthat there is a significant increase beyond the transitionpoint (race C to race A) with the highest values oftenrecorded for the bottommost samples. Conversely, Fig.5g–i demonstrates that other measures show a significantdecrease beyond the transition point with the lowest val-
ues often recorded for the bottommost samples. A cor-responding set of figures, Fig. 6a–h, shows the relation-ships between elemental composition of plant tissue anddistance along transect 3. Both plant races showed sig-nificant correlations between soil and plant tissue con-centrations of calcium and sodium as well as with thecalcium:magnesium ratios. Correlations are higher forrace A plants than they are for race C plants. Some dif-ferences were noted between the two races: magnesiumis significantly correlated for race A plants but not forrace C plants, whereas potassium is significantly corre-lated for race C plants but not for race A plants. For other

November 1999] 1583RAJAKARUNA AND BOHM—VARIATION IN LASTHENIA CALIFORNICA
TABLE 4. Elemental analyses of plant tissue comparing race A and race C plants. Concentrations of elements given in ppm (mg/g plant tissue).
Element Race Mean 6 1 SE F Range
Calcium CA
5445.3 6 90.54965.8 6 186.3
P , 0.0135 3811.7–7934.63539.0–7819.7
Magnesium CA
6778.4 6 121.28887.1 6 332.7
P , 0.0001 4431.5–11 292.75863.2–12 577.0
Ca/Mg CA
0.83 6 0.020.60 6 0.04
P , 0.0001 0.37–1.280.28–1.14
Potassium CA
15 057.4 6 248.013 636.8 6 675.2
P , 0.0157 6750.0–20 683.24090.9–19 866.7
Sodium CA
672.4 6 33.12304.0 6 232.0
P , 0.0001 98.36–1970.59619.1–5268.3
Nickel CA
86.6 6 4.2783.9 6 8.45
P , 0.0001 28.5–243.421.0–198.9
Aluminuma CA
111.0 6 6.1179.3 6 21.6
P . 0.05 29.8–400.152.0–491.6
Zinc CA
62.7 6 0.867.0 6 2.0
P . 0.05 48.0–80.947.1–97.9
Iron CA
1807.5 6 109.81950.7 6 236.9
P . 0.05 357.3–6049.7530.2–4984.1
Manganese CA
81.4 6 2.875.7 6 6.4
P . 0.05 29.1–182.434.1–183.9
Chromium CA
18.2 6 1.221.5 6 2.9
P . 0.05 4.1–69.04.0–61.5
Copper CA
9.5 6 0.47.8 6 1.2
P . 0.05 1.9–22.80.0–36.9
a Four samples tested.
metals the correlations were not significant for eitherrace. Results from the correlation analyses are presentedin Table 7. The linear relationships between soil and planttissue concentrations for magnesium and sodium areshown in Fig. 7a and b.
Soil and plant tissue analysis of other populations—Soil samples from 22 sites representing the range of L.californica in southern Oregon and California were an-alyzed for the same suite of features as described for theJasper Ridge soils (Table 3). Data arising from these an-alyses are presented in Table 8. Soil pH and exchangeablemagnesium were shown to be significantly greater (P ,0.02) in soils harboring race A plants compared to soilsharboring race C plants. Values for percentage clay con-tent, CEC, electrical conductivity (EC), ionic strength,and exchangeable sodium were also greater for soils ofrace A plants, although the differences were not statisti-cally significant (P . 0.05). Several differences were ob-served between the patterns from Jasper Ridge and thosefrom the other analyses. For example, exchangeable po-tassium was significantly higher in soils of race A plantsfrom the other sites than was seen for soils of race Aplants at Jasper Ridge. Similarly, exchangeable calciumand nickel were higher for race A plants from the othersites, although the values were not statistically significant(P . 0.05). The difference between the means of ECmeasurements was not significant (P . 0.05). It is ofinterest to note that the highest electrical conductivityvalue so far observed for the soils of the species wasrecorded for a race A population recently collected fromSoda Lake, San Luis Obispo County, California (;330
km southeast of Jasper Ridge). Electrical conductivitiesabove 4 mS/cm are highly toxic to most plants (Brady,1990), and the value of 7.49 mS/cm recorded for the soilsof this population clearly indicates the high salt-tolerantcapacity of this race.
Results of analysis of plant tissues from the other col-lection sites are presented in Table 9. The results are ingeneral agreement with those from the Jasper Ridge siteanalyses, although the majority of differences were notstatistically significant at P , 0.05. However, significantdifferences were observed in the higher concentrations ofaluminum (P , 0.0001), iron (P , 0.011), and manga-nese (P , 0.0001) in soils harboring race C plants. Re-lationships between soil and plant tissue concentrationsof elements were calculated for collections from the othersites, as was done for the Jasper Ridge site (Table 7).Table 10 presents the results of the correlation analyses.Significant correlations were observed for race A plantand soil concentrations of calcium, magnesium, sodium,nickel, and zinc. Significant correlations between race Cplant and soil concentrations of chromium and nickelwere observed.
Discriminant function analysis—Discriminant func-tion analysis was performed in order to determine howwell soil and plant tissue chemistry could be used to pre-dict races of L. californica. Analysis of soil samples in-dicated significantly different (P , 0.0001) group means(centroids) for soils of both races, informing us that soilchemistry is highly reliable in predicting race. Soil pH,magnesium, sodium, and the calcium:magnesium ratio, inthat order, were the most discriminating variables. The

1584 [Vol. 86AMERICAN JOURNAL OF BOTANY
TA
BL
E5.
Soi
lch
arac
teri
stic
sof
sam
ples
take
nat
2-m
inte
rval
sal
ong
tran
sect
3.C
once
ntra
tion
sof
elem
ents
are
give
nin
mg/
gso
il(p
pm).
Col
l.no
.aP
lant
race
pH H2O
pHC
aCl 2
CE
C(m
mol
ofch
arge
/10
0g
soil
)E
C(m
S/c
m)
I(m
mol
/L
)R
WC
Cla
y(%
)C
aM
gC
a/M
gN
aK
Ni
Mn
Co
Cu
Zn
Fe
Cr
0 2 4 6 8
C C C C C
6.49
6.78
6.40
6.95
6.60
5.71
5.87
5.65
5.90
5.80
40.5
41.9
30.1
41.5
40.1
0.19
0.18
0.16
0.18
0.20
2.10
1.97
1.78
1.97
2.23
20.6
— — — 24.0
32.4
— — — —
670
565
382.
550
049
5
2300
2850
1600
2900
2150
0.29
0.20
0.24
0.17
0.23
25.5
29.8
17.5
21.3
18.5
110
285
195
147.
510
2.5
118.
210
4.2
105.
810
4.0
134.
8
27.0
21.7
24.5
33.8
35.9
0.99
0.71
1.66
1.17
1.87
1.54
1.54
1.25
1.60
1.57
1.51
2.27
3.50
1.39
1.61
57.5
48.7
76.0
51.1
57.3
0.06
0.06
0.02
0.05
0.04
10 12 14 16 18
C C C C(B
)C
6.31
6.44
6.42
6.69
6.85
5.84
5.59
5.53
5.84
5.79
48.5
36.8
32.3
39.6
38.9
0.19
0.18
0.24
0.16
0.16
2.09
1.97
2.62
1.69
1.78
— 22.0
— 22.6
—
— — — 31.9
—
480
415
472.
554
7.5
412.
5
2950
1500
1750
2400
2850
0.16
0.28
0.27
0.23
0.14
19.3
22.3
25.5
25.3
18.8
140 82
.518
2.5
155
152.
5
113.
514
0.3
134.
512
1.8
87.0
38.1
36.7
42.6
31.1
31.9
1.35
1.49
1.66
1.21
0.58
1.64
2.03
1.84
1.71
1.53
1.18
2.77
4.73
5.0
1.23
59.6
99.1
115.
766
.943
.5
0.05
0.07
0.08
0.05
0.06
20 22 24 26 28 30 32 34
C C C C C C C C
6.21
6.54
6.66
6.22
6.42
6.70
6.56
6.65
5.81
5.67
5.82
5.88
5.58
5.79
5.54
5.73
40.0
37.8
48.2
43.1
40.5
37.2
38.3
42.0
0.21
0.18
0.18
0.17
0.16
0.16
0.25
0.24
2.28
1.98
1.91
1.87
1.78
1.72
2.84
2.62
22.3
— 23.2
— 27.8
— — —
— — — — — 33.8
— —
500
552.
575
062
7.5
610
592.
554
2.5
720
2750
2450
2500
1900
2250
2700
2350
3100
0.18
0.23
0.30
0.33
0.27
0.22
0.23
0.23
26.3
36.8
23.0
30.0
22.0
22.8
22.5
26.0
127.
512
2.5
210
132.
519
014
016
7.5
152.
5
97.8
155.
314
1.3
152.
217
7.4
115.
016
3.9
147.
2
26.7
34.6
41.8
40.1
41.8
31.9
44.2
35.7
0.98
2.25
2.31
2.24
2.60
1.77
2.67
2.28
1.65
1.75
1.57
1.63
2.05
1.49
1.77
1.74
2.14
5.63
3.18
2.87
3.23
2.44
3.68
4.91
57.2
101.
473
.170
.710
1.7
61.4
103.
987
.9
0.05
0.03
0.03
0.05
0.03
0.03
0.02
0.03
36 38 40 42 44 46
C C C C C A
6.66
6.55
6.76
6.91
6.82
7.01
5.77
5.64
6.02
5.88
5.91
6.09
46.5
45.7
41.6
47.2
48.2
47.9
0.35
0.22
0.17
0.13
0.18
0.20
3.99
2.48
1.82
1.40
1.97
2.23
— 29.3
— — — 26.6
— — — — — —
640
800
555
482.
548
568
5
2800
3600
3350
2550
3050
2950
0.23
0.22
0.17
0.19
0.16
0.23
53.0
24.8
17.5
21.8
22.5
21.3
182.
515
516
2.5
80 120
185
172.
818
0.2
110.
011
4.3
109.
312
1.9
48.4
43.2
30.9
24.8
29.6
31.8
2.43
2.22
1.05
1.02
1.08
1.20
2.0
1.97
1.69
1.81
1.79
1.92
4.05
2.92
1.30
1.25
1.39
2.08
108.
391
.756
.057
.956
.362
.7
0.03
0.04
0.06
0.05
0.07
0.06
48 50 52 54 56 58 60 62
A A A A A A A A
6.95
6.77
6.95
6.75
6.92
7.14
7.12
7.09
6.07
5.97
6.02
6.08
6.24
6.44
6.42
6.31
47.0
47.6
48.7
50.2
48.6
43.9
63.0
53.3
0.21
0.34
0.40
0.38
0.53
0.50
0.44
0.74
2.35
3.91
4.65
4.33
6.18
5.80
5.03
8.74
— — — 49.0
38.7
— — 49.4
41.1
— — — 41.5
— — 44.4
580
477.
554
043
2.5
502.
538
547
7.5
347.
5
3750
2900
4250
4100
3950
3650
4350
3750
0.15
0.16
0.13
0.11
0.13
0.11
0.11
0.10
29.5
45.5
28.8
26.3
38.0
40.8
45.5
34.8
135
112.
512
511
512
2.5
137.
514
7.5
102.
5
98.9
128.
710
5.8
151.
011
0.8
99.2
186.
710
3.9
28.6
34.6
70.7
47.8
30.4
35.4
51.8
25.8
1.05
1.25
0.83
2.73
0.99
2.38
3.86
1.60
1.65
2.01
1.82
3.14
1.99
2.13
2.81
1.84
1.37
2.80
1.56
3.19
3.02
2.20
3.67
3.51
55.2
84.1
70.7
158.
962
.411
7.0
131.
078
.3
0.05
0.07
0.05
0.12
0.07
0.07
0.08
0.03
aN
umbe
rre
pres
ents
met
res
from
star
ting
poin
tof
tran
sect
;0
isat
Fir
eR
oad
and
62is
atoa
k-gr
assl
and
boun
dary
.
November 1999] 1585RAJAKARUNA AND BOHM—VARIATION IN LASTHENIA CALIFORNICA
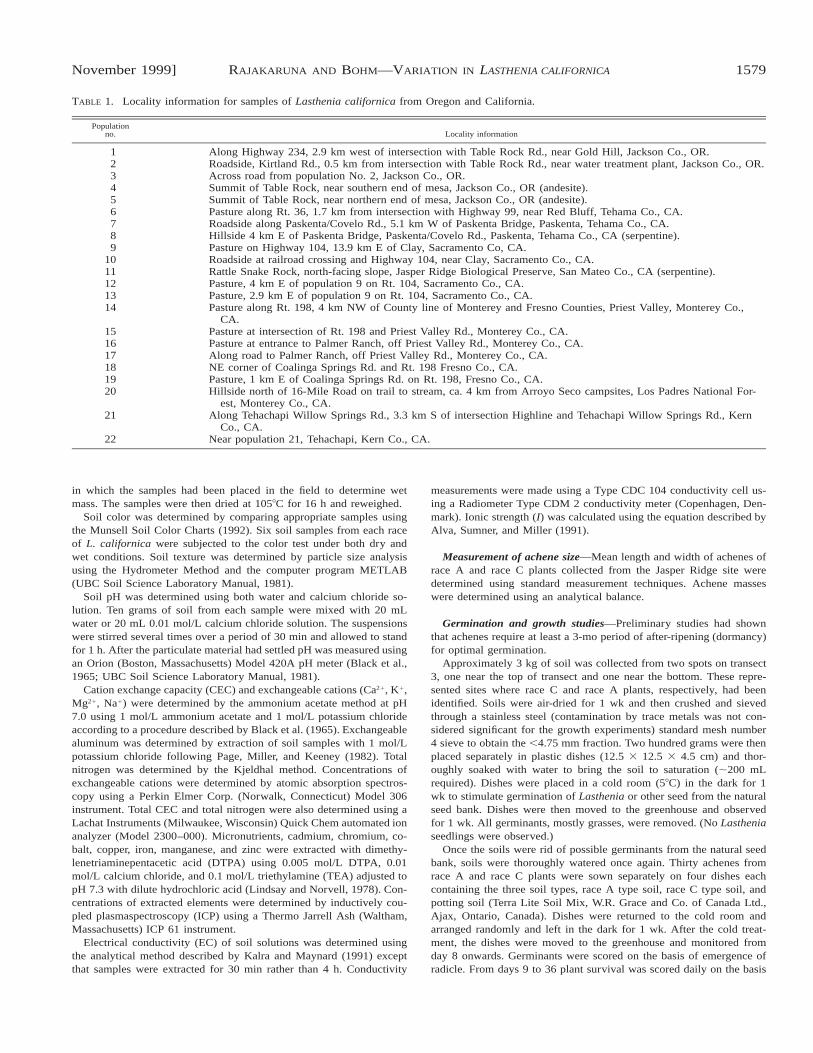
TABLE 6. Elemental composition of plants taken at 2-m intervals along transect 3. Concentration given in mg/g (ppm) dry mass of plant material.
Coll.no.a
Plantrace Ca Mg Ca/Mg Na K Al Fe Cu Zn Cr Mn Ni
02468
CCCCC
64297934650461735182
73657707847767869404
0.871.030.770.900.55
976579815
1279447
16 21414 78914 55614 93013 934
110183164140215
20443729317225394063
2.308.53
10.86.797.68
48.865.053.463.753.0
15.237.133.627.539.8
90.5133.2111.0107.2133.1
81.6152.2149.5112.5162.2
101214161820
CCCC(B)CC
502960575640450947564154
832070659270706069527476
0.600.860.610.640.680.56
800846
1105724621594
15 30016 15413 73715 00020 68314 660
19184
20492
131116
327216433829155227691871
19.51.87
15.67.938.037.34
61.055.451.957.262.357.1
34.713.717.414.425.219.7
114.974.895.879.8
110.971.1
146.373.7
144.078.0
110.583.7
222426283032
CCCCCC
467354555061518251604779
766260986488611968966511
0.610.890.780.850.750.73
1470952812258828620
10 78316 13113 60415 56214 48315 211
1025480
101113
78
1597788
1057132016811162
7.978.436.289.847.337.28
50.963.656.659.363.155.3
15.06.57
10.516.121.011.3
69.352.656.766.781.077.8
77.643.154.677.785.961.6
3436384042
CCCCC
41274127491041844536
74047628699377226408
0.560.540.700.540.71
6101512
592478623
15 95711 90616 47418 56514 973
10571
127202
97
13691059207429601250
10.26.718.458.156.17
52.850.959.272.759.6
14.69.24
19.738.417.2
94.547.577.0
124.577.6
79.354.090.1
152.578.7
4446485052
CAAAA
46767016712278205961
71136612705568608582
0.661.061.011.140.69
735933
221028791429
14 91219 867
936011 63618 171
141127163
96159
19751808172010052117
11.112.136.910.10.87
65.665.565.155.573.6
7.439.52
13.511.913.4
84.476.671.238.968.2
93.382.973.149.1
101.95456586062
AAAAA
47814796463447983735
8070867895499498
12 577
0.590.550.480.510.30
44634059434235822880
12 02412 265
852613 30912 660
13599
210267491
1820939
237434614984
3.638.697.78
10.313.6
73.672.947.173.857.3
17.612.515.334.261.5
112.845.0
125.3102.1183.9
83.148.0
107.5132.5198.9
a Number represents metres from starting point of transect; 0 is at Fire Road and 62 is at oak-grassland boundary.
others, in decreasing order, were nickel, calcium, potas-sium, copper, chromium, zinc, cobalt, iron, and manga-nese (percentage clay, RWC, EC, and I not included inthis analysis owing to incomplete data). Table 11 pro-vides a summary of the classification of results of dis-criminant function analysis for the soils from JasperRidge. Discriminant function analysis of plant tissue el-emental content proved equally effective (P , 0.0001) indiscriminating between the two races. Sodium, magne-sium, and the calcium:magnesium ratio were the best dis-criminating variables followed by aluminum and calciumwith the rest of the elements being comparatively less so.Table 12 summarizes the discriminant function analysisfor plant tissue samples from Jasper Ridge.
Discriminant function analysis of soil and plant tissuevariables from the other populations also indicated thatboth soils and plant tissue are highly reliable predictorsof the two races [centroids significantly different (P ,0.0001)].
The final treatment to which the Jasper Ridge datawere subjected involved principal components analysis,the results of which are illustrated in Fig. 8a and b. Figure8a shows the array of sites for all soil variables. Axis 1accounts for 32.6% of the total variation, and axis 2 ac-counts for 20.6%. The ellipses indicate 95% confidencelimits. Figure 8b represents the variation for all plant tis-sue variables where axis 1 represents 41.3% and axis 2,20.3% of total variation. Again, the ellipses represent95% confidence limits.
Germination and growth studies—Achenes of race Cplants germinated about equally in type C soil (80%), intype A soil (68%), and in potting soil (83%) (P . 0.05).Although the overall germination success was lower withrace A achenes, they also germinated about equally in thethree soils, 34% in type C soil, 28% in type A soil, and38% in potting soil (P . 0.05). Germination results aregiven in Table 13.
Whereas germination behavior of achenes from thetwo races was about equal in the three soil types, differ-ences in survivorship were clearly evident. Race C plantssurvived equally well in type C soil and in potting soil(P . 0.05), but significantly (P , 0.001) poorer in typeA soil. At the end of the test period, 60 d after emergenceof the radicle, 78% of race C plants had survived in soilnormally harboring race C plants, whereas only 6% hadsurvived in type A soil. The results of this experimentare illustrated in Fig. 9a.
A parallel experiment tested the capacity of race Aplants to survive in the three soils. Survivorship of raceA plants was not significantly different (P . 0.05) whenreared in type C (8%) or type A soil (10%). Race Aplants survived significantly better (P , 0.001) in pottingsoil than in either of the natural soils. These results es-tablish that race A plants are capable of maintaining alow but similar level of survivorship in their own soiltype or in soil normally associated with race C plants.These observations are illustrated in Fig. 9b.
Both race A and race C plants grew significantly taller

1586 [Vol. 86AMERICAN JOURNAL OF BOTANY
Fig. 5. Variation in soil characteristics as a function of distance along transect 3. (a) pH, (b) cation exchange capacity, (c) electrical conductivity,(d) ionic strength, (e) magnesium, (f) sodium, (g) potassium, (h) calcium, and (i) calcium:magnesium ratio.
when grown in potting soil than they did when grown ineither of the natural soils. Soil normally associated withrace C plants was the next better medium. Table 14 sum-marizes results from a study of height of plants main-tained in the three soil types. It is clear from these ob-servations that life in type A soil seems harsh for bothraces as indicated by their stunted growth. Whereas soiltype does not appear to have any significant effect upongermination, as described above, further growth, dem-onstrated by the measurements of plant height, is clearly
affected. This is also borne out in the number of leavesproduced by the two races depending upon soil treatment.Table 15 shows that race A plants produce the same num-ber of leaves when grown in type A soil or type C soil(potting soil is again the best medium). It would appear,however, that race C plants find life in type A soil to bemore difficult, producing a little more than four leaves,than life in their own soil type where they produce slight-ly over seven leaves during the same growth period. Pot-ting soil continues to be the best medium. Although this

November 1999] 1587RAJAKARUNA AND BOHM—VARIATION IN LASTHENIA CALIFORNICA
Fig. 5. Continued.
soil was not fertilized, it appears to be chemically andphysically more suited for plant growth than either of theserpentine soils.
With information on hand concerning germination andgrowth, we next monitored the production of flowerheads by the two races, again subjected to the three soiltreatments. Race C plants in both type C soil and potting
soil began to flower 9 d prior to race A plants, thus con-firming the flowering time differences we had observedin the field. The most striking result came from the ob-servation that, while race C plants germinated and grewin type A soil, they failed to flower. In their own soiltype, some 72% of race C plants flowered (P , 0.0001).Race A plants exhibited about the same level of floweringregardless of the type of natural soil in which they weregrown, 12.5% when grown in type C soil, 14.3% whengrown in their own type (P . 0.05). When grown inpotting soil both races flowered well, 63% for race Aplants and almost 95% for race C. These results are pre-sented in Table 16.
These observations suggest that type A soil providesless than ideal growing conditions regardless of the seedsource. The particular nature of the stressing factors,whether based on soil chemistry, the physical propertiesof the soil, or some combination thereof cannot yet bedefined.
Germination and growth using soil extracts—Thefirst set of results from this study is presented in Table17, which shows that race A achenes germinate aboutequally well regardless of the nature of the irrigating so-lution (P . 0.05). On the other hand, race C achenesshowed a distinct sensitivity to the nature of irrigatingsolution, with ;80% germination with an extract fromits own soil type, or distilled water, but only ;62% whenirrigated with solution from type A soil (P , 0.005).
After 2 wk, the number of leaves that had developedwas scored. Approximately 30% of plants developingfrom race A achenes exhibited leaves regardless of thenature of the irrigating solution (P . 0.05). Two-thirdsof the achenes from race C plants developed leaves whenirrigated with either extract from type C soil or with dis-tilled water, whereas only ;40% of C achenes treatedwith type A soil extract developed leaves (P , 0.002).These results are presented in Table 18.
Seed bank study—Many species characteristic of theserpentine outcrop emerged during the first month of thestudy. Trays containing soils from the lower part of thetransect showed a lower species composition than trayscontaining soils from the upper part. Bottom soils weredominated by a species of Trifolium, and two species ofPoa were observed. No Lasthenia seedlings appeared.Emerging from upper soils were Plantago erecta Morris,Layia platyglossa (F. & M.) Gray, Brodiaea spp., Esch-scholzia californica Cham., Castilleja sp., and threegrasses. One L. californica seedling appeared. This in-dividual, found in a tray of upper soil, was a race C plant.The lack of viable achenes of L. californica in the seedbank indicates the importance of each year’s seed fall inthe establishment of a new population.
Achene dispersal—Observations on achene dispersalare also relevant. Observations in the field suggest thatachenes of L. californica do not disperse very far. Matureinflorescences usually break at the end of the pedicel justbelow the receptacle bringing about ;1808 twist, whichturns the inflorescence face down. A gentle tap or currentof air caused achenes to be dispersed ;5–8 cm from thebase of the mother plant with most achenes falling di-
1588 [Vol. 86AMERICAN JOURNAL OF BOTANY
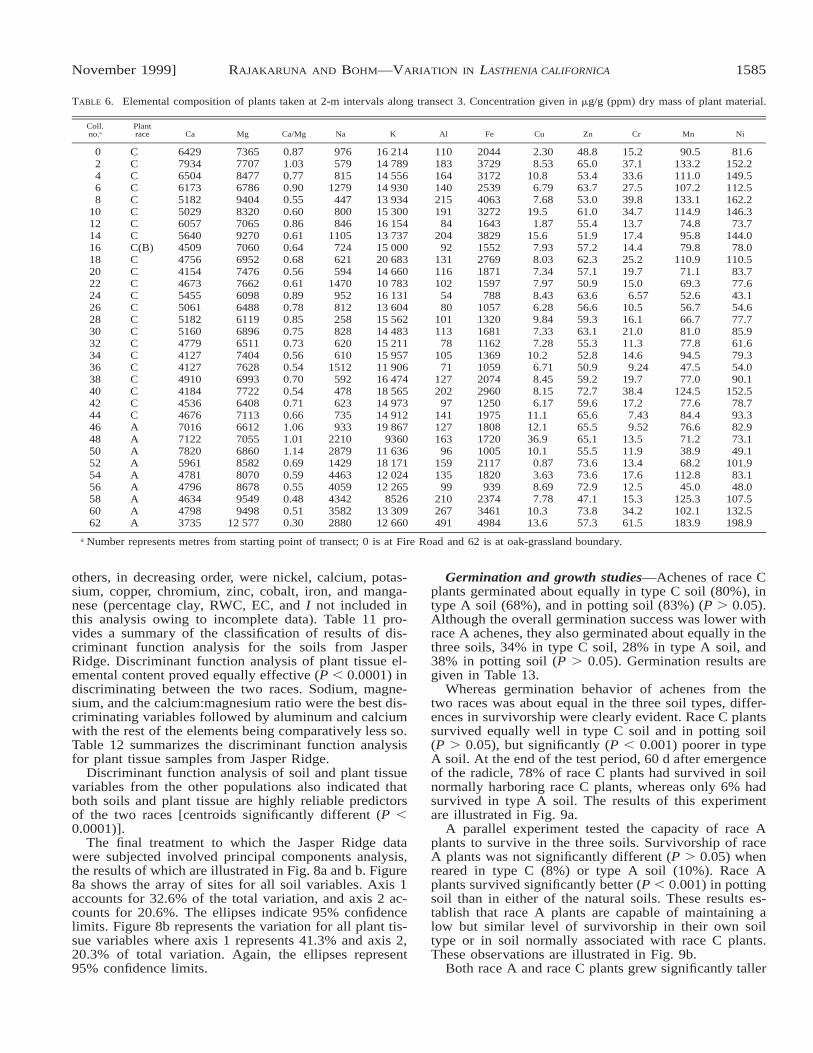
Fig. 6. Variation in plant tissue elemental composition as a function of distance along transect 3. (a) Magnesium, (b) sodium, (c) aluminum,(d) zinc, (e) potassium, (f) calcium, and (g) calcium : magnesium ratio.
rectly at the base. Achenes that do not fall directly to theground get trapped in tufts of grass found growing ad-jacent to the Lasthenia plants. During the latter stage ofthe life cycle of L. californica the serpentine outcrop isusually taken over by an abundance of perennial grasses,making it difficult for the achenes to disperse far fromthe maternal parent.
DISCUSSION
Unusual soil conditions can give rise to localized pat-terns of plant distribution (Kruckeberg, 1986). The clas-sic generalizations on the distribution of plants (Cain,1944) place the edaphic factor second only to climate asthe major environmental determinants of plant distribu-tion. The edaphic factor pertains to the substratum uponwhich the plant grows and from which it derives mineralnutrients and much of its water supply, and involvesphysical, chemical, and biological properties of soils(Mason, 1946a, b). Soils derived from ultramafic rocksprovide excellent opportunities to study the effects of theedaphic factor on plant distribution. Serpentine soils, de-rived from rocks such as serpentinite, are often shallowand rocky and exhibit physical and chemical propertiesthat strongly reflect the elemental composition of theirparent material. Iron, magnesium, and silicon are the ma-jor elements present with nickel, cobalt, and chromiumoften present in exceptional amounts. Serpentine soils
have high values of exchangeable magnesium and char-acteristically low values of exchangeable calcium. Thesesoils are usually deficient in nutrients such as nitrogen,phosphorus, potassium, boron, and molybdenum. Theyalso tend to have lower clay content and their cation-exchange capacities can be lower than normal (agricul-tural) soils; pH values are often high and can range from6.1 to 8.8 (Kruckeberg, 1984, 1992; Brooks, 1987; Brady,1990). In short, serpentine-derived soils can provide chal-lenging, if not outright hostile, environments for the ger-mination and successful growth of plants.
Lasthenia californica, a widespread mainly Californianspring annual, is a species capable of achieving more thanmere survival in serpentine-derived soils. It can coverlarge areas with a dense golden floral display in earlyspring (giving rise to the common name ‘‘goldfields’’).One of these large areas, the serpentine outcrop in theJasper Ridge Biological Preserve of Stanford University,attracted our attention a number of years ago as an idealsite for detailed studies of flavonoid variation. In additionto the size of the population and its existence on a ser-pentine substrate about which comparatively little wasknown at the time, the site offered protection from ‘‘de-velopment,’’ thus providing opportunity to establish along-term program of study.
The work described in this paper involves two differ-ent, but closely related, sets of observations. The first
November 1999] 1589RAJAKARUNA AND BOHM—VARIATION IN LASTHENIA CALIFORNICA
Fig. 6. Continued.
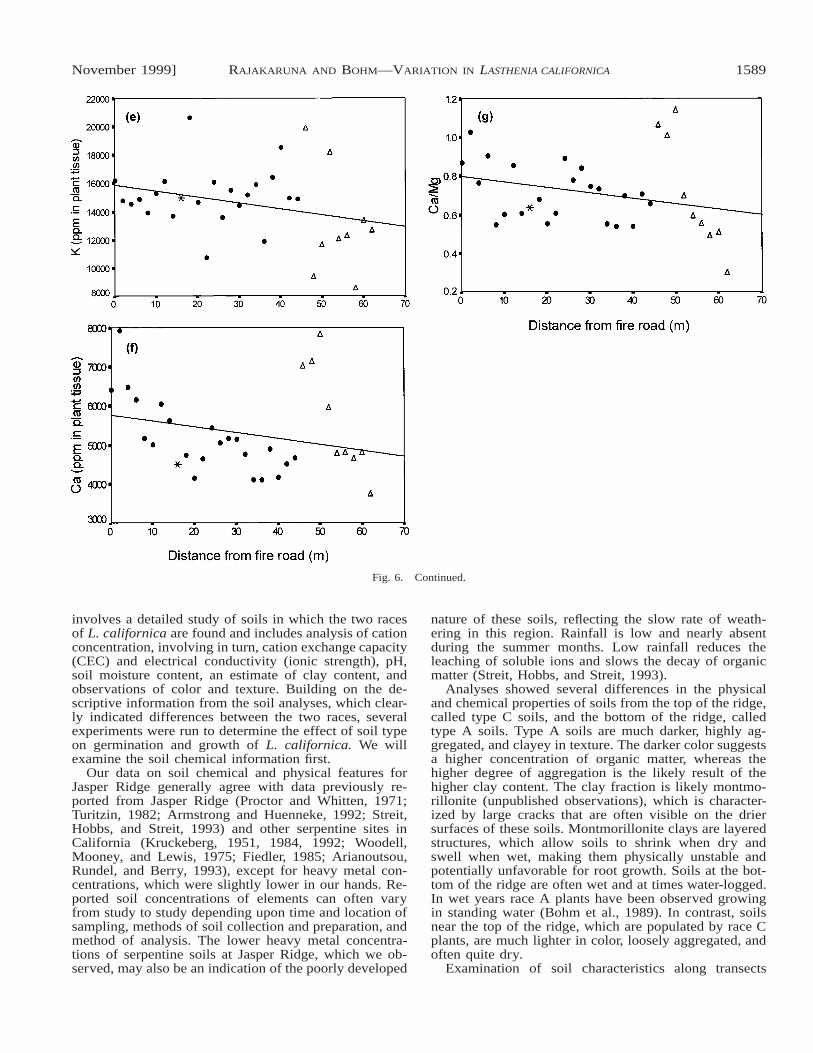
involves a detailed study of soils in which the two racesof L. californica are found and includes analysis of cationconcentration, involving in turn, cation exchange capacity(CEC) and electrical conductivity (ionic strength), pH,soil moisture content, an estimate of clay content, andobservations of color and texture. Building on the de-scriptive information from the soil analyses, which clear-ly indicated differences between the two races, severalexperiments were run to determine the effect of soil typeon germination and growth of L. californica. We willexamine the soil chemical information first.
Our data on soil chemical and physical features forJasper Ridge generally agree with data previously re-ported from Jasper Ridge (Proctor and Whitten, 1971;Turitzin, 1982; Armstrong and Huenneke, 1992; Streit,Hobbs, and Streit, 1993) and other serpentine sites inCalifornia (Kruckeberg, 1951, 1984, 1992; Woodell,Mooney, and Lewis, 1975; Fiedler, 1985; Arianoutsou,Rundel, and Berry, 1993), except for heavy metal con-centrations, which were slightly lower in our hands. Re-ported soil concentrations of elements can often varyfrom study to study depending upon time and location ofsampling, methods of soil collection and preparation, andmethod of analysis. The lower heavy metal concentra-tions of serpentine soils at Jasper Ridge, which we ob-served, may also be an indication of the poorly developed
nature of these soils, reflecting the slow rate of weath-ering in this region. Rainfall is low and nearly absentduring the summer months. Low rainfall reduces theleaching of soluble ions and slows the decay of organicmatter (Streit, Hobbs, and Streit, 1993).
Analyses showed several differences in the physicaland chemical properties of soils from the top of the ridge,called type C soils, and the bottom of the ridge, calledtype A soils. Type A soils are much darker, highly ag-gregated, and clayey in texture. The darker color suggestsa higher concentration of organic matter, whereas thehigher degree of aggregation is the likely result of thehigher clay content. The clay fraction is likely montmo-rillonite (unpublished observations), which is character-ized by large cracks that are often visible on the driersurfaces of these soils. Montmorillonite clays are layeredstructures, which allow soils to shrink when dry andswell when wet, making them physically unstable andpotentially unfavorable for root growth. Soils at the bot-tom of the ridge are often wet and at times water-logged.In wet years race A plants have been observed growingin standing water (Bohm et al., 1989). In contrast, soilsnear the top of the ridge, which are populated by race Cplants, are much lighter in color, loosely aggregated, andoften quite dry.
Examination of soil characteristics along transects
1590 [Vol. 86AMERICAN JOURNAL OF BOTANY
TABLE 7. Results of correlation analysis of soil and plant tissue con-centrations of elements.
ElementPlantrace r F
Calcium CA
0.320.45
P , 0.002P , 0.027
Magnesium CA
0.0050.49
P . 0.05P , 0.01
Ca/Mg CA
0.440.47
P , 0.0001P , 0.01
Sodium CA
0.2530.735
P , 0.015P , 0.0001
Potassium CA
0.2291.186
P , 0.03P . 0.05
Iron CA
0.1190.005
P . 0.05P . 0.05
Coppera CA
0.0080.077
P . 0.05P . 0.05
Manganese CA
0.0310.155
P . 0.05P . 0.05
Chromiuma CA
0.0650.207
P . 0.05P . 0.05
Nickel CA
0.0140.078
P . 0.05P . 0.05
Zinc CA
0.080.076
P . 0.05P . 0.05
a Linear model; others determined using the power model.
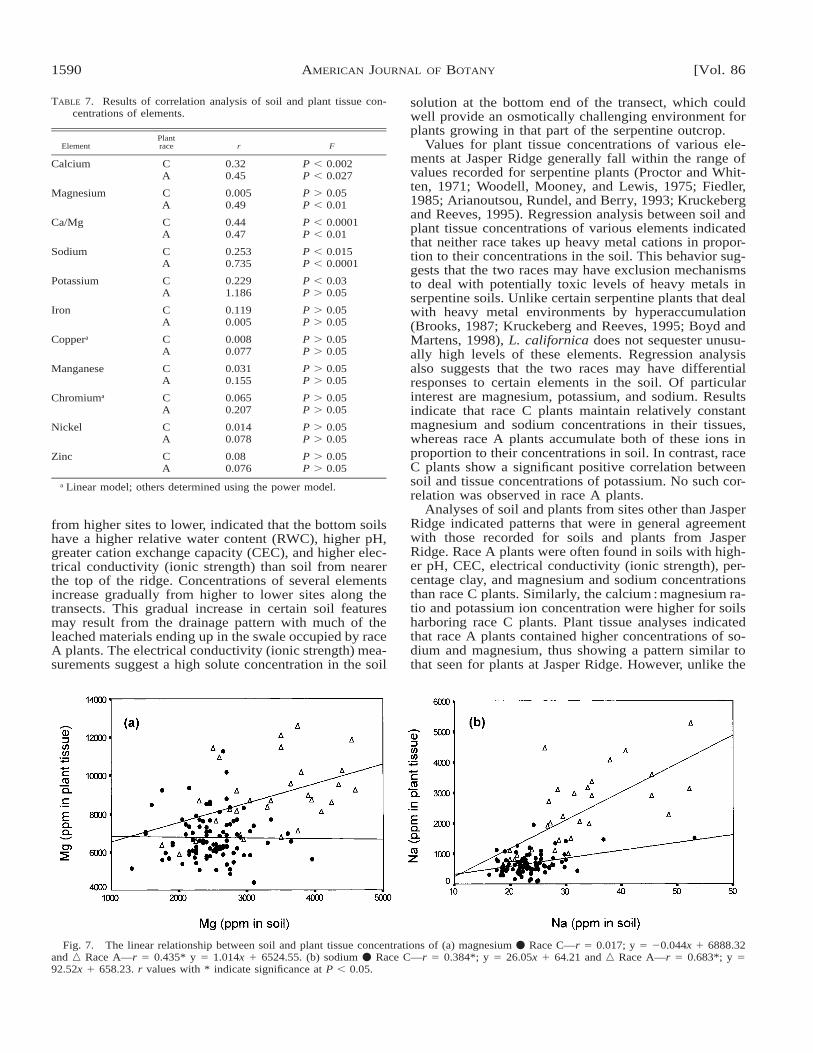
Fig. 7. The linear relationship between soil and plant tissue concentrations of (a) magnesium v Race C—r 5 0.017; y 5 20.044x 1 6888.32and n Race A—r 5 0.435* y 5 1.014x 1 6524.55. (b) sodium v Race C—r 5 0.384*; y 5 26.05x 1 64.21 and n Race A—r 5 0.683*; y 592.52x 1 658.23. r values with * indicate significance at P , 0.05.
from higher sites to lower, indicated that the bottom soilshave a higher relative water content (RWC), higher pH,greater cation exchange capacity (CEC), and higher elec-trical conductivity (ionic strength) than soil from nearerthe top of the ridge. Concentrations of several elementsincrease gradually from higher to lower sites along thetransects. This gradual increase in certain soil featuresmay result from the drainage pattern with much of theleached materials ending up in the swale occupied by raceA plants. The electrical conductivity (ionic strength) mea-surements suggest a high solute concentration in the soil
solution at the bottom end of the transect, which couldwell provide an osmotically challenging environment forplants growing in that part of the serpentine outcrop.
Values for plant tissue concentrations of various ele-ments at Jasper Ridge generally fall within the range ofvalues recorded for serpentine plants (Proctor and Whit-ten, 1971; Woodell, Mooney, and Lewis, 1975; Fiedler,1985; Arianoutsou, Rundel, and Berry, 1993; Kruckebergand Reeves, 1995). Regression analysis between soil andplant tissue concentrations of various elements indicatedthat neither race takes up heavy metal cations in propor-tion to their concentrations in the soil. This behavior sug-gests that the two races may have exclusion mechanismsto deal with potentially toxic levels of heavy metals inserpentine soils. Unlike certain serpentine plants that dealwith heavy metal environments by hyperaccumulation(Brooks, 1987; Kruckeberg and Reeves, 1995; Boyd andMartens, 1998), L. californica does not sequester unusu-ally high levels of these elements. Regression analysisalso suggests that the two races may have differentialresponses to certain elements in the soil. Of particularinterest are magnesium, potassium, and sodium. Resultsindicate that race C plants maintain relatively constantmagnesium and sodium concentrations in their tissues,whereas race A plants accumulate both of these ions inproportion to their concentrations in soil. In contrast, raceC plants show a significant positive correlation betweensoil and tissue concentrations of potassium. No such cor-relation was observed in race A plants.
Analyses of soil and plants from sites other than JasperRidge indicated patterns that were in general agreementwith those recorded for soils and plants from JasperRidge. Race A plants were often found in soils with high-er pH, CEC, electrical conductivity (ionic strength), per-centage clay, and magnesium and sodium concentrationsthan race C plants. Similarly, the calcium : magnesium ra-tio and potassium ion concentration were higher for soilsharboring race C plants. Plant tissue analyses indicatedthat race A plants contained higher concentrations of so-dium and magnesium, thus showing a pattern similar tothat seen for plants at Jasper Ridge. However, unlike the

November 1999] 1591RAJAKARUNA AND BOHM—VARIATION IN LASTHENIA CALIFORNICA
TABLE 8. Soil characteristics for 22 populations of L. californica other than Jasper Ridge. Elemental composition is given in mg/g soil (ppm).
Feature Race Mean 6 1 SE F Range
CEC (mmol of charge/100 g soil)
CA
21.1 6 2.429.5 6 3.5
P . 0.05 11.1–29.79.20–52.3
Percentage clay CA
16.1 6 2.024.0 6 2.8
P . 0.05 5.18–23.37.42–41.3
pH in H2O CA
5.64 6 0.166.42 6 0.15
P , 0.041 4.81–6.165.26–7.12
pH in CaCl2 CA
4.63 6 0.135.48 6 0.15
P , 0.0008 4.17–5.294.51–6.17
ECa (mS/cm) CA
0.45 6 0.471.06 6 0.29
P . 0.05 0.12–1.790.13–7.49
Ia (mmol/L) CA
5.66 6 2.1314.87 6 4.42
P . 0.05 1.19–26.181.34–111.72
Calcium CA
1275 6 2901234 6 185
P . 0.05 203–2750443–2850
Magnesium CA
280.6 6 78.41147 6 261
P , 0.024 25.0–650.052.0–2800
Calcium : magnesium CA
5.23 6 0.563.97 6 1.39
P . 0.05 2.62–8.10.24–17.0
Potassium CA
175.0 6 18.3386.0 6 56.6
P , 0.012 113–260.0170–758
Sodium CA
19.9 6 3.660.8 6 39.6
P . 0.05 11.3–42.01.75–553
Nickel CA
0.69 6 0.2316.2 6 7.6
P . 0.05 0.16–2.170.07–102
Zinc CA
2.49 6 0.553.43 6 1.33
P . 0.05 0.79–5.80.42–17.8
Iron CA
90.1 6 9.571.3 6 13.6
P . 0.05 5.6–1204.9–172.2
Manganese CA
45.8 6 7.536.2 6 4.0
P . 0.05 12.7–68.716.5–68.7
Chromium CA
0.002 6 0.0010.015 6 0.006
P . 0.05 0–0.0080–0.72
Cobalt CA
0.100 6 0.040.284 6 0.10
P . 0.05 0–1.260–0.26
Copper CA
2.09 6 0.252.11 6 0.34
P . 0.05 0.89–3.420.33–4.83
Cadmium CA
0.03 6 0.000.07 6 0.01
P . 0.05 0.02–0.050–0.21
a EC and I values are based on analyses of soil samples from a total of 37 populations. Included are 15 additional samples collected in 1998 fromcoastal bluffs, serpentine outcrops, and a vernal pool (13 race A and 2 race C). Approximate locations of these new populations are indicated inFig. 1.
situation at Jasper Ridge most means for the two raceswere not statistically significantly different. This was pos-sibly the result of the smaller sample size and the highvariation in the range of values from within each race.The high within-group variation may be partly due tocomparing samples growing on a variety of geologic sub-strates. Sodium, however, was again of special interest.Regression analysis indicated that race A plants had amuch higher positive correlation for soil and plant tissuesodium than race C plants. A more efficient sodium up-take system in race A plants may explain why racial dif-ferentiation in this species has resulted in the ability ofrace A plants to colonize areas subject to water stress, bethey coastal, desert, or characterized by more highly con-centrated soil solutions such as those found at Soda Lake
and at the bottom of the serpentine outcrop at JasperRidge.
Sodium is of particular interest because of the differentaccumulation behavior observed for the two races. Al-though both race A and race C plants grow in soils ofroughly similar sodium ion concentrations, race A plantsaccumulate sodium to at least three times the concentra-tion observed for race C plants. The level of sodium inrace A plants approximates that found in halophytes anddesert plants exposed to extreme water stress (Ravetta,McLaughlin, and O’Leary, 1997). The mechanism of ac-cumulation of sodium ion and the significance of its ac-cumulation in terms of survival value for the race Aplants requires additional detailed study but some spec-ulation is in order, especially in view of differences in

1592 [Vol. 86AMERICAN JOURNAL OF BOTANY
TABLE 9. Elemental analysis of plant tissue for samples from 22 pop-ulations other than Jasper Ridge. Concentration of elements is giv-en in mg/g dry mass (ppm).
Element Race Mean 6 1 SE F Range
Calcium CA
12 473 6 52710 844 6 1150
P . 0.05 1390–15 8905371–17 602
Magnesium CA
2715 6 1083707 6 268
P . 0.05 2338–32582019–7652
Ca/Mg CA
4.62 6 0.193.86 6 0.73
P . 0.05 3.80–5.370.70–8.03
Potassium CA
20 424 6 11 10017 960 6 1628
P . 0.05 14 640–24 640227–29 560
Sodium CA
358 6 21.9547.5 6 232
P . 0.05 270–460120–3830
Nickel CA
5.72 6 1.0211.4 6 3.8
P . 0.05 3.18–12.41.66–56.6
Aluminum CA
2426 6 397585 6 134
P , 0.0001 73.4–2117527–3551
Zinc CA
71.7 6 9.361.1 6 3.5
P . 0.05 40.6–112.535.4–83.7
Iron CA
1829 6 333876 6 173
P , 0.011 57.0–299228.0–2843
Manganese CA
283 6 4974.1 6 10.4
P , 0.0001 118–55628.9–157
Chromium CA
8.18 6 1.667.05 6 2.14
P . 0.05 2.15–21.20.92–21.7
Copper CA
11.1 6 0.59.34 6 0.5
P , 0.033 9.35–13.46.71–14.2
TABLE 11. Classification results from discriminant function analysis forsoils from Jasper Ridge.
Actual groupNumber of
cases
Predicted groupmembership
Race A Race C
Race ARace C
3093
24 (80%)3 (3.2%)
6 (20%)90 (96.8%)
TABLE 12. Classification results from discriminant function analysis forplant tissue samples from Jasper Ridge.
Actual groupNumber of
cases
Predicted groupmembership
Race A Race C
Race ARace C
3093
24 (80%)2 (2.2%)
6 (20%)91 (97.8%)
TABLE 10. Results of correlation analysis of soil and plant tissue con-centration of elements for 22 populations other than Jasper Ridge.
ElementPlantrace r F
Calcium CA
0.360.78
P . 0.05P , 0.024
Magnesium CA
0.310.81
P . 0.05P , 0.0004
Ca/Mg CA
0.910.94
P , 0.0001P , 0.0001
Sodium CA
0.230.87
P . 0.05P , 0.0001
Potassium CA
0.350.23
P . 0.05P . 0.05
Iron CA
0.220.13
P . 0.05P . 0.05
Copper CA
0.010.08
P . 0.05P . 0.05
Manganese CA
0.530.49
P . 0.05P . 0.05
Chromium CA
0.690.17
P 5 0.058P . 0.05
Nickel CA
0.960.92
P , 0.0001P , 0.0001
Zinc CA
0.160.57
P . 0.05P , 0.04
root mass observed between the two races in the fieldand greenhouse (data not included). Root mass of indi-vidual race A plants was consistently greater than indi-vidual race C plants. It is possible that race A plantsproduce a larger root mass in order to increase their ca-pacity to absorb water. It is possible that water, althoughpresent in chemically greater amounts in the lower soils,is not as biologically readily available owing to the natureof the soil. Although the soil at the bottom of the tran-sects is wetter, its higher clay content and more aggre-gated nature may combine to make water less availablefor uptake by race A plants. It is also possible that raceA plants have intrinsically greater demand for water andthat these differences reflect adaptations to meet this chal-lenge. The increased sodium ion uptake, resulting in amore favorable osmotic situation, coupled with greaterroot mass could be rationalized, then, as the means re-sorted to by these plants to survive in the desert-like,water-stressed environment. The sodium-accumulatingnature of the race A plants may help to explain how thisrace often successfully colonizes the coastal and desertsites that characterize the southern part of the range of L.californica. Studies of comparative root growth undercontrolled conditions are necessary (and underway) inorder to assess the differences in root mass. Work is alsounderway to study the physiology of sodium ion uptakeby the two races.
The detailed soil chemical analysis of Jasper Ridge in-dicated that, despite the sharp boundary between the tworaces of L. californica, there are no abrupt changes insoil chemistry along the transects. The observed changesin soil chemistry are gradual with certain elements andother soil features increasing or decreasing along eachtransect. Even though there were no sharply definedchanges in the separately tested soil characteristics, bothdiscriminant function analysis and principal componentsanalysis recognized the soils associated with race A andrace C plants as separate groups. It is interesting to spec-ulate that some factor, or combination of factors, gradesfrom higher sites on Jasper Ridge to lower sites such thata threshold condition exists near the transition point(;45 m) beyond which race C plants can no longer com-plete their life cycle (set seed). The threshold may in-volve the plants’ sensitivity to the increasing ionic con-

November 1999] 1593RAJAKARUNA AND BOHM—VARIATION IN LASTHENIA CALIFORNICA
Fig. 8. Results of principal components analysis for all (a) soil and (b) plant tissue variables tested at Jasper Ridge.
TABLE 14. Height (mm) of 3-wk-old race A and race C plants grownin different soils.
Plantrace
Soiltreatment
Height6 1 SE F
Race C type C soiltype A soilpotting soil
21.24 6 0.628.92 6 0.4573.3 6 2.01
P , 0.0001
Race A type C soiltype A soilpotting soil
12.6 6 1.28.58 6 2.0153.7 6 2.6
P , 0.0043
TABLE 13. Germination results for achenes of race A and race C plantsof L. californica from Jasper Ridge.
Plantrace
Soiltreatment
Percentagegermination
6 1 SE F Range
Race C type C soiltype A soilpotting soil
80 6 3.268 6 7.583 6 2.4
P . 0.05 76.7–90.056.7–90.076.7–86.7
Race A type C soiltype A soilpotting soil
34 6 4.628 6 4.438 6 3.2
P . 0.05 23.3–43.316.7–36.733.3–46.7
centration, increasing pH, larger concentration of clay inthe soil, the differently aggregated soil, apparent aridityof the soil, or, more likely, some combination of thesefactors.
Many studies in the past have documented sharpboundaries in single elements, especially heavy metals,leading to vegetation boundaries over short distances (re-viewed by Linhart and Grant, 1996). However, the pictureat Jasper Ridge suggests that gradual increases of a num-ber of soil characteristics, including organic substances,water content, pH, cation exchange capacity, the cationsthemselves, and soil conductivity, over a short distancemay have resulted in an extreme edaphic condition thatis inhospitable for race C plants. Race A plants may bemore tolerant of the extreme edaphic conditions near thebottom of the transect and are, thus, the only form thatcan colonize this habitat. The absence of race A plantson soils that support race C plants suggests that the latterare the more vigorous and outcompete the race A indi-viduals near the top of the ridge. These studies suggestthat no single factor can explain the pattern of occurrenceof the two races on Jasper Ridge. This seems a reasonableposition in view of the complexity of ecosystems that
function as multifactorial, holocoenotic systems (Kruck-eberg, 1984). Single-factor dependence is merely a sim-plifying device enabling the scientist to study the system.Thus, in addition to the already demonstrated array ofsoil differences, it is possible that other inorganic, organ-ic, or biotic factors (Tadros, 1957; Turkington and Aars-sen, 1984; Hopkins, 1987) may differ between ridge topand bottom.
Germination and growth studies clearly indicated high-er vigor of race C plants. This was evident from com-paring germination and growth potential of both plantraces in potting soil, the medium preferred by both racesover either natural soil. Here, race C plants showed anoverall higher percentage germination, survivorship, andgrowth than race A plants. This may be due to the nat-urally low vigor of race A plants or to the fact that it wasnot possible to provide optimal conditions for germina-tion and growth for race A plants in the greenhouse. Thepatterns observed with the greenhouse studies are insome ways comparable to certain patterns observed instudies done on species pairs growing on and off serpen-tine (Kruckeberg, 1951, 1954, 1967), calcareous (Snay-don, 1962), and metal-contaminated sites (Cook, Le-febve, and McNeilly, 1972; Hickey and McNeilly, 1975).

1594 [Vol. 86AMERICAN JOURNAL OF BOTANY
Fig. 9. Survivorship of (a) race C and (b) race A plants in ridge top (type C soil), bottom (type A soil), and potting soils. Percentage valuesare based on 30 achenes per dish 3 4 dishes per treatment.
TABLE 15. Number of leaves in 3-wk-old race A and race C plantsgrown in different soils.
Plantrace
Soiltreatment
Number of leavesper plant 6 1 SE F
Race C type C soiltype A soilpotting soil
7.08 6 0.594.28 6 0.18
18.87 6 7.93
P , 0.0001
Race A type C soiltype A soilpotting soil
4.9 6 0.344.42 6 0.25
10.09 6 0.28
P , 0.0001
TABLE 17. Percentage of race A and race C achenes with radiclegrowth 8 d after treatment with aqueous extracts of type A andtype C soils.
Plantrace
Solutiontreatment
Percentage ofachenes with
radicle growth6 1 SE F
Race C type C solutiontype A solutiondistilled water
80.0 6 2.761.7 6 1.776.7 6 4.3
P , 0.005
Race A type C solutiontype A solutiondistilled water
57.0 6 3.347.0 6 4.743.0 6 4.3
P . 0.05
TABLE 18. Percentage of race A and race C plants, grown on irrigatedfilter paper, that had leaves 14 d after sowing.
Plantrace
Solutiontreatment
Percentage ofplants with
leaves 6 1 SE F
Race C type C solutiontype A solutiondistilled water
66.7 6 2.741.7 6 3.266.7 6 2.7
P , 0.002
Race A type C solutiontype A solutiondistilled water
28.3 6 4.231.7 6 3.230.0 6 4.3
P . 0.05
TABLE 16. Percentage of race A and race C plants grown in differentsoils that had inflorescences 45 d after germination.
Plantrace
Soiltreatment
Percentage ofplants with
inflorescences6 1 SE F
Race C type C soiltype A soilpotting soil
72.0 6 5.50
94.9 6 1.9
P , 0.0001
Race A type C soiltype A soilpotting soil
12.5 6 1.914.3 6 1.663.0 6 5.4
P , 0.0001
Race A plants growing in the ridge-bottom soils are morelike the ‘‘stress-tolerant’’ races of these previous studies,showing low vigor but an indifference to the soil in whichthey were grown. Race C plants best fit the ‘‘stress-in-tolerant’’ category, growing well in their own soil butpoorly in the soil harboring the other race.
Ecological (extreme habitats) and physiological evi-dence (higher tissue sodium and greater root mass) so fardocumented support the possibility that race A may be amore stress-tolerant race. There is some evidence in theliterature that the occurrence of sulfated flavonoids inplants seems to have some relationship to the type ofhabitat in which they grow (Harborne, 1975; Barron etal., 1988), occurring in plants growing under water-logged or saline conditions. In this regard, it is interestingto note that race A plants found in coastal, desert, orserpentine soils (including the lower transect area in Jas-per Ridge) contain sulfated flavonoids. This is the main
feature distinguishing the flavonoid profiles of the tworaces of L. californica. It is not clear, however, whethersulfated flavonoids play an actual role in these systems.However, experiments done on Zostera (Zosteraceae), asalt-tolerant plant, suggest that flavonoid sulfates mayhave an active function in salt uptake and metabolism(Nissen and Benson, 1964).
The challenges provided to plants by soils derivedfrom ultramafic rock have been widely documented inthe literature (Proctor and Woodell, 1975; Kruckeberg,1984, 1992; Brooks, 1987). It is not unusual to see thesesituations described as ‘‘stressful.’’ Yet, stress is not aneasy term to define. A situation in which a plant expe-riences extremes of temperature, limited water, the ab-sence of essential nutrients, or is exposed to toxic sub-stances or high herbivore activity, can be described asstressful. Since many plants obviously have the capacity

November 1999] 1595RAJAKARUNA AND BOHM—VARIATION IN LASTHENIA CALIFORNICA
to survive under one or a combination of these condi-tions, the botanist’s goal is to determine how they do it.This is what we are attempting to do in the case of Las-thenia californica, some populations of which appearwell adapted for living on serpentine-derived soils. Ourstudies have documented that two physiologically differ-entiated races coexist on the serpentine outcrop at JasperRidge—one race occupying the less stressful ridge-topsoils, and the other occupying the more extreme environ-ment at the bottom of the ridge. Plants at the bottom ofthe ridge exhibit adaptations normally seen in plants inwater-stress situations (desert-like), much enlarged rootmass, and capacity for accumulation of sodium ions.Limitation of the availability of water is likely associatedwith the significantly higher clay content of the ridge-bottom soil. This soil also shows a greater tendency tocrack, which is expected with clayey soils. Ionic toxicity(heavy metal or other) is another possibility, as indicatedby growth experiments using soil extracts. The presenceof toxic organic material cannot be ruled out. Both thesepossibilities are under investigation.
The combination of differential responses to edaphicconditions, the low level of crossability (data not includ-ed), and the markedly different flowering times stronglysuggest that two different biological entities exist at theJasper Ridge site, and by inference, across a wider rangeof occurrence of the species. This collection of differ-ences, along with the restricted range of achene dispers-ability and the limitations of the seed bank, may contrib-ute to maintaining the sharp boundary observed betweenthe two races at the Jasper Ridge site. Although the racialdifferences discussed in this paper, combined with earlierobservations on allozyme and flavonoid profiles of thetwo races of Lasthenia californica, would appear suffi-cient to address the subject of speciation, we will post-pone that discussion until the study of breeding behavior,currently underway, has been completed.
LITERATURE CITED
ALVA, A. K., M. E. SUMNER, AND W. P. MILLER. 1991. Relationshipbetween ionic strength and electrical conductivity for soil solutions.Soil Science 152: 239–242.
ARIANOUTSOU, M., P. W. RUNDEL, AND W. L. BERRY. 1993. Serpentineendemics as biological indicators of soil elemental concentrations.In B. Markert [ed.], Plants as biomonitors. Indicators for heavymetals in terrestrial environment. VCH, Weinheim, Germany.
ARMSTRONG, J. K., AND L. F. HUENNEKE. 1992. Spatial and temporalvariation in species composition in California grasslands: the in-teraction of drought and substratum. In A. J. M. Baker, J. Proctor,and R. D. Reeves [eds.], The vegetation of ultramafic (serpentine)soils. Intercept, Andover, Hampshire, UK.
BARRON, D., L. VARIN, R. K. IBRAHIM, J. B. HARBORNE, AND C. A.WILLIAMS. 1988. Sulfated flavonoids—an update. Phytochemistry27: 2375–2395.
BLACK, C. A., D. D. EVANS, J. L. WHITE, L. E. ENSMINGER, AND F. E.CLARK. 1965. Methods of soil analysis. Part 2. Chemical and mi-crobial properties. American Society of Agronomy, Inc., Madison,WI.
BOHM, B. A. 1987. Intraspecific flavonoid variation. Botanical Review53: 197–279.
———, A. HERRING, K. W. NICHOLLS, L. R. BOHM, AND R. ORNDUFF.1989. A six-year study of flavonoid distribution in a population ofLasthenia californica (Asteraceae). American Journal of Botany76: 157–162.
———, N. A. M. SALEH, AND R. ORNDUFF. 1974. The flavonoid chem-
istry of Lasthenia (Compositae). American Journal of Botany 61:551–561.
BOYD, R. S., AND S. N. MARTENS. 1998. Nickel hyperaccumulation byThlaspi montanum var. montanum (Brassicaceae): A constitutivetrait. American Journal of Botany 85: 259–265.
BRADY, N. C. 1990. The nature and properties of soils, 10th ed. Mac-millan, New York, NY.
BROOKS, R. R. 1987. Serpentine and its vegetation: a multidisciplinaryapproach. Dioscorides Press, Portland, OR.
CAIN, S. A., 1944. Foundations of plant geography. Harper, New York,NY.
COOK, S. C. A., C. LEFEBVE, AND T. MCNEILLY. 1972. Competitionbetween metal tolerant and normal populations on normal soil. Evo-lution 26: 366–372.
DESROCHERS, A. M. 1992. A biosystematic study of Lasthenia califor-nica (Asteraceae). Ph.D. dissertation, University of British Colum-bia, Vancouver, British Columbia, Canada.
———, AND B. A. BOHM. 1993. Flavonoid variation in Lasthenia cal-ifornica. Biochemical Systematics and Ecology 21: 449–453.
———, AND ———. 1995. Biosystematic study of Lasthenia califor-nica (Asteraceae). Systematic Botany 20: 65–84.
FIEDLER, P. L. 1985. Heavy metal accumulation and the nature ofedaphic endemism in the genus Calochortus (Liliaceae). AmericanJournal of Botany 72: 1712–1718.
JENNY, H. 1941. Factors of soil formation, a system of quantitativepedology. McGraw Hill, New York, NY.
HARBORNE, J. B. 1975. Flavonoid sulfates: A new class of sulfur com-pounds in higher plants. Phytochemistry 14: 1147–1155.
HICKEY, D. A., AND T. MCNEILLY. 1975. Competition between metaltolerant and normal populations: a field experiment in normal soils.Evolution 29: 458–464.
HOPKINS, N. A. 1987. Mycorrhizae in a California serpentine grasslandcommunity. Canadian Journal of Botany 65: 484–487.
KALRA, Y. P., AND D. G. MAYNARD. 1991. Methods manual for forestsoil and plant analysis. Information report NOR-X-319. ForestryCanada, Northwest region, Edmonton, Alberta, Canada.
KARIS, P. O., AND O. RYDING. 1994. Tribe Helenieae. In K. Bremer[ed.], Asteraceae: cladistics and classification, 521–558. TimberPress, Portland, OR.
KRUCKEBERG, A. R. 1951. Intraspecific variability in the response ofcertain native plants to serpentine soil. American Journal of Botany38: 408–419.
———. 1954. The ecology of serpentine soils: a symposium. III. Plantspecies in relation to serpentine soils. Ecology 35: 267–274.
———. 1967. Ecotypic response to ultramafic soils by some plantspecies of Northwestern United States. Brittonia 19: 133–151.
———. 1969. Soil diversity and the distribution of plants, with ex-amples from western North America. Madrono 20: 129–154.
———. 1984. California serpentines: flora, vegetation, geology, soils,and management problems. University of California Press, Berke-ley, CA.
———. 1986. An essay: the stimulus of unusual geologies for plantspeciation. Systematic Botany 11: 455–463.
———. 1992. Plant life of western North American ultramafics. In B.A. Roberts and J. Proctor [eds.], The ecology of areas with serpen-tinized rock: a world view, 31–73. Kluwer Academic Publications,London, UK.
———, AND R. D. REEVES. 1995. Nickel accumulation by serpentinespecies of Streptanthus (Brassicaceae): field and greenhouse stud-ies. Madrono 42: 458–469.
LINDSAY, W. L., AND W. A. NORVELL. 1978. Development of a DTPAsoil test for zinc, iron, manganese, and copper. Journal of the SoilScience Society of America 42: 421–428.
LINHART, Y. B., AND M. C. GRANT. 1996. Evolutionary significance oflocal genetic differentiation in plants. Annual Review of Ecologyand Systematics 27: 237–277.
MASON, H. 1946a. The edaphic factor in narrow endemism. 1. Thenature of environmental influences. Madrono 8: 209–226.
———. 1946b. The edaphic factor in narrow endemism. 2. The geo-graphic occurrence of plants in highly restricted patterns of distri-bution. Madrono 8: 241–257.
MAYER, M. S., AND P. S. SOLTIS. 1994. The evolution of serpentine

1596 [Vol. 86AMERICAN JOURNAL OF BOTANY
endemics: a chloroplast DNA phylogeny of the Streptanthus glan-dulosus complex (Cruciferae). Systematic Botany 19: 557–574.
MUNSELL SOIL COLOR CHARTS. 1992. Macbeth Division of KollmorgenInstruments Corporation, revised ed. Newburgh, New York, NY.
NISSEN, P., AND A. A. BENSON. 1964. Absence of selenate esters and‘‘selenolipid’’ in plants. Biochimica et Biophysica Acta 82: 400–402.
NORUSIS, M. J. 1993. SPSS for windows: base system user’s guiderelease 6.0. SPSS Inc., Chicago, IL.
ORNDUFF, R. 1966. A biosystematic survey of the Goldfield genus Las-thenia (Compositae: Helenieae). University of California Publica-tions in Botany 40: 1–92.
PAGE, A. L., R. H. MILLER, AND D. R. KEENEY. 1982. Methods of soilanalysis, Part 2, Chemical and microbial properties, 281–283. SoilScience Society of America, Inc. Madison, WI.
PROCTOR, J., AND K. WHITTEN. 1971. A population of the Valley PocketGopher (Thomomys bottae) on a serpentine soil. American MidlandNaturalist 85: 517–521.
———, AND S. R. J. WOODELL. 1975. The ecology of serpentine soils.Advances in Ecological Research 9: 255–366.
RAVETTA, D. A., S. P. MCLAUGHLIN, AND J. W. O’LEARY. 1997. Eval-uation of salt tolerance and resin production in coastal and centralvalley accessions of Grindelia species (Asteraceae). Madrono 44:74–88.
SNAYDON, R. W. 1962. The growth and competitive ability of contrast-ing natural populations of Trifolium repens L. on calcareous andacid soils. Journal of Ecology 50: 439–447.
STREIT, B., R. J. HOBBS, AND S. STREIT. 1993. Plant distributions andsoil chemistry at a serpentine/non-serpentine boundary in Califor-nia. In B. Markert [ed.], Plants as biomonitors: indicators for heavymetals in terrestrial environment. VCH, Weinheim, Germany.
TADROS, T. M. 1957. Evidence of the presence of an edapho-bioticfactor in the problem of serpentine tolerance. Ecology 38: 14–23.
TURITZIN, S. N. 1982. Nutrient limitation to plant growth in a Californiaserpentine grassland. American Midland Naturalist. 107: 95–99.
TURKINGTON, R., AND L. W. AARSSEN. 1984. Local-scale differentiationas a result of competitive interactions. In R. Dirzo and J. Sarukhan[eds.], Perspectives in plant population ecology. Sinauer, Sunder-land, MA.
UBC SOIL SCIENCE LABORATORY MANUAL. 1981. Methods manual. Pe-dology Laboratory. Department of Soil Science, University of Brit-ish Columbia, Vancouver, British Columbia, Canada.
WILKINSON, L., M. HILL, AND E. VANG. 1992. SYSTAT: statistics, ver-sion 5.2 edition. SYSTAT INC., Evanston, IL.
WOODELL, S. R. J., H. A. MOONEY, AND H. LEWIS. 1975. The adaptationto serpentine soils in California of the annual species Linanthusandrosaceus (Polemoniaceae). Bulletin of the Torrey BotanicalClub 102: 232–238.