Economics of Fertilizer Utilization in Small-Scale Farming ...
133
Give to AgEcon Search The World’s Largest Open Access Agricultural & Applied Economics Digital Library This document is discoverable and free to researchers across the globe due to the work of AgEcon Search. Help ensure our sustainability. AgEcon Search http://ageconsearch.umn.edu [email protected] Papers downloaded from AgEcon Search may be used for non-commercial purposes and personal study only. No other use, including posting to another Internet site, is permitted without permission from the copyright owner (not AgEcon Search), or as allowed under the provisions of Fair Use, U.S. Copyright Act, Title 17 U.S.C.
-
Upload
khangminh22 -
Category
Documents
-
view
1 -
download
0
Transcript of Economics of Fertilizer Utilization in Small-Scale Farming ...
Give to AgEcon Search
The World’s Largest Open Access Agricultural & Applied Economics Digital Library
This document is discoverable and free to researchers across the globe due to the work of AgEcon Search.
Help ensure our sustainability.
AgEcon Search http://ageconsearch.umn.edu
Papers downloaded from AgEcon Search may be used for non-commercial purposes and personal study only. No other use, including posting to another Internet site, is permitted without permission from the copyright owner (not AgEcon Search), or as allowed under the provisions of Fair Use, U.S. Copyright Act, Title 17 U.S.C.
Economics of Fertilizer Utilization in Small-Scale Farming Systems
and Appropriate Role for Policy
By
Gutsa Freeman
A Thesis Submitted in Partial Fulfillment of the Requirements for the Degree of Masters of
Science in Agricultural and Applied Economics
Department of Agricultural Economics and Extension
Faculty of Agriculture
University of Zimbabwe
August 2010
- 2 -
UNIVERSITY OF ZIMBABWE
FACULTY OF AGRICULTURE
The undersigned certify that they have read, and recommended to the Department of Agricultural
Economics and Extension for acceptance, the thesis entitled:
Economics of fertilizer utilization in small-scale farming systems and appropriate
role for policy
Submitted by Gutsa Freeman in partial fulfillment of the requirements for the degree of
Masters of Science in Agricultural and Applied Economics
Approved:
.......................................................................
Chairperson: Dr. Mutambara
……………………………….. ………………………………………
Supervisor: Mr. Chamboko Associate Supervisor: Dr. Zvinavashe
…………………………………
Date

- 3 -
DEDICATION
To Natasha my lovely sister
- 4 -
ABSTRACT
Upholding increased adoption and utilization of superior agricultural technologies such as
inorganic fertilizers has become the panacea and the real option to revitalize the agricultural
sector in Zimbabwe. This research study focuses on the supply side issues determining the
demand of the inorganic fertilizers by small-scale farming communities. The main objective is to
carry out a comparative institutional performance evaluation of the government of Zimbabwe’s
fertilizer input support and the private input supply systems. It is argued that the fertilizer
marketing channel used by small-scale farmers to obtain the input plays a critical role in
influencing the utilization of the input and subsequent performance of the farming community. A
survey was administered to 200 farmers randomly selected in Mashonaland Central Province.
Tobit, Probit and Logistical Regression Models were employed as data analysis tools. Also, the
Institutional Analysis and Development Framework was used and key characteristics of the
farmers were examined disaggregated by the fertilizer marketing channel used to acquire the
input. Performance was measured using crop production and asset ownership variables.
The major finding of this study is that untargeted public provision of fertilizer has severely
undermined the free market system through the crowding out effect. It has contributed to
timeliness failures, operational inefficiencies, growing political interference, heavy reliance on
handouts, and availability problems. The study recommends the development of a detailed
national fertilizer sub-sector policy that is carefully integrated with a comprehensive agricultural
policy. There is need for reconstruction of efficient institutions and new ‘social capital’ that will
ensure the proper functioning of fertilizer markets in the countryside. To minimize the exposure
to food insecurity of vulnerable segments, government and other development partners are
encouraged to make use of non-market distorting interventions such as making the beneficiaries
work at public works projects for fertilizer vouchers which are locally redeemable at any of the
agro-dealer retail outlets.

- 5 -
ACKNOWLEDGEMENTS
I would like to express my sincere gratitude to Mr. Chamboko, Dr. R. Mano and Dr. Zvinavashe
for the tireless support and inspirational supervision, their guidance throughout the research
study is deeply appreciated.
Help has been received from so many colleagues, lecturers at other institutions, and also
students, that it is impractical to name them all. Still some of them should be explicitly
mentioned: Prof. J. Kirsten (University of Pretoria), Dr. T. S. Hyuha (Makerere University), Mr.
Chiwashira, H. Ntuli, A. Majuru and S. Mazani (fellow students), all working together to perfect
my thesis.
Special thanks are extended to Miss. E. Bema from the Ministry of Agricultural Mechanization
and Irrigation Development, Department of Research and Specialist Services for her unwavering
support.
I also want to thank my parents and the entire family for assisting me in my studies
My special thanks also go to the enumerators who braced the volatile political environment, went
ahead, and administered the questionnaire in the district under study.
May God bless you all!
Finally, my praises goes to the Almighty God for guiding me throughout the entire course of my
study.
- 6 -
CONTENTS
ABSTRACT ........................................................................................................................... - 4 -
ACKNOWLEDGEMENTS ................................................................................................... - 5 -
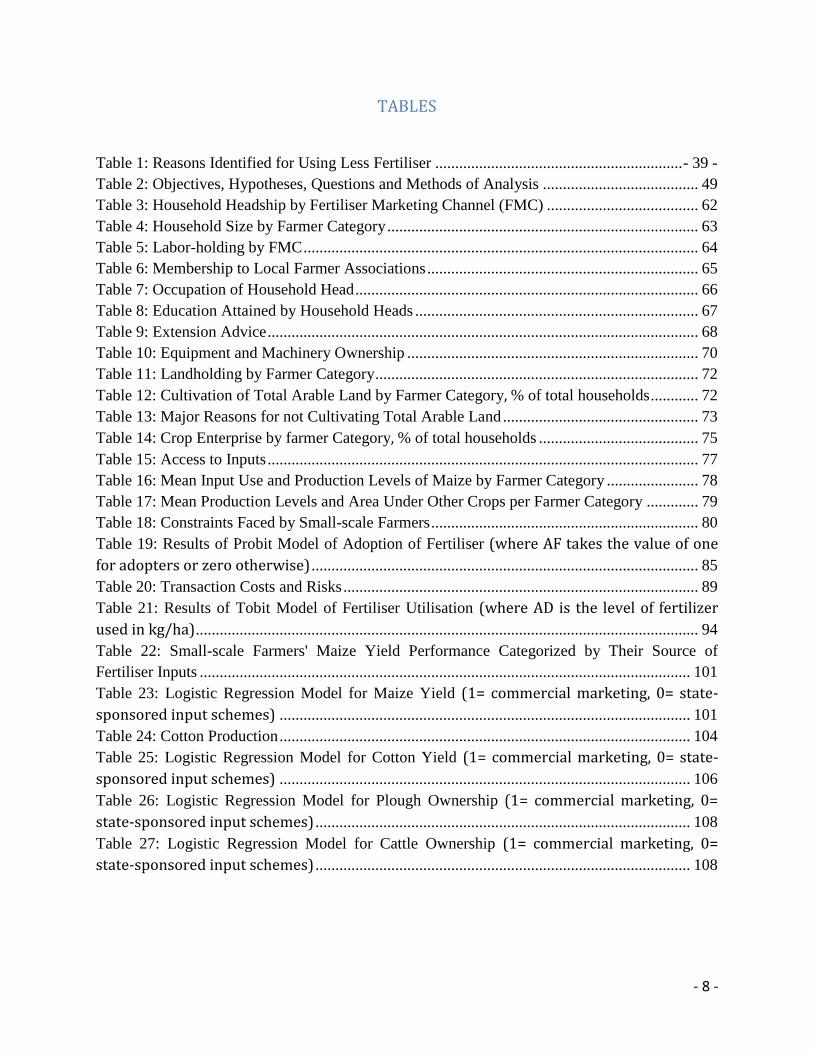
TABLES ................................................................................................................................. - 8 -
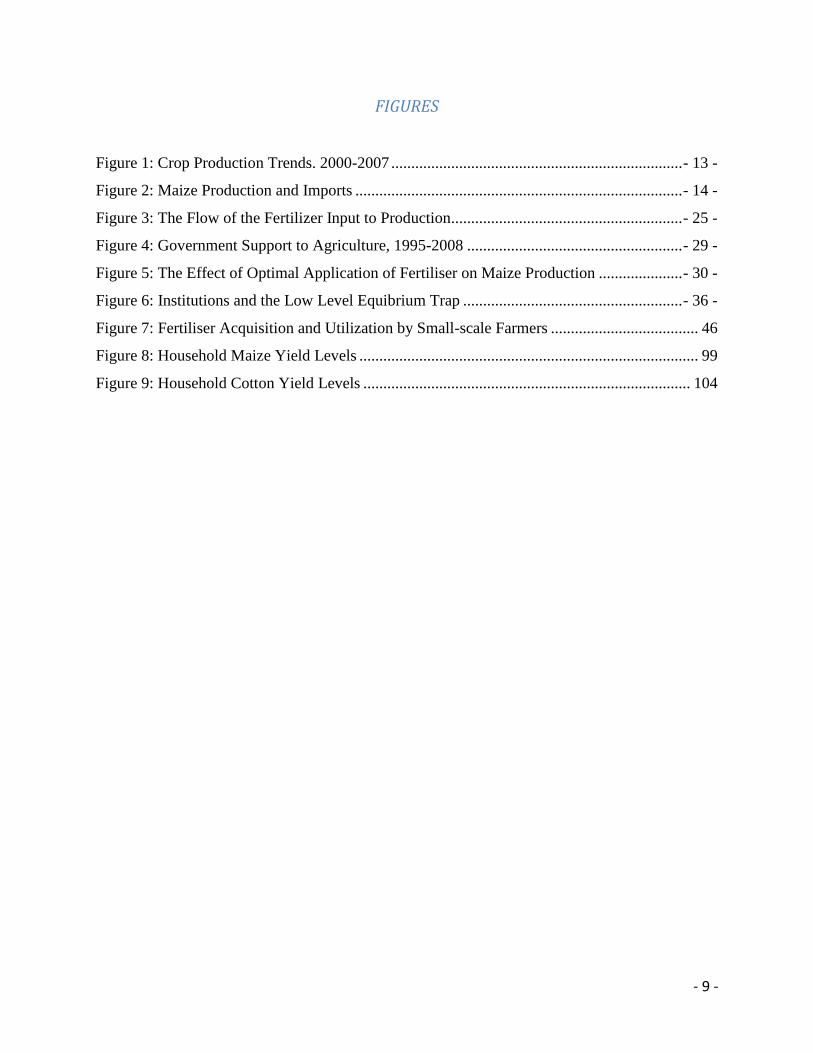
FIGURES ............................................................................................................................... - 9 -
CHAPTER ONE .................................................................................................................. - 11 -
INTRODUCTION ............................................................................................................... - 11 -
1.1. Introduction ....................................................................................................... - 11 -
1.2. Background ....................................................................................................... - 12 -
1.3. Specific Policy Pursuits .................................................................................... - 15 -
1.4. Problem Statement ............................................................................................ - 20 -
1.5. Research Objectives, Questions and Hypotheses ............................................. - 21 -
1.6. Justification of the study ................................................................................... - 22 -
1.7. Organization of the study .................................................................................. - 22 -
1.8. Summary ........................................................................................................... - 23 -
CHAPTER TWO ................................................................................................................. - 24 -
LITERATURE REVIEW..................................................................................................... - 24 -
2.1. Introduction ....................................................................................................... - 24 -
2.2. An Overview of the Agricultural Inputs Sector in Zimbabwe .......................... - 24 -
2.3. Theoretical Issues on Fertilizer Utilization ....................................................... - 30 -
2.4. Review of Key Theoretical Concepts ............................................................... - 31 -
2.5. Small-Scale Farmer Fertilizer Utilization and Decision Making ..................... - 38 -
2.6. Insights from Literature .................................................................................... - 40 -
2.7. Summary ........................................................................................................... - 41 -
CHAPTER THREE .............................................................................................................. - 42 -
RESEARCH METHODS .................................................................................................... - 42 -
3.1. Introduction ....................................................................................................... - 42 -
3.2. Conceptual Framework ..................................................................................... - 42 -
3.3. Study Area ............................................................................................................ 48
3.4. Analytical Framework .......................................................................................... 48
3.5. Research Design.................................................................................................... 58
3.6. Research Procedure ............................................................................................... 59
3.7. Chapter Summary ................................................................................................. 59
CHAPTER FOUR .................................................................................................................... 61
COMPARATIVE CHARACTERISATION OF SMALL-SCALE FARMERS ..................... 61
4.1. Introduction ........................................................................................................... 61
4.2. Household Organization and General Characteristics .......................................... 61
4.3. Household size and labor supply systems ............................................................. 63
4.4. Personality Factors ................................................................................................ 65

- 7 -
4.5. Asset Ownership of Households by FMC ............................................................ 69
4.6. Land Cultivation ................................................................................................... 71
4.7. Crop Production .................................................................................................... 74
4.8. Constraints Limiting Agricultural Production ...................................................... 79
4.9. Chapter Summary ................................................................................................. 80
CHAPTER FIVE ...................................................................................................................... 84
ECONOMETRIC ANALYSIS OF FACTORS AFFECTING LIKELIHOOD AND
INTENSITY OF FERTILIZER UTILISATION ..................................................................... 84
5.1. Introduction ........................................................................................................... 84
5.2. Effectiveness of a fertilizer marketing system ...................................................... 84
5.3. Fertilizer utilization by small-scale farmers ......................................................... 85
5.4. Chapter Summary ................................................................................................. 97
CHAPTER SIX ........................................................................................................................ 99
COMPARATIVE ANALYSIS OF PERFORMANCE OF SMALL-SCALE FARMERS ..... 99
6.1. Introduction ........................................................................................................... 99
6.2. Crop Productivity .................................................................................................. 99
6.3. Asset Ownership ................................................................................................. 107
6.4. Chapter Summary ............................................................................................... 109
CHAPTER SEVEN ................................................................................................................ 111
SUMMARY, CONCLUSION AND POLICY RECOMMENDATIONS ............................ 111
7.1. Introduction ......................................................................................................... 111
7.2. Summary of Key Findings .................................................................................. 111
7.3. Conclusion of the study ...................................................................................... 113
7.4. Policy Recommendations.................................................................................... 115
7.5. Limitation of the study ........................................................................................ 117
References .............................................................................................................................. 118
ANNEX A .............................................................................................................................. 122
Household Questionnaire ................................................................................................... 122
- 8 -
TABLES
Table 1: Reasons Identified for Using Less Fertiliser .............................................................. - 39 -
Table 2: Objectives, Hypotheses, Questions and Methods of Analysis ....................................... 49
Table 3: Household Headship by Fertiliser Marketing Channel (FMC) ...................................... 62
Table 4: Household Size by Farmer Category .............................................................................. 63
Table 5: Labor-holding by FMC ................................................................................................... 64
Table 6: Membership to Local Farmer Associations .................................................................... 65
Table 7: Occupation of Household Head ...................................................................................... 66
Table 8: Education Attained by Household Heads ....................................................................... 67
Table 9: Extension Advice ............................................................................................................ 68
Table 10: Equipment and Machinery Ownership ......................................................................... 70
Table 11: Landholding by Farmer Category ................................................................................. 72
Table 12: Cultivation of Total Arable Land by Farmer Category, % of total households ............ 72
Table 13: Major Reasons for not Cultivating Total Arable Land ................................................. 73
Table 14: Crop Enterprise by farmer Category, % of total households ........................................ 75
Table 15: Access to Inputs ............................................................................................................ 77
Table 16: Mean Input Use and Production Levels of Maize by Farmer Category ....................... 78
Table 17: Mean Production Levels and Area Under Other Crops per Farmer Category ............. 79
Table 18: Constraints Faced by Small-scale Farmers ................................................................... 80
Table 19: Results of Probit Model of Adoption of Fertiliser (where AF takes the value of one
for adopters or zero otherwise) ................................................................................................. 85
Table 20: Transaction Costs and Risks ......................................................................................... 89
Table 21: Results of Tobit Model of Fertiliser Utilisation (where AD is the level of fertilizer
used in kg/ha) .............................................................................................................................. 94
Table 22: Small-scale Farmers' Maize Yield Performance Categorized by Their Source of
Fertiliser Inputs ........................................................................................................................... 101
Table 23: Logistic Regression Model for Maize Yield (1= commercial marketing, 0= state-
sponsored input schemes) ....................................................................................................... 101
Table 24: Cotton Production ....................................................................................................... 104
Table 25: Logistic Regression Model for Cotton Yield (1= commercial marketing, 0= state-
sponsored input schemes) ....................................................................................................... 106
Table 26: Logistic Regression Model for Plough Ownership (1= commercial marketing, 0=
state-sponsored input schemes) .............................................................................................. 108
Table 27: Logistic Regression Model for Cattle Ownership (1= commercial marketing, 0=
state-sponsored input schemes) .............................................................................................. 108
- 9 -
FIGURES
Figure 1: Crop Production Trends. 2000-2007 ......................................................................... - 13 -
Figure 2: Maize Production and Imports .................................................................................. - 14 -
Figure 3: The Flow of the Fertilizer Input to Production.......................................................... - 25 -
Figure 4: Government Support to Agriculture, 1995-2008 ...................................................... - 29 -
Figure 5: The Effect of Optimal Application of Fertiliser on Maize Production ..................... - 30 -
Figure 6: Institutions and the Low Level Equibrium Trap ....................................................... - 36 -
Figure 7: Fertiliser Acquisition and Utilization by Small-scale Farmers ..................................... 46
Figure 8: Household Maize Yield Levels ..................................................................................... 99
Figure 9: Household Cotton Yield Levels .................................................................................. 104

- 10 -
ACRONYMS
AFC……………………Agricultural Finance Cooperation
AGRIBANK…………..Agricultural Bank of Zimbabwe
ALE……………………Adult Labor Equivalence
AN……………………..Ammonium Nitrate
AREX………………….Agricultural Research and Extension
ASPEF…………………Agricultural Sector Productivity Enhancement Facility
CFP…………………….Champion Farmer Program
DA……………………...Discriminant Analysis
DAPP…………………..Development Aid from People to People
DV………………………Dependent Variable
FAO…………………….Food and Agriculture Organization
FMC…………………….Fertilizer Marketing Channel
GIS……………………..Government Input Scheme
GMB……………………Grain Marketing Board
HIV……………………..Human Immuno Virus
IAD……………………..Institutional Analysis and Development framework
IV……………………….Independent Variable
LCD…………………….Less Developed Countries
LR………………………Logistical Regression
NGO……………………Non Governmental Organization
OFS…………………….Operation Food Security
PSF……………………..Productivity Sector Facility
RBZ…………………….Reserve Bank of Zimbabwe
SADC…………………..Southern African Development Cooperation
ZFC…………………….Zimbabwe Fertilizer Company
ZFU…………………….Zimbabwe Farmers Union
ZimPhos………………..Zimbabwe Phosphate Industries
- 11 -
CHAPTER ONE
INTRODUCTION
1.1. Introduction
The majority of Zimbabweans live in rural areas with agriculture as their main occupation. Over
70% of the farming households are small-scale farmers, who used to produce at least 75% of
grains in the country, particularly maize (Kachere, 1995). Maize is a strategic crop in Zimbabwe
because it is the staple food crop and it doubles as a cash crop. Cotton and tobacco are also other
common cash crops grown by small-scale farmers. Livestock production is also another area of
interest in the small-scale sub-sector. The production of maize is a major enterprise on small-
scale farms where mostly white maize is grown, retaining part of it for home consumption, and
selling the remainder to the market. Rukuni (2006) noted that Zimbabwe’s annual commercial
maize requirements are approximately 2 million tons. Therefore, it has been a government policy
to promote maize production as an effort towards food self-sufficiency. However, during the last
10 years, Zimbabwe has been importing maize and has been facing serious shortages of wheat
and meat products (FAOSTAT, 1998-2008).
Agricultural production has generally declined from 1997 farming season, which had a stockpile
of about 1.8 million tons, 220 000 tons and 200 000 tons of maize, wheat and tobacco
respectively (Rukuni, 2006). This decline has been due to a notable subsequent fall in the
average yield for the crops in both the commercial and small-scale farming systems. According
to the Ministry of Agriculture, Mechanization and Irrigation Development Crop and Livestock
Assessments Reports, the average national maize yield has been hinging around 0.7tons per
hectare since 2002 except in 2004 when it was above 1ton per hectare. FAO (2000) expressed
the view that yields on commercial farms are on average four times higher than on small-scale
farms, in part due to inherent differences in fertilizer acquisition and utilization. Better yields on
commercial farms are attributable to the better state of the land compared with the fragile and
exhausted soils in the small-scale farming communities. This highlights the importance of the
provision and adequate supplies of the fertilizer input to the small-scale farming sector. For these
small-scale farming communities to be highly productive, they require the right type of
fertilizers, in the correct quantities, at the right time and at affordable prices, while the
effectiveness of input supplying institutions in satisfying these requirements is largely influenced
- 12 -
by the structure, conduct, and regulatory environment facing them. Data from the Ministry of
Agriculture (1980-2000) on fertilizer sales in Zimbabwe shows that the existing fertilizer
supplying institutions are failing to effectively make fertiliser available to the small-scale
farming community and thus has contributed to a fall in agricultural production.
This study attempts to gain insight into the challenges facing the small-scale farming community
by investigating the relationship between the fertilizer marketing channels they use and their
performance. Performance is measured using two common independent variables – yield and
asset ownership. The impact of the fertilizer marketing systems on small-scale farming
community’s socio-economic developments is also investigated in this study. The importance of
the study hinges on its ability to suggest the best form of a fertilizer marketing system, the policy
and the institutional set-up that will unambiguously enhance fertilizer utilization and
consequently agricultural production in the small-scale farming sector. The study recognizes the
need to strengthen and expand the emerging opportunities brought about by the Land Reform
Program, and deals with the challenges of fertilizer marketing facing crop production.
1.2. Background
At independence, Government of Zimbabwe inherited a skewed distribution of both land and
financial resources to the farming public. Small-scale farmers did not have unimpeded access to
credit facilities, while commercial farmers had almost limitless access to farming finance. The
main reason cited in literature is that communal farmers did not have sufficient collateral to
secure credit. In-order to address this problem, Government of Zimbabwe introduced the
Resettlement Credit Scheme where loans to newly settled farmers were guaranteed by
government. At the same time, government ordered the Agricultural Finance Corporation (AFC)
to grant loans to small-scale farmers with government guaranteeing against default. However, the
credit culture did not hold and massive defaults occurred (Zumbika, 2000). Government did not
honor their guarantee to the AFC forcing the parastatal to resort to selling asserts of the
defaulters in order to recover the debt. This put the AFC in a tight financial situation eventually
forcing the organization to appeal to government to change its status into a commercial bank.
Without capital of their own and with little or no access to state financing, a large number of
small-scale farmers resorted to basic subsistence and this marked a significant reduction in

- 13 -
agricultural productivity. The small-scale farmers had very limited capacity to purchase inputs
such as fertilizers. Food security was now in jeopardy.
The framework for policies in the post independence era was well meaning. However,
subsequent policy pursuits after 2000 were fraught with both conceptual and implementation
pitfalls. Food security decline at household and national level became steep and significant. This
discernible decline in food security was mainly due to the newly announced government policy
where government committed itself to supplying inputs, particularly grain related inputs to the
farmers for the next six years through Government Input Scheme (GIS). This meant farmers
would be acquiring their fertilizer and seed requirements through the state-sponsored schemes.
The objectives of GIS were noble as government appreciated the increasing difficulty communal
farmers faced in accessing fertilizers and other inputs due to high costs. Potentially the GIS could
improve access to inputs and production if it had been implemented properly.
Figure below shows the varying average yields for respective farming seasons for a number of
crops grown in the country after the implementation of GIS to date. Maize in particular, shows a
negative trend throughout as is shown in the figure below. The declining production trends were
due to the inadequacy of the GIS and other implementation pitfalls. One of the shortcomings of
GIS was that government could not guarantee basic inputs such as fertilizers in adequate
quantities and on time. The government input scheme introduced in 2001 benefited a few people
while some deserving farmers found it difficult to access inputs such as fertilizers. Some of the
beneficiaries that accessed inputs diverted them into the informal marketing sector comprising
the speculative middlemen (e.g. mbare musika). Untimely delivery of inputs due to price
negotiations and delayed imports were also major causes of crop failure.
Figure 1: Crop Production Trends. 2000-2007

- 14 -
Source: Data compiled by the African Institute for Agrarian Studies (AIAS) from various sources
Maize production has never reached the self-sufficiency level (1.8 million tons) over the past
nine years. This is against the background that maize is the staple food crop and the main source
of carbohydrates for the majority of the Zimbabwe population. The major constraint in maize
production has been cited as the limited availability of critical inputs such as fertilizers and
unattractive producer prices which have failed to provide incentives for production. Figure below
shows trend in maize imports which reflects poor forecasting or severe shortages of resources
such as fertilizers resulting in ad-hoc importations.
Figure 2: Maize Production and Imports
Source: Central Statistics Office – Harare Key: Maize imports include food aid
1.2.1. Main Issues of the Study
Rukuni (2006) highlighted that it should be possible to double yields in the A1 and communal
- 15 -
farming systems by using recommended fertiliser application rates. More emphasis should be
placed on the application of the correct type of fertilizer on time and in the right quantities. Thus,
the requirement for a growth in agriculture in Zimbabwe may not succeed if fertilizer utilization
by the small-scale community is not enhanced from current levels (Maene, 2001).
The current problem in accessing and affording fertilizers by the smallholder farmers in
Zimbabwe is compounded by the fact that the government remains the single largest direct
retailer of agricultural credit and inputs. It has a strong control of the agricultural input
distribution system. Fertilizer has been provided as handouts to the farming community for
production under the auspices of a number of state-sponsored input schemes The primary
motivation out of which the state-sponsored input schemes were designed was to help
disadvantaged small-scale farmers during the period of apprehensions and general inertia by
banks to lend into agriculture during the emotive stages of the land reform program. Practically,
the performance over the past nine seasons of these state-sponsored input schemes has made
fertilizer inaccessible in the right amount and at the right time for many intended beneficiaries.
The provision of fertilizer as free handouts to small-scale farmers has severely undermined
fertilizer sales through the commercial market. Retailers are reluctant to sell a product that may
be given away for free by the government (Rusike, 2000). These government programs have run
for nine consecutive years since 2000 and looks set to be implemented again although as has
been highlighted, performance is questionable in terms of making the input available to farmers.
1.3. Specific Policy Pursuits
Zimbabwe’s agricultural sector has experienced several transformations since 2000. These
changes have not only demanded a new thinking in terms of the future of agriculture, but have
provided major challenges for policy makers. Several attempts have been made to chart policy
perspectives but the pace and intensity of changes did not allow for consolidated implementation.
The result has been piecemeal implementation of policies, some of which did not emerge into the
public domain. However, the position of agriculture in the economy remains dominant as a major
employer and provider of key raw materials for the industrial and manufacturing sectors. The
policies to be discussed in this study include; Government Input Scheme (GIS), Productive
Sector Facility (PSF), Agricultural Sector Productivity Enhancement Facility (ASPEF),

- 16 -
Operation Food Security/Maguta (OFS) and The Champion Farmer Program (CFP).
1.3.1. The Government Input Scheme (GIS)
In the year 2000, the Government of Zimbabwe announced that it would be responsible for
providing inputs (seeds, fertilizers, e.t.c.) to the farming community for the next six years.
Requirements for inputs were appropriated through the Ministry of Agriculture. However, due to
resource limitations the Ministry of Agriculture never got what they had budgeted for. Over the
years the funding gap grew with the absence of commercial lending from banks that cited lack of
collateral security largely as a result of the land reform program. Despite clear indications that
government would never be in a position to adequately fund agriculture, the policy of the GIS
continued to prevail.
GIS took away the initiative from the farmer and created an unprecedented level of dependence
on government. In future years the farmers took no action to prepare for the season while they
waited for government to come up with the inputs. Funding for GIS was very inadequate as
government failed to appropriate enough resources to the Ministry of Agriculture. In an attempt
to guarantee availability of inputs, government ring-fenced all the available inputs thereby
crowding out other people who may have wanted to access inputs through commercial outlets.
Declining allocations through vote appropriations and eventual off-budget funding procedure
compromised the GIS further. Poor implementation of the GIS through inappropriate targeting of
beneficiaries further reduced its effectiveness. Absence of policy evaluation and review made
GIS moribund. In 2003, the Ministry of Finance decided not to appropriate the GIS, preferring
instead to treat it as an off-budget item. This necessitated the need for alternative funding
mechanisms and indeed in the following year, the Reserve Bank of Zimbabwe (RBZ) introduced
the PSF (Pazvakavambwa, 2009).
1.3.2. The Productive Sector Facility (PSF)
The Productive Sector Facility (PSF) was introduced by government through the RBZ in 2004.
The PSF was introduced to take account of the government’s increasing inability to fund the
input scheme through vote appropriations due to financial and fiscal constraints. Under the PSF
for agriculture RBZ made financing available at 25% interest rate for food crop production. This
- 17 -
was potentially a good gesture but its other provisions made its implementation difficult.
i. The facility had a six month tenor for seasonal loans and an eighteen months tenor for
capital formation loans. This period was inadequate for effective acquittal of loans as
some of the crops financed would not have been marketed at the expiry of the facility.
ii. Loans not paid up by the maturity date or any part remaining thereof immediately
assumed commercial attributes in terms of interest. At that time commercial interest rates
were between 300% and 400%.
iii. Although lending was for individual farmers, they only accessed their loans through
commercial banks that were then held liable for repayment by RBZ. This increased risk
of commercial banks for most loans especially those advanced to the development sector.
iv. Despite relentless pressure from the farming public, releases of financial resources were
late initially from RBZ to commercial banks and later from commercial banks to
individual farmers. This resulted in late planting and low yields
v. Most seasonal loans matured and were called up before the items they financed were
ready for market.
vi. As a result, some commercial banks paid up the loans on behalf of their clients but went
on to put the loans under the ruling commercial interest rate. The putting of loans on
commercial interest rates placed many farmers into a debt trap which further
compromised their ability to go back to the land.
vii. Some farmers, in open defiance resorted to side marketing and the objective of food
security was never achieved.
As a result, PSF failed to deliver in the very first year it was conceived. This forced the RBZ to
go back to the drawing table where another facility later emerged (Pazvakavambwa, 2009).
1.3.3. The Agricultural Sector Productivity Enhancement Facility (ASPEF)
The ASPEF was mooted from the shortcomings of PSF. The facility was an improvement in
many aspects. ASPEF came in various support frameworks for a number of key areas such as
irrigation rehabilitation, horticulture, crop and livestock production and development of new
irrigation schemes, e.t.c. In essence, ASPEF sought to correct the shortcomings of PSF and even
go further through direct support of other selected productive areas. Despite the good intentions
initially shown in the implementation of ASPEF, further complications arose as a result of the
- 18 -
following:-
i. ASPEF programmes were poorly designed. Emphasis appears to have been on financial
aspects instead of farmer empowerment.
ii. There was limited consultation between the RBZ and experts in the agriculture field
which would have enriched the facility.
iii. Implementation was too centralised with the central bank making all the decisions. The
central bank had employed a few key people recruited from the Ministry who were now
sole advisors to the bank.
iv. The role of the Ministry of Finance as the provider of funding to Ministries was
compromised. Ministry of finance became an inactive conduit through which requests
could be channelled, but had no say over the final outcome.
v. The role of the Ministry of Agriculture was marginalised and structures within the
Ministry were rendered ineffective as they depended on the whims of the central bank.
vi. Ministry plans and projections were often ignored as the Central Bank sought to
implement its own policies and strategies often at variance with the Ministry of
Agriculture
The role of the central bank in both program planning and implementation further marginalised
the Ministry of Agriculture and its structures resulting in non-achievement of the objectives of
ASPEF. If the Central Bank had stuck to its traditional role and left both the Ministry Of Finance
and Agriculture to play their roles and mandates, ASPEF would have enjoyed a better measure of
success. As a food security policy and strategy, ASPEF delivery was constrained largely due to
the dominance of the Central Bank in its implementation modalities. The small-scale farming
sector suffered considerably under ASPEF as its design and provisions were not compatible with
the requirements of that sector. As a result, Operation Food Security was designed.
1.3.4. Operation Food Security – Operation Maguta (OFS)
Operation Maguta/ Food Security program (Operation Food Security) was the government’s
response to the continued deterioration of the national food security status. Maguta originated
from the government’s desire to improve food security in the country. In its simplest form,
Operation Food Security was a form of Command Agriculture where the farmer would be guided
on what crops to grow. Government of Zimbabwe was under the impression that earlier attempts
- 19 -
to improve food security had failed because there had not been sufficient guidance given to the
farmers. There was also the conviction that earlier policies had failed due to poor logistics.
Hence Maguta was set up with strong logistical support. It was believed that if there was an
improvement in the logistics, farmers would get their inputs such as fertilizers in time and hence
in a position to crop early and get decent yields.
Farmers could not obtain even fertilisers unless they “join” Maguta. What had initially started as
a logistical support for food security had evolved into a full blown institution. Maguta operations
being headed by the key people from the Ministry of Defence suffered from high levels of
patronage and delivery was compromised. Operating together with OFS was the Champion
Farmer Program.
1.3.5. The Champion Farmers Program (CFP)
With the evident failure of Maguta and the worsening food insecurity situation, government
introduced the Champion Farmer Program starting summer 2008. The situation in that season
was even more critical. There were hardly any fertilisers to talk about and the few that had been
targeted for the CFP found their way into the parallel market. Under the CFP government
undertook to provide inputs to targeted farmers who would be put to the best farmers to boost
food production and food security. However, early indications point to the contrary. It would
appear the program has failed to target potentially productive farmers.
i. Delays in launching the program affected yields. The program was launched very late and
fertiliser distribution suffered from lack of fuel and transport facilities.
ii. Original crop packs were revised to 50% of the initial quantities
iii. Revision of crop packs and their reduction of fertilizer requirements by 50% made
projected yields unattainable. The program had been premised on a yield level of 5 tons
per hectare of maize with a provision of 600 kilograms (12*50kg bags) of compound D
and 400 kilograms (8*50kg bags) of Ammonium Nitrate top dressing fertilizer. Within a
short period after the launch, these provisions were reduced to 250 kgs of compound D
and 150kgs AN.
There is evidence that despite the severe shortage of inputs such as fertilizers, some of these
inputs found their way to the informal market where they were sold at exorbitant prices. Given

- 20 -
the fact that government did not allow any fertilizer to flow into the commercial retail outlets, it
therefore means that only one source was available for the inputs. This situation restricted other
farmers who may have wanted to contribute to the food security situation outside the CFP.
1.4. Problem Statement
The precarious food security situation in Zimbabwe has prompted the government to engage a
number of input schemes such as GIS, PSF, ASPEF, OFS and the CFP to promote the use of
crop production technologies, a key component of which is chemical fertilizer. However,
adoption and intensity of fertilizer application, especially by small-scale farmers remained very
low despite government efforts to promote its use. Since the inception of state-sponsored input
schemes such as Operation Food Security in 2005, very little progress towards the objective has
been noted. Fertilizer remains scarce among the small-scale farming communities resulting in no
solid impact on the livelihoods and their state of preparedness, raising questions about the
viability, usefulness, and sustainability of state sponsored input schemes. There is rather a
considerable reduction in the ability of fertilizer market development to stimulate commercial
interest in the supply of this input and farmers’ state of preparedness for any farming season has
gradually been weakened (Mazvimavi, 2006). This social provision of fertilizer as an input to
small-scale farmers has led to the problem of delivery failure and diversion including the failure
by the mandated institutions to meet demand at the subsidized price, causing formal and informal
rationing of the input, illegal marketing of the input at unofficial prices, reflecting supply
failures.
The cumbersome and sometimes unworkable bureaucratic procedures for the release and
delivery of the fertilizer input to farmers, which tend to favor those who can afford to persist
with paperwork or can pay others to do so, has in effect raised the transaction costs associated
with the acquisition process and thus rendered the fertilizer delivery system practically non-
viable. In trying to ration the fertilizer when in short supply, there are biases typically favoring
wealthy clients who are in position to pay extra costs of acquiring input supplies but are outside
the target group. Also, there are more general logistical defects in the geographical allocation and
movement of the fertilizer input, resulting in timeliness failures more compounded by underpaid
and poorly motivated officials who have no incentive to conduct transactions with speed and

- 21 -
efficiency (Seward, 2006).
1.5. Research Objectives, Questions and Hypotheses
The main objective of this study is to carry out a comparative institutional evaluation of the
Government of Zimbabwe’s fertilizer input support and the private input supply system for the
small-scale farming community.
1.5.1. Specific Objectives
a. To establish the socio-economic characteristics of small-scale farmers operating under
different fertilizer marketing channels
b. To establish the factors affecting likelihood and intensity of fertilizer utilization by small-
scale farmers
c. To carry out a comparative analysis of the performance of small-scale farmers using
different fertilizer marketing channels
1.5.2. Research Questions
a. What are the socio-economic disparities between small-scale farmers using different
fertilizer marketing channels
b. What are the factors that affect the likelihood and intensity of fertilizer utilization by
small-scale farmers
c. Does the choice of a fertilizer marketing channel significantly affect the performance of
small-scale farmers
1.5.3. Hypotheses
a. There are no significant disparities in socio-economic characteristics of farmers using
different marketing channels to obtain their fertilizer inputs
b. An effective fertilizer marketing policy and institutional reform should be economically
justified, technically sound, socially acceptable, financially sound, and should enhance
timely and sustainable use of fertilizer by small-scale farmers
c. Marketing channel used by small-scale farmers to obtain fertilizers is not an important
variable meaning that performance is influenced more by other factors

- 22 -
1.6. Justification of the study
This study will contribute to the theoretical and empirical literature on economics of fertilizer
utilization among the small-scale farming systems. The output will be a useful reference to
numerous state institutions whose policies directly and indirectly affect small-scale farmers’
utilization of fertilizer. Potential agents for policy change that include NGOs, government
officials, private sector and academia, can also use it. The study will provide an insight into
development plans policies and institutional arrangements or programs that would contribute to
improved fertilizer utilization and reduced transaction costs in small scale farming systems.
Through illumination of the responses of intended state-sponsored input schemes beneficiaries,
the study will help in the shaping of appropriate evolution of local institutions and policies.
Within a framework of efficiency, this study will make use of economic principles to respond to
a vastly amplified set of questions including attitudes and behavior of smallholder farmers
formally considered non-rational. It is after the research that the need for policy design will be
suggested which is sensitive to the existing institutional arrangements of fertilizer distribution,
and which recognizes that these arrangements are shaping the responses of smallholder farmers
in ways that are distorting intended policy outcomes. It provides a clear guidance on normative
questions, particularly the distributional objectives that are extensively political decisions in a
quest for a better match between institutions and their incentive structure.
1.7. Organization of the study
This study is organized into seven chapters. The first chapter presenting the introduction and the
study background, the research objectives, questions and hypotheses and justification of the
study. The second chapter presents a detailed literature review about fertilizer and its utilization
among small-scale agricultural sector in Zimbabwe. Chapter three presents a detailed
methodology employed in this study. Chapter four presents a comparative characterization of
smallholder farmers found in the survey area using primary data. Chapter five presents the first
analytical stage where empirical model analysis is used. This section of analysis uses Probit and
Tobit models. Chapter six is the second stage of empirical data analysis that serves to suggest an
appropriate institutional reform and policy setup that will incentivize small-scale farmers to use
more fertilizer. Chapter 7 gives a summary of the study, conclusions and recommendations.
- 23 -
1.8. Summary
The foundation of the study is laid down in this chapter with the problem, objectives, hypotheses,
research question and the specific agricultural policy pursuits clearly articulated. This chapter
highlights the basis, the reasons as well as the economic motives of engaging such a research. In
addition, this chapter presented a justification for the study and the expected contribution and
benefits from the project. The organization of the study is also presented in this first session of
the write-up.

- 24 -
CHAPTER TWO
LITERATURE REVIEW
2.1. Introduction
This chapter reviews relevant literature on input supply systems and production responses. It
starts by analyzing the agricultural inputs sector and the input supply systems in Zimbabwe with
special reference to the fertilizer sector, its production and distribution systems. Relevant
literature on fertilizer utilization is reviewed in this chapter with an intention of coming up with
an enabling institutional environment that acts as an incentive for improved fertilizer use in
agricultural production by the small-scale farming community. Some key theoretical concepts
such as market structure – conduct – performance paradigm, institutional analysis and
development framework and transaction costs economic theory are also reviewed. Then insights
from the literature are presented.
2.2. An Overview of the Agricultural Inputs Sector in Zimbabwe
Agricultural production is the sector which is very sensitive to input use and especially to issues
of timeliness, quantities and quality. The small-scale community is the group that is mostly
affected by the inefficiencies in the supply systems of the production inputs. There are quite a
number of inputs that small-scale farmers look out for;-fertilizers, seeds, herbicides, feeds,
chemicals, farming equipment and other fixed and variable inputs. The fertilizer input and its
supply systems have sparked concern among all stakeholders in the agricultural sector and
outside. The input has been viewed as a major determinant of the level of production of the
small-scale farming community and that its shortages causes considerable loses and variations in
agricultural crop production. The reason being that the small-scale farmers’ major enterprises
involve grain production with maize dominating (Kachere, 1995).
2.2.1. Inputs Supply Systems
Currently, there are two input supply systems in the country, commercial marketing system as
well as the subsidised input marketing system which is the public flow of the inputs. The flow of
other inputs such as chemicals and herbicides has never been of major concern even to the small-
scale farming community. A lot of complaints have been caused by the flow of fertilisers and

- 25 -
seeds with more concern on the fertiliser side.
Source: Adapted from various sources
2.2.2. Production and Supply of Fertiliser
There are five major fertilizer suppliers in Zimbabwe and these are Zimbabwe Fertilizer
Company Limited, Windmill Pvt Ltd, Sable Chemical Industries Limited, Zimbabwe Phosphate
Industries Limited (ZimPhos), Omnia Fertilizer Zimbabwe Pvt Ld and other importers. The
companies’ products range from “straights” to “compounds” all of which contain one or more of
the three primary nutrients; nitrogen(N), phosphorous(P) and potassium(K). Sable Chemicals
manufactures ammonium nitrate and ZimPhos produces phosphates which are exclusively used
to produce straight and blended fertilizers distributed by ZFC Ltd and Windmill (Pvt) Ltd . The
EFFICIENT FLOW
Right farmer
Right product
Right quantity
Right time
Low transaction costs, etc
INEFFICIENT FLOW
Poorly designed
Conflicting objectives
Untimely supplies
Inconveniencing
High transaction costs, etc
HIGH PERFOMANCE
high yield
enhanced asset ownership
“improved food security”
LOW PERFOMANCE
Low yields
Compromised asset ownership
“enhanced food insecurity”
FERTILIZER INPUT
To flow in different
channels
Figure 3: The Flow of the Fertilizer Input to Production
FLOW
USE

- 26 -
latter two import potash and other raw materials and, together with products from Sable and
ZimPhos, manufacture compound fertilizers. There are a few other companies (e.g. Omnia, a
subsidiary of Omnia South Africa) with smaller market shares that are involved in importing,
blending, and distributing fertilizers (Utete, 2003).
The fertilizer industry has the capacity to manufacture around half a million tons of fertilizer per
annum. Sable has the capacity to produce around 22 000 tons of ammonium nitrate per month.
An electrolysis process produces about two thirds of its output with the remainder being
manufactured using anhydrous ammonia imported from South Africa (Utete, 2003). Makiwa
(2002) highlighted that there has been serious fluctuations in the production of ammonium
nitrate since 1997. The year had a peak production of 256 239 tons followed by a 16% fall in
1998. The economic crisis in the country compounded with unfavorable agricultural policy and
institutional setup has in effect contributed to another 19% fall from 1997 figures giving rise to
207 243 tons of fetiliser in year 2000. 2001 was another worse year in terms of fertiliser
production with its 187 215 tons, a 10% fall from year 2000.
This depicts a declining production trend of ammonium nitrate implying that more had to be
imported. Extra demand has been filled by imports by ZFC, Omnia and Windmill, in the form of
urea for top dressing because ammonium nitrate is banned in South Africa and cannot pass
overland in that country for export. Farmers World has been importing small amounts of
fertilizer and selling blends. The fertilizer industry has been faced with a number of constraints,
severely affecting its response to the new agrarian challenges. These include lack of foreign
currency to import sufficient quantities of potash and other imported ingredients like sulphur and
poor supplies of ammonium nitrate from Sable Chemicals to the two main compound fertilizer
manufacturing and distributing companies. Yet another factor limiting availability is the pricing
structures for fertilizers and raw materials. The government of Zimbabwe controls the pricing
system of the input. It determines the buying price from the manufacturers as well as the channel
through which the input flows to the small-scale farmers introducing input supply failures (Utete,
2003).
2.2.3. Fertilizer Distribution and Utilization in Zimbabwe
- 27 -
The government of Zimbabwe introduced a number of state-sponsored input schemes to
dominate the fertilizer market. The design of the schemes gives the government a direct control
of the marketing system surrounding the fertilizer subsector. It determines how much is to be
produced and how the fertilizer is to be distributed to the farming community and it determines
who gets what quantity. State-sponsored input schemes such as OFS allows the government to
buy most of the fertilizer produced locally and to market it directly to the farmers. Fertilizer is
obtained from the manufacturers, transported to Grain Marketing Depots or designated points
where it is allocated to the respective farmers by the government. A farmer has to apply for the
input share at a district level and supplies are obtained from local GMB depots or designated
points. The fertilizer is obtained on a credit basis and a guarantee that the maize output will be
marketed to the GMB. The major issue is that the public institutions with the mandate of
fertilizer distribution are faced with a number of problems leading to timeliness failures,
unsustainable rationing, and reliability concerns.
Weiland, (2008) carried out a comparative study of fertilizer distribution in Bangladesh. The
author used probit and tobit models to establish the factors affecting likelihood and intensity of
fertiliser use by farmers. The study revealed that the decline in fertilizer utilization in Bangladesh
was partly attributable to counter-productive government fertilizer delivery systems and a lack of
institutionally supported marketing facilities, which acted together as powerful disincentives to
increased utilization. Fertilizer supply systems directly linking rural retailers with the fertilizer
companies in Zimbabwe have been weakened by a strong reliance by the Government of
Zimbabwe’s stance of distributing the input free of charge through, for example Operation Food
Security.
Stack (2004) documented that multiple years of free input distribution under government
sponsored input schemes has encouraged farmers to expect free handouts and discouraged
retailers from stocking fertilizers. The author further noted that achievement of sustained gains in
household food security depends on the elimination of these handouts. Mazvimavi (2006)
highlighted that rural retailers should be incorporated into programs to assist the poorest and
most vulnerable households. This can be accomplished by providing farmers vouchers for
subsidized inputs that are redeemable in rural shops. This encourages farmers to continue to look
- 28 -
to rural shops for their agricultural inputs and encourages retailers to stock fertilizers. This kind
of setup will teach farmers the actual value of fertilizer in terms of the benefits. Once this is
achieved, the food security gains achieved through these programs will be sustained.
The state handouts hardly meet the demanded quantities and thus render the input more of a
limiting factor. Before the land reform program, Zimbabwe consumed an average of 500000 tons
of fertilizer (equivalent to 186 000 tons on N, P, K, S) per annum ( (Kachere, 1995). Fertilizer
demand consists of large-scale commercial and smallholder farmers. Rugube (2003) documented
that in 2003, there were 4835 large-scale commercial farmers using an average of 858 kilograms
of fertilizer per hectare and around 1.2 million smallholders using less than 50 kilograms of
fertilizer per hectare. Considering the average fertilizer use in maize per hectare by the small-
scale farmers, the product becomes primarily the limiting factor (Rugube, 2003).
Mazvimavi (2006) noted that the public provision of fertilizer inputs at the expense of
commercial sales of the input is very common in Africa. Africa accounts for 2% of world’s
fertilizer consumption yet the region contains 12% of the world’s population. Mazvimavi (2006)
highlighted on some reasons why most small-scale farmers do not use inorganic fertilizer despite
extension recommendations for high rates of application in the region. The ever-increasing
shortage of the critical input in the small-scale farming sector has very serious negative
implications on the food security status of the very people whose livelihoods depend heavily on
own production. The author reflected on unavailability in local retail shops and that some
farmers have to travel long distances to larger business centers to find it, which contribute to
high transaction costs. Most farmers look at the logic of purchasing fertilizers rarely found on the
formal market at very high price levels when they know they stand a chance of getting some
bags of the input from Operation Food Security or Champion Farmer Program.
Purchasing fertilizer from side markets potentially raises a serious price risk to the poor farmers
since when the maize output price is being set; the idea that the fertilizers were sourced through
state-schemes is taken into consideration. Budgets prepared by the state agents which are used to
formulate output prices are a deliberate undervaluation of the actual costs incurred by the small-
scale farming community. Questions remain firm about the sustainability of the gains under OFS
- 29 -
or any input scheme if fertilizer remains scarce and expensive in real terms. In small-scale
farming communities, when the distribution of these free bags of fertilizer stops, usage will
simply collapse unless the access constraints are resolved.
2.2.4. Shortcomings in Government Funding for Agriculture
The GoZ has for the past ten years excitedly crafted policies and programs aimed at subsidizing
most of the agricultural inputs. Pazvakavambwa (2009) noted that the government crafts policies
which lobby for subsidies when the national budgets are not in support of those policies. Despite
the fact that the Ministry of Agriculture produce elaborate plans for the crop financing well in
time for discussions with the Ministry of Finance during the Estimates of Expenditure Exercises,
the results of those discussions are always disappointing. The Ministry of Agriculture did not
receive any obvious priority and the out-turn was always far below 10% of the national budget.
The resultant allocation was always a source of perpetual frustration as resources made available
were far inadequate. The Ministry of Agriculture progressively failed to meet its obligations due
to inadequate financial resource allocation. This further compromised Zimbabwe’s ability to
achieve food security at the household and national level.
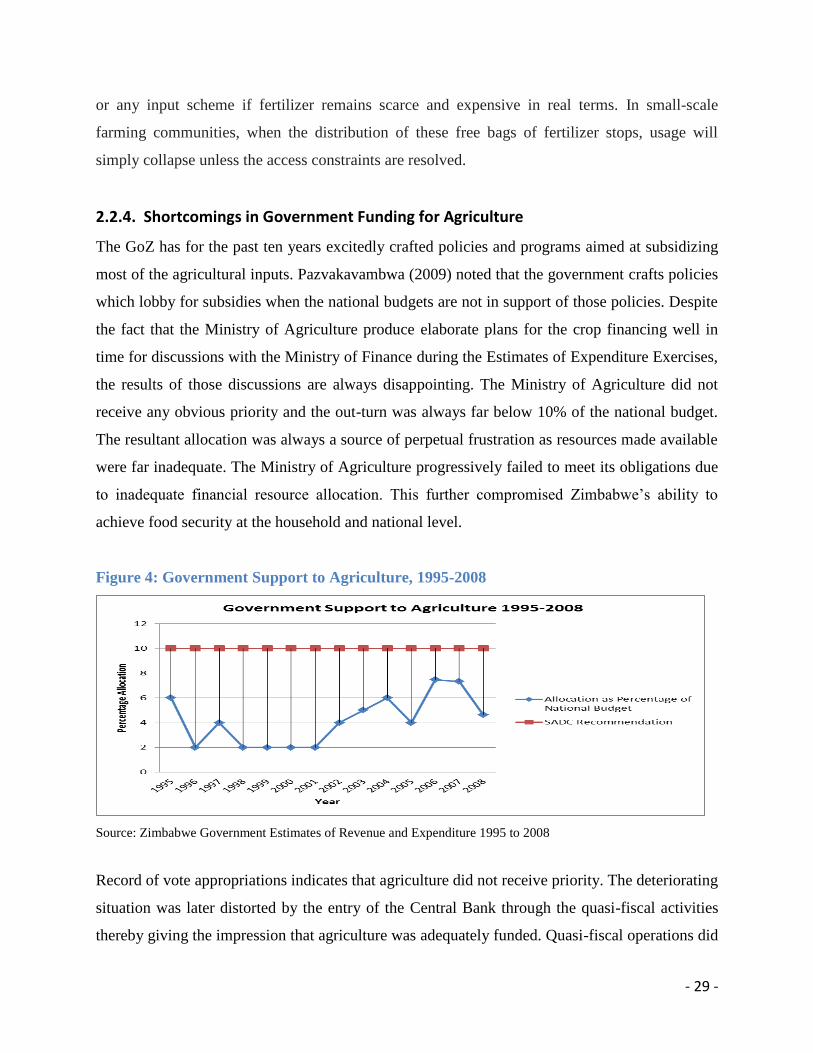
Figure 4: Government Support to Agriculture, 1995-2008
Source: Zimbabwe Government Estimates of Revenue and Expenditure 1995 to 2008
Record of vote appropriations indicates that agriculture did not receive priority. The deteriorating
situation was later distorted by the entry of the Central Bank through the quasi-fiscal activities
thereby giving the impression that agriculture was adequately funded. Quasi-fiscal operations did

- 30 -
not support the ministry’s operating expenses resulting in ineffective programme monitoring and
implementation on the ground. For four years running (1998 – 2001), agriculture could only
attract 2% of the national budget. The figures are against the African Union Maputo Declaration
in 2003 that African states would devote at least 10% of their national budgets to agriculture
given its importance as the driver of economic development.
2.3. Theoretical Issues on Fertilizer Utilization
In crop production, inputs such as herbicides, seeds, capital, land or labor may not be very
productive without an ample application of the fertiliser input. This relationship is based on basic
agronomic or biological characteristics of crops. There are several different combinations of
fertilizer and seeds or land or any other input that will produce M1 maize yield but slightly
increasing fertiliser utilization, provided it’s not surpassing the optimal application, the
production will shift to even a higher level, M2. This implies that if maize is to grow and produce
highest yields, all the inputs including fertiliser must be in ample supplies.
Figure 5: The Effect of Optimal Application of Fertiliser on Maize Production
M2
f2(xi/fertiliser level 2)
Maize output (tons)
M1 f1(xi/fertiliser level 1)
Xi
Production input e.g. seeds, herbicides, land or capital given a fertiliser level
This means that if highest crop yield per hectare is to be obtained, then in principle, the
recommended fertilizer application rates should be applied. The use of fertiliser is one of the
most important factors that will contribute to the increase in crop production. There is empirical
evidence, which suggest that nearly 30% of the increase in food crop yields in developing

- 31 -
regions in the 1980s was due to increased use of fertiliser (Makiwa, 2002). The economic
concept explained in figure above is linked to “Von Liebig’s Law of the Minimum” which states
that plant growth is constrained by the most limiting factor. Due to the biology of crop growth, a
synergistic effect is present. The presents of ample amounts of fertilizer make the productivity of
seeds, land, labor or machinery greater. Fertiliser can be applied until the cost for more fertiliser
is equal to the return to more fertiliser.
The unavailability of fertilizer to the small-scale farming community is a threat to their food
security status. Rhobach et al (1997) indicated that less than 40% of the farmers in the
smallholder farming systems in Zimbabwe have ever tried inorganic fertiliser because of its
unavailability. Smallholder fertiliser practices contrast sharply with extension recommendations.
In Zimbabwe, the national extension services officially recommends smallholders to apply at
least 50kg of nitrogen(N) and 35kg of phosphorous(P) per hectare of maize. However, average
utilization rates even during the free fertiliser programs are less than 25% of these levels. Rusike
et al (2000) indicated that total fertiliser consumption per year declined from roughly 510 000
tons in 1981-1989 to 490 000 tons in 1990 – 1996. One explanation for this is that of the efficacy
of the general policy environment and existing institutions. Therefore, the challenge is how to
achieve major increase in fertilizer use at the same time that government’s capacity to subsidize
distribution to small-scale farmers is limited, and where such subsidies compete for scarce
resources with other public interventions such as roads, agricultural resources, and extension that
could contribute to more sustainable maize production practices
2.4. Review of Key Theoretical Concepts
2.4.1. Market Structure – Conduct – Performance Paradigm
The Structure, Conduct and Performance framework (S-C-P) emphasizes the close relationship
between structure, conduct and performance of the fertiliser supply and distribution systems. It
states that in a fertiliser market, there are certain basic conditions that determine structure
(Pomeroy, 1995). Structure includes all the firms like the fertiliser manufacturing companies,
state institutions and all the players engaged in a given market channel. Two important strategic
features are the number and relative sizes of the institutions involved and the business
relationships between these institutions. An issue of fertiliser availability and accessibility to the

- 32 -
farming community has more to do with the supply system in place and relatively less to do with
local production. If efficient systems are in place to create effective demand for the fertiliser
input, then there will be more players in the supply channel from local, regional or international
sources. This introduces competition and thus efficiency in the supply systems such that fertiliser
would be accessible to the farmers timely and affordably.
The government of Zimbabwe purchases most of the fertiliser from local manufacturing
companies. There are also some private traders in the fertiliser supply subsector though the
institutional setup and the policy environment creates artificial barriers to entry. The market
share for private traders is so small that the availability of the fertiliser to the farming community
is largely dependent on the efficiency and effectiveness of state institutions like Operation Food
Security. The structure can be divided into four types according to level of competition and these
include perfect competition, monopoly competition, oligopoly, and monopoly. A monopoly
situation is the one prevailing in the supply of fertilizers to the small-scale farming community
where the major provider of the input is the government. With the current setup, there is no space
for other players in the fertiliser supply system.
This kind of a structure in the supply of fertiliser determines the behavior of the players
involved. Conduct, which is the behavior, includes methods employed by the government or
Operation Food Security as a state institution in determining the quantities to supply, market
channel, activities, research and development commitments, legal tactics, lobbying, public
relations, and conglomerate behavior (Shughart, 1997). The behavior of the state institution,
being the major, and almost the only supplier of the fertiliser input to the farming community
determines fertiliser utilization. Operation Food Security has never supplied fertiliser to farmers
at the right time, in the right quantity and to the right farmers. Its existence has actually reduced
the availability and accessibility of the input to farmers.
2.4.2. Institutional Analysis and Development Framework
One particularly useful framework, which has structured inquiry across a broad array of policy
sectors and disciplines, is the IAD framework. Developed by Elinor Ostrom and other scholars,
the IAD framework focuses the attention of this study on small-scale farmers who make
- 33 -
decisions on fertilizer utilization. Fertiliser utilization, maize production levels, production and
transaction costs as well as other benefits and costs are considered in this framework to be
affected by four types of variables external to individual small-scale farmers;
a) Attributes of the physical and infrastructural environment and this includes existing road
networks and their conditions. With a deteriorating road network, transportation of the
fertiliser input from the market or from Operation Food Security fertiliser input issuing
deports is very expensive. This raises the farm-gate price of the commodity to an extent
that most of the farmers whose interests state-sponsored input schemes intend to serve
will not be able to afford. This means that at the end of the day very few farmers will use
fertiliser in maize production.
b) The attributes of the community within which actors are embedded. Under this, of much
consideration is the approximate population of the farmers in the district. From the
population, that’s were effective demand of the fertiliser input is derived. Very few
farmers would discourage some private traders in stocking the fertiliser commodity since
such a society lacks a guaranteed pronounced input demand. The other important aspect
is that of the scope and nature of collective action as well as cultural norms observed by
the farming society. Some farmers have developed a negative attitude towards state-
sponsored input schemes although some still give a premium to such programs.
c) Rules that create incentives and constraints for actions such as fertiliser acquisition and
utilization. Rules imply institutions in place defining how fertiliser should be acquired,
distributed and utilized. Operation Food Security and other state-sponsored input
schemes together with the fertiliser input and pricing policies are such institutions
creating certain levels of incentives and disincentives for fertiliser utilization by the
small-scale farming community. This study will use the IAD framework to see the level
of incentives in terms of benefits accruing to the smallholders as well as disincentives in
terms of transaction costs associated with the public and private flow of the fertiliser
input. Of much concern are issues of timeliness of fertiliser supplies and acquisitions,
transaction costs associated with the acquisition process, predictability and reliability of
the source of the fertiliser input, maize production levels and viability.
d) Patterns of interactions of the individual farmers. This has an effect on the level of search
costs and thus transaction costs associated with each channel of fertiliser flow.

- 34 -
The IAD framework adapted will be used to relate the following elements; actors who are,
(i) small-scale farmers, (ii) fertiliser manufacturing companies, (iii) fertiliser input dealers,
(iv) Operation Food Security and other state institutions in positions who must decide among
diverse actions in light of the information they possess about how actions are linked to the
potential outcomes and the costs and benefits assigned to actions and outcomes. Four
features characterize small-scale farmers: “the preference evaluations they assign to potential
actions by state-sponsored input schemes and private fertiliser traders and outcomes
associated; the way they acquire, process, retain, and use knowledge contingencies and
information; the selection criteria farmers use for deciding upon a particular course of action;
and the resources the farmers possess” (Ostrom, 1999).
2.4.3. Transaction Costs Economic Theory
The study of transaction costs has been brought forward by the New Institutional Economics
with the aim of explaining the operations of institutions, their development over time and how
they affect economic development (Nabli, 1989). This theory explains the issue that fertiliser
marketing does not take place in a frictionless environment. There are costs associated with such
a transaction as the marketing of the fertiliser input. It is now the responsibility of institutions
like Operation Food Security to reduce those transaction costs to manageable levels. Coase
(1937) postulated that transaction costs consist of ex-ante and ex-post costs. In the fertiliser
market ex-ante costs include the costs of searching for the fertiliser input by the farmers,
searching for a convenient and reliable supplier, specifying the fertiliser product for crop
production depending on the intended hectarage and most importantly negotiating quantities to
be supplied as well as the price. The ex-post costs are experienced after the exchange process
and these include late delivery, non-delivery, poor quality, as well as quantity problems.
Williamson (1991) suggested that transaction costs should include both the direct costs of a
transaction and the possible opportunity costs of inefficient institutions. The inefficiency of OFS
is costly to the farming community in terms of time and real money. Farmers face the problem
of bounded rationality, which implies them not being able to enumerate all possible future
outcomes such as the quantities of the fertiliser input they will get from any of the available
sources. Eggertson (1990) highlighted that transaction costs originate from the following
- 35 -
activities;
a) The search for information about the availability of the fertiliser input at the commercial
market or existing input schemes, the price and the quality and this includes personal
time, travel expenses and communication costs
b) Screening costs, which refer to the uncertainty about the reliability of OFS or private
traders
c) The bargaining that is needed to find the true position of contracting parties, especially
when prices are determined exogenously e.g interest rates
d) The making of formal and informal contracts, i.e. defining the obligations of the
contracting parties
e) Transfer costs which refer to legal or physical constraints on the movement and transfer
of fertiliser and normally include transport costs
De Janvry et al (1991) expressed the view that the presence of transaction costs is reflected by
the difference or discrepancy between the fertiliser selling price and the farm-gate price, the
actual costs of the fertiliser to the farmers. Empirical studies of transaction costs in Southern
Africa are limited. Fenwick (1998) tried to measure transaction costs directly in a study assessing
the importance of transaction costs faced by rural households to credit markets. The results
suggested that high transaction costs faced by rural households limit their access to formal credit
markets. This is in agreement with Williamson (1991) who postulated that transaction costs are
explanatory factors for certain behavior.
Small-scale farming activities take place in an environment where there are thin fertiliser
markets, inefficient exchange coordination, high transaction costs and high risks (Kirstin, 2005).
Small-scale farmers, particularly those with little financial and social resources or political
leverage face high and often prohibitive costs in accessing fertilizers and other inputs. The result
in such an economic setup can easily be a ‘low level equilibrium trap’ if the right policies and
institutions are not put in place. Institutions within the fertilizer distribution system involve the
rules and the setup that provides for the channeling of the input through either the private or the
public channel or both. In essence, institutions should be cost minimizing entities. They should
rather regulate the fertilizer distribution system in a way that will minimize or get rid of
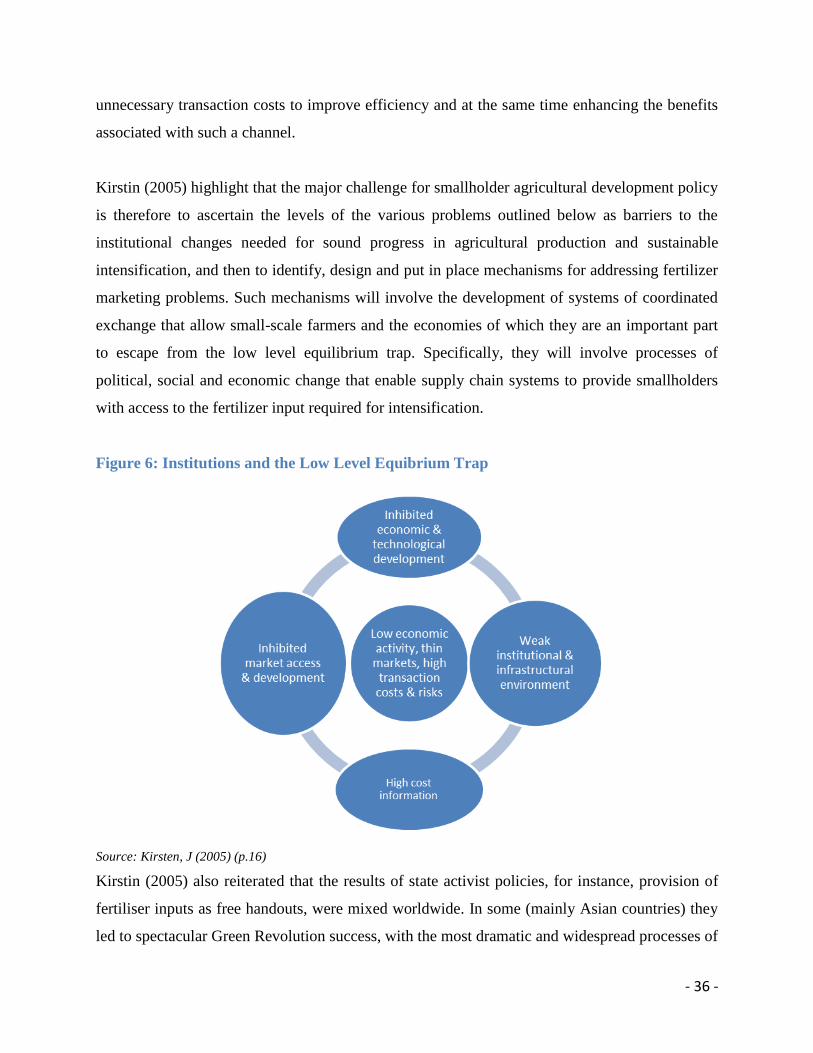
- 36 -
unnecessary transaction costs to improve efficiency and at the same time enhancing the benefits
associated with such a channel.
Kirstin (2005) highlight that the major challenge for smallholder agricultural development policy
is therefore to ascertain the levels of the various problems outlined below as barriers to the
institutional changes needed for sound progress in agricultural production and sustainable
intensification, and then to identify, design and put in place mechanisms for addressing fertilizer
marketing problems. Such mechanisms will involve the development of systems of coordinated
exchange that allow small-scale farmers and the economies of which they are an important part
to escape from the low level equilibrium trap. Specifically, they will involve processes of
political, social and economic change that enable supply chain systems to provide smallholders
with access to the fertilizer input required for intensification.
Figure 6: Institutions and the Low Level Equibrium Trap
Source: Kirsten, J (2005) (p.16)
Kirstin (2005) also reiterated that the results of state activist policies, for instance, provision of
fertiliser inputs as free handouts, were mixed worldwide. In some (mainly Asian countries) they
led to spectacular Green Revolution success, with the most dramatic and widespread processes of
- 37 -
agricultural growth and poverty reduction in history. In other (mainly African) countries,
however, large government expenditures and activity in agricultural development led to very
little agricultural growth and were a major drain on government budgets.
Government intervention is recognized as causing inefficient distortions in fertilizer distribution,
depressing efficiency by limiting local competition and private sector development in Zimbabwe.
Kirstin (2005), noted that gratuitous government intervention mostly leads to corruption, an
expensive drain on already overspent budgets leading to macroeconomic management
difficulties while also giving farmers poor services and through over-valued exchange rates,
taxing them and removing incentives for investment and own fertilizer input purchases.
Transaction cost theory attempts to answer the question of why certain transactions organized in
specific institutional arrangements can be more or less efficiently concluded. In the end, it aims
to provide an economic explanation as to which institutional form of organization is the most
efficient for which form of provision of public service. Williamson (1981) highlighted that a
quantification of the transaction costs is not necessary for the examination of the relative
economy of alternative institutional arrangements. Indeed, only in a few studies are transaction
costs measured directly in monetary units (e.g. as public expenditures). A ‘pragmatic’
operationalization of the cost determinants is regarded as sufficient for the derivation of
statements of tendency. Some studies use only qualitative arguments or argue preferably on
comparative advantages of alternative arrangements with respect to transaction costs.
A number of approaches exist for analyzing decisions made by small-scale farmers under the
influence of transaction costs. Makhura (2001) used one approach in which he combines the
household model with descriptive statistics and selective models (Heckman’s two-stage
procedure). The other analytical models of transaction cost analysis include Ordinary Least
Squares methods, Logit, Probit (Makhura, 1994) and Tobit models (Hobbs, 1997) among others.
Hobbs (1996) also used conjoint analysis in analyzing the effect of transaction costs on
processors’ choice of procurement channels.
A probit model is widely used in similar analytical researches meant to study market
- 38 -
participation of small-scale farmers. Makhura (2001), used the probit model to research on the
possibility of overcoming barriers to market participation of smallholder farmers in the Northern
Province of South Africa. Basically, the study was meant to study the role of transaction costs in
determining market participation of smallholder farmers with the intention of informing policy
interventions and institutional reforms to alleviate constraints on market participation and
improve the ability of these farmers to become part of the commercial agricultural sector
(Makhura, 2001). A probit model analysis of transaction costs and market participation was also
used for sweet potato farmers in South Eastern Nigeria (Ohajianya, 2011). The study determined
the factors (related to fixed and variable transaction costs) influencing the decision to participate
in sweet potato market by a random sample of 320 smallholder farmers in South Eastern Nigeria.
It is evident from literature that the probit model is commonly used to analyze situations where
choice problem is whether or not to adopt a technology. This study therefore employs a probit
model to examine the determinants of small-scale farmers decision to use or not to use fertilizers.
2.5. Small-Scale Farmer Fertilizer Utilization and Decision Making
The small-scale farm household is the level at which most resource allocation decisions are made
(Milner-Gulland, 1996). The specificity of these households is that they integrate in a single
institution decisions regarding production, consumption and resource use over time. Small-scale
production is dominated by maize which is grown for subsistence, with pumpkins, cucumbers,
cowpeas and other commodities successfully intercropped with it in many areas. Cotton,
groundnuts, millets, sunflowers and burley tobacco are all predominantly produced by
smallholders. Rukuni (2004) noted that maize dominated the area planted by small-scale farmers
and that they used to achieve yields of over 4 metric tons per hectare. Cotton, groundnuts and
vegetables are still widely grown.
Farmers decisions concerning what to grow, how much fertilizer to use and when, is influenced
by on-farm and off-farm conditions. The smallholder farming systems account for over 60% of
the farming area in Zimbabwe (Rukuni, 2004). It is in this sector that the level of inorganic
fertilizer use in crop production is limited. Rhobach et al (1997) indicated that less than 40% of
the farmers in this sector use inorganic fertilizer substantially. Smallholder fertilizer application
contrasts sharply with extension recommendations. One of the explanations for this are the high

- 39 -
costs of acquisition and the relative returns to this investment compared to alternative allocations
of scarce capital. ICRISAT once carried out a research and found out the reasons leading to no or
little use of fertilizer.
Table 1: Reasons Identified for Using Less Fertiliser
% of farmers with
no experience
% of farmers who have
tried fertilizer 1-2 times
% of farmers who tried
fertilizer ≥3 times
Too risky 42.5 18.6 6.7
Not necessary 24.2 9.3 3.3
Too expensive 18.3 51.2 80
Other 15 20.9 10
Source: SADC/ICRISAT
Surveys carried out indicate that experience brings a greater willingness to accept the risks of
application and that unavailability of the fertilizer input reduces experience gained.
Makiwa (2002) indicated that fertiliser application rates by small-scale farmers in Zimbabwe are
relatively low and account for 30% of total fertilizer consumption. Rusike et al (n.d) indicated
that in Zimbabwe, total fertilizer consumption per year declined from roughly 510 000 tons in
1981-1989 to 400 000 tons in 1990-1996. Makiwa (2002) noted that on average, fertilizer use per
hectare in maize production in developing countries constitutes a third of the world average and
within these countries, utilization level is the lowest in Africa. This however calls for a massive
expansion of its use in the continent. This could be done through improving availability of
fertilizer at the right time, place, and price.
According to Masendeke (n.d) over 75% of the farmers in Natural Region 1V do not apply
chemical fertilizer to crops. The main reasons are high costs and unavailability of the product.
The 25% that use fertilizers in maize production apply rates in the region of 17-43kg per hectare.
These low application rates have severe repercussions on the fertility of the soil and the
sustainability of agricultural production. AREX recommended rate of application is an average
of 350kg/ha and 200kg/ha basal and top dressing fertilizer respectively, varying on regional
basis.

- 40 -
2.6. Insights from Literature
The use of inorganic fertilizer is one of the most important factors that will contribute to the
increase in maize production. Empirical evidence suggests that nearly 30% of the increase in
food crop yields in developing regions in the 1980s was due to increased use of fertilizer
(Makiwa, 2002). A range of fertilizer supply problems, and high risks associated with free
handouts in Zimbabwe follows the more general trend of skepticism about the efficacy of state
controls. Ellis (1996) echoed that in part, it results from the inability of many developing
countries to continue to bear the financial burden of open-ended input subsidies and state
delivery systems. Some of the delivery problems noted enhances transaction costs incurred by
the very group the input policy is trying to serve. Thus, most literature has argued that supporting
the level of crop output price has a less distorting effect on fertilizer use than those free handouts
and state input delivery systems. According to Ellis (1996), other than input subsidies and state
delivery systems, there are better input policies with alternative methods for achieving the same
objective, the objective of ensuring enhanced fertilizer utilization in crop production and
consequently crop output growth.
In part, this intense interest in agricultural credit projects and free inputs handouts has been seen
by literature to result from the ease with which they can be carried out and the feeling that direct
government sponsorship is a vital part of a package needed to stimulate change in agriculture and
in maize production. Some policy makers have also regarded free fertilizer handouts as an
effective way of offsetting policies that penalize agriculture, and at the same time a convenient
way to treat rural poverty. This emphasis on the distribution of fertilizers to small-scale farmers
free of charge to stimulate production and to help the poor has unfortunately diverted attention
from the basic role that the government ought to play in rural development.
Makiwa (2002) highlighted that small-scale farmers’ own purchases of fertilizers constitute the
central economic link connecting the past, the present and the future of agricultural production.
According to Bautista (1990), the act by farmers of saving part of their income from crop output
sales and purchasing fertilizers to be used in the next season finances the capital formation
needed to increase crop outputs; this is of particular importance to typically capital-scarce less
developed countries (LDCs). The ability, willingness and opportunity of small-scale farmers to

- 41 -
save income and purchasing fertilizers over seasons can significantly influence the rate and
sustainability of maize production growth. Own purchases from the market reduces the reliance
on extenal funding which might increase transaction costs and is highly unreliable and infectious.
The literature provided a background understanding of the fertilizer industry and utilisation by
the small-scale community. It also provided insights on analytical frameworks that can be used
in analysing decision making as is influenced by transaction costs in fertilizer acquisition. IAD
framework is the major tool that has been used in analysing the effect of an institutional setup to
transaction costs and benefits associated with a production decision. Logistical Regression model
is also widely used to assess the impacts of a policy or institutional setup on the maximisation of
a specific objective in agricultural production.
2.7. Summary
From a theoretical perspective, well-defined policy and institutional support for fertilizer supply
and distribution is generally considered a precondition for improved fertilizer utilization among
small-scale farming communities. The basis is on four reasons, namely (i) this provides the
incentives necessary for local retailers to stock and competitively supply fertilizers to the
farmers; (ii) this allows a considerable decrease in the level of transaction costs associated with
exchange; (iii) effective demand and institutionally supported private supply systems brings in
more players in the industry and thus introduces efficiency; (iv) availability and affordability of
the fertilizer input helps the farming community in easing the planning process (Eggertson,
1990); (Makhura, 2001); (Rhobach, 1997).
- 42 -
CHAPTER THREE
RESEARCH METHODS
3.1. Introduction
This chapter presents the conceptual framework, data collection methods and analytical tools
used. Both primary and secondary data were used. A highlight is made on the choice of Bindura
district as the study area in addition to reviewing major data sources, research procedure as well
as the analytical methods.
3.2. Conceptual Framework
The conceptual framework is based on the flow of fertiliser from the manufacturing points or
suppliers to the farming community. It highlights the channels of fertilizer flow, how quantities
of either channel differ from those of the others, decision-making aspects of the farmers as
consequences of each channel, the transaction costs associated, and the derived demand of the
input as well as the utilization aspects. The fertiliser acquisition process has been observed as
contributing much to the current Zimbabwe’s situation of more transaction costs and fewer
benefits to the small-scale farmers. The conceptual framework also tries to make clear how the
problems associated with the public channel affects the fertilizer flow, its utilization, and crop
production. It is because of the outcomes in terms of crop production of the groups of farmers
differentiated from each other by the way they obtain their fertilizer inputs that this study
appreciates the theoretical argument in favor of a well-defined fertilizer distribution system. The
magnitude of the costs associated with each channel and the benefits highlights the fact that the
more accurate the distribution system is in reaching small-scale farmers, the less the wastage and
the less it costs to achieve the desired objective of improved agricultural production.
It is the amount of the fertiliser in stock, the amount obtained or acquired from specific input
schemes and other sources, the time factor and cost elements as well as other factors like
resource endowments, knowledge base and the climatic environment that determines fertiliser
utilization. Farmers faced with a certain amount of fertilizer, whether acquired from state-
sponsored input schemes, will have to make a decision on resource allocation basing on resource
cost and returns to investment. This will then determine the hecterage to be put under maize,
cotton, sugar beans, etc, and will determine the possible yield per hectare of the respective crops.

- 43 -
The study analyses whether an institutional setup that provides more space for government
sponsored input schemes than the free market system is likely to achieve the objective of
improved fertiliser utilization or not. Thus, the presentation of the conceptual framework below
helps the study to carry out a comparative institutional evaluation of the existing fertiliser input
supply systems.
As is highlighted by the conceptual framework below, there are two broad channels through
which small-scale farmers are currently getting their fertilizers from. There is a commercial
supply of fertilizer which involve the supply of the commodity by agro-dealers (local and urban)
as well as by some middlemen. The price of fertilizer in this private channel is determined by
market fundamentals and reflects more or less the actual cost of obtaining the commodity which
should be factored in production by the farmers. There is no transaction which is frictionless,
meaning in changing ownership, or the process of purchasing the fertilizer up to the farm
attaches some transaction costs to the nominal price set by the supplier.
The other channel of fertilizer flow is referred to as the public supply channel. This is the public
provision of agricultural inputs with the intention of subsidizing the disenfranchised agricultural
society. It involves acts by the government and the NGOs or any civil society providing free-
handouts or subsidies. NGOs mostly play their part by issuing agro-vouchers or straight input
packs. Agro-vouchers may be in the form of tickets redeemable at rural retailers or local
suppliers and input packs may be the inputs distributed directly to the farming community
depending on the design of the program. Government subsidized fertilizer may reach farmers
through a number of state sponsored input schemes such as Operation Food Security/Operation
Maguta or may be in the form of cash loans distributed to farmers by AGRIBANK or other state
run institutions. This channel is also not spared by transaction costs. The existence and level of
transaction costs embedded in this channel determines who gains and who will not. Some
farmers on realizing the level of transaction costs and procedures involved may just decide not to
participate and would rather rely on the commercial market.
Fertilizer imports are reflected on the conceptual framework to be supplementing the local
supply of the commodity. Currently, most of the fertilizer from the national supplies flows

- 44 -
through the government subsidized fertilizer channel. Very little is left for the commercial
markets. Most NGOs with a mandate of distributing fertilizers to the farming communities
import the commodity since local supplies will be dry. It is this institutional policy set-up that
dries the commercial route which brings complications in fertilizer supplies. Subsidizing
fertiliser at the same time drying the commercial supplies will have implications ranging from
leakages to exorbitant input prices on the informal market. The objective of the very policy may
not be achieved. The price of the commodity may rise three, four times more than that offered by
the government or NGOs. It will then be rational for the farmer to take the cheap fertilizer and
sell it at the informal market at a high price making instant profits, losing the whole logic of
setting up the subsidy program. The leakages may define some acts by the small-scale farming
community selling the commodity to local/urban agro-dealers or selling straight to some other
farmers. Also, some corrupt officials conducting the input schemes may be reported to be selling
the fertilizer to agro-dealers pushing a small percentage of the commodity through the correct
channel.
From the conceptual framework;
Pm((1-δ)+TCLm = PL (1)
This refers to the price of fertilizer that the local agro-dealers will pay to the manufacturing
companies or the regional or international suppliers. It is a function of some discount levied on
bulk purchases as well as some transaction costs incurred in the process of transferring
ownership of the commodity. The price PL is very important as it contributes to the pool of
factors determining the amount purchased by the agro-dealers. The agro-dealers will in turn sell
the fertilizer commodity to the small-scale farmers and as well to other large and commercial
farmers but the objective of this study is to follow the channel through to the small-scale
community.
Ph1= f(PL,πL, TCh1L) (2)
This is the price of fertilizers small-scale farmers will have to pay. It is a function of price PL,
some profits, and transaction costs incurred in transferring ownership from agro-dealers to small-
scale farmers. It is the price of the fertilizer and some other endogenous and exogenous factors
which determines the amount of the fertilizer to be purchased, utilization, crops to be put under
production, and the possible yield.
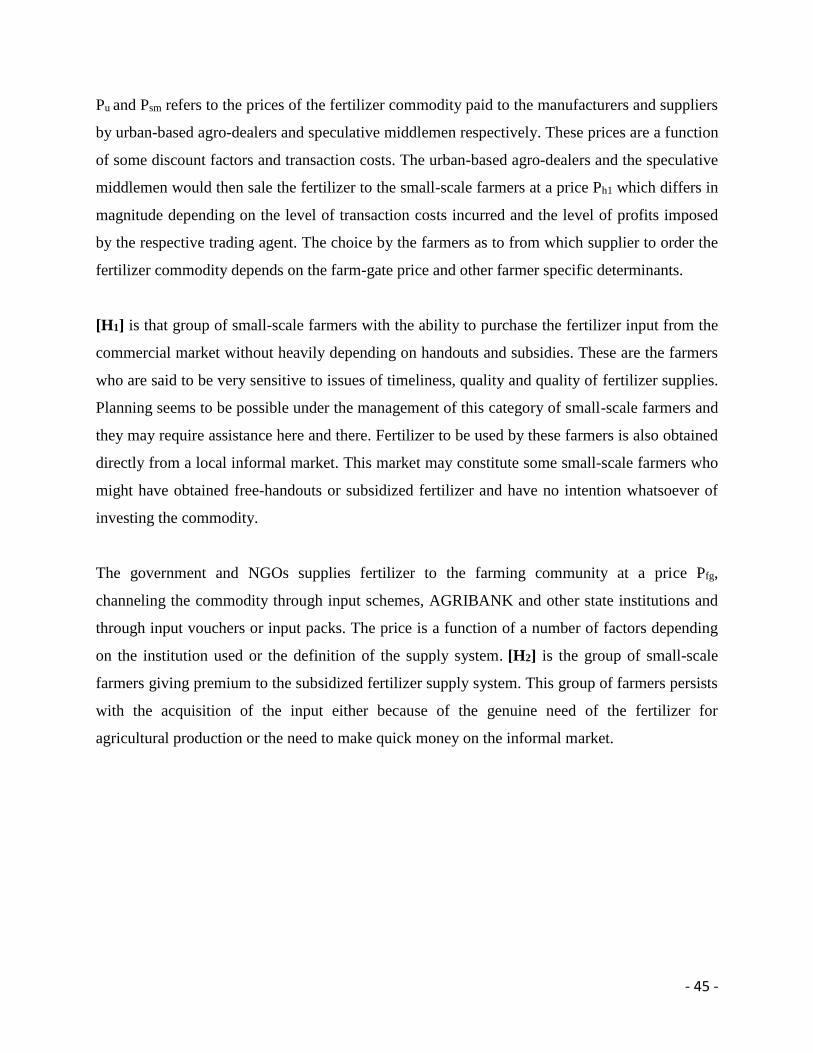
- 45 -
Pu and Psm refers to the prices of the fertilizer commodity paid to the manufacturers and suppliers
by urban-based agro-dealers and speculative middlemen respectively. These prices are a function
of some discount factors and transaction costs. The urban-based agro-dealers and the speculative
middlemen would then sale the fertilizer to the small-scale farmers at a price Ph1 which differs in
magnitude depending on the level of transaction costs incurred and the level of profits imposed
by the respective trading agent. The choice by the farmers as to from which supplier to order the
fertilizer commodity depends on the farm-gate price and other farmer specific determinants.
[H1] is that group of small-scale farmers with the ability to purchase the fertilizer input from the
commercial market without heavily depending on handouts and subsidies. These are the farmers
who are said to be very sensitive to issues of timeliness, quality and quality of fertilizer supplies.
Planning seems to be possible under the management of this category of small-scale farmers and
they may require assistance here and there. Fertilizer to be used by these farmers is also obtained
directly from a local informal market. This market may constitute some small-scale farmers who
might have obtained free-handouts or subsidized fertilizer and have no intention whatsoever of
investing the commodity.
The government and NGOs supplies fertilizer to the farming community at a price Pfg,
channeling the commodity through input schemes, AGRIBANK and other state institutions and
through input vouchers or input packs. The price is a function of a number of factors depending
on the institution used or the definition of the supply system. [H2] is the group of small-scale
farmers giving premium to the subsidized fertilizer supply system. This group of farmers persists
with the acquisition of the input either because of the genuine need of the fertilizer for
agricultural production or the need to make quick money on the informal market.
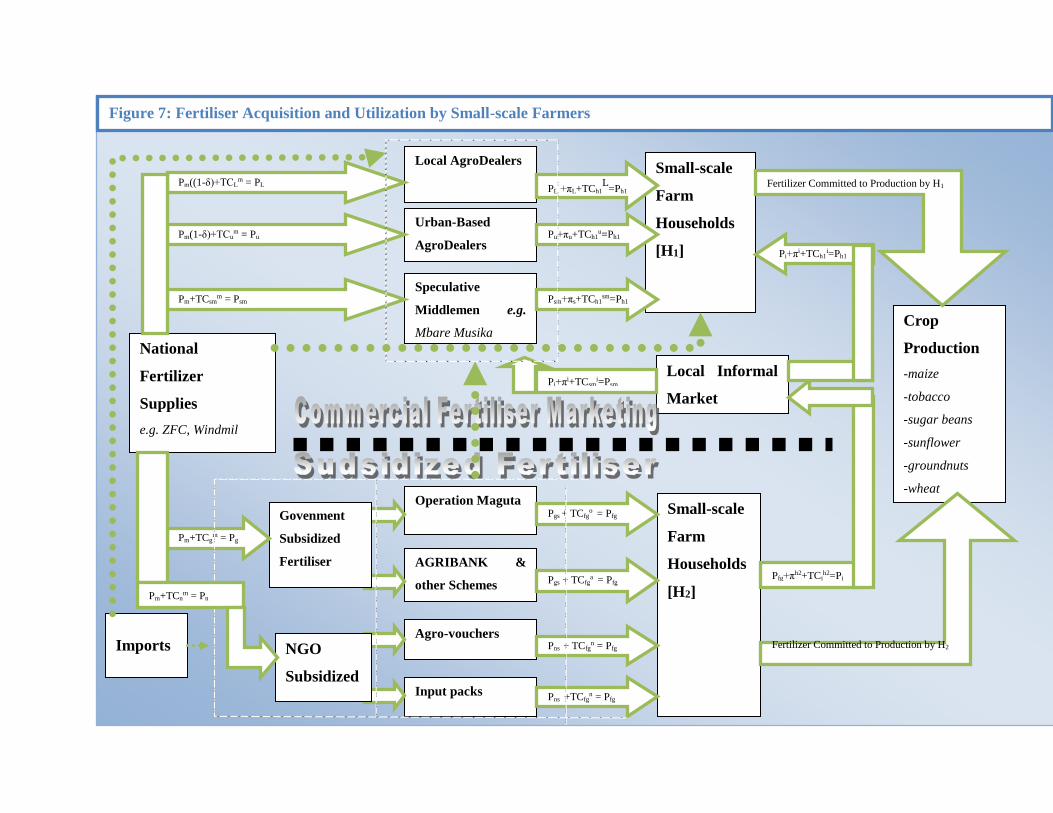
National
Fertilizer
Supplies
e.g. ZFC, Windmil
Imports
Operation Maguta
AGRIBANK &
other Schemes
Local AgroDealers
Speculative
Middlemen e.g.
Mbare Musika
Urban-Based
AgroDealers
Input packs
Agro-vouchers
Small-scale
Farm
Households
[H1]
Small-scale
Farm
Households
[H2]
Local Informal
Market
Crop
Production
-maize
-tobacco
-sugar beans
-sunflower
-groundnuts
-wheat
-cotton
Pm((1-δ)+TCLm = PL
Pm+TCsmm = Psm
Pm(1-δ)+TCum = Pu
Psm+πs+TCh1sm=Ph1
Pu+πu+TCh1u=Ph1
PL +πL+TCh1L
=Ph1
Govenment
Subsidized
Fertiliser
NGO
Subsidized
Fertiliser
Pgs + TCfgo = Pfg
Pgs + TCfga = Pfg
Pns + TCfgn = Pfg
Pns +TCfgn = Pfg
Pi+πi+TCsmi=Psm
Pm+TCgm = Pg
Pm+TCnm = Pn
Pfg+πh2+TCih2=Pi
Pi+πi+TCh1i=Ph1
Fertilizer Committed to Production by H2
Fertilizer Committed to Production by H1
Figure 7: Fertiliser Acquisition and Utilization by Small-scale Farmers

47
The commercial market orders fertilizer from the manufacturing companies basing on the
prevailing effective demand and the institutional setup defining the dominant rules of fertilizer
distribution. The more they are aware that government input schemes are possibly going to
distribute fertilizers to small-scale farmers for free, the less they will venture into the business of
buying, stocking and selling the commodity. Operation Food Security has extensively targeted
specific crops such as maize by the small-scale farming society. The small-scale farmers would
file their fertilizer requirements to the institution prior to getting the input packs on a condition
that they will sell their entire surplus to the GMB at an expected producer price of Pqɛ after the
harvesting season.
With this expected maize output price in mind, the price of other inputs, the cost at which they
will obtain the fertilizer from designated depots which is a function of a basket of transaction
costs, and given their assets, the small-scale farmers ([H2]) will only be eligible to get an amount
of fertilizer which is exogenously determined. Along this public channel, the farm-gate price of
the fertilizer is largely dependent on the level of transaction costs since at the loaning agents’
depots, the commodity is almost for free. Those farmers who prefer using channel 1 order
fertilizers from the commercial/free market and solicit some bags of the commodity from the
[H2] group of farmers who would have managed through extraordinary persistence to get the free
fertilizer from schemes like Operation Food Security.
In a way, it is like the fertilizer marketing systems in place deals with the small-scale farming
community in isolation, but at the end there are still some possibilities of resource transfer from a
locality of high concentration to that of low concentration of the fertilizer input. This framework
suggests that a truly integrated fertilizer distribution system is likely to be a lasting solution to
the problem of fertilizer availability and that a significant cross-fertilization between the input
distribution disciplines is the key element providing more fruitful ground for this study.
After such a round of fusion and transfer of the fertilizers, the question that baffles many
concerns the most efficient institutional set-up, economic and social policy structure that
enhances performance in the fields. The figure shows that performance of the two groups of
small-scale farmers, [Hi for i=1,2], is dependent largely on the channel used as is influenced by
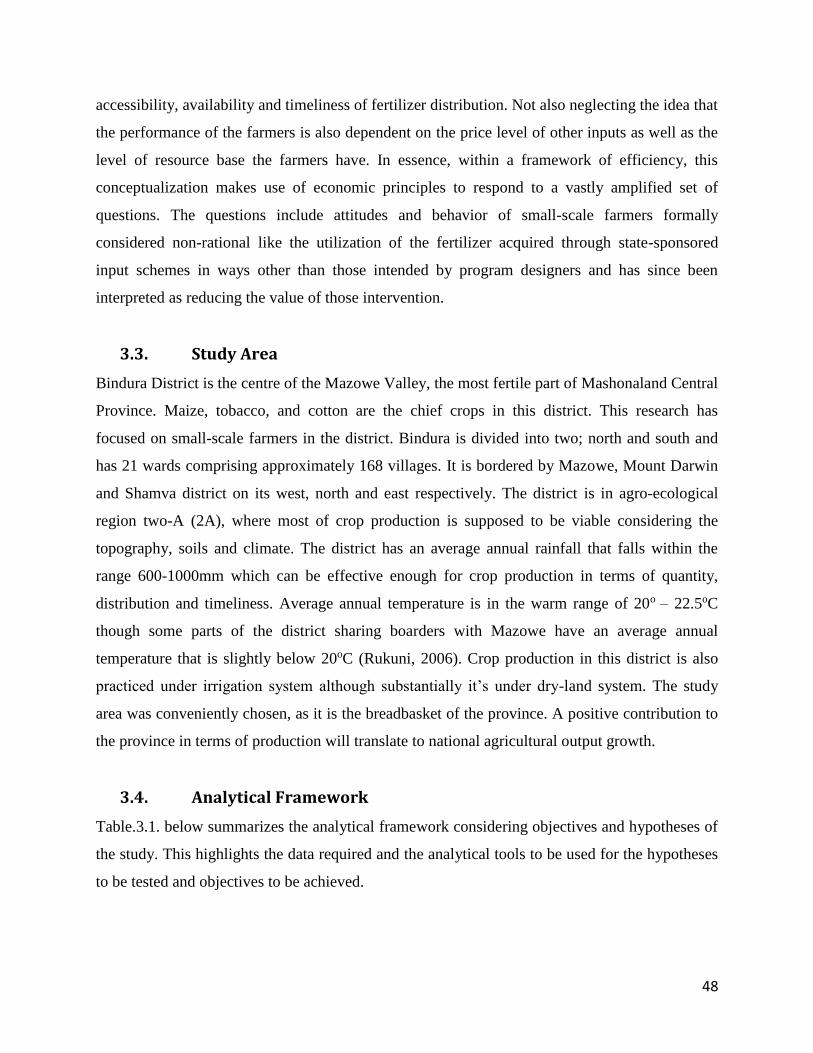
48
accessibility, availability and timeliness of fertilizer distribution. Not also neglecting the idea that
the performance of the farmers is also dependent on the price level of other inputs as well as the
level of resource base the farmers have. In essence, within a framework of efficiency, this
conceptualization makes use of economic principles to respond to a vastly amplified set of
questions. The questions include attitudes and behavior of small-scale farmers formally
considered non-rational like the utilization of the fertilizer acquired through state-sponsored
input schemes in ways other than those intended by program designers and has since been
interpreted as reducing the value of those intervention.
3.3. Study Area
Bindura District is the centre of the Mazowe Valley, the most fertile part of Mashonaland Central
Province. Maize, tobacco, and cotton are the chief crops in this district. This research has
focused on small-scale farmers in the district. Bindura is divided into two; north and south and
has 21 wards comprising approximately 168 villages. It is bordered by Mazowe, Mount Darwin
and Shamva district on its west, north and east respectively. The district is in agro-ecological
region two-A (2A), where most of crop production is supposed to be viable considering the
topography, soils and climate. The district has an average annual rainfall that falls within the
range 600-1000mm which can be effective enough for crop production in terms of quantity,
distribution and timeliness. Average annual temperature is in the warm range of 20o – 22.5oC
though some parts of the district sharing boarders with Mazowe have an average annual
temperature that is slightly below 20oC (Rukuni, 2006). Crop production in this district is also
practiced under irrigation system although substantially it’s under dry-land system. The study
area was conveniently chosen, as it is the breadbasket of the province. A positive contribution to
the province in terms of production will translate to national agricultural output growth.
3.4. Analytical Framework
Table.3.1. below summarizes the analytical framework considering objectives and hypotheses of
the study. This highlights the data required and the analytical tools to be used for the hypotheses
to be tested and objectives to be achieved.
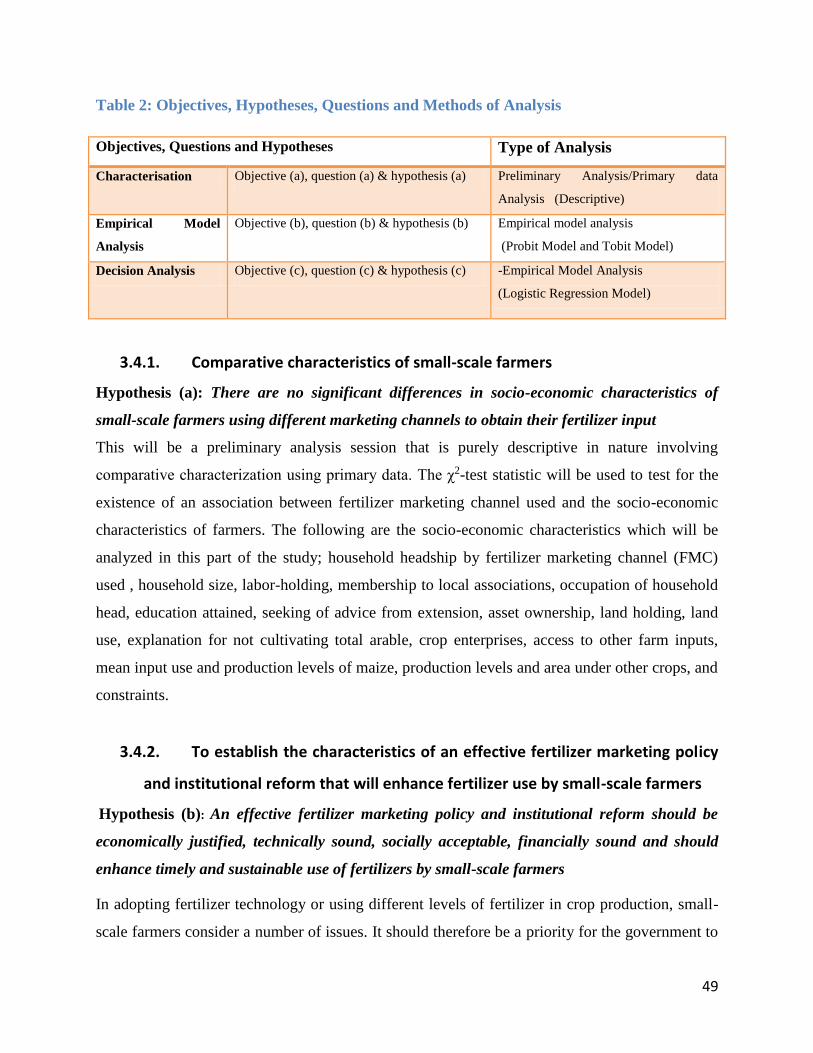
49
Table 2: Objectives, Hypotheses, Questions and Methods of Analysis
Objectives, Questions and Hypotheses Type of Analysis
Characterisation Objective (a), question (a) & hypothesis (a) Preliminary Analysis/Primary data
Analysis (Descriptive)
Empirical Model
Analysis
Objective (b), question (b) & hypothesis (b) Empirical model analysis
(Probit Model and Tobit Model)
Decision Analysis Objective (c), question (c) & hypothesis (c) -Empirical Model Analysis
(Logistic Regression Model)
3.4.1. Comparative characteristics of small-scale farmers
Hypothesis (a): There are no significant differences in socio-economic characteristics of
small-scale farmers using different marketing channels to obtain their fertilizer input
This will be a preliminary analysis session that is purely descriptive in nature involving
comparative characterization using primary data. The χ2-test statistic will be used to test for the
existence of an association between fertilizer marketing channel used and the socio-economic
characteristics of farmers. The following are the socio-economic characteristics which will be
analyzed in this part of the study; household headship by fertilizer marketing channel (FMC)
used , household size, labor-holding, membership to local associations, occupation of household
head, education attained, seeking of advice from extension, asset ownership, land holding, land
use, explanation for not cultivating total arable, crop enterprises, access to other farm inputs,
mean input use and production levels of maize, production levels and area under other crops, and
constraints.
3.4.2. To establish the characteristics of an effective fertilizer marketing policy
and institutional reform that will enhance fertilizer use by small-scale farmers
Hypothesis (b): An effective fertilizer marketing policy and institutional reform should be
economically justified, technically sound, socially acceptable, financially sound and should
enhance timely and sustainable use of fertilizers by small-scale farmers
In adopting fertilizer technology or using different levels of fertilizer in crop production, small-
scale farmers consider a number of issues. It should therefore be a priority for the government to

50
design fertilizer marketing policies or institutions that incorporate these critical issues in their
make-up. This will contribute to the design of an effective fertilizer marketing policy and a
systematic approach to institutional reform that has a long-term strategic vision with the ability
to deal with unforeseen social, technical, financial, economic and political consequences.
Fertilizer input subsidization per se is unlikely to have a marked effect on fertilizer use unless
preceded or accompanied by a variety of structural reforms to remove the various constraints
facing the small-scale farming community. Thus, the strategy of only getting prices right through
input subsidization is not enough to promote fertilizer use. The response may be sluggish not
only because of price distortions but also because of structural constraints such as lack of access
to input markets, poor road infrastructure, absence of rural institutions specialized in providing
loans without collateral, low returns to investment, high transaction costs and late input delivery
system.
It is hypothesized in this study that an institutional and policy setup that is ignorant of the
following aspects will not yield the best results in promoting fertilizer use by the small-scale
community. The aspects have different magnitudes in the way they influence fertilizer use and
this should be noted in designing an effective fertilizer marketing policy. The aspects involve all
factors which influence utilization and are; access to the fertilizer input; efficiency of the
delivery systems; transaction costs; landholding size; age of the household head; literacy;
presence of rural institutions specialized in providing unsecured loans; household size; on-farm
income; off-farm income; road infrastructure; expected rainfall conditions; returns to
investments; opportunity cost of fertilized crop production; producer welfare effect among many.
Empirical Model Specification
Limited dependent variables models have been widely used in technology adoption studies. The
said models are based on the assumption that, in making use of a technology, the farmer is
assumed to maximize expected utility (expected profit) from using that technology subject to
some constraints (Feder, 1985). In the case of categorical dependent variable (binomial or
multinomial) qualitative choice models of adoption such as the probit are usually specified.
These models are commonly used to analyze situations where choice problem is whether or not
(0-1 value range) to adopt a technology. This study therefore employs a probit model to examine

51
the determinants of small-scale farmers’ decision to use or not fertilizers. The probit model
specification used in this study adapted from Bierens (2004) is given by;
(3)
Where, AF is the discrete fertilizer utilization choice variable, F is the cumulative probability
distribution function, β is the vector of parameters, x is the vector of explanatory variables and z
is the Z-score of the βx area under the normal curve (Bierens, 2004).
The expected value of the discrete variable in the model conditional or explanatory variables is
given by (Bierens, 2004);
(4)
The marginal effect of each explanatory variable on the probability of utilization is;
(5)
Where Ø(.) is the standard normal density function (Bierens, 2004).
While the probit model is adequate for analyzing adoption decisions that occur over a discrete
range such as yes or not, it does not handle the case of adoption choices that have a continuous
value range that is truncated from below. This is the typical case for fertilizer utilization
decisions where some small-scale farmers apply positive levels of fertilizer while others have
zero applications (non- users). Intensity of use is a very important aspect of fertilizer utilization
because it is not only the choice to use but also how much to apply that often matters. The tobit
model of Tobin (1958) is used to handle truncated distribution dependent choice variables such
as levels of fertilizer use (Bierens, 2004). This study used the tobit model specification to
analyze determinants of the variation in intensity of fertilizer use by maize producing small-scale
farmers as adapted from Milner-Gulland (1996) and is given by;
(6)

52
Where AD is the utilization intensity (level of fertilizer application), is the critical value
adoption intensity and is the standard error term, f(x) the value of the derivative of the normal
curve at a given point (density function). McDonald and Moffit (1980) showed that the marginal
effect of an explanatory variable on the expected value of the truncated distribution is given by;
(7)
On the other hand, the change in the probability of adoption as the explanatory variable
changes is given by the following as explained by McDonald and Moffit (1980);
(8)
And the change in the intensity of adoption among adopters as an explanatory variable changes
is given by equation 9 below (MacDonal, 1980);
] (9)
A number of interrelated components within the decision environment in which small-scale
farmers operate influence the utilization of fertilizer. However, not all factors are equally
important in different areas and for small-scale farmers with different socio-economic situations.
Socio-economic factors such as age of the household head, household size, literacy and
landholding size were considered important determinants of fertilizer utilization. The age of the
household head (AGE) is measured in years and is a continuous variable, landholding size
(LAND) is continuous and is measured in hectares and household size (HSIZE) is also a
continuous variable. Literacy (LITERACY) takes a value of one (1) if the farmer is literate and
zero (0) otherwise. Access to fertilizer inputs describes the easy with which the farmer acquires
the input (FERTACCESS) and is represented by a dummy variable (1 = easily accessible, 0 =
accessibility is a problem) and efficiency of the delivery systems (DELIVERY) is also
represented by a dummy variable (1 = efficient, 0 = not efficient). Income from farming
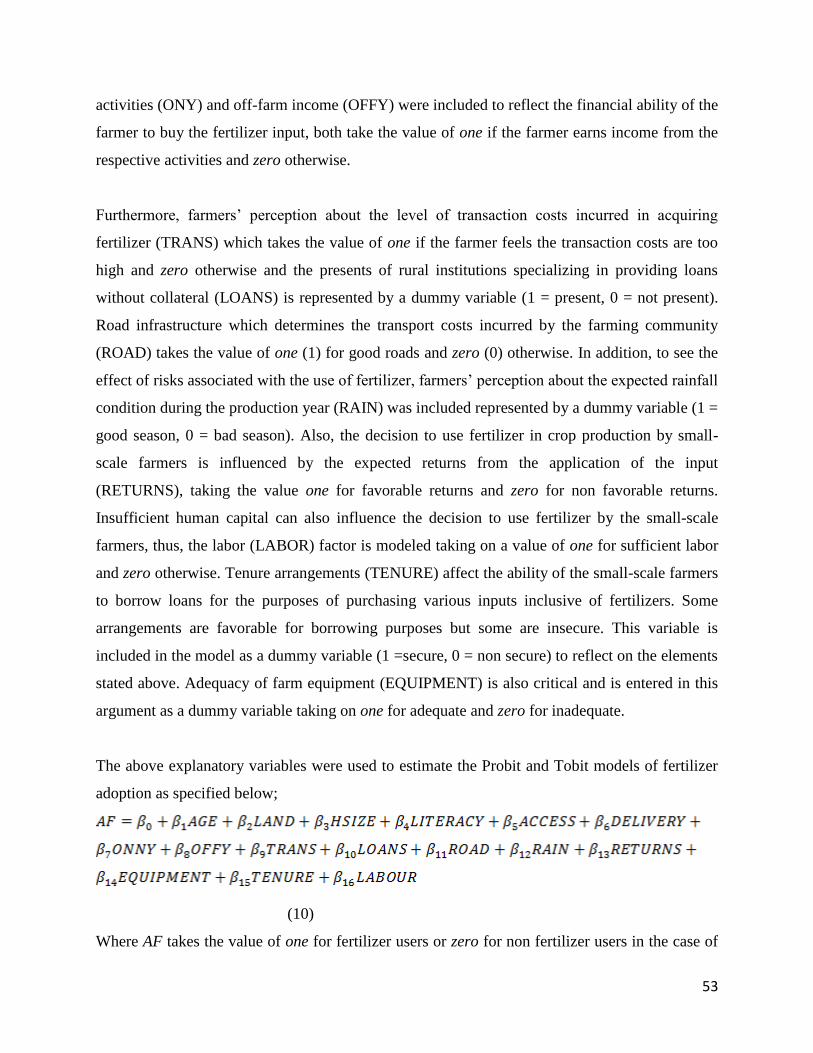
53
activities (ONY) and off-farm income (OFFY) were included to reflect the financial ability of the
farmer to buy the fertilizer input, both take the value of one if the farmer earns income from the
respective activities and zero otherwise.
Furthermore, farmers’ perception about the level of transaction costs incurred in acquiring
fertilizer (TRANS) which takes the value of one if the farmer feels the transaction costs are too
high and zero otherwise and the presents of rural institutions specializing in providing loans
without collateral (LOANS) is represented by a dummy variable (1 = present, 0 = not present).
Road infrastructure which determines the transport costs incurred by the farming community
(ROAD) takes the value of one (1) for good roads and zero (0) otherwise. In addition, to see the
effect of risks associated with the use of fertilizer, farmers’ perception about the expected rainfall
condition during the production year (RAIN) was included represented by a dummy variable (1 =
good season, 0 = bad season). Also, the decision to use fertilizer in crop production by small-
scale farmers is influenced by the expected returns from the application of the input
(RETURNS), taking the value one for favorable returns and zero for non favorable returns.
Insufficient human capital can also influence the decision to use fertilizer by the small-scale
farmers, thus, the labor (LABOR) factor is modeled taking on a value of one for sufficient labor
and zero otherwise. Tenure arrangements (TENURE) affect the ability of the small-scale farmers
to borrow loans for the purposes of purchasing various inputs inclusive of fertilizers. Some
arrangements are favorable for borrowing purposes but some are insecure. This variable is
included in the model as a dummy variable (1 =secure, 0 = non secure) to reflect on the elements
stated above. Adequacy of farm equipment (EQUIPMENT) is also critical and is entered in this
argument as a dummy variable taking on one for adequate and zero for inadequate.
The above explanatory variables were used to estimate the Probit and Tobit models of fertilizer
adoption as specified below;
(10)
Where AF takes the value of one for fertilizer users or zero for non fertilizer users in the case of
54
the Probit model and becomes AD in the case of tobit model to reflect the level of fertilizer used
in kg/ha of land.
3.4.3. Comparative analysis of the performance of small-scale farmers
Hypothesis (c): Fertilizer input supply system employed by small-scale farmers is not an
important variable, implying that their performance is influenced more by other factors
This analysis is used to test if the channel of fertiliser flow from the manufacturers or suppliers
of the fertiliser input is an important factor influencing the performance of the small-scale
farmers. Performance is measured using two sets of variables – crop production and asset
ownership. In this study area, more than two crops are grown. Farmers produce food crops and
cash crops. 100% of the farmers grow maize as number one food crop. 21% grow cotton as a
cash crop. As a measure of crop productivity, maize and cotton yield levels are used to depict
performance. Also, to depict performance in the form of investment in assets, plough and cattle
ownership is used.
For the food crop performance indicator, maize yield (the level of maize yield [MZYIELD] of
the small-scale farmer which might be above or below the average yield for the whole sample of
farmers) is represented using a dummy variable (1 = above average yield, 0 = below average
yield). Maize yield is assumed to be influenced by a number of factors including; channel of
fertiliser used by the small-scale farmer [FTCHANNEL] which is also represented by a dummy
variable (1 =commercial marketing, 0 = state-sponsored input schemes); amount of basal
fertilizer[FERTBASAL] and top dressing fertiliser (FERTTOP) used by the farmers and is
continuous; weed control[WEED)] which is also represented by a dummy variable (1 = early, 0
= late); seed[SEED] represented by a dummy variable (1 = hybrid, 0 = not hybrid); farm
size[LAND] is a continuous variable measured in hectares; literacy[LITERATE] represented by
a dummy variable(1 = literate, 0 = illiterate) and labour [LABOR] represented by a dummy
variable(1 = constrained, 0 = not constrained).
For the cash crop performance indicator, cotton yield (the level of cotton yield [CYIELD] of the
small-scale farmer which might be above or below the average yield for the whole sample of
farmers) is represented using a dummy variable (1 = above average yield, 0 = below average

55
yield). Cotton yield is assumed to be influenced by a number of factors including; channel of
fertiliser used by the small-scale farmer [FTCHANNEL] which is also represented by a dummy
variable (1 =commercial marketing, 0 = state-sponsored input schemes); amount of basal
fertilizer[FERTBASAL] and top dressing fertiliser (FERTTOP) used by the farmers and is
continuous; weed control[WEED)] which is also represented by a dummy variable (1 = early, 0
= late); seed[SEED] represented by a dummy variable (1 = hybrid, 0 = not hybrid); farm
size[LAND] is a continuous variable measured in hectares; literacy[LITERATE] represented by
a dummy variable(1 = literate, 0 = illiterate) and labour [LABOR] represented by a dummy
variable(1 = constrained, 0 = not constrained).
In considering asset ownership, plough and cattle ownership were taken as the dependent
variables where; plough ownership (POWNERSHIP) is represented using a dummy variable (1 =
at least one plough, 0 = no plough at all). Plough ownership is assumed to be influenced by a
number of factors including on-farm income (ONNY) and off-farm income (OFFY) both
represented by a dummy (1 = if the farmer earns income from the source, 0 = if the farmer does
not earn income from the source), farm size [LAND] which is a continuous variable measured in
hectares; channel of fertiliser used by the small-scale farmer [FTCHANNEL] which is also
represented by a dummy variable (1 =commercial marketing, 0 = state-sponsored input
schemes), labour [LABOR] also represented by a dummy variable(1 = constrained, 0 = not
constrained), literacy[LITERATE] represented by a dummy variable(1 = literate, 0 = illiterate),
draftpower (DRAFTPOWER) being represented by 1 if the farmer has at least one head and 0 if
the farmer has zero cattle, and loans (CREDIT) also being represented by a dummy (1= if the
farmer has access to commercial loans, 0 = no access to loans).
Also, cattle ownership (COWNERSHIP) is represented using a dummy variable (1 = at least one
head, 0 = no cattle at all). Cattle ownership is assumed to be influenced by a number of factors
including on-farm income (ONNY) and off-farm income (OFFY) both represented by a dummy
(1 = if the farmer earns income from the source, 0 = if the farmer does not earn income from the
source), farm size [LAND] which is a continuous variable measured in hectares; channel of
fertiliser used by the small-scale farmer [FTCHANNEL] which is also represented by a dummy
variable (1 = commercial marketing, 0 = state-sponsored input schemes), labour [LABOR] also
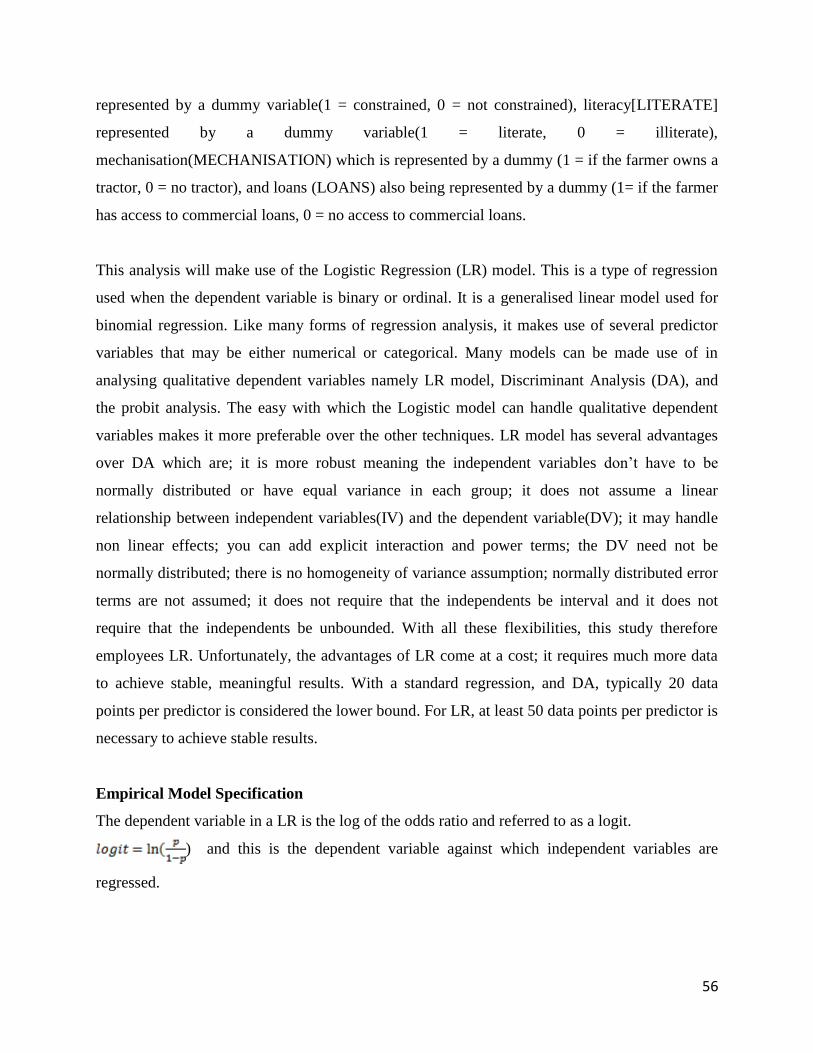
56
represented by a dummy variable(1 = constrained, 0 = not constrained), literacy[LITERATE]
represented by a dummy variable(1 = literate, 0 = illiterate),
mechanisation(MECHANISATION) which is represented by a dummy (1 = if the farmer owns a
tractor, 0 = no tractor), and loans (LOANS) also being represented by a dummy (1= if the farmer
has access to commercial loans, 0 = no access to commercial loans.
This analysis will make use of the Logistic Regression (LR) model. This is a type of regression
used when the dependent variable is binary or ordinal. It is a generalised linear model used for
binomial regression. Like many forms of regression analysis, it makes use of several predictor
variables that may be either numerical or categorical. Many models can be made use of in
analysing qualitative dependent variables namely LR model, Discriminant Analysis (DA), and
the probit analysis. The easy with which the Logistic model can handle qualitative dependent
variables makes it more preferable over the other techniques. LR model has several advantages
over DA which are; it is more robust meaning the independent variables don’t have to be
normally distributed or have equal variance in each group; it does not assume a linear
relationship between independent variables(IV) and the dependent variable(DV); it may handle
non linear effects; you can add explicit interaction and power terms; the DV need not be
normally distributed; there is no homogeneity of variance assumption; normally distributed error
terms are not assumed; it does not require that the independents be interval and it does not
require that the independents be unbounded. With all these flexibilities, this study therefore
employees LR. Unfortunately, the advantages of LR come at a cost; it requires much more data
to achieve stable, meaningful results. With a standard regression, and DA, typically 20 data
points per predictor is considered the lower bound. For LR, at least 50 data points per predictor is
necessary to achieve stable results.
Empirical Model Specification
The dependent variable in a LR is the log of the odds ratio and referred to as a logit.
) and this is the dependent variable against which independent variables are
regressed.

57
If, for MZYIELD
(11)
........where β0 is an intercept and βi for i=1,2,…7 are regression coefficients
Then the logit is converted into a probability using this formula;
logit-
logit
logit
e 1
1
e 1
e p
)11( a
as adapted from Milner-Gulland (1996)
There is no direct equivalence of R (or R-squared) for LR to which we can get an idea of how
powerful our equation is at predicting the variable of interest. However, there are R-like
measures which can be used and these are ‘Cox and Snell’s R-square’, ‘Pseudo-R-square’ as
well as ‘Hagle and Mitchell’s Pseudo-R-square’ (Milner-Gulland, 1996)
LR is perfect for situations where you are trying to predict whether something “happens” or not,
e.g a farmer attains above average yield or not, or the farmer owns a specific asset or not. These
are binary outcome measures. It is actually useful where the data set is large, and the predictor
variables do not behave in orderly ways, or obey the assumptions required of DA. From a
practical standpoint, LR and Least Squares (OLS) regression are almost identical. Both methods
produce prediction equations. In both cases the regression coefficients measure the predictive
capability of the independent variables. The response variable that characterise LR is what makes
it special. With OLS regression, the response variable is a quantitative variable. With LR, the
response variable is an indicator of some characteristic, that is 0/1 variable. The LR predicts the
natural logarithm of the odds (log odds) that an observation will have an indicator equal to 1. The
odds of an event is defined as the ratio of the probability that an event occurs to the probability
that it fails to occur, (Milner-Gulland, 1996)
For example- maize yield
Thus;
Or
…………..in this example the will be maize yield (MZYIELD)
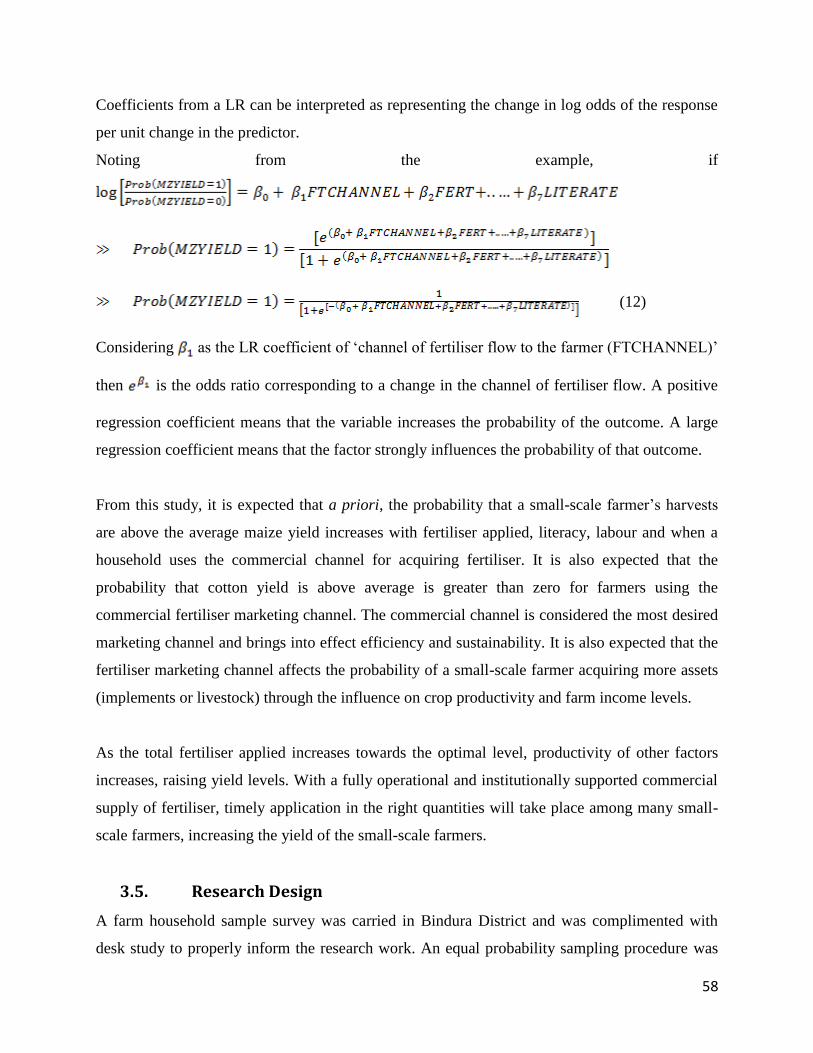
58
Coefficients from a LR can be interpreted as representing the change in log odds of the response
per unit change in the predictor.
Noting from the example, if
(12)
Considering as the LR coefficient of ‘channel of fertiliser flow to the farmer (FTCHANNEL)’
then is the odds ratio corresponding to a change in the channel of fertiliser flow. A positive
regression coefficient means that the variable increases the probability of the outcome. A large
regression coefficient means that the factor strongly influences the probability of that outcome.
From this study, it is expected that a priori, the probability that a small-scale farmer’s harvests
are above the average maize yield increases with fertiliser applied, literacy, labour and when a
household uses the commercial channel for acquiring fertiliser. It is also expected that the
probability that cotton yield is above average is greater than zero for farmers using the
commercial fertiliser marketing channel. The commercial channel is considered the most desired
marketing channel and brings into effect efficiency and sustainability. It is also expected that the
fertiliser marketing channel affects the probability of a small-scale farmer acquiring more assets
(implements or livestock) through the influence on crop productivity and farm income levels.
As the total fertiliser applied increases towards the optimal level, productivity of other factors
increases, raising yield levels. With a fully operational and institutionally supported commercial
supply of fertiliser, timely application in the right quantities will take place among many small-
scale farmers, increasing the yield of the small-scale farmers.
3.5. Research Design
A farm household sample survey was carried in Bindura District and was complimented with
desk study to properly inform the research work. An equal probability sampling procedure was

59
used to come up with 100 Ultimate Sampling Units and information was collected from these
households. Knowledgeable individuals from the households who were only permanent residents
were interviewed. Government departments under the Ministry of Agriculture were visited and
officials interviewed. Through this, technical personnel were allowed to express their own
accounts of their experiences by describing and explaining their opinions in their own words.
This method was given an opportunity to clarify the questions in order to solicit for more
information.
3.6. Research Procedure
100 questionnaires were administered in the study area. A list of farmers from the district was
obtained from AGRITEX, Mashonaland Central Province. A simple random sampling technique
was employed in coming up with the sample to enhance the validity of the study. This involves
assigning numbers in alphabetic order of the surnames. The numbers were correspondingly
printed onto slips of paper and the slips put into a container and mixed thoroughly. The slips
were then drawn from the container one at a time and the numbers recorded on a sheet of paper.
The questionnaires were then administered to the households whose names corresponded to the
selected numbers.
3.7. Chapter Summary
The chapter presented the basic route the study will follow to test the hypothesis and answer
research questions. The conceptual framework depicted the flow of the fertilizer inputs from the
manufacturers and different suppliers to the small-scale farming communities. It highlights how
the channel of fertilizer flow affects the quality to be received, transaction costs incurred,
fertilizer allocation and its utilization as well as crop production.
The two broad channels depicted include the public and the free market system. The study area is
discussed as well as the analytical framework. Descriptive analysis is said to be used to
characterize the small-scale farming households, noting the significant differences in socio-
economic characteristics of the farmers. The chapter reveals that the study will use the logistical
regression model to carry out a comparative analysis of the performance of small-scale farmers
to establish if the fertilizer input supply system employed by the farmers is an important variable

60
of performance. The chapter also highlighted that the tobit and probit models will be used to
establish the characteristics of an effective fertilizer marketing policy and institutional reform
that will enhance fertilizer use by small-scale farmers.

61
CHAPTER FOUR
COMPARATIVE CHARACTERISATION OF SMALL-SCALE FARMERS
4.1. Introduction
This chapter is a preliminary analysis that is purely descriptive in nature involving comparative
characterization using primary data. The chapter assesses for any significant differences in the
socio-economic and biophysical characteristics of small-scale farmers using different fertilizer
marketing channels. The χ2-test for homogeneity is used to test the hypothesis that each socio-
economic and/or biophysical characteristic has the same proportion of observations across
different channels of fertilizer supply.
4.2. Household Organization and General Characteristics
In the study area, the head of the household is generally the husband if alive or otherwise the
widow or the eldest son. In around 17% of the surveyed households, women take day-to-day
decisions about running the farm. About 11% of these are de jure female –headed households
with the women making all the decisions although they may consult their children or other
relatives. Although in de facto female-headed households, women manage the farm, they usually
consult men for changes in crops or farming practices. 62% of the households indicated that
decision-making is an all-inclusive consultative practice whereby the father and the mother help
each other in making farming decisions. In around 9% of the surveyed households, the eldest son
is answerable for all actions at the farm. These children make day to day decisions on how the
farm should be run either because all the parents are dead or because they fell prey to some form
of victimization or abuse. About 74% of the households are male headed with the male making
all the necessary decisions and probably delegating to some other supporting staff like the wife,
the children or designated management.

62
Table 3: Household Headship by Fertiliser Marketing Channel (FMC)
Fertiliser
Marketing
Channel
Household Headship, % of total households ; n = 100
Male headed
Female headed
Child headed
Total
Commercial 11 0 1 12
Public 38 13 2 53
Both Commercial
and Public
25 4 6 35
Total 74 17 9 100
Chi2(2) 1 3.59
p 0.043
Source: Survey Data, 2010
Considering the three categories of fertilizer acquisition, the public fertilizer marketing system
(53%) seems to be serving more farmers. The least ranked in terms of percentage of farmers
served is the commercial marketing system (12%). About 35% of farmers obtain their inputs
from both the commercial and public marketing systems. The majority of farmers using the
public system belong to male headed households constituting 38% against a mere 13% for
female headed households. The survey has also revealed that male-headed households dominate
the commercial marketing system. Male headed households use more of the public fertilizer
marketing system than the commercial marketing system or use of both systems and the same
applies for the female headed households. As for the child headed households, the commercial
marketing system is used more than any other channel.
A test for homogeneity between household headship and the fertilizer marketing channel used
led to the rejection of the null hypothesis which states that each household headship category has
the same proportion of observations at every channel of fertilizer flow in favor of the alternative
hypothesis at the 5% significance level. Results seem to suggest different household headship
categories have different proportions of observations under commercial, public and both
categories of fertilizer marketing systems. Female headed households are socially disadvantaged
and can hardly stand a chance to win the favor of the fertilizer distributing agencies of the public
marketing system. An analysis carried out depicted that less female-headed households use
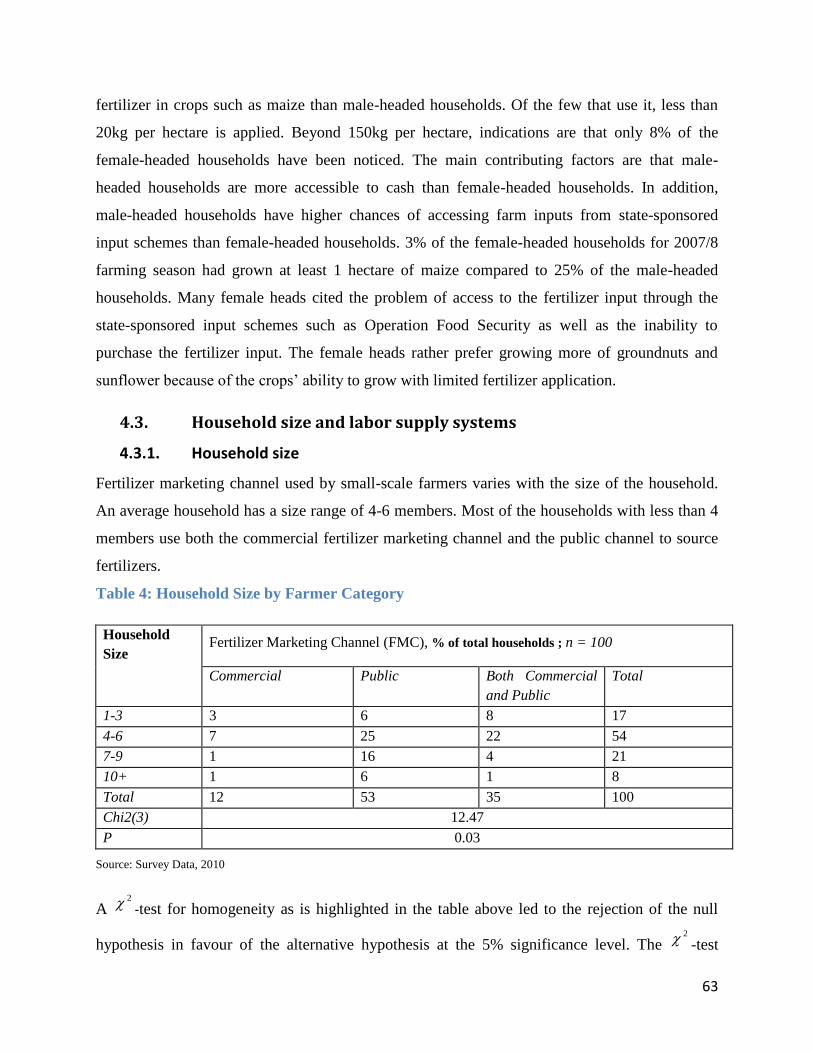
63
fertilizer in crops such as maize than male-headed households. Of the few that use it, less than
20kg per hectare is applied. Beyond 150kg per hectare, indications are that only 8% of the
female-headed households have been noticed. The main contributing factors are that male-
headed households are more accessible to cash than female-headed households. In addition,
male-headed households have higher chances of accessing farm inputs from state-sponsored
input schemes than female-headed households. 3% of the female-headed households for 2007/8
farming season had grown at least 1 hectare of maize compared to 25% of the male-headed
households. Many female heads cited the problem of access to the fertilizer input through the
state-sponsored input schemes such as Operation Food Security as well as the inability to
purchase the fertilizer input. The female heads rather prefer growing more of groundnuts and
sunflower because of the crops’ ability to grow with limited fertilizer application.
4.3. Household size and labor supply systems
4.3.1. Household size
Fertilizer marketing channel used by small-scale farmers varies with the size of the household.
An average household has a size range of 4-6 members. Most of the households with less than 4
members use both the commercial fertilizer marketing channel and the public channel to source
fertilizers.
Table 4: Household Size by Farmer Category
Household
Size Fertilizer Marketing Channel (FMC), % of total households ; n = 100
Commercial Public Both Commercial
and Public
Total
1-3 3 6 8 17
4-6 7 25 22 54
7-9 1 16 4 21
10+ 1 6 1 8
Total 12 53 35 100
Chi2(3) 12.47
P 0.03
Source: Survey Data, 2010
A 2
-test for homogeneity as is highlighted in the table above led to the rejection of the null
hypothesis in favour of the alternative hypothesis at the 5% significance level. The 2 -test

64
suggests that each household size has different proportions of observations across different
channels of fertilizer used. Smaller households use both the commercial channel and the public
channel while larger households use more of the public channel. This may be explained by the
fact that the public supply which is unreliable in terms of quantity and time is used by those
households with more labor and can afford the application of manure, compost, leaf litter, e.t.c.
4.3.2. Labor
The average adult labor equivalence (ALE) for the households in the district is 4.46 units with a
standard deviation of 1.52 units. The distribution of ALE shows some element of leptokurtism as
is indicated by the coefficient of kurtosis of 3.14. 28% of the households have ALE of 5 units
followed by 26% with size 4 and the least is ALE of 1 and 9 units each constituting 1%. The
proportion of members living on the farm has implications on the availability of labor for farm
activities. This may explain the reason why there is a correlation between household size and
fertilizer quantity applied by the farming households up to household size of 5. A household size
above 5 experiences a decrease in the utilization of the fertilizer input may be because of the
reason that more members would make it easy for the households to substitute fertilizer with
other soil ameliorates such as anthill, kraal manure, leaf liter or compost.
Household size and age structures are the important parameters impinging on labor supply and
subsistence requirements. Availability of adult active labor force is critical in sustaining the
livelihood of small-scale resource poor households. Family labor and hired-in labor are the main
sources of labor supply in the study area. Regarding allocation of labor to agricultural activities,
clearly adult women work the most and contribute around 44% of total labor input. There are a
number of gender-disaggregated and age related activities and farmers often face seasonal labor
shortages as well as buy and sell labor depending on their resource needs and resource level
status. Access to labor for fertilizer related activities were cited by farmers as a constraint
primarily for its application.
Table 5: Labor-holding by FMC
Labor-holding Fertilizer Marketing Channel (FMC), % of total households; n = 100
Commercial Public Total
1-3 4 23 27
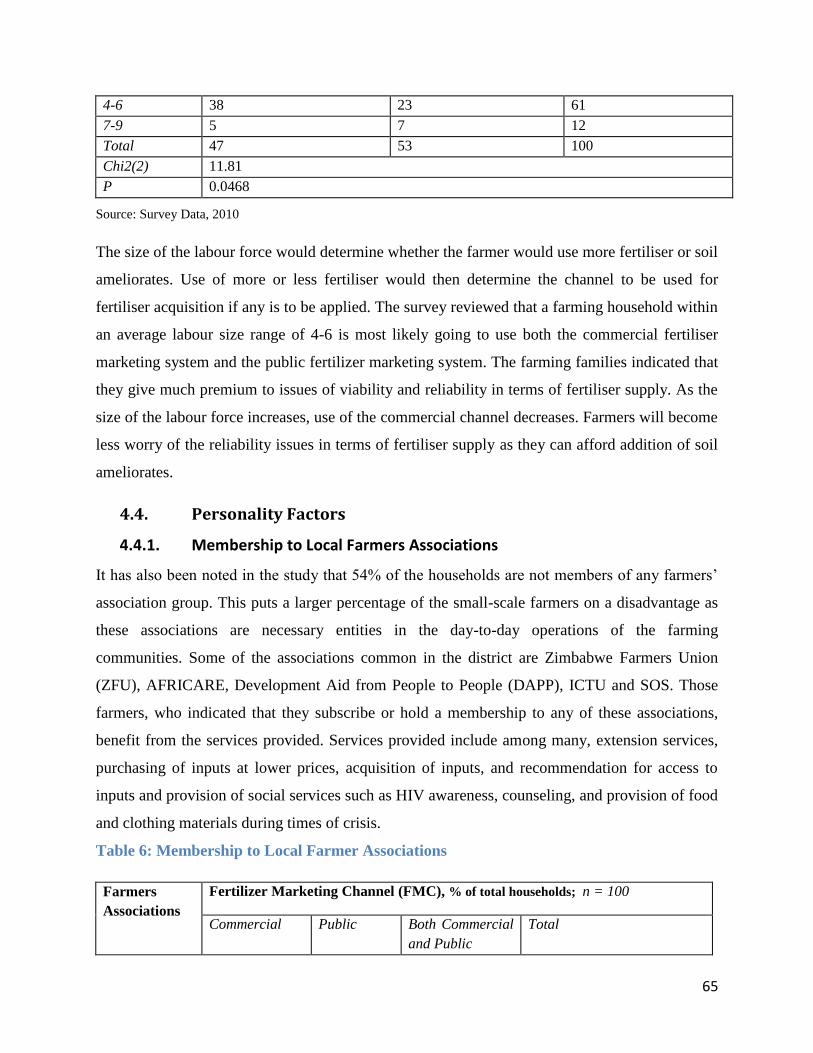
65
4-6 38 23 61
7-9 5 7 12
Total 47 53 100
Chi2(2) 11.81
P 0.0468
Source: Survey Data, 2010
The size of the labour force would determine whether the farmer would use more fertiliser or soil
ameliorates. Use of more or less fertiliser would then determine the channel to be used for
fertiliser acquisition if any is to be applied. The survey reviewed that a farming household within
an average labour size range of 4-6 is most likely going to use both the commercial fertiliser
marketing system and the public fertilizer marketing system. The farming families indicated that
they give much premium to issues of viability and reliability in terms of fertiliser supply. As the
size of the labour force increases, use of the commercial channel decreases. Farmers will become
less worry of the reliability issues in terms of fertiliser supply as they can afford addition of soil
ameliorates.
4.4. Personality Factors
4.4.1. Membership to Local Farmers Associations
It has also been noted in the study that 54% of the households are not members of any farmers’
association group. This puts a larger percentage of the small-scale farmers on a disadvantage as
these associations are necessary entities in the day-to-day operations of the farming
communities. Some of the associations common in the district are Zimbabwe Farmers Union
(ZFU), AFRICARE, Development Aid from People to People (DAPP), ICTU and SOS. Those
farmers, who indicated that they subscribe or hold a membership to any of these associations,
benefit from the services provided. Services provided include among many, extension services,
purchasing of inputs at lower prices, acquisition of inputs, and recommendation for access to
inputs and provision of social services such as HIV awareness, counseling, and provision of food
and clothing materials during times of crisis.
Table 6: Membership to Local Farmer Associations
Farmers
Associations
Fertilizer Marketing Channel (FMC), % of total households; n = 100
Commercial Public Both Commercial
and Public
Total

66
None 9 20 25 54
ZFU 1 13 2 16
AFRICARE 1 6 2 9
DAPP 0 4 0 4
ICTU 1 4 1 6
SOS 1 6 4 11
Total 12 53 35 100
Chi2(5) 12.82
P 0.0036
Source: Survey Data, 2010
A larger percentage of those not subscribing to any farmers association group uses both the
commercial and the public fertiliser marketing systems while those who hold membership use
more of the public channel to the commercial channel. The farmers’ association groups seem to
be linking the farmers to the public channel. This is expected since the farmers groups act as
lobbying entities for the supply of the fertiliser inputs to the farming communities. A 2
-test for
homogeneity has led to the rejection of the null hypotheses at 5% significance level. This
suggests that each farmers’ association group has different proportions of observations across all
channels of fertilizer used.
4.4.2. Occupation of Household Head
According to the survey, most of the small-scale farming household heads are in the informal
sector or self employed. Only 8% are full-time farmers while 9% are students either at school or
college. Full time farmers, those who are self-employed, public sector and the students, use more
of the public channel of fertiliser supply system while those farmers in the private sector use both
the commercial and public marketing systems. A priory it is expected that only farmers with the
financial ability to make own fertiliser purchases would use the commercial marketing system.
On the other hand, those farmers who can’t make own purchases, or those with the political
power will use more of the public marketing system.
Table 7: Occupation of Household Head
Occupation Fertilizer Marketing Channel (FMC), % of total households; n = 100

67
Commercial Public Both Commercial and Public Total
Full-time farmer 1 5 2 8
Self-employed 4 25 11 40
Public Sector 3 17 8 28
Private Sector 3 1 11 15
Student 1 5 3 9
Total 12 53 35 100
Chi2(4) 12.53
P 0.009
Source: Survey Data, 2010
Occupation of the household head determines the size of the income and power of influence and
these two variables then determine the fertiliser marketing channel used. The survey revealed
that there is an association between the fertiliser marketing channel used and the occupation of
the household head.
4.4.3. Education Attained by Household Heads
The survey showed that the majority of the total household heads (66%), have not attained
education or have attained education up to primary level and a mere 34% constitutes those
farmers who attained at least secondary school level. This generally indicates that most small-
scale farmers have little technical knowledge and need extensive extension services to
compliment what they know. This may positively improve on fertilizer utilization.
Table 8: Education Attained by Household Heads
Education Level Fertilizer Marketing Channel (FMC), % of total households; n = 100
Commercial Public Both Commercial
and Public
Total
Nil 2 30 6 38
Primary 3 18 7 28
Secondary 4 2 11 17
Tertiary 2 0 7 9
Degreed 1 1 2 4
Masters Degree 0 2 2 4
Total 12 53 35 100
Chi2(5) 19.45
P 0.019
68
Source: Survey Data, 2010
The table above is showing a special trend depicting some relationships. The less educated
farmers use more of the public fertiliser marketing system than the commercial marketing
system. Farmers who have gone above the secondary education give much premium to the
commercial fertiliser marketing system. 22% of the households using both the commercial and
public systems have attained at least a secondary education. Thus, the survey revealed that there
is an association between the education level attained by the household head and the fertiliser
marketing channel used. This reflects that the use of a channel of fertiliser flow is not uniform
across an education level category. This is what is revealed by the 2 -test at 5% significance
level.
4.4.4. Extension Services
Agricultural Technical and Extension Services (AGRITEX) provide extension services in
Bindura District. Extension officers are located in respective wards in the district and throughout
the country to give expert advice to farmers throughout the year. The survey indicated that 88%
of the farming households have knowledge of the existence of an Agricultural Extension Officer
in respective wards. 20% of the households have never sought advice from the Agricultural
Extension Officers. 80% of the respondents seek advice from the extension staff. Farmers can
seek advice from the extension staff individually or through block meetings, farmers’ clubs,
cooperatives, farm demonstrations, and field days. The most popular method in the district is
block meetings followed by field days. Farmers made it clear that they don’t normally make use
of individual consultations. With regards to the quality of the extension, 52% ranked it poor. The
most other important source of extension is the electronic and the print media particularly the
radio and the farmer magazine respectively. About 92% of the interviewed farmers have access
to the radio and 38% to agricultural shows. Very few get extension through NGOs and private
companies. Besides the fact that about 80% seek advice from the extension agents, fertilizer
application is still a problem in the small-scale farming sector. 43% of the respondents do not
even know the recommended fertilizer application rates and planting dates. This is a major
handicap in the district and explains the reason why agricultural productivity is very low.
Table 9: Extension Advice

69
Extension Advice Fertilizer Marketing Channel (FMC), % of total households; n = 100
Commercial Public Both Commercial
and Public
Total
Never 0 19 1 20
When in need 8 32 22 62
Throughout the farming season 4 2 12 18
Total 12 53 35 100
Chi2(2) 11.73
P 0.042
Source: Survey Data, 2010
Most of the farmers who never seek extension advice use the public fertiliser marketing system
(19%) to acquire their fertiliser while most of those who seek advice throughout the farming
season use both the commercial and the public marketing systems to acquire fertilizers. There
also seem to be an association between seeking of extension advice and the fertilizer marketing
channel used to acquire fertilizers as is indicated by the test of association at 5% significance
level.
4.5. Asset Ownership of Households by FMC
The ownership of farm equipment and machinery indicates that farm implements are very critical
when it comes to what to produce, how to produce, and when to produce. Crop output at farm
level is largely dependent on this aspect. Farmers with necessary farm implements are able to
come to terms with timely operations and thus the ability to reduce the costs associated with the
monetary value of lost time. The ownership of important farm implements varied across
households interviewed. The major implements were ox-drawn carts, ploughs, planters,
cultivators and vehicles. Ox-drawn carts are extensively used by small-scale farmers to transport
agricultural and non-agricultural inputs as well as output from one point to another. Ownership
of this important asset would enable farmers to transport fertilizer from the market to the farm-
house or to the field. The other alternative is to pay for the transportation, which is rather costly
to the small-scale farming households. Without ox-drawn carts, draught power or any vehicle,
use of fertilizer by the households is negatively affected.
40% of the sampled farmers did not have ox-drawn carts, and 57% of the farmers had one cart
while 3% had 2 carts. Of the 57% who had one ox-drawn cart per individual farmer, only 36%
had working carts. In essence, with these percentages and considering an average ox-cart

70
ownership of 0.63 with a standard deviation of 0.54, it implies farmers are also facing a transport
constraint to an extent that they can’t mobilize some of their resources such as fertilizers. Of
major interest is the plough; the survey revealed that 66% of the farmers have a plough, 14%
have two ploughs while 20% have no plough at all. The average plough ownership is 0.94 with a
standard deviation of 0.58. Plough ownership presents the extent of tillage and land preparation
constraints being faced by the farming households. Also of equal importance is the cultivator
although the sample reviewed that 55% of the farmers have zero cultivators, 45% have at least a
single cultivator. The average ownership of cultivators is 0.5 with a standard deviation of 0.63.
The large percentage of the farmers with no cultivators has implications on crops grown,
decision making and use of resources such as fertilizers.
Table 10: Equipment and Machinery Ownership
Equipment/Machi
nery
Fertilizer Marketing Channel (FMC), % of total households; n = 100
Commercial Public Both Commercial and
Public
Total
Plough 0 3 16 1 20
1 20 13 33 66
2 4 2 8 14
Cultivator 0 20 30 5 55
1 8 4 30 42
2 0 0 1 1
3 0 0 2 2
Ox-drawn
carts
0 10 25 5 40
1 17 10 30 57
2 1 0 2 3
Planter 0 30 50 13 93
1 3 0 2 5
2 0 0 1 1
3 0 0 1 1
Vehicles 0 20 44 20 84
1 3 3 5 11
2 0 0 3 3
3 0 1 1 2
Source: Survey data, 2010
Equipment and machinery ownership is related to the channel of fertilizer acquisition used by a
household. This interpretation follows the idea that the ownership of a specific asset informs a

71
household to use a certain fertilizer acquisition channel. To acquire fertilizers, farmers use the
commercial channel, the public channel or both the commercial and the public as complimenting
supply systems. It has been noted, of those households which do not own a plough, a cultivator,
an ox-drawn cart, a planter or a vehicle, a larger percentage constitutes those using the public
channel as their source of fertilizer inputs. As the asset ownership improves, use of both the
commercial and public fertilizer marketing systems as augmenting instruments improves also.
4.6. Land Cultivation
4.6.1. Land-holding
With the small-scale A1 resettled farming community in Bindura District, the location of fields is
of considerable importance as it has implications on accessibility and security of crops from
thieves and stray animals. The farmers sampled had field plots ranging from 1 to 5 with an
average figure of 3 plots per farmer. 94% of the farmers have their homesteads situated closer to
their field plots. The majority strategically located in full view for security reasons. In Bindura
District, agricultural production forms the main economic activity followed by mining. The
survey recorded the sizes of the arable area including the plots under furrow that had been and
would be cropped in future basing on farmers’ estimates of the area. The area was noted in
hectares since this is a common unit of measuring farmland. The average arable landholding for
a household in the district is 2.52 hectares (6.23 acres) with a standard deviation of 1.31hectares
(3.24 acres). The minimum landholding size is 0.5hectares (1.24 acres) while the maximum is 7
hectares (17.3 acres).
The distribution of farmland with a positive coefficient of skeweness (1.00) shows that there are
some farmers who are even further away from the mean of 2.52 hectares and hence stand a
chance of planting more land given resources in the right quantity and time. On average men
own more arable land than women. On renting of land, 86% of the households do not rent in land
and of those who do rent land, the average area rented is 1 hectare (2.471 acres). The community
has since stopped charging cash for rented land, but instead, they charge inputs like fertilizer.
Most farmers surveyed indicated that they are paying a 50kg bag of fertilizer for a hectare rented.
Most farmers indicated their need to rent out land although very few are willing to take up the
offers, may be because of the payment method.
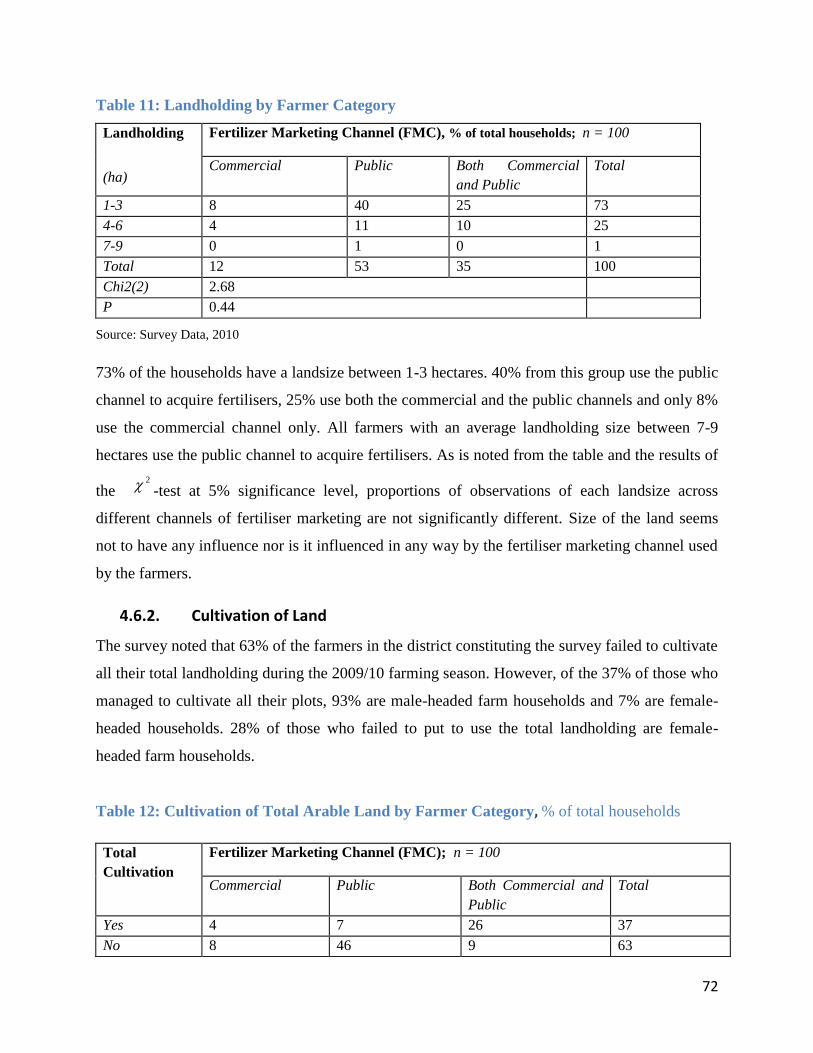
72
Table 11: Landholding by Farmer Category
Landholding
(ha)
Fertilizer Marketing Channel (FMC), % of total households; n = 100
Commercial Public Both Commercial
and Public
Total
1-3 8 40 25 73
4-6 4 11 10 25
7-9 0 1 0 1
Total 12 53 35 100
Chi2(2) 2.68
P 0.44
Source: Survey Data, 2010
73% of the households have a landsize between 1-3 hectares. 40% from this group use the public
channel to acquire fertilisers, 25% use both the commercial and the public channels and only 8%
use the commercial channel only. All farmers with an average landholding size between 7-9
hectares use the public channel to acquire fertilisers. As is noted from the table and the results of
the 2 -test at 5% significance level, proportions of observations of each landsize across
different channels of fertiliser marketing are not significantly different. Size of the land seems
not to have any influence nor is it influenced in any way by the fertiliser marketing channel used
by the farmers.
4.6.2. Cultivation of Land
The survey noted that 63% of the farmers in the district constituting the survey failed to cultivate
all their total landholding during the 2009/10 farming season. However, of the 37% of those who
managed to cultivate all their plots, 93% are male-headed farm households and 7% are female-
headed households. 28% of those who failed to put to use the total landholding are female-
headed farm households.
Table 12: Cultivation of Total Arable Land by Farmer Category, % of total households
Total
Cultivation
Fertilizer Marketing Channel (FMC); n = 100
Commercial Public Both Commercial and
Public
Total
Yes 4 7 26 37
No 8 46 9 63
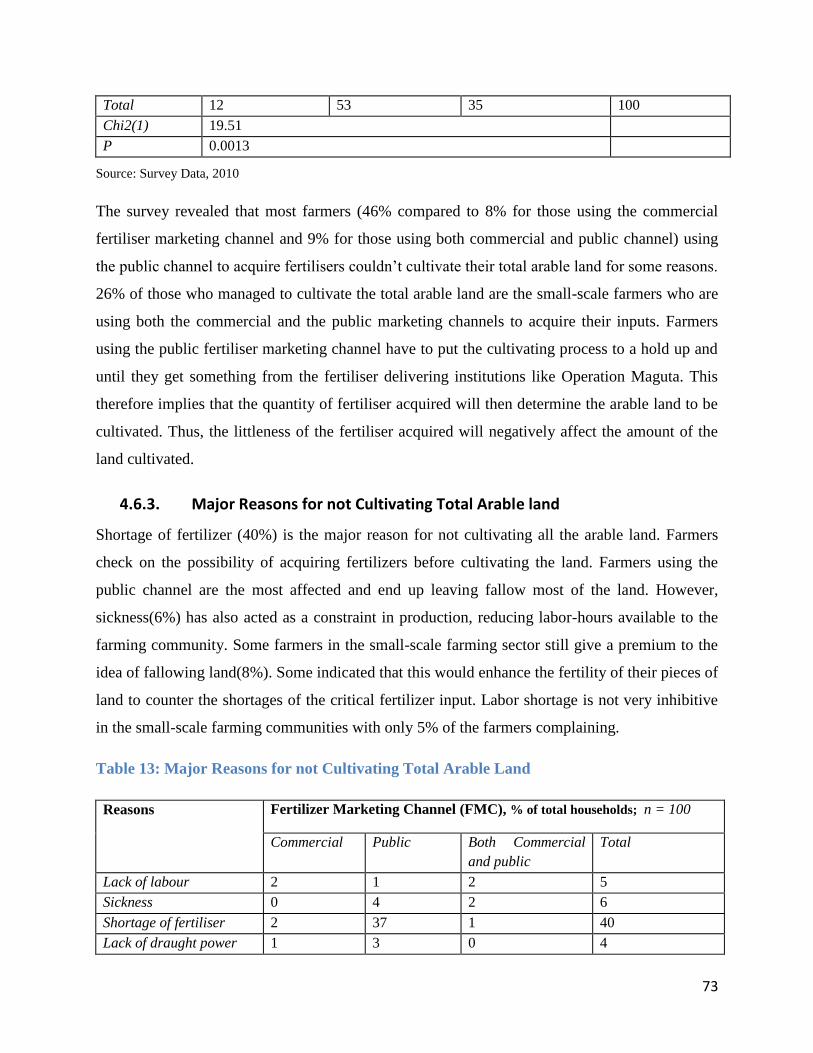
73
Total 12 53 35 100
Chi2(1) 19.51
P 0.0013
Source: Survey Data, 2010
The survey revealed that most farmers (46% compared to 8% for those using the commercial
fertiliser marketing channel and 9% for those using both commercial and public channel) using
the public channel to acquire fertilisers couldn’t cultivate their total arable land for some reasons.
26% of those who managed to cultivate the total arable land are the small-scale farmers who are
using both the commercial and the public marketing channels to acquire their inputs. Farmers
using the public fertiliser marketing channel have to put the cultivating process to a hold up and
until they get something from the fertiliser delivering institutions like Operation Maguta. This
therefore implies that the quantity of fertiliser acquired will then determine the arable land to be
cultivated. Thus, the littleness of the fertiliser acquired will negatively affect the amount of the
land cultivated.
4.6.3. Major Reasons for not Cultivating Total Arable land
Shortage of fertilizer (40%) is the major reason for not cultivating all the arable land. Farmers
check on the possibility of acquiring fertilizers before cultivating the land. Farmers using the
public channel are the most affected and end up leaving fallow most of the land. However,
sickness(6%) has also acted as a constraint in production, reducing labor-hours available to the
farming community. Some farmers in the small-scale farming sector still give a premium to the
idea of fallowing land(8%). Some indicated that this would enhance the fertility of their pieces of
land to counter the shortages of the critical fertilizer input. Labor shortage is not very inhibitive
in the small-scale farming communities with only 5% of the farmers complaining.
Table 13: Major Reasons for not Cultivating Total Arable Land
Reasons Fertilizer Marketing Channel (FMC), % of total households; n = 100
Commercial Public Both Commercial
and public
Total
Lack of labour 2 1 2 5
Sickness 0 4 2 6
Shortage of fertiliser 2 37 1 40
Lack of draught power 1 3 0 4
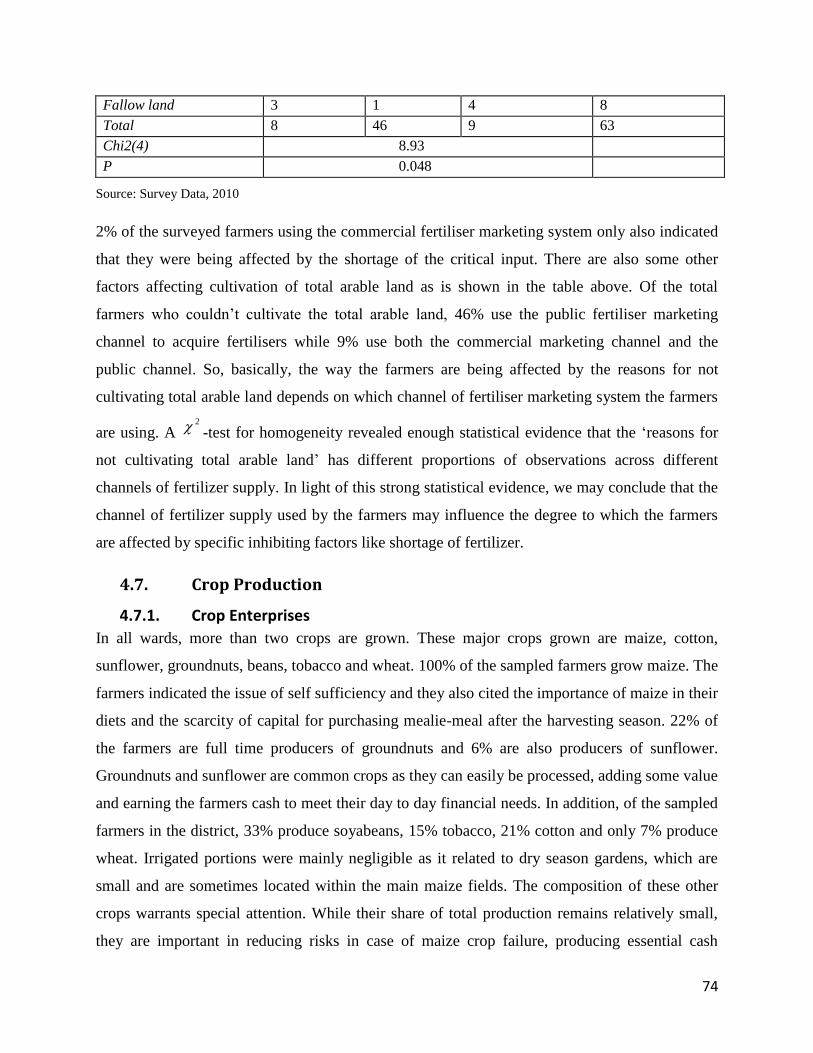
74
Fallow land 3 1 4 8
Total 8 46 9 63
Chi2(4) 8.93
P 0.048
Source: Survey Data, 2010
2% of the surveyed farmers using the commercial fertiliser marketing system only also indicated
that they were being affected by the shortage of the critical input. There are also some other
factors affecting cultivation of total arable land as is shown in the table above. Of the total
farmers who couldn’t cultivate the total arable land, 46% use the public fertiliser marketing
channel to acquire fertilisers while 9% use both the commercial marketing channel and the
public channel. So, basically, the way the farmers are being affected by the reasons for not
cultivating total arable land depends on which channel of fertiliser marketing system the farmers
are using. A 2 -test for homogeneity revealed enough statistical evidence that the ‘reasons for
not cultivating total arable land’ has different proportions of observations across different
channels of fertilizer supply. In light of this strong statistical evidence, we may conclude that the
channel of fertilizer supply used by the farmers may influence the degree to which the farmers
are affected by specific inhibiting factors like shortage of fertilizer.
4.7. Crop Production
4.7.1. Crop Enterprises
In all wards, more than two crops are grown. These major crops grown are maize, cotton,
sunflower, groundnuts, beans, tobacco and wheat. 100% of the sampled farmers grow maize. The
farmers indicated the issue of self sufficiency and they also cited the importance of maize in their
diets and the scarcity of capital for purchasing mealie-meal after the harvesting season. 22% of
the farmers are full time producers of groundnuts and 6% are also producers of sunflower.
Groundnuts and sunflower are common crops as they can easily be processed, adding some value
and earning the farmers cash to meet their day to day financial needs. In addition, of the sampled
farmers in the district, 33% produce soyabeans, 15% tobacco, 21% cotton and only 7% produce
wheat. Irrigated portions were mainly negligible as it related to dry season gardens, which are
small and are sometimes located within the main maize fields. The composition of these other
crops warrants special attention. While their share of total production remains relatively small,
they are important in reducing risks in case of maize crop failure, producing essential cash

75
requirements for the families.
Table 14: Crop Enterprise by farmer Category, % of total households
Crop Enterprise Fertilizer Marketing Channel (FMC); n = 100
Commercial Public Both Commercial
and Public
Total
Maize 20 53 27 100
Groundnuts 13 0 9 22
Sunflower 3 0 3 6
Soyabeans 9 14 10 33
Cotton 4
12 5 21
Tobacco 2 10 3 15
Wheat 1 5 1 7
Source: Survey Data, 2010
State-sponsored input schemes normally come in packages defined for specific crops. The major
crops financed through these programs include maize, wheat, soyabeans, cotton and tobacco. It is
on rare occasions when the government sponsored input schemes would be funding the
production of groundnuts and sunflower. The survey has revealed that for maize, soyabeans,
cotton and wheat, most farmers growing these crops use the public fertiliser marketing channel
to acquire their fertilisers while for groundnuts and sunflower most farmers use the commercial
marketing channel to acquire their fertilisers. Therefore, depending on which crop the farmer
intends to grow, a suitable fertiliser marketing channel will be selected and used. This survey
therefore reveals that there is an association between the channel of fertiliser flow used and the
crop to be grown by the farming community.
4.7.2. Access to inputs
Farming systems in small-scale farms are complex, diverse and risk prone. They are dynamic
systems with changing levels of resources and biophysical environments subject to major
seasonal and inter-seasonal variation in rainfall. In addition to this, farmers’ access to inputs such
as fertilizer, chemicals and improved seeds is constrained by market and policy factors. In the
study area, besides the land and draught power, major farm inputs include organic and inorganic
fertilizer, improved seeds, herbicides, and labor. Manure is not normally bought, but only those
with livestock mostly use it. Small-scale farmers in the district indicated that sourcing fertilizer is
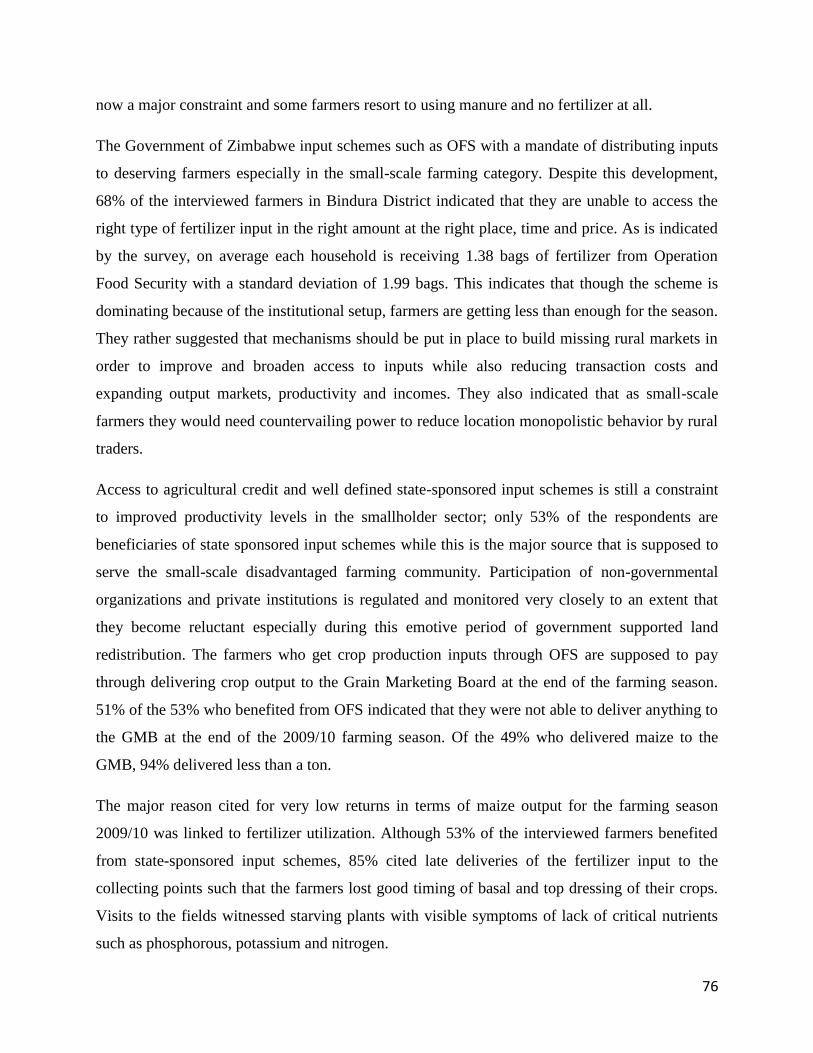
76
now a major constraint and some farmers resort to using manure and no fertilizer at all.
The Government of Zimbabwe input schemes such as OFS with a mandate of distributing inputs
to deserving farmers especially in the small-scale farming category. Despite this development,
68% of the interviewed farmers in Bindura District indicated that they are unable to access the
right type of fertilizer input in the right amount at the right place, time and price. As is indicated
by the survey, on average each household is receiving 1.38 bags of fertilizer from Operation
Food Security with a standard deviation of 1.99 bags. This indicates that though the scheme is
dominating because of the institutional setup, farmers are getting less than enough for the season.
They rather suggested that mechanisms should be put in place to build missing rural markets in
order to improve and broaden access to inputs while also reducing transaction costs and
expanding output markets, productivity and incomes. They also indicated that as small-scale
farmers they would need countervailing power to reduce location monopolistic behavior by rural
traders.
Access to agricultural credit and well defined state-sponsored input schemes is still a constraint
to improved productivity levels in the smallholder sector; only 53% of the respondents are
beneficiaries of state sponsored input schemes while this is the major source that is supposed to
serve the small-scale disadvantaged farming community. Participation of non-governmental
organizations and private institutions is regulated and monitored very closely to an extent that
they become reluctant especially during this emotive period of government supported land
redistribution. The farmers who get crop production inputs through OFS are supposed to pay
through delivering crop output to the Grain Marketing Board at the end of the farming season.
51% of the 53% who benefited from OFS indicated that they were not able to deliver anything to
the GMB at the end of the 2009/10 farming season. Of the 49% who delivered maize to the
GMB, 94% delivered less than a ton.
The major reason cited for very low returns in terms of maize output for the farming season
2009/10 was linked to fertilizer utilization. Although 53% of the interviewed farmers benefited
from state-sponsored input schemes, 85% cited late deliveries of the fertilizer input to the
collecting points such that the farmers lost good timing of basal and top dressing of their crops.
Visits to the fields witnessed starving plants with visible symptoms of lack of critical nutrients
such as phosphorous, potassium and nitrogen.
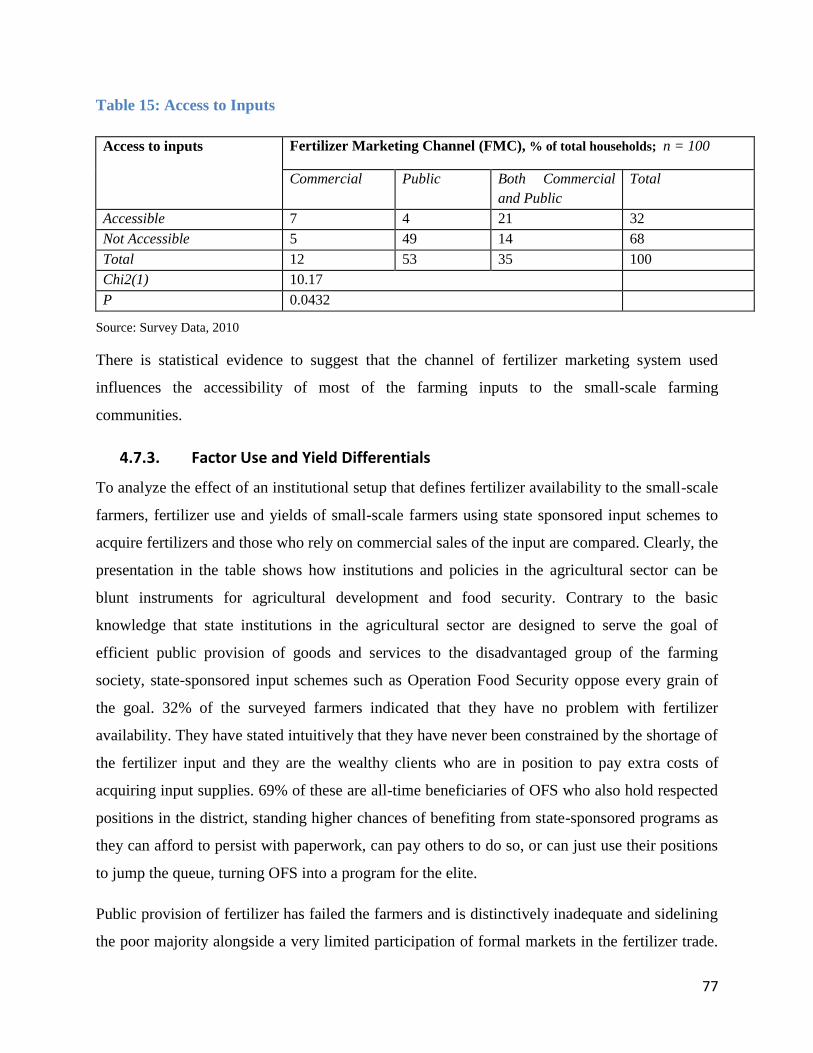
77
Table 15: Access to Inputs
Access to inputs Fertilizer Marketing Channel (FMC), % of total households; n = 100
Commercial Public Both Commercial
and Public
Total
Accessible 7 4 21 32
Not Accessible 5 49 14 68
Total 12 53 35 100
Chi2(1) 10.17
P 0.0432
Source: Survey Data, 2010
There is statistical evidence to suggest that the channel of fertilizer marketing system used
influences the accessibility of most of the farming inputs to the small-scale farming
communities.
4.7.3. Factor Use and Yield Differentials
To analyze the effect of an institutional setup that defines fertilizer availability to the small-scale
farmers, fertilizer use and yields of small-scale farmers using state sponsored input schemes to
acquire fertilizers and those who rely on commercial sales of the input are compared. Clearly, the
presentation in the table shows how institutions and policies in the agricultural sector can be
blunt instruments for agricultural development and food security. Contrary to the basic
knowledge that state institutions in the agricultural sector are designed to serve the goal of
efficient public provision of goods and services to the disadvantaged group of the farming
society, state-sponsored input schemes such as Operation Food Security oppose every grain of
the goal. 32% of the surveyed farmers indicated that they have no problem with fertilizer
availability. They have stated intuitively that they have never been constrained by the shortage of
the fertilizer input and they are the wealthy clients who are in position to pay extra costs of
acquiring input supplies. 69% of these are all-time beneficiaries of OFS who also hold respected
positions in the district, standing higher chances of benefiting from state-sponsored programs as
they can afford to persist with paperwork, can pay others to do so, or can just use their positions
to jump the queue, turning OFS into a program for the elite.
Public provision of fertilizer has failed the farmers and is distinctively inadequate and sidelining
the poor majority alongside a very limited participation of formal markets in the fertilizer trade.

78
Most of the small-scale farmers are now living from hand to mouth without adequate harvests to
take them through. An average maize yield of 0.657 tons per hectare is very discouraging and
threatening. This means that the fertilizer input support schemes are not sustainable and are
failing the struggling farmers. The small-scale farmers average top dressing application rate is
86.11 kg/ha, 63.89kg short of the recommended rate of at least 150kg per hectare. This is so
mainly because of the average for those farmers acquiring fertilizers through the public channel
with an average application rate of 53.85kg/ha, which is well below the total average. The survey
has revealed that the most affected farmers are those who are fully using the public fertilizer
marketing system to acquire their fertilizers as is indicated by their average application rates
which are lower than those for the small-scale farmers using the commercial fertilizer marketing
system.
It is noticed that the application of manure has no link with the fertilizer marketing system used
by the farmers as this is a dependent of the number of cattle owned by the farmers. The mean
fertilizer use and the production level of maize indicate that there is an association between the
two variables. This is not in contradiction with a priory expectation as one would have
anticipated that the fertilizer marketing system used determines the average fertilizer application
rate which will then influence the average crop yield.
Table 16: Mean Input Use and Production Levels of Maize by Farmer Category
Factor use and yield
differential
Fertilizer Marketing Channel (FMC), % of total households; n = 100
Commercial Public Both Commercial
and Public
Total
Ha 1.07 0.97 1.35 1.13
Top dressing (kg/ha) 89.17 53.85 115.32 86.11
Basal fertiliser (kg/ha) 112.62 79.55 136.19 109.45
Manure (tons/ha) 0.85 0.84 0.81 0.83
Yield (tons/ha) 0.681 0.313 0.976 0.657
Source: Survey Data, 2010
4.7.4. Mean Production Levels and Area under Other Crops
Although farmers cannot afford to achieve the expected yield levels for different crop
enterprises, yields of small-scale farmers using the commercial fertiliser marketing system is
significantly higher than that for farmers relying on handouts from state institutions. Hectarage

79
and yield levels for groundnuts, cotton and tobacco are higher for those farmers relying on the
commercial marketing of the fertiliser input. Those farmers depending on handouts are being
negatively affected by the system and thus lower yields and area under specific crops. Only
sunflower has shown differing results with farmers using the public fertiliser marketing system
having higher hectarage and yield levels than those using the commercial marketing system.
Table 17: Mean Production Levels and Area under Other Crops per Farmer Category
Crop Fertilizer Marketing Channel (FMC); n = 100
Commercial Public Both Commercial
and Public
Total
Groundnuts Ha 0.38 0.31 0.41 0.37
Yield 0.41 0.37 0.40 0.39
Cotton Ha 0.09 0.04 0.21 0.11
Yield 0.16 0.06 0.30 0.17
Tobacco Ha 0.20 0.19 0.20 0.20
Yield 0.851 0.270 0.973 0.698
Sunflower Ha 0.05 0.10 0.04 0.06
Yield 0.09 0.19 0.35 0.21
Source: Survey Data, 2010
4.8. Constraints Limiting Agricultural Production
Farmers were interviewed about the limitations and challenges they are facing in their day-to-day
agricultural activities. Percentages were recorded of farmers raising an aspect as a limiting
factor. Major factors affecting small-scale farmers across the fertilizer marketing systems are;
very expensive inputs/high transaction costs (28%), shortage of inputs (25%), delays in input
supply (25%), poor access to markets (13%), unfair distribution of inputs (4%), unavailability of
credit (2%), shortage of tillage facility (1%), labour constraint (1%) and poor output prices (1%)
in that order. The extent to which the limitations affect the small-scale farmers varies with the
fertiliser marketing system used by respective farmers. The farm-gate price of the inputs such as
fertilisers has been indicated to be the most limiting factor affecting crop production by all the
farming communities. With regard to fertiliser marketing system used, those using the
commercial fertiliser marketing system indicated that input price, input availability, timeliness of
input supplies, and accessibility to markets are the major constraints limiting production in that
order. Those using the public fertiliser marketing system indicated that timeliness of input
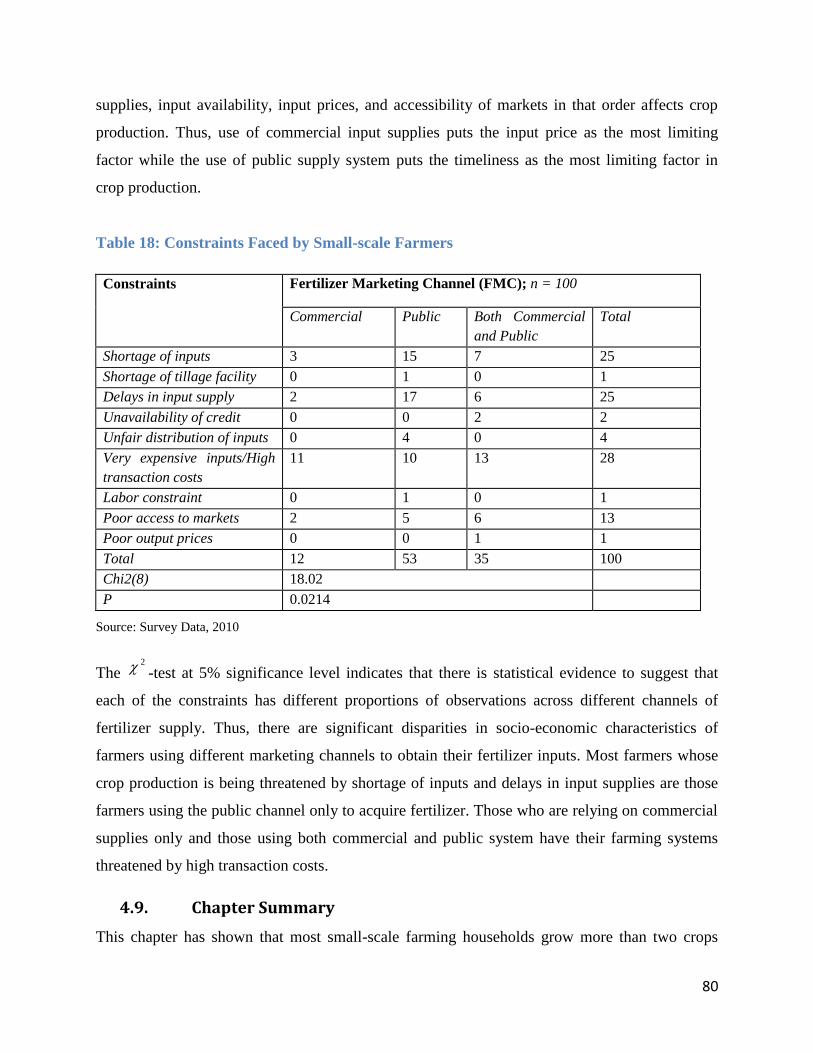
80
supplies, input availability, input prices, and accessibility of markets in that order affects crop
production. Thus, use of commercial input supplies puts the input price as the most limiting
factor while the use of public supply system puts the timeliness as the most limiting factor in
crop production.
Table 18: Constraints Faced by Small-scale Farmers
Constraints Fertilizer Marketing Channel (FMC); n = 100
Commercial Public Both Commercial
and Public
Total
Shortage of inputs 3 15 7 25
Shortage of tillage facility 0 1 0 1
Delays in input supply 2 17 6 25
Unavailability of credit 0 0 2 2
Unfair distribution of inputs 0 4 0 4
Very expensive inputs/High
transaction costs
11 10 13 28
Labor constraint 0 1 0 1
Poor access to markets 2 5 6 13
Poor output prices 0 0 1 1
Total 12 53 35 100
Chi2(8) 18.02
P 0.0214
Source: Survey Data, 2010
The 2 -test at 5% significance level indicates that there is statistical evidence to suggest that
each of the constraints has different proportions of observations across different channels of
fertilizer supply. Thus, there are significant disparities in socio-economic characteristics of
farmers using different marketing channels to obtain their fertilizer inputs. Most farmers whose
crop production is being threatened by shortage of inputs and delays in input supplies are those
farmers using the public channel only to acquire fertilizer. Those who are relying on commercial
supplies only and those using both commercial and public system have their farming systems
threatened by high transaction costs.
4.9. Chapter Summary
This chapter has shown that most small-scale farming households grow more than two crops
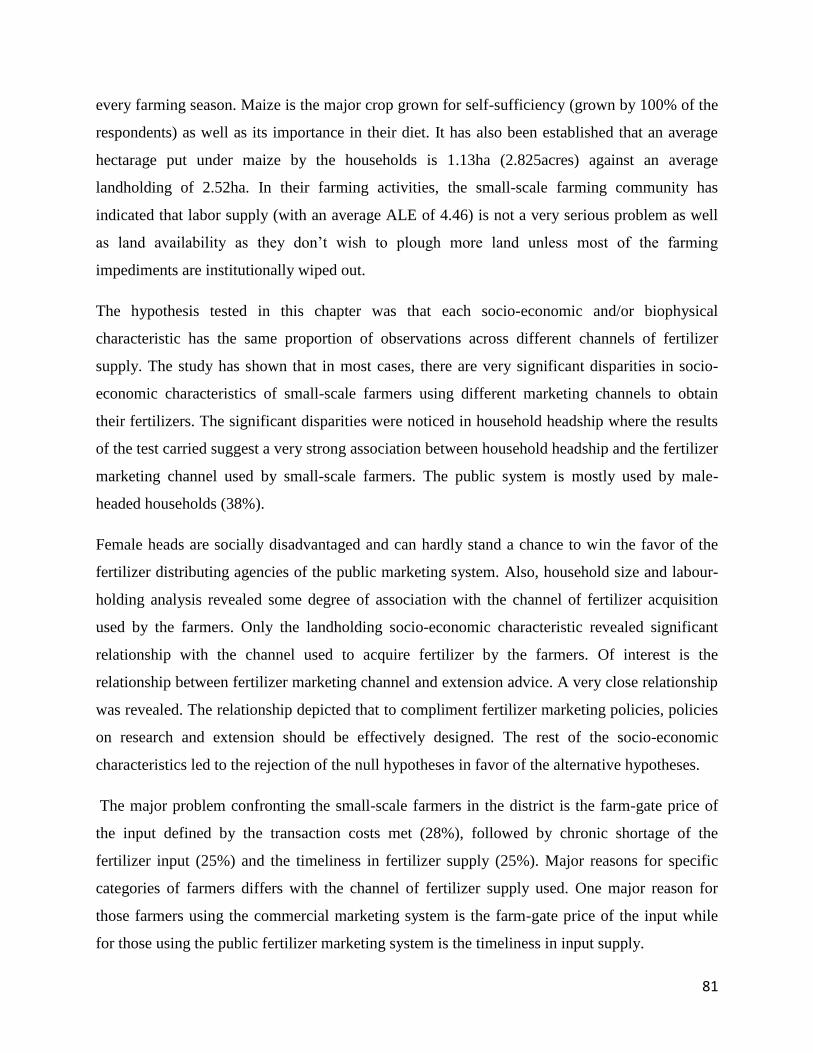
81
every farming season. Maize is the major crop grown for self-sufficiency (grown by 100% of the
respondents) as well as its importance in their diet. It has also been established that an average
hectarage put under maize by the households is 1.13ha (2.825acres) against an average
landholding of 2.52ha. In their farming activities, the small-scale farming community has
indicated that labor supply (with an average ALE of 4.46) is not a very serious problem as well
as land availability as they don’t wish to plough more land unless most of the farming
impediments are institutionally wiped out.
The hypothesis tested in this chapter was that each socio-economic and/or biophysical
characteristic has the same proportion of observations across different channels of fertilizer
supply. The study has shown that in most cases, there are very significant disparities in socio-
economic characteristics of small-scale farmers using different marketing channels to obtain
their fertilizers. The significant disparities were noticed in household headship where the results
of the test carried suggest a very strong association between household headship and the fertilizer
marketing channel used by small-scale farmers. The public system is mostly used by male-
headed households (38%).
Female heads are socially disadvantaged and can hardly stand a chance to win the favor of the
fertilizer distributing agencies of the public marketing system. Also, household size and labour-
holding analysis revealed some degree of association with the channel of fertilizer acquisition
used by the farmers. Only the landholding socio-economic characteristic revealed significant
relationship with the channel used to acquire fertilizer by the farmers. Of interest is the
relationship between fertilizer marketing channel and extension advice. A very close relationship
was revealed. The relationship depicted that to compliment fertilizer marketing policies, policies
on research and extension should be effectively designed. The rest of the socio-economic
characteristics led to the rejection of the null hypotheses in favor of the alternative hypotheses.
The major problem confronting the small-scale farmers in the district is the farm-gate price of
the input defined by the transaction costs met (28%), followed by chronic shortage of the
fertilizer input (25%) and the timeliness in fertilizer supply (25%). Major reasons for specific
categories of farmers differs with the channel of fertilizer supply used. One major reason for
those farmers using the commercial marketing system is the farm-gate price of the input while
for those using the public fertilizer marketing system is the timeliness in input supply.
82
About 28% of the households have indicated that the unavailability of the input have
subsequently raised the price beyond their reach and can hardly afford to buy even a single bag.
They raised their concern asking the responsible authorities to come in with proper institutions
and policies to cushion them. The most affected are the de jure female headed households (11%)
who are always looking up for remittances from children and relatives. 17% constitute female
headed households with the de facto group better off in that they are supplied with inputs by
husbands working in urban areas or towns. The issue presented above tells it that if state-
sponsored input schemes are to be designed, it has to be taken into serious consideration that a
certain proportion of the households in the small-scale setup are female-headed. They should be
rather targeted and ready to capture the disadvantaged group of the rural society unlike the
current setup, which is serving the elite.
This chapter has also established that besides being disadvantaged, the small-scale community
does not give a premium to the idea of subscribing to local agricultural associations (54%)
traditionally known to help the very community. Some of these privately run associations known
to help the farming community are ZFU, AFRICARE, DAPP, ICTU, and SOS. Those farmers,
who indicated that they subscribe or hold a membership to any of these associations, benefit
from the services provided. Services provided include among many, extension services,
purchasing of inputs at lower prices, acquisition of inputs, and recommendation for access to
inputs and provision of social services such as HIV awareness, counseling, and provision of food
and clothing materials during times of crisis. These private associations or self-help groups have
been indicated to be very helpful in other countries. In Kenya at one time, the only available
sources of credit were found in the informal sector, in particular self-help groups referred to as
‘Nyoluoro’, which are referred to in the literature as Rotating Savings and Credit Associations
(ROSCAs). These groups have impressively struggled to bridge financial shortfalls for a number
of farmers, and are known to have existed as early as 1980 (Kenya, 1986). In Malawi, similar
groups have been found to mobilize savings and substantially invest in farming, with fertilizer
accounting for 64.9%. Other similar groups have been reported in west African countries such as
the ‘susu’ of Ghana (Aryeetey, 1992), ‘tontines’ of Cameroon and ‘esusu’ of Nigeria (Bouman,
1994). Similar groups have also been found to be operational in Ethopia known as ‘iddir’, South
Africa known as ‘stokvel’, Tanzania, Zambia and Zaire (Slover, 1992). Besides these few
studies, the associations’ contribution to the development of the small-scale sector is not clearly

83
understood by policymakers. The private supply of agricultural inputs is in a way still a ‘black
box’ in many countries.
Politicians and policymakers are fretted about private supply of agricultural inputs such as
fertilizer, they preach against it, trying to regulate it or creating programs (such as OFS) targeted
to or substituting for it and these concerns have a negative effect on agricultural development of
the poor small-scale community. The tests conducted explained the reason why in crafting
fertilizer distribution policies, a number of socio-economic characteristics of the farmers should
be considered as these directly or indirectly determine or are determined by the fertilizer
marketing systems in place.

84
CHAPTER FIVE
ECONOMETRIC ANALYSIS OF FACTORS AFFECTING LIKELIHOOD AND
INTENSITY OF FERTILIZER UTILISATION
5.1. Introduction
This chapter serves to establish factors affecting the likelihood and intensity of fertilizer
utilization by small-scale farmers. An effective fertilizer marketing environment is influenced by
different processes such as those that determine the agronomic potential of fertilizer utilization,
those that convert the potential into effective demand for the input, those that determine the
growth of aggregate fertilizer supply, and those that develop the fertilizer distribution system. It
is the establishment of these characteristics which will shape the expected recommendations for
a strategic national fertilizer marketing system.
5.2. Effectiveness of a fertilizer marketing system
It is noted in this study that fertilizer input subsidization per se is unlikely to have a marked
effect on fertilizer use unless preceded or accompanied by a variety of structural reforms to
remove the various constraints facing the small-scale farming communities. Thus, the strategy of
only getting prices right through input subsidization is not enough to promote fertilizer use. The
response may be sluggish not only because of price distortions but also because of structural
constraints such as access to the fertilizer input, efficiency of the delivery systems, transaction
costs, landholding size, household socioeconomic and biophysical characteristics, presence of
rural institutions specialized in providing unsecured loans, road infrastructure, expected rainfall
conditions, returns to investments, opportunity cost of fertilized crop production, producer
welfare effect among many. The aspects have different magnitudes in the way they influence
fertilizer use. It is hypothesized in this study that an institutional and policy setup that is ignorant
of these factors will not yield the best results in promoting fertilizer use by the small-scale
community. Rather, an effective fertilizer marketing policy and institutional reform should be
economically justified, technically sound, socially acceptable, financially sound, and should
enhance timely and sustainable use of fertilizer by small-scale farmers.

85
5.3. Fertilizer utilization by small-scale farmers
This study employs a probit model to examine the determinants of small-scale farmers’ decision
to use or not fertilizers. The probit model is adequate for analyzing adoption decisions that occur
over a discrete range such as yes or not. The case of adoption choices that have a continuous
value range that is truncated from below is analyzed using a tobit model. This is the typical case
for fertilizer utilization decisions where some small-scale farmers apply positive levels of
fertilizer while others have zero applications (non- users). Intensity of use is a very important
aspect of fertilizer utilization because it is not only the choice to use but also how much to apply
that often matters. The tobit model of Tobin (1958) is used to handle truncated distribution
dependent choice variables.
5.3.1. Probit model of adoption of fertilizer
It is noted in this study that not all factors are equally important in different areas and for small-
scale farmers with different socio-economic characteristics. The above explanatory variables
were used to estimate the probit model of fertilizer adoption as is specified below;
(13)
The model explains about 56.7% of the variation in the dependent variable. Table below shows
the probit model results for the factors affecting fertilizer adoption by the small-scale farmers as
is indicated by the study.
Table 19: Results of Probit Model of Adoption of Fertiliser (where AF takes the value of
one for adopters or zero otherwise)
AF Coef. Std err P-value Marginal Effect
AGE -0.0014** 0.0147 0.019 -0.0006
LAND -0.3958 0.1310 0.763 -0.0157
LITERACY~ -0.4668 0.3506 0.183 -0.1815
HSIZE -0.1060** 0.0748 0.015 -0.0419
ONNY~ 0.5622 0.3712 0.130 0.2155

86
OFFY~ 0.4208 0.3348 0.209 0.1653
TRANS~ -2.2728* 0.3735 0.005 -0.7328
ACCESS -0.734** 0.0307 0.017 -0.0291
FTCHANNEL 2.3581** 0.0255 0.038 0.6894
RAIN~ 0.1753 0.3484 0.615 0.0695
RETURNS 0.3564** 0.2461 0.048 0.3681
EQUIPMENT 0.0189 0.3594 0.647 0.0032
TENURE 1.6834* 0.0679 0.002 0.5164
LABOUR -0.734** 0.0307 0.017 -0.0291
ROAD 0.0011 0.0058 0.835 0.0007
LOANS 0.9522 0.4002 0.104 0.6154
DELIVERY 1.6942* 0.2153 0.004 0.2861
β0 1.5006 1.0117 0.008
Source: Survey data, 2010
(~) marginal effect is for discrete change of dummy variable from 0 to 1
Log Likelihood = -40.332201
Chi-squared = 57.80
*significant at 1% **significant at 5%
Some of the explanatory variables specified for the probit model reported in the table above had
the expected sign but some otherwise. Age of the household head with a negative coefficient of -
0.0014 and a p-value of 0.019 has shown that it is negatively and significantly related to fertilizer
adoption. The variable is significant at 5% significance level. Results show that the probability of
adoption decreases by 0.06% for every year of age as is indicated by the marginal effect value of
0.0006. This is explained possibly by the idea that with age farmers become more conservative
and less acceptable of new ideas although this can be questioned by some studies which revealed
that with age, farmers gain more experience and acquaintance with technologies such as fertilizer
use and thus, are expected to have higher ability to use fertilizer more efficiently and optimally.
One study (Hassan. R.M, 1998) found age to be an important determinant of fertilizer usage. The
study by Hassan revealed that the age variable has positive and significant effects to fertilizer
usage.
Considering the land variable, the coefficient of -0.3958 shows that the variable is negatively

87
related to fertilizer utilization within the small-scale farming communities. Though the variable
is insignificant at both 1% and 5% significance levels, the negative relationship may be used to
explain the idea that as the size of the land expands; small-scale farmers tend to opt for extensive
farming practices. In theory, small-scale farmers build with time their main objective of
venturing into farming which is maximization of output. It is noted, there is a difference between
yield and output. In this case, small-scale farmers would just aim to harvest say 3 tons of maize,
5 bales of cotton, 10 bales of tobacco, e.t.c. and this can simply be achieved by expanding area
under cultivation and not necessarily by practicing intensive crop production or specifically
feeding the soil the right nutrients in their correct quantities. As the size of the land shrinks,
farmers are naturally forced to practice intensive crop production so as to be able to harvest the
minimum expected output to feed the family.
A priori expectation was that literacy is positively and significantly related to fertilizer use. The
expectation was that the literate farmer should be more conversant with the necessary
information that links some very critical technologies such as ‘fertilizer’ and its use with
agricultural output. In this study, the literacy variable is negative and insignificantly related to
fertilizer adoption. The negative coefficient reveals that literacy reduces the probability of a
farmer adopting a fertilizer technology. Results show that the probability of fertilizer adoption
decreases by 18.15% for a discrete change from being illiterate to being literate as is indicated by
the marginal effect value of 0.1815.
From the study, family size (HSIZE) has shown to be a disincentive for fertilizer adoption in
maize production. This may be true for very poor small-scale households since the financial
resources are used for other family commitments with little left for the purchase of fertilizer. A
unit increase in family size reflects a 4.2% higher probability of less adoption. Family size and
labor variables have a negative and significant effect on fertilizer use at 5% significance level. A
farmer with sufficient labor has his probability of adopting fertilizer technology reduced by 2.9%
more than a farmer without sufficient labor. This is explained by the idea that with more labor
small-scale farmers prefer using different soil ameliorates such as plant litter, compost or anthill
material. The belief is that these give the nutrients with the same quality as the inorganic
fertilizers.
88
On-farm income (ONNY) and off-farm income (OFFY) have positive coefficients. However,
these are statistically insignificant which may imply that their presence in the model is only
necessary to explain model fitness and not the possibility of the farmer adopting the fertilizer
technology. Although the on-farm income and off-farm income variables are insignificant, the
result suggest weak and yet positive effects on fertilizer utilization. Further suggestions are that
the variables may have indirect effects which are perhaps more stronger and this might be
through the positive feedback effect
Small-scale farmers’ perception on the level of transaction costs (TRANS) has shown that it is an
important factor affecting fertilizer use. This means that any institutional or policy setup that
forces small-scale farmers to believe that transaction costs are likely going to increase will
reduce fertilizer adoption by small-scale farmers by a margin of 2.27%. The marginal effect
values of the Probit model shows the change in the probability of adoption of fertilizer for each
additional unit increase in independent variables. Farmers with a perception of high transaction
costs have a 73.3% higher probability of less adoption than farmers with a perception of low
transaction costs.
Fertilizer marketing systems have different magnitudes of transaction costs. It’s the definition of
a marketing system that paves way for a specific package of transaction costs. The small-scale
farmers perform their crop production within the realms of an environment, which constitutes the
physical and infrastructural factors, socio-economic aspects as well as the policy and institutional
aspects. The interactive impacts of these three categories of environmental factors condition and
reflect how the intentions of a fertilizer input supply system and attributes of the farmers and
other players along a supply chain combine to shape transaction costs and benefits. Policy and
institutional factors condition how physical, technical, and socio-economic factors are articulated
in given settings, thereby establishing links through which prevailing conditions influence
fertilizer acquisition and the level of transaction costs to be incurred.
This social provision of fertilizers to small-scale farmers has led to the problem of high
transaction costs through delivery failure, diversion of the input, and the failure by the mandated

89
institution to meet demand at the subsidized price. This causes formal and informal rationing of
the input, illegal marketing of the input at unofficial prices, reflecting supply failures. This has
subsequently resulted in high transaction costs and risks. When the institutional set up for
fertilizer distribution has a support for commercial marketing of the input, the market will be
acting as the coordinating device with all players rationally responding to market fundamentals.
This will provide space for frictionless co-existence of the free market system and the public
fertilizer input supply system. Farmers will have alternative channels through which they can
acquire their fertilizer input. They will have space for monitoring their transaction costs
structures and benefits. This stands a chance of improving crop production and reducing
transaction costs.
The Institutional Analysis and Development Framework is used to construct table 20 that
categorizes and analyses transaction costs associated with the two systems of fertilizer supply.
The table below depicts the transaction costs as well as some factors that induce the transaction
costs. In analyzing the transaction costs and benefits flowing to the small-scale farming
community, the cost determinants were listed so that statements of tendency can be derived.
Table 20: Transaction Costs and Risks
State-Sponsored Fertilizer Supply System The Commercial Marketing of
Fertilizer
Information costs and the cost of processing it. Information costs and the costs of
processing it
Side payments by small-scale farmers for approval at ward
level and be recognized as beneficiaries
Nil
Transport costs including continuous visits to different stations
such as AREX offices, OFS and the GMB
Once-off transport costs to and from
the market
The cost of informal rationing of the fertilizer input and illegal
marketing at unofficial price
Nil
The cost of cumbersome and unworkable bureaucratic
procedures for the release and delivery of the fertilizer input to
Nil
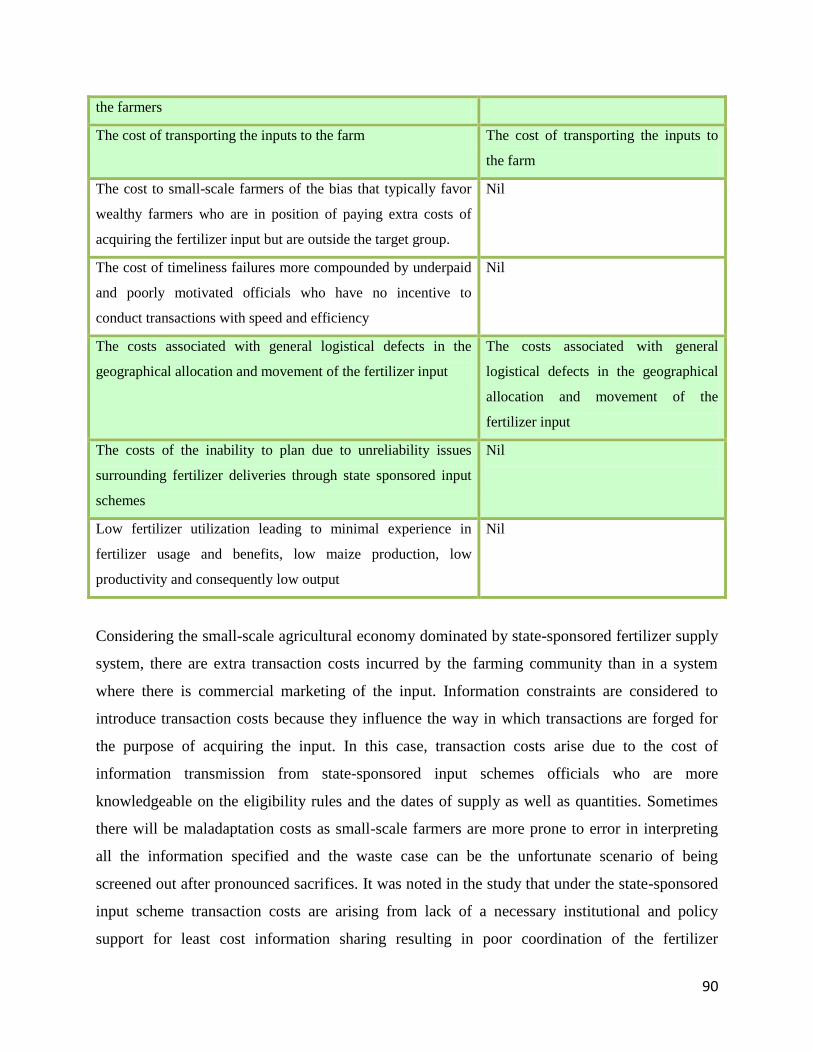
90
the farmers
The cost of transporting the inputs to the farm The cost of transporting the inputs to
the farm
The cost to small-scale farmers of the bias that typically favor
wealthy farmers who are in position of paying extra costs of
acquiring the fertilizer input but are outside the target group.
Nil
The cost of timeliness failures more compounded by underpaid
and poorly motivated officials who have no incentive to
conduct transactions with speed and efficiency
Nil
The costs associated with general logistical defects in the
geographical allocation and movement of the fertilizer input
The costs associated with general
logistical defects in the geographical
allocation and movement of the
fertilizer input
The costs of the inability to plan due to unreliability issues
surrounding fertilizer deliveries through state sponsored input
schemes
Nil
Low fertilizer utilization leading to minimal experience in
fertilizer usage and benefits, low maize production, low
productivity and consequently low output
Nil
Considering the small-scale agricultural economy dominated by state-sponsored fertilizer supply
system, there are extra transaction costs incurred by the farming community than in a system
where there is commercial marketing of the input. Information constraints are considered to
introduce transaction costs because they influence the way in which transactions are forged for
the purpose of acquiring the input. In this case, transaction costs arise due to the cost of
information transmission from state-sponsored input schemes officials who are more
knowledgeable on the eligibility rules and the dates of supply as well as quantities. Sometimes
there will be maladaptation costs as small-scale farmers are more prone to error in interpreting
all the information specified and the waste case can be the unfortunate scenario of being
screened out after pronounced sacrifices. It was noted in the study that under the state-sponsored
input scheme transaction costs are arising from lack of a necessary institutional and policy
support for least cost information sharing resulting in poor coordination of the fertilizer

91
marketing.
State-sponsored input schemes generally have conflicting objectives that result in operational
inefficiency and mismanagement as well as growing political intervention in operational issues
with the appointment of politicians on the Boards. These inefficiencies in delivering the required
service lead to a crisis in the organization of small-scale farmers. State-sponsored input schemes
such as OFS have failed to honor their statutory obligation of delivering the fertilizer input in the
right quantity, quality, and time and farmers are powerless to enforce the ‘statutory’ contract.
Some farmers could go up to February without having received the basal fertilizer and this
impact negatively on crop productivity. With deteriorating access to inputs small-scale farmers
productivity slumped and most farmers lost faith in the state-sponsored input schemes though
they are faced with an institutionally constricted alternative fertilizer marketing system. Though
there are some costs which are common in all systems, state-sponsored input schemes are
associated with a high transaction cost structure, high risks and fewer benefits to the small-scale
farming community. Access to fertilizer (ACCESS) describes the easy with which the farmer
acquires the input. Some farmers in the study area have revealed that they can easily access
fertilizer whilst some are facing difficulties in accessing the input. The accessibility of the input
is influenced by a number of factors including personality and employment issues. The ACCESS
variable has shown that it is also an important factor affecting fertilizer utilization. This means
that any institutional and policy set up that increases accessibility of the fertilizer input will also
increase its adoption by small-scale farmers by a margin of 0.73%. This is so since farmers with
an easy access to fertilizers have a 2.9% higher probability of more adoption than farmers with
limited access.
Results of the model show that there is high possibility of fertilizer adoption if the policy and
institutional environment supports commercial marketing of the input. A policy setup that
supports the institutionalization and well-functioning of the commercial marketing system of the
input will increase adoption by small-scale farmers by a margin of 2.36%. Farmers faced with
well functioning, institutionally supported and vibrant commercial markets of fertilizer have a
68.94% higher probability of more adoption than farmers exposed to a fertilizer marketing
system dominated by public handouts. Public handouts in theory and in practice crowd out the

92
well functioning of commercial trading of the inputs. Faced with such an environment, small-
scale farmers will resort to the use of common soil ameliorates at the expense of nutritional
quality of the given piece of land.
According to the theory of rational expectations, small-scale farmers effectively make use of the
information that is available to them to inform decisions. The model in the table above has
shown that the small-scale farmers’ expectations about the rainfall condition for a respective
production season influences adoption of the fertilizer technology. Small-scale farmers use
different skills and information sources ranging from socio-cultural to environmental beliefs to
inform them of the expected rainfall condition for a specific farming season. The process is
normally completed well before the onset of the season. This then informs the small-scale
farmers well in advance for planning purposes. A ‘good season’ state, being the most desired
condition increases fertilizer adoption by small-scale farmers by a margin of 0.18%. A
production period with well promising socio-cultural, scientific, and environmental determinants
for a good season characterized with effective rainfall have a 6.95% higher probability of more
fertilizer adoption than a pre-production period endowed with social, cultural, environmental and
scientific attributes promising a ‘bad season’ characterized with little or less effective rainfall
patterns. However, the variable of rainfall expectations was found to be insignificant at both 1%
and 5% significance levels.
When making an investment, the main objective for the small-scale farming community is to
maximize the net returns. Fertilizer application is considered as an investment activity that
produces some expected results over an extended period of time. Expected returns (RETURNS)
show direct positive effects to fertilizer adoption by small-scale farmers. The variable is
statistically significant at 5% significance level. Results of the model show that if expected
returns are favorable, fertilizer adoption increases by 0.36% and that ‘non-favorable returns’
status reduces the probability of adoption by 36.81%.
Ownership of farm equipment (EQUIPMENT) such as ploughs cultivators, planters and many
common implements positively affects fertilizer adoption. Ownership of necessary farm
equipment increases the probability of fertilizer adoption by 0.32% although the variable is

93
statistically insignificant at both 1% and 5% significance levels. Adequate farm equipment
increases fertilizer adoption by small-scale farmers by a margin of 0.019%.
Secure tenure (TENURE), representing the most desired form of tenure, is positively and
significantly associated with fertilizer utilization by small-scale farmers. The model results show
that small-scale farmers under secure tenure system have a 51.64% higher probability of
fertilizer adoption than farmers operating under an insecure tenure regime. The results show that
the tenure variable has a positive effect of 1.68% on fertilizer adoption and that the variable is
significant at both 1% and 5% significance levels.
The labor factor (LABOR), ceteris paribus, statistically significantly affects fertilizer utilization.
There is a negative relationship between labor factor and fertilizer adoption with a margin of
0.73%. A priori expectations about the effect of road infrastructure (ROAD) are that it is
positively and significantly related to fertilizer adoption. The results of the model have revealed
that the road factor is statistically insignificant at both 1% and 5% significance levels. Although
this variable is statistically insignificant, the result (coefficient of 0.0011) suggest a weak and yet
positive effect on fertilizer adoption. It is suggested that the variable may have indirect effects
which are perhaps more stronger and this probably comes through its determination on transport
costs incurred by the farming community.
The provision of loans (LOANS) and efficiency of the fertilizer delivery systems (DELIVERY)
both have a positive influence on fertilizer adoption. Although the loan factor is insignificant, the
fertilizer delivery system statistically significantly affects fertilizer adoption. The result on the
DELIVERY variable show strong and positive effects and that a farming environment
characterized by an efficient fertilizer delivery system enhances fertilizer adoption by 1.69% and
that the attribute of efficiency increases the probability of fertilizer adoption by 28.61% more
than an environment characterized by inefficiencies in fertilizer delivery.
5.3.2. Intensity of Use of the Fertilizer Input
Use of fertilizer in crop production is very critical for the success of the sector. Small-scale
farmers tend to use positive though little amounts of the input in such a way that the application

94
is insignificant in terms of its impact in the determination of crop output. A number of factors
inform this decision of how much to apply in specific crops. From the tobit model, social
variables like age of the household head (AGE) and household size (HSIZE) have negative and
statistically significant effects on fertilizer utilization. For each additional year age, the use of
fertilizer declines by 0.24kg/ha for the entire sample and by 1.19kg/ha for adopters while a unit
increase in the size of the family reduces the use of fertilizer by 3.4kg/ha and 5.8kg/ha for the
entire sample and for adopters respectively. Table below shows the tobit model results.
Table 21: Results of Tobit Model of Fertiliser Utilisation (where AD is the level of
fertilizer used in kg/ha)
AD Coef. Std err P-value Total Change
Change in
Prob.
Change among
adopters
AGE -0.511** 2.0191 0.018 -0.236 -0.014 -1.191
LAND 20.4263 18.1587 0.264 5.640 0.352 9.583
LITERACY -52.1373 48.6802 0.287 -13.547 -0.036 -21.572
HSIZE -12.5558** 10.0024 0.021 -3.447 -0.080 -5.789
ONNY 50.4979 49.0981 0.306 6.391 0.092 12.579
OFFY 51.8473 46.6343 0.269 11.578 0.202 20.759
TRANS -163.0434* 48.4050 0.001 -46.230 -0.763 -87.190
ACCESS 0.0491 0.0138 0.951 0.0039 0.0034 0.0396
FTCHANNEL 7.1630* 5.0671 0.002 2.454 0.146 5.396
RAIN 33.7482** 48.7634 0.049 4.281 0.687 9.598
RETURNS 13.521* 9.518 0.027 3.032 0.269 6.025
EQUIPMENT 1.020 0.050 0.142 0.095 0.036 0.761
TENURE 3.948* 2.650 0.037 1.071 0.218 2.471
LABOUR -4.9907 4.1360 0.231 -0.946 -0.016 -1.500
ROAD 0.0021 0.0043 0.719 0.0012 0.0010 0.0015
LOANS 0.851* 0.3112 0.050 0.4001 0.297 0.4189
DELIVERY 2.560* 1.012 0.036 1.002 0.739 1.5610
β0 62.8953 150.2534 0.043 10.070 0.364 24.998
95
Source: Survey data, 2010
*significant at 1% **significant at 5%
The relationship between household size and fertilizer utilization might have been brought about
by the possibility of having too much labor to substitute the use of fertilizer with soil
ameliorates. The result that age (AGE) is a disincentive to fertilizer utilization might be
explained by the idea that with age farmers become more conservative and less acceptable of
new ideas.
To consider the economic justification of fertilizer marketing policy and institutional reform,
factors like transaction costs, expected returns form fertilizer investments, tenure systems and the
efficiency of the input delivery system were also analyzed. The perception on transaction costs
has negative and significant effects on fertilizer utilization. The marginal effects shows that the
perception of high fertilizer prices (inclusive of transaction costs) reduces the use of fertilizer by
46.2kg/ha and 87.2kg/ha for the entire sample and the adopters respectively. 46.2kg/ha for the
entire sample is regarded in this survey as a substantial amount and thus the perception on
transaction costs as a variable is considered very critical. The negative coefficient of the
transaction costs variable is large enough to depict a very strong negative relationship between
the two variables and the transaction cost variable is statistically significant at both 1% and 5%
significance levels.
The ‘expected returns’ from the application of fertilizer is positively and significantly related to
fertilizer application. The results show that favorable net returns increase the probability of more
fertilizer utilization by 26.9% among the small-scale farmers. Favorable expected net returns
increase fertilizer application by 3.032kg/ha for the entire sample and by 6.025kg for adopters.
This means that a policy framework that has an objective of increasing fertilizer utilization
should be complimented in theory and in practice by another policy structure that seeks to
enhance the net returns from the use of the input. An institutional environment that addresses the
issues of availability and accessibility of the fertilizer input will yield minimum benefits if not
complimented by these policies meant to increase net returns from the use of the input.
Tenure comes in this model as an economic factor as it is influenced more by the national
96
economic policies. Again, as with the probit model, the tenure variable is positively and
significantly related to fertilizer utilization. A secure tenure increases fertilizer application by
1.071kg/ha and 2.471kg/ha for the entire sample and for the adopters respectively. The efficiency
of the fertilizer delivery system is also an economic factor which influences the rate of fertilizer
utilization among the small-scale farmers. The decline in fertilizer utilization is partly
attributable to counterproductive government fertilizer delivery systems and a lack of
institutionally supported marketing facilities, which have acted together as powerful
disincentives to increased input utilization. Public input delivery system is not a bad state of
affair. It is rather a commendable initiative which is not easy to implement. The initiative
requires national investment activities that a fiscally impoverished government cannot afford.
The model has revealed that the ‘fertilizer delivery’ efficiency variable is an important factor. It
is positively and significantly related to fertilizer utilization. An efficient fertilizer delivery
system enhances the use of the input by 1.002kg/ha and by 1.561kg/ha for the entire sample and
for the adopters respectively.
Though positively related to fertilizer utilization, the land (LAND) variable is statistically
insignificant at both 1% and 5% significance levels. The result for this variable shows that the
land factor indirectly and positively affects fertilizer utilization. The other variables carrying the
expected sign although insignificant at both 1% and 5% significance levels include the on-farm
income (ONNY) and the off-farm income (OFFY). These variables are positively related to
fertilizer utilization. An a priori expectation is that the variables should be significant since they
affect the potential of the farmers to purchase the fertilizer inputs. Low income from either
source would imply inability to purchase the fertilizer input and thus an option of relying heavily
on alternatives such as application of soil ameliorates.
The road factor (ROAD) positively and weakly affects fertilizer utilization. This may imply that
its presence in the model is only necessary to explain model fitness and not the possibility of
increased fertilizer use. Again, literacy variable (LITERACY) is negatively and insignificantly
related to fertilizer utilization. Results show that the probability of increasing fertilizer utilization
is reduced by 3.6% if the farmer is literate. This can be explained by the idea that current farmer
education classes being undertaken are recommending fertilizer micro-dosing technologies.
97
Farmers are equipped with knowledge on how to apply little fertilizer at the same time
harvesting much. The fertilizer marketing channel used by the farming community defines
accessibility of the fertilizer input as well as efficiency of the delivery system. The marketing
channel of fertilizer flow is very critical in determining how much fertilizer to be applied and in
which enterprise. The variable (FTCHANNEL) is positively and significantly related to fertilizer
utilization. An institutional and policy structure that supports commercial marketing of the
fertilizer input increases its use by 2.45kg/ha and 5.396kg/ha for the entire sample and for the
adopters respectively.
The easy with which farmers access the fertilizer input (ACCESS) is considered in this study to
be very critical in determining how much fertilizer is to be used in crop production. The
expectation was that this variable be positively and significantly related to fertilizer utilization.
Besides being positively related to fertilizer use, the access variable is insignificant at both 1%
and 5% significance levels. Contrary to previous results of the probit model, the ‘provisions of
loans (LOANS)’ as an independent variable is significantly and positively related to fertilizer
use. Loans provide the capital base on which most of fertilizer purchases rest on. An institutional
environment that enables easy access to loans without collateral for the small-scale farmers
sector positively impacts on fertilizer utilization. This environment increases fertilizer use by
0.4kg/ha for the entire sample and by 0.4189kg/ha for the adopters.
Recalling on the theory of rational expectations, farmers use the information they would have
gathered about the expected rainfall condition for the coming season effectively. Information
linking the season to effective rainfall increases fertilizer utilization among small-scale farming
communities. Anticipation for a ‘good season’ induces investments in fertilizer technologies.
The result show that such an anticipation increases fertilizer use by 4.281kg/ha for the entire
sample and by 9.598kg/ha for the adopters. Good season induces some increase in fertilizer use
by a margin of 33.75%.
5.4. Chapter Summary
This chapter analyzed the factors affecting the likelihood and the intensity of fertilizer utilization
by small-scale farmers. It was noted that fertilizer input subsidization per se is unlikely to have a
98
marked effect on fertilizer use unless preceded or accompanied by a variety of structural reforms
to remove the various constraints facing the small-scale farming communities. Probit and tobit
models were used to analyze adoption and utilization decisions. For the probit model, the
fertilizer marketing system, net returns for fertilizer investment and the tenure system variables
were positive and significant at 1% and 5% significance levels. The age variable, household size,
transaction costs, accessibility of inputs and the labor variable were found to be negative and
significant at both 1% and/or 5% significance levels.
For the tobit model, the fertilizer market, expectations about the rain condition, net returns from
fertiliser investment, tenure variable, provision of loans, and the efficiency of the delivery system
were found to be positive and significant at both 1% and 5% significance levels. The age
variable, household size, transaction costs incurred, and the labor variable were also found to be
significant although depicting a negative relationship with fertiliser utilization. Thus, an effective
fertiliser marketing policy and institutional reform should be shaped and be well informed by
these cross-cutting factors for it to have an impact on fertiliser utilization in crop production.

99
CHAPTER SIX
COMPARATIVE ANALYSIS OF PERFORMANCE OF SMALL-SCALE FARMERS
6.1. Introduction
This chapter presents an econometric modelling of the influence of channel of fertiliser
marketing used by small-scale farmers to acquire fertilisers on agricultural performance by
estimating the logistic regression model which allows explicit testing of the respective variables.
Performance here is measured by four depended variables; variables measuring crop production
(food crop and cash crop) and variables determining asset ownership (ploughs and cattle). The
majority of farmers grow maize as their food crop (100%), and cotton as their cash crop (21%)
and they also value the ownership of ploughs (80%) and cattle (51%).
6.2. Crop Productivity
Farmers acquire fertilizers from different sources. The choice of a specific source for the
acquisition of the fertilizer input is depended on a number of factors. The source of the fertilizer
input (be it the commercial market, public supply system or both) determines the amount of the
fertilizer to be accessed by the farmer. This then influences the yield levels to be realized by
these farmers.
6.2.1. Maize Production
The average yield level for the sampled farmers is 0.497tons/ha. This tonnage is very low for a
society that aims self-sufficient supplies of maize. Crop Breeding Institute in the Department of
Research and Specialist Services puts it that over the decades they have been developing maize
varieties and have pushed for multiplication and marketing varieties with a capacity of producing
at least 7 tons/ha. About 52% of the farmers as is shown in the line chart below are low
performers in terms of yield level per hectare. Only 35% are high performers, yielding more than
the average 0.497tons/ha. About 13% are average producers as is highlighted by the ‘average
yield line’ in the chart.
Figure 8: Household Maize Yield Levels

100
The study has shown that of the 52% constituting the low performers, 33% obtain their fertilizer
through the public channel of fertilizer flow, 14% through both the public and the commercial
marketing systems and 5% through the commercial marketing channel. This highlights that the
public fertilizer supply system is associated with low yields compared to the use of both systems.
Of the 35% constituting high performers in terms of maize yield levels, 15% are those
households using both the commercial and the public channels of fertilizer flow, 13% being
those relying only on public handouts while 7% give a premium only to the commercial
marketing system.
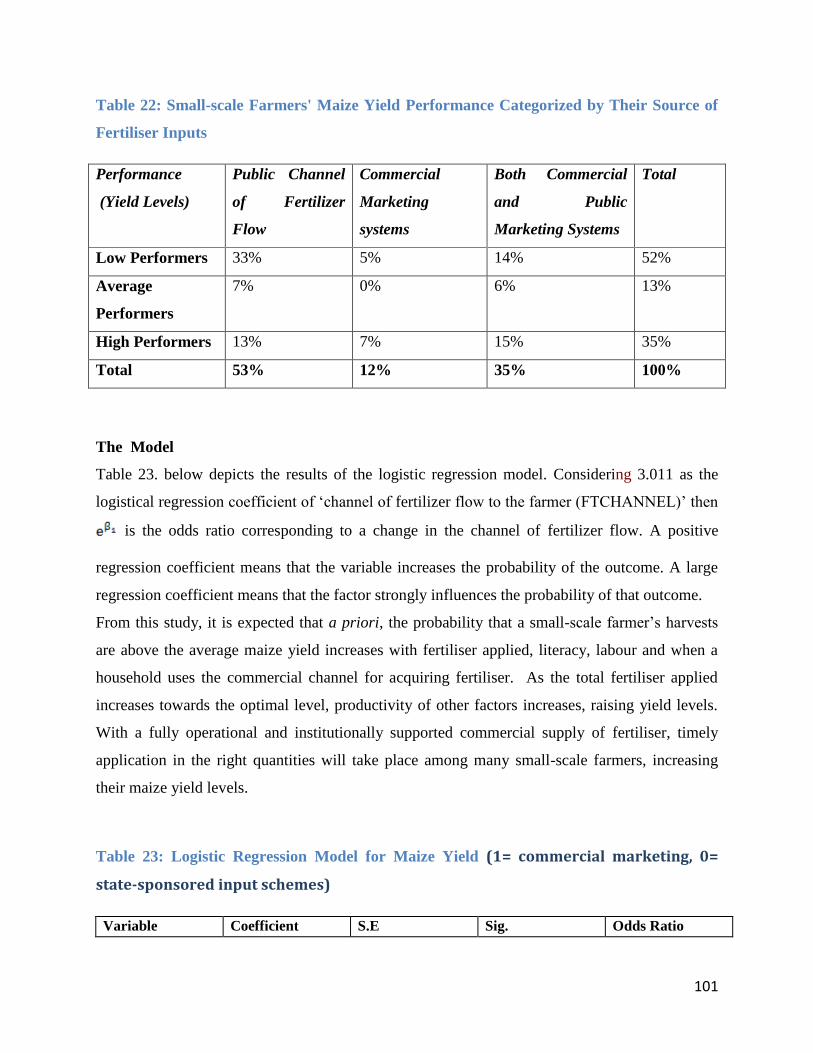
101
Table 22: Small-scale Farmers' Maize Yield Performance Categorized by Their Source of
Fertiliser Inputs
Performance
(Yield Levels)
Public Channel
of Fertilizer
Flow
Commercial
Marketing
systems
Both Commercial
and Public
Marketing Systems
Total
Low Performers 33% 5% 14% 52%
Average
Performers
7% 0% 6% 13%
High Performers 13% 7% 15% 35%
Total 53% 12% 35% 100%
The Model
Table 23. below depicts the results of the logistic regression model. Considering 3.011 as the
logistical regression coefficient of ‘channel of fertilizer flow to the farmer (FTCHANNEL)’ then
is the odds ratio corresponding to a change in the channel of fertilizer flow. A positive
regression coefficient means that the variable increases the probability of the outcome. A large
regression coefficient means that the factor strongly influences the probability of that outcome.
From this study, it is expected that a priori, the probability that a small-scale farmer’s harvests
are above the average maize yield increases with fertiliser applied, literacy, labour and when a
household uses the commercial channel for acquiring fertiliser. As the total fertiliser applied
increases towards the optimal level, productivity of other factors increases, raising yield levels.
With a fully operational and institutionally supported commercial supply of fertiliser, timely
application in the right quantities will take place among many small-scale farmers, increasing
their maize yield levels.
Table 23: Logistic Regression Model for Maize Yield (1= commercial marketing, 0=
state-sponsored input schemes)
Variable Coefficient S.E Sig. Odds Ratio
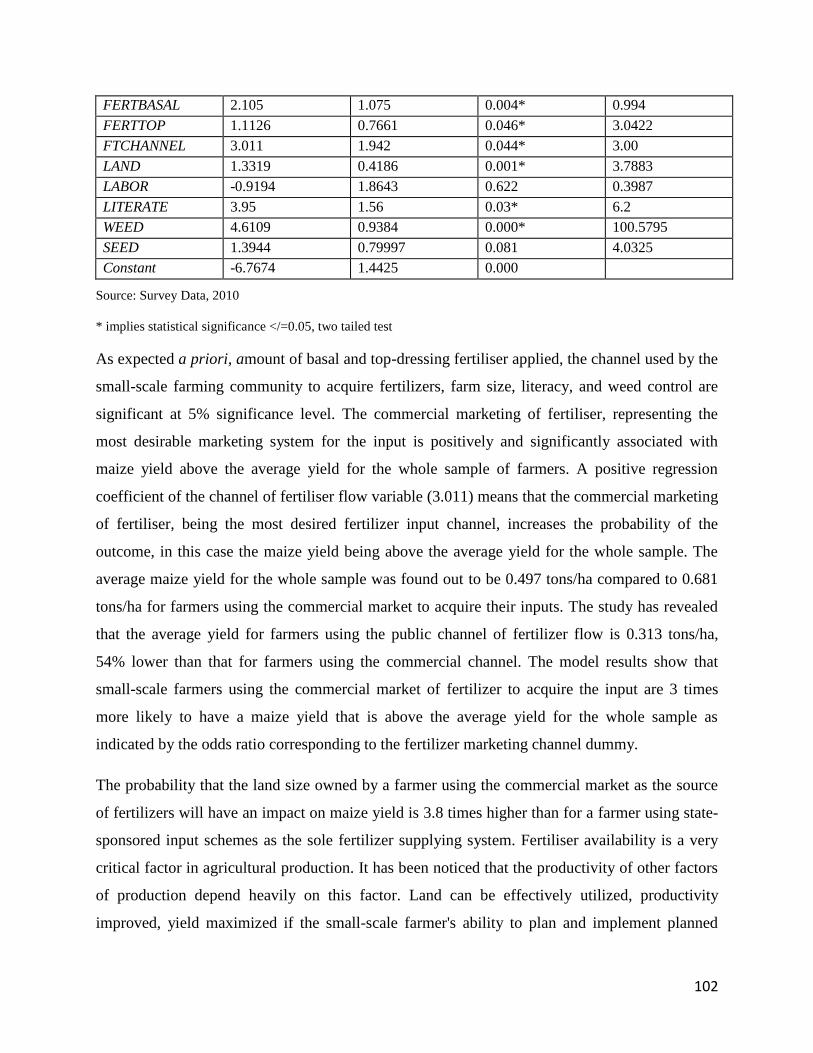
102
FERTBASAL 2.105 1.075 0.004* 0.994
FERTTOP 1.1126 0.7661 0.046* 3.0422
FTCHANNEL 3.011 1.942 0.044* 3.00
LAND 1.3319 0.4186 0.001* 3.7883
LABOR -0.9194 1.8643 0.622 0.3987
LITERATE 3.95 1.56 0.03* 6.2
WEED 4.6109 0.9384 0.000* 100.5795
SEED 1.3944 0.79997 0.081 4.0325
Constant -6.7674 1.4425 0.000
Source: Survey Data, 2010
* implies statistical significance </=0.05, two tailed test
As expected a priori, amount of basal and top-dressing fertiliser applied, the channel used by the
small-scale farming community to acquire fertilizers, farm size, literacy, and weed control are
significant at 5% significance level. The commercial marketing of fertiliser, representing the
most desirable marketing system for the input is positively and significantly associated with
maize yield above the average yield for the whole sample of farmers. A positive regression
coefficient of the channel of fertiliser flow variable (3.011) means that the commercial marketing
of fertiliser, being the most desired fertilizer input channel, increases the probability of the
outcome, in this case the maize yield being above the average yield for the whole sample. The
average maize yield for the whole sample was found out to be 0.497 tons/ha compared to 0.681
tons/ha for farmers using the commercial market to acquire their inputs. The study has revealed
that the average yield for farmers using the public channel of fertilizer flow is 0.313 tons/ha,
54% lower than that for farmers using the commercial channel. The model results show that
small-scale farmers using the commercial market of fertilizer to acquire the input are 3 times
more likely to have a maize yield that is above the average yield for the whole sample as
indicated by the odds ratio corresponding to the fertilizer marketing channel dummy.
The probability that the land size owned by a farmer using the commercial market as the source
of fertilizers will have an impact on maize yield is 3.8 times higher than for a farmer using state-
sponsored input schemes as the sole fertilizer supplying system. Fertiliser availability is a very
critical factor in agricultural production. It has been noticed that the productivity of other factors
of production depend heavily on this factor. Land can be effectively utilized, productivity
improved, yield maximized if the small-scale farmer's ability to plan and implement planned
103
strategies is not tempered with. Farmers using the public channel of fertilizer flow have their
ability to plan and implement planned strategies robbed from them. Using the commercial
fertilizer marketing system enables the farmers to implement planned strategies effectively as
every activity is time bound and fertilizers are acquired right on time.
The channel of fertilizer acquisition used by the farming community determines timeliness in
input delivery, the quality of the fertilizer input as well as the quantity to be received per a
specific period with respect to shifts in seasons. This will have an impact on the effectiveness of
other farming activities such as weeding. As expected a priori, the attainment of a higher maize
yield is positively and significantly affected by timely and effective weed control systems. The
probability that an early weed control system used by a specific farmer using the commercial
market as the source of fertilizers will have an impact on maize yield is 100.6 times higher than
for a farmer using the public channel of fertilizer flow. A positive regression coefficient of weed
control systems (4.61) which defines earliness means that the variable increases the probability
of the expected outcome. A large regression coefficient means that the factor strongly influences
the probability of a maize yield to be above 0.497 tons per hectare.
The results also indicate that the variables for basal and top dressing fertilizer applications are
both significant and positively associated with higher maize yields. This is expected since most
of the soils in the region are highly degraded and only perform better if ample fertilizer quantities
are applied and that maize is a critical crop which does well when enough nutrients in the form
of inorganic fertilizers or soil ameliorates are added. Positive coefficients of 2.105 and 1.113 for
basal fertiliser and top dressing fertilizer application respectively means that the variables
increase the probability of maize yield above 0.497 tons/ha. The probability that the basal
fertiliser applied by a farmer using the commercial market to acquire the input will have an
impact on maize yield is 0.99 times higher than for a farmer using state-sponsored input schemes
as the sole fertilizer supplying system. For farmers using the commercial market to source
fertiliser, the probability that the top dressing fertiliser applied will have an impact on maize
yield is 3 times higher than that for farmers using the public channel. In the same interest, the
study has also revealed that the probability that the literacy level of a specific small-scale farmer
using the commercial market to acquire the fertiliser input will have an impact on maize yield is
6.2 times higher than for a farmer using state-sponsored input schemes as the sole input
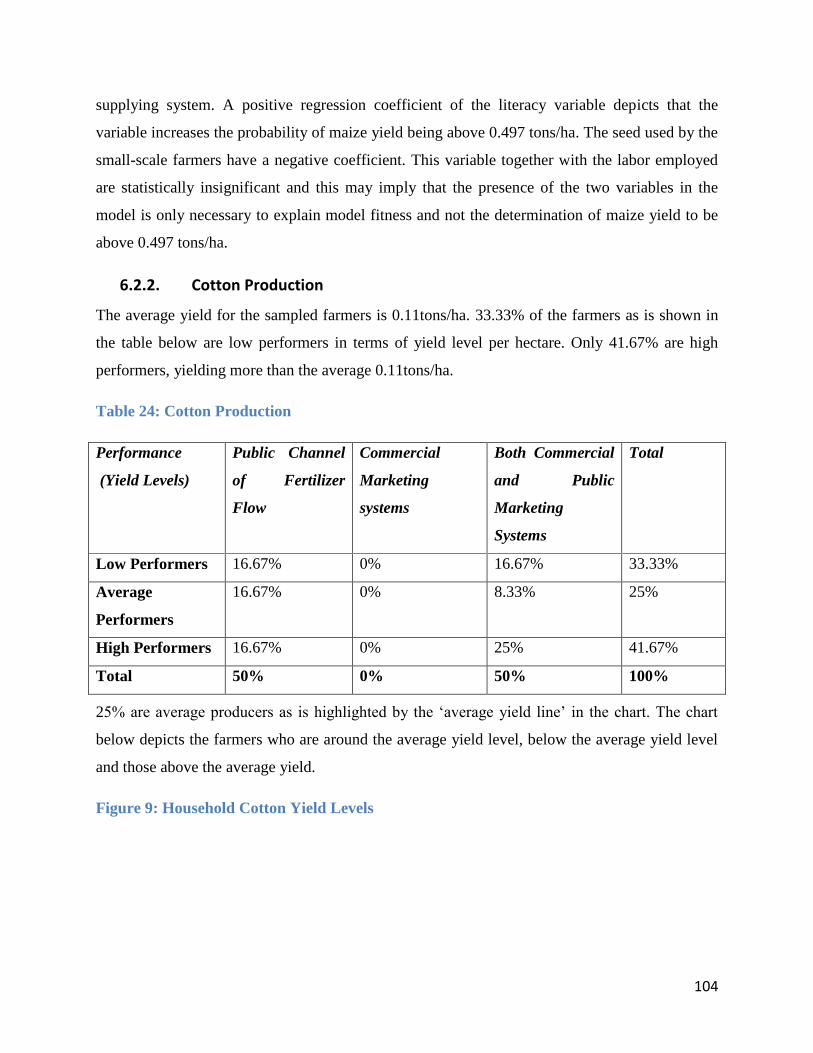
104
supplying system. A positive regression coefficient of the literacy variable depicts that the
variable increases the probability of maize yield being above 0.497 tons/ha. The seed used by the
small-scale farmers have a negative coefficient. This variable together with the labor employed
are statistically insignificant and this may imply that the presence of the two variables in the
model is only necessary to explain model fitness and not the determination of maize yield to be
above 0.497 tons/ha.
6.2.2. Cotton Production
The average yield for the sampled farmers is 0.11tons/ha. 33.33% of the farmers as is shown in
the table below are low performers in terms of yield level per hectare. Only 41.67% are high
performers, yielding more than the average 0.11tons/ha.
Table 24: Cotton Production
Performance
(Yield Levels)
Public Channel
of Fertilizer
Flow
Commercial
Marketing
systems
Both Commercial
and Public
Marketing
Systems
Total
Low Performers 16.67% 0% 16.67% 33.33%
Average
Performers
16.67% 0% 8.33% 25%
High Performers 16.67% 0% 25% 41.67%
Total 50% 0% 50% 100%
25% are average producers as is highlighted by the ‘average yield line’ in the chart. The chart
below depicts the farmers who are around the average yield level, below the average yield level
and those above the average yield.
Figure 9: Household Cotton Yield Levels
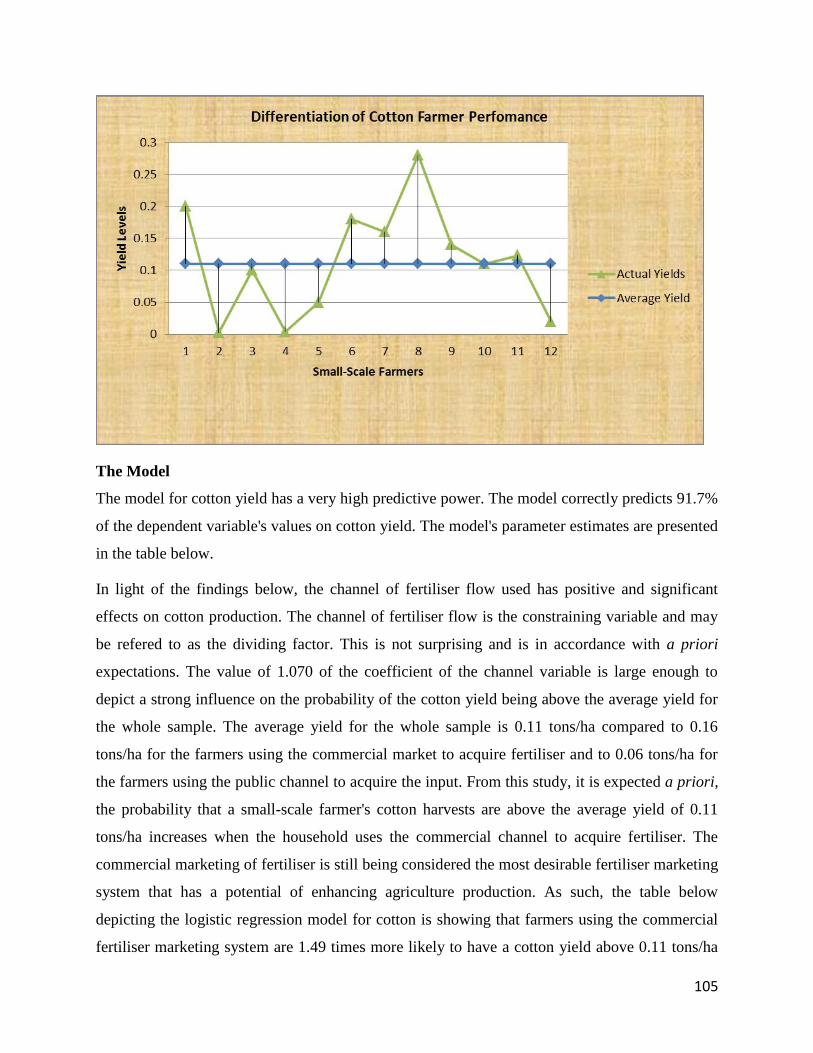
105
The Model
The model for cotton yield has a very high predictive power. The model correctly predicts 91.7%
of the dependent variable's values on cotton yield. The model's parameter estimates are presented
in the table below.
In light of the findings below, the channel of fertiliser flow used has positive and significant
effects on cotton production. The channel of fertiliser flow is the constraining variable and may
be refered to as the dividing factor. This is not surprising and is in accordance with a priori
expectations. The value of 1.070 of the coefficient of the channel variable is large enough to
depict a strong influence on the probability of the cotton yield being above the average yield for
the whole sample. The average yield for the whole sample is 0.11 tons/ha compared to 0.16
tons/ha for the farmers using the commercial market to acquire fertiliser and to 0.06 tons/ha for
the farmers using the public channel to acquire the input. From this study, it is expected a priori,
the probability that a small-scale farmer's cotton harvests are above the average yield of 0.11
tons/ha increases when the household uses the commercial channel to acquire fertiliser. The
commercial marketing of fertiliser is still being considered the most desirable fertiliser marketing
system that has a potential of enhancing agriculture production. As such, the table below
depicting the logistic regression model for cotton is showing that farmers using the commercial
fertiliser marketing system are 1.49 times more likely to have a cotton yield above 0.11 tons/ha
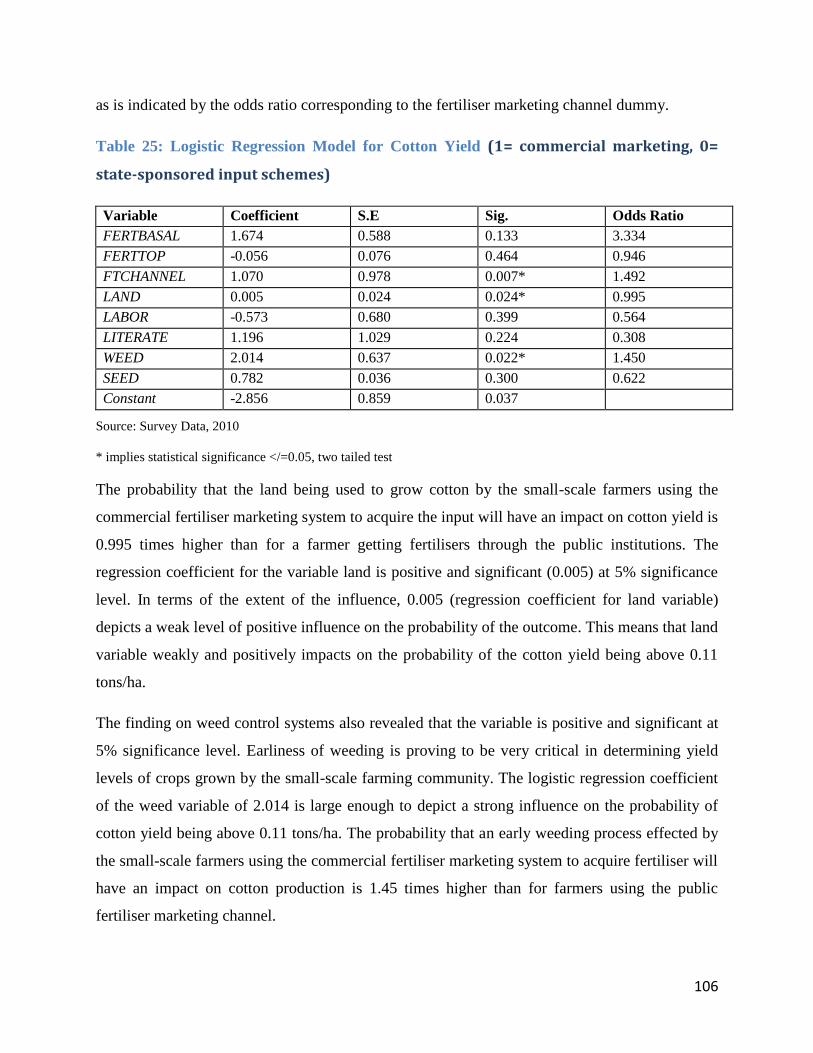
106
as is indicated by the odds ratio corresponding to the fertiliser marketing channel dummy.
Table 25: Logistic Regression Model for Cotton Yield (1= commercial marketing, 0=
state-sponsored input schemes)
Variable Coefficient S.E Sig. Odds Ratio
FERTBASAL 1.674 0.588 0.133 3.334
FERTTOP -0.056 0.076 0.464 0.946
FTCHANNEL 1.070 0.978 0.007* 1.492
LAND 0.005 0.024 0.024* 0.995
LABOR -0.573 0.680 0.399 0.564
LITERATE 1.196 1.029 0.224 0.308
WEED 2.014 0.637 0.022* 1.450
SEED 0.782 0.036 0.300 0.622
Constant -2.856 0.859 0.037
Source: Survey Data, 2010
* implies statistical significance </=0.05, two tailed test
The probability that the land being used to grow cotton by the small-scale farmers using the
commercial fertiliser marketing system to acquire the input will have an impact on cotton yield is
0.995 times higher than for a farmer getting fertilisers through the public institutions. The
regression coefficient for the variable land is positive and significant (0.005) at 5% significance
level. In terms of the extent of the influence, 0.005 (regression coefficient for land variable)
depicts a weak level of positive influence on the probability of the outcome. This means that land
variable weakly and positively impacts on the probability of the cotton yield being above 0.11
tons/ha.
The finding on weed control systems also revealed that the variable is positive and significant at
5% significance level. Earliness of weeding is proving to be very critical in determining yield
levels of crops grown by the small-scale farming community. The logistic regression coefficient
of the weed variable of 2.014 is large enough to depict a strong influence on the probability of
cotton yield being above 0.11 tons/ha. The probability that an early weeding process effected by
the small-scale farmers using the commercial fertiliser marketing system to acquire fertiliser will
have an impact on cotton production is 1.45 times higher than for farmers using the public
fertiliser marketing channel.

107
Top dressing fertiliser applied and the labor force employed has negative coefficients. However,
these are statistically insignificant which may imply that their presence in the model is only
necessary to explain model fitness and not the possibility of the cotton yield being above 0.11
tons/ha. Top dressing fertiliser application, and the labor force employed, ceteris paribus, does
not significantly affect the probability of whether a farmer's cotton yield is above 0.11 tons/ha or
not. Basal fertiliser application, literacy and cotton seed used carry a positive sign implying the
three variables may have a positive influence on cotton production which may be theoretically
and practically correct, but still the three variables are insignificant at 5% significance level.
6.3. Asset Ownership
6.3.1. Plough Ownership
The model correctly predicts plough ownership about 73.9% of the times. On-farm income, land
variable, fertiliser marketing channel used, labor, literacy and draftpower were all found to be
significant at 5% significance level. Commercial marketing of fertiliser being the desired
marketing channel is positively and significantly associated with plough ownership. Farmers
using the free market system are 0.68 times more likely to own at least a plough than farmers
using the state-sponsored input schemes.
The fertiliser marketing channel is very critical as is indicated in this model. The probability that
the land being owned by the farmer using the commercial marketing system to acquire fertilisers
for crop production will have results which will impact on plough ownership is 2.78 times higher
than that for a farmer using the state-sponsored input schemes. Also on-farm income will have
enhanced impact on plough ownership if the farmer is using the free market system to acquire
fertilisers for crop production. Farmers using the state-sponsored input schemes to acquire
fertilisers will have the probability of their on-farm income impacting on plough ownership
being 2.55 times less than for farmers using the free market system.
Although the study has revealed that the majority of the small-scale farmers are illiterate, the
literacy variable is positively and significantly related to plough ownership. Then model results
show that farmers who are literate are 2 times more likely to own ploughs as is indicated by the
odds ratio corresponding to the literacy dummy. The probability that draftpower owned by the
farmers using the free market to acquire fertilisers will have an impact on plough ownership is
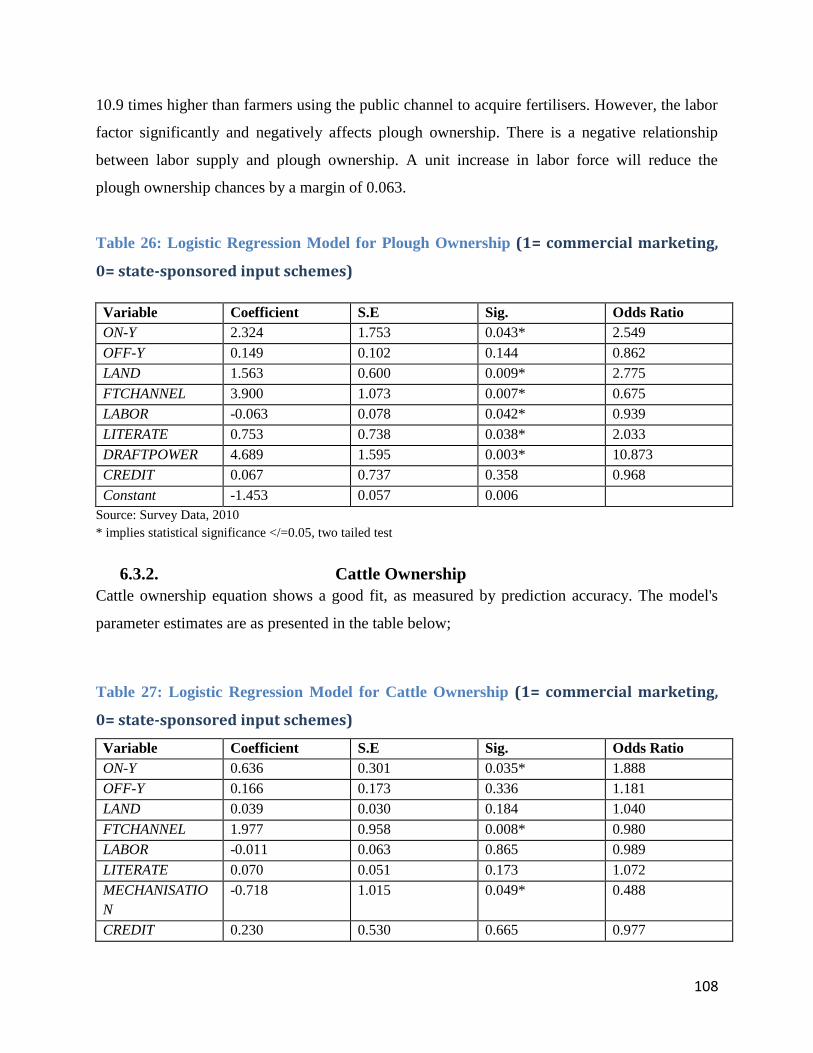
108
10.9 times higher than farmers using the public channel to acquire fertilisers. However, the labor
factor significantly and negatively affects plough ownership. There is a negative relationship
between labor supply and plough ownership. A unit increase in labor force will reduce the
plough ownership chances by a margin of 0.063.
Table 26: Logistic Regression Model for Plough Ownership (1= commercial marketing,
0= state-sponsored input schemes)
Variable Coefficient S.E Sig. Odds Ratio
ON-Y 2.324 1.753 0.043* 2.549
OFF-Y 0.149 0.102 0.144 0.862
LAND 1.563 0.600 0.009* 2.775
FTCHANNEL 3.900 1.073 0.007* 0.675
LABOR -0.063 0.078 0.042* 0.939
LITERATE 0.753 0.738 0.038* 2.033
DRAFTPOWER 4.689 1.595 0.003* 10.873
CREDIT 0.067 0.737 0.358 0.968
Constant -1.453 0.057 0.006
Source: Survey Data, 2010
* implies statistical significance </=0.05, two tailed test
6.3.2. Cattle Ownership
Cattle ownership equation shows a good fit, as measured by prediction accuracy. The model's
parameter estimates are as presented in the table below;
Table 27: Logistic Regression Model for Cattle Ownership (1= commercial marketing,
0= state-sponsored input schemes)
Variable Coefficient S.E Sig. Odds Ratio
ON-Y 0.636 0.301 0.035* 1.888
OFF-Y 0.166 0.173 0.336 1.181
LAND 0.039 0.030 0.184 1.040
FTCHANNEL 1.977 0.958 0.008* 0.980
LABOR -0.011 0.063 0.865 0.989
LITERATE 0.070 0.051 0.173 1.072
MECHANISATIO
N
-0.718 1.015 0.049* 0.488
CREDIT 0.230 0.530 0.665 0.977

109
Constant -2.762 0.878 0.002
Source: Survey data
* implies statistical significance </=0.05, two tailed test
Investment in cattle is influenced by a number of factors. The model has revealed that only on-
farm income, fertiliser marketing channel used and the mechanization variables are significant at
5% significance level. Off-farm income, land, labor, literacy and credit variables are insignificant
and are only necessary to explain model fitness and not the possibility of owning cattle.
The fertiliser marketing channel is positively and significantly related to cattle ownership. The
free market system is the desired delivery system and that the probability that a farmer using this
system to acquire fertiliser owns cattle is positive. This probability is reduced if the farmer
switches to the state sponsored input schemes. The mechanization variable is negatively and
significantly related to cattle ownership. The probability that this variable will have a negative
impact on cattle ownership is high if the farmer is using the free market system to acquire
fertilisers.
A high mechanization level reduces the incentive to own cattle. The two variables
(mechanization and cattle) may be interpreted as substitutes. An example will be draftpower and
tractor ownership. Mostly small-scale farmers own cattle for draftpower and their investment in
cattle is negatively affected if they by chance own tractors or other mechanized implements. On
the other hand, on-farm income will impact positively on cattle ownership (1.89 times more) if
the farmer is using the free market to source fertiliser for crop production.
6.4. Chapter Summary
The chapter presented an econometric modeling of the influence of the fertiliser marketing
system on agricultural performance of the small-scale farmers. Performance was measured using
two sets of variables which are crop productivity and asset ownership. Maize production
represented the food crop sector, cotton production representing the cash crop division, plough
and cattle ownership measuring investments on important assets.
A number of factors including the channel of fertiliser flow used were analyzed to see their
influence on the possibility of the maize and cotton yields of the small-scale farmers to be above
the average yields which are 0.497tons/ha and 0.11tons/ha for maize and cotton respectively. As
110
was expected, the channel of fertiliser used to acquire the input, basal and top dressing fertiliser
applied, farm size, literacy and weed control were significant at 5% significance level in
impacting on maize yield. For cotton production, weed control system, the land factor, and the
fertiliser marketing channel were also found to be significant at 5% significance level. This
means that the channel of fertiliser flow and weed control systems are very critical factors
determining performance of the crop production sector. The results depicted that small-scale
farmers using the free market are 3 times more likely to have a maize yield that is above
0.497tons/ha and are also 1.49 times more likely to have a cotton yield that is above 0.11 tons/ha.
Also, in terms of asset ownership, small-scale farmers using the free market to source fertiliser
for crop production are 0.68 times more likely to own ploughs and are also 0.98 times more
likely to own cattle for draftpower.
111
CHAPTER SEVEN
SUMMARY, CONCLUSION AND POLICY RECOMMENDATIONS
7.1. Introduction
This chapter gives a summary of the research findings, conclusions and recommendations.
Recommendations are provided for policy makers and agricultural researchers based on the basic
policy objective for agricultural development. The objective is to achieve self-sufficiency in food
crops especially maize and wheat and to optimize the production of export crops through
enhanced fertilizer application.
7.2. Summary of Key Findings
7.2.1. General Findings
The Government of Zimbabwe’s agricultural policies and institutional structures have undergone
major changes over the last 10 or so decades. Realizing that the agricultural sector will be the
principal focus of growth in the foreseeable future, the government of Zimbabwe designed a
number of public fertilizer distribution systems. This was intended to accelerate the national
drive towards food self-sufficiency and economic recovery. These public institutions were
conceived as programs of national survival which would revolutionalize agricultural production
by both feeding the people and producing surplus for export. Despite institutionalizing these
state-sponsored input schemes and allocating them a budget, crop yields per unit land remained
very low. Average yields per hectare were found to be 0.497 tons/ha for maize, 0.11 tons/ha for
cotton, 0.5606 tons/ha for tobacco and 0.14 tons/ha for sunflower among the small-scale farmers.
The result of the study shows that small-scale farmers on average are applying 96.08kg/ha of
compound D and 71.51kg/ha ammonium nitrate as basal and top dressing fertilizers in maize
production. This is against extension recommendations of 300-400kg/ha compound D and 150-
200kg/ha ammonium nitrate for one to harvest at least 5 tons /ha, ceteris paribus. As a result,
small-scale farmers simply cannot produce enough maize to keep pace with their needs if
fertilizer utilization in crop production is not improving. The research has shown that the study
area is endowed with two common systems of fertilizer supply. The two common systems, the
112
public supply and the private supply are said to be competing rather than complimenting each
other. The competition, rather than complimentary efforts, has introduced the following elements
in the fertilizer marketing industry;
a) Poor free market coordination scenarios and thin markets for the fertilizer input making
the input unavailable and inaccessible
b) Conflicting fertilizer distribution objectives resulting in operational inefficiencies,
mismanagement, and growing political interference
c) Timeliness failures and the inability of small-scale farmers to plan due to unreliability
issues surrounding fertilizer deliveries
d) High transaction costs in fertilizer acquisition implying a bigger margin between the
producer price of fertilizer and its consumer price
e) Heavy reliance on state-sponsored input schemes by the small-scale farmers besides the
common attribute of high fertilizer input supply uncertainties
The private input supply system is made up of a few agro-dealers who might have survived the
negating impacts of the operations of the public fertilizer supply system.
7.2.2. Research Observations Based on Study Questions and Hypotheses
a). Socio-Economic Characteristics of Small-Scale Farmers Using Different Fertiliser
Marketing Channels
There are significant differences in the socio-economic characteristics of small-scale farmers
using different fertiliser marketing channels to acquire the input. In some instances, it is the
fertiliser marketing channel that determines the socio-economic characteristics of a specific
group of farmers and its vice-versa in some. The bottom line is that there is an association
between the following socio-economic characteristics and the fertilizer marketing channels used
by the farming communities; household headship, household size, labor-holding, membership to
local associations, occupation of household head, education attained, seeking of advice from
extension, asset ownership, land use, explanation for not cultivating total arable, crop enterprises,
access to other farm inputs, mean input use and production levels of maize, production levels and
area under other crops, and constraints. It was observed that only the landholding factor is
independent of the fertilizer marketing channel used by the farmers.

113
b). Factors Affecting the Likelihood and Intensity of Fertilizer Utilization.
In terms of adoption of the fertilizer technology, the probit model has revealed that fertilizer
marketing policies and institutional reforms should take note of age structures, household sizes,
accessibility of the input, expected returns from the use of the input, tenure systems, labor supply
systems and transaction costs. Also important, are issue concerning the road infrastructure, land,
farmer income, literacy, the provision of loans, and weather forecasts. This has depicted the point
that an institutional and policy support for the integration of small-scale farmers into a fertilizer
marketing system that correctly interprets economic marketing issue, social and technical issues
as well as financial issues minimizes transaction costs and maximizes benefits and will
significantly increase fertilizer use in crop production.
c). Impact of Fertilizer Marketing Channels used on Performance of Small-scale
Farmers
The free marketing system, representing the most desirable marketing system for the fertiliser
inputs is positively and significantly associated with maize and cotton production. The
commercial marketing increases the probability of the maize yield and of cotton yield to be
above average yield levels for the sample. The logistical regression model has shown that small-
scale farmers using the free market of fertiliser to acquire the input are more likely to have a
maize yield and a cotton yield above average. Also, the study has shown that the fertilizer
marketing system used by the farming community impacts on the ability of the farmer to own
assets such as ploughs and cattle. It was revealed that use of the public fertiliser marketing
system reduces the positive effects on cattle ownership of factors like on-farm income, literacy,
land, off-farm income and mechanization.
7.3. Conclusion of the study
Having considered the above research findings, the study has concluded that the availability of
agricultural inputs such as fertilizers to small-scale farmers is seen as one of the best ways of
improving agricultural production. It is also concluded that the current challenge is how to
achieve major increases in fertilizer use at the same time that government’s capacity to subsidize
distribution to small-scale farmers is limited. Such subsidies also compete for scarce resources
with other public investments such as roads, agricultural research and extension that could
114
contribute to a more sustainable commercial use of improved crop technology over the long run.
Public provision of inputs has severely undermined fertilizer sales through the commercial
market and has contributed to the existence of thin markets for the input, operational
inefficiencies, growing political interference in fertilizer supplies, timeliness failures and
unreliable issues surrounding deliveries as well as heavy reliance on these handouts which is
economically unwarranted for. The decline in fertilizer utilization is partly attributable to
counter-productive government fertilizer delivery systems and a lack of institutionally supported
marketing facilities, which have acted together as powerful disincentives to increased utilization.
Government of Zimbabwe’s intervention is recognized as causing inefficient distortion in
fertilizer distribution, depressing efficiency by limiting local competition and private sector
development. State sanctioned institutions may not serve the best interest of small-scale farmers.
Contractual issues between state institutions and small-scale farmers are not well defined and
typically small-scale farmers do not have any effective voice in such contracts.
Small-scale farmers, particularly those with little financial and social resources or political
leverage face high and often prohibitive transaction costs and risks in accessing fertilizers and
other inputs. Reductions in transaction costs and risks should be achieved by institutional
changes. It should be apparent from the discussion above that institutional change potentially
plays a significant role. In Zimbabwe, domestic marketing costs account for 50% or more of the
farm-gate price of fertilizer. Lack of competition in fertilizer distribution systems, often as a
result of public sector operations, contributes to inefficiencies and higher marketing margins.
Government sponsored institutions appear not to be an adequate locus for decision making in
matters related to input supply and crop marketing services, particularly with respect to subsidy
management, because of spillover effects.eg. fertilizer subsidized in Bindura district being sold
at market price in Mazowe district. Also, according to the household survey in Bindura District,
most of the small-scale farmers complained of late deliveries. Timeliness seems most
problematic with Operation Food Security deliveries, where 89% of farmers reporting late
fertilizer deliveries, while this figure falls to 15% among commercial purchasers of fertilizer. Not
only do subsidies constitute a distortion of the market but there are also substantial “leakages” of
such credit away from those for whom it was intended towards the large scale estates. This study

115
has shown that the leakages can be substantial, about 15.5% of total fertilizer. The problem of
leakages is related to institutional design. However, the leakages should be weighed against the
gains of increased use of fertilizer by the target groups and the impact on their productivity and
income. A certain level of leakages may be tolerable where the gains to the poor recipients are as
substantial as they are likely to be in the country. Gratuitous government input schemes mostly
leads to corruption, an expensive drain on already overspent budgets leading to macroeconomics
management difficulties while also giving farmers poor services. The fiscal burden of such
schemes should be cause of concern but then that is true of any effort to provide support for the
poor. Ultimately, the problem here is one of political values and fiscal capacity that apply to any
aspect of public expenditure. The long term question is whether the support eventually is self-
eliminating in the sense that the recipients eventually can become self-supporting.
7.4. Policy Recommendations
7.4.1. Recommendations to Policy Makers
a) For the fertilizer sector to be effective, the government in consultation with the private
sector and donors, must develop what Zimbabwe currently lacks; a detailed national
fertilizer policy and plan that is carefully integrated with a comprehensive agricultural
strategy. Dedicated planning units should be established with defined roles and
responsibilities for improving food security. Proper links should be established which
increase the available fertilizer and hence decrease rationing, while preserving the
strengths of informal systems, and provision of flexible services with low transaction
costs. To reach a proper balance, innovative thinking is needed, preferably within the
context of reconstruction of efficient institutions and new ‘social capital’ that will ensure
the proper functioning of fertilizer markets in the countryside.
b) The key institutional challenge is to link the informal and formal input provision sectors,
drawing on the strengths of each, but without destroying the farmer. There is need to
promote private input supply channels while maintaining more modest government run
credit or targeted input distribution program meant to benefit vulnerable farmers to
recover. A balanced integrated approach is required.
c) It is recommended that government and other rural community development partners
when providing fertilizer for the needy and vulnerable groups should rather focus on

116
adoption of non-market distorting interventions. Identified beneficiaries should work at
public works programs for input vouchers which are redeemable at locally based fertilizer
agro-dealers or community based distribution systems
d) Scale up capacity building to councils, village representatives to enable them to identify
the poor and food insecure, and endorse lists of households eligible for social transfers
and development assistance. This should be free from political interference as this would
jeopardize on efficiency and effectiveness. Establish targeted input distribution programs
that are able to promote social and economic development through fertilized crop
production that is sustainable over time, economically justified, financially viable,
socially acceptable and technically sound without causing unacceptable impacts on
commercial sales of the fertilizer input. Increase input use in the target population
without interfering with emerging input markets.
e) The private sector should assume a much larger role in input supply and marketing, the
government at the central and local levels has an important role to play in creating an
enabling environment for private sector activities. The development of functioning
private markets is not a short-term objective. Thus, policies aimed at developing
functioning rural markets must be prompted by a long term vision. New rules and other
measures must be introduced and implemented in a coherent manner and on a permanent
basis.
f) Throughout the privatization process, the relationship between government and the
private sector must be clearly defined; short and long-term roles, and how this change as
the sector develops will need to be spelled out if mutual trust and confidence are to
develop. Some government functions are likely to remain important after privatizing
fertilizer marketing. These include setting and enforcing standards and quality control,
estimating demand, in consultation with the private sector; monitoring and evaluating
sector performance; stabilizing mechanisms for consultations between the private sector
and the government, creating an environment conducive to private sector participation
and supporting long-term research and extension as well as infrastructure development;
putting efforts to increase output/input price ratio and thus providing the liquidity which
enables farmers to increase the obstacles of capital market imperfections.
117
g) Putting up provisions which will help reduce the cost of producing the fertilizer in the
country and consequently translating that into low fertilizer prices at market levels would
improve fertilizer utilization by the small-scale farming communities
7.4.2. Recommendations to Researchers
Based on this study, the following research areas may be the focus for future research;
a) Intensive evaluation of precision conservation agriculture (PCA) with a view of
analyzing the scientific and socio-economic impacts of complementing conservation
agriculture with fertilizer micro-dosing technology.
b) The impact to agricultural productivity of adapting the Mother-Baby Trial design in
national crop breeding programs and variety selection of all agricultural crops
c) Evaluating the option of improved and extended biofertilizer development and utilization
in Zimbabwe
7.5. Limitation of the study
It is accepted that there are also other factors that affect performance of the small scale farming
communities that may not have been captured in the study. Another limitation may crop up from
the data collected. Incorrect data may have been provided knowingly or unknowingly by the
farmers. To minimize this possibility, farmers were acquainted with the advantages associated
with providing correct data sets raging up to the shaping of the policy formulation systems in the
fertilizer sector.
118
References
Bautista, R. M. (1990). Comparative saving behavior of rural and urban households in the
Philipines. Journal of Philipine Development , Vol. 31 (7).
Bierens, H. (2004). The Probit model.
Coase, R. H. (1937). The nature of the firm. Economica.
Colman, D. a. (1989). Principles of agricultural economics. New York: Department of
Agricultural Economics, University of Manchester.
De Janvry, A. F. (1991). Peasant household behavior with missing markets: Some paradoxes
explained. The economic journal , 101, 1400-1417.
Debertin, L. (1986). Agricultural Production Economics. New York: University of Macmilan.
Dorward, A. J. (2005). Institutions, markets and economic coordination: Linking development
policy to theory and praxis. Development and change , 36 (1), 1-25.
Durojaiye, B. (1991). Rural household consumption-saving behavior in low income nations: The
case of Ago-Iwoye, Nigeria. Savings and development (1), 85-96.
Eggertson, T. (1990). Economic behavior and institutions. Cambridge University Press.
Ellis, F. (1996). Agricultural policies in developing countries. Cambridge: School of
development studies, University of East Aglia. Cambridge University Press.
Hobbs, J. (1997). Measuring the importance of transaction costs in cattlemarketing. American
journal of agricultural economics , 79, 1083-1095.
Hobbs, J. (1996). Transaction costs and slaughter cattle procurement: Processors selection of
supply channels. Agribusiness , 12 (6), 509-523.
Kachere, M. (1995). The Zimbabwe fertiliser industry, its strengths and weaknesses and role in a
liberalised environment. Chemplex Corporation Limited.
Kasekende, L. (1998). Savings in the context of macroeconomic policy issues. The East Africa
experience. The 14th annual conference for the Southeast regional association family
economics-Home management, 14, pp. 70-75.
Kirstin, J. a. (2005). The economics of institutions: Theory and applications to African
agriculture.
Maene, L. M. (2001). Review and projection of fertiliser supply and demand balances. Paris:
The International Fertiliser Industry Association.

119
Makhura, M. (2001). Overcoming transaction costs barriers to market participation of
smallholder farmers in the northern province of South Africa . University of Pretoria:
Unpublished PHD Thesis.
Makhura, M. T. (1994). Theoretical and econometric models of commercialisation behavior of
households in the developing areas of South Africa. Pennsylvania State University: Unpublished
MSc Thesis.
Makhura, T. (2001). Overcoming transaction costs barriers to market participation of
smallholder farmers in the Northen Province of South Africa. University of Pretoria.
Makiwa, E. (2002). Fertiliser production and utilisation in Zimbabwe. Ministry of Lands,
Agriculture and Rural Resettlement.
Mazvimavi, K. R. (2006). Building Sustainable Fertilizer Delivery Systems. Briefing Note No. 2,
Department for International Development.
Milner-Gulland, E. J. (1996). A model of household decisions in dryland agropastoral systems.
Miner-Gulland, E. M. (1996). A model of household decisions in dryland agropastoral systems.
Muir-Leresche, K. (1985). Crop price and wage policy in the light of Zimbabwe's development
goals (Vol. DPhil thesis). Harare: Department of Land Management, University of Zimbabwe.
Nabli, M. a. (1989). The new institutional economics and its applicability to development. 17,
pp. 1333-1347.
Nerlove, M. (1958). The dynamics of supply: Estimation of farmers' response to price. Johns
Hopkins University Press.
Bierens, H. (2004). The Probit model.
MacDonal, F. e. (1980). The Tobit Model.
Makhura, T. (2001). Overcoming transaction costs barriers to market participation of
smallholder farmers in the Northen Province of South Africa. University of Pretoria.
Milner-Gulland, E. (1996). A model of household decisions in dryland agropastoral systems.
Ohajianya, D. a. (2011). An ordered probit model analysis of transaction costs and market
participation by sweet potato farmers in South Eastern Nigeria. 85th Annual Conference of the
Agricultural Economics Society (pp. 18-20). Warwick University.
Onyenwaku, C. (1992). Savings mobilisation among rural households in Anambra State of
Nigeria. Quarterly Journal of International Agriculture , Vol. 31 (3).

120
Ostrom, E. (1999). Institutional rational choice: An assessment of the institutional analysis and
development framework. (P. A, Ed.) Westview Press.
Ostrom, E. (1999). Institutional rational choice: An assessment of the institutional analysis and
development framework. Westview Press.
Ostrom, E. (1995). The institutional analysis and development framework: An application to the
study of common pool resources in Sub-Saharan Africa. Curriculum Development Workshop.
Washington D.C: Environment and Development Institute.
Pomeroy, R. a. (1995). The economics of production and marketing in a small-scale fishery.
Phillipines: ICLARM.
Rhobach, D. a. (1997). Setting targets: Modelling crop performance or crop decisions. Workshop
held at Kadoma Ranch. CIMMYT, ICRISAT and DANIDA.
Rugube, L. (2003). Fertiliser industry in Zimbabwe. Unpublished.
Rukuni, M. (2006). Agricultural revolution in Zimbabwe (2nd ed.). Harare: University of
Zimbabwe.
Rusike, J. R. (2000). Developing cereal-based demand for fertiliser among smallholders in
Southern Africa: Lessons learned and implications for other African regions. MSU Agricultural
Economics.
Schrieder, G. (1991). Evaluation of the financial projects for the rural poor with special
emphasis on savings schemes. Finance and development in West Africa. University of
Ouagadougou.
Seward, P. (2006). Appropriate inputs for Kenya's farmers. Retrieved March 28, 2006, from
http://www.fipsafrica.com/
Shughart, W. (1997). The organisation of industry. United States of America: Dame
Publications.
Stack, J. (2004). Fertiliser supply systems in Zimbabwe. Harare, Zimbabwe: University of
Zimbabwe.
Tagwirei, F. (2001). The state of economic indigenisation of the agricultural sector in
Zimbabwe. Harare: SIRDC/UNDP/Ministry of Industry and Internatioal Trade.
Utete. (2003). Inputs production and delivery systems. Harare.
Wang, Y. (1995). Permanent income and wealth accumulation: A cross-sectional study of
Chinese urban and rural households. Economic development and cultural change , Vol. 43, 523-
547.
121
Wierenga, B. (1995). Agricultural marketing Efficiency. Retrieved 1997, from Prices, products
and people: Analysing agricultural markets: www.
Williamson, O. E. (1991). Comparative economic organisation: The analysis of discrete
structural alternatives (Vol. 36). Administrative Science Quarterly.
Williamson, O. (1981). The economics of organisation: The transaction cost approach. American
journal of sociology , 87, 58-577.
Williamson, O. (1985). Vertical integration: Theory and evidence. Economic institutions of
Capitalism. New York: The Free Press.
122
ANNEX A -------------------------------------------------------------------------------------------------------------------------------------------------------------
Household Questionnaire
Economics of fertilizer utilization in maize-based
smallholder farming systems and appropriate role for
policy
This questionnaire is an instrument that I am using as a Masters of Science Degree
in Agriculture and Applied Economics student at the University of Zimbabwe to carry
out a study on the economics of fertilizer utilization, assessing the effectiveness of
government sponsored input schemes on improving fertilizer use. It is my special
request that you spare me some of your time that I may gather as much information
as possible. This will enable me to recommend the best policy environment that will
put into being instruments which will empower you small scale farmers to take your
rightful place in fertilizer input sourcing, improving your state of preparedness in
maize production.
It is my promise before this discussion that the information you will provide will only
be used for the mentioned purpose and will be treated with a pronounced state of
confidentiality it deserves.
Questionnaire Number:……………………………………………………………………
Name of interviewer:……………………………………………………………………….
Date:……………………………………………………………………………………………
District:………………………………………………………………………………………
Village:………………………………………………………………………………………
Ward:…………………………………………………………………………………………

123
SECTION A: HOUSEHOLD DEMOGRAPHIC AND GENERAL INFORMATION
1. Structure of the household
1.1. Age of respondent………………………………………………………………….…years old
1.2. Relationship of respondent to the household head……………………………………………..
1 = Male head 2 = Female head 3 = Wife 4 = Son 5 = Daughter 6 = Brother 7 = Other (specify)
1.3. The one accountable for final farming decisions is . . . . . . . . . . . . . . . . . . . . . . . . . . . . . . . . . . . . . . . . . . . . . . . . . . .
1 = Father and mother 2 = Mother since father works outside the district
2 = The children since all the parents are dead 4 = Father since mother is dead
5 = mother since father is dead 6 = Father since mother works outside the district
1.4. Number of family members in the household………………………………………
1 = [1-3] 2 = [4-6] 3 = [7-9] 4 = [10+]
1.5. An approximate size of the farm .......................................................................................................................
1.6. Other household members information
Person code Relation to head.
1=Father
2=Mother
3=Son
4=Daughter
5=Other(specify)
……………………
…………
Sex
1=Male
2=Female
Age (yrs)
1= 0-6
2= 7-15
3=16-22
3= 23-29
4= 30-49
5= 50+
Marital status
1=single
2=married
3=divorced
Highest
Education level
attained
1=Primary
2= Secondary
3= Tertiary
4= Degreed
5= Masters
Formal
Employment
1 = yes
2 = no
Male head
Female head
Member 1
Member 2
Member 3
Member 4
Member 5
Member 6

124
Member 7
Member 8
1.7. Indicate your labour sources and quantity in the table below;
Source of labour 2007/8 2008/9 2009/10
Household Adult Labour
Equivalence (ALE)
Hired in
labour
Permanent
Seasonal
2. Farmers social network
2.1. Are you a member of any farmers’ association group in the region? If the answer is yes , please specify on the space provided, but if the answer is no, please go to question 2.5.
1 [yes] ………………………………………………………………………….…………….…… 2 [no]
2.2. What is the main objective of the above mentioned association? . . . . . . . . . . . . . . . . . . . . . . . . . . . . . . . . . . . . . . . . . . . . . . . . . . . . . . . . . . . . . . . . . . . . . . . . . . . . . . . . . . . . . . . . . . . . . . . . . . . . . . . . . . . . . . . . . . . . . . . . . . . . . . . . . . . .
2.3. Which inputs do you sometimes purchase as an association? . . . . . . . . . . . . . . . . . . . . . . . . . . . . . . . . . . . . . . . . . . . . . . . . . . . . . . . . . . . . . . . . . . . . . . . . . . . . . . . . . . . . . . . . . . . . . . . . . . . . . . . . . . . . . . . . . . . . . . . . . . . . . . . . . . . .
2.4. What other services does the association help you with? . . . . . . . . . . . . . . . . . . . . . . . . . . . . . . . . . . . . . . . . . . . . . . . . . . . . . . . . . . . . . . . . . . . . . . . . . . . . . . . . . . . . . . . . . . . . . . . . . . . . . . . . . . . . . . . . . . . . . . . . . . . . . . . . . . . . . . . . . . . . . . . . . . . . . . . . . . . . .. . . . . . . . . . . . . . . . . . . . . . . . . . . . . . . . . . . . . . . . . . . . . . . . . . . . . . . . . . . . . . . . . . . . . . . . . . . . . . . . . . . . . . . . . . . . . . . . . . . . . . . . . . .
2.5. Do you hold any influential position in the village, ward, district or provincial structures?
............................................................................................................................................................................
2.6. Are you a well known personality at village, ward or district level? If the answer is yes, what costs or
disadvantages, benefits or advantages are associated with this? 1 [yes] : costs or disadvantages
……………………………………………………………………………………………………………
: benefits or advantages
……………………………………………………………………………………………………………
2 [no]
2.7. When you are not working on your farm, what other duties will you be performing in or out of the
district?
........................................................................................................................................................................................................................
................................................................................................................................
2.8. Approximately, what is the distance from your farm to Bindura town? . . . . . . . . . . . . . . . . . . . . . . . . . . . . . . . . . . . . . . . . . . . . . . . . . . . . . . . . . . . . . . . . . . . . . . . . . . . . . . . . . . . . . . . . . . . . . . . . . . . . . . . . . . . . . . . . . . . . . . . . . . . . . . . . . . . .
3. Access to extension
3.1. Are you aware there is an agricultural extension officer representing your area?
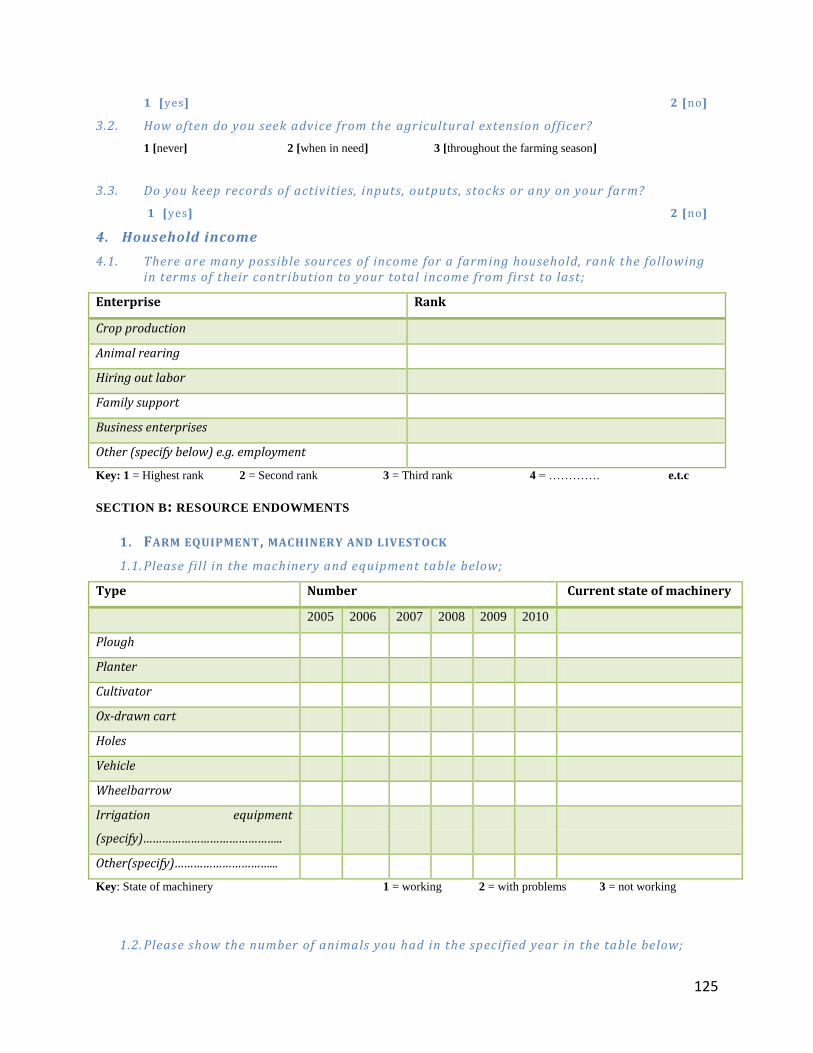
125
1 [yes] 2 [no]
3.2. How often do you seek advice from the agricultural extension officer?
1 [never] 2 [when in need] 3 [throughout the farming season]
3.3. Do you keep records of activities, inputs, outputs, stocks or any on your farm?
1 [yes] 2 [no]
4. Household income
4.1. There are many possible sources of income for a farming household, rank the following in terms of their contribution to your total income from first to last;
Enterprise Rank
Crop production
Animal rearing
Hiring out labor
Family support
Business enterprises
Other (specify below) e.g. employment
Key: 1 = Highest rank 2 = Second rank 3 = Third rank 4 = …………. e.t.c
SECTION B: RESOURCE ENDOWMENTS
1. FARM EQUIPMENT , MACHINERY AND LIVESTOCK
1.1. Please fill in the machinery and equipment table below;
Type Number Current state of machinery
2005 2006 2007 2008 2009 2010
Plough
Planter
Cultivator
Ox-drawn cart
Holes
Vehicle
Wheelbarrow
Irrigation equipment
(specify)……………………………………..
Other(specify)…………………………...
Key: State of machinery 1 = working 2 = with problems 3 = not working
1.2. Please show the number of animals you had in the specified year in the table below;

126
Type 2006 2007 2008 2009 20010
Cattle
Chickens
Goats
Sheep
Pigs
Donkeys
Other(specify)…………………………………….
SECTION C: CROP PRODUCTION
1. PRODUCTION ISSUES AND CROP UTILIZATION
1.1. Fill in the table below to indicate the crops you grew in the specified farming seasons and their respective yields;
Crop 2007/8 2008/9 2009/10
Ha output retained sold Ha output retained sold Ha output retained sold
Maize
Rapoko
Sorghum
Tobacco
Cotton
Sunflower
G/nuts
Paprika
Beans
Wheat
Other
……………..
Note: Output is measured in tones
1.2. Please fill in the table below to indicate use of the following inputs on the whole farm ;
Inputs 2007/8 2008/9 2009/10
Fertiliser Basal fert.
Top dressing
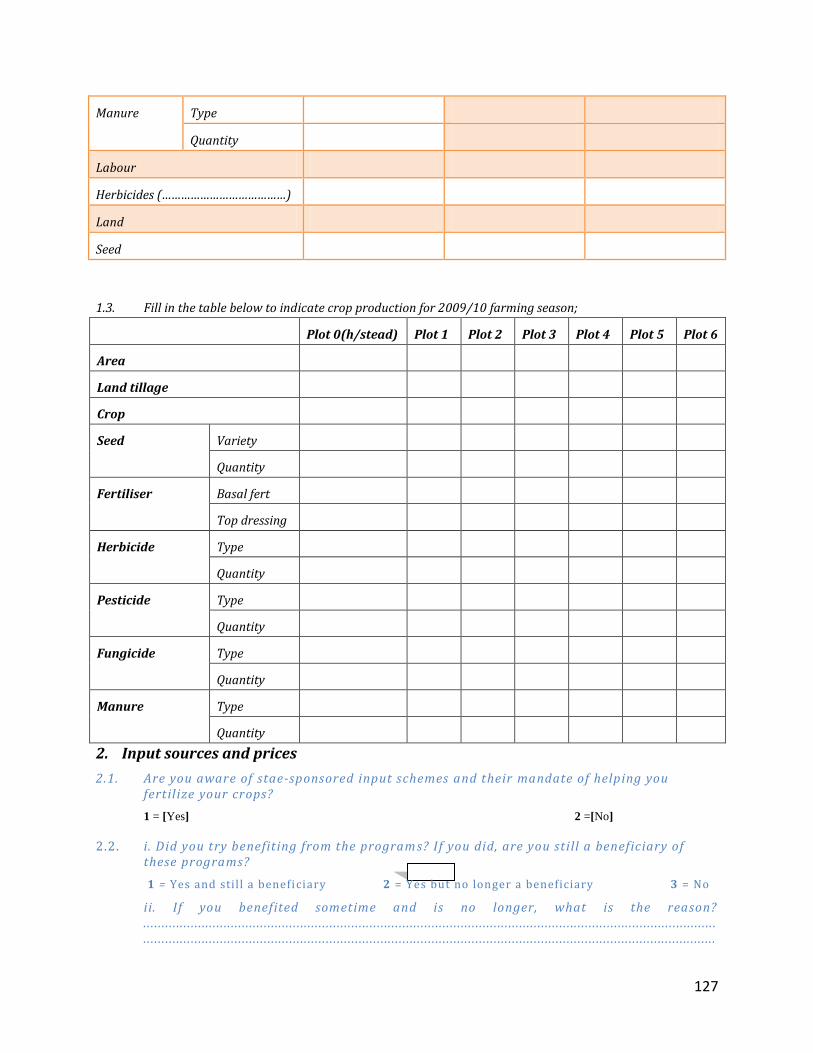
127
Manure Type
Quantity
Labour
Herbicides (…………………………………)
Land
Seed
1.3. Fill in the table below to indicate crop production for 2009/10 farming season;
Plot 0(h/stead) Plot 1 Plot 2 Plot 3 Plot 4 Plot 5 Plot 6
Area
Land tillage
Crop
Seed Variety
Quantity
Fertiliser Basal fert
Top dressing
Herbicide Type
Quantity
Pesticide Type
Quantity
Fungicide Type
Quantity
Manure Type
Quantity
2. Input sources and prices
2.1. Are you aware of stae-sponsored input schemes and their mandate of helping you fertilize your crops?
1 = [Yes] 2 =[No]
2.2. i. Did you try benefiting from the program s? If you did, are you still a beneficiary of these programs?
1 = Yes and stil l a beneficiary 2 = Yes but no longer a beneficiary 3 = No
ii. If you benefited sometime and is no longer, what is the reason? . . . . . . . . . . . . . . . . . . . . . . . . . . . . . . . . . . . . . . . . . . . . . . . . . . . . . . . . . . . . . . . . . . . . . . . . . . . . . . . . . . . . . . . . . . . . . . . . . . . . . . . . . . . . . . . . . . . . . . . . . . . . . . . . . . . . . . . . . . . . . . . . . . . . . . . . . . . . .. . . . . . . . . . . . . . . . . . . . . . . . . . . . . . . . . . . . . . . . . . . . . . . . . . . . . . . . . . . . . . . . . . . . . . . . . . . . . . . . . . . . . . . . . . . . . . . . . . . . . . . . . . . . . . . . . . . . . . . . . . . . . . . . . . . . . . . . . . . . . . . . . . . . . . . . . . . . .
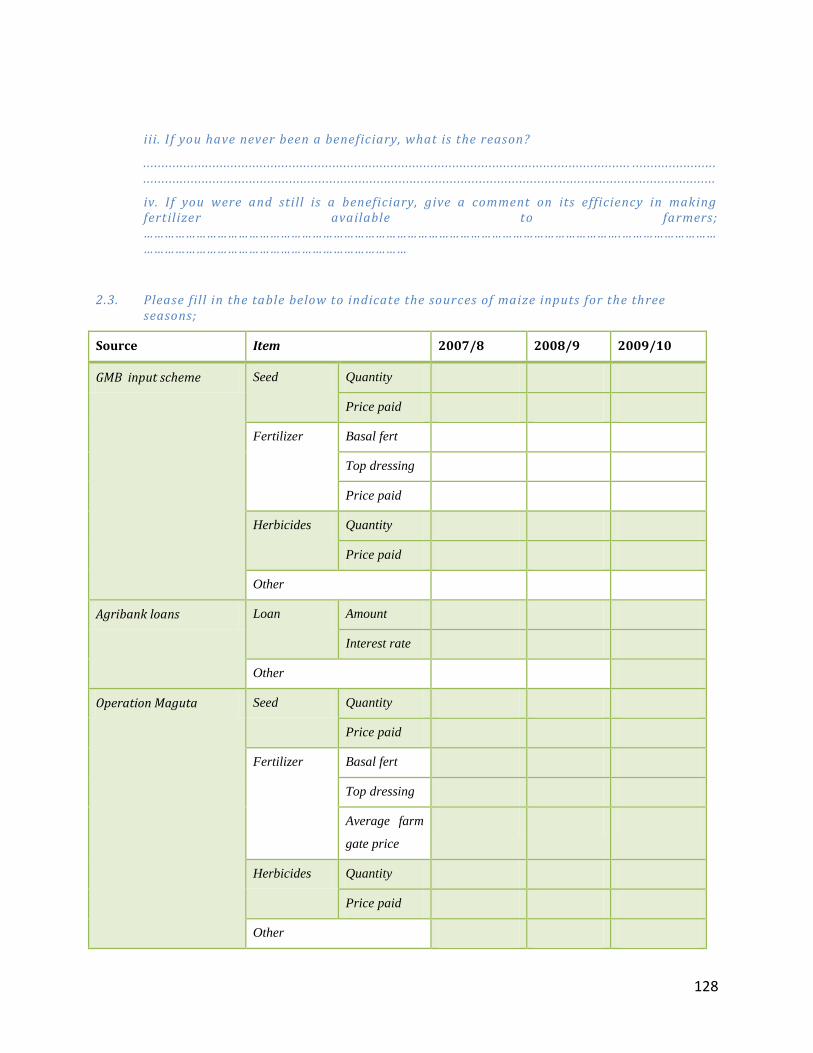
128
iii. I f you have never been a beneficiary, what is the reason?
. . . . . . . . . . . . . . . . . . . . . . . . . . . . . . . . . . . . . . . . . . . . . . . . . . . . . . . . . . . . . . . . . . . . . . . . . . . . . . . . . . . . . . . . . . . . . . . . . . . . . . . . . . . . . . . . . . . . . . . . . . . . . . . . . . . . . . . . . . . . . . . . . . . . . . . . . . . . .
. . . . . . . . . . . . . . . . . . . . . . . . . . . . . . . . . . . . . . . . . . . . . . . . . . . . . . . . . . . . . . . . . . . . . . . . . . . . . . . . . . . . . . . . . . . . . . . . . . . . . . . . . . . . . . . . . . . . . . . . . . . . . . . . . . . . . . . . . . . . . . . . . . . . . . . . . . . . .
iv. I f you were and still is a beneficiary, give a comment on its efficiency in making fertilizer available to farmers; ……………………………………………………………………………………………………………………….…………………………………………………………………………………………
2.3. Please fill in the table below to indicate the sources of maize inputs for the three seasons;
Source Item 2007/8 2008/9 2009/10
GMB input scheme Seed Quantity
Price paid
Fertilizer Basal fert
Top dressing
Price paid
Herbicides Quantity
Price paid
Other
Agribank loans Loan Amount
Interest rate
Other
Operation Maguta Seed Quantity
Price paid
Fertilizer Basal fert
Top dressing
Average farm
gate price
Herbicides Quantity
Price paid
Other

129
Market Seed Quantity
Average price
Fertiliser
(bags)
Basal fert
Top dressing
Average farm
gate price
Herbicide Quantity
Average price
Labour Own labour
Hired in
Average price
Capital Amount
Interest
2.4. Please fill in the table below;
Year benefited from
Operation Maguta
Timeliness Reliability Effects on decision
making
2005/6
2006/7
2007/8
2.5. Please fill in the table below;
Maize
2007/8 2008/9 2009/10
Yield
Planting date(week) and reason
% of area planted to planned [100(planted/planned)]
Average Compound D rate (kg/ha)
Average top dressing fertilizer rate (kg/ha)
Timing of top dressing (good/late)and reason
Timing of basal dressing (good/late)and reason
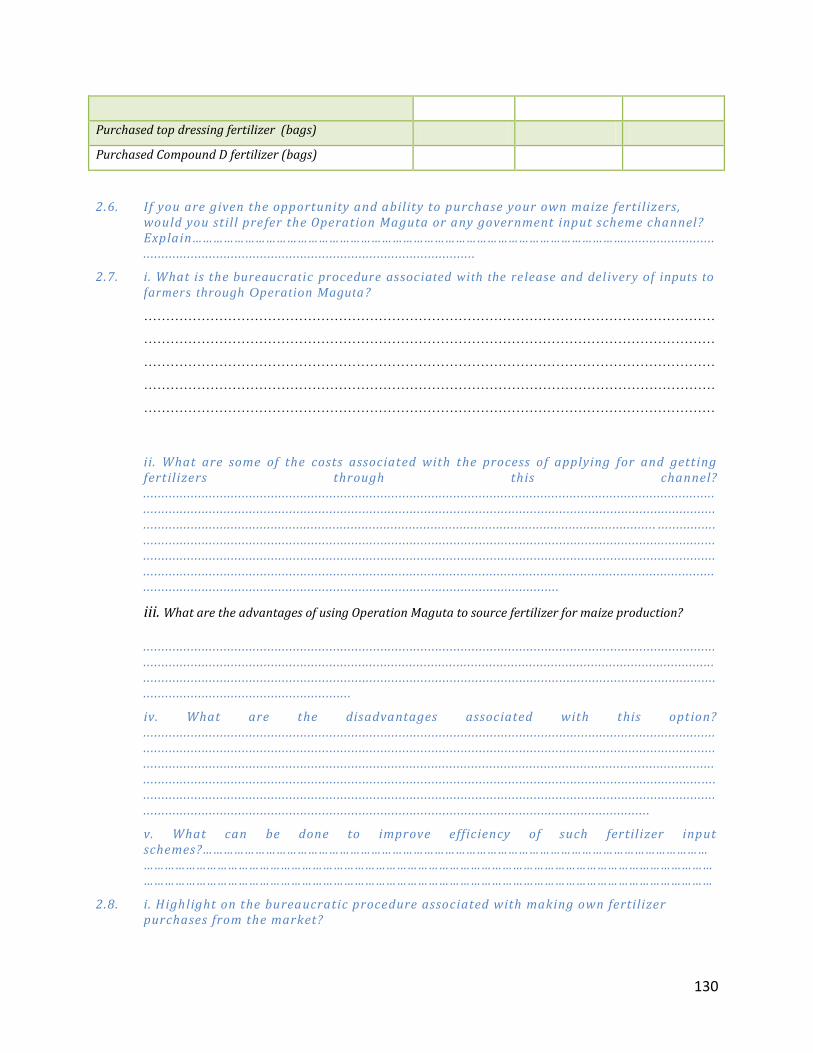
130
Purchased top dressing fertilizer (bags)
Purchased Compound D fertilizer (bags)
2.6. If you are given the opportunity and ability to purchase your own maize fertilizers, would you still pre fer the Operation Maguta or any government input scheme channel? Explain……………………………………………………………………………………………………………... . . . . . . . . . . . . . . . . . . . . . .. . . . . . . . . . . . . . . . . . . . . . . . . . . . . . . . . . . . . . . . . . . . . . . . . . . . . . . . . . . . . . . . . . . . . . . . . . . . . . . . . . . . . . . . . . .
2.7. i. What is the bureaucratic procedure associated with the release and delivery of inputs to
farmers through Operation Maguta ?
…………………………………………………………………………………………………………………
…………………………………………………………………………………………………………………
…………………………………………………………………………………………………………………
…………………………………………………………………………………………………………………
…………………………………………………………………………………………………………………
ii. What are some of the costs associated with the process of applying for and getting fertilizers through this channel? . . . . . . . . . . . . . . . . . . . . . . . . . . . . . . . . . . . . . . . . . . . . . . . . . . . . . . . . . . . . . . . . . . . . . . . . . . . . . . . . . . . . . . . . . . . . . . . . . . . . . . . . . . . . . . . . . . . . . . . . . . . . . . . . . . . . . . . . . . . . . . . . . . . . . . . . . . . . .. . . . . . . . . . . . . . . . . . . . . . . . . . . . . . . . . . . . . . . . . . . . . . . . . . . . . . . . . . . . . . . . . . . . . . . . . . . . . . . . . . . . . . . . . . . . . . . . . . . . . . . . . . . . . . . . . . . . . . . . . . . . . . . . . . . . . . . . . . . . . . . . . . . . . . . . . . . . .. . . . . . . . . . . . . . . . . . . . . . . . . . . . . . . . . . . . . . . . . . . . . . . . . . . . . . . . . . . . . . . . . . . . . . . . . . . . . . . . . . . . . . . . . . . . . . . . . . . . . . . . . . . . . . . . . . . . . . . . . . . . . . . . . . . . . . . . . . . . . . . . . . . . . . . . . . . . .. . . . . . . . . . . . . . . . . . . . . . . . . . . . . . . . . . . . . . . . . . . . . . . . . . . . . . . . . . . . . . . . . . . . . . . . . . . . . . . . . . . . . . . . . . . . . . . . . . . . . . . . . . . . . . . . . . . . . . . . . . . . . . . . . . . . . . . . . . . . . . . . . . . . . . . . . . . . .. . . . . . . . . . . . . . . . . . . . . . . . . . . . . . . . . . . . . . . . . . . . . . . . . . . . . . . . . . . . . . . . . . . . . . . . . . . . . . . . . . . . . . . . . . . . . . . . . . . . . . . . . . . . . . . . . . . . . . . . . . . . . . . . . . . . . . . . . . . . . . . . . . . . . . . . . . . . .. . . . . . . . . . . . . . . . . . . . . . . . . . . . . . . . . . . . . . . . . . . . . . . . . . . . . . . . . . . . . . . . . . . . . . . . . . . . . . . . . . . . . . . . . . . . . . . . . . . . . . . . . . . . . . . . . . . . . . . . . . . . . . . . . . . . . . . . . . . . . . . . . . . . . . . . . . . . .. . . . . . . . . . . . . . . . . . . . . . . . . . . . . . . . . . . . . . . . . . . . . . . . . . . . . . . . . . . . . . . . . . . . . . . . . . . . . . . . . . . . . . . . . . . . . . . . . . . . . . . . . . . . . . . . . .
iii. What are the advantages of using Operation Maguta to source fertilizer for maize production?
. . . . . . . . . . . . . . . . . . . . . . . . . . . . . . . . . . . . . . . . . . . . . . . . . . . . . . . . . . . . . . . . . . . . . . . . . . . . . . . . . . . . . . . . . . . . . . . . . . . . . . . . . . . . . . . . . . . . . . . . . . . . . . . . . . . . . . . . . . . . . . . . . . . . . . . . . . . . .
. . . . . . . . . . . . . . . . . . . . . . . . . . . . . . . . . . . . . . . . . . . . . . . . . . . . . . . . . . . . . . . . . . . . . . . . . . . . . . . . . . . . . . . . . . . . . . . . . . . . . . . . . . . . . . . . . . . . . . . . . . . . . . . . . . . . . . . . . . . . . . . . . . . . . . . . . . . . .
. . . . . . . . . . . . . . . . . . . . . . . . . . . . . . . . . . . . . . . . . . . . . . . . . . . . . . . . . . . . . . . . . . . . . . . . . . . . . . . . . . . . . . . . . . . . . . . . . . . . . . . . . . . . . . . . . . . . . . . . . . . . . . . . . . . . . . . . . . . . . . . . . . . . . . . . . . . . .
. . . . . . . . . . . . . . . . . . . . . . . . . . . . . . . . . . . . . . . . . . . . . . . . . . . . . . . . .
iv. What are the disadvantages associated with this option? . . . . . . . . . . . . . . . . . . . . . . . . . . . . . . . . . . . . . . . . . . . . . . . . . . . . . . . . . . . . . . . . . . . . . . . . . . . . . . . . . . . . . . . . . . . . . . . . . . . . . . . . . . . . . . . . . . . . . . . . . . . . . . . . . . . . . . . . . . . . . . . . . . . . . . . . . . . . .. . . . . . . . . . . . . . . . . . . . . . . . . . . . . . . . . . . . . . . . . . . . . . . . . . . . . . . . . . . . . . . . . . . . . . . . . . . . . . . . . . . . . . . . . . . . . . . . . . . . . . . . . . . . . . . . . . . . . . . . . . . . . . . . . . . . . . . . . . . . . . . . . . . . . . . . . . . . .. . . . . . . . . . . . . . . . . . . . . . . . . . . . . . . . . . . . . . . . . . . . . . . . . . . . . . . . . . . . . . . . . . . . . . . . . . . . . . . . . . . . . . . . . . . . . . . . . . . . . . . . . . . . . . . . . . . . . . . . . . . . . . . . . . . . . . . . . . . . . . . . . . . . . . . . . . . . .. . . . . . . . . . . . . . . . . . . . . . . . . . . . . . . . . . . . . . . . . . . . . . . . . . . . . . . . . . . . . . . . . . . . . . . . . . . . . . . . . . . . . . . . . . . . . . . . . . . . . . . . . . . . . . . . . . . . . . . . . . . . . . . . . . . . . . . . . . . . . . . . . . . . . . . . . . . . .. . . . . . . . . . . . . . . . . . . . . . . . . . . . . . . . . . . . . . . . . . . . . . . . . . . . . . . . . . . . . . . . . . . . . . . . . . . . . . . . . . . . . . . . . . . . . . . . . . . . . . . . . . . . . . . . . . . . . . . . . . . . . . . . . . . . . . . . . . . . . . . . . . . . . . . . . . . . .. . . . . . . . . . . . . . . . . . . . . . . . . . . . . . . . . . . . . . . . . . . . . . . . . . . . . . . . . . . . . . . . . . . . . . . . . . . . . . . . . . . . . . . . . . . . . . . . . . . . . . . . . . . . . . . . . . . . . . . . . . . . . . . . . . . . . . . . . . .
v. What can be done to improve efficiency of such fertilizer input schemes?………………………………………………………………………………………………………………………………………………………………………………………………………………………………………………………………………………………………………………………………………………………………………………………………………………………………
2.8. i. Highlight on the bureaucratic procedure associated with making own fertilizer purchases from the market?

131
………………………………………………………………………………………………………………………………………………………………………………………………………………………………………………………………………………………………………………………………………………………………………………………………………………………………………………
ii. What are some of the costs associated with the process of purchasing own fertilizer from the market? . . . . . . . . . . . . . . . . . . . . . . . . . . . . . . . . . . . . . . . . . . . . . . . . . . . . . . . . . . . . . . . . . . . . . . . . . . . . . . . . . . . . . . . . . . . . . . . . . . . . . . . . . . . . . . . . . . . . . . . . . . . . . . . . . . . . . . . . . . . . . . . . . . . . . . . . . . . . .. . . . . . . . . . . . . . . . . . . . . . . . . . . . . . . . . . . . . . . . . . . . . . . . . . . . . . . . . . . . . . . . . . . . . . . . . . . . . . . . . . . . . . . . . . . . . . . . . . . . . . . . . . . . . . . . . . . . . . . . . . . . . . . . . . . . . . . . . . . . . . . . . . . . . . . . . . . . .. . . . . . . . . . . . . . . . . . . . . . . . . . . . . . . . . . . . . . . . . . . . . . . . . . . . . . . . . . . . . . . . . . . . . . . . . . . . . . . . . .
i ii. What are the advantages of banking on this option? . . . . . . . . . . . . . . . . . . . . . . . . . . . . . . . . . . . . . . . . . . . . . . . . . . . . . . . . . . . . . . . . . . . . . . . . . . . . . . . . . . . . . . . . . . . . . . . . . . . . . . . . . . . . . . . . . . . . . . . . . . . . . . . . . . . . . . . . . . . . . . . . . . . . . . . . . . . . .. . . . . . . . . . . . . . . . . . . . . . . . . . . . . . . . . . . . . . . . . . . . . . . . . . . . . . . . . . . . . . . . . . . . . . . . . . . . . . . . . . . . . . . . . . . . . . . . . . . . . . . . . . . . . . . . . . . . . . . . . . . . . . . . . . . . . . . . . . . . . . . . . . . . . . . . . . . . .. . . . . . . . . . . . . . . . . . . . . . . . . . . . . . . . . . . . . . . . . . . . . . . . . . . . . . . . . . . . . . . . . . . . . . . . . . . . . . . . . . . . . . . . . . . . . . . . . . . . . . . . . . . . . . . . . . . . . . . . . . . . . . . . . . . . . . . . . . . . . . . . . . . . . . . . . . . . .
iv. What are the disadvantages associated with this channel? .... . . . . . . . . . . . . . . . . . . . . . . . . . . . . . . . . . . . . . . . . . . . . . . . . . . . . . . . . . . . . . . . . . . . . . . . . . . . . . . . . . . . . . . . . . . . . . . . . . . . . . . . . . . . . . . . . . . . . . . . . . . . . . . . . . . . . .. . . . . . . . . . . . . . . . . . . . . . . . . . . . . . . . . . . . . . . . . . . . . . . . . . . . . . . . . . . . . . . . . . . . . . . . . . . . . . . . . . . . . . . . . . . . . . . . . . . . . . . . . . . . . . . . . . . . . . . . . . . . . . . . . . . . . . . . .. . . . . . . . . . . . . . . . . . . . . . . . . . . . . . . . . . . . . . . . . . . . . . . . . . . . . . . . . . . . . . . . . . . . . . .
v. What can be done to improve efficiency along this option? . . . . . . . . . . . . . . . . . . . . . . . . . . . . . . . . . . . . . . . . . . . . . . . . . . . . . . . . . . . . . . . . . . . . . . . . . . . . . . . . . . . . . . . . . . . . . . . . . . . . . . . . . . . . . . . . . . . . . . . . . . . . . . . . . . . . . . . . . . . . . . . . . . . . . . . . . . . . .. . . . . . . . . . . . . . . . . . . . . . . . . . . . . . . . . . . . . . . . . . . . . . . . . . . . . . . . . . . . . . . . . . . . . . . . . . . . . . . . . . . . . . . . . . . . . . . . . . . . . . . . . . . . . . . . . . . . . . . . . . . . . . . . . . . . . . . . . . . . . . . . . . . . . . . . . . . . .. . . . . . . . . . . . . . . . . . . . . . . . . . . . . . . . . . . . . . . . . . . . . . . . . . . . . . . . . . . . . . . . . . . . . . . . . . . . . . . . . . . . . . . . . . . . . . . . . . . . . . . . . . . . . . . . . . . . . . . . . . . . . . . . . . . . . . . . . . . . . . . . . . . . . . . . . . . . .. . . . . . . . . . . . . . . . . . . . . . . . . . . . . . . . . . . . . . . . . . . . . . . . . . . . . . . . .
2.9. i. Given the known advantages, disadvantages, benefits and costs, which channel of fertilizer flow do you prefer?
1=[Input schemes] 2=[free market] 3=[a combination]
ii. Give a reason to support your answer above
………………………………………………………………………………………………………………………………………………………………
……………………………………………………………………………………………………………………………………………………………
2.10. Generally, what are the policies, issues or programs which should be put to improve fertiliser use in
small-scale maize production for better yields?
........................................................................................................................................................................................................................
........................................................................................................................................................................................................................ 2.11. Fertilizer use in maize production in Zimbabwe has gone down when more should be applied due to
extensive nutrient depletion in most soils. What do you think are the major reasons for this?
………............................................................................................................................. .................................................................................
............................................................................................................................................................................... .........................................
3. Farmers decision making
3.1. Your decision to grow maize, is it influenced to an exten t by the producer price or some other factors?
1= [strongly by the price] 2 = [partially by the price and other factors ]
3= [not by the price but other factors ]
3.2. What sort of support and services do you think the governm ent should concentrate on which will help you improve maize productivity? . . . . . . . . . . . . . . . . . . . . . . . . . . . . . . . . . . . . . . . . . . . . . . . . . . . . . . . . . . . . . . . . . . . . . . . . . . . . . . . . . . . . . . . . . . . . . . . . . . . . . . . . . . . . . . . . . . . . . . . . . . . . . . . . . . . . . . . . . . . . . . . . . . . . . . . . . . . . .

132
3.3. What are some of the factors affecting your production of maize?
……………………………………………………………………………………………………………………………