ORGANIC FARMING IN SIKKIM
56
ORGANIC FARMING IN SIKKIM: IMPLICATION FOR LIVELIHOOD DIVERSIFICATION AND COMMUNITY DEVELOPMENT BINOD CHETTRI DEPARTMENT OF ECONOMICS SCHOOL OF SOCIAL SCIENCES SIKKIM UNIVERSITY GANGTOK- 737102 SIKKIM, INDIA “THESIS SUBMITTED IN PARTIAL FULFILLMENT OF THE DEGREE OF MASTER OF PHILOSOPHY” FEBRUARY, 2015
-
Upload
khangminh22 -
Category
Documents
-
view
2 -
download
0
Transcript of ORGANIC FARMING IN SIKKIM

ORGANIC FARMING IN SIKKIM: IMPLICATION FOR LIVELIHOOD
DIVERSIFICATION AND COMMUNITY DEVELOPMENT
BINOD CHETTRI
DEPARTMENT OF ECONOMICS
SCHOOL OF SOCIAL SCIENCES
SIKKIM UNIVERSITY
GANGTOK- 737102
SIKKIM, INDIA
“THESIS SUBMITTED IN PARTIAL FULFILLMENT OF THE
DEGREE OF MASTER OF PHILOSOPHY”
FEBRUARY, 2015

DECLARATION
I declare that the thesis entitled “Organic Farming in Sikkim: Implication for Livelihood
Diversification and Community Development” submitted to Department of Economics,
Sikkim University for the degree of Master of Philosophy. The research work brings to the
light the results of an original investigation made by me and it is authentic in nature. The thesis
is work of my own and has not been submitted for any other degree of this University or any
other University.
Binod Chettri
Roll Number: 13MPEC03
We recommend this thesis to be placed before the examiners for evaluation.
Dr. Ruma Kundu Dr. Manesh Choubey
Supervisor Head of the Department
Department of Economics
Sikkim University
6th Mile, Samdur, Tadong
Gangtok, Sikkim-737102
CERTIFICATE
This is to certify that the thesis entitled “Organic Farming in Sikkim: Implication for
Livelihood Diversification and Community Development” submitted to Department of
Economics, Sikkim University in partial fulfillment of the requirements for the degree of
Master of Philosophy in Economics, embodies the result of bona fide research work carried
out by Mr. Binod Chettri under my guidance and supervision. He has fulfilled the
requirements relating to the nature, period of research and presentation of seminar talk etc.
It is also being certified that the research work brings to the light the results of an original
investigation made by Mr. Binod Chettri and no part of the thesis has been submitted for
any degree, diploma, associate-ship and fellowship.
Dr. Ruma Kundu
Supervisor
Department of Economics
Sikkim University
6th Mile, Samdur, Tadong
Gangtok, Sikkim- 737102

ACKNOWLEDGEMENT
During the course of investigation I gained a life changing experience that somehow enriched me as a person. Now, I would like to express my gratitude to the people without whom this dissertation would never have completed.
Mere words can never suffice to express the sense of my indebtedness and heartfelt adoration to my Supervisor of Advisory Committee Dr. Ruma Kundu, Assistant Professor, Department of Economics, Sikkim University, for her invaluable and ceaseless guidance, precious counsel, profuse help, sustained interest and constant encouragement throughout the course of investigation and constructive critics during the preparation of manuscript of the dissertation which can never be forgotten.
I extend my gratefulness towards Dr. Indraneel Mandal, Assistance Professor, IMS Unison University, Dehradun for his kind co-operation and stimulating suggestions during the course of my study.
I would like to convey my profound gratitude to Dr. Pradyut Guha, Assistant Professor of Economics Department, Sikkim University for his valuable guidance and support. My sincere thanks to the entire faculty staffs of the Department of Economics, Sikkim University for their good wishes for the completion of dissertation.
I feel exhilarated by expressing my profound gratitude to Mr. N. Mollah, Senior Lecturer in Vinayaka Mission Sikkim University for his kind assist and continuous efforts in operating software used in the dissertation.
I would also like to extend my great thanks to Central Library and their staffs of Sikkim University for providing books, journals and internet services, which enhance in preparing the dissertation.
In omega, I cannot but admit that my words fail to express my cordial love and gratitude to my beloved Baba, Aama, Baini, and other family members for their never-ending encouragement during my study.
Sincere thanks to my friends (Kul Bhadur Chettri and Manjeel Rai) for their valuable suggestions, co-operation and encouragement during my study. Last but not the least I would also like to express my gratitude and appreciation to all those who gave me the immense support in completion of this dissertation.
Place: Gangtok, Sikkim University Binod Chettri
Date:

Dedication…………
This dissertation is dedicated to my Baba (Father); Mr. Palman Chettri, Aama (Mother); Mrs. Ran Maya Chettri, Kaka (Uncle); Mr. Dhan Bhadhur Chettri and all other family members.

CONTENTS
Page No
Declaration
Certificate
Acknowledgements
CHAPTER 1 INTRODUCTION 1 - 6
1.1 Introductory view 1 - 3
1.2 Statement of the problem 4
1.3 Location of the study area 5
1.4 Brief objectives of the study 6
CHAPTER 2 REVIEW OF LITERATURE AND JUSTIFICATION OF THE
STUDY 7 – 14
2.1 Brief Literature on Organic Farming 7 – 12
2.2 Research Gap and Justification of the study 13
2.3 Plan of the Work 14
CHAPTER 3 DATABASE AND METHODOLOGY 15 - 20
3.1 Sampling Design 15 - 16
3.2 Database related to Study 17
3.3 Methodology of the Study 18 - 20
CHAPTER 4 AN OVERVIEW OF THE STUDY AREA 21 - 23
4.1 Descriptions of the study area of the North District of Sikkim 22
4.2 Descriptions of the study area of the South District of Sikkim 23
4.3 Descriptions of the study area of the East District of Sikkim 23
4.4 Descriptions of the study area of the West District of Sikkim 23

CHAPTER 5 RESULTS AND DISCUSSIONS 24 - 37
5.1 Description of the Variables 24
5.2 Descriptive Statistics of the Variables 25 - 26
5.3 Results and Analysis of Socio- Economic Conditions of the
Respondent of the Study Area in terms of Gini- Coefficient 27
5.4 Results and Analysis of Standard Normal Test Statistic for investigating the
the Economic conditions of those participating in group-based
organic Farming Activities before and after joining the group. 28 - 31
5.5 Results and Analysis of the Livelihood Diversification through HH Index.
Index 32 - 33
5.6 Results and Analysis of the Effect of the Diverse Variables
on the Per Capita Income of Households through Multiple
Regression Analysis 34 - 35
5.7 Results and Analysis of the means and variances of
household Diversification across villages through ANOVA 36 - 37
CHAPTER 6 COMPARATIVE DISCUSSIONS OF THE ANALYSIS 38 - 40
6.1 Comparative Study to measure the Income Inequality among the East, West,
North and West, North and South District by Gini Coefficient 38
6.2 Comparative Study among the East, West, North and South
District by Multiple Regression Model 39
6.3 Comparative Study among East, West, North and South District by applying
Applying ANNOVA 40

CHAPTER 7 CONCLUSIVE OBSERVATIONS AND POLICY
PRESCRIPTIONS 41 - 43
7.1 Concluding Observations 41 - 42
7.2 Policy Prescriptions 43
Bibliography

LIST OF ABBREVIATIONS USED IN THE STUDY
et al., `et alii' (masculine plural) or `et aliae' (feminine plural) meaning: and others
IFOAM International Federation of Organic Agriculture Movements
Mt Million Tones
APEDA Agricultural and Processed Food Products Export Development Authority
Mha Million Hectares
SGDP State Gross Domestic Product
Mt Mount
USDA United State Department of Agriculture
FAO Food and Agriculture Organisation
WTP Willingness to Pay
SHGs Self Help Groups
NGO Non Governmental Organisation
ICAR Indian Council of Agricultural Research
HH Hirchman-Herfindahl
WM Working Members
AAGE Average age of the family
ANNOVA Analysis of variance
OLS Ordinary Least Square
Km kilo meter
MGNREGS Mahatma Gandhi National Rural Employment Guarantee Scheme
Etc et cetera
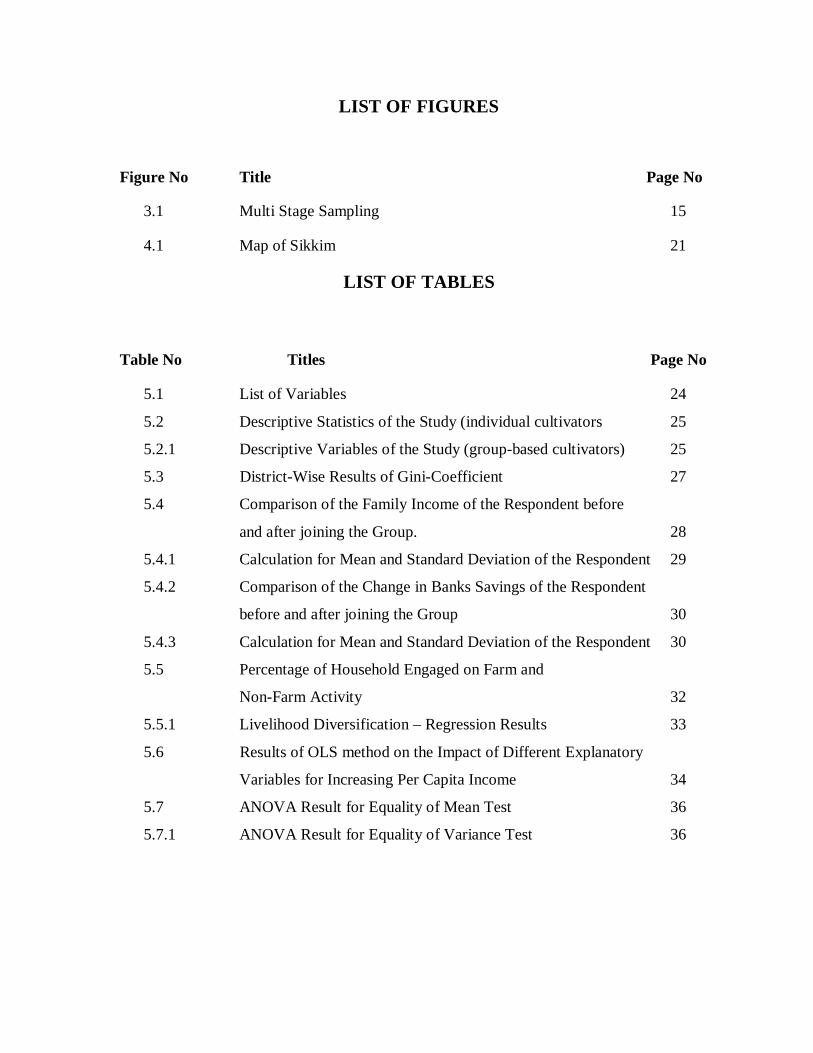
LIST OF FIGURES
Figure No Title Page No
3.1 Multi Stage Sampling 15
4.1 Map of Sikkim 21
LIST OF TABLES
Table No Titles Page No
5.1 List of Variables 24
5.2 Descriptive Statistics of the Study (individual cultivators 25
5.2.1 Descriptive Variables of the Study (group-based cultivators) 25
5.3 District-Wise Results of Gini-Coefficient 27
5.4 Comparison of the Family Income of the Respondent before
and after joining the Group. 28
5.4.1 Calculation for Mean and Standard Deviation of the Respondent 29
5.4.2 Comparison of the Change in Banks Savings of the Respondent
before and after joining the Group 30
5.4.3 Calculation for Mean and Standard Deviation of the Respondent 30
5.5 Percentage of Household Engaged on Farm and
Non-Farm Activity 32
5.5.1 Livelihood Diversification – Regression Results 33
5.6 Results of OLS method on the Impact of Different Explanatory
Variables for Increasing Per Capita Income 34
5.7 ANOVA Result for Equality of Mean Test 36
5.7.1 ANOVA Result for Equality of Variance Test 36

1
CHAPTER 1
INTRODUCTION
1.1 Introductory View
Organic farming is a system of agriculture that promotes working in harmony with nature rather
than against it. This involves using techniques aimed at achieving good crop yields without
harming the natural environment or the people who live and work in it. The technique of organic
farming is still gaining in popularity in India. It has mainly evolved in the developed countries of
the west and has been positioned as an alternative to conventional methods of agriculture.
One of the reasons for the popularity of organic farming is that it preserves the health of soil,
ecosystem and people. The term ‘organic’ is best thought of as referring not to the type of inputs used, but to the
concept of the farm as an organism, in which all the components — the soil minerals, organic
matter, microorganisms, insects, plants, animals and humans — interact to create a coherent,
self-regulating and stable whole. Reliance on external inputs, whether chemical or organic, is
reduced as far as possible. (Lampkin et al.1999). Organic agriculture includes all agricultural systems that promote the environmentally, socially
and economically sound production of food and s. These systems take local soil fertility as a key
to successful production. By respecting the natural capacity of plants, animals and the landscape,
it aims to optimise quality in all aspects of agriculture and the environment. Organic agriculture
dramatically reduces external inputs by refraining from the use of chemo-synthetic fertilisers,
pesticides, and pharmaceuticals. Instead it allows the powerful laws of nature to increase both
agricultural yields and disease resistance. Organic agriculture adheres to globally accepted
principles, which are implemented within local social-economic, climatic and cultural settings.
As a logical consequence, the International Federation of Organic Agriculture Movements
(IFOAM) stresses and supports the development of self-supporting systems on local and regional
levels. (IFOAM, 2000). Organic farming is gradually gaining in popularity as a movement across the world. The growing
awareness of health and environmental issues in agriculture has led to the demand for production

2
of organic food which is emerging as an attractive source of income generation. (Sukla et al
2013).
Organic agriculture is now being practiced in more than 130 countries with a total area of 30.4
million hectares, about 0.65% of the total agricultural land of the world (Willer et al., 2008).
With respect to the area under organic agriculture, Australia occupies the prime position
followed by China, Argentina, USA, Italy and many other countries (Willer et al., 2008). Organic farming in the Indian rural economy can be leveraged to mitigate the ever increasing
problem of food security in India. Rapid industrialisation of the states of India has brought about
a scarcity of farmland. Currently, India ranks 10th among the top ten countries in terms of
cultivable land under organic certification. The certified area includes 10% cultivable area with
0.50 million hectares and rest 90% (4.71 million hectare) is forest and wild area for collection of
minor forest produces. The total area under organic certification is 5.21 million hectare (APEDA,
2013). India produced around 1.34 million mt of certified organic products which includes all
varieties of food products namely sugarcane, cotton, basmati rice, pulses, tea, spices, coffee, oil
seeds, fruits and their value added products. The production is not limited to the edible sector but
also produces organic cotton fibres, functional food products etc (APEDA, 2013). Among all the
states, Madhya Pradesh has the largest area under organic certification followed by Rajasthan
and Uttar Pradesh. In terms of area Madhya Pradesh has highest area under organic farming (1.1
mha or 52%), Maharashtra is second (0.96 mha or 33.6%) and Orissa ranks third (0.67 mha or
9.7%) while Uttrakhand and Sikkim are organic States. Organic farming has been used by the farming community of the state of Sikkim for a long time.
But in due course of time as chemical fertilisers and pesticides were utilised for the supply of
plant nutrients and control of diseases the noble practice slowly started fading and chemicals
took over in certain crops over a period of time. Still the consumption of synthetic fertilisers and
pesticides was very low compared to the other states of India and far below the national average.
Many of the crops have never encountered chemicals and have been growing on the strength of
organic inputs. This would certainly make it easier for the organic movement to take root here.
The green revolution was launched in India in the early seventies bringing about increased
chemical use leading to enhanced production and productivity of crops under irrigated
agriculture. But in a mountainous state like Sikkim as well as other north eastern states where

3
agriculture is basically rain fed, the chemical use did not have significant impact on production
and productivity.
Sikkim, which is endowed with climatic conditions favourable for the production of fruits,
flowers and certain other crops, has been currently adapting the technique of organic farming for
more than a decade. The state is now moving towards the organic mission by producing such
crops with high demand in both domestic as well as foreign markets, such as cardamom, ginger,
oranges, medicinal plants, etc. As of 2010 almost 60% of the total cultivable land had been
brought under organic farming. The total area under organic certification in case of Sikkim was
1,391.04 hectare. The total area under certified organic cultivation of the state was 1,726.34
hectares and the total organic production was 5174.44 tonnes (Yadav 2012). The contribution of
the agricultural sector to the state gross domestic product (SGDP) was 7.4 percent (according to
the Central Statistical Organisation) during 2012-2013. The use of chemical fertilisers and
pesticides was completely withdrawn in the state after 2003 and the state government advocated
the idea of making Sikkim an organic state. The Government of Sikkim has already set up a
broad target of making the state largely organic by 2015. The cultivators have been encouraged
to use bio-fertilisers for their farming activities. The practitioners are mostly supported by the
government through the provision of different kinds of training relating to farming practices
along with the provision of costly input materials for free for almost all the practitioners at the
initial level. In spite of these developments a certain amount of reluctance has been observed
among the farming community regarding the adoption of organic farming in Sikkim. One of the
reasons for this could be that in contrast to conventional agriculture, the expected benefits from
organic farming are not immediately obvious. This could result in the practitioners moving
towards alternative forms of agriculture, which in turn could be counterproductive for the state in
the long run.

4
1.2 Statement of the Problem
The Indian economy is mainly dominated by the agricultural sector, where agriculture
contributes about 14.6 percent in gross domestic product (GDP) and support over 58 percent of
nation’s population for livelihood (GOI, 2010). Although India holds the second position with
respect to total number of certified organic farms (44,926), it has the 13th position as far as the
area under organic agriculture is concerned. In India, about 528,171 hectares of area is under
organic agriculture (including certified and area under organic conversion) accounting for about
0.3% of total agricultural land. Despite of the economic boom in the last few decades, India is also witnessing some of
important and interrelated issues in the agriculture sector such as increasing food production in
the face of continuously shrinking land resources, rapid degradation of land, size of land holding
and water resources and environmental and health related issues. The growth of organic farming in India is relatively slower and there are a number of constraints
impeding Indian farmers - especially small farm holders - from adopting organic farming.
(Pandey and Singh, 2012). The state of Sikkim with a favourable climatic condition has been adapting to the technique of
organic farming for more than a decade. The state is now moving towards the organic mission by
producing crops like cardamom, ginger, oranges, medicinal plants, etc. As of 2010 almost 60%
of the total cultivable land had been brought under organic farming. The total area under organic
certification in Sikkim was 1,391.04 hectares. The total area under certified organic cultivation in
the state was 1,726.34 hectare while the total organic production was 5174.44 tones. (Yadav
2012). The contribution of the agricultural sector to the state gross domestic product (SGDP)
was 7.4 percent (according to the Central Statistical Organisation) during 2012-2013. Among the problems facing organic farming in Sikkim, The non-availability of sufficient
amount of organic supplements, bio-fertilisers and a local market for organic produce, lack of
access to guidelines and size of land holding could be considered as the main constraints for the
growth and development of organic farming in the state. Additionally low participation of the
total workforce in such farming practices, better alternatives as employment opportunities,
difficult geographical area and insufficient infrastructure facilities for promoting or enhancing
organic products, can also be mentioned in this regard.

5
1.3 Location of the Study Area
The study areas for the present work comprised of the following locations:
(i) Sajung and Assam Lingzey, situated near Gangtok, the capital of East district as well as the
state. East Sikkim occupies the south-east corner of the state. The district is surrounded by steep
hills, valleys and slopes. It is the hub of all administrative activity in the state. The village of
Sajung is just 2 kilometres away from the Rumtek monastery, one of the most popular tourist
destinations of the state.
(ii) Mukrung and Bega are located in western part of Sikkim, near the snow-capped mighty
Kanchenjunga. The highlights of West Sikkim are the amazing Himalayan treks in the foothills
of Mt Kanchenjunga. It serves as a base for all treks into the Himalayas. The study area falls
under Gyalshing, the district headquarters, under Maneybung constituency.
(iii) Singhik and Upper Dzongu are located in the North district of the state. The district is the
largest among the four districts of Sikkim. The landscape is mountainous with dense vegetation
all the way up to the alpine altitudes. The study was conducted mostly in the villages
surrounding the district headquarters of Mangan. One of the study areas at Singhik is situated at
a distance of four kilometers from Mangan.
(iv) Chalamthang and Kitam are situated in the South district of Sikkim. This is the most
industrialised district in the state, owing to the availability of flat land. The district is also famous
for its Sikkim Tea, which is grown at Temi Tarku near Namchi, the district headquarters.

6
1.4 Brief Objectives of the Study
The broad objective of the study is to examine the implications for livelihood diversification and
community development in the context of the organic farming initiative in Sikkim. The specific
objectives can be formulated as follows:
a) To examine extent of livelihood diversification generated by the pursuit of organic agriculture
and the associated tradeoffs in Sikkim.
b) To analyse whether organic farming is acting as a means for sustainable livelihood.
c) To investigate whether the facilities provided by the government for organic farming are being
utilised effectively by the people of Sikkim.
d) To examine whether the community based organic farming is enhancing the socio-economic
status of cultivators.

7
CHAPTER 2
A BRIEF SURVEY OF THE EXISTING LITERATURE AND JUSTIFICATION OF THE STUDY
2.1 Brief Literature on Organic Farming
As per the definition of the United State Department of Agriculture (USDA) study team on
organic farming “organic farming is a system which avoids or largely excludes the use of
synthetic inputs (such as fertilizers, pesticides, hormones, feed additives etc) and to the
maximum extent feasible relies upon crop rotations, crop residues, animal manures, off-farm
organic waste, mineral grade rock additives and the biological system of nutrient mobilisation
and plant protection”. The technical and quality standards are important aspects of organic farming methods, a broader
perspective is necessary to grasp yet another fundamental feature. Organic farming is a different
approach to agriculture, a holistic management system of agricultural production (FAO, 1999). Van Mansvelt et al (1993) argue that the potentials of organic types of agriculture make them
valuable options for a sustainable agriculture and rural development. This obvious connection
between organic farming and sustainable rural development has been progressively
acknowledged. Author found that for sustainable livelihood organic farming would be the best
option and consider way to adopt for rural development. According to the Codex Alimentarius Commission (FAO, 2001), “organic agriculture is a
holistic production management system that avoids use of synthetic fertilizers, pesticides and
genetically modified organisms, minimizes pollution of air, soil and water, and optimizes the
health and productivity of interdependent communities of plants, animals and people”. To
meet these objectives, the commission suggests that organic cultivators need to implement a
series of practices that optimise nutrient and energy flows and minimise risk, such as: crop
rotations and enhanced crop diversity; different combinations of livestock and plants;
symbiotic nitrogen fixation with legumes; application of organic manure; and biological
pest control. Pugliese (2001) explains the spreading of organic farming methods and initiatives of sustainable
rural development are both crucial processes underway in many agricultural areas. It is suggested

8
that organic farming systems can effectively contribute the basic aspects of sustainable rural
development, i.e. innovation, conservation, participation, and integration. Piyasiri and Ariyawardana (2002) reveal that most of the consumers are aware of organic
products and this awareness has influenced their consumption of organic products in the past.
Further, a majority of the consumers considered price as an important factor for their organic
product consumption and have attached a higher importance for certification from a reputed
organization. Consumers also indicated that organic products should be sold in easily accessible
shops for the convenience of purchasing. Results of the regression analysis revealed that of the
socio-demographic factors, income, environmental education and years of education
significantly influence the willingness to pay for organic vegetables. Sumner (2005) reported that organic farmers directly engage with their rural communities and
promote rural development by making a wide range of economic, social and environmental
contributions. Economically, they contribute to their local communities by directly selling to
local businesses as well as family friends, other farmers and a range of customers through farm-
gate, farm-store or produce-stand sales and community-supported agriculture projects. Bhattacharyya and Chakraborty (2005) mention that, rapid population growth may be consider as
a main reason behind for the food and nutritional security problem of the world. The author
suggested neither conventional farming with inorganic alone nor organic farming only with the
use organic input can face this challenge. The combination of organic and inorganic is
undoubtedly the best option as on today unless the existing dietary system is changed. Singh and Mathur (2006) carried out a study relating to developing countries, where a majority
of families derive their livelihoods from agriculture. According to the authors sustainable
agriculture cannot be discussed in isolation from sustainable rural livelihood. Sustainable rural
livelihood is a multifaceted concept and refers to the maintenance or enhancement of access of
rural families to food and income-generating activities on a long-term basis. It encompasses
secured ownership of, or access to resources, assets and income-earning activities to offset risks,
ease shocks and meet contingencies. In the Indian context, where average farm-size is very
small, and poverty and food-security continue to be preponderant among small landholders; the
notion of sustainable agriculture ought to be viewed in the context of need for enhancement of

9
productivity, production and profitability of agriculture and above all, improvement in the
economic conditions of farmers. Xia and Zeng (2008) have attempted to analyse the consumer’s willingness to pay (WTP) for
organic food, and they have successfully found that the younger people who are aged between
16-30 years-old and older people who are over 50 years old tend to be willing to pay more for
organic food. Again it was found that the higher the proportion of female respondents, the
smaller the average WTP. Griffith and Nesheim (2008) have highlighted the relationship between the organic products and
the consumer’s willingness to pay in the United Kingdom and they have shown that the reasons
those households being willing to pay for organic product differ, with quality being the most
important, health concerns coming second, and environmental concerns lagging far behind. Muller (2009) has carried out a study on the benefits of organic agriculture as a climate change
adaptation and mitigation strategy for developing countries. His conclusion is that in the current
situation, access to and increased development of (local) markets for the products, local
processing possibilities, and export infrastructure are of particular importance for organic
agriculture. For this the role of international institutions and trade policies (World Trade
Organisation, Food and Agriculture Organisation, United Nations Development Program, United
Nations Environmental Program, etc.) has to be discussed. The institutional environment for
organic agriculture as an adaptation and mitigation strategy also needs to be identified on a
global level. Knowledge transfer has to be institutionalised. There is a wealth of knowledge
available on organic agriculture, especially in the north (e.g., in various EU countries). Clearly,
this knowledge is tied to specific climatic circumstances and cannot be transferred to other
regions without due caution and modification. Reddy (2010) has been argued that Organic agriculture has been neglected in the agricultural
policy, and therefore there is less government assistance for the promotion of organic agriculture,
as it exists for the conventional agriculture in the form of subsidies, agricultural extension
services and official research. He mention that by Giving proper encouragement, organic
farming will progress tremendously in India, especially in the dry land regions of the country,
taking advantage of the diverse soil and climatic conditions.

10
Charyulu and Subho (2010) have contributed a study where they have tried to highlight issues
like the problem of sustainability, global warming and food security. They found that in India
several forms of organic farming are being successfully practiced in diverse climates,
particularly in the rain fed, tribal, mountainous and hill areas of the country. The organic land
area has increased substantially between 2005 and 2006 and is now more than 500,000 hectares.
The Indian government has acquired both the USDA (United State Department of Agriculture)
equivalence for the NOP (National Organic Programme) and the EU third country listing in
2006. India produced around 3,96,997 MT (as of 2007-08) of certified organic products which
includes all varieties of food products namely basmati rice, pulses, honey, tea, spices, coffee, oil
seeds, fruits, processed food, cereals, herbal medicines and their value added products. Singh and Grover (2011) have dealt with economic viability of organic farming on an empirical
experience of wheat cultivation in Punjab. The study touches on the major issues of organic
farming like area of production, total variable cost per acre and net returns of organic as well as
inorganic cultivation. The study has revealed that the major share of organic area was dominated
by wheat crop (about 15%) and the total variable cost on per acre for organic wheat cultivation
has been found to be less compared to inorganic wheat. Simultaneously, the net returns over
variable cost have been found to be higher for organic wheat (Rs.21895/acre) compared to the
inorganic variety (Rs. 16700/acre). Datta and Sing (2011) have worked on the issue of the recent evolution of the concept of
livelihood diversification in developing countries in general and India in particular. They have
found that the diversification is basically governed by the extent of alternative non-farm
opportunity in the neighbourhood, socio-economic features of villages, and their access to credit,
assets and government benefit schemes. Subrahmanyeswari and Chander (2011) have carried out a study to examine the possibility of
using organic agriculture as a tool for achieving gender equality in India. The authors have
interviewed around 200 respondents in Uttarkhand and they found that the state government has
been encouraging women’s participation on a formal basis. They have also indicated the need for
further studies in order to compare conventional and organic systems on the basis of gender of
the practitioners.

11
Aher et al. (2012) have illustrated how organic agriculture plays a role in the sustainable
utilisation of resources in food production as well as contribution to reducing pollution and
ultimately to the climate change. Their reviews show that the agricultural yields in all the studies
almost remain equivalent to, and in many cases better than conventional farming practices. In
some, an overall lower yield also reported but the economy still performed better than in case
of conventional agriculture practices due to the lower external inputs. In addition to
improved yield, organic practices result in higher organic matter in soil, lower energy
consumption, and lower use of external inputs, better food quality, and also have the potential to
address global issues like climate change. Kundu (2012) was involved study on self- help groups (SHGs) and women empowerment. The
author found that the participation of women in different socio-economic activities based on the
self help group model has resulted in a distinct improvement in their respective status.
Consequently there has been a definite empowerment of women as they have gained a measure
of economic independence with better control over available local resources for their sustainable
livelihood. Pandey and Singh (2012) have worked on issues related to organic farming of the Indian
agriculture sector and they found that, the growth of such type of farming is relatively slower.
Despite of this there are a number of constrain has been seen especially to small farm holder
adopting organic farming. The non availability of sufficient amount of organic supplements, bio
fertilizers and local market for organic produce could be considers as the main constraints of
organic farming in India. Gupta (2013) has carried out the study relating to Horticulture and organic farming. The author
highlighted the issues regarding the performance of organic farming in the State of Madhya
Pradesh, India. The study shows that the state is producing main organic crops by increasing
total area under organic cultivation and it also shown that horticulture is the fastest growing
sector in agriculture in the state. Even though, the development of agriculture is still a critical
factor in the overall performance of the state. The state requires chemical free, low cost
product/method and horticulture production and improvement in education of farmers to enhance
the productivity.

12
Sukla et al. (2013) have worked on the current status of organic farming in India and they have
found that such farming can contribute to sustainable food security by improving nutrition
intake, supporting livelihoods in rural areas and enhancing biodiversity, and also reduce
vulnerability to climate change. They also concluded that, on an average organic farming would
sustain 30 percent higher biodiversity than conventional farming.
Siddaraju and Indira (2013) contributed the study where they have tried to highlight economic
performance of organic and modern agriculture. They found that the performance of organic
agriculture was more economically profitable comparing with the modern agricultural system
and the income generated from organic agriculture is greater than that of modern agriculture. Archana (2013) has carried out the study on the role of Indian Government for the development
of organic agriculture. The author argued that, for enhancing organic agriculture government
interference is much needed in Indian Agricultural sector particularly in organic farming. By
providing more subsidies and providing knowledge based on adverse effects of chemical based
agriculture sector, organic agriculture can be encouraged.

13
2.2 Research Gap and Justification of the Study
Organic farming is a practice that has been historically favoured by the farming community in
the state of Sikkim. However in the course of time chemical fertilisers and pesticides replaced
organic nutrients.
With reference to the literature on Sikkim it consists of descriptive work with hardly any
exploratory efforts. If contemporary issues like community development and sustainable
livelihood are taken into consideration, research on organic agriculture in the state would be
beneficial at the national level in general and Sikkim in particular.
However, organic farming being a very recent phenomenon in developing countries likes India,
it can be expected that with time we shall be witness much more in depth efforts in this direction.
The present study could be beneficial for both policy makers as well as cultivators for the
development of organic farming and sustainable livelihood practices in Sikkim. The study deals
with concepts like sustainable livelihood and livelihood diversification. It also looks into the
socio-economic status of different communities as well as the issue of empowerment of women.
Thus it could be beneficial for providing a more holistic view of organic agriculture as it is
carried out in the state of Sikkim.

14
2.3 Plan of the Work
Following are the plan of the work of our study
Chapter 1: Introductory view of Extramarital relationships. Chapter 2: A brief survey of Existing Literature, Research Gap and Justification of the Study. Chapter 3: Database and Methodology of the Study. Chapter 4: An Overview of the Study Area. Chapter 5: Results and Discussions. Chapter 6: Comparative Study among the Rural and Urban, Male and Female Respondents. Chapter 7: Concluding Observations and Policy Prescriptions.

15
CHAPTER 3
DATABASE AND METHODOLOGY
3.1 Sampling Design
The study was carried out in different villages across the four districts of Sikkim. Respondents
were chosen on the basis of both multistage and convenience sampling. The procedure of
multistage sampling involves several stages like first stage unit, second state unit, and third stage
unit and so on, until we reach the ultimate units.
1. State
(Sikkim)
2. Districts
Fig: 3.1 Stages of Multi-stage Sampling
As per the figure 3.1, we selected the four districts viz.,- East, West, North and South.
Thereafter the districts were divided into blocks which were further divided into villages. Finally
West North East
South
Block
Block
Block
Block
Village/Urban
Village/Urban
Village/Urban
Village/Urban
Ultimate Stage Unit

16
after selecting the ultimate stage units the samples from these units were collected on the basis of
both convenience as well as purposive sampling (for conducting the household survey). The
preferred sample size consists of 30 respondents each in two different villages spread across the
four districts of Sikkim and hence the total estimated sample size is around 260. The study also
considered group-based organic cultivators. The survey have covered 4 groups from East district,
1 from West District, 1 from South district and 1 from North district, which consist of total of 74
members. Out of the total group’s members across the four districts, the average number of
group member is 10.57.

17
3.2 Database related to Study
The primary data for this study was collected on the basis of pre-structured questionnaires
directed towards the stakeholders with regard to organic farming in Sikkim. Data was also
obtained through open ended but directed interviews. For the purpose of study detailed
information was collected from each of the surveyed households like size of family, average
educational qualification, average age of a family, gender, per capita income, expenditure, net
savings, experience, etc. Apart from this the data was collected on occupation, total income
earned from a diversity of occupations by the family members within a family, working
members within a family, utilisation of government facilities, types of land ownership, types of
productive activities, were also collected. In addition, various secondary sources like government
reports, agricultural databases, and institutional reports of NGOs, ICAR, etc, has been utilised for
the study.

18
3.3 Methodology of the Study
The analytical tools which have been used for the study is consists of the following components:
a) The Gini Coefficient the Gini coefficient is a measure of statistical dispersion intended to
represent the income distribution of a nation’s residents, and is the most commonly used of
measure of inequality. A value of zero expresses perfect equality while a value of one expresses
maximal inequality. The study employed the Gini-coefficient for the purpose of measuring the
income inequality among the organic product cultivators across the four districts of Sikkim. The
model for the Gini coefficient which we have consider for the study is given by
G=1/n2μ∑∑(xi-xj)fifj……xi>xj In case of a set of n values of X say x₁.,x2.,x₃…..,xn with frequencies f₁,f₂ ,f₃,…..,fn, where, is
the mean of the X values and x₁, x₂,……, xn are the per capita incomes of the respondents with
the corresponding frequencies f₁,f₂,……….,fn of the distribution.
b) Hirchman-Herfindahl (HH) Index
The HH Index was named after economists Orris C. Herfindahl and Albert O. Hirschman. It is
defined as the sum of squares of the market share; it can range from 0 to 1. To analyse the
household livelihood diversification of the sampled household of the four districts of Sikkim, we
have used inverse of Hirchman-Herfindahl (HH) Index in the form of 1/∑Aij2 where Aij represents
the summation of different activities for the ith household’s aggregate income. The index is then
regressed against the variables like total number of working members (WM), average age of the
family (AAGE), and the average educational qualification among the sampled households.
The HH index being a measure of concentration, its inverse would indicate contribution of the
different livelihood activities to total income the households1. The less the value of HH index
greater will be the diversification and vice versa. If the value of inverse index is one, this implies
that the total income is obtained from only one activity. But if the value is not equal to one this
means that the contribution to income is spread across different activities; in that case the
maximum value of index will be equal to the number of activities (Ellis, 2000).
1 Datta and Singh ; Livelihood Diversification: case study of backward regions in India, international journal of current research , 2011, pp. 139 -151.

19
The following model has been utilised for the purpose to know the household’s livelihood
diversification
HHi = α0 + α1 (WM)i + α2 (AAGF)i + α3 (EDN)i + εi............................(1)
Where HHi represent Herfindahl-Hirschman Index for Livelihood Diversification, WMi, AAGFi
and EDNi are number of working members, average age and educational qualification of the
individual household respectively. c) Regression analysis
Multiple regression analysis is proposed to be utilised for explaining the effect of diverse
variables on the household diversification indices. In the same way individual regression analysis
is to be used for the individuals within a family.
The equation for the regression is as follows;
Yi = β1 + β2 X2i + β3 X3i + ui
Where Y is per-capita income of the respondent, X2 represent educational qualification and X3 is
the total year of experience in particular occupation of the household, u is the stochastic
disturbance term, and the suffix i refer to the ith observation; in case of time series data the
subscript t will denote the tth observation. d) ANOVA is expected to come into the picture for the comparison of the means and variances
of household diversification across villages. e) Ordinary Least Squares Method
This method is used for studying the effect of variables like education, experience, government
facilities that are available for organic cultivation, etc on the per capita income of the individual
respondents as well as group-based farmers.
The equation of the OLS is as follows:
PCIi = β1 + β2 (EDN)i + β3 (EXPR)i + β4 (UGF)i + α1 Di + ui.................(2)
Where PCIi denotes per-capita income of the respondent, EDNi is average educational
qualification of the family, EXPRi represent total year of experience in particular occupation of
the household, Di is dummy in case of group based as well as individual growers. Where Di = 1
for utilisation of government facilities for both individual and group-based growers and Di = 0
for not utilisation of government facilities, ui is the stochastic disturbance term, and the suffix i
refer to the ith observation.

20
The OLS method has been used for looking into how organic farming leads to community
development as well as its contribution to the trust cohesion, social and human capital, etc.
f) Standard Normal Test Statistic (z Test)
This is proposed to be utilised for investigating the economic conditions of those
participating in group based organic farming activities before and after joining the group. In this
connection, aspects like utilisation of bank loans, households saving, etc. has been taken into
consideration.

21
CHAPTER 4
AN OVERVIEW OF THE STUDY AREA
Sikkim also known as Skhim or Su Khyim is a landlocked Indian state located in the Himalayan Mountains. The State is bordered by Nepal to the West, China’s Tibet Autonomous Region to the north and east, and Bhutan to the east. The Indian state of West Bengal lies to the south.2
Fig. 4.1: Map of Sikkim
2 “ Physical Features of Sikkim”, Department of Information and Public Relations, Government of Sikkim. 29 September 2005.

22
The state has four districts namely, East, West, North and South and the district headquarters are
Gangtok, Gyalshing, Mangan and Namchi respectively. These four districts are further divided
into subdivisions; Pakyong and Rongli are the subdivisions of East district; Soreng is the
subdivision of West district; Chungthang is the subdivision of North district and Ravongla is the
subdivision of South district.
The total population of Sikkim is 6,10,5773 covering an area of 7,096 km2. It is one of the least
populous states in India and the second-smallest state after Goa. The east district of state, with a
population size of 2,81,293 and a total area of 954 km2 is the most populous district having 257
people per km2 followed by the South district with a population size of 1,46,742 with a
population density of 750 people per km2 having the population density of 175/ km2. The least
populous district of Sikkim is considered to be the North district which has a population size of
43,354 covering an area of 4,226 km2 with a population density of 10 people per km2 followed by
the West district where the population size is 1,36,299 covering an area of 1,166 km2 and a
population density of 106/km2.The literacy rate of the state stands at 82.20 percent as per the
2011 census. The district-wise literacy rates are 84.67 per cent for the East district, 82.07 per
cent for the South district, 78.69 per cent for the West district and 77.39 per cent for the North
district.
4.1 The North District of Sikkim
The study area is located in the northern part of the state. It is the seventh least populous district
in the country with a population of 43,354 (FYP-2011). The total area of the district of North
Sikkim of Sikkim is 4226 sq km. The rate of literacy among the inhabitants of the district is
77.39 %.The district headquarters at Mangan is situated 65 kms away from the capital city of
Gangtok. The town is located at a height of 3950 feet. The important cash crop in this area is
cardamom. Other major crops cultivated here include corn and paddy. Apart from these crops,
vegetables like potato, apple and cabbage are also cultivated in these parts of North Sikkim. For
the purpose of collection of primary data on organic farming, the survey has been conducted at
Upper Singhik, Dzongu and its adjoining villages, which have identical features and well
structured villages in the north district.
3 According to 2011 population census

23
4.2 The South District of Sikkim
Primary data has been collected from Namchi (the district headquarters) and its surrounding
areas. It lies at an altitude of 400 to 2000 meters having temperate climate for most of the year.
The population size of 1,46,742 with the area of 750 km2 and a population density of 175/ km2.
The district is also known for being the most industrialised district in the state, owing to the
availability of flat land. The literacy rate of the district stands at 82.07 %. It is well known for
organic tea estate situated at Temi Tarku. The important cash crops of this area are ginger and
corn. Other major crops include green vegetables, orange and flowers are also cultivated in these
parts of the district. 4.3 The East District of Sikkim
The study areas in the East district consist of the district headquarters at Gangtok and its
adjoining areas. Being the capital of Sikkim, Gangtok is home to people of different ethnicities
such as Lepchas, Bhutias and Nepalis. Geographically, the East district occupies the south-east
corner of the state with a total area of 954 sq km a population size of 2,81,293. The literacy rate
stands at 84.67 %. The district has well developed villages where most of the people support the
organic mode of cultivation. It is well known as a tourist destination due to its unique culture and
a history of monasteries and traditional education. 4.4 The West District of Sikkim
The study has covered two villages situated at the periphery of the district headquarters at
Geyzing near the international boundary with Nepal. The total area of West Sikkim is 1,166 km2
with a population (as of 2011) of 1,36,299 and a literacy rate of 78.69 %. West Sikkim is well
known for housing Yuksom, the first capital of Sikkim. This place is the starting point of all
kinds of trekking and mountaineering activities towards the high ranges around Kanchenjunga.
Soreng is a one of the major towns of West Sikkim. It is a peaceful place which rich its linguistic
cultures and traditions, with people of all ethnicities living in peace and harmony. It is major
centre for politics, education, culture and commerce. The important cash crops of the districts are
corn and cardamom. Apart from these, vegetables like cabbage, cauliflower, potatoes, peanuts,
fruits and flowers are also cultivated in this part of the district.

24
CHAPTER 5
RESULTS AND DISCUSSIONS
5.1: Description of Variables
Table 5.1: list of Variables
Variable Name Description of the variables
1 PCI Per Capita Income of the Family
2 HHI Herfindahl-Hirschman Index for Livelihood Diversification
3 WM Numbers of Working Member in a Family
4 AAGF Average Age of the Family
5 EDN Average Educational Qualification of the Family
6 EXPR Experience of the Members of the Households in their Particular
Occupations
7 UGF Utilisation of Government Facilities for Organic Farming
8 Di Utilisation of Government Facilities for Organic Farming =1;
otherwise 0
9 LDN Livelihood Diversification of North District of Sikkim
10 LDS Livelihood Diversification of South District of Sikkim
11 LDE Livelihood Diversification of East District of Sikkim
12 LDW Livelihood Diversification of West District of Sikkim
The above table represents the various variables utilised for the purpose of foregoing study.
25
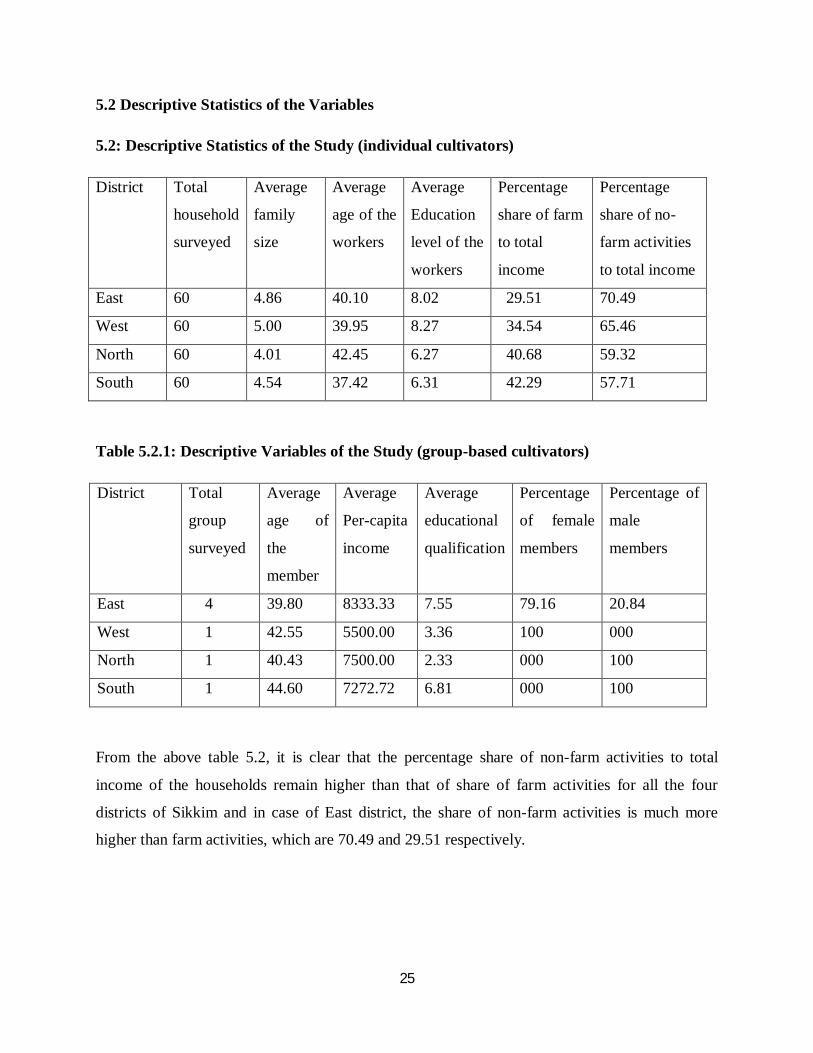
5.2 Descriptive Statistics of the Variables
5.2: Descriptive Statistics of the Study (individual cultivators)
District Total
household
surveyed
Average
family
size
Average
age of the
workers
Average
Education
level of the
workers
Percentage
share of farm
to total
income
Percentage
share of no-
farm activities
to total income
East 60 4.86 40.10 8.02 29.51 70.49
West 60 5.00 39.95 8.27 34.54 65.46
North 60 4.01 42.45 6.27 40.68 59.32
South 60 4.54 37.42 6.31 42.29 57.71
Table 5.2.1: Descriptive Variables of the Study (group-based cultivators)
District Total
group
surveyed
Average
age of
the
member
Average
Per-capita
income
Average
educational
qualification
Percentage
of female
members
Percentage of
male
members
East 4 39.80 8333.33 7.55 79.16 20.84
West 1 42.55 5500.00 3.36 100 000
North 1 40.43 7500.00 2.33 000 100
South 1 44.60 7272.72 6.81 000 100
From the above table 5.2, it is clear that the percentage share of non-farm activities to total
income of the households remain higher than that of share of farm activities for all the four
districts of Sikkim and in case of East district, the share of non-farm activities is much more
higher than farm activities, which are 70.49 and 29.51 respectively.

26
Again, from the table 5.2.1, we can conclude that after considering the group-based organic
cultivators, most of the groups are dominated by female participant or we can say that the female
members are much more interested to carry out those kinds of activities. In case of East district,
we have seen that most of the women participant were leading their groups and became more
successful to promote the organic farming. In other words community based organic farming is
more popular in East district of Sikkim.

27
5.3 Results and Analysis of Socio-Economic Conditions of the Respondents of the Study in
terms of Gini-Coefficient
Table 5.3: District-Wise Results of Gini-Coefficient
District Gini-Coefficient
East District 0.143
West District 0.177
North District 0.178
South District 0.158
Source: Author’s calculation
The economic well being of a family is a major element that affects many areas of the life of the
members, including how they view society and the world at large. Naturally it can be expected
that income of a family and hence its economic status will have an important bearing on their
attitude towards organic farming. Hence it would be pertinent to examine the extent of income
homogeneity among the respondents, as it can be reasonably assumed that those coming from
similar socio-economic backgrounds will harbour similar sentiments towards organic farming.
The Gini coefficient is the most appropriate tool for measuring income inequality. In the present
case the Gini coefficient has been used to evaluate the extent of income inequality among the
respondents from the different districts of Sikkim.
Table 5.3 reflects the value of Gini Coefficient of income inequality (G) among the respondents
from the four districts of Sikkim. A consideration of the value of G makes it clear that in terms of
the income inequality the four districts are quite similar to each other; this implies there is no
such strong income inequality between them. Furthermore, careful observation of the value of G
reveals that the income inequality is comparatively higher in the West and North districts of
Sikkim.

28
5.4 Results and Analysis the study of group-based organic farming activities using the
Standard Normal Test Statistic.
In order to examine the hypothesis that group based farming activities lead to better socio-
economic conditions for the participants, we considered changes in family income and savings
with the help of the z test.
5.4.1 Analysis of the Change in Family Income of the Respondents
In order to fulfill the basic necessities of life, people choose specific occupations based on their
interests, capabilities and education and accordingly make a living. Table 5.3.1 presents the
comparison between the family income before and after joining the group
Table 5.4: Comparison of the Family Income of the Respondent before and after joining the Group
Sl. No.
Monthly Income (In Rupees)
Before joining
After joining
1
0-5000
51 23
2
5000-10000 19 36
3
10000-15000 4 7
4
15000-20000 0 4
5
20000-25000 0 4
Total
74
74
Source: Primary data
Let the null hypothesis be that there is no significance difference in the average family income of
the respondent before and after joining the group, so that the alternative hypothesis is that the
mean family income of the respondent before joining the group is lower than that after joining
the group. This can be symbolically represented as
H0: µ1 = µ2 against alternative, i.e., H1: µ1’ < µ2’

29
Table 5.4.1: Calculation for Mean and Standard Deviation of the Respondent
Particulars
Before joining After joining
Mean (in Rs.)
3624.324
7371.622
Standard Deviation (in Rs.)
2897.557
5083.59
Sample size
74 74
Source: Author’s Calculation
The above table 5.4.1, the calculated value of |Z| = 5.509 is greater than critical value of 1.64 at 5
% level of significance. Hence the null hypothesis is rejected. Thus we can conclude that there is
a significant difference in the family income before and after joining the group. This also
indicates that the mean income of the respondent has increased after joining the group. This
could be because of proper utilisation of available resources like governmental facilities
(financial assistance, training or workshop, high quality seeds, bio-fertilisers, vermi compost,
polyhouse, etc), homemade manure or compost; especially cow dung/urine, and other low cost
inputs, which lead to better productivity in quantity as well as quality.
5.4.2 Analysis of the Change in Bank Savings of the Respondents
The amount of savings is an important factor for the purpose of economic planning of group-
based organic cultivators. Banks are regarded as a good option for safeguarding of savings; in
addition there is the benefit of interest accrued on the amount deposited. Table 5.4.2 gives the
data on the savings of the respondents before and after joining the group.

30
Table 5.4.2: Comparison of the Change in Banks Savings of the Respondent before and after joining the group
Amount of savings ( In Rupees)
Before Joining ( No. of Respondent)
After Joining ( No. of Respondent)
0-1000
56 18
1000-2000
12 20
2000-3000
3 16
3000-4000
3 9
4000-5000
0 3
5000-6000
0 1
6000-7000
0 7
Total
74 74
Source: Primary Data
Let the null hypothesis be that there is no significance difference between bank savings of the
respondent before and after joining the group, with the alternative hypothesis being that the mean
savings of the respondent before joining the group is less compared to the mean savings after
joining the group. The symbolic representation would be
H0: µ1 = µ2 against alternative, i.e., H1: µ3’ < µ4’
Table 5.4.3: Calculation for Mean and Standard Deviation of the Respondent
Source: Author’s Calculation
Particulars
Before joining After joining
Mean (in Rs.) 445.9459 2247.297
Standard Deviation (in Rs.) 752.0181
1662.497
Sample size 74 74

31
Since the calculated value of |Z| = 8.492 is greater than the tabulated value of 1.64 at 5 % level of
significance, the null hypothesis is rejected. This means that there is significance difference in
the savings and also suggests that the mean savings of the respondents has increased after joining
the group. The savings of the members can be attributed to better banking facilities.

32
5.5 Results and Analysis of the Livelihood Diversification through HH Index.
Securing the basic necessities of life and the capacity to acquire those necessities by working either individually or as a group while exploring different avenues for earning can lead livelihood to diversify. To examine these, let us first consider the following table
Table 5.5: Percentage of Household Engaged on Farm and Non-Farm Activity
Source: Author’s Calculation
To analyse the issue of livelihood diversification, we categorise the households into two broad
categories, viz.- (i) households that are completely dependent on farming and (ii) households that
adopt both farm and non-farm activities.
From table 5.5, we can conclude that, farming is considered as the primary source of livelihood
because almost all the households are engaged in farming activities. However a substantial
dependence on non-farm activities is still evident. About 80%, 70%, 76%, and 88 % of the
sample households of East, West, North and South district are dependent on non-farm
activities. This implies that the income generated from farming is insufficient for fulfilling the
increasing necessities of the people of Sikkim.
Name of the Sample Districts of Sikkim East
District West District
North District
South District
Percentage of households engaged on only farming activity
10 30 24 12
Percentage of households engaged on farming and one more occupation
56 36 60 58
Percentage of households engaged on farming and two more occupation
24 28 14 22
Percentage of households engaged on farming and three more occupation
10 6 2 8

33
Let us now consider the following model for studying the impact of different explanatory
variables on livelihood diversification through OLS.
HHi = α0 + α1 (WM)i + α2 (AAGF)i + α3 (EDN)i + εi…………………(1)
Table 5.5.1: Livelihood Diversification – Regression Results
Explanatory Variables
Estimated Coefficient (Marginal Effects)
WM
0.120**
(2.05) EXPR
0.003 (0.54)
EDN
0.005 (0.02)
CONS
1.140*** (6.60)
Observations 240
R-Squared 0.030
Adjusted R-Squared 0.122
F-Statistics P-Value
1.820 0.145
Note: ***, ** and * indicates the significance at 1%, 5% and 10% level respectively. Figures within the brackets represents the t-statistics
The above estimated coefficient result from equation 5.5.1, suggests that all variables except
WM (working member) are found to be insignificant. The coefficient is positive; about 27%
variation of dependent variable (HHi) is explained by independent variable (WM). This implies
that the increase in the number of working members leads to greater livelihood diversification. It
seems 1 unit change in working variable leads to 27 units change in livelihood diversification. It
also implies that, the greater the number of working family members the greater would be the
diversification. This could be due to the fact that members of the same household engage in
different activities in search of better earnings or better alternative source of earning. Factors like
urbanisation, development of infrastructure, transport facilities and communications, growth in
employment opportunities, etc, or change in governmental policies may also have further
encouraged such livelihood diversification.

34
5.6 Results and Analysis of the Effect of the Diverse Variables on the Household
Diversification Indices through Multiple Regression Analysis
With a view to examining the effects of variables like educational qualifications, experience and
utilisation of government facilities on the per capita income (PCI) of both individual growers and
group based growers; we have employed the following model;
PCIi = β1 + β2 (EDN)i + β3 (EXPR)i + β4 (UGF)i *Di + ui………………..(2)
Table 5.6: Results of OLS method on the Impact of Different Explanatory Variables for
increasing Per Capita Income
Explanatory variables
Estimated Coefficients
Combined East West North South EDN 548.683***
(10.13) 260.264*** (4.57)
195.504 (1.17)
330.450*** (3.301)
28.2006 (0.294)
EXPR 193.652** (2.06)
84.210 (0.66)
272.470 (1.586)
-65.253 (-0.329)
22.320 (0.120)
UGF 23.778 (0.31)
57.362* (-2.07)
223.316 (0.-1.602)
408.904*** (-2.744)
-215.113 (-1.895)
Di 4906.98** (10.97)
CONS -1632.470** (-2.38)
1112.330* (1.48)
2003.918 (0.525)
2287.069 (1.526)
2784.544*** (0.027)
Observations 240 60 60 60 60 R-Squared 0.4789 0.4393 0.1002 0.3437 0.0768 F- Statistics P- value
61.59 0.0000***
11.752 0.0000***
1.671 0.1866
7.856 0.0002***
1.248 0.303
Note: ***, ** and * indicates the significance at 1%, 5% and 10% level respectively. Figures within the brackets represents the t-statistics
The estimated coefficients from equation (2) for Sikkim as a whole are shown in column 1 of
Table 5.6, while in case of the four districts, the estimated coefficients from the same equation
are shown in column 2, 3, 4 and 5. In order to examine linear relationship through ordinary least
square method, we have considered per capita income (PCI) as a dependent variable and
educational qualification (EDN), experiences and utilisation of government facilities (UGF) as
independent variables. Apart from this, we have introduced the dummy variable (Di) for
utilisation of government facilities for both the individual as well as group-based cultivators.

35
Where Di = 1 for utilisation of government facilities group-based growers and Di = 0 for
individual cultivators. From the value of dummy variable (Di) it is clear that, the utilisation of
government facilities (UGF) is found to be significant at 5% level of significance. Furthermore,
we can conclude that increase in the government facilities leads to increase in per-capita income
of the respondents and from the value of intercept, -1632.470, it is clear that the mean per capita
income of the individual growers is less than that of group based growers by 3274.14 .
The value of the estimated coefficients for educational qualifications and experiences in case of
respondents from the combined sample are found to be statistically significant at 1 % and 5 %
level of significance. This implies that the higher the level of education and greater will be the
chance of increasing per capita income of the household. The years of experience also has the
same impact on the per capita income of the respondents. Further, in case of all the sampled
districts except North and East, the impact of these two variables (EDN and EXPR) is found to
be insignificant.
For district wise comparison, the utilisation of governmental facilities is found to be significant
at 10 % in case of the East district and highly significant at 1 % level of significance in North
district, which means that optimum utilisation of facilities leads to a rise in the per capita income
of the respondents.

36
5.7 Results and Analysis of the means and variances of household diversification across
Districts through ANOVA
For testing the equality of the mean and variance indices, we have considered the four districts of
Sikkim.
Table 5.7: ANOVA Result for Equality of Mean Test
Method Degree of freedom (df) Value Probability
All District Anova F-test (3, 232) 40.47066 0.00000
LDE 235 1.81886 0.078537 LDS 235 0.777813 0.067147
LDW 235 1.64927 0.094394 LDN 235 1.883636 0.079939
Table 5.7.1: ANOVA Result for Equality of Variance Test
Method Degree of freedom (df) Value Probability
Barlett 3 6.699436 0.0821 Levene 3,232 2.744929 0.0438
Brown-Forsythe 3,232 3.356861 0.0196
From the table 5.7, it is clear that there is significant difference in the mean level of
diversification across the four districts of Sikkim, which is revealed by the F-value. Furthermore
the difference among variance figures for the diversification indices is also found to be
significant, as revealed in table 5.7.1. By considering all three methods (Barlett, Levene and
Brown-Forsythe), we can conclude that there is great difference in the patterns of diversification
to non-farm activities across the four district of Sikkim.
Most of the household members in each district are engaged in multiple economic activities so as
to ensure better earnings. Particularly in the East and South districts each and every household
member is engaged in multiple activities while being less concerned about the agricultural jobs.
This could be due to better alternative employment opportunities. On the other hand, in case of

37
the North and West districts most of the household belongs to farming class and/or farming is
their basic livelihood. This could be due to poor infrastructures and favourable climatic condition
conducive to the cultivation of agricultural products.

38
CHAPTER 6
COMPARATIVE STUDY AMONG THE EAST, WEST, NORTH
AND SOUTH DISTRICT OF SIKKIM
6.1. Comparative Study to Measure the Income Inequality among the East, West, North
and West District by Gini-Coefficient
The extent of income homogeneity among the respondents, as it can be reasonably assumed that
those coming from similar socio-economic backgrounds will harbour similar sentiments towards
organic farming. From the value of Gini-Coefficient of income inequality shown in Table 5.2
suggested that the income inequality the four districts are quite similar to each other; this implies
there is no such strong income inequality between them. Furthermore, careful observation of the
value of G reveals that the income inequality is comparatively higher in the West and North
districts of Sikkim.
The respondents of the study area show homogeneity in nature irrespective of their level of
income. In case of East and South districts, the value of Gini-Coefficient suggested that there is
equal distribution of income among the respondent, this could be due to the fact that their
perception regarding organic farming is more or less similar and the revenue generated by selling
their produce are comparable. The study also reveals that, in case of East district the group based
cultivators are able to find proper market channel to sell their organic produce, and demand for
organic products, higher as compare to other districts of the state. Whereas in south district most
of the cultivators were motivated by governmental as well as other non-government organisation
and are more focused for promoting the organic farming.

39
6.2 Comparative Study among the East, West, North and South District by Multiple
Regression Model
In order to examine relationship through ordinary least square method, we have considered per
capita income (PCI) as a dependent variable and, educational qualification (EDN), experiences
(EXPR) and utilisation of government facilities (UGF) as independent variables. Apart from this,
we have introduced the dummy (Di), where Di = 1 for group based growers and Di= 0 for
individual growers.
From the value of estimated coefficient of table 5.6, we can conclude that the impact of variables
like educational qualification is found to be significant at 1 % level of significance for East and
North District and found insignificant for rest of the two districts. Which means the educational
qualification is playing imperative role to increase the per-capita income of the respondent of
East and North district. In case of West and South district the education has not much impact on
increasing the per-capita income. While for all four districts impact of experience is found to be
insignificant.
The utilisation of governmental facilities is found to be significant at 10 % in case of the East
district and highly significant at 1 % level of significance in North district, which means that
optimum utilisation of facilities leading to a rise in the per capita income of the respondents.
Further, we may conclude that, the government facilities were properly utilising by the
cultivators of North districts than those of East, West and South district.
As per the field survey, we found that there is strong correlation between educational
qualification and utilisation of government facilities. This means, the facilities provided by
government for promoting the organic farming is being properly utilised by the household whose
average education qualification is high and vice versa. Likewise, if we compare group based and
individual organic cultivators, the governmental facilities were effectively utilised by group
based than individual cultivators across the four districts of Sikkim.

40
6.3 Comparative Study among East, West, North and South District by applying
ANNOVA.
From the ANNOVA results shown in table 5. 7, it is clear that there is significant difference in
the mean level of diversification across the four districts of Sikkim, which is revealed by the F-
value. Furthermore the difference among variance figures for the diversification indices is also
found to be significant, as revealed in table 5.7.1. By considering all three methods (Barlett,
Levene and Brown-Forsythe), we can conclude that there is great difference in the patterns of
diversification to non-farm activities across the four district of Sikkim.
Most of the household members in each district are engaged in multiple economic activities so as
to ensure better earnings. Particularly in the East and South districts each and every household
member is engaged in multiple activities while being less concerned about the agricultural jobs.
This could be due to better alternative employment opportunities. On the other hand, in case of
the North and West districts most of the household belongs to farming class or farming as their
basic livelihood. This could be due to poor infrastructures and favourable climatic condition
conducive to the cultivation of agricultural products.
There is dissimilarity in diversification pattern among the respondent of the study area. In East
district apart from farming, the members of sampled households are engaged in business
activities like running a shops, restaurant, hotel, tours and travels, employed in private
companies, government services etc. while considering the remaining districts, they work on
daily wages basis like MGNREGA, driving and other non-farm activities. Each and every
household has a member working on daily wages and less participated in other activities like
business, working at private sector and so on. In South and North districts most of the working
members are self employed and work as a vendor in nearby local markets like Namchi of South
district and Mangan of North District.

41
CHAPTER 7
CONCLUSIVE OBSERVATION AND POLICY PRESCRIPTION
7.1 Concluding Observations
Contemporarily, Organic farming is practicing almost all the countries of the world by its better
socio-economic advantages. With a suitable climatic condition, Sikkim has been adapting the
technique of organic farming for more than a decade and it has become a basic source of
livelihood for those who belong from the rural areas of the state.
The foregoing study reveals that the percentage share of non-farm activities to total income of
the households remain higher than that of share of farm activities for all the four districts of
Sikkim and in case of East district, the share of non-farm activities is much more higher than
farm activities. This may be due to better alternative employment opportunities and since east
district is consider to being one of urbanised district among other three district of the state. Most
of the government offices, schools, hospitals, hotels/resort, business organisation, and other
private sector institution are located in the district itself. After considering the group-based
organic cultivators, most of the groups are dominated by female participant or we can say that
the female members are much more interested to perform community based organic farming.
The study revealed that there are substantial changes in socio-economic profile of the cultivators
after adopting such type of farming technique. As we have witnessed the increasing demand and
supply of organic product consequently witnessing the better living standard, infrastructural
development, better health, better cohesion among the people within a village or society, etc.
while considering the group-based growers, most of the group was dominated by female
participant, which suggest that organic farming can be one of the basic way for empowering the
women by making them economically stronger.
As from the result of ordinary least square, with an increase in educational qualification,
experiences and government facilities on organic farming, the per capita income of the
respondent has been increasing significantly. By promoting these types of variable, in near
future, we may witness the better socio-economic condition of the people of Sikkim.

42
The study was mostly carried out in rural areas of the four district of Sikkim, where we have
found that after introducing such farming by the government in 2003, not only the farm activities
has improved but there is growth and development of other non-farm activities. This may be due
to consequences of different governmental policies on organic farming. By promoting organic
farming in Sikkim not only the agricultural sector but the entire economic sector would be
benefited and it would have direct impact on improving socio-economic condition of the people
in general and farming class at the particular.

43
7.2 Policy Prescription
Government support is necessary for those who are unable to access the basic requirement to
promote organic cultivation in Sikkim, which there should be a proper distribution of
government facilities among the organic cultivators, so that they can improve their quality as
well as quantity of their organic production as consequences there is a chance for extending of
organic marketing within a state or abroad.
The basic governmental facilities is needed to the local cultivators, like increasing the level of
education, that would be possible only by increasing number of school, colleges and establishing
professional institution, especially agricultural institution, and increasing number of seats in
private institution for the local students, providing scholarship and other educational scheme.
Most of the cultivators were finding difficulties to sell their organic products, it is due to lack of
availability of local market, and so more attention is needed in this regard. Government should
provide more space for organic products than that of in organic products importing other places.
The study suggested that, the concept of organic should be clearly define to every individual,
households, society of the state, so that the more preference will be giving than that of inorganic
products. By doing so the market structure for agricultural product; particularly for organic
product would increase in near coming future. Further, export of inorganic product from other
part of India will decline and it would be benefited not only to producer but also the consumer
and it may help the government to make Sikkim as a fully organic state.
The government should motivate the cultivators who are already following an organic technique,
by giving regular training, demonstration and providing proper inputs, so that they can increase
the quality as well as quantity of the production. The state government should also be more
flexible to promote or invite all the organisation as well group-based growers by providing more
inputs required in farming, financial assistance, market facilities, etc.
The proper road connection or transport facilities are needed for both organic producer as well as
consumer of the state. These would help the producer to get proper value for their produce and at
the same time consumer will gets fresh farm product at cost effective price. To achieve this,
government should be more conscious and should focus on rural areas having lack of roads
facilities.

44
Bibliography
Aher, S. B., Swami, B. and Sengupta, B. (2012). Organic agriculture: Way towards sustainable
development; International Journal of Environmental Sciences, 3 (1).
Anonymous (2013). Agricultural and Processed Food Products Export Development Authority
(APEDA). Organic production and current scenario in India. http;//
www.apeda.gov.in/apedawebsite/Organic _Products.htm (Retrieved on 20th Dec, 2013).
Bhattacharyya, P. and Chakraborty, G. (2005) Current Status of Organic Farming in India and
Other Countries. Indian Journal of Fertilisers. 1 (9): 111-123
Chandrashekar, H.M (2010); Changing scenario of organic farming in India: an overview.
International NGO Journal. 5 (1): 34-39.
Charyulu, D. K. and Biwas, S. (2010). Economics and Efficiency of Organic Farming Vis-à-vis
Conventional Farming in India. Working paper series, IIMA, W.P. No. 2010-04-03.
Datta, S. K. and Sing, K. (2011). Livelihood Diversification: Case Study of Some Backward
Regions In India. International Journal of Current Research. 33 (2): 139-151.
FAO (1999) Organic Agriculture, Food and Agriculture Organization of the United Nations,
Rome.
GoI (Government of India) (2001) Report of Working Group on Organic Farming and
Biodynamic Farming for the 10th Five-Year Plan. Planning Commission, New Delhi.
Griffith, R. and Nesheim, L. (2008). Household willingness to pay for organic products. The
Institute for Fiscal Studies Department of Economics, UCL, centre for micro data and practice,
cemmap working paper CWP.
Gupta, H. (2013). Organic Farming and Horticulture: New Dimensions of Agricultural
Development in Mp, India. International Journal of Social Sciences. 2 (7): 14-18.
K, Archana. (2013). Role of Indian Government in the Development of Organic Agriculture.
Journal of Agriculture and Veterinary Science. 2: 32-39

45
Kumar, P., Singh, N.P. and Mathur, V.C. (2006). Sustainable Agriculture and Rural Livelihood:
A Synthesis. Agriculture Economic Research Review. 19: 1-22.
Kundu, R. (2012). Self Help Groups and Women Empowerment: A Case of Sikkim. Identity,
Politics and Economic Development. Concept Publishing Pvt. Ltd. 245-261.
Lampkin, N. (1990). Organic Farming, Farming Press Book, IPSWICH, UK.
Letourneau, D.K. and Goldstein, B. (2001) Pest damage and arthropod community structure in
organic vs conventional tomato production in California, Journal of Applied Ecology, 38(3):557-
570.
Motegaonkar, M. B. and Salunke S. D. (2012). The Ash and Iron Content of Common Vegetable
Grown in Latur District, India, Res. J. Recent Sci., 1(4): 60-63.
Muller, A. (2009). Benefits of organic agriculture as a climate change adaptation and mitigation
strategy for developing countries. Environment for development, discussion paper series.
Pandey, J. and Singh, A. (2012). Opportunities and Constraints in Organic Farming: an Indian
Perspective. Journal of Scientific Research. 56: 47-72.
Piyasiri, A. G. A. and Ariyawardana, A. (2002). Market Potentials and Willingness to Pay for
Selected Organic Vegetables in Kandy. Sri Lankan Journal of Agricultural Economic. 4 (1):
107-119.
Pugliese, P. (2001). Organic Farming and Sustainable Rural Development: A multifaceted and
Promising Convergence. Sociologia Ruralis. 41: 113-130.
Ramesh, P., Singh, Mohan and Subba Rao, A. (2005) Organic farming: Its relevance to the
Indian context, Current Science, 88(4).
Reddy, B. S. (2010). Organic Farming: Status, Issues and Prospects. Agricultural Economics
Research Review. 23: 343-358
Samie, A., Abedullah, Ahmed, M. And Shahzad, K. (2010) Economics of Conventional and
Partial Organic Farming Systems and Implication for Resource Utilisation in Punjab (Pakistan).
Pakistan Economic and Social Review. Vol.48 (2): 245-260.

46
Sharma, P.D. and Singh Mohan.(2004) Problems and Prospects of Organic Farming. Bulletin of
Indian Society of Soil Science, No.22: 14- 41
Shukla, U.N, Mishra, M.L and Bairwa. (2013) Organic Farming: Current Status in India.
Popular Kheti. 1 (4).
Singh, I. P. and Grover, D.K. (2011). Economic Viability of Organic Farming: An Empirical
Experience of Wheat Cultivation in Punjab. Agricultural economic research review. 24: 275-
281.
Singh, N.P and Mathur, V.C. (2006). Sustainable Agriculture and Rural Livelihoods: A
Synthesis. Agricultural Economics Research Review. 19: 1-22.
Subrahmanyeswari, B., and Chander, M. (2011). Organic Agriculture: A Way Forward to
Achieve Gender Equality in India. Journal of Organic System. 6 (3): 13-19.
Sukla, U.N, Mishra M. L. and Bairwa K.C. (2013). Organic Farming: Current Status in India.
Popular Kheti. 1.
Summer, J. (2005). Organic Farmers and Rural Development. A Research Report on the Links
Between Organic Farmers and Community Sustainability in Southwestern Ontario,
OISE/University of Toronto.
V.G, Siddaraju and M, Indira. (2013). Economic Performance of Organic and Modern
Agriculture System in Karnataka- An Empirical Study. Indian Journal of Applied Research. 3.
Van Mansvelt, J.D. and A.J. Mulder (1993) the contribution of organic agriculture to sustainable
rural development in Central and Eastern Europe. Proceedings of the international seminar for
policy makers organised by the Avalon Foundation. 29–62.
Xia, W. and Zeng, Y. (2008). Consumer’s willingness to pay for organic food in the perspective
of meta-analysis. International conference on applied economics (ICOAE).