Farming in Rondonia
34
ELSEVIER Resource and Energy Economics 17 (1995) 155-188 RESOURCE andENERGY ECONOMICS Farming in Rond6nia Donald W. Jones a,., Virginia H. Dale b, John J. Beauchamp c, Marcos A. Pedlowski d, Robert V. O'Neill b a Ener~, Dirision, Oak Ridge National Laborato~, Oak Ridge, TN 37831, USA Lel'ironmentai Sciences Dirision, Oak Ridge National Laboratory, Oak Ridge, TN 37831, USA c Er~gineering Physics and Mathematics Dirision, Oak Ridge National Laboratory, Oak Ridge, TN 37831, USA d Department of Urban Affairs and Planning, Virginia Polytechnic Institute and State Uni-'ersity, Blacksburg, VA, USA Received October 1993; accepted May 1994 Abstract We study economic and environmental aspects of farming practices of a sample of 91 family farms around the city of Ouro Preto, in Brazil's state of Rond6nia, in western Amazonia, from four overlapping r,~,'spectives. First, we estimate production functions for six activities on muitiproduct farms, finding evidence of increasing returns to scale in cattle activity and possible evidence of nonindependence of profit and utility maximization in several subsistence crops. Second, we examine determinants of overall current farm revenue and wealth, finding possible evidence of overuse of land and underinvestment in cattle, decapitalization of farms over time, overpopulation, and a trade-off between children and capital accumulation. Third, we study interactions between burning strategies, diversifica- tion of f~rm activities, locational choice, length of tenure on a farm, and soil quality. Longer tenure on a farm and larger area in perennial crops appear to reduce the frequency of burning, while greater area in annual crops increases the frequency. Larger pasture area tends to reduce the frequency of burning below an annual periodicity. Less frequent burning appears to be accompanied by greater diversification of farm income sources. Fourth, we study the determinants of deforestation on lots, finding a negative effect of clearance costs and productivity of land in cultivation on the clearance of new land. However, the evidence for the relationship between cattle activit~ and deforestation is mixed: a larger number of * Corresponding author. Prepared by the Oak Ridge National Laboratory, Oak Ridge, TN 37831, USA, managed by Martin Marietta Energy Systems, Inc. for the U.S. Depaament of Energy under contract no. DE-ACO5-840R21400. SSDI 0928-7655(94)0001 1-8
Transcript of Farming in Rondonia
ELSEVIER Resource and Energy Economics 17 (1995) 155-188
RESOURCE and ENERGY ECONOMICS
Farming in Rond6nia
Donald W. Jones a,., Virginia H. Dale b, John J. Beauchamp c, Marcos A. Pedlowski d, Robert V. O'Neill b
a Ener~, Dirision, Oak Ridge National Laborato~, Oak Ridge, TN 37831, USA Lel'ironmentai Sciences Dirision, Oak Ridge National Laboratory, Oak Ridge, TN 37831, USA c Er~gineering Physics and Mathematics Dirision, Oak Ridge National Laboratory, Oak Ridge,
TN 37831, USA d Department of Urban Affairs and Planning, Virginia Polytechnic Institute and State Uni-'ersity,
Blacksburg, VA, USA
Received October 1993; accepted May 1994
Abstract
We study economic and environmental aspects of farming practices of a sample of 91 family farms around the city of Ouro Preto, in Brazil's state of Rond6nia, in western Amazonia, from four overlapping r,~,'spectives. First, we estimate production functions for six activities on muitiproduct farms, finding evidence of increasing returns to scale in cattle activity and possible evidence of nonindependence of profit and utility maximization in several subsistence crops. Second, we examine determinants of overall current farm revenue and wealth, finding possible evidence of overuse of land and underinvestment in cattle, decapitalization of farms over time, overpopulation, and a trade-off between children and capital accumulation. Third, we study interactions between burning strategies, diversifica- tion of f~rm activities, locational choice, length of tenure on a farm, and soil quality. Longer tenure on a farm and larger area in perennial crops appear to reduce the frequency of burning, while greater area in annual crops increases the frequency. Larger pasture area tends to reduce the frequency of burning below an annual periodicity. Less frequent burning appears to be accompanied by greater diversification of farm income sources. Fourth, we study the determinants of deforestation on lots, finding a negative effect of clearance costs and productivity of land in cultivation on the clearance of new land. However, the evidence for the relationship between cattle activit~ and deforestation is mixed: a larger number of
* Corresponding author. Prepared by the Oak Ridge National Laboratory, Oak Ridge, TN 37831, USA, managed by Martin Marietta Energy Systems, Inc. for the U.S. Depaament of Energy under contract no. DE-ACO5-840R21400.
SSDI 0928-7655(94)0001 1-8
156 D.W. Jones et al. ~Resource and Energy Economics 17 (1995) 155-188
cattle increases the absolute amount of land deforested on a lot, but a higher proportion of income from cattle increases the ratio of cultivated land to pasture on a farm. There is also evidence of a trade-off between land quality an~ the quantity of land deforested.
Keywords: Deforestation; Land-use; Amazonia
JEL classification: 013; Q15
1. Introduction
For two decades, Amazonia in western Brazil has experienced extensive deforestation from the immigration of small farmers and the establishment of large cattle ranches (Smith, 1982; Fearnside 1986, 1987). Unfortunately, the loss of tropical forest may not be compensated by the opening of a viable agricultural region. Ia some areas, farmers have thrived. In others, settlers exhaust the land in a few seasons and move on, leaving environmental desolation behind. 1 In 1968, colonization of RondSnia began (Leite and Furley, 1985; Frohn et al., 1990) with the construction of BR-364, the only paved road in the region (Sldllings and Tcheyan, 1979; Millikan, 1988; Goodland and Irwin, 1975). In 1970, Ouro Preto d'Oeste began as a model colonization project. Designed for 500 families, by 1974 there were 4000 (Mueller, 1979), and by 1987 there were 5098 (Becker, 1987). The lots, averaging 100 hectares, were carefully laid out on a square grid along the side roads, but no consideration was given to soil type or fertility in lot assign- ments.
This study examines a small region around Ouro Preto d'Oeste over a period of about a year in 1991. The study area is composed primarily of soils classified as 'good' but soils range from moderate to 'unsuitable for crops' and 'restricted for pasture.' e The original vegetation was dense tropical forest with smaller areas of
! lanni (1978) indicates that farming operations with considerable investments in conservation and land maintenance have been successful in Amazonia. Barrow (1990) notes the success of Japanese immigrants, who have practiced careful conservation continuously since their arrival in Amazonia in 1929. See also Subler and Uhl (1990).
2 Brazil, Departamento Nacional da Produ~o Mineral, Projeto RADAMBRASIL (1978). 'Good' soils face no to light limitations for a large number of crops which are climatically adapted, and good yields are expected for 20 years, when they start to decrease gradually. 'Moderate' soils present light to moderate limitations for a large number of crops; good yields are expected for 10 years, and the yields are expected to decrease to a medium level during the following 10 years. 'Restricted' soils pose moderate to strong limitations; medium yields can be expected for the first few years but will decrease rapidly. 'Unsuitable' soils present very strong limitations, and yields are expected to be very low. Soil productivity decline is well established in the literature on agriculture in Amazonia. For instance, Serr~o and Toledo (1990, p. 199) report that "During the first four to six years after establishment, productivity of the pastures is generally good. After this period, however, there is a gradual decline in the productivity of planted grasses, associated with an increased presence of weeds .. . . The process ... occurs in most of the pastures established in the Amazon region to date . . . "

D.W. Jones et aL ~Resource and Energy Economics 17 (1995) 155-188 157
open palm forests. There is a rainy season from September to April and a dry period the rest of the year. Annual rainfall exceeds 230 cm per year. Topography is dominated by low hills, with an average elevation of 340 m above sea level. From 91 surveyed farms, we derived 83 useful observations, although not all observations are complete. 3 Farms ranged from 5 to 300 ha with a mean slightly below 100. Family labor force averages five adults, with children under twelve averaging an additional 60% of adults. Without accurate estimates of production expenses, we determined a wide range of gross incomes, skewed toward the poorer end of the income distribution. Income from cattle, both beef and milk, averages 54% of gross income. Annual crops - corn, rice, and beans - provide 27% of gross income but are consumed largely by the producers. Perennial crops - coffee, cocoa, rubber, and fruit - are predominantly cash crops, and 87% are sold. Perennials provide 33% of gross cash income, with annuals contributing an average of 18% and cattle 48%. The average farm markets half of its output, a substantial connection to outside markets.
The average farm has one-third of its area in pasture and 18% in cultivation, leaving half uncleared. 4 Burning is used to clear the virgin forest and subse- quently to control weeds. Annual burning is practiced on 58% of the farms, the remainder burning less often. The typical farm is diversified, with the median having six income sources out of thirteen possible categories. Sixty-three farms purchased herbicides, 21 purchased seeds, and only 2 used commercial fertilizer. The median (and mean) farmer has occupied the lot for 10 years, the longest occupancy is 20 years, and the distribution of occupancy length is symmetric about the mean. Eighty-one of 90 farms are owner-operated, and tenancy condi- tions are not a pervasive issue.
With the survey data, we first estimate production functions for six major agricultural activities. Next, we investigate determinants of current fa__rn~_ income and, to the extent possible, family wealth. Income and wealth, together with simple survival on the lot, are indicators of farming success. Finally, we examine forest clearance in terms of clearance costs and demands for land.
2. Agricultural production
We treat farms as multiproduct firms producing products Q with variable inputs Vj, and influenced by a vector of variables 0 which cannot be varied by the farmer in the current period. We have observations on separate outputs and on the
3 Details are in Pedlowski and Dale (1992). 4 Our surveyed measure of pasture includes an unknown element of previously used pasture which
has been abandoned and allowed to return to secondary forest. We have no way of estimating an average proportion of abandoned pasture for individual observations or for the entire region.
158 D.W. Jones et al . / Resource and Energy Economics 17 (1995) 155-188
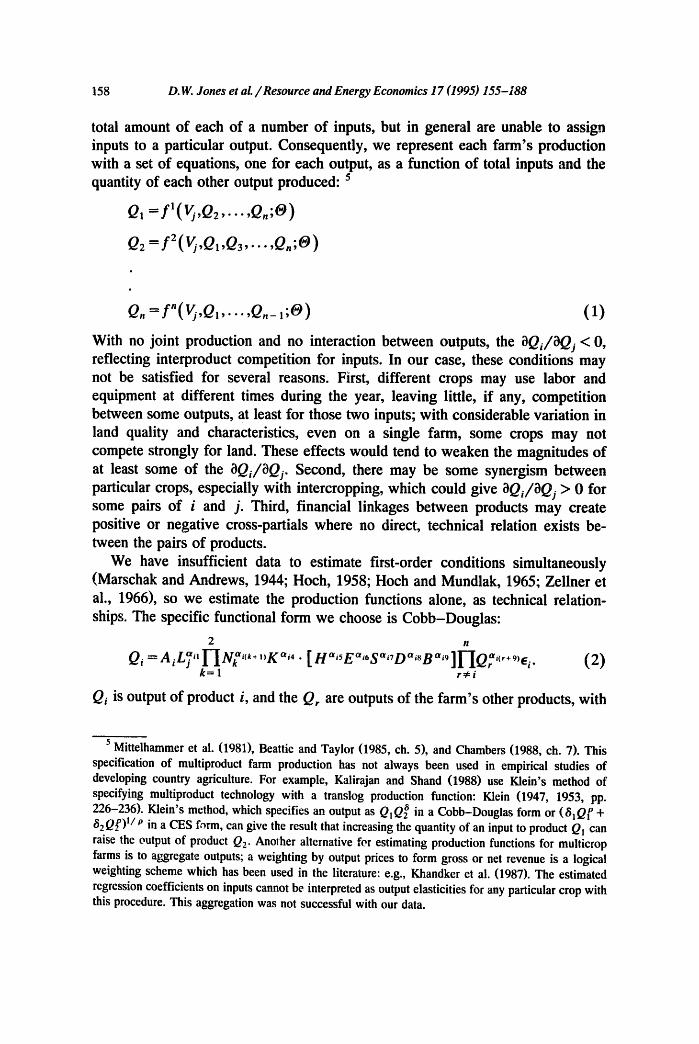
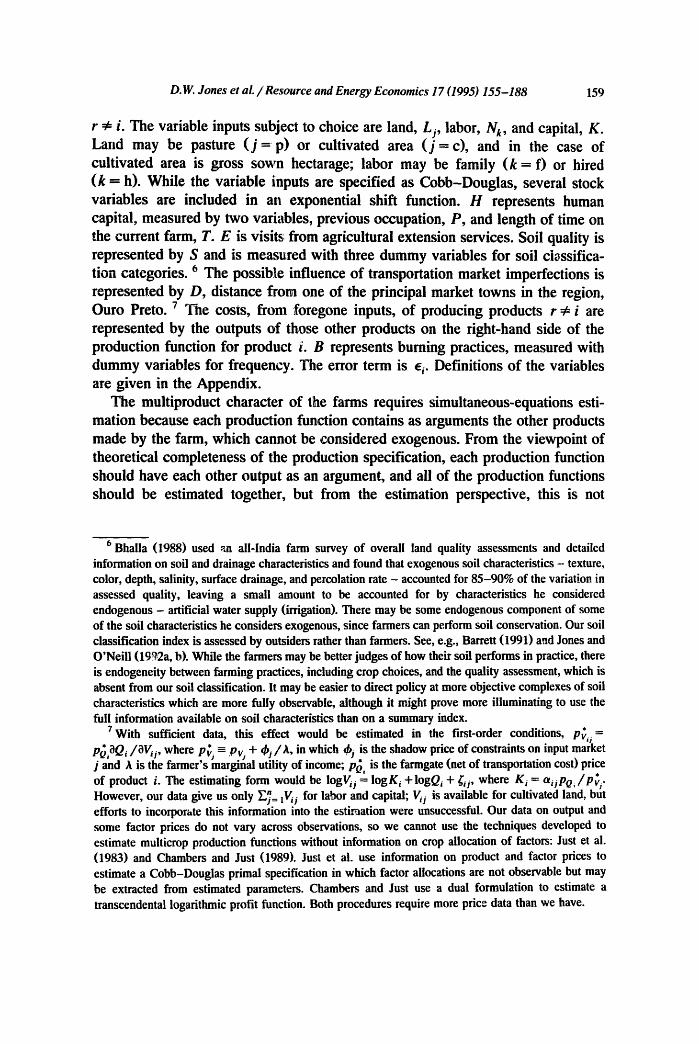
total amount of each of a number of inputs, but in general are unable to assign inputs to a particular output. Consequently, we represent each farm's production with a set of equations, one for each output, as a function of total inputs and the quantity of each other output produced: 5
Q: =
Qn = f n ( V j ,Ql , . . . , Q , _ l ;6) ) ( 1 )
With no joint production and no interaction between outputs, the OQi/OQj < O, reflecting interproduct competition for inputs. In our case, these conditions may not be satisfied for several reasons• First, different crops may use labor and equipment at different times during the year, leaving little, if any, competition between some outputs, at least for those two inputs; with considerable variation in land quality and characteristics, even on a single farm, some crops may not compete strongly for land. These effects would tend to weaken the magnitudes of at least some of the OQi//OQj. Second, there may be some synergism between particular crops, especially with intercropping, which could give aQi/OQj > 0 for some pairs of i and j. Third, financial linkages between products may create positive or negative cross-partials where no direct, technical relation exists be- tween the pairs of products.
We have insufficient data to estimate first-order conditions simultaneously (Marschak and Andrews, 1944; Hoch, 1958; Hoch and Mundlak, 1965: Zellner et al., 1966), so we estimate the production functions alone, as technical relation- ships. The specific functional form we choose is Cobb-Douglas:
2 n
Qi=ALa~'X-IN~ick+"K~4"z-i [HaisEa~6Sa~TDa~sBa~9]X-iQ~c'+9'6i . ( 2 ) k = l r ~ i
Qi is output of product i, and the Q, are outputs of the farm's other products, with
5 Mittelhammer et al. (1981), Beattie and Taylor (1985, ch. 5), and Chambers (1988, ch. 7). This specification of multiproduct farm production has not always been used in empirical studies of developing country agriculture. For example, Kalirajan and Shand (1988) use Klein's method of specifying multiproduct technology with a translog production function: Klein (1947, 1953, pp. 226-236). Klein's method, which specifies an output as QIQ~ in a Cobb-Douglas form or (61Qi ° + 82Q:~) 1/P in a CES form, can give the result that increasing the quantity of an input to product Q~ can raise the output of product Q2. Anol~her alternative fer estimating production functions for multicrop farms is to aggregate outputs; a weighting by output prices to form gross or net revenue is a logical weighting scheme which has been used in the literature: e.g., Khandker et al. (1987). The estimated regression coefficients on inputs cannot be interpreted as output elasticities for any particular crop with this procedure. This aggregation was not successful with our data.
D.W. Jones et aL /Resource and Energy Economics 17 (1995) 155-188 159
r ~ i. The variable inputs subject to choice are land, Lj, labor, N k, and capital, K. Land may be pasture ( j = p) or cultivated area ( j = c), and in the case of cultivated area is gross sown hectarage; labor may be family (k = f) or hired (k = h). While the variable inputs are specified as Cobb-Douglas, several stock variables are included in an exponential shift function. H represents human capital, measured by two variables, previous occupation, P, and length of time on the current farm, T. E is visits from agricultural extension services. Soil quality is represented by S and is measured with three dummy variables for soil classifica- tion categories. 6 The possible influence of transportation market imperfections is represented by D, distance from one of the principal market towns in the region, Ouro Preto. 7 The costs, from foregone inputs, of producing products r 4= i are represented by the outputs of those other products on the right-hand side of the production function for product i. B represents burning practices, measured with dummy variables for frequency. The error term is ~. Definitions of the variables are given in the Appendix.
The multiproduct character of the farms requires simultaneous-equations esti- mation because each production function contains as arguments the other products made by the farm, which cannot be considered exogenous. From the viewpoint of theoretical completeness of the production specification, each production function should have each other output as an argument, and all of the production functions should be estimated together, but from the estimation perspective, this is not
¢' Bhaila (1988) used an all-India farm survey of overall land quality assessments and detailed information on soil and drainage characteristics and found that exogenous soil characteristics - texture, color, depth, salinity, surface drainage, and percolation rate - accounted for 85-90% of the variation in assessed quality, leaving a small amount to be accounted for by characteristics he considered endogenous - artificial water supply (irrigation). There may be some endogenous component of some of the soil characteristics he considers exogenous, since farmers can perform soil conservation. Our soil classification index is assessed by outsiders rather than farmers. See, e.g., Barrett (1991) and Jones and O'Neill (19~2a, b). While the farmers may be better judges of how their soil performs in practice, there is endogeneity between farming practices, including crop choices, and the quality assessment, which is absent from our soil classification. It may be easier to direct policy at more objective complexes of soil characteristics which are more fully observable, although it might prove more illuminating to use the full information available on soil characteristics than on a summary index.
7With sufficient data, this effect would be estimated in the first-order conditions, p~, = p~aQi/aV~j, where p~,, = p~) + ekj / A, in which d'j is the shadow price of constraints on input market j and A is the farmer's marginal utility of income; p~, is the farmgate (net of transportation cost) price of product i. The estimating form would be iogV 0 = logK, +logQi + ~ij, where K i = aijpO,/p~, ,. However, our data give us only E~_- iV, j for labor and capital; V~j is available for cultivated land, but efforts to incorporate this information into the estir~,ation were unsuccessful. Our data on output and some factor prices do not vary across observations, so we cannot use the techniques developed to estimate multicrop production functions without information on crop allocation of factors: Just et ai. (1983) and Chambers and Just (1989). Just et al. use information on product and factor prices to estimate a Cobb-Douglas primal specification in which factor allocations are not observable but may be extracted from estimated parameters. Chambers and Just use a dual formulation to estimate a transcendental logarithmic profit function. Both procedures require more price data than we have.
160 D.W. Jones et aL ~Resource and Energy Economics 17 (1995) 155-188
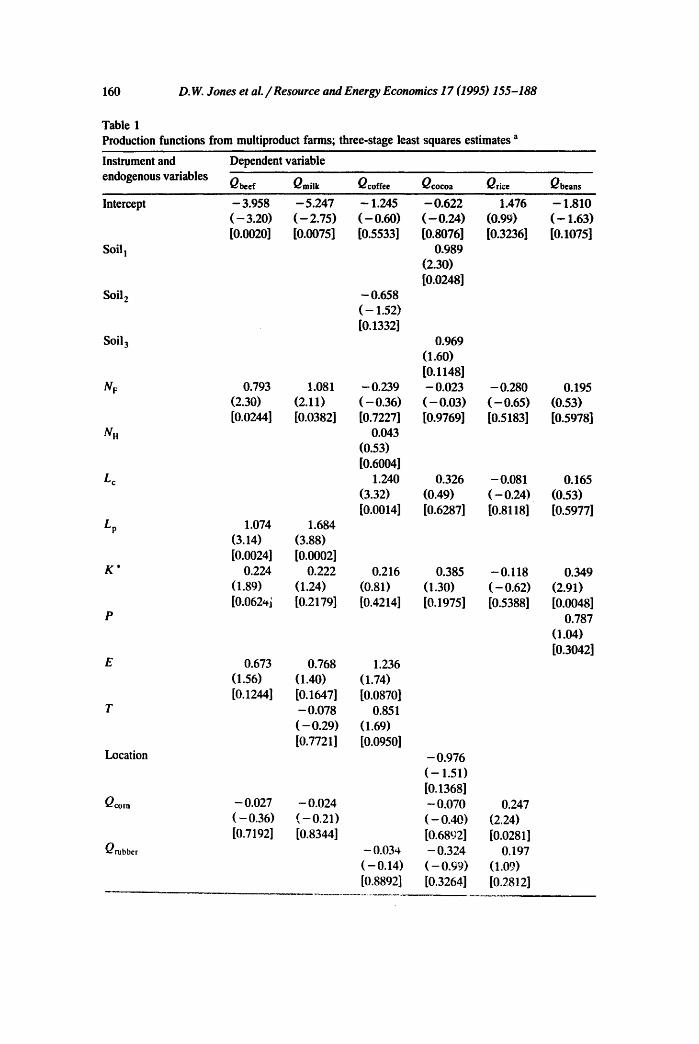
Table 1 Production functions from multipmduct farms; three-stage least squares estimates a
Instrument and endogenous variables
Dependent variable
Qbecf Qmilk Qcoffee Qcocoa Qrice Qbeans Intercept
S o i l !
Soil 2
Soil 3
NH
Lc
Lp
K ,
Location
Q~o,.
Qrubber
- 3.958 - 5.247 - 1.245 -0 .622 1.476 ( - 3.20) ( - 2.75) ( -0 .60) ( -0 .24 ) (0.99) [0.0020] [0.0075] [0.5533] [0.8076] [0.3236]
0.989 (2.30) I0.0248]
0.793 1.081 (2.30) (2.11) [0.0244] [O.0382]
1.074 1.684 (3.14) (3.88) [0.OO24] [o.0002]
0.224 0.222 (1.89) (1.24) [0.062,~i [0.2179]
0.673 (1.56) [0.1244]
- 0.027 ( -0 .36) [0.7192]
0.768 (1.40) [0.1647] - 0.078 ( -0 .29 ) [0.7721]
- 0.024 ( -0 .21 ) [0.8344]
-0.658 ( - 1.52) [0.1332]
- 0.239 ( -0 .36) [0.7227]
0.043 (0.53) [0.6004]
1.240 (3.32) [0.0014]
0.216 (o.81) [o.4214]
1.236 (1.74) [0.0870]
0.851 (1.69) [0.0950]
- 0.034 (-0.14) [0.8892]
0.969 (1.60) [0.1148] - 0.023 ( -0 .03 ) [0.9769]
0.326 (0.49) [0.6287]
0.385 (1.30) [0.1975]
-0 .976 ( -1 .51 ) [0.13681 - 0.070 ( -0 .40 ) [0.6892] - 0.324 ( -0 .99 ) [0.32641
- 0.280 (-0.65) [0.5183]
- 0.081 (-0.24) [0.8118]
-0.118 ( -0 .62) [0.5388]
0.247 (2.24) [0.0281]
0.197 (1.09) [0.2812]
- 1.810 ( - 1.63) [0.1075]
0.195 (0.53) [0.5978]
0.165 (0.53) [0.5977]
0.349 (2.91) [0.0048]
0.787 ( 1 . 0 4 )
[0.3042]
D.W. Jones et al. / Resource and Energy Economics 17 (1995) 155-188
Table 1 (continued)
161
Instrument and endogenous variables
Dependent variable
Qb~a Qmilk Qcoffee Qcocoa Qfice Qbeans Qbananas
Bl
B3
Qbeef
Qmilk -0.373 ( - 1.23) [0.2219]
Qcoffee -0.324 ( - 2.87) [0.0054]
Qcocoa -0.088 ( -0 .90) [0.3733j
Qbeans
Q,J,°
- 0.004 0.417 ( -0 .03) (2.28) [0.9793] [0.0258]
- 0.887 - 0.553 -- 0.241 ( - 1.70) ( - 1.42) (-0.53) [0.09321 [0.1602] [0.59701
- 0.260 ( - 1.31) [0.1944]
-0.514 ( - 1.47) [0.14571
0.197 (0.59) [0.5574]
-0A72 ( - 1.,62) [0.11021
0.564 (2.36) [0.0209]
- 0.206 ( - 1.12) [0.2653]
0.250 (1.37) [o.17461
0.600 (2.01) [0.04801
0.075 (0.90) [o.372o]
-0.585 ( - 1.50) [0.13861
0.294 (,1.79) [0.0771]
0.385 0.496 0.385 (2.33) (2.21) (2.41) [0.0226] [0.0301] [0.0185]
System weighted R 2 0.4379 System weighted 1.2983 (434)
MSE (D.F.) Observations 83
a All variables except dummies are in logarithms. T-statistics are in parentheses. Probabilities for two-tailed tests are in brackets.
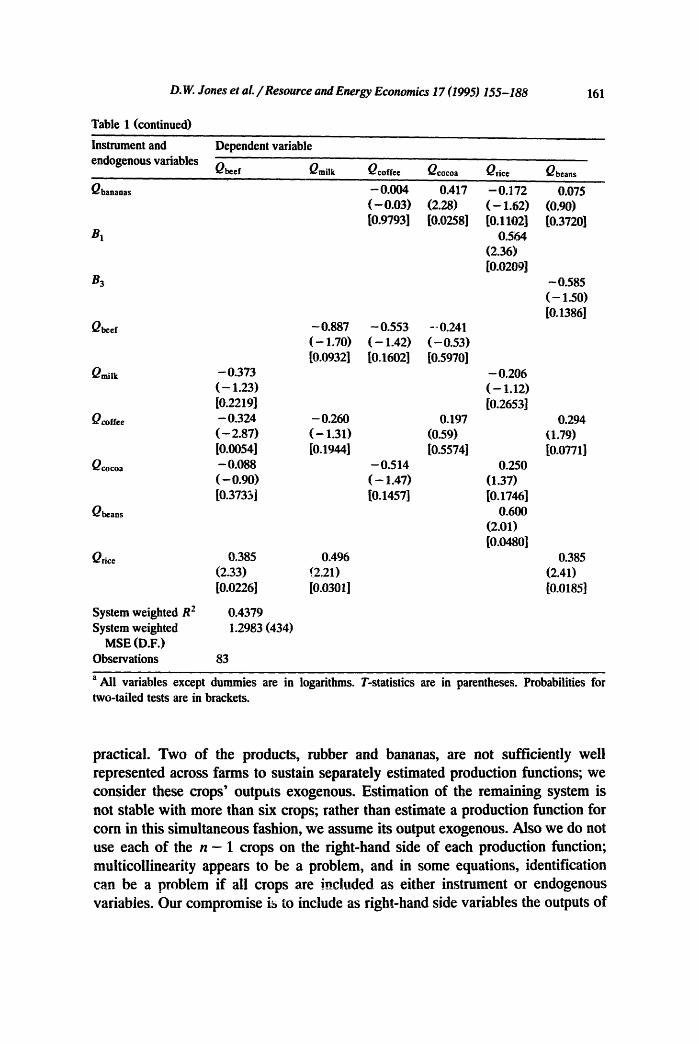
practical. Two of the products, rubber and bananas, are not sufficiently well represented across farms to sustain separately estimated production functions; we consider these crops' outputs exogenous. Estimation of the remaining system is not stable with more than six crops; rather than estimate a production function for corn in this simultaneous fashion, we assume its output exogenous. Also we do not use each of the n - 1 crops on the right-hand side of each production function; multicollinearity appears to be a problem, and in some equations, identification can be a problem if all crops are included as either instrument or endogenous variabies. Our compromise is to include as right-hand side variables the outputs of
162 D. W. Jones et al. / Resource and Energy Economics 17 (1995) 155-188
those products which should have important competitive or complementary effects upon the product whose production function is being estimated. We estimate the system of six equations with three-stage least squares and present the results in Table 1. Order and rank conditions for identification are satisfied for each equation; using Kmenta's (1986, pp. 665-666) terminology, K * * > G a - 1, and rank(Ha.. ) = rank(A) - G aa = G a - 1. We use exclusion restrictions on vari- ables to identify equations.
2.1. Empirical results
As a system, the milk and beef equations and the coffee and beef equations demonstrate the highest cross-equation correlation of residuals, at rmb -- 0.678 and rcfb = 0.602. The remaining correlations are distinctly lower, with cocoa and rice and coffee and rice negatively correlated at rcc r = - 0 . 3 0 8 and rcf r -- -0 .290. The iwterse covariance matrix is not close to diagonal. The system R 2 is relatively high at 0.44. We performed Hausman's (1978) artificial regression specification test, as reviewed by MacKinnon (1992), on the system and obtained mixed results. 8
Rather than examine each equation exhaustively, we summarize the results of Table 1. Beef and milk production show increasing returns to scale, and hired labor is important only in coffee production. The minimal effects of soil quality are striking: soil type 2 reduces coffee production, and soil types 1 and 3 raise cocoa production, relative to what would occur on soil type 4, the poorest. Effects of extension visits appear to raise productivity on the major, marketed products - beef, milk, and cocoa - but has no effect on coffee and the subsistence crops - rice and beans. Among human capital measures, previous farming occupation raises productivity only in beans and time oa lot raises productivity only in coffee, presumably reflecting the time required for coffee trees to mature rather than lot-specific human capital effects. Burning strategy had effects only in rice production, which was increased by annual burning, and in beans, output of which was reduced by burning strategy B 3 (never burn or burn only in first year on lot).
8 Hausman (1Q78, pp. 1264-1266); MacKinnon (1992, eq. 68, p. 126). One version of the test statistic is (/3 - / 3 )r(g,(/~ )_ ~,(/j ) ) - i ( /~ _ / j ), which is distributed as X 2 MacKinnon notes that this "procedure runs into difficulties when the matrix (gr ( / j )_ ~,(/~ )) is not positive definite, something that is often the case in practice" (p. 125). Indeed, the difference between our sample covariance matrices is not positive definite, and calculation of the test statistic with only positive ei~envalues yielded X,~ = 30.25 (P = 0.096). Alternatively, we used Hausman's artificial regression, which is equivalent, as recommended by MacKinnon, for which the value of an F-test for significaace of the three-stage estimator is F(64,310) = 1.79, with P = (}.0006, indicating specification error. Examination of the two- and three-stage estimates reveals only minor changes in values between most of the coefficients, and it is possible that the large number of degrees of freedom yields spurious significance. On the other hand, omission of separate productit~,n function for cc, rn, bananas, and rubber may be reflected.
D. W. Jones et al. / Resource and Energy Economics 17 (1995) 155-188 163
There is clear evidence of competition between beef and milk production, and the positive effect of rice production on beef and milk probably reflects the practice of intensely dry farming rice for several seasons, exhausting the soil, and then converting the land to pasture. Only cocoa demonstrates a significant locational effect, with greater productivity closer to Ouro Preto. The beans are dried on the producing farms, so timely delivery of fresh beans to market should not be an issue. The locational effect could result from the temporal pattern of colonization spreading away from Ouro Preto: lots closer to town probably were established earlier and have had more time in which trees could have matured. 9 Estimation of production functions for the subsistence crops, rice and beans, was not particularly successful, and as we noted above, corn was especially difficult. There is a smaller marketed surplus ratio for rice than for beans, but larger than that for corn, which is primarily animal feed and is difficult to store. We are unable to estimate a corn production function successfully in this system approach, possibly because of the inability of our approach to account for utility maximization effects differing from profit maximization effects in poorly marketed products. 10 The positive bean-rice interaction in both those production functions may be attributable to the symbiotic association of beans with nitrogen-fLxing bacteria which enrich the soil.
The most striking feature of production in the area is the absence of a strong effect of soil quality. 11 We suspect that flexibility in crop choice and in technology permits farms to avoid the worst effects of soil quality differences. Next, while longer time on lot did not appear to produce improvements in productivity, neither did it show indications of farmers mining the land, although
9 Some of the farms were established by previous owners; in these cases the value of T, the current owner's time on the lot, will understate the length of time the farm has been in operation. Our data allow us to identify farmers who have owned other lots previously in Rond6nia, but not which lots were initially developed by previous owners. Some aspects of diversification which involve the development of relatively slowly growing capital stock such as trees will be influenced by the entire length of time the farm has been established, particularly if previous owners began operations which were simply continued by present occupants. Thus there will be some noise in some - but not all - of our uses of T, in which the value of T will understate the strength of relationships which depend on the time an activity has been in operation rather than the time the present tenant has been conducting it.
l0 Such as has been attempted with agricultural household production models, both theoretically and empirically for cases in which profit maximization in production is not expected to be independent of utility maximization in consumption. See, e.g., Nakajima (1969), Barnum and Squire (1979), Singh et al. (i986), and Thornton and Eaton (1992).
~1 These results contrast somewhat from those found by Bhalla and Roy (1988), who use an overall land quality assessment made by individual farmers. They find this index of reported soil quality to be important in explaining productivity differences between large and small farms, although they do not use a production or cost function specification to control for the effects of other variable inputs. They use value of aggregate output per hectare of farm as the productivity measure, which corresponds more closely to our assessment of gross income per adult. Allowing for the effects of variable input and output choices, we do not find a simply characterized effect of soil quality such as 'productivity is
higher on better soils.'

164 D. W. Jones et al. / Resource and Energy Economics 17 (1995) 155-188
~here is some possible evidence that pasture is succeeding rice cultivation, possibly because of declining productivity in the latter crop. A relatively clear distinction appears between the marketed and the subsistence crops, and extension efforts appear to be most effective in raising productivity of the former. Even in the marketed crops, family labor appears more important than hired; possibly product markets are better formed than the labor market. 12
3. The success of farming: income and wealth
Income and wealth are two measures of the successfulness of a farm, the former a flow, the latter a stock. We rely on gross income as our income indicator because our data on expenses are inadequate to construct a reliable net income measure. Accumulated wealth is a more satisfactory measure of past success, but in this case as well we have imperfect measures and rely on a number of partial concepts: separate measures of equipment and building stock, land stock, and current cattle inventory. The standing stock of perennial trees - coffee, cocoa, banana, and various species of fruits - is another capital stock component which may be important to some farms, but we have no data on numbers or ages of trees. We study the determinants of the current value or stock of each of four indicators of success: income, equipment and building stock, cattle inventory, and land.
We estimate income as a flow from capital stocks with equation of the form:
Y= y ( L , N , K , C , H ; Life Cycle Stage, Utilization, Location,
Child Investmen.*, Diversification, Soil Quality), (3)
in which L is land, N is the stock of family adult labor, K is equipment measured as a value, C is cattle, and H is human capital. Each of these five variables is a capital stock, with the rate at which income flows from it equal to the stock-specific
12 The effect of malaria on agricultural productivity in the Ouro Preto region is reported to be serious (C~ , !987). Malaria accounted for 95% of the 4931 disease cases registered among the population of Ouro Preto in 1987 ( S E P ~ / R o , 1988, p. 32), and a decade earlier it was repe .! that males older than 10 years lost an average of 38 work days per year from malaria infection along the Manaus-Boa Vista highway in central Amazonia (Hayes and Fc,:raroni, 1978; cited in Smith, 1982, p. 106, fn. 3). Direct examination of interrelations of health aed productivity were inconclusive, showing only more sick days on poorer quality soils and among younger families, but a striking productivity effect appeared, ~,iheit inadequately controlled, when we included the measure of sick days in the production functions..~ore sick days raised production, but not directly; placing sick days on the right-hand side of the equations apparently reduced the partial effect of the endogenous other outputs on the same side; with a smaller implicit quantity of other outputs competing for inputs, the relationship between sick days and the output on the left-hand side of the equation turned positive. We suspect that we are unable to specify the compensation mechanisms for family absenteeism due to illness. Pitt and Rosenzweig (1985) also found no significant effect of the number of sick days on farm profits and suggested that sick family members might be replaced by labor-market hires.

D.W. Jones et al. ~Resource and Energy Economics 17 (1995) 155-188 I b5
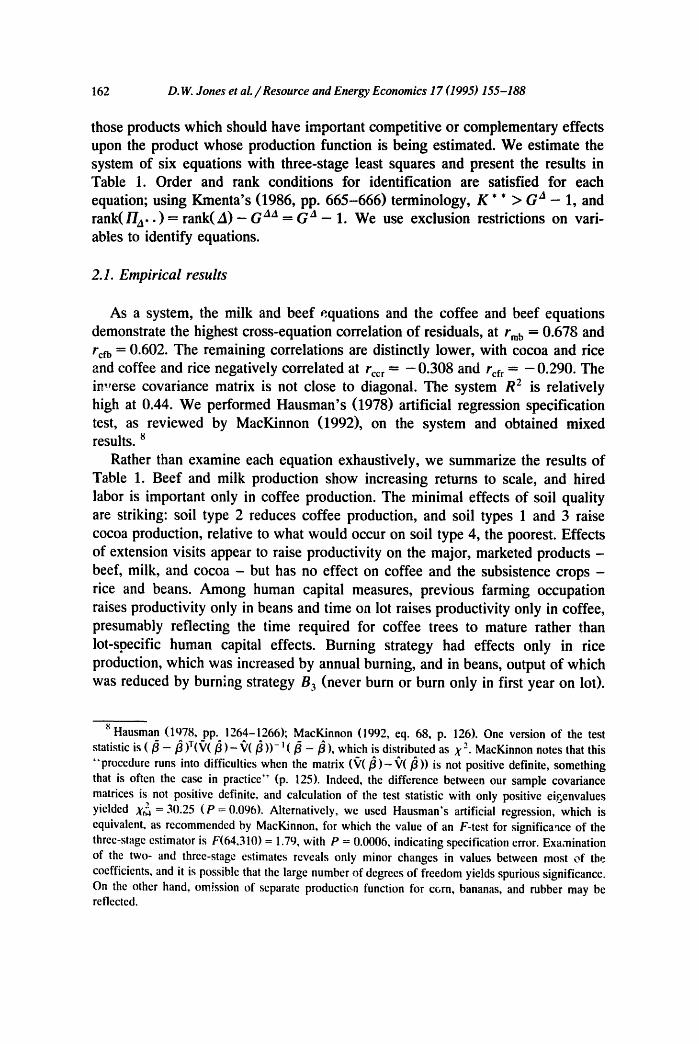
rate of return. The variable Life Cycle Stage, for which we use the age of the household head, attempts to capture a transitory component of income. Utilization is the proportion of land actively used for cultivation (net sown area) or pasture. We assume full utilization of the other capital stock components. Location is used to control any systematic effects of location relative to the major town ia the region, Ouro Preto, on current income. Child Investment represents a fav~ily's choice between current consumption and investment of its resources, partic~alarly labor time, into producing children, who may be viewed as a future labor force, old-age insurance, and consamption of familial affection. Diversification views the farm's set of activities as a portfolio which can be arranged to yield a desired trade-off between the level and stability of current income~ measured as the number of activities which contribute to income; it also may capture the extent to which family resources are fully utilized. This measure does not capture the covariance of returns across activities, and rather than reflecting the sacrifice of expected rate of return required to purchase a more stable rate of return, in practice it reflects the positive contribution to expected current income of greater income stability. Soil Quality, the soil dummies, controls for residual effects of land quality on income. We study both total farm income and income per adult family member.
Our capital stock component equations attempt to capture cumulative effects with cross-sectional data. We do not attempt to explain the stock of human capital because our measure of it (the variable P) is crude, and we have little information on variables which should be its major determinants. Each of the other capital stock component equations has the following form:
Stock = s(Time, H, Location, Child Investment,
Life Cycie Stage, Soil Quality). (4) Time represents the effect of time's passage on the translation of a current saving rate into a cumulative capital stock. Our measure, time on the current farm, is imperfect as it does not capture the possibility of interfarm mobility and the transportability of capital stock. Human capital stock, H, we represent with the dummy variable for previous occupation, P (P = 1 for farm related occupations, = 0 otherwise). In practice, this variable may capture substitutabilities or comple- mentarities between human and other forms of capital. For example, a larger stock of human capital could permit a farmer to work more imaginatively with a smaller quantity of land or equipment; alternatively, in a complementary relationship, greater human capital could raise the productivity of additional units of equipment or land hsed by a single farmer. Location controls for the effect of location, primarily differential transportation costs, on capital stock choices. Child Invest- ment controls for that alternative investment. Life Cycle Stage, measured by age of the household head, supplements Time in accounting for cumulative effects of previous savings. It also may mix in the effects of drawing down one's capital stock in declining years. Bank accounts are scarce among this rural farm pc, pula-

166 D.W. Jones et a l . / Resource and Energy Economics 17 (1995) 155-188
[..
I I ea
~
~.~.~ ~
~ ~.
-I
.,,,,a
U t.... , . ~ t-,i ¢¢~
D. W. Jones et al. / Resource and Energy Economics 17 (1995) 155-188 167
(,~i I~" ~ ,--, "=~
I ~ l~.,c~ oo o.o~i c~
, ...~ '.L~.
l ,_, c~ ~ cp
o
• . . . d ~
c~O '~.,..c,c~
"T,
o c~ ~ o I I ~ . -4o ~ o
~ . I I ~ ~o ~
m
t ~
N o , . . m
0
r .
° m ¢~1 ¢",
¢,fi ¢8 ~= < < < if:
168 D.W. Jones et al. / Resource and Energy Economics 17 (1995) 155-188
° , ~
0
~ . . ~
~J
~~_~ o
~~_~o 0
.o
< <
" ~ ~
v
o O - . ,
~, 0
cA
t J
" 0 cA
° , . M
.=_
E
¢ t J o .=.
ca_
U
M
t ~
e a
D. K: Jones et al. ~Resource and Energy Economics 17 (1995) 155-188 169
tion, and physical capital is a more common savings vehicle; although physical capital may be more difficult to parlay into cash for current consumption, sale of assets is possible. Life-cycle-income theory suggests that elderly farmers may choose to operate smaller units when they cannot handle as much work as formerly, using the cash from asset sales to finance current consumption. Extended families on most of these farms attenuate this effect. The Soil Quality dummy variables control for possible effects of soil quality on asset accumulation. We estimate these equations for both total capital stocks and capital stocks per adult family member.
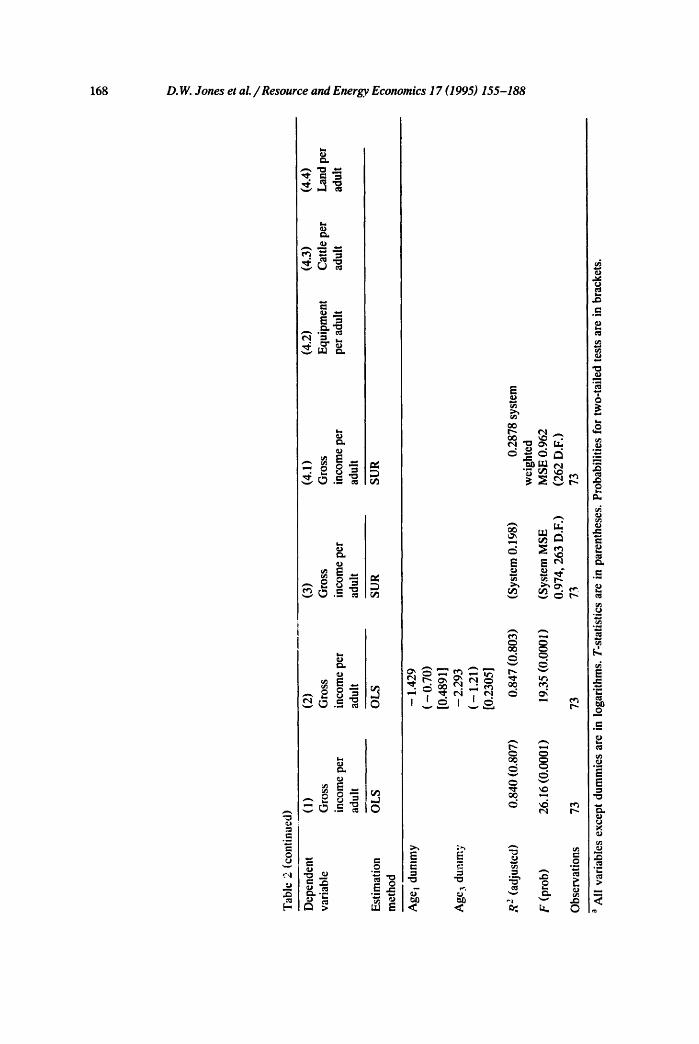
We estimate the income equation by OLS as a flow from the separate capital stock components. We do not have sufficient data to estimate these four equations - income and capital stock components - as a fully simultaneous system. The OLS regressions show no serious signs of heteroskedasticity. We do not have sufficient data to estimate these four equations as a fully simultaneous system, so we estimate the income and capital stock equations with seemingly unrelated regressions because the three capital stock equations are joined by past budget constraints, while the income is a flow from the stocks, although this procedure requires omission of the capital stock components from the income equation.
3.1. Empirical results
The results we emphasize here involve possible different rates of return on land and cattle in the income equation, the possibility of decapitalization of farms over time, and an apparent trade-off between children and capital accumulation. In regression 1 of Table 2, the coefficients on lot size (L) and number of cattle (C) suggest different rates of return on these two forms of capital stock, 0.286 on land and 0.404 on cows. This could be interpreted as a depressed rate of return on land relative to cattle, possibly reflecting overuse of land, but use of gross rather than net income complicates such a straightforward inference. To explore the interpreta- tion of these coefficient values, we examine a formalization of Eq. (3). Net income is related to the observed, gross farm revenue as
n k ~ n
PQ,Qi - ~ P~,,Vj) "" ~ Ti'i, o r Y g r ° s s _ factor costs = Y net ,
i=l j= l i = 1
which, with rearrangement of the accounting format, is ygross = H + factor costs. Considering, for simplicity, only the factors land and cattle, yg~oss= II+ rL + pc¢C, in which L and C are the stocks of land and cattle, r is rent per unit of land, Pc is the purchase price of a cow, and ¢ is the turn-over rate of cattle, i.e., the percent marketed in any year. Differentiating the last expression totally and putting it in elasticity form yields
I ° ) ( ° ) Y= r L--~ + ikrL L+ r¢-~ + ¢kvc C,
170 D.W. Jones et al. / Resource and Energy Economics 17 (1995) 155-188
in which a circumflex above a variable (.") represents a percent change ( d . / . ), r L and r c are net rates of return on land and cattle, FI/Y is the profit rate, i is the interest rate on land purchases, and the krj =__n.. V:/yg r°ss, with V.. representing ~ v j j , , l stocks, are gross, component capital-output ratios. The coefficients on land and cattle in the income regressions of Table 2 therefore contain more than the rate of return on those two assets. It is quite likely that i and -r have similar magnitudes, plausibly between 0.33 and 0.50; if, also, krL and krc are about the same magnitude, the values 0.29 and 0.40 will understate the difference between the rates of return on land and cattle. If i(r)krj = 0.2, and H / Y = 0.5 (a generous profit rate), then r L = 0.16 and r c = 0.40. Of course, it is also possible that, with "rk,. c > ikrL, r c = r L. These results highlight the need to assess empirically the magnitudes of the gross, component capital-output ratios, as well as i and -r. Interpretation of our results as indicating underinvestment in cows and overuse of land, leading to deterioration of land quality, is consistent with quite plausible values of capital-output ratios and profit rates, although we do not have the data to establish that as more than a reasonable possibility. An alternative possibility is that land is being used to provide insurance which is unavailable through established markets; if this is the case, the value of the insurance is not captured in the income measure. ~3 We cannot ignore the possibility, however, that the net rates of return are, for all practical purposes, the same, and there is no overuse of land.
The income regressions otherwise indicate the positive influence of both capacity utilization of land resources and of diversification. Number of children has no effect in the single-equation income :'egressions. Statistically weak evi- dence of a life-cycle effect of age on current income appears, but the weak significance levels of these variables may derive from our lack of specification of how extended families behave over the life cycle, since the life-cycle-income hypothesis was developed for individuals in nuclear families in societies with well-developed savings institutions. The families on the farms in our sample frequently contain more than one generation, and our inability to separate the activities of the separate age groups may be responsible for weak significance levels. Eacb family may indeed experience a life-cycle pattern of saving and dissaving, but our data aggregate different points in that cycle for several families. However, the youngest age group is less likely to have a fully grown, second generation on the farm, while the two older groups may. Empirically, there are few clear associations between age of head and the indicators of family structure in the sample.
13 Khandker et al. (1987) found evidence, from unadjusted first-order conditions, of overuse of land in their Bangladeshi farm sample and suggested that the result might represent allocation of more land to crops than is technically required to produce an expected target crop, intended to reduce the likelihood of severe production shortage. While such behavior is not a certainty in our case, it cannot be excluded as a possibility.
I).W. Jones et ai. ~Resource and Energy Economics 17 (1995) 155-188 171
The system estimation of income and capital stock components indicates a trade-off between children and capital accumulation in all three categories, al- though children had no effect in the single-equation income regressions. There is some evidence that capital stock of all three types, per adult and per capita, is smaller with older age of farm head, although that result does not appear in regressions of capital stock per farm. Using these two variables - age of farm head and number of children - simultaneously should hold constant much of the effect that ageing would have on moving children out of the right-hand side of the equation and into the denominator of the dependent variable. It is possible that these equations highlight both a long-term decapitalization of farms and the influence of population growth as a drag on capital accumulation. Population growth cannot be identified as a cause of decapitalization~ but it may slow capital accumulation while other factors actively encourage the conversion of capital into current consumption. We focus on Age as an indicator of decapitalization over time rather than T. The time-on-lot variable had little explanatory power, possibly because of farmers' mobility. The results appear to indicate that time in farming, represented by age, rather than simple time on the current lot is the motive force behind the apparent decapitalization.
4. The success of farming: length of time on lot and burning strategies
The length of time a farmer survives on his lot (variable T) is an indicator of success, at least in the sense that circumstances have not forced abandonment. Length of time on the current lot is a cumulative variable and should be affected by stock rather than current flow variables. Greater human capital should foster longer survival, and income diversification should stabilize income, raising the probability of continued occupance. An older farmer has greater opportunity to have been on his or her lot longer than a younger farmer. We use two measures of this: the age of the farmer upon arrival on the current lot and the length of time in Rond6nia. We also assess whether farmers who pick lots closer to town survive better than those who settle at less accessible sites. Burning strategies, both for clearance and for periodic weed control, may be more or less successful, either raising or lowering the probability of economic :mrvival on a lot. For this construct we use a set of dummy variables representing frequencies of burning: annual, irregularly, never, etc. Finally, we assess whether soil quality affects length of survival.
However, determinants of T are choice variables themselves and influenced by T. First, the burning strategies themselves are subject to learning, represented by length of time on the current lot. Some of this learning may be about the effects of different methods and strategies of burning in general, and some ~bout responses of the specific lot to different burning practices. The farm's location itself is a choice, and access to the principal market town should be a desirable locational
172 D.W. Jones et al. / Resource and Energy Economics 17 (199S) 155-188
characteristic. In a recently settled region earlier settlers may have located closer to the town, leaving later settlers with higher probabilities of purchasing more distant lots. Year of arrival on the current lot is simply the present year minus years on the current lot, the variable component of which is T. The Distance variable is determined simultaneously with T. As a farmer enjoys longer tenure on a lot, he or she may learn more about obtaining income from additional sources on it. Additionally, several years' success in low-capital-intensity crops might permit enough savings to be retained to purchase a cow or two or some other animals. Alternatively, cattle income could provide money for expansion into some peren- nial cash crops.
Farmers can diversify income by choosing an array of farm activities and can find part-time income sources off-farm, in town, on another farm, or elsewhere. 14 Greater access to the town could lower the cost of off-farm opportunities, possibly leading to greater diversification of on-farm activity farther from the town. 15 Additionally, the same absolute risks are larger proportions of net farm product prices (net of transportation costs) farther from market, making ordinary farm risks a more serious matter farther from town (Jones, 1983). These relationships make Diversification a function of Location, which is already suspected to be endoge- nous. We lack information on off-farm employment, but the data can reveal consistency of behavior with existence of off-farm opportunities.
The interactions between length of time on lot and its proximate determinants yields a system of simultaneous equations accounting for burning strategies, farm activity diversification, and location relative to Ouro Preto. The implication of this reasoning is that neither farm survival time nor burning strategies can be assessed independently of each other. With information sufficient to support four burning strategies (every year, B~; two or more years, B2; never or only in the first year, B3; and one year other titan the first, B4), the probabilities of choosing three of which are independent, we torm a six-equation system with equations for the B~, i = 1, . . . ,3, T, Location, and Diversification. In linear form, the system is:
3 B 1 = a 1 + ~ bljSoilj + b~4T + b15Location + b16 H + b17E + b18NF
j = l
+ b l9Lca + b l loLcp + b l l l L p + u 1
14 Mining is one off-farm earning opportunity for Rond6nian farm family members presently. A few of our farm owners live in the town; while we do not have information on non-farm activities of their household members, town residence would offer a higher probability of some member supplementing family income with town employment which may have a low or negative correlation with farm income.
15 In fact, most of the off-farm employment is on other farms. We do not have sufficient information to assess the covariance of yields over this heterogeneous landscape; additionally, different crop mixes could yield low or negative covariance pat!eros for overall revenue with price variations common to the entire area. For absentee owners located in Ouro Preto, supervision costs would be lower, ceteris paribus, for farms located closer to town.

D. W. Jones et aL ~Resource and Energy Economics 17 (1995) 155-188 173
3 B 2 -- a 2 4- £ b2jSoil j 4- b24T 4- b25Location 4- b26H 4- b27E 4- u 2
j = l 3
B 3 = a 3 4- ~ b3jSoilj + b34T + b35Location 4- ba6H j = l
-1- b37 Diversification 4-//3 3 8
T = a 4 4- ~'~b4jSoil j 4- b44Location 4- b45H 4- ~ b 4 j B j j = l j=6
+ b49Diversification + b410AAL -t- U 4 3 8
Location = a s + ~ bsjSoil j + b54T + bssH + ~ bsjB j + b59AAL j = l j=6
+ bsloN F + U5 3
Diversification = a 6 + ~ b6jSoil j + b64Location 4- b6sH j=l
8
+ ~ bbjB j + b69L + b61oTR 4- U 6 . (5) j=6
In the B~ equation, Lca is net cultivated area in annual crops, Lcp is net cultivated area in perennial crops, and Lp is pasture area. In the Diversification equation, L is total lot size, which includes cultivated area, pasture, and uncleared area. Variable AAL in the T equation is the age of the farmer upon arrival on his or her present lot. In the Diversification equation, TR is the year the farmer arrived in Rond6nia.
The dichotomous character of the B i variables makes this system difficult to estimate, so we substitute endogenous expressions for the burning strategies into the equations for time on lot, location, and diversification, obtaining a three-equa- tion, quasi-reduced form system which retains the original interactions. The three-equation system is:
3 3
b46 Y'.bij + ~.,b4j a ib46 + a4 j= 1 j = 1
T = + 1 - b14 b46 1 -- b14 b46
b15b46 4- b44 Soilj + Location
1 - b14 b46
bl6 b46 + b45 b49 b4,o + H + Diversification +
1 - bl4 b46 1 -- b14 b46 1 - b14 b46 AAL
blllb46 bq6u1 + u 4
+ 1 - b14 b46 Lp + 1 - b14/:?46
b17 b46 b18b46 b19b46 bllob46 +
1 - b~4b46 E + 1 - b~4b46 NF + 1 - b14646 Lea + 1 - b14b46 Lcp
174 D.W. Jones et ai./ Resource and Energy Economics 17 (1995) 155--188
Location -
3 3
b56 ~_, b3j + E bsj a3 b56 + a5 j = 1 j = 1 b34 b56 + b54
+ Soilj + 1 - b35b56 1 -- b35b56 1 -- b35b56
b36 b56 + b55 b37 b56 + H + Diversification
1 - b 3 5 b 5 6 1 " - b 3 5 b 5 6
b57 b58 b56u3 + u 5 + A A L + NF+
1 - b35 b56 1 - b35 b56 1 - b35 b56
Diversification = a 2 b66 + a 6 -I-
3 3 ] b66 E b2 . /+ E b6j Soilj
j = l j = l J
+ ( b25 b66 + b64)Location + ( b26b66 + b65)H
q- b67L Jr- b68TR + b24b66T + b27666E + b66u2 + u 6. (6)
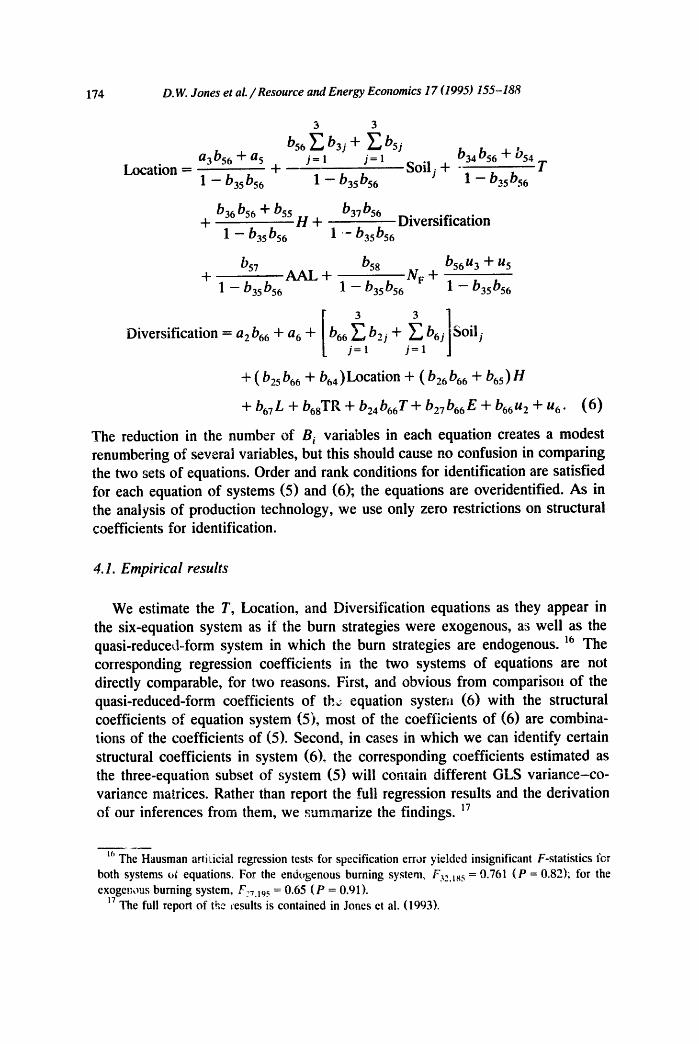
The reduction in the number of B i variables in each equation creates a modest renumbering of several variables, but this should cause no confusion in comparing the two sets of equations. Order and rank conditions for identification are satisfied for each equation of systems (5) and (6); the equations are overidentified. As in the analysis of production technology, we use only zero restrictions on structural coefficients for identification.
4.1. Empirical results
We estimate the T, Location, and Diversification equations as they appear in the six-equation system as it the burn strategies were exogenous, as well as the quasi-reduced-form system in which the burn strategies are endogenous. 16 The corresponding regression coefficients in the two systems of equations are not directly comparable, for two reasons. First, and obvious from comparison of the quasi-reduced-form coefficients of the: equation system (6) with the structural coefficients of equation system (5), most of the coefficients of (6) are combina- tions of the coefficients of (5). Second, in cases in which we can identify certain structural coefficients in system (6), the corresponding coefficients estimated as the three-equation subset of system (5) will contain different GLS variance-co- variance matrices. Rather than report the full regression results and the derivation of our inferences from them, we summarize the findings. ~7
~' The Hausman artificial regression tests for specification error yielded insignificant F-statistics for both systems ui equations. For the end~genous burning system, F32.185 = 9.761 (P = 0.82); for the exoge,t~ous burning system, F..-7.195 = 0.65 (P = 0.91).
17 The full report of th~ ~esults is contained in Jones et al. (1993).
b. IA: Jones et al. / Resource and Energy Economics 17 (1995) 155-188 175
Longer time on lot lowers the probability of adopting an annual burning strategy; symmetrically, annual burning occurs more frequently on farms with shorter occupancies. This could occur for any of several reasons: large, initial clearance efforts might yield to more routine, maintenance clearance; annual burning may lower probability of farm survival; longer-established farmers may change burning strategies. Farms on soil type 3 are likely to have longer tenure than those on soil type 4, but soil types 1 and 2 show no such effect; location on soil type 3 also raises the probability of annual burning or burning in two or more years. Farms receiving more extension visits are more likely to burn annually, although the causation is open to question. A larger number of adults on a farm raises the probability of annual burning. Larger hectarage in annual crops raises the probability of burning annually, probably reflecting the use of burning for weed control, while larger area in perennial crops and larger pasturage reduce that probability. Larger pasturage discourages annual burning relative to burning only in one year other than the first year on the lot.
Location closer to Ouro Preto is associated with longer tenure and raises the probability of adopting an annual burning strategy, which cuts against the partial relationship between location and time on lot. Better access to sources of income security in or near the town may permit farmers to conduct riskier, or at least more frequent, bv rning strategies, or access to a more concentrated labor pool near the town may lower the cost of more frequent burning. 18 Location farther from town encourages diversification of farm activities. As noted above, earlier settlement on a lot is likely to have been closer to Ouro Preto and also allows time to have established perennial tree crops, which are the most likely candidates for diversifi- cation of income sources. ~9 If a farmer burns in two or more years, he is likely to diversify less than if he had chosen burn strategy B4. Correspondingly, greater diversification makes a farm mere likely to adopt burn strategy B 3 (never or only in the first year), and location farther from Our6 Preto tends to push a farm into burn strategy B 3. T h u s , greater diversification tends to be accompanied by less frequent burning. If greater diversification creates a more broken up field pattern, which raises costs of controlled burning, this result is intuitive. Additionally, greater diversification would move farmers into perennials, some of which cannot exist with a frequent burning regime.
~8 We do not have inform~,tion on agricultural employmet~t of the numerous unemployed in Ouro Preto, and there is in fact some question about the extent of agricultural employment of Our(} Preto residents, but there appears to be more hired labor than would derive from interfarm hiring, and farmers are known to complain about thc high cost of labor for slashing (in preparation for burning), suggesting that they do hi[e some labor for burning and would hire more if it were cheaper.
~0 Howev,er, some of the perennial trees, e.g., rubber, Brazil nuts, and palms, were already in the forest at the time of establishment of the farm and consequentiy do not need to be planted. Their principal n~ed is to be protected from fire.
176 D.W. Jones et al. / Resource and Energy Economics 17 (1995) 155-188
Overall, burning strategy and on-farm diversification appear to be well-in- tegrated choices, and both appear to be related sensibly to survival probability measured by time on lot. Although location may be a somewhat more constrained choice than burning or diversification, location appears to exercise its own effects on diversification and burning, and hence on survival as well.
5. Forest clearance and land use
Forest clearance decisions appear to be too complicated to be amenable to single-equation models of either the stock of cleared land on a farm (the percent of the lot cleared) or our approximation to the average annual rate of clearance (hectares per year). The complete story about clearance appears to proceed as follows. Higher productivity of land in cultivation and in cattle activities (average product of land) has two, opposing effects on the average annual rate of land clearance (hectares cleared per year), controlling for farm size and other indicators of the scale of operation: while greater income opportunities tend to encourage clearance, higher productivity of land already under cultivation tends to dampen expansive tendencies intended to compensate for soil exhaustion. It appears that the latter effect dominates in this sample, although we cannot tell whether it tends to dominate on each farm or whether this is an aggregate outcome. Higher labor costs of clearance have a modest, but statistically highly significant, retarding effect on clearance rates. Reinforcing the evidence from annual clearance rates, higher productivity in both groups of activities leads to a smaller stock of cleared land on a farm, controlling for farm size. Farms with larger current stocks of cleared land tend to be longer established than those with smaller cleared stocks and appear to have been cleared somewhat more rapidly, although neither effect is large or statistically significant at conventional levels. More rapid clearance appears to depress productivity in cultivate6 crops but has little discernible effect on productivity in cattle activity. The negative relationship between land produc- tivity and clearance rates suggests that more rapid clearance is less careful and is in fact a response to low or declining productivity of land, possibly even the wearing out of land. The total stock of cleared land has no effect on productivity in cultivated crops but has a strong, negative effect on productivity in cattle. Larger stocks of cleared land also encourage more rapid rates of clearance, although the reverse effect is weak. Of the four variables which appear to plz:y a major role in these interactions - the average annual clearance rate, the total stock of cleared land, and productivity in cultivated crops and in cattle production - we do not find all three variables to be statistically significant in any equation, but their interconnectlons indicate the endogeneity of all four.
We model interactions among current clearance decisions, the current stock of cleared land, and the productivity of land in cultivation and in cattle activities. The flow demand for newly cleared land depends on the productivity of land in the
D.W. Jones et aL /Resource and Energy Economics 17 (1995) 155-188 177
activities to which it can be put, as is the demand for the total stock of cleared land. The productivity of land in various activities is, in turn, affected by the rate of clearance of land, but not necessarily positively. Finally, the total stock of cleared land is a function of the average clearance rate, among other factors. We consider four equations estimated simultaneously by three-stage least squares: the yearly clearance rate equation, the cleared land stock equation, and an equation each for the productivity of land in cultivation and in cattle activities. The equation for the yearly rate of clearance is:
Clearance/year = C(productivity, clearance cost, soil quality, location,
burning strategy, time).
The stock equation is:
Stock of cleared land
--S(productivity, clearance rate,
stocks of complementary and substitute inputs, time).
The productivity equation in each activity has the form:
Productivity/hectare = Pi(l°cati°n, clearance rates, stock of cleared land,
competing uses of land, scale effects,
human capital, time, soil quality, burning strategy).
In the land productivity equations, location is a surrogate for the farmgate price of output. With a cross section of observations, we are unable to obtain any variance of crop, cattle, or milk prices over time, from which to estim.~: ~ the effects of price, ~-"'ou, ,I,;th...... relatively detailed spatial data, locational variation across farms may capture differences in farmgate (i.e., net of transportation costs) prices. 20
We estimate this system with annual clearance and stocks of cleared land as levels, i.e., the number of hectares of each, and as proportions of total farm area, with similar results. We recognize _a measurement problem in our average annual clearance measure. The variable should be constructed as the hectares of cleared land divided by the number of years the farm has been in operation, but the only information we have on the denominator is the number of years the current occupant has been on the farm. Construction of the average clearance rate with occupancy time rather than with farm operation time introduces a measurement error which biases upward the calculated clearance rate, a bias which becomes less serious with longer occupancy time of the current operator. Examination of this va~.iab!e indicates tbaL despite the measurement error, it contains a good bit of
2o Deaton (1988) uses this technique with rural household consumption data from the C6te d'lvoire,
with encou:aging results.
178 D.W. Jones et al. / Resource and Energy Economics 17 (1995) 155-188
Table 3 Forest clearance and land use a
Independent Dependent variable
variables Lc! Scl Yc / Lc Ymb / Lp Intercept
Soil 2
Lcl
Scl
Y~/L~
Ymb/Lp
N c / h a (clearance cost)
C2/Lp
Location
B I
- 0.429 ( - 0 . 8 4 )
[0.4065]
0.520 (3.89) [o.00o31 - 0.031 ( - 0 . 1 8 ) [0.8574] -0 .030 ( - 0 . 4 1 ) [0.6809]
- 0 . 1 9 7
( - 3 . 7 0 ) [o.ooo61
0.152 (lYS) [0.08691
0.171 (1.60) [0.1172]
1.973 2.746 (5.11) (5.83) [0.0001] [0.00011
-0 .159 ( - 1 . 4 5 )
[o.15431 0.077 - O.349
(0.78) ( - 1.34) [0.4387] [0.1872]
- 0.029 ( - 0 . 1 1 ) [0.9152]
- 0.259 ( - 2.44) [0.0183] -0 .558 ( - 7 . 6 8 ) to.oooll
0.637 (8.34) [o.oool1
0.170 (1.39) [0.1713]
0.050 (1.05) [0.3000]
- 0.094 ( - 0 . 7 6 ) [0.4493]
0.159 (2.51) [0.01571
- 0.257 ( - 1.66) [0.1029] - 0.378
( - 1 . 8 8 )
[0.o662]
3.195 (7.92) [0.00011
0.099 (0.77) [0.4450] - 0.880 ( - 6 . 5 5 ) [0.0001] - 0.354 ( - 2.77) [0.0080]
0.172 (1.08) [0.2838]
0.525 (16.66) [o.oool1
D.W. Jones et al. / Resource and Energy Economics 17 (1995) 155-188 179
Table 3 (continued)
Independent variables
Dependent variable
Lcl Yc / Lc Ymh / Lp
B 2 0.159 (1.31) [0.1954]
B 3 0.673 (3.87) [o.0003]
System weighted R 2 0.896 System weighted 2.256
MSE, D.F. 189 Observations 55
a All variables except dummies are in logarithms. T-statistics are in parentheses. Probabilities for two-tailed tests are in brackets.
information on annual clearance and, considering data availability, we should not discard it. 21
5.1. Empirical results: !. Interactions of clearance and profitability
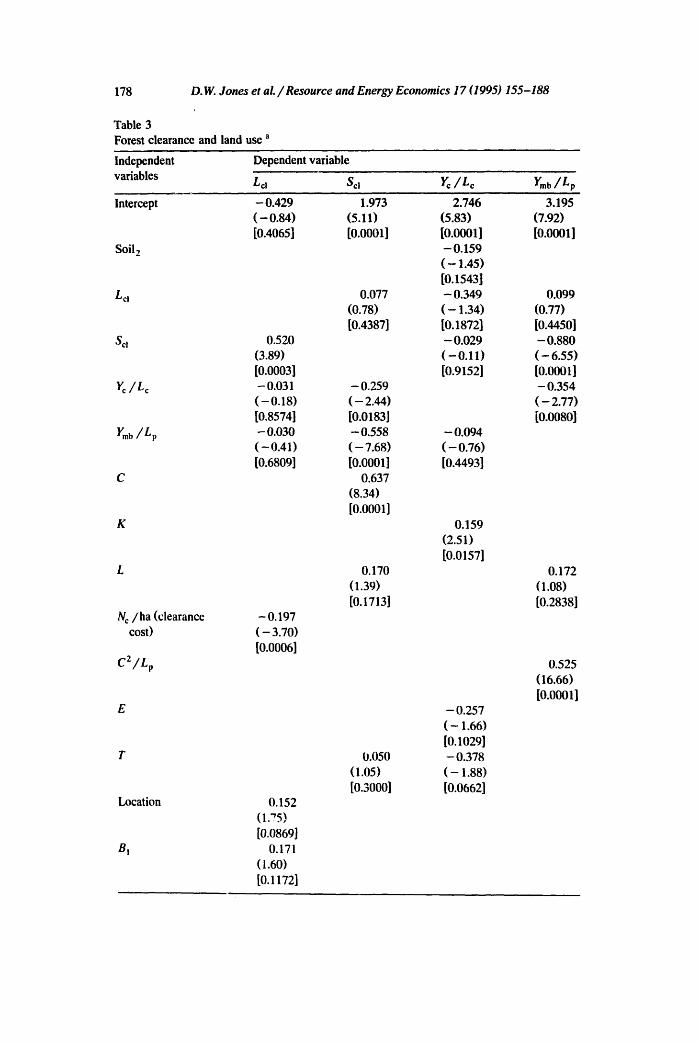
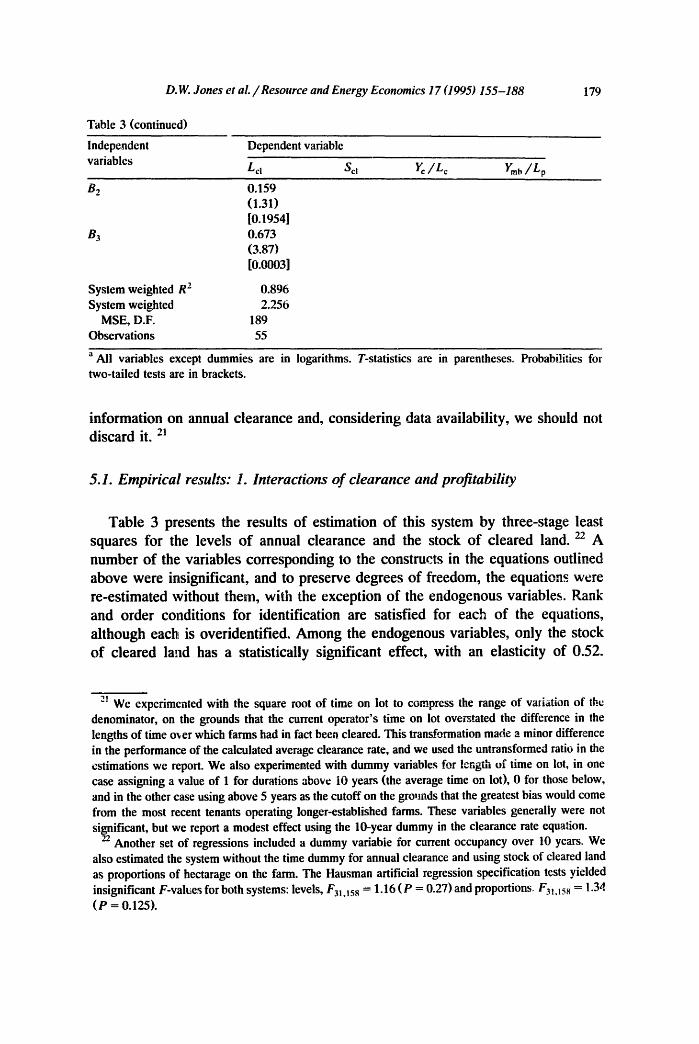
Table 3 presents the results of estimation of this system by three-stage least squares for the levels of annual clearance and the stock of cleared land. 22 A number of the variables corresponding to the constructs in the equations outlined above were insignificant, and to preserve degrees of freedom, the equations were re-estimated without them, with the exception of the endogenous variables. Rank and order conditions for identification are satisfied for each of the equations, although each is overidentified. Among the endogenous variables, only the stock of cleared land has a statistically significant effect, with an elasticity of 0.52.
2~. We experimented with the square root of time on lot to compress the range of variation of the denominator, on the grounds that the current operator's time on lot overstated the difference in the lengths of time o~, er which farms had in fact been cleared. This transformation made a minor difference in the performance of the calculated average clearance rate, and we used the untransformed ratio in the estimations we report. We also experimented with dummy variables for length of time on lot, in one case assigning a value of 1 for durations above 10 years (the average time on lot), 0 for those below, and in the other case using above 5 years as the cutoff on the gro,mds that the greatest bias would come from the most recent tenants operating longer-established farms. These variables generally were not significant, but we report a modest effect using the 10-year dummy in the clearance rate equation.
22 Another set of regressions included a dummy variable for current occupancy over 10 years. We also estimated the system without the time dummy for annual clearance and using stock of cleared land as proportions of hectarage on the farm. The Hausman artificial regression specification tests yielded insignificant F-val~es for both systems: levels, F31.~ss = 1.16 ( P = 0.27) and proportions: F3,.~s8 = 1.34 ( P = 0.125).
180 D.W. Jones et al./ Resource and Energy Economics 17 (1995) 155-188
Productivity per hectare in both activities has a statistically insignificant effect, although using the time dummy (not reported), the neg~tive effect of productivity in cultivated crops approaches a level of significance which we are reluctant to dismiss. The elasticity of annual clearance with respect to the clearance cost is -0.197, and highly significant; this result holds in the unreported regressions with the i0-year dummy as well. Farms located farther from Ouro Preto had a slightly higher annual clearance rate than farms closer to that town; possibly reflecting the introduction of chain saws in the early 1980s, which reduced clearance costs on lots established during that period, at locations farther from Ouro Preto. The relatively infrequent burning represented by B 3 (farmer never burns or burned only in his or her first year on the lot) is associated with higher annual clearance rates, while B~ (annual burning) and B 2 (burni~g in two or more years) have positive effects one-quarter the magnitude of B3, of modest statistical significance. While the modest, positive effects of B~ and B 2 indicate some restricted scope for burning complementing manual clearance, the much larger size of B 3 seems to indicate substitutability between burning and manual clearance. This result is unaffected by the inclusion of the dummy variable for occupance time of the current operator, so the result does not appear te be reflecting the dominant effect of recent entrants' restricted opportunity to burn. Soil type has no influence on annual clearance rates, nor does any measure of farm scale (capital stock, area of the farm, or farm labor force). Finally, the intercept is not statistically different from zero, suggesting that there is no 'automatic' clearance per year; clearance decisions involve definite choices.
In the second equation of Table 3, cattle are a major driver of the stock of cleared land, but while total hectarage on the farm has a positive, marginall2r significant effect, with an elasticity of 0.17, its effect is far from unitary. The stock of cleared land is lower on farms with higher average productivity of land in cultivated crops and in cattle. The average annual clearance rate has a weak, positive, but statistically insignificant effect, as does time on lot by the current operator. While it seems reasonable to expect that larger annual clearance rates and longer times on lot would produce larger stocks of cleared land, two effects may remain combined in the current specification. Ceteris paribus, higher clear- ance rates and longer times on lot would produce a larger stock of cleared land, but if annual clearance rates are dampened by soil which resists exhaustion under the operator's methods of ,lse and care - as seems to be indicated by the significant negative signs on the two land productivity variables in the stock equation - the cetera are not paribus, and the intuitive accounting relationship is interrupted.
Productivity of cultivated land is depressed by more rapid clearance, although the significance level is not especially strong~ but productivity of land in cattle appears to be essentially onaffected by clearance rates. The stock of cleared land has no effect on productivity of cultivated land but sharply depresses productivity in cattle activity. The effects of land productivity in one activity on land

D.W. Jones et ai. / Resource and Energy Economics 17 (1995) 155-188 181
productivity in the other activity seem to reflect limited suitability of a given piece of land for both activities rather than competition between cultivated crops and cattle. The effect of productivity in cattle has a negative but insignificant effect on productivity in cultivated crops, but higher productivity in cultivated crops has a relatively strong, statistically significant effect on productivity in cattle activity. Conversion of worn-out crop land to cattle land could produce this relationship. Time on lot's negative effect on productivity in cultivated crops appears to reinforce this interpretation. Larger scale of operation, as reflected in capital stock, boosts productivity on cultivated land, while a larger scale of cattle operation, represented by C2/Lp, has a strong, positive effect on productivity i~1 cattle activities. The negative sign of extension visits on productivity in cultivated crops seems to reflect greater attention of extension agents to less productive farms rather than to a counterproductive effect of extension.
While a larger number of cattle appears to lead to a larger stock of cleared (deforested) land on a farm, higher productivity of land in both cultivation and cattle activities appears to retard the average annual rate of clearance and the total stock of cleared land. It is generally held to be the case that these sn-mll, family farmers do not clear land directly and immediately for pasture, but rather clear initially for cultivation and later convert cultivated land to pasture, after land productivity in cultivation has declined. The negative sign of time on lot in the productivity equation for cultivated land may reflect such an effect. In the following section, we study the behavior of cattle production in somewhat more detail.
The third and fourth regressions of "Fable 3 explore further the relationship between cattle activities and land use on family farms. In the two regressions of dcforestation, the current profitability of cattle activities depressed both the rate of deforestation and the absolute amount of land deforested, on average, per year. The third regression explores the proportion of land used in cultivation as a function of the average value of land in cultivated crops and cattle activities. The average value of pastured land per hectare increases the proportion of a lot in cultivation, but the average value of cultivated land per hectare shows no effect. A larger number of adult family members per hectare increases the proportion of cultivated area, and a llarger number of cattle depresses that proportion, but the clearance cost has no effect. Cultivated crops undoubtedly have higher labor-land ratios than cattle activities, but the cost of clearance exhibits no discernible influence on the proportion of a lot in cultivation. Location and soil types also show no influence, but time on lot has a strong, statistically significant, positive effect: on the proportion of a lot under cultivation. The fourth regression examines the ratio of cultivated to pastured hectarage as a function of the same variables The average values of land in cultivation and in cattle activities both raise the proportion of land under cultivation, the latter with an effect seven times that of the former and highly :~ignificant. A larger number of catile tilts the proportion of land use toward pasturage, and clearance costs again show no effect. Apparently

182 D.W. Jones et al. / Resource and Energy. Economics 17 (1995) 155-188
clearance costs are the same for the two uses. A larger adult family labor force raises the ratio of land under cultivation to that in pasture. A longer time on lot raises the ratio of cultivated hectarage to pasture. The average values of land in cultivation and in pasture may not represent the relative profitabilities of the associated activities because of different relative costs, but we would expect the measures Y J L c and Ymb/Lp to understate the relative cost of cultivation activities, which would depress the size and significance of Y J L c but not affect the sign of Ymb/Lp. We have studied the possibility of simultaneous equations bias between Lc/L p on the one hand and Yc/Lc and Yp/Lp on the other, but that problem appears to be minimal. A story which would account for the positive sign and strong significance on Ymb/Lp in the third and fourth regressions revolves around the target income concept, which has not found particular favor in analyses involving peasant profit maximization. Nonetheless, if a small area devoted to highly profitable cattle activities were able to deliver a target cash income, greater profitability per hectare in ~: ttle activities could release land for cultivation of crops. The question remains wi~ J farmers would want to restrain cattle activities at such a target income and move their land thereafter into cultivation. Such a target income concept could play a role as insurance: if cultivated crops have a particularly bad year, the cattle activities may supply cash to purchase items that ordinarily would have been grown at home. But why not expand the cattle activities if they m'e more profitable and purchase more of those other items every year? Capital market barriers may exist which prevent farmers from borrowing to expand profitable activities, but it is not obvious that credit rationing would produce the relationships we observe.
5.2. Empirical results: 2. More on the role of cattle
Does the negative relationship between cattle income and deforested area and the positive relationship between cattle income and the share of land in cultivation reflect primary feeding of cattle with corn, with pasture used as a suppiement or simply a place to keep cattle? We study the derived demand for corn in beef and milk production and the derived demand for land in corn. In unreported regres- sions we find a more prominent role for corn in beef production than the production function revealed, but overall cattle production is not a prime influence on corn production. Pasture appears to be the major feed source for beef and, particularly, milk cattle.
Finally, we consider an insurance hypothesis about cattle income. Suppose cattle income is reliable, but that perennial cash crops offer a higher rate of return but a higher variance. Do farmers increase the share of cattle income in their portfolios to balance a higher share of assets in perennial crops, at the cost of putting a squeeze on annual crops? We examined this hypothesis in other unreported regressions, finding that a larger share of more secure cattle income does not foster gambling on perennial crops and, in fact, appears to permit farmers
D. W. Jones et al. / Resource and Energy Economics 17 (1995) 155-188 183
to allocate more (non-land) resources to annual crops, possibly because income from cattle can be used to purchase food when home production falls short, but only at sharply higher prices farther from harvest time, reflecting storage costs at high interest rates. Our assessment suggests that cattle income appears to be a hedge that permits more extensive attention to subsistence activities rather than a springboard for gambling in the cash crop markets. This interpretation reinforces the suggestion of a target income concept among these farmers, which we discussed above.
6. Discussion
Our examination of farming in Rond6nia is hampered by our restriction to cross-sectional data. The crucial questions being asked about Amazonian develop- ment involve sustainability, admittedly a loosely defined concept. But the urgency of addressing tropical deforestation requires that analysis begins before adequate time series are available. Our analysis shows that f~.rmers decisions are thoughtful and well-integrated over their range of activities. Although we cannot address the future success of their strategies, we can point to the lengthy survival of many members of our sample. We have no information on ur~,uccessful farmers who have left the area and cannot evaluate the extent to which our sample is atypical. However, our analysis indicates that tenure of a decade or more is possible with a reasonable and diversified approach to farm management. More extensive time series data and analyses in other regions will be needed to more squarely answer diachronic questions.
Rnnd~ni~n ¢~,~e~ appear to be ,,,or,;,,,, economically thanght-out land-use . . . . . . . . . . w . o L ~ s ~ J a . a ~ a g a t . t a ~ . . . . .
choices. While there is possible evidence of overuse of land relative to cattle, it is possible that different capital-outpet ratios for cattle and laad mask quite similar rates of return on those two assets, which would indicate overuse of neither. We do not have information on the effects of farmers' actions on soil conditions, but production methods, including crop choice, appear to be sufficiently flexible to compensate for a wide range of soil qualities. Burning strategies, whatever their longer-term effects on soil quality, appear to be integrated with current soil quality, income diversification, :and human resource constraints. Deforestation ot individual lots appears m be guided more closely by crop profitability than by profitability of cattle production,, and at any rate, appears to have clear economic rationales, even ff discounting of the future is high. These findings modi~ somewhat the picture of settlement and farming drawn in the recent literature on Amazonia, which has emphasized a routinization of behavior. For instance, it has been cited that a direct relationship exists between increases in paved road mileage and deforestation caused by the land-use practices of colonists arriving in Rond6nia (Fearnside, 1983; Leite and Furley, 19,55). Forest clearing and land use have been reposed to follow a typical pattern. Small areas of forest are cut and burned~ with
184 D.W. Jones et al. / Resource and Energy Economics 17 (1995) 155-188
only a few of the most valuable tree species being harvested. After clearing the forests, the colonists practice "slash and burn' cultivation of annual crops for a few years and then turr~ the land to pasture which is burned annually (Coy, 1987). The land becomes so degraded that it will not sustain any type of farming. The result has been major deforestation with little economic gain for the colonist in the long run. We do not dispute the claims of extensive deforestation in the area, which followed the paving of roads, but the mechanical pattern of entry, clearance, annual burni.ng, mining cultivated land, turning to cattle, and finally abandoning the entire enterprise and moving on does not correspond to the behavioral patterns we find in our survey. While we do not have information on abandonments or other means of exiting the area, the fact that our mean and median farmers have been on their current lots for a decade belies the mobility pattern described in the literature. The superior soils in Rond6nia, relative to those in the Transam~on region, may contribute to the longer tenure, and in fact the definitions of 'good' and 'moderate' soils in Rond6nia predict 'reasonabie' yields for 20 and 10 years, but our statistical analysis uncovers only erratic effects of soil quality on behavior and economic outcomes. Nonetheless, our finding that the productivity of land in cultivation appears to decline with time on lot by the current operator is a disturbing signal that all may not be well, despite the average length of tenure to date. Some observers have cited land speculation as a major force behind clearance. 23 According to this explanation, after initial clearance, farmers do not allow trees to re-establish themselves, maintaining cleared land purely for the potential value to future owners and grazing few cattle in the meantime, on the belief that 'clean' land is more saleable than wooded land. A Brazilian study reported that while 80% of farms in central Rondrnia were clearing pasture, fewer than 40% had cattle, 24 but in our survey cattle were always present when pasture was established. Land speculation may have been important in earlier years and may still be important outside the survey area, but we found no evidence for this pattern around Ouro Preto. The previous reports principally discuss an initial, entry effect which involved extensive clearing. 25 No studies to date suggest the possibility that the initial clearing was accompanied by learning through trial and error. 26 However, our data yield a zero simple correlation between length of time on lot and percent of the lot cleared, which belies the pattern of clearing three
23 E.g., for R~ndonia, Millikan (1988, pp. 145-148); for the eastern Amazon and large ranchers rather than small, family farmers; Hecht (1985) describes clearance incentives given by various subsidies.
24 Comiss~o Estadual de Planejamento Agficc, la (1982). Millikan (1988, p. 131, fn. 20), however, re~orts that many of the non-cattle-owning farms with pasture rented pasture out to farmers with cattle.
E.g., Fearnside (1984) repc.,q:, that clearance was greatest during a colonists' first four years on a lot, levelling off after six years.
26 Moran (1980, pp. 46-57) has contended that chronic mobility reduces the opportunities for farmers to acquire site-specific knowledge and management strategies necessary in the Amazon environment.

D.W. Jones et aL ~Resource and Energy Economics 17 (1995) 155-188 185
hectares a year, abandoning previously cleared land, until the entire lot is cleared and abandoned. 27 Instead, an initial period of rapid deforestation may be followed by a calmer period, closer to an equilibrium pattern of farming practices. This possibility bears examination.
Appendix: variable definitions
Soil!
Soil z Soil 3 Soil 4
Qi Location
P Diversifi-
cation Utilization AAL T TR E Adults Children NF NH Nc Ld
Lea L~ Lp sd L K
K .
dummy variable ffi 1 for soil type 1 (good soil), dummy variable = 1 for soil type 2 (moderate soil), dummy variable = 1 for soil type 3 (restricted soil), default soil type for Soil i (unsuitable soil), output of product i , distance by road from farm to Ouro Preto, unpaved road distances weighted twice paved distances, dummy variable = 1 if previous occupation involves farming, number of i n . m e sources on the farm,
percent of lot cultivated or in pasture, age of farmer when he or she arrived on the presem lot, number of years on current lot, year of arrival in Rond6nia, not necessarily on present lot, integer variable for number of visits by extension agents, number of adult family members (older than 12 years) on the farm, number of children on the farm, family labor (adult), in hours, hired labor, in hours, days used to clear land (deforest) in a year, average land cleared per year, in hectai-es, cultivated hectares in annual crops (gross sown area), cultivated hectares in perennial crops (gross sown area), hectares in pasture, stock of cleared land = Lea + Lcp + Lp, total hectares in lot (includes L i (net sown areas) and uncleared area), capital stock: sum of cumulative expenditures on (1) mechanical equipment, (2) animal-powered vehicles, (3) buildings and other structures, (4) other equipment, and (5) hand equipment,
• 4 K j, i (interest flow of services from capital equipment = K 5 + t Ej = 1 rate) = 0.33; depreciation unknown; hand equipment is largely re- placed annually,
27 Or even the more complicated pattern generated by the occasionally effective 50% clearance law, of 50% clearance, and sale of the uncleared half to a neighbor who sells his uncleared half in exchange.

186 D.W. Jones et al. /Resource and Energy Economics ~ 7 (1995) 155-188
g 1 B2 B3
B4
C Cb(m) '://Lc Y~ ~/Lc
Ymb/Lp
Ymb//Y Yann r er Age LCS i
Agei Dummy
Timelo Dummy
dummy variable - 1 if farmer bums annually, dummy variable -- 1 if farmer bums two or more years, dummy variable - 1 if farmer never burns or burned only in his or her first year on the lot, default burning strategy: farmer bums in only one year other than first year on the lot, number of cattle, number of beef (milk) cattle, gross income per hectare of cultivated land (average product of land), gross income from cultivated crops per cLdtivated hectare (average product of cultivated land), gross income from cattle activities per hec~.are of pasture (average product of pasture), percent of gross income derived from m'hk and beef, gross income from annual crops, gross income from perennial crops, age of farm head; alternatively called Life Cycle Stage, age of farm head, when farmers are divided into three age groups: 1, 35 and under; 2, 36-50; 3, over 50; alternatively called Age i, dummy variable = 1 if farm head is in age group i, i = 1 or 3,
dummy variable = 1 if current operator has been on farm for more than 10 years.
References
Barnum, H.N. and L. Squire, 1979, A model of an agricultural household (Johns Hopkins University Press, Baltimore).
Barrett, S., 1991, Optimal soil conservation and the reform of agricultural pricing policies, Journal of Development Economics 36, 145-165.
Barrow, C., 1990, Environmentally appropriate, sustainable small-farm strategies for Amazonia, in: D. Goodman and A. Hall, eds., The future of Amazonia (St. Martin's, New York, NY) 360-382.
Beatt~e; B.R. and C.R. Taylor, 1985, The economics of production (Wiley, New York, NY). Becket, B.K., 1987, Estrategia do estado e povoamento espont.aneo na expans~o da fronteira agricola
em Rondrnia: Intera~o e conflito, Tiibingener Geographische Studien 95, 235-351. BhaUa, S.S., 1988, Does land quality matter? Theory and measurement, Jo, lrnal of Development
Economics 29, 45-62. Bhalla, S.S. and P. Roy, 1988, Mis-specification in farm productivity analysis: The role of land quality,
Oxford Economic Papers 40, 55-73. Brazil, Departamento Nacional da Produ~o Mineral, Projeto ILADAMBRASIL, 1978, Porto Velho;
Geologia, geomorfologia, pedologia, vegeta~o e uso potencial da terra, Folha SC.20 (De- partamento Nacional da Produ~o Mineral, Rio de Janeiro).
Chambers, R.G., 1988, Applied production analysis (Cambridge University Press, Cambridge, UK). Chambers, R.G. and R.E. Just, 1989, Estimating multioutput technologies, American Journal of
Agricultural Economics 71, 980-995.

D.W. Jones et al. ~Resource and Energy Economics 17 (1995) 155-188 187
Comis~o Estadual de Pianejamento Agricola, 1982, Projeto de desenvolvimento rural integrado de Rond6nia: Caracteristicas e pre~xamaOo 1982/1983 (Comiss~o Estadual de Planejamento Agri- cola, Porto Velho, Rond6nia)~
Coy, M°, 1987, Rond6nia: Fren~e pioneira e programa polonomeste. O processo de diferenciaOo s6cio-econ6mica na periferia e os limites do planejamento publico, Tiibingener Geographische Studien 95, 253-270.
Deaton, A., 1988, Quality, quantity, and spatial variation of price, American Economic Review 78, 418-430.
Feamside, P.M., 1983, Land use ~trends in the Brazilian Amazon region as factors in accelerating deforestation, Environmental Conservation 19, 141-148.
Fearnside, P.M. 1984, Land clearing bebaviour in small farmer settlement schemes in the Brazilian Amazon and its relation to human carrying capacity, in: A.C. Chadwick and S.L. Sutton, eds., Tripical rain forest: The Leeds Symposium (Leeds Philosophical and Literary Society, Leeds, UK) 255-271.
Fearnside, P.M., 1986, Human carryi~ag capacity of the Brazilian rainforest (Columbia University Press, New York, NY).
Feamside, P.M., 1987, Deforestatiow~ and international economic development projects in Brazilian Amazonia, Conservation Biology 1, 214-221.
Frohn, R.C., V.H. Dale and B.D. Jimenez, 1990, Colonization, mad development and deforestation in the Brazilian Amazon basin of Rond6nia, ORNL/TM-11470 (Oak Ridge National Laboratory, Oak Ridge, "IN, March).
Goodland, R.J.A. and H.S. Irwin, 1975, Amazon jungle: Green hell to red desert? (Elsevier, Amsterdam).
Hausman, J.A., 1978, Specification tests in econometrics, Econometrica 46, 1251-1271. Hayes, J. and J.J. FerraronL 1~ o-,Q~. ,,., O¢o~.r~cia de mal~ria numa estrada rec6m-constmlda no Amazonas.
Acta Amazonica 8, 397-407. Hecht, S.B., 1985, Environment, development, and politics: Capital accumulation and the livestock
sector in eastern Amazonia, World Developme,t 13, 663-684. Hoch, l.J., 1958, Simultaneous equations bias in the context of the Cobb-Douglas production function,
Econometrica 26, 566-578. Hoch, l.J. and Y. Mundlak, 1965, Consequences of alternative specification in estimates of Cobb-
Douglas production functions, Econometrica 33, 814-828. Ianni, O., 1978, A luta pela terra (Vozes, Petropolis). Jones, D.W., 1983, Location, agricultural risk, and farm income diversification, Geographical .Analysis
15, 231-246. Jones, D.W. and R.V. O'Neill, 1992a, Land use with endogenous environmental degradation and
conservation, Resources and Energy 14, 381-400. Jones, D.W. and R.V. O'Neill, 1992b, Endogenous environmental degradation and land conservation:
Agricultural land use in a large region, Ecological Ec~nomics 6, 79-101. Jones, D.W., V.H. Dale, J.J. Beauchamp, M.A. Pedlowski and R.V. O'Neill, 1993, Farming in
Rond6nia (Oak Ridge National Laboratory, Oak Ridge, TN, October). Just, R.E., D. Zilberman and E. Hochman, 1983, Estimation of multicrop production functions,
American Journal of Agricultural Economics 65, 770-780. Kalirajan, ICE and R.T. Shand, 1988, Firm and product-specific technical efficiencies in a multipmd-
uct cycle system, Journal of Development Studies 25, 83-96. Khandker, S.R., S. Mestelman and D. Feeny, 1987, Allocative efficiency, the aggregation of labour
inputs, and the effects of farm sizt, and tenancy status: Tests from rural Bangladesh, Journal of Development Studies 24, 31-42.
Klein, L.R., 1947, The use of cross-section data in econometrics with application to a study of production of railroad services in the United States, Mimeograph (Na:~onai Bureau of Economic Research, Washington~ DC).
188 D.W. Jones et aL / Resource arut Energy Economics 17 (1995) 155-188
Klein, L.R., 1953, A textbook of econometrics (Row Peterson, Evanston, IL). Kmenta, J., 1986, Elements of econometrics, 2nd Ed. (Macmillan, New York, NY). Leite, L.L. and P.A. Furley, 1985, Land development in the Braz,qian Amazon, with particular
reference to Rond6nia and the Ouro Preto colonization project, in: J. Hemming, ed., Change in the Amazon basin (Manchester University Press, Manchester, UK) 21-35.
MacKinnon, J., 1992, Model specification tests and artificial regressions, Journal of Economic Literature 30, 102-146.
Marschak, J. and W.H. Andrews, 1944, Random simultaneous equations and the theory of production, Eco~tometrica 12, 143-205.
Millikan, B.H., 1988, The dialectics of devastation: Tropical deforestation, land degradation, and society in RondSnia, Brazil, M.A. thesis (DepartmeM of Geography, University of California, Berkeley, CA, December).
Mittelhammer, R.C., S.C. Matulich and D. Bushaw, 1981, Oti implicit forms of multiproduct-multifac- tor production functions, American Journal of Agricultural Economics 63, 164-168.
Mo~'an, E.F., 1980, Mobility and resource use in Amazonia, in: F. Barbira-Scazzocchio, ed., Land, people, and planning in contemporary Amazonia (Cambridge University Press, Cambridge, UK).
MueUer, C.C., 1979, Recent frontier expansion in Brazil: The case in Rond6nia, in: Proceedings of the Conference on Development of Amazonia in Seven Countries (Cambridge University Press, Cambridge, UK) 141-153.
Nakajima, C., 1969, Subsistence and commercial family farms: Some "t,~oretical models of subjective equilibrium, in: C.R. Wharton, Jr., ed., Subsistence agriculture ano ,.~nomic development (Aldine, Chicago, IL) 165-185.
Pedlowski, M. and V.H. Dale, 1992, Land-use practices in Ouro Preto d'Oeste, Rond6nia, Brazil, ORNL-12062 (Oak Ridge National Laboratory, Oak Ridge, TN, September).
Pitt, M.M. and M.R. Rosenzweig, 1985, Health and nutrient consumption across and within farm households, Review of Economics and Statistics 67, 2!2-223.
SEPLAN/Ro, 1988, Perfil socio econ6mico de Ouro Preto do Oeste (SEPLAN/Ro, Porto Velho, R6ndonia).
Serr~o, E.A. and J.N. Toledo, 1990, The search for sustainability in amazonian pasture, in: A.B. Anderson, ed., Alternatives to deforestation: Steps toward sustainable use of the Amazon rain forest (Columbia University Press, New York, NY).
Singh, !., L. Squire and J. Strauss, eds., 1986, Agricultul'ai househgld models; Extensions, applications, and policy (Johns Hopkins University Press, Baltimore, MD).
Skillings, R.F. and N.O. Tcheyan, 1979, Economic development prospects of the Amazon region of Brazil, Center for Brazilian Studies, Occasional Paper No. 9 (Johns Hopkins University, School of Advanced International Studies, Baltimore, MD).
Smith, NJ.H., 1982, Rainforest corridors; The transamazon colonization scheme (University of California Press~ Berkeley. CA).
Subler, S. and C. Uhl, 1990, Japanese agroforestry in Amazonia: A case study in Tom6-Aga, Brazil, in: A.B. Anderson, ed., Alternatives to deforestation: Steps toward sustainable use of the Amazon rain forest (Columbia University Press, New Yerk, NY) 152-166.
Thornton, J. and B.K. Eaton, 1992, Virtual prices and a general theory of the owner operated firm, Southern Economic Journal 53, 1015-1029.
Zellner, A., J. F, menta and J.H. Dr/:ze, 1966, Specification and estimation of Cobb-Douglas production function models, Econometrica 34, 784-795.