sustainable intensification of key farming systems in ea
117
Africa Research in Sustainable Intensification for the Next Generation Sustainable Intensification of Key Farming Systems in East and Southern Africa Technical Report, 01 April 2019 – 30 September 2019 Submitted to United States Agency for International Development (USAID) Contact Person Dr. Irmgard Hoeschle-Zeledon, Project Manager [email protected] November 2019 www.africa-rising.net
-
Upload
khangminh22 -
Category
Documents
-
view
0 -
download
0
Transcript of sustainable intensification of key farming systems in ea

Africa Research in Sustainable Intensification for the Next Generation
Sustainable Intensification of Key Farming Systems in East and Southern Africa
Technical Report, 01 April 2019 – 30 September 2019
Submitted to United States Agency for International Development (USAID)
Contact Person Dr. Irmgard Hoeschle-Zeledon, Project Manager
[email protected] November 2019
www.africa-rising.net

The Africa Research In Sustainable Intensification for the Next Generation (Africa RISING) program comprises three research-in-development projects supported by the United States Agency for International Development (USAID) as part of the U.S. Government’s Feed the Future initiative. Through action research and development partnerships, Africa RISING is creating opportunities for smallholder farm households to move out of hunger and poverty through sustainably intensified farming systems that improve food, nutrition, and income security, particularly for women and children, and conserve or enhance the natural resource base. The three regional projects are led by the International Institute of Tropical Agriculture (in West Africa and East and Southern Africa) and the International Livestock Research Institute (in the Ethiopian Highlands). The International Food Policy Research Institute leads the program’s monitoring, evaluation and impact assessment.
Africa RISING appreciates support from the American people delivered through the USAID Feed the Future initiative. We also thank farmers and local partners at all sites for their contributions to the program and the CGIAR Trust Fund. © 2019
This publication is licensed for use under the Creative Commons Attribution 4.0 International Licence - https://creativecommons.org/licenses/by/4.0. Unless otherwise noted, you are free to share (copy and redistribute the material in any medium or format), adapt (remix, transform, and build upon the material) for any purpose, even commercially, under the following conditions:
ATTRIBUTION. The work must be attributed, but not in any way that suggests endorsement by the publisher or the author(s).

i
Contents Partners ................................................................................................................................ iii
Summary ...............................................................................................................................1
Africa RISING ESA project action sites .....................................................................................8
Implemented work and achievements per research outcome..................................................9
Outcome 1. Productivity, diversity, and income of crop‒livestock systems in selected agroecologies enhanced under climate variability ...................................................................... 9
Output 1.1 Demand-driven, climate-smart, integrated crop‒livestock research products (contextualized technologies) for improved productivity, diversified diets, and higher income piloted for specific typologies in target agroecologies ............................................... 9
Output 1.2 Demand-driven, labor-saving, and gender-sensitive research products to reduce drudgery while increasing labor efficiency in the production cycle piloted for relevant typologies in target areas ....................................................................................................... 21
Output 1.3. Tools (including ICT-based) and approaches for disseminating recommendations in relation to above research products, integrated in capacity development .......................................................................................................................... 23
Outcome 2. Natural resource integrity and resilience to climate change enhanced for the target communities and agroecologies ..................................................................................... 32
Output 2.1. Demand-driven research products for enhancing soil, land, and water resource management to reduce household/community vulnerability and land degradation piloted in priority agroecologies......................................................................................................... 32
Output 2.2 Innovative options for soil, land and water management in selected farming systems demonstrated at strategically located learning sites ............................................... 32
Outcome 3. Food and feed safety, nutritional quality, and income security of target smallholder families improved equitably (within households) .................................................. 43
Output 3.1: Demand-driven research products to reduce postharvest losses and improve food quality and safety piloted in target areas ...................................................................... 43
Output 3.2 Nutritional quality due to increased accessibility and use of nutrient-dense crops by farmers improved .................................................................................................... 56
Outcome 4. Functionality of input and output markets and other institutions to deliver demand-driven sustainable intensification research products improved .................................. 60
Output 4.1 Access to profitable markets for smallholder farming communities and priority value chains facilitated ........................................................................................................... 60
Outcome 5. Partnerships for the scaling of sustainable intensification research products and innovations ................................................................................................................................. 65
Output 5.1 Opportunities for the use and adoption of sustainable intensification technologies identified for relevant farm typologies ............................................................ 65
Output 5.2 Strategic partnerships with public and private initiatives for the diffusion and adoption of research products ............................................................................................... 94

ii
Capacity building ............................................................................................................... 106
Challenges and actions taken ............................................................................................. 108
Communications and knowledge sharing ............................................................................ 109
Selected reports and publications ....................................................................................... 111
Peer reviewed journal articles .................................................................................................. 111
Reports ..................................................................................................................................... 112

iii
Partners ADD Agriculture Development Division, Malawi AGRA Alliance for a Green Revolution in Africa ARI-Naliendele Agricultural Research Institute, Naliendele, Tanzania ARI-Hombolo Agricultural Research Institute, Hombolo, Tanzania ARI-Selian Agricultural Research Institute, Selian, Tanzania CIAT International Center for Tropical Agriculture CIMMYT International Maize and Wheat Improvement Center DALDO District Agriculture and Livestock Development Officers (Malawi) ICRAF International Center for Agroforestry Research ICRISAT International Crops Research Institute for the Semi-arid Tropics IFPRI International Food Policy Research Institute IITA International Institute of Tropical Agriculture ILRI International Livestock Research Institute LUANAR Lilongwe University of Agriculture and Natural Resources, Malawi MSU Michigan State University MAFC Ministry of Agriculture, Food, and Cooperatives, Tanzania MERU- AGRO MERU-AGRO Seed Co MMFL Minjingu Mines and Fertilizer Co NAFAKA II Cereals market system development (Tanzania) SAIOMA Strengthening Agricultural Input and Output Markets SFHC Soils, Food, and Healthy Communities, Malawi TLC UDOM ZARI WU WorldVeg
Total Land Care (Zambia, Malawi) University of Dodoma, Tanzania Zambian Agriculture Research Institute Wageningen University, The Netherlands The World Vegetable Center

1
Summary The current reporting period presents substantial research products as most of the research data were collected during this period. In some cases, it is a build-up, reflecting trends starting with data collected in previous seasons. We continued deployment of elite crop varieties, which have a critical and significant role in improving smallholder agricultural production systems using the SI approach. Drought tolerant and high yielding maize hybrids are among the elite crops that were validated in central Tanzania. Eighteen best performing hybrids selected from previous years’ studies, were further validated for their performance under on-farm conditions during the 2019 cropping season. Out of these, four hybrids (CKDHH170114, CKH160231, CKDHH170346, and CKDHH1600016) have now been identified for scaling, based on their superior yield and agronomic performance as well as profitability. Africa RISING is partnering with formal seed companies, notably Meru Agro, to push for promotion of these hybrids as a precursor to production of seed for farmers. In the same central region of Tanzania, new Africa RISING crop (groundnut, pigeonpea, sorghum, and pearl millet) varieties, released or proposed for release, were tested. The elite materials out-performed the landrace controls and had relatively less yield loss, sometimes up to three-fold less when planted late compared with the landrace There was differential site reaction of the test material, confirming our early classification of sub-ecologies, while identifying the suitable adapted high performing material. We therefore successfully mapped genotype to ecology to inform scaling out. Production of seed for these crops is through the informal community seed bank approach. To address improved availability of seed for the introduced elite crop varieties, both maize and groundnut seed value chains were studied as representatives of the formal and informal seed systems in central Tanzania. Preliminary analysis of the survey data shows that improvement of the groundnut seed systems to deliver technologies requires, among others, strategic partnerships and building the seed value chains from the supply side. Grain production is slowly driving demand for improved inputs such as seed. Starting with informal seed systems is critical because it provides basic information to guide private sector investment into formal seed systems. In Malawi, Africa RISING consolidated availability of quality seed for soybean, groundnut, and nutrient-dense common bean varieties, through a network of 300 seed producers who received 20 kg foundation seed each during the 2017/18 cropping season. About 46 tons (t) of Quality Declared Seed (QDS) were distributed to over 4000 baby farmers at 10 kg seed for each farmer during December 2018. During 2019, we engaged the same experienced 300 farmers to produce seed, with an estimated 50t seed produced. Seed farmers have been linked to the Agriculture Extension Coordination Committee (DAECC) for assistance with marketing the seed they produced. Over the next few months, we will study the viability of this community seed production and marketing system when farmers seek for real markets, beyond the Africa RISING project facilitation. Validation of cereal‒legume intercrop and rotational diversity has continued in terms of identifying when and where each offers advantage and sufficiency. In Malawi, four cropping systems that have been running since 2016 (sole pigeonpea rotated with maize, sole groundnut

2
rotated with maize, groundnut/pigeonpea doubled-up intercrop rotated with maize, and the maize/pigeonpea intercrop system rotated with another maize/pigeonpea intercrop system in the second year) were compared with the traditional maize/pigeonpea intercrop system. Maize yield was 5.51 > 5.01 > 4.06 > 3.05 Mg/ha when grown after sole pigeonpea, sole groundnut, groundnut/pigeon pea doubled-up intercrop, maize/pigeonpea intercrop system rotated with another maize/pigeonpea intercrop system in the second year, respectively. However, of the alternatives tested here, the novel doubled-up intercrop rotated with maize was the only one to perform as well economically as the farmer check. Sufficient economic and environmental returns are required to compensate for opportunity costs associated with maize production limitations due to small farm sizes. The on-seasonal drought in Babati District of Tanzania suppressed the effects of another novel Mbili-Mbili intercropping technology as treatment differences were not observed in the yield assessment of the maize crop. But there were differences in the yield of the early maturing bean intercrop (in two out of 3 eco-zones), ranging from 0.3 t/ha under Mbili-Mbili to 0.5 t/ha under the doubled-up legume system. The drought equally suppressed yield performance of other agronomy trials in central Tanzania, including intercropping with agroforestry’s Gliricidia sepium. However, data generated for other growth indicators like leaf chlorophyll, photosynthetically active radiation, and soil moisture & temperature during the different growth stages are presented to explain some differences between treatments. Crop systems simulation modelling using the Agricultural Production Systems sIMulator (APSIM) has been initiated, using both own and secondary data, to predict performance of different cereal‒legume cropping systems. In central Tanzania, the application of the APSIM model showed that pigeonpea‒sorghum and pigeonpea‒groundnut intercrops have high potential to de-risk production in drought environments. We find that medium duration pigeonpea (takes up to 180 days to mature) are best suited for these ecologies compared to the long duration (takes up to 240 days to mature), currently used by farmers. However, medium duration pigeonpea is affected by shading especially when intercropped with fast growing maize, a common practice in these ecologies. In Malawi, APSIM is being used to explore resource use efficiencies and maize‒legume rotational systems. Model calibration and simulation runs were completed. Simulated maize and legume grain yield generally approximated the observed yields from the 2012/2013 to 2017/2018 cropping seasons (RMSE = 1317 kg/ha for maize and 274 kg/ha for groundnut) confirming prior observations that APSIM is able to predict maize response to fertility inputs, rotation, and intercrops. Total soil organic C simulated in the top 15 cm of soil decreased over the 1986‒2019 period for continuous sole maize in all three agroecological zones of Malawi. Integration of legumes into the maize systems slightly reduced the magnitude of this decrease in soil organic C, especially when pigeonpea was added to the cropping system, signifying the importance of grain legumes in sequestering soil C and eventual sustainability of the cropping systems. The results presented in this report on the effects of net houses and biopesticide application vegetable production represent the end of the experimentation on these technologies. A manuscript for publication is being drafted. In general, net houses increased overall plant performance in terms of vegetative and reproductive growth in both sweet pepper and tomato. The modified weather conditions inside the net houses favour growth of plants compared to open field crops as they prevent/reduce disease outbreaks during adverse weather conditions, especially fungal diseases. Fruits inside net houses are protected from direct sunlight, which

3
often leads to sun scalding. The use of bio-pesticides (Metarhizium anisopliae) was more efficient in controlling T. absoluta rather than whitefly (B. tabaci) although the average insect count of both pests was lower in net houses compared to open fields. Farmer evaluation confirms the research findings; they observed that crops grown inside the net houses performed better than those grown in open fields in terms of quality (skin color, test, texture), low pest incidence leading to low pesticide use, and higher marketable fruits. First season evaluation of the impact of improved management practices (IMP - a technological package of good quality improved seed, healthy seedlings, and good agronomic practices) on the performance of vegetables grown by 64 farmers in Karatu District of Tanzania showed that the practices increased the yield of tomato by 48%, of nightshade by 30%, and of Ethiopian mustard by 28%. Respective incomes increased 57% (tomato), 39% (nightshade), and 40% (Ethiopian mustard). Besides, IMP reduced postharvest losses by 86‒98% for all three vegetables crops. Market participation increased by 14% for tomato, 36% for nightshade, and 11% for Ethiopian mustard. Enhancing soil water infiltration and moisture conservation for better crop growth in semi-arid cropping areas of central Tanzania appeared to falter under the severe drought conditions that prevailed during this cropping period. For example, while rip tillage had 52% grain yield advantage over the control, it was only over a measly total yield of 0.7 t/ha. There were no differences between treatments in biomass yield. This opens up a whole new approach of setting situation boundaries for defining when a technology can be applied successfully. However, because the soil and water conservation studies have been conducted over periods of 3 or more years, they have presented an opportunity for gender and social dynamics analyses. Preliminary results from these analyses show that (i) although gender roles did not emerge as very pronounced in the labor process, the decision of establishing fanya juu terraces is predominantly taken by men, and (ii) both men and women perceived tied ridges as more beneficial in terms of soil moisture, productivity, and income from sales, is less labor intensive during weeding but more during field preparation. Further studies are planned to address social dynamics within collective action groups and capturing the drudgery involved. Other innovations options being validated for soil, land, and water management options have included (i) conservation agriculture (CA) with its associated practices, (ii) combining tied ridges with fertilizer application, (iii) combined climate-smart farming practices, and (iv) contour farming with the use of fodder trees and grass forages to stabilize the bunds. During this reporting period, the CA work engaged in collecting and analysing data from all field trials and conducting a socioeconomic survey whose data analysis is in progress. There are several learning points from the analysed data:
• In intercropping trials under low soil fertility, maize‒cowpea and maize‒lablab rotations had the highest maize yields whereas sole maize and maize‒lablab intercropping after 21 days were lowest.
• Under higher soil fertility maize‒lablab intercropping after 7 days outperformed all other treatments and maize yield was lowest in the sole maize treatment and the maize‒lablab intercropping after 21 days.
• Pigeonpea and lablab provided a great amount of additional biomass both under low and high fertility.

4
• Maize grain yield in the maize‒pigeonpea ratooning trials was dominated by maize‒pigeonpea full rotations but were not significantly different by different ratooning strategies, especially those that were ratooned at harvest and after maize seeding.
• After more than 4 years of CA practice, there is no more maize yield suppression in maize intercropping trials which means that all legumes will be an added advantage to farmers and not a penalty.
• The legume biomass yields obtained in addition to the maize biomass yield by far outweighs sole cropping of maize and will, in the long run, improve soil fertility besides other benefits (firewood, groundcover, nutrition etc.). However, to become attractive to farmers, the legumes also must provide sufficient grain yields to sell. There is need for more research to increase grain yield production.
• Legume grain yields can be very low when (i) they are planted late, (ii) rainfall is high, leading to reduced legume growth due to diseases, and (iii) there is insufficient or ineffective spraying against blister beetle and pod borers.
• Soil chemical analysis between treatments did not show many significant differences although an increase in total N was observed in the maize‒lablab treatment, and higher infiltration in the maize‒pigeonpea intercropping. Soil quality results are not yet conclusive and require further research.
Maize productivity was assessed across several sites in a split-plot experimental design where water management (tied-ridges or ridges only) were the main plots and fertilizer management were sub-plots. Implementation of tied ridges without fertilizer application did not increase maize productivity. Water management had more effect when fertilization was at 100% of the recommended fertilizer rates in the different sites. These results suggest that the benefits of water conservation measures are more pronounced when N and P are adequately supplied. Four fields with climate-smart approaches including micro-catchments, planting of weather-informed varieties, and utilization of slow-release N fertilizer were successfully implemented in Babati District. Collection of the associated data, except dry weight measurements of pigeon pea, is complete. The prevailing weather conditions during the season played a significant role in bean performance in the two eco-zones of Babati. For example, one of the two fields with intercropped beans in Gallapo eco-zone had total crop loss due to on-season drought. Maize grain yields ranged from 1.5 t/ha under the conventional intercrop system to 2.3 t/ha under the system with maize variety choice based on regional weather forecast. Economic profitability of the cropping systems under study will be examined after pigeon pea yield data measurements have been finalized. Productivity and economic benefits of contour farming were determined with maize, Guatemala grass, and G. sepium as test crops. Relative to the farmer practice, contours improved maize grain yield by 200% during the 2018 cropping season. The low and sporadic rainfall patterns appear to have masked the response of maize to improved soil conditions on contours. Fodder and wood yields were less affected by drought and hence contributed to higher gross margins (76‒112%) and returns to labor (12‒74%) when compared to farmer practice. In previous good seasons, maize contributed up to 50% of the gross income. These results demonstrate the benefits of crop diversification in contour farming to enhance agroecosystem resilience and the adaptive capacity of farmers.

5
Increased crop productivity has necessitated research attention to identify and validate technology products that reduce postharvest losses. Three of such products (single hermetic liner bag [AgroZ], double hermetic liner bag [PICS], and metal silo) were installed in 39 farmers’ stores and evaluated for their context-specific challenges in storing maize and beans grain over a period of 7 months. The following are key findings.
1. Overall grain damage levels across the villages were different; relatively higher levels occurred in the higher altitude villages compared to the lower altitude ones.
2. Insect pests survived in all the hermetic containers (maize storage), but the populations were rather low compared with the control. The populations were lowest in the AgroZ bag and highest in the metallic silo. The resultant grain damage by insects followed the same pattern.
3. The hermetic bags used to store maize were perforated by insects. The double liner PICS bags were more damaged by insects compared to the AgroZ bags. About 30% of the PICS bags had > 20 punctures on the inner liner and half of these had also > 20 insect holes in the outer liner. About 15% of AgroZ bags had insect holes > 20. When the hermetic bags are extremely damaged after a single use, they are no longer attractive to farmers. The issue of quality consistency (quality assurance) should be followed up with the private sector manufacturers. If not, a technology that in principle is very useful may disappear from the market.
4. Unlike in previous trials undertaken in our group, the Larger grain borer (Prostephanus truncatus, Horn; LGB) was identified in farmer’s stores. The prevalence was 5‒9% and the pest was found in all the villages.
5. Two thirds of host farmers liked the metallic silo more than the bags because of stability against damage by insects or rodents, and the possibility to store more food in a confined space.
6. From the present results, the PICs bag was not profitable for maize storage while AgroZ was profitable in the 2nd year of use; returns to investment = 6.57%; Net returns 10 $/ton.
7. The different bean varieties exhibited storability differences both in PICS bags and the control; the effects of variety and storage technology were statistically significant.
8. The PICS bags were highly perforated by bean bruchids (at least 50% of bags had over 50 insect holes on the inner liner and 30% had over 50 insect holes on the outer liner as well.
9. Profitability of the PICS bag for bean storage varied with variety depending on the market value, vulnerability to damage, and attack by insects of different varieties. This is new knowledge. Out of the three varieties examined, the technology was profitable for only one variety “Oval yellow”; returns to investment: 10.8‒13.5%; Net returns: 59.4‒$72.8 $/ton.
With the introduced elite crop varieties, some of which were based on their improved nutritional values, a study was conducted to determine drivers of food choice that would lead to adoption of nutrient diets. Pearl millet and pigeon pea were used as test crop products targeting feeding to school children in central Tanzania. Although pearl millet grain is largely perceived in the communities as food for caregivers who generally tend to be female, young, and school going children, over 60% of the caregivers were unaware of the nutritional benefits of pearl millet. A trend of consumption, similar to that of pearl millet, was also observed for pigeon pea. The study concluded that there is need to promote innovative recipes and approaches to

6
expand consumption of these nutritious crop products, especially by adolescents who are a nutritionally vulnerable group. This would probably apply to such other crops like the nutrient-dense bean varieties (SER83 and NUA45) introduced in Malawi’s maize-based cropping systems. In this case, nutrition never featured as a reason for selecting between technologies that involved intercropping the beans with maize during a participatory technology selection exercise. One approach of promoting innovative recipes is messaging, whose potential impact is being tested with vegetables in Karatu District of Tanzania. The baseline survey identified that although several vegetables types are grown, most farmers do not grow any, and 81% of the yield is sold. Farmers still lack knowledge about the nutritional content of vegetables and their health benefits. But more than 80% of the households would like to increase vegetable consumption while 60% of the households indicated that they plan to increase consumption of vegetables among family members. This confirmed the need for training and messaging to increase nutrition knowledge among households in Karatu. Subsequently, a nutrition training was conducted in eight villages during August involving 332 farmers (52% women), 10 NGO employees, eight government extension staff, and 16 restaurants/food kiosk staff. The training equipped participants with knowledge and skills on food groups and better feeding practices to reduce undernutrition, particularly in children under 5 and women of reproductive age. For practical purposes, two new recipes were developed during nutrition training. The impact of these activities will be evaluated during the coming years. Another form of messaging we are exploring is the use of ICTs for linking farmers to markets. The objective of this work is to scale out promising technologies beyond the Africa RISING target sites in Tanzania by providing advice on agronomy, climate services, and market information via mobile phone. Use of interactive videos for training was also deployed as an add-on to improve the knowledge transfer to the farmers. The videos were developed involving the communities and in Swahili language in Tanzania to ensure the literacy gap was bridged, and to give the communities a sense of ownership. During this reporting period, we reached more than 2,200 smallholder farmers (unique profiles in Babati) using SMS information services; 70% were males and 30% females. The low number of registered female farmers may be attributed to mobile phone ownership, which is skewed in favor of men due to cultural and socioeconomic factors. Dissemination of SMS messages for land preparation will soon commence as guided by the cropping calendar. To make the database more attractive and an inch closer to sustainability, profiling at least 200,000 farmers is being targeted. Apart from messaging, the ESA Project is deploying several other approaches to taking the technologies to scale. We are applying the GIS approach to generate regionally relevant extrapolation domain mapping for multiple technologies; included in this report are the fodder trees and grass forage maps, maize‒legume cropping maps and vegetable varieties maps. Related to this is the piloting of FarmMatch (Matching Agricultural Technologies to Farms and their Context) which identifies (i) the most suitable and promising technologies for different types of farms, (ii) where the hotspots of suitability of technologies and potential adopters are, and (iii) which contextual farm and technology characteristics promote the adoption and scaling of technologies. Testing the algorithm for performance, matching, and signaling is still ongoing. We have commenced testing the framework for a number of GIS gridcells in Babati, Tanzania. Developing a “data pipeline” that can extract ARBES data and insert it into farm models, to allow
7
rapid assessment of more complex SI indicators for sampled farms in Africa RISING case study areas. The ESA Project is seriously taking on developing partnerships with institutions whose main role is technology delivery as the driver for taking our technologies to scale. Where these have been successful, technology demonstration sites have been used by the researchers to train partner institutions’ staff and provide them with knowledge about the technology as well as consolidating their abilities in delivery of that technology. These trainings are supplemented by training manuals and backstopping during technology dissemination, as requested. Such institutions include World Vision Tanzania (WVT), FIDE, Re-greening Africa, and Farm Africa (FA) that are interested in livestock technologies (new forage crops, feed processing & rations and housing) in Tanzania; Meru Agro Seed Company, MAMS Agriculture, and Aminata Quality seeds and discussed partnerships for scaling of the new DT QPM hybrids in Tanzania; Islands of Peace for scaling postharvest and improved vegetable production technologies; Catholic Relief Services (CRS) in Zambia and Malawi for scaling green manure cover crops; Total Land Care in Malawi for scaling CA practices; and the World Food Program’s FMNR Project for scaling soil and water conservation practices in Tanzania. Several other development partners are being identified. During this reporting period, the ESA Project has directly offered short-term training to about 3,300 trainees (about 47% women) being mainly farmers and extension agents. We had one PhD, two MSc, and one BSc students on board. Nine peer review manuscripts were published as journal articles.

8
Africa RISING ESA project action sites The ESA-wide geo-referenced sites are shown where Africa RISING was implementing either research activities or technology dissemination over the project time, updated to the current reporting period (Fig. 1).
Figure 1. Locations where the Africa RISING–ESA Project has conducted research (green diamond) and scaling (red triangle).

9
Implemented work and achievements per research outcome
Outcome 1. Productivity, diversity, and income of crop‒livestock systems in selected agroecologies enhanced under climate variability
Output 1.1 Demand-driven, climate-smart, integrated crop‒livestock research products (contextualized technologies) for improved productivity, diversified diets, and higher income piloted for specific typologies in target agroecologies
Validation of drought tolerant maize (DT) hybrids under on-farm conditions in central Tanzania Kongwa and Kiteto districts in central Tanzania normally receive limited rainfall, less than 500 mm annually, with poor distribution. In addition, most areas in Kongwa and Kiteto have poor soils with low fertility; therefore, these two major factors, combined, limit maize yields on-farm to an average of 1.1 t/ha in a season. The crop growing season in 2019 in Tanzania was affected by a very severe drought, which covered a wide region in eastern Africa, so much so that yield data from our experiments could only be obtained from three out of the seven sites. It is under these conditions that the 18 best performing hybrids selected from previous years’ studies were further validated for their performance under on-farm conditions. Four best performing hybrids were selected based on their yield and agronomic performance (Table 1). These same hybrids have high profitability based on gross margins. Table 1. Mean Grain Yield and Agronomic performance of top four performing maize hybrids at Mlali and Nghumbi sites during 2019 crop growing season. These same varieties performed well during the 2018 cropping season.
Hybrid Name Grain weight (t ha-1)
% Gain over check
Plant Height (cm)
Ear Height (cm)
Drought tolerance
Profitability (Gross margin, US$)
CKDHH170114 5.1 1177.5 146 66 Early 618
CKH160231 4.9 1112.8 161 82 Late 575
CKDHH170346 5.0 1154.0 154 84 Early 606
CKDHH1600016 2.6 530.46 ‒ ‒ Intermediate 307
Consolidating availability of quality legume seeds through production of Quality Declared Seeds (QDS) In Malawi, we have consolidated availability of quality seed for soybean, groundnut and nutrient-dense common bean varieties, through a network of 300 seed producers who received 20 kg foundation seed each during the 2017/18 cropping season. About 46 t of Quality Declared Seed (QDS) were distributed to over 4000 baby farmers at 10 kg seed for each farmer during December 2018. Groundnut seed was stored in the shell until just about planting time. This resulted in nearly 100% seed viability, largely surpassing viability of commercial seed that originates from agrodealers. During 2019, we engaged the same experienced 300 farmers to

10
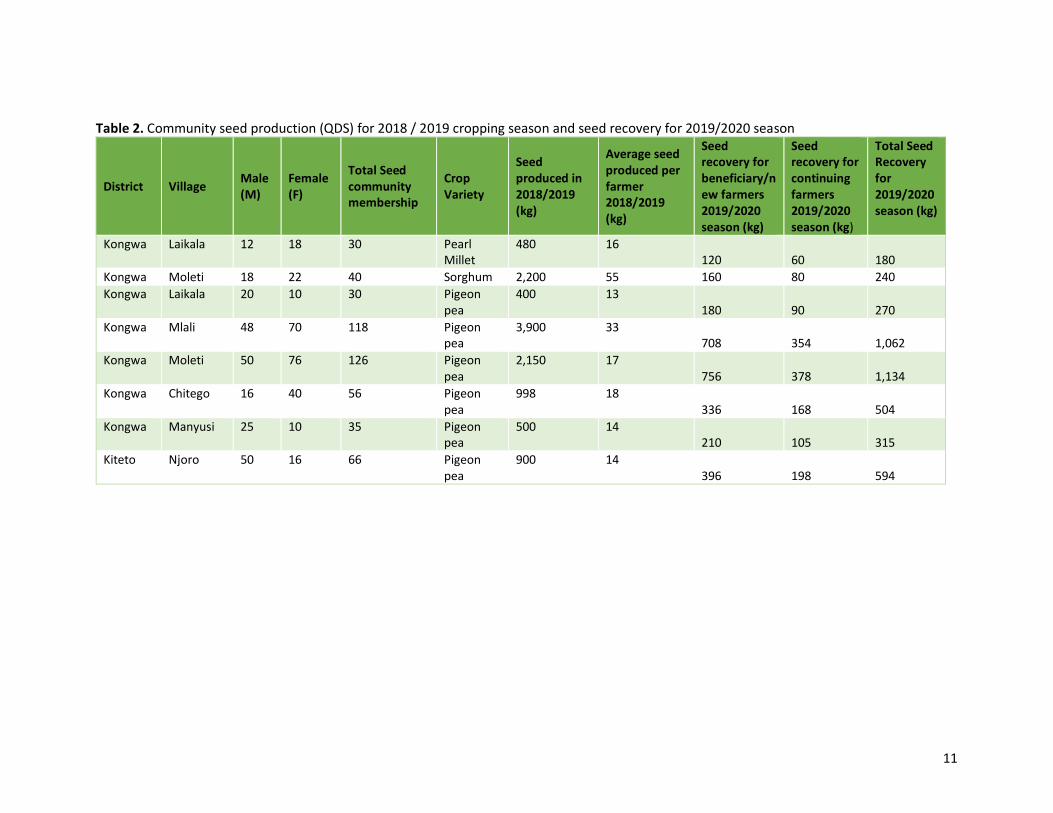
produce seed, with an estimated 50 t of seed produced. As part of our exit strategy, we have only purchased 15 t of this seed for distribution to baby farmers. Seed farmers have been linked to the DAECC for assistance with marketing the rest of the seed they produced. Over the next few months, we will study the viability of this community seed production and marketing system when farmers seek for real markets, beyond the Africa RISING project facilitation. During the past two cropping seasons, Africa RISING bought all the seed produced, save for a mandatory 20 kg that each producer was required to retain for scaling SI technologies on their farms. Consolidating availability of quality cereal and legume seeds through community seed banks In Tanzania, availing to farmers the seed of best performing crops has been tested through multiplying seed through Community Seed Banks (CSB), and the results are promising (Table 2). For pearl millet & sorghum, each farmer gives back 4 kg of seed to CSB to be issued to two new/beneficiary farmers for the following season (2 kg of seed is enough to plant one acre). For pigeon pea, each farmer gives back 6 kg of seed to CSB to be issued to two new farmers for the following season (3 kg of seed is enough to plant one acre). Continuing/current farmers (pigeon pea, sorghum, and pearl millet) are allowed to sell excess seed to earn cash for the betterment of their livelihood.
11
Table 2. Community seed production (QDS) for 2018 / 2019 cropping season and seed recovery for 2019/2020 season
District Village Male (M)
Female (F)
Total Seed community membership
Crop Variety
Seed produced in 2018/2019 (kg)
Average seed produced per farmer 2018/2019 (kg)
Seed recovery for beneficiary/new farmers 2019/2020 season (kg)
Seed recovery for continuing farmers 2019/2020 season (kg)
Total Seed Recovery for 2019/2020 season (kg)
Kongwa Laikala 12 18 30 Pearl Millet
480 16 120
60
180
Kongwa Moleti 18 22 40 Sorghum 2,200 55 160 80 240
Kongwa Laikala 20 10 30 Pigeon pea
400 13 180
90
270
Kongwa Mlali 48 70 118 Pigeon pea
3,900 33 708
354
1,062
Kongwa Moleti 50 76 126 Pigeon pea
2,150 17 756
378
1,134
Kongwa Chitego 16 40 56 Pigeon pea
998 18 336
168
504
Kongwa Manyusi 25 10 35 Pigeon pea
500 14 210
105
315
Kiteto Njoro 50 16 66 Pigeon pea
900 14 396
198
594

12
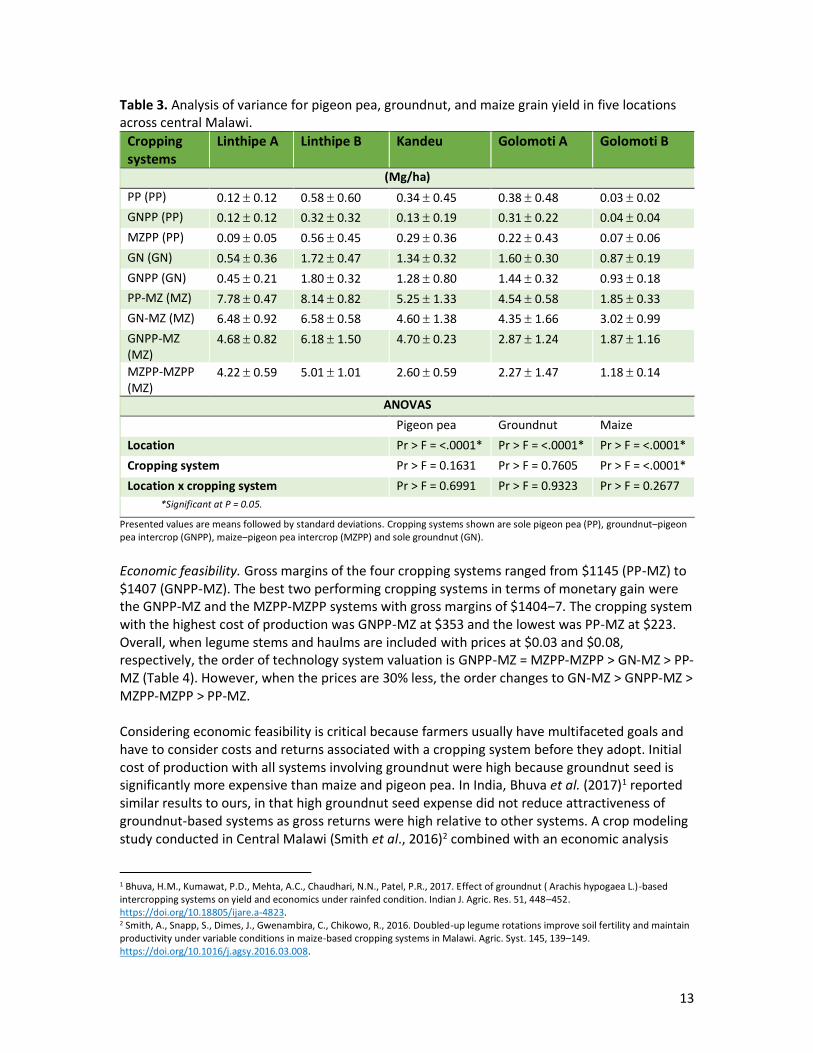
Broadening farmer options through legume rotational and intercrop diversity in maize-based cropping of central Malawi Sustainability of rain-fed cropping across southern Africa is undermined by the dominant maize (Zea mays L.) monoculture. Farmers have traditionally intercropped maize with food legumes, an important source of field and dietary diversity. However, the question remains if intercrop diversity is sufficient, or if rotational diversity is more advantageous. Four cropping systems were tested and set up in a randomized complete block design with four replicates per location. The four cropping systems consisted of (i) sole pigeon pea rotated with maize (PP-MZ), (ii) sole groundnut rotated with maize (GN-MZ), (iii) groundnut‒pigeon pea doubled-up intercrop rotated with maize (GNPP-MZ), and (iv) the maize‒pigeon pea intercrop system rotated with another maize‒pigeon pea intercrop system in the second year (MZPP-MZPP). The traditional maize‒pigeon pea intercrop (MZPP) system was included as the control. Data were analyzed for the period 2016 to 2019. Crop yields. Pigeon pea, groundnut, and maize grain yields are reported in Table 3. Location had a strong influence on grain yield for both pigeon pea and groundnut. In contrast to the pattern observed for biomass, modest to nil grain yield was produced by pigeon pea (0.03 to 0.6 Mg/ha), and it was not influenced by cropping system. Groundnut yields were moderate to high (0.5 to 1.8 Mg/ha) and followed biomass accumulation patterns. For example, aboveground biomass was markedly high at Linthipe B (4.9 Mg/ha), as was belowground biomass (0.2 Mg/ha) and groundnut grain yield was high at this site as well (1.7 to 1.8 Mg/ha). About one-half as much groundnut biomass was accumulated at Linthipe A and Golomoti B, which were also the low yielding sites at 0.5 to 0.9 Mg/ha (Table 3). Productivity of legumes was assessed during year one with a rotational maize crop used to quantify the cropping system effect in year two. Both location and cropping system had a significant effect on maize grain but with no interaction effect. In a comparison of all systems that were fertilized (69kg N/ha for sole maize and 35 kg N/ha for the MZPP intercrop), performance of maize yield across locations in 2017 varied. Maize yield after sole pigeon pea produced the highest maize grain (5.51 Mg/ha), maize after sole groundnut was 5.01 Mg/ha, maize after the GNPP intercrop was 4.06 Mg/ha, and maize yield was lowest in the MZPP intercrop system at 3.05 Mg/ha. These findings were consistent across four of the five locations, the one exception was the lowest yielding site (Golomoti B). During the 2016 agricultural season, the sole groundnut cropping system produced the lowest shoot biomass across all sites. However, the system supported good maize growth and grain yield in 2017 (Table 3).
13
Table 3. Analysis of variance for pigeon pea, groundnut, and maize grain yield in five locations across central Malawi.
Cropping systems
Linthipe A Linthipe B Kandeu Golomoti A Golomoti B
(Mg/ha)
PP (PP) 0.12 0.12 0.58 0.60 0.34 0.45 0.38 0.48 0.03 0.02
GNPP (PP) 0.12 0.12 0.32 0.32 0.13 0.19 0.31 0.22 0.04 0.04
MZPP (PP) 0.09 0.05 0.56 0.45 0.29 0.36 0.22 0.43 0.07 0.06
GN (GN) 0.54 0.36 1.72 0.47 1.34 0.32 1.60 0.30 0.87 0.19
GNPP (GN) 0.45 0.21 1.80 0.32 1.28 0.80 1.44 0.32 0.93 0.18
PP-MZ (MZ) 7.78 0.47 8.14 0.82 5.25 1.33 4.54 0.58 1.85 0.33
GN-MZ (MZ) 6.48 0.92 6.58 0.58 4.60 1.38 4.35 1.66 3.02 0.99
GNPP-MZ (MZ)
4.68 0.82 6.18 1.50 4.70 0.23 2.87 1.24 1.87 1.16
MZPP-MZPP (MZ)
4.22 0.59 5.01 1.01 2.60 0.59 2.27 1.47 1.18 0.14
ANOVAS
Pigeon pea Groundnut Maize
Location Pr > F = <.0001* Pr > F = <.0001* Pr > F = <.0001*
Cropping system Pr > F = 0.1631 Pr > F = 0.7605 Pr > F = <.0001*
Location x cropping system Pr > F = 0.6991 Pr > F = 0.9323 Pr > F = 0.2677
*Significant at P = 0.05.
Presented values are means followed by standard deviations. Cropping systems shown are sole pigeon pea (PP), groundnut‒pigeon pea intercrop (GNPP), maize‒pigeon pea intercrop (MZPP) and sole groundnut (GN).
Economic feasibility. Gross margins of the four cropping systems ranged from $1145 (PP-MZ) to $1407 (GNPP-MZ). The best two performing cropping systems in terms of monetary gain were the GNPP-MZ and the MZPP-MZPP systems with gross margins of $1404‒7. The cropping system with the highest cost of production was GNPP-MZ at $353 and the lowest was PP-MZ at $223. Overall, when legume stems and haulms are included with prices at $0.03 and $0.08, respectively, the order of technology system valuation is GNPP-MZ = MZPP-MZPP > GN-MZ > PP-MZ (Table 4). However, when the prices are 30% less, the order changes to GN-MZ > GNPP-MZ > MZPP-MZPP > PP-MZ. Considering economic feasibility is critical because farmers usually have multifaceted goals and have to consider costs and returns associated with a cropping system before they adopt. Initial cost of production with all systems involving groundnut were high because groundnut seed is significantly more expensive than maize and pigeon pea. In India, Bhuva et al. (2017)1 reported similar results to ours, in that high groundnut seed expense did not reduce attractiveness of groundnut-based systems as gross returns were high relative to other systems. A crop modeling study conducted in Central Malawi (Smith et al., 2016)2 combined with an economic analysis
1 Bhuva, H.M., Kumawat, P.D., Mehta, A.C., Chaudhari, N.N., Patel, P.R., 2017. Effect of groundnut ( Arachis hypogaea L.)-based intercropping systems on yield and economics under rainfed condition. Indian J. Agric. Res. 51, 448–452. https://doi.org/10.18805/ijare.a-4823. 2 Smith, A., Snapp, S., Dimes, J., Gwenambira, C., Chikowo, R., 2016. Doubled-up legume rotations improve soil fertility and maintain productivity under variable conditions in maize-based cropping systems in Malawi. Agric. Syst. 145, 139–149. https://doi.org/10.1016/j.agsy.2016.03.008.

14
found 75% higher profits associated with a groundnut rotation compared to maize monocultures; due in large part to 50% reduced requirements for nitrogen fertilizer in the maize phase of the rotation (Komarek et al., 2018)3. The high gross margin associated with farmer MZ/PP intercrop system was not surprising, that a farmer check system was economically robust. Of the alternatives tested here, the novel doubled-up GNPP intercrop rotated with maize was the only one to perform as well economically as the farmer check. This is consistent with earlier findings of farmer preference for a highly diverse doubled-up rotational system (Snapp et al., 2018)4. A breadth of economic and environmental returns are required to compensate for opportunity costs associated with maize production limitations due to small farm sizes. Table 4. Economic feasibility of four cropping systems involving maize, pigeon pea, and groundnut across three agroecologies in central Malawi.
Cropping system
Crop or crops
Year Harvested
Cost of production
Total revenue
Gross margins
US $* US $# US $
PP-MZ Pigeon pea 2016 47 252 205
PP-MZ Maize 2017 176 1116 940
PP-MZ Pigeon pea and maize 2016‒2017 223 1368 1145
GN-MZ Groundnut 2016 130 699 569
GN-MZ Maize 2017 176 986 810
GN-MZ Groundnut and maize 2016‒2017 306 1685 1379
GNPP-MZ Groundnut 2016 130 684 554
GNPP-MZ Pigeon pea 2016 47 212 165
GNPP-MZ Maize 2017 176 864 688
GNPP-MZ Groundnut, pigeon pea, and maize
2016‒2017 353 1760 1407
MZPP-MZPP Maize 2016 96 574 478
MZPP-MZPP Pigeon pea 2016 47 237 190
MZPP-MZPP Maize 2017 96 642 546
MZPP-MZPP Pigeon pea 2017 47 237 190
MZPP-MZPP Maize and pigeon pea 2016‒2017 286 1690 1404 *Seed and fertilizer cost over two years #Economic returns include forage, fuelwood, and grain *Cropping systems shown are sole pigeon pea rotated with sole maize (PP-MZ), sole groundnut rotated with sole maize (GN-MZ), groundnut‒pigeon pea intercrop rotated with sole maize (GNPP-MZ) and maize‒pigeon pea intercrop rotated with maize‒pigeon pea intercrop (MZPP-MZPP). Figures in italics show the total economic values of combined crops for every cropping system assessed over two years.
3 Komarek, A.M., Koo, J., Haile, B., Msangi, S., Azzarri, C., 2018. Trade-offs and synergies between yield, labor, profit, and risk in Malawian maize-based cropping systems. Agron. Sustain. Dev. 38, 32. https://doi.org/10.1007/s13593-018-0506-6. 4 Snapp, S.S., Grabowski, P., Chikowo, R., Smith, A., Anders, E., Sirrine, D., Chimonyo, V., Bekunda, M., 2018. Maize yield and profitability tradeoffs with social, human and environmental performance: Is sustainable intensification feasible? Agric. Syst. 162, 77–88. https://doi.org/10.1016/J.AGSY.2018.01.012.

15
Refining groundnut agronomy Groundnut yields in Malawi remain low, averaging 600 kg/ha against yields > 2500 kg/ha that are obtained at research stations. Use of recycled seed, poor agronomy, and low soil fertility are blamed for low yields. Absence of literature in Malawi on yield penalties as a result of use of recycled legume seed prompted studies to evaluate productivity gaps in groundnut in Machinga and Dedza. In the 2017/2018 season, a set of experiments evaluated the effect of seed generation (certified vs. recycled) and planting density (double rows vs single row) on groundnut biological nitrogen fixation and grain productivity. The trials had a split-plot design with seed generation (recycled vs. certified) as main plot factor, while sub-plot factors inoculation (inoculation vs. uninoculated) for soybean experiments and planting density (single vs. double rows) for groundnut. In all cases, planting groundnut on double rows on a ridge significantly increased biomass and pod yields, and biological N2-fixation (Table 5). Groundnut seed generation was less important for biomass productivity, but certified seed had relatively larger pod yields. Productivity for certified seed was negatively affected by poorer germination compared to that achieved with farmer recycled seed. We have noted that farmer-retained seed had consistently better germination compared with seed that originates from Lilongwe agrodealers. This is probably due to poor commercial handling as machinery is used for shelling. Contrary to this, smallholder farmers always keep their groundnut in the shell and only hand-shell within a month of planting. There were larger residual effects when maize was sequenced with double-row groundnut, irrespective of seed generation (Table 6). Table 5. Effect of groundnut planting density and seed generation on plant population, biomass, biological N2-fixation, and pod yield in Machinga and Dedza, during the 2018/2019 cropping season.
Plant population/ha
Total biomass (kg/ha)
BNF (kg/ha) Pod yield (kg/ha)
Treatment Machinga Dedza Machinga Dedza Machinga Dedza Machinga Dedza
Planting density Double row 210,340 141,17
1 3432 5539 56 124 1331 2711
Single row 100,102 68,313 2102 3462 35 55 787 1957
SED 5,358 13,482 90 505 6 25 80 195 P-value < 0.001 0.012 < 0.001 0.026 0.033 0.009 0.007 0.031
Seed generation Certified 151,769 96,528 2762 4389 45 87 1109 2512 Recycled 158,673 112,95
6 2772 4613 45 92 1009 2156
SED 3056 5491 57 76 5 15 111 176 P-value 0.043 0.011 0.866 0.013 0.993 0.755 0.389 0.067

16
Table 6. Effect of groundnut‒maize rotation on maize biomass and grain yield in Dedza and Machinga districts in 2018/2019 season.
Treatment description
Total maize biomass (kg/ha)
Maize grain yield (kg/ha)
Machinga Dedza Machinga Dedza Maize after recycled g/nut in double rows + 46 kg N/ha 1509a 13,815b 746a 5624b
Maize after certified g/nut in double rows + 46 kg N/ha 1497a 11,158ab 691a 4627ab
Maize after recycled g/nut in single rows + 46 kg N/ha 1364a 10,442a 612a 4364ab
Maize after certified g/nut in single rows + 46 kg N/ha 1494a 8,655a 670a 3582a
SED 74.2 1079.5 99.4 495.3 P-value 0.235 < 0.001 0.622 0.004
Yield, economic, and BNF benefits of innovative approaches addressing the pigeon pea and common bean productivity within maize-based cropping system and variable weather in Tanzania The background to, and field activities, for this study were given in the Oct 2018‒March 2019 report. All the planned field activities relating to the initiation and management of six mother trials of crop configurations were accomplished. Only the analysis of pigeon pea production data and soil water infiltration tests are pending and will be included in next reporting. Soil, pigeon pea roots, and above ground biomass samples for biological nitrogen fixation (BNF) quantification have already been collected, pre-processed and are awaiting shipping for 15N determination. Grain yield assessment. Across the fields, maize grain yields ranged from 1.7 t/ha to 2.3 t/ha (data not shown as no treatment differences were expected or observed). On the other hand, bean yields ranged from 0.3 t/ha under the Mbili-Mbili to 0.5 t/ha under the doubled-up legume system. Across the three eco-zones, bean productivity was highly affected by on-season drought. Harvesting was done in two of the three agroecologies, with Gallapo eco-zone experiencing total bean failure. Besides, the second bean phase was also affected by soil moisture deficiency leading to total crop failure in all eco-zones. After compilation of the pigeon pea yields, economic profitability for the three crop species will be examined on each of the seven cropping systems being tested (these systems are as presented in Table 7). Chlorophyll assessment. Leaf chlorophyll is a key indicator of the nitrogen content in a leaf. The amount of chlorophyll helps to inform the effect of a cropping system or field management practice on nitrogen uptake by plants. As expected, leaf chlorophyll was significantly (P ≤ 0.01) affected by treatments and time. At leaf V8 and V12 stages, leaf chlorophyll content under Mbili-Mbili and the treatment with two maize plants per hill were significantly lower than that of the control (Table 7). Competition for moisture, nutrients, and sunlight amongst the intercropped plants could have reduced leaf N content compared with sole maize under the control treatment. During the period before the reproductive growth stage 4 (R4), Meru 513 variety had a higher chlorophyll content compared with a similar system with Meru 515. This points to varietal differences including improved resistance to soil moisture stress by Meru 513, which may explain its yielding levels similar to treatment of sole maize.

17
Table 7. Effect of treatment and sampling time on maize leaf chlorophyll content under variable plant spacing configuration during LR 2019 in Babati (P ≤ 0.01).
TRT Leaf chlorophyll (SPAD units)
V8 V12 VT R4
Maize no legume 44ab 52a 41ab 32ab
Maize not topped 45a 51ab 40ab 31b
Maize topped 44abc 50bc 40ab 32ab
Doubled-up legume – – – –
Maize 2 plants per hill 43c 49c 40ab 32ab
Mbili-Mbili 43c 49c 39b 31b
Maize 513 variety 45a 52ab 41a 34a
LSD 1.7 1.7 2.2 2.4
*All treatments had pigeon pea intercrops; Mbili-Mbili had common beans as well.
Photosynthetically active radiation. The amount of light intercepted by the maize canopy affects the proliferation of the understorey legumes in the intercropping system. Photosynthetically active radiation (PAR) readings are available on pigeon pea crop after maize was harvested (R6 stage). As expected, the level of light interception by pigeon pea canopy was significantly affected by treatments (P ≤ 0.01). In the majority of cases, doubled-up legume had the highest light interception pointing to improved growth of the pigeon pea (Table 8). This system had no maize planted and common beans matured early thus increasing light access for pigeon pea. The ability of pigeon pea to maximally utilize PAR is associated with improvement in final yields and enhanced biological nitrogen fixation, a proposition that will be validated at the end of this study. Table 8. Effects of manipulating plant spaces on interception of photosynthetically active radiation during the 2019 cropping season in Babati (5 sites), Tanzania (P ≤ 0.01).
Treatments PAR fraction index
Baraka Bura Chief Dodo Sch. John Stanslause
Maize no legume – – – – –
Maize not topped 0.28 0.27ab 0.33b 0.23 0.17ab
Maize topped 0.22 0.19b 0.37ab 0.18 0.20a
Doubled-up legume 0.43 0.36a 0.52a 0.20 0.10ab
Maize 2 plants per hill 0.22 0.23ab 0.39ab 0.25 0.18bc
Mbili-Mbili 0.26 0.26ab 0.33b 0.37 0.09ab
Maize 513 variety 0.32 0.23ab 0.36ab 0.01 0.06b *All treatments had pigeon pea intercrops; Mbili-Mbili and doubled-up legume had beans.
Soil moisture and temperature assessment. Monthly soil moisture and temperature readings recorded from the V6 maize stage to the physiological maturity of pigeon pea plants show that time of sampling influenced (P ≤ 0.01) the amount of moisture in the soil. However, no soil moisture effects were observed across the treatments (Table 9). Soil moisture content, at different maize growth stages, ranged between 0.09 m3m-3 under doubled-up legume at V9 stage to 0.24 m3m-3 in system with Meru 513 variety at R4 stage (data not shown). The lower soil cover under the doubled-up legume at the V9 stage could have resulted from the slow establishment of pigeon pea within a bean intercrop, which might have exposed the system to increased evaporation, elevating moisture losses to near air-dry soils (0.05 m3m-3). In the period

18
between the V9 and V12 maize stages, Mbili Mbili had low moisture content (0.13 m3m-3) compared to other treatments, which can be attributed to both uptake and evapotranspiration of water by the actively growing crops. Besides, the period immediately before V9 and tasselling stage had the lowest soil moisture recorded. Averaged across maize growth stages, use of Mbili Mbili and the vertical leaf architecture of Meru 513 increased the soil temperatures compared to the conventional system with untopped maize and the sole maize crop (Table 9). Table 9. Effect of treatments on soil moisture and temperatures under variable crop configuration patterns during the LR 2019 in Babati (P ≤ 0.01).
Treatments Average soil moisture (m3m-3)
Average Temperature (°C)
Maize no legume 0.1678 34.2b
Maize not topped 0.1691 34.2b
Maize topped 0.1704 34.4ab
Doubled-up Legume 0.167 34.4ab
Maize 2 plants per hill 0.1718 34.4ab
Mbili-Mbili 0.1695 34.6a
Maize 513 variety 0.1681 34.6a
LSD 0.33
*All treatments had pigeon pea intercrops; Mbili-Mbili and doubled-up legume had beans as well.
Testing Gliricidia intercropping strategies for drought resilience For the rainout shelter experiment whose set up was described in the October 2018‒March 2019 report, maize yield data collection and processing for analysis are complete. Pigeon pea yield data collection was done in three phases throughout the month of August and the data are still under processing. Analysis of tissue nutrient concentration in maize and soil moisture determination of destructive wood samples are ongoing in the laboratory. We also collected data on stomatal conductance, air temperature, relative humidity, economics, and gender responses, and these are being analyzed. Preliminary results of maize grain yield indicate that intercropping maize with pigeon pea or G. sepium (2-crop intercropping) has no effects on maize grain yield compared to sole maize under ambient rainfall with fertilizer treatment (Fig. 2). But 3-crop intercropping (maize‒pigeon pea‒Gliricidia) supressed maize grain yield, reflecting competition for nutrients and/or soil moisture due to poor soil fertility and low and sporadic precipitation on this site. As a result, there was no significant yield increase due to fertilizer application or intercropping under the resource limiting conditions (drought and/or without fertilizer). However, the intercropping advantage is not considered based on the yield of one component only as presented in these preliminary results. Thus, more information on the land use efficiency (based on the land equivalent ratio-LER), agroecological interactions, and economic benefits of intercropping will also be used to validate the technology once processing of pigeon pea grain yields, wood yield, nutrient uptake, farm operation costs, and income are completed. We submitted an abstract summarizing preliminary results to a special issue of the journal Frontiers in Sustainable Food Systems, which is titled “Diversifying farming systems for adaptive capacity”. The abstract has been accepted for developing a full manuscript for peer review by March 31, 2020.

19
Figure 2. Impacts of intercropping G. sepium and pigeon pea on maize yield under ambient rainfall conditions (left column) and drought conditions (right column) with fertilizer (upper row) and without fertilizer (lower row). Letters indicate significant differences between group means across all 4 panels (i.e., all cropping system-fertilizer-water combinations) at P < 0.05 according to Tukey’s studentized range test. M = sole maize, MP = maize–pigeon pea, MG = maize–Gliricidia, and MGP = maize–Gliricidia–pigeon pea.
Managing pests of vegetables using biopesticide and net houses A study on the use of net houses and biopesticide (Metarhizium anisopliae) in controlling Bemisia tabaci and Tuta absoluta on solanaceous vegetables (tomato and sweet pepper) has been completed. It was conducted in Babati District of Tanzania. A draft journal article is being finalized and fruit yield results are presented in Figures 2 and 3. The findings show that net houses combined with biopesticides increased plant yield in terms of marketable weight and total weight for both tomato and sweet pepper. Total yields from tomato and sweet pepper in the open fields were at times higher compared with net house yields. However, the non-marketable weight was higher in the open fields (up to 40% of total yield) because of full interception of sunlight by plants, which creates a platform for the presence of sap sucking insects such as whiteflies, and the scalding of fruits. The evaluation by 14 women and 15 men farmers who had been testing the technology for two production seasons was that the technology impacted positively in terms of production, income, and nutrition. Farmers mentioned that crops grown inside the net house performed better than those grown in open fields in terms of quality (skin color, test, texture), low pest incidences leading to low pesticide use and higher marketable fruits, confirming the findings presented in Figures 3 and 4. Specifically, women mentioned that their husbands now are participating in vegetable production and often request their wives to include vegetables in the meals to enjoy the nutritional and health benefits of vegetables.

20
Figure 3. Effects of net houses and biopesticide (Metarhizium anisopliae) on the yield of sweet pepper (Capsicum annum) over two seasons in Tanzania. Data represent averages (± standard errors, N = 30). Different letters indicate significant differences (P = 0.05) between the treatments. Key: bio_op: Tomato/sweet pepper treated with biopesticide in open field; bio_sh: Tomato/sweet pepper treated with biopesticide in net house; no_op: Tomato/sweet pepper control experiment in open field; no_sh: Tomato/sweet pepper control experiment in net house.
Figure 4. Effects of net houses and biopesticide (Metarhizium anisopliae) on the yields of tomato (Solanum lycopersicum) over two seasons in Tanzania. Data represent averages (± standard errors, N = 30). Different letters indicate that there are significant differences (P = 0.05) between the treatments.
Vegetable production benefits from improved management practices A technological package combining good quality improved sees, healthy seedlings, and good agronomic practices (GAPs), dubbed Improved Management Practices (IMP) was validated with smallholder farmers for the first season in Karatu District of Tanzania. Results show that IMP significantly (P ≤ 0.05) increased the yield of tomato by 48%, of nightshade by 30%, and of Ethiopian mustard by 28%. Respective incomes increased 57% (tomato), 39% (nightshade), and 40% (Ethiopian mustard). Besides, IMP reduced postharvest losses by 86‒98% for all three vegetables crops (Table 10). Market participation increased by 14% for tomato, 36% for nightshade, and 11% for Ethiopian mustard. Farmer evaluation of the IMP based on the rating of its impact on production (yield), economics (profit), environment (pesticide use and soil

21
fertility), human condition (vegetable consumption and diversity), and social activities (labor sharing, control of crop output, and conflict of resources between husband and wife), was that IMP had a positive effect on productivity, profitability, and nutrition, but with less effect on the environment and social aspects. The latter two aspects require longer exposure time to be appreciated. A second season study has been planned. Table 10. Impact of improved management practices (IMP) on three SI indicators (productivity, environment, and economics).
SI indicators Improved management practices (IMP)
Standard farmer practices (SFP)
Impact in %
test (t/chi-sq)1
Tomato (Tengeru 97) Yield (t/ha) 11.68 6.07 48% *** Revenue (Tsh/ha) 2,864,583 1,236,979 57% *** Postharvest loss (% lost) 0.2% 8% –98% *** Amount sold (% sold) 94% 80% 14% *** African nightshade (Nduruma-BG16)
Yield t/ha 3.66 2.57 30% *** Revenue (Tsh/ha) 1,883,681 1,144,965 39% *** Postharvest loss (% lost) 2% 11% –86% *** Amount sold (% sold) 79% 51% 36% *** Ethiopian mustard (ML EM1)
Yield (t/ha) 3.67 2.62 28% *** Revenue (Tsh/ha) 1,883,681 1,128,472 40% *** Postharvest loss (% lost) 2% 20% –89% *** Amount sold (% sold) 81% 72% 11% ***
Community chicken breeding and management The Principal Investigator of this activity (UDOM) has delivered an unintelligible report. We consider this a serious delivery failure and are discontinuing support to this activity.
Output 1.2 Demand-driven, labor-saving, and gender-sensitive research products to reduce drudgery while increasing labor efficiency in the production cycle piloted for relevant typologies in target areas
Use of tractor-mounted ripper tillage implements for enhancing soil water infiltration and moisture conservation In this study, four treatments combining rip tillage and two maize varieties were evaluated. Productivity results are given in Figure 5 and show that rip tillage significantly increases maize grain yield (> 52% yield advantage), irrespective of the variety, even though the biomass yield did not follow this trend. The differences in yield are attributed to a lowered bulk density after ripping, which allows for better root development, increased infiltration (> 100%), and soil water retention at deeper depths (e.g., 8% soil water content for rip tillage compared to 5% for conventional tillage—at flowering stage). Rainwater use efficiency was increased by about 1.4

22
times by rip tillage. Yield differences between varieties were not significant. The generally low grain yields were due to a prolonged drought spell during the growing season.
Figure 5. Maize grain (left) and biomass (right) yield under different till × crop variety treatment combinations during the 2018/2019 cropping season. CT = Conventional tillage; DCK9089 = commercial hybrid maize variety; WE2109 = Water Efficiency Maize for Africa variety; RT = Rip tillage.
Gender and social dynamics analysis of soil and water conservation technologies In August 2019, a team of scientists from TARI, IITA, ICRAF, and UDOM collected social science data on fanya juu terraces and tied ridges in four villages of Kongwa District. In a two-day workshop preceding the fieldwork we shared knowledge on soil and water conservation practices (including social issues surrounding them). A visit to the fields of a lead farmer equipped social scientists with a better understanding of the practical use and establishment of terraces and ridges. Team members also discussed ways of operationalizing the Sustainable Intensification Assessment Framework (SIAF) for gender analysis and honed the tools for the subsequent investigation. During fieldwork we facilitated 16 gender-separate focus group discussions, conducted 32 participatory exercises (activity profiles, matrix scoring, seasonal calendars) and administered a short questionnaire to the same respondents (135 respondents in total). Currently, audio-recordings from focus group discussions are being transcribed for analysis. Survey data will be entered. Preliminary results from participatory exercises are summarized in what follows. Fanya juu terraces. Although gender roles did not emerge as very pronounced in the labor process, it was reported that the decision of establishing fanya juu terraces is predominantly taken by men. Men were described as taking up supervisory roles and as being in charge of technical aspects such as preparing measurement equipment and marking the measured furrow. Respondents indicated that all gender and age groups participate in activities that require substantial labor. Collective action groups facilitate access to non-household labor and the required equipment. Wealthier households engage hired labor. Because of the strong out-migration of men in the study area, women play an important role in the preparation and maintenance of terraces. Tied ridges. In matrix scoring exercises respondents compared maize flat cultivation and maize cultivation with tied ridges in relation to four indicators from the Sustainable Intensification Assessment Framework (SIAF). Both men and women perceived tied ridges as more beneficial in terms of soil moisture, productivity, and income from sales. However, for the fourth indicator

23
(labor requirement) mixed views emerged. Flat cultivation was perceived as less labor demanding during field preparation compared with the construction or maintenance of tied ridges. On the other hand, weeding appeared less labor intensive under tied ridges than under flat cultivation. During the 2019/2020 season, all data will be analyzed and written up. In addition, a short follow-up study on two aspects is planned: First, focus group discussions did not allow for a sufficient exploration of social dynamics within collective action groups (establishment of terraces/ridges). Individual semi-structured interviews are a more suitable method for this topic and will be used. Second, there is a need to better capture the drudgery involved in the establishment and maintenance of tied ridges compared with flat cultivation. We will therefore collect drudgery scores in a smaller investigation.
Output 1.3. Tools (including ICT-based) and approaches for disseminating recommendations in relation to above research products, integrated in capacity development
Farmer/Extension messaging (forage production and use, crop residue processing and use, and feed rations) using MWANGA. See ICT Report under Output 4.1. Regionally relevant technology extrapolation domain mapping for variable technologies Fodder trees and grass forage maps. A spatially explicit land degradation index (LDI) is being developed for Kongwa and Kiteto districts of central Tanzania. The LDI map is expected to guide spatial targeting of land rehabilitation programs using agroforestry and other soil and water conservation practices that are validated in sub-activities 2.1.1.4 (Land rehabilitation through integration of fodder trees and grass forage species in dryland farming), 2.1.1.5 (Evaluation of land rehabilitation benefits of shelterbelts and contours), and 2.2.1.6 (Validation of residual tied ridging as a labor-saving technology in semi-arid areas of Central Tanzania). This work is part of MSc research of a student from the Centre for Remote Sensing of Land Surfaces (ZFL), University of Bonn. The study area has a semi-arid climate with a unimodal precipitation distribution from October to May. Land degradation is assessed using TrendsEarth plug-in of QGIS and Google Earth Engine. Following the UNCCD Good Practice Guidance (GPG 17) for SDG indicator 15.3.1, assessment is conducted for three sub-indicators of land degradation (LD): Land Cover (LC), Soil Organic Carbon (SOC), and Land Productivity (LP). Change in LC is assessed using the ESA-CCI LC classification for 2000 and 2015 with a 300-m resolution. This spatial resolution was found to be coarse for a sub-national analysis and was therefore substituted with a new (2019) land cover map produced by SERVIR/RCMDR with a spatial resolution of 30 meters. The maps produced during preliminary analysis are being improved by employing higher resolution (20–30 m) land-cover. Transitions from cropland to forest are evaluated as improvement, whereas changes from grasslands to settlements are classified as degradation. SOC is based on the modelled ISRIC SoildGrids250m. LC conversions trigger corresponding changes of SOC values with a time delay of up-to 20 years, based on established LC coefficients. LP was measured with the Normalized Differences Vegetation Index (NDVI), which serves as a proxy for net primary production (NPP). Annual NDVI-integrals are calculated based on the

24
MODIS bi-weekly products with 250 m spatial resolution. LP consists of three individual sub-indicators, namely: trajectory, performance, and state. Trajectory indicator measures the rate of change over time based on a linear regression and the significance is determined using a Mann-Kendall test. Water use efficiency was considered to account for influence of climatic variability, i.e., precipitation and evapotranspiration on NPP. The state sub-indicator detects recent changes of LP by comparing the last three years to the preceding period. Annual integrals of NDVI are classified into 10% percentiles and transitions of more than two classes between the baseline and recent period are flagged as improvement or degradation. The performance sub-indicator compares the local LP with other similar vegetation types in comparable LC types and soils in the study area. If the NDVI is lower than 50 % of the maximum value, then it is assessed as degraded. The three sub-indicators were finally integrated into one indicator of LP using the “one out, all out” (1OAO) approach. So far, results show that in the last 15 years, land productivity declined in over 70% of the Kongwa and Kiteto districts and croplands are more affected by degradation (Fig.6). No significant changes were detected for land cover and soil organic carbon, that is, as a result of the coarse spatial resolution of input data. Preliminary results revealed that the 250 m spatial resolution of input NDVI grid layers is coarse for a sub-national (district) scale analysis. Methods for improving the NDVI layers are being explored by data fusion with Landsat. Fieldwork is planned, starting October 2019, to verify the type and magnitude of land degradation at farm level and assess the area under different sustainable land use practices. Drivers of declining land productivity will be assessed using a mixed effect model with productivity trend derived from remote sensing as the response and farm level dataset as explanatory variables.

25
Figure 6. Maps showing the status of (a) land cover (LC), (b) soil organic carbon, (c) land productivity, and (d) the overall land degradation (LD) computed by combination of a–c using the “one out all out principle” in Kongwa and Kiteto districts of central Tanzania from 2000 to 2015. The decline in vegetation productivity was the main driver of overall land degradation.
Maize‒legume cropping maps. The aim of this activity was to collate time-series, gridded, climatic data with high-spatial and temporal resolution for Kongwa and Kiteto districts in Tanzania. The gridded monthly time series for rainfall and minimum and maximum temperature was obtained from the TerraClimate database. The monthly climate layers had a spatial resolution of 4 km covering the period 1981 to 2017; therefore, the time series for each input variable had 444 layers. The accuracy of the gridded climatic data was evaluated using available gauge station data. Long-term spatial and temporal trends of rainfall and minimum and maximum temperatures were mapped. Results show a significant negative trend of rainfall in October and May (‒0.01 to–1.6 mm/yr, Figure 7). The two extreme temperature variables show a consistent significant warming trend (+ 0.001 to + 0.057 oC/yr) recorded across the two districts in all months although the increase of Tmax in March to May was not significant (Fig.8). The warming trend is most severe in the months of December. The observed trends point to increasing moisture and heat stress in the two districts that could decrease agricultural productivity. The gridded time series data will be used as an input to investigate the effect of climatic variability on cereal production in Kongwa and Kiteto districts of Tanzania for sub-activity 1.1.1.7 (monitoring the impact of weather and climate variability on the productivity and resilience of maize–legume cropping systems of Kongwa and Kiteto, Tanzania). Deliverables for sub-activity 1.1.1.7 included collation of current and historical grain yields of maize that is ongoing (first

26
season harvest grain yields quantified). The historical yield data will be correlated with the gridded climatic variables to determine the spatial variation of climatic influence of maize yields. Moreover, automated gauge stations were installed for daily weather monitoring that would be used for evaluating the accuracy of satellite data that is available for a long period (over 30 years). One of deliverables for sub-activity 1.1.1.7 is a household survey to gauge the level of understanding of weather/climate variability and associated impacts on cereal and legume production among the communities in Kongwa and Kiteto districts. The generated long-term spatial and temporal trends of rainfall and minimum and maximum temperatures generated in this study will be compared with farmers’ perceptions on climate variability (obtained from survey conducted under sub-activity 1.1.1.7) to gauge their knowledge compared to conventional measurements.
Figure 7. The rainfall trends in Kongwa and Kiteto districts of central Tanzania.

27
Figure 8. Significant trend in Tmin in Kongwa and Kiteto districts for 37 years (1981‒2017) monitored using gridded data from the TerraClimate database.
Vegetable varieties maps. A previous study examined the yield response and economic performance of farmer selected and preferred elite tomato (Lycopersicon esculentum; “Tengeru 2010”) and African eggplant (Solanum aethiopicum; “Tengeru white”) grown under improved management practices (IMPs) and standard farmer’ practices (SFPs) for two growing seasons (2013/2014 and 2014/2015) in four villages in Babati District, Tanzania. Data obtained from on-farm participatory vegetable research trials revealed that IMPs led to significant yield and profit increase of up to 64 t/ha compared to 28 t/ha (control) with a benefit‒cost ratio (BCR) of 8.5 for Tengeru 2010 tomato and 54 t/ha compared to 23.04 t/ha (BCR = 4.50) for African eggplant (Fig.9). Given the tremendous high yield and profit margins of the two varieties grown under IMPs, the challenge is to determine where else to extrapolate the IMP technology packages for the two varieties with the lowest risk of failure in other farms in Babati District. We hypothesized that technological packages that show high yield potential in reference trial sites will also perform equally well in outlying areas with similar environmental conditions. The aim of the study was to delineate extrapolation suitability index (ESI) maps for two improved vegetable varieties grown

28
under IMPs in Babati District. These maps are expected to guide extension staff to prioritize scaling out of IMPs of the two varieties to sites with high potential.
Figure 9. Comparison of the yield and net benefits between standard farmers’ practice (Control) and Integrated Management Practice (IMP) for African eggplant and Tomato for all sites. Adapted from (Lukumay et al. 20185).
Maps of the extrapolation suitability index (ESI) were generated from 11 selected biophysical and socioeconomic variables that directly affect suitability of vegetables in the study area (Table 11). ESI maps were generated using methodology proposed by Muthoni et al. (20196) for identifying priority areas for targeting bundles of agronomic technologies. The environmental conditions at the location of trial sites were used as a reference. A Mahalanobis distance was calculated between reference conditions and the rest of the grid cells in covering the district. Before extrapolations, the homogeneity of environmental conditions in the reference grid cells was investigated by fitting a principle component analysis (PCA). A biplot of PCA results revealed three relatively homogenous clusters of trial sites in regard to their environmental composition (Fig. 10). The first two PCA axes explained 63% and 23% of variance in environmental conditions, respectively. Cluster 1 and 2 were discriminated from first axis. Most trial plots were located within cluster 3 that included high potential for agriculture due to high elevation, precipitation and SOC compared to low potential areas represented by cluster 1 that was characterized by
5 Lukumay, P. J., V. Afari-Sefa, J. Ochieng, I. Dominick, D. Coyne, and T. Chagomoka. 2018. Yield response and economic performance
of participatory evaluated elite vegetable cultivars in intensive farming systems in Tanzania. Acta Hortic. 1205:75 - 86 6 Muthoni, F. K., F. Baijukya, M. Bekunda, H. Sseguya, A. Kimaro, T. Alabi, S. Mruma, and I. Hoeschle-Zeledon. 2019. Accounting for correlation among environmental covariates improves delineation of extrapolation suitability index for agronomic technological packages. Geocarto International 34:368-390

29
warmer temperatures (high Tmin) and sandy and alkaline soils (Fig. 10). Cluster 3 was more correlated with the second PCA axis and represented areas with high CEC and longer distance to the market. Table 11. Input variables for delineating extrapolation suitability index for vegetable technologies. To avoid loss of high-resolution topographic details, all gridded data was resampled to a 30-meterresolution.
Code Parameter Original Resolution
Source
Climatic
Tmin Annual mean minimum temperature (Co)
4 km http://www.climatologylab.org/terraclimate.html
PPT Annual precipitation (mm)
“ “
ETP Evapotranspiration “ “
Topographic
DEM Elevation (m) 30 m https://asterweb.jpl.nasa.gov/gdem.asp
Slope Slope (degrees) 30 m Generated from DEM
Edaphic
Sand Sand content (%) 250 m https://www.soilgrids.org
CEC Cation Exchange Capacity (cmol+/kg)
“ “
SOC Soil organic carbon (fine earth) (g kg-1)
“ “
pH Soil pH “ “
Socioeconomic
TotPop Total human population 100 m https://www.worldpop.org/
Market Market access (distance in minutes)
100 m https://harvestchoice.org/

30
Figure 10. Biplot from Principle components analysis of environmental conditions of 23 replicate trial plots for Tengeru-2010 tomato variety and integrated management practices (IMPs).
Clusters 2 and 3 showed the highest mean of quantity produced (Qty Prod) and monetary income for African eggplant and tomato, respectively. Therefore, trial plots located in the two clusters were selected as the reference sites when delineating the respective extrapolating suitability maps for African eggplant and tomato. The ESI maps for Tengeru 2010 tomato (Fig. 11) represented the risk of extrapolating Tengeru-2010 tomato with the IMP package to achieve an average yield of 64 t/ha with a benefit-cost ratio (BCR) of 8.5 that translates to an average income of about $22,000/ha. The lower the ESI index, the more a particular location is similar to the reference sites and therefore is more suitable/has greater potential of achieving the target yield when the same package is applied.
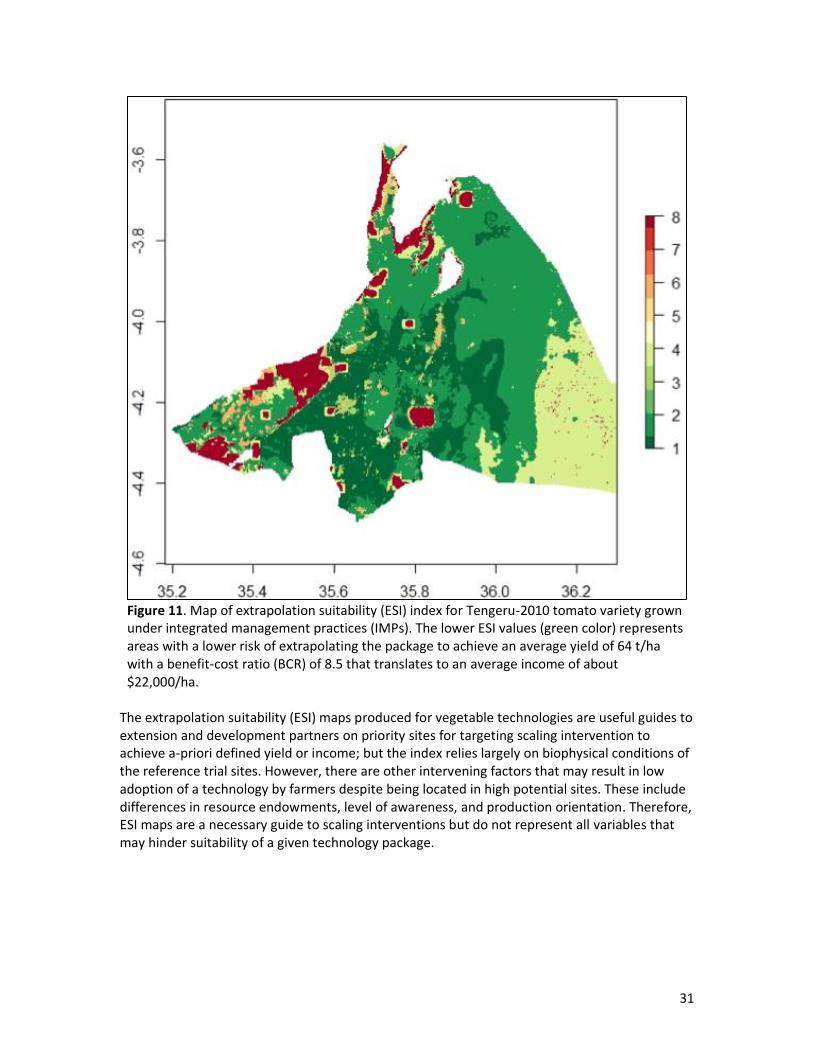
31
Figure 11. Map of extrapolation suitability (ESI) index for Tengeru-2010 tomato variety grown under integrated management practices (IMPs). The lower ESI values (green color) represents areas with a lower risk of extrapolating the package to achieve an average yield of 64 t/ha with a benefit-cost ratio (BCR) of 8.5 that translates to an average income of about $22,000/ha.
The extrapolation suitability (ESI) maps produced for vegetable technologies are useful guides to extension and development partners on priority sites for targeting scaling intervention to achieve a-priori defined yield or income; but the index relies largely on biophysical conditions of the reference trial sites. However, there are other intervening factors that may result in low adoption of a technology by farmers despite being located in high potential sites. These include differences in resource endowments, level of awareness, and production orientation. Therefore, ESI maps are a necessary guide to scaling interventions but do not represent all variables that may hinder suitability of a given technology package.

32
Outcome 2. Natural resource integrity and resilience to climate change enhanced for the target communities and agroecologies
Output 2.1. Demand-driven research products for enhancing soil, land, and water resource management to reduce household/community vulnerability and land degradation piloted in priority agroecologies
No activities were implemented during this reporting period.
Output 2.2 Innovative options for soil, land and water management in selected farming systems demonstrated at strategically located learning sites
Lessons from long-term on-station Conservation Agriculture trials in Zambia Trials were established at Msekera Research Station by ZARI. The results of these trials will be invaluable in the recommendation of CA and GMCC systems and will be used to influence the decision making on a newly funded EU project where CIMMYT is a key partner. Detailed trial results are shared below. Maize legume intercropping trial. The on-station legume intercropping trials revealed interesting aspects between the fertilized and unfertilized areas of the plot (Fig. 12). The treatments here are: a) maize sole; b) maize‒pigeon pea intercropping; c) maize‒lablab rotation; d) maize‒lablab intercropping at 0, 7, and 21 days after maize planting; e) maize‒cowpea rotation, and f) maize‒cowpea intercropping. The unfertilized area had much lower yields but showed significant yield differences in grain yield amongst the treatments (Fig. 12). Here maize‒pigeon pea, maize‒lablab, and maize‒cowpea rotations were on top whereas the sole maize treatment and maize with lablab planted 3 weeks after the maize were at the bottom. In the fertilized area, maize planted with lablab at 7 days was the best performer whereas the lowest was sole maize. We can clearly see from the intercropping strategies that there is a yield benefit emerging and it is strongest in the treatments that fix a lot of nitrogen (e.g., lablab at 7 days) while providing sufficient groundcover under CA. Combined biomass yield of both maize and legume showed significant results in both the fertilized and unfertilized areas. All treatments that had pigeon pea and/or lablab showed superior results whereas the sole maize treatment, rotations with cowpea and lablab or intercropping with cowpea had little effect. The top performer here was the maize‒pigeon pea intercropping (Fig. 13). In the fertilized area the trend was very similar, having greatest combined biomass yield (8412 kg/ha) for maize and pigeon pea intercropping compared with sole maize only (2157 kg/ha). Cowpea biomass yield was in general low as by the time of harvesting, most of it had already decomposed. (Fig. 13).

33
Figure 12. The effect of different intercropping and rotation strategies on combined maize and legume grain yield (kg/ha), Msekera Research Station, 2018/2019; Error bars represent SEDs. Error bars represent SEDs; means followed by the same letter in column are not significantly different.
Figure 13. The effect of different intercropping and rotation strategies on combined and legume biomass yield (kg/ha), Msekera Research Station, 2018/2019. Error bars represent SEDs; means followed by the same letter in column are not significantly different at P < 0.05 probability level.
Maize‒Gliricidia trial. The Maize‒Gliricidia trial compared three different treatments: a) Maize‒groundnut rotation; b) Maize/Gliricidia dense spacing–groundnut/Gliricidia dense spacing; and c) Maize/Gliricidia dispersed shading–groundnut/pigeon pea/Gliricidia dispersed spacing. There was no significant maize grain yield difference discovered between treatments, but there was a
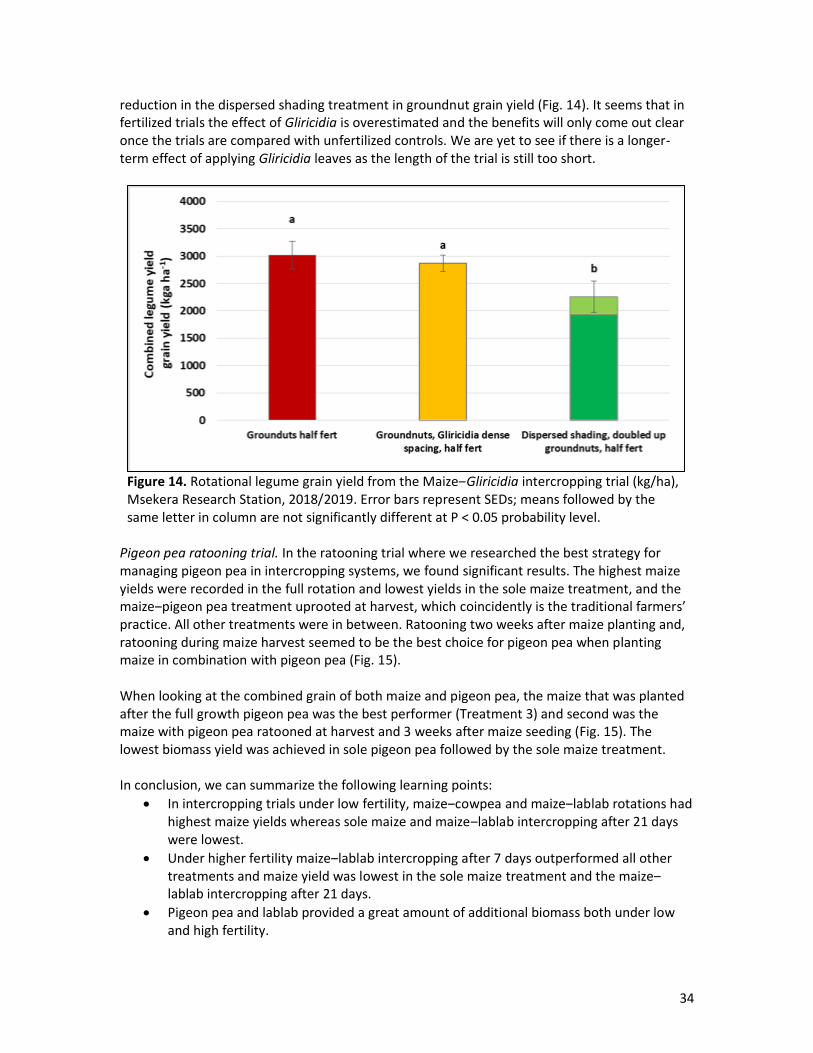
34
reduction in the dispersed shading treatment in groundnut grain yield (Fig. 14). It seems that in fertilized trials the effect of Gliricidia is overestimated and the benefits will only come out clear once the trials are compared with unfertilized controls. We are yet to see if there is a longer-term effect of applying Gliricidia leaves as the length of the trial is still too short.
Figure 14. Rotational legume grain yield from the Maize‒Gliricidia intercropping trial (kg/ha), Msekera Research Station, 2018/2019. Error bars represent SEDs; means followed by the same letter in column are not significantly different at P < 0.05 probability level.
Pigeon pea ratooning trial. In the ratooning trial where we researched the best strategy for managing pigeon pea in intercropping systems, we found significant results. The highest maize yields were recorded in the full rotation and lowest yields in the sole maize treatment, and the maize‒pigeon pea treatment uprooted at harvest, which coincidently is the traditional farmers’ practice. All other treatments were in between. Ratooning two weeks after maize planting and, ratooning during maize harvest seemed to be the best choice for pigeon pea when planting maize in combination with pigeon pea (Fig. 15). When looking at the combined grain of both maize and pigeon pea, the maize that was planted after the full growth pigeon pea was the best performer (Treatment 3) and second was the maize with pigeon pea ratooned at harvest and 3 weeks after maize seeding (Fig. 15). The lowest biomass yield was achieved in sole pigeon pea followed by the sole maize treatment. In conclusion, we can summarize the following learning points:
• In intercropping trials under low fertility, maize‒cowpea and maize‒lablab rotations had highest maize yields whereas sole maize and maize‒lablab intercropping after 21 days were lowest.
• Under higher fertility maize‒lablab intercropping after 7 days outperformed all other treatments and maize yield was lowest in the sole maize treatment and the maize‒lablab intercropping after 21 days.
• Pigeon pea and lablab provided a great amount of additional biomass both under low and high fertility.

35
• No significant grain yield differences were recorded in the maize‒Gliricidia trial although groundnut yields were lower in the dispersed shading treatment.
• Maize grain yield in the maize‒pigeon pea ratooning trials was dominated by maize‒pigeon pea full rotations but were not significantly different by different ratooning strategies, especially those that were ratooned at harvest and after maize seeding.

36
Figure 15. Combined maize and pigeon pea grain yield (in kg/ha), Ratooning Trial, Msekera Research Station, Zambia, 2018/2019. Error bars represent SEDs; means followed by the same letter in column are not significantly different at P < 0.05 probability level.

37
Assessing the benefits of nutrient and water management for climate resilience in Malawi Seasonal rainfall variability and within season dry spells are responsible for poor response to applied soil nutrients. Nutrient use efficiencies could be increased through increased rainwater capture in situ. Simple tied ridges store excess rainwater, creating more residence time for infiltration and reduced run-off losses. Overall, this increases the effectiveness of rainfall that comes at intensities that are higher than the infiltration rates ordinarily associated with particular soils. Maize productivity was assessed across several sites in a split-plot experimental design where water management (tied ridges or ridges only) were the main-plots and fertilizer management were sub-plots. Implementation of tied ridges without fertilizer application did not increase maize productivity (Fig. 16). Water management had a larger effect when fertilization was at 100% of the recommendation fertilizer rates in the different sites. These results suggest that the benefits of water conservation measures are more pronounced when N and P are adequately supplied.
Figure 16. Mean maize productivity across several sites with or without tied ridges for unfertilized maize, maize fertilized at 50% recommended rates (@50% F) and maize fertilized at 100% recommended NP rates (@100% F).
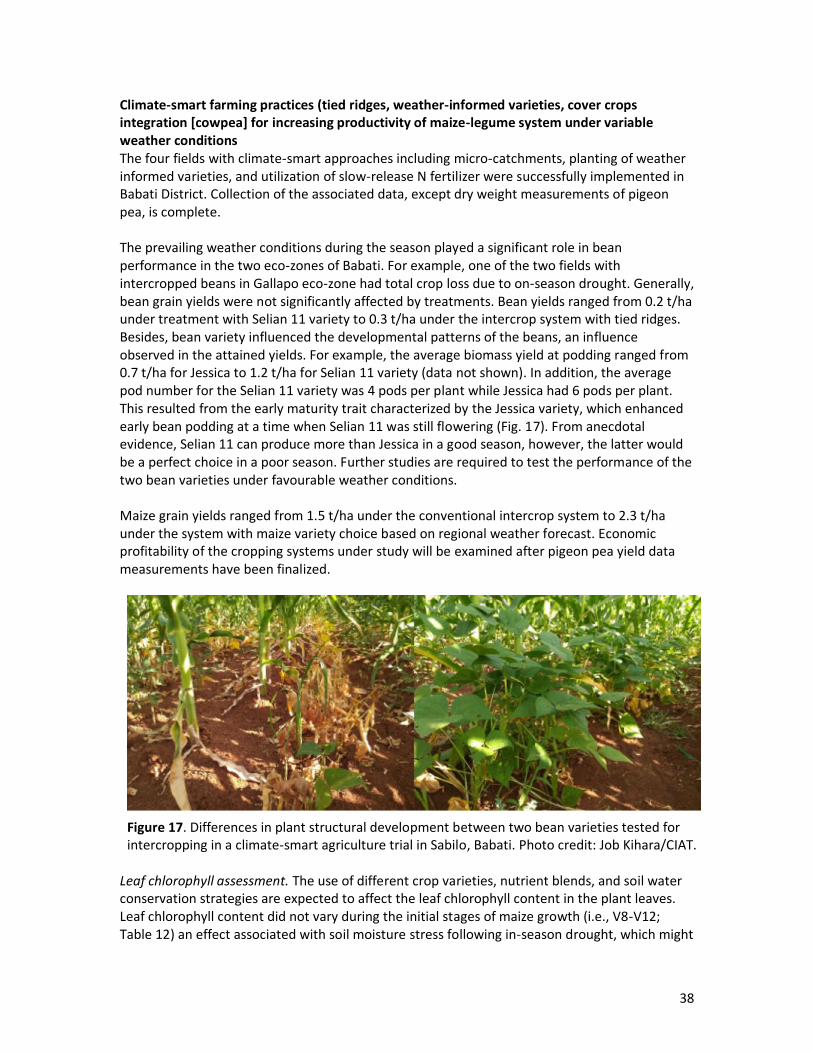
38
Climate-smart farming practices (tied ridges, weather-informed varieties, cover crops integration [cowpea] for increasing productivity of maize-legume system under variable weather conditions The four fields with climate-smart approaches including micro-catchments, planting of weather informed varieties, and utilization of slow-release N fertilizer were successfully implemented in Babati District. Collection of the associated data, except dry weight measurements of pigeon pea, is complete. The prevailing weather conditions during the season played a significant role in bean performance in the two eco-zones of Babati. For example, one of the two fields with intercropped beans in Gallapo eco-zone had total crop loss due to on-season drought. Generally, bean grain yields were not significantly affected by treatments. Bean yields ranged from 0.2 t/ha under treatment with Selian 11 variety to 0.3 t/ha under the intercrop system with tied ridges. Besides, bean variety influenced the developmental patterns of the beans, an influence observed in the attained yields. For example, the average biomass yield at podding ranged from 0.7 t/ha for Jessica to 1.2 t/ha for Selian 11 variety (data not shown). In addition, the average pod number for the Selian 11 variety was 4 pods per plant while Jessica had 6 pods per plant. This resulted from the early maturity trait characterized by the Jessica variety, which enhanced early bean podding at a time when Selian 11 was still flowering (Fig. 17). From anecdotal evidence, Selian 11 can produce more than Jessica in a good season, however, the latter would be a perfect choice in a poor season. Further studies are required to test the performance of the two bean varieties under favourable weather conditions. Maize grain yields ranged from 1.5 t/ha under the conventional intercrop system to 2.3 t/ha under the system with maize variety choice based on regional weather forecast. Economic profitability of the cropping systems under study will be examined after pigeon pea yield data measurements have been finalized.
Figure 17. Differences in plant structural development between two bean varieties tested for intercropping in a climate-smart agriculture trial in Sabilo, Babati. Photo credit: Job Kihara/CIAT.
Leaf chlorophyll assessment. The use of different crop varieties, nutrient blends, and soil water conservation strategies are expected to affect the leaf chlorophyll content in the plant leaves. Leaf chlorophyll content did not vary during the initial stages of maize growth (i.e., V8-V12; Table 12) an effect associated with soil moisture stress following in-season drought, which might

39
have masked variability between treatments. The short duration variety, guided by weather forecast information, had a higher chlorophyll content than maize under the conventional intercrop system (control). This can be associated with improved drought resistance of the variety, which corresponded to the higher maize yields than the latter system. In addition, the slow release N applied during planting might have increased (P ≤ 0.05) the leaf chlorophyll content of maize during tasselling compared to the control. This could be attributed to increased N availability, at a period of improved soil moisture following the onset of rain. An increment in leaf chlorophyll in treatments with cowpea relay compared to the control at VT could point to reduced water and nutrient competition since cowpea did not establish. The high chlorophyll in treatment with the heat tolerant bean variety could not be explained. However, the experiment will be repeated in the consecutive season to validate the results. Table 12. Effect of treatment and sampling time on maize leaf chlorophyll content under climate smart agriculture during LR 2019 in Babati (P ≤ 0.05).
Treatment Leaf chlorophyll (SPAD units)
V8 V12 VT R4
Maize with recommended fertilizer rates 45 49 40b 38ab Maize variety based on forecasts 46 50 45a 41a Maize under tied ridges 45 49 43ab 38ab Maize with cowpea relay 45 49 44a 38ab Maize with heat tolerant bean 46 50 44a 37b Maize with slow release N 45 49 44a 38ab Maize with micronutrient 45 49 43ab 38ab LSD 3.5 3.1
*All the treatments had beans and pigeon pea except the treatment where beans were substituted with a cowpea relay.
Soil moisture and temperature assessment. The use of soil water conservation technologies is important in enhancing water capture and storage during the growth season. The effectiveness of tied ridges in enhancing soil water conservation was noted between VT (tasselling) and R4 (grain development) maize stages when some rainfall was received (Table 13). However, the effect was not visible at the beginning of the season because the construction of the micro-catchments was done at the same time and no rainfall event was recorded until maize attained VT stage. The average soil temperatures during the season ranged from 25.4 to 43.5 °C but there were no effects across treatments. However, no specific patterns of soil temperatures across treatments were observed during the season.

40
Table 13. Effect of treatments on soil moisture and temperature under the different nutrient and soil water conservation strategies during the LR 2019 in Babati (P ≤ 0.05).
All the treatments had beans and pigeon pea except the treatment where beans were substituted with a cowpea relay. Maize growth stages are categorized into 2 Phases, i.e., the vegetative stages (V) and the reproductive stages (R). Vegetative stages begin from seed emergence VE to tasseling (VT). Reproductive stages start at silking (R1) to dent stage (R6) when maize grains have attained maximum dry weight, i.e., physiological maturity.
Integration of fodder trees and grass forages in dryland farming Productivity and economic benefits of contour farming were determined with maize, Guatemala grass, and G. sepium as test crops (Tables 14 and 15). Relative to a farmer practice, contours improved maize grain yield 200% during the 2018 cropping season due to improved soil conditions and/or use of improved maize variety (question on attribution to contour effect only). The low and sporadic rainfall patterns appear to have masked the response of maize to improved soil conditions on contours. Fodder and wood yields were less affected by drought and hence contributed to higher gross margins (76‒112%) and returns to labor (12‒74%) in contours compared to the farmer practice. In good seasons like 2018, maize contributed 50% of the gross income on this site while in bad seasons like 2019, G. sepium wood contributed to 89.7% of the income. Also, seasonal distribution of Guatemala grass yields and income increase the purchasing power of farmers, contributing to improved food access during lean periods when supply from the farm is finished. These results demonstrate the benefits of crop diversification in contour farming to enhance agroecosystem resilience and the adaptive capacity of farmers.
Treatments Soil moisture (m3m-3) Average soil Temperatures (°C)
V8 V12 VT R4
Maize under recommended fertilizer rate
0.130 0.113ab 0.118ab 0.293 32.61
Maize variety based on forecasts 0.132 0.110ab 0.117ab 0.299 32.88
Maize under tied ridges 0.129 0.108ab 0.123a 0.303 32.71
Maize with cowpea relay 0.137 0.100b 0.114b 0.297 32.94
Maize with heat tolerant bean 0.135 0.112ab 0.120ab 0.302 32.73
Maize with slow release N 0.135 0.118a 0.118ab 0.291 32.76
Maize with micronutrient 0.126 0.113ab 0.117ab 0.299 32.98
LSD 0.012 0.008

41
Table 14. Yields (t/ha/yr) of maize, fodder, and fuelwood in Contour Farming at Mlali, Kongwa District, Tanzania.
Farm/Site Year Maize grain Maize stover Guatemala garss1 Wood2
Lowland site (n = 3) 2018 3.16 6.20 4.88 –
Upland site (n = 6) 2018 3.35 7.02 6.84 –
Lowland site 2019 – – 3.04 3.46
Upland site 2019 0.83 2.30 2.40 3.44
F/practice (n = 17)3 2017 1.04 2.11 1 Mean yield per ha based on monthly estimates recorded by the host farmer. 2 Wood yield from Gliricidia estimated after 4 years to allow establishment on contours. To allow comparison with annual crop data, the mean annual increment of 0.86 t/ha was used for CBA presented in Table 15. 3 Farmer practice data collected in 2017 from 17 georeferenced farm fields at Mlali was used as a baseline to estimate the impacts of land rehabilitation by contours.
Table 15. Annual economic benefits of Contour Farming in Mlali Village.
Farm/Site Year GM (USD/ha) Gross Income (USD/ha)
Maize Fodder Wood Total
Lowland site 2018 1359.90 930.86 143.95 780.93 1855.73
Upland site 2018 1319.74 992.19 201.89 596.92 1791.01
Lowland site 2019 380.78 ‒ 88.10 767.47 855.57
Upland site 2019 458.21 253.06 69.48 586.63 909.18
F/Practice (n = 17) 1 2017 216.25 300.79 300.79 1 Farmer practice data collected in 2017 from 17 georeferenced farm fields at Mlali was used as a baseline to estimate the impacts of land rehabilitation by contours.
Validation of residual tied ridging as a labor-saving technology in the semi-arid areas of Tanzania A study on the use of the Residual Tied Ridging (RTR) tillage technique as a labor-saving technology was initiated during 2016 as a sound strategy for alleviating labor bottlenecks. A principal benefit is derived from this technique: In the first cropping season the land is ploughed, ridges and cross ties are made, and high labor input is required. In the subsequent cropping seasons, tied ridges made in the previous season are not disturbed, so less labor is required for maintaining the ridges, hence the name Residual Tied Ridging. During this reporting period, maize and sorghum crops were used as test crops for two different agroecologies, each comparing a local check and an elite variety. The sorghum test crop trial. Residual tied ridging performed poorly, even worse than the control, in terms of grain yield when the soils were sandy clay (Fig. 18), but dry matter yields were not significantly different. There were no significant treatment effects on soils that were not sandy.

42
Figure 18. Figure sorghum grain yield as affected by tillage treatments on sandy clay soils of Laikala village during the 2018/2019 cropping season. * CT = Conventional tillage; NACO = Commercial sorghum variety (NACO Mtama 1); Macia = Improved sorghum variety; Annual tied ridging; RTR = Residual tied ridging CV% = Coefficient of variation.
The grain yield results did not relate to the soil bulk density, which was significantly higher for conventional tillage at planting only at the 20 cm depth. Annual tied ridges and residual tied ridges had significantly higher (> 3 times) cumulative infiltration than conventional tillage. The maize test crop trial. The data of this trial were so variable because of the drought that affected crop growth during this cropping season. We are looking at a broader synthesis of treatment results of previous years to attribute the actual treatment effects. In general, while labor requirement was less for land preparation with the residual tied ridges treatments, it significantly increased with the weeding operations (Table 16). This was possibly because the limited soil disturbance also allows for less disruption of the weed seed banks in the soil, resulting in higher weed regrowth. Table 16. Preliminary comparison of costs associated with labor across tillage treatments during 2018/2019 cropping season
Tillage method Land preparation/ha Weeding/ha
Person-hours
Costs (USD) Person-hours Costs (USD)
CT 140 35.3 72 32.8 RTR 65 16.4 94 42.8 ATR 106 26.7 78 35.5
CT = Conventional tillage; RTR = Residual tied ridging; ATR = Annual tied ridging.

43
Outcome 3. Food and feed safety, nutritional quality, and income security of target smallholder families improved equitably (within households)
Output 3.1: Demand-driven research products to reduce postharvest losses and improve food quality and safety piloted in target areas
Impact of nutritional messaging on household nutrition, knowledge, attitude, and practices A study was initiated in Karatu District of Tanzania to determine the impact of nutritional messaging on farmers’ nutritional knowledge, attitudes, practices, and household nutritional status. The baseline survey conducted during July shows that there are no significant differences between the messaging-beneficiaries and control groups (Table 17), thus both groups can be used to estimate the impact of nutrition education. Several vegetables are grown in Karatu, but by a few farmers, including Ethiopian mustard (27% of farmers), Chinese cabbage (17%), African nightshade (14%), onions (11%), tomato (9%). and pumpkin leaves (7%); 81% of the yield is sold. Farmers still lack knowledge about the nutritional content of vegetables and their health benefits. More than 80% of the households would like to increase vegetable consumption while 60% of the households indicated that they plan to increase consumption of vegetables among family members. This confirmed the need for training/messaging to increase nutrition knowledge among households in Karatu. Table 17. Basic characteristics of the surveyed households.
Variables Beneficiaries (B) (n = 236)
Control (C) (n = 251)
Total (n = 487)
Test (T=C) -P -value
Sex of respondent (= 1 if male) % 58.05 66.93 62.63 0.043
Sex of head of the HH (= 1 if male) % 87.29 92.43 89.94 0.059
Marital status 1 = married (%) 84.32 83.27 83.78 0.529
2 = single (%) 2.97 8.76 5.95
3 = divorced (%) 1.69 0.4 1.03
4 = separated (%) 3.81 1.99 2.87 5 = widowed (%) 7.2 5.58 6.37
Household size (#) 6.09 5.83 5.96 0.216
Land owned (Average, ha) 0.84 0.94 0.89 0.16
Land allocated to vegetables (Average, ha) 0.06 0.09 0.07 0.04 Own vegetable home garden (1 = yes) % 51.71 40 45.66 0.010
Access to extension services (yes) % 27.97 20.32 24.020 0.058
No. of times visited by extension officer 1.42 1.0 1.2 0.18
Participation in agriculture training (yes) 39.83 23.51 31.42 0.000 After the baseline survey, nutrition training was conducted in eight villages during August. In total, 332 farmers (52% women), 10 NGO employees, eight government extension staff, and 16 restaurants/food kiosk staff participated. The training equipped participants with knowledge and skills on food groups and better feeding practices to reduce undernutrition, particularly in

44
children under 5 and women of reproductive age. Major activities included the provision of information on the importance of eating diverse foods, recipe preparations, ways to add value to their farm produce based on relationship between plant health and human health, and tips/approaches to change diet-related habits that would ultimately improve nutritional status. For practical purposes, two new recipes were developed during nutrition training (Fig. 19). The impact of these activities will be evaluated during the coming years.
Figure 19. Sample of recipes prepared (left) and the facilitator receiving feedback from trainees (right). Photo credit: Justus Ochieng/World Veg.
Validating hermitic storage structures and the environment on physical and economic loss abatement in produce Maize storage trials were conducted in farmers own stores (n = 39) using three types of locally manufactured (private sector) hermetic storage technologies—PICS bag, AgroZ bag, and metal silo. These were compared with farmers’ storage structures, being made of a brick wall with a concrete floor and roofed with iron sheets (48%, n = 39) or wooden poles plastered with mud with an earthen floor and roofed with iron sheets (43%). The variety of stored maize was not strictly controlled but was noted; farmers stored their home cultivated varieties. A total of 14 varieties was recorded hybrids (9), composites (2), and traditional ones (3). In some cases, farmers had mixtures of more than two varieties. Insect infestation, insect damage, overall damage (includes mold/rot/disease damage, rodent damage, broken grain, shrivelled grain, impurities/foreign matter and discolored grain) and total loss was determined. The hermetic bags were also examined for insect damage (perforations). There were differences in overall maize grain damage levels across the villages after 7 months (Fig. 20). The damage levels were higher in the higher altitude villages: Buger (1686‒1725 masl), Kambi ya Simba (1545‒1626 masl), and G. Lambo (1474‒1486 masl) compared to the lower altitude ones: Chemchem (1219‒1240) and Changarawe (1375‒1440 masl). An earlier study that also compared physical quality of stored grain in two contrasting agro-locations of neighboring Babati District also showed that the grain damage levels were higher in the high-altitude

45
location (Mutungi et al., 20197). Usually, lower altitude zones would be favorable for insect multiplication because of warmer and more humid conditions, so would experience higher grain damage. The cooler conditions, however, also encourage mold, but could also encourage insect damage due to higher grain moisture; moist grain is softer and insects bore into it easily during oviposition. Thus, the higher overall grain damage recorded in the high-altitude villages may be attributed to the interaction effect of temperature and relative humidity on insect population development, but also the progression of other forms of biodeterioration. The cultivated varieties and farm practices may also have contributed to the observed differences, although specific data in this direction could not be generated with certainty. The performance of hermetic storage technologies was not significantly different (P = 0.628), and neither amongst the villages (P = 0.641). Similar results have been reported (Abass et al., 20188). The overall grain damage levels averaged 8‒9% and translated into physical quantity losses of 4.4‒4.9% after 7 months of storage. These losses can be considered reasonably low (a damage level > 5% is considered significant because the grain attracts significant price discounting in the market; Compton et al., 19989). However, three other interesting observations were made:
(1) Insects survived in the hermetic containers. The populations were lowest in the AgroZ bag and highest in the metallic silo. The resultant grain damage by insects followed the same pattern. It is not strange that the insects surviving in the hermetic containers did not have a huge impact on grain damage. This is because the activity of the insects was reduced by the relatively low oxygen conditions. Nonetheless, the presence of active insect activity signals that sound handling and management of the technologies by farmers must also be ensured, especially because farmers would need to open the containers more frequently.
(2) A significant number of the hermetic bags had insect punctures (Fig. 21). Interestingly, the double liner PICS bags were more damaged by insects compared to the AgroZ bags, which are made of micro-multilayer sheets forming a single hermetic liner. An example of one extreme case is shown in Figure 22. Air-tight bags with insect holes are ineffective are no longer attractive to farmers after a single use. Earlier research showed that air-tight bags should be reusable for at least 2‒3 seasons to be economically attractive (Kotu et al., 201910).
(3) Unlike in previous assessments, the Larger grain borer (Prostephanus truncatus, Horn; LGB) was identified in some farmers’ stores during the current trial (Fig. 20). The average LGB incidence on the harvested maize before storage was 4.7% (Changarawe village 12.5%; Bashay 10%; Slahhmo 12.5%; 0% in the other villages. At 7 months the
7 Mutungi C., Muthoni F., Bekunda M., Gaspar A., Kabula E., Abass A. (2019) Physical quality of maize grain harvested and stored by smallholder farmers in the Northern highlands of Tanzania: Effects of harvesting and pre-storage handling practices in two marginally contrasting agro-locations. Journal of Stored Products Research 84:101517. DOI: https://doi.org/10.1016/j.jspr.2019.101517. 8 Abass A.B., Fischler M., Schneider K., Daudi S., Gaspar A., Rüst J., Kabula E., Ndunguru G., Madulu D., Msola D. (2018) On-farm comparison of different postharvest storage technologies in a maize farming system of Tanzania Central Corridor. Journal of Stored Products Research 77:55-65. DOI: https://doi.org/10.1016/j.jspr.2018.03.002. 9 Compton J.A.F., Floyd S., Magrath P.A., Addo S., Gbedevi S.R., Agbo B., Bokor G., Amekupe S., Motey Z., Penni H., Kumi S. (1998) Involving grain traders in determining the effect of postharvest insect damage on the price of maize in African markets. Crop Protection 17:483-489. DOI: https://doi.org/10.1016/S0261-2194(98)00041-6. 10 Kotu B.H., Abass A.B., Hoeschle-Zeledon I., Mbwambo H., Bekunda M. (2019) Exploring the profitability of improved storage technologies and their potential impacts on food security and income of smallholder farm households in Tanzania. Journal of Stored Products Research 82:98-109. DOI: https://doi.org/10.1016/j.jspr.2019.04.003.

46
prevalence was 8.5%, and the pest was noticed in all the eight villages except Buger. The incidence of the common grain weevil was 76% on harvested maize before storage, and 72 % at 7 months sampling. The LGB is the greatest threat to stored maize, especially in the warm humid regions; the pest tolerates drier conditions better than other storage pests (Haines 199111) and causes more damage in the drier environments. It was therefore not surprising that the extreme case depicted in Figure 6 was in Changarawe which is about 1220 masl. Successful grain storage devices must demonstrate the ability to control or supress this pest, which is capable of causing extensive damage to storage structures.
Figure 20. Damage of maize grain stored in ordinary bags (left) and in hermetic containers (right) for 7 months in different villages. Without the hermetic storage technology, there is a broad range in insect damage levels in most villages. However, a similar observation is also made regarding performance of the hermetic technology.
11 Haines, C.P. (1991). Insects and arachnids of tropical stored products: their biology and identification- A training manual. Natural Resources Institute (NRI).

47
Figure 21. Insect holes on the air-tight bags after 7 months of maize storage.
Figure 22. A case of technology failure: (A) AgroZ bag (single liner) and PICS bag (double liner) placed side by side; (B) insect holes on the outer polypropylene bag of the PICS bag and grain powder around it; (C) caked damaged grain from the PICS bag. The ferocious larger grain borer was identified in this particular store (Changarawe Village), and also in some other farmers’ stores with an overall prevalence rate of 8.5%. The AgroZ bag outperformed the double liner PICS bags at this famer’s store. Photo credit: Christopher Mutungi/IITA.
Hermetic technologies for storage of common beans. The storability of three popular, locally cultivated common bean varieties: purple speckled, oval round, and round yellow variety (Fig. 23) was tested. The test involved hermetic PICS bags against the control (PP bags). Insect population, level of damage, and integrity of the hermetic bags after the storage exercise were examined.

48
Figure 23. Popular common bean varieties. Photo credit: Christopher Mutungi/IITA.
The round yellow variety exhibited higher, but not significant, infestation and damage by bruchids, right from the field and during storage. Overall damage (includes insect damage and other forms such as change in color, shrinkage, and mold damage) by variety was significant (P = 0.030; Fig. 24); the round yellow variety was most damaged in both PICS and PP storage. This finding agreed well with what farmers had earlier reported. The effect of storage technology was also significant (P = 0.000; Fig. 25) but there was no significant interaction effect between variety and storage technology.
Figure 24. Bruchid infestation (top) and overall seed damage (bottom) on popular varieties of common beans at baseline (A and B) and after 7 months of storage (C and D). All data of PICS or PP storage.

49
Figure 25. Overall damage of stored common bean varieties by type of storage technology. Ordinary storage in PP bags is to the left; hermetic PICS bag is to the right.
Integrity of hermetic bags. The PICS bags were perforated by bruchids. Where the bruchids did not make perforations, clear transparent lesions were evident. The lesions were similar to windows often seen covering the maturing adults inside infested seed, just before the adults emerge, but these collapsed quite easily into holes, which would allow in air. There were more perforations and lesions on the inner liner compared to the outer one (Fig. 26). More than half of the bags had over 50 insect holes on the inner liner whereas about a third had at least 50 clear insect holes on the outer liner.
Figure 26. Range of the number of perforations and bruchid-inflicted lesions on polyethylene liners of PICS bags.
The bean weevil (Acanthoscelides obtectus Say), and the Mexican bean weevil (Zabrotes subfasciatus Boheman) are the common bruchids known to attack beans. The two pests are thought to co-exist but A. obtectus is reported to be more widely distributed in East and Southern Africa and is distinguished from Z. subfaciatus by the ability to oviposit on maturing

50
pods in the field, whereas the latter hardly does so (Giga and Chinwada, 199312). The incidence of adult bean weevil infestation was 58% at the time of storage. The median infestation level at the onset of storage was 20 adult insects/kg, but infestation levels as high as 200 adults/kg were determined. This was an indicator of already high levels of latent infestation. As a counter measure, an additional step to disinfect the grain before bagging, e. g., solarization on mats, is recommended. Bruchid populations in the PICS bags were low up to 3.5 months, but then increased significantly by the 7th month, suggesting that the insects did not die, and the hidden infestation was able to emerge and reproduce further in some stores. Low oxygen environments can trigger insects to enter diapause, an hypometabolic state in which activity is highly minimized (Mutungi et al., 201413). The return to normal state could then happen with frequent opening of the bags as would be done by users in many households to draw grain for consumption or sale. Furthermore, immature stages of many insect species exhibit higher tolerances to hermetic storage conditions than adults (Annis, 198614), which would then explain bruchid resurgence at some point, if produce is internally infested at the time of storage. In the present case, the hermetic PICS bags used to store beans for 7 months were highly perforated by bean bruchids possibly because of the combination of factors including high initial infestation levels, poor sealing, and even poor-quality bags. With this high extent of perforation, farmers would be unable to reuse the bags as recommended for economic reasons. Farmer perceptions of the technologies. Most farmers (66%) liked the metallic silo which could not be damaged by insects or rodents and was able to store more food in a confined space. However, we also noticed that 27 out of 35 households (77%) participating in the demos were unable to accommodate the 500 kg silo because it was too large to pass through the door of the houses or stores, otherwise they would have to make do with modifications or adopt a smaller silo. Farmers were interested in the local availability and suggested that having it manufactured locally would probably make it cheaper. There were also queries regarding durability; farmers felt that it was too light and thought it would be attractive if manufactured from a stronger material. A main concern regarding the hermetic bags was consistency of quality from batch to batch (season to season). Farmers who had applied the technology before pointed out that the bags introduced in the past years were stronger and offered better protection. According to farmer ratings, the single liner AgroZ bag performed better than the double liner PICS bags. Farmers felt that the bags were not suitable for beans, arguing that bean weevils (bruchids) punctured the bags with more ease than maize weevils. Gender and socio aspects of the technologies were not assessed. To be able to elicit meaningful responses on these, it was advised that farmers/users should have a long period of interaction with the technologies, at least two seasons.
12 Giga, D.P., and P Chinwada, 1993. Progress in bean bruchid research in SADC, pp. 23-39. In J. K. O. Ampofo (ed.), Proceedings, 2nd meeting of the Pan-Africa Working Group on Bean Entomology, 19-22 September 1993, Harare, Zimbabwe. CIAT, Network on Bean Research in Africa 13 Mutungi C.M., Affognon H., Njoroge A.W., Baributsa D., Murdock L.L. (2014) Storage of mung bean (Vigna radiata [L.] Wilczek) and pigeon pea grains (Cajanus cajan [L.] Millsp) in hermetic triple-layer bags stops losses caused by Callosobruchus maculatus (F.) (Coleoptera: Bruchidae). Journal of Stored Products Research 58:39-47. DOI: https://doi.org/10.1016/j.jspr.2014.03.004. 14 Annis, P.C., 1986. Towards rational controlled atmosphere dosage schedules: a review of current knowledge. In: Donahaye, E., Navarro, S. (Eds.), Stored Products Protection, Proceedings of the 4th International Working Conference on Storedproduct Protection, 21- 26 September 1986, Tel Aviv, Israel. Maor-Wallach Press, Jerusalem, Israel, pp. 128-148.

51
Economic interpretation of the produce damage abatement. From the work of Compton et al. (199815) insect damaged grains attract a price discount of 0.6‒1% for every addition 1% grain damage. Similarly, from Mishili et al. (201116) common beans may attract a price discount of 2.3% for every bruchid hole per 100 bean seeds in the urban retail markets of Tanzania. Conservatively, this value can be taken to mean a 2.3% discount for every 1% damage. We apply the following data (Tables 18‒20) to compute profitability of the various technologies for maize and beans. We assume a 25% opportunity cost of capital and apply the framework of Jones et al. (201117) to derive the returns to storage. Other assumptions: hermetic bags could be used for a second season. Cost of the hermetic bag was straight-line depreciated over two years (crop seasons). An example of the estimation is shown in Table 21, and results summarized in Tables 22 and 23. Table 18. Maize damage and weight loss data.
Storage technology
PICS AgroZ Silo Control (PP)
Mean damage (kg/100kg) 10.2 7.91 9.31 72.3
Mean weight loss (kg/100kg) 6.62 4.49 4.92 23.57 Table 19. Bean damage and weight loss data.
Purple speckled var. Round yellow var. Oval yellow var.
PICS PP PICS PP PICS PP
Mean damage (kg/100kg) 4.25 46.05 24.9 75.8 6.3 44.6
Mean weight loss (kg/100kg) 2.26 13.51 7.12 33.27 1.93 2.38 Table 20. Commodity prices as provided by farmers.
Commodity At harvest season (TZS/kg)1
6‒7 months after harvest (TZS/kg)
Maize 350 600
Beans - Purple specked variety 900 1200
Beans - Oval yellow variety 1200 1800
Beans - Round yellow variety 1500 2400
15 Compton J.A.F., Floyd S., Magrath P.A., Addo S., Gbedevi S.R., Agbo B., Bokor G., Amekupe S., Motey Z., Penni H., Kumi S. (1998) Involving grain traders in determining the effect of postharvest insect damage on the price of maize in African markets. Crop Protection 17:483-489. DOI: https://doi.org/10.1016/S0261-2194(98)00041-6. 16 Mishili, F. J., Temu, A., Fulton, J., & Lowenberg-DeBoer, J. (2011). Consumer preferences as drivers of the common bean trade in Tanzania: A marketing perspective. Journal of International Food & Agribusiness Marketing 23: 110-127. 17 Jones, M., Alexander, C. & Lowenberg-DeBoer, J. (2011). An initial investigation of the potential for hermetic Purdue improved crop storage (PICS) bags to improve incomes for maize producers in sub-Saharan Africa. Working Paper #11- 3. Department of Agricultural Economics Purdue University, 44p.

52
Table 21. Estimation of profitability of technologies. Commodity: Beans - Oval Yellow Variety (Local name: Njano Ndefu)
Sell at harvest (June)
Store in PICS bags and sell in lean season (December)
Revenue Derivation
PICS 1st year use PICS 2nd year use
Sample production (kg) 100 100.00 100.0
Weight loss (%) 0 1.93 1.93
Quantity marketed 100 98.07 98.07
Beans damaged 0 6.30 6.30
Farmgate price ($)1 0.53 0.80 0.80
Price received with damage discount ($)
0.53 0.68 0.68
Total revenue 53 66.67 66.67
Storage costs
Sieving/sorting ($) 0.42 0.42 0.42
Insecticide cost ($) 0 0.00 0.00
Storage bag cost ($) 0.21 2.19 1.10
Bagging cost ($) 0.21 0.21 0.21
Total storage costs ($) 0.84 2.82 1.73
Nominal total income ($)
52.16 63.85 64.94
Opportunity cost of capital (25%) ($)
5.75 5.50
Gain from storage ($) 5.94 7.28
Gain on investment (%)
10.80 13.52 1 Discounted price = (Farm-gate price) – (discounting rate) *(% Beans damaged) *(Farm-gate price). Discounting rate is 2.3% for beans and 1% for maize. 1 1 $ = 2280 TZS.
• Net income = Total revenue – (marketing costs +storage costs)
• Net gain on storage = Net income – (opportunity cost of capital +net income if selling at harvest)
• Return to storage = (Net gain on storage)/(net income if selling at harvest + total storage costs)
Table 22. Profitability of storing maize in different air-tight bags in Karatu.
PICS bag AgroZ bag
1st year 2nd year 1st year 2nd year
Gain from storage ($) –1.35 0.00 –0.30 1.04
Returns of storage (%) –7.93 –0.01 –1.78 6.57
Table 23. Profitability of storing different common bean varieties in hermetic PICS bags in Karatu.
Purple speckled Round yellow Oval yellow
1st year 2nd year 1st year 2nd year 1st year 2nd year
Gain from storage ($) –0.99 0.36 –29.99 –28.64 5.94 7.28 Returns of storage (%) –2.41 0.90 –44.11 –42.82 10.80 13.52

53
1. From the present results, the PICS bag was not profitable for maize storage because of the high grain damage levels and losses. The AgroZ was profitable in the 2nd year of use; returns to investment = 6.57%; Net returns 10 $/ton.
2. Profitability of the PICS bag for beans storage varied with variety depending on the market value, vulnerability to damage, and attack by insects of different varieties. The technology was profitable for only one variety “Oval yellow”; returns to investment: 10.8‒13.5%; Net returns: 59.4‒72.8 $/ton. Earlier work revealed that the three varieties had different traits with respect to storability, nutritional value, and economic value. The round yellow variety attracts a higher market price because it cooks fast and uniformly and does not cause flatulence. It is therefore preferred in urban markets where cooking fuel is a constraint. Nonetheless, it is more susceptible to insect attack during storage and also undergoes a color change during storage, which are likely to cause a higher amount of grain that cannot be sold at a premium price. The Purple specked bean resists insect damage but is least preferred because it takes too long to cook and causes flatulence while the oval yellow bean is a moderate variety (Table 24).
Table 24. Farmers’ perception of popular common bean varieties.
Characteristic
Variety
Purple speckled bean variety (PS)
Yellow colored, round shaped variety (YR)
Yellow colored, oval shaped variety (YO)
Productivity - - High yielding. - Less yielding. - Higher yield than to YR but less compared to PS.
- - Performs well even under low soil fertility.
- Performs poorly under low soil fertility compared to PS.
- Performs better than YR but poorer that PS.
- - Matures earlier than YR and YO.
- Takes longer in the field compared to PS.
-
Postharvest & Nutrition
- - Harder; does not break easily during threshing.
- Breaks more readily during threshing compared to PS.
- Breaks less compared to YR but less compared to PS.
- - Less susceptible to insect attack during storage.
- More susceptible to insect attack during storage than PS.
- More resistant to insect damage compared to YR but less than PS.
- - Color is more stable during storage.
- Color changes to yellow brown during storage.
- Colour more stable than YR.

54
- - Takes longer to cook (60‒80 min)
- Cooks faster (40 min); saves on cooking fuel.
- Longer cooking time than YR but shorter compared to PS (50‒60 min)
- - More stable cooked quality; good gravy quality.
- Cooked beans develop unpleasant smell when left overnight.
- Cooked beans develop bad smell when left overnight just as YR.
- - Causes flatulence.
- Causes Less flatulence compared to PS.
- Less flatulence as YR.
- - Superior taste. - Less tasteful than PS.
- Less tasteful than YR.
Economic - - Lower prices in the market.
- Higher market value compared to PS by 160‒200%
- Higher price than PS by 120‒160% depending on location.
- - Less demanded by traders. In a typical season only 10% of traders buy it.
- Higher demand compared to PS and YO; In a typical season only 70% of traders buy it.
- Higher demand by traders than PS. In atypical season 20% of traders buy it.
Nutritional value, safety, and processing quality of produce during storage and utilization by households Nutritional characteristics of popular maize and common bean varieties were reported in the earlier reports. In the present reporting period, we examined effect of storage on content of key nutrients. The main factors were storage duration, variety, and storage technology (open or air-tight storage). Crude protein, fat, total minerals, and fiber content were determined according to the official methods of analysis of the Association of Official Analytical Chemists (AOAC, 200018). Individual minerals were analyzed using atomic absorption spectrophotometry. Common beans. Storage duration influenced the levels of all measured nutritional parameters except fiber (Table 25). The interaction effect of storage duration and variety was also significant for all the parameters except fat. Storage technology was significant on total ash and iron; on average the beans stored in PP bags had 3‒5% higher levels of total ash and iron. The interaction of storage technology and variety was, however, significant for protein, iron, and
18 Association of Official Analytical Chemists (AOAC). 2000. Official Methods of Analysis (17th Ed). AOAC, Arlington, VA, USA.

55
manganese, further supporting the observation that air-tight storage did not perform the same way for the different common bean varieties. Table 25. Effects of variety, storage technology, and storage duration on proximate and mineral content of beans after 7 months storage. Factor Protein Fat Fiber Ash Fe Zn Mn
Storage duration .000 (.31) .000 (.27) ns .000 (.54) .000 (.52) .027 (.05) .000 (.40)
Storage technology ns ns ns ns .000 (.11) ns ns Variety ns ns .000 (.46) .000 (.25) .000 (.18) ns ns
Storage duration * Storage technology
ns ns ns .009 (.05) .000 (.11) ns ns
Storage duration * variety .000 (.10) ns .001 (.11) .018 (.06) ns .005 (.11) .017 (.07) Storage technology * variety .007 (.05) ns ns ns .000 (.15) ns ns
Storage duration * Storage technology * variety
ns ns ns ns .000 (.15) ns ns
ns = P- value not significant. Significant effects (P - values at 95% CI) are presented, followed by partial eta squared (ηp2), in parenthesis, which is a measure of effect size or relative contribution of the factor of factor combinations to the overall variability observed for the particular dependent variable.
Maize. Crude protein, fat, and fiber content of maize stored in PICS and PP bags did not differ with storage technology, while total ash, Fe, and manganese were significantly higher in the maize stored in PP bags (Table 26). Storage duration had clearer and more pronounced effects. Unlike common bean protein, fat and ash increased in the first 3.5 months after which a decrease seemed to occur. With respect to protein content, a similar trend was reported (Pinto et al., 200619). In the present case, increases were 0.6‒6.7% (protein), 13‒19% (fat), and 16% (ash). The greater increase in the first months is probably because of the development of insect larvae inside the grains and the decrease that follows could be attributed to emergence of adult insects and the feeding on the grains that continue thereafter. Unlike bean bruchids that continue to reside for some time inside the grains after reaching adult stage, the adult maize weevils are more active and tend to leave the grain at once to oviposit on new grains (Ngángá et al., 201620). The levels of the three micro-elements—iron, zinc, and manganese—increased linearly probably due to increasing hidden infestation. The increases were by 26%, 16%, and 29% and 56%, 36%, and 113%, after 3.5 and 7 months, respectively. Fe and Zn are known to accumulate in grains. For the maize stored in hermetic containers, these nutritional improvements are useful, but should be confirmed.
19 Pinto A.R., Kozlowski L.A., Amantini E., Furiatti R.S. (2006) Variation of the nutritional components of stored maize, due to the influence of insects from the Sitophilus complex (S. oryzae and S. zeamais) infestation and resultant fungal development. http://spiru.cgahr.ksu.edu/proj/iwcspp/pdf2/9/6298.pdf 20 Ng’ang’a J., Mutungi C., Imathiu S.M., Affognon H. (2016) Low permeability triple-layer plastic bags prevent losses of maize caused by insects in rural on-farm stores. Food Security 8:621-633. DOI: 10.1007/s12571-016-0567-9.

56
Table 26. Effects of storage technology and storage duration on nutrient content of maize grain.
Factor/ factor combination Protein Fat Fiber Ash Fe Zn Mn
Storage technology ns ns ns .028 (.03) .032 (.026) ns .008 (.04) Storage duration .003 (.064) .000 (.12) .000 (.13) .000 (.24) .000 (.41) .000 (.19) .000 (.60) Storage duration * Storage technology
.007 (.055) ns ns ns .000 (.09) ns .005 (.06)
ns = P-value not significant. Significant effects (P- values at 95% CI) are presented and are followed by partial eta squared (ηp2), in parenthesis, which is a measure of effect size or relative contribution of the factor/ factor combinations to the overall variability observed for the particular dependent variable.
Output 3.2 Nutritional quality due to increased accessibility and use of nutrient-dense crops by farmers improved
Pathways to sustainable adoption of nutrient diets in central Tanzania A study was conducted to investigate the drivers of food choice in the semi-arid central zone of Tanzania. Focus group discussions were used to develop and test a contextualized survey tool. A survey of drivers of food choice relating to pearl millet and pigeon pea feeding to school going children was conducted with 130 respondents. Highlights of some results are given below. Pearl millet. The grain is largely perceived in these communities as food for caregivers who generally tend to be female, young, and school going children (Table 27). Yet over 60% of caregivers were unaware of nutritional benefits of pearl millet, though they were aware of the benefits of iron and zinc (which are present in pearl millet) to the health of their children. The study finds that adolescents are a nutritionally vulnerable group (Table 27) that could benefit from the nutrients in pearl millet, especially iron and calcium, needed for growth. There is need to promote innovative recipes and approaches to expand consumption to the group. A total of 65% of the caregivers were not worried about availability of the grain, but 30% indicated the time required for processing prior to feeding to be a challenge. The respondents also identified medical doctors as the trusted and influential personnel in disseminating nutrition and health messages. Table 27. Main consumers of pearl millet and pigeon pea in households of Kongwa and Kiteto (n = 130).
Household group Frequency (%) Pearl millet
Frequency (%) Pigeon pea
Spouse/partner 27.6 30.4
Caregiver 42.5 42.8
Infants (children less than one year) 3.1 5.8
Young children (2‒4 years) 29.9 32.6
School going children (5‒12 years) 35.4 36.2
Adolescent (13‒19 years) 15.0 10.1
Youth (21‒49 years) 6.3 8.7
Older people (above 50) 3.1 13.0
Pigeon pea. A trend of consumption, similar to that of pearl millet, was also observed for pigeon pea. Knowledge on the high protein and iron content of pigeon pea was limited (< 50%) among caregivers even though caregivers were aware of the importance of iron containing foods to the health of the child. During nutrition education, the iron content of pigeon pea should thus be

57
emphasized to drive acceptance of pigeon pea in daily diets especially for groups such as adolescents. Unlike for pearl millet, the majority of caregivers (54%) were worried about the limited supply of pigeon pea while 39% consider the processing time a challenge. The results show the need for increased promotion of pigeon pea production, together with its promotion for consumption. For both pigeon pea and pearl millet, the promotion of promotion of labor-saving processing technologies will likely improve their consumption. Health service providers appear to have the most influence on nutritional advice to caregivers; up to 93% of them believe the doctors’ opinions to be very important. Strategic partnership with health service providers is thus a good starting point to increase nutrition knowledge delivery. Promoting farmer production of nutrient dense (Zn, Fe) SER83 and NUA45 bean varieties in Malawi Maize occupies a disproportionately high percentage (70‒80%) of cropped land in central Malawi, leaving only at most 30% of the land for grain legumes and other minor crops. Dietary diversity studies have confirmed the dominant role of maize in diets. Consequently, protein and micronutrient deficiencies are widespread. Over the years, we have advocated for a shift towards intensified scaling of grain legumes on farms. While this is one pathway towards bringing more balance on farms and improved nitrogen cycling through biological N2-fixation, there is an opportunity to improve nutrition without necessarily changing the proportion of land allocated to grain legumes. This could be achieved through increased use of nutrient-dense and drought-tolerant bean varieties in the maize-based cropping systems to increase land productivity in areas with small land holding capacity. Maize and common bean are both major food crops in the cereal and pulse categories, where maize is a source of carbohydrates as bean is for protein in human diets. Crop productivity. A study was carried out on maize/bean intercropping under field conditions on three experimental sites: Dedza, Linthipe, and Chitedze. At Dedza and Linthipe, the trials were located in farmers’ fields, while the one at Chitedze was at a research station farm. This experiment tested the combination of maize with two types of common bean growth habits (bush and climbing). Within each bean growth habit, there were two types of varieties, which were selected on purpose. Among the bush bean category, both varieties were released in Malawi, where SER83 is known for drought tolerance, and NUA45 is known for nutrition—biofortified (high Fe and Zn) content. In the climbing bean category, there was a local variety (Domwe wawilira) and a new test variety (MAC109). To compare maize with maize/bean intercrop treatments, one plot was planted to maize pure stand. Likewise, to compare bean/maize intercrop with bean only, the whole set of bean varieties were planted in pure stand, where the climbing bean was supported by stakes. The mean grain yield of common bean was 600 kg/ha at Linthipe, 431 kg/ha at Dedza, and 298 kg/ha at Chitedze (Table 28). The main attribute to low grain yield across the sites was the heavy rains associated with cyclone Idai in March 2019, which led to excessive bean flower drop and subsequently poor pod set. In addition, the excessive rains came along with diseases like angular leaf spot and floury leafspot at Deadza. Across all the three testing sites, common bean yield was higher in pure stand compared to the intercrop. The mean yield of maize was higher in Linthipe (4875 kg/ha), followed by Dedza (2191 kg/ha) and Chitedze (671 kg/ha). At Chitedze, the maize crop was attacked by fall army worm at the vegetative stage and this led to low grain yield while at Dedza the acidic soil and cool temperatures might have contributed to low maize

58
grain yield. Despite the low grain yield of both common bean and maize, especially at Chitedze and Linthipe, the land equivalent ratio was greater than 1.0 (Table 28) in all the testing locations emphasizing the economic advantage of intercropping common bean with maize. Table 28. Bean yield from bean‒maize intercrop evaluated in three locations. (Land equivalent ratios in parenthesis when bean is intercropped with beans.)
Treatments Common bean yield (kg/ha)
Bembeke Linthipe Chitedze
Domwe 774 530 339
MAC 542 511 348
Maize + Domwe 522 (1.67) 710 (1.98) 109 (1.18)
Maize + MAC 291 (1.27) 434 (1.68) 196 (1.45)
Maize + NUA45 311 (1.65) 651 (1.83) 205 (1.26)
Maize + SER83 262 (1.53) 366 (1.69) 333 (1.44)
NUA45 327 804 398
SER83 415 801 453
Mean 431 601 298
LSD(0.05) 303.4 320 256
P-Value 0.03 0.06 0.14
CV% 13.4 15.2 30.4
Participatory technology selection. During the 2018/19 season, CIAT conducted participatory technology selection in Bembeke EPA. The activity engaged 45 farmers (13 male and 32 female). The farmers were given cards with different numbers to use for ranking. The farmers were to choose from different varieties of beans, and different cropping systems. They were given a card with number 1 for their best choice; 2 for their second choice, and 3 for their third choice. To effect the selection of a technology and its ranking, each participant had to place a corresponding card in a plastic bag located in each technology plot. Men and women made their choices separately beginning with the best choice. After tallying the selections, reasons were given for each choice (Table 29).

59
Table 29. Participatory technology selection.
Focus group discussion results on gender implications of the different bean varieties. Nineteen farmers from Linthipe EPA were invited for a focus discussion on gender issues in relation to the bean crop. The interaction had 7 male and 12 female participants aged from 24 to 57 years. Table 30 summarizes the bean production themes and consequent responses. Table 30. Responses that were advanced in relation to gender participation in common bean production.
Theme Response 1. Household decision
making on what crop to grow
The decisions are made as a couple depending on the size of land required for the crop.
2. Procurement of inputs needed to produce the crop
Decision is made as a couple depending on how much money is available in the household.
3. Division of labor in farm activities
Land preparation, planting, fertilizer application, weeding, and harvesting are done by both men and women. When children have closed from school for the day, they assist with field activities. Postharvest activities are mostly done by women and girls. The activities include drying, de-husking, winnowing, and postharvest treatment
4. Selling of harvest Depending on the quantities involved, either men or women are involved. If the quantities are less than 50Kgs, women take the beans to the market. If quantities are above 50Kgs, men take the produce to the market because of the effort required. In rare cases, husband and wife sell beans without the knowledge of the other to purchase alcohol.
5. Use of revenue retained from sale of beans
A couple decides on how the funds should be used. Funds have been used for paying school fees for children and procurement of inputs.
Gender Selected technology Reasons for selection
Women
1. Maize + NUA45 (53%) Early maturity, high yield, marketable due to grain size, performed well as an intercrop with maize, perceived good taste
2. NUA45 (37.5%) Early maturity, high yield, marketable due to grain size, not very labor demanding as compared to climbing beans
3. SER83 (9.5%) High yielding performed well under dry conditions. The small size makes the grain fetch a low price
Men
1. NUA45 (50%) Early maturing, high yielding, large grain size making them fetch a high price on the market
2. MAC109+ maize (32.4%) Highly marketable due to its attractive color and size (sugar bean), high yielding
3. NUA45 +maize (17.6%) NUA45 better as sole crop

60
Outcome 4. Functionality of input and output markets and other institutions to deliver demand-driven sustainable intensification research products improved
Output 4.1 Access to profitable markets for smallholder farming communities and priority value chains facilitated
Value chain analysis of groundnut seed and design of its operation enhancement strategies The study was conducted in the semi-arid ecologies of central Tanzania and the following are the key findings:
1. Groundnut seed value chain is under-invested by the private sector, including the government seed agency (ASA) in central Tanzania (Table 31). As such, the informal systems predominate, with seed supply (production), mostly being done by farmer-groups, managed through associations. Most of the seed producers (51.6% of the farmers involved in seed production) are producing quality declared seed followed by those engaged in certified seed production. The study established that 68% of the seed producers are women.
2. The main improved seed sources are public research agencies such as ICRISAT and TARI-Naliendele. The groundnut seed value chain is also not competitive, being prone to production risks (weather and diseases). The formal seed sector is still weak with very few private seed companies engaged in production, along with their agro-dealer networks to sell groundnut seed. The private sector albeit, shows a slowly growing demand for improved seed, mostly driven by the grain market in Kibaigwa, that supplies grain to the country and region.
3. Grain production in that case is slowly driving demand for improved inputs such as seed. 4. Seed production standards exist for groundnut and the seed being produced should
adhere to distinctiveness, uniformity, and other key seed production measures. 5. The seed production regulatory services are offered at a fee whereby seed companies are
mandated to pay the fee in case of producing certified seed whereas for QDS the fee is paid by the government. The government system has no distinct incentives to promote investment in development of improved varieties, but investors are rewarded with intellectual property rights for groundnut. The authority ensures the seed under commercialization follow the agreed standards through field inspections, sorting, and grading; and issuance of seed certification and quality mechanisms are in relation to quality and shelf life.
6. Seed production is supported by the extension staff from government, but they experience several challenges when executing their support services such as low level of education of trainees, group cohesion, and limited supply of inputs (some of the farmers expect to get inputs free of charge) to a large extent; and lack of collateral in relation to input acquisition.
7. Though the public sector supports seed production, neither they nor the private sector are fully involved in ensuring efficient delivery of groundnut seed. As such, an integrated seed supply system would offer a sustainable solution, and this calls for concerted efforts to have strategic partnerships towards achieving this goal. Opportunities in support of this approach were identified (Table 32).

61
Table 31. Groundnut seed supply avenues in central Tanzania. Seed avenue Frequency Percent Remarks and in-depth views
Agro-dealer 7 10.9 The seed supply in the region was being done by a number of organizations including community seed banks, with NGOs and research institutes (TARI and ICRISAT) dominating with moderate supply from the agro-dealers. Most of the community seed associations sell the TOSCI certified seed direct without involving the agro-dealers. The agro-dealers stated that red colored groundnut is the most preferred by the market; and one kg of shelled seed cost Tzsh-20-0. The supply from the agro-dealers was low due to the fact that there was no major private seed company distributing groundnut seed in the country. 1. This was stated by the agro-dealers as a major drawback since the demand for quality
seed is high. In addition, some farmers tend to recycle seed from the previous season, thus reducing the demand that the agro-dealers would cater for.
2. The model of production entails both contractual and own production, thus this serves as an avenue for employment for youth and women who are hired to produce the seed. The proportion of women contracted as per the seed companies interviewed is 74% while the rest are youth. Among the seed producers, only one (DASPA) was involved in the production of seed for other crops, and groundnut represented 40%. The producers sell the seed direct to farmers and farmer groups.
Research Institute, e.g. TARI and ICRISAT
19 29.7
Community Seed Bank
13 20.3
Seed Company 1 1.6
NGOs 15 23.4
Government project
9 14
Total 64 100

62
3. Market information and infrastructure were highlighted as major challenges the seed producers face in seed distribution. The seed producers were well supported by government research and extension departments in terms of provision of early generation seed, linkage to farmers and markets, agronomy, postharvest, and storage. The producers get fertilizer from manufacturers. The seed producers have processing units but the stated access to machinery and packaging of the seed as major challenges they encounter.
4. The seed producers are governed by government seed policies (distinctness, uniformity, stability, isolation distance) that they have to adhere to, and they testified that these policies support their seed production business objectives. The existing regulations include registration and licensing, at least 3 field inspections, laboratory testing, and certification/permit to sell seed. The seed producers have access to credit to support their agro-enterprises at an interest rate of 7‒18%.
5. The seed producers are part of associations that produce seed and in support of Agro-enterprises as well. They also participate in agricultural shows, initiatives which they attribute to stimulating demand for their seed. The companies are also involved in market scoping missions annually.
Table 32. Opportunities in input supply system in support of seed production in central Tanzania.
Opportunities in input supply system
Number of respondents
Percentage Remarks
Supply of early generation of seed
13 19% The study identified key entry points that would act as economic drivers to farmers in central Tanzania. Seed multiplication was identified as the most feasible option. This is can go a long way in stimulating the supply of quality seed in the region. As such developing a concrete strategy that would ensure access to basic seed, credit services, and extension support to feed into the seed multiplication initiative would contribute to making the groundnut seed value chain more vibrant. Improving the functioning of markets for the grain in the region can translate to more demand for seed.
Start own agro-dealer shop
13 19%
Provision of credit services
11 16%
Seed multiplication business
31 46%

63
Value chain analysis for nutrient-dense maize seed in central Tanzania We conducted the seed VCA study survey in Kongwa, Kiteto, and Babati between the last week of August and the last week of September. The survey involved key actors in the seed value chain households (consumers/grain producers), input suppliers, seed producers/suppliers, seed regulatory authority, and researchers involved in variety release. The information and data are being analyzed and the results will be submitted by December 15. Exploring ICTs for linking farmers to market The objective of this work is to scale out promising technologies beyond the Africa RISING target sites in Tanzania by providing advice on agronomy, climate services, and market information via phone. Use of interactive videos for training was also deployed as an add-on to improve knowledge transfer to the farmers. The videos were developed involving the communities and in Swahili language in Tanzania to ensure the literacy gap was bridged and give the communities a sense of ownership. During this reporting period, we reached more than 2,200 smallholder farmers (unique profiles in Babati) using SMS information services; 70% were males and 30% females. The low number of registered female farmers may be attributed to mobile phone ownership, which is skewed in favor of men due to cultural and socioeconomic factors. Currently, dissemination of SMS on agronomy is ongoing in trickles as the postharvest season is winding up and preparations for land preparation will soon commence. Equally, messages on Agri-tips on harvest, postharvest technologies, and storage and marketing tips were delivered to an audience of 2,200 farmers. We are engaging with project partners to tailor messages to the farmer’s needs towards providing reliable, relevant, and timely information on postharvest interventions and livestock activities. Other accomplishments during the reporting period are:
1. Successful engagement and partnership with ESOKO. 2. Showcasing AR-NAFAKA work part of which includes components from Africa RISING at
the NaneNane Agricultural show in Tanzania. 3. Showcasing Africa RISING MWANGA Platform at the AGRF in Accra in September2019. 4. Cleaning smallholder farmers’ profile information and developing a database of the
project beneficiaries for both the Southern Highlands and Babati farmers. 5. Disseminating to the beneficiaries agronomy SMS content and videos co-developed with
Africa RISING partners and personalized information based on farmer profiles. 6. Report on beneficiaries’ user experiences for monitoring and evaluation purposes. 7. Align the SMS dissemination with the radio programs to ensure complementarity. 8. Deployment of the K-Plus video module to the Platform.
Recommendations for future work
• Feedback mechanism: Farmers requested for a phone number they can call when they have inquiries on farming, markets, weather, or inputs. We feel the most appropriate channel is a call center running a farmer helpline, which they can call and get answers from. Esoko Tanzania is seeking to establish this as it will be a necessity as the number of farmers being reached increases.
• Sensitization and creating awareness through mass media: There should be a provision for running radio or TV campaigns before engaging farmers to ensure they have some

64
background of the project before engaging them on the ground. This can also be used for aiding in farmers self-subscription and registration.
• Early deployment: The most vital and key component of improving production for smallholder farmers lies in seed variety selection. Therefore, it is important to start the campaigns early enough so that the farmers can make informed choices based of the information they get about the improved seed varieties. We encourage colleagues (Partners) to remember invitation of agro-dealers to field days.
• Increase the number of farmers profiled, ICT is all about scale, the bigger the number the better: To make the database more attractive and an inch closer to sustainability, investment in profiling at least 200,000 farmers is recommended. This project is only reaching 13,000 farmers but there is potential to reach hundreds of thousands with an additional 25,000 in the database unprofiled due to the absence of phone contact.
• Development and deployment of Video training modules: The video training modules have been received with a lot of enthusiasm and are very attractive to youth. Effort should be put in place to develop content in all the four covered value chains and deployed to current and future farmers. The videos are more detailed and help bridge the literacy gap and establish a sense of ownership in communities.

65
Outcome 5. Partnerships for the scaling of sustainable intensification research products and innovations
Output 5.1 Opportunities for the use and adoption of sustainable intensification technologies identified for relevant farm typologies
Lessons from long-term on-farm Conservation Agriculture research and demonstration trials Long-term, on-farm trials on different types of CA systems were established in 16 target communities of Malawi and Zambia with support from ZARI, MoA Zambia, Machinga ADD, and Total LandCare. Trials were established both manually and with animal traction, with maize and legumes in rotation or intercropped, and with doubled up-legume systems (in six sites) or sole crops. Data from all the sites reveal interesting results. The density plots in Figure 27 show peaks of the conventional ridge tillage system, which was lower than the CA systems in central Malawi and was at par with the maize/legume intercropping under CA in southern Malawi. CA systems in central Malawi seemed to occupy a wider range of yield spaces in both cases, which is probably an indication for a greater resilience to climate change. A similar trend was observed for sites in Eastern Zambia (Fig. 28) where main peaks of conventional systems were found around 3.5‒4 t/ha; again, CA systems occupied a wider yield space. Average yields in the four agroecologies (Fig. 29) were mostly significant for CA treatments. In central Malawi, both CA interventions out yielded the control whereas in southern Malawi it was only the direct seeded treatment without intercrop. In the manual CA system of Eastern Zambia, only the maize‒legume rotation under CA had a significant yield benefit while it was significant for both CA systems under animal traction in eastern Zambia. These overly positive yield results in the last cropping season clearly show a strong proof of concept that the SI systems we promoted have yield benefits. Interestingly maize‒pigeon pea and maize‒cowpea intercropping in southern Malawi and Eastern Zambia had yield penalties. This is likely due to the strong competition effects between maize and legumes in this relatively good cropping season with well distributed rainfalls in the target agroecologies. Legume rotational yields from both clusters of site in Malawi confirmed that both groundnut and pigeon pea yields were higher under CA systems than under the conventional control treatment. For groundnut in central Malawi, farmers could harvest between 396 and 546 kg/ha more grain yield (42‒57%) if they planted them under CA. For southern Malawi the yield benefit for pigeon pea was 182‒206 kg/ha (15‒17%) if planted under CA.

66
Figure 27. Density plots of maize yields in clustered on-farm trials in Central and Southern Malawi, 2018/2019. CRT = conventional ridge tillage; DS = direct seeding with a dibble stick, DS/Int = direct seeding with a dibble stick, intercropped with a legume; rot = maize fully rotated with a legume.
Figure 28. Density plots of maize grain yield in target communities of Eastern Zambia, 2018/2019. CRT = conventional ridge tillage; DS = direct seeding with a dibble stick, DS/Int = direct seeding with a dibble stick, intercropped; rot = maize fully rotated with a legume; CP = conventional ploughing; ATRI = Animal traction ripping, ATRI rot = animal traction ripping in full rotation with a legume.

67
Figure 29. Boxplots of maize grain yield grouped by agroecology and seeding method in Malawi and Zambia. CRT = conventional ridge tillage; DS = direct seeding with a dibble stick, DS/Int = direct seeding with a dibble stick, intercropped; rot = maize fully rotated with a legume; CP = conventional ploughing; ATRI = Animal traction ripping.
Small-scale piloting of FarmMATCH (Matching Agricultural Technologies to Farms and their Context) FarmMatch is an innovation designed to identify (i) the most suitable and promising technologies for different types of farms, (ii) where the hotspots of suitability of technologies and potential adopters are, and (iii) which contextual farm and technology characteristics promote the adoption and scaling of technologies. Testing the algorithm for performance, matching and signaling is still ongoing. A software engineer was hired to program the matching algorithm of the FarmMATCH framework. He has been working with researchers of IITA and IFPRI to prepare data from ARBES and GIS maps, and analyzed these data for their use in FarmMATCH. We have commenced testing the framework for a number of GIS gridcells in Babati, Tanzania. Developing a “data pipeline” that can extract ARBES data and insert it into farm models, to allow rapid assessment of more complex SI indicators for sampled farms in Africa RISING case study areas, has been initiated. This study will likely take into consideration the findings of a study (Jambo et al., 201921) that analyzed the role of intrinsic and extrinsic motivations among 246 sampled households alongside the perceived benefits and constraints from SI practices in five districts of Malawi and Tanzania. The results showed that farmer decisions were not exclusively dependent on external incentives, but also on intrinsic values which farmers attach to their production resources and farming practices. Despite various benefits perceived, farmers highlighted the lack of financial resources as a major constraint to the use of externally proposed SI practices. The results demonstrated equal importance of intrinsic and extrinsic motivations in influencing the number of SI practices which smallholder farmers used. It was proposed that explicitly addressing both intrinsic and extrinsic motivations in further research in combination with socioeconomic and
21 Isaac Jonathan Jambo, Jeroen C.J. Groot, Katrien Descheemaeker, Mateete Bekunda, Pablo Tittonell. Motivations for the use of sustainable intensification practices among smallholder farmers in Tanzania and Malawi. NJAS - Wageningen Journal of Life Sciences. Volume 89, November 2019, 100306.

68
biophysical variables would give a better reflection of what drives farmers’ decisions to use more sustainable farming practices. Socioeconomic studies on the benefits of CA systems, GMCC, and agroforestry trials Cost‒benefit analysis. Socioeconomic data sheets to collect labor data were shared with partners in the three research areas. Labor data, input quantities, and prices for each treatment were collected, entered, and cleaned and cost‒benefit analysis (CBA) of different cropping systems done in all target areas. The CBA results of different systems revealed that in a normal season with rainfall evenly distributed, in high productivity areas, all cropping systems will produce positive net-benefits. We analyzed different sets of data looking at partial budgets of maize only, of maize in combination with legume rotation, and at maize in combination with a doubled-up legume system (Tables 33‒36). In southern Malawi, looking at the maize treatments only, CA maize‒legume intercropping provided the highest net benefit and return to labor followed by the CA sole maize. In central Malawi net benefits of the intercropping strategy were lower due to failure of the intercrop (cowpea) in these areas. It was interesting to note that in central Malawi and the Eastern Zambian animal traction system, the CA sole maize cropping system outperformed the CA maize legume cropping system, yielding the highest net-benefits among the cropping systems promoted in these target areas (Tables 33 and 34). CA maize legume intercrop provided the highest net benefits and return to labor in the manual systems of Eastern Zambia (Table 34). This is mainly because in a rotation, the cropped area is divided between both the maize and the legume, whereas in intercropping treatments they share the same space, which has a direct bearing on the gross benefits. The matrix ranking of technology preference show that both men and women prefer the CA maize legume intercrop or CA maize legume rotation over other cropping systems. During the interactive discussion, women highlighted that they preferred the CA maize legume intercropping for two main reasons; reduction in weeding labor and increased food diversity, whilst men liked these systems for reduced market risk and improved income stability. Table 33. Partial budgets of maize-based conservation agriculture systems (maize-phase) in southern and central Malawi in cropping season 2018/2019.
Southern Malawi Central Malawi
SI technologies Conventional practice
CA sole Maize
CA Maize‒legume intercropping
Conventional Practice
CA sole Maize
CA Maize‒ Legume intercropping
Gross benefits (USD) 1307.18 1500.56 2385.48 1047.14 1454.11 1472.74
Labour (days) 97.33 73.88 84.33 97.08 73.08 85.67
Labour cost (USD) 187.85 142.58 162.76 187.37 141.05 165.34 Input costs (USD)
Maize seed 77 77 77 77 77 77
Legume seed 0 0 167 0 0 167
Fertilizer 288.35 288.35 288.35 288.35 288.35 288.35
Herbicides 0 42 42 0 42 42

69
Pesticides 22.5 22.5 22.5 22.5 22.5 22.5 Total cost (USD) 575.69 572.43 759.60 575.22 570.90 662.19
Net benefits (USD) 731.49 928.13 1625.87 471.92 883.21 710.55
Return to labour 4.89 7.51 10.99 3.52 7.26 5.30 Notes: Returns to labor is calculated as: Gross benefit–(total cost–labor cost))/labor cost; Net benefits are calculated as: Gross benefits–total costs
Table 34. Partial budgets of maize-based conservation agriculture systems under manual and animal traction in eastern Zambia in cropping season 2018/2019.
Zambia Manual Systems Zambia Animal traction system
SI technologies Conventional practice
CA sole Maize
CA Maize-legume intercropping
CA Maize‒legume rotation
Conventional Practice
CA sole Maize
CA Maize‒ Legume Rotation
Gross benefits (USD)
986.29 1101.94 1135.09 1549.58 1205.99 1504.24
1164.34
Labor (days) 98.89 69.00 68.33 79.78 92.79 33.16 33.89
Labor cost (USD) 190.86 133.17 131.88 153.97 179.08 64.00 65.41
Input costs (USD)
Maize seed 66.75 66.75 66.75 66.75 66.75 66.75 33.38
Legume seed 0 0 25.05 66.8 0 0 66.8
Fertilizer 273.50 273.50 273.5 194.5 273.5 273.5 194.5
Herbicides 33.7 33.7 0 16.5 33.7 33.7 16.5
Pesticides 0 0 0 0 0 0 0
Total cost (USD) 564.81 507.12 497.18 498.52 553.03 437.95 376.59 Net benefits (USD)
421.48 594.82 637.90 1051.06 652.97 1066.29
787.75
Return to labor 3.21 5.47 5.84 7.8 4.65 17.07 13.04 Notes: Returns to labor is calculated as: Gross benefit–(total cost–labor cost))/labor cost; Net benefits are calculated as: Gross benefits–total costs.
Table 35. Partial budgets of complete maize‒doubled-up legume systems under conservation agriculture systems in Lemu Village of Balaka, southern Malawi in cropping season 2018/2019.
Lemu: Maize‒doubled up legume rotation
SI technologies Conventional practice CA sole Maize CA Maize‒legume intercropping
Maize yield (kg/ha) 1443.06 1726.88 1436.155
Groundnut yield (kg/ha) 820.75 2080.33 2152.935
Pigeon pea yield (kg/ha) 217.28 281.305 480 Gross benefits (USD) 1268.5 2460.4 2262.5
Labor (days) 102.65 63.54 70.69
Labor costs (USD) 198.12 122.63 136.43
Input costs (USD) Maize seed costs 28.75 28.75 28.75

70
Groundnut seed cost 69.00 115.00 115.00 Pigeon Pea seed cost 1.80 1.80 3.60
Fertilizer 104.00 104.00 104.00
Herbicides 0.00 42.00 42.00
Pesticides 11.25 11.25 11.25 Total cost (USD) 412.92 425.43 441.03
Net benefits (in USD) 855.62 2035.01 1821.48
Return to labor 5 18 14 Notes: Returns to labor is calculated as: Gross benefit (total cost–labor cost))/labor cost; Net benefits are calculated as: Gross benefits–total costs.
Table 36. Partial budgets of complete maize‒groundnut rotation systems under conservation agriculture systems in Central Malawi in cropping season 2018/2019.
Central Malawi - CA maize‒groundnut rotation
SI technologies Conventional practice
CA sole Maize CA Maize-legume intercropping
Maize yield (in kg/ha) 1701 2338.94 2416.25 Groundnut yield (in kg/ha) 309 426.56 535.99
Pigeon pea Yield (in kg/ha) 0 0 80.83
Gross benefits (USD) 982.64 1331.12 1527.17
Labor (days) 100.5 73.08 85.67
Labor cost (USD) 193.97 141.05 165.33
Input costs (USD)
Maize seed costs 38.5 38.5 38.5 Groundnut seed cost 69 115 115
Cowpea seed cost 0 0 3.93
Fertilizer 118.5 118.5 118.5
Herbicides 0 42 42
Pesticide 11.25 11.25 11.25
Total cost (USD) 431.22 351.30 390.33
Net benefits (USD) 551.42 979.82 1136.84
Return to labor 3.22 7.9 7.88 Notes: Returns to labor is calculated as: Gross benefit–(total cost–labor cost))/labor cost; Net benefits are calculated as: Gross benefits–total costs.
Gender and labor distribution. Socioeconomic studies on the impact of CA-based sustainable intensification technologies on labor distribution, food & nutritional security, and income both at household and community level in three districts of eastern Zambia and five districts of Malawi were implemented. An integrated mixed method approach, which combined structured questionnaires to gather quantitative data and gendered focus group discussions for qualitative data were administered. Using this integrated approach, the implication of these improved livelihood changes on gender dynamics particularly with regard to labor distribution and decision making were analyzed. The preliminary results reveal that though SI technologies help in spreading and reducing the labor of women during land preparation and weeding by 30%, increased yields from these systems increase workload for women during threshing and storage by 15 to 20%. Women in all

71
the target communities did not perceive the increased workload during harvesting and storage as a burden as they had control over the use of produce and income of the promoted food legumes (cowpea, groundnut, and pigeon pea). It was interesting to note that SI promoted technologies contributed to 39%, 35%, and 38% of the total household income in southern Malawi, central Malawi, and eastern Zambia, respectively (Tables 33‒36). Nutritional benefits. Three indicators were used to assess the contribution of CA-based SI practices to household food security and nutrition outcomes. First, the household food insecurity access score (HFIAS) that captures the experience of food insecurity calculated (following methods outlined by Coates et al., 200722), reflecting the food insecurity of members of the household. Second, the household dietary diversity score (HDDS) was applied, which is a count of food groups that household members have consumed over a 24-h and/or seven-day reference period, following the approach documented in the SIAF guidelines by Swindale and Bilinsky (200623). Third, the food consumption score (FCS) which calculates the frequency of consumption of different food groups by a household during a seven-day reference period, using weights assigned to each food group by nutritional value, adapted from the World Food Programme (WFP 200824). The analysis of results and report writing is still in progress and will be available soon. The preliminary results revealed that all the food and nutrition security indicators have improved over the years (from 2012‒2019) in the target communities (Table 37). This may indicate that households are diversifying their consumption following production diversification and improved incomes. The results also show that greater improvements in the food security indicators were observed in the southern Malawi and Lundazi district of eastern Zambia. Since 2012, there has been an overall reduction in food insecurity of members of the households of 32% and 27% in the target communities of southern Malawi and Lundazi District, respectively (Table 37). Table 37. Nutritional indicators measured in 2012 and 2019 in different target regions under trials in Malawi and Eastern Zambia.
Target areas HDDS1 HDDS2 HFIAS1 HFIAS2
Malawi Central 0.35 0.46 0.51 0.43
Malawi South 0.41 0.47 0.66 0.45
Chipata 0.29 0.36 0.47 0.42
Lundazi 0.31 0.42 0.59 0.43
Sinda 0.24 0.39 0.61 0.57 Note: HHDS1 = Household dietary diversity score in 2012; HDDS2 = Household Diversity in 2019; HFIAS1 = household food insecurity access score in 2012; HFIAS2 = Household food insecurity access score in 2019. Malawi Central was represented by Nkhotakota, Salima and Dowa sites; Malawi South by Balaka, Machinga and Zomba sites.
22 Coates J, Swindale A, Bilinsky P (2007) Household Food Insecurity Access Scale (HFIAS) for measurement of food access: indicator guide. Washington, DC: food and nutrition technical assistance project, academy for educational Development 34 23 Swindale A, Bilinsky P (2006) Household dietary diversity score (HDDS) for measurement of household food access: indicator guide. Washington, DC: Food and Nutrition Technical Assistance Project, Academy for Educational Development 24 WFP (2008) Food consumption analysis: Calculation and use of the food consumption score in food security analysis. World Food Programme Rome, Italy

72
Illustration of the impacts of CA-based sustainable intensification practices In this report, data and discussions have been presented on various impact aspects of CA. To illustrate their combined effect, we used the SIAF to construct two radar graphs for central and southern Malawi sites using the average yields of maize and legumes for the 2018/2019 cropping season, the net benefits, calculations of protein and calories, reduction in erosion, increase in soil carbon, rating of technologies, and reductions in labor (Figs. 30 and 31). The radar graphs for both southern and central Malawi show an overly positive assessment of improved technologies as compared with the conventional control practice. The difference was more pronounced in southern than in central Malawi due to harvest from more crops (e.g., from pigeon pea intercropping and pigeon pea alleys), which failed in the central Malawian trials.
Figure 30. Radar graphs describing cropping systems in central Malawi.

73
Figure 31. Radar graphs describing cropping systems in southern Malawi.
Demonstrating fixed or rainfall-responsive nitrogen fertilization strategies in Malawi: in search of increased nitrogen use efficiency by smallholder farmers under drought prone conditions Agricultural intensification invariably requires efficient use of resources. This is especially so for resource-constrained farmers in developing countries. While it is known that nitrogen (N) fertilizers’ recovery uptake by crops is intricately linked to soil water availability, current N application strategies, especially using urea-N, barely reflect the mechanism for reduced N application when rainfall fails. Six on-farm experiments were established in Ntubwi, Nsanama, and Nyambi during 2017/2018 to assess the effects of N fertilization strategies on maize productivity and N use efficiencies under rain-fed conditions across a rainfall gradient spanning three agroecologies. The experiments were repeated during 2018/2019 cropping season. The experiment consisted of nine treatments (Table 38); 1) eight treatments based on fixed-N application strategies to a maximum of 92 kg/ha and 2) one variable N application strategy, hinged on the quality of the rainfall season. All plots received 10 kg/ha P as single super phosphate.

74
Table 38. Treatments for the N-response experiment. For 2019, Treatment 9 had variable N applied (indicated in parenthesis) across sites depending on rainfall received.
Treatment Basal NP Treatment Code N as AN
Basal N and P
Side dress 1 (4 WAE)
Side dress 2 (6 WAE)
Total N (kg/ha)
Nitrogen management details
1 Control: P only as SSP Control 0 0:21 0 No N added
2 NP(23:21) 23N 0 23:21 23 Basal N only
3 NP(23:21) 46NL +23 N 23:21 23 46 One low rate side dressing N
4 NP(23:21) 69N -LL +46 N 23:21 23 23 69 Two low rates side dressing
5 NP(23:21) 92N-LH +69 N 23:21 23 46 92 Low and high rate side dressing
6 NP(23:21) 69N-H +46 N 23:21 46 69
Quantity same as Treatment 4 but all side dressing N applied at 4WAE
7 NP(23:21) 92N-H +69 N 23:21 46 23 92
Quantity same as Treatment 5 but reversed side dressing application strategy (HL instead of LH)
8 NP(23:21)+ Micro-nutrients 69N-LL-Zn +46N 23:21 23 23 69
Treatment has Zn. N application strategy as for Treatment 4
9 NP(23:21) Variable N Variable N 23:21 23
46 (69 -110)
Basal N fixed, further application a function of rainfall
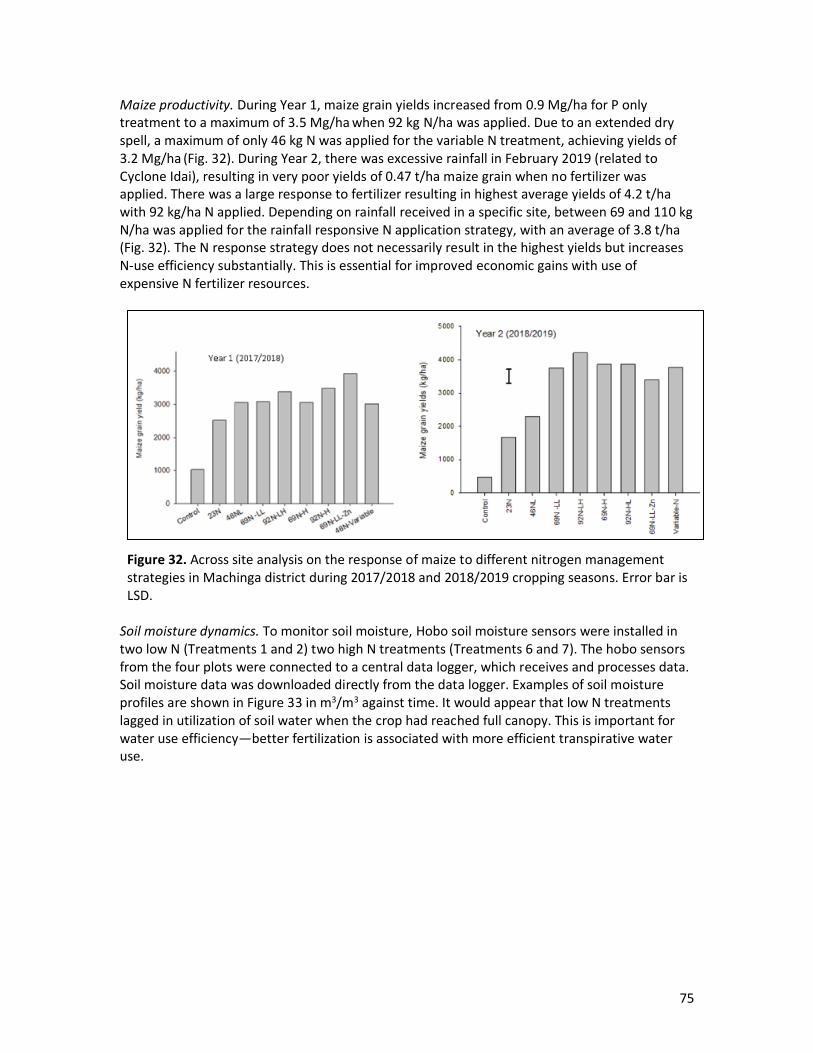
75
Maize productivity. During Year 1, maize grain yields increased from 0.9 Mg/ha for P only treatment to a maximum of 3.5 Mg/ha when 92 kg N/ha was applied. Due to an extended dry spell, a maximum of only 46 kg N was applied for the variable N treatment, achieving yields of 3.2 Mg/ha (Fig. 32). During Year 2, there was excessive rainfall in February 2019 (related to Cyclone Idai), resulting in very poor yields of 0.47 t/ha maize grain when no fertilizer was applied. There was a large response to fertilizer resulting in highest average yields of 4.2 t/ha with 92 kg/ha N applied. Depending on rainfall received in a specific site, between 69 and 110 kg N/ha was applied for the rainfall responsive N application strategy, with an average of 3.8 t/ha (Fig. 32). The N response strategy does not necessarily result in the highest yields but increases N-use efficiency substantially. This is essential for improved economic gains with use of expensive N fertilizer resources.
Figure 32. Across site analysis on the response of maize to different nitrogen management strategies in Machinga district during 2017/2018 and 2018/2019 cropping seasons. Error bar is LSD.
Soil moisture dynamics. To monitor soil moisture, Hobo soil moisture sensors were installed in two low N (Treatments 1 and 2) two high N treatments (Treatments 6 and 7). The hobo sensors from the four plots were connected to a central data logger, which receives and processes data. Soil moisture data was downloaded directly from the data logger. Examples of soil moisture profiles are shown in Figure 33 in m3/m3 against time. It would appear that low N treatments lagged in utilization of soil water when the crop had reached full canopy. This is important for water use efficiency—better fertilization is associated with more efficient transpirative water use.

76
Figure 33. Soil moisture dynamics for Linthipe Chiyembekezo Chayera (top) and Nyambi Samila Wyson (bottom).
Farmer evaluation of legume‒maize intercrop technologies based on SI domains In Malawi, the Africa RISING program introduced several technologies: Fertilized maize, no fertilizer, legume/maize rotations, doubled-up legume technology, maize and pigeon pea intercrop, and double row planting of groundnut and soybean. Farmers select one or more from the above technologies to practice in their own fields depending on their preferences or farming objectives. A structured questionnaire and focus group discussions were administered to assess farmers' preferences on several selected technologies. The assessment focused on household food production, income generation, and labor requirements. Data collection was done in Nsanama extension planning area. The results are presented in Table 39.

77
Table 39. Gender disaggregated rating of SI technologies based on food security, income, production input requirements.

78
Household food production. Maize with full rate of fertilizer, maize intercropped with pigeon pea, and maize rotated with pigeon pea were rated highly by both men and women (100%) as major contributors to household food production. Due to limited soil fertility in the sampled area, maize with fertilizer usually yields better compared to zero or half-rate fertilizer-maize-based technologies, hence contributes effectively to household food security, which is a major concern among both men and women in rural Malawi. Apart from yielding better, maize and pigeon pea intercrop contribute more to pigeon pea biomass. They together make nsima (maize meal) and relish, which is a major meal in southern Malawi for both men and women. This combination of maize and pigeon pea also contributes to nutrition security as it provides required carbohydrates and protein, respectively. Maize rotated with pigeon pea was also rated highly by both men and women due to the high yield of maize produced with less inputs (fertilizer) as a result of pigeon pea biomass. Maize with no fertilizer and maize with half-rate of fertilizer were least-preferred technologies by both men and women (100%) due to their failure to contribute fully to household food production. Low nutrient levels in the soils makes inorganic fertilizer to be a key component to maize production in the sampled area. Mixed reactions were observed from both men and women on contribution of pigeon pea and groundnut intercrop to household food production. All men (100%) ranked it highly as opposed to only 70% of women. Men considered total yields contributed by both legumes to be significant to household food production while women thought groundnut yields reduce more when intercropped with pigeon pea. On the other hand, the contribution of sole groundnut and sole pigeon pea to household food production was both rated highly (100%) by men as compared to 60% and 70% of women, respectively. The higher rating was due to low production costs as they require limited amounts of fertilizer. Income generation. All men and women rated maize with fertilizer full rate, maize in rotation with groundnut, maize in rotation with pigeon pea, and groundnut and pigeon pea as the best technologies and major contributors to household income generation. This is because they produce better yields among all the introduced technologies in the area, hence enabling them to have a surplus of good quality for sale. Maize with zero fertilizer was rated the least by both men and women because of little or no yield produced due to nutrient deficiency in the soil. Men differed with women on maize with half-rate fertilizer and soybean on income generation. Just like maize with zero fertilizer, men (100%) rated maize with half-rate fertilizer and soybean as poor on income generation while women partly agreed with men on soybean (60%) but differed on maize half rate. Women (100%) rated maize with half the rate of fertilizer highly on income generation. Both men and women agreed that soybean performed poorly in the area due to insufficient rainfall especially during later stages. Women, on the other hand, believe maize with half rate fertilizer can still perform better and produce a surplus for sale. Input requirements. Both men and women (100%) rated soybean, groundnut, and pigeon pea as the best technologies in relation to input requirement compared with all maize technologies. This is because legumes perform well even with limited or no fertilizer application. A total of 90% of both men and women also rated maize rotated with pigeon pea highly on input requirements as it performs well with a minimum amount of fertilizer. On maize rotated with groundnut, 10% of women disagreed with the rest (both men and women) as they think it is poor on input requirement. Pigeon pea and groundnut intercrop was rated the least by both men and women (100%) on input requirement. This is because pigeon pea develops faster in the area hence depriving groundnut of sunlight, which eventually affects their yield. Only 10% of men thought maize with half rate fertilizer was better on input requirement while the rest of

79
both men and women thought otherwise. Some 30% of men also thought maize with the full rate of fertilizer was much better on input requirement due to its better yield which compensates for the cost of inputs. Labor requirements. On labor requirement, only sole pigeon pea received the best score by both men (100%) and women (90%) followed by maize intercropped with pigeon pea (80% men, 90% women). Pigeon pea was rated highly compared with other crops because the plant spacing is wider (90 cm) and most of the farmers do not apply fertilizer hence a low labor requirement. Groundnut intercropped with pigeon pea was rated poorly by both men and women (100%) on labor requirement. Any SI technology that had many several operations was rated poorly on labor, despite high productivity that may be associated with that technology. These operations included planting, weeding, fertilizer application, spraying, and harvesting, most of which occurs more than once. Harvesting of groundnut also has to be done carefully when intercropped with pigeon pea to avoid damaging pigeon pea roots, requiring more labor. The poor rating of soybean resulted from planting, which many farmers thought tedious due to the plant spacing (5 to 8 cm). Men and women differed on labor requirements of maize in rotation with groundnut and sole groundnut. All men rated labor requirement for maize in rotation with groundnut highly while the opposite happened with women (100%). Men thought labor requirement could be compensated with better yield and sometimes basal fertilization is bypassed on maize rotated with groundnut. A total of 90% of women thought sole groundnut required more labor while 70% of men thought sole groundnut did not require more labor. The women attributed their decision to ridge requirement (flat on top), plant spacing (10‒15 cm), and double row planting for groundnut. Conclusion. Choice of technologies by smallholder farmers is influenced by a number of factors, which include, but is not limited to, contribution of the technology to household food production, income generation, input requirements, and labor requirements. Most of the farmers prefer technologies that contribute highly to household food production followed by income generation. However, the poor rating on labor was not related to overall preference for a technology—what was overriding was productivity and food security. Engaging development partners to identify livestock technologies of interest for partnership dissemination A meeting was held in Babati District to discuss livestock technology scaling plans and commitments for 2019/2020 with World Vision Tanzania (WVT), FIDE, Re-greening Africa, and Farm Africa (FA). FA and FIDE already implemented training activities in the reporting period. Materials to use in developing MoUs to guide implementation were identified. Formulating feed rations from Napier grass, maize stover, and bean haulms for improved milk yield This activity is ongoing, having started during August 2019, and is being conducted in Long/Bashnet and Hysum villages in Babati District. Thirty-four farmers were selected to host the trials, in collaboration with village extension officers and the project data clerk, based on the following criteria:
• Providing animals for the trial
• Entrusting the project with their animals over the experimental period
• Providing the basal rations—Napier grass and the other types of crop residues
• Providing labor—to chop feed, actual feeding, and data recording as needed

80
• Undergo training in trial management and data collection
• Ability to communicate any teething problems with project technician and staff at the earliest opportunity so they can be addressed.
The Africa RISING project provided:
• All materials for data recording—stationery
• Fuel for the chopping machines
• Starter concentrates, minerals, and molasses
• Treatment, should cows fall sick during the period of the experiment
• Other technical advice as required. Formulating home-made chicken feed rations based on Gliricidia sepium leaf meal and vegetable waste This activity was initiated during August and is being implemented in four villages (Mlali, Mwanya, Matufa, and Seloto/Bermi) in Kongwa, Kiteto, and Babati districts, and is ongoing. A total of 32 farmers were selected to participate in the poultry nutrition experiment. Visits to selected farmers were conducted to ensure they met the selection criteria. A total of 1632 day-old chicks were procured from AKM Glitter Company and distributed to the experiment host farmers. Each farmer received 51 chicks and, as a starter pack, 28 kg of chick mash feeds, one packet of antibiotics, one packet of vitamins, and one packet each of Newcastle, Gumbolo, and Fowl pox vaccines, enough to vaccinate all experimental chicks and neighbors’ chicks.
a. The 32 farmers were trained on the experiment implementation and management. The following roles and responsibilities were agreed upon by the farmers:
i. Farmers roles and responsibility ▪ NOT sell any of the experimental chickens before the end of feeding
experiment ▪ Contribute maize grain, maize bran, sunflower seed cake, and
medication for chickens during the experiment. ▪ Improve dairy houses, feeders, and drinkers. ▪ Contribute labor for grinding feeds and feeding chickens
ii. Project roles and responsibilities. ▪ Provided to farmers materials for data collection during the
experimental period ▪ Donate the chickens to farmers after the experiment. ▪ Provide vaccines, Gliricidia leaf meal, minerals, premix, weighing
balance, fuel for grinding feed grains, and the grinding machine b. In addition, 82 farmers (26 females and 56 males) were trained on poultry husbandry,
poultry feed processing, and poultry housing. Crop simulation modelling with APSIM to explore medium- to long-term SOC, and resource use efficiencies in intercropping systems of Malawi Estimating soil water characteristics. Crop growth models such as the Agricultural Production Systems Simulator (APSIM) are useful in simulating the effects of biophysical heterogeneity and management strategies. However, they require detailed biophysical data for simulation of crop production in the resource-constrained environments of SSA. Soil water characteristics are often poorly estimated as part of model parameterization. In this work, we bridged that gap by determining the Drainage Upper Limit (field capacity) and the lower limit (wilting point) for

81
major soils for APSIM parameterization (Fig. 34). We then parametrized APSIM and evaluated how the detailed soil water characterization improved Plant Available Water Capacity (PAWC), water balance, and yield simulations for legume systems as tested on Africa RISING on-farm sites.
Figure 34. Two-stage process of determining the soil moisture at field capacity for APSIM model parameterization. Firstly, an area of at least 3 m diameter is wetted to saturation point to an entire root zone depth (Left photo). The wetted area is then covered by a plastic sheet for a period of two weeks (Right photo). Soil water above field capacity is lost through gravitational drainage. Moisture content in soils sampled in the wetted zone after 2 weeks is a good estimate of field capacity.Photo credit: Regis Chikowo/IITA.
Simulation modelling with APSIM. We parameterized and tested APSIM for a doubled-up legume SI technology against experimental data from on-farm experiments conducted in central and southern Malawi. We used soil and crop yield data from on-farm trials. The calibrated model was used to simulate groundnut–pigeon pea intercropping, maize–pigeon pea intercropping and maize–groundnut rotation, soybean–maize rotation, and continuous maize under a range of N fertilizer inputs. Simulated maize and legume grain yield generally approximated the observed yields from the 2012/2013 to 2017/2018 cropping seasons (RMSE = 1317 kg/ha for maize and 274 kg/ha for groundnut) confirming prior observations that APSIM is able to predict maize response to fertility inputs, rotation, and intercrops. Maize yields were reduced by around 30% in intercrops with pigeon pea compared with sole maize. However, the depressed maize yields were compensated for by pigeon pea grain. Similarly, the depressed groundnut yields in intercrops with pigeon pea were compensated with pigeon pea grain yields. Sole groundnut and soybean were highly beneficial to the following maize yields. Averaged across sites, maize yield after sole groundnut gave similar yields to maize receiving the full fertilizer rate. Hence, the nutrient gap for maize across the sites was largely filled by the legume rotation treatments receiving 50% of the fertilizer rate. This result indicates a potentially huge saving in fertilizer costs for maize

82
production (setting aside opportunity costs of forgone maize in the preceding season) (Kiwia et al., 201925). Total soil organic C simulated in the top 15 cm of soil decreased over the course of our study (1986‒2019) for continuous sole maize at all three agroecological zones. Integration of legumes into the maize systems slightly reduced the magnitude of this decrease in soil organic C, especially when pigeon pea was added to the cropping system signifying the importance of grain legumes in sequestering soil C and eventual sustainability of the cropping systems. This result is in tandem with Smith et al. (201626) that reported higher total C and N levels in doubled-up legume systems compared with sole maize. Towards precision agriculture through hand-held monitoring of soil organic carbon and targeted fertilizer use Our Panel Survey that tracks progress being made by farmers in adopting SI technologies is data intensive and requires an innovative data handling system. To respond to this challenge, we began work on migrating from paper-based questionnaires to phone/tablet-based electronic surveys, and concurrently started training on the use of the Land PKS application and the hand-held reflectometer for rapid evaluation of soils in fields of Africa RISING beneficiary and non-beneficiary panel fields during April‒May, 2019. Of particular interest was finding a rapid and inexpensive method to determine soil organic carbon (SOC) content. SOC status explains a large proportion of poor crop yields, as it determines early crop growth and regulates soil nitrogen and phosphorus availability. SOC status has an impact on fertilizer recommendations, as there is a threshold level that is necessary for crops to respond profitably to fertilizer. Fields below the threshold are not good fertilizer investments, they must be rehabilitated through SOC building practices. The consequences of this is that increasing doses of fertilizer should be applied to fields with increasing SOC as this largely determines yield potential. Soil samples from the panel farms were scanned with the inexpensive hand-held reflectometer to predict SOC and regressed against standard lab analysis of SOC (dry combustion, the benchmark method). We have since established a usable relationship between the soil spectral signatures and SOC content (Fig. 35). Recent work has improved the R2 value to 0.74. Thus, we have a potential “game changer”. Until the advent of the hand-held reflectometer, it was not practical or economical to determine soil SOC status for a given field. We are now moving on to test the efficacy of this new approach at district level in Ntcheu, where extension workers from four Extension Planning Areas (EPAs) are going to be trained on the use of the reflectometer in October 2019. They will subsequently use the reflectometers to advise farmers on which fields to target fertilizer application for maize production during the 2019/20 cropping season. Maize productivity will be determined for farmers who would have received their reflectometer-based recommendations for fertilizer targeting (treated group) and non-participating farmers in a similar agroecology.
25 Kiwia A, Kimani D, Harawa R, Jama B, Sileshi GW (2019) Sustainable intensification with cereal-legume intercropping in eastern and southern Africa. Sust 11: 2891 26 Smith, A., Snapp, S., Dimes, J., Gwenambira, C., Chikowo, R., 2016. Doubled-up legume rotations improve soil fertility and maintain productivity under variable conditions in maize-based cropping systems in Malawi. Agric. Syst. 145, 139–149.
https://doi.org/10.1016/j.agsy.2016.03.008.
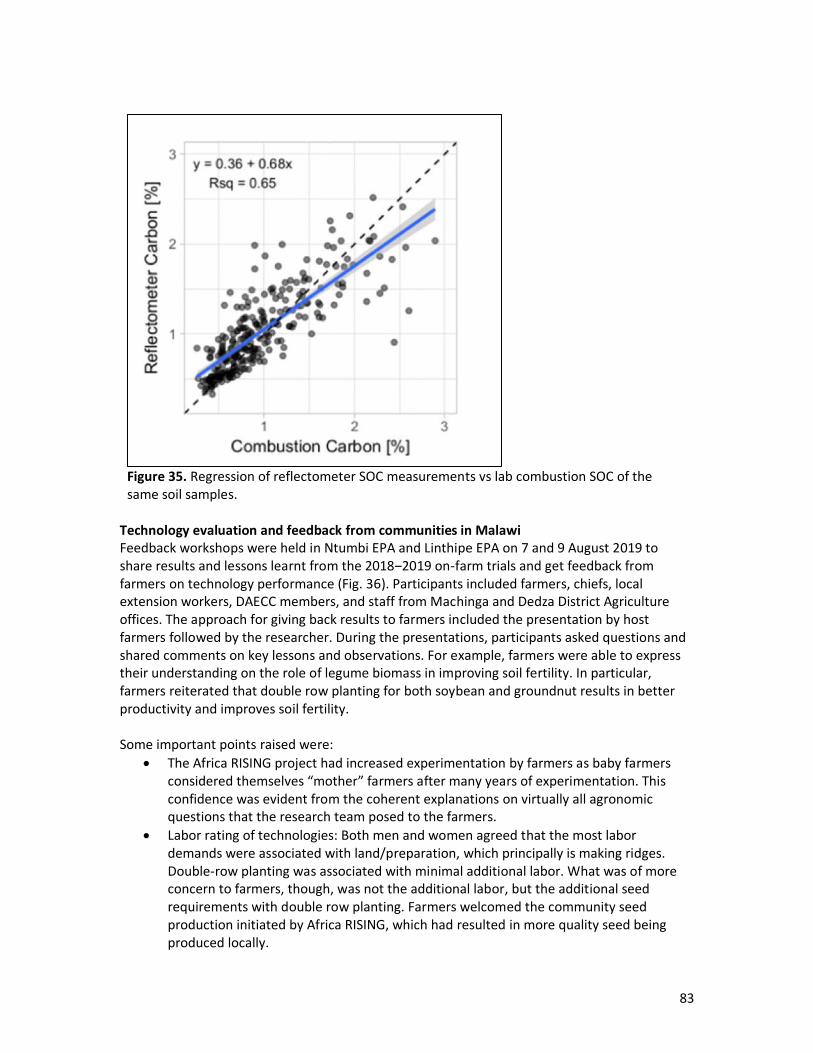
83
Figure 35. Regression of reflectometer SOC measurements vs lab combustion SOC of the same soil samples.
Technology evaluation and feedback from communities in Malawi Feedback workshops were held in Ntumbi EPA and Linthipe EPA on 7 and 9 August 2019 to share results and lessons learnt from the 2018‒2019 on-farm trials and get feedback from farmers on technology performance (Fig. 36). Participants included farmers, chiefs, local extension workers, DAECC members, and staff from Machinga and Dedza District Agriculture offices. The approach for giving back results to farmers included the presentation by host farmers followed by the researcher. During the presentations, participants asked questions and shared comments on key lessons and observations. For example, farmers were able to express their understanding on the role of legume biomass in improving soil fertility. In particular, farmers reiterated that double row planting for both soybean and groundnut results in better productivity and improves soil fertility. Some important points raised were:
• The Africa RISING project had increased experimentation by farmers as baby farmers considered themselves “mother” farmers after many years of experimentation. This confidence was evident from the coherent explanations on virtually all agronomic questions that the research team posed to the farmers.
• Labor rating of technologies: Both men and women agreed that the most labor demands were associated with land/preparation, which principally is making ridges. Double-row planting was associated with minimal additional labor. What was of more concern to farmers, though, was not the additional labor, but the additional seed requirements with double row planting. Farmers welcomed the community seed production initiated by Africa RISING, which had resulted in more quality seed being produced locally.

84
• Women farmers noted that there was increased consumption of healthy foods linked to soybean or groundnut processing. This was also directly a result of Africa RISING interventions.
• Viability of certified seed from Lilongwe agro-dealers was generally poorer than QDS produced by farmers. It was intriguing to listen to farmers as they explained that seed stored in pods was always superior.
• Most female farmers preferred Nsinjiro variety as its flour was rated highly for relish preparation.
Figure 36. Farmer feedback meeting in Ntubwi EPA, Machinga, August 2019. Photo credit: Regis Chikowo/IITA.
Exploring the productivity domains of selected legumes and cereals to elucidate their best fitting cropping system at community/landscape level and their dissemination A mother‒baby study approach was used to establish field demonstrations in Kongwa, Kiteto, and Iringa districts under stressed and non-stressed conditions. Fourteen mother demonstrations were established (Table 40) to determine performance of legumes and cereals crops under different ecological and management regimes, and from these data were taken and analyzed; key results are presented below:

85
Table 40. Technology × Location description of the 2018/2019 legumes/cereal variety evaluation. aZones District Village Farmers ID Technologies
Varieties + bplanting dates Crop Combinations
Low potential Iringa Igula L1 Sorghum, pearlmillet, groundnut Pigeon pea + sorghum; pigeon pea + pearlmillet
Kongwa Igula L2 Sorghum, pearlmillet, groundnut Pigeon pea + sorghum; pigeon pea + pearlmillet
Kongwa Moleti L3 Sorghum, pearlmillet, groundnut Pigeon pea + sorghum; pigeon pea + pearlmillet
Kongwa Moleti L4 Sorghum, pearlmillet, groundnut Pigeon pea + sorghum; pigeon pea + pearlmillet
Kongwa Laikala L5 Sorghum, pearlmillet, groundnut Pigeon pea + sorghum; pigeon pea + pearlmillet
Kongwa Laikala L6 Sorghum, pearlmillet, groundnut Pigeon pea + sorghum; pigeon pea + pearlmillet
Moderate potential Kiteto Njoro M1 Pigeon pea, groundnut, sorghum Pigeon pea + sorghum; pigeon pea + groundnut
Kiteto Njoro M2 Pigeon pea, groundnut, sorghum Pigeon pea + sorghum; pigeon pea + groundnut
Kiteto Kiperesa M3 Pigeon pea, groundnut, sorghum Pigeon pea + sorghum; pigeon pea + groundnut
Kiteto Kiperesa M4 Pigeon pea, groundnut,sorghum Pigeon pea + sorghum; pigeon pea + groundnut
High potential Kongwa Manyusi H1 Pigeon pea, groundnut, sorghum Pigeon pea + sorghum; pigeon pea + groundnut
Kongwa Manyusi H2 Pigeon pea, groundnut, sorghum Pigeon pea + sorghum; pigeon pea + groundnut
Kongwa Mlali H3 Pigeon pea, groundnut, sorghum Pigeon pea + sorghum; pigeon pea + groundnut
Kongwa Mlali H4 Pigeon pea, groundnut, sorghum Pigeon pea + sorghum; pigeon pea + groundnut a= The three sub agroecologies/environments in Kongwa, Kiteto and Iringa namely: a) high potential zones include Chitego and Mlali villages; b) Moderate potential sub-ecologies include Njoro and Kiperesa villages and low potential zones include Laikala, Moleti and Igula in Iringa District. The sub-ecologies were identified by (i) Multivariate analysis of our data that showed three sub-ecologies; (ii) Annual rainfall received i.e., High potential sub-ecology receives > 500 mm, Moderate potential sub-ecology receives 400-500 mm and low potential sub-ecology receives = < 350 mm b= Two planting dates were used i.e. Early/ appropriate planting date = 8th-16th January 2019 and late planting = at least 2 weeks later depending on rainfall i.e., 31st to 10 February 2019.

86
Groundnut. There were significant differences (p < 0.05) in genotype reactions in the three sub-ecologies when planted both early and late planting date (Table 41). As expected, the high potential sub-ecologies had the best performance and were able to support genotypes of medium duration—Virginia groundnut (takes 110‒120 days to mature, e.g., ICGV-SM 02724). Nevertheless, the medium duration Virginia ICGV-SM 02724 losses up to 57% of its grain, when planted late in a low potential environment such as Igula and Njoro. Whereas the short duration Spanish ICGV-SM 05650 genotype out yielded the Virginia genotype by almost 300 kg/ha, its relative yield losses under a stressful environment were higher (Table 41). Higher yield losses were found for the landrace showing the advantage of superior genetic‒environment interactions. The highest grain yield was found in Mlali, Moleti, and Manyusi—all in Kongwa District; whereas the lowest yields were in Igula, Njoro, and Kiperesa (Fig. 37). Overall, yield penalty ranged from 38 to 63% and from 17 to 46% in high and moderate sub-ecologies, respectively. Table 41. Genotype by management by environment interaction of selected superior groundnut varieties in Kongwa, Kiteto, and Iringa districts of the central Tanzania.
Sub-ecology Management Maturity group and Yield Kg/ha
Medium duration Short duration
ICGV-SM
02724
*Losses ICGV-SM 05650)
*Losses Land race
*Losses
High Early planting 1032.2 0 1433.1 0 1230 0
Late planting 977.0 5.4 1303.0 9.08 1078.9 12.3 Moderate Early planting 440.6 0 1066.5 0 639.29 0
Late planting 305.3 30.7 664. 7 37.7 358.4 44.0
Low Early planting 972.7 0 1722.7 0 1000.2 0
Late planting 415.9 57.3 379.2 78.0 253.9 74.7
For-sub-ecology 0.013
For-planting date 0.002
For-genotype 0.071 SED 494.04
*The yield loss is computed as a proportionate reduction in grain yield from the optimally managed crop, i.e., early planted in a high potential environment.

87
Figure 37. Performance of groundnut test genotypes in five villages that represent high potential (Mlali, Manyusi, Moleti—Kongwa), moderate (Kiperesa and Njoro—Kiteto), and low potential ecologies (Laikaka—Kongwa, and Igula—Iringa).
Guide for dissemination: The elite material had superior genetics and indeed fitted well in the micro-environments earlier detected. Virginia groundnut, that takes about 120 days to mature, performed best in the high potential ecologies such as Mlali in Kongwa District compared to the short duration Spanish elite and local landraces, respectively. The relative yield losses in the landraces compared to elite Spanish and Virginia material, show the relative advantages of these improved genotypes, and suggest that Virginias, though high yielding, may only be best adapted for high potential areas where they secure harvests even in the event of a drought. Blanket adoption messaging is not advised. Pigeon pea. Significant differences in reaction (P < 0.05) of the genotypes was found in the different sub-ecologies and planting date (Table 42). All three materials are improved, and this may explain the non-significance in reaction to stress. However, in general, better performance was found for medium duration material (ICEAP 00554, and 00557), that take up to 180 days to mature, compared with the long duration variety ICEAP 00040 that takes up to 240 days to mature. At late planting, the medium-duration varieties also register high yield losses. Hardly any yield losses were recorded for the long-duration material due to its long crop phenology, compared with the medium duration that lost up to 82% of its yield moderate environments (Table 42). As such, the two medium-duration materials are best adapted for this region. Interestingly ICEAP 00040, a long-duration variety, was the most stable genotype across the different environments with moderate yields (Fig. 38).

88
Table 42. Genotype by management by environment interaction of selected superior pigeon pea in Kongwa, Kiteto, and Iringa districts of Central Tanzania.
Sub-ecology Management Medium duration genotypes Long duration genotype
Yield kg/ha
ICEAP 00040 *Losses (%)
ICEAP 00557
*Losses (%)
ICEAP 00554 *Losses (%)
High Early planting 748.7 0 1018.7 0 825.6 0
Late planting 747.2 0.20 561.7 44.9 504.8 38.9
Moderate Early planting 1024.2 0 510.9 0 662.5 0
Late planting 220.4 78.5 131.2 74.3 121 81.8
For-sub-ecology
< .001
For-planting date
< .001
For-genotype
0.358
SED
145.13
Figure 38. Mega environments for pigeon pea production in Central Tanzania and stable genotypes. Manyusi was the most stable environment.
Guide for dissemination: The long duration variety (ICEAP-0040-Mali) that takes up to 240 days to mature was least adapted, especially under severe drought stress compared to the two early maturing varieties (00554 (Ilonga M1), 00557 (Ilonga M2). Yet the long duration pigeon pea, locally called Mali is popular. This shows the impact of limited access to improved seed of recently released material such as Ilonga M1 and Ilonga M2, which should be promoted to overcome the low farm yields. Sorghum. Generally, all the three improved varieties outperformed the local check. For the moderate potential environment, sorghum was planted in four villages. Late planting (two weeks after the first planting and onset of the rains, coincided with severe drought resulting in complete crop failure (Table 43). The new materials were highly adapted, Gambella 1107 being the best performer. The local landrace lost up to 71% of its grain when planted late, in a high potential sub-ecology compared to 11% for Gambella and 32% for IESV 23010 DL. This demonstrates the advantage of superior genotypes even under harsh conditions.

89
Table 43. Genotype by management by environment interaction of selected superior sorghum in Kongwa and Kiteto districts of central Tanzania. Sub-ecology Management Yield kg/ha
Gambella 1107
*Yield loss
IESV 23010 DL
*Yield loss
IESV 92028 *Yield loss
Local land race
*Yield loss
High Early planting 1444.6 0 1336.3 0 1029.3 0 689.3 0 Late planting 1286.3 11.0 907.3 32.1 703.3 31.7 201 70.5
Low Early planting 940.4 0 834 0 755.5 0 436.5 0 Late planting 770.5 18.1 704.5 15.5 477.5 36.8 399.5 8.5
Moderate Early planting 611.4 0 952 0 584.4 0 364.4 0 Late planting 0 100 0 100 0 100 0 100
For-sub-ecology
< .001
For-planting date
0.002
For-genotype
0.006
SED
350.9
*The yield loss is computed as a proportionate reduction in grain yield from the optimally managed crop, i.e., early planted in a high potential environment

90
A multivariate analysis grouped the villages into two mega environments (Fig. 39). Among the villages, there was an overlap of Njoro and Moleti in between the two mega environments, an indication that they could represent both mega environments. The most representative mega environments had 6 out of the 7 villages grouped within it; whereas the 2nd mega environment had Mlali in addition to Njoro and Moleti that had an overlap (Fig. 39). Kiperesa, Laikala, and Igula were the most stable in relation to sorghum performance (and as expected low to moderate yields; whereas Mlali and Manyusi were highly unstable (and as expected high yields were recorded owing to their favorable conditions). The candidate line IESV 92028 DL was the most stable genotype across the different environments.
Figure 39. Performance of candidate sorghum across potential variety deployment environments represented by five villages. The GGE genotype plus genotype by environment interaction biplot to shows similarities among the test environments in discriminating the genotypes with two broad mega environments observed.
Guide for dissemination: The elite sorghum was highly adapted to the study areas. Generally, all the three improved varieties outperformed the local check. The new materials were highly adapted, Gambella 1107 being the best performer. The local landrace lost up to 71% of its grain when planted late, in a high potential sub-ecology, compared to 11 Gambella and 32% for IESV 23010 DL. Because of the demonstrated advantage of superior genetics even under harsh conditions, the elite sorghums should be promoted. Pearl millet. Three (3) genotypes namely IP 8774, SDMV 96052, and SDMV 94005 were evaluated against a local check in three villages that fall under a low potential sub-ecology. For pearl millet, the extra early maturing material IP 8774 performed well. As expected, we find highly significant genotype reactions for grain yield (P < 0.001) but none for management (planting date), perhaps due to the already harsh environment (Table 44). Planting early and late in Laikala for example had no advantage due to the very limited rainfall received. Interestingly, while the improved material such as IP 8774 matured earlier and produced high yields of up to 1.6 t/ha, the comparator yield loss in the landrace was 11.4% compared to 28% in the improved material. The candidate genotype SDMV 96053 was the most stable followed by IP

91
8774. The local check and SDMV 94005 were unstable, an indication that they are highly influenced by environment and thus their performance is environment specific. Table 44. Genotype by management by environment interaction of selected superior pearl millet in Kongwa and Iringa districts of Central Tanzania.
Sub-ecology Management Yield kg/ha
IP 8774 *Losses (%)
SDMV 94005
*Losses (%)
SDMV 96053
*Losses (%)
Local Land race
*Losses (%)
Low Early planting 1553.0 0 837.9 0 979.8 0 425.2 0
Low Late planting 1114.3 28.3 643.0 23.3 869.5 11.3 376.9 11.4
For-planting date
0.173
For-genotype
< .001
SED
284.23
*The yield loss is computed as a proportionate reduction in grain yield from the optimally managed crop, i.e., early planted in a high potential environment
Guide for dissemination: Pearl millet was only evaluated in three villages that fall in the low potential agroecology as identified by multivariate analysis of the genotype and genotype by environment interactions in the 2016‒2027 cropping season. Interestingly while improved material such as IP 8774 matured earlier and produced high yields of up to 1.6 tons/ha, the comparator yield loss in the landrace was 11.4% compared to 28% in the improved material. Promotion may be guided by another factor—biomass production. The local check had the highest biomass perhaps reflecting selection for fodder, being a dual-purpose crop for semi-arid ecologies. Legume‒cereal cropping systems. In Kongwa, intercropping elite pigeon pea and sorghum reduced sorghum grain yields by 400 and 160 kg/ha grown in alternate rows and within row, respectively, when intercropped with long duration pigeon pea variety ICEAP00040 (Fig. 40; Kongwa). In Kiteto, sorghum grain yields were reduced by 180 kg/ha when intercropped within row with medium duration pigeon pea ICEAP00057 (Fig. 37; Kiteto). This suggests that in this environment the medium duration pigeon pea variety offered competition for soil water with sorghum since medium duration pigeon pea reaches maximum vegetative growth before sorghum reaches maturity. Similar to the results obtained in Kongwa, the highest reductions in sorghum yield were realized when sorghum was intercropped with long duration pigeon pea variety ICEAP00040 in Iringa. Sorghum grain yields were reduced by 440 and 380 kg/ha when intercropped in alternate rows and within row with ICEAP00040, respectively (Fig. 40; Iringa).

92
Figure 40. Sorghum grain yield (kg/ha) as influenced by intercropping with pigeon pea in Kongwa, Kiteto, and Iringa districts during the 2018/2019 cropping season. Error bars indicate standard errors.
Further in Kongwa, there was a significant (P < 0.001) effect of pigeon pea variety on yield. ICEAP00040 gave 560 kg/ha more grain yield than ICEAP00557. There was significant (P < 0.05) interaction of variety and cropping system at Iringa. While there was no significant interaction between sole cropping and within row planting for ICEAP00040, planting ICEAP00040 in alternate rows with sorghum gave 45% lower grain yields than sole cropping (Table 45). Similarly, within row planting gave 70% lower pigeon pea yield compared with sole cropping for ICEAP00557. In Kiteto, pigeon pea grain yields were not influenced by intercropping. Table 45. Pigeon pea grain yield (kg/ha) as influenced by intercropping in Kongwa, Kiteto, and Iringa, 2018/2019 season. Figures in parenthesis indicate standard errors.
Kongwa Kiteto
Iringa
Intercrop system
ICEAP00040 ICEAP00557 ICEAP00040 ICEAP00557 ICEAP00040 ICEAP00557
Pure stand 1260 (183.6) 642 (224.8) 1136 (254) 544 (254) 368 (19) 216 (19)
Alternate rows
998 (183.6) 531.5 (159) 580 (312) 351 (245) 254 (19) 203 (19)
Within row planting
1015 (159) 418 (159) 484 (254.5) 580 (245) 394 (19) 127 (19)
APSIM crop simulation modelling to assess changes in resource use efficiencies, productivity, and profitability of the cropping systems in Central Tanzania We developed protocols for data collection and parameterization and used them to collect data for parameterization of the model. Yield data was generated from our three experimental sites that evaluate the performance of improved legume and cereal varieties under intercropping in stressed and moderately stressed conditions of Iringa, Kongwa, and Kiteto districts. Data collected included soil samples for analyses of chemical and physical parameters, plant

93
populations, crop phenology, biomass, PhotosynQ data, Leaf Area Index, and days to 50% flowering. APSIM was parameterized using soil data generated by ISRIC soil grids. Soil water characteristics, bulk density, and % soil organic matter were estimated using the SPAW model. Daily rainfall data was obtained using rain gauges at each study site while temperature and solar radiation were obtained from NASA power. The parameterized APSIM model was used to calibrate newly developed varieties of legumes and cereals and model evaluation before assessment of changes in resource base, resource use efficiencies, and productivity using long-term climatic data. Key results were that:
• Simulated cereal (sorghum and pearl millet) and legume (pigeon pea and groundnut) grain yields, approximated the observed yields showing that APSIM can predict cereal response to intercropping (Fig. 40). A second season of trials is needed to validate these results.
• In the low potential sites such as Igula and Iringa, pigeon pea grain yield was reduced by up to 30% when intercropped with sorghum, especially where the long duration pigeon pea cultivar was used, suggesting that varietal phenology is critical.
• In pigeon pea and groundnut doubled-up cropping systems, the faster establishing groundnut used up most of the available water resources especially under drought as was experienced in the 2018-2019 cropping season, before the slow-establishing pigeon pea, especially for the long duration material, resulting in reduced pigeon pea yields. Thus, productivity can inadvertently be affected by crop and variety compatibility.
• Total soil organic C simulated in the top 15 cm of soil increased over the course of our study (1980‒2019) especially when pigeon pea was added to the cropping system signifying the importance of grain legumes in sequestering soil C and eventual sustainability of the cropping systems.
Modeling using APSIM shows that pigeon pea‒sorghum and pigeon pea‒groundnut intercrops can enable farmers in Central Tanzania to de-risk crop production by using multiple cropping. Integrating pigeon pea into the cereal-based cropping systems has an additional advantage of increasing total soil C overtime compared with continuous sole cereals. While this study has shown the potential of the APSIM model to devise appropriate management systems for cereal‒legume production under smallholder farmers’ conditions in Central Tanzania, practical experimentation among smallholder farmers is advocated to allow resource-limited farmers to determine the cereal‒legume systems that suit their conditions as part of a strategy to build soil fertility while providing immediate household needs.

94
Figure 40. Pigeon pea grain yield comparison between sole and intercrops systems simulated under farmers’ conditions in central Tanzania (1986‒2019).
Output 5.2 Strategic partnerships with public and private initiatives for the diffusion and adoption of research products
Strategy and implementation framework for scaling up intensification technologies in semi-arid ecologies of Central Tanzania This work was aimed at gaining understanding of power dynamics between different innovation platform (IP) actors and the processes conducted to and/or desired to be conducted by the IP. The focus on understanding power dynamics is because IPs are often promoted as a means of addressing power imbalances between farming communities, researchers, and decision-makers, being regarded as a model of inclusive innovation. The focus IP was the Kongwa-Kiteto IP established in Phase 1. Key findings are presented below:
1. The study mapped, ranked, and investigated the availability of key-service providers in Africa RISING study villages of Kongwa and Kiteto districts. No significant differences were found between IP member and non-member IP control groups in the ranking of importance and availability of service providers (Fig. 41). Aggregators were, however, found most readily available, suggesting working as an IP benefits from their services.
2. Culture influences gender and land ownership but does not affect access to knowledge and technologies.
3. Key actors providing knowledge in Kongwa and Kiteto are mostly public institutions, i.e., extension, research, and/or civil society. But because they are not-for-profit based, and therefore, have a limited direct role in improving farm household incomes, they cluster together away from knowledge and technology providers and producers (Fig. 42).

95
Figure 41. Ranking importance and availability of service providers in Mlali, Kongwa District by Innovation Platform members, compared to a non-member control group.
Figure 42. Dendogram from cluster analysis of power relationships among key stakeholders in Kiteto and Kiteto districts with respect to increasing farm household incomes. The analysis reveals three main clusters 1-(Business agencies); 2-(Consumers, policy and knowledge institutions); 3-(Farmers, knowledge agencies). Numbers on dendogram leaves (tips), indicate how the data was recorded and not the ranking of their significance.

96
Engage with seed companies to accelerate QPM seed scaling in Tanzania We held meetings during August 2019 in Arusha with Meru Agro Seed Company, MAMS Agriculture, and Aminata Quality Seeds and discussed partnerships for scaling of the new DT QPM hybrids. These companies have a great interest in marketing QPM. The two released QPM hybrids were allocated to Meru Agro and this means these hybrids cannot be marketed by Aminata Seeds or MAMS Agriculture. For this, MAMS and AMINATA were looking for new DT or QPM hybrids that can be released under their names. This implies that the new DT hybrids being tested in Kongwa and Kiteto can eventually be allocated to these companies if their applications for the hybrids can be considered through the CIMMYT product allocation processes. According to Meru Agro, the license from CIMMYT provides the mandate for them to market the new hybrids allocated to them. However, their main challenge is that the new product should be promoted first; therefore, they have to identify resources to support promotion of these new products. Partnership with Islands of Peace (IoP) in Tanzania to scale postharvest management technologies Africa RISING partnership with IoP seeks to deliver to farmers postharvest technology packages that improve the productivity social, human, and economic conditions of smallholder farmers in Karatu District. The overall goal is to contribute to sustainable family farming and responsible food systems. Four activities were implemented during this reporting period, aimed at winding up actions in the eight villages of Karatu District that were started during July 2018. The activities were for strengthening the capacity of IoP staff and lead farmers to enable them to expand scaling activities in these and other villages. The activities were:
1. A workshop to disseminate results and review activities of the collaboration. This was attended by 24 participants representing IoP staff, local government extension staff, and farmers’ representatives. Feedback from the workshop was that (i) metallic silos were preferable over the PICs bags because they were resistant to insect and rodent damage, more consistently re-usable and stored more produce; and (ii) there were differences in grain damage levels between villages considered to be influenced by altitude and its effect on temperature.
2. Refresher training for lead farmers and IoP staff. The aim was to build the confidence of lead farmers to be able to spearhead scaling actions including setting up of technology demonstrations and forming postharvest committees as a mechanism for increasing advocacy and improving accessibility of the technologies in the villages. Twenty-six farmers were trained in the aspects of (i) Improved postharvest technologies and their contribution to improved grain quality; (ii) improved drying and grain moisture verification, threshing, and storage; (iii) Grading and classification of grain lots based on physical quality parameters; (iv) Grain quality standards and specifications for grain (East African grain standards); (v) Sampling and grain quality assessment techniques for small-scale farmers; (vi) Aflatoxin and the pre- and postharvest mitigation approaches; and (vii) Storage hygiene and store management.
3. ICT messaging. Eight (8) short messages, which included actionable tips and reminders on good postharvest practices (good harvesting procedures, threshing and drying; sorting prior to bagging, improved storage techniques; aflatoxin control approaches; store preparation and storage hygiene) were test-disseminated through SMS (Fig. 43). These were intended to reinforce knowledge acquired through training and practical demonstrations. In the coming months, village postharvest committees will register and
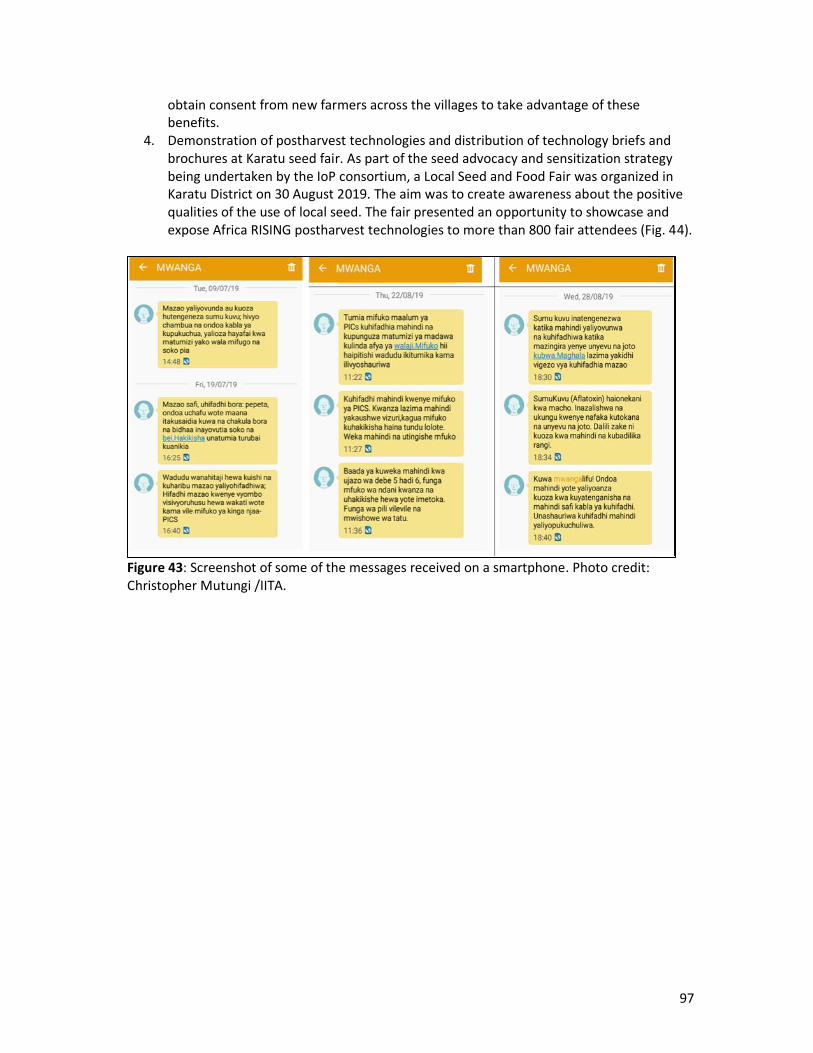
97
obtain consent from new farmers across the villages to take advantage of these benefits.
4. Demonstration of postharvest technologies and distribution of technology briefs and brochures at Karatu seed fair. As part of the seed advocacy and sensitization strategy being undertaken by the IoP consortium, a Local Seed and Food Fair was organized in Karatu District on 30 August 2019. The aim was to create awareness about the positive qualities of the use of local seed. The fair presented an opportunity to showcase and expose Africa RISING postharvest technologies to more than 800 fair attendees (Fig. 44).
Figure 43: Screenshot of some of the messages received on a smartphone. Photo credit: Christopher Mutungi /IITA.

98
Figure 44. Africa RISING scientist (A. Gaspar) displays technology briefs and fliers (a); Visitors take interest in postharvest technology briefs (b); A lead farmer explains how to use the metallic silo to visitors (c); IoP’s country director for Tanzania (L. Joly) explains the metallic silo to a VIP visitor (d). Photos credit: Eveline Massam/IITA.
Partnership with IoP in Tanzania to scale improved vegetable varieties and management practices Africa RISING is partnering with IoP in taking improved vegetable management technologies to scale. During this reporting period, Africa RISING conducted postharvest training to equip the IoP partner staff with skills and knowledge for maintaining quality and safety (appearance, texture, flavour, and nutritive value) and to reduce losses between harvest and consumption (Fig. 45). Twenty-eight staff (39% female) were trained. These technologies are planned to be scaled to 800 households.

99
Figure 45. Trainees showing chopped vegetable samples ready for drying. Photos credit: D. Kejo/WorldVeg.
Partnership with Mboga na Matunda (MnM) Project and Tanzania Horticultural Association (TAHA) in Zanzibar and Arusha Region These projects are benefitting from nutrition materials and are scaling technologies validated in Babati during Africa RISING Phase I. MnM is targeting 1000 households in Zanzibar. Partnership with Catholic Relief Services (CRS) in Zambia for scaling green manure cover crops (GMCCs) The leading research partner, CIMMYT, supports the scaling activities of CRS through the provision of technical knowledge and building of expertise around GMCCs. In previous years, this has been through sharing reports, presentations, and discussion tools. This year Africa RISING has involved the Senior Agriculture Officers and the Provincial Agriculture Coordinators in field tours to expose them to new GMCC strategies and technologies. These mainstreaming activities are likely to continue. A newly funded project from the EU will take on some of the preliminary work on GMCCs and agroforestry to scale these technologies further. Also, technical knowledge has been included into the programming of a large GCF project where CRS is a lead designer, who will support scaling on GMCCs in the future. Over the years of project implementation, 4,647 farmers were reached in Eastern Zambia producing pigeon pea. Many more farmers attended awareness events and trainings. These were:
• Trainings and Learning Events: o 28 community-based sensitization meetings were held with a total of 3,702
participants. o 6,242 farmers attended community-based trainings which included holistic natural
resource management, integrated pest management, postharvest handling and storage, and marketing.
o 2,223 farmers attended 12 field days to learn about intercropping, integrated pest management, and benefits of growing pigeon pea and Gliricidia.
o 40 (8 women and 32 men) Agriculture Development Agents (ADAs) were trained in facilitating pigeon pea production and marketing.
• Production and Market Linkages:

100
o In the 2 years of project support, farmers on average produced 73 kg of pigeon pea. This production was used as follows: 10% (7 kg) for household consumption, 4% (3 kg) as seed for the coming season, 10% (7 kg) paid to ADAs for loan repayment, and 77% (41 kg) delivered to the bulking centers for marketing.
o During the period of the project, out of the 4,647 farmers reached by the project, 988 (23%) were linked to a pigeon pea buyer. The total quantity of the marketed commodity was 63,827 kg valued at K214,003 (approximately US$20,370), translating to an average net income of K216 (approximately US$21) per farmer compared to the situation before the intervention where farmers realized approximately K114 (approximately US$11) each.
• Climate Change Mitigation: o 26,880 Gliricidia seedlings were distributed to 450 farmers, 82% of the distributed
seedlings established. Partnership with development actors to conduct on-farm trials using different GMCC and grain legume intercropping strategies. Green Manure Cover Crops (GMCC) intercropping trials were established in 18 on-farm locations in Chipata and Lundazi in Zambia with the help of ZARI, CRS, GRT, and CARITAS personnel. These trials were also to act as demonstrations for scaling the technologies. Not all GMCC intercropping on-farm trials could be established due to lack of commitment by our collaborating partners—CRS and CARITAS. However, the trials in Chipata looked generally better managed than in previous years. Problems in late procurement and distribution of inputs by the NGOs still exist which affected the general performance of these trials. The cropping season had favorable rainfall, which translated to high maize yields at all sites. Legume yields on the other hand were low and more affected by the high rainfall. In the trials, a sole maize treatment was compared with four different legume intercropping strategies: i) maize intercropped with pigeon pea, ii) maize intercropped with cowpea and pigeon pea, iii) maize intercropped with lablab, and iv) maize intercropped with Gliricidia and rotated with a pigeon pea/groundnut doubled-up legume system. Results from the trials showed no difference in grain yield between the maize sole cropping, and all other intercropping strategies. This shows that there is no further yield penalty in growing legumes with maize after the third cropping season. However, in the assessment of biomass, maize/lablab intercropping had a small yield penalty. Legume grain yield in all intercropped treatments was extremely low (Fig. 46), which was a big surprise and disappointment. The high rainfall could have led to the reduction in legume grain yields; –but more likely the well growing maize provided too much shade to the under sown legume. Also, late planting of the trials by our partner organizations could have contributed to the low legume yield. Where there were only groundnut and pigeon pea (Treatment 5), there was a more adequate grain yield (Fig. 46) amounting to 1392 kg/ha for groundnut and 284 kg/ha for pigeon pea. Biomass yield of the legumes was fairly high and above 2 t/ha in all treatments (Fig. 47). Combined grain and biomass yield of maize and legumes showed no change in this trend due to low grain yields of the legumes, but there was a huge increase in combined biomass on all intercropped treatments (Fig. 48). Pigeon pea added a large amount of extra biomass input into

101
the system when compared to growing maize as a sole crop. This will have future benefits on soil fertility if the system is to be continuously planted. The results confirm those gathered in the 2016/2017 and 2017/2018 cropping seasons.
Figure 46. Effect of intercropping on legume grain yield in on-farm sites (n = 18), Eastern Zambia, 2018/2019. Error bars represent SEDs; means followed by the same letter in column are not significantly different at P < 0.05 probability level.
Figure 47. Effect of intercropping on legume biomass yield in on-farm sites (n = 18), Eastern Zambia, 2018/2019. Error bars represent SEDs; means followed by the same letter in column are not significantly different at P < 0.05 probability level.

102
Figure 48. Combined maize and legume biomass yield (n = 18), Eastern Zambia, 2018/2019. Error bars represent SEDs; means followed by the same letter in column are not significantly different at P < 0.05 probability level.
Soil sampling and infiltration measurements using the time to pond method were done in March 2019. The soil analysis results show very few significant differences between treatments, which was mainly due to large variability between on-farm trial replicates. Nevertheless, we found a difference in total N content at a soil depth of 0‒20cm soil depth in the maize-lablab intercropping, outperforming other treatments. A second significant difference was found in K, where the control treatment outperformed the others. Significantly, the highest water infiltration was recorded in the maize pigeon pea treatment followed by the control. Lowest infiltration rates were recorded in the maize/Gliricidia‒legume rotation treatment. Both results are not yet conclusive and will require further research. From the development partner-managed on-farm trials we can capture the following learning points:
• There is no longer any maize yield suppression in maize-intercropping trials, which means that all legumes will be an added advantage to farmers and not a penalty.
• Only the lablab intercropping treatment led to a slight yield reduction on maize grain yield which was however not significant.
• Legume biomass yields obtained in addition to the maize biomass yield by far outweigh sole cropping of maize and will in the long run improve soil fertility besides other benefits (firewood, groundcover, nutrition etc.). However, to become attractive to farmers, the legumes must also have sufficient grain yield for sale. There is need for more research to increase grain yield production.
• Legume grain yields were very low and possible reasons are late planting of trials in on-farm sites, high rainfall leading to reduced legume growth due to diseases, and insufficient or ineffective spraying against blister beetle and pod borers, which all affected the yield.
• Soil chemical analysis between treatments did not show many significant differences although an increase in total N was observed in the maize/lablab treatment.

103
• Maize/pigeon pea intercropping led to higher infiltration rates which will in the longer run provide greater climate resilience.
• Soil quality results are not yet conclusive and require further research. Partnership with Total Landcare (TLC) in Malawi for scaling CA practices Since 2005, CIMMYT and TLC have built a strong linkage between research and development on promoting CA systems to smallholder farmers in Malawi, Zambia, and Zimbabwe. TLC staff were involved in annual field tours and efforts have been made to continuously engage with this important development partner. In one of the target communities (Mwansambo), adoption of CA is widespread and more than 50% of farmers are practicing the technologies. We have engaged local media during the field tours and features were broadcast on national radio and Zodiac. CIMMYT, now financially supported by Africa RISING, is pursuing this and is starting to move into smallholder mechanization with farmers. The first pilots on 2-wheel tractors have already been established and will continue to be expanded in years to come. TLC will likely get further funding from the Royal Norwegian Embassy and this will enable further scaling of technologies. We will however have to make sure that we continue collaborating with TLC as in previous years, despite their current shift to new intervention areas in Malawi. Table 46. Other research or development support partnerships, or partners with initiated discussions on future collaboration.
Research Institution
Partner/Project Partner role
CIAT Meru Agro Supply of improved seeds
Minjingu Fertiliser Company
Supply of Minjingu NAFAKA fertilizer
IITA SIL: Geospatial Consortium Partner in developing a new method of clustering multivariate time series-gridded data
IITA African Data Cube Provision of free and ready to use time series remote sensing data (http://52.54.26.108/)
TARI Hombolo
World Food Program and Farmer managed Natural Regeneration Project
Ongoing discussions for scaling Fanya juu and in-situ rainwater harvesting technologies
ICRAF UC Davis and the Climate Smart Project (USDA)
Collaboration on the implementation of the rainout shelter experiments
ICRAF Mikumi National Park Scale agroforestry technologies in Kitete and Msindazi villages. Formal agreement under development
CIMMYT Sustainable Intensification of farming systems in Zambia (SIFAZ - EU)
Initiated August 2019. Potential for co-creation of new research building on ESA Project results

104
ESA-specific monitoring and evaluation activities
• IFPRI and ESA M&E officer led a discussion on various M&E-related issues with researchers during the 2019 ESA Review and Planning Meeting (10‒11 September, Dar es Salaam). Topics covered included FtF and custom indicators, monitoring of different types of program beneficiaries, and program data management.
• The M&E officer started working on/updating databases of different types of program beneficiaries with input from IFPRI and ESA Chief Scientist. Upon receipt of data about new action sites in Tanzania, the Beneficiary and Technology Tracking Tool (BTTT) was modified to allow the data manager to enter information regarding beneficiaries in the new sites.
• The M&E officer and IFPRI started compiling FtF data for FY 2019 working with researchers through field visits, desk activities, and emails.
• IFPRI continued its management of program generated data (uploading of data and supporting documentation as well as monitoring of data requests) through the program repository platform Dataverse accessible here: https://dataverse.harvard.edu/dataverse/AfricaRISING. Since the introduction of the online data user agreement Google form, there were 37 requests for restricted datasets, of which 18 have been granted. Requests have been received from a wide variety of users, ranging from graduate students to full time research professionals. Geographically, requests have been received from institutions based in the US, Australia, the Netherlands, India, Japan, and Tanzania. The following are the reasons why some data owners were refused data access: (1) the scientist responsible for managing the data is still studying and analyzing it, or (2) the data are part of a multiyear trial and are not yet ready for public release.
• IFPRI worked with MSU to implement the Malawi Africa RISING Follow-up Evaluation Survey (MARFES), as a follow up to baseline data collected in 2013. This data collection, spanning the districts of Ntcheu and Dedza, serves a panel dataset by re-interviewing the same beneficiary and non-beneficiary households. With approximately 96% of the baseline sample covered thus far, the current attrition rate is 11%. Data collection activities have included a two-week training of experienced enumerators in Zomba, Malawi, led by an IFPRI consultant, who also oversaw the first week and a half of data collection. The themes covered in the follow-up survey reflect a streamlined version of those collected during the baseline, including data on household demographics, agricultural production and sales, food security and consumption, and anthropometrics for children under 5 and women of reproductive age. Special attention was paid to plot-level adoption of different sustainable practices in the most recent growing season as well as retrospective data. Additional data was collected from beneficiary respondents on their experience in the Africa Rising program. Challenges experienced were largely limited to tracking households that migrated to nearby urban centers and estimation of hired and family labor throughout the season.
• IFPRI collaborated with WUR on FarmMATCH—a framework for typology-based targeting and scaling of agricultural innovations. An MSc student has contributed to the mapping work and processing of data from IFPRI’s Baseline Evaluation Survey (ARBES) to feed into the FarmMATCH framework. A software engineer was hired to program the matching algorithm of the FarmMATCH framework, who worked with IITA and IFPRI researchers to prepare ARBES data for the analyses. A “data pipeline” has been developed that can extract ARBES data and insert it into farm models, to allow rapid

105
assessment of more complex SI indicators for sampled farms in Africa RISING case study areas. The method is being tested in Babati, Tanzania.
• IFPRI and CIMMYT initiated research to assess the role of conservation agriculture in enhancing the stability and resistance of cropping systems yields to weather variability in Malawi. The research is expected to be submitted to a journal in the summer of 2020.

106
Capacity building Table 47. Short- and long-term training, and field days offered during the period April 2018–September 2019.
Subject of training/Field day Lead institution
Venue Dates Participant Category Number of participants
Percentage of women
Short-term training and Field days Postharvest management WorldVeg IoP Office, Karatu 13–17 July Farmers,
extension officers 28 39
Nutrition training WorldVeg Karatu, 8 villages 22–28 August
NGOs, extension officers, restaurant & kiosk staff, farmers
366 52
Field days on Improved vegetable varieties and GAPs
WorldVeg Karatu, 7 villages 8–13 July Farmers, extension officers
215 46
Seed and trade fair IoP Karatu Town 30 August Farmers, local and national government officials, students, journalists
800 (estimate)
Field day: Performance of various air-tight storage techniques
IITA Karatu, 8 villages 20–31 May Farmers, extension agents
239 33
Grain standards and storage hygiene IITA Karatu 18 July Farmers, extension agents
33 24
Hermitic technologies for grain storage
IITA Karatu 28–28 August
Farmers, extension agents
30 43
Refresher training in postharvest technologies
IITA Karatu Lead farmers, IoP staff
28 46
Training of trainers in soil & water conservation and agroforestry
Lead Foundation + Farmer Moshi Maile
Mpwapa, Chamwino, Kondoa, and Mutumba Teachers Colleges
20 May–14 June
Farmers 825 75

107
Feed processing and formulation ILRI/FIDE Yerotonik Village, Babati
30–31 July Farmers, extension officers
78 45
Crop residue processing ILRI/Farm Africa
Mamire Village, Babati
5–6 Aug Farmers, extension officers
67 41
Experiment implementation and management (Poultry/Dairy)
ILRI Bermi, Matufa, Bashnet villages, Babati; Mwanya Village, Kiteto; Mlali Village, Kongwa
26 Aug–5 Sept
Farmers, extension officers
55 44
Poultry husbandry, housing and feed processing
ILRI Babti, Kongwa, Kiteto
12–24 July 2019
Farmers, extension officers
82 32
Postharvest: training and feedback LUANAR Linthipe 7 August Farmers, extension officers
200 70
Ntubwi 9 August Farmers, extension officers 146 69
Long-term training
Productivity and resilience of G. sepium intercropping
ICRAF UC Davis (USA) & Humboldt University (Germany)
Continuing 1 MSc, 1PhD 2 50
Mapping land degradation index with remote sensing
IITA University of Bonn (Germany)
Aug–Sept 2019
MSc 1 0
Application of Geomatics in Agriculture
IITA Ardhi University (Tanzania)
Jul–Sept 2019
BSc 2 0
108
Challenges and actions taken • Termination of operations by development partner TLC in one target area in Malawi led
to neglect of some trials in Linga and crop failures in three sites. We will have to increase spending in central Malawian sites to keep the long-term trials going. We hope to be able to engage one of the site managers from TLC to continue this successful work.
• Obtaining research permits for non-Tanzanian project staff and students delays certain research programs. The Hub administration can only keep urging relevant authorities for speedy action.
• The Principal Investigator of the community chicken breeding activity from UDOM has repeatedly delivered an unintelligible report. We consider this a serious delivery failure and are discontinuing support to this activity. There is no alternative researcher.

109
Communications and knowledge sharing The main communication channels supported during the reporting period were:
• Wiki internal workspace: http://africa-rising-wiki.net/Home
• Project updates on the program website: https://africa-rising.net/
• A Yammer network with internal updates
• Photos: https://www.flickr.com/photos/africa-rising/
• Repository: https://cgspace.cgiar.org/handle/10568/16501 A revamp of the Africa RISING program website was completed in August 2019. Inputs for the structure and content for the Africa RISING web interface were collected from different project stakeholders and a comprehensive analysis of the program’s web presence by the lead consultants for the revamp. One of the major improvements of the new website from the previous version is the integration of the different communication tools and platforms used by Africa RISING into the site. From this platform, all stakeholders can now access publications, news from the project, PowerPoint presentations, photos etc. The CKS team also collaborated with the Chief Scientist to produce country briefs highlighting Africa RISING outputs in Tanzania, Malawi, and Zambia. These briefs were prepared to support the process of planned engagements and interactions with the USAID country Missions and the Development partners who have in certain instances requested for a list of improved agricultural technologies validated by Africa RISING in each country. These briefs will be updated annually to reflect newer/emerging information. The stories listed below were published and disseminated to stakeholders concerning different project activities and outputs. Click on hyperlinked titles below to view each.
• Filling the missing pieces: ESA partners set targets for collating sustainable intensification data (27 September 2019)
• Establishing shared prosperity: Farmers’ groups in northern Ghana set ground rules for using maize shellers (24 September 2019)
• Key take-aways from a recent Africa RISING exchange visit in Ghana (22 August 2019)
• In pictures: the 2019 Africa RISING Tanzania monitoring visit (23 July 2019)
• Adopting good agricultural practises was the game changer I needed! (25 June 2019)
• Mechanized maize shelling transforms lives in rural Tanzania (18 June 2019)
• Anecdotes of sustainable intensification (video) (30 April 2019)
• Africa RISING takes part in preseason agribusiness networking forum in Tamale, Ghana (26 April 2019)
• Next generation RISING (video) (23 April 2019) The following meetings and events were held during the reporting period.
• 12 September: Africa RISING ESA Project Steering Committee Meeting - Dar es Salaam, Tanzania
• 10 - 11 September: Africa RISING ESA Project Review and Planning Meeting - Dar es Salaam, Tanzania
• 5 - 7 September: Training for farmers hosting poultry experiments – Seloto & Matufa, Babati, Tanzania
110
• 3 – 4 September: Training for farmers hosting poultry experiments – Mlali, Kongwa, Tanzania
• 31 August – 1 September: Training for farmers hosting poultry experiments – Mwanya, Kiteto, Tanzania
• 30 August: Karatu seed fair and food fair - Karatu, Tanzania • 27 – 29 August: Training for farmers hosting dairy experiments – Babati, Tanzania • 26 August: Meeting with development partners for scaling livestock technologies –
Babati, Tanzania • 19 - 27 August: Vegetable nutrition training for farmers - Babati, Tanzania • 14 - 16 August: Post harvest handling and drying of vegetables training for farmer -
Babati, Tanzania • 8 August: Nane nane exhibition • 2 - 3 August: Introductory workshop on social science research on soil and water
conservation practices in Kongwa/Kiteto - Dodoma, Tanzania • 1 - 7 August: Field visit/work social science research on soil and water conservation
practices in Kongwa/Kiteto • 15 - 17 July: Africa RISING East and Southern Africa Project - Malawi Country Meeting -
Lilongwe, Malawi • 9-12 July: Farmers field day - Grow and eat more vegetables for improved income and
nutrition - Babati, Tanzania • 08 - 10 July: Africa RISING East and Southern Africa Project - Tanzania Country Meeting -
Arusha, Tanzania • 3 - 4 July: Africa RISING - NAFAKA Project review and planning meeting - Dar es Salaam,
Tanzania • 13 - 14 May: Africa RISING Tanzania Livestock Integration planning meeting - Arusha,
Tanzania

111
Selected reports and publications The following peer reviewed journal articles and reports were published by the project team during this period.
Peer reviewed journal articles • TerAvesta, D., Wandschneider, P.R., Thierfelder, C. and Reganolda, J.P. 2019.
Diversifying conservation agriculture and conventional tillage cropping systems to improve the wellbeing of smallholder farmers in Malawi. Agricultural Systems 171:23–35.
• Jambo, I.J., Groot, J.C.J., Descheemaeker, K., Bekunda, M., & Tittonell, P. (2019). Motivations for the use of sustainable intensification practices among smallholder farmers in Tanzania and Malawi. NJAS–Wageningen Journal of Life Sciences, 1–10.
• Shitindi, M., Kpomblekou-A, K., McElhenney, W.H., Ankumah, R., Semoka, J., Bekunda, M. & Bonsi, C. (2019). Maize response to leguminous biomass composted with phosphate rocks in the northern zone of Tanzania. Journal of Experimental Agriculture International, 35(4), 1–15.
• Mupangwa, W., Thierfelder, C., Cheesman, S., Nyagumbo, I., Muoni, T., Mhlanga, B., Mwila, M., Sida, T. and Ngwira, A., 2019. Effects of maize residue and mineral nitrogen applications on maize yield in conservation-agriculture-based cropping systems of Southern Africa. Renewable Agriculture and Food Systems, 1–14.
• Kotu, B.H., Abass, A.B., Hoeschle-Zeledon,I., Mbwambo, H. and Bekunda, M. 2019. Exploring the profitability of improved storage technologies and their potential impacts on food security and income of smallholder farm households in Tanzania. Journal of Stored Products Research 82, 98–109.
• Komarek, A.M., Kwon, H., Haile, B., Thierfelder, C.,Mutenje, M.J. and Azzarri, C. 2019. From plot to scale: ex–ante assessment of conservation agriculture in Zambia. Agricultural Systems 173: 504–518.
• Mutenje, M.J., Farnworth, C.R., Stirling, C., Thierfelder, C., Mupangwa, W. and Nyagumbo, I. 2019. A cost–benefit analysis of climate–smart agriculture options in Southern Africa: Balancing gender and technology. Ecological Economics 163: 126–137.
• Harrison, R.D., Thierfelder, C., Baudron, F., Chinwada, P., Midega, C., Schaffner, U. and Van den Berg, J. 2019. Agro-ecological options for fall armyworm (Spodoptera frugiperda JE Smith) management: Providing low-cost, smallholder friendly solutions to an invasive pest. Journal of Environmental Management 243:318–330.
• Chimonyo, V.G.P., Snapp, S.S. and Chikowo, R. 2019. Grain legumes increase yield stability in maize based cropping systems. Crop Science 59(3):1222–1235.

112
Reports • Richardson, R. 2019. Final Report: Africa RISING Global Climate Change Mitigation
(Zambia). Ibadan, Nigeria: IITA.
• IITA. 2019. Enhancing partnership among Africa RISING, NAFAKA and TUBORESHE CHAKULA Programs for fast tracking delivery and scaling of agricultural technologies in Tanzania: Quarterly report (01 January 2019–31 March 2019). Ibadan, Nigeria: IITA.