Profitability analysis of a farming system in Africa
13
Agricultural Systems 24 (1987) 81-93 Profitability Analysis of a Farming System in Africa* Michael Boateng Utah State University, Logan, Utah 84322, USA C. Brice Ratchford & Melvin Blase University of Missouri-Columbia, College of Agriculture, Department of Agricultural Economics, 200 Mumford Hall, Columbia, Missouri 65211, USA (Received 25 October 1986; accepted 13 November 1986) SUMMARY This analysis questions the assumptions that in a traditional farming system food production is primarily for home consumption and is not competitive with export crop (cocoa) production. Government planners and policy makers must look at the total operation of a farmer to understand the role of food crop production. In the case of Ghana in 1981 they needed to seek ways to make cocoa production relatively more profitable if the goal of increased cocoa production from small farms were to succeed. The analysis indicates why farmers were devoting scarce resources, particularly labor, to producing food crops in Ghana in 1981. Food crops were the most profitable both (1) in 1981 and (2) when theflow of incomefrom the life of the trees was considered. Clearly, the farmers were demonstrating that they were rational economic men. In order to get an idea of what price cocoa must bring for it to be as profitable as thefood crop systems, the price of cocoa was varied with all other prices held constant. The price of cocoa would have had to be approximately ~400 per load of 30 kilograms in 1981. The government purchase price was ~120 per load. Nor surprisingly, cocoa production in Ghana was declining steadily. * Contribution from the Missouri Agricultural Experiment Station. Journal Series No. 9964. 81 Agricultural Systems 0308-521X/87/$03-50 © Elsevier Applied Science Publishers Ltd, England, 1987. Printed in Great Britain
Transcript of Profitability analysis of a farming system in Africa

Agricultural Systems 24 (1987) 81-93
Profitability Analysis of a Farming System in Africa*
Michael Boateng
Utah State University, Logan, Utah 84322, USA
C. Brice Ratchford & Melvin Blase
University of Missouri-Columbia, College of Agriculture, Department of Agricultural Economics,
200 Mumford Hall, Columbia, Missouri 65211, USA
(Received 25 October 1986; accepted 13 November 1986)
SU M M ARY
This analysis questions the assumptions that in a traditional farming system food production is primarily for home consumption and is not competitive with export crop (cocoa) production. Government planners and policy makers must look at the total operation of a farmer to understand the role of food crop production. In the case of Ghana in 1981 they needed to seek ways to make cocoa production relatively more profitable if the goal of increased cocoa production from small farms were to succeed.
The analysis indicates why farmers were devoting scarce resources, particularly labor, to producing food crops in Ghana in 1981. Food crops were the most profitable both (1) in 1981 and (2) when the flow of income from the life of the trees was considered. Clearly, the farmers were demonstrating that they were rational economic men.
In order to get an idea of what price cocoa must bring for it to be as profitable as the food crop systems, the price of cocoa was varied with all other prices held constant. The price of cocoa would have had to be approximately ~400 per load of 30 kilograms in 1981. The government purchase price was ~120 per load. Nor surprisingly, cocoa production in Ghana was declining steadily.
* Contribution from the Missouri Agricultural Experiment Station. Journal Series No. 9964.
81 Agricultural Systems 0308-521X/87/$03-50 © Elsevier Applied Science Publishers Ltd, England, 1987. Printed in Great Britain

82 Michael Boateng, C. Brice Ratchford, Melvin Blase
INTRODUCTION
Ghana's cocoa output has been consistently declining at the rate of about 4% annually since 1974 (Ghana Cocoa Marketing Board). The question that needs to be answered is: 'Contrary to their performance in the 1960s, why have the small cocoa farmers let the cocoa industry decline since the early 1970s?'
Obayemi (1973) writing on costs and returns to cocoa and alternative crops in Western Nigeria, pointed out that the reason for the adoption of cocoa into traditional farming was due to the ease of intercropping traditional crops with cocoa. Rourke's (1972) pioneering work on profitability analysis of cocoa and alternative crops in Ghana concluded that cocoa intercropped was the most profitable enterprise among all enterprises considered. Killick (1966) argued that Ghana's efficiency in cocoa production was due to abundant labor and virgin forestland. Wood (1974) at the Cocoa Economic Conference in Ghana in that year, concluded that the problems involved in increasing the size of cocoa farms were management and administration capabilities. Recent researchers have attributed the decline in cocoa production to the price paid to farmers, the land tenure system and smuggling of cocoa across the borders, Nyanteng (1980), Dapaah (1982) and LaAnyane (1972). Suffice it to say, the literature does not contain a concensus with regard to reasons for the decline of a long established farming system.
The objective of this study is to gain insight into why cocoa farmers have reduced cocoa production. The unique feature of this study is determining which crops compete with cocoa in the traditional farming system and the extent to which competition is determined by relative profitability.
DATA SOURCES
Three units in the Konongo zone of the Ashanti Cocoa Project area were chosen for the collection of data. The purpose of the project is to increase cocoa production on small farms. It has received World Bank financing for a substantial period of time.
A two-stage sampling procedure involving primary and secondary sampling techniques was followed using a list of all cocoa farmers in the area. On the whole, 300 cocoa farmers were selected from four villages and towns to be included in the study. University diploma graduates were trained for the questionnaire administration and subsequent data collection. The data were gathered in 1981 for the previous crop year.
A variety of socio-economic data were obtained. These included the age,

Profitability analysis of a farming system in Africa 83
marital status, literacy, occupation, wage rates and labor constraints. Data concerning the sample farms focused on age of cocoa trees, size of cocoa farms, availability of selected inputs, type of tenure, farming system and types of marketable surplus.
The survey data were supplemented with secondary data. Information concerning the activities adopted, man-days (one man-day is taken to be 6-8 h (full day) of work per person) of labor, and yield per acre for cassava and corn were taken from Rourke's (1972) work. Man-days and yield per acre for cocoa, plantain and cocoyam were taken from the Ministry of Agriculture, Cocoa Division (Government of Ghana). The price for cocoa and wage rates were the 1980-81 government guaranteed price and minimum wage, respectively (Government of Ghana, Central Bureau of Statistics). Prices for other food crops were taken from the Ministry of Agriculture, Economic and Marketing Division, Ghana (Government of Ghana), as well as from the Ghana Central Bureau of Statistics (Government of Ghana).
METHOD OF ANALYSIS
In the Ghanaian traditional farming system at least one food farm (field planted to food crops) is producing at all times. In practice a farmer will use five farms (fields) in a 10-year rotation, with harvesting occurring annually from either one or two farms. This study takes into account the entire rotation.
The three following cropping systems were considered, cocoa inter- cropped with plantain and cocoyam; plantain-cocoyam mix and cassava--corn (maize) mix. These cropping systems were chosen for the following reasons:
(1) Cocoa intercropped with plantain and cocoyam is the traditional way of establishing a cocoa farm.
(2) Plantain-cocoyam mix is one alternative way of utilizing land suitable for cocoa production.
(3) Cassava-corn mix is a second commonly used cropping system.
In other words, the cropping systems used in this analysis are the usual alternative ways of utilizing the same land and other resources.
The analysis is divided into three steps. The first step is an explanation of traditional farming systems in Ghana. The second step results in determining net income per acre for thirty years for each cropping system. (Thirty years was chosen for the analysis because the comparison is between perennial crops whose economic life is thirty years, and annuals whose

84 Michael Boateng, C. Brice Ratchford, Melvin Blase
economic life is one year. It would be unfair and misleading to use one to five years as a period for comparison because, in this period, the perennials have not reached their economic bearing age.) The third step is the calculation of the Net Present Value (NPV) of the cropping system considered.
RESULTS OF ANALYSIS
Utilization of land in a traditional farming system--land rotation
The land rotation system demonstrates how, in a traditional farming system, the need for a continuous family food Supply will divert resources to food production. To understand what small farmers in Ghana do with the availableland, we will explain, step by step, how a traditional food cropping system works. One farm (field) is assumed to have 2 acres since that is the amount that frequently is cleared at one time. In the initial year the farmer plants 2-5 crops in a given field. (In our study we adopted 2-3 crops in a given field.) Thus, the first year's costs are taken as fixed costs. In the second year the farmer has only one field to produce his food needs. In the third year another field is established. The new field is to provide a continuous supply of food when the first ceases to produce. In the fourth year the second field comes to bearing age and the first one is producing little. In the fifth year, the first field is fallowed for six years. A third field is established to take the place of the second field whose life will be approaching the fallow period. In the fifth year the farmer harvests from the second field.
The third field begins bearing in the sixth year at which time the yield on the second will be tapering off. The latter is fallowed in the seventh year, and the fourth is brought into production. In year seven, crops are harvested only from field three. In year eight, both three and four will be yielding, but three will be nearing fallow. In year nine, field three goes into fallow and five will be established to eventually take the place of four. Field five will not come into bearing until year ten. By then the fourth is approaching fallow.
Field four is fallowed in year eleven. At that time one is ready to come back into the picture. The procedure continues until, in our case, the stipulated thirty years are completed (Tables 1 and 2). Almost invariably, only 10 acres are utilized in one cycle of the rotation system. (This system is generally practised in the forest area where export tree crops like cocoa, coffee and cola are intercropped with food crops during the initial stages of establishment of the export crop in question. Whenever a field is fallowed, in the case of an export crop intercropping system, the fallowed field becomes a pure stand of the export crop, because, at this time, the export crop has formed a canopy and does not need any shade from the food crops.

TA
BL
E 1
L
and
Ro
tati
on
for
a T
ypic
al T
rad
itio
nal
Far
min
g S
yste
m,
Gh
ana,
19
81
Far
m i
n fa
llow
Ye
ars
of
esta
blis
hmen
t an
d fa
rms
Acr
eage
of
Acr
eage
F
arm
s R
etur
n fr
om
farm
s cr
oppe
d o
f far
ms
yiel
ding
fa
llow
at
a t
ime
yiel
ding
Tota
l la
nd
in u
se
Fal
low
ing
farm
s
F1
F2
F3
I(F
1)
2 --
--
2
2 2
Fl
3 F
2 4
2 F
1 4
4 4
F1
F /
5 F
3 4
1 F
z 6
4 4
FzF
3
7 F
4 4
2 F
3 8
4 4
F4
F 3
9
F 5
4 2
F 4
10
4 4
F4
F 5
F4
I1F
1
4 2
F 5
12
4 4
F1
F 5
F
s 13
F 2
4
2 F
t 14
4
4 F
IF:
FI
15 F
3
4 2
F 2
16
4 4
F3
F 2
F
z 17
F 4
4
2 F
3 18
4
4 F
3F4
F 3
19 F
5
4 2
F 4
20
4 4
FsF
,
m
F1
Ft
F1F
2 F
1F2
FzF
3 F
2F3
F+
F3
F+
F3
F,F
5
F4F
5
2 2 4 4 6 6 8 8 10
10
1st
cycl
e en
ds
2 2 4 4 6 6 8 8 10
10
2nd
cycl
e en
ds
F1
F1
F1F
2 F
1F2
F1F
2F3
FIF
2F
3
F2
F3
F,
F2F
3F4
F3F
4F5
F3F
4F5
F4F
sF1
F4F
sF1
F2F
sF1
F2F
sF1
F2
F3
FI
F2
F3
FI
(con
tinue
d)

Oo
TA
BL
E l
~co
ntd.
Far
m i
n Ye
ars
of
Acr
eage
of
Acr
eage
F
arm
s R
etur
n fr
om
Tot
al l
and
fall
ow
esta
blis
hmen
t /b
r~ns
crop
ped
of f
arm
s yi
eldi
ng
fall
ow
in u
se
and
farm
s at
a t
ime
yiel
ding
Fal
low
ing
farm
s
F4
21 F
, 4
2 F
s F
tFs
2 22
4
4 F
sF 1
F
IF s
2 F
s 23
F 2
4
2 F
1 F
IF 2
4
24
4 4
F2F
l F
IF 2
4
FI
25 F
3
4 2
F z
FaF
2 6
26
4 4
F2F
a F
aF z
6 F2
27
F4
4 2
F3
FaF
, 8
28
4 4
F4F
3
FaF
4 8
F3
29 F
5
4 2
F 4
FsF
4
10
30
4 4
F4F
s F
sF4
I0
3r
d cy
cle
ends
F2Fa
F4
F2F3
F4
F3F4
Fs
F3F4
Fs
FtF4
Fs
F,F4
Fs
F,F2
F5
FtF
zFs
FIF
2F
3
FIF
2F
3
g~
F =
farm
or
fiel
d, F
1 =
Far
m
1; F
2 =
Far
m 2
, et
c. F
allo
w =
lan
d th
at i
s to
rep
leni
sh l
ost
nutr
ient
s.
Not
e:
1.
Fal
low
las
ts f
or s
ix y
ears
. 2.
F
rom
yea
r 5
on,
all
farm
s fu
ncti
on e
ffec
tive
ly f
or t
wo
year
s.
3.
Alw
ays
ther
e ar
e tw
o fa
rms
fun
ctio
nin
g--
it c
ould
be
mor
e th
an t
wo,
but
in
our
anal
ysis
we
use
only
tw
o.
4.
Tot
al o
pera
ting
lan
d is
abo
ut
l0 a
cres
but
onl
y 10
acr
es a
re u
tili
zed
in o
ur c
ase.
5.
E
ach
farm
is
abou
t 2
acre
s.

TA
BL
E 2
S
umm
ary
of L
and
Rot
atio
n fo
r a
Typ
ical
Tra
diti
onal
Far
min
g Sy
stem
, Gha
na,
1981
Yea
rs
1 2
3 4
5 6
7 8
9 10
11
12
13
14
15
16
17
18
19
20
21
22
23
24
25
26
27
28
29
30
FI
F1
FI
F1
FI
F1
F2
F2
F2
F2
Fz
F2
F2
F2
Fs
F3
F3
F3
F3
F3
F3
F3
F4
F4
F4
F4
F4
F4
F4
F4
F 5
F 5
F s
F 5
F5
F5
F5
F5
F1
F1
F1
Fl
F~
F~
F2
F2
F2
F2
F3
F3
Fa
F3
F4
F4
F~
F 4
F 5
F~
F2E
F
sE
F4E
F
sE
~ F
IE
F2E
F
aE
F~F
a F
2Fa
FsF
a F
4Fa
FsF
a F
IFa
O
F4E
F
sE
~ F
IE
F2F
a F
3Fa
N
F4F
a F2
E
F3E
F4
E
FsF
a F~
Fa
F2F
a
rn
FsE
~_
. F
3Fa
~
F =
Far
m o
r fi
eld,
e.g
., F
t =
Far
m 1
; F 2
= F
arm
2, e
tc.
F2E
= F
arm
2 e
stab
lish
ed;
FsE
= F
arm
3 e
stab
lish
ed,
etc.
F
a =
In f
allo
w,
e.g.
, F~F
a =
Far
m 1
in f
allo
w.
End
of
Cyc
le =
The
fir
st f
allo
wed
far
m r
eady
to
com
e ba
ck i
nto
oper
atio
n.
OO

88 Michael Boateng, C. Brice Ratchford, Melvin Blase
Consequently, a 10-acre export crop farm is fully established in 10 years. This system is to ensure a continuous food supply for the family while waiting for the export crop to take off. In the case of a food crops intercropping system, a fallowed field is really left to recuperate from the lost nutrients for six years before it comes back into production. In the savannahs and shrubs where food crops are mainly produced, a new field is established every year instead of every other year as in the forest area. Moreover, the following years are shortened to about four years.)
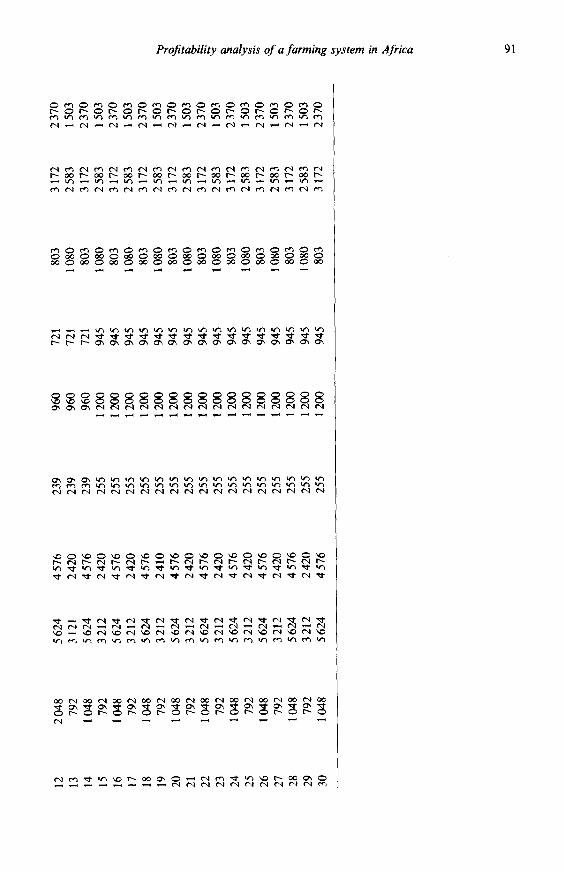
Net income estimates for traditional farming systems
In this section we will use the cropping systems discussed earlier to develop cost-benefit estimates. Gross income, expenditure and net income are calculated for three common farming systems. All costing and pricing were based on 1981 wholesale prices and the government minimum wage (Tables 3 and 4). Note that labor is the major cost of production in all systems. The results of the calculations are presented in Table 5.
Net present value estimates for selected farming systems
The Net Present Value estimates are made for the three farming systems in Table 6 according to different rates of discount. The data are also plotted in Fig. 1. Plantain--cocoyam mixed was the most profitable system, followed by the cassava--corn mixed system. Cocoa intercropped with plantain and cocoyam was clearly the least profitable, particularly when the cocoa becomes a pure stand in year 5.
TABLE 3 Summary of Costs and Man-Days in Profitability Analyses of Crops Competing with Cocoa,
Ghana, 1981
Cropping systems Average Average Average man-days~acre a total cost~acre b labor cost
¢ as % of total cost~acre (%)
Hybrid cocoa intercropped with plantain and cocoyam
Plantain and cocoyam mixed Cassava and corn mixed
23'3 324.10 80 61"0 1 076"40 75 69.3 1026.23 85
a Cost per man-day was based on the 1981 government minimum wage of ¢12"00. b 2-75 Cedis = $1.

TABLE 4 Estimated Yield Per Acre and Prices Received for Selected Crop Enterprises in Ghana, 1981
(In Loads)
Year Mixed plantain Mixed cocoa, plantain Mixed maize and cocoyam and cocoyam (corn) and cassava
Plantain Cocoyam Cocoa Plantain Cocoyam Maize Cassava
1 . . . . . 24
2 50.0 57'0 - - 50 38 - - 120'0
3 23 '0 14.5 - - 35 15 12 39'0
4 37"0 37"0 2 17 6 - - 67"5
5 28-5 14'5 3 - - - - 12 39-9
6 37.0 37"0 4 - - - - - - 67"5
7 28.5 14"5 8 - - - - 12 39"0
8 37.0 37-0 8 - - - - - - 67"5
9 28.5 14'5 8 - - - - 12 39"0
10 37.0 37'0 8 - - - - - - 67"5
11 28.5 14"5 8 - - - - 12 39-0
12 37-0 37'0 8 - - - - - - 67.5
13 28.5 14'5 8 - - - - 12 39'0
14 37.0 37"0 8 - - - - - - 67'5
15 28'5 24-5 10 - - - - 12 39-0
16 37.0 37"0 10 - - - - - - 67"5
17 28.5 14'5 10 - - - - 12 39"0
18 37.0 37"0 10 - - - - - - 67"5
19 28.5 14.5 10 - - - - 12 39"0
20 37'0 37'0 10 - - - - - - 67'5
21 28.5 14-5 10 - - - - 12 39'0
22 37.0 37-0 10 - - - - - - 67,5
23 28"5 14"5 10 - - - - 12 39'0
24 37"0 37"0 10 - - - - - - 67.5
25 18.5 14"5 10 - - - - 12 39.0
26 37.0 37-0 10 - - - - - - 67-5
27 28"5 14'5 10 - - - - - - 39.0
28 37.0 37"0 10 - - - - - - 67.5
29 28.5 14'5 10 - - - - 12 39-0
30 37.0 37-0 10 - - - - - - 67.5
Pr ice ¢ 72 80 120 72 80 62.5 47
Source : M i n i s t r y o f A g r i c u l t u r e - - v a r i o u s d iv i s ions , 1981.
No te : Pr ice is per l o a d a n d pr ices based on the 1981 price. Al l f igures in l oads specif ied be low:
1. I t is a s s u m e d t h a t a l o a d o f p l a n t a i n c o n t a i n s a b o u t four b u n c h e s a n d e a c h b u n c h sells for
¢18 (1981 price). Pr ice pe r load is ¢18 × 3 =¢72 .0 .
2. T h e r e a re t h r ee l o a d s in a b a g o f 200 Ib c o c o y a m E a c h b a g sells for ¢240. T h e r e f o r e pr ice
pe r l o a d is 240 - 3 = ¢80.
3. T h e r e a re t h r ee l o a d s o f c a s s a v a in a 200 lb ba g a n d one bag sells for ¢140. There fore , one
load is 140 + 3 = ¢47.
4. T h e r e are f o u r l o a d s in a b a g o f m a i z e (corn) a n d a bag o f m a i z e sells for ¢250 (1981 price).
T h e r e f o r e pr ice pe r l o a d is ¢250 ÷ 4 = ¢62.50.
5. C o c o a p r i ce is a d m i n i s t e r e d . In 1980-81 c o c o a was so ld for ¢120 a l o a d o f 3 0 k g 166 lbs).

TA
BL
E
5 N
et B
enef
it fo
r A
lter
nati
ve C
rop
pin
g S
yste
ms
in G
han
a, 1
981
t~
Year
M
ixed
pla
ntai
n an
d co
coya
m
Coc
oa i
nter
crop
ped
wit
h pl
anta
in a
nd c
ocoy
am
Mix
ed c
orn
and
cass
ava
Exp
endi
ture
G
ross
N
et
(¢)
inco
me
inco
me
(¢)
(¢)
Exp
endi
ture
(¢
) G
ross
in
com
e (¢
)
Net
in
com
e (¢
)
Exp
endi
ture
(¢
) G
ross
in
com
e (¢
)
Net
in
com
e (¢
)
1 1
053
--
2 1
147
8 16
0 3
1074
2
816
4 1 0
48
5 41
4 5
792
3 21
2 6
1 94
8 5
624
7 79
2 3
212
8 10
48
5 62
4 9
792
3 21
2 10
1
048
5 62
4 11
79
2 3
212
- 1
053
6713
1
742
4 57
6 2
420
4 57
6 2
420
4 57
6 2
420
4 57
6 2
420
1 16
7 1
219
804
505
218
225
239
239
239
239
239
6 08
0 3
720
1 94
4 36
0 48
0 96
0 96
0 96
0 96
0 96
0
-- 1
168
4
861
2916
14
39
142
255
721
721
721
721
721
1 20
3 1
347
1080
80
3 1
080
803
1080
80
3 1
080
803
1 08
0
1 50
0 56
40
2 58
3 3
172
2 58
3 3
172
2 58
3 3
172
2 58
3 3
172
2 58
3
297
4 29
3 1
503
2 37
0 1
530
2 37
0 1
503
1 37
0 1
503
2 37
0 1
503
Profitability analysis of a farming system in Africa 91

92 Michael Boateng, C. Brice Ratchford, Melvin Blase
Fig. 1.
40
3 5 - cocoyam mixed
A 3 0 -
ii ~3 p . &
25
,m_ Corn-cassava \ ° \ ue \ ~ i x e d
O°o 20 ~ \ \ \ ~
._c
_= 15- 0~ >
5 - Cocoa intercropped ~ .
0 I I I I I i I 8, 10 12 15 20 25 30
Discount rates
Profitability analysis of crops competing with cocoa at the study area--Ghana, 1981.
TABLE 6 Net Present Value (On Per Acre Basis) of Selected Cropping Systems of Crops Competing
with Cocoa in the Survey Area, Ghana, 1981
Rate of Net income for 30 years for selected farming systems discount
(%) Plantain and Cocoa intercropped Cassava-corn mixed cocoyam mixed ¢ ¢
¢
0 101921 29323 58812 8 36875 12170 22302
I0 30327 10475 18 710 12 25653 9194 16013 15 20457 7 773 13070 20 14954 5273 9910 25 11574 5164 7933 30 9230 4853 6587

Profitability analysis of a farming system in Africa 93
R E F E R E N C E S
Adegboye, R. O. (1974). Land tenure problems and improved practices. In: Economics of cocoa production and marketing, the Institute of Statistical Social and Economic Research (ISSER), University of Ghana, Legon.
Dapaah, S. K. (1982). Price incentive and revitalization of the declining Ghanaian cocoa industry--A multiperiod linear programming-risk simulation approach. A PhD thesis presented to the Faculty of Graduate Studies of the University of Guelph, Canada.
Eckstein, Otto (1968). Water resource development: The economics of project evaluation. (4th edn) Harvard University Press, Cambridge, Massachusetts, USA.
Ghana Cocoa Marketing Board (1981). Research Development Unpublished Statistics of Cocoa Production for the various years.
Government of Ghana (GOG). Ministry of Agriculture, Cocoa Division, various files on replanting scheme, and annual budgets, Accra, Ghana.
Government of Ghana (GOG). Ministry of Agriculture: Economics and Marketing Division, various files on marketing crops.
Government of Ghana (GOG). Central Bureau of Statistics, Accra, Ghana. Various files and publications on wholesale prices and minimum wages.
Killick, Tony (1966). Economics of cocoa. In: A study of contemporary Ghana Vol. 1--The economy of Ghana. Northwestern University Press, Evanston.
LaAnyane, S. (1972). The Ghana cocoa industry. In: Cocoa Growers Bulletin No. 19, 1972.
Nyanteng, V. K. (1980). The declining Ghana cocoa industry: An analysis of some fundamental problems. ISSER, University of Ghana, Legon. Technical Publication Series No. 40, 1980.
Obayemi, J. K. (1973). Cost and returns to cocoa and alternative crops in Western Nigeria. In: Economics of cocoa production and marketing, ISSER, University of Ghana, Legon, 1974.
Paterson, John H. (1972). Land work and resources--An introduction to economic geography, London, Edward Arnold.
Polly Hill (1970). Studies in rural capitalism in West Africa, Cambridge University Press, Cambridge.
Rourke, B. E. (1972). Profitability of cocoa and alternative crops in the Eastern Region of Ghana. In: Economics of cocoa production and marketing, ISSER, Legon, Ghana, 1974.
Saleh, Abdullah A. (1975). Disincentives to agricultural production in developing countries: A policy survey, Foreign Agriculture USDA Foreign Agricultural Service, Washington, DC. Supplementary Research.
Singleton, Seth F. & Stingier, John (1971). Africa in perspective, New York Hayden Book Company.
Wood, G. A. R. (1974). Some aspects of cocoa production costs on plantations. In: Economics of cocoa production and marketing, ISSER, University of Ghana, Legon.
World Bank (1973). Compounding and discounting tables for project evaluation, Economic Development Institute, International Bank for Reconstruction and Development, Washington, DC.