Economic Review of the Massachusetts Child Support ...
66
The information and opinions contained in this report are those of the authors exclusively and do not represent the views or positions of the Office of Court Management or the 2012 Child Support Guidelines Task Force. © 2013. All Rights Reserved. Economic Review of the Massachusetts Child Support Guidelines Submitted to: Commonwealth of Massachusetts Office of Court Management Child Support Guidelines Task Force 2 Center Plaza, Suite 540 Boston, MA 02108 Submitted by: Mark A. Sarro, Ph.D. The Brattle Group, Inc. R. Mark Rogers Rogers Economics, Inc. June 2013
-
Upload
khangminh22 -
Category
Documents
-
view
0 -
download
0
Transcript of Economic Review of the Massachusetts Child Support ...
The information and opinions contained in this report are those of the authors exclusively and do not represent the views or positions of the Office of Court Management or the 2012 Child Support Guidelines Task Force. © 2013. All Rights Reserved.
Economic Review of the Massachusetts Child Support Guidelines
Submitted to:
Commonwealth of Massachusetts Office of Court Management
Child Support Guidelines Task Force
2 Center Plaza, Suite 540 Boston, MA 02108
Submitted by:
Mark A. Sarro, Ph.D. The Brattle Group, Inc.
R. Mark Rogers Rogers Economics, Inc.
June 2013
i
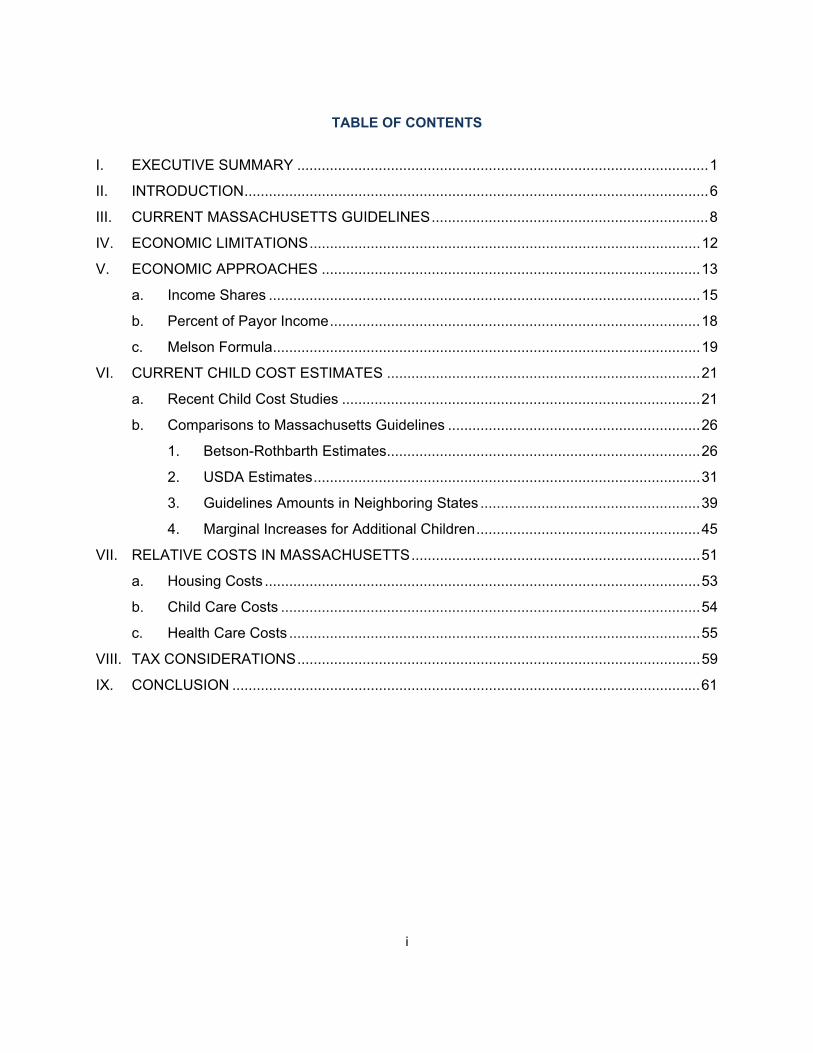
TABLE OF CONTENTS
I. EXECUTIVE SUMMARY ..................................................................................................... 1
II. INTRODUCTION .................................................................................................................. 6
III. CURRENT MASSACHUSETTS GUIDELINES .................................................................... 8
IV. ECONOMIC LIMITATIONS ................................................................................................ 12
V. ECONOMIC APPROACHES ............................................................................................. 13
a. Income Shares .......................................................................................................... 15
b. Percent of Payor Income ........................................................................................... 18
c. Melson Formula ......................................................................................................... 19
VI. CURRENT CHILD COST ESTIMATES ............................................................................. 21
a. Recent Child Cost Studies ........................................................................................ 21
b. Comparisons to Massachusetts Guidelines .............................................................. 26
1. Betson-Rothbarth Estimates ............................................................................. 26
2. USDA Estimates ............................................................................................... 31
3. Guidelines Amounts in Neighboring States ...................................................... 39
4. Marginal Increases for Additional Children ....................................................... 45
VII. RELATIVE COSTS IN MASSACHUSETTS ....................................................................... 51
a. Housing Costs ........................................................................................................... 53
b. Child Care Costs ....................................................................................................... 54
c. Health Care Costs ..................................................................................................... 55
VIII. TAX CONSIDERATIONS ................................................................................................... 59
IX. CONCLUSION ................................................................................................................... 61
ii
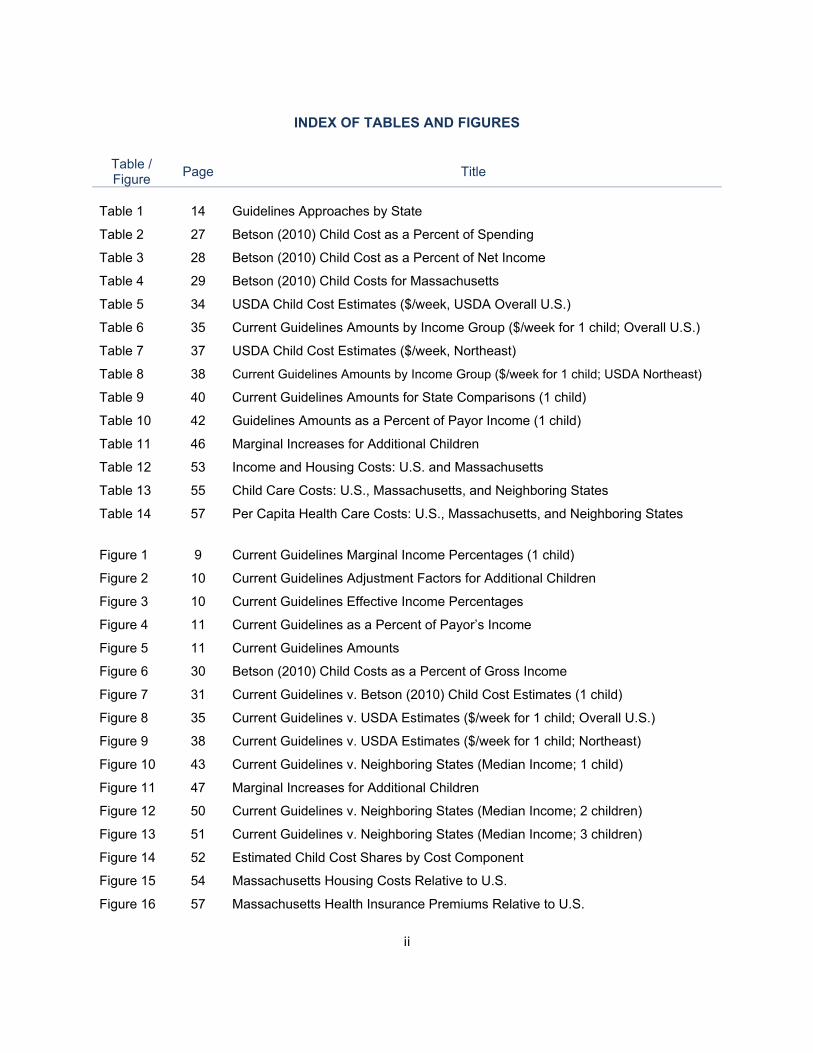
INDEX OF TABLES AND FIGURES
Table / Figure
Page Title
Table 1 14 Guidelines Approaches by State
Table 2 27 Betson (2010) Child Cost as a Percent of Spending
Table 3 28 Betson (2010) Child Cost as a Percent of Net Income
Table 4 29 Betson (2010) Child Costs for Massachusetts
Table 5 34 USDA Child Cost Estimates ($/week, USDA Overall U.S.)
Table 6 35 Current Guidelines Amounts by Income Group ($/week for 1 child; Overall U.S.)
Table 7 37 USDA Child Cost Estimates ($/week, Northeast)
Table 8 38 Current Guidelines Amounts by Income Group ($/week for 1 child; USDA Northeast)
Table 9 40 Current Guidelines Amounts for State Comparisons (1 child)
Table 10 42 Guidelines Amounts as a Percent of Payor Income (1 child)
Table 11 46 Marginal Increases for Additional Children
Table 12 53 Income and Housing Costs: U.S. and Massachusetts
Table 13 55 Child Care Costs: U.S., Massachusetts, and Neighboring States
Table 14 57 Per Capita Health Care Costs: U.S., Massachusetts, and Neighboring States
Figure 1 9 Current Guidelines Marginal Income Percentages (1 child)
Figure 2 10 Current Guidelines Adjustment Factors for Additional Children
Figure 3 10 Current Guidelines Effective Income Percentages
Figure 4 11 Current Guidelines as a Percent of Payor’s Income
Figure 5 11 Current Guidelines Amounts
Figure 6 30 Betson (2010) Child Costs as a Percent of Gross Income
Figure 7 31 Current Guidelines v. Betson (2010) Child Cost Estimates (1 child)
Figure 8 35 Current Guidelines v. USDA Estimates ($/week for 1 child; Overall U.S.)
Figure 9 38 Current Guidelines v. USDA Estimates ($/week for 1 child; Northeast)
Figure 10 43 Current Guidelines v. Neighboring States (Median Income; 1 child)
Figure 11 47 Marginal Increases for Additional Children
Figure 12 50 Current Guidelines v. Neighboring States (Median Income; 2 children)
Figure 13 51 Current Guidelines v. Neighboring States (Median Income; 3 children)
Figure 14 52 Estimated Child Cost Shares by Cost Component
Figure 15 54 Massachusetts Housing Costs Relative to U.S.
Figure 16 57 Massachusetts Health Insurance Premiums Relative to U.S.
1
I. EXECUTIVE SUMMARY
The Commonwealth of Massachusetts Office of the Chief Justice of the Trial Court asked us to
provide analysis for the 2012 Massachusetts Child Support Task Force on economic issues as they
relate to the current Massachusetts Child Support Guidelines, effective January 1, 2009.
Child support amounts under the Guidelines are presumptive in the absence of specific findings to
the contrary. Therefore, it is important to continually evaluate both the structure and results of the
Guidelines relative to fundamental economic principles and standard economic benchmarks.
Most states base their child support guidelines, to some extent, on specific economic studies.
However, the most widely used studies do not measure actual direct spending on children and are
based on national data. Most child costs are not directly observable, but rather are indirect costs
shared by adults and children in a household, such as housing and food. Therefore, the available
economic data are estimates with theoretical and practical limitations, and the resulting child cost
estimates are informative and important to consider, but they are not determinative.
The current Massachusetts Guidelines are based, in part, on a review by a prior Task Force of so-
called Income Shares estimates. The Income Shares approach uses a child’s share of a
household’s combined income to measure child costs. The term “income shares” refers to the share
of household income required to cover child-related costs in a household, not the sharing of those
costs between parents. This report explains both the Income Shares approach in theory and the
empirical methodology used to implement it in practice. The report also discusses other approaches
used to estimate child costs, as well as child cost benchmarks.
Specifically, we compare the current Massachusetts Guidelines amounts to three estimates of child
costs as benchmarks: (1) current estimates using the Income Shares approach, (2) estimates from
the U.S. Department of Agriculture (USDA), and (3) guidelines amounts in the five neighboring
states (Connecticut, New Hampshire, New York, Rhode Island and Vermont). First, we compare the
2
Guidelines amounts for one child to each of the benchmarks, and then we compare the amounts for
two and three children.1 We find the current Guidelines amounts for one child are lower than the
benchmark amounts at the very low-income range and are higher than the benchmarks, to varying
degrees, as income increases.
Over the full range of incomes in the Massachusetts Guidelines Chart, the combined child support
amounts for one child range from $18 per week to $915 per week, and are $295 per week at the
current Massachusetts median income level. By comparison, current Income Shares estimates of
child costs, excluding child care and extraordinary medical expenses, range from $24 per week at
the lowest income levels to $342 at the highest income levels, and are $185 per week at median
household income. So the Massachusetts Guidelines amounts, while lower than the Income Shares
estimates at very low incomes (less than $165 per week), are higher at middle and high incomes.
For two and three children, the same is true at incomes above $342 per week and $774 per week,
respectively. While the combined amounts from the Guidelines Chart are the right basis of
comparison to the Income Shares estimates, how much of the combined amount ultimately becomes
a payor’s child support obligation in Massachusetts depends on the payor’s relative share of
combined available income.
Likewise, the current Guidelines amounts for one, two, and three children are lower than or
equivalent to the USDA national estimates at low incomes and higher at middle and high incomes,
both in dollars and as a percentage of income. The USDA estimates of child costs for one child,
again excluding child care and health care costs, range, by income level, from $175 to $373 per
week for married households, and from $168 to $328 per week for single-headed households,
averaging $256 per week. For the same income groups, the current Guidelines amounts are lower
than USDA at low incomes and higher than USDA at middle and high incomes. The corresponding
1 Our comparisons stop at three children due to data limitations. For example, the standard benchmarks have
sample sizes that are statistically valid only up to three children, and USDA estimates are available only up to three children.
3
USDA estimates for the Northeast U.S. are 10 percent higher, ranging from $193 to $410 per week,
and averaging $286 per week, for married households with one child. As with the national USDA
estimates, the current Guidelines amounts are lower or equivalent at low incomes and higher at
middle and high incomes.
The Massachusetts Guidelines amounts for one child also are higher at most income levels than the
five neighboring states (Connecticut, New Hampshire, New York, Rhode Island, and Vermont). Only
in cases of very low-income payors (e.g., less than $20,000 per year) paired with middle- to high-
income recipients (e.g., $60,000 per year or more) are the Massachusetts amounts sometimes less
than neighboring states. Otherwise, the current Guidelines amounts for one child are higher on a
state-by-state basis by as little as 8 percent, and by more than 50 percent on average.
For simplicity, most of our comparisons assume no child care costs or health care costs, since the
amounts of such costs vary widely across cases and they are handled differently in guidelines
across states and in the sources of economic data available for the Task Force to consider as child
cost benchmarks. To that extent, our calculations may overstate the differences in child support
amounts between Massachusetts and neighboring states. Of all neighboring states, the Guidelines
amounts for one child are most similar to New Hampshire: lower by at least 3 percent for low-income
payors (e.g., $20,000 per year or less) paired with middle- to high-income recipients (e.g., $60,000
per year or more), and otherwise higher by at least 8 percent over the full range of recipient income.
While the Massachusetts Guidelines amounts for one child are mostly higher than the child cost
benchmarks, the adjustment factors for additional children listed in Table B of the Guidelines are
lower. These marginal adjustment factors apply some multiple to the Guidelines amounts for one
child (from Table A or the Guidelines Chart) in order to account for the additional incremental cost of
having an additional child in a household, up to five children in total. The marginal adjustments in
the current Guidelines (20 percent for a second child and an additional 6 percent, 4 percent and 2
percent for each additional child) are below the entire range of adjustments for any number of
4
children and any benchmark. On average, the benchmark marginal adjustments are 47 percent for
a second child, and 18 percent, 12 percent, and 13 percent, for each additional child up to five
children, or two to six times the Massachusetts adjustments.
As a result, the Massachusetts Guidelines amounts for more than one child are lower than the
benchmarks in more cases. They are lower than the Income Shares estimates, for example, at
relatively low income levels (e.g., at combined incomes of less than $342 per week for two children,
and less than $774 per week for three children). They also are lower than both the USDA national
and Northeast estimates at low incomes, but are higher at middle and high incomes. For two
children, the Guidelines amounts are 22 and 29 percent lower than USDA national and Northeast
estimates, respectively, for the low-income group. For three children, they are 30 and 36 percent
lower at low incomes, and within 10 percent at middle incomes. The Guidelines amounts for more
than one child are closer to the guidelines amounts in neighboring states, but they are still higher in
most cases. The Guidelines amounts are lower than neighboring states for low-income payors
paired with high-income recipients and otherwise higher, but by less than the differences in the
amounts for one child.
The economic evidence, alone, in the three comparisons we performed does not explain the
differences we observe between Massachusetts and each of the child cost benchmarks. However,
there is empirical evidence that both incomes and expenses in Massachusetts are relatively high.
Median income, as well as all of the largest components of household spending (e.g., housing, child
care and education, and health care) are higher in Massachusetts than in the U.S. overall. Median
household income (currently $62,859 per year) is 25 percent higher; home ownership costs ($2,042
per month) are 10 percent higher; child care costs for young children ($224 to $288 per week) are 10
to 20 percent higher; and health care costs (e.g., $93 per week for a single premium and $265 per
week for a family premium) are 10 to 12 percent higher than the national average. Higher incomes
and household costs in Massachusetts might indicate higher child costs as well. Not all households
in Massachusetts have higher incomes, however, while all households do face the state’s higher

5
cost of living. Therefore, household costs in Massachusetts may be disproportionately high relative
to income for some households. To the extent higher overall costs tend to crowd out spending on
other things, certain types of spending on children may be lower. To the extent, however, that
higher costs overall in Massachusetts reflect higher child costs, it may be appropriate for the
Massachusetts Guidelines amounts also to be higher than some benchmarks. No studies have
specifically analyzed whether a higher cost of living crowds out spending on children or whether
higher local costs lead to higher child costs.
* * *
6
II. INTRODUCTION
The 2012 Massachusetts Child Support Task Force formed by the Chief Justice of the Trial Court
has asked us to assist as economic consultants in its review of the Massachusetts Child Support
Guidelines. As part of its review, the Task Force asked us to provide background, data and analysis
on economic issues relating to the Guidelines. This report summarizes that information. In addition
to preparing this report, we reviewed and considered comments the Task Force received at a series
of public forums. We also attended Task Force meetings in a consulting capacity, where we
presented the data and information in this report to the Task Force, responded to questions of an
economic nature, and assisted the Task Force in performing calculations over thousands of
hypothetical fact patterns under the current Guidelines and alternative formulas and percentage
tables.
In order to receive federal funds for child support enforcement, Federal law requires each state to
review its child support guidelines at least every four years to assure their application results in
appropriate child support amounts.2 Massachusetts’ current Guidelines took effect on January 1,
2009,3 so the present Task Force review is being done within this federally mandated four-year
window. As a matter of economics, this requirement is not a mere formality. It is important for
children to have adequate financial support, ideally by both parents in an economically efficient and
equitable proportion. Child support amounts under the Guidelines are presumptive in the absence of
specific findings explaining why applying the presumptive amount would be unjust or inappropriate in
a particular case.4 Therefore, it is especially important to evaluate both the structure and results of
the Guidelines amounts relative to the best available indicators of actual child costs in
Massachusetts, and other economic benchmarks on the cost of raising children.
2 42 U.S.C. sec. 667; accord 45 CFR 302.56 (e). 3 See, Child Support Guidelines, The Commonwealth of Massachusetts Administrative Office of the Trial Court,
January 1, 2009 at http://www.mass.gov/courts/childsupport/guidelines.pdf. 4 45 CFR 302.56 (f).
7
Since the amounts under the Guidelines are presumed to be appropriate, there should be a clear
relationship between them and the information underlying that presumption (e.g., economic studies,
policy principles, etc.). An economic presumption should have a sound theoretical and empirical
basis that can be evaluated and applied in practice. To that end, in addition to requiring child
support guidelines to be reviewed at least every four years, federal law requires guidelines to be
developed only after considering economic data on child costs:
As part of the review of a State's guidelines required under paragraph (e) of this
section, a State must consider economic data on the cost of raising children and
analyze case data, gathered through sampling or other methods, on the
application of, and deviations from the guidelines.5
The Task Force asked us to assist it in reviewing and evaluating the available current economic data
on child costs. That is the focus of this report. Specifically, we provided the Task Force with data,
analysis, and information regarding:
(1) the economic approaches used to estimate child costs;
(2) current estimates of child costs from economic studies and data sources;
(3) how the structure and results of the Guidelines amounts compare to other states,
especially states neighboring Massachusetts; and
(4) alternative child support amounts under different formulas and percentage tables for
various hypothetical fact patterns, to understand the potential impact of changes to the
Guidelines.
This report summarizes the information we provided to the Task Force on each of the first three
items listed above. It does not address the fourth item. Based in part on this information, as of the
time of writing this report, the Task Force was still preparing its recommendations and report on
what, if any, changes to the current Guidelines it recommends. Therefore, this report does not
5 45 CFR 302.56 (h).
8
anticipate or evaluate any specific recommendations of the Task Force. It simply lays out economic
principles, facts, and comparisons to help inform any such recommendations.
III. CURRENT MASSACHUSETTS GUIDELINES
The current Massachusetts Guidelines are based on a comprehensive review by a prior Task Force
over a two-year period in 2007 and 2008.6 Its review included detailed examination of the
assumptions, principles, and formulas underlying the Guidelines at the time. The Task Force’s
recommendations resulted in significant changes to the Guidelines for the first time in the 20 years
since Massachusetts first revised its initial Guidelines in January 1989.7 These changes are
reflected in the percentages and multipliers listed in Tables A and B on the current Guidelines
Worksheet, respectively. Table A on the Worksheet lists the marginal percentages of combined
income used to determine the amount of child support for one child as income increases up to
$250,000 per year. Each marginal percentage represents the share of incremental combined
available income used to calculate the total child support amount. The resulting child support
amount thus reflects the income-weighted average of the series of marginal percentages up to the
actual amount of combined available income in a particular case. The marginal percentages range
in an arc from 21 percent of combined income at the lowest levels, to 26 percent of incremental
income (between $321 and $500 per week), and gradually declining to 15 percent at the highest
income levels (above $3,500 per week). The resulting effective (i.e., weighted average) percentages
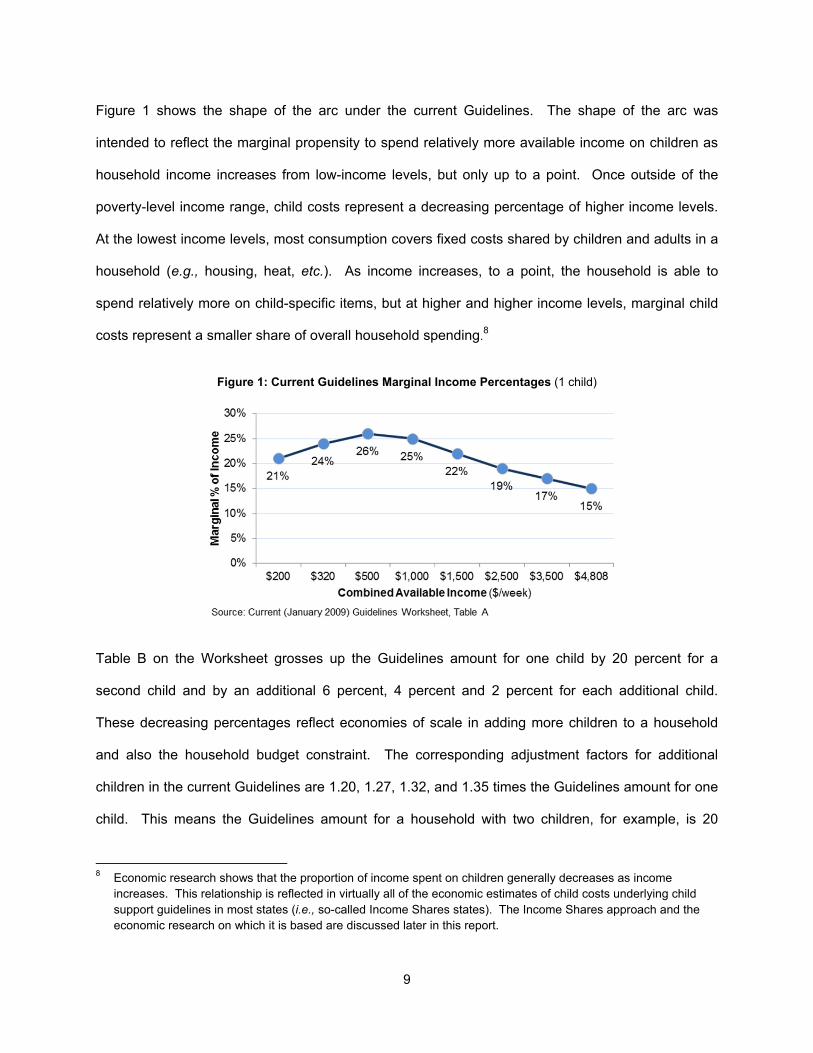
range from a minimum of 18 percent of combined income to as high as 25 percent.
6 The prior Task Force first met on October 31, 2006. Its review culminated in a detailed report, “Report of the Child
Support Guidelines Task Force” (http://www.mass.gov/courts/childsupport/task-force-report.pdf), and a minority report (http://www.mass.gov/courts/childsupport/minority-report.pdf), both in October 2008. Dr. Sarro was a member of the prior Task Force.
7 Under federal law, (42 U.S.C. sec. 667), each state had to establish advisory child support guidelines by October 1, 1987, and presumptive guidelines by October 13, 1989. Massachusetts issued interim guidelines in May 1987, to which it made minor changes four times (in 1989, 1994, 1998, and 2002). The 2009 Guidelines represented a fundamental shift toward the Income Shares approach described in Section V.
9
Figure 1 shows the shape of the arc under the current Guidelines. The shape of the arc was
intended to reflect the marginal propensity to spend relatively more available income on children as
household income increases from low-income levels, but only up to a point. Once outside of the
poverty-level income range, child costs represent a decreasing percentage of higher income levels.
At the lowest income levels, most consumption covers fixed costs shared by children and adults in a
household (e.g., housing, heat, etc.). As income increases, to a point, the household is able to
spend relatively more on child-specific items, but at higher and higher income levels, marginal child
costs represent a smaller share of overall household spending.8
Figure 1: Current Guidelines Marginal Income Percentages (1 child)
Table B on the Worksheet grosses up the Guidelines amount for one child by 20 percent for a
second child and by an additional 6 percent, 4 percent and 2 percent for each additional child.
These decreasing percentages reflect economies of scale in adding more children to a household
and also the household budget constraint. The corresponding adjustment factors for additional
children in the current Guidelines are 1.20, 1.27, 1.32, and 1.35 times the Guidelines amount for one
child. This means the Guidelines amount for a household with two children, for example, is 20
8 Economic research shows that the proportion of income spent on children generally decreases as income
increases. This relationship is reflected in virtually all of the economic estimates of child costs underlying child support guidelines in most states (i.e., so-called Income Shares states). The Income Shares approach and the economic research on which it is based are discussed later in this report.
10
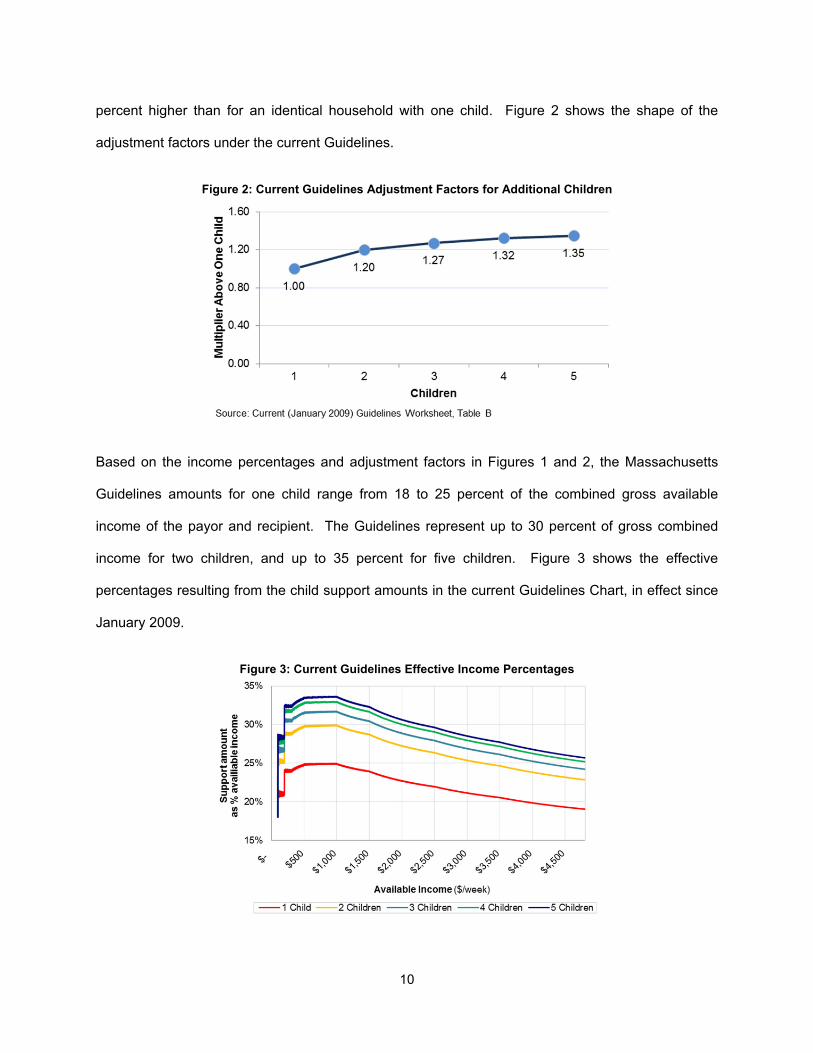
percent higher than for an identical household with one child. Figure 2 shows the shape of the
adjustment factors under the current Guidelines.
Figure 2: Current Guidelines Adjustment Factors for Additional Children
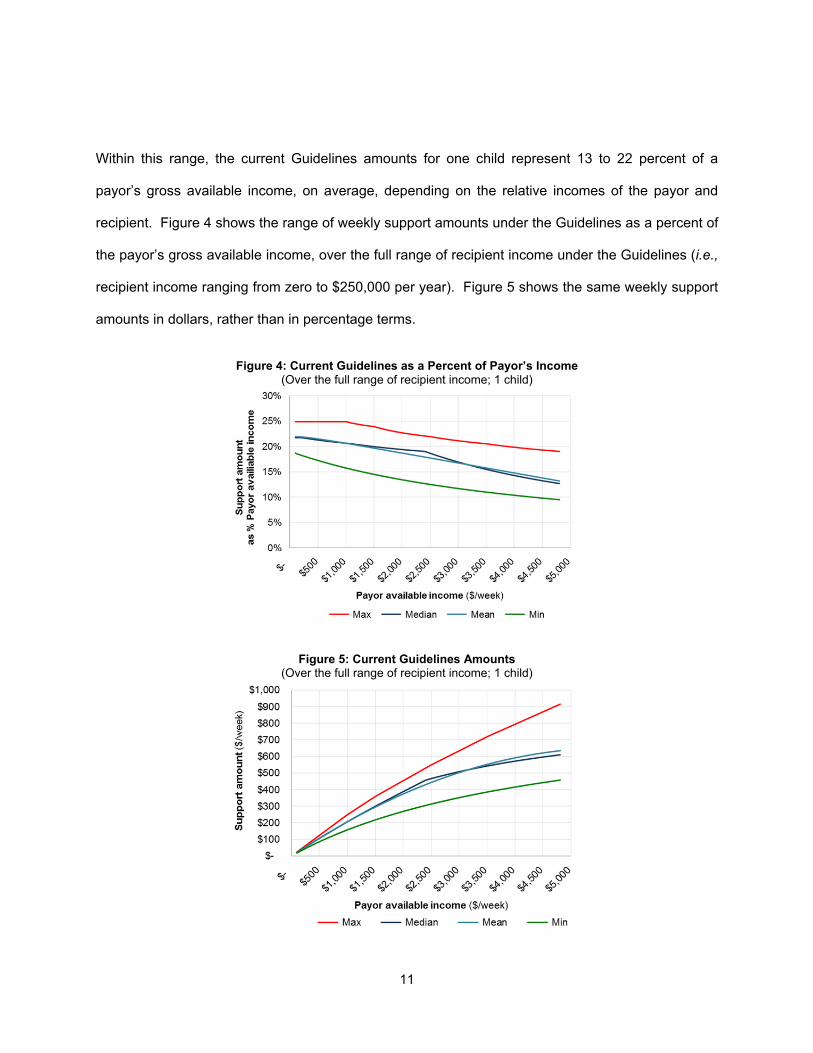
Based on the income percentages and adjustment factors in Figures 1 and 2, the Massachusetts
Guidelines amounts for one child range from 18 to 25 percent of the combined gross available
income of the payor and recipient. The Guidelines represent up to 30 percent of gross combined
income for two children, and up to 35 percent for five children. Figure 3 shows the effective
percentages resulting from the child support amounts in the current Guidelines Chart, in effect since
January 2009.
Figure 3: Current Guidelines Effective Income Percentages
11
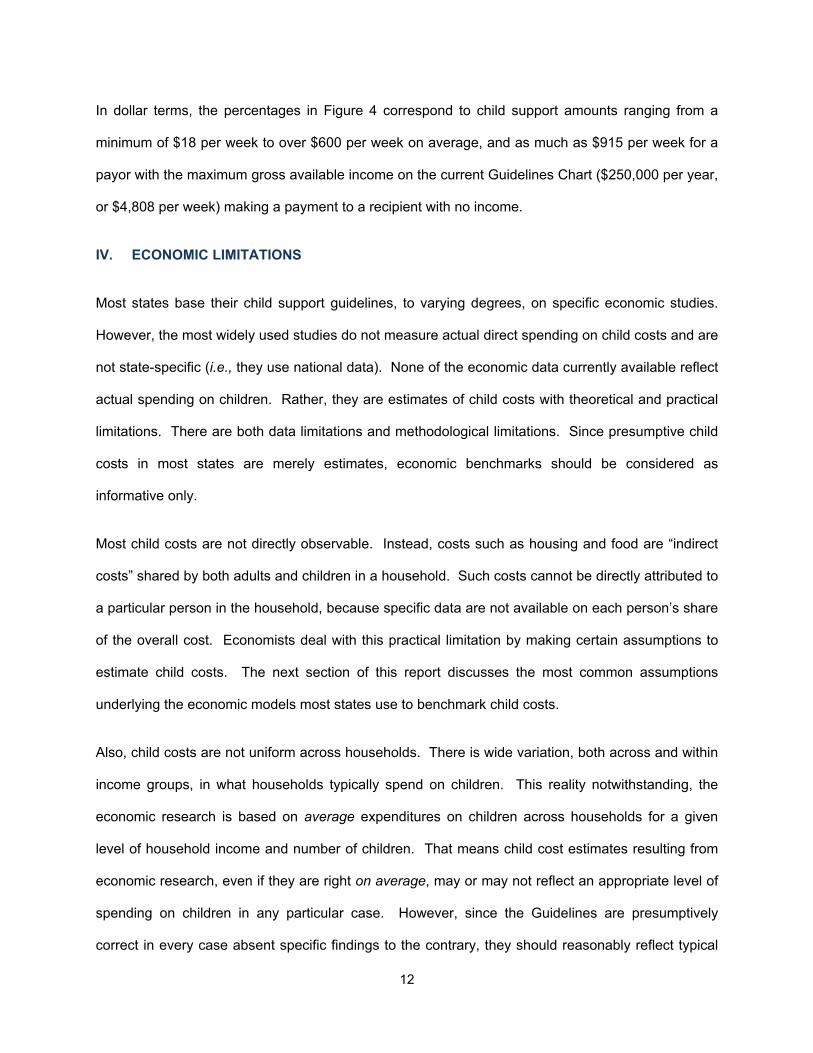
Within this range, the current Guidelines amounts for one child represent 13 to 22 percent of a
payor’s gross available income, on average, depending on the relative incomes of the payor and
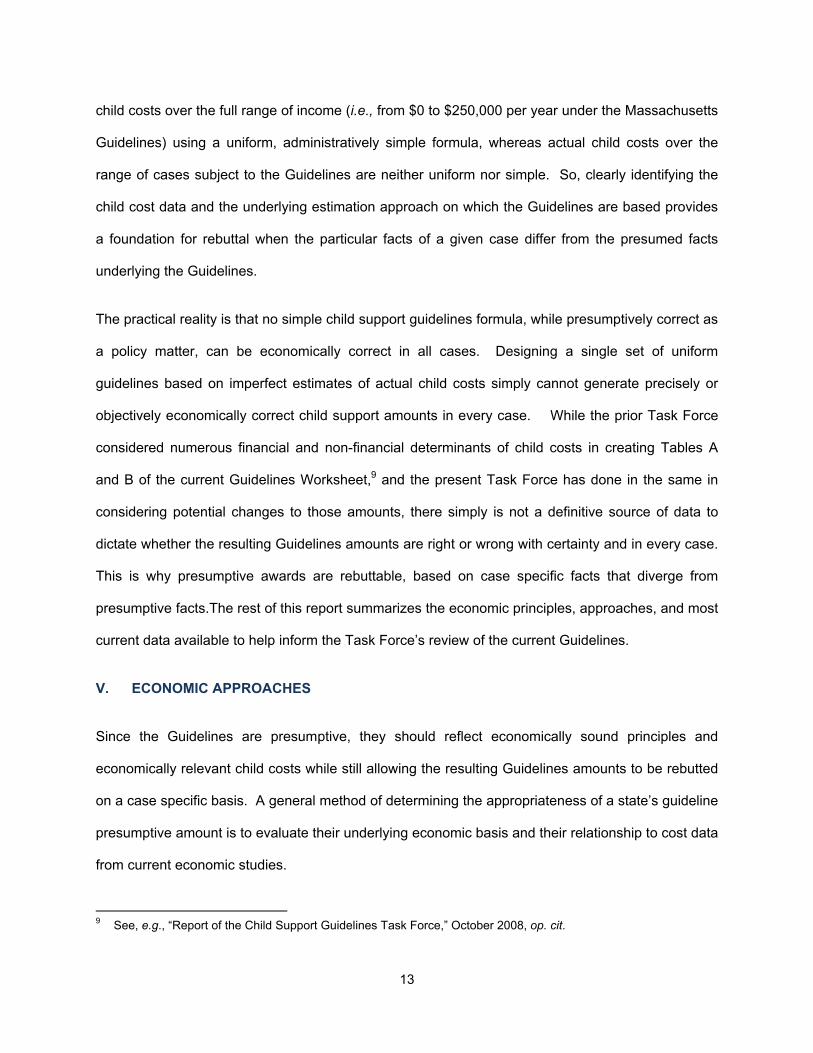
recipient. Figure 4 shows the range of weekly support amounts under the Guidelines as a percent of
the payor’s gross available income, over the full range of recipient income under the Guidelines (i.e.,
recipient income ranging from zero to $250,000 per year). Figure 5 shows the same weekly support
amounts in dollars, rather than in percentage terms.
Figure 4: Current Guidelines as a Percent of Payor’s Income (Over the full range of recipient income; 1 child)
Figure 5: Current Guidelines Amounts (Over the full range of recipient income; 1 child)
12
In dollar terms, the percentages in Figure 4 correspond to child support amounts ranging from a
minimum of $18 per week to over $600 per week on average, and as much as $915 per week for a
payor with the maximum gross available income on the current Guidelines Chart ($250,000 per year,
or $4,808 per week) making a payment to a recipient with no income.
IV. ECONOMIC LIMITATIONS
Most states base their child support guidelines, to varying degrees, on specific economic studies.
However, the most widely used studies do not measure actual direct spending on child costs and are
not state-specific (i.e., they use national data). None of the economic data currently available reflect
actual spending on children. Rather, they are estimates of child costs with theoretical and practical
limitations. There are both data limitations and methodological limitations. Since presumptive child
costs in most states are merely estimates, economic benchmarks should be considered as
informative only.
Most child costs are not directly observable. Instead, costs such as housing and food are “indirect
costs” shared by both adults and children in a household. Such costs cannot be directly attributed to
a particular person in the household, because specific data are not available on each person’s share
of the overall cost. Economists deal with this practical limitation by making certain assumptions to
estimate child costs. The next section of this report discusses the most common assumptions
underlying the economic models most states use to benchmark child costs.
Also, child costs are not uniform across households. There is wide variation, both across and within
income groups, in what households typically spend on children. This reality notwithstanding, the
economic research is based on average expenditures on children across households for a given
level of household income and number of children. That means child cost estimates resulting from
economic research, even if they are right on average, may or may not reflect an appropriate level of
spending on children in any particular case. However, since the Guidelines are presumptively
correct in every case absent specific findings to the contrary, they should reasonably reflect typical
13
child costs over the full range of income (i.e., from $0 to $250,000 per year under the Massachusetts
Guidelines) using a uniform, administratively simple formula, whereas actual child costs over the
range of cases subject to the Guidelines are neither uniform nor simple. So, clearly identifying the
child cost data and the underlying estimation approach on which the Guidelines are based provides
a foundation for rebuttal when the particular facts of a given case differ from the presumed facts
underlying the Guidelines.
The practical reality is that no simple child support guidelines formula, while presumptively correct as
a policy matter, can be economically correct in all cases. Designing a single set of uniform
guidelines based on imperfect estimates of actual child costs simply cannot generate precisely or
objectively economically correct child support amounts in every case. While the prior Task Force
considered numerous financial and non-financial determinants of child costs in creating Tables A
and B of the current Guidelines Worksheet,9 and the present Task Force has done in the same in
considering potential changes to those amounts, there simply is not a definitive source of data to
dictate whether the resulting Guidelines amounts are right or wrong with certainty and in every case.
This is why presumptive awards are rebuttable, based on case specific facts that diverge from
presumptive facts.The rest of this report summarizes the economic principles, approaches, and most
current data available to help inform the Task Force’s review of the current Guidelines.
V. ECONOMIC APPROACHES
Since the Guidelines are presumptive, they should reflect economically sound principles and
economically relevant child costs while still allowing the resulting Guidelines amounts to be rebutted
on a case specific basis. A general method of determining the appropriateness of a state’s guideline
presumptive amount is to evaluate their underlying economic basis and their relationship to cost data
from current economic studies.
9 See, e.g., “Report of the Child Support Guidelines Task Force,” October 2008, op. cit.
14
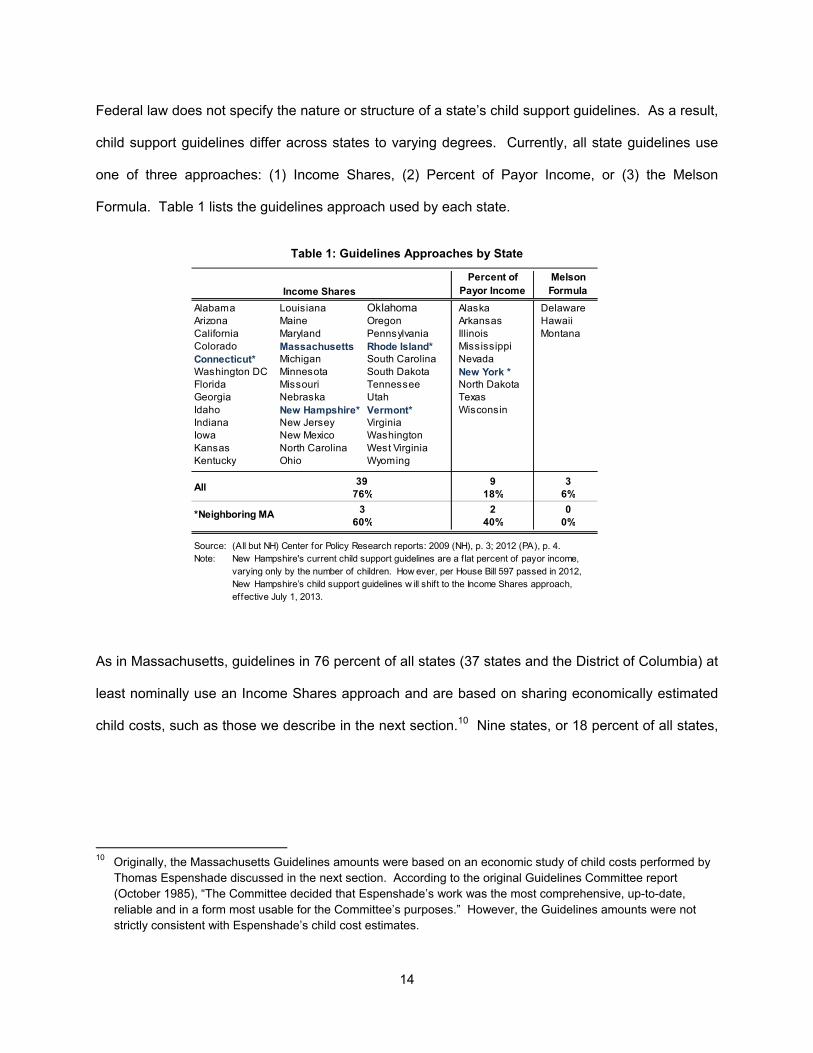
Federal law does not specify the nature or structure of a state’s child support guidelines. As a result,
child support guidelines differ across states to varying degrees. Currently, all state guidelines use
one of three approaches: (1) Income Shares, (2) Percent of Payor Income, or (3) the Melson
Formula. Table 1 lists the guidelines approach used by each state.
Table 1: Guidelines Approaches by State
As in Massachusetts, guidelines in 76 percent of all states (37 states and the District of Columbia) at
least nominally use an Income Shares approach and are based on sharing economically estimated
child costs, such as those we describe in the next section.10 Nine states, or 18 percent of all states,
10 Originally, the Massachusetts Guidelines amounts were based on an economic study of child costs performed by
Thomas Espenshade discussed in the next section. According to the original Guidelines Committee report (October 1985), “The Committee decided that Espenshade’s work was the most comprehensive, up-to-date, reliable and in a form most usable for the Committee’s purposes.” However, the Guidelines amounts were not strictly consistent with Espenshade’s child cost estimates.
Income Shares
Percent of Payor Income
Melson Formula
Alabama Louisiana Oklahoma Alaska DelawareArizona Maine Oregon Arkansas Hawaii California Maryland Pennsylvania Illinois Montana Colorado Massachusetts Rhode Island* Mississippi Connecticut* Michigan South Carolina Nevada Washington DC Minnesota South Dakota New York *Florida Missouri Tennessee North Dakota Georgia Nebraska Utah Texas Idaho New Hampshire* Vermont* Wisconsin Indiana New Jersey Virginia Iowa New Mexico Washington Kansas North Carolina West Virginia Kentucky Ohio Wyoming
39 9 376% 18% 6%
3 2 060% 40% 0%
Source: (All but NH) Center for Policy Research reports: 2009 (NH), p. 3; 2012 (PA), p. 4.Note:
All
New Hampshire's current child support guidelines are a f lat percent of payor income, varying only by the number of children. How ever, per House Bill 597 passed in 2012, New Hampshire’s child support guidelines w ill shift to the Income Shares approach, effective July 1, 2013.
*Neighboring MA
15
use the Percent of Payor Income approach,11 and the remaining three states use the Melson
Formula. Guidelines in the five states bordering Massachusetts are split in their approaches: four of
the five states (Connecticut, New Hampshire, Rhode Island, and Vermont) use Income Shares, while
New York uses Percent of Payor Income, although differently. In New York, the ultimate child
support payment is a strict payor-only amount – a flat 17 percent of the payor’s income for one child.
Notably, the current New Hampshire guidelines formula uses a combined income table but the table
is based on fixed percentages of net income, 25 percent for one child, 33% for two children, 40% for
three children, and 45% for four or more children. However, as of July 1, 2013, New Hampshire will
shift to an Income Shares approach.12 Table 1 and subsequent comparisons in this report reflect the
July 2013 New Hampshire guidelines.
a. Income Shares
Income Shares guidelines are based on indirect estimates of a child’s share of parents’ combined
income. Hence, the term “income shares” refers to the share of household income required to cover
child-related costs in a household, not the sharing of those costs between parents. However, since
most household spending is for “public goods” (i.e., goods shared in some proportion by all
members of the household), a child’s actual income share is not directly observable. This is
important because, to be perfectly clear, it means the Income Shares approach is not based on
actual child costs that are directly observed or measured. Instead, the Income Shares approach
yields estimates of child costs by applying a specific analytic methodology to what economic data
are available.
11 Prior to the January 2009 revisions, the then-current Massachusetts Guidelines used a hybrid approach, starting
off as a percent of payor income model until the recipient’s income reached a predetermined disregard ($20,000 per year net of child care costs) and then applying combined income to the cost table, in part, based on Income Shares estimates.
12 See, e.g., H.B. 597 at legiscan.com/NH/text/HB597/id/151424 and July 2013 New Hampshire child support guidelines at www.nhbar.org/uploads/pdf/CSG-2013-July.pdf.
16
Since most actual child costs are not directly observed, the crux of the Income Shares approach is to
compare equivalent households with and without children, in order to back-into the amount of
household income spent on children. Specifically, the approach is to estimate the marginal cost of
an additional child by comparing households with the same standard of living but different numbers
of children. This comparison requires a measure to proxy for a household’s standard of living.
Initially, the Income Shares approach was applied to two different measures, only one of which is still
used today. Both measures pre-date child support guidelines calculations and neither was originally
developed to quantify child costs. The Income Shares approach simply applies these methodologies
with the goal of estimating child costs.
The Income Shares approach was initially introduced in a child support context by public policy
expert Dr. Robert Williams coincident with the federal requirement to establish presumptive
guidelines in order to retain certain federal funding.13 The initial Income Shares cost table Williams
developed was based on prior research by Princeton sociologist Thomas Espenshade,14 which in
turn was based on a standard of living proxy developed by economist Ernst Engel in the late
nineteenth century.15 The Engel approach defines a household’s standard of living by the proportion
of its spending on food. Since food is a necessity, this approach assumes a household that spends
proportionately less on food is better off (because it is spending proportionately more money on
other things) than a household for which food is a larger component of spending. The Engel
approach assumes households with the same proportional expenditure on food are equally well off,
regardless of family size. Using this proxy, the Income Shares approach estimates child costs
13 Robert G. Williams, Development of Guidelines for Child Support Orders: Advisory Panel Recommendations and
Final Report, Parts II and III, Policy Studies, Inc., Denver, Colorado, under a grant to the National Center for State Courts, Williamsburg, Virginia, submitted to U.S. Department of Health and Human Services, Washington, D.C., September 1987.
14 Ibid., pp. II-19 through II-20. See, Thomas J. Espenshade, Investing in Children: New Estimates of Parental Expenditures, The Urban Institute Press, Washington, D.C. (1984).
15 Ernst Engel, “Consumption and Production in the Kingdom of Saxony,” Journal of the Statistical Bureau of the Ministry of the Interior (1857).
17
based on the difference in total spending between households with the same food shares (as a
proportion of income) but different numbers of children.
While a number of Income Shares states originally implemented variations of the original Engel-
based cost table, economists now agree that the Engel-based cost tables were unreasonably high.16
Therefore, Dr. David Betson at the University of Notre Dame applied the Income Shares approach to
a different proxy for a household’s standard of living. The new proxy was based on research done in
the 1940s by statistician Erwin Rothbarth.17 The Rothbarth approach defines a household’s
standard of living by its spending on adult clothing. It assumes a household that spends more on
adult clothing is better off than a household that spends less, so that households with the same
amount of spending on adult clothing are equally well off, regardless of family size. Under this
approach, child costs are estimated by the difference in total spending between households that
spend the same amounts on adult clothing but have different numbers of children.
From time to time, Betson has updated his Rothbarth estimates to account for the availability of
more current data.18 The most current Betson-Rothbarth estimates of child costs, published in
2010,19 as well as other current Income Shares estimates published by the USDA using a slightly
different methodology,20 are discussed in more detail below.
16 See, e.g., David M. Betson, “Alternative Estimates of the Cost of Children from the 1980-86 Consumer
Expenditure Survey,” September 1990, pp. 55-56, stating, “…given the high estimates that result from this methodology, even when compared to the per capita method, the estimates from the Engel method should be discounted.”
17 Erwin Rothbarth, “Notes on a method of determining equivalent income for families of different composition,” in C. Madge (Ed.), War-Time Pattern of Spending and Saving, Cambridge University Press, Cambridge MA (1943).
18 See, e.g., David M. Betson: (1) "Alternative Estimates of the Cost of Children from the 1980-86 Consumer Expenditure Survey," Institute for Research on Poverty, Special Report 51, University of Wisconsin-Madison (1990); (2) “Parental Expenditures on Children: A Preliminary Report,” unpublished manuscript (2000); (3) “Parental Expenditures on Children: Rothbarth Estimates,” prepared for Policy Studies, Inc., for the State of Oregon (2006).
19 David M. Betson (2010), “Appendix A: Parental Expenditures on Children: Rothbarth Estimates,” in Judicial Council of California, Review of Statewide Uniform Child Support Guidelines ( June 28, 2011).
20 Mark Lino, USDA, "Expenditures on Children by Families, 2011" (June 2012).
18
b. Percent of Payor Income
Currently, child support guidelines in 9 states, including one state bordering Massachusetts (New
York), use a Percent of Payor Income approach.21 This approach was developed initially by
economist Jacques van der Gaag at the University of Wisconsin at Madison.22 As the name
suggests, child support guidelines using this approach consider only the payor’s income, not the
relative incomes or combined income of both the payor and the recipient. Typically, Percent of
Payor Income guidelines establish child support as a fixed percentage of a payor’s income at all
income levels (i.e., child support as a percent of income does not vary by income level). In most
states, the resulting guideline amounts are simply a flat percentage of the payor’s income. Some
states’ guidelines, however, such as Arkansas and Wisconsin, use tiered percentages of payor
income. Initially, the Percent of Payor Income approach was intended to be used only in extreme
low-income (i.e., welfare) cases and the percentage reflected child costs only at low-income levels.
The initial study assumed the recipient had no income but full parenting responsibility, and that child
support payments would be less than the amount required of the recipient’s welfare payments.
While the Percent of Payor Income approach is relatively simple to implement, current payor-only
guidelines violate essentially every assumption of the original van der Gaag study. In addition, flat
child support percentages regardless of the payor’s income level contradict economic principles and
data showing the proportion of income spent on children decreases as income increases.
21 Again, the ultimate child support payment in New York is a flat 17 percent of the payor’s income, while the
guidelines amount in New Hampshire is based only on the payor’s income only, but the ultimate payment amount is based on the payor’s relative share of combined income.
22 Jacques van der Gaag, ”On Measuring the Cost of Children,” Child Support: Technical Papers, Vol. III, SR32C, Institute for Research on Poverty, Special Report Series, University of Wisconsin, 1982.
19
c. Melson Formula
The Melson Formula was developed by Delaware Family Court judge, Elwood Melson.23 It
incorporates several public policy assumptions designed to provide a self-support reserve for each
parent in addition to providing for their child(ren). Beyond self-support, the formula establishes a
standard of living adjustment (as a percentage of income), which automatically enables a child to
share in any increases in household income. The formula adds to a baseline support amount (called
“primary support”) both child care costs and extraordinary medical expenses. It calculates an
ultimate child support amount based on each parent’s relative share of total net income, while also
accounting for the standard of living adjustment. This is an income sharing approach which, by
design, does not reflect any child cost studies for incomes above the poverty level.
While the Income Shares approach is the most common of these three basic economic approaches,
and is most consistent with economic principles in estimating child costs, it has many known
limitations. As discussed above, Income Shares cost tables reflect indirect estimates of child costs,
not actual spending on children. Thus, while Income Shares estimates may be the best available
estimates of child costs, they do not reflect specific itemized spending on children. They rely on
indirect but narrow proxies for a household’s standard of living (e.g., adult clothing) in order to
compare spending across households with different numbers of children.
Income Shares estimates, such as the Betson-Rothbarth amounts, also rely on data from intact
(specifically, husband-wife) households to inform policy decisions for households, which are not
intact. These guideline models implicitly assume economic decisions are made the same way for
separate households as for married households, when, in fact, the economic tradeoffs may be very
different. One obvious difference is the additional overhead cost required by two separate
households relative to the cost of a single household. By failing to account for this additional cost,
23 See Dalton v. Clanton, 559 A.2d 1197 (Del. 1989).
20
economic models likely overestimate the standard of living of a non-intact household at a given
income level. Maintaining a standard of living estimated based on intact household data likely
requires more income than is actually available to a non-intact household.
Finally, as a practical matter, Income Shares estimates are only as good as the data on which they
are based. For example, the latest Betson and USDA estimates use data (on intact households
only) from the Consumer Expenditure Survey (CEX) conducted by the U.S. Census Bureau on
characteristics, income, and expenditures for individual households.24 The USDA report describes
the CEX data as:
…the most comprehensive source of information on household expenditures
available at the national level, containing expenditure data for housing, food,
transportation, clothing, health care, child care and education, and miscellaneous
goods and services.25
While we agree that the CEX is the best available data source for detailed household-level
expenditures, the data are not without their known limitations.26 The CEX data show expenditures in
excess of reported income for about half of respondents, typically in the lower half of reported
income ranges. This means income may be systematically underreported in the CEX data.
However, there is no theoretical basis for making an economically reasoned adjustment in economic
models using the data. Betson adjusts his estimates, for example, by simply capping the ratio of
expenses to income at one for low-income groups, which has the effect of increasing the
corresponding child cost estimates relative to the more likely circumstance in which the ratio of
expenses to income is something less than one. That is, actual income for low-income groups likely
is higher than reported income. At higher incomes, the CEX data exhibit the opposite problem.
Savings reported for high-income households seems unreasonably high, suggesting that 24 For more information on the Consumer Expenditure Survey, see www.bls.gov/cex. 25 Lino (2012), op. cit., p. 1. 26 See, e.g., Ira Mark Ellman, “Fudging Failure: The Economic Analysis Used to Construct Child Support
Guidelines”, The University of Chicago Legal Forum (2004), p. 23.
21
expenditures may be underreported. Again, however, there is no basis for making an economically
appropriate adjustment in using the data to estimate child costs.
With these limitations in mind, the available economic data on child costs are informative and, along
with sound economic principles, can provide a basis for the Task Force to evaluate the
appropriateness of child support amounts under the current Guidelines.
VI. CURRENT CHILD COST ESTIMATES
In developing the current Guidelines, the prior Task Force considered then-current economic
estimates of child costs, most notably three Income Shares studies in which Betson applied both the
Engel and Rothbarth methodologies to CEX data through 2004.27 That Task Force noted that the
Betson-Rothbarth estimates: (1) consistently placed the marginal expenditure for one child at
approximately 25 percent of total household spending (not income); (2) consistent with general
economic theory, showed expenditures on children account for a decreasing percentage of
household spending as income increases; and (3) showed no significant differences in expenditures
on children of different ages.
a. Recent Child Cost Studies
Between the time of the prior Task Force and today, three new studies have estimated child costs:
McCaleb, et al. (2008),28 Betson (2010),29 and USDA (2012).30 In addition, a Massachusetts non-
profit group periodically publishes estimates of the cost of living in the state.
27 Betson (1990, 2000, and 2006), op. cit. 28 Thomas S. McCaleb, et al., (2008), “Review and Update of Florida’s Child Support Guidelines, Report to the
Florida Legislature,” Florida State University, Tallahassee, Florida. 29 Betson (2010), op. cit. 30 Lino (2012), op. cit.
22
McCaleb, et al. (2008)
To develop a revised cost table for consideration by the Florida legislature, Thomas McCaleb at
Florida State University developed Income Shares estimates by applying the Engel approach to CEX
data from 2004 to 2006. The study does not report its average estimates, but does report that the
estimates are considerably lower than prior estimates by Espenshade and Betson using the Engel
approach. Ultimately, the Florida legislature did not adopt McCaleb’s child cost estimates. While
Florida has changed certain provisions of its guidelines, the dollar amount of child support under its
guidelines at each income level has remained unchanged since 1993.31
Even if these estimates were reported, because the McCaleb estimates use the Engel approach,
rather than the Rothbarth approach, we would not recommend those estimates to the Task Force
due to the widely recognized flaws in the economic methodology. Again, the Engel methodology
uses a household’s spending on food as a proxy for its standard of living in comparing it to other
households with a different number of children. However, children are “food intensive” (relative to
adult proportional spending on food), meaning the Engel methodology is upwardly biased in
estimating child costs.
Betson (2010)
In 2010, as part of California’s guidelines review, Betson updated his Rothbarth estimates of child
costs using data from the CEX for 2004 through the first quarter of 2009. As in his three prior
studies (1990, 2000, and 2006), Betson’s estimates measure child costs as a percentage of total
family expenditures across a range of income levels, but the California report does not include the
detailed estimates. They are reported, however, in a subsequent report for the state of Illinois, and
are listed in the data and comparisons we report below. The current Massachusetts Guidelines are
based, in part, on a review by the prior Task Force of the 2006 Betson-Rothbarth estimates.32
31 The Florida Senate, “Review of Child Support Guidelines,” Interim Report 2010-210 (October 2009). 32 Report of the Child Support Guidelines Task Force (2008), op. cit., pp. 22-24.
23
Through this report, the current Task Force will consider the latest Betson estimates as part of its
review of the current Guidelines. Several states have already considered the latest Betson
estimates as part of their guidelines reviews, including at least two states bordering Massachusetts,
Rhode Island and Vermont, each of which revised their cost tables in 2012.
The latest Betson study applies only the Rothbarth approach.33 It reflects two changes in the CEX
data Betson used to derive his estimates. First, Betson uses an income series newly created by the
Bureau of Labor Statistics to correct for the problem of income non-reporting in the CEX discussed
above, particularly at low incomes. This likely decreases estimated child costs at low incomes, all
else equal, but also results in more realistic estimates. Second, Betson switched from using CEX
data on household “expenditures” to using “outlays,” which include finance changes and mortgage
principal payments rather than treating them as changes in net liabilities. Ultimately, Betson’s
current Rothbarth estimates are similar to the estimates from his prior (2006) study. According to
the study, (intact) households spend, on average, 24 percent of total household spending (not
income) for one child, 37 percent for two children, and 45 percent for three children. These
estimates are discussed in more detail below.
USDA (2012)
Every year since 1960, the USDA has estimated expenditures on children through age 17 for both
married and single parent households. The latest USDA report was released in June 2012, based
on CEX data from 2005-06 updated to 2011 dollars using the Consumer Price Index. The report
provides child cost estimates for each of seven expenditure categories (housing, food,
transportation, clothing, child care and education, health care, and miscellaneous expenses) by child
age, household income, and region. For example, for the overall United States, the latest USDA
report estimates annual child costs of between $12,290 and $14,320 for a child in a two-child,
33 Betson did not apply the Engel approach at all in the 2010 study, and he specifically repudiated that approach as
economically unsound.
24
married household in the middle-income group. The report also provides estimated adjustment
factors for number of children.
Like the Betson studies, the USDA uses the CEX data to derive its child cost estimates. However, it
applies a different analytic approach to the data. Prior to 2008, the USDA estimated expenditures
for shared costs within a household, such as housing and transportation, on a per capita basis; that
is, by dividing the expenditure by the number of people in the household. Most economists agree
the per capita approach overstates actual child costs. It violates the economic principle that
allocation decisions depend on marginal rather than average costs. Optimal decisions require
balancing the additional benefits with the additional costs from any proposed, but per capita
estimates simply reflect average costs. Notably, per capita allocation moves some pre-existing adult
costs to child cost estimates.
As a result, the USDA discarded that approach for housing expenditures in its most recent reports.
Instead, housing expenditures on children are estimated based on the average cost of an additional
bedroom. Implicit in this approach is the assumption that the same household without children
would live in a similar dwelling but with fewer bedrooms. That assumption may be correct in some
cases, but not always. Also, the marginal cost approach does not apply only to just housing; it
applies to other expenditure categories as well.
However, the USDA continues to simply prorate other expenses, such as food, transportation, and
miscellaneous, by a pre-determined factor related to the number of people in the household. For
example, the USDA essentially assumes a child’s haircut costs the same as a woman’s hair
treatment. Also, the cost of transportation (such as automobile note payment and gasoline) are
equally pro-rated between adults and children even though adults would incur nearly all of these
expenses even without children. Finally, the USDA in recent years added payment on principal on
house payments as part of its cost calculations. Other methodologies exclude payment on principal
25
because it is considered an investment and not a cost. These factors lead most economists to view
the USDA methodology as likely overstating child costs.
Massachusetts Economic Independence Index (2013)
The Crittenton Women’s Union (CWU), a Massachusetts non-profit advocacy group for low-income
women, periodically publishes estimates of the cost of living in Massachusetts. The CWU released
its latest estimates in March 2013.34 Since prior CWU estimates were considered by the prior (2008)
Task Force in its guidelines review, we include mention of the current estimates here. However, we
do not recommend that the Task Force rely on the CWU estimates as more than illustrative of
possible costs under specific assumptions.
The CWU report estimates the costs of various household expenditures (e.g., housing, food,
transportation, child care, health care, personal items, and taxes) for different types of households at
the state level and by county. For example, it reports estimated costs for households with: only an
adult; one adult, a pre-school age child, and a school-age child; and two adults with a pre-school age
child and a school-age child. The resulting estimates reflect “index budgets” by family type and
location, which assume each type of family makes certain types of expenditures. For example, the
report assumes all adults work full-time, regardless of family type, and have certain work-related
travel and child-care expenses. It also assumes all children under 14 years old require before and
after school care, while children not in school require full-time child care.
As a result, while the CWU report can generate cost estimates for many different family types, its
findings are tied to specific underlying income, tax-related, and spending assumptions, rather than
broadly reflecting a wide range of possible income and spending patterns. The corresponding
estimates may reflect costs reliably, on average, for the assumed scenarios. However, by design,
they will not reflect costs for income and spending patterns outside of those fixed assumptions.
34 Massachusetts Economic Independence Index 2013 (March 2013), available at www.liveworkthrive.org.
26
Since the Guidelines apply broadly to all households over a wide range of incomes (currently up to
$250,000) and spending patterns, it is important that they consider economic data on child costs
which also are broadly applicable and based on actual spending data.
Likewise, it is important for the Guidelines to consider data on marginal child costs, not overall
household expenditures. While estimates of marginal child costs can be derived from the overall
estimates in the CWU report (e.g., by calculating the cost difference between households at the
same income level but with and without a child), those child cost estimates also are entirely
dependent on the specific “basket” of goods and services the report assumes each household
consumes, and they are not more broadly indicative of child costs. The CWU data reflect more of a
policy choice set (the basket of goods and services) than data on actual spending.
b. Comparisons to Massachusetts Guidelines
It is useful to compare the current Guidelines amounts to child cost estimates over a wide range of
incomes and based on methodologies viewed as standard by economists. The current Betson-
Rothbarth and USDA estimates are the best data available for making such a comparison.
Comparing the Betson-Rothbarth and USDA estimates of child costs to the Massachusetts
Guidelines amounts first requires various calculations to put the published estimates and Guidelines
amounts on the same basis. In this section, we compare the amounts for one child. In the next
section, we compare the amounts for more than one child.
1. Betson-Rothbarth Estimates
Betson’s Rothbarth estimates reflect spending on children as a percent of total expenditures and
current consumption as a percent of a household’s net income (not gross income) at various income
levels and numbers of children, based on a national sample of households from the CEX data. The
resulting estimates reflect child costs excluding child care costs and extraordinary health care costs
(but including the children’s share of health insurance premiums), since these expenses either do
27
not always occur (e.g., child care) or are treated separately (e.g., health insurance premiums and
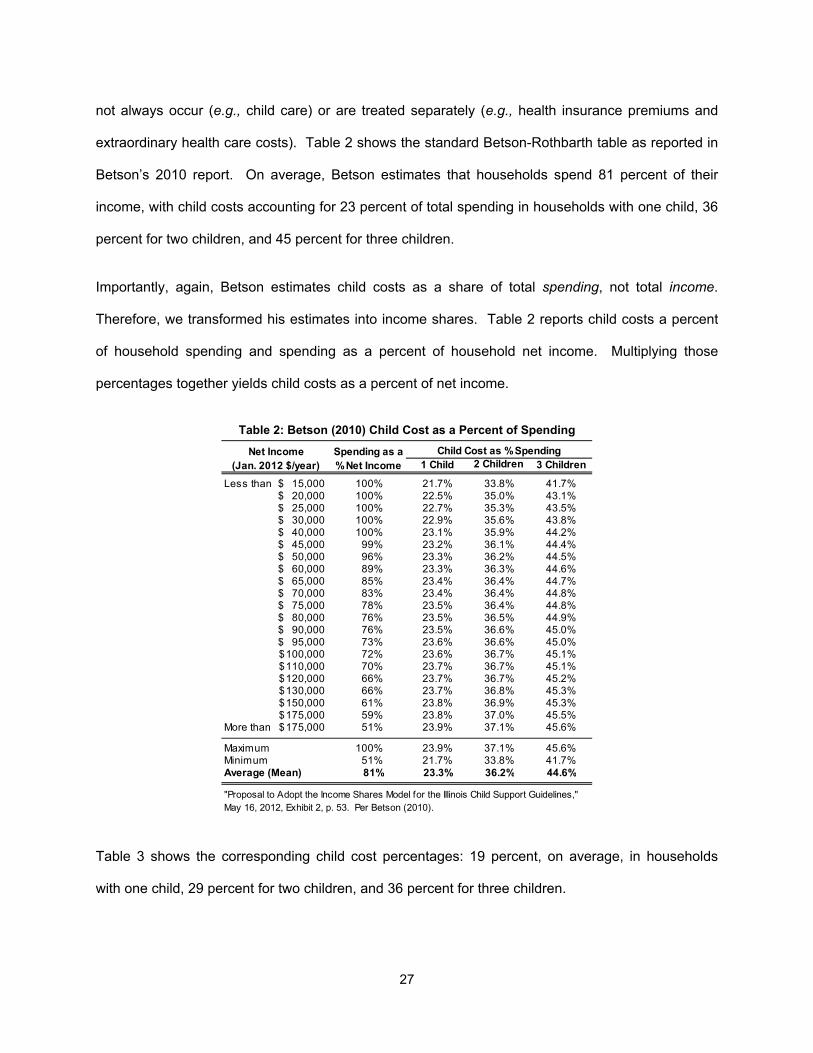
extraordinary health care costs). Table 2 shows the standard Betson-Rothbarth table as reported in
Betson’s 2010 report. On average, Betson estimates that households spend 81 percent of their
income, with child costs accounting for 23 percent of total spending in households with one child, 36
percent for two children, and 45 percent for three children.
Importantly, again, Betson estimates child costs as a share of total spending, not total income.
Therefore, we transformed his estimates into income shares. Table 2 reports child costs a percent
of household spending and spending as a percent of household net income. Multiplying those
percentages together yields child costs as a percent of net income.
Table 2: Betson (2010) Child Cost as a Percent of Spending
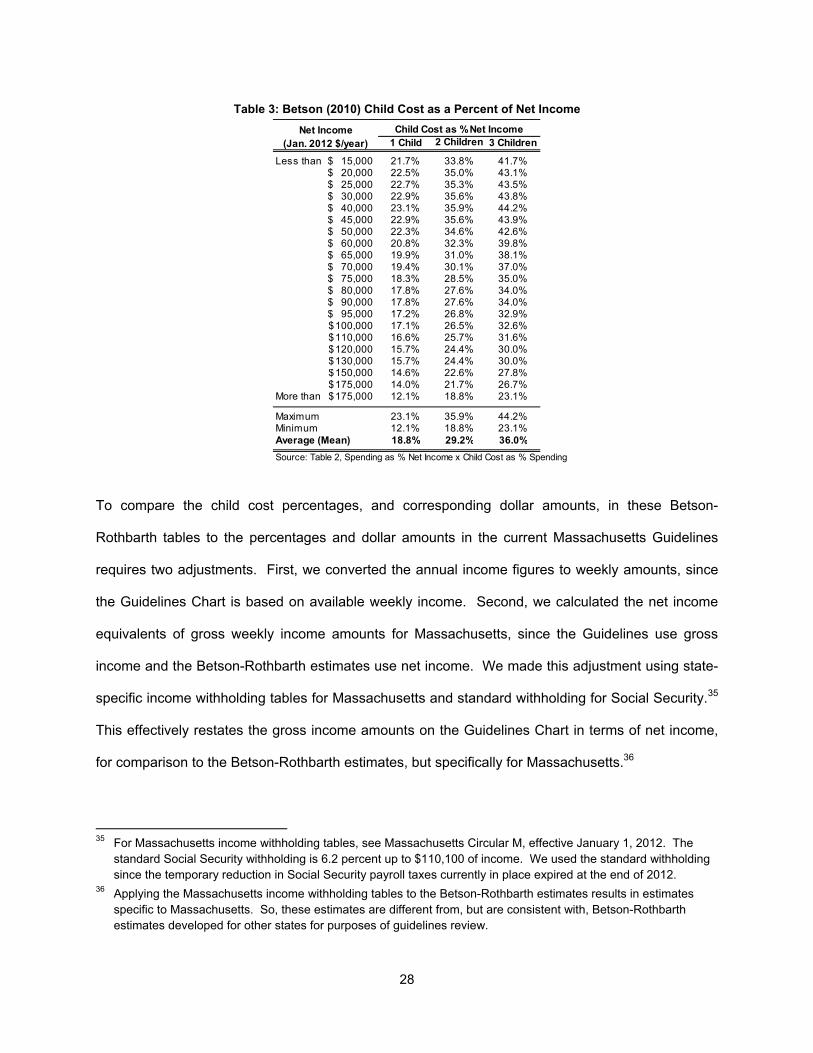
Table 3 shows the corresponding child cost percentages: 19 percent, on average, in households
with one child, 29 percent for two children, and 36 percent for three children.
Child Cost as % Spending1 Child 2 Children 3 Children
Less than 15,000$ 100% 21.7% 33.8% 41.7%20,000$ 100% 22.5% 35.0% 43.1%25,000$ 100% 22.7% 35.3% 43.5%30,000$ 100% 22.9% 35.6% 43.8%40,000$ 100% 23.1% 35.9% 44.2%45,000$ 99% 23.2% 36.1% 44.4%50,000$ 96% 23.3% 36.2% 44.5%60,000$ 89% 23.3% 36.3% 44.6%65,000$ 85% 23.4% 36.4% 44.7%70,000$ 83% 23.4% 36.4% 44.8%75,000$ 78% 23.5% 36.4% 44.8%80,000$ 76% 23.5% 36.5% 44.9%90,000$ 76% 23.5% 36.6% 45.0%95,000$ 73% 23.6% 36.6% 45.0%
100,000$ 72% 23.6% 36.7% 45.1%110,000$ 70% 23.7% 36.7% 45.1%120,000$ 66% 23.7% 36.7% 45.2%130,000$ 66% 23.7% 36.8% 45.3%150,000$ 61% 23.8% 36.9% 45.3%175,000$ 59% 23.8% 37.0% 45.5%
More than 175,000$ 51% 23.9% 37.1% 45.6%
Maximum 100% 23.9% 37.1% 45.6%Minimum 51% 21.7% 33.8% 41.7%Average (Mean) 81% 23.3% 36.2% 44.6%
Spending as a % Net Income
Net Income (Jan. 2012 $/year)
"Proposal to Adopt the Income Shares Model for the Illinois Child Support Guidelines," May 16, 2012, Exhibit 2, p. 53. Per Betson (2010).
28
Table 3: Betson (2010) Child Cost as a Percent of Net Income
To compare the child cost percentages, and corresponding dollar amounts, in these Betson-
Rothbarth tables to the percentages and dollar amounts in the current Massachusetts Guidelines
requires two adjustments. First, we converted the annual income figures to weekly amounts, since
the Guidelines Chart is based on available weekly income. Second, we calculated the net income
equivalents of gross weekly income amounts for Massachusetts, since the Guidelines use gross
income and the Betson-Rothbarth estimates use net income. We made this adjustment using state-
specific income withholding tables for Massachusetts and standard withholding for Social Security.35
This effectively restates the gross income amounts on the Guidelines Chart in terms of net income,
for comparison to the Betson-Rothbarth estimates, but specifically for Massachusetts.36
35 For Massachusetts income withholding tables, see Massachusetts Circular M, effective January 1, 2012. The
standard Social Security withholding is 6.2 percent up to $110,100 of income. We used the standard withholding since the temporary reduction in Social Security payroll taxes currently in place expired at the end of 2012.
36 Applying the Massachusetts income withholding tables to the Betson-Rothbarth estimates results in estimates specific to Massachusetts. So, these estimates are different from, but are consistent with, Betson-Rothbarth estimates developed for other states for purposes of guidelines review.
Child Cost as % Net Income1 Child 2 Children 3 Children
Less than 15,000$ 21.7% 33.8% 41.7%20,000$ 22.5% 35.0% 43.1%25,000$ 22.7% 35.3% 43.5%30,000$ 22.9% 35.6% 43.8%40,000$ 23.1% 35.9% 44.2%45,000$ 22.9% 35.6% 43.9%50,000$ 22.3% 34.6% 42.6%60,000$ 20.8% 32.3% 39.8%65,000$ 19.9% 31.0% 38.1%70,000$ 19.4% 30.1% 37.0%75,000$ 18.3% 28.5% 35.0%80,000$ 17.8% 27.6% 34.0%90,000$ 17.8% 27.6% 34.0%95,000$ 17.2% 26.8% 32.9%
100,000$ 17.1% 26.5% 32.6%110,000$ 16.6% 25.7% 31.6%120,000$ 15.7% 24.4% 30.0%130,000$ 15.7% 24.4% 30.0%150,000$ 14.6% 22.6% 27.8%175,000$ 14.0% 21.7% 26.7%
More than 175,000$ 12.1% 18.8% 23.1%
Maximum 23.1% 35.9% 44.2%Minimum 12.1% 18.8% 23.1%Average (Mean) 18.8% 29.2% 36.0%
Source: Table 2, Spending as % Net Income x Child Cost as % Spending
Net Income (Jan. 2012 $/year)
29
At that point, we used Betson’s estimates of current consumption as a percent of net income to
estimate total spending at each income level on the Guidelines Chart, and his percentages of child
spending as a percent of total spending to calculate child costs for one to three children. Since the
Guidelines apply up to five children, we used the same approach to estimate child costs for four and
five children by applying published estimates of scaling ratios for four and five children to Betson’s
cost estimates for three children.37 The ultimate result of these calculations is a set of estimated
child costs based on the current Betson-Rothbarth estimates, but specific to Massachusetts and for
the full range of incomes and number of children covered by the Guidelines.38
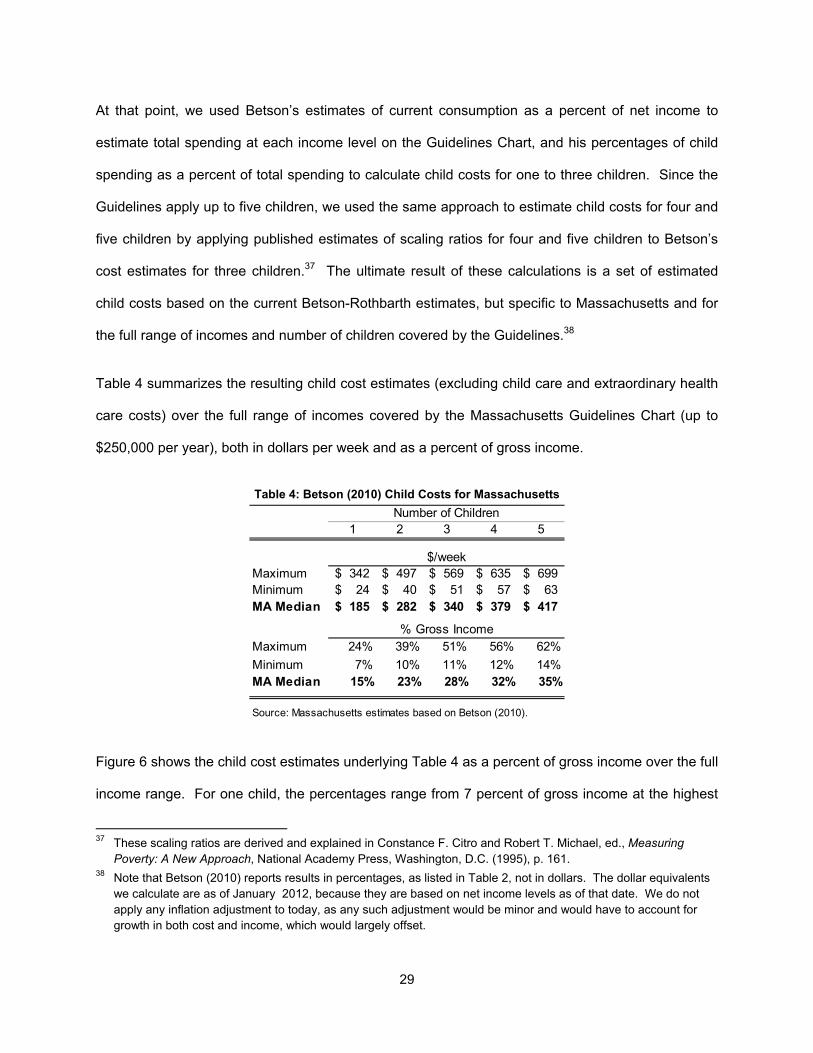
Table 4 summarizes the resulting child cost estimates (excluding child care and extraordinary health
care costs) over the full range of incomes covered by the Massachusetts Guidelines Chart (up to
$250,000 per year), both in dollars per week and as a percent of gross income.
Table 4: Betson (2010) Child Costs for Massachusetts
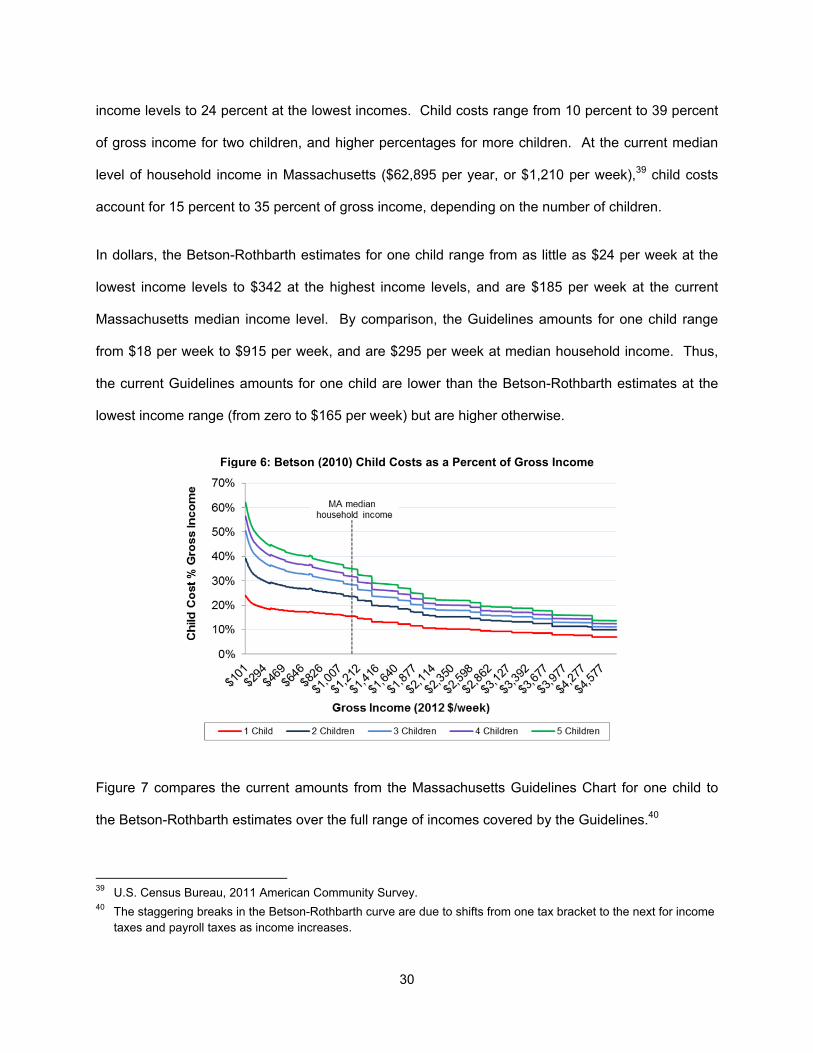
Figure 6 shows the child cost estimates underlying Table 4 as a percent of gross income over the full
income range. For one child, the percentages range from 7 percent of gross income at the highest
37 These scaling ratios are derived and explained in Constance F. Citro and Robert T. Michael, ed., Measuring
Poverty: A New Approach, National Academy Press, Washington, D.C. (1995), p. 161. 38 Note that Betson (2010) reports results in percentages, as listed in Table 2, not in dollars. The dollar equivalents
we calculate are as of January 2012, because they are based on net income levels as of that date. We do not apply any inflation adjustment to today, as any such adjustment would be minor and would have to account for growth in both cost and income, which would largely offset.
Number of Children1 2 3 4 5
$/weekMaximum 342$ 497$ 569$ 635$ 699$ Minimum 24$ 40$ 51$ 57$ 63$ MA Median 185$ 282$ 340$ 379$ 417$
% Gross IncomeMaximum 24% 39% 51% 56% 62%
Minimum 7% 10% 11% 12% 14%MA Median 15% 23% 28% 32% 35%
Source: Massachusetts estimates based on Betson (2010).
30
income levels to 24 percent at the lowest incomes. Child costs range from 10 percent to 39 percent
of gross income for two children, and higher percentages for more children. At the current median
level of household income in Massachusetts ($62,895 per year, or $1,210 per week),39 child costs
account for 15 percent to 35 percent of gross income, depending on the number of children.
In dollars, the Betson-Rothbarth estimates for one child range from as little as $24 per week at the
lowest income levels to $342 at the highest income levels, and are $185 per week at the current
Massachusetts median income level. By comparison, the Guidelines amounts for one child range
from $18 per week to $915 per week, and are $295 per week at median household income. Thus,
the current Guidelines amounts for one child are lower than the Betson-Rothbarth estimates at the
lowest income range (from zero to $165 per week) but are higher otherwise.
Figure 6: Betson (2010) Child Costs as a Percent of Gross Income
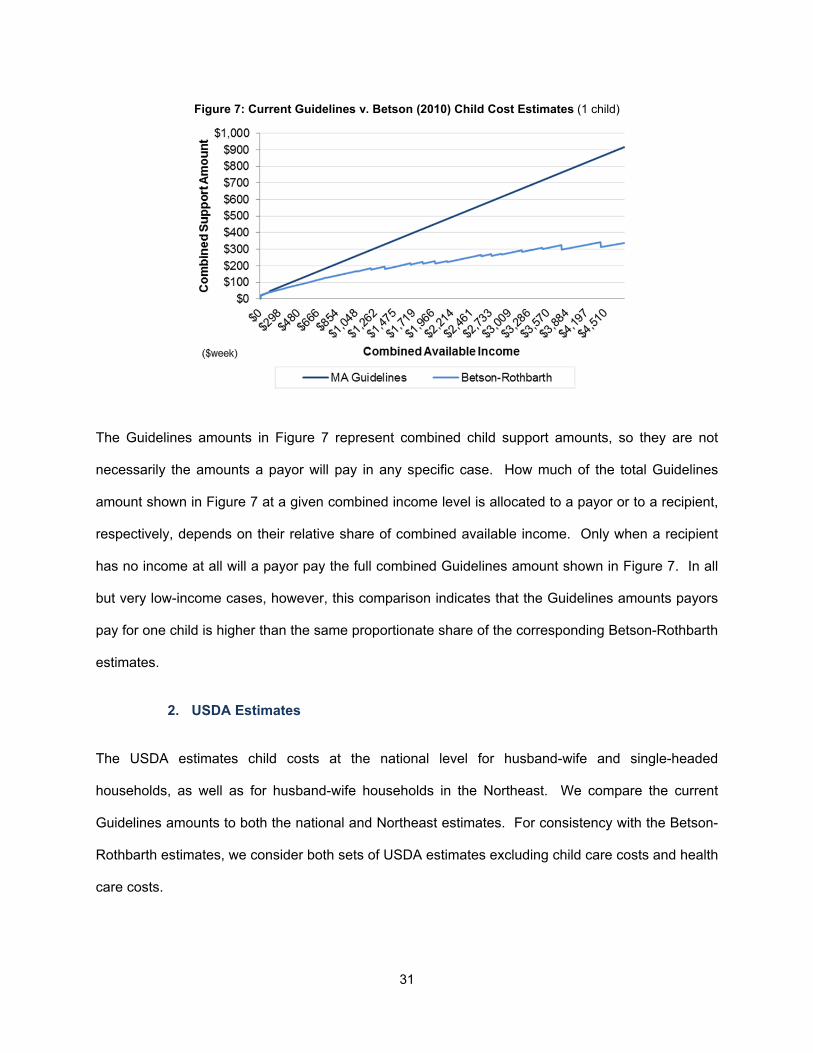
Figure 7 compares the current amounts from the Massachusetts Guidelines Chart for one child to
the Betson-Rothbarth estimates over the full range of incomes covered by the Guidelines.40
39 U.S. Census Bureau, 2011 American Community Survey. 40 The staggering breaks in the Betson-Rothbarth curve are due to shifts from one tax bracket to the next for income
taxes and payroll taxes as income increases.
31
Figure 7: Current Guidelines v. Betson (2010) Child Cost Estimates (1 child)
The Guidelines amounts in Figure 7 represent combined child support amounts, so they are not
necessarily the amounts a payor will pay in any specific case. How much of the total Guidelines
amount shown in Figure 7 at a given combined income level is allocated to a payor or to a recipient,
respectively, depends on their relative share of combined available income. Only when a recipient
has no income at all will a payor pay the full combined Guidelines amount shown in Figure 7. In all
but very low-income cases, however, this comparison indicates that the Guidelines amounts payors
pay for one child is higher than the same proportionate share of the corresponding Betson-Rothbarth
estimates.
2. USDA Estimates
The USDA estimates child costs at the national level for husband-wife and single-headed
households, as well as for husband-wife households in the Northeast. We compare the current
Guidelines amounts to both the national and Northeast estimates. For consistency with the Betson-
Rothbarth estimates, we consider both sets of USDA estimates excluding child care costs and health
care costs.
32
Directly comparing the current Guidelines amounts to the latest USDA child cost estimates in either
case requires some adjustments to the USDA estimates as they are reported. The USDA reports
estimated expenses by spending component (specifically, housing, food, transportation, clothing,
child care and education, health care, and miscellaneous expenses) for the younger child in a two-
child household up to age 18. Overall, the economic evidence on whether child costs vary
systematically by age is mixed. For example, Betson has found no significant differences in child
costs by the age of the child using the Rothbarth approach,41 and the current Betson-Rothbarth
estimates are not reported separately by age. The USDA estimates vary widely over the different
cost components, between married and single-headed households, and across income groups.
The USDA child cost estimates are published for only a limited number of income scenarios: three
scenarios for married households (low, middle, and high), and two (low and high) for single-headed
households. These scenarios are available for the U.S. overall and by census region, including the
Northeast. Each income scenario has a stated income range and specific average income over that
range.
The USDA estimates are based on gross income, so there is no need to calculate net income as
with the Betson-Rothbarth estimates. However, we did have to make two adjustments to the
estimates as reported. First, the USDA estimates are reported in annual dollars, which we
converted to weekly amounts, since the Guidelines Chart uses weekly amounts. Second, the USDA
estimates had to be adjusted for the number of children in a household.
Because the USDA estimates are for the younger child in a two-child household, the report suggests
adjustment factors to calculate estimated costs for a one-child household and for households with
two and three children. Notably, the reported adjustment factors differ for married and single-
headed households, since the USDA estimates of child costs are lower in single-headed
41 See, e.g., David M. Betson, “Chapter 5: Parental Expenditures on Children,” in Judicial Council of California,
Review of Statewide Uniform Child Support Guidelines, San Francisco, California, (2001).
33
households.42 For married households with two children, the USDA indicates that costs for the older
child are approximately the same as the reported costs for the younger child. So, to calculate
expenses for two children, the estimate for the younger child should be multiplied by two. In single-
headed households, however, the estimate for the younger child should be multiplied by 1.97.
Likewise, the adjustment factors are different for one child (1.25 for married households and 1.29 for
single-headed households) and for each of three children (0.78 for married households and 0.77 for
single-headed households).
To compare the USDA estimates to the current Guidelines amounts, we calculated the estimated
cost of one, two, and three children using the reported costs and the USDA suggested adjustment
factors. As with the Betson-Rothbarth estimates, we also calculated estimated costs for four and
five children (since the Guidelines cover up to five children) using the same scaling ratios for four
and five children relative to the USDA cost estimates for three children.43
USDA National Estimates
Table 5 shows the resulting USDA estimates for the overall U.S. by income group for both married
and single-headed households. The dollar values at the top of the table are the average estimates
within each group, stated in dollars per week.44 The percentages in the middle of the table report
those dollar values relative to the average income level for each group. The percentages at the
bottom of the table report the incremental cost of an additional child, calculated as the percentage
change in estimated cost for going from one child to two children, two to three, etc., within each
42 For example, total costs for the younger child in a two-child household are estimated to be $181 per week in a
married household and $168 per week, or 7 percent lower, in a single household. (See Tables 1 and 7 of USDA (2012), respectively). However, the lower child costs represent a larger share of income in single-headed households.
43 See Citro (1995), op. cit. 44 The dollar values in USDA (2012) are as of 2011. We do not apply an inflation adjustment to today. This is
consistent with our handling of the Income Shares dollar figures (which are as of January 2012), and for the same reasons (i.e., any adjustment would be minor, and growth in both costs and incomes would have offsetting effects).
34
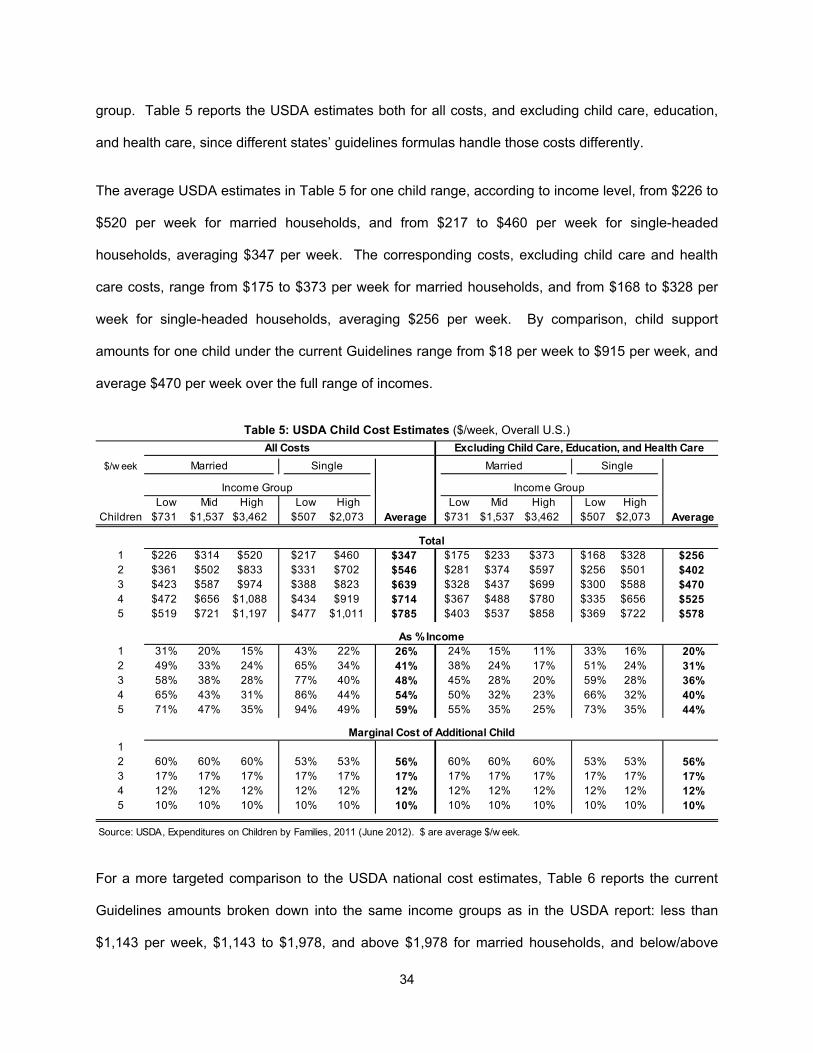
group. Table 5 reports the USDA estimates both for all costs, and excluding child care, education,
and health care, since different states’ guidelines formulas handle those costs differently.
The average USDA estimates in Table 5 for one child range, according to income level, from $226 to
$520 per week for married households, and from $217 to $460 per week for single-headed
households, averaging $347 per week. The corresponding costs, excluding child care and health
care costs, range from $175 to $373 per week for married households, and from $168 to $328 per
week for single-headed households, averaging $256 per week. By comparison, child support
amounts for one child under the current Guidelines range from $18 per week to $915 per week, and
average $470 per week over the full range of incomes.
Table 5: USDA Child Cost Estimates ($/week, Overall U.S.)
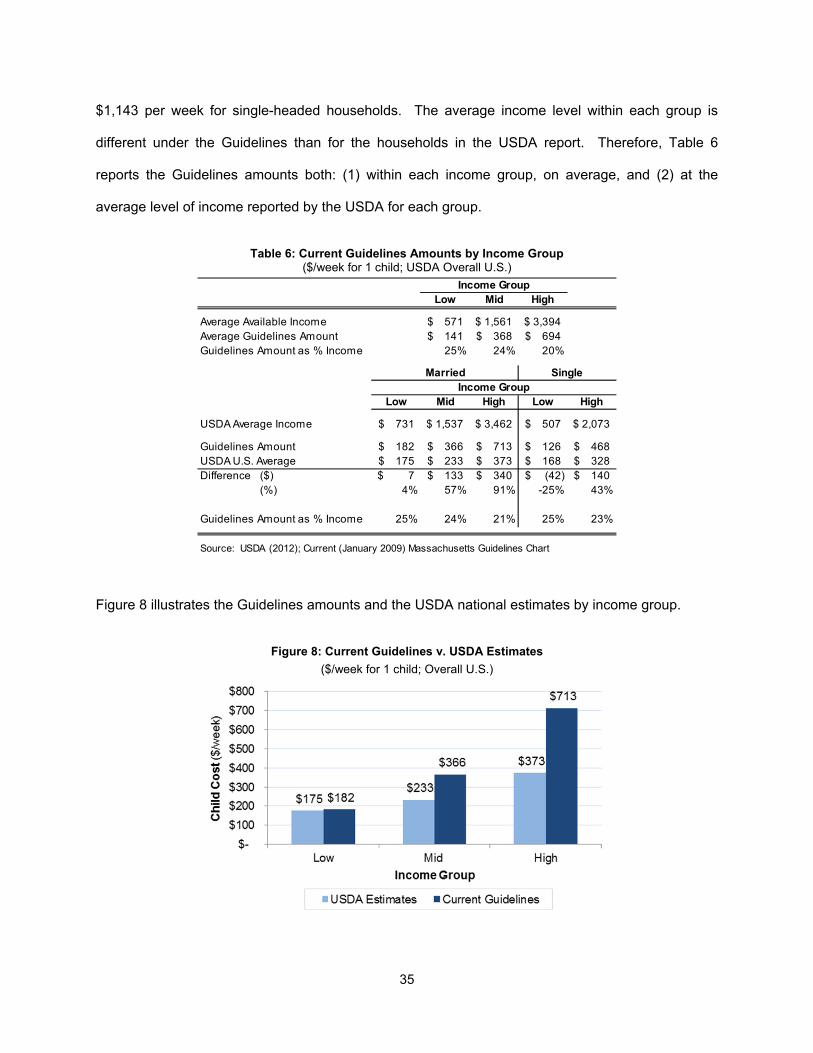
For a more targeted comparison to the USDA national cost estimates, Table 6 reports the current
Guidelines amounts broken down into the same income groups as in the USDA report: less than
$1,143 per week, $1,143 to $1,978, and above $1,978 for married households, and below/above
All Costs Excluding Child Care, Education, and Health Care
$/w eek Married Single Married Single
Income Group Income GroupLow Mid High Low High Low Mid High Low High
Children $731 $1,537 $3,462 $507 $2,073 Average $731 $1,537 $3,462 $507 $2,073 Average
Total1 $226 $314 $520 $217 $460 $347 $175 $233 $373 $168 $328 $2562 $361 $502 $833 $331 $702 $546 $281 $374 $597 $256 $501 $4023 $423 $587 $974 $388 $823 $639 $328 $437 $699 $300 $588 $4704 $472 $656 $1,088 $434 $919 $714 $367 $488 $780 $335 $656 $5255 $519 $721 $1,197 $477 $1,011 $785 $403 $537 $858 $369 $722 $578
As % Income1 31% 20% 15% 43% 22% 26% 24% 15% 11% 33% 16% 20%2 49% 33% 24% 65% 34% 41% 38% 24% 17% 51% 24% 31%3 58% 38% 28% 77% 40% 48% 45% 28% 20% 59% 28% 36%4 65% 43% 31% 86% 44% 54% 50% 32% 23% 66% 32% 40%5 71% 47% 35% 94% 49% 59% 55% 35% 25% 73% 35% 44%
Marginal Cost of Additional Child12 60% 60% 60% 53% 53% 56% 60% 60% 60% 53% 53% 56%3 17% 17% 17% 17% 17% 17% 17% 17% 17% 17% 17% 17%4 12% 12% 12% 12% 12% 12% 12% 12% 12% 12% 12% 12%5 10% 10% 10% 10% 10% 10% 10% 10% 10% 10% 10% 10%
Source: USDA, Expenditures on Children by Families, 2011 (June 2012). $ are average $/w eek.
35
$1,143 per week for single-headed households. The average income level within each group is
different under the Guidelines than for the households in the USDA report. Therefore, Table 6
reports the Guidelines amounts both: (1) within each income group, on average, and (2) at the
average level of income reported by the USDA for each group.
Table 6: Current Guidelines Amounts by Income Group ($/week for 1 child; USDA Overall U.S.)
Figure 8 illustrates the Guidelines amounts and the USDA national estimates by income group.
Figure 8: Current Guidelines v. USDA Estimates
($/week for 1 child; Overall U.S.)
Income GroupLow Mid High
Average Available Income 571$ 1,561$ 3,394$ Average Guidelines Amount 141$ 368$ 694$ Guidelines Amount as % Income 25% 24% 20%
Married SingleIncome Group
Low Mid High Low High
USDA Average Income 731$ 1,537$ 3,462$ 507$ 2,073$
Guidelines Amount 182$ 366$ 713$ 126$ 468$ USDA U.S. Average 175$ 233$ 373$ 168$ 328$ Difference ($) 7$ 133$ 340$ (42)$ 140$
(%) 4% 57% 91% -25% 43%
Guidelines Amount as % Income 25% 24% 21% 25% 23%
Source: USDA (2012); Current (January 2009) Massachusetts Guidelines Chart
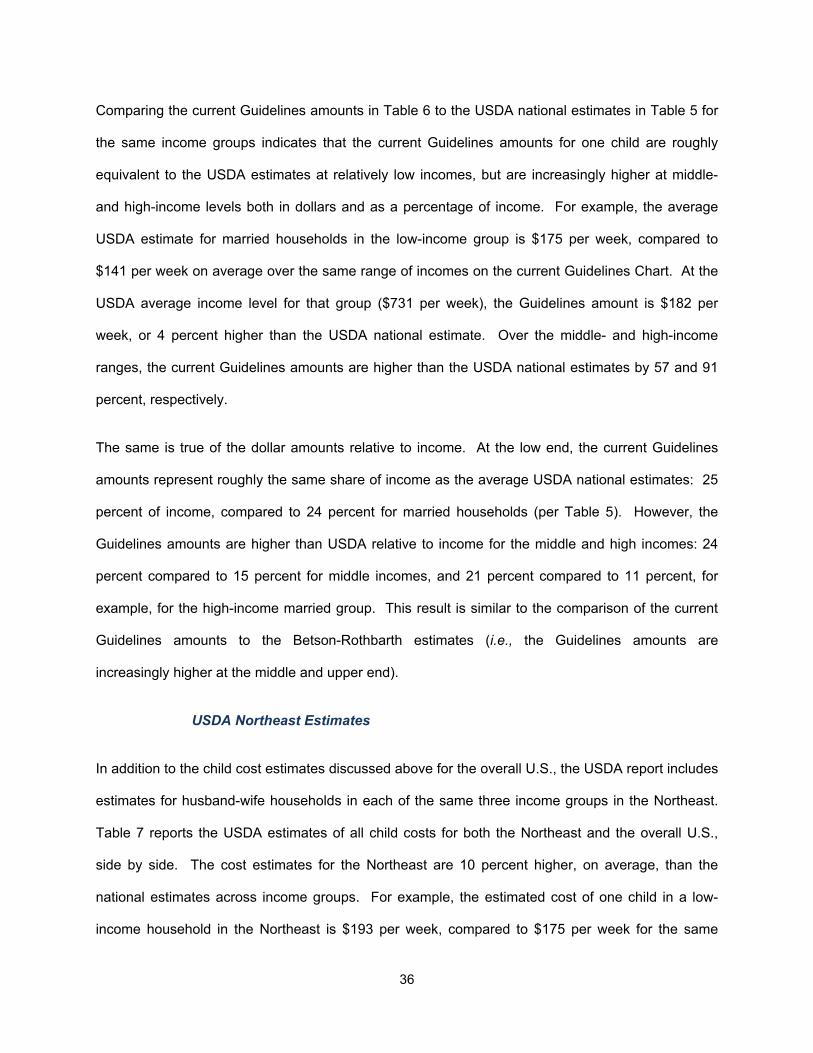
36
Comparing the current Guidelines amounts in Table 6 to the USDA national estimates in Table 5 for
the same income groups indicates that the current Guidelines amounts for one child are roughly
equivalent to the USDA estimates at relatively low incomes, but are increasingly higher at middle-
and high-income levels both in dollars and as a percentage of income. For example, the average
USDA estimate for married households in the low-income group is $175 per week, compared to
$141 per week on average over the same range of incomes on the current Guidelines Chart. At the
USDA average income level for that group ($731 per week), the Guidelines amount is $182 per
week, or 4 percent higher than the USDA national estimate. Over the middle- and high-income
ranges, the current Guidelines amounts are higher than the USDA national estimates by 57 and 91
percent, respectively.
The same is true of the dollar amounts relative to income. At the low end, the current Guidelines
amounts represent roughly the same share of income as the average USDA national estimates: 25
percent of income, compared to 24 percent for married households (per Table 5). However, the
Guidelines amounts are higher than USDA relative to income for the middle and high incomes: 24
percent compared to 15 percent for middle incomes, and 21 percent compared to 11 percent, for
example, for the high-income married group. This result is similar to the comparison of the current
Guidelines amounts to the Betson-Rothbarth estimates (i.e., the Guidelines amounts are
increasingly higher at the middle and upper end).
USDA Northeast Estimates
In addition to the child cost estimates discussed above for the overall U.S., the USDA report includes
estimates for husband-wife households in each of the same three income groups in the Northeast.
Table 7 reports the USDA estimates of all child costs for both the Northeast and the overall U.S.,
side by side. The cost estimates for the Northeast are 10 percent higher, on average, than the
national estimates across income groups. For example, the estimated cost of one child in a low-
income household in the Northeast is $193 per week, compared to $175 per week for the same
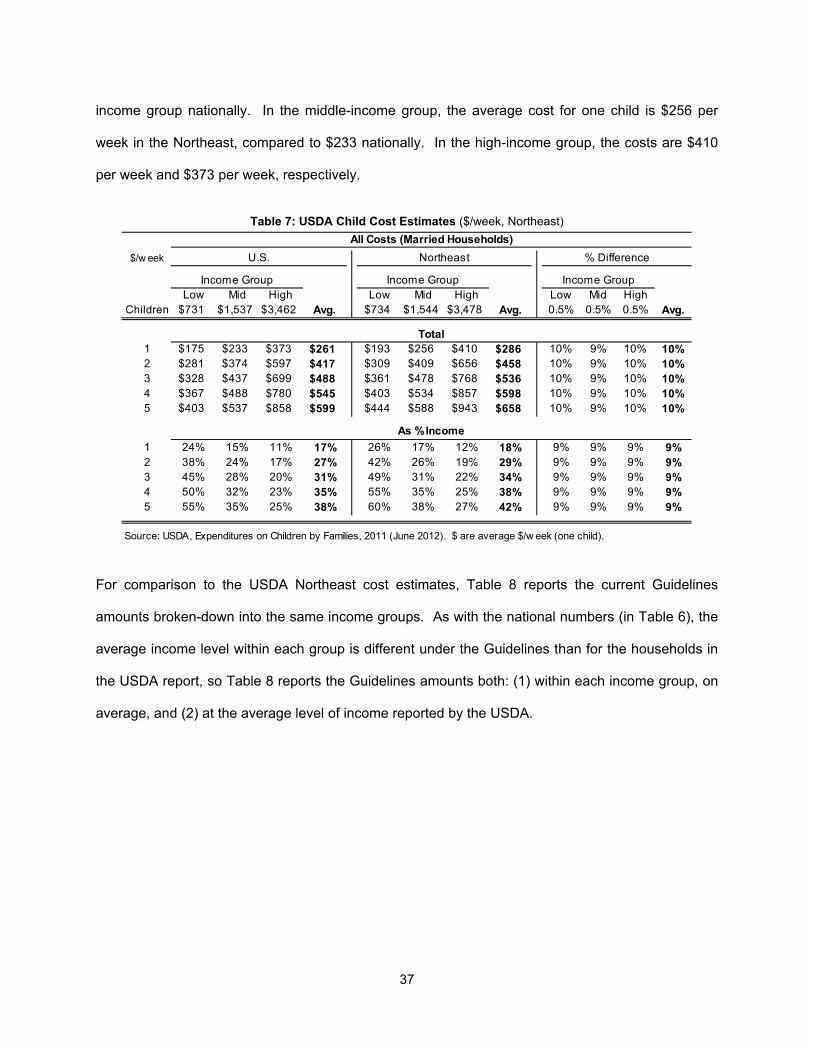
37
income group nationally. In the middle-income group, the average cost for one child is $256 per
week in the Northeast, compared to $233 nationally. In the high-income group, the costs are $410
per week and $373 per week, respectively.
Table 7: USDA Child Cost Estimates ($/week, Northeast)
For comparison to the USDA Northeast cost estimates, Table 8 reports the current Guidelines
amounts broken-down into the same income groups. As with the national numbers (in Table 6), the
average income level within each group is different under the Guidelines than for the households in
the USDA report, so Table 8 reports the Guidelines amounts both: (1) within each income group, on
average, and (2) at the average level of income reported by the USDA.
All Costs (Married Households)
$/w eek U.S. Northeast % Difference
Income Group Income Group Income GroupLow Mid High Low Mid High Low Mid High
Children $731 $1,537 $3,462 Avg. $734 $1,544 $3,478 Avg. 0.5% 0.5% 0.5% Avg.
Total1 $175 $233 $373 $261 $193 $256 $410 $286 10% 9% 10% 10%2 $281 $374 $597 $417 $309 $409 $656 $458 10% 9% 10% 10%3 $328 $437 $699 $488 $361 $478 $768 $536 10% 9% 10% 10%4 $367 $488 $780 $545 $403 $534 $857 $598 10% 9% 10% 10%5 $403 $537 $858 $599 $444 $588 $943 $658 10% 9% 10% 10%
As % Income
1 24% 15% 11% 17% 26% 17% 12% 18% 9% 9% 9% 9%2 38% 24% 17% 27% 42% 26% 19% 29% 9% 9% 9% 9%3 45% 28% 20% 31% 49% 31% 22% 34% 9% 9% 9% 9%4 50% 32% 23% 35% 55% 35% 25% 38% 9% 9% 9% 9%5 55% 35% 25% 38% 60% 38% 27% 42% 9% 9% 9% 9%
Source: USDA, Expenditures on Children by Families, 2011 (June 2012). $ are average $/w eek (one child).
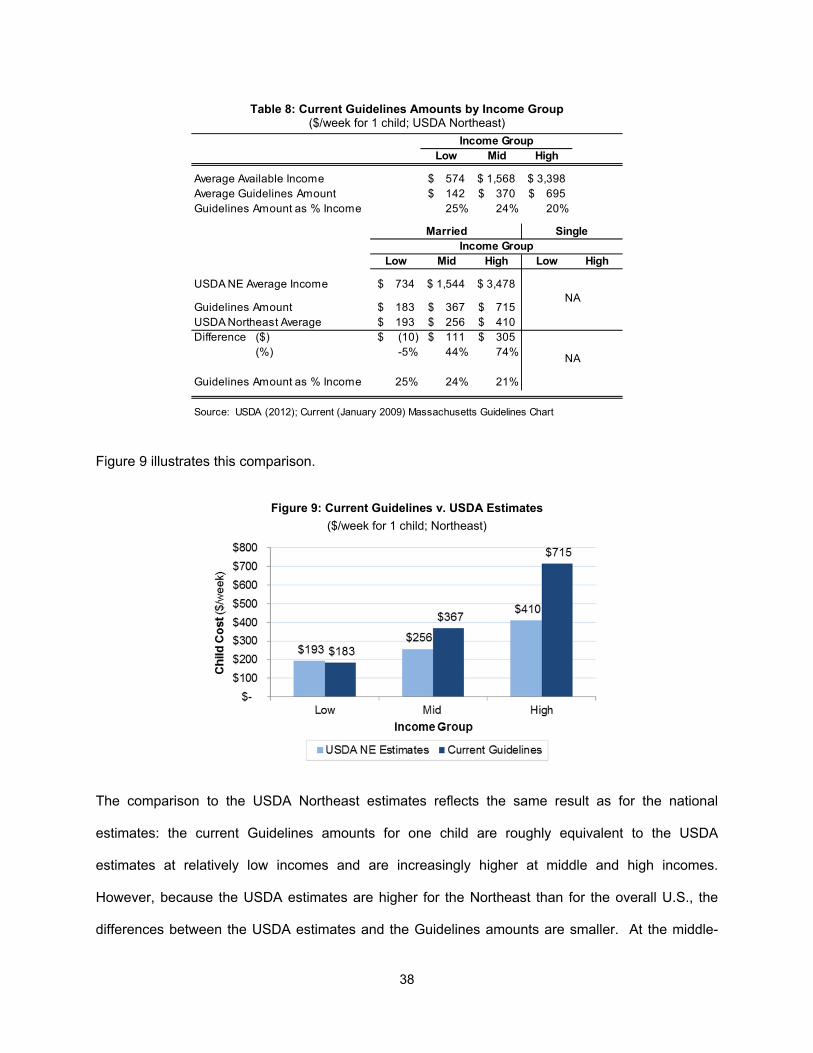
38
Table 8: Current Guidelines Amounts by Income Group ($/week for 1 child; USDA Northeast)
Figure 9 illustrates this comparison.
Figure 9: Current Guidelines v. USDA Estimates
($/week for 1 child; Northeast)
The comparison to the USDA Northeast estimates reflects the same result as for the national
estimates: the current Guidelines amounts for one child are roughly equivalent to the USDA
estimates at relatively low incomes and are increasingly higher at middle and high incomes.
However, because the USDA estimates are higher for the Northeast than for the overall U.S., the
differences between the USDA estimates and the Guidelines amounts are smaller. At the middle-
Income GroupLow Mid High
Average Available Income 574$ 1,568$ 3,398$ Average Guidelines Amount 142$ 370$ 695$ Guidelines Amount as % Income 25% 24% 20%
Married SingleIncome Group
Low Mid High Low High
USDA NE Average Income 734$ 1,544$ 3,478$
Guidelines Amount 183$ 367$ 715$ USDA Northeast Average 193$ 256$ 410$ Difference ($) (10)$ 111$ 305$
(%) -5% 44% 74%
Guidelines Amount as % Income 25% 24% 21%
Source: USDA (2012); Current (January 2009) Massachusetts Guidelines Chart
NA
NA
39
income level, for example, the difference is 44 percent, on average (rather than 57 percent), with the
USDA estimating child costs of $256 per week relative to the current Massachusetts Guidelines
amount of $367 per week.
3. Guidelines Amounts in Neighboring States
Another potentially interesting basis of comparison for the current Guidelines is how they compare to
other states. For illustration, we compared the current Guidelines to the guidelines in each of the
five states bordering Massachusetts: Connecticut, New Hampshire, New York, Rhode Island, and
Vermont. As we pointed out previously, child support guidelines in four of these five states
(Connecticut, New Hampshire, Rhode Island, and Vermont) use the Income Shares approach, while
New York uses a Percent of Payor Income approach. Three of these five states (New Hampshire,
Rhode Island and Vermont) reviewed their guidelines in 2012. As previously noted, New Hampshire
shifted in 2012 from a Percent of Payor approach to an Income Shares approach, effective July 1,
2013.
Currently, the NH guidelines amounts vary only according to the number of children: 25 percent of
net income for one child, 33 percent for two children, 40percent for three children, and 45 percent for
four or more children, regardless of income. Under the new guidelines as of July 1, 2013, those
percentages will change to declining percentages of income. For example, child support will range
from 19 to 26 percent of net income for one child, depending on the income level. The
corresponding ranges for two, three, and four or more children are 26 to 36 percent, 31 to 43
percent, and 34 to 45 percent, respectively. In effect, New Hampshire’s new guidelines simply
create an Income Shares range around the current percentages. Relative to New Hampshire’s
current guidelines, the new percentages lead to lower child support amounts at all but the lowest
income levels, and increasingly lower amounts as income increases. On average, child support
amounts under the July 2013 New Hampshire guidelines will be approximately 15 to 20 percent
lower, depending on the income level and number of children.
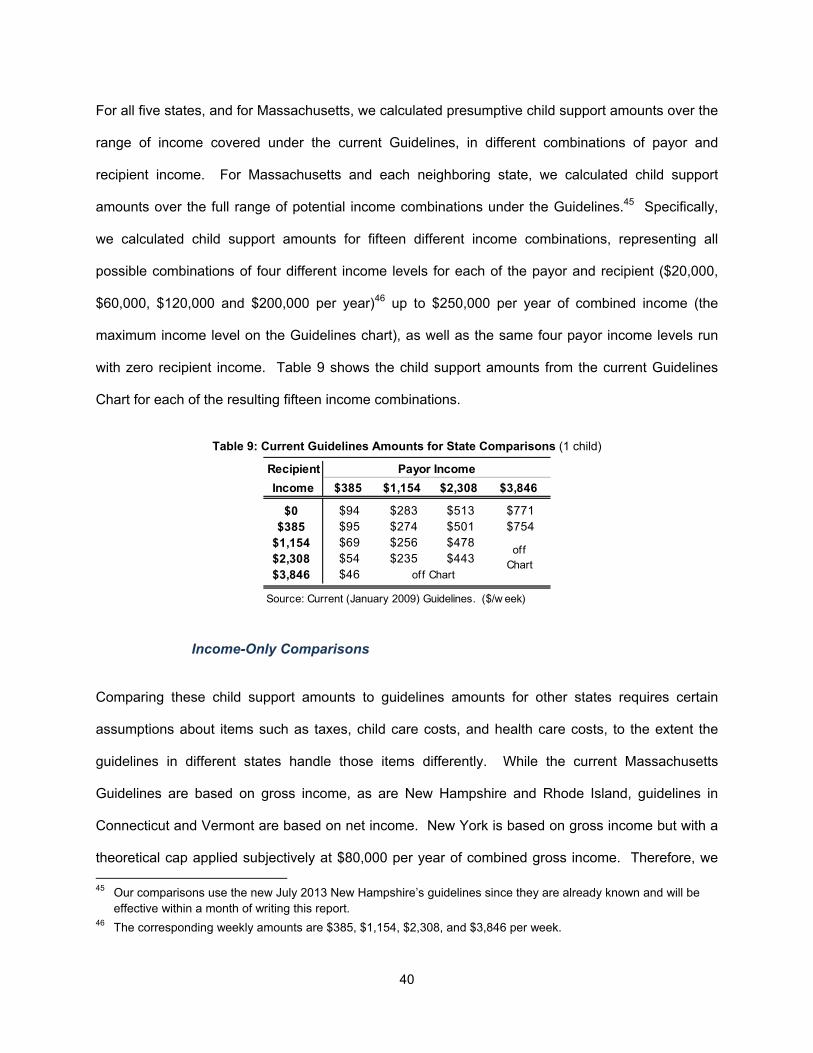
40
For all five states, and for Massachusetts, we calculated presumptive child support amounts over the
range of income covered under the current Guidelines, in different combinations of payor and
recipient income. For Massachusetts and each neighboring state, we calculated child support
amounts over the full range of potential income combinations under the Guidelines.45 Specifically,
we calculated child support amounts for fifteen different income combinations, representing all
possible combinations of four different income levels for each of the payor and recipient ($20,000,
$60,000, $120,000 and $200,000 per year)46 up to $250,000 per year of combined income (the
maximum income level on the Guidelines chart), as well as the same four payor income levels run
with zero recipient income. Table 9 shows the child support amounts from the current Guidelines
Chart for each of the resulting fifteen income combinations.
Table 9: Current Guidelines Amounts for State Comparisons (1 child)
Income-Only Comparisons
Comparing these child support amounts to guidelines amounts for other states requires certain
assumptions about items such as taxes, child care costs, and health care costs, to the extent the
guidelines in different states handle those items differently. While the current Massachusetts
Guidelines are based on gross income, as are New Hampshire and Rhode Island, guidelines in
Connecticut and Vermont are based on net income. New York is based on gross income but with a
theoretical cap applied subjectively at $80,000 per year of combined gross income. Therefore, we 45 Our comparisons use the new July 2013 New Hampshire’s guidelines since they are already known and will be
effective within a month of writing this report. 46 The corresponding weekly amounts are $385, $1,154, $2,308, and $3,846 per week.
Recipient Payor Income
Income $385 $1,154 $2,308 $3,846
$0 $94 $283 $513 $771$385 $95 $274 $501 $754
$1,154 $69 $256 $478$2,308 $54 $235 $443$3,846 $46 off Chart
Source: Current (January 2009) Guidelines. ($/w eek)
off Chart
41
calculated the guidelines amounts for each of those three states using the net income equivalents of
the various gross income numbers we used for Massachusetts.
Likewise, the current Massachusetts Guidelines account for the costs of child care and health care
as deductions from gross income in computing available income on which the amount of child
support is based. New Hampshire, Rhode Island, and Vermont also deduct health care costs from
gross income, but only New Hampshire also deducts child care costs. Connecticut and New York
adjust their child support amounts directly to account for health care costs, rather than deducting
them from income, as do all of the neighboring states except New Hampshire for child care costs.
The adjustments for child care costs and health care costs in each state differ across states, as do
the typical amounts of the costs themselves. For simplicity, therefore, our comparisons assume no
child care or health care costs. To that extent, our calculations may overstate the differences in child
support amounts between Massachusetts and neighboring states whose guidelines directly adjust
for those costs, resulting in higher guidelines amounts in cases where such costs are present.47
The resulting guidelines amounts for one child for a given income combination sometimes are similar
and sometimes vary widely across states due to differences in both the structure and percentages of
each state’s guidelines. For example, the guidelines amount for a low-income payor ($20,000 per
year) and a recipient with no income are 18 percent of the payor’s gross income for Rhode Island,
24 percent for Vermont, 21 percent for Connecticut, and 22 percent for New Hampshire. Only New
York’s flat 17 percent of income is very different, by design. The guidelines amounts at higher
income combinations are more varied. The guidelines amounts for a relatively high-income payor
($120,000 per year) and a recipient with no income, for example, range from 12 percent of the
payor’s gross income (in Vermont) to 15 percent (in New Hampshire and New York). Table 10
47 To test the sensitivity of our comparisons to the presence of child care costs and health care costs, we also ran
comparisons to the July 2013 New Hampshire guidelines including costs. We discuss those results below.
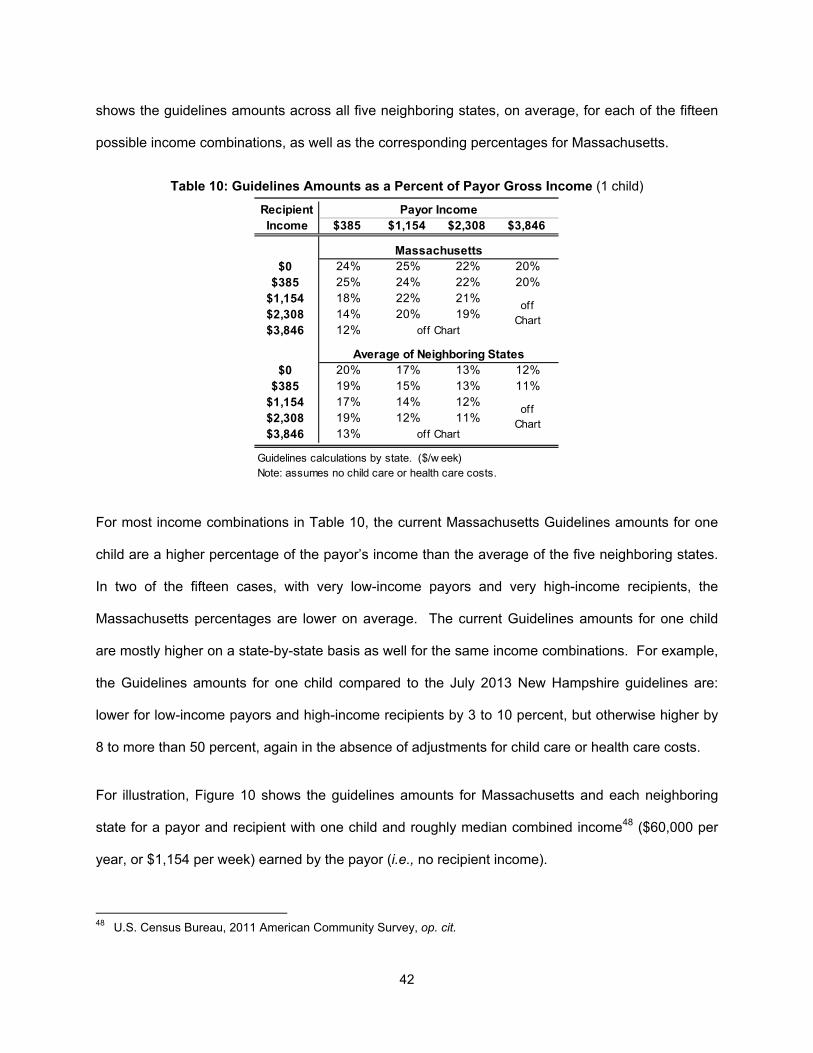
42
shows the guidelines amounts across all five neighboring states, on average, for each of the fifteen
possible income combinations, as well as the corresponding percentages for Massachusetts.
Table 10: Guidelines Amounts as a Percent of Payor Gross Income (1 child)
For most income combinations in Table 10, the current Massachusetts Guidelines amounts for one
child are a higher percentage of the payor’s income than the average of the five neighboring states.
In two of the fifteen cases, with very low-income payors and very high-income recipients, the
Massachusetts percentages are lower on average. The current Guidelines amounts for one child
are mostly higher on a state-by-state basis as well for the same income combinations. For example,
the Guidelines amounts for one child compared to the July 2013 New Hampshire guidelines are:
lower for low-income payors and high-income recipients by 3 to 10 percent, but otherwise higher by
8 to more than 50 percent, again in the absence of adjustments for child care or health care costs.
For illustration, Figure 10 shows the guidelines amounts for Massachusetts and each neighboring
state for a payor and recipient with one child and roughly median combined income48 ($60,000 per
year, or $1,154 per week) earned by the payor (i.e., no recipient income).
48 U.S. Census Bureau, 2011 American Community Survey, op. cit.
Recipient Payor IncomeIncome $385 $1,154 $2,308 $3,846
Massachusetts$0 24% 25% 22% 20%
$385 25% 24% 22% 20%$1,154 18% 22% 21%$2,308 14% 20% 19%$3,846 12% off Chart
Average of Neighboring States$0 20% 17% 13% 12%
$385 19% 15% 13% 11%$1,154 17% 14% 12%$2,308 19% 12% 11%$3,846 13% off Chart
Guidelines calculations by state. ($/w eek)Note: assumes no child care or health care costs.
off Chart
off Chart
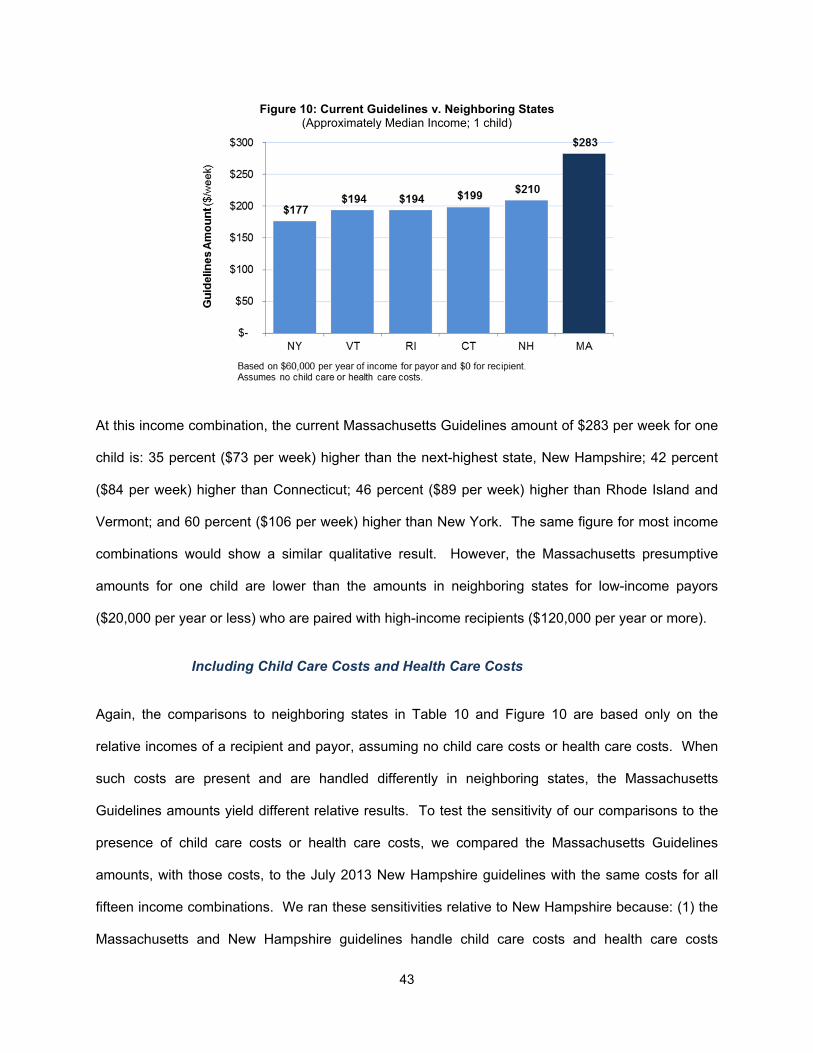
43
Figure 10: Current Guidelines v. Neighboring States (Approximately Median Income; 1 child)
At this income combination, the current Massachusetts Guidelines amount of $283 per week for one
child is: 35 percent ($73 per week) higher than the next-highest state, New Hampshire; 42 percent
($84 per week) higher than Connecticut; 46 percent ($89 per week) higher than Rhode Island and
Vermont; and 60 percent ($106 per week) higher than New York. The same figure for most income
combinations would show a similar qualitative result. However, the Massachusetts presumptive
amounts for one child are lower than the amounts in neighboring states for low-income payors
($20,000 per year or less) who are paired with high-income recipients ($120,000 per year or more).
Including Child Care Costs and Health Care Costs
Again, the comparisons to neighboring states in Table 10 and Figure 10 are based only on the
relative incomes of a recipient and payor, assuming no child care costs or health care costs. When
such costs are present and are handled differently in neighboring states, the Massachusetts
Guidelines amounts yield different relative results. To test the sensitivity of our comparisons to the
presence of child care costs or health care costs, we compared the Massachusetts Guidelines
amounts, with those costs, to the July 2013 New Hampshire guidelines with the same costs for all
fifteen income combinations. We ran these sensitivities relative to New Hampshire because: (1) the
Massachusetts and New Hampshire guidelines handle child care costs and health care costs
44
differently, and (2) the no-cost New Hampshire guidelines amounts (i.e., excluding child care costs
and health care costs) are the closest of the neighboring states to the Massachusetts Guidelines
amounts.
Under the Massachusetts guidelines, out-of-pocket child care costs and health insurance costs are
deducted from the incomes of a payor and a recipient, and the combined child support amount is
calculated based on the remaining combined available income. To determine the combined support
amount, the New Hampshire guidelines only deduct a payor’s cost of health insurance coverage,
and only for the children covered by an order (i.e., not the full cost of health insurance, like
Massachusetts).49 A recipient’s income is adjusted for any cost of the children’s health insurance or
child care only after the combined support amount is determined, and then the combined support
amount is prorated between a payor and a recipient based on their respective incomes adjusted for
all costs.
To compare guidelines amounts with child care costs and health care costs requires an assumption
about the magnitude of those costs. Our comparisons are based on the average costs reported for
Massachusetts. Child care costs average at least $109 per week for Massachusetts, and $99 per
week nationally, depending on a child’s age.50 Our comparisons assumed $100 per week. The
average cost of a family health plan in Massachusetts is $326 per week, and single coverage is 35
percent of that cost.51 Employers usually pay some part of health care premiums, say 50 percent, so
the corresponding out-of-pocket health insurance cost is $162 per week. So our comparisons
assumed $160 per week for a family plan and $56 per week (i.e., 35 percent of $160) to cover a
child. We used these costs in all scenarios with sufficient income to warrant them. For example, in
the scenarios with zero recipient income, we assumed zero costs for the recipient. Also, the New
49 Both states deduct health insurance costs. However, Massachusetts deducts the full cost, while New Hampshire
deducts only the child’s portion of the cost and also applies a 4% “reasonable cost” threshold. 50 See Table 13 below. 51 See Figure 16 and related text below.
45
Hampshire guidelines cap the “reasonable cost” of children’s health insurance at 4 percent of a
payor’s gross income. So our comparisons used the lesser of $56 per week or 4 percent of income.
Including child care and health care costs in our comparisons of Massachusetts and New Hampshire
guidelines amounts for one child resulted in different numbers but the same qualitative result: the
Massachusetts amounts are still higher for most income scenarios, but by less than in the income-
only comparisons. For example, at approximately median payor income ($60,000 per year) and no
recipient income, with $160 per month in health insurance costs, the guidelines amount is $248 per
week in Massachusetts, or 22 percent higher than the $204 per week under New Hampshire’s July
2013 guidelines. The guidelines amounts for the same income scenario with no costs were $283
and $210 per week, respectively, a 35 percent difference. The differences between are wider at
higher incomes. As before, only in cases of low-income payors are the Massachusetts guideline
amounts for one child lower than the New Hampshire amounts, by approximately 20 percent, on
average; the Massachusetts amounts are otherwise higher, even after accounting for the differences
in handling child care costs and health care costs.52
4. Marginal Increases for Additional Children
So far, the comparisons discussed reflect the cost of one child. Relative to the current Betson-
Rothbarth child cost estimates, USDA estimates, and guidelines amounts in neighboring states, the
current Massachusetts Guidelines amounts for one child are relatively high, especially at middle and
high incomes. However, the comparisons for one child reflect only the percentages in Table A on
the Guidelines Worksheet and the amounts on the resulting Guidelines Chart. We have not yet
discussed how the scale factors in Table B on the Worksheet, which apply in cases with two to five
children, compare with available benchmarks. This section reports the results of those comparisons.
52 We note the analogous results for two and three children in the next section.
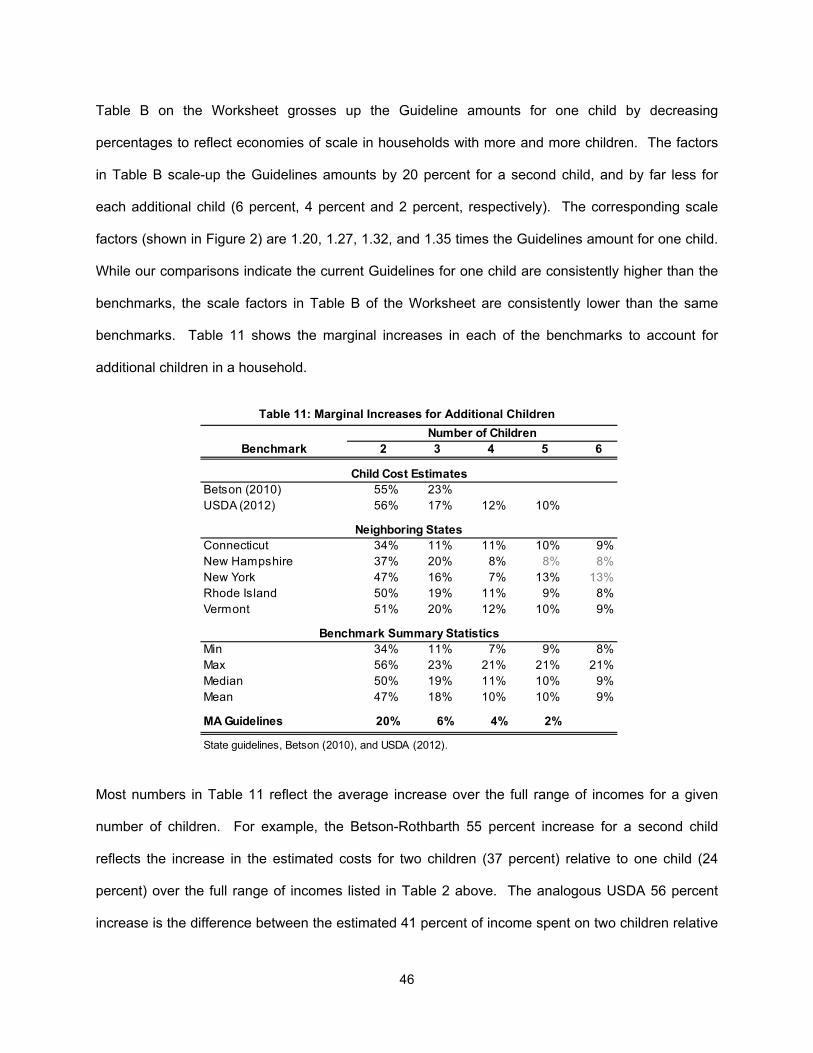
46
Table B on the Worksheet grosses up the Guideline amounts for one child by decreasing
percentages to reflect economies of scale in households with more and more children. The factors
in Table B scale-up the Guidelines amounts by 20 percent for a second child, and by far less for
each additional child (6 percent, 4 percent and 2 percent, respectively). The corresponding scale
factors (shown in Figure 2) are 1.20, 1.27, 1.32, and 1.35 times the Guidelines amount for one child.
While our comparisons indicate the current Guidelines for one child are consistently higher than the
benchmarks, the scale factors in Table B of the Worksheet are consistently lower than the same
benchmarks. Table 11 shows the marginal increases in each of the benchmarks to account for
additional children in a household.
Table 11: Marginal Increases for Additional Children
Most numbers in Table 11 reflect the average increase over the full range of incomes for a given
number of children. For example, the Betson-Rothbarth 55 percent increase for a second child
reflects the increase in the estimated costs for two children (37 percent) relative to one child (24
percent) over the full range of incomes listed in Table 2 above. The analogous USDA 56 percent
increase is the difference between the estimated 41 percent of income spent on two children relative
Number of ChildrenBenchmark 2 3 4 5 6
Child Cost EstimatesBetson (2010) 55% 23%USDA (2012) 56% 17% 12% 10%
Neighboring StatesConnecticut 34% 11% 11% 10% 9%New Hampshire 37% 20% 8% 8% 8%New York 47% 16% 7% 13% 13%Rhode Island 50% 19% 11% 9% 8%Vermont 51% 20% 12% 10% 9%
Benchmark Summary StatisticsMin 34% 11% 7% 9% 8%Max 56% 23% 21% 21% 21%Median 50% 19% 11% 10% 9%Mean 47% 18% 10% 10% 9%
MA Guidelines 20% 6% 4% 2%
State guidelines, Betson (2010), and USDA (2012).
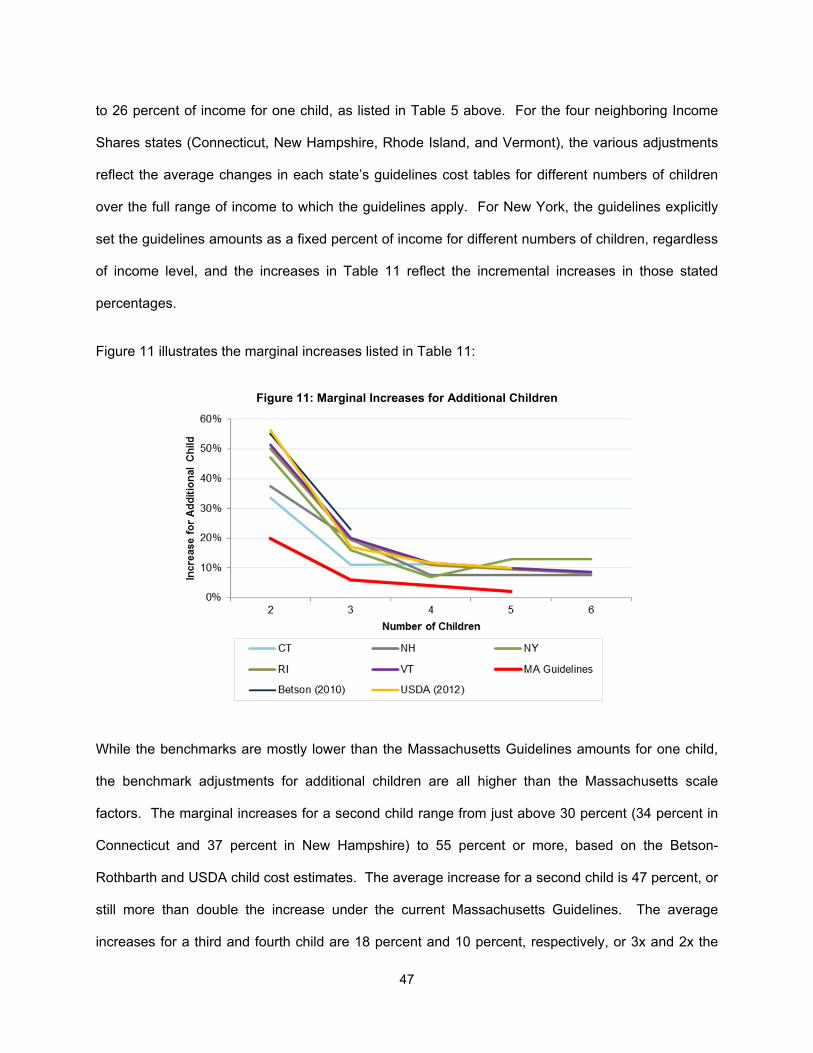
47
to 26 percent of income for one child, as listed in Table 5 above. For the four neighboring Income
Shares states (Connecticut, New Hampshire, Rhode Island, and Vermont), the various adjustments
reflect the average changes in each state’s guidelines cost tables for different numbers of children
over the full range of income to which the guidelines apply. For New York, the guidelines explicitly
set the guidelines amounts as a fixed percent of income for different numbers of children, regardless
of income level, and the increases in Table 11 reflect the incremental increases in those stated
percentages.
Figure 11 illustrates the marginal increases listed in Table 11:
Figure 11: Marginal Increases for Additional Children
While the benchmarks are mostly lower than the Massachusetts Guidelines amounts for one child,
the benchmark adjustments for additional children are all higher than the Massachusetts scale
factors. The marginal increases for a second child range from just above 30 percent (34 percent in
Connecticut and 37 percent in New Hampshire) to 55 percent or more, based on the Betson-
Rothbarth and USDA child cost estimates. The average increase for a second child is 47 percent, or
still more than double the increase under the current Massachusetts Guidelines. The average
increases for a third and fourth child are 18 percent and 10 percent, respectively, or 3x and 2x the
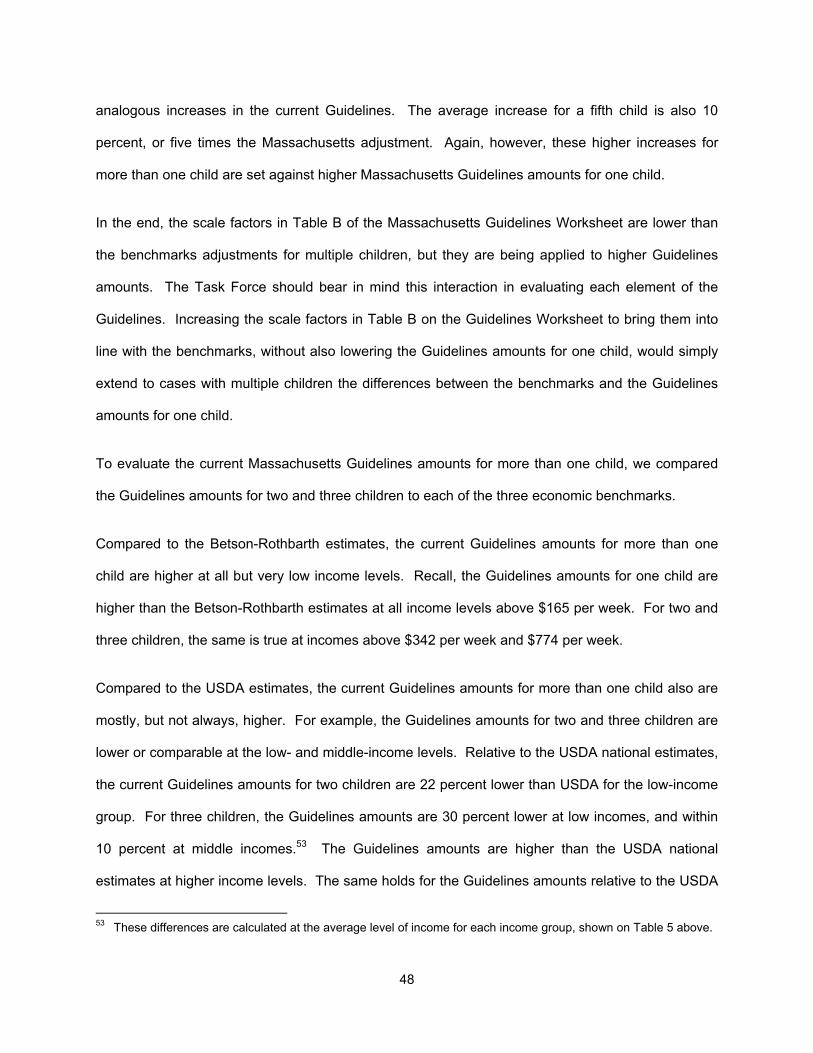
48
analogous increases in the current Guidelines. The average increase for a fifth child is also 10
percent, or five times the Massachusetts adjustment. Again, however, these higher increases for
more than one child are set against higher Massachusetts Guidelines amounts for one child.
In the end, the scale factors in Table B of the Massachusetts Guidelines Worksheet are lower than
the benchmarks adjustments for multiple children, but they are being applied to higher Guidelines
amounts. The Task Force should bear in mind this interaction in evaluating each element of the
Guidelines. Increasing the scale factors in Table B on the Guidelines Worksheet to bring them into
line with the benchmarks, without also lowering the Guidelines amounts for one child, would simply
extend to cases with multiple children the differences between the benchmarks and the Guidelines
amounts for one child.
To evaluate the current Massachusetts Guidelines amounts for more than one child, we compared
the Guidelines amounts for two and three children to each of the three economic benchmarks.
Compared to the Betson-Rothbarth estimates, the current Guidelines amounts for more than one
child are higher at all but very low income levels. Recall, the Guidelines amounts for one child are
higher than the Betson-Rothbarth estimates at all income levels above $165 per week. For two and
three children, the same is true at incomes above $342 per week and $774 per week.
Compared to the USDA estimates, the current Guidelines amounts for more than one child also are
mostly, but not always, higher. For example, the Guidelines amounts for two and three children are
lower or comparable at the low- and middle-income levels. Relative to the USDA national estimates,
the current Guidelines amounts for two children are 22 percent lower than USDA for the low-income
group. For three children, the Guidelines amounts are 30 percent lower at low incomes, and within
10 percent at middle incomes.53 The Guidelines amounts are higher than the USDA national
estimates at higher income levels. The same holds for the Guidelines amounts relative to the USDA
53 These differences are calculated at the average level of income for each income group, shown on Table 5 above.
49
Northeast child cost estimates: the Guidelines amounts for two children are 29 percent lower than
USDA at low incomes, within 10 percent at middle incomes, and higher at high incomes. For three
children, the Guidelines are 36 percent lower at low incomes, 2 percent lower at middle incomes,
and higher at high incomes.
Relative to neighboring states, the current Massachusetts Guidelines amounts for more than one
child are higher in most, but not all, cases. They tend to be lower than neighboring states for low-
income payors paired with high-income recipients and otherwise higher, but by less than the
differences in the amounts for one child. For example, where the current Guidelines for two children
are higher for the income combinations we considered, they are within 12 percent of New Hampshire
guidelines amounts. Compared to other neighboring states, the current Guidelines amounts for two
children are relatively higher.
Figure 12 compares the guidelines amounts for two children at $60,000 per year ($1,154 per week)
of payor income and no recipient income (i.e., analogous to Figure 10 above, but for two children
rather than one child). At this income combination, the current Massachusetts Guidelines amount of
$340 per week for two children is: 14 percent ($43 per week) higher than Rhode Island; 15 percent
($44 per week) higher than Vermont; 18 percent ($52 per week) higher than New Hampshire (2013);
24 percent ($65 per week) higher than Connecticut;; and 31 percent ($80 per week) higher than New
York.
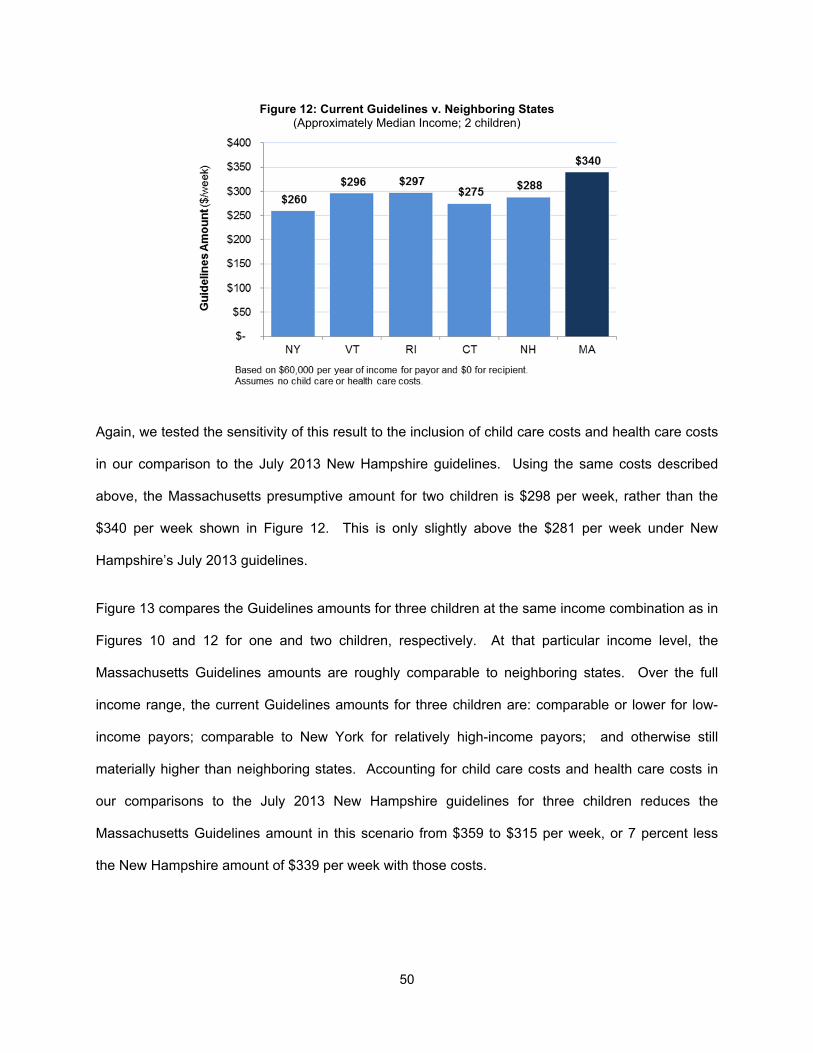
50
Figure 12: Current Guidelines v. Neighboring States (Approximately Median Income; 2 children)
Again, we tested the sensitivity of this result to the inclusion of child care costs and health care costs
in our comparison to the July 2013 New Hampshire guidelines. Using the same costs described
above, the Massachusetts presumptive amount for two children is $298 per week, rather than the
$340 per week shown in Figure 12. This is only slightly above the $281 per week under New
Hampshire’s July 2013 guidelines.
Figure 13 compares the Guidelines amounts for three children at the same income combination as in
Figures 10 and 12 for one and two children, respectively. At that particular income level, the
Massachusetts Guidelines amounts are roughly comparable to neighboring states. Over the full
income range, the current Guidelines amounts for three children are: comparable or lower for low-
income payors; comparable to New York for relatively high-income payors; and otherwise still
materially higher than neighboring states. Accounting for child care costs and health care costs in
our comparisons to the July 2013 New Hampshire guidelines for three children reduces the
Massachusetts Guidelines amount in this scenario from $359 to $315 per week, or 7 percent less
the New Hampshire amount of $339 per week with those costs.
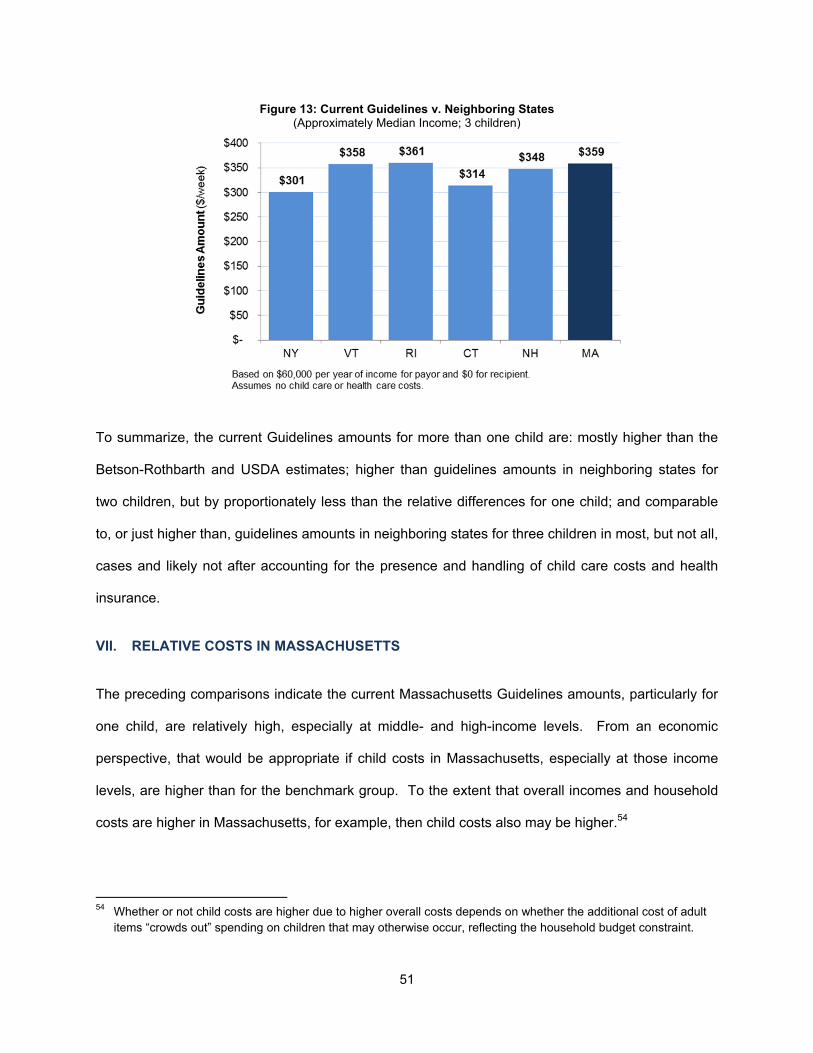
51
Figure 13: Current Guidelines v. Neighboring States (Approximately Median Income; 3 children)
To summarize, the current Guidelines amounts for more than one child are: mostly higher than the
Betson-Rothbarth and USDA estimates; higher than guidelines amounts in neighboring states for
two children, but by proportionately less than the relative differences for one child; and comparable
to, or just higher than, guidelines amounts in neighboring states for three children in most, but not all,
cases and likely not after accounting for the presence and handling of child care costs and health
insurance.
VII. RELATIVE COSTS IN MASSACHUSETTS
The preceding comparisons indicate the current Massachusetts Guidelines amounts, particularly for
one child, are relatively high, especially at middle- and high-income levels. From an economic
perspective, that would be appropriate if child costs in Massachusetts, especially at those income
levels, are higher than for the benchmark group. To the extent that overall incomes and household
costs are higher in Massachusetts, for example, then child costs also may be higher.54
54 Whether or not child costs are higher due to higher overall costs depends on whether the additional cost of adult
items “crowds out” spending on children that may otherwise occur, reflecting the household budget constraint.
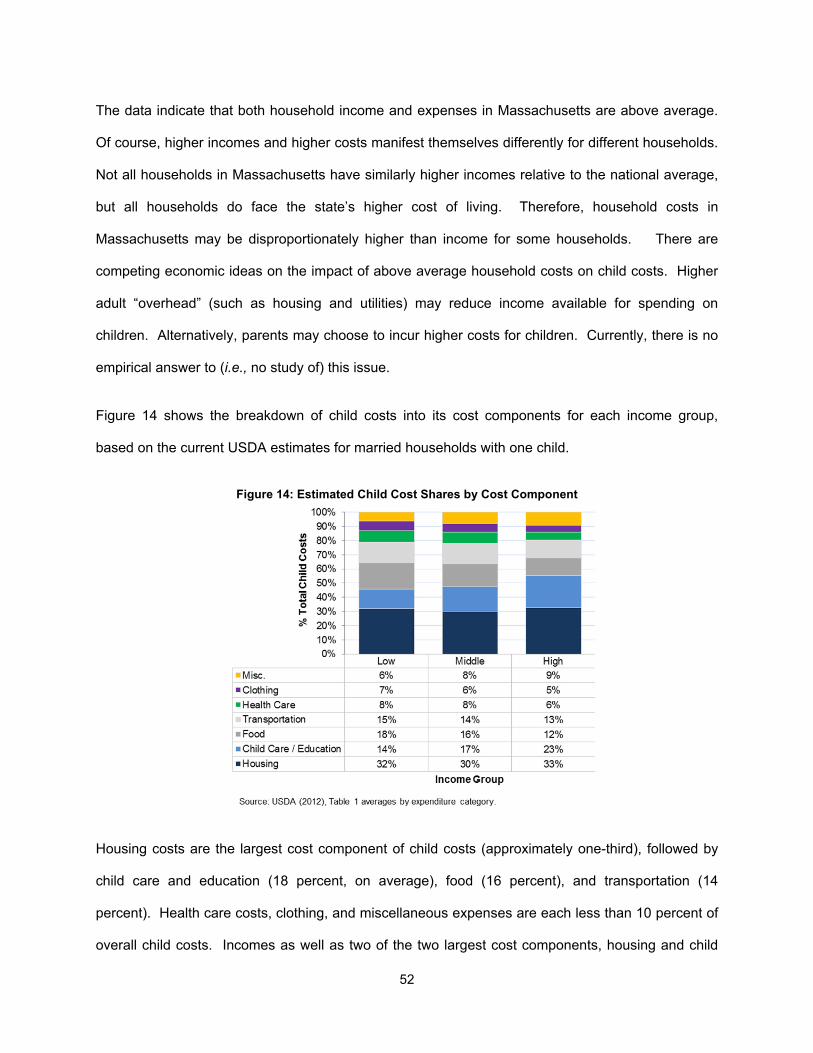
52
The data indicate that both household income and expenses in Massachusetts are above average.
Of course, higher incomes and higher costs manifest themselves differently for different households.
Not all households in Massachusetts have similarly higher incomes relative to the national average,
but all households do face the state’s higher cost of living. Therefore, household costs in
Massachusetts may be disproportionately higher than income for some households. There are
competing economic ideas on the impact of above average household costs on child costs. Higher
adult “overhead” (such as housing and utilities) may reduce income available for spending on
children. Alternatively, parents may choose to incur higher costs for children. Currently, there is no
empirical answer to (i.e., no study of) this issue.
Figure 14 shows the breakdown of child costs into its cost components for each income group,
based on the current USDA estimates for married households with one child.
Figure 14: Estimated Child Cost Shares by Cost Component
Housing costs are the largest cost component of child costs (approximately one-third), followed by
child care and education (18 percent, on average), food (16 percent), and transportation (14
percent). Health care costs, clothing, and miscellaneous expenses are each less than 10 percent of
overall child costs. Incomes as well as two of the two largest cost components, housing and child
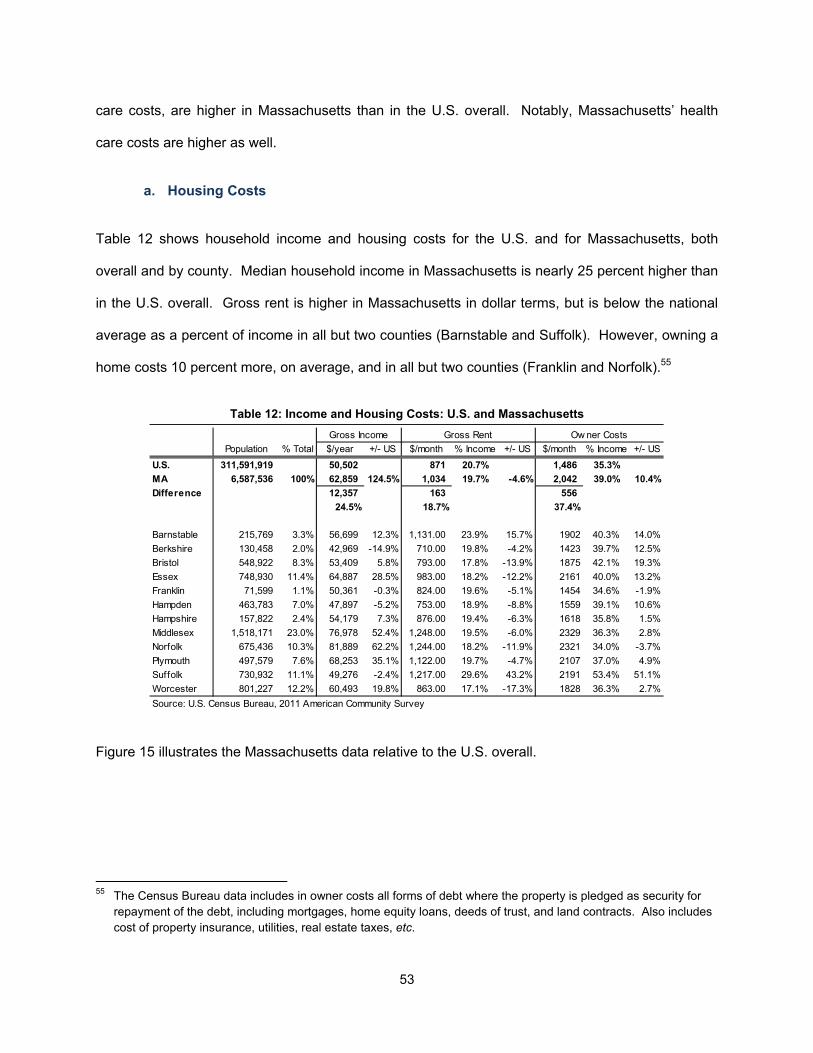
53
care costs, are higher in Massachusetts than in the U.S. overall. Notably, Massachusetts’ health
care costs are higher as well.
a. Housing Costs
Table 12 shows household income and housing costs for the U.S. and for Massachusetts, both
overall and by county. Median household income in Massachusetts is nearly 25 percent higher than
in the U.S. overall. Gross rent is higher in Massachusetts in dollar terms, but is below the national
average as a percent of income in all but two counties (Barnstable and Suffolk). However, owning a
home costs 10 percent more, on average, and in all but two counties (Franklin and Norfolk).55
Table 12: Income and Housing Costs: U.S. and Massachusetts
Figure 15 illustrates the Massachusetts data relative to the U.S. overall.
55 The Census Bureau data includes in owner costs all forms of debt where the property is pledged as security for
repayment of the debt, including mortgages, home equity loans, deeds of trust, and land contracts. Also includes cost of property insurance, utilities, real estate taxes, etc.
Gross Income Gross Rent Ow ner Costs
Population % Total $/year +/- US $/month % Income +/- US $/month % Income +/- US
U.S. 311,591,919 50,502 871 20.7% 1,486 35.3%
MA 6,587,536 100% 62,859 124.5% 1,034 19.7% -4.6% 2,042 39.0% 10.4%
Difference 12,357 163 556
24.5% 18.7% 37.4%
Barnstable 215,769 3.3% 56,699 12.3% 1,131.00 23.9% 15.7% 1902 40.3% 14.0%
Berkshire 130,458 2.0% 42,969 -14.9% 710.00 19.8% -4.2% 1423 39.7% 12.5%
Bristol 548,922 8.3% 53,409 5.8% 793.00 17.8% -13.9% 1875 42.1% 19.3%
Essex 748,930 11.4% 64,887 28.5% 983.00 18.2% -12.2% 2161 40.0% 13.2%
Franklin 71,599 1.1% 50,361 -0.3% 824.00 19.6% -5.1% 1454 34.6% -1.9%
Hampden 463,783 7.0% 47,897 -5.2% 753.00 18.9% -8.8% 1559 39.1% 10.6%
Hampshire 157,822 2.4% 54,179 7.3% 876.00 19.4% -6.3% 1618 35.8% 1.5%
Middlesex 1,518,171 23.0% 76,978 52.4% 1,248.00 19.5% -6.0% 2329 36.3% 2.8%
Norfolk 675,436 10.3% 81,889 62.2% 1,244.00 18.2% -11.9% 2321 34.0% -3.7%
Plymouth 497,579 7.6% 68,253 35.1% 1,122.00 19.7% -4.7% 2107 37.0% 4.9%
Suffolk 730,932 11.1% 49,276 -2.4% 1,217.00 29.6% 43.2% 2191 53.4% 51.1%
Worcester 801,227 12.2% 60,493 19.8% 863.00 17.1% -17.3% 1828 36.3% 2.7%
Source: U.S. Census Bureau, 2011 American Community Survey
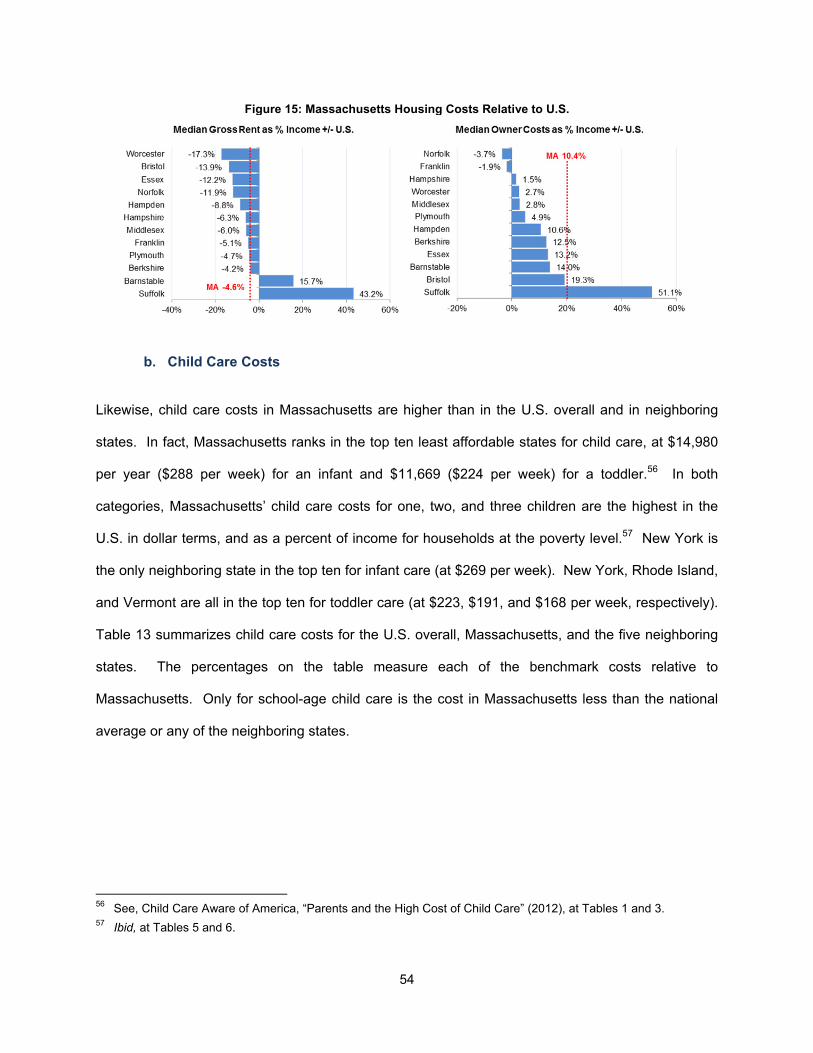
54
Figure 15: Massachusetts Housing Costs Relative to U.S.
b. Child Care Costs
Likewise, child care costs in Massachusetts are higher than in the U.S. overall and in neighboring
states. In fact, Massachusetts ranks in the top ten least affordable states for child care, at $14,980
per year ($288 per week) for an infant and $11,669 ($224 per week) for a toddler.56 In both
categories, Massachusetts’ child care costs for one, two, and three children are the highest in the
U.S. in dollar terms, and as a percent of income for households at the poverty level.57 New York is
the only neighboring state in the top ten for infant care (at $269 per week). New York, Rhode Island,
and Vermont are all in the top ten for toddler care (at $223, $191, and $168 per week, respectively).
Table 13 summarizes child care costs for the U.S. overall, Massachusetts, and the five neighboring
states. The percentages on the table measure each of the benchmark costs relative to
Massachusetts. Only for school-age child care is the cost in Massachusetts less than the national
average or any of the neighboring states.
56 See, Child Care Aware of America, “Parents and the High Cost of Child Care” (2012), at Tables 1 and 3. 57 Ibid, at Tables 5 and 6.
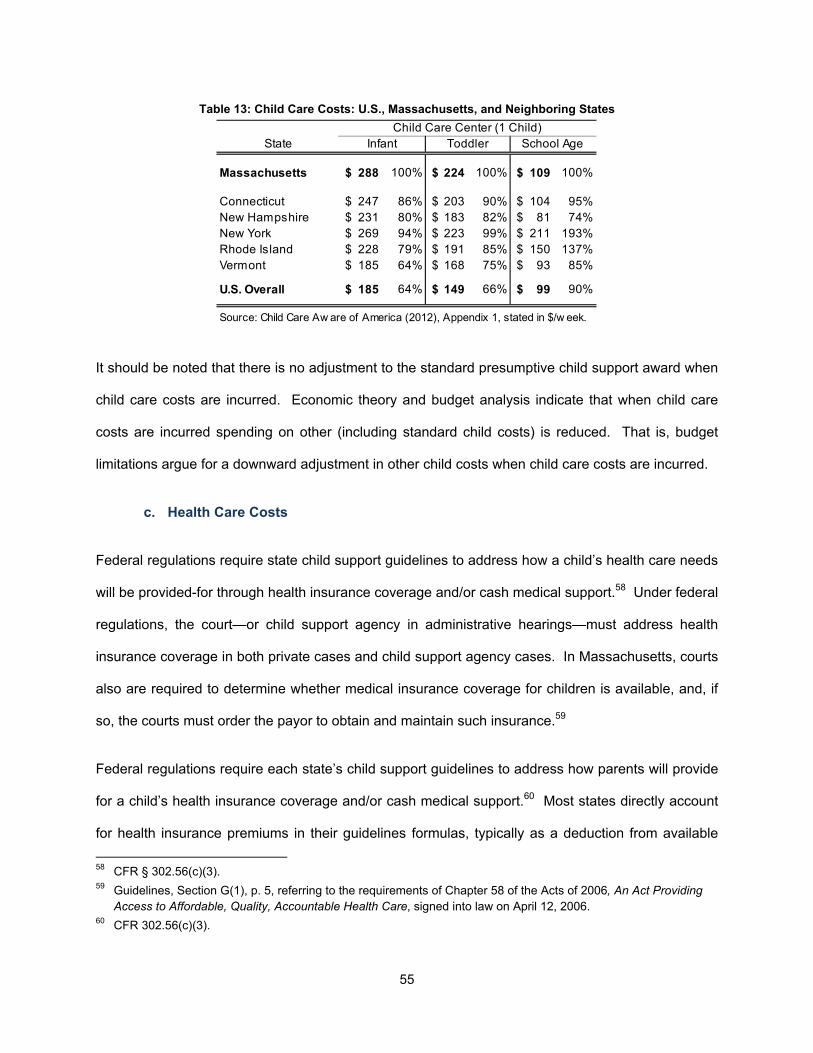
55
Table 13: Child Care Costs: U.S., Massachusetts, and Neighboring States
It should be noted that there is no adjustment to the standard presumptive child support award when
child care costs are incurred. Economic theory and budget analysis indicate that when child care
costs are incurred spending on other (including standard child costs) is reduced. That is, budget
limitations argue for a downward adjustment in other child costs when child care costs are incurred.
c. Health Care Costs
Federal regulations require state child support guidelines to address how a child’s health care needs
will be provided-for through health insurance coverage and/or cash medical support.58 Under federal
regulations, the court—or child support agency in administrative hearings—must address health
insurance coverage in both private cases and child support agency cases. In Massachusetts, courts
also are required to determine whether medical insurance coverage for children is available, and, if
so, the courts must order the payor to obtain and maintain such insurance.59
Federal regulations require each state’s child support guidelines to address how parents will provide
for a child’s health insurance coverage and/or cash medical support.60 Most states directly account
for health insurance premiums in their guidelines formulas, typically as a deduction from available
58 CFR § 302.56(c)(3). 59 Guidelines, Section G(1), p. 5, referring to the requirements of Chapter 58 of the Acts of 2006, An Act Providing
Access to Affordable, Quality, Accountable Health Care, signed into law on April 12, 2006. 60 CFR 302.56(c)(3).
Child Care Center (1 Child)State Infant Toddler School Age
Massachusetts 288$ 100% 224$ 100% 109$ 100%
Connecticut 247$ 86% 203$ 90% 104$ 95%New Hampshire 231$ 80% 183$ 82% 81$ 74%New York 269$ 94% 223$ 99% 211$ 193%Rhode Island 228$ 79% 191$ 85% 150$ 137%Vermont 185$ 64% 168$ 75% 93$ 85%
U.S. Overall 185$ 64% 149$ 66% 99$ 90%
Source: Child Care Aw are of America (2012), Appendix 1, stated in $/w eek.
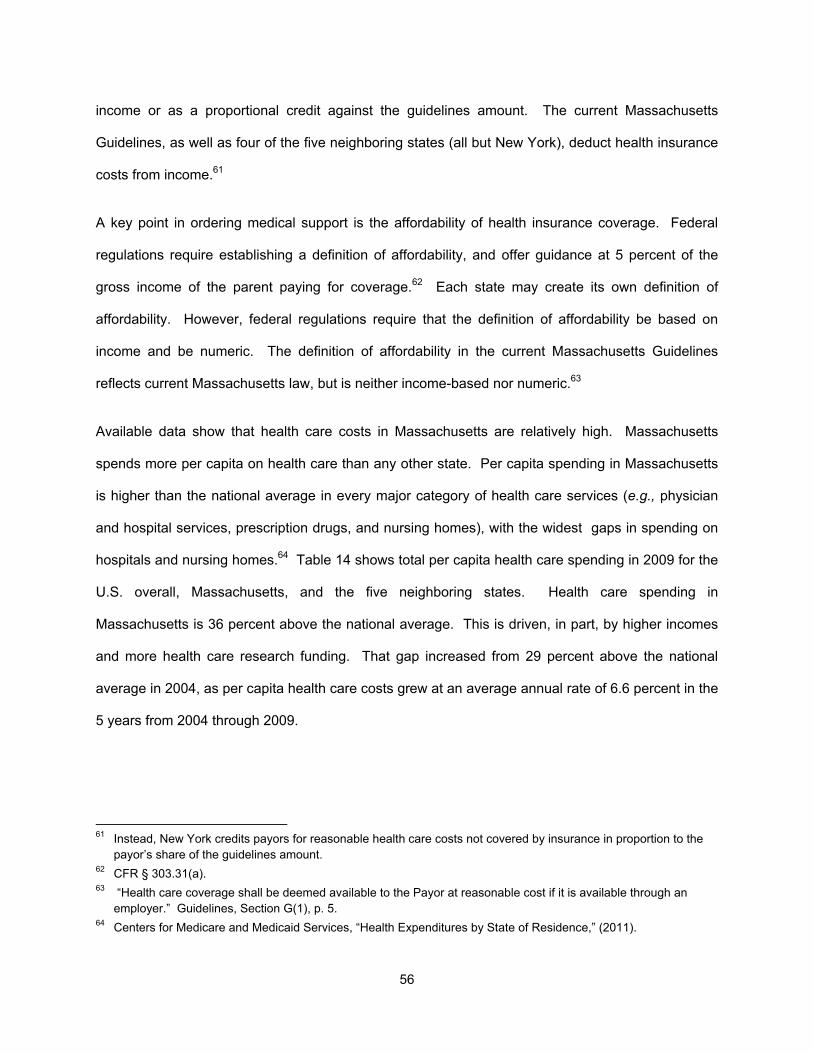
56
income or as a proportional credit against the guidelines amount. The current Massachusetts
Guidelines, as well as four of the five neighboring states (all but New York), deduct health insurance
costs from income.61
A key point in ordering medical support is the affordability of health insurance coverage. Federal
regulations require establishing a definition of affordability, and offer guidance at 5 percent of the
gross income of the parent paying for coverage.62 Each state may create its own definition of
affordability. However, federal regulations require that the definition of affordability be based on
income and be numeric. The definition of affordability in the current Massachusetts Guidelines
reflects current Massachusetts law, but is neither income-based nor numeric.63
Available data show that health care costs in Massachusetts are relatively high. Massachusetts
spends more per capita on health care than any other state. Per capita spending in Massachusetts
is higher than the national average in every major category of health care services (e.g., physician
and hospital services, prescription drugs, and nursing homes), with the widest gaps in spending on
hospitals and nursing homes.64 Table 14 shows total per capita health care spending in 2009 for the
U.S. overall, Massachusetts, and the five neighboring states. Health care spending in
Massachusetts is 36 percent above the national average. This is driven, in part, by higher incomes
and more health care research funding. That gap increased from 29 percent above the national
average in 2004, as per capita health care costs grew at an average annual rate of 6.6 percent in the
5 years from 2004 through 2009.
61 Instead, New York credits payors for reasonable health care costs not covered by insurance in proportion to the
payor’s share of the guidelines amount. 62 CFR § 303.31(a). 63 “Health care coverage shall be deemed available to the Payor at reasonable cost if it is available through an
employer.” Guidelines, Section G(1), p. 5. 64 Centers for Medicare and Medicaid Services, “Health Expenditures by State of Residence,” (2011).
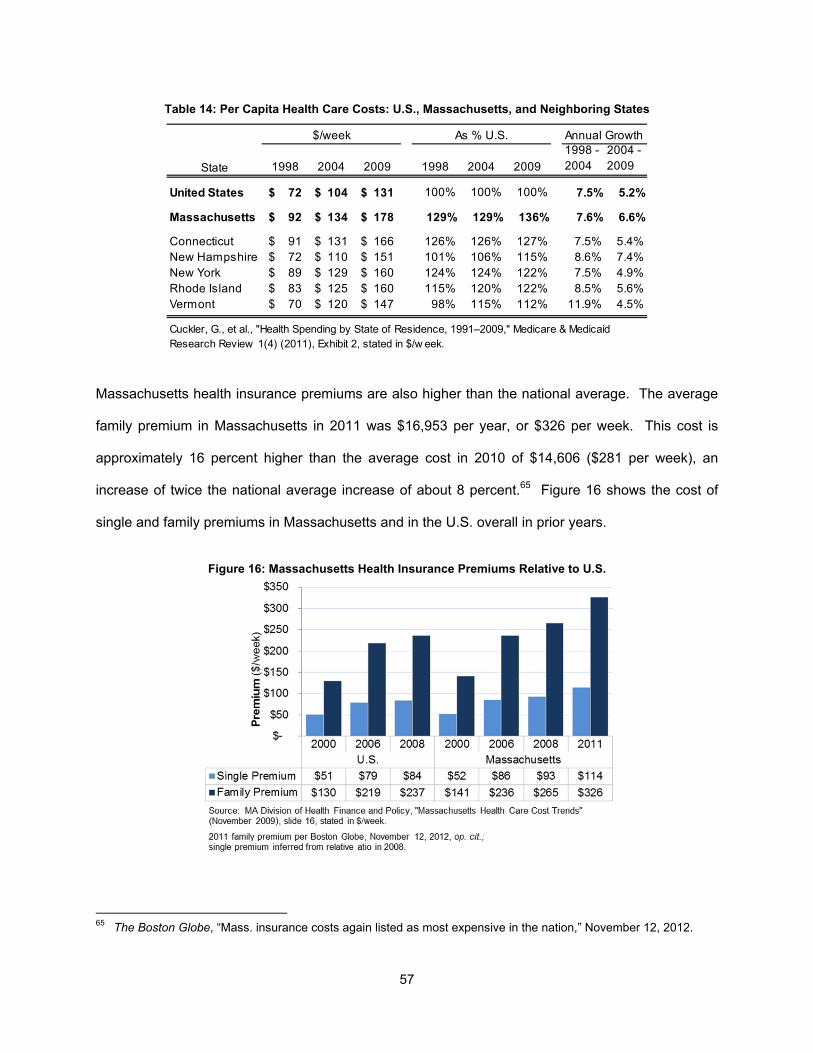
57
Table 14: Per Capita Health Care Costs: U.S., Massachusetts, and Neighboring States
Massachusetts health insurance premiums are also higher than the national average. The average
family premium in Massachusetts in 2011 was $16,953 per year, or $326 per week. This cost is
approximately 16 percent higher than the average cost in 2010 of $14,606 ($281 per week), an
increase of twice the national average increase of about 8 percent.65 Figure 16 shows the cost of
single and family premiums in Massachusetts and in the U.S. overall in prior years.
Figure 16: Massachusetts Health Insurance Premiums Relative to U.S.
65 The Boston Globe, “Mass. insurance costs again listed as most expensive in the nation,” November 12, 2012.
1998 2004 2009 1998 2004 2009
1998 - 2004
2004 - 2009
United States 72$ 104$ 131$ 100% 100% 100% 7.5% 5.2%
Massachusetts 92$ 134$ 178$ 129% 129% 136% 7.6% 6.6%
Connecticut 91$ 131$ 166$ 126% 126% 127% 7.5% 5.4%New Hampshire 72$ 110$ 151$ 101% 106% 115% 8.6% 7.4%New York 89$ 129$ 160$ 124% 124% 122% 7.5% 4.9%Rhode Island 83$ 125$ 160$ 115% 120% 122% 8.5% 5.6%Vermont 70$ 120$ 147$ 98% 115% 112% 11.9% 4.5%
Cuckler, G., et al., "Health Spending by State of Residence, 1991–2009," Medicare & Medicaid Research Review 1(4) (2011), Exhibit 2, stated in $/w eek.
State
$/week As % U.S. Annual Growth
58
In 2008, premiums were $93 per week for single coverage and $265 for family coverage. This is 10
percent and 12 percent, respectively, above the national average premiums. The growth in
premiums has slowed since Massachusetts passed health care reform legislation in 2006, to growth
rates below the national average. However, the gap between Massachusetts and the rest of the
U.S. in the cost of health insurance premiums is widening. A single premium in Massachusetts was
2 percent, 8 percent, and 10 percent higher than in the U.S. overall in 2000, 2006 and 2008,
respectively. Likewise, the family premium was 8 percent, 8 percent, and 12 percent above the
national average for each of the same years.
With empirical evidence of higher costs for housing, child care, and health care in Massachusetts, it
is not unreasonable to expect the portion of such costs attributable to children to be similarly higher
than benchmarks reflecting national averages or costs in other states. To the extent those costs
represent the majority of child costs, child costs in Massachusetts likely are higher than nationally or
in other states. However, the same may or may not be true of other child costs as well, which may
be subject to binding household budget constraints. Households facing a higher overall cost of living
in Massachusetts, for example, may have to reduce certain types of spending on children (e.g.,
private school tuition, more individualized child care, sports fees, etc.) in favor of lower-cost options,
because they have only so much money to spend.
Also, to the extent child costs in Massachusetts are higher than in other states, then that is true for
both households in which such costs are incurred, a recipient’s household and a payor’s household
alike. However, the current Guidelines do not account for the common economic reality in the
context of child support of two separate households, each of which incurs both: (1) fixed overhead
expenses, such as rent/mortgage and utilities, and (2) variable costs to the extent a child spends
time in each household.66 Even at the one-third/two-thirds parenting presumption in the current
66 Currently, Kansas is the only state with a second household adjustment (a deduction from available income) in its
Income Shares guidelines formula, to account for the payor’s additional housing costs.
59
Guidelines, those costs are material and may be no less in the payor’s household than they are in
the recipient’s household. In practice, some payors could end up paying several of the same costs
twice, once in each household.
The standard Income Shares child cost tables do not reflect the fact that the payor’s available
income in many cases is reduced by the cost of a separate mortgage or rent payment and a second
set of household utilities. Instead, the Income Shares tables yield guidelines amounts based on data
from an intact household applied to a payor in a second single-parent household, but who is
presumed to have the same available income as in the non-existent situation of shared expenses in
one household rather than two. Also ignored is the fact that when intact households take on new or
higher costs, such as child care or health care costs, they frequently cut back on other spending
accordingly to stay within their budget constraints. Thus, although household costs in
Massachusetts appear to be higher than the benchmarks, it may not be equitable or economically
realistic for the amounts payors pay under the Guidelines to be higher as well. The current
Massachusetts Guidelines do not fully address the interaction of these factors.
VIII. TAX CONSIDERATIONS
The current Massachusetts Guidelines consider the gross available income of the payor and
recipient, as opposed to their net income after taxes and tax-related child benefits. Of the 38 states
listed in Table 1 whose guidelines are based on the Income Shares model, 26 states (like
Massachusetts) use gross income. However, the distinction between gross and net income in this
context is not clear-cut, as the underlying tax assumptions and formulas vary widely. For example,
the Betson-Rothbarth estimates on which many income shares guidelines are based relate child
costs to net income. So many states whose guidelines use gross income simply apply state and
federal tax tables to gross up the net income amounts in the underlying economic studies. In that
sense, those guidelines use gross incomes but the guidelines amounts are based on underlying
child cost estimates relating to net incomes.
60
Using gross income in the Guidelines is appealing for its simplicity. By considering only gross
income, the Guidelines Worksheet does not have to incorporate information about the payor or
recipient’s tax filing status, the amount of income taxes each pays, or the relative financial impact of
various deductions and credits. And the discovery and analytical burden on the court is reduced.
From an economic perspective, however, gross income may not best reflect the amount of income
that is actually available to a payor or recipient to spend on a child.
Gross income also does not reflect the availability or dollar value of child-related tax credits,
deductions, and exemptions. The financial impact of three key child-related tax credits are subject to
policy uncertainty at the federal level: (1) the child tax credit; (2) the child care tax credit, and (3) the
earned income tax credit, all of which were scheduled to be cut if Congress had not reached a
compromise on the “fiscal cliff” in January 2013.67 While the near-term uncertainty regarding these
tax benefits has been resolved, they will continue to be subject to revision going forward. More
specifically:68
The child tax credit allows married couples with household incomes less than $110,000
and single parents earning less than $75,000 to claim $1,000 per child under age 17.
This credit was doubled to its current amount by the Tax Relief Reconciliation Act of
2001, and would have reverted to $500 per child if it had not been extended this year.
The fiscal cliff deal extended this tax credit for five years.
67 Other child-related tax benefits were not affected by the fiscal cliff deal, including the dollar values of the head of
household standard deduction and the child dependency exemption, which is different from the child tax credit. 68 Elise Marrion, “Critical Tax Credits for Families May Expire,” October 17, 2012
(http://www.creditscore.net/critical-tax-credits-for-families-may-expire/); Blake Ellis, “Fiscal cliff deal protects family tax breaks,” CNN Money, January 3, 2013 (http://money.cnn.com/2013/01/03/pf/taxes/family-tax-breaks-fiscal-cliff/index.html).
61
The earned income tax credit benefits both families and low-income married couples
without children. Married couples earning less than $50,270 with three or more children
can save up to $5,891 per year in 2012. The fiscal cliff deal also extended this tax
credit for five years, averting a reduction of up to $600 per year.
The child and dependent care tax credit helps working parents cover child care costs
by allowing them to claim a credit of up to 35% of such costs up to $3,000 per child or
$6,000 per family. The fiscal cliff deal extended this credit without sunset (i.e.,
permanently for now), averting a reduction to $2,400 per child or $4,800 per family,
and up to 30% of child care costs.
Since the current Massachusetts Guidelines use gross income, not net income, any uncertainty
regarding the future value of child-related tax credits, deductions, or exemptions would not directly
affect the Guidelines amounts. However, the availability and dollar-value of such tax benefits does
affect the relative incomes actually available to payors and recipients to cover child costs.
IX. CONCLUSION
Based on our analysis of current child cost benchmarks, including the latest Betson-Rothbarth
estimates, the latest USDA estimates, and guidelines amounts in neighboring states, the current
Massachusetts Guidelines amounts for one child are relatively high. However, the marginal
increases for additional children are relatively low. As a result, the current Guidelines amounts for
more than one child are mostly higher than the Betson-Rothbarth estimates, USDA estimates, and
neighboring states, but by proportionately less than the amounts for one child. Compared to those
benchmarks, the current Guidelines amounts are higher at all but the lowest income levels, though
to a lesser degree for more than one child.
There is not a clear economic rationale to explain why actual child costs, if we could observe them
directly, would be higher in Massachusetts than in the U.S. overall (as reflected in the Betson-
62
Rothbarth and USDA national numbers), or regionally (as reflected in the USDA Northeast numbers
and in neighboring states’ guidelines, assuming they reasonably reflect child costs). However, the
data do show that the overall cost of living is higher in Massachusetts than in the nation as a whole
or in neighboring states. This may indicate higher child costs as well. However, the precise
question of how Massachusetts’ higher cost of living translates into child costs at various income
levels, taking into account household budget constraints, is a complex and unresolved empirical
question.
Ultimately, it is important for the Massachusetts Guidelines to have their foundation in fundamental
economic principles and actual data on child costs. By having a strong economic foundation, the
Guidelines can better establish the appropriate amount of support for a child and create appropriate
economic incentives for both payors and recipients. The economic principles, facts, and
comparisons in this report provide the Task Force with current information and data to help inform its
recommendations with that objective in mind.
* * *

About the Authors
Mark A. Sarro, Ph.D.
Principal The Brattle Group, Inc.
Managing Director Watermark Economics, LLC
Dr. Mark Sarro is a financial economist, a Principal in the Cambridge, Massachusetts office of The Brattle Group, and a Managing Director of Watermark Economics. He works with academics, attorneys, entrepreneurs, executives, and policymakers, providing expertise on economic issues involving private decision-making and public finance.
In the area of household economics, he has researched the significance of financial and non-financial factors in household economic decision-making. His prior research developed a behavioral economic framework for, and reported empirical evidence on, the interrelated economic decisions to have children, marry, work, and/or seek public assistance.
From 2006-2008, he was the economist on the Massachusetts Child Support Guidelines Task Force, whose recommendations were the basis for the child support guidelines formula in Massachusetts. He also has testified before the New Hampshire Senate Ways and Means Committee regarding proposed child support legislation, and has provided expert testimony in alimony and child support cases.
Dr. Sarro has worked for over 15 years as an economic expert with international firms in the Boston area, in addition to Watermark Economics, which he co-founded. He holds a Ph.D. in Economics from Boston College, specializing in Public Finance and Monetary Economics, conducted public policy research, and taught micro- and macroeconomics. He also holds a BA from Fairfield University, magna cum laude, with a double major in Economics and English Writing and a minor in Politics.
R. Mark Rogers
President Rogers Economics, Inc.
R. Mark Rogers is a former Federal Reserve economist with two decades of experience at the Federal Reserve Bank of Atlanta, Georgia as an expert on forecasting and data analysis. He also was a commissioner on the 1998 Georgia Commission on Child Support and is a leading authority on the economics of that field.
As an independent consultant and expert witness, Mr. Rogers has consulted on forensic economics relating to child support for both custodial and noncustodial parents. He regularly publishes about analysis of economic conditions and on child costs.
He was a governor's appointee to the Georgia Commission on Child Support, 1998, and was its only economist. In that role, he engaged in economic research regarding the origins of states' guidelines and conflict with long-established, mainstream economic research and theory. His child cost research included, but was not limited to: review of child support guideline methodologies, child costs by differing methodologies, analysis of tax treatment for payors and recipients, and their standards of living.
Mr. Rogers has consulted on child cost issues for clients in Alabama, Florida, Georgia, Illinois, Indiana, Kentucky, Maryland, Michigan, Minnesota, Missouri, Montana, Nebraska, New Hampshire, New Mexico, New York, Ohio, Texas, Virginia, Wisconsin, Wyoming, and Washington State. Rogers has testified on child support issues before legislative committees in Georgia, Minnesota, and Virginia and by invitation before the U.S. Congress. He has presented to child support review commissions in Alabama, Georgia, Ohio, Tennessee, and Virginia.