Office of Child Support Enforcement
278
Office of Child Support Enforcement ANNUAL REPORT TO CONGRESS FY 2019
-
Upload
khangminh22 -
Category
Documents
-
view
0 -
download
0
Transcript of Office of Child Support Enforcement
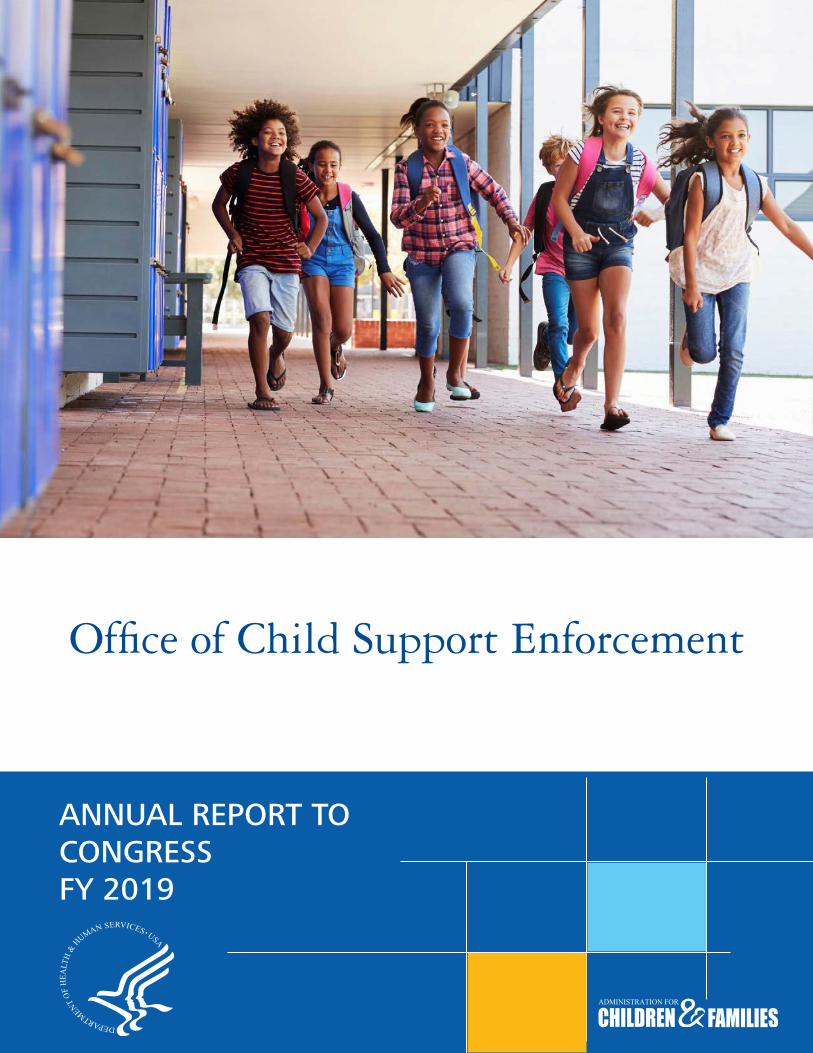
Office of Child Support Enforcement
ANNUAL REPORT TO CONGRESSFY 2019

i
CONTENTS
1Executive Summary
3Highlights of the Year
A-1National Program Performance
B-1State Program Performance
C-1Tribal Program Performance
D-1Data Tables
i
E-1Glossary
F-1Incentive Formulas and Forms
This page is intentionally left blank
1
EXECUTIVE Summary
2
The Office of Child Support Enforcement (OCSE) is part of the Administration for Children and Families (ACF) within the Department of Health and Human Services (HHS). HHS is the principal agency for protecting the health of all Americans and providing essential human services, especially for those who are least able to help themselves. ACF’s mission is to foster health and well-being by providing federal leadership, partnership, and resources for the compassionate and effective delivery of human services. The ultimate ACF vision is that children, youth, families, individuals, and communities are resilient, safe, healthy, and economically secure.
OCSE’s core mission is to: ● Establish paternity ● Obtain child support to encourage responsible parenting, family self-sufficiency and child well-
being ● Recognize the essential role of both parents in supporting their children
The national child support program helps children receive support by: ● Locating parents ● Establishing paternity ● Establishing and modifying support obligations ● Monitoring and enforcing support obligations
The child support program is a federal/state/tribal/local partnership that operates under Title IV-D of the Social Security Act. The program functions in 54 states and territories, and 60 tribes.
The OCSE Annual Report to Congress highlights financial and statistical child support achievements based on data reported by state and tribal child support agencies. The content of the annual report is mandated by Section 452(a) under Title IV-D of the Social Security Act to give congressional members information that relates to the overall operations and success of the national child support program.
In fiscal year (FY) 2019, OCSE worked collaboratively and collectively with state and tribal programs and a variety of public and private partners. OCSE’s work focused on engaging both parents in the lives of their children, increasing the economic stability of both parents, and strengthening family relationships.
The child support program made solid progress in its mission to increase family self-sufficiency and meet the needs of children and their families. These accomplishments are discussed further in the Highlights section of the report and supported by the data in the tables found in the Appendix.

33
HIGHLIGHTS of the Year
4
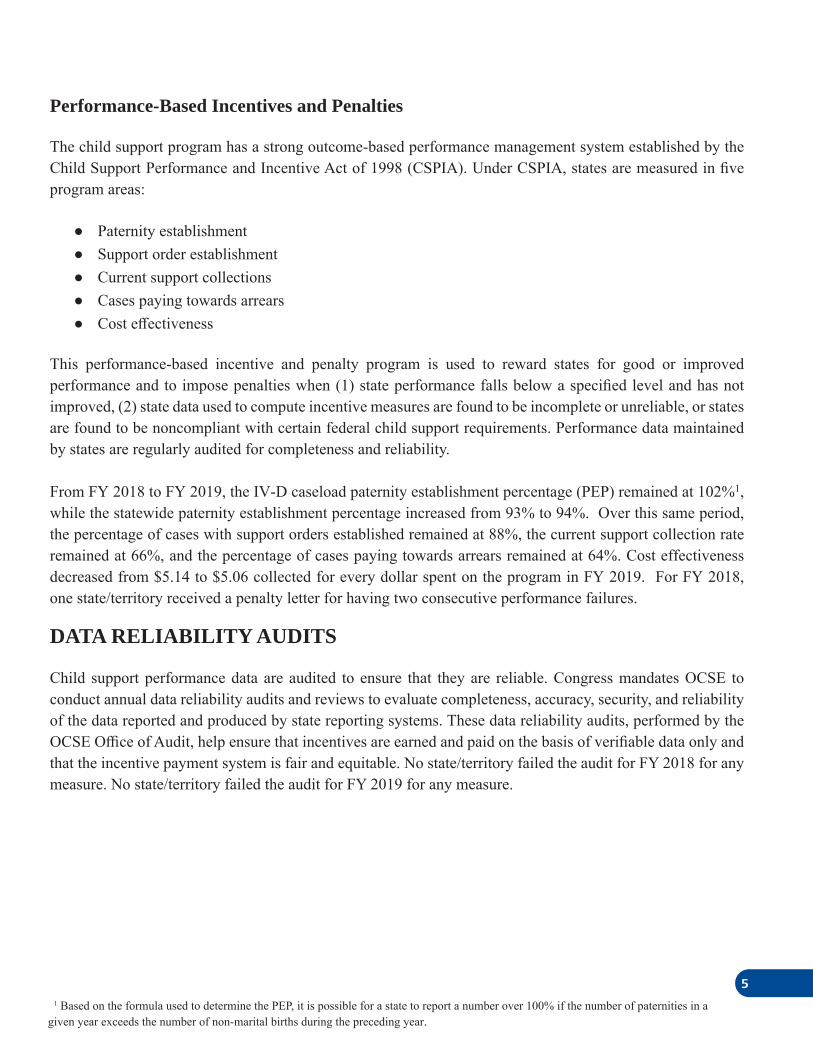
ACHIEVEMENTS
OCSE promoted effective approaches and excellent customer service to achieve the goal of ensuring children receive consistent financial support from their parents living apart from them. OCSE, states, and tribes identified proven strategies, including setting accurate orders to improve payment compliance rates and intervening early when payments stop. OCSE emphasized to states and territories the need for technology modernization and employer outreach to increase income withholding and new hire reporting compliance. OCSE also emphasized the importance of partnering with private and public programs that nurture healthy relationships between both parents and their children. These strategies contributed to improvements in program performance, reliable payments for children, and provided help to parents struggling to support their families.
PROGRAM PERFORMANCE
The child support program measures its successes in helping families become self-sufficient through a variety of outcome-based measures. This section describes the statistical performance of the national, state, and tribal programs.
Performance-Based Incentives and Penalties
The child support program has a strong outcome-based performance management system established by the Child Support Performance and Incentive Act of 1998 (CSPIA). Under CSPIA, states are measured in five program areas:
● Paternity establishment● Support order establishment● Current support collections● Cases paying towards arrears● Cost effectiveness
This performance-based incentive and penalty program is used to reward states for good or improved performance and to impose penalties when (1) state performance falls below a specified level and has not improved, (2) state data used to compute incentive measures are found to be incomplete or unreliable, or states are found to be noncompliant with certain federal child support requirements. Performance data maintained by states are regularly audited for completeness and reliability.
From FY 2018 to FY 2019, the IV-D caseload paternity establishment percentage (PEP) remained at 102%1, while the statewide paternity establishment percentage increased from 93% to 94%. Over this same period, the percentage of cases with support orders established remained at 88%, the current support collection rate remained at 66%, and the percentage of cases paying towards arrears remained at 64%. Cost effectiveness decreased from $5.14 to $5.06 collected for every dollar spent on the program in FY 2019. For FY 2018, one state/territory received a penalty letter for having two consecutive performance failures.
DATA RELIABILITY AUDITS
Child support performance data are audited to ensure that they are reliable. Congress mandates OCSE to conduct annual data reliability audits and reviews to evaluate completeness, accuracy, security, and reliability of the data reported and produced by state reporting systems. These data reliability audits, performed by the OCSE Office of Audit, help ensure that incentives are earned and paid on the basis of verifiable data only and that the incentive payment system is fair and equitable. No state/territory failed the audit for FY 2018 for any measure. No state/territory failed the audit for FY 2019 for any measure.
5
1 Based on the formula used to determine the PEP, it is possible for a state to report a number over 100% if the number of paternities in a given year exceeds the number of non-marital births during the preceding year.
6
COST AUDITS
OCSE is required by Section 452(a)(4)(C) of the Social Security Act to evaluate the adequacy of the financial management of each state’s child support program. Specifically, OCSE is mandated to perform reviews of expenditures claimed by states for federal reimbursement. The primary objectives of a cost audit are to determine whether the claimed child support costs are allowable, allocable, and reasonable, and to ensure that states bear their fair share of child support costs. Financial audits are performed after the data reliability audits are completed, to the extent that resources permit. There were no cost audits performed in FY 2019.
FEDERAL SYSTEMS
OCSE has an expansive portfolio of Information Technology (IT) services and programs, referred to as Federal Systems, that help states and tribes effectively and efficiently achieve the core mission of the program, which is to provide child support to millions of our nation’s children. The Federal Systems portfolio composed of multiple systems, including three that are critical to the business mission of the child support program:
● National Directory of New Hires (NDNH), a database of employees, their quarterly wages, and unemployment benefit information
● Federal Case Registry, a national database of child support participants, cases, and orders ● Debtor File, a database of noncustodial parents who owe past-due support that helps states and tribes
collect through the Administrative and Federal Tax Refund Offset and Passport Denial programs, and the Multistate Financial Institution Data Match and Insurance Match programs
OCSE expanded this portfolio to provide IT services and programs that assist child support agencies and other critical program partners – employers, financial institutions, insurers, and other federal agencies – in their efforts to support the child support program in cost-effective and efficient ways. OCSE and state child support systems exchange information daily through batch processing as well as a web-based interactive portal that allows for location services, case and participant inquiries, and document exchange. Currently, all 54 states and territories and three tribes – Muscogee Creek Nation, White Earth Nation, and Cherokee Nation – are using the Child Support Portal. The information collected and stored at the Federal Systems greatly assist state agencies with intergovernmental child support case management. Most of the OCSE's batch systems were developed in mid to late 1990s and OCSE continued the task of modernizing its systems. Enhancements include migration to relational databases, open systems architecture, and modern programming languages. These enhancements align with federal guidance on modernization as well as state systems modernization initiatives.
While Congress established the NDNH to help state child support agencies locate parents and enforce child
7
support orders, Congress has authorized certain state and federal agencies to receive NDNH data for authorized purposes, primarily to reduce improper payments from needs-based public benefit programs. Below are outcomes from these data matches in FY 2019:
● The Social Security Administration (SSA) estimates savings of approximately $1 billion in prevention of annual benefits future overpayments and adjustments of incorrect payment amounts in the Supplemental Security Income program. SSA reports that the benefit-to-cost ratio for the entire program is estimated to be 5.3 to 1.
● Department of Treasury’s Bureau of the Fiscal Service used a combination of NDNH and other data to recover approximately $58.5 million in federal nontax debt.
● The U.S. Department of Housing and Urban Development identified over $2.3 billion in underreported income using NDNH data, which could have resulted in $300 million in overpayments to rental recipients. With over $2.7 million in personnel and computer costs, this represents a return on investment of over 100:1.
STATE AND TRIBAL SYSTEMS
States continued to try to replace or enhance their legacy statewide automated case management computer systems in FY 2019. In nearly all states, the systems are obsolete, and in some states, the systems are close to the end of their usable lives. However, state budget constraints continue to delay most enhancement and replacement efforts.
Despite these challenges, these states began to conduct planning and feasibility studies to examine a path forward to replace their systems:
● Georgia ● New Mexico
In addition to the states that are conducting the feasibility study, some states like Alaska, Ohio, Pennsylvania, Tennessee, and Utah are re-platforming to essentially come out of an obsolete mainframe environment to a more distributed platform. The re-platforming projects are a low-cost alternative to developing a new system. Other states like Maryland, Oklahoma, and West Virginia are modernizing their systems as part of a multi-agency effort.
To reduce the federal costs of automating tribal programs, OCSE developed the Model Tribal System in FY 2013. The Model Tribal System is a comprehensive, highly configurable child support system available for implementation by tribal programs. By FY 2018, 13 tribes had completed full installation. In FY 2019 Keewenaw Bay Indian Community tribe has submitted the Advance Planning Document for new installation.
● Cherokee Nation of OK ● The Chippewa Cree Tribe of
the Rocky Boys Reservation ● Confederated Tribes of Colville
Reservation ● Eastern Band of Cherokee
Indians of NC
● Eastern Shoshone of Wyoming
● Forest County Potawatomi Community of WI
● Lac Courte Oreilles ● Mille Lacs Band of
Ojibwe
● Modoc Tribe of OK ● Prairie Band of
Potawatomi Nation ● Sisseton Wahpeton
Oyate ● The Suquamish Tribe ● White Earth Nation
From the above list of tribes, two tribes – The Chippewa Cree Tribe of the Rocky Boys Reservation and Prairie Band of Potawatomi Nation – will moved to cloud-based MTS.
8
In late 2017, OCSE released the updated State Systems Certification Guide that provides requirements for all state child support systems. Several states – Oregon, Massachusetts, and South Carolina – have started using the new guide for development of the new statewide system.
PROGRAM INNOVATION
Competitive Grants and Initiatives
Section 1115(a) of the Social Security Act authorizes OCSE to award competitive grants to state and tribal Title IV-D agencies. The purpose is to support research and demonstration projects that promote Title IV-D activities, with a goal of improving the operation of the child support program. In FY 2019, OCSE issued new awards and continuation funding to current awards. OCSE also supported other ongoing grant projects, fully funded in FY 2017.
New Awards: OCSE released a new Section 1115(a) grant announcement, Child Support Intergovernmental Case Processing Innovation Demonstration. OCSE awarded funding to seven states and two tribal child support agencies. During the two-year grant period, awardees are making improvements to their existing intergovernmental case processing procedures and systems to test innovations likely to increase payments on intergovernmental cases and implement procedures to increase their efficiency and customer service.
Continuation Awards: OCSE awarded continuation funding to two cohorts of previously-awarded Section 1115(a) demonstrations: the 1) Behavioral Interventions for Child Support Services Demonstration, and 2) Procedural Justice-Informed Alternatives to Contempt Demonstration.
The Behavioral Interventions for Child Support Services Demonstration (BICS) is a five-year project initially awarded in FY 2014. Eight state child support agencies are exploring individual behavior and decision-making ability related to child support. BICS grantees are testing how strategies from behavioral economics can be used to improve child support services.
Procedural Justice-Informed Alternatives to Contempt (PJAC) is a five-year project awarded in FY 2016. This project allows the six grantees to examine whether incorporating procedural justice principles into child support business practices increases reliable child support payments. The PJAC project seeks to increase parents’ compliance with child support orders by increasing trust and confidence in the child support agency and its processes.
Ongoing Awards: In FY 2017, OCSE awarded grants to nine state and two tribal child support agencies as part of the Using Digital Marketing to Increase Participation in the Child Support Program Demonstration. These demonstration grants are fully funded, two-year projects scheduled to operate through FY 2020. Grantees are using the funds to test digital marketing approaches and partnerships to reach parents that could benefit from child support services. Methods are tested to create or improve two-way digital
9
communication and engagement with parents.
Access and Visitation
OCSE administers grants to states for the Access and Visitation Program to support and facilitate noncustodial parents’ access to and visitation with their children by means of activities including:
● mediation, ● counseling, ● parenting education, ● developing parenting time schedules, ● visitation enforcement (monitoring, supervision, and neutral drop-off and pick-up), ● and developing guidelines for alternative custody arrangements.
The annual appropriation for this program is $10 million, and each state and territory receives a portion of this funding based on the formula in the authorizing statute.
OCSE Program Partnerships
Program partnerships are critical to fulfilling OCSE’s goal of improving child support outcomes for all children. Partnerships are a low-cost effective way to increase the consistency of child support payments in those cases where there are barriers by addressing the reasons parents are not paying, such as unemployment, incarceration, parental conflict, or lack of access to their children. Partnerships also help other stakeholders in accomplishing their mission and goals. Examples of OCSE’s FY 2019 partnerships:
● Department of Veterans Affairs to identify veterans with child support issues, address child support debt, improve employment prospects, and restore family connections.
● HHS/ACF Office of Family Assistance's (OFA) Healthy Marriage and Responsible Fatherhood grants to plan for building local child support collaborations and to improve services and outcomes for fathers participating in the OFA grants.
● Consumer Financial Protection Bureau's Your Money, Your Goals, which is a set of financial empowerment materials designed to help families meet their financial goals through increased knowledge, skills, and resources.
● HHS/ACF/ACYF Family Youth Services Bureau/Family Violence Prevention Services Program to coordinate training and technical assistance to increase safety for survivors of domestic violence accessing child support services.
POLICY
International Child Support Program
HHS is the U.S. Central Authority for international child support, and the Secretary has designated OCSE to carry out the Central Authority duties. The United States implemented the Hague Convention on the
10
International Recovery of Child Support and Other Forms of Family Maintenance starting in 2017. The Hague Convention provides for a comprehensive system of cooperation between the child support authorities of contracting states, establishes procedures for recognition of foreign child support decisions, and requires effective measures for prompt enforcement.
In FY 2019, in addition to providing technical assistance and policy guidance, OCSE published judicial bench cards for the Uniform Interstate Family Support Act (UIFSA) and Hague Convention cases, hosted 10 countries for a day of bilateral meetings at OCSE, and delivered training on international child support to judicial and legal groups and at child support conferences. With the new Hague Convention and our existing bilateral arrangements, the United States partnered with 40 countries and 12 Canadian provinces and territories to ensure that child support obligations are enforced. OCSE also responded to over 1,200 customer service inquiries on international child support cases from families, states, and countries.
Revision of Intergovernmental Child Support Enforcement Forms
As required by the Paperwork Reduction Act, OCSE requested public comment and revised the Standard Intergovernmental Child Support Enforcement forms and instructions during FY 2019 (although the final forms were published early in FY 2020). These 13 forms integrate federal and state law and assist child support agencies in providing uniform, efficient services to families seeking child support across state lines.
Intergovernmental Case Processing and Intergovernmental Forms Training
In FYs 2018 and 2019, OCSE provided training on Intergovernmental Case Processing, which included Interstate 101, Interstate 201, Interstate Scenarios, Interstate Payment Processing, Interstate Case Closure, and OCSE Interstate Tools and Resources. All of this training is available on the OCSE website.
11
State Plan
As a condition of receiving federal funding, state child support agencies must submit approvable state plans describing the nature and scope of the respective state’s child support program. In FY 2019, there were no federal regulations issued that required states to submit new state plan components. However, states continued to update their plans as needed in response to changes in state laws and procedures.
TRIBAL PROGRAMS
Funding for tribal IV-D grants is authorized under Section 455(f) of the Social Security Act. In order to demonstrate the capacity to operate a tribal child support program, tribes or tribal organizations must include the following tribally determined performance targets in a tribal IV-D plan:
● paternity establishment, ● support order establishment, ● amount of current support to be collected, ● and amount of past-due support to be collected.
Tribal child support programs may also submit any other performance measures they wish. For example, one tribe includes total expenditures per case as a performance measure. They also measure their performance in providing customer service. Another tribe chooses to set collaboration efforts as a goal, such as collaborating with other tribal departments to find alternatives to incarceration.
● Currently 60 tribes operate child support programs, providing services to Native American families consistent with tribal values and cultures.
● This represents a 161 percent increase in tribal child support programs since 2008 when we had only 23 comprehensive programs.
● Many tribal child support programs experience challenging caseloads due to a number of factors such as a smaller scale, higher unemployment, and higher poverty rates on reservations than in states.
● Despite the challenges, the tribal child support program has grown from 29,350 cases with collections of $23 million in FY 2008 to 59,513 cases and over $56 million collected in FY 2019.
CUSTOMER COMMUNICATIONS
During FY 2019, OCSE managed and disseminated key communications for the national child support program to inform and engage OCSE customers, partners, stakeholders and the public.
● OCSE supported plain language guidelines to ensure information from the federal office is easy to read, understand, and use.
● Parents, program partners, and child support professionals visit the OCSE website for policy documents and contact and program information. Child support populations, including military service members, veterans, and incarcerated parents, can find specific information targeted for those groups.
● OCSE managed communication campaigns to disseminate timely information through the appropriate
12
social media channels. ● OCSE managed two blogs:
o Commissioner’s Voice featured messages from our commissioner highlighting important OCSE initiatives.
o Analyze This provided in-depth analysis of child support data to inform child support professionals and other stakeholders about national child support trends.
● Customers also learned about OCSE, state, local and tribal initiatives promoting the well-being of children and families in our monthly e-newsletter, Child Support Report. Our newsletter’s reach is one of the largest in the agency, with distribution to over 5,500 subscribers each month.
● Using OCSE’s Customer Inquiry Management system, OCSE responded to thousands of customer inquiries from the public, parents, Congress, the White House, HHS Office of Inspector General, and other officials and advocates.
● OCSE created an informational video, What is Child Support, to share with parents and partners. It explains the most common child support services that parents typically use and provides general advice to ensure the process goes smoothly.
13
DATA DISCLAIMER AND TERMS OF USE
This data was originally compiled and reported by the states, territories and tribal child support programs. OCSE assumes no responsibility or legal liability concerning the data’s accuracy, reliability, completeness, timeliness, or usefulness.
OCSE makes this data available without charge as a public service on the condition that users of the data agree to be solely responsible for ensuring the accuracy and other qualities of any products derived from or in connection with this data.
OCSE disclaims any responsibility or legal liability to users for damages of any kind, including lost profits, lost savings or any other incidental or consequential damages relating to the data or the use of it.
The user agrees to credit HHS/ACF/OCSE in any publication that results from the use of this data. The names HHS/ACF/OCSE, however, may not be used in any advertising or publicity to endorse or promote any products or commercial entities unless specific written permission is obtained from HHS/ACF/OCSE in advance. The user also understands that HHS/ACF/OCSE is not obligated to provide the user with any support, consulting, training or assistance of any kind with regard to the use of this data or to provide the user with any updates, revisions or new versions of this data.
Please note: The data is collected from various sources, and may be modified over time without notice. OCSE disclaims responsibility for the accuracy of the data and makes no warranty about it.
1
This page is intentionally left blank
A-1
PROGRAMPerformance
NATIONAL PERFORMANCE
A-2 This data was originally compiled and reported by the states, territories and tribal child support programs. OCSE assumes no responsibility or legal liability concerning the data’s accuracy, reliability, completeness, timeliness, or usefulness.
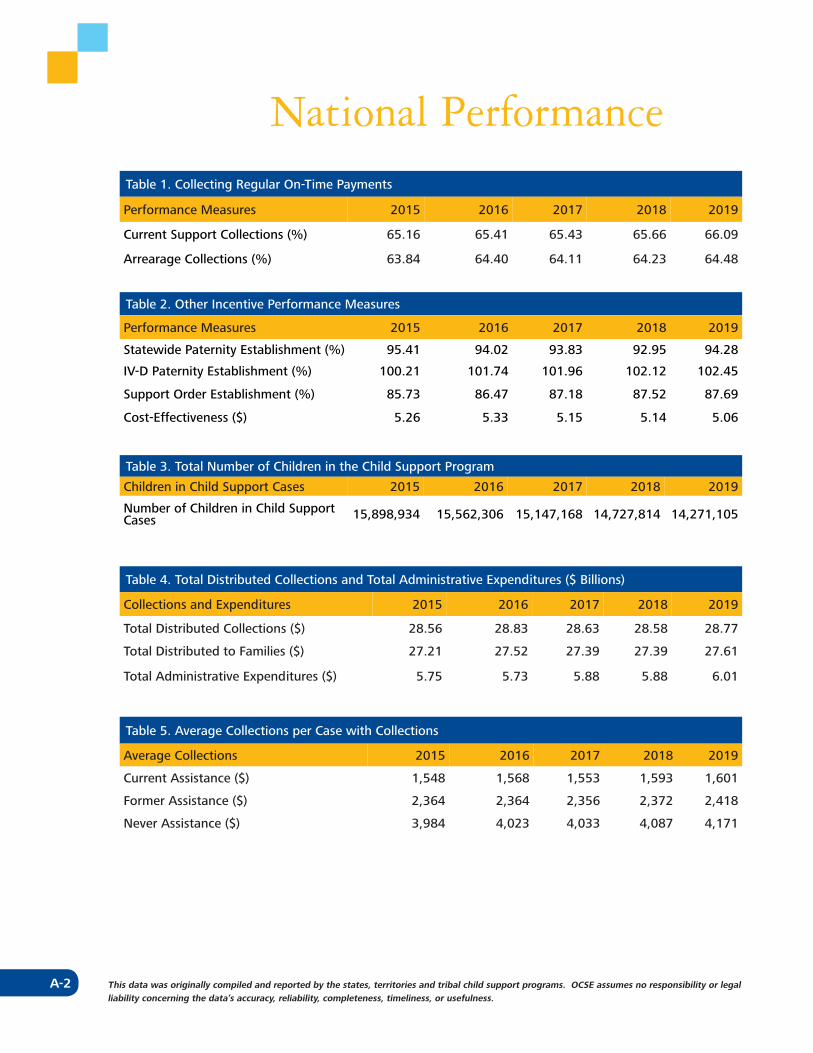
National PerformanceTable 1. Collecting Regular On-Time Payments
Performance Measures 2015 2016 2017 2018 2019
Current Support Collections (%) 65.16 65.41 65.43 65.66 66.09
Arrearage Collections (%) 63.84 64.40 64.11 64.23 64.48
Table 2. Other Incentive Performance Measures
Performance Measures 2015 2016 2017 2018 2019
Statewide Paternity Establishment (%) 95.41 94.02 93.83 92.95 94.28
IV-D Paternity Establishment (%) 100.21 101.74 101.96 102.12 102.45
Support Order Establishment (%) 85.73 86.47 87.18 87.52 87.69
Cost-Effectiveness ($) 5.26 5.33 5.15 5.14 5.06
Table 3. Total Number of Children in the Child Support Program
Children in Child Support Cases 2015 2016 2017 2018 2019
Number of Children in Child Support Cases 15,898,934 15,562,306 15,147,168 14,727,814 14,271,105
Table 4. Total Distributed Collections and Total Administrative Expenditures ($ Billions)
Collections and Expenditures 2015 2016 2017 2018 2019
Total Distributed Collections ($) 28.56 28.83 28.63 28.58 28.77
Total Distributed to Families ($) 27.21 27.52 27.39 27.39 27.61
Total Administrative Expenditures ($) 5.75 5.73 5.88 5.88 6.01
Table 5. Average Collections per Case with Collections
Average Collections 2015 2016 2017 2018 2019
Current Assistance ($) 1,548 1,568 1,553 1,593 1,601
Former Assistance ($) 2,364 2,364 2,356 2,372 2,418
Never Assistance ($) 3,984 4,023 4,033 4,087 4,171
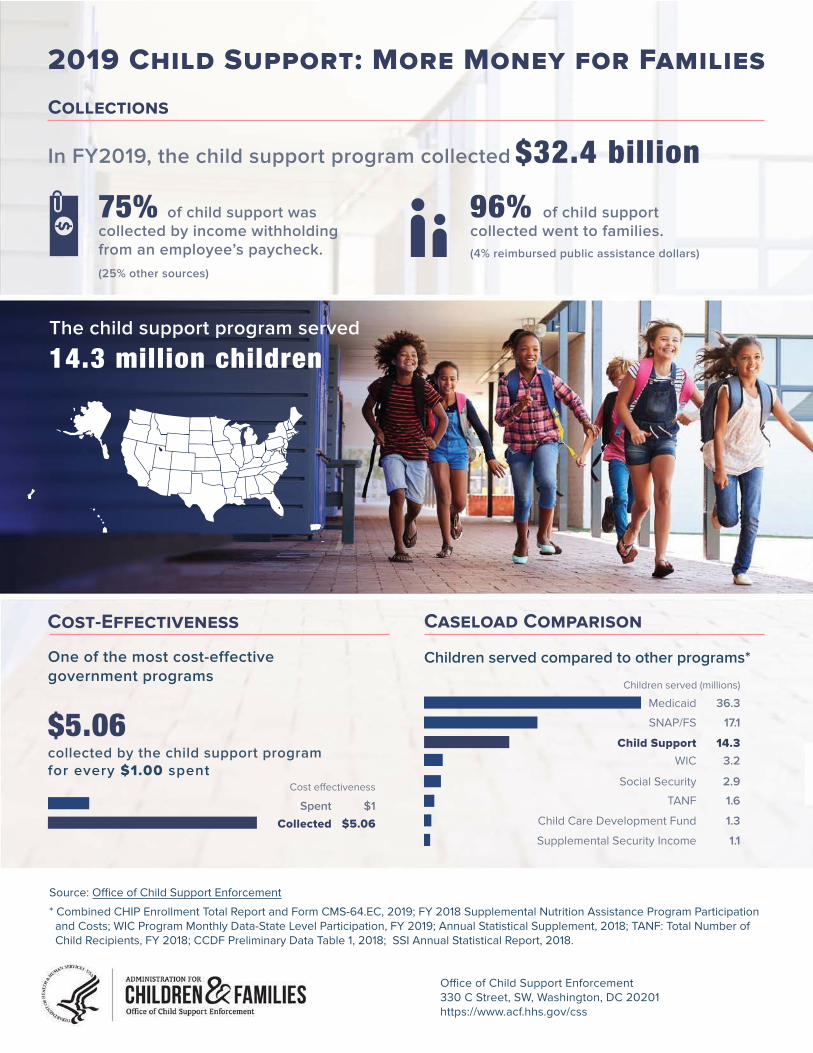
2019 Child Support: More Money for Families
Collections
In FY2019, the child support program collected $32.4 billion75% of child support wascollected by income withholding
from an employee ’s paycheck. (25% other sources)
96% of child support collected went to families. (4% reimbursed public assistance dollars)
The child support program served
14.3 million children
Cost-Effectiveness
One of the most cost-effective government programs
$5.06 collected by the child support program for every $1.00 spent
Cost effectiveness
Spent $1Collected $5.06
Caseload Comparison
Children served compared to other programs*
* Combined CHIP Enrollment Total Report and Form CMS-64.EC, 2019; FY 2018 Supplemental Nutrition Assistance Program Participation and Costs; WIC Program Monthly Data-State Level Participation, FY 2019; Annual Statistical Supplement, 2018; TANF: Total Number of Child Recipients, FY 2018; CCDF Preliminary Data Table 1, 2018; SSI Annual Statistical Report, 2018.
Children served (millions)
Medicaid 36.3
SNAP/FS 17.1
Child Support 14.3WIC 3.2
Social Security 2.9
TANF 1.6
Child Care Development Fund 1.3
Supplemental Security Income 1.1
Source: Office of Child Support Enforcement
Office of Child Support Enforcement330 C Street, SW, Washington, DC 20201https://www.acf.hhs.gov/css
A-4
This page is intentionally left blank

B-1
PROGRAMPerformance
STATEPERFORMANCE
B-2 This data was originally compiled and reported by the states, territories and tribal child support programs. OCSE assumes no responsibility or legal liability concerning the data’s accuracy, reliability, completeness, timeliness, or usefulness.
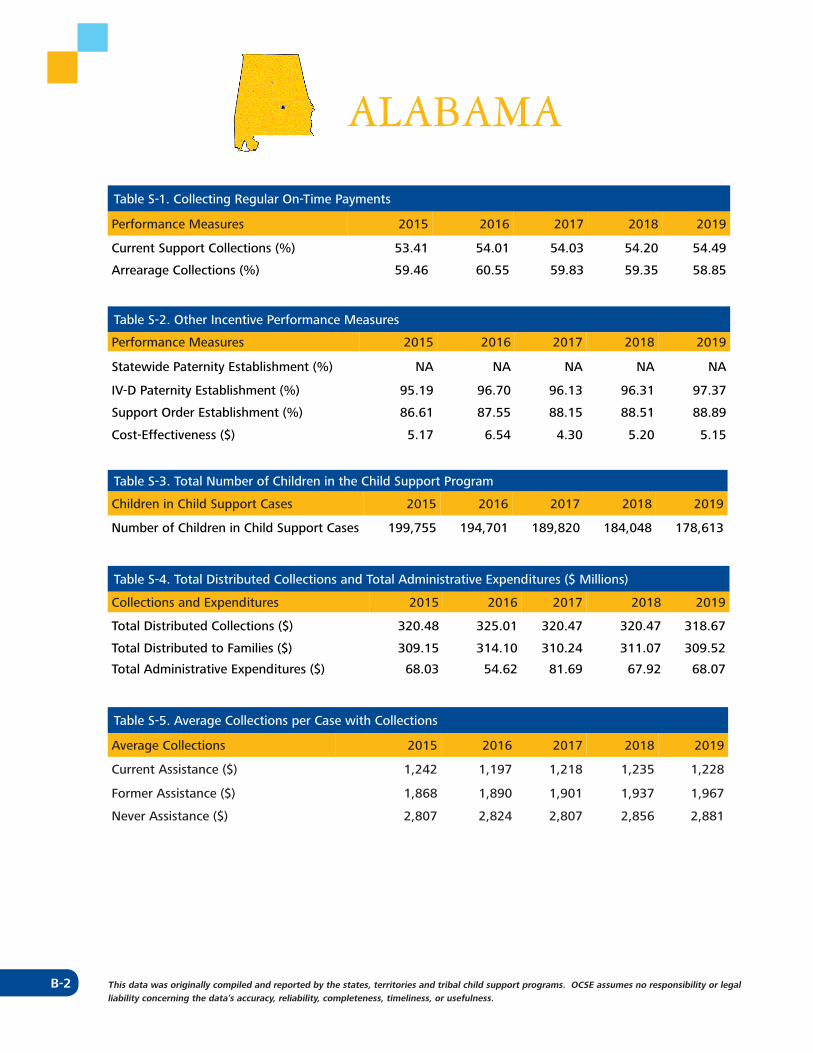
ALABAMA
Table S-1. Collecting Regular On-Time Payments
Performance Measures 2015 2016 2017 2018 2019
Current Support Collections (%) 53.41 54.01 54.03 54.20 54.49
Arrearage Collections (%) 59.46 60.55 59.83 59.35 58.85
Table S-2. Other Incentive Performance Measures
Performance Measures 2015 2016 2017 2018 2019
Statewide Paternity Establishment (%) NA NA NA NA NA
IV-D Paternity Establishment (%) 95.19 96.70 96.13 96.31 97.37
Support Order Establishment (%) 86.61 87.55 88.15 88.51 88.89
Cost-Effectiveness ($) 5.17 6.54 4.30 5.20 5.15
Table S-3. Total Number of Children in the Child Support Program
Children in Child Support Cases 2015 2016 2017 2018 2019
Number of Children in Child Support Cases 199,755 194,701 189,820 184,048 178,613
Table S-4. Total Distributed Collections and Total Administrative Expenditures ($ Millions)
Collections and Expenditures 2015 2016 2017 2018 2019
Total Distributed Collections ($) 320.48 325.01 320.47 320.47 318.67
Total Distributed to Families ($) 309.15 314.10 310.24 311.07 309.52
Total Administrative Expenditures ($) 68.03 54.62 81.69 67.92 68.07
Table S-5. Average Collections per Case with Collections
Average Collections 2015 2016 2017 2018 2019
Current Assistance ($) 1,242 1,197 1,218 1,235 1,228
Former Assistance ($) 1,868 1,890 1,901 1,937 1,967
Never Assistance ($) 2,807 2,824 2,807 2,856 2,881
B-3This data was originally compiled and reported by the states, territories and tribal child support programs. OCSE assumes no responsibility or legal liability concerning the data’s accuracy, reliability, completeness, timeliness, or usefulness.
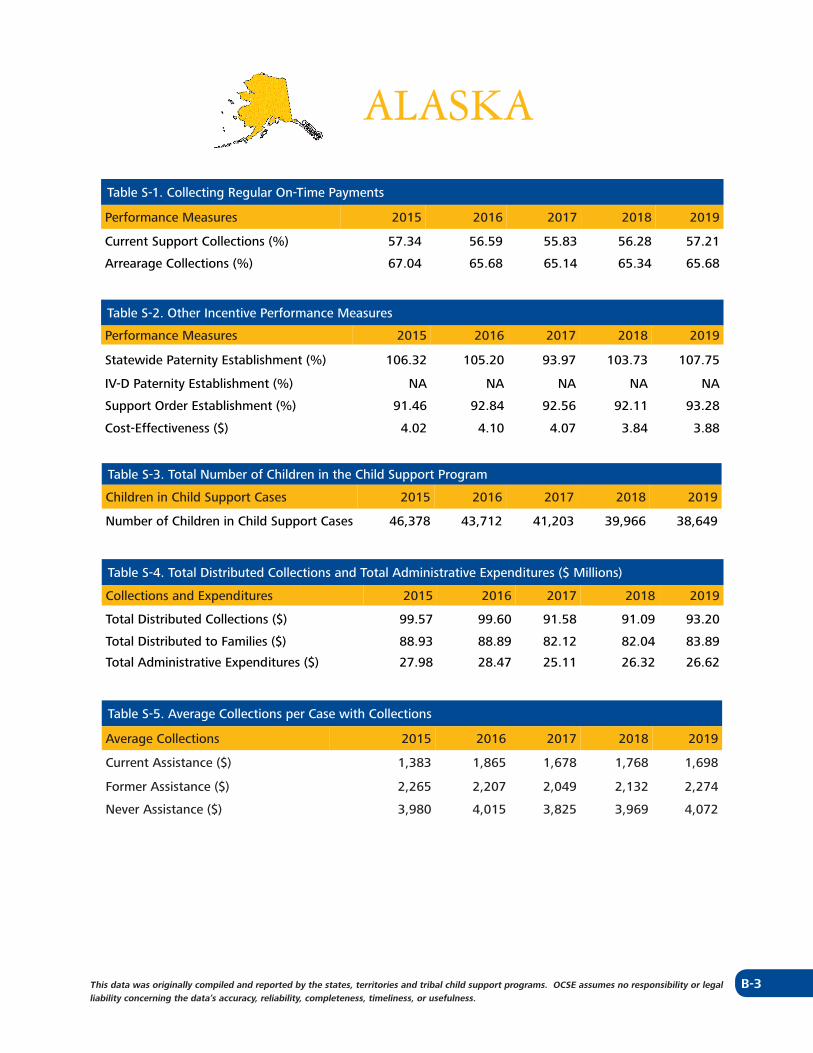
ALASKA
Table S-1. Collecting Regular On-Time Payments
Performance Measures 2015 2016 2017 2018 2019
Current Support Collections (%) 57.34 56.59 55.83 56.28 57.21
Arrearage Collections (%) 67.04 65.68 65.14 65.34 65.68
Table S-2. Other Incentive Performance Measures
Performance Measures 2015 2016 2017 2018 2019
Statewide Paternity Establishment (%) 106.32 105.20 93.97 103.73 107.75
IV-D Paternity Establishment (%) NA NA NA NA NA
Support Order Establishment (%) 91.46 92.84 92.56 92.11 93.28
Cost-Effectiveness ($) 4.02 4.10 4.07 3.84 3.88
Table S-3. Total Number of Children in the Child Support Program
Children in Child Support Cases 2015 2016 2017 2018 2019
Number of Children in Child Support Cases 46,378 43,712 41,203 39,966 38,649
Table S-4. Total Distributed Collections and Total Administrative Expenditures ($ Millions)
Collections and Expenditures 2015 2016 2017 2018 2019
Total Distributed Collections ($) 99.57 99.60 91.58 91.09 93.20
Total Distributed to Families ($) 88.93 88.89 82.12 82.04 83.89
Total Administrative Expenditures ($) 27.98 28.47 25.11 26.32 26.62
Table S-5. Average Collections per Case with Collections
Average Collections 2015 2016 2017 2018 2019
Current Assistance ($) 1,383 1,865 1,678 1,768 1,698
Former Assistance ($) 2,265 2,207 2,049 2,132 2,274
Never Assistance ($) 3,980 4,015 3,825 3,969 4,072
B-4 This data was originally compiled and reported by the states, territories and tribal child support programs. OCSE assumes no responsibility or legal liability concerning the data’s accuracy, reliability, completeness, timeliness, or usefulness.
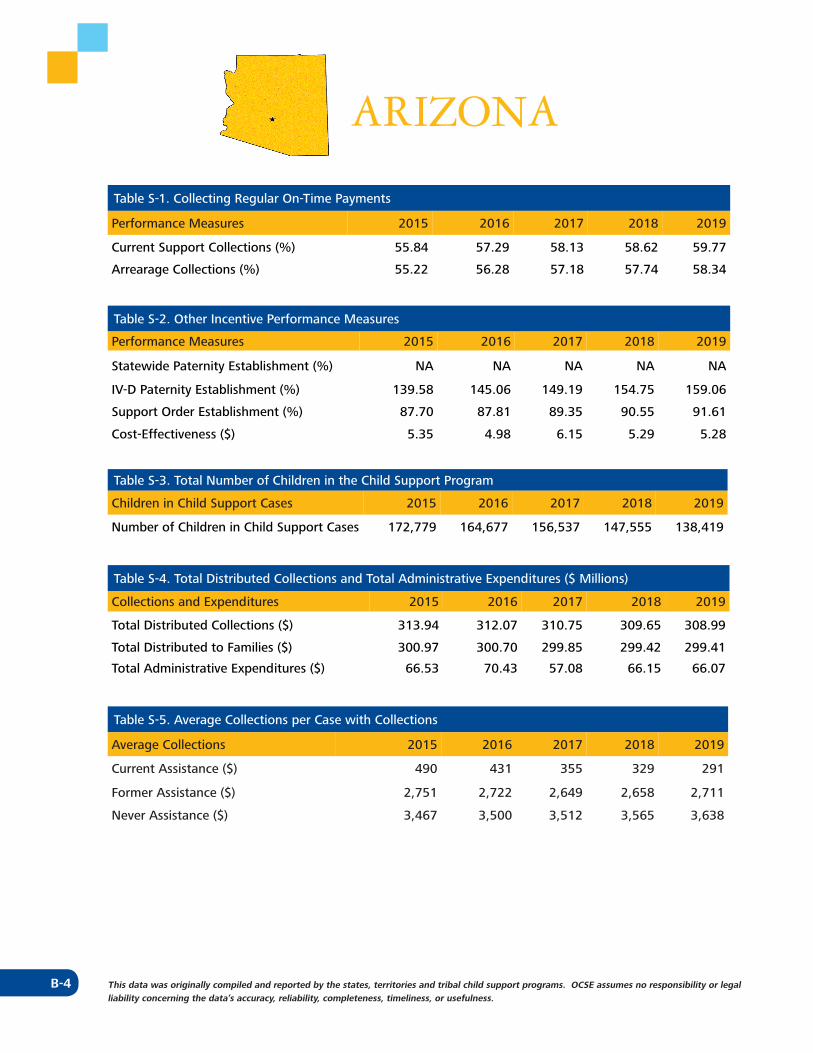
ARIZONA
Table S-1. Collecting Regular On-Time Payments
Performance Measures 2015 2016 2017 2018 2019
Current Support Collections (%) 55.84 57.29 58.13 58.62 59.77
Arrearage Collections (%) 55.22 56.28 57.18 57.74 58.34
Table S-2. Other Incentive Performance Measures
Performance Measures 2015 2016 2017 2018 2019
Statewide Paternity Establishment (%) NA NA NA NA NA
IV-D Paternity Establishment (%) 139.58 145.06 149.19 154.75 159.06
Support Order Establishment (%) 87.70 87.81 89.35 90.55 91.61
Cost-Effectiveness ($) 5.35 4.98 6.15 5.29 5.28
Table S-3. Total Number of Children in the Child Support Program
Children in Child Support Cases 2015 2016 2017 2018 2019
Number of Children in Child Support Cases 172,779 164,677 156,537 147,555 138,419
Table S-4. Total Distributed Collections and Total Administrative Expenditures ($ Millions)
Collections and Expenditures 2015 2016 2017 2018 2019
Total Distributed Collections ($) 313.94 312.07 310.75 309.65 308.99
Total Distributed to Families ($) 300.97 300.70 299.85 299.42 299.41
Total Administrative Expenditures ($) 66.53 70.43 57.08 66.15 66.07
Table S-5. Average Collections per Case with Collections
Average Collections 2015 2016 2017 2018 2019
Current Assistance ($) 490 431 355 329 291
Former Assistance ($) 2,751 2,722 2,649 2,658 2,711
Never Assistance ($) 3,467 3,500 3,512 3,565 3,638
B-5This data was originally compiled and reported by the states, territories and tribal child support programs. OCSE assumes no responsibility or legal liability concerning the data’s accuracy, reliability, completeness, timeliness, or usefulness.
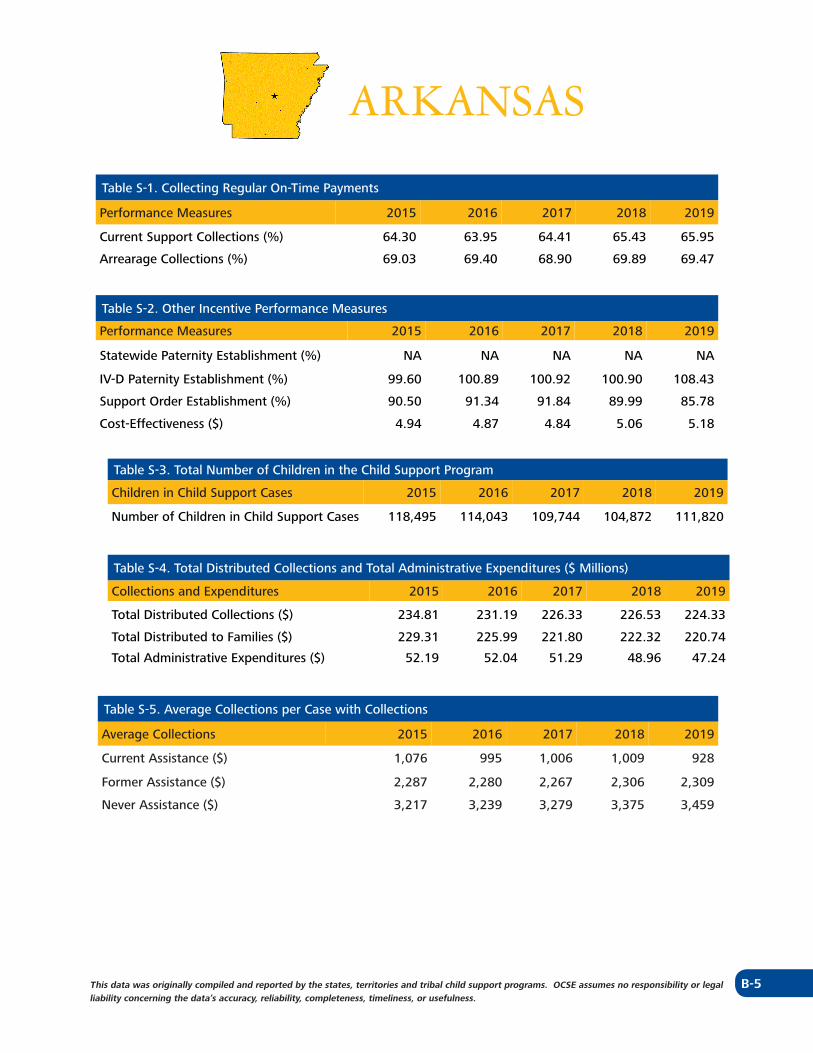
ARKANSAS
Table S-1. Collecting Regular On-Time Payments
Performance Measures 2015 2016 2017 2018 2019
Current Support Collections (%) 64.30 63.95 64.41 65.43 65.95
Arrearage Collections (%) 69.03 69.40 68.90 69.89 69.47
Table S-2. Other Incentive Performance Measures
Performance Measures 2015 2016 2017 2018 2019
Statewide Paternity Establishment (%) NA NA NA NA NA
IV-D Paternity Establishment (%) 99.60 100.89 100.92 100.90 108.43
Support Order Establishment (%) 90.50 91.34 91.84 89.99 85.78
Cost-Effectiveness ($) 4.94 4.87 4.84 5.06 5.18
Table S-3. Total Number of Children in the Child Support Program
Children in Child Support Cases 2015 2016 2017 2018 2019
Number of Children in Child Support Cases 118,495 114,043 109,744 104,872 111,820
Table S-4. Total Distributed Collections and Total Administrative Expenditures ($ Millions)
Collections and Expenditures 2015 2016 2017 2018 2019
Total Distributed Collections ($) 234.81 231.19 226.33 226.53 224.33
Total Distributed to Families ($) 229.31 225.99 221.80 222.32 220.74
Total Administrative Expenditures ($) 52.19 52.04 51.29 48.96 47.24
Table S-5. Average Collections per Case with Collections
Average Collections 2015 2016 2017 2018 2019
Current Assistance ($) 1,076 995 1,006 1,009 928
Former Assistance ($) 2,287 2,280 2,267 2,306 2,309
Never Assistance ($) 3,217 3,239 3,279 3,375 3,459
B-6 This data was originally compiled and reported by the states, territories and tribal child support programs. OCSE assumes no responsibility or legal liability concerning the data’s accuracy, reliability, completeness, timeliness, or usefulness.
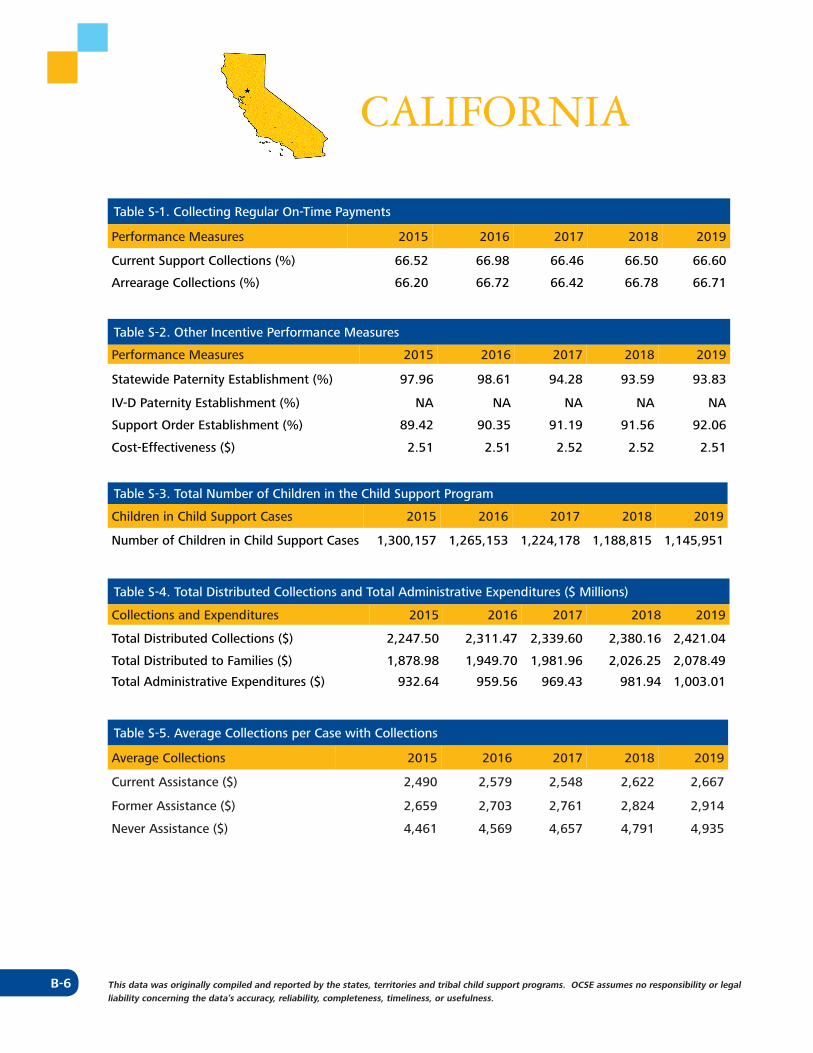
CALIFORNIA
Table S-1. Collecting Regular On-Time Payments
Performance Measures 2015 2016 2017 2018 2019
Current Support Collections (%) 66.52 66.98 66.46 66.50 66.60
Arrearage Collections (%) 66.20 66.72 66.42 66.78 66.71
Table S-2. Other Incentive Performance Measures
Performance Measures 2015 2016 2017 2018 2019
Statewide Paternity Establishment (%) 97.96 98.61 94.28 93.59 93.83
IV-D Paternity Establishment (%) NA NA NA NA NA
Support Order Establishment (%) 89.42 90.35 91.19 91.56 92.06
Cost-Effectiveness ($) 2.51 2.51 2.52 2.52 2.51
Table S-3. Total Number of Children in the Child Support Program
Children in Child Support Cases 2015 2016 2017 2018 2019
Number of Children in Child Support Cases 1,300,157 1,265,153 1,224,178 1,188,815 1,145,951
Table S-4. Total Distributed Collections and Total Administrative Expenditures ($ Millions)
Collections and Expenditures 2015 2016 2017 2018 2019
Total Distributed Collections ($) 2,247.50 2,311.47 2,339.60 2,380.16 2,421.04
Total Distributed to Families ($) 1,878.98 1,949.70 1,981.96 2,026.25 2,078.49
Total Administrative Expenditures ($) 932.64 959.56 969.43 981.94 1,003.01
Table S-5. Average Collections per Case with Collections
Average Collections 2015 2016 2017 2018 2019
Current Assistance ($) 2,490 2,579 2,548 2,622 2,667
Former Assistance ($) 2,659 2,703 2,761 2,824 2,914
Never Assistance ($) 4,461 4,569 4,657 4,791 4,935
B-7This data was originally compiled and reported by the states, territories and tribal child support programs. OCSE assumes no responsibility or legal liability concerning the data’s accuracy, reliability, completeness, timeliness, or usefulness.
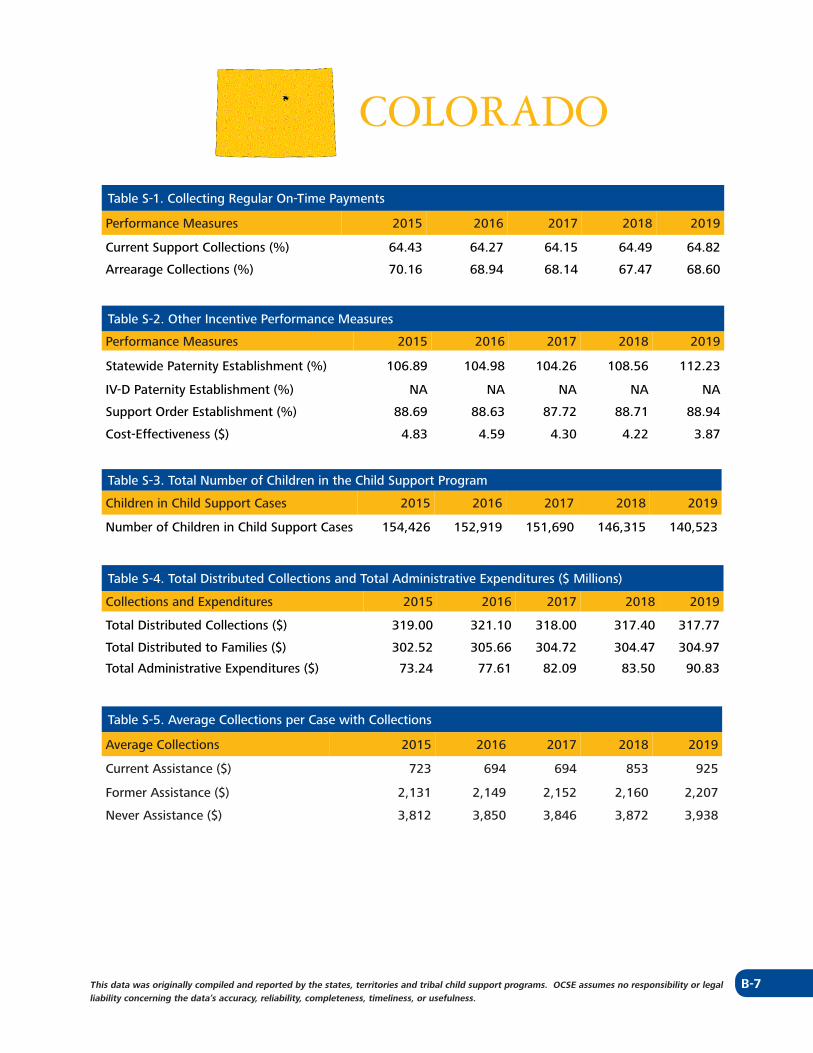
COLORADO
Table S-1. Collecting Regular On-Time Payments
Performance Measures 2015 2016 2017 2018 2019
Current Support Collections (%) 64.43 64.27 64.15 64.49 64.82
Arrearage Collections (%) 70.16 68.94 68.14 67.47 68.60
Table S-2. Other Incentive Performance Measures
Performance Measures 2015 2016 2017 2018 2019
Statewide Paternity Establishment (%) 106.89 104.98 104.26 108.56 112.23
IV-D Paternity Establishment (%) NA NA NA NA NA
Support Order Establishment (%) 88.69 88.63 87.72 88.71 88.94
Cost-Effectiveness ($) 4.83 4.59 4.30 4.22 3.87
Table S-3. Total Number of Children in the Child Support Program
Children in Child Support Cases 2015 2016 2017 2018 2019
Number of Children in Child Support Cases 154,426 152,919 151,690 146,315 140,523
Table S-4. Total Distributed Collections and Total Administrative Expenditures ($ Millions)
Collections and Expenditures 2015 2016 2017 2018 2019
Total Distributed Collections ($) 319.00 321.10 318.00 317.40 317.77
Total Distributed to Families ($) 302.52 305.66 304.72 304.47 304.97
Total Administrative Expenditures ($) 73.24 77.61 82.09 83.50 90.83
Table S-5. Average Collections per Case with Collections
Average Collections 2015 2016 2017 2018 2019
Current Assistance ($) 723 694 694 853 925
Former Assistance ($) 2,131 2,149 2,152 2,160 2,207
Never Assistance ($) 3,812 3,850 3,846 3,872 3,938
B-8 This data was originally compiled and reported by the states, territories and tribal child support programs. OCSE assumes no responsibility or legal liability concerning the data’s accuracy, reliability, completeness, timeliness, or usefulness.
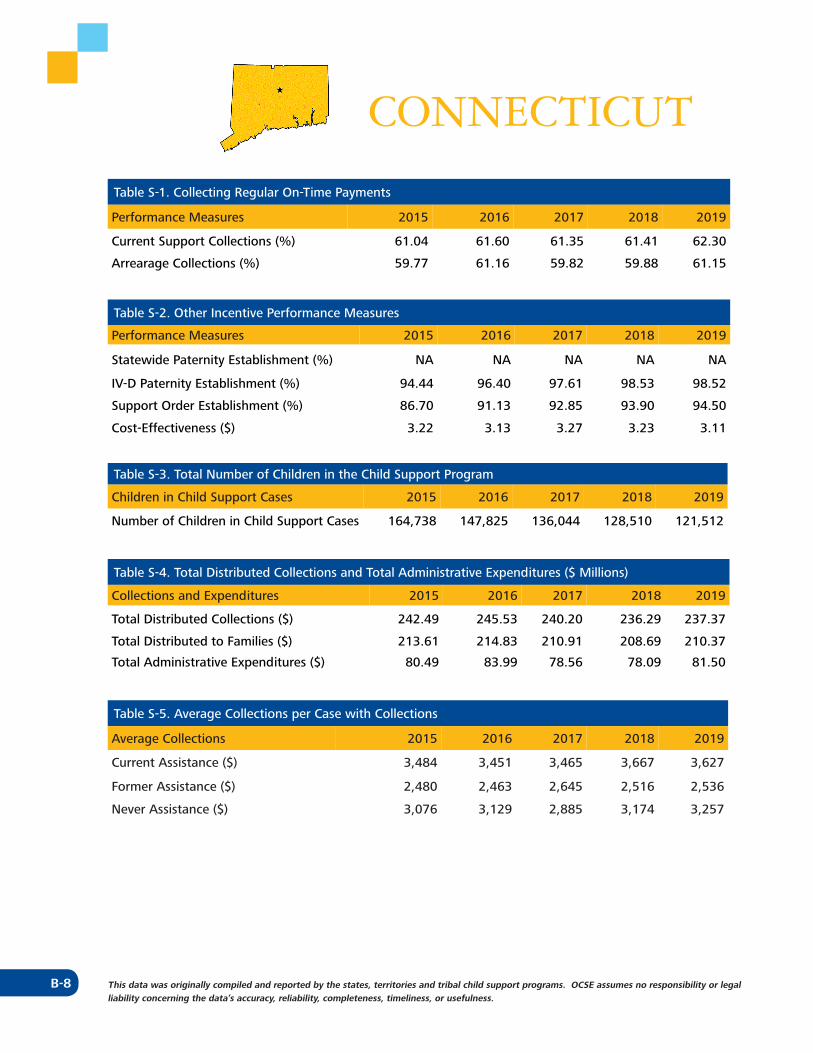
CONNECTICUT
Table S-1. Collecting Regular On-Time Payments
Performance Measures 2015 2016 2017 2018 2019
Current Support Collections (%) 61.04 61.60 61.35 61.41 62.30
Arrearage Collections (%) 59.77 61.16 59.82 59.88 61.15
Table S-2. Other Incentive Performance Measures
Performance Measures 2015 2016 2017 2018 2019
Statewide Paternity Establishment (%) NA NA NA NA NA
IV-D Paternity Establishment (%) 94.44 96.40 97.61 98.53 98.52
Support Order Establishment (%) 86.70 91.13 92.85 93.90 94.50
Cost-Effectiveness ($) 3.22 3.13 3.27 3.23 3.11
Table S-3. Total Number of Children in the Child Support Program
Children in Child Support Cases 2015 2016 2017 2018 2019
Number of Children in Child Support Cases 164,738 147,825 136,044 128,510 121,512
Table S-4. Total Distributed Collections and Total Administrative Expenditures ($ Millions)
Collections and Expenditures 2015 2016 2017 2018 2019
Total Distributed Collections ($) 242.49 245.53 240.20 236.29 237.37
Total Distributed to Families ($) 213.61 214.83 210.91 208.69 210.37
Total Administrative Expenditures ($) 80.49 83.99 78.56 78.09 81.50
Table S-5. Average Collections per Case with Collections
Average Collections 2015 2016 2017 2018 2019
Current Assistance ($) 3,484 3,451 3,465 3,667 3,627
Former Assistance ($) 2,480 2,463 2,645 2,516 2,536
Never Assistance ($) 3,076 3,129 2,885 3,174 3,257
B-9This data was originally compiled and reported by the states, territories and tribal child support programs. OCSE assumes no responsibility or legal liability concerning the data’s accuracy, reliability, completeness, timeliness, or usefulness.
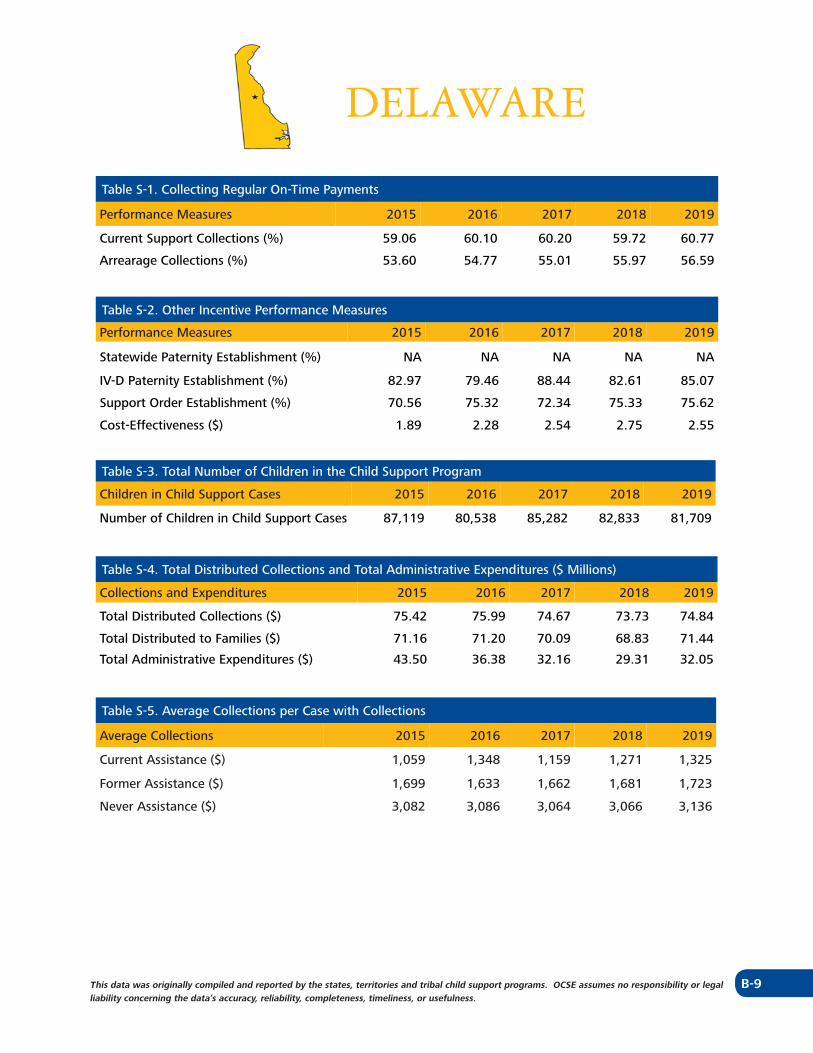
DELAWARE
Table S-1. Collecting Regular On-Time Payments
Performance Measures 2015 2016 2017 2018 2019
Current Support Collections (%) 59.06 60.10 60.20 59.72 60.77
Arrearage Collections (%) 53.60 54.77 55.01 55.97 56.59
Table S-2. Other Incentive Performance Measures
Performance Measures 2015 2016 2017 2018 2019
Statewide Paternity Establishment (%) NA NA NA NA NA
IV-D Paternity Establishment (%) 82.97 79.46 88.44 82.61 85.07
Support Order Establishment (%) 70.56 75.32 72.34 75.33 75.62
Cost-Effectiveness ($) 1.89 2.28 2.54 2.75 2.55
Table S-3. Total Number of Children in the Child Support Program
Children in Child Support Cases 2015 2016 2017 2018 2019
Number of Children in Child Support Cases 87,119 80,538 85,282 82,833 81,709
Table S-4. Total Distributed Collections and Total Administrative Expenditures ($ Millions)
Collections and Expenditures 2015 2016 2017 2018 2019
Total Distributed Collections ($) 75.42 75.99 74.67 73.73 74.84
Total Distributed to Families ($) 71.16 71.20 70.09 68.83 71.44
Total Administrative Expenditures ($) 43.50 36.38 32.16 29.31 32.05
Table S-5. Average Collections per Case with Collections
Average Collections 2015 2016 2017 2018 2019
Current Assistance ($) 1,059 1,348 1,159 1,271 1,325
Former Assistance ($) 1,699 1,633 1,662 1,681 1,723
Never Assistance ($) 3,082 3,086 3,064 3,066 3,136
B-10 This data was originally compiled and reported by the states, territories and tribal child support programs. OCSE assumes no responsibility or legal liability concerning the data’s accuracy, reliability, completeness, timeliness, or usefulness.
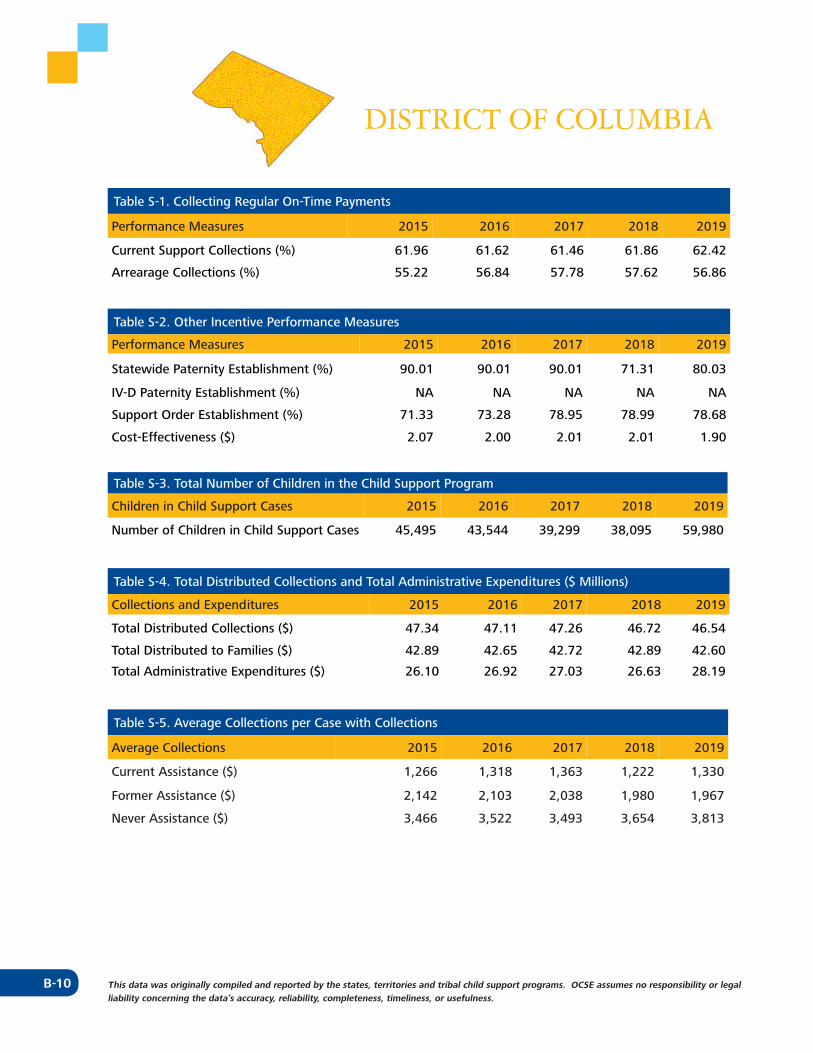
DISTRICT OF COLUMBIA
Table S-1. Collecting Regular On-Time Payments
Performance Measures 2015 2016 2017 2018 2019
Current Support Collections (%) 61.96 61.62 61.46 61.86 62.42
Arrearage Collections (%) 55.22 56.84 57.78 57.62 56.86
Table S-2. Other Incentive Performance Measures
Performance Measures 2015 2016 2017 2018 2019
Statewide Paternity Establishment (%) 90.01 90.01 90.01 71.31 80.03
IV-D Paternity Establishment (%) NA NA NA NA NA
Support Order Establishment (%) 71.33 73.28 78.95 78.99 78.68
Cost-Effectiveness ($) 2.07 2.00 2.01 2.01 1.90
Table S-3. Total Number of Children in the Child Support Program
Children in Child Support Cases 2015 2016 2017 2018 2019
Number of Children in Child Support Cases 45,495 43,544 39,299 38,095 59,980
Table S-4. Total Distributed Collections and Total Administrative Expenditures ($ Millions)
Collections and Expenditures 2015 2016 2017 2018 2019
Total Distributed Collections ($) 47.34 47.11 47.26 46.72 46.54
Total Distributed to Families ($) 42.89 42.65 42.72 42.89 42.60
Total Administrative Expenditures ($) 26.10 26.92 27.03 26.63 28.19
Table S-5. Average Collections per Case with Collections
Average Collections 2015 2016 2017 2018 2019
Current Assistance ($) 1,266 1,318 1,363 1,222 1,330
Former Assistance ($) 2,142 2,103 2,038 1,980 1,967
Never Assistance ($) 3,466 3,522 3,493 3,654 3,813
B-11This data was originally compiled and reported by the states, territories and tribal child support programs. OCSE assumes no responsibility or legal liability concerning the data’s accuracy, reliability, completeness, timeliness, or usefulness.
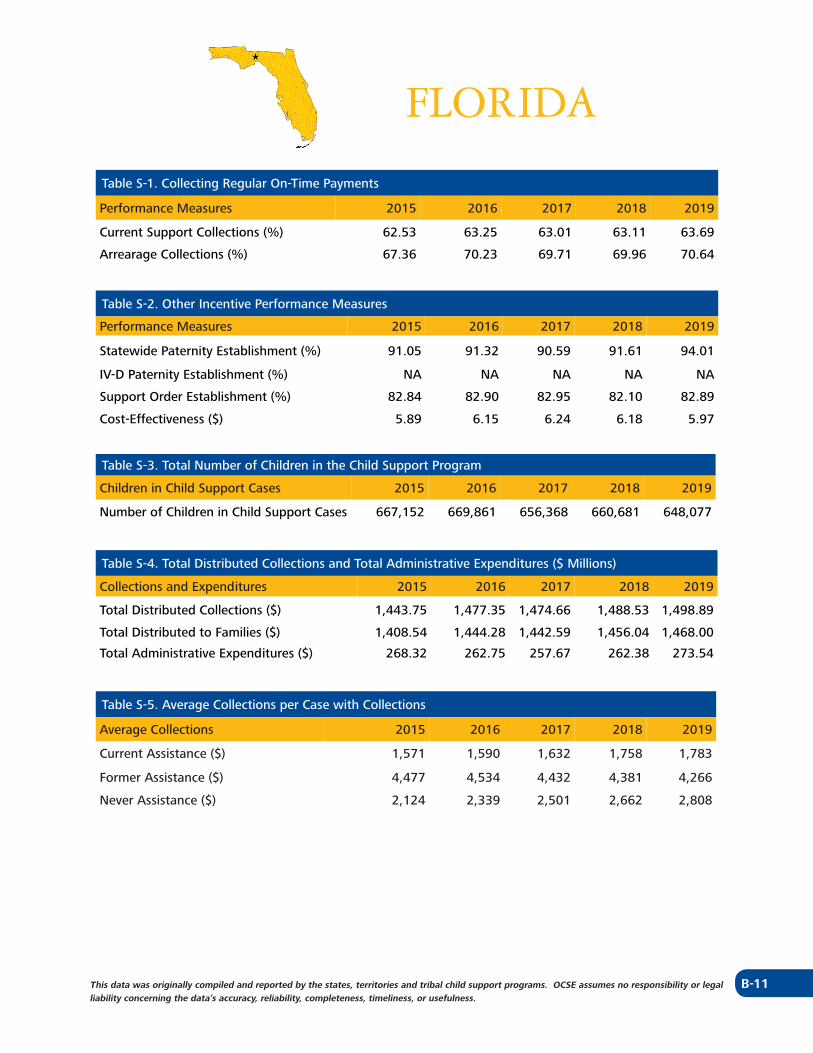
FLORIDA
Table S-1. Collecting Regular On-Time Payments
Performance Measures 2015 2016 2017 2018 2019
Current Support Collections (%) 62.53 63.25 63.01 63.11 63.69
Arrearage Collections (%) 67.36 70.23 69.71 69.96 70.64
Table S-2. Other Incentive Performance Measures
Performance Measures 2015 2016 2017 2018 2019
Statewide Paternity Establishment (%) 91.05 91.32 90.59 91.61 94.01
IV-D Paternity Establishment (%) NA NA NA NA NA
Support Order Establishment (%) 82.84 82.90 82.95 82.10 82.89
Cost-Effectiveness ($) 5.89 6.15 6.24 6.18 5.97
Table S-3. Total Number of Children in the Child Support Program
Children in Child Support Cases 2015 2016 2017 2018 2019
Number of Children in Child Support Cases 667,152 669,861 656,368 660,681 648,077
Table S-4. Total Distributed Collections and Total Administrative Expenditures ($ Millions)
Collections and Expenditures 2015 2016 2017 2018 2019
Total Distributed Collections ($) 1,443.75 1,477.35 1,474.66 1,488.53 1,498.89
Total Distributed to Families ($) 1,408.54 1,444.28 1,442.59 1,456.04 1,468.00
Total Administrative Expenditures ($) 268.32 262.75 257.67 262.38 273.54
Table S-5. Average Collections per Case with Collections
Average Collections 2015 2016 2017 2018 2019
Current Assistance ($) 1,571 1,590 1,632 1,758 1,783
Former Assistance ($) 4,477 4,534 4,432 4,381 4,266
Never Assistance ($) 2,124 2,339 2,501 2,662 2,808
B-12 This data was originally compiled and reported by the states, territories and tribal child support programs. OCSE assumes no responsibility or legal liability concerning the data’s accuracy, reliability, completeness, timeliness, or usefulness.
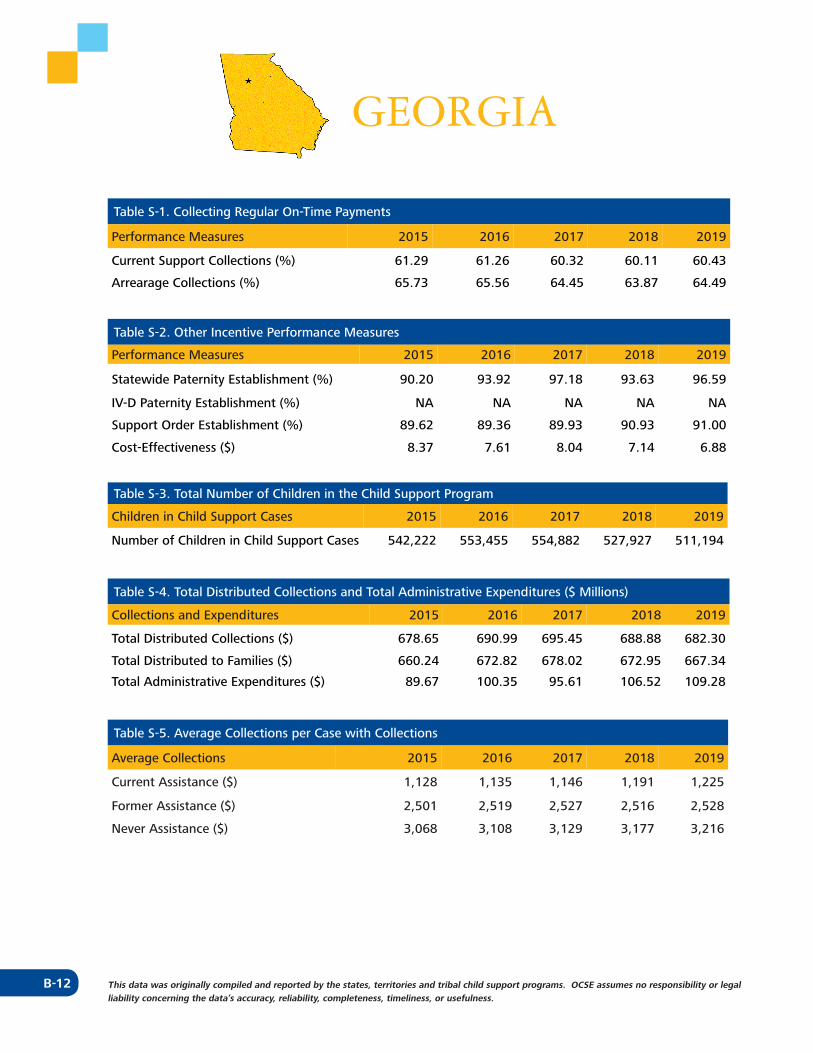
GEORGIA
Table S-1. Collecting Regular On-Time Payments
Performance Measures 2015 2016 2017 2018 2019
Current Support Collections (%) 61.29 61.26 60.32 60.11 60.43
Arrearage Collections (%) 65.73 65.56 64.45 63.87 64.49
Table S-2. Other Incentive Performance Measures
Performance Measures 2015 2016 2017 2018 2019
Statewide Paternity Establishment (%) 90.20 93.92 97.18 93.63 96.59
IV-D Paternity Establishment (%) NA NA NA NA NA
Support Order Establishment (%) 89.62 89.36 89.93 90.93 91.00
Cost-Effectiveness ($) 8.37 7.61 8.04 7.14 6.88
Table S-3. Total Number of Children in the Child Support Program
Children in Child Support Cases 2015 2016 2017 2018 2019
Number of Children in Child Support Cases 542,222 553,455 554,882 527,927 511,194
Table S-4. Total Distributed Collections and Total Administrative Expenditures ($ Millions)
Collections and Expenditures 2015 2016 2017 2018 2019
Total Distributed Collections ($) 678.65 690.99 695.45 688.88 682.30
Total Distributed to Families ($) 660.24 672.82 678.02 672.95 667.34
Total Administrative Expenditures ($) 89.67 100.35 95.61 106.52 109.28
Table S-5. Average Collections per Case with Collections
Average Collections 2015 2016 2017 2018 2019
Current Assistance ($) 1,128 1,135 1,146 1,191 1,225
Former Assistance ($) 2,501 2,519 2,527 2,516 2,528
Never Assistance ($) 3,068 3,108 3,129 3,177 3,216
B-13This data was originally compiled and reported by the states, territories and tribal child support programs. OCSE assumes no responsibility or legal liability concerning the data’s accuracy, reliability, completeness, timeliness, or usefulness.
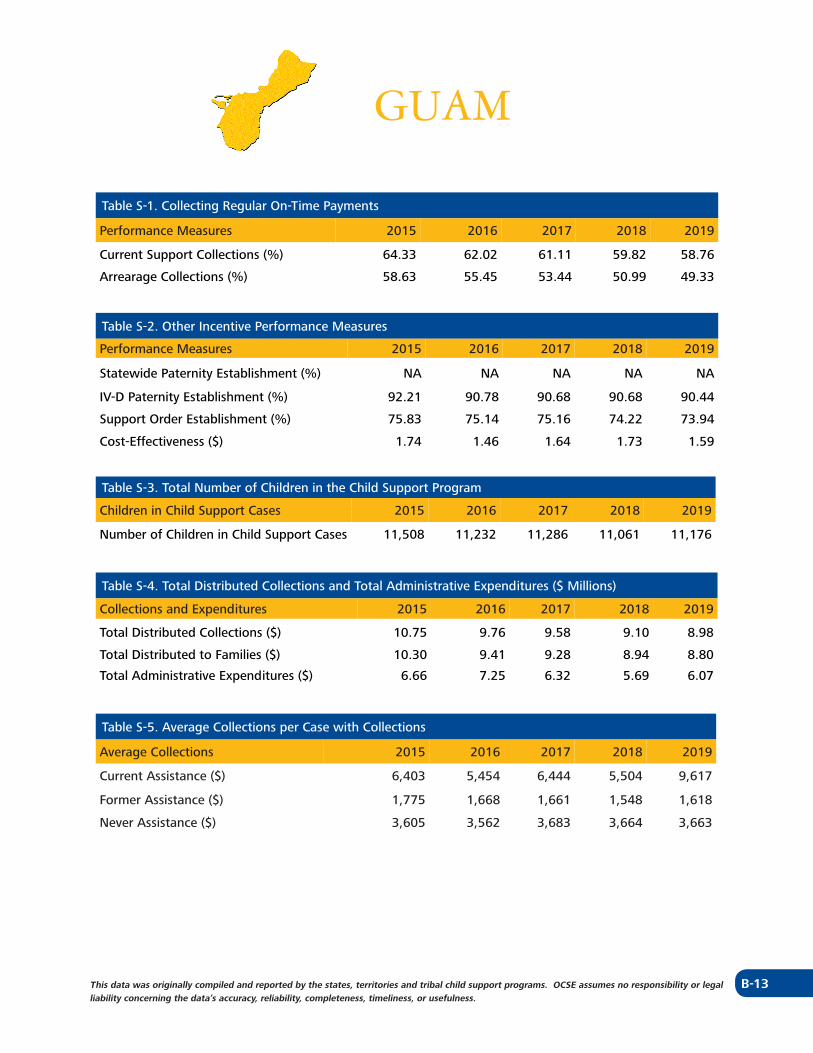
GUAM
Table S-1. Collecting Regular On-Time Payments
Performance Measures 2015 2016 2017 2018 2019
Current Support Collections (%) 64.33 62.02 61.11 59.82 58.76
Arrearage Collections (%) 58.63 55.45 53.44 50.99 49.33
Table S-2. Other Incentive Performance Measures
Performance Measures 2015 2016 2017 2018 2019
Statewide Paternity Establishment (%) NA NA NA NA NA
IV-D Paternity Establishment (%) 92.21 90.78 90.68 90.68 90.44
Support Order Establishment (%) 75.83 75.14 75.16 74.22 73.94
Cost-Effectiveness ($) 1.74 1.46 1.64 1.73 1.59
Table S-3. Total Number of Children in the Child Support Program
Children in Child Support Cases 2015 2016 2017 2018 2019
Number of Children in Child Support Cases 11,508 11,232 11,286 11,061 11,176
Table S-4. Total Distributed Collections and Total Administrative Expenditures ($ Millions)
Collections and Expenditures 2015 2016 2017 2018 2019
Total Distributed Collections ($) 10.75 9.76 9.58 9.10 8.98
Total Distributed to Families ($) 10.30 9.41 9.28 8.94 8.80
Total Administrative Expenditures ($) 6.66 7.25 6.32 5.69 6.07
Table S-5. Average Collections per Case with Collections
Average Collections 2015 2016 2017 2018 2019
Current Assistance ($) 6,403 5,454 6,444 5,504 9,617
Former Assistance ($) 1,775 1,668 1,661 1,548 1,618
Never Assistance ($) 3,605 3,562 3,683 3,664 3,663
B-14 This data was originally compiled and reported by the states, territories and tribal child support programs. OCSE assumes no responsibility or legal liability concerning the data’s accuracy, reliability, completeness, timeliness, or usefulness.
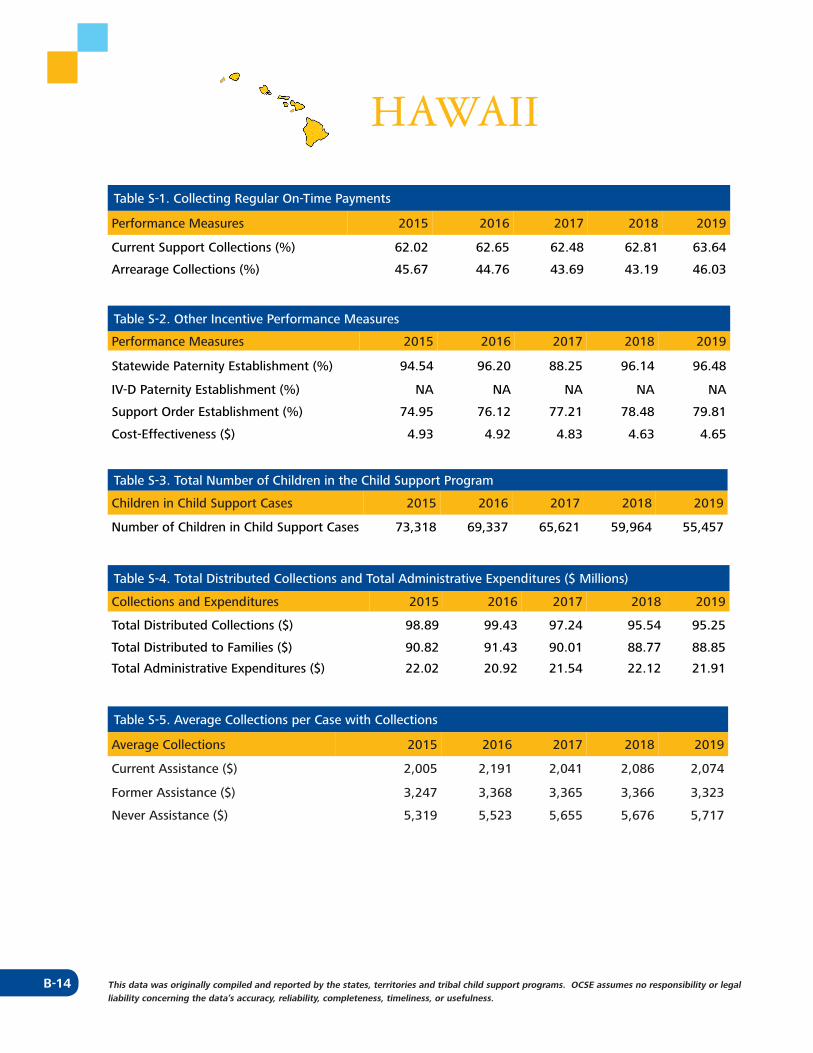
HAWAII
Table S-1. Collecting Regular On-Time Payments
Performance Measures 2015 2016 2017 2018 2019
Current Support Collections (%) 62.02 62.65 62.48 62.81 63.64
Arrearage Collections (%) 45.67 44.76 43.69 43.19 46.03
Table S-2. Other Incentive Performance Measures
Performance Measures 2015 2016 2017 2018 2019
Statewide Paternity Establishment (%) 94.54 96.20 88.25 96.14 96.48
IV-D Paternity Establishment (%) NA NA NA NA NA
Support Order Establishment (%) 74.95 76.12 77.21 78.48 79.81
Cost-Effectiveness ($) 4.93 4.92 4.83 4.63 4.65
Table S-3. Total Number of Children in the Child Support Program
Children in Child Support Cases 2015 2016 2017 2018 2019
Number of Children in Child Support Cases 73,318 69,337 65,621 59,964 55,457
Table S-4. Total Distributed Collections and Total Administrative Expenditures ($ Millions)
Collections and Expenditures 2015 2016 2017 2018 2019
Total Distributed Collections ($) 98.89 99.43 97.24 95.54 95.25
Total Distributed to Families ($) 90.82 91.43 90.01 88.77 88.85
Total Administrative Expenditures ($) 22.02 20.92 21.54 22.12 21.91
Table S-5. Average Collections per Case with Collections
Average Collections 2015 2016 2017 2018 2019
Current Assistance ($) 2,005 2,191 2,041 2,086 2,074
Former Assistance ($) 3,247 3,368 3,365 3,366 3,323
Never Assistance ($) 5,319 5,523 5,655 5,676 5,717
B-15This data was originally compiled and reported by the states, territories and tribal child support programs. OCSE assumes no responsibility or legal liability concerning the data’s accuracy, reliability, completeness, timeliness, or usefulness.
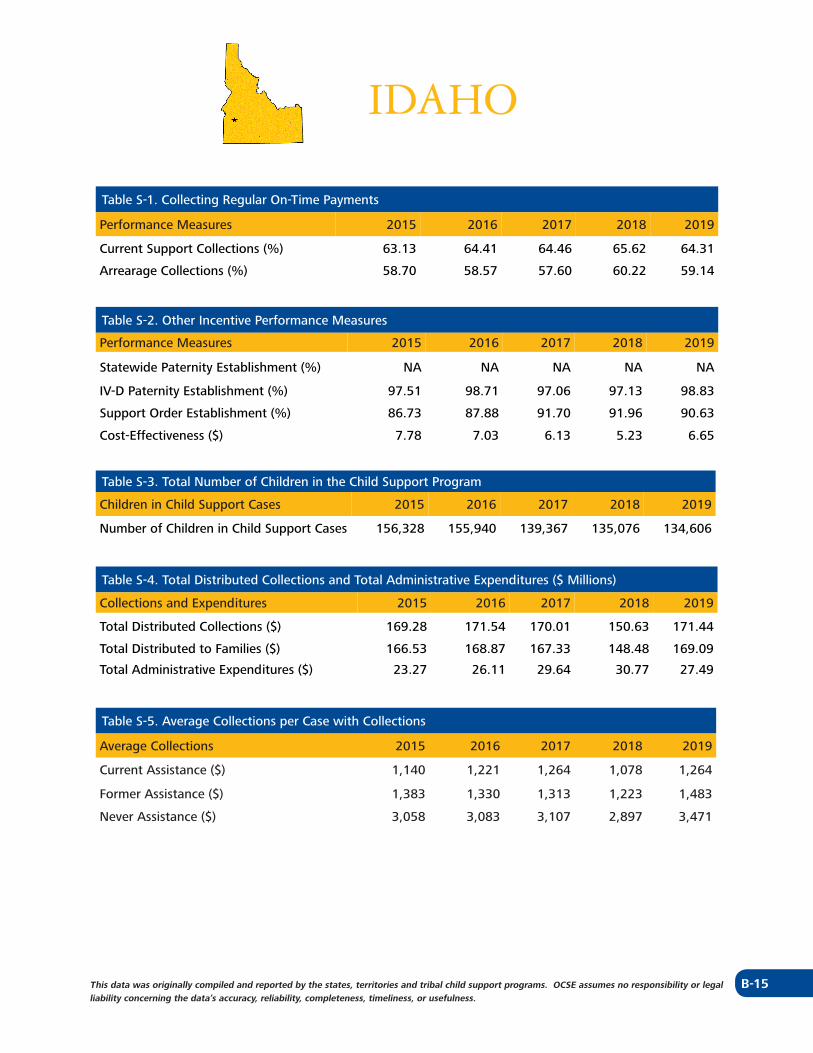
IDAHO
Table S-1. Collecting Regular On-Time Payments
Performance Measures 2015 2016 2017 2018 2019
Current Support Collections (%) 63.13 64.41 64.46 65.62 64.31
Arrearage Collections (%) 58.70 58.57 57.60 60.22 59.14
Table S-2. Other Incentive Performance Measures
Performance Measures 2015 2016 2017 2018 2019
Statewide Paternity Establishment (%) NA NA NA NA NA
IV-D Paternity Establishment (%) 97.51 98.71 97.06 97.13 98.83
Support Order Establishment (%) 86.73 87.88 91.70 91.96 90.63
Cost-Effectiveness ($) 7.78 7.03 6.13 5.23 6.65
Table S-3. Total Number of Children in the Child Support Program
Children in Child Support Cases 2015 2016 2017 2018 2019
Number of Children in Child Support Cases 156,328 155,940 139,367 135,076 134,606
Table S-4. Total Distributed Collections and Total Administrative Expenditures ($ Millions)
Collections and Expenditures 2015 2016 2017 2018 2019
Total Distributed Collections ($) 169.28 171.54 170.01 150.63 171.44
Total Distributed to Families ($) 166.53 168.87 167.33 148.48 169.09
Total Administrative Expenditures ($) 23.27 26.11 29.64 30.77 27.49
Table S-5. Average Collections per Case with Collections
Average Collections 2015 2016 2017 2018 2019
Current Assistance ($) 1,140 1,221 1,264 1,078 1,264
Former Assistance ($) 1,383 1,330 1,313 1,223 1,483
Never Assistance ($) 3,058 3,083 3,107 2,897 3,471
B-16 This data was originally compiled and reported by the states, territories and tribal child support programs. OCSE assumes no responsibility or legal liability concerning the data’s accuracy, reliability, completeness, timeliness, or usefulness.
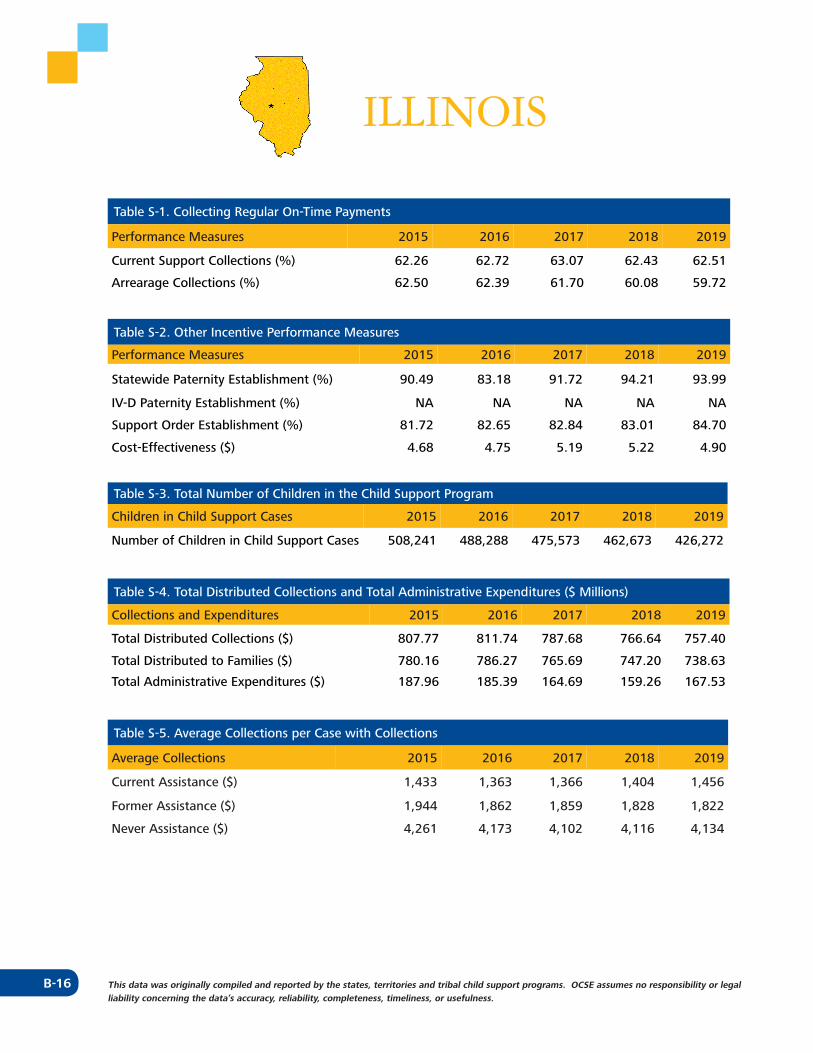
ILLINOIS
Table S-1. Collecting Regular On-Time Payments
Performance Measures 2015 2016 2017 2018 2019
Current Support Collections (%) 62.26 62.72 63.07 62.43 62.51
Arrearage Collections (%) 62.50 62.39 61.70 60.08 59.72
Table S-2. Other Incentive Performance Measures
Performance Measures 2015 2016 2017 2018 2019
Statewide Paternity Establishment (%) 90.49 83.18 91.72 94.21 93.99
IV-D Paternity Establishment (%) NA NA NA NA NA
Support Order Establishment (%) 81.72 82.65 82.84 83.01 84.70
Cost-Effectiveness ($) 4.68 4.75 5.19 5.22 4.90
Table S-3. Total Number of Children in the Child Support Program
Children in Child Support Cases 2015 2016 2017 2018 2019
Number of Children in Child Support Cases 508,241 488,288 475,573 462,673 426,272
Table S-4. Total Distributed Collections and Total Administrative Expenditures ($ Millions)
Collections and Expenditures 2015 2016 2017 2018 2019
Total Distributed Collections ($) 807.77 811.74 787.68 766.64 757.40
Total Distributed to Families ($) 780.16 786.27 765.69 747.20 738.63
Total Administrative Expenditures ($) 187.96 185.39 164.69 159.26 167.53
Table S-5. Average Collections per Case with Collections
Average Collections 2015 2016 2017 2018 2019
Current Assistance ($) 1,433 1,363 1,366 1,404 1,456
Former Assistance ($) 1,944 1,862 1,859 1,828 1,822
Never Assistance ($) 4,261 4,173 4,102 4,116 4,134

B-17This data was originally compiled and reported by the states, territories and tribal child support programs. OCSE assumes no responsibility or legal liability concerning the data’s accuracy, reliability, completeness, timeliness, or usefulness.
INDIANA
Table S-1. Collecting Regular On-Time Payments
Performance Measures 2015 2016 2017 2018 2019
Current Support Collections (%) 64.78 65.31 65.98 66.35 66.96
Arrearage Collections (%) 71.85 73.26 72.32 72.38 73.49
Table S-2. Other Incentive Performance Measures
Performance Measures 2015 2016 2017 2018 2019
Statewide Paternity Establishment (%) NA NA NA NA NA
IV-D Paternity Establishment (%) 104.41 105.39 105.24 105.17 106.03
Support Order Establishment (%) 93.21 93.61 93.90 94.60 94.66
Cost-Effectiveness ($) 5.56 5.88 5.25 5.21 5.50
Table S-3. Total Number of Children in the Child Support Program
Children in Child Support Cases 2015 2016 2017 2018 2019
Number of Children in Child Support Cases 278,973 268,747 257,988 247,011 237,905
Table S-4. Total Distributed Collections and Total Administrative Expenditures ($ Millions)
Collections and Expenditures 2015 2016 2017 2018 2019
Total Distributed Collections ($) 553.89 549.29 529.81 521.99 518.71
Total Distributed to Families ($) 539.30 535.75 517.33 510.41 508.09
Total Administrative Expenditures ($) 106.39 99.71 107.94 107.06 100.95
Table S-5. Average Collections per Case with Collections
Average Collections 2015 2016 2017 2018 2019
Current Assistance ($) 1,141 1,090 1,104 1,137 1,053
Former Assistance ($) 2,328 2,270 2,242 2,229 2,208
Never Assistance ($) 3,273 3,276 3,280 3,332 3,395
B-18 This data was originally compiled and reported by the states, territories and tribal child support programs. OCSE assumes no responsibility or legal liability concerning the data’s accuracy, reliability, completeness, timeliness, or usefulness.
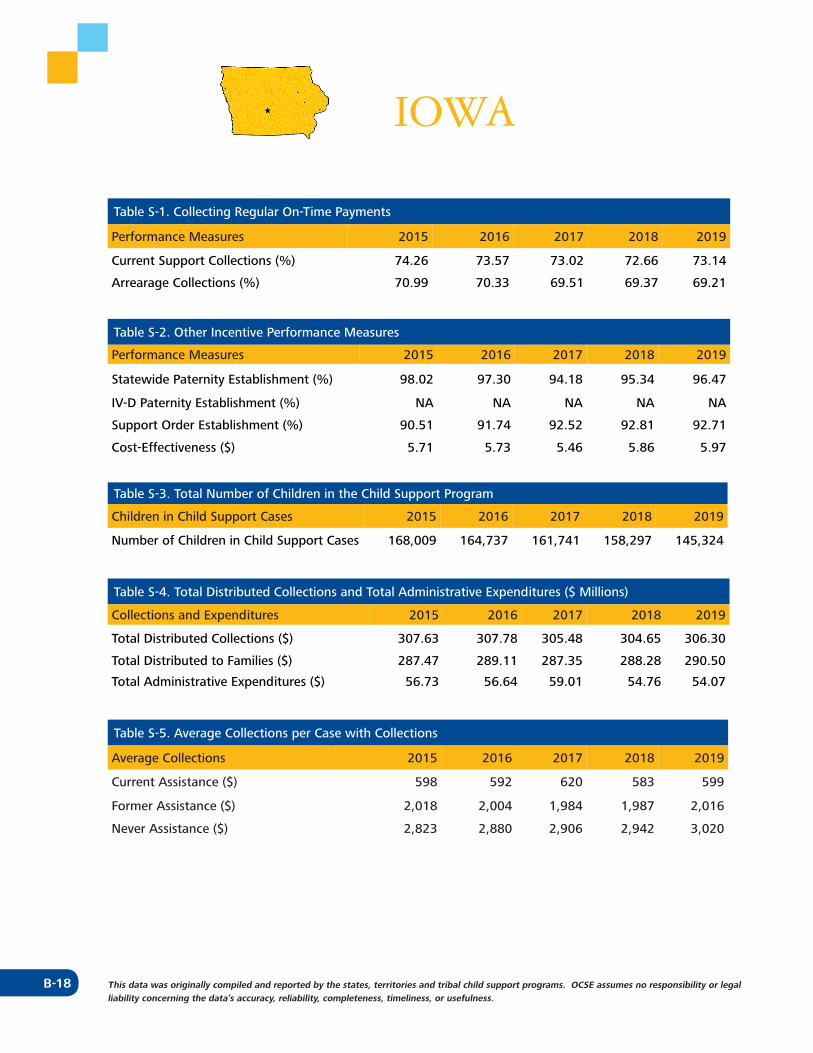
IOWA
Table S-1. Collecting Regular On-Time Payments
Performance Measures 2015 2016 2017 2018 2019
Current Support Collections (%) 74.26 73.57 73.02 72.66 73.14
Arrearage Collections (%) 70.99 70.33 69.51 69.37 69.21
Table S-2. Other Incentive Performance Measures
Performance Measures 2015 2016 2017 2018 2019
Statewide Paternity Establishment (%) 98.02 97.30 94.18 95.34 96.47
IV-D Paternity Establishment (%) NA NA NA NA NA
Support Order Establishment (%) 90.51 91.74 92.52 92.81 92.71
Cost-Effectiveness ($) 5.71 5.73 5.46 5.86 5.97
Table S-3. Total Number of Children in the Child Support Program
Children in Child Support Cases 2015 2016 2017 2018 2019
Number of Children in Child Support Cases 168,009 164,737 161,741 158,297 145,324
Table S-4. Total Distributed Collections and Total Administrative Expenditures ($ Millions)
Collections and Expenditures 2015 2016 2017 2018 2019
Total Distributed Collections ($) 307.63 307.78 305.48 304.65 306.30
Total Distributed to Families ($) 287.47 289.11 287.35 288.28 290.50
Total Administrative Expenditures ($) 56.73 56.64 59.01 54.76 54.07
Table S-5. Average Collections per Case with Collections
Average Collections 2015 2016 2017 2018 2019
Current Assistance ($) 598 592 620 583 599
Former Assistance ($) 2,018 2,004 1,984 1,987 2,016
Never Assistance ($) 2,823 2,880 2,906 2,942 3,020
B-19This data was originally compiled and reported by the states, territories and tribal child support programs. OCSE assumes no responsibility or legal liability concerning the data’s accuracy, reliability, completeness, timeliness, or usefulness.
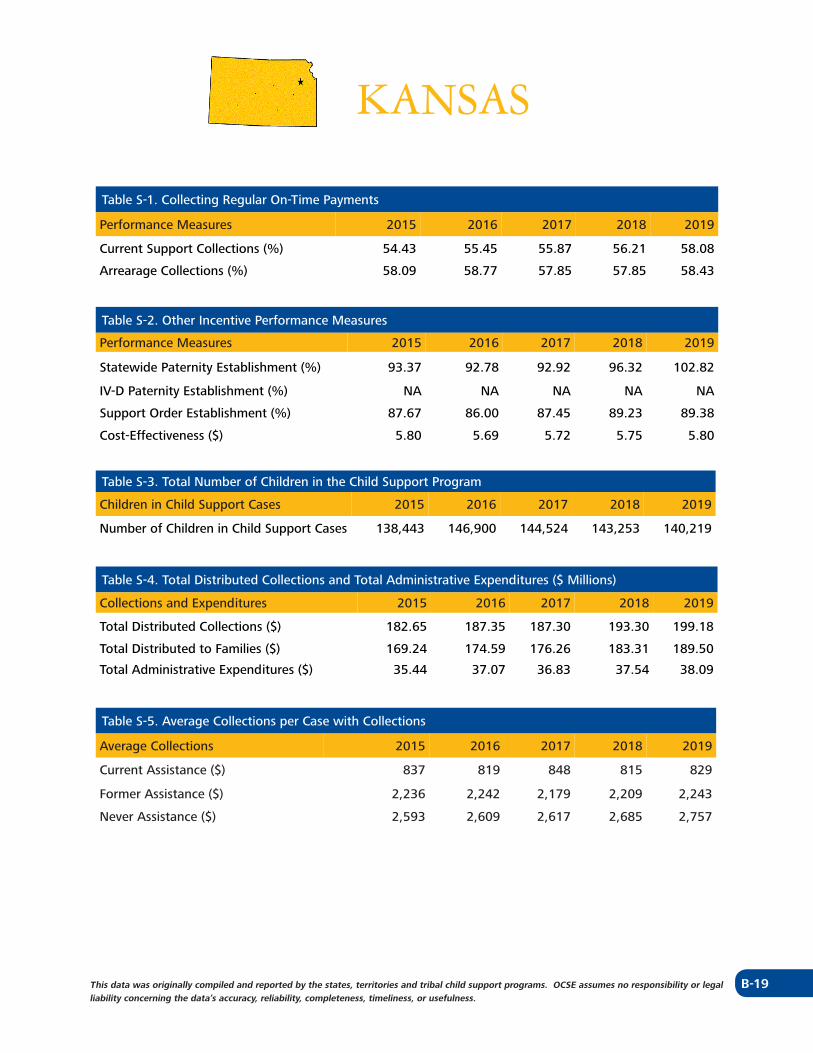
KANSAS
Table S-1. Collecting Regular On-Time Payments
Performance Measures 2015 2016 2017 2018 2019
Current Support Collections (%) 54.43 55.45 55.87 56.21 58.08
Arrearage Collections (%) 58.09 58.77 57.85 57.85 58.43
Table S-2. Other Incentive Performance Measures
Performance Measures 2015 2016 2017 2018 2019
Statewide Paternity Establishment (%) 93.37 92.78 92.92 96.32 102.82
IV-D Paternity Establishment (%) NA NA NA NA NA
Support Order Establishment (%) 87.67 86.00 87.45 89.23 89.38
Cost-Effectiveness ($) 5.80 5.69 5.72 5.75 5.80
Table S-3. Total Number of Children in the Child Support Program
Children in Child Support Cases 2015 2016 2017 2018 2019
Number of Children in Child Support Cases 138,443 146,900 144,524 143,253 140,219
Table S-4. Total Distributed Collections and Total Administrative Expenditures ($ Millions)
Collections and Expenditures 2015 2016 2017 2018 2019
Total Distributed Collections ($) 182.65 187.35 187.30 193.30 199.18
Total Distributed to Families ($) 169.24 174.59 176.26 183.31 189.50
Total Administrative Expenditures ($) 35.44 37.07 36.83 37.54 38.09
Table S-5. Average Collections per Case with Collections
Average Collections 2015 2016 2017 2018 2019
Current Assistance ($) 837 819 848 815 829
Former Assistance ($) 2,236 2,242 2,179 2,209 2,243
Never Assistance ($) 2,593 2,609 2,617 2,685 2,757
B-20 This data was originally compiled and reported by the states, territories and tribal child support programs. OCSE assumes no responsibility or legal liability concerning the data’s accuracy, reliability, completeness, timeliness, or usefulness.
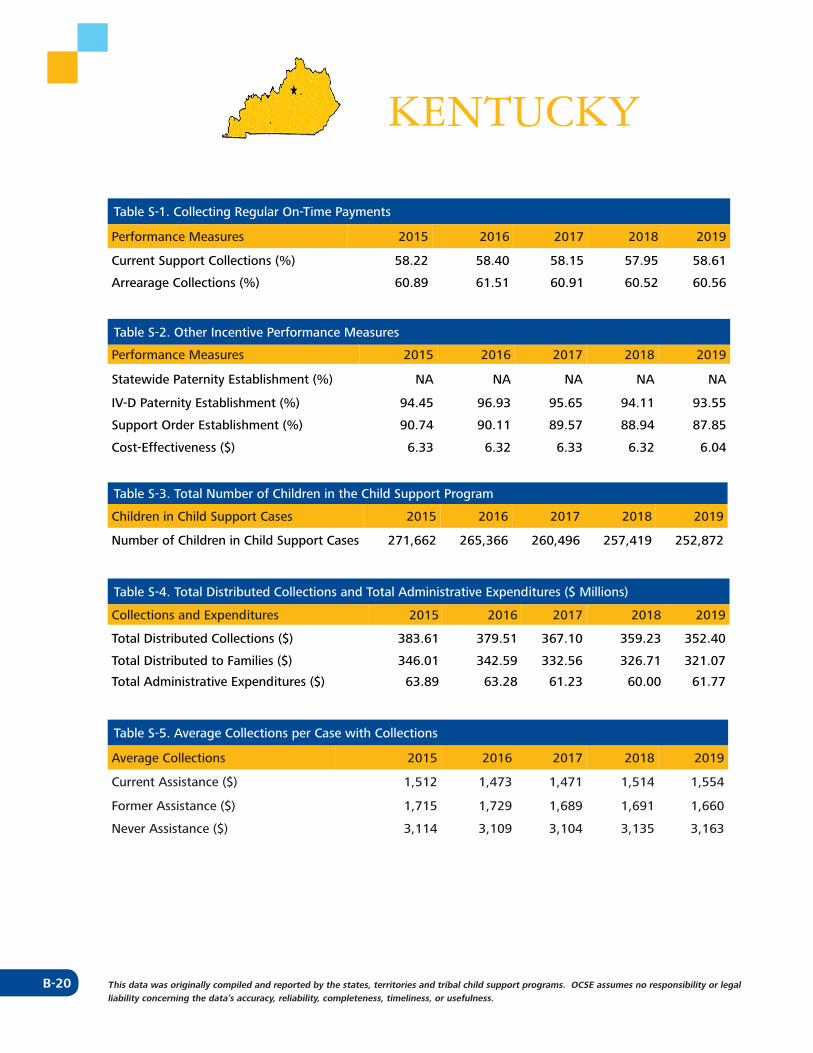
KENTUCKY
Table S-1. Collecting Regular On-Time Payments
Performance Measures 2015 2016 2017 2018 2019
Current Support Collections (%) 58.22 58.40 58.15 57.95 58.61
Arrearage Collections (%) 60.89 61.51 60.91 60.52 60.56
Table S-2. Other Incentive Performance Measures
Performance Measures 2015 2016 2017 2018 2019
Statewide Paternity Establishment (%) NA NA NA NA NA
IV-D Paternity Establishment (%) 94.45 96.93 95.65 94.11 93.55
Support Order Establishment (%) 90.74 90.11 89.57 88.94 87.85
Cost-Effectiveness ($) 6.33 6.32 6.33 6.32 6.04
Table S-3. Total Number of Children in the Child Support Program
Children in Child Support Cases 2015 2016 2017 2018 2019
Number of Children in Child Support Cases 271,662 265,366 260,496 257,419 252,872
Table S-4. Total Distributed Collections and Total Administrative Expenditures ($ Millions)
Collections and Expenditures 2015 2016 2017 2018 2019
Total Distributed Collections ($) 383.61 379.51 367.10 359.23 352.40
Total Distributed to Families ($) 346.01 342.59 332.56 326.71 321.07
Total Administrative Expenditures ($) 63.89 63.28 61.23 60.00 61.77
Table S-5. Average Collections per Case with Collections
Average Collections 2015 2016 2017 2018 2019
Current Assistance ($) 1,512 1,473 1,471 1,514 1,554
Former Assistance ($) 1,715 1,729 1,689 1,691 1,660
Never Assistance ($) 3,114 3,109 3,104 3,135 3,163
B-21This data was originally compiled and reported by the states, territories and tribal child support programs. OCSE assumes no responsibility or legal liability concerning the data’s accuracy, reliability, completeness, timeliness, or usefulness.
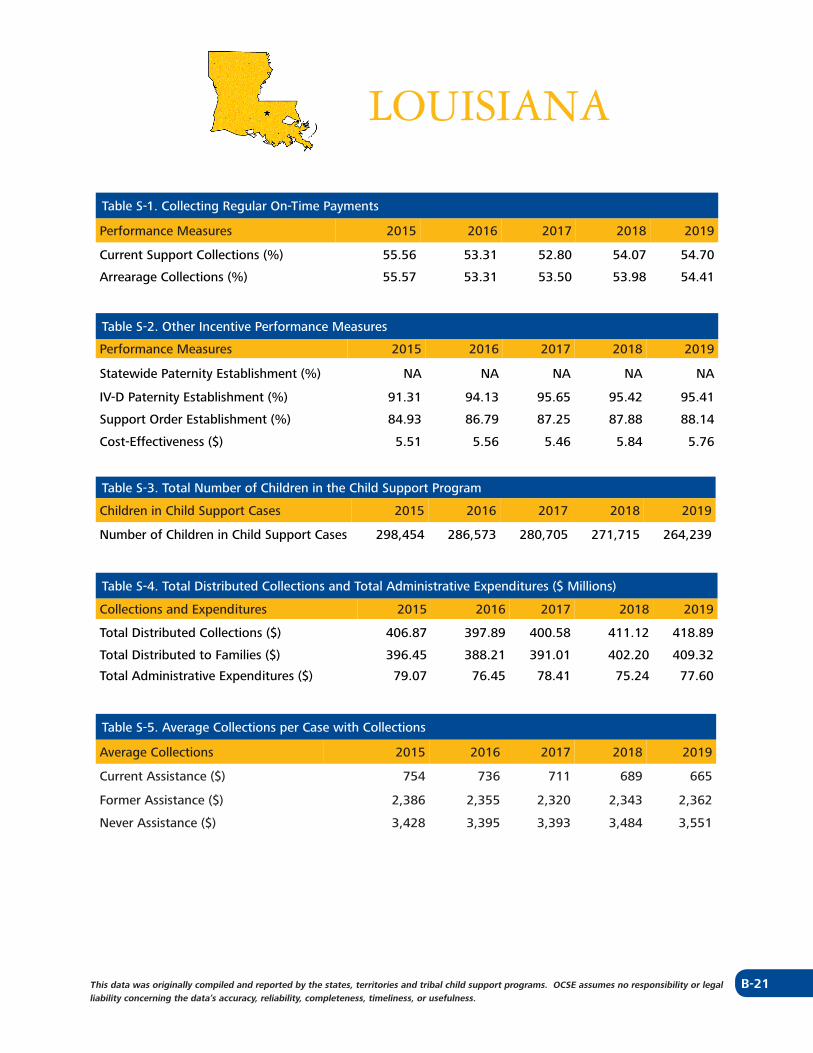
LOUISIANA
Table S-1. Collecting Regular On-Time Payments
Performance Measures 2015 2016 2017 2018 2019
Current Support Collections (%) 55.56 53.31 52.80 54.07 54.70
Arrearage Collections (%) 55.57 53.31 53.50 53.98 54.41
Table S-2. Other Incentive Performance Measures
Performance Measures 2015 2016 2017 2018 2019
Statewide Paternity Establishment (%) NA NA NA NA NA
IV-D Paternity Establishment (%) 91.31 94.13 95.65 95.42 95.41
Support Order Establishment (%) 84.93 86.79 87.25 87.88 88.14
Cost-Effectiveness ($) 5.51 5.56 5.46 5.84 5.76
Table S-3. Total Number of Children in the Child Support Program
Children in Child Support Cases 2015 2016 2017 2018 2019
Number of Children in Child Support Cases 298,454 286,573 280,705 271,715 264,239
Table S-4. Total Distributed Collections and Total Administrative Expenditures ($ Millions)
Collections and Expenditures 2015 2016 2017 2018 2019
Total Distributed Collections ($) 406.87 397.89 400.58 411.12 418.89
Total Distributed to Families ($) 396.45 388.21 391.01 402.20 409.32
Total Administrative Expenditures ($) 79.07 76.45 78.41 75.24 77.60
Table S-5. Average Collections per Case with Collections
Average Collections 2015 2016 2017 2018 2019
Current Assistance ($) 754 736 711 689 665
Former Assistance ($) 2,386 2,355 2,320 2,343 2,362
Never Assistance ($) 3,428 3,395 3,393 3,484 3,551
B-22 This data was originally compiled and reported by the states, territories and tribal child support programs. OCSE assumes no responsibility or legal liability concerning the data’s accuracy, reliability, completeness, timeliness, or usefulness.
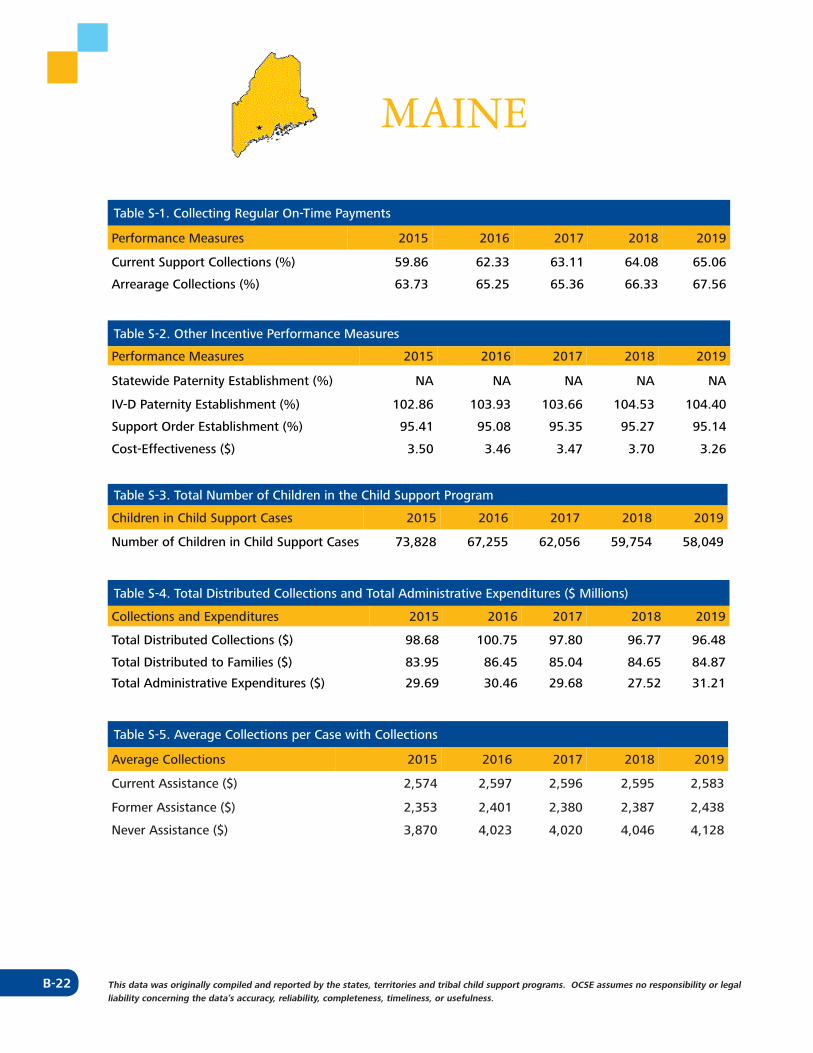
MAINE
Table S-1. Collecting Regular On-Time Payments
Performance Measures 2015 2016 2017 2018 2019
Current Support Collections (%) 59.86 62.33 63.11 64.08 65.06
Arrearage Collections (%) 63.73 65.25 65.36 66.33 67.56
Table S-2. Other Incentive Performance Measures
Performance Measures 2015 2016 2017 2018 2019
Statewide Paternity Establishment (%) NA NA NA NA NA
IV-D Paternity Establishment (%) 102.86 103.93 103.66 104.53 104.40
Support Order Establishment (%) 95.41 95.08 95.35 95.27 95.14
Cost-Effectiveness ($) 3.50 3.46 3.47 3.70 3.26
Table S-3. Total Number of Children in the Child Support Program
Children in Child Support Cases 2015 2016 2017 2018 2019
Number of Children in Child Support Cases 73,828 67,255 62,056 59,754 58,049
Table S-4. Total Distributed Collections and Total Administrative Expenditures ($ Millions)
Collections and Expenditures 2015 2016 2017 2018 2019
Total Distributed Collections ($) 98.68 100.75 97.80 96.77 96.48
Total Distributed to Families ($) 83.95 86.45 85.04 84.65 84.87
Total Administrative Expenditures ($) 29.69 30.46 29.68 27.52 31.21
Table S-5. Average Collections per Case with Collections
Average Collections 2015 2016 2017 2018 2019
Current Assistance ($) 2,574 2,597 2,596 2,595 2,583
Former Assistance ($) 2,353 2,401 2,380 2,387 2,438
Never Assistance ($) 3,870 4,023 4,020 4,046 4,128
B-23This data was originally compiled and reported by the states, territories and tribal child support programs. OCSE assumes no responsibility or legal liability concerning the data’s accuracy, reliability, completeness, timeliness, or usefulness.
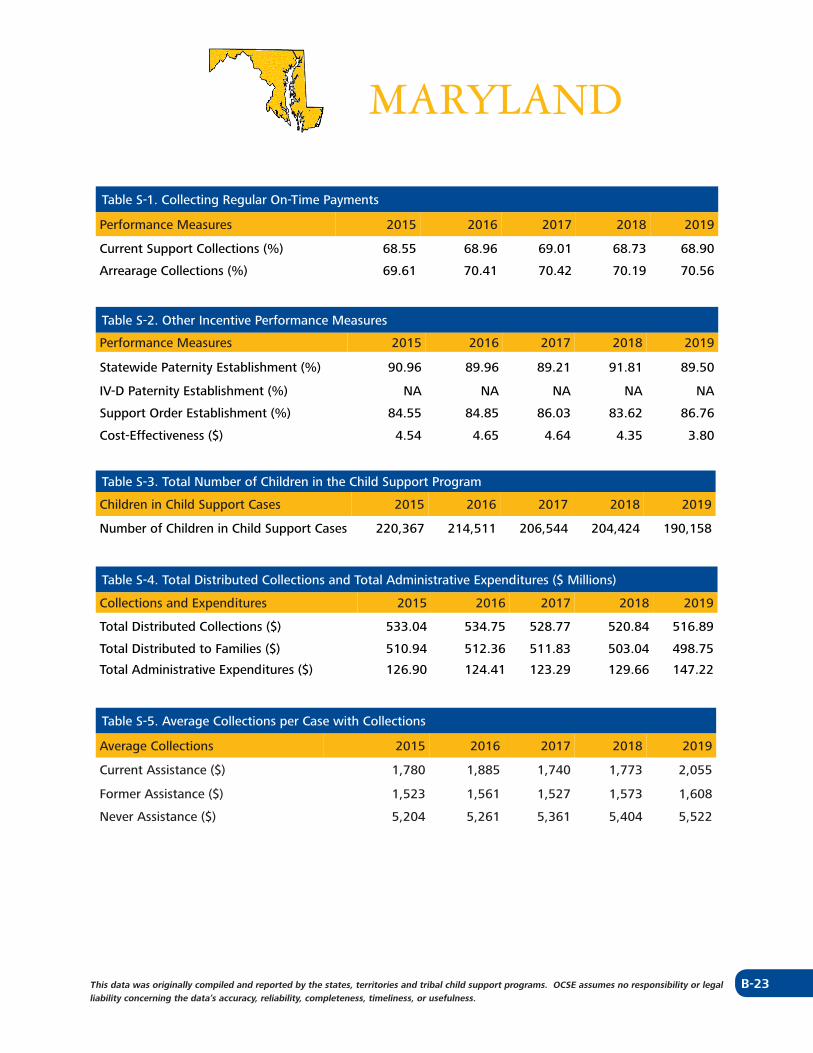
MARYLAND
Table S-1. Collecting Regular On-Time Payments
Performance Measures 2015 2016 2017 2018 2019
Current Support Collections (%) 68.55 68.96 69.01 68.73 68.90
Arrearage Collections (%) 69.61 70.41 70.42 70.19 70.56
Table S-2. Other Incentive Performance Measures
Performance Measures 2015 2016 2017 2018 2019
Statewide Paternity Establishment (%) 90.96 89.96 89.21 91.81 89.50
IV-D Paternity Establishment (%) NA NA NA NA NA
Support Order Establishment (%) 84.55 84.85 86.03 83.62 86.76
Cost-Effectiveness ($) 4.54 4.65 4.64 4.35 3.80
Table S-3. Total Number of Children in the Child Support Program
Children in Child Support Cases 2015 2016 2017 2018 2019
Number of Children in Child Support Cases 220,367 214,511 206,544 204,424 190,158
Table S-4. Total Distributed Collections and Total Administrative Expenditures ($ Millions)
Collections and Expenditures 2015 2016 2017 2018 2019
Total Distributed Collections ($) 533.04 534.75 528.77 520.84 516.89
Total Distributed to Families ($) 510.94 512.36 511.83 503.04 498.75
Total Administrative Expenditures ($) 126.90 124.41 123.29 129.66 147.22
Table S-5. Average Collections per Case with Collections
Average Collections 2015 2016 2017 2018 2019
Current Assistance ($) 1,780 1,885 1,740 1,773 2,055
Former Assistance ($) 1,523 1,561 1,527 1,573 1,608
Never Assistance ($) 5,204 5,261 5,361 5,404 5,522
B-24 This data was originally compiled and reported by the states, territories and tribal child support programs. OCSE assumes no responsibility or legal liability concerning the data’s accuracy, reliability, completeness, timeliness, or usefulness.
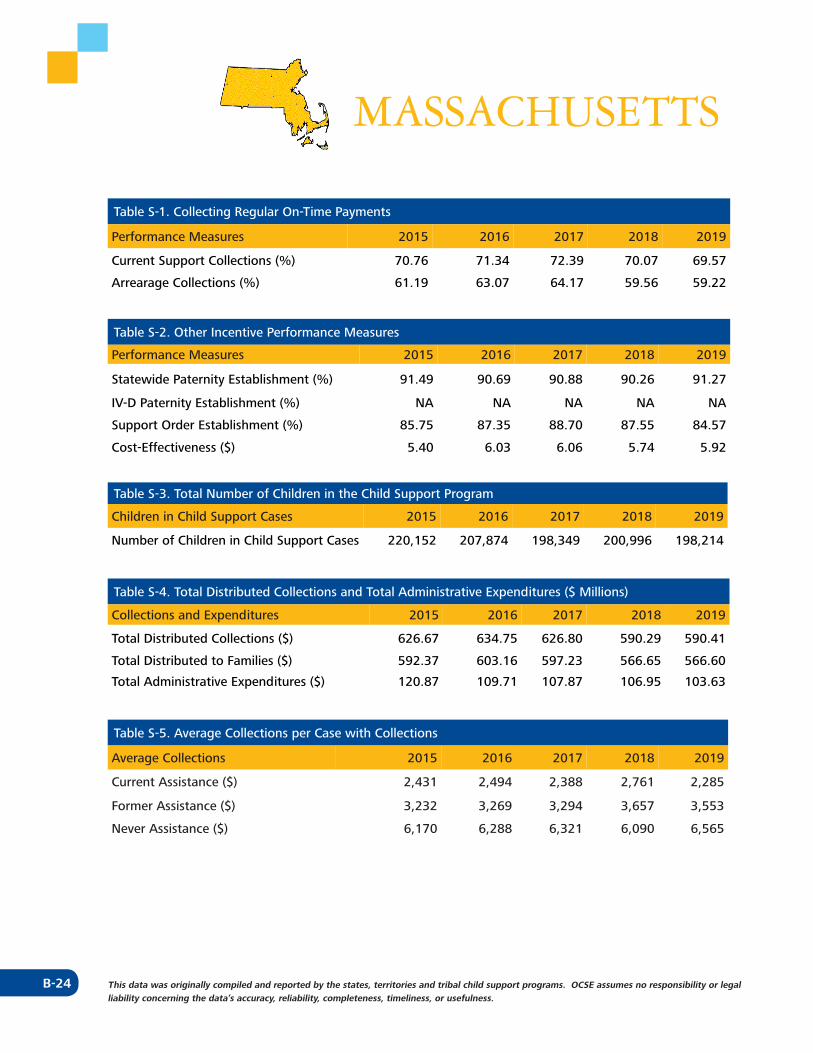
MASSACHUSETTS
Table S-1. Collecting Regular On-Time Payments
Performance Measures 2015 2016 2017 2018 2019
Current Support Collections (%) 70.76 71.34 72.39 70.07 69.57
Arrearage Collections (%) 61.19 63.07 64.17 59.56 59.22
Table S-2. Other Incentive Performance Measures
Performance Measures 2015 2016 2017 2018 2019
Statewide Paternity Establishment (%) 91.49 90.69 90.88 90.26 91.27
IV-D Paternity Establishment (%) NA NA NA NA NA
Support Order Establishment (%) 85.75 87.35 88.70 87.55 84.57
Cost-Effectiveness ($) 5.40 6.03 6.06 5.74 5.92
Table S-3. Total Number of Children in the Child Support Program
Children in Child Support Cases 2015 2016 2017 2018 2019
Number of Children in Child Support Cases 220,152 207,874 198,349 200,996 198,214
Table S-4. Total Distributed Collections and Total Administrative Expenditures ($ Millions)
Collections and Expenditures 2015 2016 2017 2018 2019
Total Distributed Collections ($) 626.67 634.75 626.80 590.29 590.41
Total Distributed to Families ($) 592.37 603.16 597.23 566.65 566.60
Total Administrative Expenditures ($) 120.87 109.71 107.87 106.95 103.63
Table S-5. Average Collections per Case with Collections
Average Collections 2015 2016 2017 2018 2019
Current Assistance ($) 2,431 2,494 2,388 2,761 2,285
Former Assistance ($) 3,232 3,269 3,294 3,657 3,553
Never Assistance ($) 6,170 6,288 6,321 6,090 6,565
B-25This data was originally compiled and reported by the states, territories and tribal child support programs. OCSE assumes no responsibility or legal liability concerning the data’s accuracy, reliability, completeness, timeliness, or usefulness.
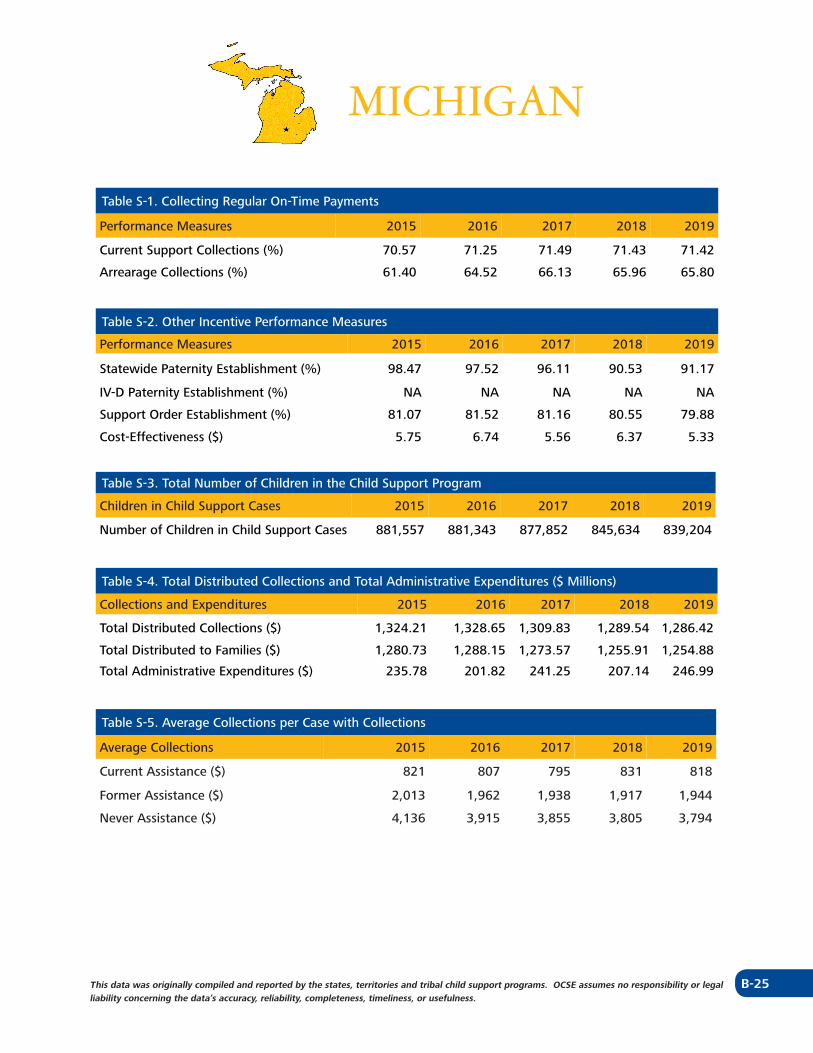
MICHIGAN
Table S-1. Collecting Regular On-Time Payments
Performance Measures 2015 2016 2017 2018 2019
Current Support Collections (%) 70.57 71.25 71.49 71.43 71.42
Arrearage Collections (%) 61.40 64.52 66.13 65.96 65.80
Table S-2. Other Incentive Performance Measures
Performance Measures 2015 2016 2017 2018 2019
Statewide Paternity Establishment (%) 98.47 97.52 96.11 90.53 91.17
IV-D Paternity Establishment (%) NA NA NA NA NA
Support Order Establishment (%) 81.07 81.52 81.16 80.55 79.88
Cost-Effectiveness ($) 5.75 6.74 5.56 6.37 5.33
Table S-3. Total Number of Children in the Child Support Program
Children in Child Support Cases 2015 2016 2017 2018 2019
Number of Children in Child Support Cases 881,557 881,343 877,852 845,634 839,204
Table S-4. Total Distributed Collections and Total Administrative Expenditures ($ Millions)
Collections and Expenditures 2015 2016 2017 2018 2019
Total Distributed Collections ($) 1,324.21 1,328.65 1,309.83 1,289.54 1,286.42
Total Distributed to Families ($) 1,280.73 1,288.15 1,273.57 1,255.91 1,254.88
Total Administrative Expenditures ($) 235.78 201.82 241.25 207.14 246.99
Table S-5. Average Collections per Case with Collections
Average Collections 2015 2016 2017 2018 2019
Current Assistance ($) 821 807 795 831 818
Former Assistance ($) 2,013 1,962 1,938 1,917 1,944
Never Assistance ($) 4,136 3,915 3,855 3,805 3,794
B-26 This data was originally compiled and reported by the states, territories and tribal child support programs. OCSE assumes no responsibility or legal liability concerning the data’s accuracy, reliability, completeness, timeliness, or usefulness.
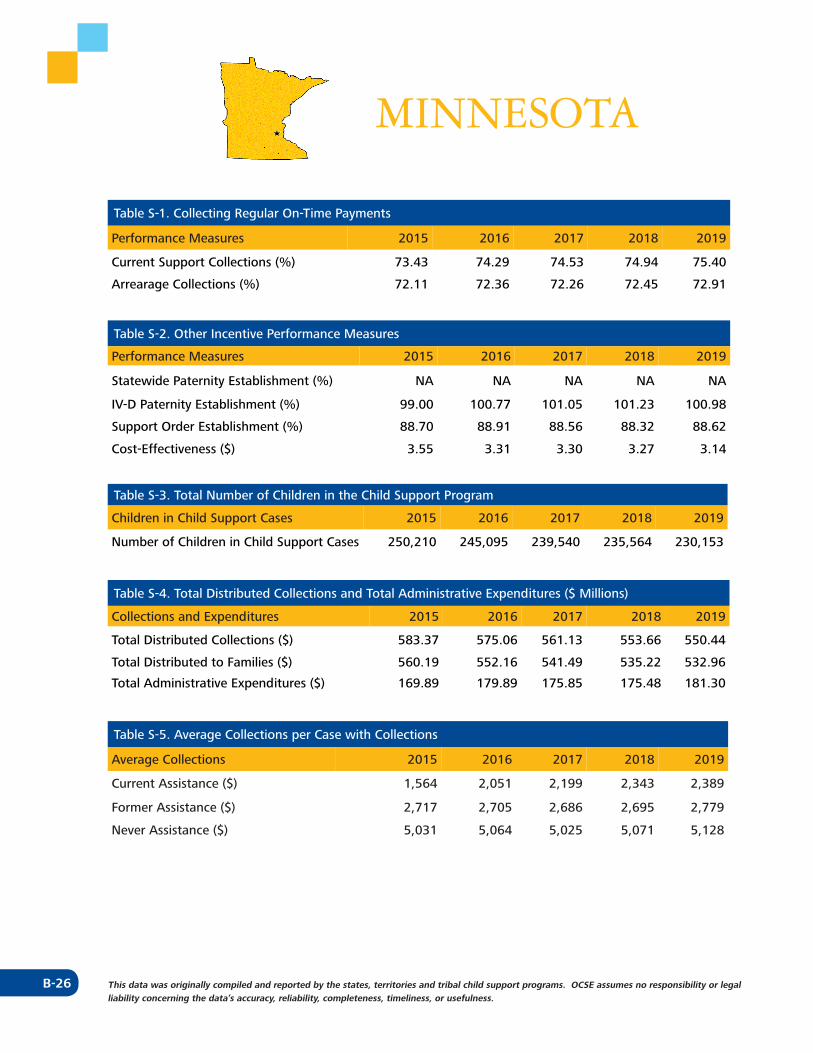
MINNESOTA
Table S-1. Collecting Regular On-Time Payments
Performance Measures 2015 2016 2017 2018 2019
Current Support Collections (%) 73.43 74.29 74.53 74.94 75.40
Arrearage Collections (%) 72.11 72.36 72.26 72.45 72.91
Table S-2. Other Incentive Performance Measures
Performance Measures 2015 2016 2017 2018 2019
Statewide Paternity Establishment (%) NA NA NA NA NA
IV-D Paternity Establishment (%) 99.00 100.77 101.05 101.23 100.98
Support Order Establishment (%) 88.70 88.91 88.56 88.32 88.62
Cost-Effectiveness ($) 3.55 3.31 3.30 3.27 3.14
Table S-3. Total Number of Children in the Child Support Program
Children in Child Support Cases 2015 2016 2017 2018 2019
Number of Children in Child Support Cases 250,210 245,095 239,540 235,564 230,153
Table S-4. Total Distributed Collections and Total Administrative Expenditures ($ Millions)
Collections and Expenditures 2015 2016 2017 2018 2019
Total Distributed Collections ($) 583.37 575.06 561.13 553.66 550.44
Total Distributed to Families ($) 560.19 552.16 541.49 535.22 532.96
Total Administrative Expenditures ($) 169.89 179.89 175.85 175.48 181.30
Table S-5. Average Collections per Case with Collections
Average Collections 2015 2016 2017 2018 2019
Current Assistance ($) 1,564 2,051 2,199 2,343 2,389
Former Assistance ($) 2,717 2,705 2,686 2,695 2,779
Never Assistance ($) 5,031 5,064 5,025 5,071 5,128
B-27This data was originally compiled and reported by the states, territories and tribal child support programs. OCSE assumes no responsibility or legal liability concerning the data’s accuracy, reliability, completeness, timeliness, or usefulness.
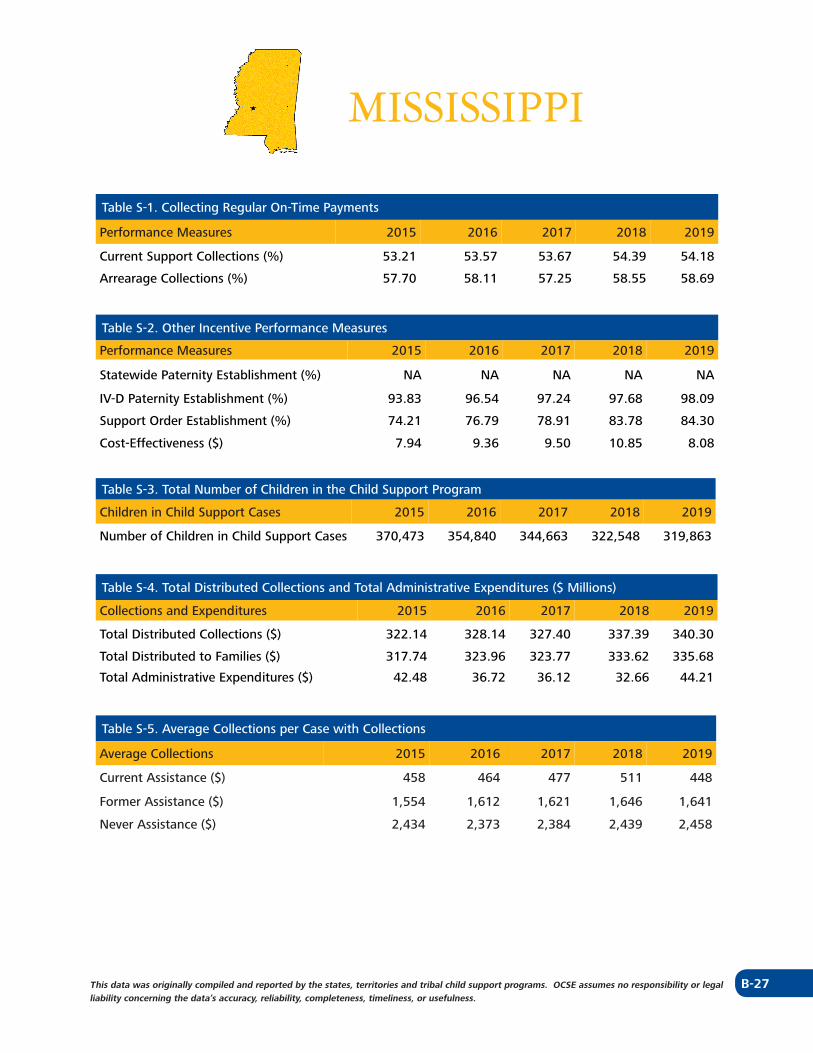
MISSISSIPPI
Table S-1. Collecting Regular On-Time Payments
Performance Measures 2015 2016 2017 2018 2019
Current Support Collections (%) 53.21 53.57 53.67 54.39 54.18
Arrearage Collections (%) 57.70 58.11 57.25 58.55 58.69
Table S-2. Other Incentive Performance Measures
Performance Measures 2015 2016 2017 2018 2019
Statewide Paternity Establishment (%) NA NA NA NA NA
IV-D Paternity Establishment (%) 93.83 96.54 97.24 97.68 98.09
Support Order Establishment (%) 74.21 76.79 78.91 83.78 84.30
Cost-Effectiveness ($) 7.94 9.36 9.50 10.85 8.08
Table S-3. Total Number of Children in the Child Support Program
Children in Child Support Cases 2015 2016 2017 2018 2019
Number of Children in Child Support Cases 370,473 354,840 344,663 322,548 319,863
Table S-4. Total Distributed Collections and Total Administrative Expenditures ($ Millions)
Collections and Expenditures 2015 2016 2017 2018 2019
Total Distributed Collections ($) 322.14 328.14 327.40 337.39 340.30
Total Distributed to Families ($) 317.74 323.96 323.77 333.62 335.68
Total Administrative Expenditures ($) 42.48 36.72 36.12 32.66 44.21
Table S-5. Average Collections per Case with Collections
Average Collections 2015 2016 2017 2018 2019
Current Assistance ($) 458 464 477 511 448
Former Assistance ($) 1,554 1,612 1,621 1,646 1,641
Never Assistance ($) 2,434 2,373 2,384 2,439 2,458
B-28 This data was originally compiled and reported by the states, territories and tribal child support programs. OCSE assumes no responsibility or legal liability concerning the data’s accuracy, reliability, completeness, timeliness, or usefulness.
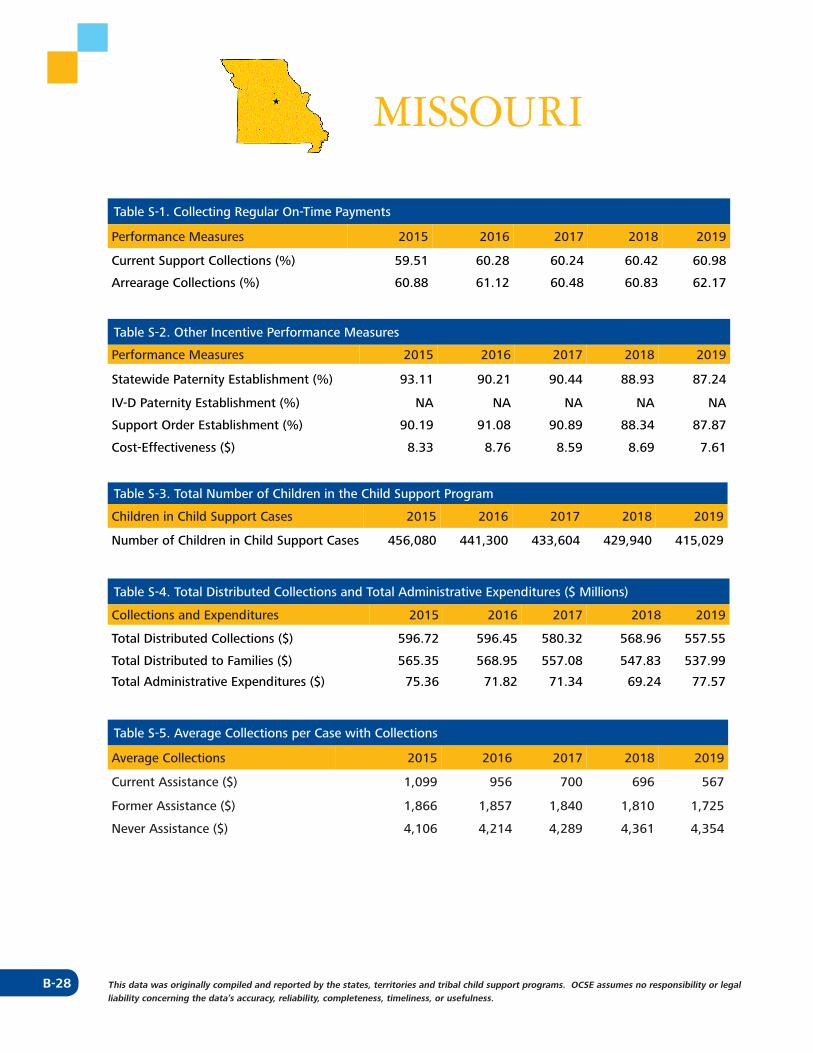
MISSOURI
Table S-1. Collecting Regular On-Time Payments
Performance Measures 2015 2016 2017 2018 2019
Current Support Collections (%) 59.51 60.28 60.24 60.42 60.98
Arrearage Collections (%) 60.88 61.12 60.48 60.83 62.17
Table S-2. Other Incentive Performance Measures
Performance Measures 2015 2016 2017 2018 2019
Statewide Paternity Establishment (%) 93.11 90.21 90.44 88.93 87.24
IV-D Paternity Establishment (%) NA NA NA NA NA
Support Order Establishment (%) 90.19 91.08 90.89 88.34 87.87
Cost-Effectiveness ($) 8.33 8.76 8.59 8.69 7.61
Table S-3. Total Number of Children in the Child Support Program
Children in Child Support Cases 2015 2016 2017 2018 2019
Number of Children in Child Support Cases 456,080 441,300 433,604 429,940 415,029
Table S-4. Total Distributed Collections and Total Administrative Expenditures ($ Millions)
Collections and Expenditures 2015 2016 2017 2018 2019
Total Distributed Collections ($) 596.72 596.45 580.32 568.96 557.55
Total Distributed to Families ($) 565.35 568.95 557.08 547.83 537.99
Total Administrative Expenditures ($) 75.36 71.82 71.34 69.24 77.57
Table S-5. Average Collections per Case with Collections
Average Collections 2015 2016 2017 2018 2019
Current Assistance ($) 1,099 956 700 696 567
Former Assistance ($) 1,866 1,857 1,840 1,810 1,725
Never Assistance ($) 4,106 4,214 4,289 4,361 4,354
B-29This data was originally compiled and reported by the states, territories and tribal child support programs. OCSE assumes no responsibility or legal liability concerning the data’s accuracy, reliability, completeness, timeliness, or usefulness.
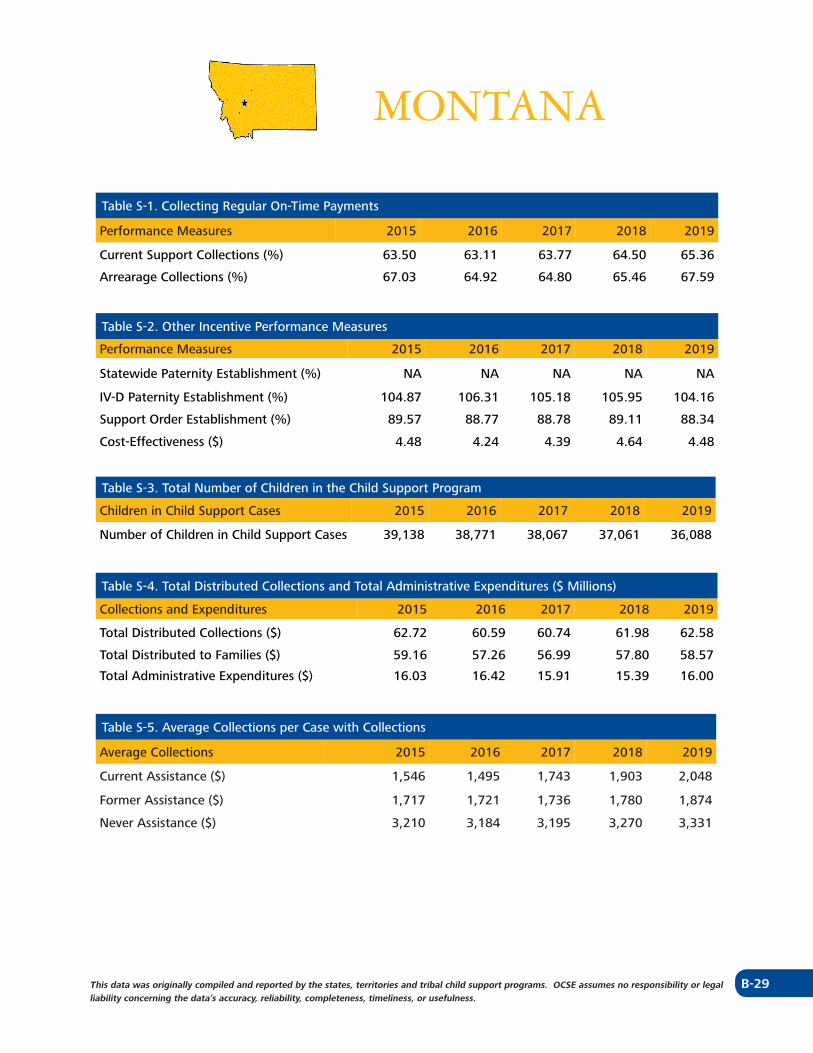
MONTANA
Table S-1. Collecting Regular On-Time Payments
Performance Measures 2015 2016 2017 2018 2019
Current Support Collections (%) 63.50 63.11 63.77 64.50 65.36
Arrearage Collections (%) 67.03 64.92 64.80 65.46 67.59
Table S-2. Other Incentive Performance Measures
Performance Measures 2015 2016 2017 2018 2019
Statewide Paternity Establishment (%) NA NA NA NA NA
IV-D Paternity Establishment (%) 104.87 106.31 105.18 105.95 104.16
Support Order Establishment (%) 89.57 88.77 88.78 89.11 88.34
Cost-Effectiveness ($) 4.48 4.24 4.39 4.64 4.48
Table S-3. Total Number of Children in the Child Support Program
Children in Child Support Cases 2015 2016 2017 2018 2019
Number of Children in Child Support Cases 39,138 38,771 38,067 37,061 36,088
Table S-4. Total Distributed Collections and Total Administrative Expenditures ($ Millions)
Collections and Expenditures 2015 2016 2017 2018 2019
Total Distributed Collections ($) 62.72 60.59 60.74 61.98 62.58
Total Distributed to Families ($) 59.16 57.26 56.99 57.80 58.57
Total Administrative Expenditures ($) 16.03 16.42 15.91 15.39 16.00
Table S-5. Average Collections per Case with Collections
Average Collections 2015 2016 2017 2018 2019
Current Assistance ($) 1,546 1,495 1,743 1,903 2,048
Former Assistance ($) 1,717 1,721 1,736 1,780 1,874
Never Assistance ($) 3,210 3,184 3,195 3,270 3,331
B-30 This data was originally compiled and reported by the states, territories and tribal child support programs. OCSE assumes no responsibility or legal liability concerning the data’s accuracy, reliability, completeness, timeliness, or usefulness.
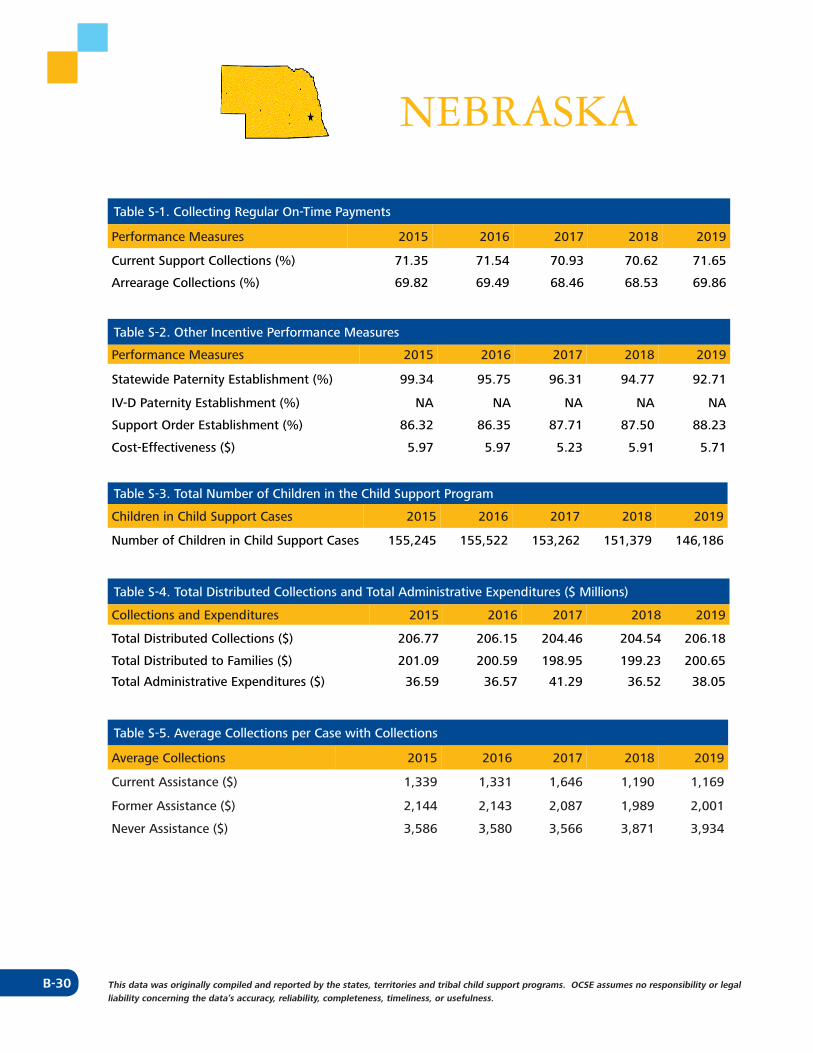
NEBRASKA
Table S-1. Collecting Regular On-Time Payments
Performance Measures 2015 2016 2017 2018 2019
Current Support Collections (%) 71.35 71.54 70.93 70.62 71.65
Arrearage Collections (%) 69.82 69.49 68.46 68.53 69.86
Table S-2. Other Incentive Performance Measures
Performance Measures 2015 2016 2017 2018 2019
Statewide Paternity Establishment (%) 99.34 95.75 96.31 94.77 92.71
IV-D Paternity Establishment (%) NA NA NA NA NA
Support Order Establishment (%) 86.32 86.35 87.71 87.50 88.23
Cost-Effectiveness ($) 5.97 5.97 5.23 5.91 5.71
Table S-3. Total Number of Children in the Child Support Program
Children in Child Support Cases 2015 2016 2017 2018 2019
Number of Children in Child Support Cases 155,245 155,522 153,262 151,379 146,186
Table S-4. Total Distributed Collections and Total Administrative Expenditures ($ Millions)
Collections and Expenditures 2015 2016 2017 2018 2019
Total Distributed Collections ($) 206.77 206.15 204.46 204.54 206.18
Total Distributed to Families ($) 201.09 200.59 198.95 199.23 200.65
Total Administrative Expenditures ($) 36.59 36.57 41.29 36.52 38.05
Table S-5. Average Collections per Case with Collections
Average Collections 2015 2016 2017 2018 2019
Current Assistance ($) 1,339 1,331 1,646 1,190 1,169
Former Assistance ($) 2,144 2,143 2,087 1,989 2,001
Never Assistance ($) 3,586 3,580 3,566 3,871 3,934
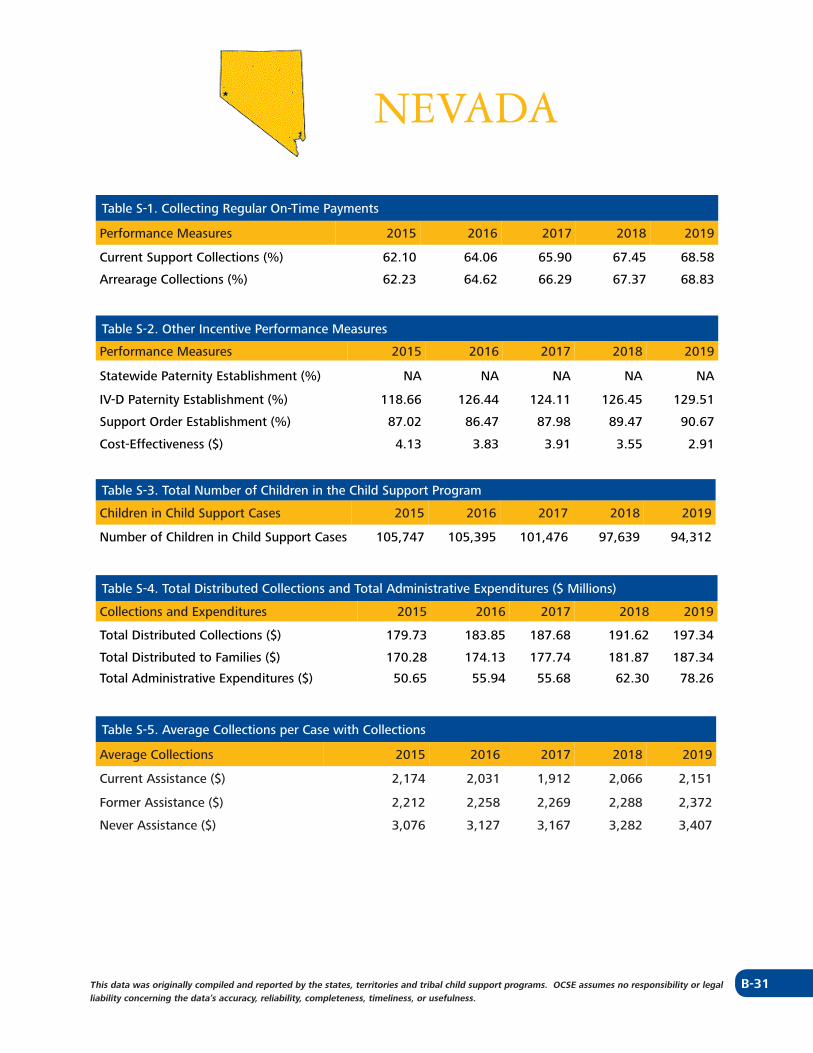
B-31This data was originally compiled and reported by the states, territories and tribal child support programs. OCSE assumes no responsibility or legal liability concerning the data’s accuracy, reliability, completeness, timeliness, or usefulness.
NEVADA
Table S-1. Collecting Regular On-Time Payments
Performance Measures 2015 2016 2017 2018 2019
Current Support Collections (%) 62.10 64.06 65.90 67.45 68.58
Arrearage Collections (%) 62.23 64.62 66.29 67.37 68.83
Table S-2. Other Incentive Performance Measures
Performance Measures 2015 2016 2017 2018 2019
Statewide Paternity Establishment (%) NA NA NA NA NA
IV-D Paternity Establishment (%) 118.66 126.44 124.11 126.45 129.51
Support Order Establishment (%) 87.02 86.47 87.98 89.47 90.67
Cost-Effectiveness ($) 4.13 3.83 3.91 3.55 2.91
Table S-3. Total Number of Children in the Child Support Program
Children in Child Support Cases 2015 2016 2017 2018 2019
Number of Children in Child Support Cases 105,747 105,395 101,476 97,639 94,312
Table S-4. Total Distributed Collections and Total Administrative Expenditures ($ Millions)
Collections and Expenditures 2015 2016 2017 2018 2019
Total Distributed Collections ($) 179.73 183.85 187.68 191.62 197.34
Total Distributed to Families ($) 170.28 174.13 177.74 181.87 187.34
Total Administrative Expenditures ($) 50.65 55.94 55.68 62.30 78.26
Table S-5. Average Collections per Case with Collections
Average Collections 2015 2016 2017 2018 2019
Current Assistance ($) 2,174 2,031 1,912 2,066 2,151
Former Assistance ($) 2,212 2,258 2,269 2,288 2,372
Never Assistance ($) 3,076 3,127 3,167 3,282 3,407
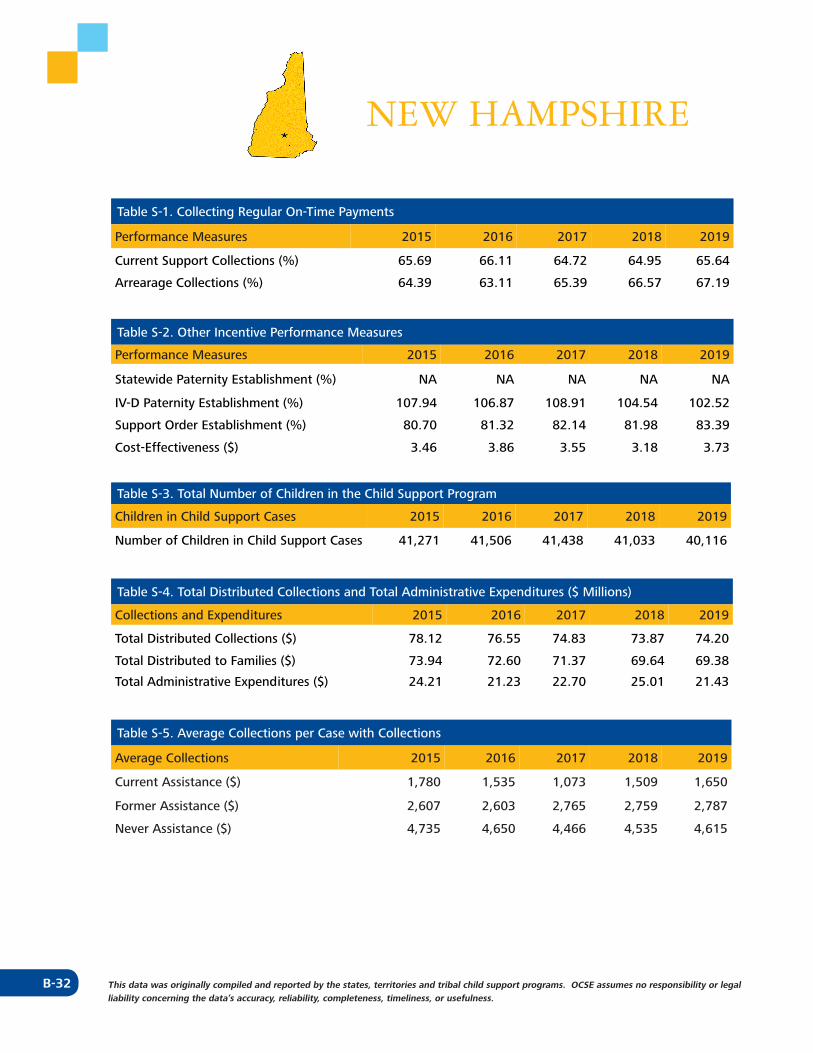
B-32 This data was originally compiled and reported by the states, territories and tribal child support programs. OCSE assumes no responsibility or legal liability concerning the data’s accuracy, reliability, completeness, timeliness, or usefulness.
NEW HAMPSHIRE
Table S-1. Collecting Regular On-Time Payments
Performance Measures 2015 2016 2017 2018 2019
Current Support Collections (%) 65.69 66.11 64.72 64.95 65.64
Arrearage Collections (%) 64.39 63.11 65.39 66.57 67.19
Table S-2. Other Incentive Performance Measures
Performance Measures 2015 2016 2017 2018 2019
Statewide Paternity Establishment (%) NA NA NA NA NA
IV-D Paternity Establishment (%) 107.94 106.87 108.91 104.54 102.52
Support Order Establishment (%) 80.70 81.32 82.14 81.98 83.39
Cost-Effectiveness ($) 3.46 3.86 3.55 3.18 3.73
Table S-3. Total Number of Children in the Child Support Program
Children in Child Support Cases 2015 2016 2017 2018 2019
Number of Children in Child Support Cases 41,271 41,506 41,438 41,033 40,116
Table S-4. Total Distributed Collections and Total Administrative Expenditures ($ Millions)
Collections and Expenditures 2015 2016 2017 2018 2019
Total Distributed Collections ($) 78.12 76.55 74.83 73.87 74.20
Total Distributed to Families ($) 73.94 72.60 71.37 69.64 69.38
Total Administrative Expenditures ($) 24.21 21.23 22.70 25.01 21.43
Table S-5. Average Collections per Case with Collections
Average Collections 2015 2016 2017 2018 2019
Current Assistance ($) 1,780 1,535 1,073 1,509 1,650
Former Assistance ($) 2,607 2,603 2,765 2,759 2,787
Never Assistance ($) 4,735 4,650 4,466 4,535 4,615
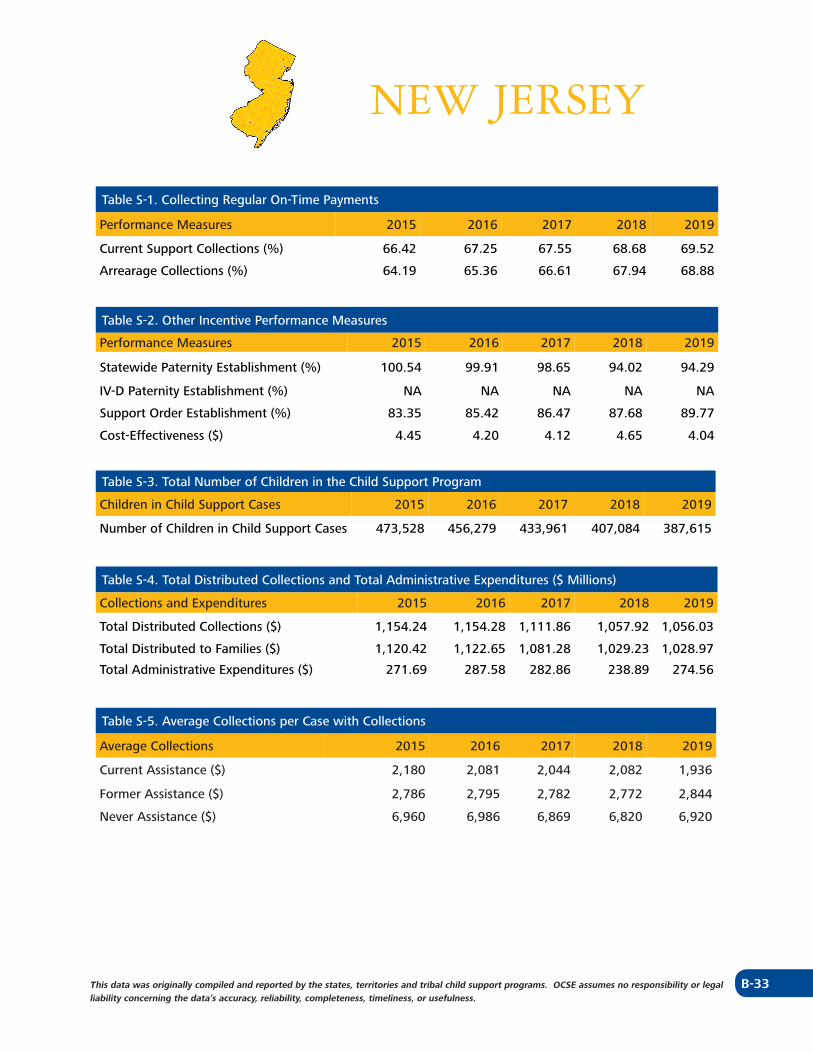
B-33This data was originally compiled and reported by the states, territories and tribal child support programs. OCSE assumes no responsibility or legal liability concerning the data’s accuracy, reliability, completeness, timeliness, or usefulness.
NEW JERSEY
Table S-1. Collecting Regular On-Time Payments
Performance Measures 2015 2016 2017 2018 2019
Current Support Collections (%) 66.42 67.25 67.55 68.68 69.52
Arrearage Collections (%) 64.19 65.36 66.61 67.94 68.88
Table S-2. Other Incentive Performance Measures
Performance Measures 2015 2016 2017 2018 2019
Statewide Paternity Establishment (%) 100.54 99.91 98.65 94.02 94.29
IV-D Paternity Establishment (%) NA NA NA NA NA
Support Order Establishment (%) 83.35 85.42 86.47 87.68 89.77
Cost-Effectiveness ($) 4.45 4.20 4.12 4.65 4.04
Table S-3. Total Number of Children in the Child Support Program
Children in Child Support Cases 2015 2016 2017 2018 2019
Number of Children in Child Support Cases 473,528 456,279 433,961 407,084 387,615
Table S-4. Total Distributed Collections and Total Administrative Expenditures ($ Millions)
Collections and Expenditures 2015 2016 2017 2018 2019
Total Distributed Collections ($) 1,154.24 1,154.28 1,111.86 1,057.92 1,056.03
Total Distributed to Families ($) 1,120.42 1,122.65 1,081.28 1,029.23 1,028.97
Total Administrative Expenditures ($) 271.69 287.58 282.86 238.89 274.56
Table S-5. Average Collections per Case with Collections
Average Collections 2015 2016 2017 2018 2019
Current Assistance ($) 2,180 2,081 2,044 2,082 1,936
Former Assistance ($) 2,786 2,795 2,782 2,772 2,844
Never Assistance ($) 6,960 6,986 6,869 6,820 6,920
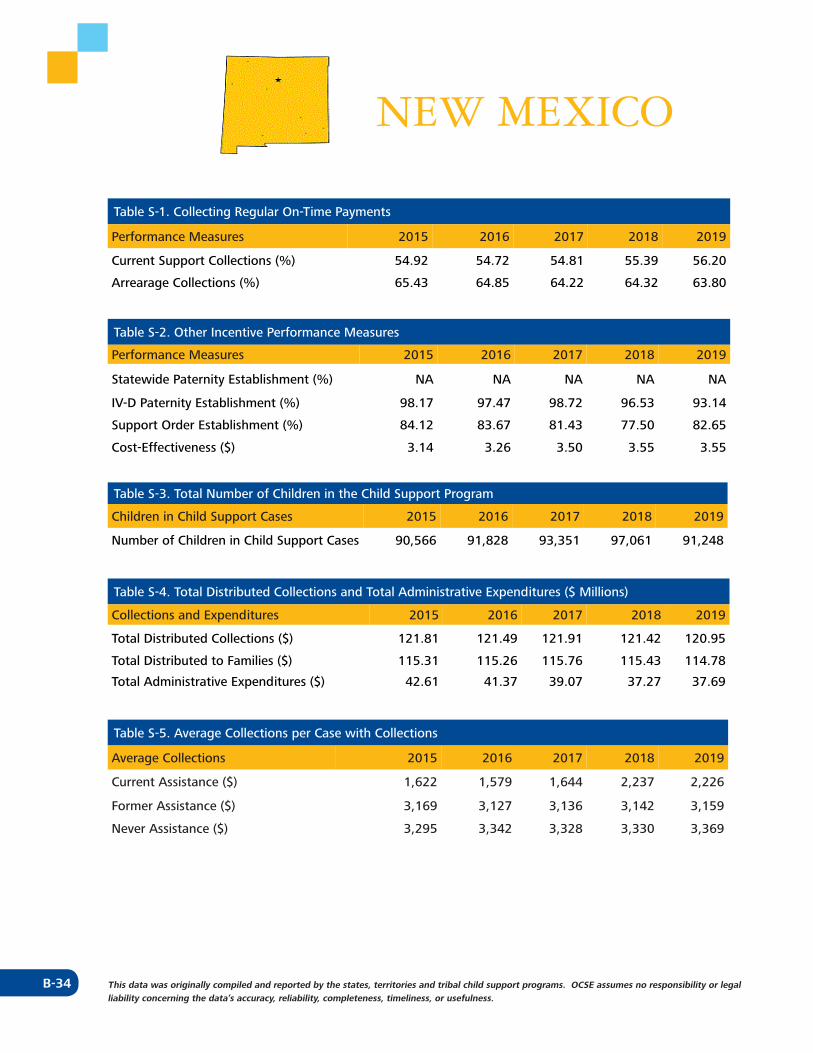
B-34 This data was originally compiled and reported by the states, territories and tribal child support programs. OCSE assumes no responsibility or legal liability concerning the data’s accuracy, reliability, completeness, timeliness, or usefulness.
NEW MEXICO
Table S-1. Collecting Regular On-Time Payments
Performance Measures 2015 2016 2017 2018 2019
Current Support Collections (%) 54.92 54.72 54.81 55.39 56.20
Arrearage Collections (%) 65.43 64.85 64.22 64.32 63.80
Table S-2. Other Incentive Performance Measures
Performance Measures 2015 2016 2017 2018 2019
Statewide Paternity Establishment (%) NA NA NA NA NA
IV-D Paternity Establishment (%) 98.17 97.47 98.72 96.53 93.14
Support Order Establishment (%) 84.12 83.67 81.43 77.50 82.65
Cost-Effectiveness ($) 3.14 3.26 3.50 3.55 3.55
Table S-3. Total Number of Children in the Child Support Program
Children in Child Support Cases 2015 2016 2017 2018 2019
Number of Children in Child Support Cases 90,566 91,828 93,351 97,061 91,248
Table S-4. Total Distributed Collections and Total Administrative Expenditures ($ Millions)
Collections and Expenditures 2015 2016 2017 2018 2019
Total Distributed Collections ($) 121.81 121.49 121.91 121.42 120.95
Total Distributed to Families ($) 115.31 115.26 115.76 115.43 114.78
Total Administrative Expenditures ($) 42.61 41.37 39.07 37.27 37.69
Table S-5. Average Collections per Case with Collections
Average Collections 2015 2016 2017 2018 2019
Current Assistance ($) 1,622 1,579 1,644 2,237 2,226
Former Assistance ($) 3,169 3,127 3,136 3,142 3,159
Never Assistance ($) 3,295 3,342 3,328 3,330 3,369
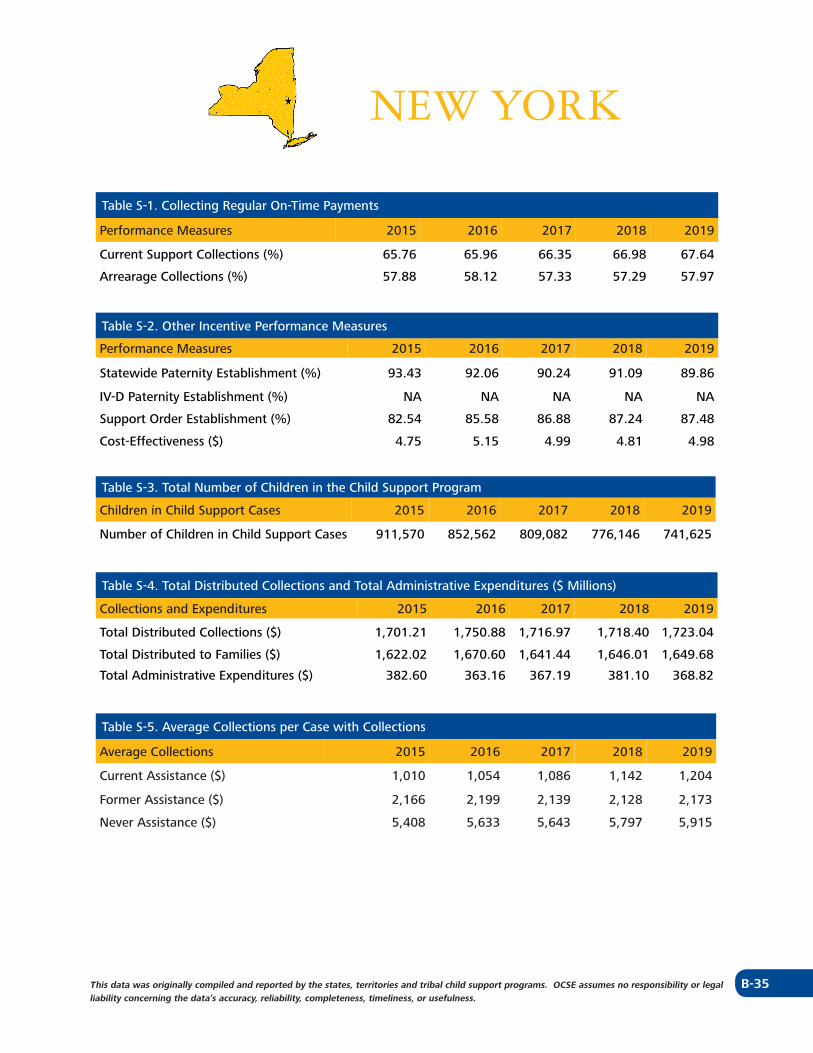
B-35This data was originally compiled and reported by the states, territories and tribal child support programs. OCSE assumes no responsibility or legal liability concerning the data’s accuracy, reliability, completeness, timeliness, or usefulness.
NEW YORK
Table S-1. Collecting Regular On-Time Payments
Performance Measures 2015 2016 2017 2018 2019
Current Support Collections (%) 65.76 65.96 66.35 66.98 67.64
Arrearage Collections (%) 57.88 58.12 57.33 57.29 57.97
Table S-2. Other Incentive Performance Measures
Performance Measures 2015 2016 2017 2018 2019
Statewide Paternity Establishment (%) 93.43 92.06 90.24 91.09 89.86
IV-D Paternity Establishment (%) NA NA NA NA NA
Support Order Establishment (%) 82.54 85.58 86.88 87.24 87.48
Cost-Effectiveness ($) 4.75 5.15 4.99 4.81 4.98
Table S-3. Total Number of Children in the Child Support Program
Children in Child Support Cases 2015 2016 2017 2018 2019
Number of Children in Child Support Cases 911,570 852,562 809,082 776,146 741,625
Table S-4. Total Distributed Collections and Total Administrative Expenditures ($ Millions)
Collections and Expenditures 2015 2016 2017 2018 2019
Total Distributed Collections ($) 1,701.21 1,750.88 1,716.97 1,718.40 1,723.04
Total Distributed to Families ($) 1,622.02 1,670.60 1,641.44 1,646.01 1,649.68
Total Administrative Expenditures ($) 382.60 363.16 367.19 381.10 368.82
Table S-5. Average Collections per Case with Collections
Average Collections 2015 2016 2017 2018 2019
Current Assistance ($) 1,010 1,054 1,086 1,142 1,204
Former Assistance ($) 2,166 2,199 2,139 2,128 2,173
Never Assistance ($) 5,408 5,633 5,643 5,797 5,915
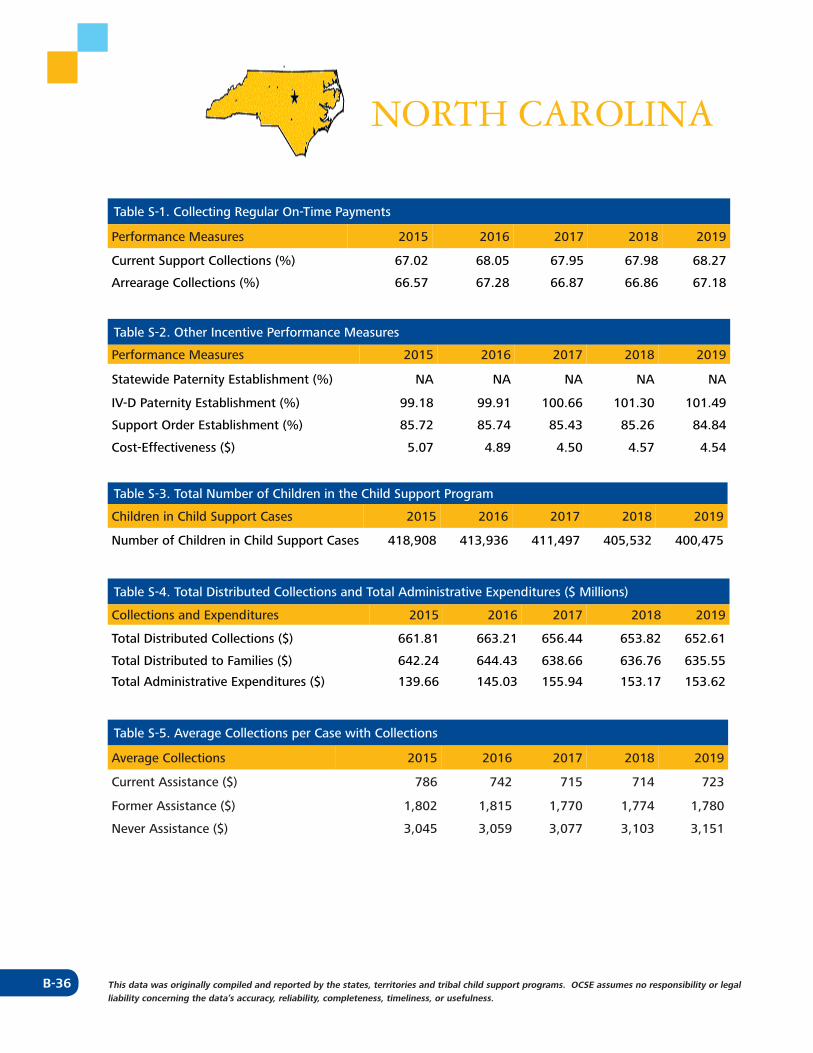
B-36 This data was originally compiled and reported by the states, territories and tribal child support programs. OCSE assumes no responsibility or legal liability concerning the data’s accuracy, reliability, completeness, timeliness, or usefulness.
NORTH CAROLINA
Table S-1. Collecting Regular On-Time Payments
Performance Measures 2015 2016 2017 2018 2019
Current Support Collections (%) 67.02 68.05 67.95 67.98 68.27
Arrearage Collections (%) 66.57 67.28 66.87 66.86 67.18
Table S-2. Other Incentive Performance Measures
Performance Measures 2015 2016 2017 2018 2019
Statewide Paternity Establishment (%) NA NA NA NA NA
IV-D Paternity Establishment (%) 99.18 99.91 100.66 101.30 101.49
Support Order Establishment (%) 85.72 85.74 85.43 85.26 84.84
Cost-Effectiveness ($) 5.07 4.89 4.50 4.57 4.54
Table S-3. Total Number of Children in the Child Support Program
Children in Child Support Cases 2015 2016 2017 2018 2019
Number of Children in Child Support Cases 418,908 413,936 411,497 405,532 400,475
Table S-4. Total Distributed Collections and Total Administrative Expenditures ($ Millions)
Collections and Expenditures 2015 2016 2017 2018 2019
Total Distributed Collections ($) 661.81 663.21 656.44 653.82 652.61
Total Distributed to Families ($) 642.24 644.43 638.66 636.76 635.55
Total Administrative Expenditures ($) 139.66 145.03 155.94 153.17 153.62
Table S-5. Average Collections per Case with Collections
Average Collections 2015 2016 2017 2018 2019
Current Assistance ($) 786 742 715 714 723
Former Assistance ($) 1,802 1,815 1,770 1,774 1,780
Never Assistance ($) 3,045 3,059 3,077 3,103 3,151
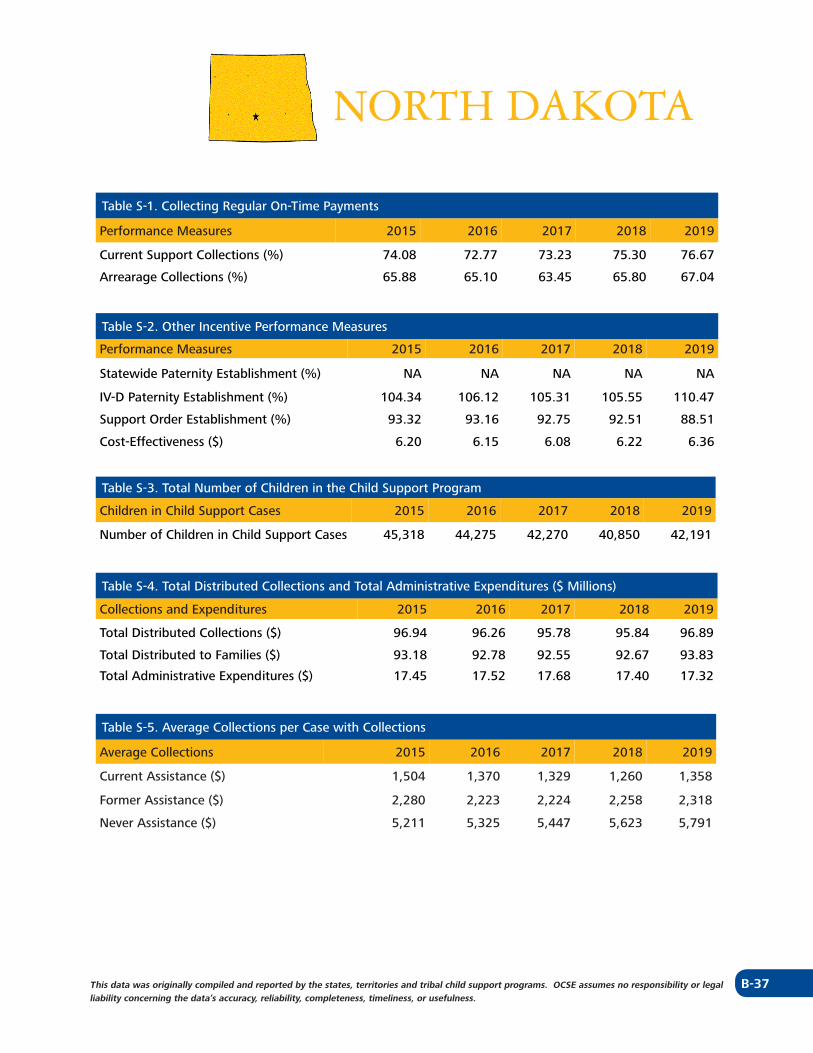
B-37This data was originally compiled and reported by the states, territories and tribal child support programs. OCSE assumes no responsibility or legal liability concerning the data’s accuracy, reliability, completeness, timeliness, or usefulness.
NORTH DAKOTA
Table S-1. Collecting Regular On-Time Payments
Performance Measures 2015 2016 2017 2018 2019
Current Support Collections (%) 74.08 72.77 73.23 75.30 76.67
Arrearage Collections (%) 65.88 65.10 63.45 65.80 67.04
Table S-2. Other Incentive Performance Measures
Performance Measures 2015 2016 2017 2018 2019
Statewide Paternity Establishment (%) NA NA NA NA NA
IV-D Paternity Establishment (%) 104.34 106.12 105.31 105.55 110.47
Support Order Establishment (%) 93.32 93.16 92.75 92.51 88.51
Cost-Effectiveness ($) 6.20 6.15 6.08 6.22 6.36
Table S-3. Total Number of Children in the Child Support Program
Children in Child Support Cases 2015 2016 2017 2018 2019
Number of Children in Child Support Cases 45,318 44,275 42,270 40,850 42,191
Table S-4. Total Distributed Collections and Total Administrative Expenditures ($ Millions)
Collections and Expenditures 2015 2016 2017 2018 2019
Total Distributed Collections ($) 96.94 96.26 95.78 95.84 96.89
Total Distributed to Families ($) 93.18 92.78 92.55 92.67 93.83
Total Administrative Expenditures ($) 17.45 17.52 17.68 17.40 17.32
Table S-5. Average Collections per Case with Collections
Average Collections 2015 2016 2017 2018 2019
Current Assistance ($) 1,504 1,370 1,329 1,260 1,358
Former Assistance ($) 2,280 2,223 2,224 2,258 2,318
Never Assistance ($) 5,211 5,325 5,447 5,623 5,791
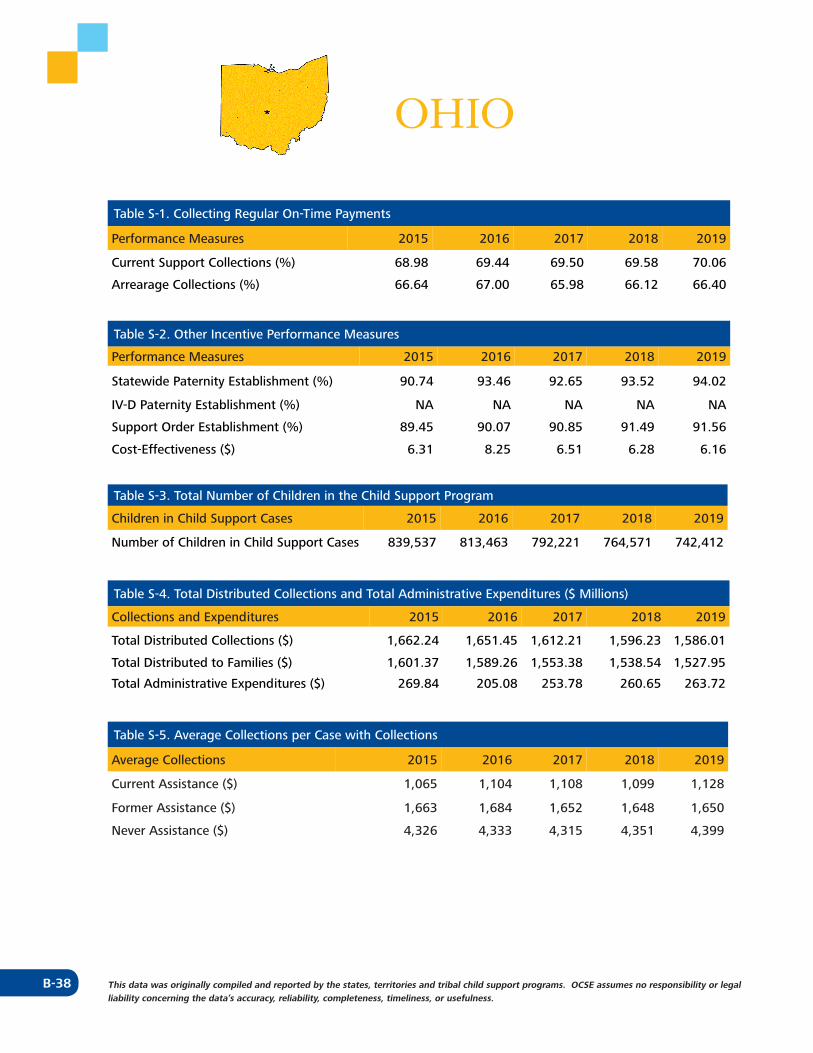
B-38 This data was originally compiled and reported by the states, territories and tribal child support programs. OCSE assumes no responsibility or legal liability concerning the data’s accuracy, reliability, completeness, timeliness, or usefulness.
OHIO
Table S-1. Collecting Regular On-Time Payments
Performance Measures 2015 2016 2017 2018 2019
Current Support Collections (%) 68.98 69.44 69.50 69.58 70.06
Arrearage Collections (%) 66.64 67.00 65.98 66.12 66.40
Table S-2. Other Incentive Performance Measures
Performance Measures 2015 2016 2017 2018 2019
Statewide Paternity Establishment (%) 90.74 93.46 92.65 93.52 94.02
IV-D Paternity Establishment (%) NA NA NA NA NA
Support Order Establishment (%) 89.45 90.07 90.85 91.49 91.56
Cost-Effectiveness ($) 6.31 8.25 6.51 6.28 6.16
Table S-3. Total Number of Children in the Child Support Program
Children in Child Support Cases 2015 2016 2017 2018 2019
Number of Children in Child Support Cases 839,537 813,463 792,221 764,571 742,412
Table S-4. Total Distributed Collections and Total Administrative Expenditures ($ Millions)
Collections and Expenditures 2015 2016 2017 2018 2019
Total Distributed Collections ($) 1,662.24 1,651.45 1,612.21 1,596.23 1,586.01
Total Distributed to Families ($) 1,601.37 1,589.26 1,553.38 1,538.54 1,527.95
Total Administrative Expenditures ($) 269.84 205.08 253.78 260.65 263.72
Table S-5. Average Collections per Case with Collections
Average Collections 2015 2016 2017 2018 2019
Current Assistance ($) 1,065 1,104 1,108 1,099 1,128
Former Assistance ($) 1,663 1,684 1,652 1,648 1,650
Never Assistance ($) 4,326 4,333 4,315 4,351 4,399
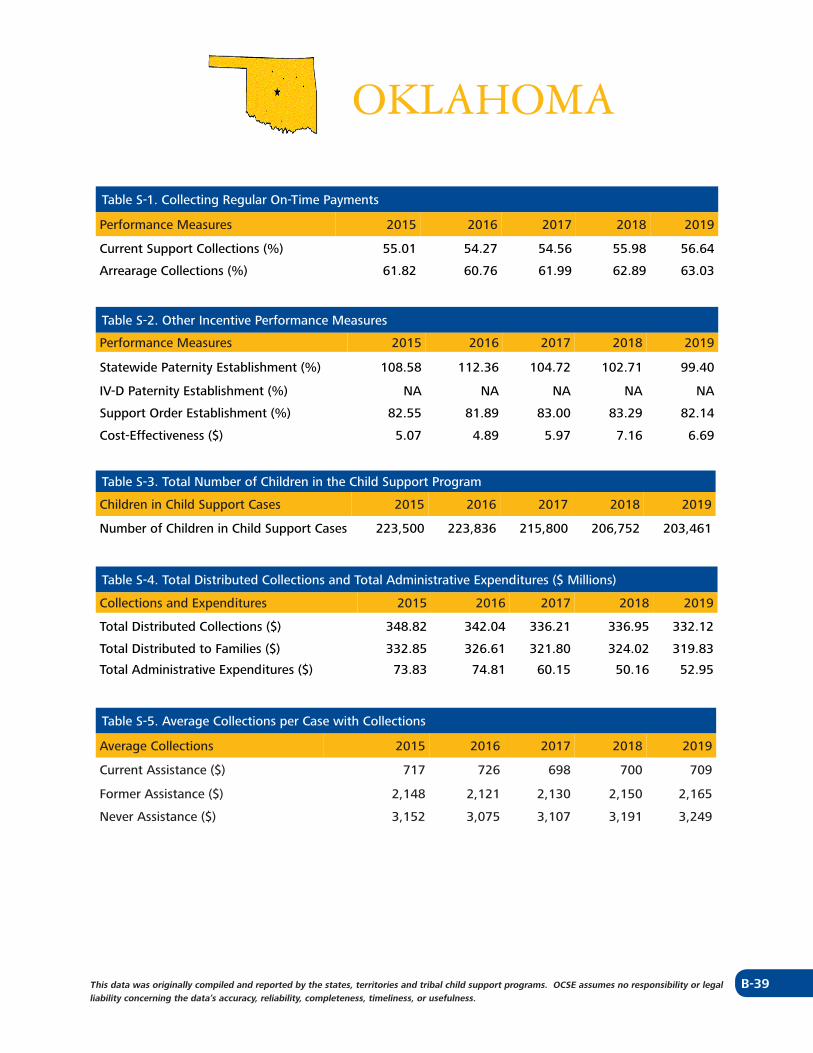
B-39This data was originally compiled and reported by the states, territories and tribal child support programs. OCSE assumes no responsibility or legal liability concerning the data’s accuracy, reliability, completeness, timeliness, or usefulness.
OKLAHOMA
Table S-1. Collecting Regular On-Time Payments
Performance Measures 2015 2016 2017 2018 2019
Current Support Collections (%) 55.01 54.27 54.56 55.98 56.64
Arrearage Collections (%) 61.82 60.76 61.99 62.89 63.03
Table S-2. Other Incentive Performance Measures
Performance Measures 2015 2016 2017 2018 2019
Statewide Paternity Establishment (%) 108.58 112.36 104.72 102.71 99.40
IV-D Paternity Establishment (%) NA NA NA NA NA
Support Order Establishment (%) 82.55 81.89 83.00 83.29 82.14
Cost-Effectiveness ($) 5.07 4.89 5.97 7.16 6.69
Table S-3. Total Number of Children in the Child Support Program
Children in Child Support Cases 2015 2016 2017 2018 2019
Number of Children in Child Support Cases 223,500 223,836 215,800 206,752 203,461
Table S-4. Total Distributed Collections and Total Administrative Expenditures ($ Millions)
Collections and Expenditures 2015 2016 2017 2018 2019
Total Distributed Collections ($) 348.82 342.04 336.21 336.95 332.12
Total Distributed to Families ($) 332.85 326.61 321.80 324.02 319.83
Total Administrative Expenditures ($) 73.83 74.81 60.15 50.16 52.95
Table S-5. Average Collections per Case with Collections
Average Collections 2015 2016 2017 2018 2019
Current Assistance ($) 717 726 698 700 709
Former Assistance ($) 2,148 2,121 2,130 2,150 2,165
Never Assistance ($) 3,152 3,075 3,107 3,191 3,249
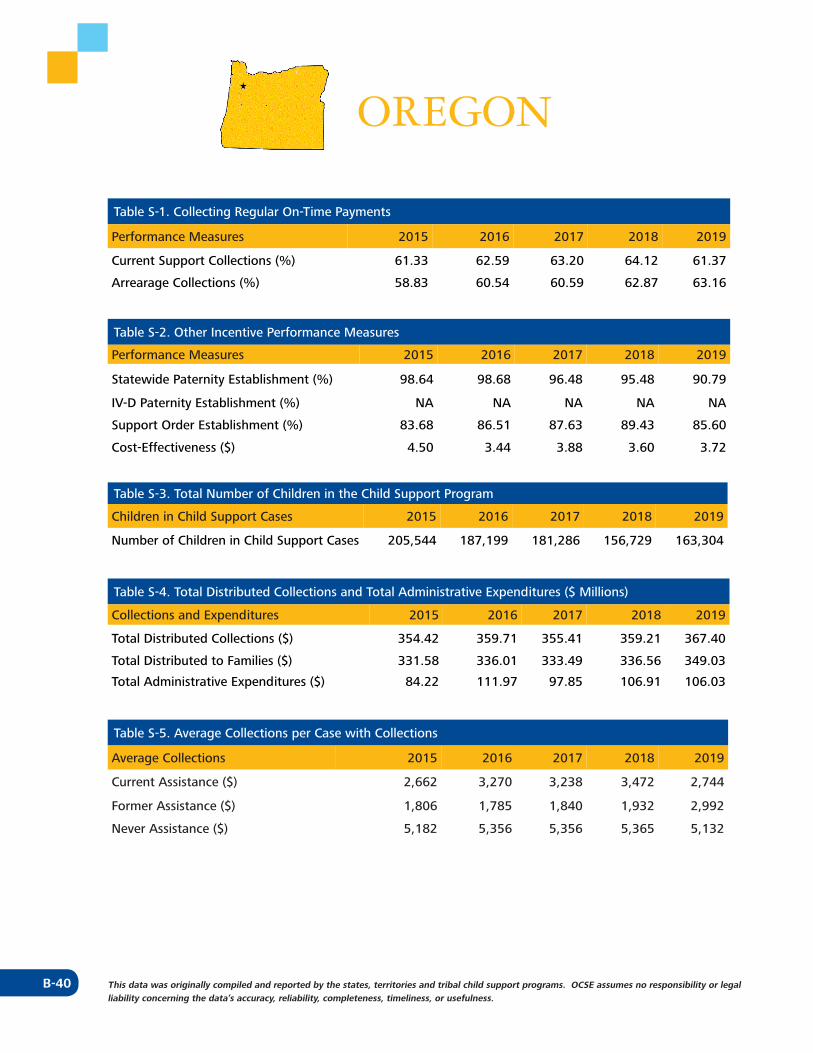
B-40 This data was originally compiled and reported by the states, territories and tribal child support programs. OCSE assumes no responsibility or legal liability concerning the data’s accuracy, reliability, completeness, timeliness, or usefulness.
OREGON
Table S-1. Collecting Regular On-Time Payments
Performance Measures 2015 2016 2017 2018 2019
Current Support Collections (%) 61.33 62.59 63.20 64.12 61.37
Arrearage Collections (%) 58.83 60.54 60.59 62.87 63.16
Table S-2. Other Incentive Performance Measures
Performance Measures 2015 2016 2017 2018 2019
Statewide Paternity Establishment (%) 98.64 98.68 96.48 95.48 90.79
IV-D Paternity Establishment (%) NA NA NA NA NA
Support Order Establishment (%) 83.68 86.51 87.63 89.43 85.60
Cost-Effectiveness ($) 4.50 3.44 3.88 3.60 3.72
Table S-3. Total Number of Children in the Child Support Program
Children in Child Support Cases 2015 2016 2017 2018 2019
Number of Children in Child Support Cases 205,544 187,199 181,286 156,729 163,304
Table S-4. Total Distributed Collections and Total Administrative Expenditures ($ Millions)
Collections and Expenditures 2015 2016 2017 2018 2019
Total Distributed Collections ($) 354.42 359.71 355.41 359.21 367.40
Total Distributed to Families ($) 331.58 336.01 333.49 336.56 349.03
Total Administrative Expenditures ($) 84.22 111.97 97.85 106.91 106.03
Table S-5. Average Collections per Case with Collections
Average Collections 2015 2016 2017 2018 2019
Current Assistance ($) 2,662 3,270 3,238 3,472 2,744
Former Assistance ($) 1,806 1,785 1,840 1,932 2,992
Never Assistance ($) 5,182 5,356 5,356 5,365 5,132
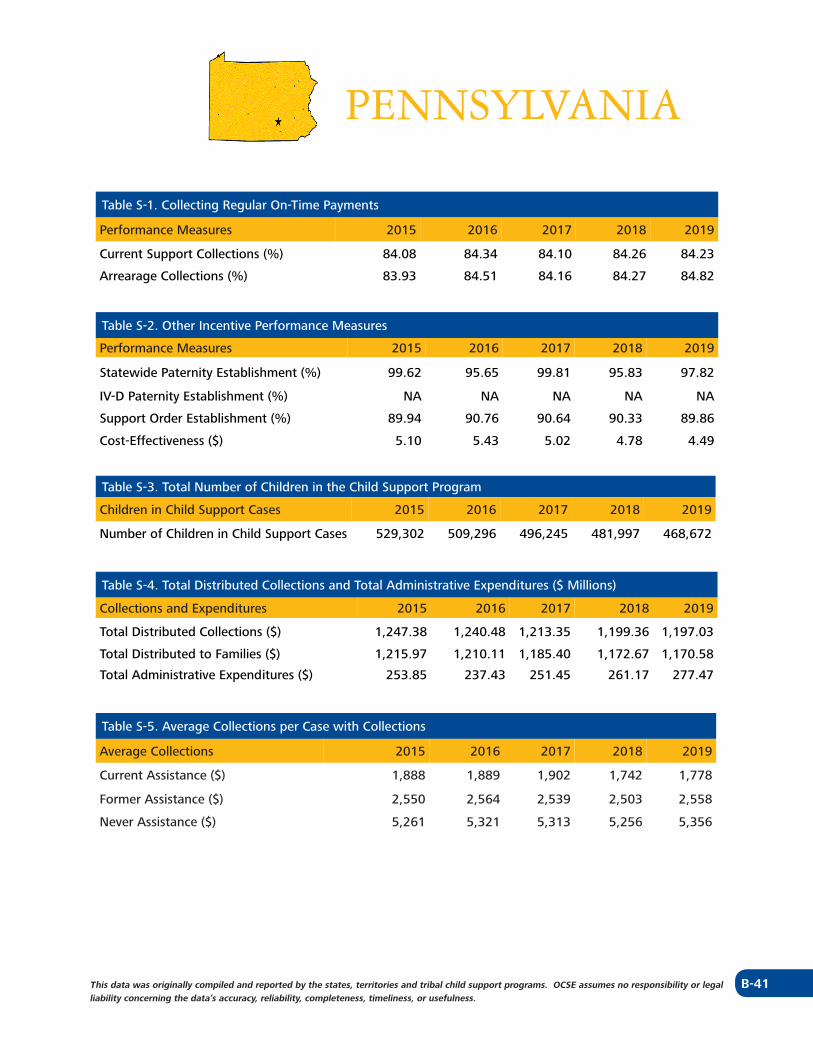
B-41This data was originally compiled and reported by the states, territories and tribal child support programs. OCSE assumes no responsibility or legal liability concerning the data’s accuracy, reliability, completeness, timeliness, or usefulness.
PENNSYLVANIA
Table S-1. Collecting Regular On-Time Payments
Performance Measures 2015 2016 2017 2018 2019
Current Support Collections (%) 84.08 84.34 84.10 84.26 84.23
Arrearage Collections (%) 83.93 84.51 84.16 84.27 84.82
Table S-2. Other Incentive Performance Measures
Performance Measures 2015 2016 2017 2018 2019
Statewide Paternity Establishment (%) 99.62 95.65 99.81 95.83 97.82
IV-D Paternity Establishment (%) NA NA NA NA NA
Support Order Establishment (%) 89.94 90.76 90.64 90.33 89.86
Cost-Effectiveness ($) 5.10 5.43 5.02 4.78 4.49
Table S-3. Total Number of Children in the Child Support Program
Children in Child Support Cases 2015 2016 2017 2018 2019
Number of Children in Child Support Cases 529,302 509,296 496,245 481,997 468,672
Table S-4. Total Distributed Collections and Total Administrative Expenditures ($ Millions)
Collections and Expenditures 2015 2016 2017 2018 2019
Total Distributed Collections ($) 1,247.38 1,240.48 1,213.35 1,199.36 1,197.03
Total Distributed to Families ($) 1,215.97 1,210.11 1,185.40 1,172.67 1,170.58
Total Administrative Expenditures ($) 253.85 237.43 251.45 261.17 277.47
Table S-5. Average Collections per Case with Collections
Average Collections 2015 2016 2017 2018 2019
Current Assistance ($) 1,888 1,889 1,902 1,742 1,778
Former Assistance ($) 2,550 2,564 2,539 2,503 2,558
Never Assistance ($) 5,261 5,321 5,313 5,256 5,356
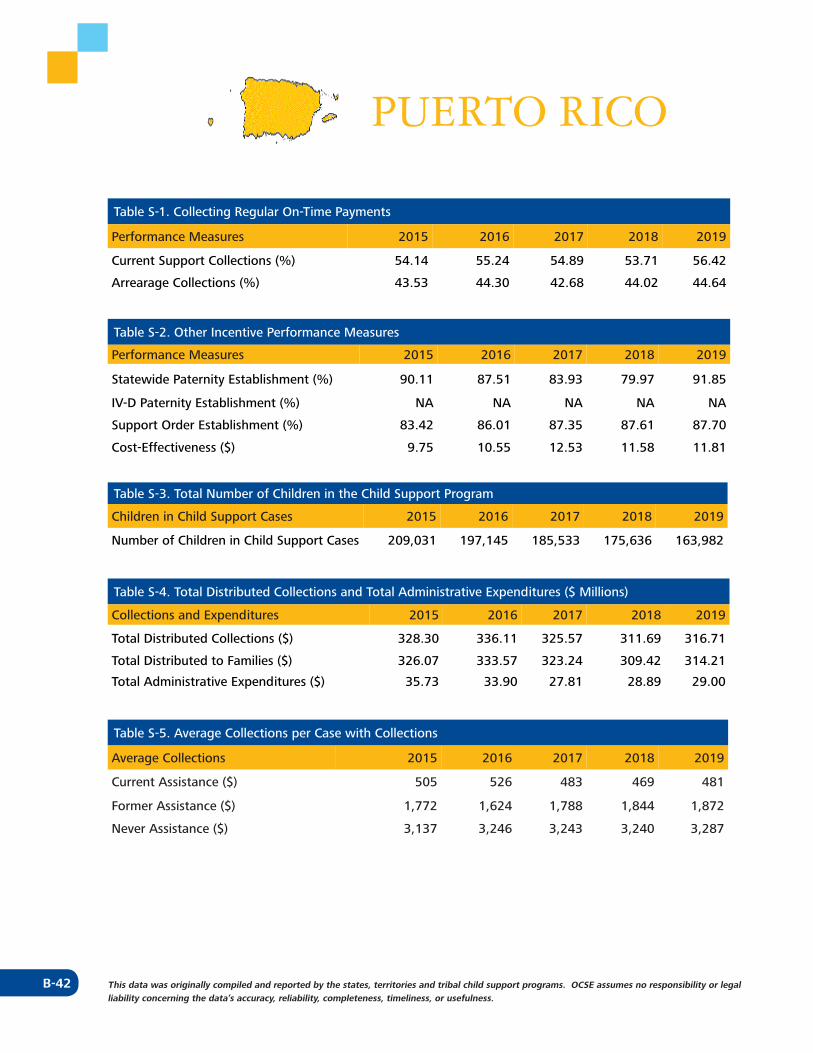
B-42 This data was originally compiled and reported by the states, territories and tribal child support programs. OCSE assumes no responsibility or legal liability concerning the data’s accuracy, reliability, completeness, timeliness, or usefulness.
PUERTO RICO
Table S-1. Collecting Regular On-Time Payments
Performance Measures 2015 2016 2017 2018 2019
Current Support Collections (%) 54.14 55.24 54.89 53.71 56.42
Arrearage Collections (%) 43.53 44.30 42.68 44.02 44.64
Table S-2. Other Incentive Performance Measures
Performance Measures 2015 2016 2017 2018 2019
Statewide Paternity Establishment (%) 90.11 87.51 83.93 79.97 91.85
IV-D Paternity Establishment (%) NA NA NA NA NA
Support Order Establishment (%) 83.42 86.01 87.35 87.61 87.70
Cost-Effectiveness ($) 9.75 10.55 12.53 11.58 11.81
Table S-3. Total Number of Children in the Child Support Program
Children in Child Support Cases 2015 2016 2017 2018 2019
Number of Children in Child Support Cases 209,031 197,145 185,533 175,636 163,982
Table S-4. Total Distributed Collections and Total Administrative Expenditures ($ Millions)
Collections and Expenditures 2015 2016 2017 2018 2019
Total Distributed Collections ($) 328.30 336.11 325.57 311.69 316.71
Total Distributed to Families ($) 326.07 333.57 323.24 309.42 314.21
Total Administrative Expenditures ($) 35.73 33.90 27.81 28.89 29.00
Table S-5. Average Collections per Case with Collections
Average Collections 2015 2016 2017 2018 2019
Current Assistance ($) 505 526 483 469 481
Former Assistance ($) 1,772 1,624 1,788 1,844 1,872
Never Assistance ($) 3,137 3,246 3,243 3,240 3,287
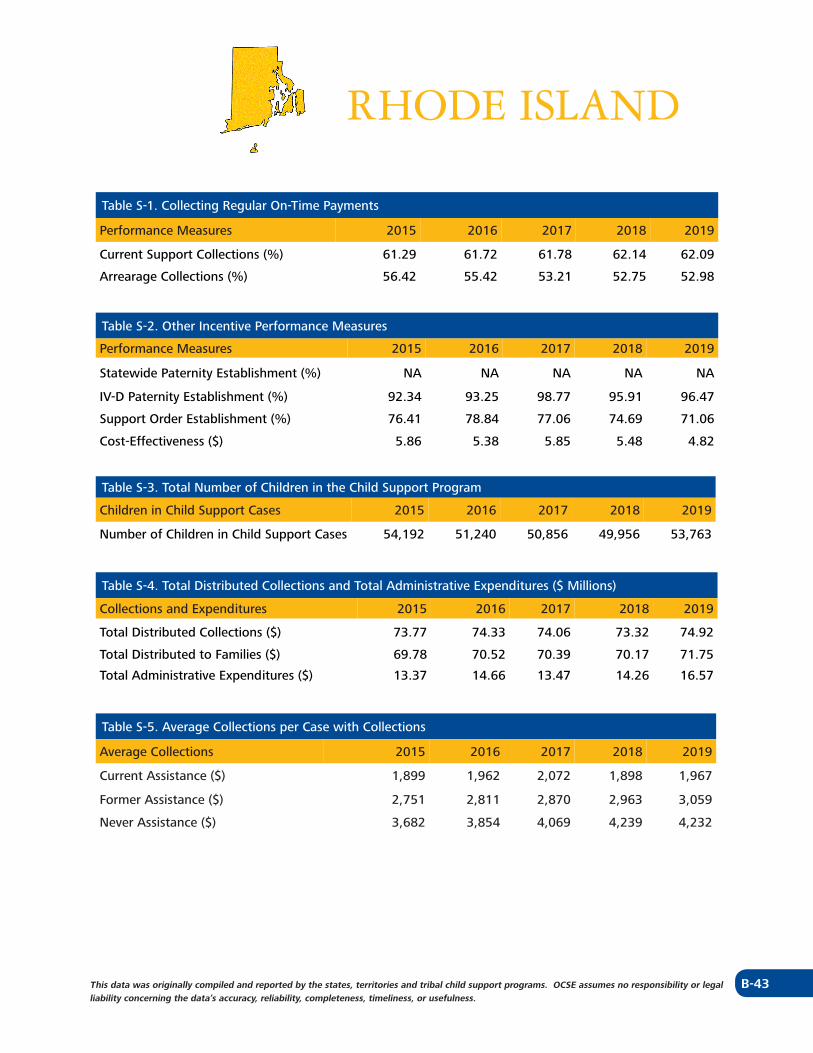
B-43This data was originally compiled and reported by the states, territories and tribal child support programs. OCSE assumes no responsibility or legal liability concerning the data’s accuracy, reliability, completeness, timeliness, or usefulness.
RHODE ISLAND
Table S-1. Collecting Regular On-Time Payments
Performance Measures 2015 2016 2017 2018 2019
Current Support Collections (%) 61.29 61.72 61.78 62.14 62.09
Arrearage Collections (%) 56.42 55.42 53.21 52.75 52.98
Table S-2. Other Incentive Performance Measures
Performance Measures 2015 2016 2017 2018 2019
Statewide Paternity Establishment (%) NA NA NA NA NA
IV-D Paternity Establishment (%) 92.34 93.25 98.77 95.91 96.47
Support Order Establishment (%) 76.41 78.84 77.06 74.69 71.06
Cost-Effectiveness ($) 5.86 5.38 5.85 5.48 4.82
Table S-3. Total Number of Children in the Child Support Program
Children in Child Support Cases 2015 2016 2017 2018 2019
Number of Children in Child Support Cases 54,192 51,240 50,856 49,956 53,763
Table S-4. Total Distributed Collections and Total Administrative Expenditures ($ Millions)
Collections and Expenditures 2015 2016 2017 2018 2019
Total Distributed Collections ($) 73.77 74.33 74.06 73.32 74.92
Total Distributed to Families ($) 69.78 70.52 70.39 70.17 71.75
Total Administrative Expenditures ($) 13.37 14.66 13.47 14.26 16.57
Table S-5. Average Collections per Case with Collections
Average Collections 2015 2016 2017 2018 2019
Current Assistance ($) 1,899 1,962 2,072 1,898 1,967
Former Assistance ($) 2,751 2,811 2,870 2,963 3,059
Never Assistance ($) 3,682 3,854 4,069 4,239 4,232
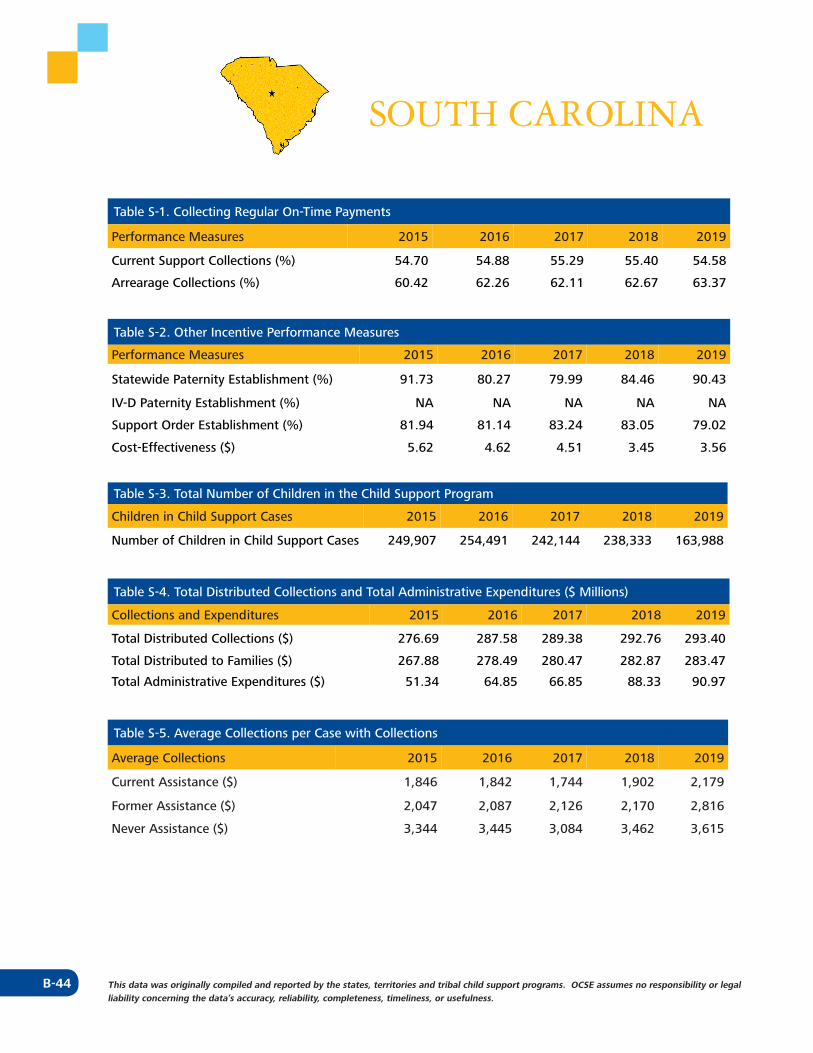
B-44 This data was originally compiled and reported by the states, territories and tribal child support programs. OCSE assumes no responsibility or legal liability concerning the data’s accuracy, reliability, completeness, timeliness, or usefulness.
SOUTH CAROLINA
Table S-1. Collecting Regular On-Time Payments
Performance Measures 2015 2016 2017 2018 2019
Current Support Collections (%) 54.70 54.88 55.29 55.40 54.58
Arrearage Collections (%) 60.42 62.26 62.11 62.67 63.37
Table S-2. Other Incentive Performance Measures
Performance Measures 2015 2016 2017 2018 2019
Statewide Paternity Establishment (%) 91.73 80.27 79.99 84.46 90.43
IV-D Paternity Establishment (%) NA NA NA NA NA
Support Order Establishment (%) 81.94 81.14 83.24 83.05 79.02
Cost-Effectiveness ($) 5.62 4.62 4.51 3.45 3.56
Table S-3. Total Number of Children in the Child Support Program
Children in Child Support Cases 2015 2016 2017 2018 2019
Number of Children in Child Support Cases 249,907 254,491 242,144 238,333 163,988
Table S-4. Total Distributed Collections and Total Administrative Expenditures ($ Millions)
Collections and Expenditures 2015 2016 2017 2018 2019
Total Distributed Collections ($) 276.69 287.58 289.38 292.76 293.40
Total Distributed to Families ($) 267.88 278.49 280.47 282.87 283.47
Total Administrative Expenditures ($) 51.34 64.85 66.85 88.33 90.97
Table S-5. Average Collections per Case with Collections
Average Collections 2015 2016 2017 2018 2019
Current Assistance ($) 1,846 1,842 1,744 1,902 2,179
Former Assistance ($) 2,047 2,087 2,126 2,170 2,816
Never Assistance ($) 3,344 3,445 3,084 3,462 3,615
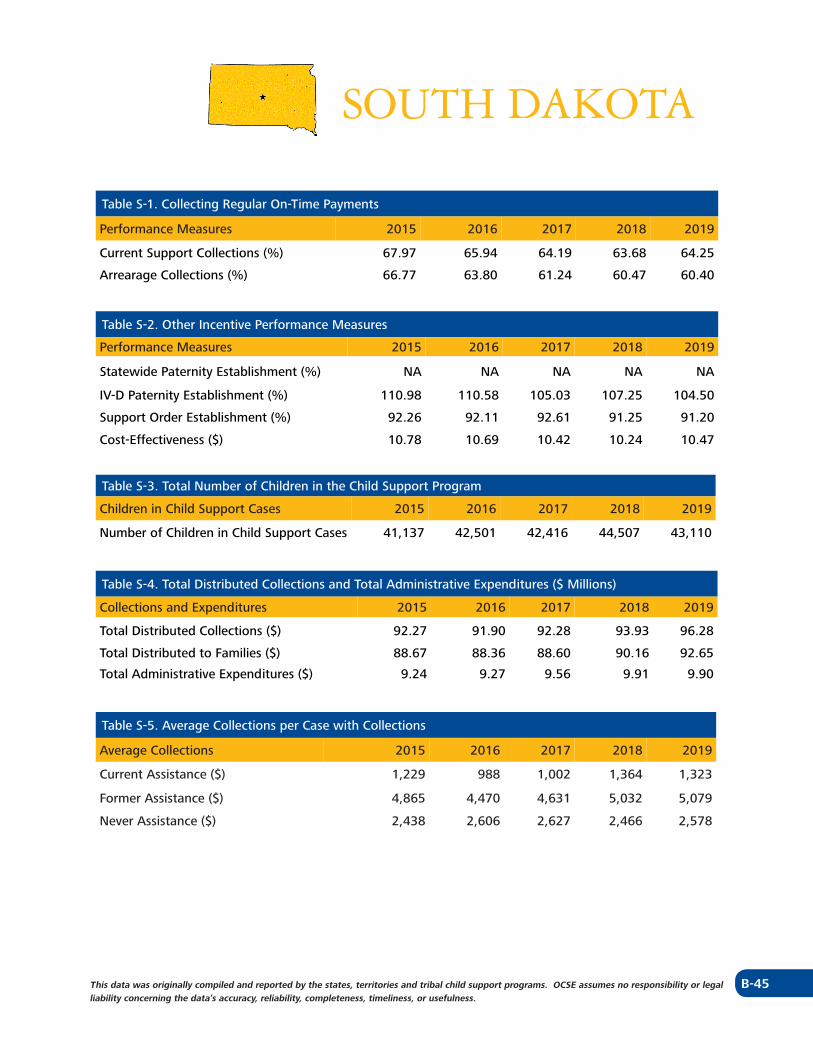
B-45This data was originally compiled and reported by the states, territories and tribal child support programs. OCSE assumes no responsibility or legal liability concerning the data’s accuracy, reliability, completeness, timeliness, or usefulness.
SOUTH DAKOTA
Table S-1. Collecting Regular On-Time Payments
Performance Measures 2015 2016 2017 2018 2019
Current Support Collections (%) 67.97 65.94 64.19 63.68 64.25
Arrearage Collections (%) 66.77 63.80 61.24 60.47 60.40
Table S-2. Other Incentive Performance Measures
Performance Measures 2015 2016 2017 2018 2019
Statewide Paternity Establishment (%) NA NA NA NA NA
IV-D Paternity Establishment (%) 110.98 110.58 105.03 107.25 104.50
Support Order Establishment (%) 92.26 92.11 92.61 91.25 91.20
Cost-Effectiveness ($) 10.78 10.69 10.42 10.24 10.47
Table S-3. Total Number of Children in the Child Support Program
Children in Child Support Cases 2015 2016 2017 2018 2019
Number of Children in Child Support Cases 41,137 42,501 42,416 44,507 43,110
Table S-4. Total Distributed Collections and Total Administrative Expenditures ($ Millions)
Collections and Expenditures 2015 2016 2017 2018 2019
Total Distributed Collections ($) 92.27 91.90 92.28 93.93 96.28
Total Distributed to Families ($) 88.67 88.36 88.60 90.16 92.65
Total Administrative Expenditures ($) 9.24 9.27 9.56 9.91 9.90
Table S-5. Average Collections per Case with Collections
Average Collections 2015 2016 2017 2018 2019
Current Assistance ($) 1,229 988 1,002 1,364 1,323
Former Assistance ($) 4,865 4,470 4,631 5,032 5,079
Never Assistance ($) 2,438 2,606 2,627 2,466 2,578
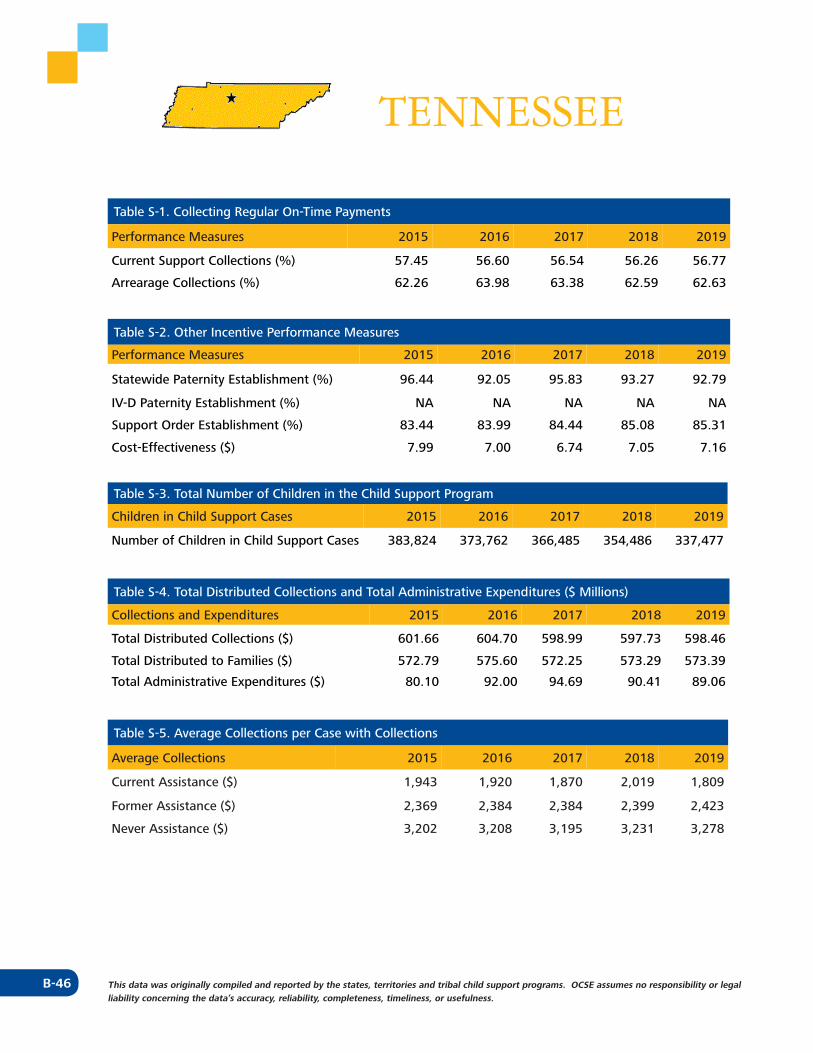
B-46 This data was originally compiled and reported by the states, territories and tribal child support programs. OCSE assumes no responsibility or legal liability concerning the data’s accuracy, reliability, completeness, timeliness, or usefulness.
TENNESSEE
Table S-1. Collecting Regular On-Time Payments
Performance Measures 2015 2016 2017 2018 2019
Current Support Collections (%) 57.45 56.60 56.54 56.26 56.77
Arrearage Collections (%) 62.26 63.98 63.38 62.59 62.63
Table S-2. Other Incentive Performance Measures
Performance Measures 2015 2016 2017 2018 2019
Statewide Paternity Establishment (%) 96.44 92.05 95.83 93.27 92.79
IV-D Paternity Establishment (%) NA NA NA NA NA
Support Order Establishment (%) 83.44 83.99 84.44 85.08 85.31
Cost-Effectiveness ($) 7.99 7.00 6.74 7.05 7.16
Table S-3. Total Number of Children in the Child Support Program
Children in Child Support Cases 2015 2016 2017 2018 2019
Number of Children in Child Support Cases 383,824 373,762 366,485 354,486 337,477
Table S-4. Total Distributed Collections and Total Administrative Expenditures ($ Millions)
Collections and Expenditures 2015 2016 2017 2018 2019
Total Distributed Collections ($) 601.66 604.70 598.99 597.73 598.46
Total Distributed to Families ($) 572.79 575.60 572.25 573.29 573.39
Total Administrative Expenditures ($) 80.10 92.00 94.69 90.41 89.06
Table S-5. Average Collections per Case with Collections
Average Collections 2015 2016 2017 2018 2019
Current Assistance ($) 1,943 1,920 1,870 2,019 1,809
Former Assistance ($) 2,369 2,384 2,384 2,399 2,423
Never Assistance ($) 3,202 3,208 3,195 3,231 3,278
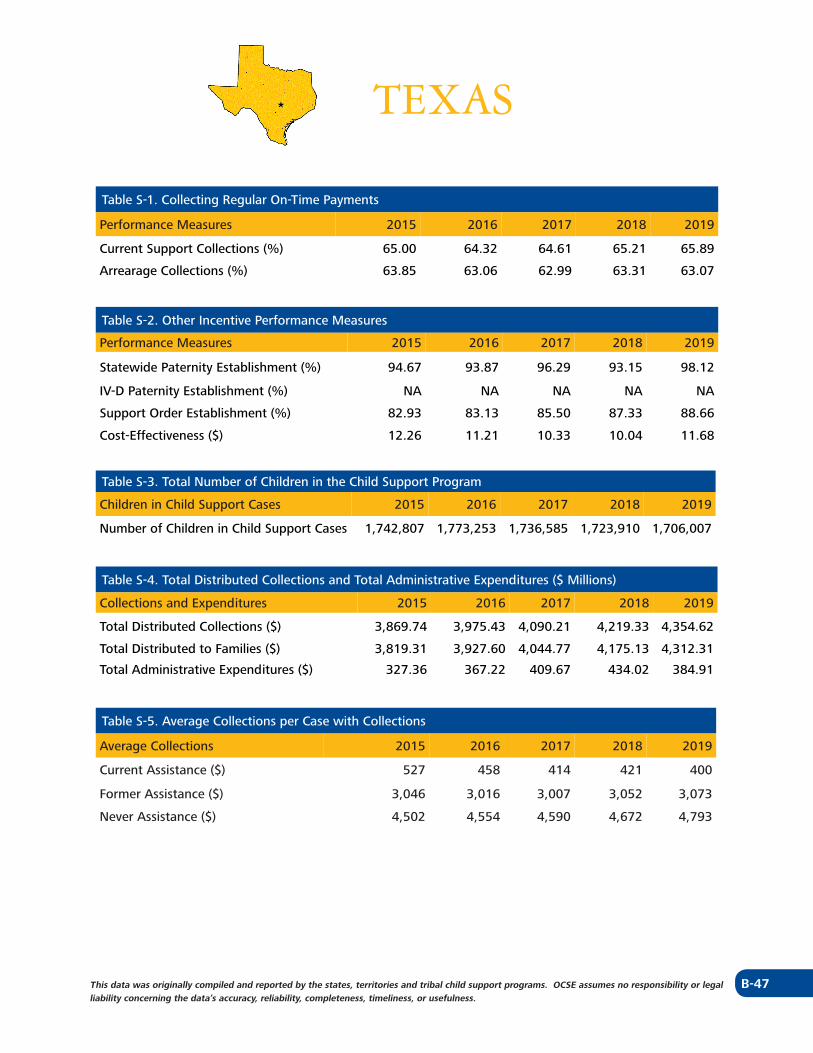
B-47This data was originally compiled and reported by the states, territories and tribal child support programs. OCSE assumes no responsibility or legal liability concerning the data’s accuracy, reliability, completeness, timeliness, or usefulness.
TEXAS
Table S-1. Collecting Regular On-Time Payments
Performance Measures 2015 2016 2017 2018 2019
Current Support Collections (%) 65.00 64.32 64.61 65.21 65.89
Arrearage Collections (%) 63.85 63.06 62.99 63.31 63.07
Table S-2. Other Incentive Performance Measures
Performance Measures 2015 2016 2017 2018 2019
Statewide Paternity Establishment (%) 94.67 93.87 96.29 93.15 98.12
IV-D Paternity Establishment (%) NA NA NA NA NA
Support Order Establishment (%) 82.93 83.13 85.50 87.33 88.66
Cost-Effectiveness ($) 12.26 11.21 10.33 10.04 11.68
Table S-3. Total Number of Children in the Child Support Program
Children in Child Support Cases 2015 2016 2017 2018 2019
Number of Children in Child Support Cases 1,742,807 1,773,253 1,736,585 1,723,910 1,706,007
Table S-4. Total Distributed Collections and Total Administrative Expenditures ($ Millions)
Collections and Expenditures 2015 2016 2017 2018 2019
Total Distributed Collections ($) 3,869.74 3,975.43 4,090.21 4,219.33 4,354.62
Total Distributed to Families ($) 3,819.31 3,927.60 4,044.77 4,175.13 4,312.31
Total Administrative Expenditures ($) 327.36 367.22 409.67 434.02 384.91
Table S-5. Average Collections per Case with Collections
Average Collections 2015 2016 2017 2018 2019
Current Assistance ($) 527 458 414 421 400
Former Assistance ($) 3,046 3,016 3,007 3,052 3,073
Never Assistance ($) 4,502 4,554 4,590 4,672 4,793
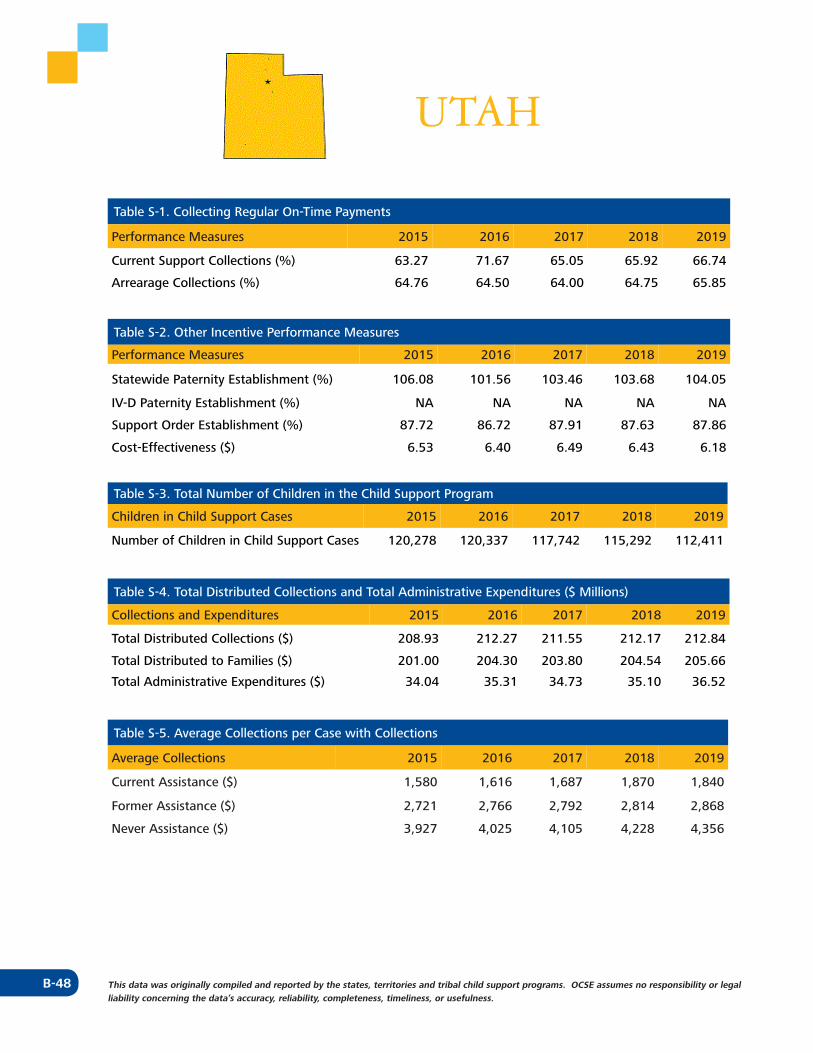
B-48 This data was originally compiled and reported by the states, territories and tribal child support programs. OCSE assumes no responsibility or legal liability concerning the data’s accuracy, reliability, completeness, timeliness, or usefulness.
UTAH
Table S-1. Collecting Regular On-Time Payments
Performance Measures 2015 2016 2017 2018 2019
Current Support Collections (%) 63.27 71.67 65.05 65.92 66.74
Arrearage Collections (%) 64.76 64.50 64.00 64.75 65.85
Table S-2. Other Incentive Performance Measures
Performance Measures 2015 2016 2017 2018 2019
Statewide Paternity Establishment (%) 106.08 101.56 103.46 103.68 104.05
IV-D Paternity Establishment (%) NA NA NA NA NA
Support Order Establishment (%) 87.72 86.72 87.91 87.63 87.86
Cost-Effectiveness ($) 6.53 6.40 6.49 6.43 6.18
Table S-3. Total Number of Children in the Child Support Program
Children in Child Support Cases 2015 2016 2017 2018 2019
Number of Children in Child Support Cases 120,278 120,337 117,742 115,292 112,411
Table S-4. Total Distributed Collections and Total Administrative Expenditures ($ Millions)
Collections and Expenditures 2015 2016 2017 2018 2019
Total Distributed Collections ($) 208.93 212.27 211.55 212.17 212.84
Total Distributed to Families ($) 201.00 204.30 203.80 204.54 205.66
Total Administrative Expenditures ($) 34.04 35.31 34.73 35.10 36.52
Table S-5. Average Collections per Case with Collections
Average Collections 2015 2016 2017 2018 2019
Current Assistance ($) 1,580 1,616 1,687 1,870 1,840
Former Assistance ($) 2,721 2,766 2,792 2,814 2,868
Never Assistance ($) 3,927 4,025 4,105 4,228 4,356
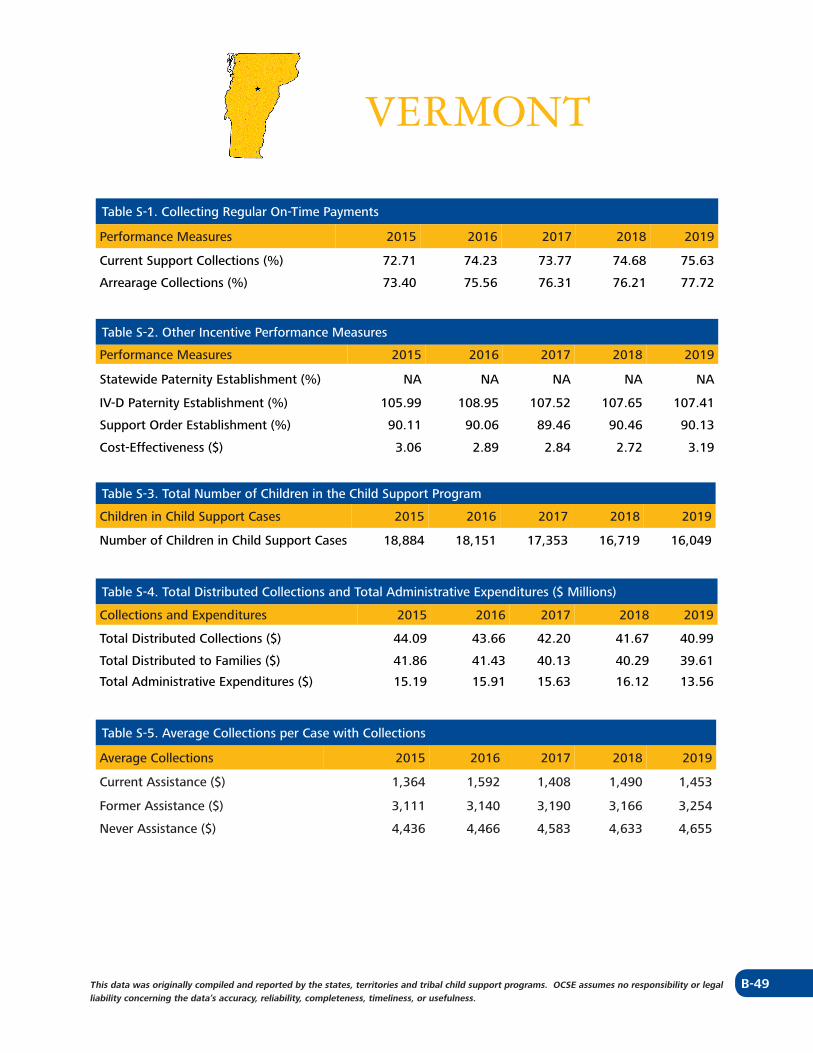
B-49This data was originally compiled and reported by the states, territories and tribal child support programs. OCSE assumes no responsibility or legal liability concerning the data’s accuracy, reliability, completeness, timeliness, or usefulness.
VERMONT
Table S-1. Collecting Regular On-Time Payments
Performance Measures 2015 2016 2017 2018 2019
Current Support Collections (%) 72.71 74.23 73.77 74.68 75.63
Arrearage Collections (%) 73.40 75.56 76.31 76.21 77.72
Table S-2. Other Incentive Performance Measures
Performance Measures 2015 2016 2017 2018 2019
Statewide Paternity Establishment (%) NA NA NA NA NA
IV-D Paternity Establishment (%) 105.99 108.95 107.52 107.65 107.41
Support Order Establishment (%) 90.11 90.06 89.46 90.46 90.13
Cost-Effectiveness ($) 3.06 2.89 2.84 2.72 3.19
Table S-3. Total Number of Children in the Child Support Program
Children in Child Support Cases 2015 2016 2017 2018 2019
Number of Children in Child Support Cases 18,884 18,151 17,353 16,719 16,049
Table S-4. Total Distributed Collections and Total Administrative Expenditures ($ Millions)
Collections and Expenditures 2015 2016 2017 2018 2019
Total Distributed Collections ($) 44.09 43.66 42.20 41.67 40.99
Total Distributed to Families ($) 41.86 41.43 40.13 40.29 39.61
Total Administrative Expenditures ($) 15.19 15.91 15.63 16.12 13.56
Table S-5. Average Collections per Case with Collections
Average Collections 2015 2016 2017 2018 2019
Current Assistance ($) 1,364 1,592 1,408 1,490 1,453
Former Assistance ($) 3,111 3,140 3,190 3,166 3,254
Never Assistance ($) 4,436 4,466 4,583 4,633 4,655
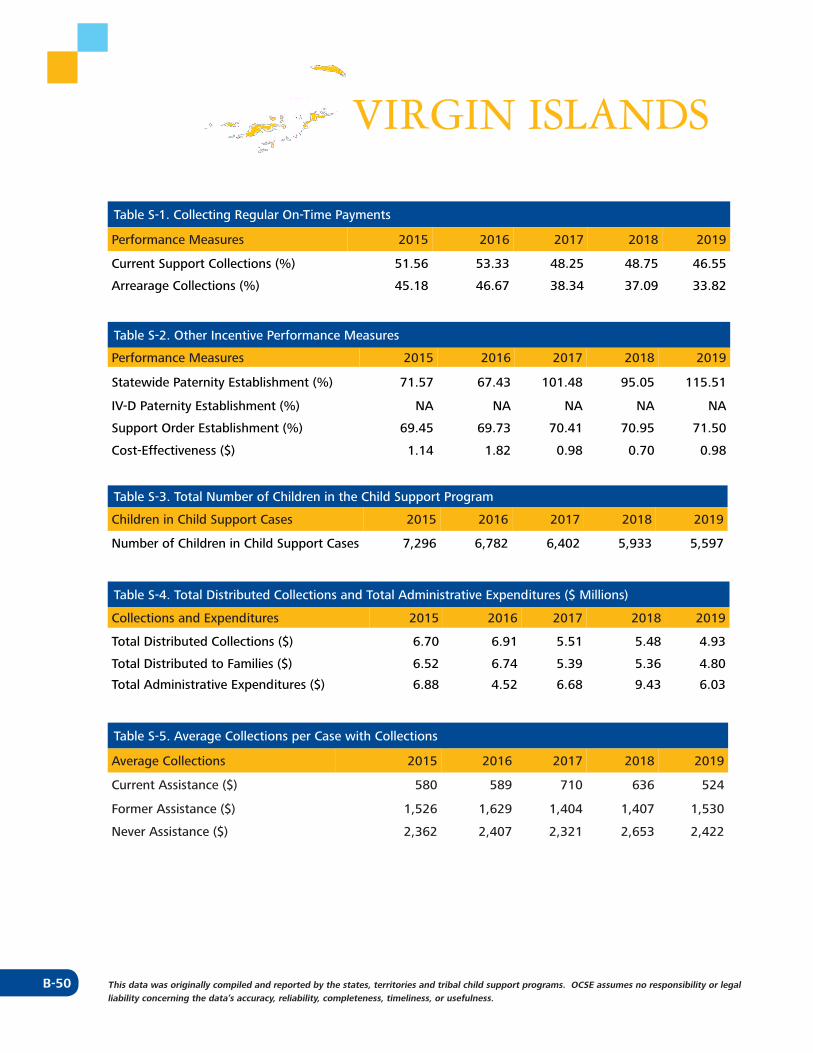
B-50 This data was originally compiled and reported by the states, territories and tribal child support programs. OCSE assumes no responsibility or legal liability concerning the data’s accuracy, reliability, completeness, timeliness, or usefulness.
VIRGIN ISLANDS
Table S-1. Collecting Regular On-Time Payments
Performance Measures 2015 2016 2017 2018 2019
Current Support Collections (%) 51.56 53.33 48.25 48.75 46.55
Arrearage Collections (%) 45.18 46.67 38.34 37.09 33.82
Table S-2. Other Incentive Performance Measures
Performance Measures 2015 2016 2017 2018 2019
Statewide Paternity Establishment (%) 71.57 67.43 101.48 95.05 115.51
IV-D Paternity Establishment (%) NA NA NA NA NA
Support Order Establishment (%) 69.45 69.73 70.41 70.95 71.50
Cost-Effectiveness ($) 1.14 1.82 0.98 0.70 0.98
Table S-3. Total Number of Children in the Child Support Program
Children in Child Support Cases 2015 2016 2017 2018 2019
Number of Children in Child Support Cases 7,296 6,782 6,402 5,933 5,597
Table S-4. Total Distributed Collections and Total Administrative Expenditures ($ Millions)
Collections and Expenditures 2015 2016 2017 2018 2019
Total Distributed Collections ($) 6.70 6.91 5.51 5.48 4.93
Total Distributed to Families ($) 6.52 6.74 5.39 5.36 4.80
Total Administrative Expenditures ($) 6.88 4.52 6.68 9.43 6.03
Table S-5. Average Collections per Case with Collections
Average Collections 2015 2016 2017 2018 2019
Current Assistance ($) 580 589 710 636 524
Former Assistance ($) 1,526 1,629 1,404 1,407 1,530
Never Assistance ($) 2,362 2,407 2,321 2,653 2,422
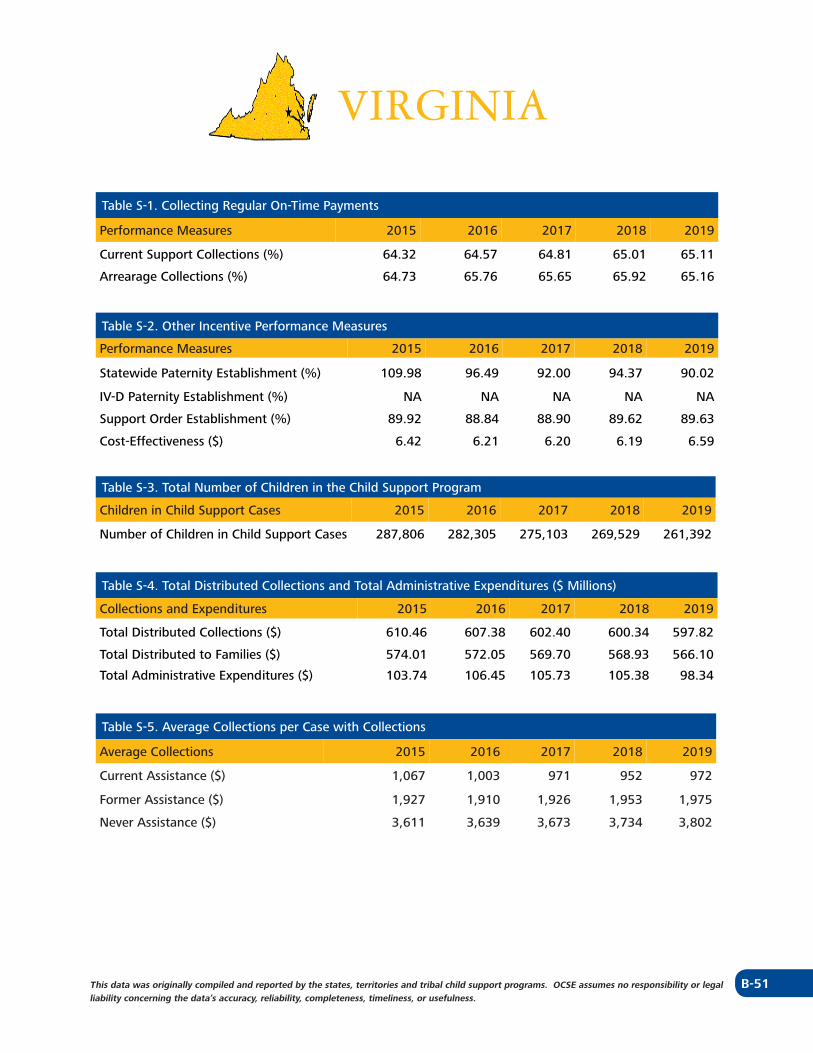
B-51This data was originally compiled and reported by the states, territories and tribal child support programs. OCSE assumes no responsibility or legal liability concerning the data’s accuracy, reliability, completeness, timeliness, or usefulness.
VIRGINIA
Table S-1. Collecting Regular On-Time Payments
Performance Measures 2015 2016 2017 2018 2019
Current Support Collections (%) 64.32 64.57 64.81 65.01 65.11
Arrearage Collections (%) 64.73 65.76 65.65 65.92 65.16
Table S-2. Other Incentive Performance Measures
Performance Measures 2015 2016 2017 2018 2019
Statewide Paternity Establishment (%) 109.98 96.49 92.00 94.37 90.02
IV-D Paternity Establishment (%) NA NA NA NA NA
Support Order Establishment (%) 89.92 88.84 88.90 89.62 89.63
Cost-Effectiveness ($) 6.42 6.21 6.20 6.19 6.59
Table S-3. Total Number of Children in the Child Support Program
Children in Child Support Cases 2015 2016 2017 2018 2019
Number of Children in Child Support Cases 287,806 282,305 275,103 269,529 261,392
Table S-4. Total Distributed Collections and Total Administrative Expenditures ($ Millions)
Collections and Expenditures 2015 2016 2017 2018 2019
Total Distributed Collections ($) 610.46 607.38 602.40 600.34 597.82
Total Distributed to Families ($) 574.01 572.05 569.70 568.93 566.10
Total Administrative Expenditures ($) 103.74 106.45 105.73 105.38 98.34
Table S-5. Average Collections per Case with Collections
Average Collections 2015 2016 2017 2018 2019
Current Assistance ($) 1,067 1,003 971 952 972
Former Assistance ($) 1,927 1,910 1,926 1,953 1,975
Never Assistance ($) 3,611 3,639 3,673 3,734 3,802
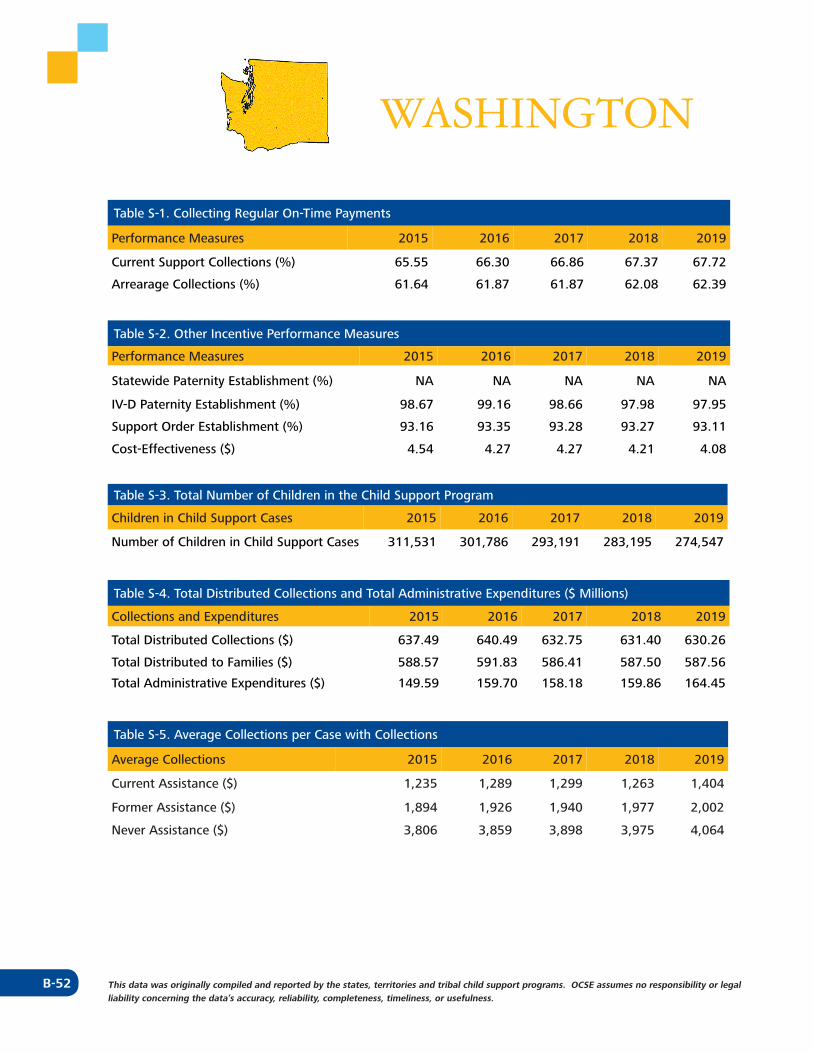
B-52 This data was originally compiled and reported by the states, territories and tribal child support programs. OCSE assumes no responsibility or legal liability concerning the data’s accuracy, reliability, completeness, timeliness, or usefulness.
WASHINGTON
Table S-1. Collecting Regular On-Time Payments
Performance Measures 2015 2016 2017 2018 2019
Current Support Collections (%) 65.55 66.30 66.86 67.37 67.72
Arrearage Collections (%) 61.64 61.87 61.87 62.08 62.39
Table S-2. Other Incentive Performance Measures
Performance Measures 2015 2016 2017 2018 2019
Statewide Paternity Establishment (%) NA NA NA NA NA
IV-D Paternity Establishment (%) 98.67 99.16 98.66 97.98 97.95
Support Order Establishment (%) 93.16 93.35 93.28 93.27 93.11
Cost-Effectiveness ($) 4.54 4.27 4.27 4.21 4.08
Table S-3. Total Number of Children in the Child Support Program
Children in Child Support Cases 2015 2016 2017 2018 2019
Number of Children in Child Support Cases 311,531 301,786 293,191 283,195 274,547
Table S-4. Total Distributed Collections and Total Administrative Expenditures ($ Millions)
Collections and Expenditures 2015 2016 2017 2018 2019
Total Distributed Collections ($) 637.49 640.49 632.75 631.40 630.26
Total Distributed to Families ($) 588.57 591.83 586.41 587.50 587.56
Total Administrative Expenditures ($) 149.59 159.70 158.18 159.86 164.45
Table S-5. Average Collections per Case with Collections
Average Collections 2015 2016 2017 2018 2019
Current Assistance ($) 1,235 1,289 1,299 1,263 1,404
Former Assistance ($) 1,894 1,926 1,940 1,977 2,002
Never Assistance ($) 3,806 3,859 3,898 3,975 4,064
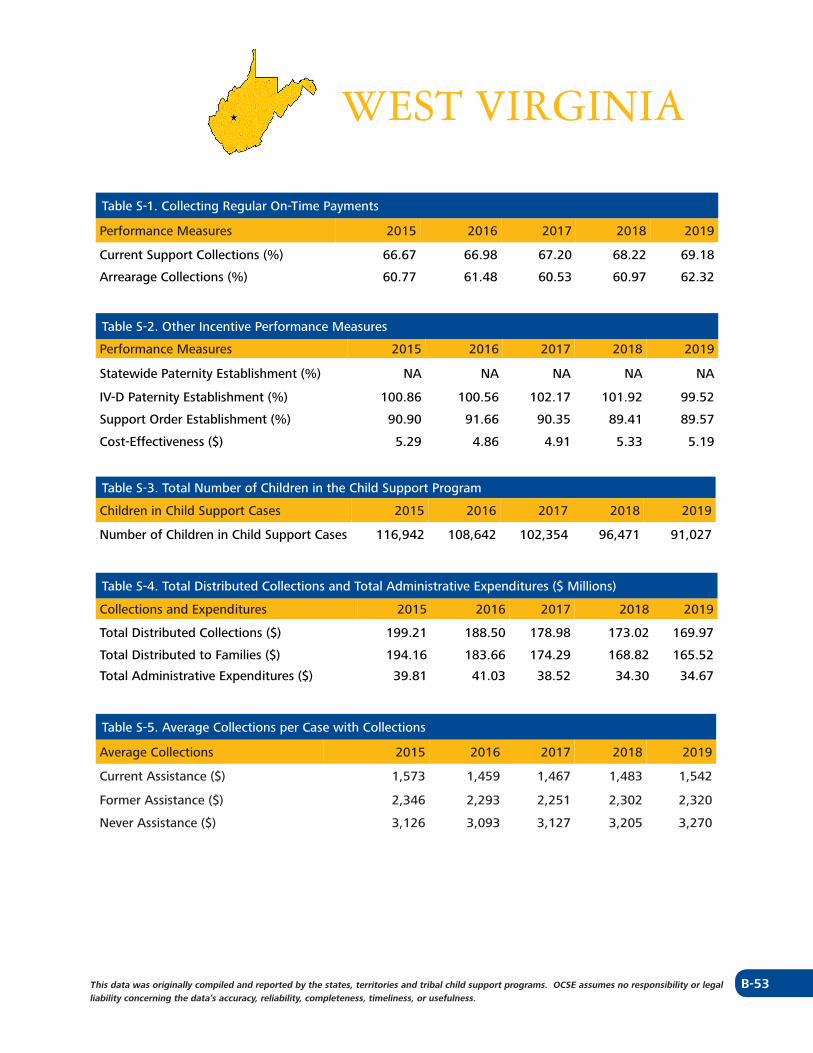
B-53This data was originally compiled and reported by the states, territories and tribal child support programs. OCSE assumes no responsibility or legal liability concerning the data’s accuracy, reliability, completeness, timeliness, or usefulness.
WEST VIRGINIA
Table S-1. Collecting Regular On-Time Payments
Performance Measures 2015 2016 2017 2018 2019
Current Support Collections (%) 66.67 66.98 67.20 68.22 69.18
Arrearage Collections (%) 60.77 61.48 60.53 60.97 62.32
Table S-2. Other Incentive Performance Measures
Performance Measures 2015 2016 2017 2018 2019
Statewide Paternity Establishment (%) NA NA NA NA NA
IV-D Paternity Establishment (%) 100.86 100.56 102.17 101.92 99.52
Support Order Establishment (%) 90.90 91.66 90.35 89.41 89.57
Cost-Effectiveness ($) 5.29 4.86 4.91 5.33 5.19
Table S-3. Total Number of Children in the Child Support Program
Children in Child Support Cases 2015 2016 2017 2018 2019
Number of Children in Child Support Cases 116,942 108,642 102,354 96,471 91,027
Table S-4. Total Distributed Collections and Total Administrative Expenditures ($ Millions)
Collections and Expenditures 2015 2016 2017 2018 2019
Total Distributed Collections ($) 199.21 188.50 178.98 173.02 169.97
Total Distributed to Families ($) 194.16 183.66 174.29 168.82 165.52
Total Administrative Expenditures ($) 39.81 41.03 38.52 34.30 34.67
Table S-5. Average Collections per Case with Collections
Average Collections 2015 2016 2017 2018 2019
Current Assistance ($) 1,573 1,459 1,467 1,483 1,542
Former Assistance ($) 2,346 2,293 2,251 2,302 2,320
Never Assistance ($) 3,126 3,093 3,127 3,205 3,270
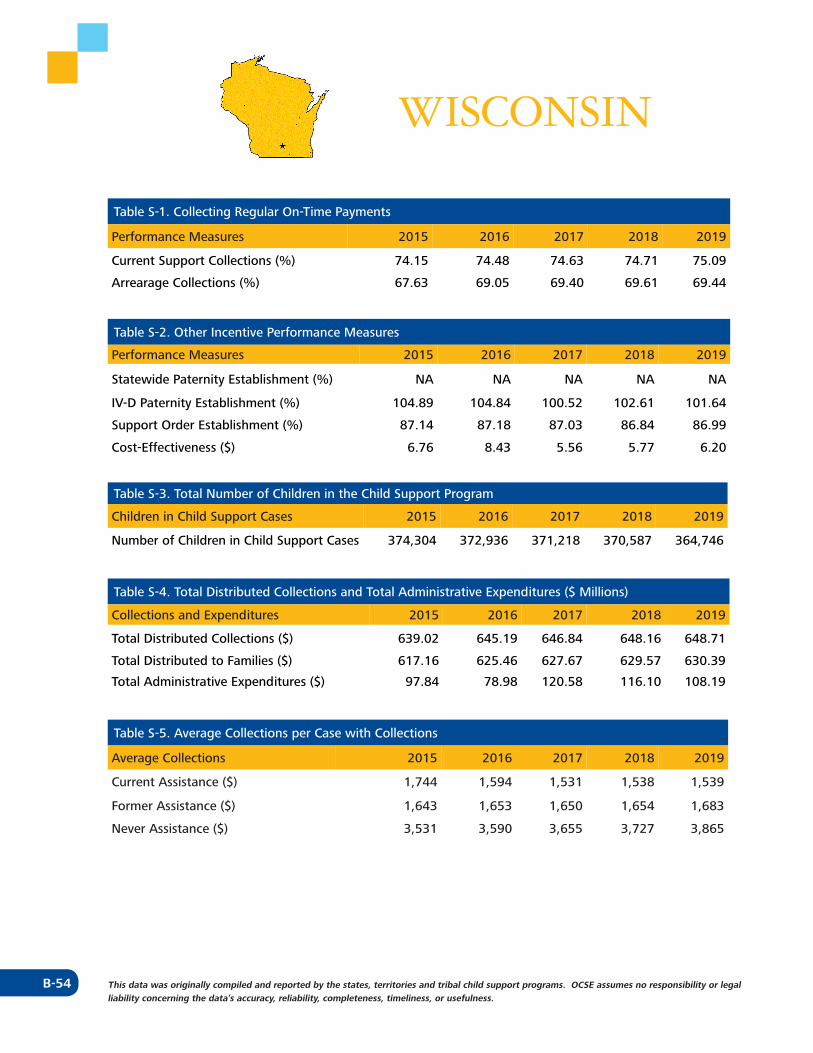
B-54 This data was originally compiled and reported by the states, territories and tribal child support programs. OCSE assumes no responsibility or legal liability concerning the data’s accuracy, reliability, completeness, timeliness, or usefulness.
WISCONSIN
Table S-1. Collecting Regular On-Time Payments
Performance Measures 2015 2016 2017 2018 2019
Current Support Collections (%) 74.15 74.48 74.63 74.71 75.09
Arrearage Collections (%) 67.63 69.05 69.40 69.61 69.44
Table S-2. Other Incentive Performance Measures
Performance Measures 2015 2016 2017 2018 2019
Statewide Paternity Establishment (%) NA NA NA NA NA
IV-D Paternity Establishment (%) 104.89 104.84 100.52 102.61 101.64
Support Order Establishment (%) 87.14 87.18 87.03 86.84 86.99
Cost-Effectiveness ($) 6.76 8.43 5.56 5.77 6.20
Table S-3. Total Number of Children in the Child Support Program
Children in Child Support Cases 2015 2016 2017 2018 2019
Number of Children in Child Support Cases 374,304 372,936 371,218 370,587 364,746
Table S-4. Total Distributed Collections and Total Administrative Expenditures ($ Millions)
Collections and Expenditures 2015 2016 2017 2018 2019
Total Distributed Collections ($) 639.02 645.19 646.84 648.16 648.71
Total Distributed to Families ($) 617.16 625.46 627.67 629.57 630.39
Total Administrative Expenditures ($) 97.84 78.98 120.58 116.10 108.19
Table S-5. Average Collections per Case with Collections
Average Collections 2015 2016 2017 2018 2019
Current Assistance ($) 1,744 1,594 1,531 1,538 1,539
Former Assistance ($) 1,643 1,653 1,650 1,654 1,683
Never Assistance ($) 3,531 3,590 3,655 3,727 3,865
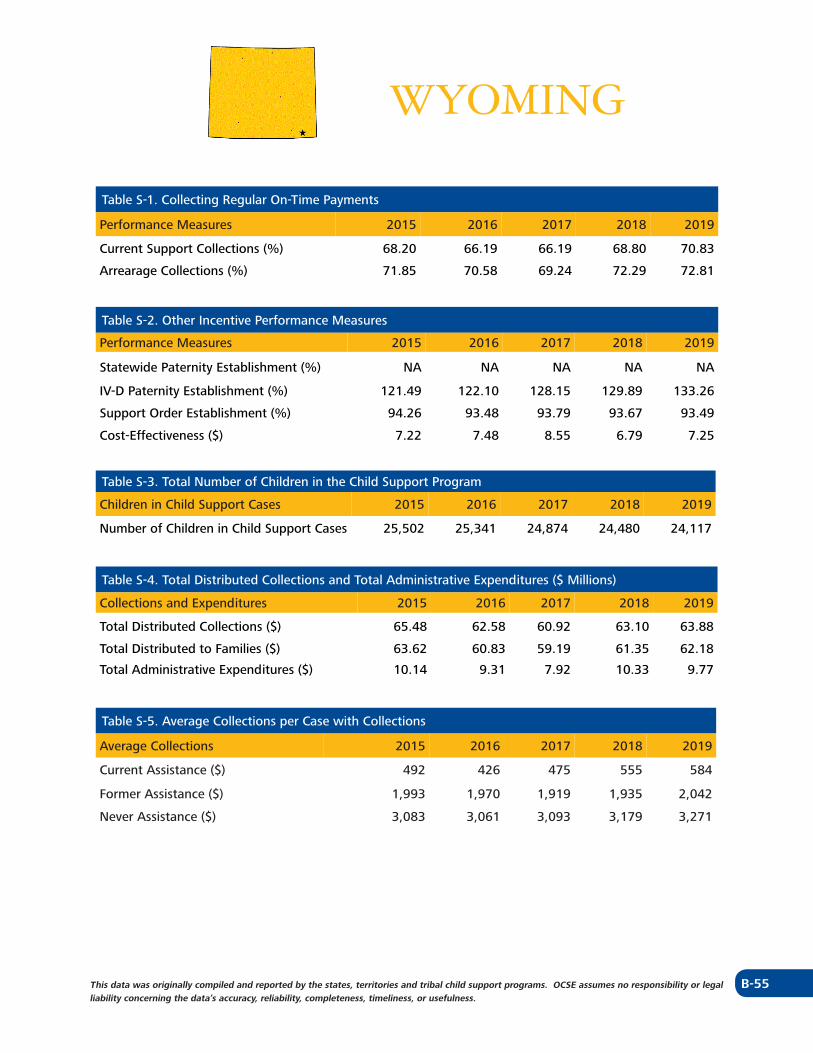
B-55This data was originally compiled and reported by the states, territories and tribal child support programs. OCSE assumes no responsibility or legal liability concerning the data’s accuracy, reliability, completeness, timeliness, or usefulness.
WYOMING
Table S-1. Collecting Regular On-Time Payments
Performance Measures 2015 2016 2017 2018 2019
Current Support Collections (%) 68.20 66.19 66.19 68.80 70.83
Arrearage Collections (%) 71.85 70.58 69.24 72.29 72.81
Table S-2. Other Incentive Performance Measures
Performance Measures 2015 2016 2017 2018 2019
Statewide Paternity Establishment (%) NA NA NA NA NA
IV-D Paternity Establishment (%) 121.49 122.10 128.15 129.89 133.26
Support Order Establishment (%) 94.26 93.48 93.79 93.67 93.49
Cost-Effectiveness ($) 7.22 7.48 8.55 6.79 7.25
Table S-3. Total Number of Children in the Child Support Program
Children in Child Support Cases 2015 2016 2017 2018 2019
Number of Children in Child Support Cases 25,502 25,341 24,874 24,480 24,117
Table S-4. Total Distributed Collections and Total Administrative Expenditures ($ Millions)
Collections and Expenditures 2015 2016 2017 2018 2019
Total Distributed Collections ($) 65.48 62.58 60.92 63.10 63.88
Total Distributed to Families ($) 63.62 60.83 59.19 61.35 62.18
Total Administrative Expenditures ($) 10.14 9.31 7.92 10.33 9.77
Table S-5. Average Collections per Case with Collections
Average Collections 2015 2016 2017 2018 2019
Current Assistance ($) 492 426 475 555 584
Former Assistance ($) 1,993 1,970 1,919 1,935 2,042
Never Assistance ($) 3,083 3,061 3,093 3,179 3,271

B-56
This page is intentionally left blank
C-1
PROGRAM Performance
TRIBALPERFORMANCE
C-2
The Office of Child Support Enforcement recognizes the unique relationship between the federal government and federally recognized Indian Tribes. The direct federal funding provisions in Section 455(f) of the Social Security Act provides Tribes with an opportunity to administer their own IV-D programs in a manner that meets the needs of children and their families.
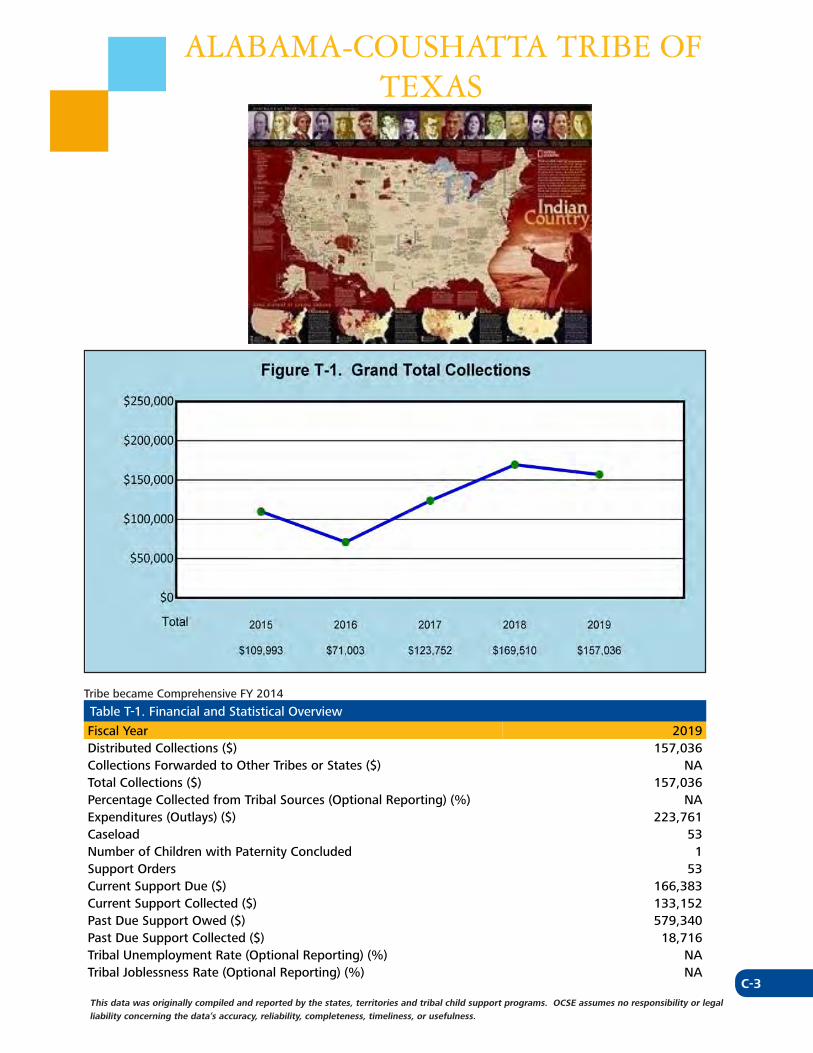
C-3This data was originally compiled and reported by the states, territories and tribal child support programs. OCSE assumes no responsibility or legal liability concerning the data’s accuracy, reliability, completeness, timeliness, or usefulness.
ALABAMA-COUSHATTA TRIBE OF TEXAS
Tribe became Comprehensive FY 2014
Table T-1. Financial and Statistical Overview
Fiscal Year 2019Distributed Collections ($) 157,036Collections Forwarded to Other Tribes or States ($) NATotal Collections ($) 157,036Percentage Collected from Tribal Sources (Optional Reporting) (%) NAExpenditures (Outlays) ($) 223,761Caseload 53Number of Children with Paternity Concluded 1Support Orders 53Current Support Due ($) 166,383Current Support Collected ($) 133,152Past Due Support Owed ($) 579,340Past Due Support Collected ($) 18,716Tribal Unemployment Rate (Optional Reporting) (%) NATribal Joblessness Rate (Optional Reporting) (%) NA
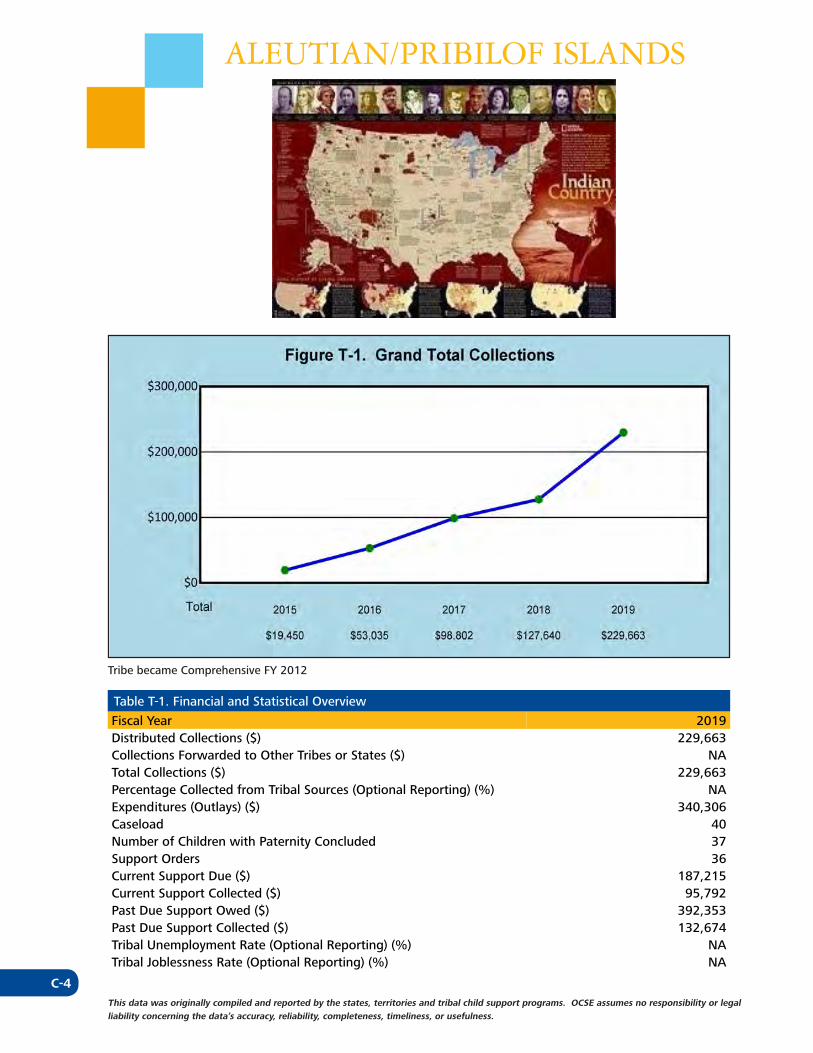
C-4This data was originally compiled and reported by the states, territories and tribal child support programs. OCSE assumes no responsibility or legal liability concerning the data’s accuracy, reliability, completeness, timeliness, or usefulness.
ALEUTIAN/PRIBILOF ISLANDS
Tribe became Comprehensive FY 2012
Table T-1. Financial and Statistical Overview
Fiscal Year 2019Distributed Collections ($) 229,663Collections Forwarded to Other Tribes or States ($) NATotal Collections ($) 229,663Percentage Collected from Tribal Sources (Optional Reporting) (%) NAExpenditures (Outlays) ($) 340,306Caseload 40Number of Children with Paternity Concluded 37Support Orders 36Current Support Due ($) 187,215Current Support Collected ($) 95,792Past Due Support Owed ($) 392,353Past Due Support Collected ($) 132,674Tribal Unemployment Rate (Optional Reporting) (%) NATribal Joblessness Rate (Optional Reporting) (%) NA
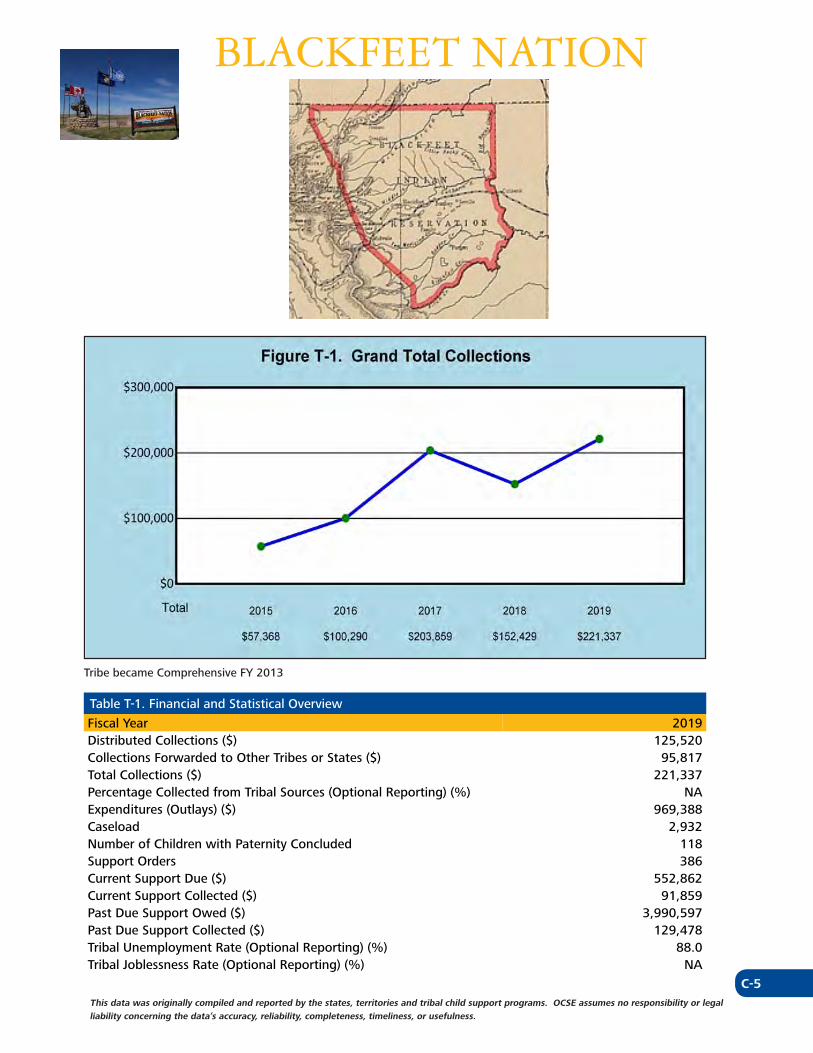
C-5This data was originally compiled and reported by the states, territories and tribal child support programs. OCSE assumes no responsibility or legal liability concerning the data’s accuracy, reliability, completeness, timeliness, or usefulness.
BLACKFEET NATION
Tribe became Comprehensive FY 2013
Table T-1. Financial and Statistical Overview
Fiscal Year 2019Distributed Collections ($) 125,520Collections Forwarded to Other Tribes or States ($) 95,817Total Collections ($) 221,337Percentage Collected from Tribal Sources (Optional Reporting) (%) NAExpenditures (Outlays) ($) 969,388Caseload 2,932Number of Children with Paternity Concluded 118Support Orders 386Current Support Due ($) 552,862Current Support Collected ($) 91,859Past Due Support Owed ($) 3,990,597Past Due Support Collected ($) 129,478Tribal Unemployment Rate (Optional Reporting) (%) 88.0Tribal Joblessness Rate (Optional Reporting) (%) NA
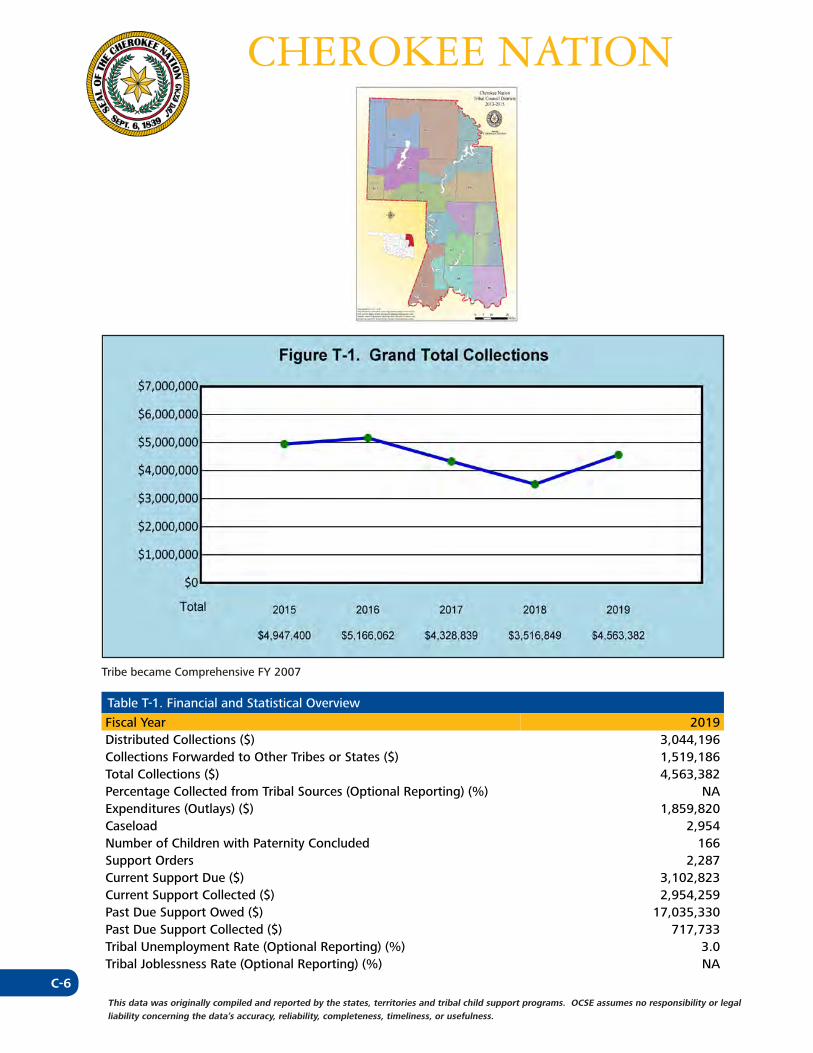
C-6This data was originally compiled and reported by the states, territories and tribal child support programs. OCSE assumes no responsibility or legal liability concerning the data’s accuracy, reliability, completeness, timeliness, or usefulness.
CHEROKEE NATION
Tribe became Comprehensive FY 2007
Table T-1. Financial and Statistical Overview
Fiscal Year 2019Distributed Collections ($) 3,044,196Collections Forwarded to Other Tribes or States ($) 1,519,186Total Collections ($) 4,563,382Percentage Collected from Tribal Sources (Optional Reporting) (%) NAExpenditures (Outlays) ($) 1,859,820Caseload 2,954Number of Children with Paternity Concluded 166Support Orders 2,287Current Support Due ($) 3,102,823Current Support Collected ($) 2,954,259Past Due Support Owed ($) 17,035,330Past Due Support Collected ($) 717,733Tribal Unemployment Rate (Optional Reporting) (%) 3.0Tribal Joblessness Rate (Optional Reporting) (%) NA
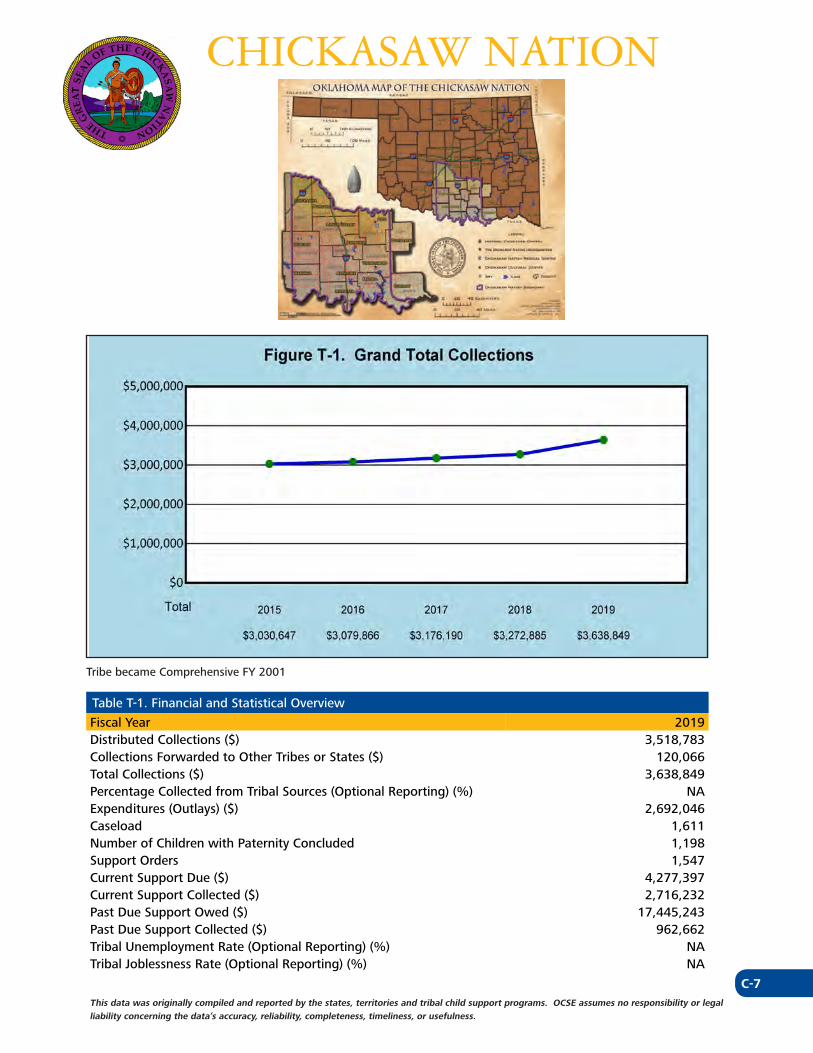
C-7This data was originally compiled and reported by the states, territories and tribal child support programs. OCSE assumes no responsibility or legal liability concerning the data’s accuracy, reliability, completeness, timeliness, or usefulness.
CHICKASAW NATION
Tribe became Comprehensive FY 2001
Table T-1. Financial and Statistical Overview
Fiscal Year 2019Distributed Collections ($) 3,518,783Collections Forwarded to Other Tribes or States ($) 120,066Total Collections ($) 3,638,849Percentage Collected from Tribal Sources (Optional Reporting) (%) NAExpenditures (Outlays) ($) 2,692,046Caseload 1,611Number of Children with Paternity Concluded 1,198Support Orders 1,547Current Support Due ($) 4,277,397Current Support Collected ($) 2,716,232Past Due Support Owed ($) 17,445,243Past Due Support Collected ($) 962,662Tribal Unemployment Rate (Optional Reporting) (%) NATribal Joblessness Rate (Optional Reporting) (%) NA
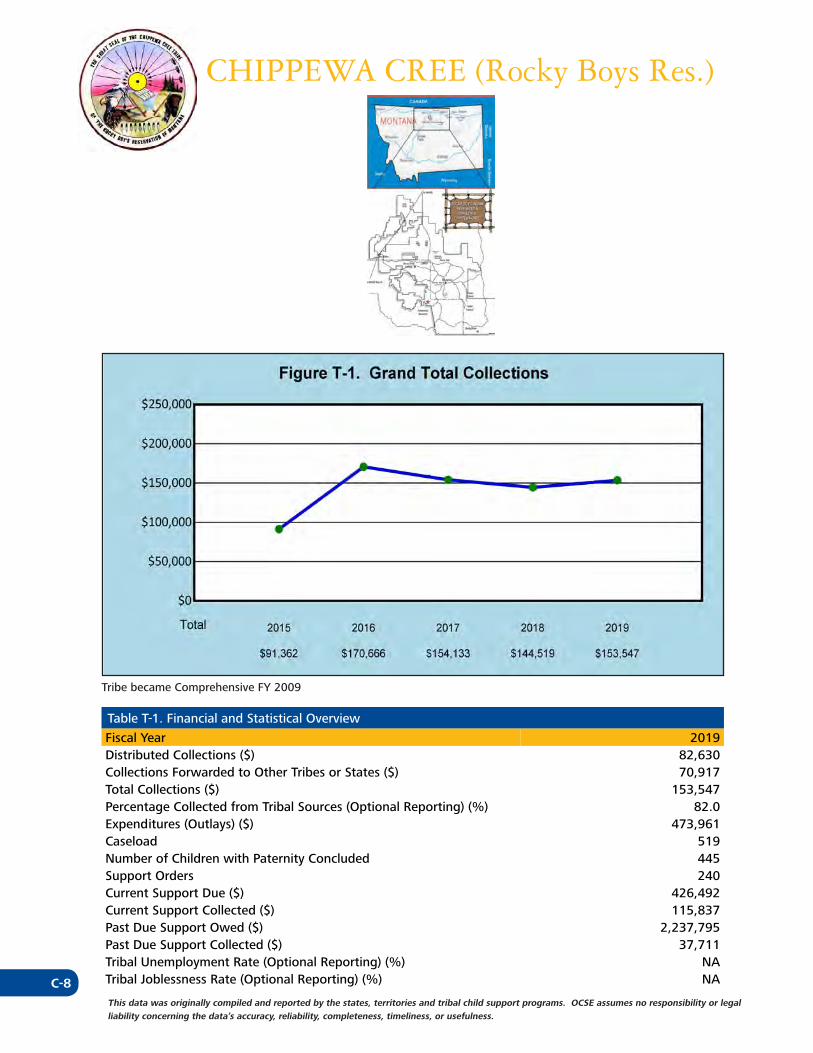
C-8This data was originally compiled and reported by the states, territories and tribal child support programs. OCSE assumes no responsibility or legal liability concerning the data’s accuracy, reliability, completeness, timeliness, or usefulness.
CHIPPEWA CREE (Rocky Boys Res.)
Tribe became Comprehensive FY 2009
Table T-1. Financial and Statistical Overview
Fiscal Year 2019Distributed Collections ($) 82,630Collections Forwarded to Other Tribes or States ($) 70,917Total Collections ($) 153,547Percentage Collected from Tribal Sources (Optional Reporting) (%) 82.0Expenditures (Outlays) ($) 473,961Caseload 519Number of Children with Paternity Concluded 445Support Orders 240Current Support Due ($) 426,492Current Support Collected ($) 115,837Past Due Support Owed ($) 2,237,795Past Due Support Collected ($) 37,711Tribal Unemployment Rate (Optional Reporting) (%) NATribal Joblessness Rate (Optional Reporting) (%) NA
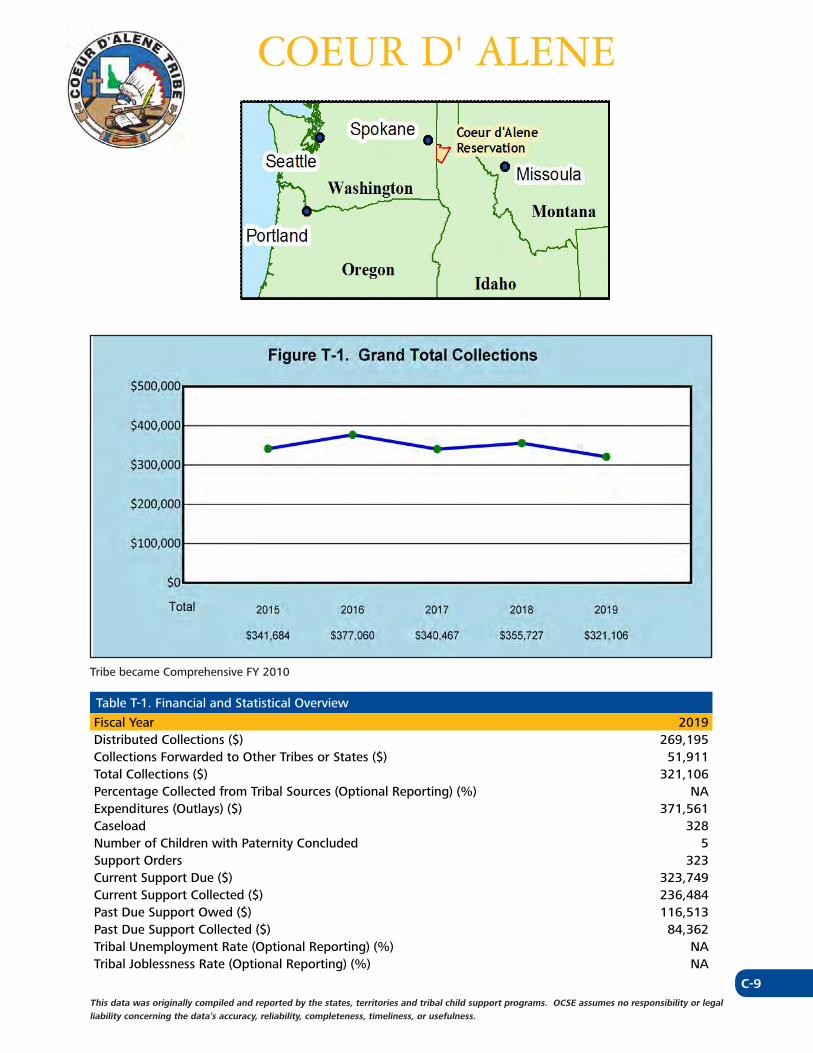
C-9This data was originally compiled and reported by the states, territories and tribal child support programs. OCSE assumes no responsibility or legal liability concerning the data’s accuracy, reliability, completeness, timeliness, or usefulness.
COEUR D' ALENE
Tribe became Comprehensive FY 2010
Table T-1. Financial and Statistical Overview
Fiscal Year 2019Distributed Collections ($) 269,195Collections Forwarded to Other Tribes or States ($) 51,911Total Collections ($) 321,106Percentage Collected from Tribal Sources (Optional Reporting) (%) NAExpenditures (Outlays) ($) 371,561Caseload 328Number of Children with Paternity Concluded 5Support Orders 323Current Support Due ($) 323,749Current Support Collected ($) 236,484Past Due Support Owed ($) 116,513Past Due Support Collected ($) 84,362Tribal Unemployment Rate (Optional Reporting) (%) NATribal Joblessness Rate (Optional Reporting) (%) NA
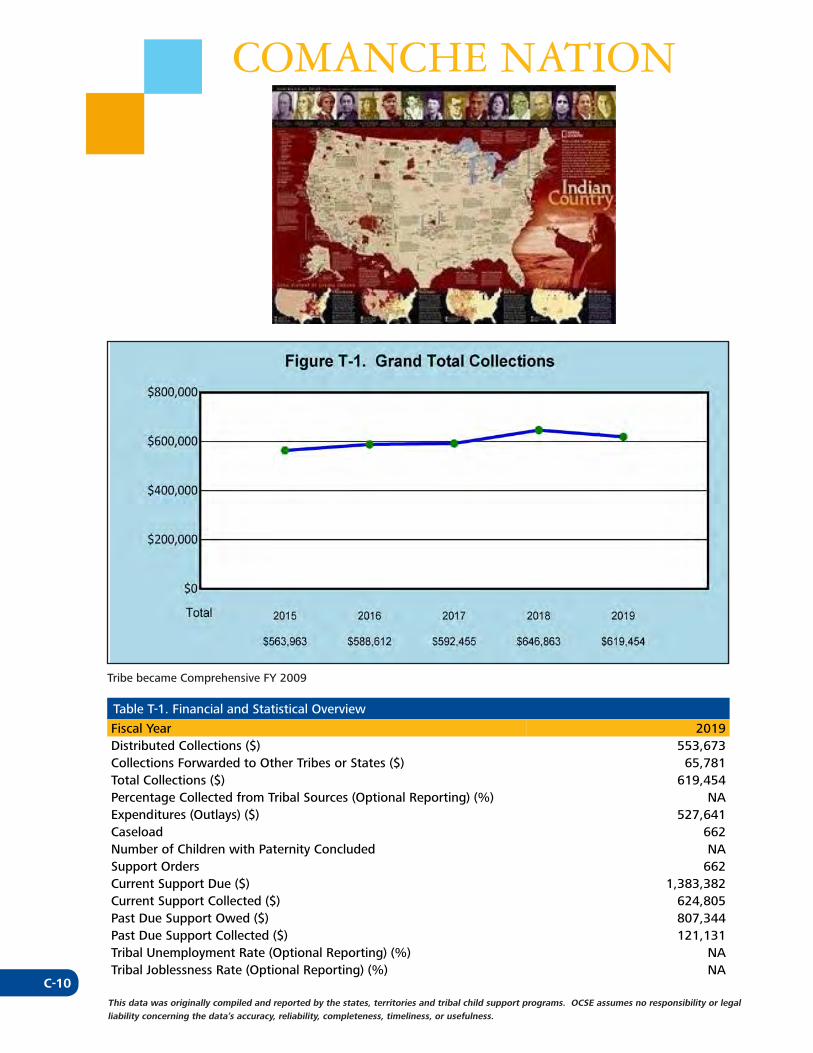
C-10This data was originally compiled and reported by the states, territories and tribal child support programs. OCSE assumes no responsibility or legal liability concerning the data’s accuracy, reliability, completeness, timeliness, or usefulness.
COMANCHE NATION
Tribe became Comprehensive FY 2009
Table T-1. Financial and Statistical Overview
Fiscal Year 2019Distributed Collections ($) 553,673Collections Forwarded to Other Tribes or States ($) 65,781Total Collections ($) 619,454Percentage Collected from Tribal Sources (Optional Reporting) (%) NAExpenditures (Outlays) ($) 527,641Caseload 662Number of Children with Paternity Concluded NASupport Orders 662Current Support Due ($) 1,383,382Current Support Collected ($) 624,805Past Due Support Owed ($) 807,344Past Due Support Collected ($) 121,131Tribal Unemployment Rate (Optional Reporting) (%) NATribal Joblessness Rate (Optional Reporting) (%) NA
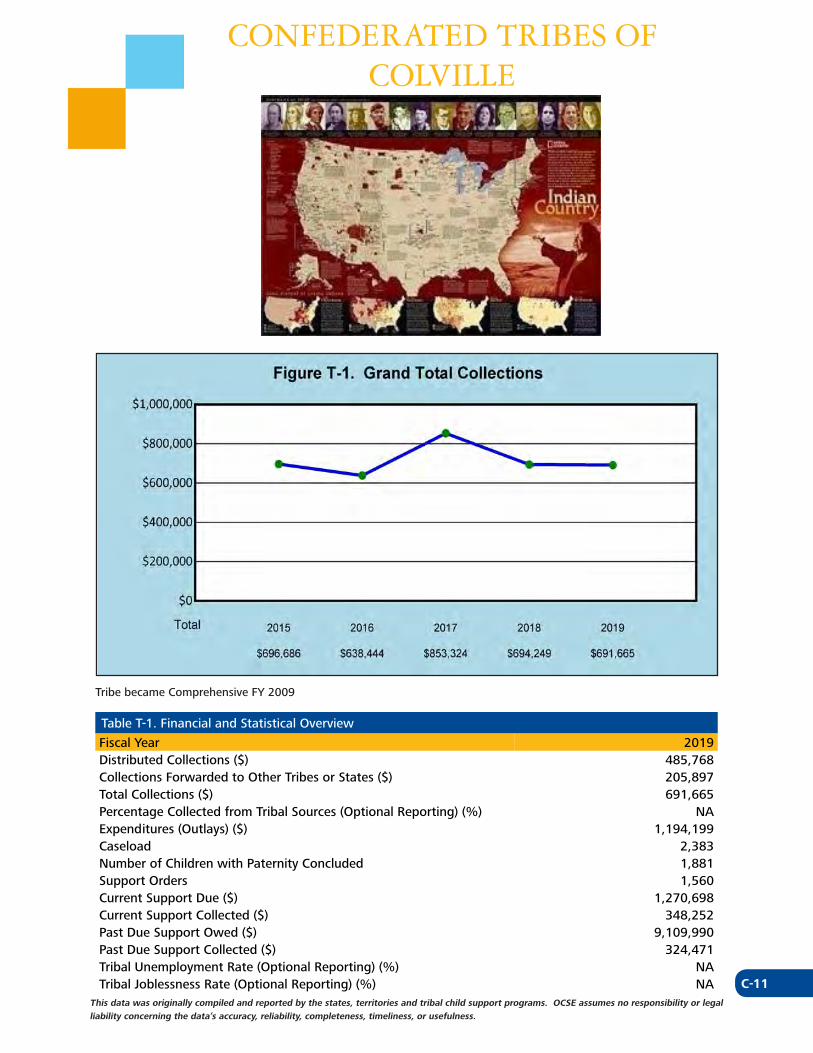
C-11This data was originally compiled and reported by the states, territories and tribal child support programs. OCSE assumes no responsibility or legal liability concerning the data’s accuracy, reliability, completeness, timeliness, or usefulness.
CONFEDERATED TRIBES OF COLVILLE
Tribe became Comprehensive FY 2009
Table T-1. Financial and Statistical Overview
Fiscal Year 2019Distributed Collections ($) 485,768Collections Forwarded to Other Tribes or States ($) 205,897Total Collections ($) 691,665Percentage Collected from Tribal Sources (Optional Reporting) (%) NAExpenditures (Outlays) ($) 1,194,199Caseload 2,383Number of Children with Paternity Concluded 1,881Support Orders 1,560Current Support Due ($) 1,270,698Current Support Collected ($) 348,252Past Due Support Owed ($) 9,109,990Past Due Support Collected ($) 324,471Tribal Unemployment Rate (Optional Reporting) (%) NATribal Joblessness Rate (Optional Reporting) (%) NA
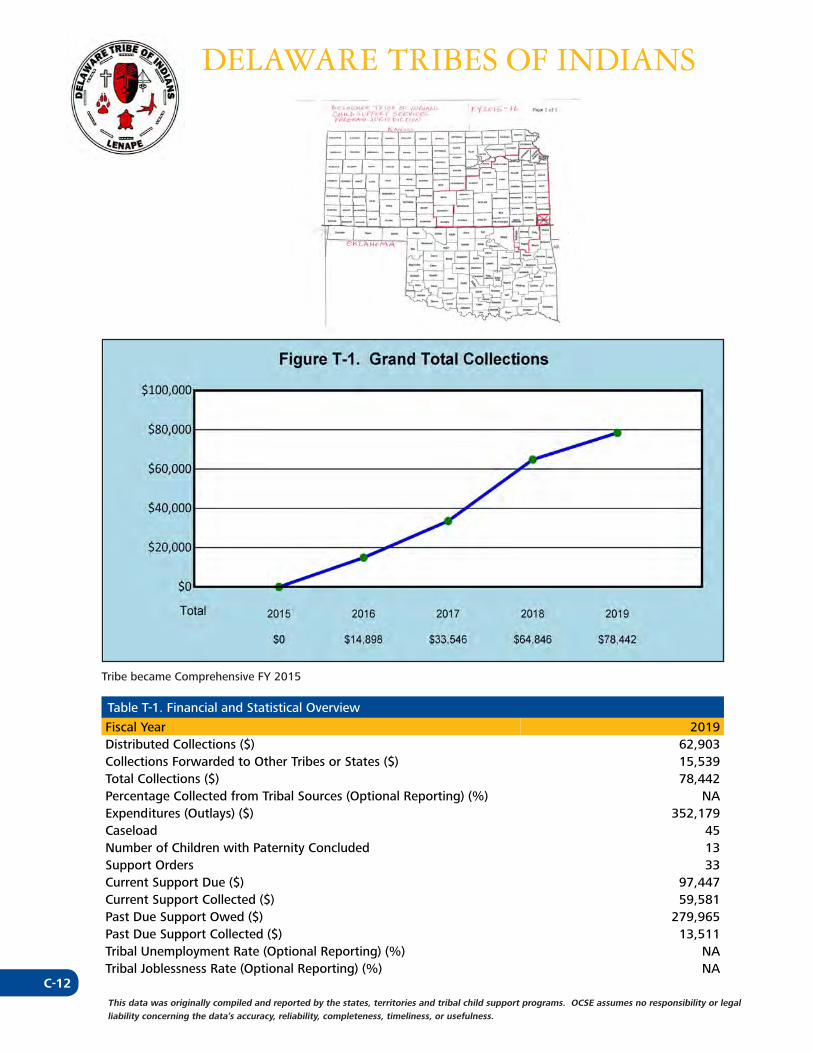
C-12This data was originally compiled and reported by the states, territories and tribal child support programs. OCSE assumes no responsibility or legal liability concerning the data’s accuracy, reliability, completeness, timeliness, or usefulness.
DELAWARE TRIBES OF INDIANS
Tribe became Comprehensive FY 2015
Table T-1. Financial and Statistical Overview
Fiscal Year 2019Distributed Collections ($) 62,903Collections Forwarded to Other Tribes or States ($) 15,539Total Collections ($) 78,442Percentage Collected from Tribal Sources (Optional Reporting) (%) NAExpenditures (Outlays) ($) 352,179Caseload 45Number of Children with Paternity Concluded 13Support Orders 33Current Support Due ($) 97,447Current Support Collected ($) 59,581Past Due Support Owed ($) 279,965Past Due Support Collected ($) 13,511Tribal Unemployment Rate (Optional Reporting) (%) NATribal Joblessness Rate (Optional Reporting) (%) NA
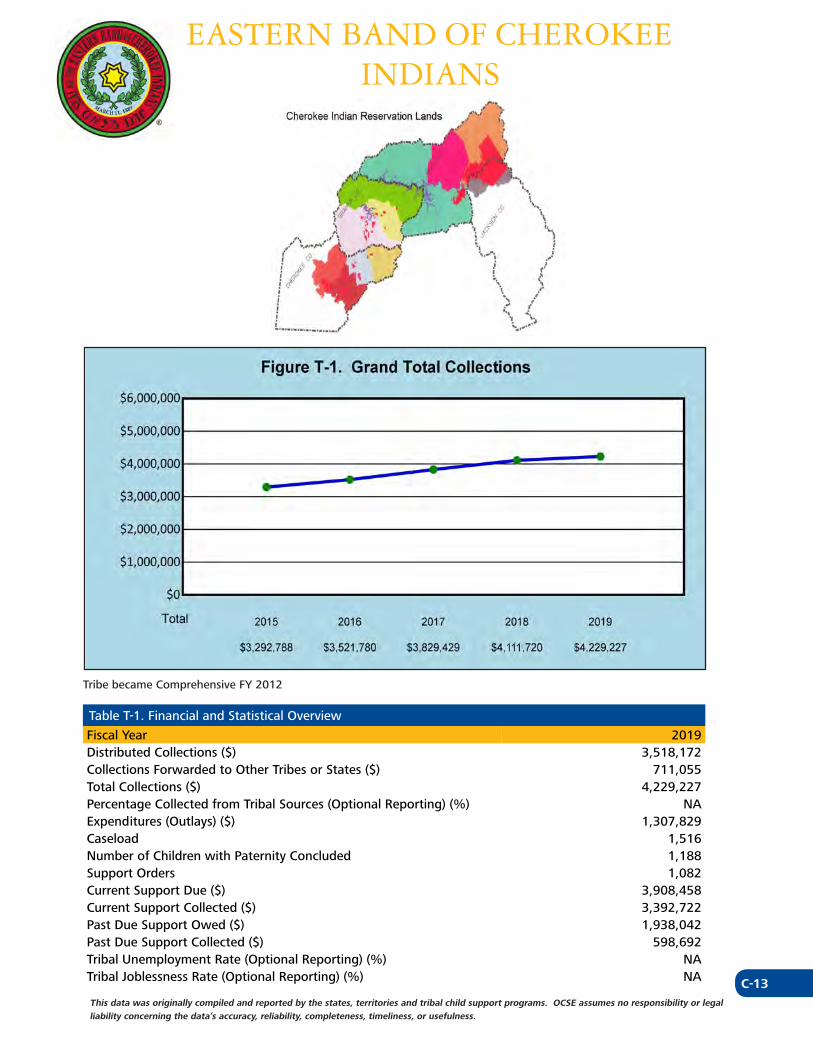
C-13This data was originally compiled and reported by the states, territories and tribal child support programs. OCSE assumes no responsibility or legal liability concerning the data’s accuracy, reliability, completeness, timeliness, or usefulness.
EASTERN BAND OF CHEROKEE INDIANS
Tribe became Comprehensive FY 2012
Table T-1. Financial and Statistical Overview
Fiscal Year 2019Distributed Collections ($) 3,518,172Collections Forwarded to Other Tribes or States ($) 711,055Total Collections ($) 4,229,227Percentage Collected from Tribal Sources (Optional Reporting) (%) NAExpenditures (Outlays) ($) 1,307,829Caseload 1,516Number of Children with Paternity Concluded 1,188Support Orders 1,082Current Support Due ($) 3,908,458Current Support Collected ($) 3,392,722Past Due Support Owed ($) 1,938,042Past Due Support Collected ($) 598,692Tribal Unemployment Rate (Optional Reporting) (%) NATribal Joblessness Rate (Optional Reporting) (%) NA
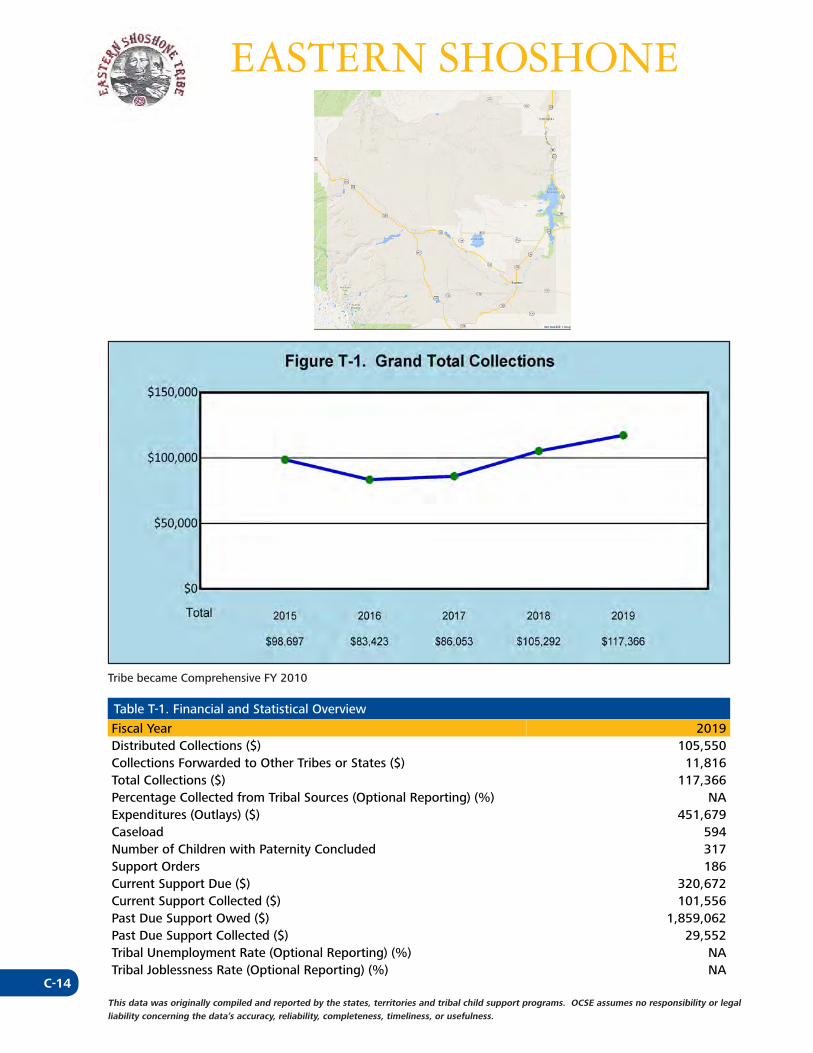
C-14This data was originally compiled and reported by the states, territories and tribal child support programs. OCSE assumes no responsibility or legal liability concerning the data’s accuracy, reliability, completeness, timeliness, or usefulness.
EASTERN SHOSHONE
Tribe became Comprehensive FY 2010
Table T-1. Financial and Statistical Overview
Fiscal Year 2019Distributed Collections ($) 105,550Collections Forwarded to Other Tribes or States ($) 11,816Total Collections ($) 117,366Percentage Collected from Tribal Sources (Optional Reporting) (%) NAExpenditures (Outlays) ($) 451,679Caseload 594Number of Children with Paternity Concluded 317Support Orders 186Current Support Due ($) 320,672Current Support Collected ($) 101,556Past Due Support Owed ($) 1,859,062Past Due Support Collected ($) 29,552Tribal Unemployment Rate (Optional Reporting) (%) NATribal Joblessness Rate (Optional Reporting) (%) NA
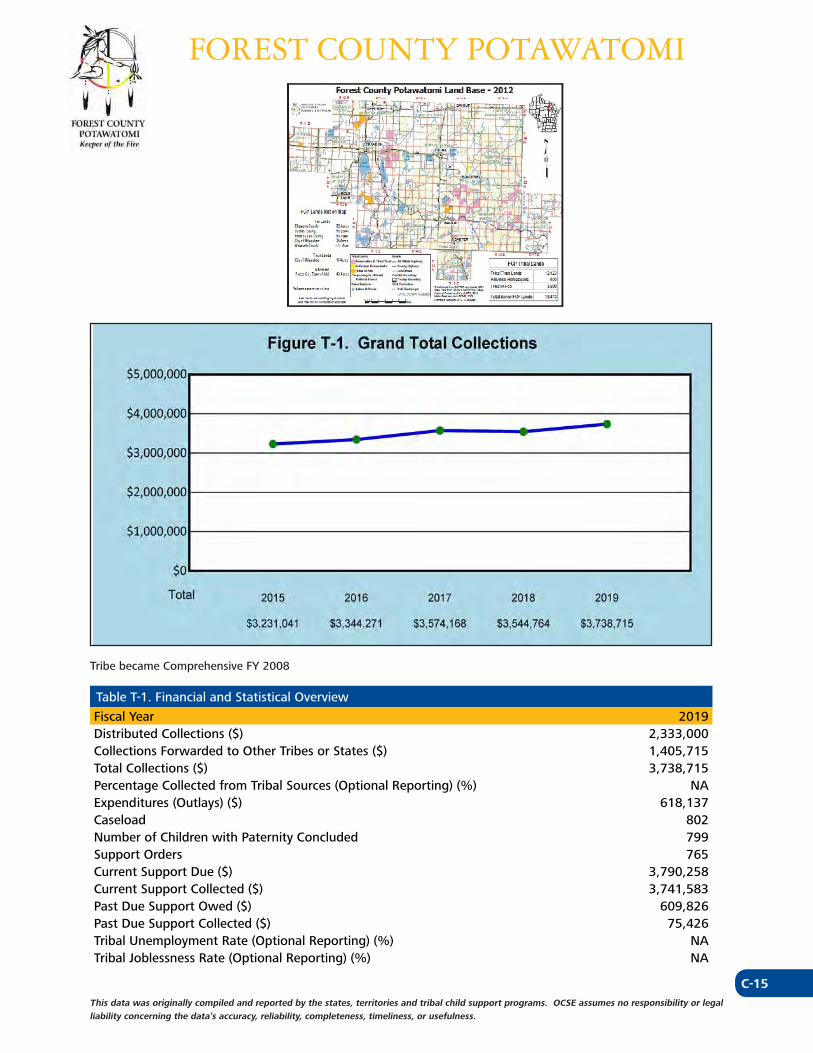
C-15This data was originally compiled and reported by the states, territories and tribal child support programs. OCSE assumes no responsibility or legal liability concerning the data’s accuracy, reliability, completeness, timeliness, or usefulness.
FOREST COUNTY POTAWATOMI
Tribe became Comprehensive FY 2008
Table T-1. Financial and Statistical Overview
Fiscal Year 2019Distributed Collections ($) 2,333,000Collections Forwarded to Other Tribes or States ($) 1,405,715Total Collections ($) 3,738,715Percentage Collected from Tribal Sources (Optional Reporting) (%) NAExpenditures (Outlays) ($) 618,137Caseload 802Number of Children with Paternity Concluded 799Support Orders 765Current Support Due ($) 3,790,258Current Support Collected ($) 3,741,583Past Due Support Owed ($) 609,826Past Due Support Collected ($) 75,426Tribal Unemployment Rate (Optional Reporting) (%) NATribal Joblessness Rate (Optional Reporting) (%) NA
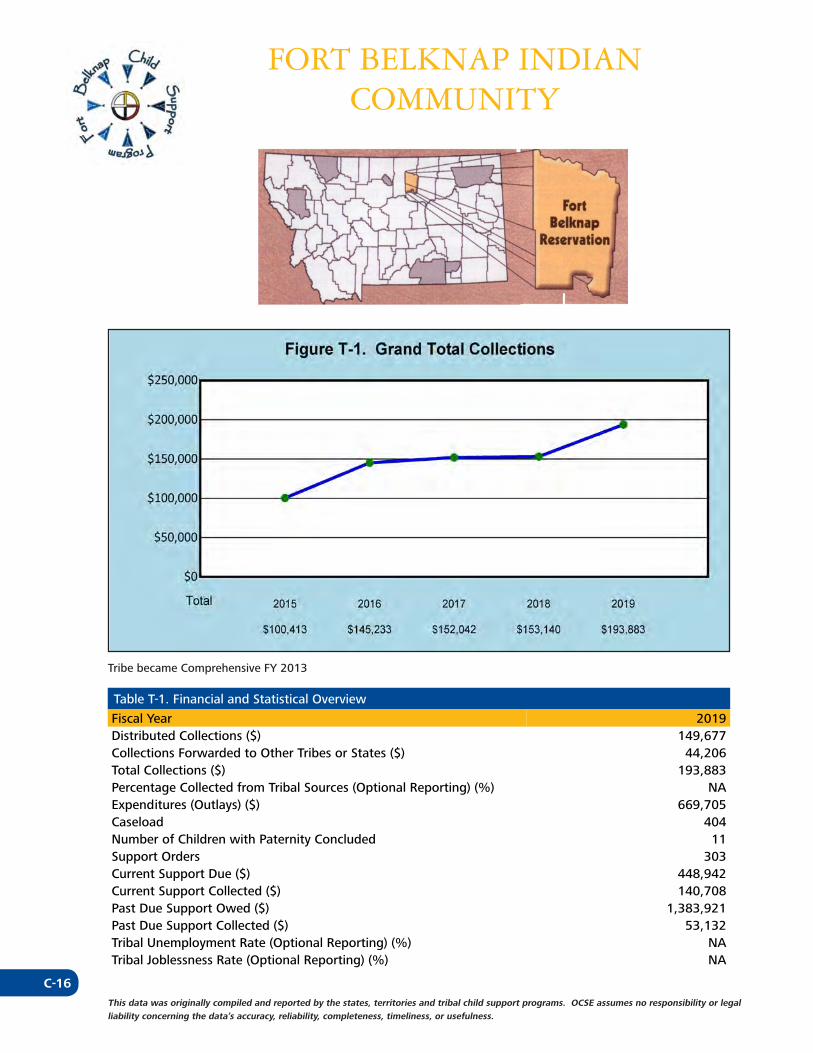
C-16This data was originally compiled and reported by the states, territories and tribal child support programs. OCSE assumes no responsibility or legal liability concerning the data’s accuracy, reliability, completeness, timeliness, or usefulness.
FORT BELKNAP INDIAN COMMUNITY
Tribe became Comprehensive FY 2013
Table T-1. Financial and Statistical Overview
Fiscal Year 2019Distributed Collections ($) 149,677Collections Forwarded to Other Tribes or States ($) 44,206Total Collections ($) 193,883Percentage Collected from Tribal Sources (Optional Reporting) (%) NAExpenditures (Outlays) ($) 669,705Caseload 404Number of Children with Paternity Concluded 11Support Orders 303Current Support Due ($) 448,942Current Support Collected ($) 140,708Past Due Support Owed ($) 1,383,921Past Due Support Collected ($) 53,132Tribal Unemployment Rate (Optional Reporting) (%) NATribal Joblessness Rate (Optional Reporting) (%) NA
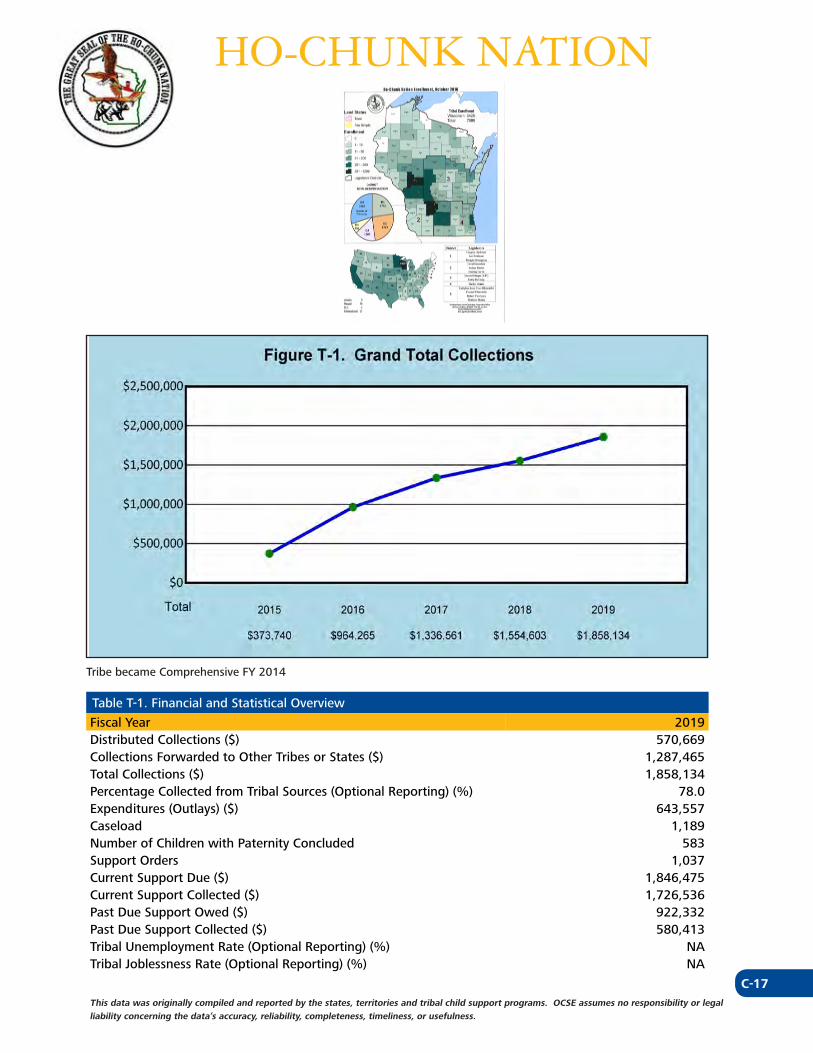
C-17This data was originally compiled and reported by the states, territories and tribal child support programs. OCSE assumes no responsibility or legal liability concerning the data’s accuracy, reliability, completeness, timeliness, or usefulness.
HO-CHUNK NATION
Tribe became Comprehensive FY 2014
Table T-1. Financial and Statistical Overview
Fiscal Year 2019Distributed Collections ($) 570,669Collections Forwarded to Other Tribes or States ($) 1,287,465Total Collections ($) 1,858,134Percentage Collected from Tribal Sources (Optional Reporting) (%) 78.0Expenditures (Outlays) ($) 643,557Caseload 1,189Number of Children with Paternity Concluded 583Support Orders 1,037Current Support Due ($) 1,846,475Current Support Collected ($) 1,726,536Past Due Support Owed ($) 922,332Past Due Support Collected ($) 580,413Tribal Unemployment Rate (Optional Reporting) (%) NATribal Joblessness Rate (Optional Reporting) (%) NA
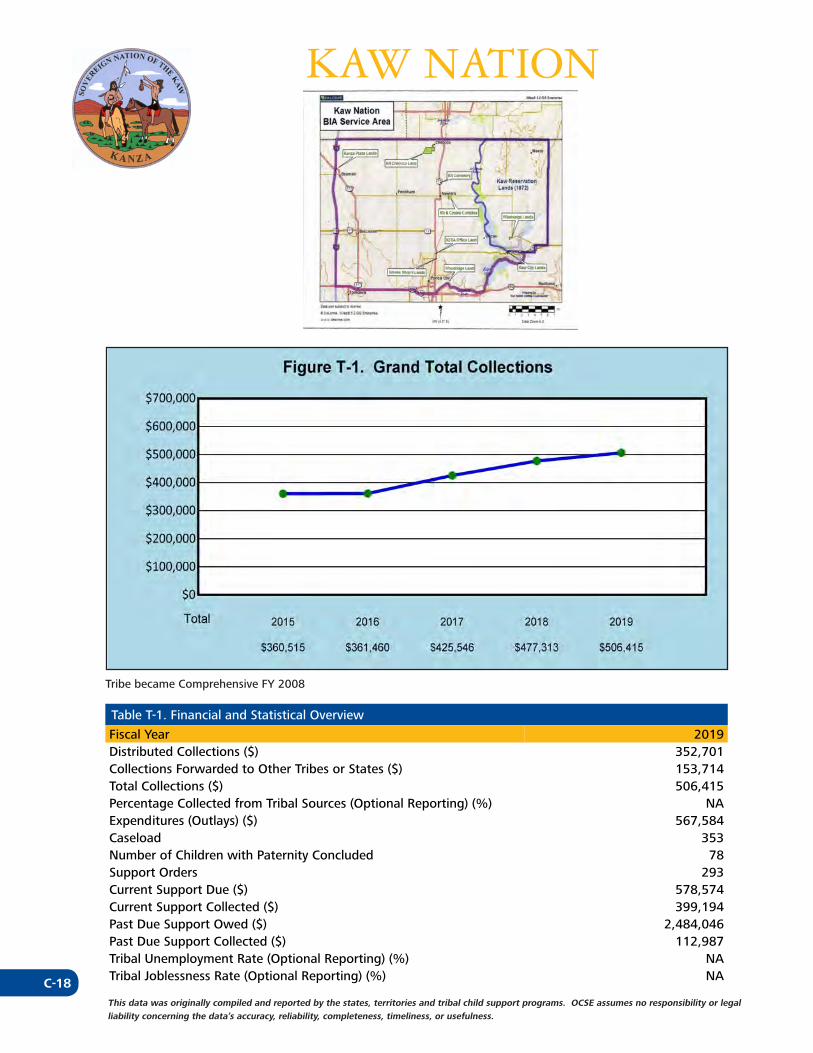
C-18This data was originally compiled and reported by the states, territories and tribal child support programs. OCSE assumes no responsibility or legal liability concerning the data’s accuracy, reliability, completeness, timeliness, or usefulness.
KAW NATION
Tribe became Comprehensive FY 2008
Table T-1. Financial and Statistical Overview
Fiscal Year 2019Distributed Collections ($) 352,701Collections Forwarded to Other Tribes or States ($) 153,714Total Collections ($) 506,415Percentage Collected from Tribal Sources (Optional Reporting) (%) NAExpenditures (Outlays) ($) 567,584Caseload 353Number of Children with Paternity Concluded 78Support Orders 293Current Support Due ($) 578,574Current Support Collected ($) 399,194Past Due Support Owed ($) 2,484,046Past Due Support Collected ($) 112,987Tribal Unemployment Rate (Optional Reporting) (%) NATribal Joblessness Rate (Optional Reporting) (%) NA
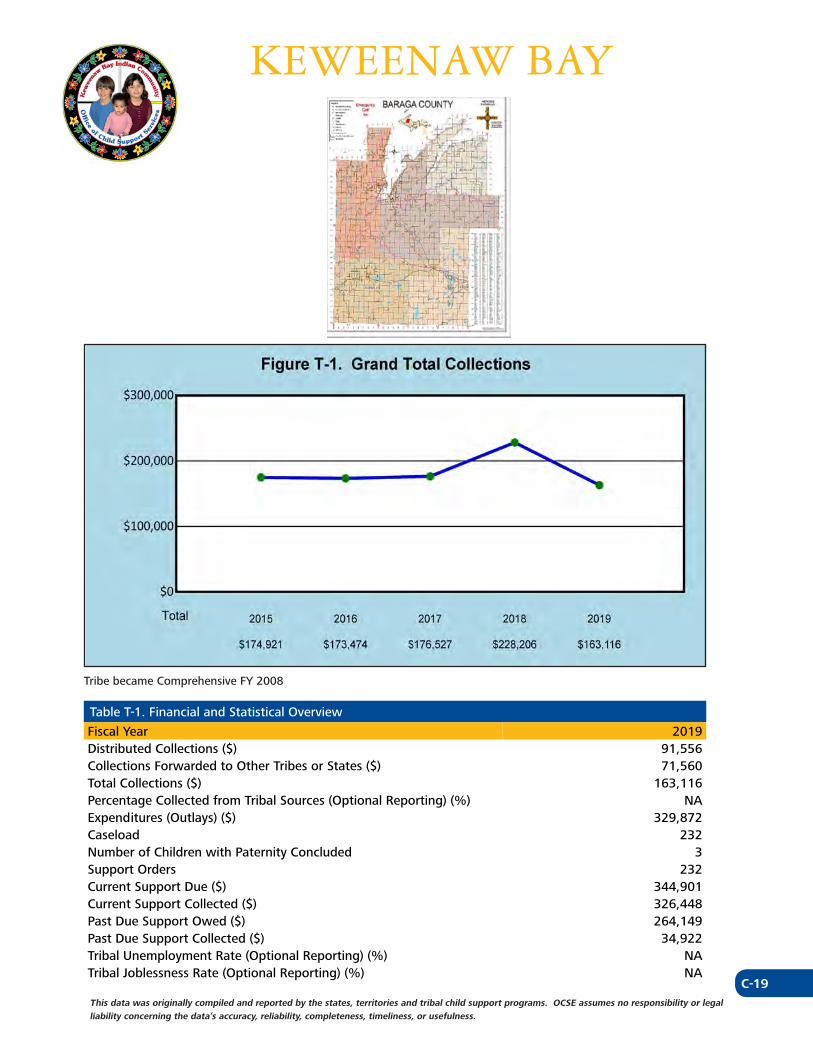
C-19This data was originally compiled and reported by the states, territories and tribal child support programs. OCSE assumes no responsibility or legal liability concerning the data’s accuracy, reliability, completeness, timeliness, or usefulness.
KEWEENAW BAY
Tribe became Comprehensive FY 2008
Table T-1. Financial and Statistical Overview
Fiscal Year 2019Distributed Collections ($) 91,556Collections Forwarded to Other Tribes or States ($) 71,560Total Collections ($) 163,116Percentage Collected from Tribal Sources (Optional Reporting) (%) NAExpenditures (Outlays) ($) 329,872Caseload 232Number of Children with Paternity Concluded 3Support Orders 232Current Support Due ($) 344,901Current Support Collected ($) 326,448Past Due Support Owed ($) 264,149Past Due Support Collected ($) 34,922Tribal Unemployment Rate (Optional Reporting) (%) NATribal Joblessness Rate (Optional Reporting) (%) NA
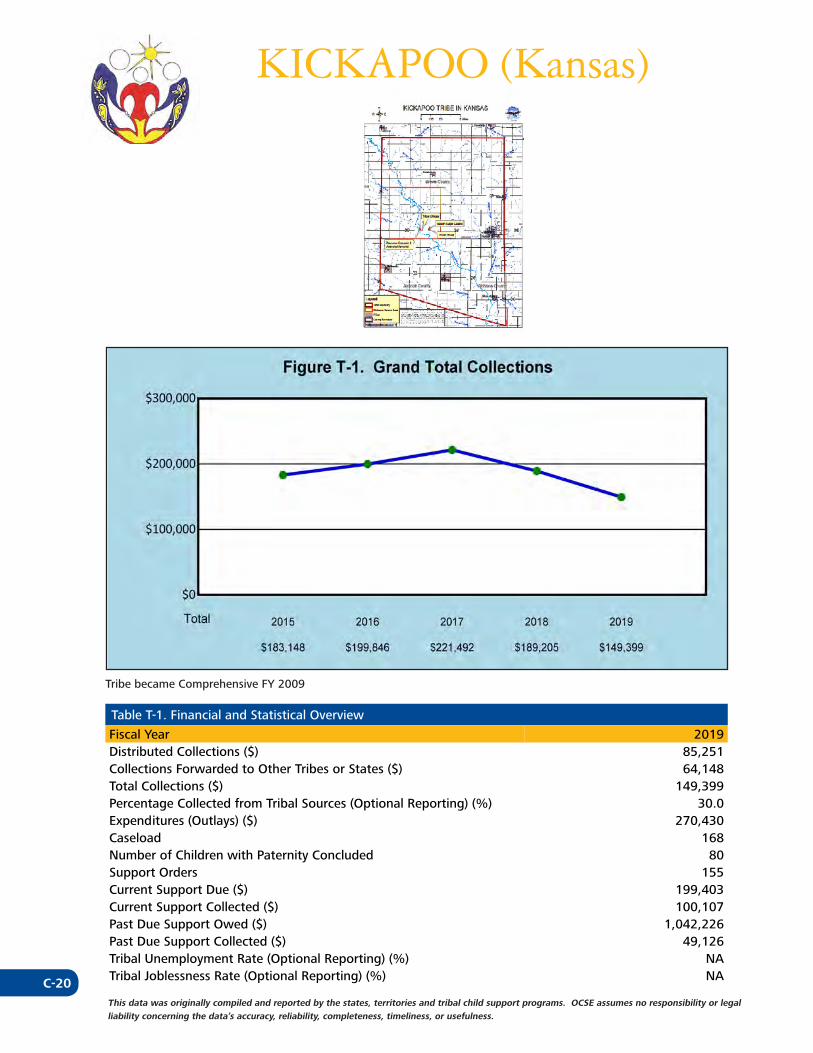
C-20This data was originally compiled and reported by the states, territories and tribal child support programs. OCSE assumes no responsibility or legal liability concerning the data’s accuracy, reliability, completeness, timeliness, or usefulness.
KICKAPOO (Kansas)
Tribe became Comprehensive FY 2009
Table T-1. Financial and Statistical Overview
Fiscal Year 2019Distributed Collections ($) 85,251Collections Forwarded to Other Tribes or States ($) 64,148Total Collections ($) 149,399Percentage Collected from Tribal Sources (Optional Reporting) (%) 30.0Expenditures (Outlays) ($) 270,430Caseload 168Number of Children with Paternity Concluded 80Support Orders 155Current Support Due ($) 199,403Current Support Collected ($) 100,107Past Due Support Owed ($) 1,042,226Past Due Support Collected ($) 49,126Tribal Unemployment Rate (Optional Reporting) (%) NATribal Joblessness Rate (Optional Reporting) (%) NA
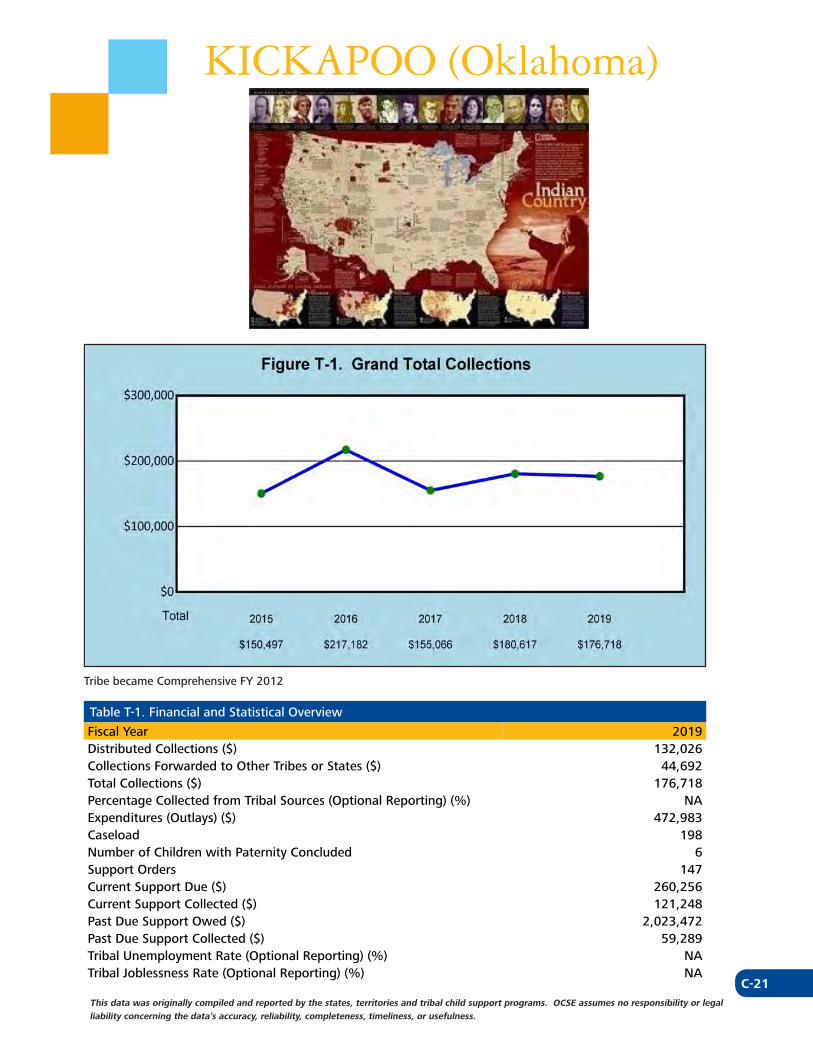
C-21This data was originally compiled and reported by the states, territories and tribal child support programs. OCSE assumes no responsibility or legal liability concerning the data’s accuracy, reliability, completeness, timeliness, or usefulness.
KICKAPOO (Oklahoma)
Tribe became Comprehensive FY 2012
Table T-1. Financial and Statistical Overview
Fiscal Year 2019Distributed Collections ($) 132,026Collections Forwarded to Other Tribes or States ($) 44,692Total Collections ($) 176,718Percentage Collected from Tribal Sources (Optional Reporting) (%) NAExpenditures (Outlays) ($) 472,983Caseload 198Number of Children with Paternity Concluded 6Support Orders 147Current Support Due ($) 260,256Current Support Collected ($) 121,248Past Due Support Owed ($) 2,023,472Past Due Support Collected ($) 59,289Tribal Unemployment Rate (Optional Reporting) (%) NATribal Joblessness Rate (Optional Reporting) (%) NA
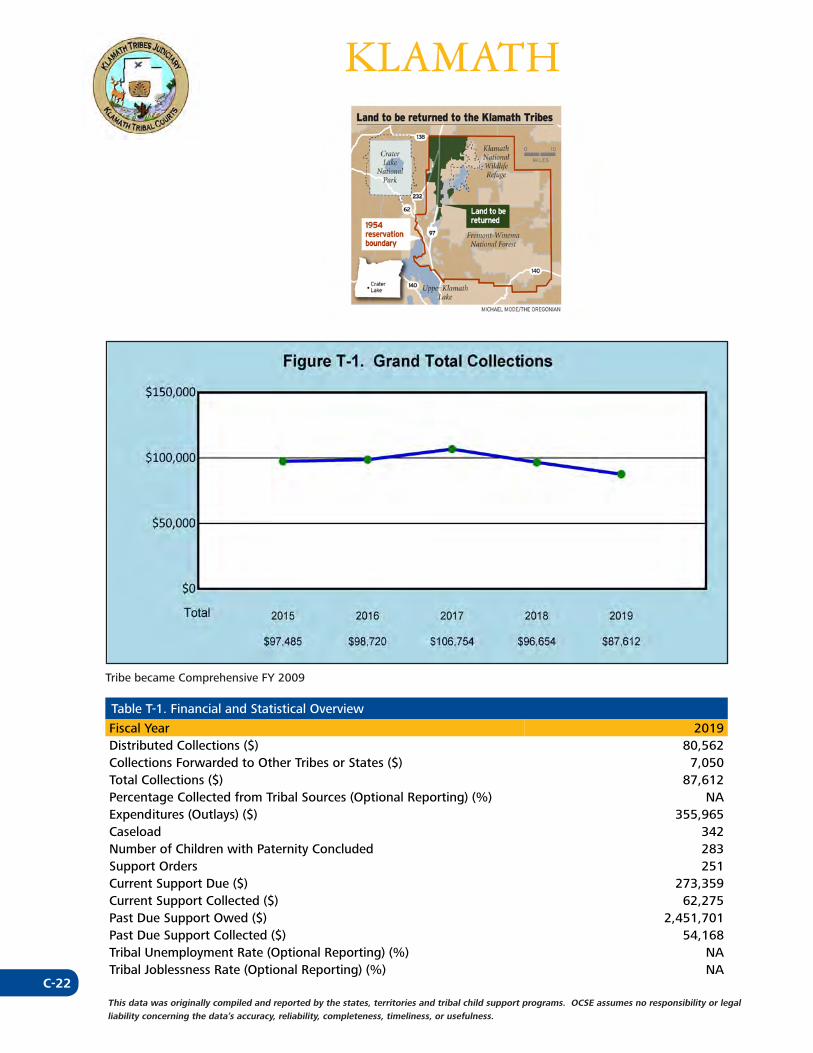
C-22This data was originally compiled and reported by the states, territories and tribal child support programs. OCSE assumes no responsibility or legal liability concerning the data’s accuracy, reliability, completeness, timeliness, or usefulness.
KLAMATH
Tribe became Comprehensive FY 2009
Table T-1. Financial and Statistical Overview
Fiscal Year 2019Distributed Collections ($) 80,562Collections Forwarded to Other Tribes or States ($) 7,050Total Collections ($) 87,612Percentage Collected from Tribal Sources (Optional Reporting) (%) NAExpenditures (Outlays) ($) 355,965Caseload 342Number of Children with Paternity Concluded 283Support Orders 251Current Support Due ($) 273,359Current Support Collected ($) 62,275Past Due Support Owed ($) 2,451,701Past Due Support Collected ($) 54,168Tribal Unemployment Rate (Optional Reporting) (%) NATribal Joblessness Rate (Optional Reporting) (%) NA
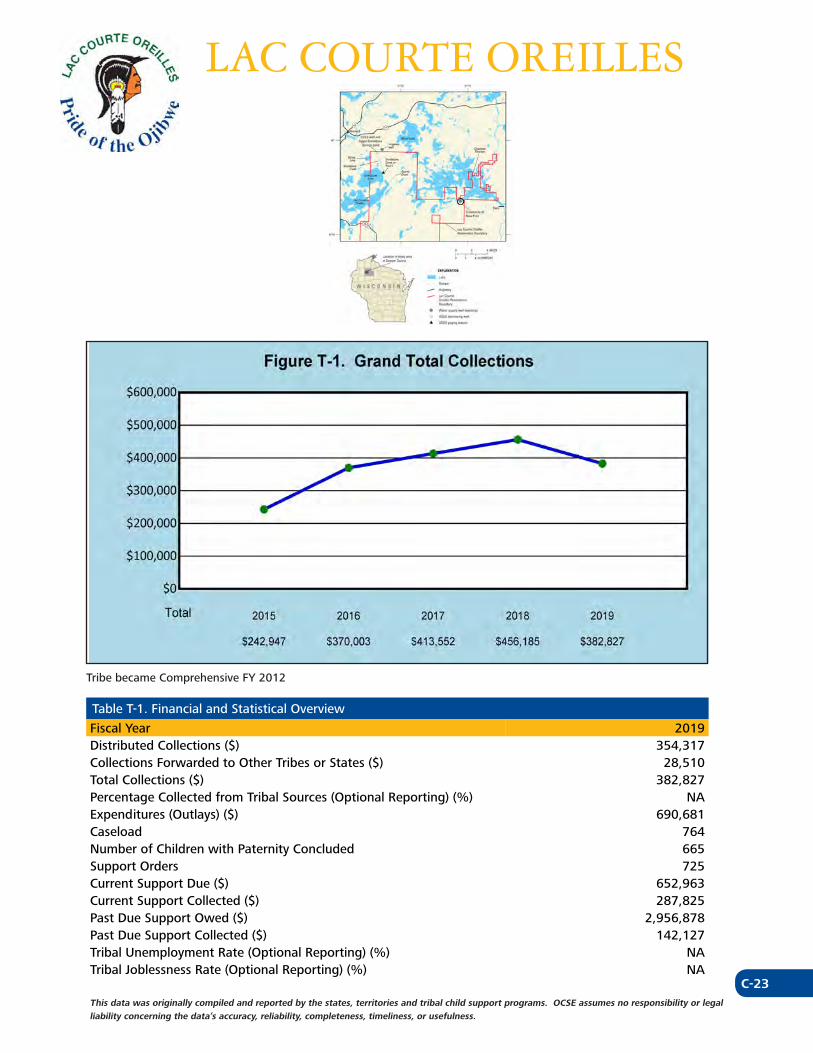
C-23This data was originally compiled and reported by the states, territories and tribal child support programs. OCSE assumes no responsibility or legal liability concerning the data’s accuracy, reliability, completeness, timeliness, or usefulness.
LAC COURTE OREILLES
Tribe became Comprehensive FY 2012
Table T-1. Financial and Statistical Overview
Fiscal Year 2019Distributed Collections ($) 354,317Collections Forwarded to Other Tribes or States ($) 28,510Total Collections ($) 382,827Percentage Collected from Tribal Sources (Optional Reporting) (%) NAExpenditures (Outlays) ($) 690,681Caseload 764Number of Children with Paternity Concluded 665Support Orders 725Current Support Due ($) 652,963Current Support Collected ($) 287,825Past Due Support Owed ($) 2,956,878Past Due Support Collected ($) 142,127Tribal Unemployment Rate (Optional Reporting) (%) NATribal Joblessness Rate (Optional Reporting) (%) NA
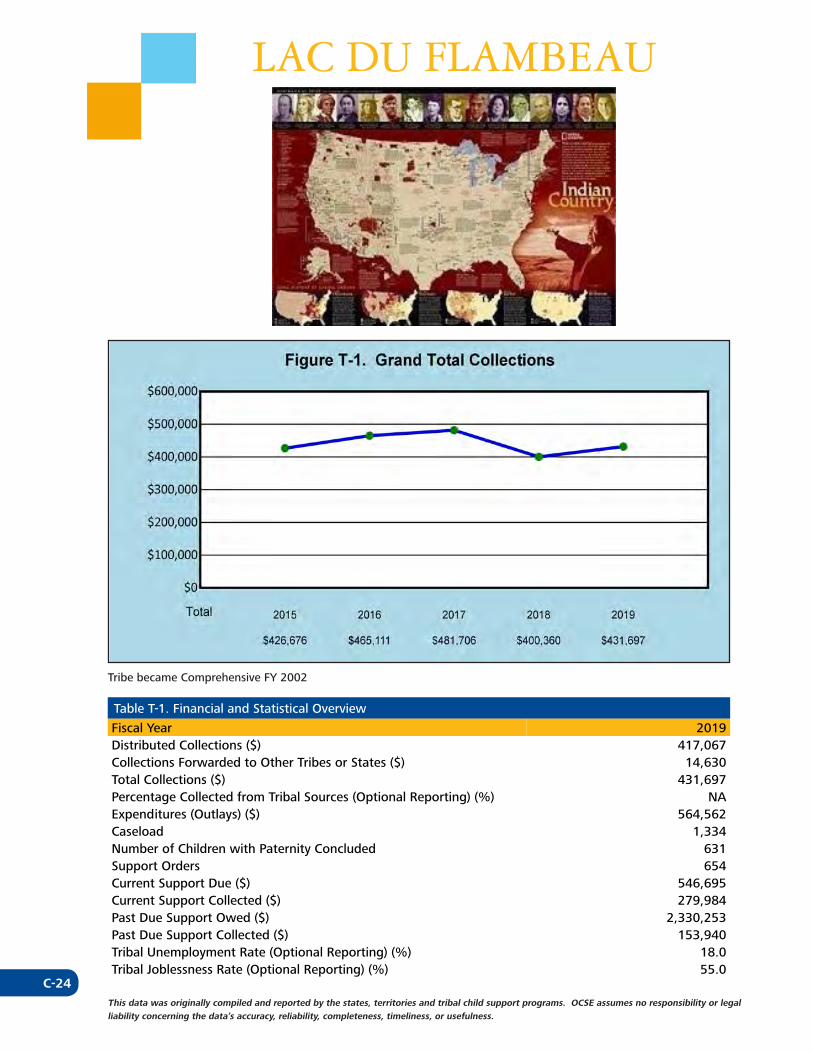
C-24This data was originally compiled and reported by the states, territories and tribal child support programs. OCSE assumes no responsibility or legal liability concerning the data’s accuracy, reliability, completeness, timeliness, or usefulness.
LAC DU FLAMBEAU
Tribe became Comprehensive FY 2002
Table T-1. Financial and Statistical Overview
Fiscal Year 2019Distributed Collections ($) 417,067Collections Forwarded to Other Tribes or States ($) 14,630Total Collections ($) 431,697Percentage Collected from Tribal Sources (Optional Reporting) (%) NAExpenditures (Outlays) ($) 564,562Caseload 1,334Number of Children with Paternity Concluded 631Support Orders 654Current Support Due ($) 546,695Current Support Collected ($) 279,984Past Due Support Owed ($) 2,330,253Past Due Support Collected ($) 153,940Tribal Unemployment Rate (Optional Reporting) (%) 18.0Tribal Joblessness Rate (Optional Reporting) (%) 55.0
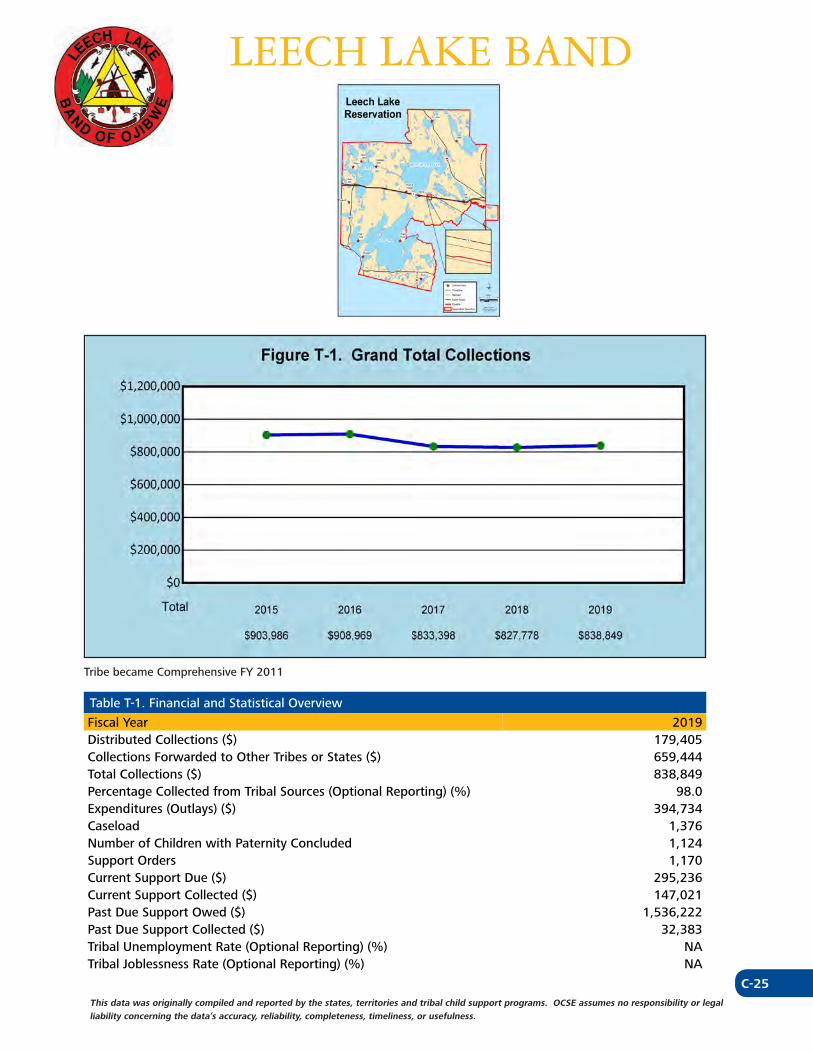
C-25This data was originally compiled and reported by the states, territories and tribal child support programs. OCSE assumes no responsibility or legal liability concerning the data’s accuracy, reliability, completeness, timeliness, or usefulness.
LEECH LAKE BAND
Tribe became Comprehensive FY 2011
Table T-1. Financial and Statistical Overview
Fiscal Year 2019Distributed Collections ($) 179,405Collections Forwarded to Other Tribes or States ($) 659,444Total Collections ($) 838,849Percentage Collected from Tribal Sources (Optional Reporting) (%) 98.0Expenditures (Outlays) ($) 394,734Caseload 1,376Number of Children with Paternity Concluded 1,124Support Orders 1,170Current Support Due ($) 295,236Current Support Collected ($) 147,021Past Due Support Owed ($) 1,536,222Past Due Support Collected ($) 32,383Tribal Unemployment Rate (Optional Reporting) (%) NATribal Joblessness Rate (Optional Reporting) (%) NA
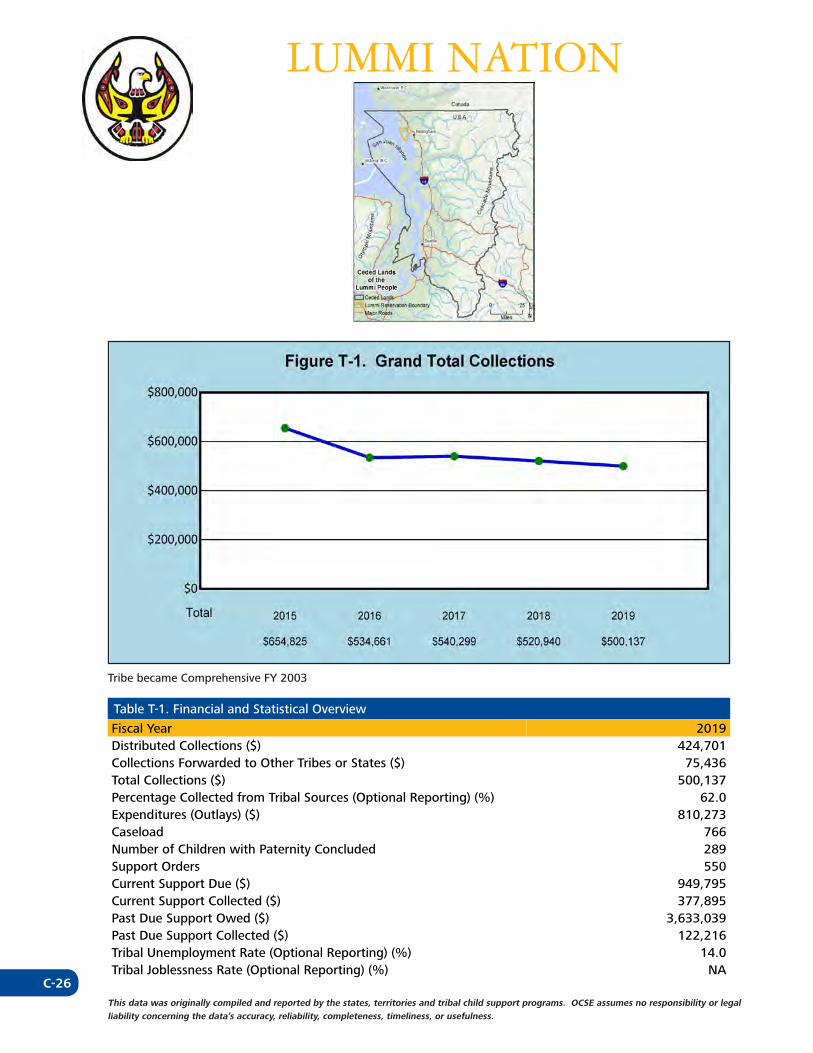
C-26This data was originally compiled and reported by the states, territories and tribal child support programs. OCSE assumes no responsibility or legal liability concerning the data’s accuracy, reliability, completeness, timeliness, or usefulness.
LUMMI NATION
Tribe became Comprehensive FY 2003
Table T-1. Financial and Statistical Overview
Fiscal Year 2019Distributed Collections ($) 424,701Collections Forwarded to Other Tribes or States ($) 75,436Total Collections ($) 500,137Percentage Collected from Tribal Sources (Optional Reporting) (%) 62.0Expenditures (Outlays) ($) 810,273Caseload 766Number of Children with Paternity Concluded 289Support Orders 550Current Support Due ($) 949,795Current Support Collected ($) 377,895Past Due Support Owed ($) 3,633,039Past Due Support Collected ($) 122,216Tribal Unemployment Rate (Optional Reporting) (%) 14.0Tribal Joblessness Rate (Optional Reporting) (%) NA
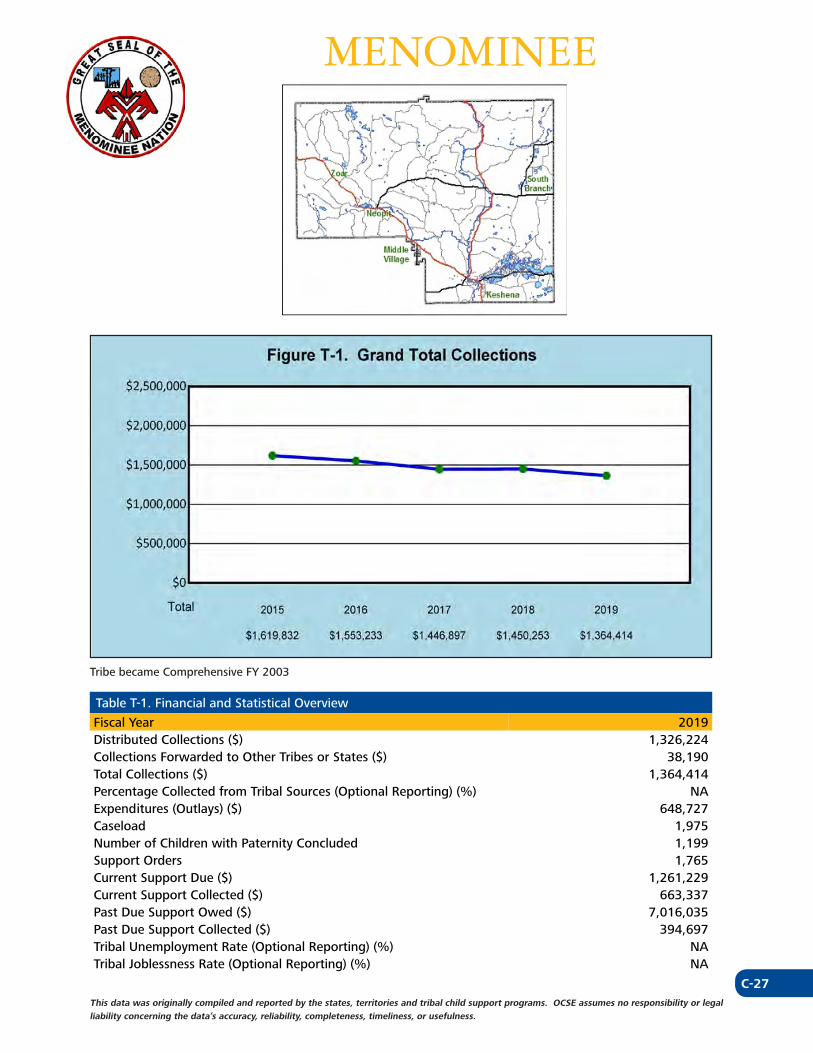
C-27This data was originally compiled and reported by the states, territories and tribal child support programs. OCSE assumes no responsibility or legal liability concerning the data’s accuracy, reliability, completeness, timeliness, or usefulness.
MENOMINEE
Tribe became Comprehensive FY 2003
Table T-1. Financial and Statistical Overview
Fiscal Year 2019Distributed Collections ($) 1,326,224Collections Forwarded to Other Tribes or States ($) 38,190Total Collections ($) 1,364,414Percentage Collected from Tribal Sources (Optional Reporting) (%) NAExpenditures (Outlays) ($) 648,727Caseload 1,975Number of Children with Paternity Concluded 1,199Support Orders 1,765Current Support Due ($) 1,261,229Current Support Collected ($) 663,337Past Due Support Owed ($) 7,016,035Past Due Support Collected ($) 394,697Tribal Unemployment Rate (Optional Reporting) (%) NATribal Joblessness Rate (Optional Reporting) (%) NA
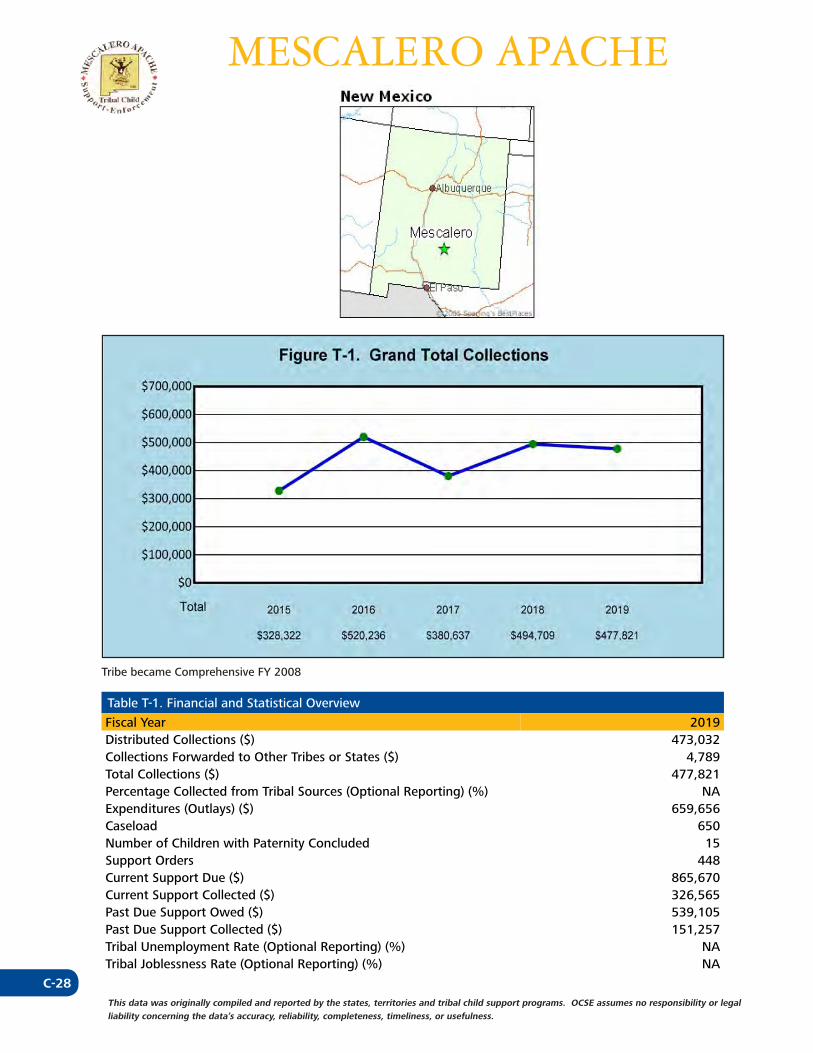
C-28This data was originally compiled and reported by the states, territories and tribal child support programs. OCSE assumes no responsibility or legal liability concerning the data’s accuracy, reliability, completeness, timeliness, or usefulness.
MESCALERO APACHE
Tribe became Comprehensive FY 2008
Table T-1. Financial and Statistical Overview
Fiscal Year 2019Distributed Collections ($) 473,032Collections Forwarded to Other Tribes or States ($) 4,789Total Collections ($) 477,821Percentage Collected from Tribal Sources (Optional Reporting) (%) NAExpenditures (Outlays) ($) 659,656Caseload 650Number of Children with Paternity Concluded 15Support Orders 448Current Support Due ($) 865,670Current Support Collected ($) 326,565Past Due Support Owed ($) 539,105Past Due Support Collected ($) 151,257Tribal Unemployment Rate (Optional Reporting) (%) NATribal Joblessness Rate (Optional Reporting) (%) NA
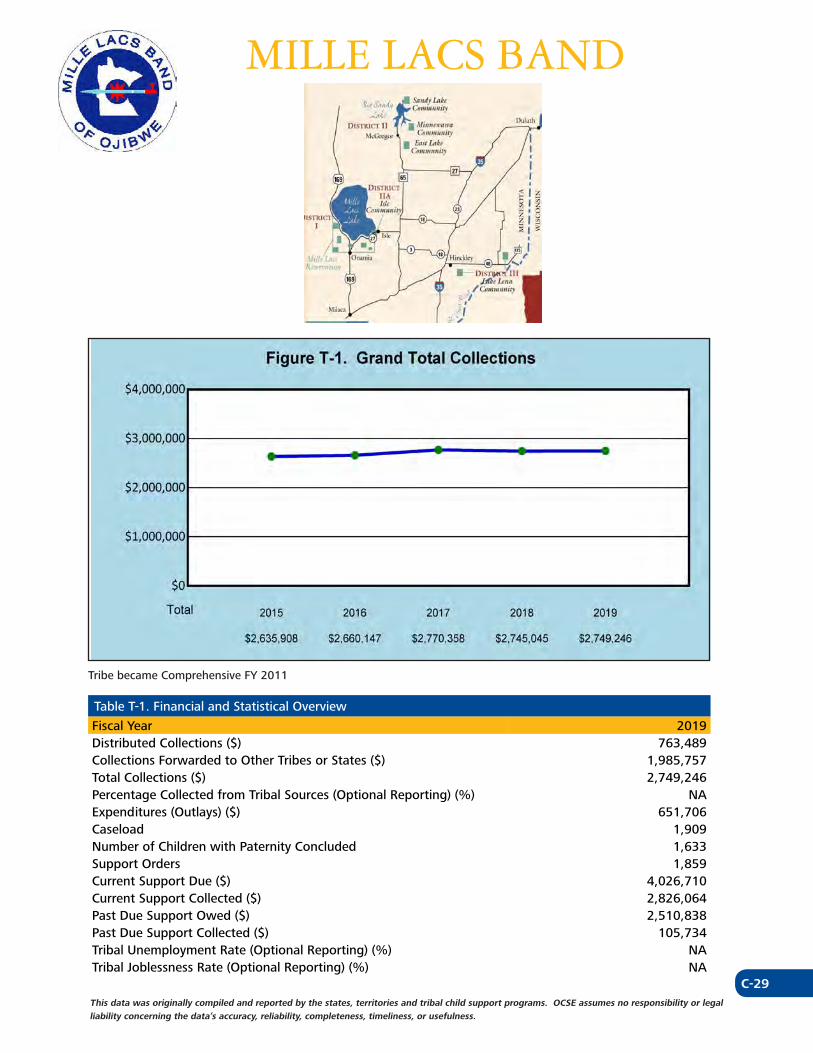
C-29This data was originally compiled and reported by the states, territories and tribal child support programs. OCSE assumes no responsibility or legal liability concerning the data’s accuracy, reliability, completeness, timeliness, or usefulness.
MILLE LACS BAND
Tribe became Comprehensive FY 2011
Table T-1. Financial and Statistical Overview
Fiscal Year 2019Distributed Collections ($) 763,489Collections Forwarded to Other Tribes or States ($) 1,985,757Total Collections ($) 2,749,246Percentage Collected from Tribal Sources (Optional Reporting) (%) NAExpenditures (Outlays) ($) 651,706Caseload 1,909Number of Children with Paternity Concluded 1,633Support Orders 1,859Current Support Due ($) 4,026,710Current Support Collected ($) 2,826,064Past Due Support Owed ($) 2,510,838Past Due Support Collected ($) 105,734Tribal Unemployment Rate (Optional Reporting) (%) NATribal Joblessness Rate (Optional Reporting) (%) NA
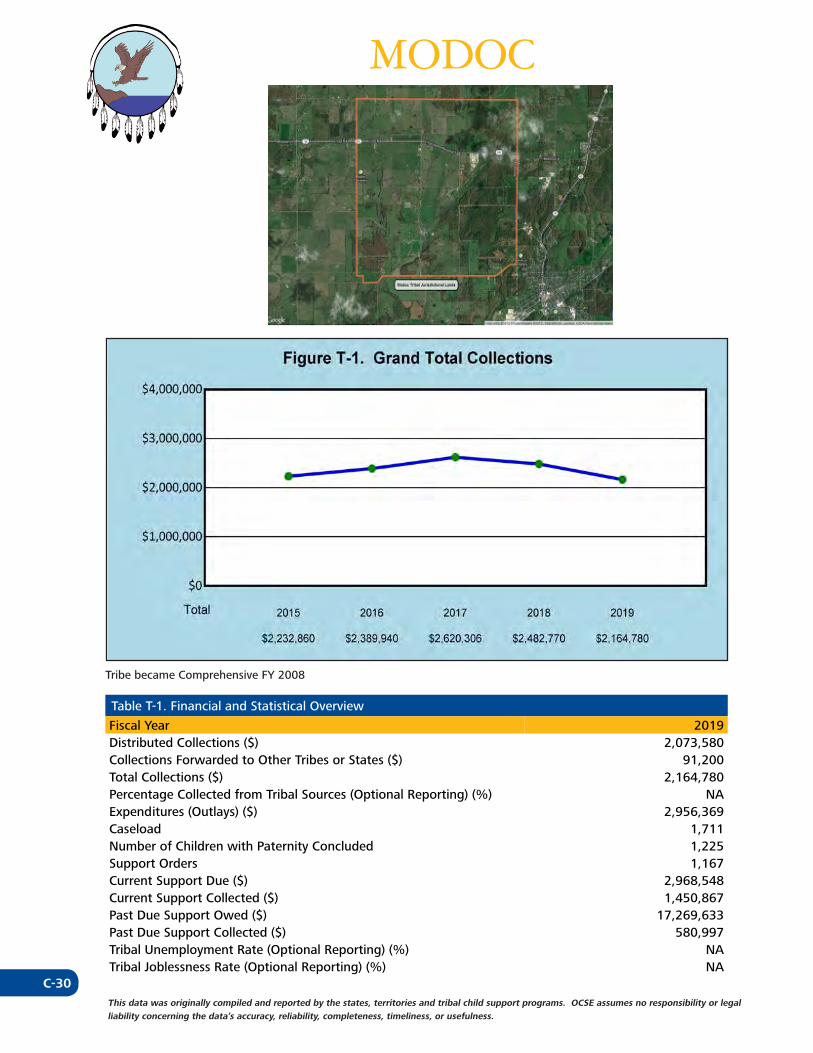
C-30This data was originally compiled and reported by the states, territories and tribal child support programs. OCSE assumes no responsibility or legal liability concerning the data’s accuracy, reliability, completeness, timeliness, or usefulness.
MODOC
Tribe became Comprehensive FY 2008
Table T-1. Financial and Statistical Overview
Fiscal Year 2019Distributed Collections ($) 2,073,580Collections Forwarded to Other Tribes or States ($) 91,200Total Collections ($) 2,164,780Percentage Collected from Tribal Sources (Optional Reporting) (%) NAExpenditures (Outlays) ($) 2,956,369Caseload 1,711Number of Children with Paternity Concluded 1,225Support Orders 1,167Current Support Due ($) 2,968,548Current Support Collected ($) 1,450,867Past Due Support Owed ($) 17,269,633Past Due Support Collected ($) 580,997Tribal Unemployment Rate (Optional Reporting) (%) NATribal Joblessness Rate (Optional Reporting) (%) NA
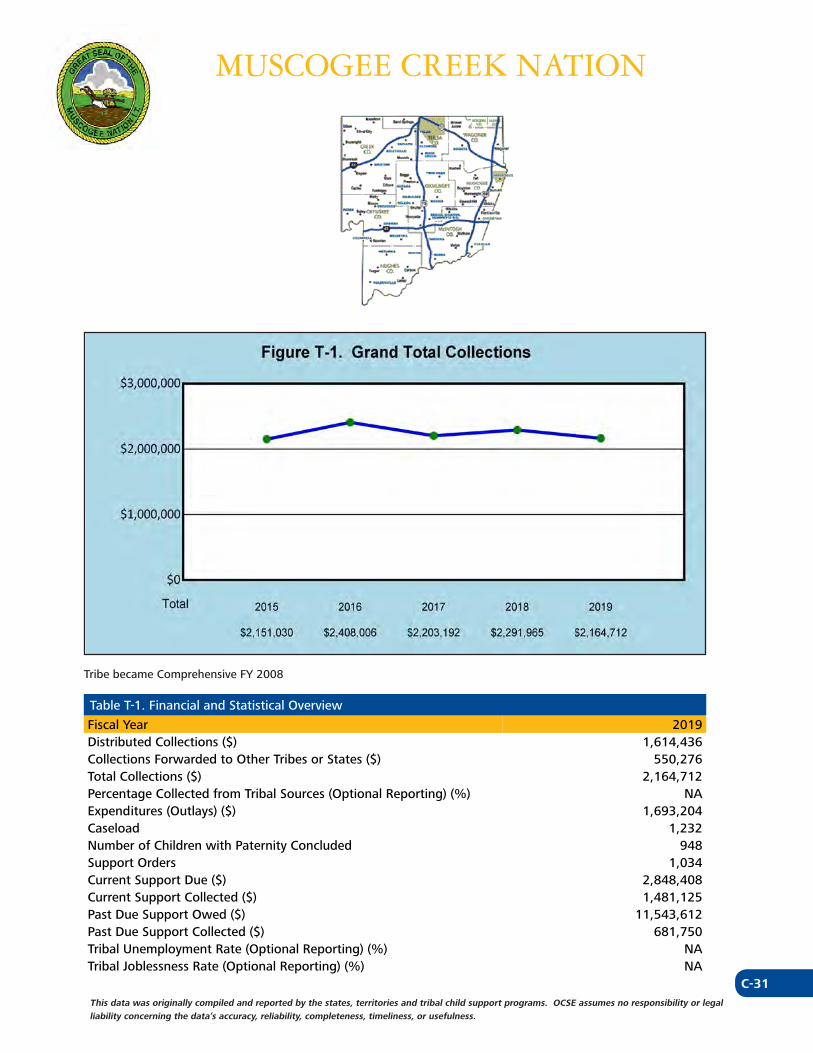
C-31This data was originally compiled and reported by the states, territories and tribal child support programs. OCSE assumes no responsibility or legal liability concerning the data’s accuracy, reliability, completeness, timeliness, or usefulness.
MUSCOGEE CREEK NATION
Tribe became Comprehensive FY 2008
Table T-1. Financial and Statistical Overview
Fiscal Year 2019Distributed Collections ($) 1,614,436Collections Forwarded to Other Tribes or States ($) 550,276Total Collections ($) 2,164,712Percentage Collected from Tribal Sources (Optional Reporting) (%) NAExpenditures (Outlays) ($) 1,693,204Caseload 1,232Number of Children with Paternity Concluded 948Support Orders 1,034Current Support Due ($) 2,848,408Current Support Collected ($) 1,481,125Past Due Support Owed ($) 11,543,612Past Due Support Collected ($) 681,750Tribal Unemployment Rate (Optional Reporting) (%) NATribal Joblessness Rate (Optional Reporting) (%) NA
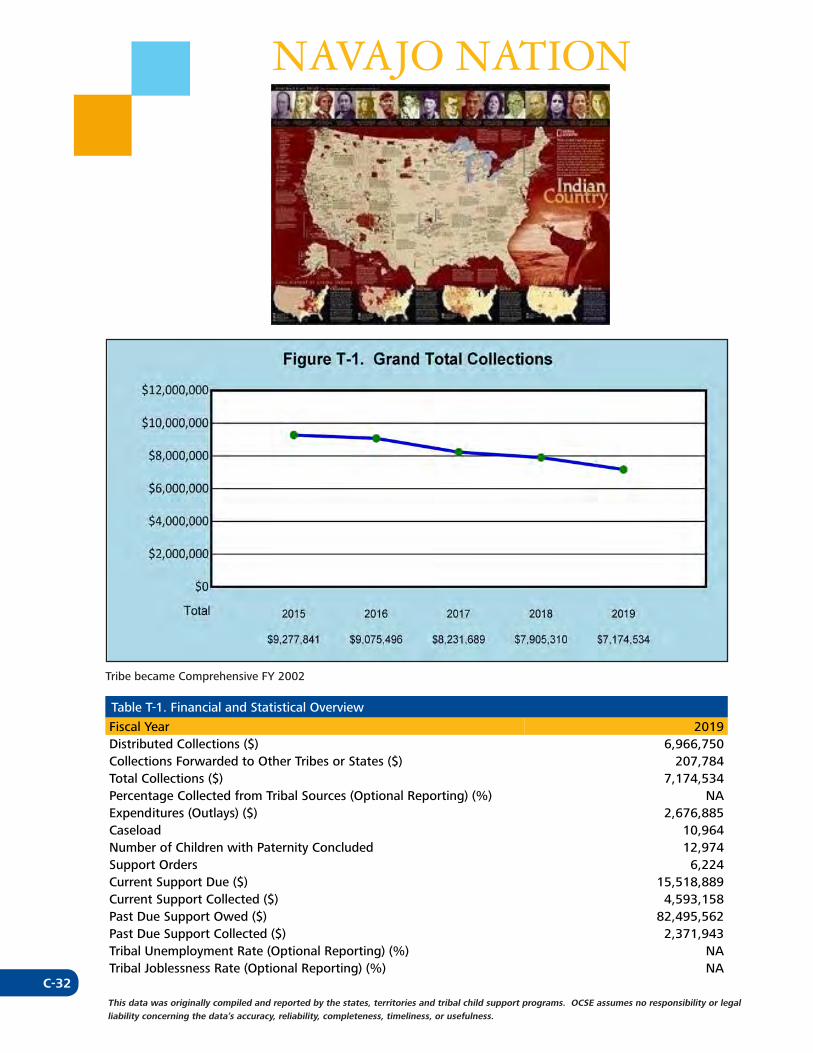
C-32This data was originally compiled and reported by the states, territories and tribal child support programs. OCSE assumes no responsibility or legal liability concerning the data’s accuracy, reliability, completeness, timeliness, or usefulness.
NAVAJO NATION
Tribe became Comprehensive FY 2002
Table T-1. Financial and Statistical Overview
Fiscal Year 2019Distributed Collections ($) 6,966,750Collections Forwarded to Other Tribes or States ($) 207,784Total Collections ($) 7,174,534Percentage Collected from Tribal Sources (Optional Reporting) (%) NAExpenditures (Outlays) ($) 2,676,885Caseload 10,964Number of Children with Paternity Concluded 12,974Support Orders 6,224Current Support Due ($) 15,518,889Current Support Collected ($) 4,593,158Past Due Support Owed ($) 82,495,562Past Due Support Collected ($) 2,371,943Tribal Unemployment Rate (Optional Reporting) (%) NATribal Joblessness Rate (Optional Reporting) (%) NA
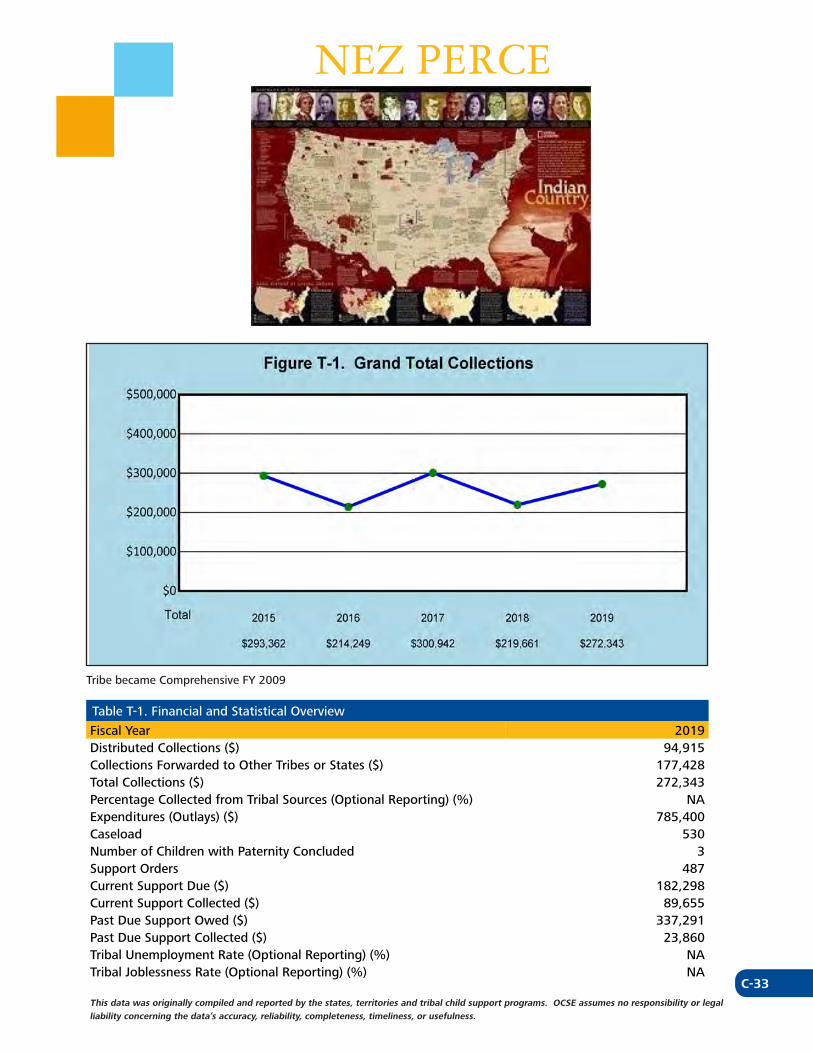
C-33This data was originally compiled and reported by the states, territories and tribal child support programs. OCSE assumes no responsibility or legal liability concerning the data’s accuracy, reliability, completeness, timeliness, or usefulness.
NEZ PERCE
Tribe became Comprehensive FY 2009
Table T-1. Financial and Statistical Overview
Fiscal Year 2019Distributed Collections ($) 94,915Collections Forwarded to Other Tribes or States ($) 177,428Total Collections ($) 272,343Percentage Collected from Tribal Sources (Optional Reporting) (%) NAExpenditures (Outlays) ($) 785,400Caseload 530Number of Children with Paternity Concluded 3Support Orders 487Current Support Due ($) 182,298Current Support Collected ($) 89,655Past Due Support Owed ($) 337,291Past Due Support Collected ($) 23,860Tribal Unemployment Rate (Optional Reporting) (%) NATribal Joblessness Rate (Optional Reporting) (%) NA
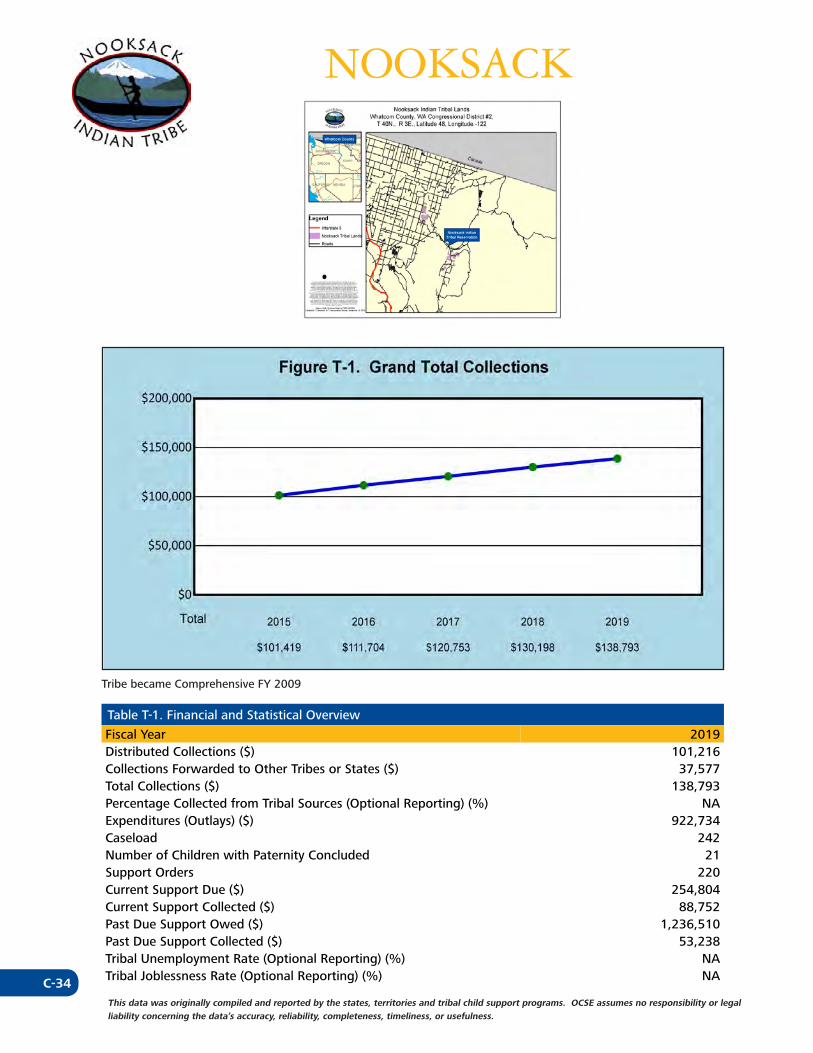
C-34This data was originally compiled and reported by the states, territories and tribal child support programs. OCSE assumes no responsibility or legal liability concerning the data’s accuracy, reliability, completeness, timeliness, or usefulness.
NOOKSACK
Tribe became Comprehensive FY 2009
Table T-1. Financial and Statistical Overview
Fiscal Year 2019Distributed Collections ($) 101,216Collections Forwarded to Other Tribes or States ($) 37,577Total Collections ($) 138,793Percentage Collected from Tribal Sources (Optional Reporting) (%) NAExpenditures (Outlays) ($) 922,734Caseload 242Number of Children with Paternity Concluded 21Support Orders 220Current Support Due ($) 254,804Current Support Collected ($) 88,752Past Due Support Owed ($) 1,236,510Past Due Support Collected ($) 53,238Tribal Unemployment Rate (Optional Reporting) (%) NATribal Joblessness Rate (Optional Reporting) (%) NA
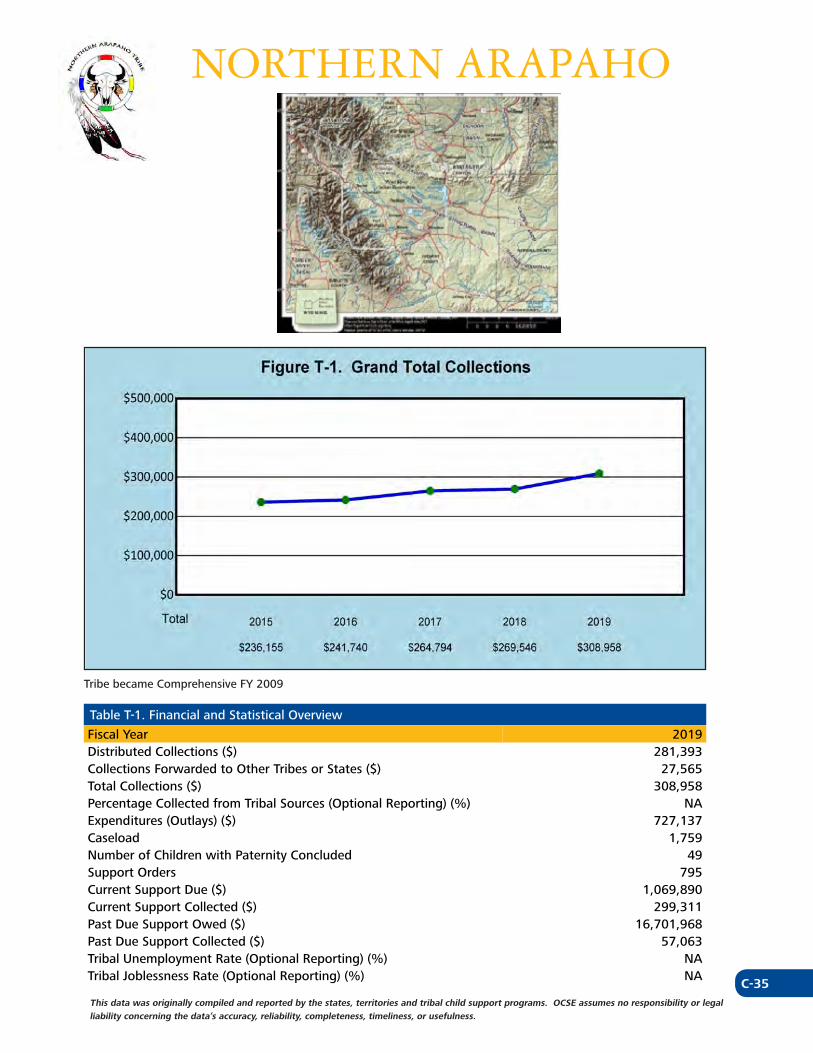
C-35This data was originally compiled and reported by the states, territories and tribal child support programs. OCSE assumes no responsibility or legal liability concerning the data’s accuracy, reliability, completeness, timeliness, or usefulness.
NORTHERN ARAPAHO
Tribe became Comprehensive FY 2009
Table T-1. Financial and Statistical Overview
Fiscal Year 2019Distributed Collections ($) 281,393Collections Forwarded to Other Tribes or States ($) 27,565Total Collections ($) 308,958Percentage Collected from Tribal Sources (Optional Reporting) (%) NAExpenditures (Outlays) ($) 727,137Caseload 1,759Number of Children with Paternity Concluded 49Support Orders 795Current Support Due ($) 1,069,890Current Support Collected ($) 299,311Past Due Support Owed ($) 16,701,968Past Due Support Collected ($) 57,063Tribal Unemployment Rate (Optional Reporting) (%) NATribal Joblessness Rate (Optional Reporting) (%) NA
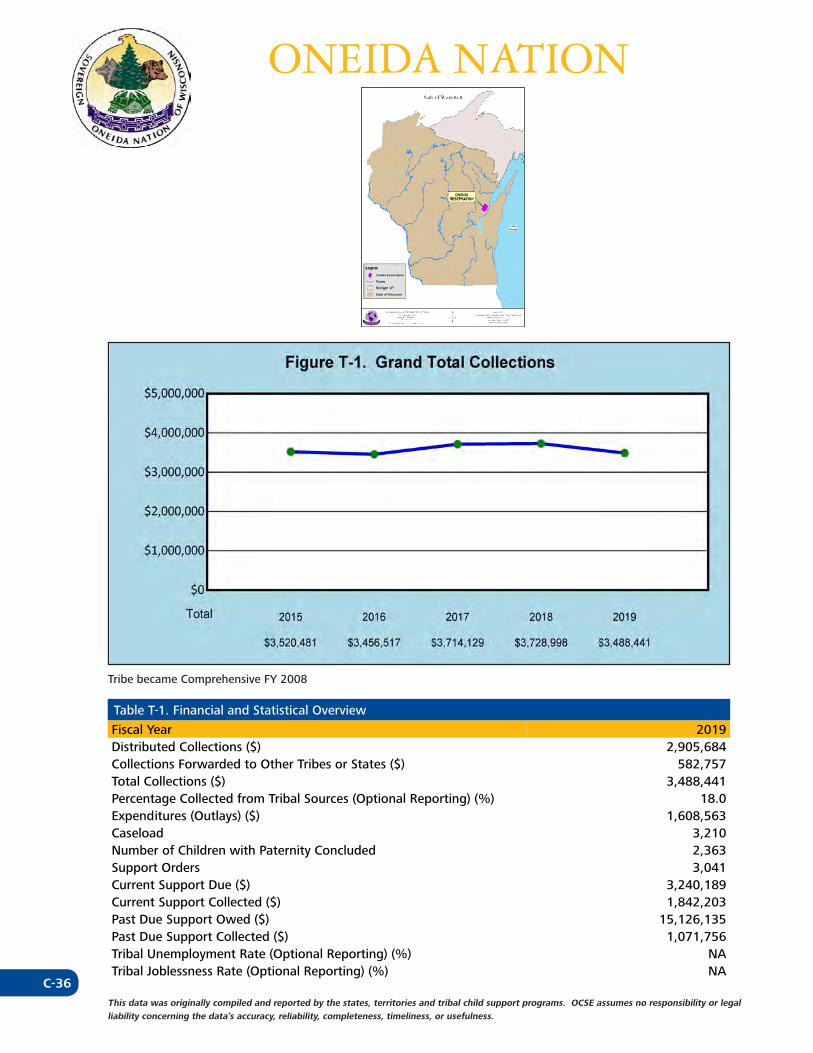
C-36This data was originally compiled and reported by the states, territories and tribal child support programs. OCSE assumes no responsibility or legal liability concerning the data’s accuracy, reliability, completeness, timeliness, or usefulness.
ONEIDA NATION
Tribe became Comprehensive FY 2008
Table T-1. Financial and Statistical Overview
Fiscal Year 2019Distributed Collections ($) 2,905,684Collections Forwarded to Other Tribes or States ($) 582,757Total Collections ($) 3,488,441Percentage Collected from Tribal Sources (Optional Reporting) (%) 18.0Expenditures (Outlays) ($) 1,608,563Caseload 3,210Number of Children with Paternity Concluded 2,363Support Orders 3,041Current Support Due ($) 3,240,189Current Support Collected ($) 1,842,203Past Due Support Owed ($) 15,126,135Past Due Support Collected ($) 1,071,756Tribal Unemployment Rate (Optional Reporting) (%) NATribal Joblessness Rate (Optional Reporting) (%) NA
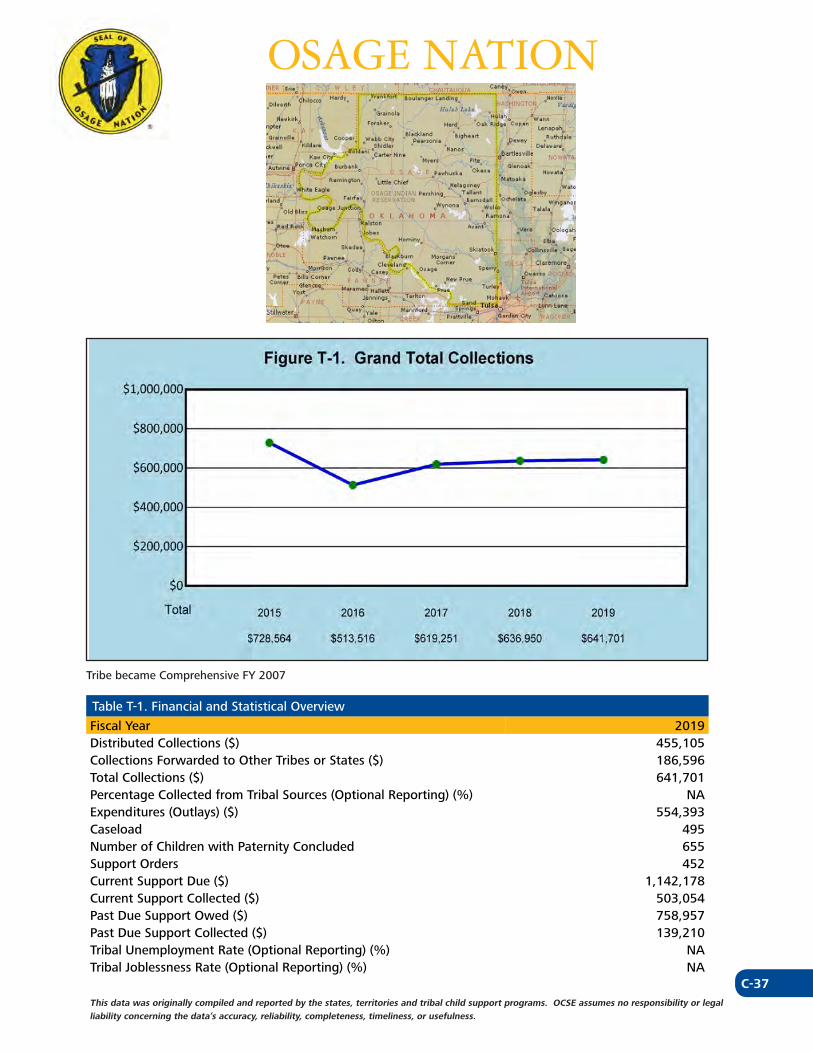
C-37This data was originally compiled and reported by the states, territories and tribal child support programs. OCSE assumes no responsibility or legal liability concerning the data’s accuracy, reliability, completeness, timeliness, or usefulness.
OSAGE NATION
Tribe became Comprehensive FY 2007
Table T-1. Financial and Statistical Overview
Fiscal Year 2019Distributed Collections ($) 455,105Collections Forwarded to Other Tribes or States ($) 186,596Total Collections ($) 641,701Percentage Collected from Tribal Sources (Optional Reporting) (%) NAExpenditures (Outlays) ($) 554,393Caseload 495Number of Children with Paternity Concluded 655Support Orders 452Current Support Due ($) 1,142,178Current Support Collected ($) 503,054Past Due Support Owed ($) 758,957Past Due Support Collected ($) 139,210Tribal Unemployment Rate (Optional Reporting) (%) NATribal Joblessness Rate (Optional Reporting) (%) NA
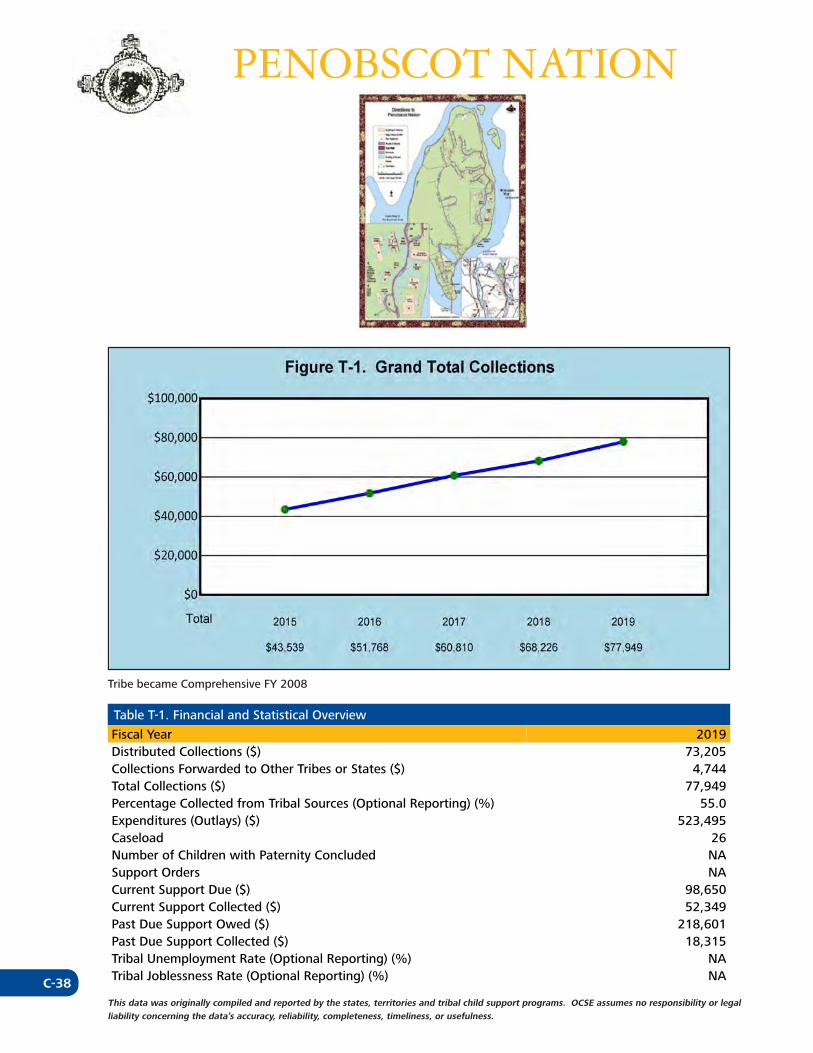
C-38This data was originally compiled and reported by the states, territories and tribal child support programs. OCSE assumes no responsibility or legal liability concerning the data’s accuracy, reliability, completeness, timeliness, or usefulness.
PENOBSCOT NATION
Tribe became Comprehensive FY 2008
Table T-1. Financial and Statistical Overview
Fiscal Year 2019Distributed Collections ($) 73,205Collections Forwarded to Other Tribes or States ($) 4,744Total Collections ($) 77,949Percentage Collected from Tribal Sources (Optional Reporting) (%) 55.0Expenditures (Outlays) ($) 523,495Caseload 26Number of Children with Paternity Concluded NASupport Orders NACurrent Support Due ($) 98,650Current Support Collected ($) 52,349Past Due Support Owed ($) 218,601Past Due Support Collected ($) 18,315Tribal Unemployment Rate (Optional Reporting) (%) NATribal Joblessness Rate (Optional Reporting) (%) NA
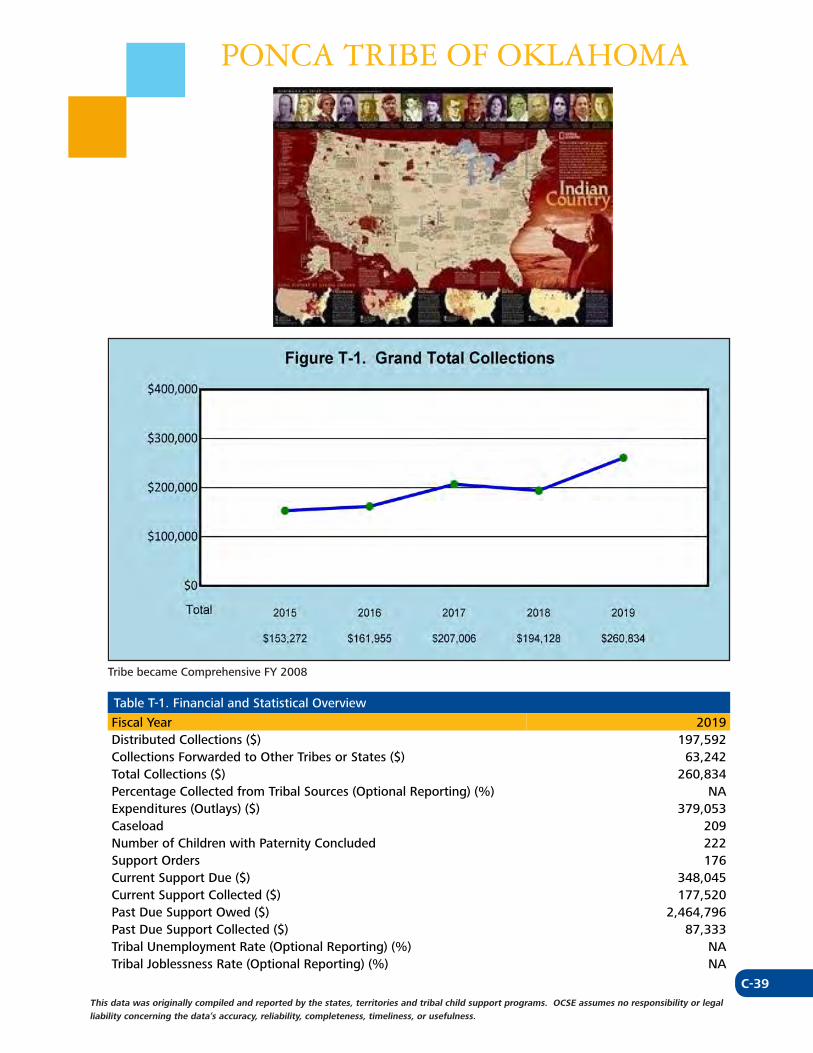
C-39This data was originally compiled and reported by the states, territories and tribal child support programs. OCSE assumes no responsibility or legal liability concerning the data’s accuracy, reliability, completeness, timeliness, or usefulness.
PONCA TRIBE OF OKLAHOMA
Tribe became Comprehensive FY 2008
Table T-1. Financial and Statistical Overview
Fiscal Year 2019Distributed Collections ($) 197,592Collections Forwarded to Other Tribes or States ($) 63,242Total Collections ($) 260,834Percentage Collected from Tribal Sources (Optional Reporting) (%) NAExpenditures (Outlays) ($) 379,053Caseload 209Number of Children with Paternity Concluded 222Support Orders 176Current Support Due ($) 348,045Current Support Collected ($) 177,520Past Due Support Owed ($) 2,464,796Past Due Support Collected ($) 87,333Tribal Unemployment Rate (Optional Reporting) (%) NATribal Joblessness Rate (Optional Reporting) (%) NA
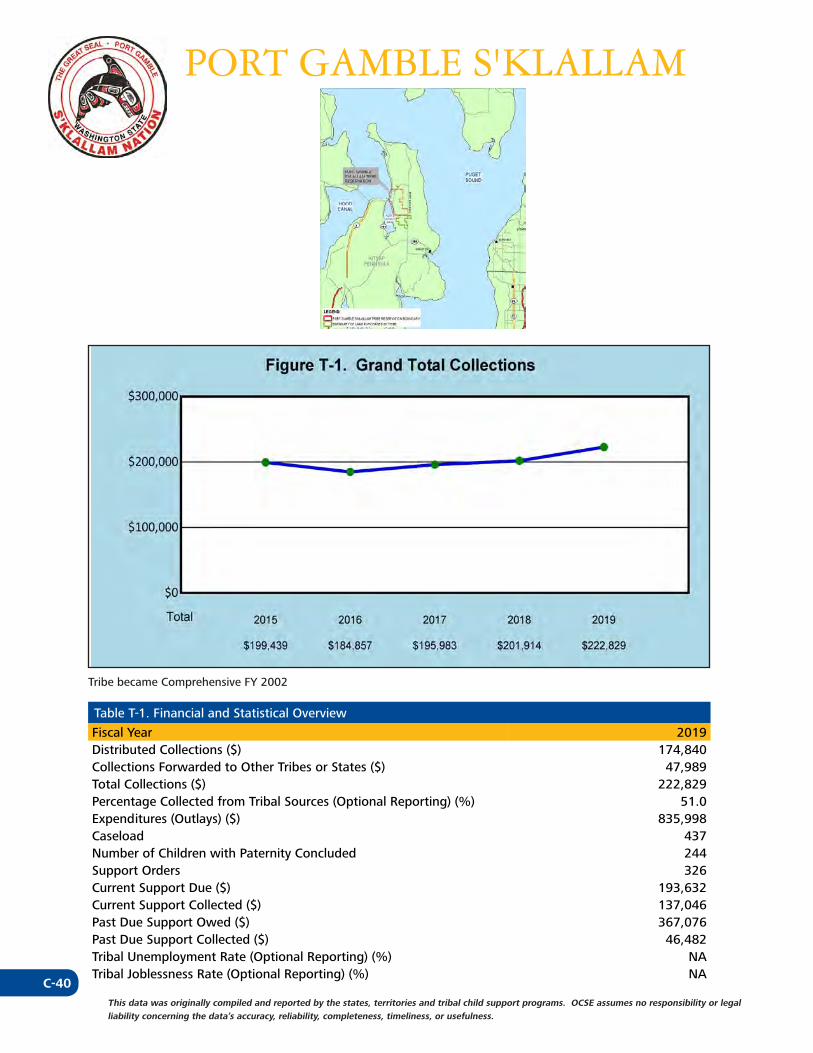
C-40This data was originally compiled and reported by the states, territories and tribal child support programs. OCSE assumes no responsibility or legal liability concerning the data’s accuracy, reliability, completeness, timeliness, or usefulness.
PORT GAMBLE S'KLALLAM
Tribe became Comprehensive FY 2002
Table T-1. Financial and Statistical Overview
Fiscal Year 2019Distributed Collections ($) 174,840Collections Forwarded to Other Tribes or States ($) 47,989Total Collections ($) 222,829Percentage Collected from Tribal Sources (Optional Reporting) (%) 51.0Expenditures (Outlays) ($) 835,998Caseload 437Number of Children with Paternity Concluded 244Support Orders 326Current Support Due ($) 193,632Current Support Collected ($) 137,046Past Due Support Owed ($) 367,076Past Due Support Collected ($) 46,482Tribal Unemployment Rate (Optional Reporting) (%) NATribal Joblessness Rate (Optional Reporting) (%) NA
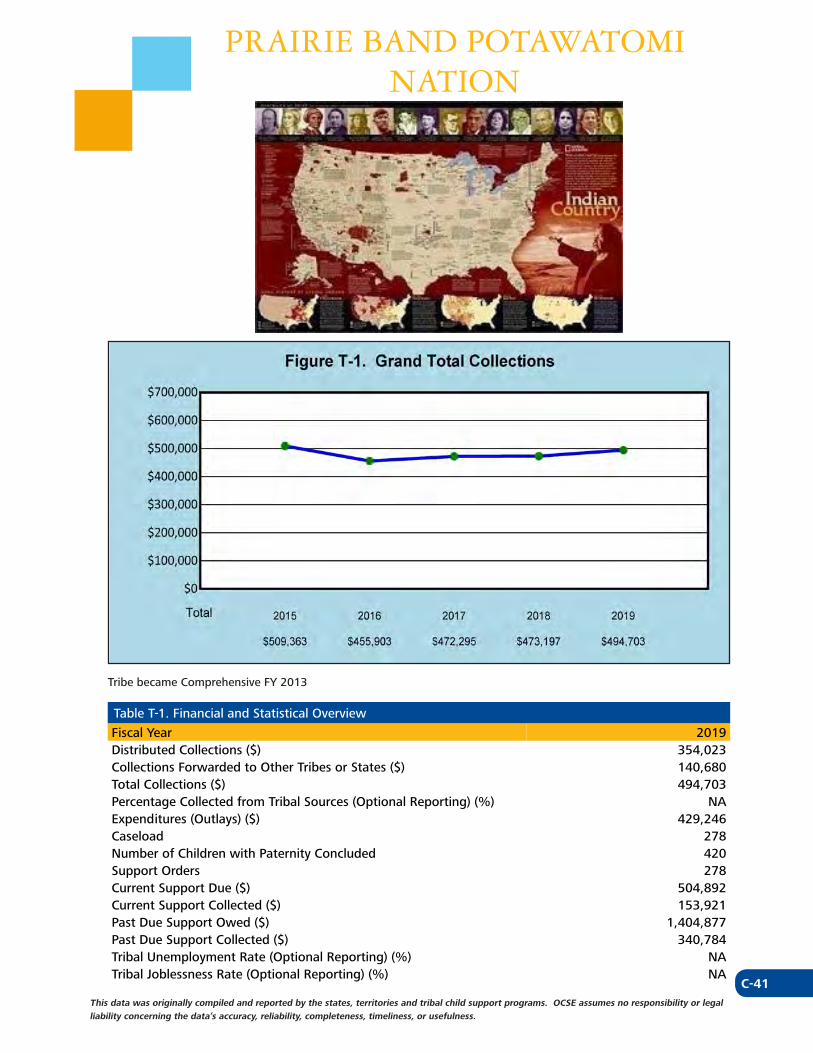
C-41This data was originally compiled and reported by the states, territories and tribal child support programs. OCSE assumes no responsibility or legal liability concerning the data’s accuracy, reliability, completeness, timeliness, or usefulness.
PRAIRIE BAND POTAWATOMI NATION
Tribe became Comprehensive FY 2013
Table T-1. Financial and Statistical Overview
Fiscal Year 2019Distributed Collections ($) 354,023Collections Forwarded to Other Tribes or States ($) 140,680Total Collections ($) 494,703Percentage Collected from Tribal Sources (Optional Reporting) (%) NAExpenditures (Outlays) ($) 429,246Caseload 278Number of Children with Paternity Concluded 420Support Orders 278Current Support Due ($) 504,892Current Support Collected ($) 153,921Past Due Support Owed ($) 1,404,877Past Due Support Collected ($) 340,784Tribal Unemployment Rate (Optional Reporting) (%) NATribal Joblessness Rate (Optional Reporting) (%) NA
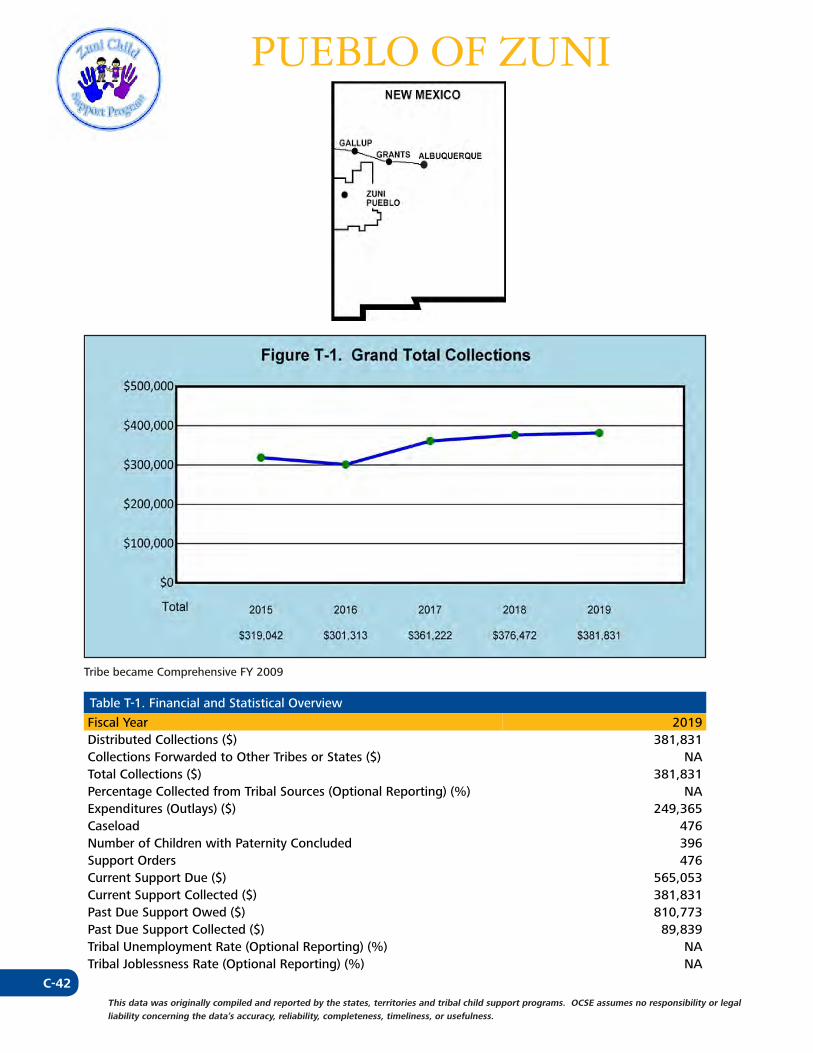
C-42This data was originally compiled and reported by the states, territories and tribal child support programs. OCSE assumes no responsibility or legal liability concerning the data’s accuracy, reliability, completeness, timeliness, or usefulness.
PUEBLO OF ZUNI
Tribe became Comprehensive FY 2009
Table T-1. Financial and Statistical Overview
Fiscal Year 2019Distributed Collections ($) 381,831Collections Forwarded to Other Tribes or States ($) NATotal Collections ($) 381,831Percentage Collected from Tribal Sources (Optional Reporting) (%) NAExpenditures (Outlays) ($) 249,365Caseload 476Number of Children with Paternity Concluded 396Support Orders 476Current Support Due ($) 565,053Current Support Collected ($) 381,831Past Due Support Owed ($) 810,773Past Due Support Collected ($) 89,839Tribal Unemployment Rate (Optional Reporting) (%) NATribal Joblessness Rate (Optional Reporting) (%) NA
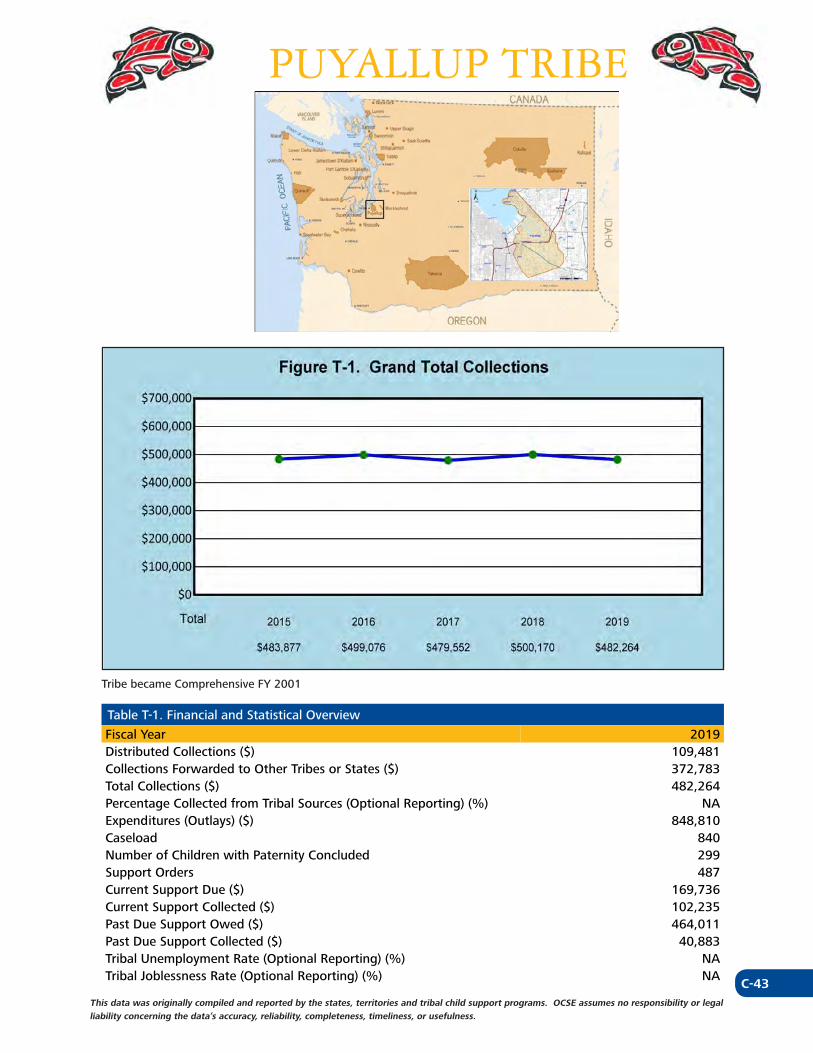
C-43This data was originally compiled and reported by the states, territories and tribal child support programs. OCSE assumes no responsibility or legal liability concerning the data’s accuracy, reliability, completeness, timeliness, or usefulness.
PUYALLUP TRIBE
Tribe became Comprehensive FY 2001
Table T-1. Financial and Statistical Overview
Fiscal Year 2019Distributed Collections ($) 109,481Collections Forwarded to Other Tribes or States ($) 372,783Total Collections ($) 482,264Percentage Collected from Tribal Sources (Optional Reporting) (%) NAExpenditures (Outlays) ($) 848,810Caseload 840Number of Children with Paternity Concluded 299Support Orders 487Current Support Due ($) 169,736Current Support Collected ($) 102,235Past Due Support Owed ($) 464,011Past Due Support Collected ($) 40,883Tribal Unemployment Rate (Optional Reporting) (%) NATribal Joblessness Rate (Optional Reporting) (%) NA
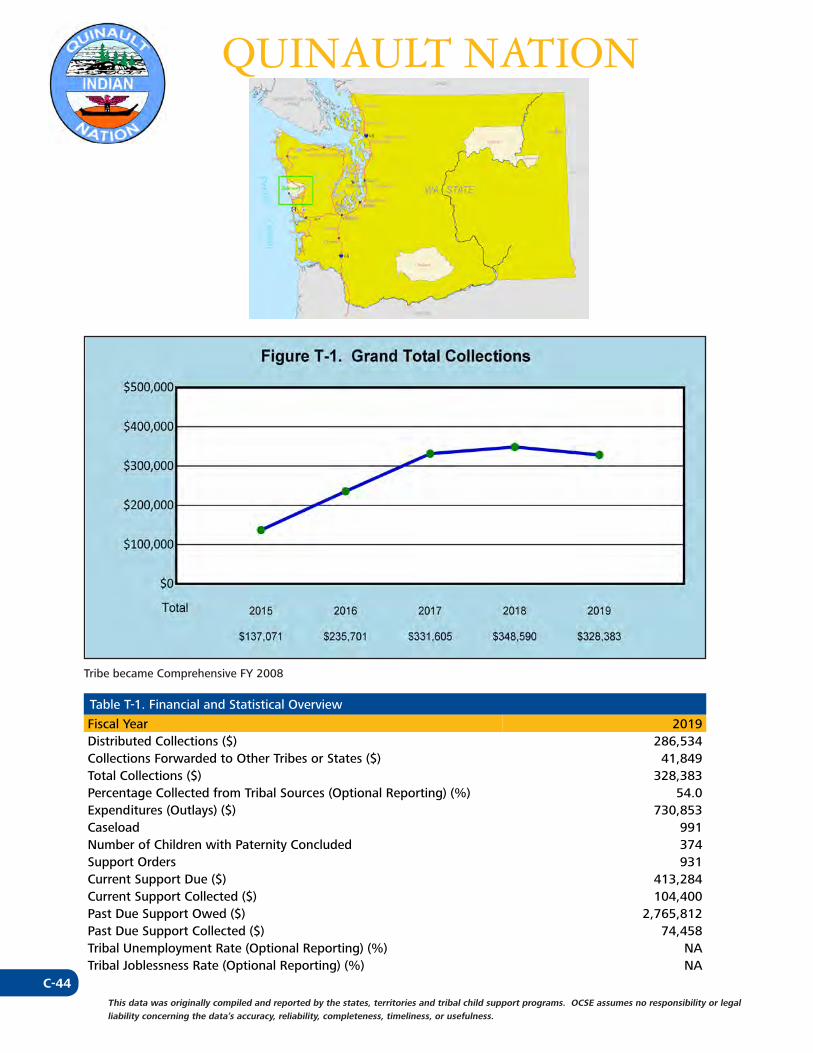
C-44This data was originally compiled and reported by the states, territories and tribal child support programs. OCSE assumes no responsibility or legal liability concerning the data’s accuracy, reliability, completeness, timeliness, or usefulness.
QUINAULT NATION
Tribe became Comprehensive FY 2008
Table T-1. Financial and Statistical Overview
Fiscal Year 2019Distributed Collections ($) 286,534Collections Forwarded to Other Tribes or States ($) 41,849Total Collections ($) 328,383Percentage Collected from Tribal Sources (Optional Reporting) (%) 54.0Expenditures (Outlays) ($) 730,853Caseload 991Number of Children with Paternity Concluded 374Support Orders 931Current Support Due ($) 413,284Current Support Collected ($) 104,400Past Due Support Owed ($) 2,765,812Past Due Support Collected ($) 74,458Tribal Unemployment Rate (Optional Reporting) (%) NATribal Joblessness Rate (Optional Reporting) (%) NA
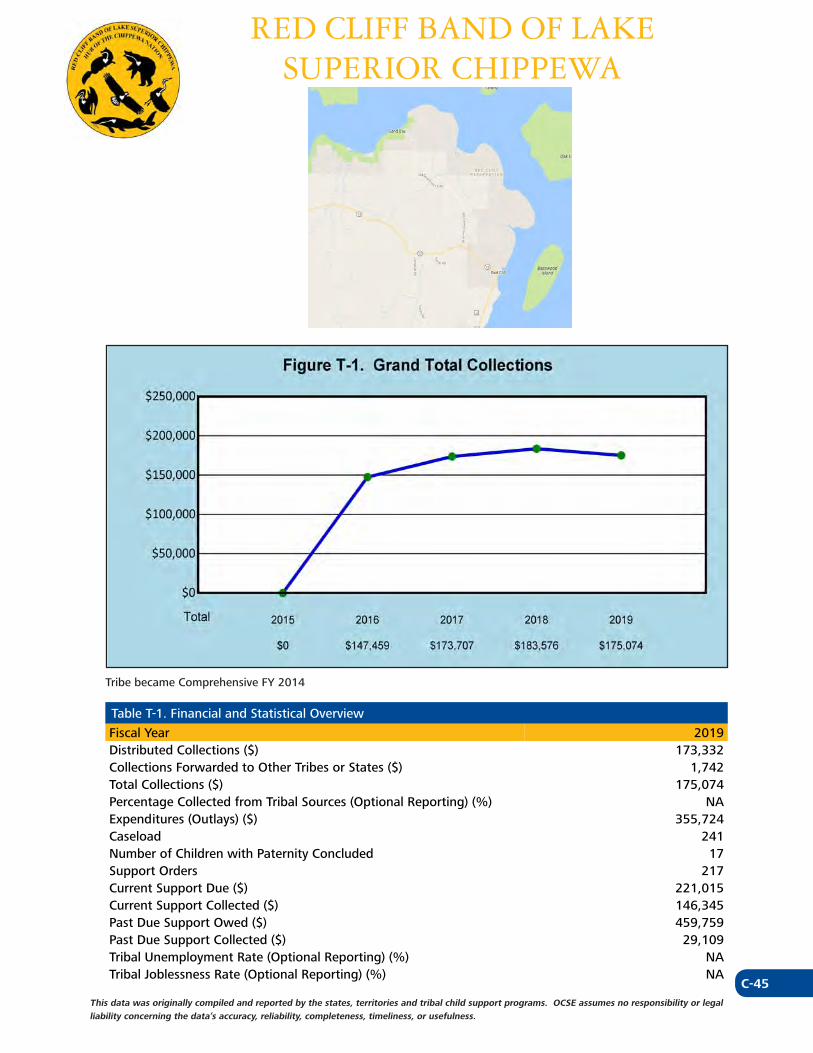
C-45This data was originally compiled and reported by the states, territories and tribal child support programs. OCSE assumes no responsibility or legal liability concerning the data’s accuracy, reliability, completeness, timeliness, or usefulness.
RED CLIFF BAND OF LAKE SUPERIOR CHIPPEWA
Tribe became Comprehensive FY 2014
Table T-1. Financial and Statistical Overview
Fiscal Year 2019Distributed Collections ($) 173,332Collections Forwarded to Other Tribes or States ($) 1,742Total Collections ($) 175,074Percentage Collected from Tribal Sources (Optional Reporting) (%) NAExpenditures (Outlays) ($) 355,724Caseload 241Number of Children with Paternity Concluded 17Support Orders 217Current Support Due ($) 221,015Current Support Collected ($) 146,345Past Due Support Owed ($) 459,759Past Due Support Collected ($) 29,109Tribal Unemployment Rate (Optional Reporting) (%) NATribal Joblessness Rate (Optional Reporting) (%) NA
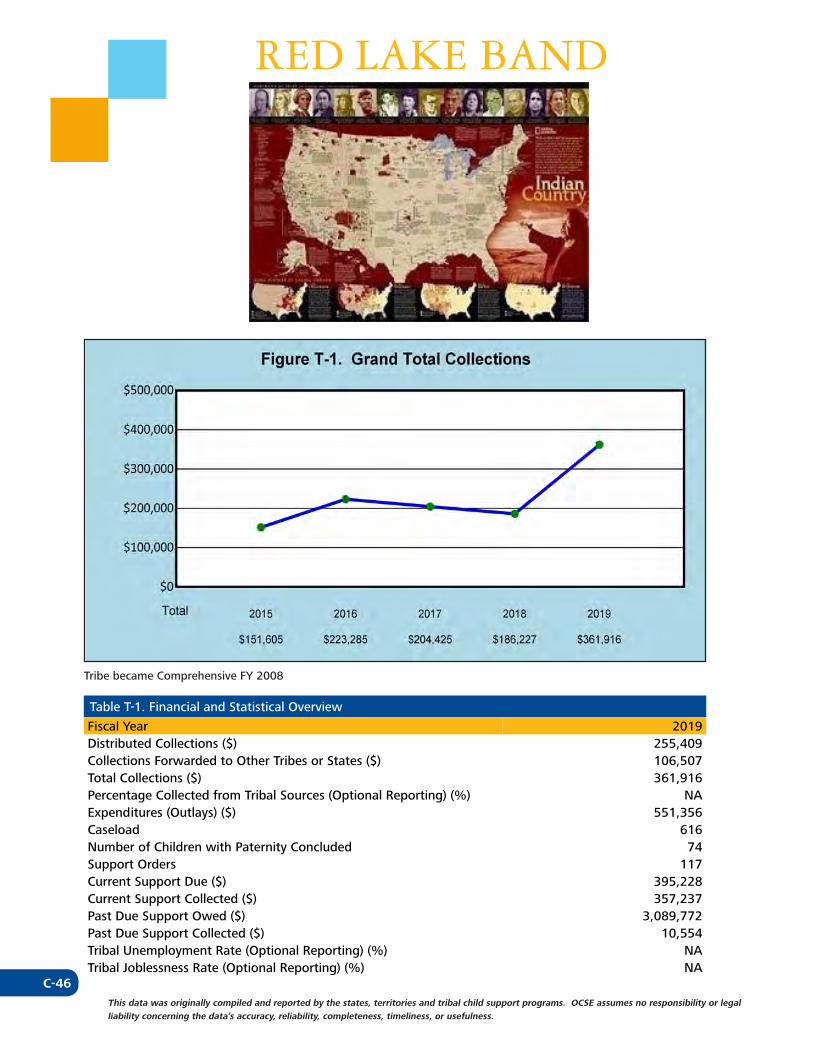
C-46This data was originally compiled and reported by the states, territories and tribal child support programs. OCSE assumes no responsibility or legal liability concerning the data’s accuracy, reliability, completeness, timeliness, or usefulness.
RED LAKE BAND
Tribe became Comprehensive FY 2008
Table T-1. Financial and Statistical Overview
Fiscal Year 2019Distributed Collections ($) 255,409Collections Forwarded to Other Tribes or States ($) 106,507Total Collections ($) 361,916Percentage Collected from Tribal Sources (Optional Reporting) (%) NAExpenditures (Outlays) ($) 551,356Caseload 616Number of Children with Paternity Concluded 74Support Orders 117Current Support Due ($) 395,228Current Support Collected ($) 357,237Past Due Support Owed ($) 3,089,772Past Due Support Collected ($) 10,554Tribal Unemployment Rate (Optional Reporting) (%) NATribal Joblessness Rate (Optional Reporting) (%) NA
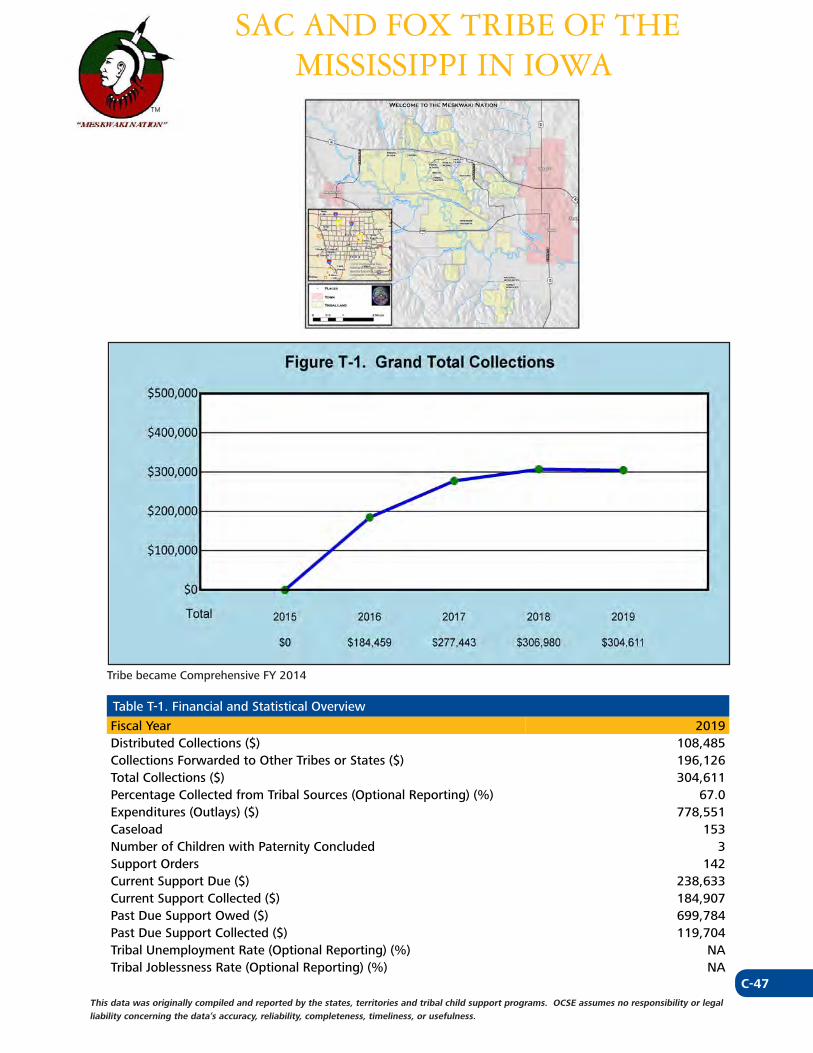
C-47This data was originally compiled and reported by the states, territories and tribal child support programs. OCSE assumes no responsibility or legal liability concerning the data’s accuracy, reliability, completeness, timeliness, or usefulness.
SAC AND FOX TRIBE OF THE MISSISSIPPI IN IOWA
Tribe became Comprehensive FY 2014
Table T-1. Financial and Statistical Overview
Fiscal Year 2019Distributed Collections ($) 108,485Collections Forwarded to Other Tribes or States ($) 196,126Total Collections ($) 304,611Percentage Collected from Tribal Sources (Optional Reporting) (%) 67.0Expenditures (Outlays) ($) 778,551Caseload 153Number of Children with Paternity Concluded 3Support Orders 142Current Support Due ($) 238,633Current Support Collected ($) 184,907Past Due Support Owed ($) 699,784Past Due Support Collected ($) 119,704Tribal Unemployment Rate (Optional Reporting) (%) NATribal Joblessness Rate (Optional Reporting) (%) NA
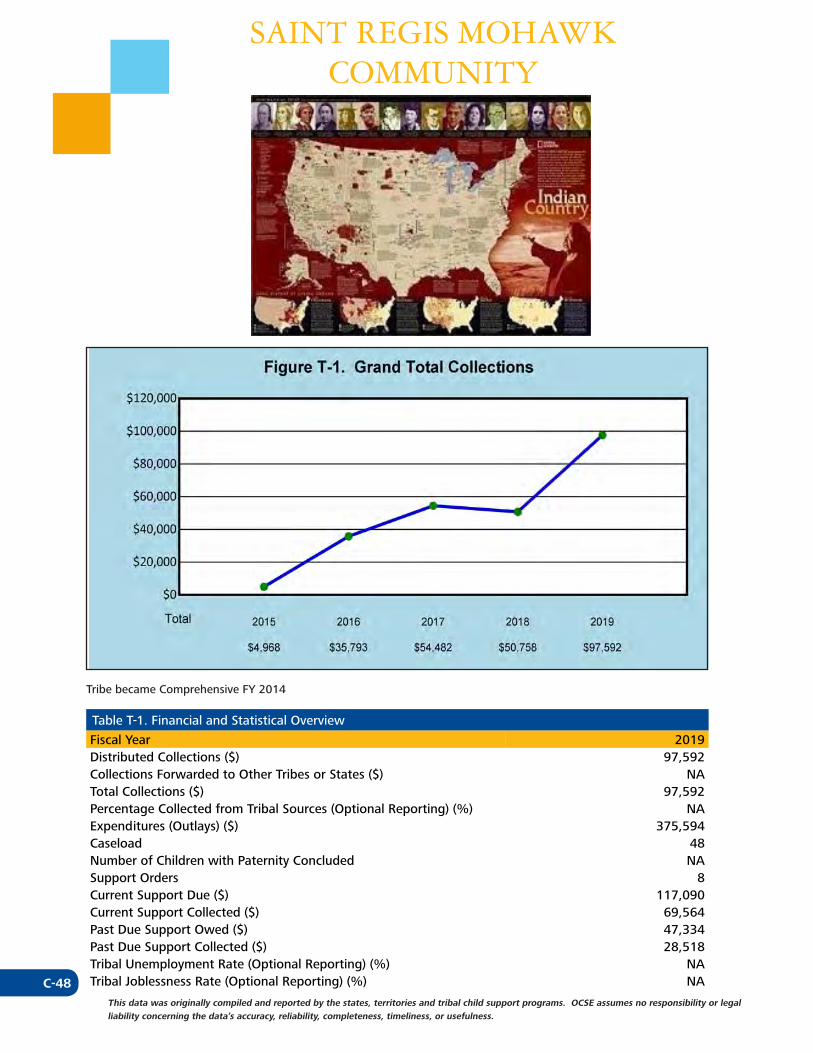
C-48This data was originally compiled and reported by the states, territories and tribal child support programs. OCSE assumes no responsibility or legal liability concerning the data’s accuracy, reliability, completeness, timeliness, or usefulness.
SAINT REGIS MOHAWK COMMUNITY
Tribe became Comprehensive FY 2014
Table T-1. Financial and Statistical Overview
Fiscal Year 2019Distributed Collections ($) 97,592Collections Forwarded to Other Tribes or States ($) NATotal Collections ($) 97,592Percentage Collected from Tribal Sources (Optional Reporting) (%) NAExpenditures (Outlays) ($) 375,594Caseload 48Number of Children with Paternity Concluded NASupport Orders 8Current Support Due ($) 117,090Current Support Collected ($) 69,564Past Due Support Owed ($) 47,334Past Due Support Collected ($) 28,518Tribal Unemployment Rate (Optional Reporting) (%) NATribal Joblessness Rate (Optional Reporting) (%) NA
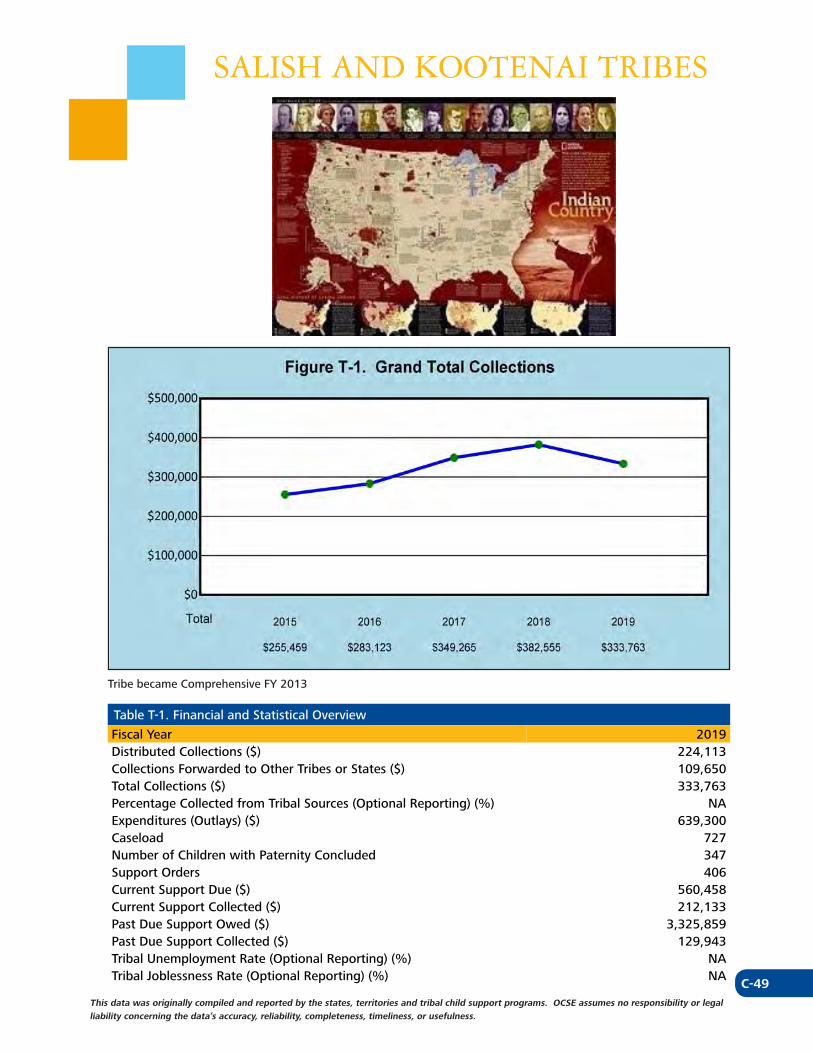
C-49This data was originally compiled and reported by the states, territories and tribal child support programs. OCSE assumes no responsibility or legal liability concerning the data’s accuracy, reliability, completeness, timeliness, or usefulness.
SALISH AND KOOTENAI TRIBES
Tribe became Comprehensive FY 2013
Table T-1. Financial and Statistical Overview
Fiscal Year 2019Distributed Collections ($) 224,113Collections Forwarded to Other Tribes or States ($) 109,650Total Collections ($) 333,763Percentage Collected from Tribal Sources (Optional Reporting) (%) NAExpenditures (Outlays) ($) 639,300Caseload 727Number of Children with Paternity Concluded 347Support Orders 406Current Support Due ($) 560,458Current Support Collected ($) 212,133Past Due Support Owed ($) 3,325,859Past Due Support Collected ($) 129,943Tribal Unemployment Rate (Optional Reporting) (%) NATribal Joblessness Rate (Optional Reporting) (%) NA
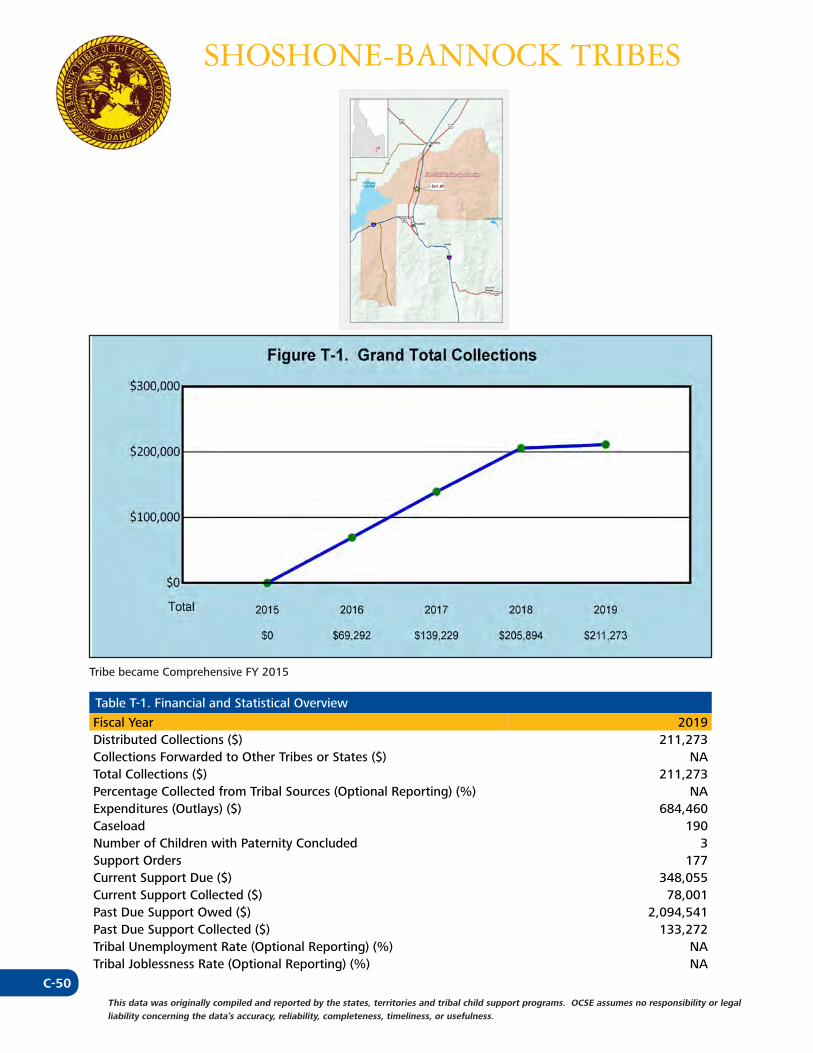
C-50This data was originally compiled and reported by the states, territories and tribal child support programs. OCSE assumes no responsibility or legal liability concerning the data’s accuracy, reliability, completeness, timeliness, or usefulness.
SHOSHONE-BANNOCK TRIBES
Tribe became Comprehensive FY 2015
Table T-1. Financial and Statistical Overview
Fiscal Year 2019Distributed Collections ($) 211,273Collections Forwarded to Other Tribes or States ($) NATotal Collections ($) 211,273Percentage Collected from Tribal Sources (Optional Reporting) (%) NAExpenditures (Outlays) ($) 684,460Caseload 190Number of Children with Paternity Concluded 3Support Orders 177Current Support Due ($) 348,055Current Support Collected ($) 78,001Past Due Support Owed ($) 2,094,541Past Due Support Collected ($) 133,272Tribal Unemployment Rate (Optional Reporting) (%) NATribal Joblessness Rate (Optional Reporting) (%) NA
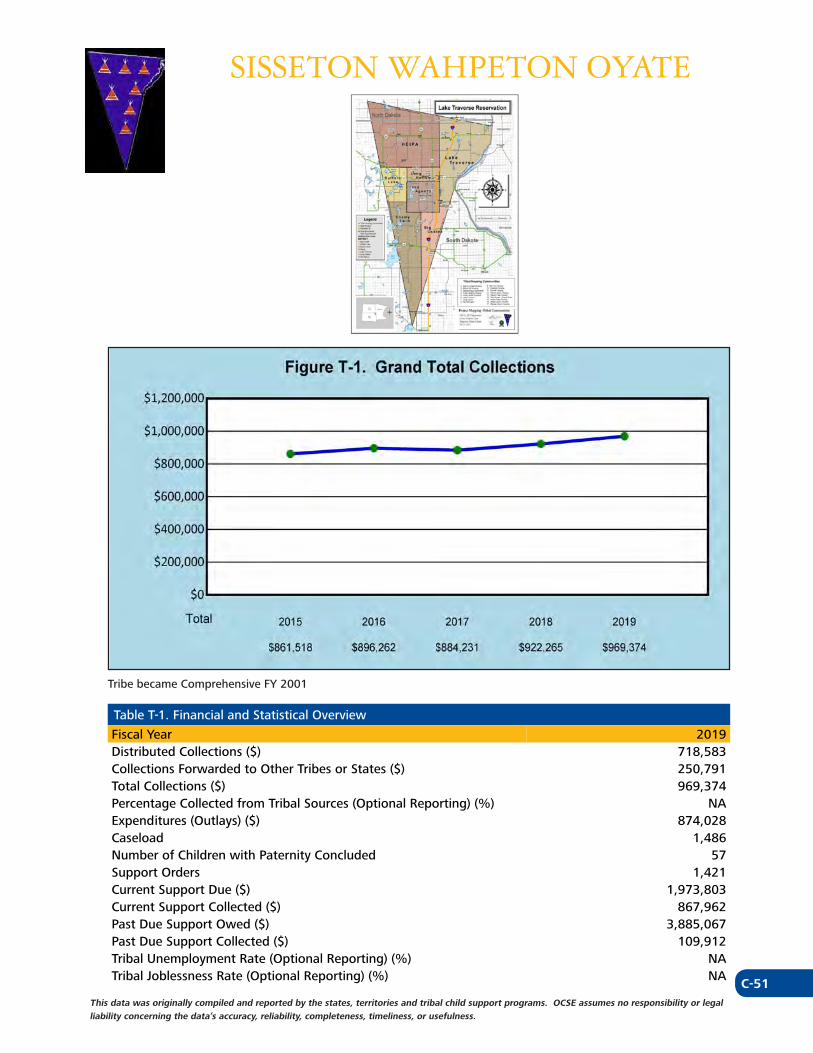
C-51This data was originally compiled and reported by the states, territories and tribal child support programs. OCSE assumes no responsibility or legal liability concerning the data’s accuracy, reliability, completeness, timeliness, or usefulness.
SISSETON WAHPETON OYATE
Tribe became Comprehensive FY 2001
Table T-1. Financial and Statistical Overview
Fiscal Year 2019Distributed Collections ($) 718,583Collections Forwarded to Other Tribes or States ($) 250,791Total Collections ($) 969,374Percentage Collected from Tribal Sources (Optional Reporting) (%) NAExpenditures (Outlays) ($) 874,028Caseload 1,486Number of Children with Paternity Concluded 57Support Orders 1,421Current Support Due ($) 1,973,803Current Support Collected ($) 867,962Past Due Support Owed ($) 3,885,067Past Due Support Collected ($) 109,912Tribal Unemployment Rate (Optional Reporting) (%) NATribal Joblessness Rate (Optional Reporting) (%) NA
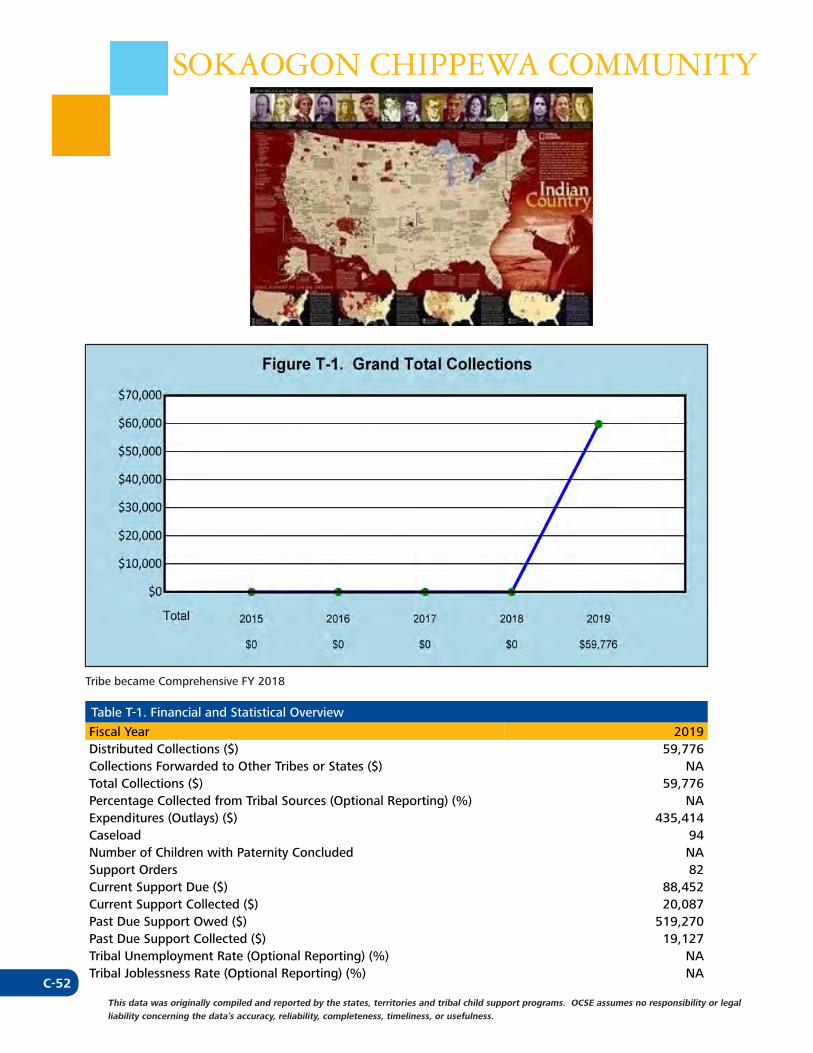
C-52This data was originally compiled and reported by the states, territories and tribal child support programs. OCSE assumes no responsibility or legal liability concerning the data’s accuracy, reliability, completeness, timeliness, or usefulness.
SOKAOGON CHIPPEWA COMMUNITY
Tribe became Comprehensive FY 2018
Table T-1. Financial and Statistical Overview
Fiscal Year 2019Distributed Collections ($) 59,776Collections Forwarded to Other Tribes or States ($) NATotal Collections ($) 59,776Percentage Collected from Tribal Sources (Optional Reporting) (%) NAExpenditures (Outlays) ($) 435,414Caseload 94Number of Children with Paternity Concluded NASupport Orders 82Current Support Due ($) 88,452Current Support Collected ($) 20,087Past Due Support Owed ($) 519,270Past Due Support Collected ($) 19,127Tribal Unemployment Rate (Optional Reporting) (%) NATribal Joblessness Rate (Optional Reporting) (%) NA
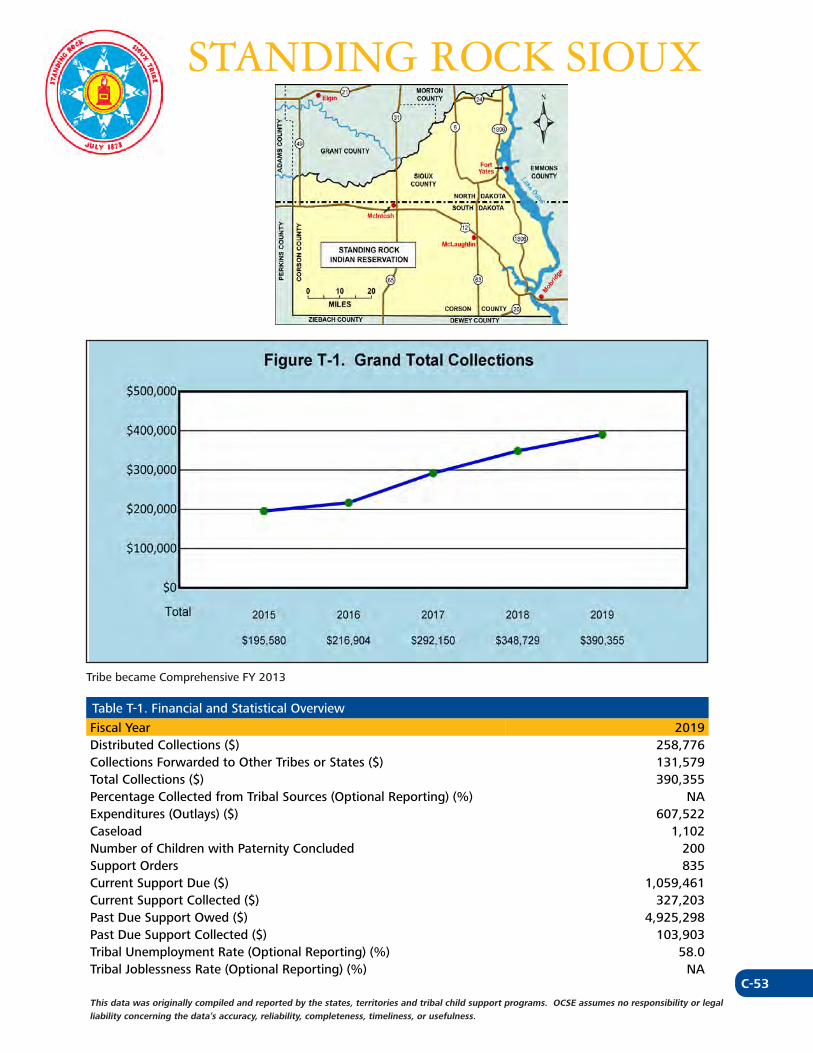
C-53This data was originally compiled and reported by the states, territories and tribal child support programs. OCSE assumes no responsibility or legal liability concerning the data’s accuracy, reliability, completeness, timeliness, or usefulness.
STANDING ROCK SIOUX
Tribe became Comprehensive FY 2013
Table T-1. Financial and Statistical Overview
Fiscal Year 2019Distributed Collections ($) 258,776Collections Forwarded to Other Tribes or States ($) 131,579Total Collections ($) 390,355Percentage Collected from Tribal Sources (Optional Reporting) (%) NAExpenditures (Outlays) ($) 607,522Caseload 1,102Number of Children with Paternity Concluded 200Support Orders 835Current Support Due ($) 1,059,461Current Support Collected ($) 327,203Past Due Support Owed ($) 4,925,298Past Due Support Collected ($) 103,903Tribal Unemployment Rate (Optional Reporting) (%) 58.0Tribal Joblessness Rate (Optional Reporting) (%) NA
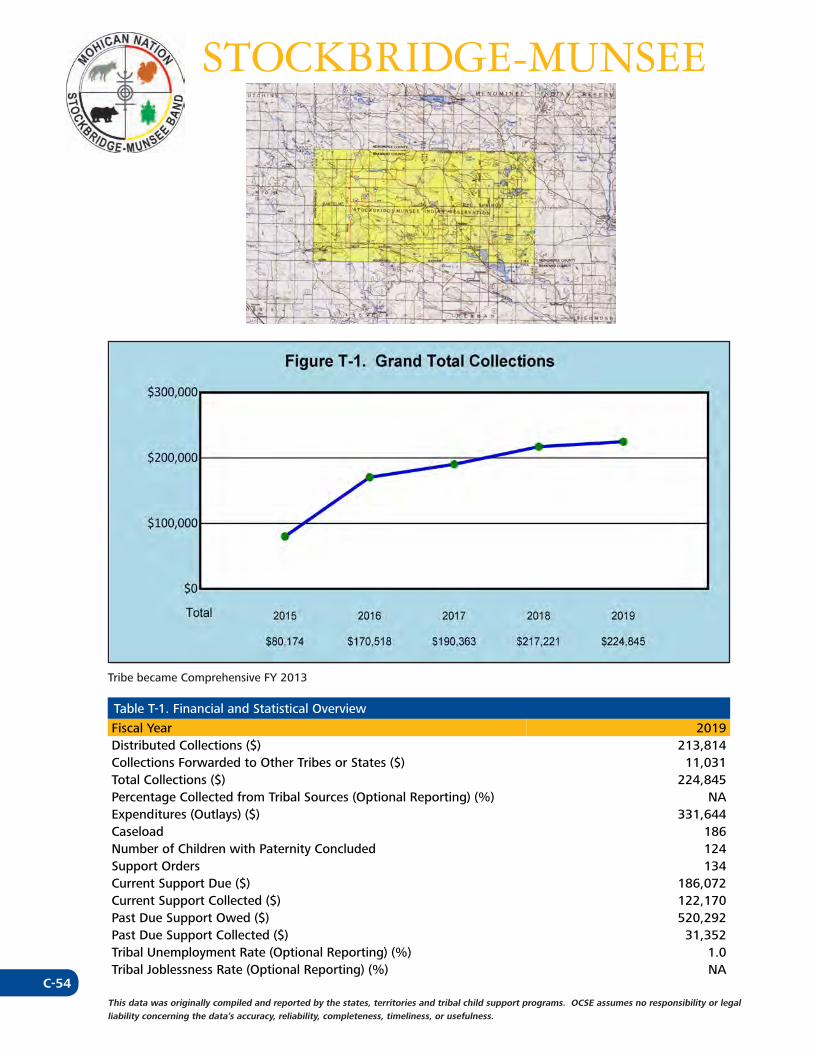
C-54This data was originally compiled and reported by the states, territories and tribal child support programs. OCSE assumes no responsibility or legal liability concerning the data’s accuracy, reliability, completeness, timeliness, or usefulness.
STOCKBRIDGE-MUNSEE
Tribe became Comprehensive FY 2013
Table T-1. Financial and Statistical Overview
Fiscal Year 2019Distributed Collections ($) 213,814Collections Forwarded to Other Tribes or States ($) 11,031Total Collections ($) 224,845Percentage Collected from Tribal Sources (Optional Reporting) (%) NAExpenditures (Outlays) ($) 331,644Caseload 186Number of Children with Paternity Concluded 124Support Orders 134Current Support Due ($) 186,072Current Support Collected ($) 122,170Past Due Support Owed ($) 520,292Past Due Support Collected ($) 31,352Tribal Unemployment Rate (Optional Reporting) (%) 1.0Tribal Joblessness Rate (Optional Reporting) (%) NA
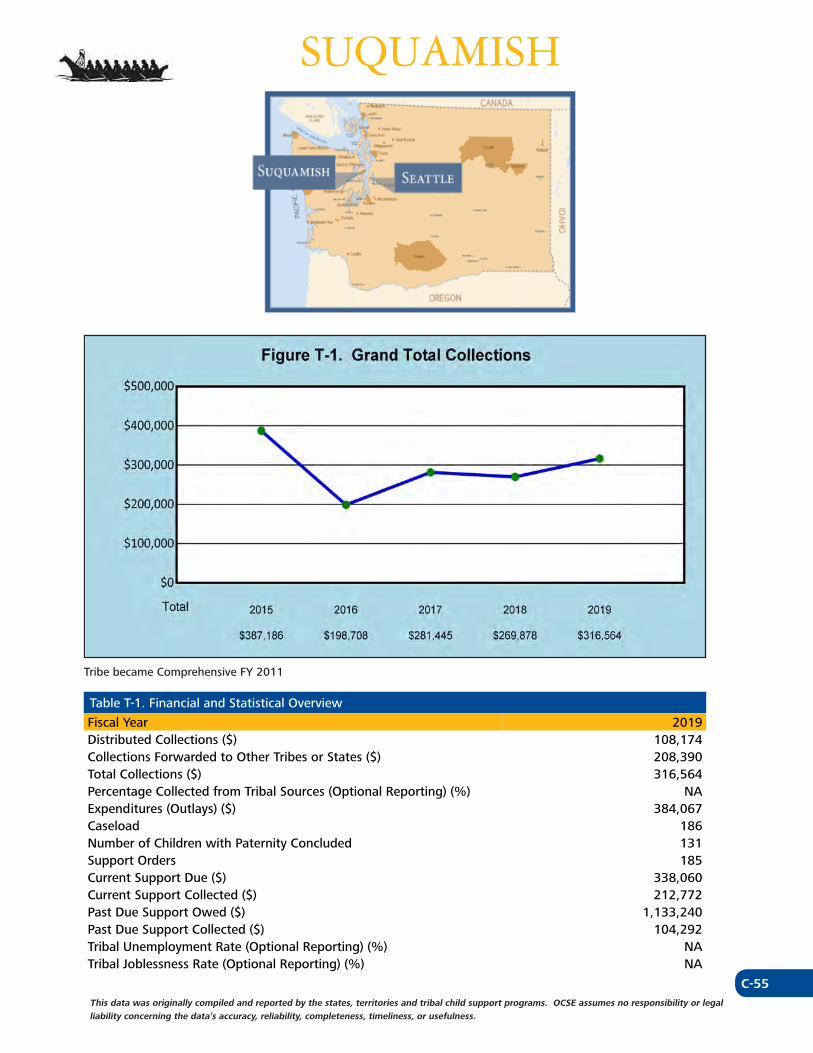
C-55This data was originally compiled and reported by the states, territories and tribal child support programs. OCSE assumes no responsibility or legal liability concerning the data’s accuracy, reliability, completeness, timeliness, or usefulness.
SUQUAMISH
Tribe became Comprehensive FY 2011
Table T-1. Financial and Statistical Overview
Fiscal Year 2019Distributed Collections ($) 108,174Collections Forwarded to Other Tribes or States ($) 208,390Total Collections ($) 316,564Percentage Collected from Tribal Sources (Optional Reporting) (%) NAExpenditures (Outlays) ($) 384,067Caseload 186Number of Children with Paternity Concluded 131Support Orders 185Current Support Due ($) 338,060Current Support Collected ($) 212,772Past Due Support Owed ($) 1,133,240Past Due Support Collected ($) 104,292Tribal Unemployment Rate (Optional Reporting) (%) NATribal Joblessness Rate (Optional Reporting) (%) NA
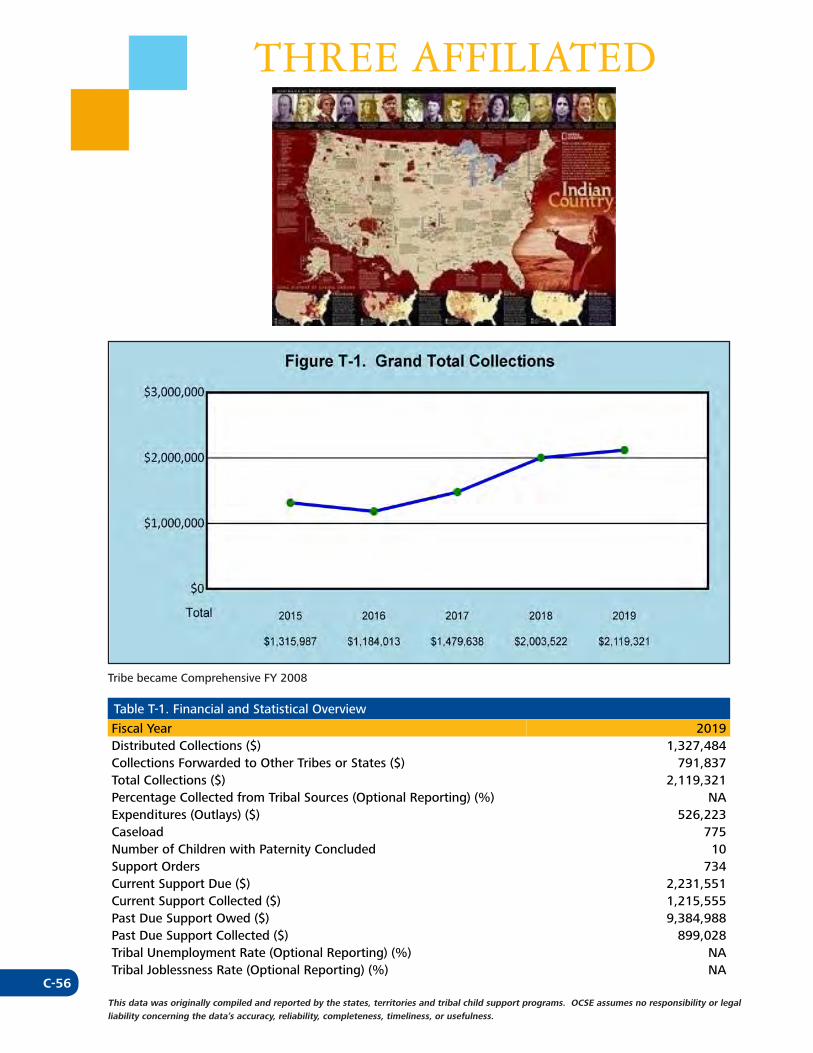
C-56This data was originally compiled and reported by the states, territories and tribal child support programs. OCSE assumes no responsibility or legal liability concerning the data’s accuracy, reliability, completeness, timeliness, or usefulness.
THREE AFFILIATED
Tribe became Comprehensive FY 2008
Table T-1. Financial and Statistical Overview
Fiscal Year 2019Distributed Collections ($) 1,327,484Collections Forwarded to Other Tribes or States ($) 791,837Total Collections ($) 2,119,321Percentage Collected from Tribal Sources (Optional Reporting) (%) NAExpenditures (Outlays) ($) 526,223Caseload 775Number of Children with Paternity Concluded 10Support Orders 734Current Support Due ($) 2,231,551Current Support Collected ($) 1,215,555Past Due Support Owed ($) 9,384,988Past Due Support Collected ($) 899,028Tribal Unemployment Rate (Optional Reporting) (%) NATribal Joblessness Rate (Optional Reporting) (%) NA
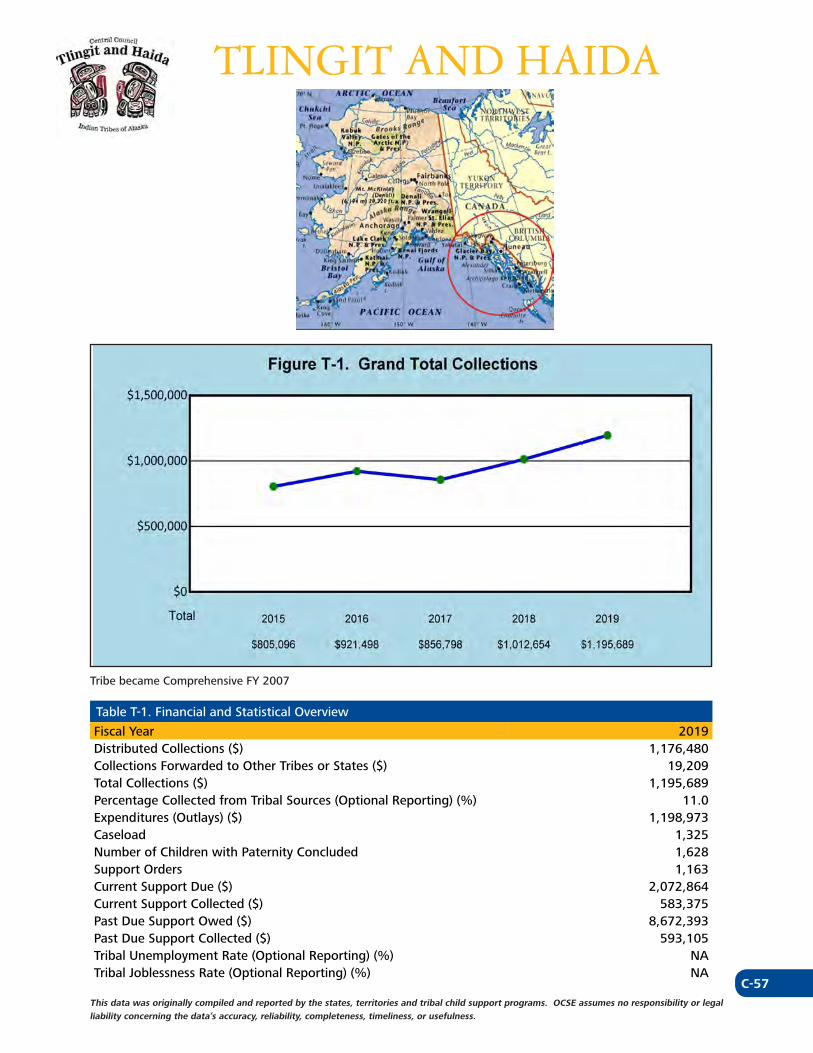
C-57This data was originally compiled and reported by the states, territories and tribal child support programs. OCSE assumes no responsibility or legal liability concerning the data’s accuracy, reliability, completeness, timeliness, or usefulness.
TLINGIT AND HAIDA
Tribe became Comprehensive FY 2007
Table T-1. Financial and Statistical Overview
Fiscal Year 2019Distributed Collections ($) 1,176,480Collections Forwarded to Other Tribes or States ($) 19,209Total Collections ($) 1,195,689Percentage Collected from Tribal Sources (Optional Reporting) (%) 11.0Expenditures (Outlays) ($) 1,198,973Caseload 1,325Number of Children with Paternity Concluded 1,628Support Orders 1,163Current Support Due ($) 2,072,864Current Support Collected ($) 583,375Past Due Support Owed ($) 8,672,393Past Due Support Collected ($) 593,105Tribal Unemployment Rate (Optional Reporting) (%) NATribal Joblessness Rate (Optional Reporting) (%) NA
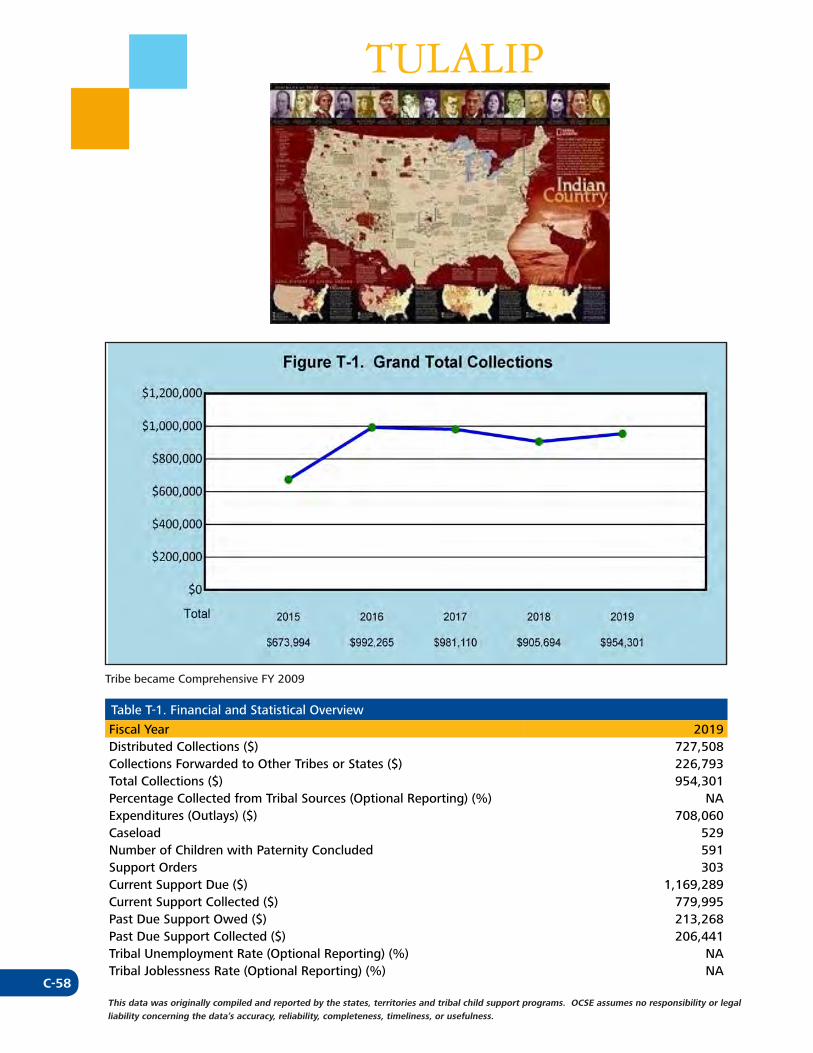
C-58This data was originally compiled and reported by the states, territories and tribal child support programs. OCSE assumes no responsibility or legal liability concerning the data’s accuracy, reliability, completeness, timeliness, or usefulness.
TULALIP
Tribe became Comprehensive FY 2009
Table T-1. Financial and Statistical Overview
Fiscal Year 2019Distributed Collections ($) 727,508Collections Forwarded to Other Tribes or States ($) 226,793Total Collections ($) 954,301Percentage Collected from Tribal Sources (Optional Reporting) (%) NAExpenditures (Outlays) ($) 708,060Caseload 529Number of Children with Paternity Concluded 591Support Orders 303Current Support Due ($) 1,169,289Current Support Collected ($) 779,995Past Due Support Owed ($) 213,268Past Due Support Collected ($) 206,441Tribal Unemployment Rate (Optional Reporting) (%) NATribal Joblessness Rate (Optional Reporting) (%) NA
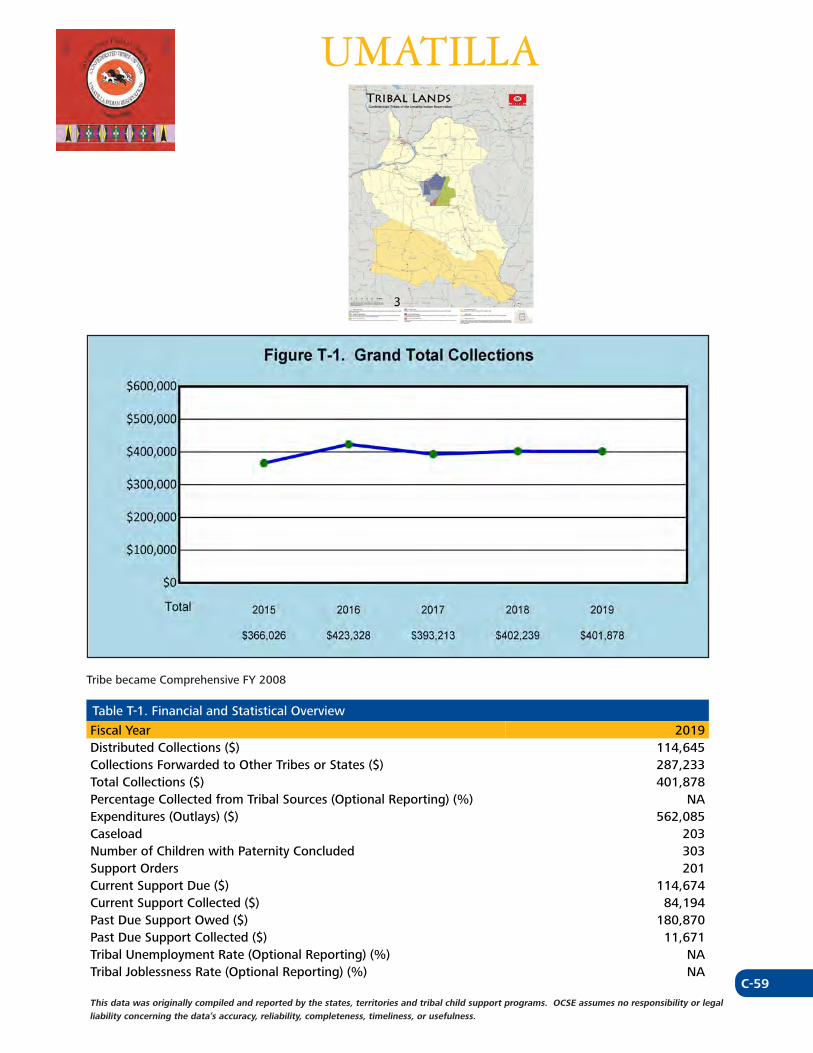
C-59This data was originally compiled and reported by the states, territories and tribal child support programs. OCSE assumes no responsibility or legal liability concerning the data’s accuracy, reliability, completeness, timeliness, or usefulness.
UMATILLA
Tribe became Comprehensive FY 2008
Table T-1. Financial and Statistical Overview
Fiscal Year 2019Distributed Collections ($) 114,645Collections Forwarded to Other Tribes or States ($) 287,233Total Collections ($) 401,878Percentage Collected from Tribal Sources (Optional Reporting) (%) NAExpenditures (Outlays) ($) 562,085Caseload 203Number of Children with Paternity Concluded 303Support Orders 201Current Support Due ($) 114,674Current Support Collected ($) 84,194Past Due Support Owed ($) 180,870Past Due Support Collected ($) 11,671Tribal Unemployment Rate (Optional Reporting) (%) NATribal Joblessness Rate (Optional Reporting) (%) NA
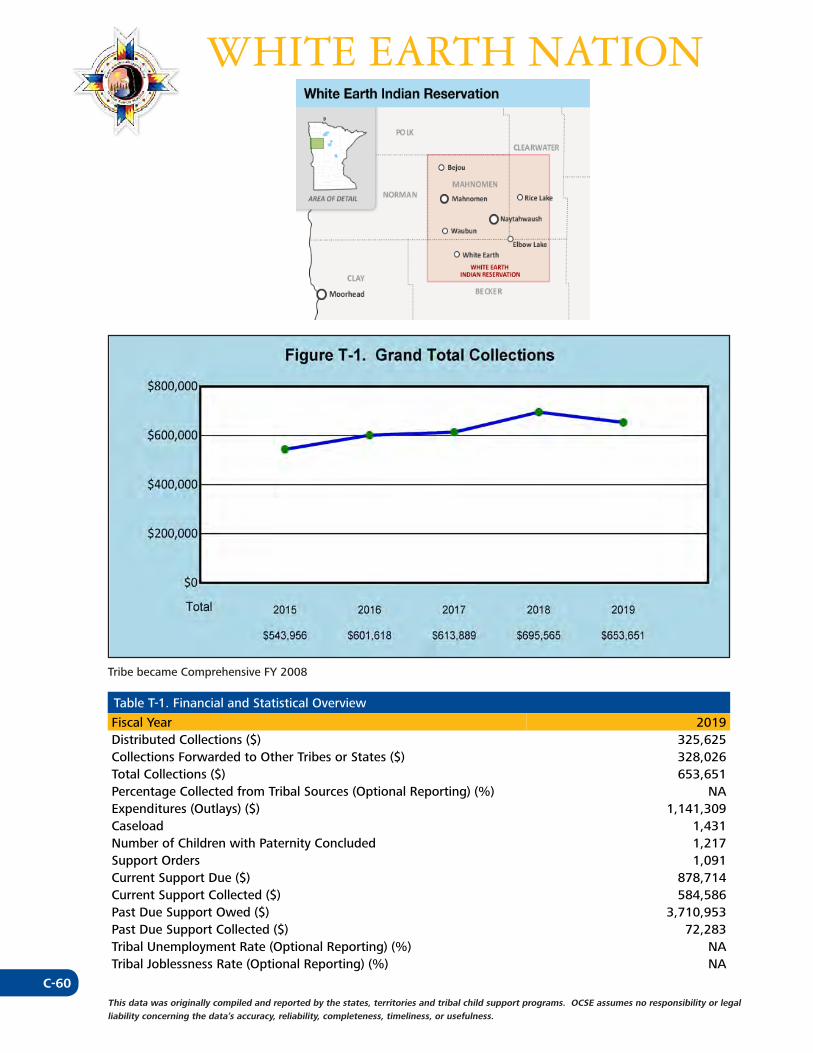
C-60This data was originally compiled and reported by the states, territories and tribal child support programs. OCSE assumes no responsibility or legal liability concerning the data’s accuracy, reliability, completeness, timeliness, or usefulness.
WHITE EARTH NATION
Tribe became Comprehensive FY 2008
Table T-1. Financial and Statistical Overview
Fiscal Year 2019Distributed Collections ($) 325,625Collections Forwarded to Other Tribes or States ($) 328,026Total Collections ($) 653,651Percentage Collected from Tribal Sources (Optional Reporting) (%) NAExpenditures (Outlays) ($) 1,141,309Caseload 1,431Number of Children with Paternity Concluded 1,217Support Orders 1,091Current Support Due ($) 878,714Current Support Collected ($) 584,586Past Due Support Owed ($) 3,710,953Past Due Support Collected ($) 72,283Tribal Unemployment Rate (Optional Reporting) (%) NATribal Joblessness Rate (Optional Reporting) (%) NA
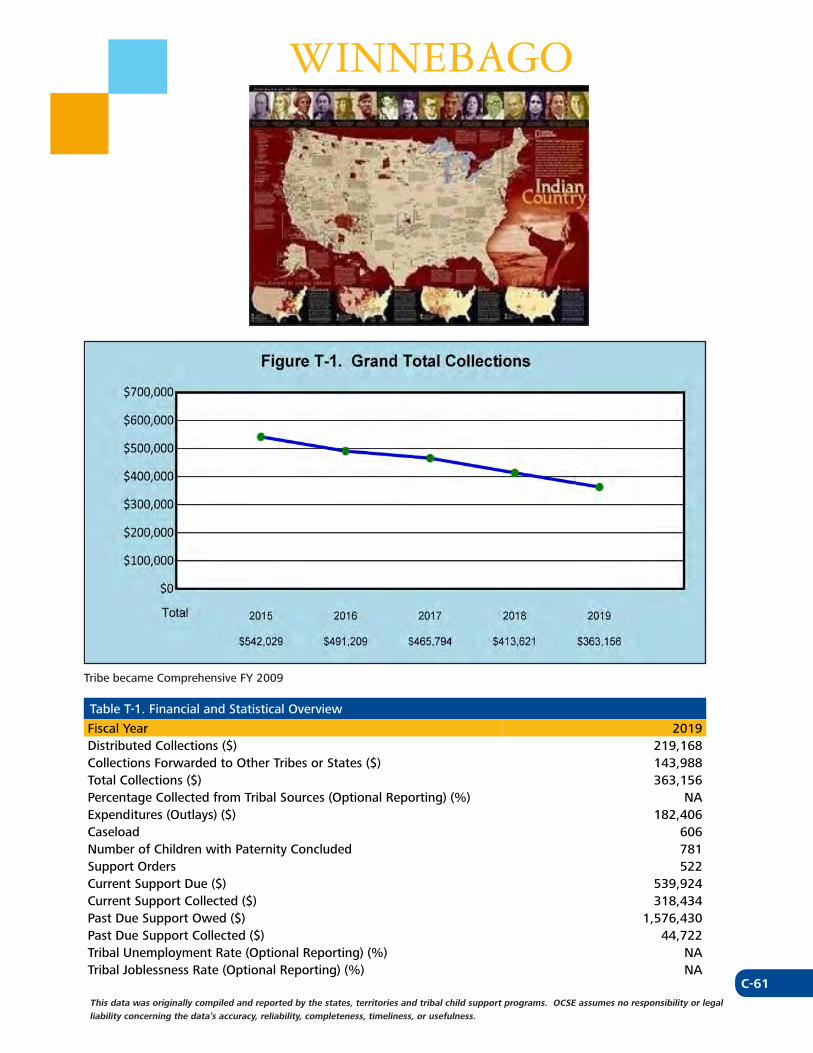
C-61This data was originally compiled and reported by the states, territories and tribal child support programs. OCSE assumes no responsibility or legal liability concerning the data’s accuracy, reliability, completeness, timeliness, or usefulness.
WINNEBAGO
Tribe became Comprehensive FY 2009
Table T-1. Financial and Statistical Overview
Fiscal Year 2019Distributed Collections ($) 219,168Collections Forwarded to Other Tribes or States ($) 143,988Total Collections ($) 363,156Percentage Collected from Tribal Sources (Optional Reporting) (%) NAExpenditures (Outlays) ($) 182,406Caseload 606Number of Children with Paternity Concluded 781Support Orders 522Current Support Due ($) 539,924Current Support Collected ($) 318,434Past Due Support Owed ($) 1,576,430Past Due Support Collected ($) 44,722Tribal Unemployment Rate (Optional Reporting) (%) NATribal Joblessness Rate (Optional Reporting) (%) NA
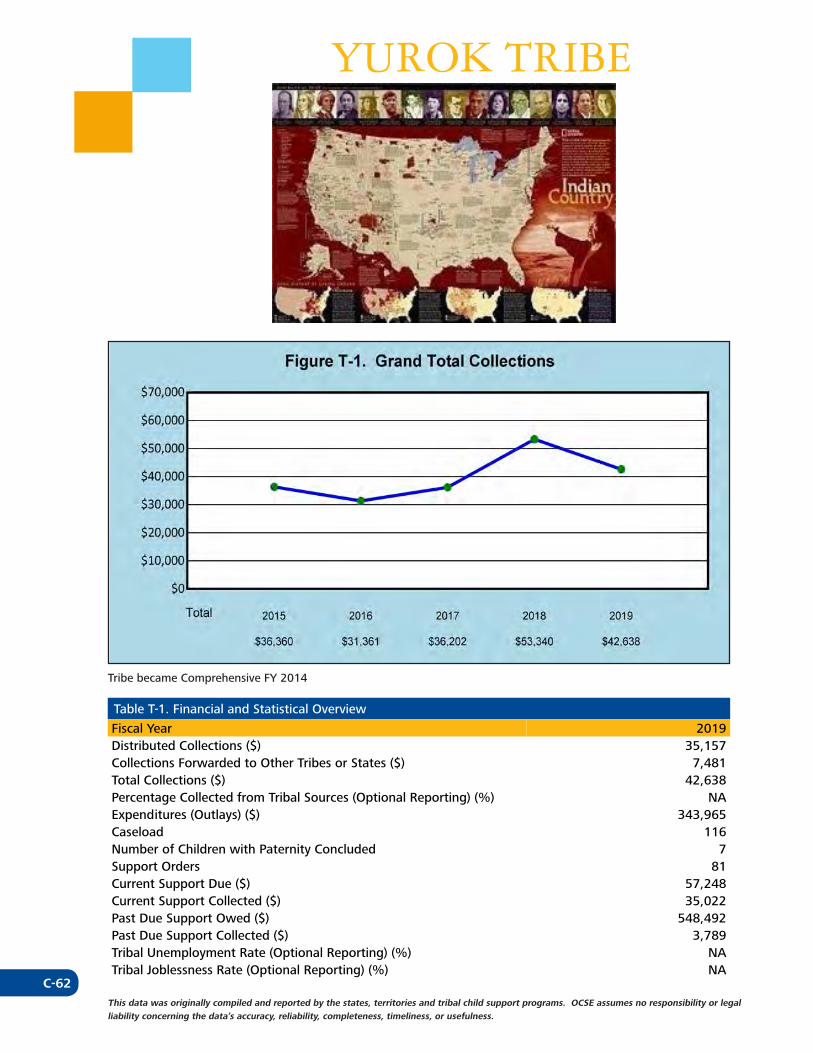
C-62This data was originally compiled and reported by the states, territories and tribal child support programs. OCSE assumes no responsibility or legal liability concerning the data’s accuracy, reliability, completeness, timeliness, or usefulness.
YUROK TRIBE
Tribe became Comprehensive FY 2014
Table T-1. Financial and Statistical Overview
Fiscal Year 2019Distributed Collections ($) 35,157Collections Forwarded to Other Tribes or States ($) 7,481Total Collections ($) 42,638Percentage Collected from Tribal Sources (Optional Reporting) (%) NAExpenditures (Outlays) ($) 343,965Caseload 116Number of Children with Paternity Concluded 7Support Orders 81Current Support Due ($) 57,248Current Support Collected ($) 35,022Past Due Support Owed ($) 548,492Past Due Support Collected ($) 3,789Tribal Unemployment Rate (Optional Reporting) (%) NATribal Joblessness Rate (Optional Reporting) (%) NA
D-1
DATA Tables
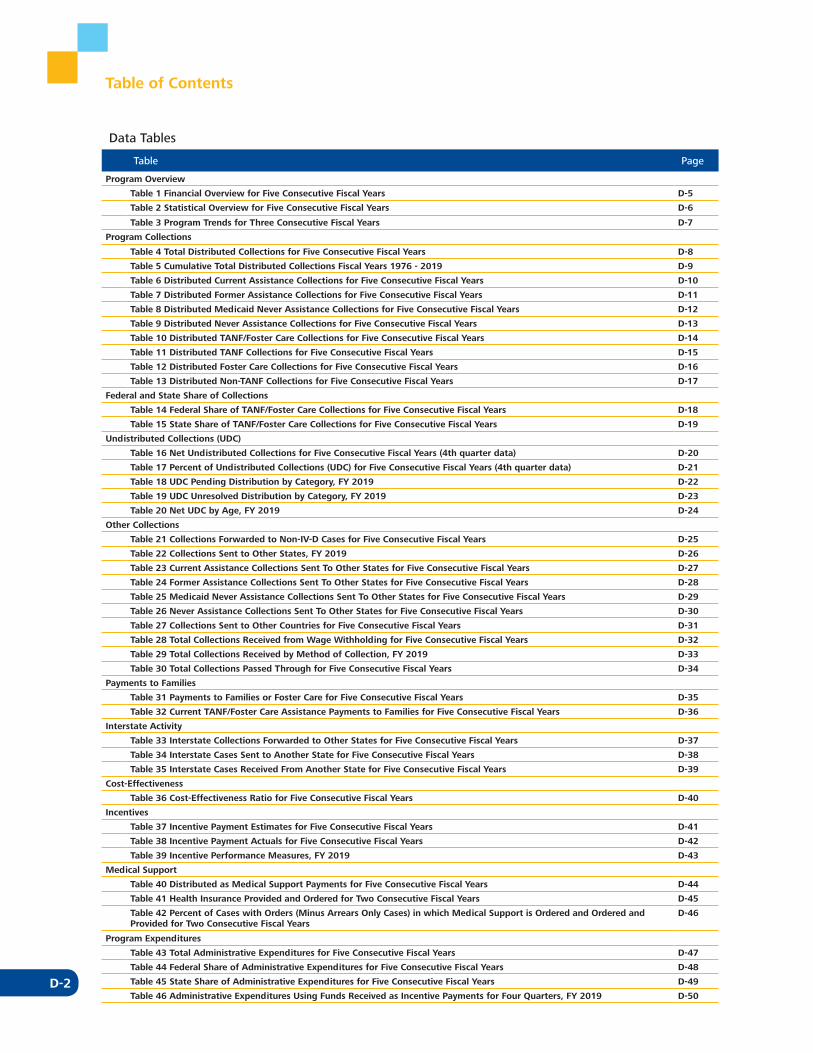
D-2
Table of Contents
Data Tables
Table Page
Program Overview
Table 1 Financial Overview for Five Consecutive Fiscal Years D-5
Table 2 Statistical Overview for Five Consecutive Fiscal Years D-6
Table 3 Program Trends for Three Consecutive Fiscal Years D-7
Program Collections
Table 4 Total Distributed Collections for Five Consecutive Fiscal Years D-8
Table 5 Cumulative Total Distributed Collections Fiscal Years 1976 - 2019 D-9
Table 6 Distributed Current Assistance Collections for Five Consecutive Fiscal Years D-10
Table 7 Distributed Former Assistance Collections for Five Consecutive Fiscal Years D-11
Table 8 Distributed Medicaid Never Assistance Collections for Five Consecutive Fiscal Years D-12
Table 9 Distributed Never Assistance Collections for Five Consecutive Fiscal Years D-13
Table 10 Distributed TANF/Foster Care Collections for Five Consecutive Fiscal Years D-14
Table 11 Distributed TANF Collections for Five Consecutive Fiscal Years D-15
Table 12 Distributed Foster Care Collections for Five Consecutive Fiscal Years D-16
Table 13 Distributed Non-TANF Collections for Five Consecutive Fiscal Years D-17
Federal and State Share of Collections
Table 14 Federal Share of TANF/Foster Care Collections for Five Consecutive Fiscal Years D-18
Table 15 State Share of TANF/Foster Care Collections for Five Consecutive Fiscal Years D-19
Undistributed Collections (UDC)
Table 16 Net Undistributed Collections for Five Consecutive Fiscal Years (4th quarter data) D-20
Table 17 Percent of Undistributed Collections (UDC) for Five Consecutive Fiscal Years (4th quarter data) D-21
Table 18 UDC Pending Distribution by Category, FY 2019 D-22
Table 19 UDC Unresolved Distribution by Category, FY 2019 D-23
Table 20 Net UDC by Age, FY 2019 D-24
Other Collections
Table 21 Collections Forwarded to Non-IV-D Cases for Five Consecutive Fiscal Years D-25
Table 22 Collections Sent to Other States, FY 2019 D-26
Table 23 Current Assistance Collections Sent To Other States for Five Consecutive Fiscal Years D-27
Table 24 Former Assistance Collections Sent To Other States for Five Consecutive Fiscal Years D-28
Table 25 Medicaid Never Assistance Collections Sent To Other States for Five Consecutive Fiscal Years D-29
Table 26 Never Assistance Collections Sent To Other States for Five Consecutive Fiscal Years D-30
Table 27 Collections Sent to Other Countries for Five Consecutive Fiscal Years D-31
Table 28 Total Collections Received from Wage Withholding for Five Consecutive Fiscal Years D-32
Table 29 Total Collections Received by Method of Collection, FY 2019 D-33
Table 30 Total Collections Passed Through for Five Consecutive Fiscal Years D-34
Payments to Families
Table 31 Payments to Families or Foster Care for Five Consecutive Fiscal Years D-35
Table 32 Current TANF/Foster Care Assistance Payments to Families for Five Consecutive Fiscal Years D-36
Interstate Activity
Table 33 Interstate Collections Forwarded to Other States for Five Consecutive Fiscal Years D-37
Table 34 Interstate Cases Sent to Another State for Five Consecutive Fiscal Years D-38
Table 35 Interstate Cases Received From Another State for Five Consecutive Fiscal Years D-39
Cost-Effectiveness
Table 36 Cost-Effectiveness Ratio for Five Consecutive Fiscal Years D-40
Incentives
Table 37 Incentive Payment Estimates for Five Consecutive Fiscal Years D-41
Table 38 Incentive Payment Actuals for Five Consecutive Fiscal Years D-42
Table 39 Incentive Performance Measures, FY 2019 D-43
Medical Support
Table 40 Distributed as Medical Support Payments for Five Consecutive Fiscal Years D-44
Table 41 Health Insurance Provided and Ordered for Two Consecutive Fiscal Years D-45
Table 42 Percent of Cases with Orders (Minus Arrears Only Cases) in which Medical Support is Ordered and Ordered and Provided for Two Consecutive Fiscal Years
D-46
Program Expenditures
Table 43 Total Administrative Expenditures for Five Consecutive Fiscal Years D-47
Table 44 Federal Share of Administrative Expenditures for Five Consecutive Fiscal Years D-48
Table 45 State Share of Administrative Expenditures for Five Consecutive Fiscal Years D-49
Table 46 Administrative Expenditures Using Funds Received as Incentive Payments for Four Quarters, FY 2019 D-50
D-3
Data Tables
Table Page
Table 47 Non-IV-D Costs for Five Consecutive Fiscal Years D-51
Functional Costs
Table 48 ADP Expenditures for Five Consecutive Fiscal Years D-52
Fees
Table 49 Fees Charged by OCSE, FY 2019 D-53
Table 50 Fees and Costs Recovered in Excess of Fees for Five Consecutive Fiscal Years D-54
Table 51 Fees Retained by Other States for Five Consecutive Fiscal Years D-55
Cases and Caseloads
Table 52 Total Caseload for Five Consecutive Fiscal Years D-56
Table 53 Cases Open at the End of the Fiscal Year for Five Consecutive Fiscal Years D-57
Table 54 Cases for Which the State Has No Jurisdiction for Five Consecutive Fiscal Years D-58
Table 55 Total Caseload by Current Assistance for Five Consecutive Fiscal Years D-59
Table 56 Total Caseload by Former Assistance for Five Consecutive Fiscal Years D-60
Table 57 Total Caseload by Never Assistance for Five Consecutive Fiscal Years D-61
Table 58 Medicaid-Only Cases Open at the End of the Fiscal Year for Five Consecutive Fiscal Years D-62
Table 59 State-Tribal Cases Initiated in This State Open at the End of the Fiscal Year for Five Consecutive Fiscal Years D-63
Table 60 State-Tribal Cases Received From a Tribal IV-D Program Open at the End of the Fiscal Year for Five Consecutive Fiscal Years
D-64
Table 61 International Cases Initiated in This State Open at the End of the Fiscal Year for Five Consecutive Fiscal Years D-65
Table 62 International Cases Received From Another Country Open at the End of the Fiscal Year for Five Consecutive Fiscal Years
D-66
Table 63 Cases With Medical Coverage Received from Any Source for Five Consecutive Fiscal Years D-67
Orders Established
Table 64 Total Cases with Support Orders Established for Five Consecutive Fiscal Years D-68
Table 65 Cases with Orders Established by Current, Former, and Never Assistance, FY 2019 D-69
Table 66 Medicaid-Only Cases With Orders Established Open at the End of the Fiscal Year for Five Consecutive Fiscal Years D-70
Table 67 State-Tribal IV-D Cases With Support Orders Established Initiated in This State for Five Consecutive Fiscal Years D-71
Table 68 State-Tribal IV-D Cases With Support Orders Established Received From a Tribe for Five Consecutive Fiscal Years D-72
Table 69 International Cases With Support Orders Established Initiated in This State for Five Consecutive Fiscal Years D-73
Table 70 International Cases With Support Orders Established Received From Another Country for Five Consecutive Fiscal Years
D-74
Paternities
Table 71 Total Number of Paternities Established or Acknowledged for Five Consecutive Fiscal Years D-75
Table 72 Paternity Establishment for Two Consecutive Fiscal Years D-76
Services Provided
Table 73 TANF Cases Closed Where a Child Support Payment Was Received for Five Consecutive Fiscal Years D-77
Table 74 Number of Support Orders Established During the Fiscal Year for Five Consecutive Fiscal Years D-78
Table 75 Number of Cases in Which a Collection Was Made on an Obligation for Five Consecutive Fiscal Years D-79
Table 76 Cases Sent to Another State for Five Consecutive Fiscal Years D-80
Table 77 Cases Received from Another State for Five Consecutive Fiscal Years D-81
Services Required
Table 78 Cases Requiring Services to Establish a Support Order for Five Consecutive Fiscal Years D-82
Table 79 Children Requiring Paternity Determination Services for Five Consecutive Fiscal Years D-83
Staff
Table 80 Total Full-Time Equivalent Staff for Five Consecutive Fiscal Years D-84
Table 81 Full-Time Equivalent Staff by State and Local, Cooperative Agreement, and Privatized IV-D Offices for Two Consecutive Fiscal Years
D-85
Table 82 Costs and Staff Associated with the Office of Child Support Enforcement for Five Consecutive Fiscal Years D-86
Current Support
Table 83 Amount of Current Support Due for Five Consecutive Fiscal Years D-87
Table 84 Amount of Support Distributed as Current Support for Five Consecutive Fiscal Years D-88
Arrears
Table 85 Total Amount of Arrearages Due for All Fiscal Years for Five Consecutive Fiscal Years D-89
Table 86 Total Amount of Support Distributed as Arrears for Five Consecutive Fiscal Years D-90
Table 87 Cases with Arrears Due for Five Consecutive Fiscal Years D-91
Table 88 Cases Paying Towards Arrears for Five Consecutive Fiscal Years D-92
Table 89 Certified Federal Offset Caseload and Arrearage Amount Totals, 2019 D-93
D-4
Data Tables
Table Page
Non-Cooperation and Good Cause
Table 90 Cases Open with a Determination of Non-Cooperation for Five Consecutive Fiscal Years D-94
Table 91 Cases Open with Good Cause Determinations for Five Consecutive Fiscal Years D-95
Children
Table 92 Children with Paternity Resolved for Five Consecutive Fiscal Years D-96
Table 93 Total Number of Children in IV-D Cases for Five Consecutive Fiscal Years D-97
Table 94 Number of Children Determined Eligible For Medicaid for Five Consecutive Fiscal Years D-98
Table 95 Number of Children Determined Eligible For Medicaid Covered by Private Health Insurance for Five Consecutive Fiscal Years
D-99
Federal Systems
Table 96 Tax Offset and Administrative Offset Programs (TANF and Non-TANF Combined), 2019 D-100
Table 97 Federal Systems, FY 2019 D-101
Table 98 Federal Systems, 2019 D-102
Table 99 Federal Systems National Directory of New Hires (NDNH), FY 2019 D-103
Table 100 Federal Systems Number of Cases in the FCR, FY 2019 D-104
Table 101 Federal Systems Number of Unique Persons in the FCR by Participant Type, FY 2019 D-105
Table 102 Federal Systems Number of Unique Persons (NCPs and PFs) in the FCR Matched by Participant Type, FY 2019 D-106
Table 103 Federal Systems Net Collections - Federal Offset Program, 2019 D-107
Table 104 Federal Systems Number of Offsets - Federal Offset Program, 2019 D-108
Table 105 Federal Systems Number of Unique Persons With Known and Unknown SSN Located through the Federal Parent Locator Service (FPLS), FY 2019
D-109
Table 106 Federal Systems Number of Unique Persons With Unknown SSN Located through the Federal Parent Locator Service (FPLS), FY 2019
D-110
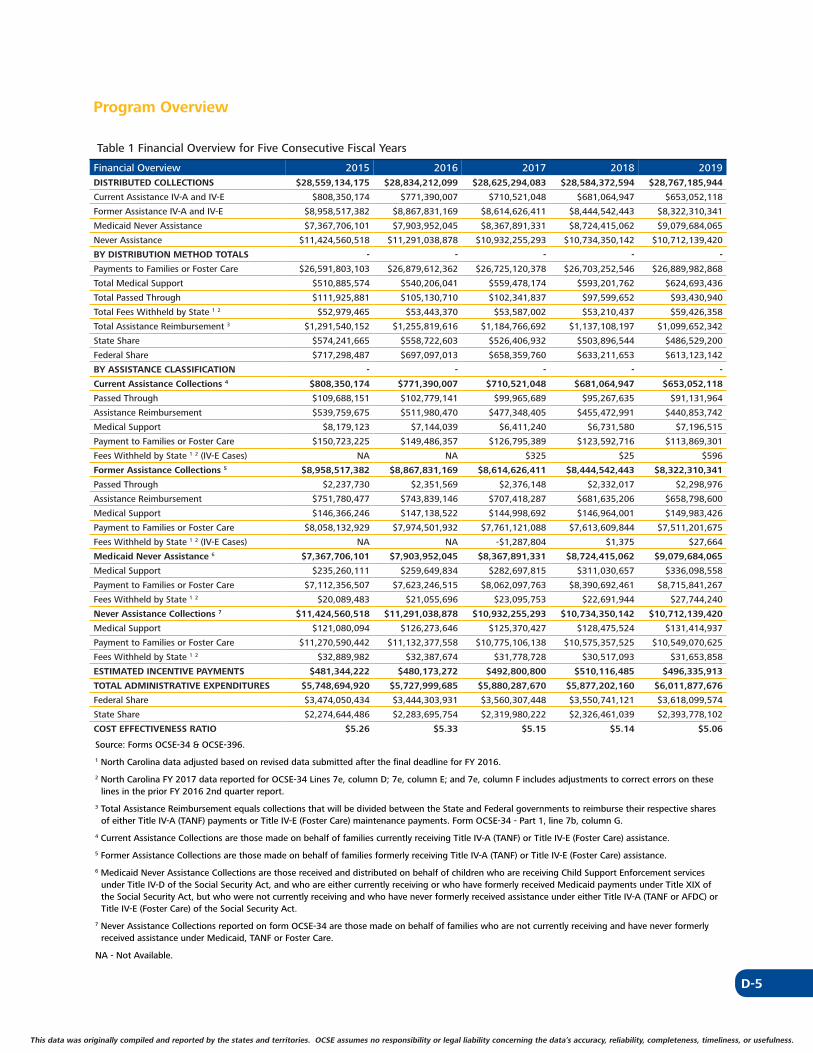
D-5
This data was originally compiled and reported by the states and territories. OCSE assumes no responsibility or legal liability concerning the data’s accuracy, reliability, completeness, timeliness, or usefulness.
Program Overview
Table 1 Financial Overview for Five Consecutive Fiscal Years
Financial Overview 2015 2016 2017 2018 2019DISTRIBUTED COLLECTIONS $28,559,134,175 $28,834,212,099 $28,625,294,083 $28,584,372,594 $28,767,185,944
Current Assistance IV-A and IV-E $808,350,174 $771,390,007 $710,521,048 $681,064,947 $653,052,118
Former Assistance IV-A and IV-E $8,958,517,382 $8,867,831,169 $8,614,626,411 $8,444,542,443 $8,322,310,341
Medicaid Never Assistance $7,367,706,101 $7,903,952,045 $8,367,891,331 $8,724,415,062 $9,079,684,065
Never Assistance $11,424,560,518 $11,291,038,878 $10,932,255,293 $10,734,350,142 $10,712,139,420
BY DISTRIBUTION METHOD TOTALS - - - - -
Payments to Families or Foster Care $26,591,803,103 $26,879,612,362 $26,725,120,378 $26,703,252,546 $26,889,982,868
Total Medical Support $510,885,574 $540,206,041 $559,478,174 $593,201,762 $624,693,436
Total Passed Through $111,925,881 $105,130,710 $102,341,837 $97,599,652 $93,430,940
Total Fees Withheld by State 1 2 $52,979,465 $53,443,370 $53,587,002 $53,210,437 $59,426,358
Total Assistance Reimbursement 3 $1,291,540,152 $1,255,819,616 $1,184,766,692 $1,137,108,197 $1,099,652,342
State Share $574,241,665 $558,722,603 $526,406,932 $503,896,544 $486,529,200
Federal Share $717,298,487 $697,097,013 $658,359,760 $633,211,653 $613,123,142
BY ASSISTANCE CLASSIFICATION - - - - -
Current Assistance Collections 4 $808,350,174 $771,390,007 $710,521,048 $681,064,947 $653,052,118
Passed Through $109,688,151 $102,779,141 $99,965,689 $95,267,635 $91,131,964
Assistance Reimbursement $539,759,675 $511,980,470 $477,348,405 $455,472,991 $440,853,742
Medical Support $8,179,123 $7,144,039 $6,411,240 $6,731,580 $7,196,515
Payment to Families or Foster Care $150,723,225 $149,486,357 $126,795,389 $123,592,716 $113,869,301
Fees Withheld by State 1 2 (IV-E Cases) NA NA $325 $25 $596
Former Assistance Collections 5 $8,958,517,382 $8,867,831,169 $8,614,626,411 $8,444,542,443 $8,322,310,341
Passed Through $2,237,730 $2,351,569 $2,376,148 $2,332,017 $2,298,976
Assistance Reimbursement $751,780,477 $743,839,146 $707,418,287 $681,635,206 $658,798,600
Medical Support $146,366,246 $147,138,522 $144,998,692 $146,964,001 $149,983,426
Payment to Families or Foster Care $8,058,132,929 $7,974,501,932 $7,761,121,088 $7,613,609,844 $7,511,201,675
Fees Withheld by State 1 2 (IV-E Cases) NA NA -$1,287,804 $1,375 $27,664
Medicaid Never Assistance 6 $7,367,706,101 $7,903,952,045 $8,367,891,331 $8,724,415,062 $9,079,684,065
Medical Support $235,260,111 $259,649,834 $282,697,815 $311,030,657 $336,098,558
Payment to Families or Foster Care $7,112,356,507 $7,623,246,515 $8,062,097,763 $8,390,692,461 $8,715,841,267
Fees Withheld by State 1 2 $20,089,483 $21,055,696 $23,095,753 $22,691,944 $27,744,240
Never Assistance Collections 7 $11,424,560,518 $11,291,038,878 $10,932,255,293 $10,734,350,142 $10,712,139,420
Medical Support $121,080,094 $126,273,646 $125,370,427 $128,475,524 $131,414,937
Payment to Families or Foster Care $11,270,590,442 $11,132,377,558 $10,775,106,138 $10,575,357,525 $10,549,070,625
Fees Withheld by State 1 2 $32,889,982 $32,387,674 $31,778,728 $30,517,093 $31,653,858
ESTIMATED INCENTIVE PAYMENTS $481,344,222 $480,173,272 $492,800,800 $510,116,485 $496,335,913
TOTAL ADMINISTRATIVE EXPENDITURES $5,748,694,920 $5,727,999,685 $5,880,287,670 $5,877,202,160 $6,011,877,676
Federal Share $3,474,050,434 $3,444,303,931 $3,560,307,448 $3,550,741,121 $3,618,099,574
State Share $2,274,644,486 $2,283,695,754 $2,319,980,222 $2,326,461,039 $2,393,778,102
COST EFFECTIVENESS RATIO $5.26 $5.33 $5.15 $5.14 $5.06
Source: Forms OCSE-34 & OCSE-396.
1 North Carolina data adjusted based on revised data submitted after the final deadline for FY 2016.
2 North Carolina FY 2017 data reported for OCSE-34 Lines 7e, column D; 7e, column E; and 7e, column F includes adjustments to correct errors on these lines in the prior FY 2016 2nd quarter report.
3 Total Assistance Reimbursement equals collections that will be divided between the State and Federal governments to reimburse their respective shares of either Title IV-A (TANF) payments or Title IV-E (Foster Care) maintenance payments. Form OCSE-34 - Part 1, line 7b, column G.
4 Current Assistance Collections are those made on behalf of families currently receiving Title IV-A (TANF) or Title IV-E (Foster Care) assistance.
5 Former Assistance Collections are those made on behalf of families formerly receiving Title IV-A (TANF) or Title IV-E (Foster Care) assistance.
6 Medicaid Never Assistance Collections are those received and distributed on behalf of children who are receiving Child Support Enforcement services under Title IV-D of the Social Security Act, and who are either currently receiving or who have formerly received Medicaid payments under Title XIX of the Social Security Act, but who were not currently receiving and who have never formerly received assistance under either Title IV-A (TANF or AFDC) or Title IV-E (Foster Care) of the Social Security Act.
7 Never Assistance Collections reported on form OCSE-34 are those made on behalf of families who are not currently receiving and have never formerly received assistance under Medicaid, TANF or Foster Care.
NA - Not Available.
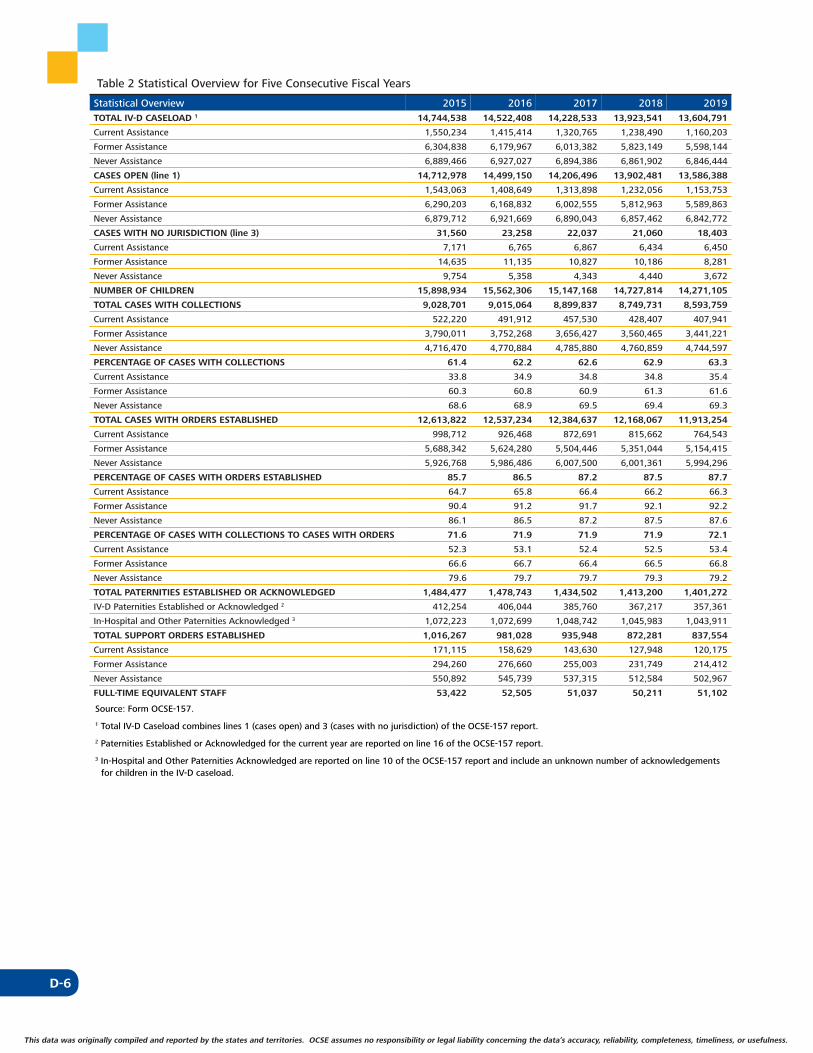
D-6
This data was originally compiled and reported by the states and territories. OCSE assumes no responsibility or legal liability concerning the data’s accuracy, reliability, completeness, timeliness, or usefulness.
Table 2 Statistical Overview for Five Consecutive Fiscal Years
Statistical Overview 2015 2016 2017 2018 2019TOTAL IV-D CASELOAD 1 14,744,538 14,522,408 14,228,533 13,923,541 13,604,791
Current Assistance 1,550,234 1,415,414 1,320,765 1,238,490 1,160,203
Former Assistance 6,304,838 6,179,967 6,013,382 5,823,149 5,598,144
Never Assistance 6,889,466 6,927,027 6,894,386 6,861,902 6,846,444
CASES OPEN (line 1) 14,712,978 14,499,150 14,206,496 13,902,481 13,586,388
Current Assistance 1,543,063 1,408,649 1,313,898 1,232,056 1,153,753
Former Assistance 6,290,203 6,168,832 6,002,555 5,812,963 5,589,863
Never Assistance 6,879,712 6,921,669 6,890,043 6,857,462 6,842,772
CASES WITH NO JURISDICTION (line 3) 31,560 23,258 22,037 21,060 18,403
Current Assistance 7,171 6,765 6,867 6,434 6,450
Former Assistance 14,635 11,135 10,827 10,186 8,281
Never Assistance 9,754 5,358 4,343 4,440 3,672
NUMBER OF CHILDREN 15,898,934 15,562,306 15,147,168 14,727,814 14,271,105
TOTAL CASES WITH COLLECTIONS 9,028,701 9,015,064 8,899,837 8,749,731 8,593,759
Current Assistance 522,220 491,912 457,530 428,407 407,941
Former Assistance 3,790,011 3,752,268 3,656,427 3,560,465 3,441,221
Never Assistance 4,716,470 4,770,884 4,785,880 4,760,859 4,744,597
PERCENTAGE OF CASES WITH COLLECTIONS 61.4 62.2 62.6 62.9 63.3
Current Assistance 33.8 34.9 34.8 34.8 35.4
Former Assistance 60.3 60.8 60.9 61.3 61.6
Never Assistance 68.6 68.9 69.5 69.4 69.3
TOTAL CASES WITH ORDERS ESTABLISHED 12,613,822 12,537,234 12,384,637 12,168,067 11,913,254
Current Assistance 998,712 926,468 872,691 815,662 764,543
Former Assistance 5,688,342 5,624,280 5,504,446 5,351,044 5,154,415
Never Assistance 5,926,768 5,986,486 6,007,500 6,001,361 5,994,296
PERCENTAGE OF CASES WITH ORDERS ESTABLISHED 85.7 86.5 87.2 87.5 87.7
Current Assistance 64.7 65.8 66.4 66.2 66.3
Former Assistance 90.4 91.2 91.7 92.1 92.2
Never Assistance 86.1 86.5 87.2 87.5 87.6
PERCENTAGE OF CASES WITH COLLECTIONS TO CASES WITH ORDERS 71.6 71.9 71.9 71.9 72.1
Current Assistance 52.3 53.1 52.4 52.5 53.4
Former Assistance 66.6 66.7 66.4 66.5 66.8
Never Assistance 79.6 79.7 79.7 79.3 79.2
TOTAL PATERNITIES ESTABLISHED OR ACKNOWLEDGED 1,484,477 1,478,743 1,434,502 1,413,200 1,401,272
IV-D Paternities Established or Acknowledged 2 412,254 406,044 385,760 367,217 357,361
In-Hospital and Other Paternities Acknowledged 3 1,072,223 1,072,699 1,048,742 1,045,983 1,043,911
TOTAL SUPPORT ORDERS ESTABLISHED 1,016,267 981,028 935,948 872,281 837,554
Current Assistance 171,115 158,629 143,630 127,948 120,175
Former Assistance 294,260 276,660 255,003 231,749 214,412
Never Assistance 550,892 545,739 537,315 512,584 502,967
FULL-TIME EQUIVALENT STAFF 53,422 52,505 51,037 50,211 51,102
Source: Form OCSE-157.
1 Total IV-D Caseload combines lines 1 (cases open) and 3 (cases with no jurisdiction) of the OCSE-157 report.
2 Paternities Established or Acknowledged for the current year are reported on line 16 of the OCSE-157 report.
3 In-Hospital and Other Paternities Acknowledged are reported on line 10 of the OCSE-157 report and include an unknown number of acknowledgements for children in the IV-D caseload.
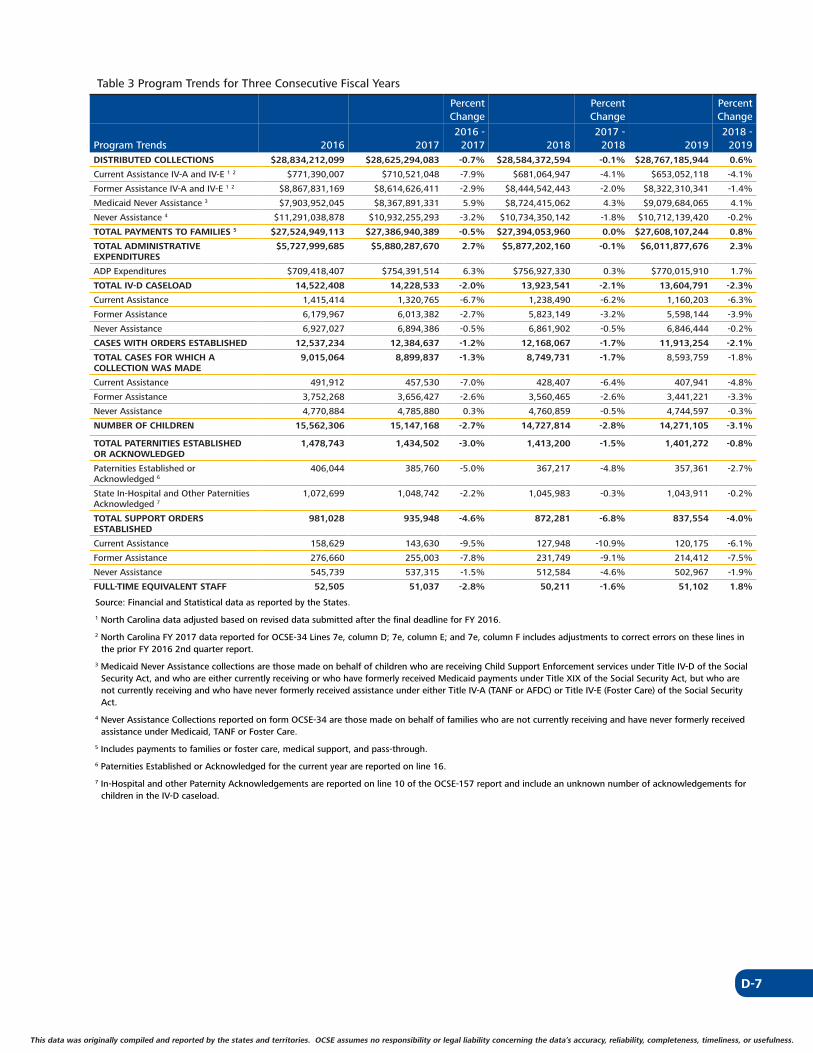
D-7
This data was originally compiled and reported by the states and territories. OCSE assumes no responsibility or legal liability concerning the data’s accuracy, reliability, completeness, timeliness, or usefulness. This data was originally compiled and reported by the states and territories. OCSE assumes no responsibility or legal liability concerning the data’s accuracy, reliability, completeness, timeliness, or usefulness.
Table 3 Program Trends for Three Consecutive Fiscal Years
Percent Percent Percent Change Change Change
2016 - 2017 - 2018 - Program Trends 2016 2017 2017 2018 2018 2019 2019DISTRIBUTED COLLECTIONS $28,834,212,099 $28,625,294,083 -0.7% $28,584,372,594 -0.1% $28,767,185,944 0.6%
Current Assistance IV-A and IV-E 1 2 $771,390,007 $710,521,048 -7.9% $681,064,947 -4.1% $653,052,118 -4.1%
Former Assistance IV-A and IV-E 1 2 $8,867,831,169 $8,614,626,411 -2.9% $8,444,542,443 -2.0% $8,322,310,341 -1.4%
Medicaid Never Assistance 3 $7,903,952,045 $8,367,891,331 5.9% $8,724,415,062 4.3% $9,079,684,065 4.1%
Never Assistance 4 $11,291,038,878 $10,932,255,293 -3.2% $10,734,350,142 -1.8% $10,712,139,420 -0.2%
TOTAL PAYMENTS TO FAMILIES 5 $27,524,949,113 $27,386,940,389 -0.5% $27,394,053,960 0.0% $27,608,107,244 0.8%
TOTAL ADMINISTRATIVE EXPENDITURES
$5,727,999,685 $5,880,287,670 2.7% $5,877,202,160 -0.1% $6,011,877,676 2.3%
ADP Expenditures $709,418,407 $754,391,514 6.3% $756,927,330 0.3% $770,015,910 1.7%
TOTAL IV-D CASELOAD 14,522,408 14,228,533 -2.0% 13,923,541 -2.1% 13,604,791 -2.3%
Current Assistance 1,415,414 1,320,765 -6.7% 1,238,490 -6.2% 1,160,203 -6.3%
Former Assistance 6,179,967 6,013,382 -2.7% 5,823,149 -3.2% 5,598,144 -3.9%
Never Assistance 6,927,027 6,894,386 -0.5% 6,861,902 -0.5% 6,846,444 -0.2%
CASES WITH ORDERS ESTABLISHED 12,537,234 12,384,637 -1.2% 12,168,067 -1.7% 11,913,254 -2.1%
TOTAL CASES FOR WHICH A COLLECTION WAS MADE
9,015,064 8,899,837 -1.3% 8,749,731 -1.7% 8,593,759 -1.8%
Current Assistance 491,912 457,530 -7.0% 428,407 -6.4% 407,941 -4.8%
Former Assistance 3,752,268 3,656,427 -2.6% 3,560,465 -2.6% 3,441,221 -3.3%
Never Assistance 4,770,884 4,785,880 0.3% 4,760,859 -0.5% 4,744,597 -0.3%
NUMBER OF CHILDREN 15,562,306 15,147,168 -2.7% 14,727,814 -2.8% 14,271,105 -3.1%
TOTAL PATERNITIES ESTABLISHED OR ACKNOWLEDGED
1,478,743 1,434,502 -3.0% 1,413,200 -1.5% 1,401,272 -0.8%
Paternities Established or Acknowledged 6
406,044 385,760 -5.0% 367,217 -4.8% 357,361 -2.7%
State In-Hospital and Other Paternities Acknowledged 7
1,072,699 1,048,742 -2.2% 1,045,983 -0.3% 1,043,911 -0.2%
TOTAL SUPPORT ORDERS ESTABLISHED
981,028 935,948 -4.6% 872,281 -6.8% 837,554 -4.0%
Current Assistance 158,629 143,630 -9.5% 127,948 -10.9% 120,175 -6.1%
Former Assistance 276,660 255,003 -7.8% 231,749 -9.1% 214,412 -7.5%
Never Assistance 545,739 537,315 -1.5% 512,584 -4.6% 502,967 -1.9%
FULL-TIME EQUIVALENT STAFF 52,505 51,037 -2.8% 50,211 -1.6% 51,102 1.8%
Source: Financial and Statistical data as reported by the States.
1 North Carolina data adjusted based on revised data submitted after the final deadline for FY 2016.
2 North Carolina FY 2017 data reported for OCSE-34 Lines 7e, column D; 7e, column E; and 7e, column F includes adjustments to correct errors on these lines in the prior FY 2016 2nd quarter report.
3 Medicaid Never Assistance collections are those made on behalf of children who are receiving Child Support Enforcement services under Title IV-D of the Social Security Act, and who are either currently receiving or who have formerly received Medicaid payments under Title XIX of the Social Security Act, but who are not currently receiving and who have never formerly received assistance under either Title IV-A (TANF or AFDC) or Title IV-E (Foster Care) of the Social Security Act.
4 Never Assistance Collections reported on form OCSE-34 are those made on behalf of families who are not currently receiving and have never formerly received assistance under Medicaid, TANF or Foster Care.
5 Includes payments to families or foster care, medical support, and pass-through.
6 Paternities Established or Acknowledged for the current year are reported on line 16.
7 In-Hospital and other Paternity Acknowledgements are reported on line 10 of the OCSE-157 report and include an unknown number of acknowledgements for children in the IV-D caseload.
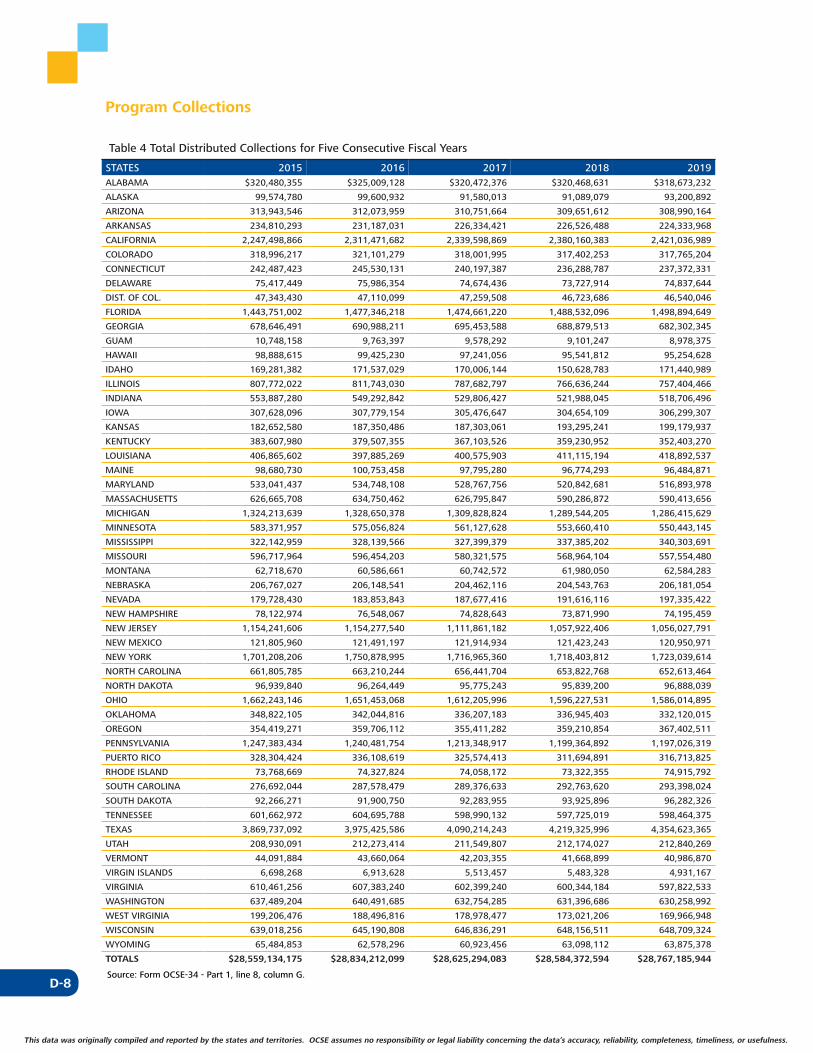
D-8
This data was originally compiled and reported by the states and territories. OCSE assumes no responsibility or legal liability concerning the data’s accuracy, reliability, completeness, timeliness, or usefulness.
Program Collections
Table 4 Total Distributed Collections for Five Consecutive Fiscal Years
STATES 2015 2016 2017 2018 2019ALABAMA $320,480,355 $325,009,128 $320,472,376 $320,468,631 $318,673,232
ALASKA 99,574,780 99,600,932 91,580,013 91,089,079 93,200,892
ARIZONA 313,943,546 312,073,959 310,751,664 309,651,612 308,990,164
ARKANSAS 234,810,293 231,187,031 226,334,421 226,526,488 224,333,968
CALIFORNIA 2,247,498,866 2,311,471,682 2,339,598,869 2,380,160,383 2,421,036,989
COLORADO 318,996,217 321,101,279 318,001,995 317,402,253 317,765,204
CONNECTICUT 242,487,423 245,530,131 240,197,387 236,288,787 237,372,331
DELAWARE 75,417,449 75,986,354 74,674,436 73,727,914 74,837,644
DIST. OF COL. 47,343,430 47,110,099 47,259,508 46,723,686 46,540,046
FLORIDA 1,443,751,002 1,477,346,218 1,474,661,220 1,488,532,096 1,498,894,649
GEORGIA 678,646,491 690,988,211 695,453,588 688,879,513 682,302,345
GUAM 10,748,158 9,763,397 9,578,292 9,101,247 8,978,375
HAWAII 98,888,615 99,425,230 97,241,056 95,541,812 95,254,628
IDAHO 169,281,382 171,537,029 170,006,144 150,628,783 171,440,989
ILLINOIS 807,772,022 811,743,030 787,682,797 766,636,244 757,404,466
INDIANA 553,887,280 549,292,842 529,806,427 521,988,045 518,706,496
IOWA 307,628,096 307,779,154 305,476,647 304,654,109 306,299,307
KANSAS 182,652,580 187,350,486 187,303,061 193,295,241 199,179,937
KENTUCKY 383,607,980 379,507,355 367,103,526 359,230,952 352,403,270
LOUISIANA 406,865,602 397,885,269 400,575,903 411,115,194 418,892,537
MAINE 98,680,730 100,753,458 97,795,280 96,774,293 96,484,871
MARYLAND 533,041,437 534,748,108 528,767,756 520,842,681 516,893,978
MASSACHUSETTS 626,665,708 634,750,462 626,795,847 590,286,872 590,413,656
MICHIGAN 1,324,213,639 1,328,650,378 1,309,828,824 1,289,544,205 1,286,415,629
MINNESOTA 583,371,957 575,056,824 561,127,628 553,660,410 550,443,145
MISSISSIPPI 322,142,959 328,139,566 327,399,379 337,385,202 340,303,691
MISSOURI 596,717,964 596,454,203 580,321,575 568,964,104 557,554,480
MONTANA 62,718,670 60,586,661 60,742,572 61,980,050 62,584,283
NEBRASKA 206,767,027 206,148,541 204,462,116 204,543,763 206,181,054
NEVADA 179,728,430 183,853,843 187,677,416 191,616,116 197,335,422
NEW HAMPSHIRE 78,122,974 76,548,067 74,828,643 73,871,990 74,195,459
NEW JERSEY 1,154,241,606 1,154,277,540 1,111,861,182 1,057,922,406 1,056,027,791
NEW MEXICO 121,805,960 121,491,197 121,914,934 121,423,243 120,950,971
NEW YORK 1,701,208,206 1,750,878,995 1,716,965,360 1,718,403,812 1,723,039,614
NORTH CAROLINA 661,805,785 663,210,244 656,441,704 653,822,768 652,613,464
NORTH DAKOTA 96,939,840 96,264,449 95,775,243 95,839,200 96,888,039
OHIO 1,662,243,146 1,651,453,068 1,612,205,996 1,596,227,531 1,586,014,895
OKLAHOMA 348,822,105 342,044,816 336,207,183 336,945,403 332,120,015
OREGON 354,419,271 359,706,112 355,411,282 359,210,854 367,402,511
PENNSYLVANIA 1,247,383,434 1,240,481,754 1,213,348,917 1,199,364,892 1,197,026,319
PUERTO RICO 328,304,424 336,108,619 325,574,413 311,694,891 316,713,825
RHODE ISLAND 73,768,669 74,327,824 74,058,172 73,322,355 74,915,792
SOUTH CAROLINA 276,692,044 287,578,479 289,376,633 292,763,620 293,398,024
SOUTH DAKOTA 92,266,271 91,900,750 92,283,955 93,925,896 96,282,326
TENNESSEE 601,662,972 604,695,788 598,990,132 597,725,019 598,464,375
TEXAS 3,869,737,092 3,975,425,586 4,090,214,243 4,219,325,996 4,354,623,365
UTAH 208,930,091 212,273,414 211,549,807 212,174,027 212,840,269
VERMONT 44,091,884 43,660,064 42,203,355 41,668,899 40,986,870
VIRGIN ISLANDS 6,698,268 6,913,628 5,513,457 5,483,328 4,931,167
VIRGINIA 610,461,256 607,383,240 602,399,240 600,344,184 597,822,533
WASHINGTON 637,489,204 640,491,685 632,754,285 631,396,686 630,258,992
WEST VIRGINIA 199,206,476 188,496,816 178,978,477 173,021,206 169,966,948
WISCONSIN 639,018,256 645,190,808 646,836,291 648,156,511 648,709,324
WYOMING 65,484,853 62,578,296 60,923,456 63,098,112 63,875,378
TOTALS $28,559,134,175 $28,834,212,099 $28,625,294,083 $28,584,372,594 $28,767,185,944
Source: Form OCSE-34 - Part 1, line 8, column G.
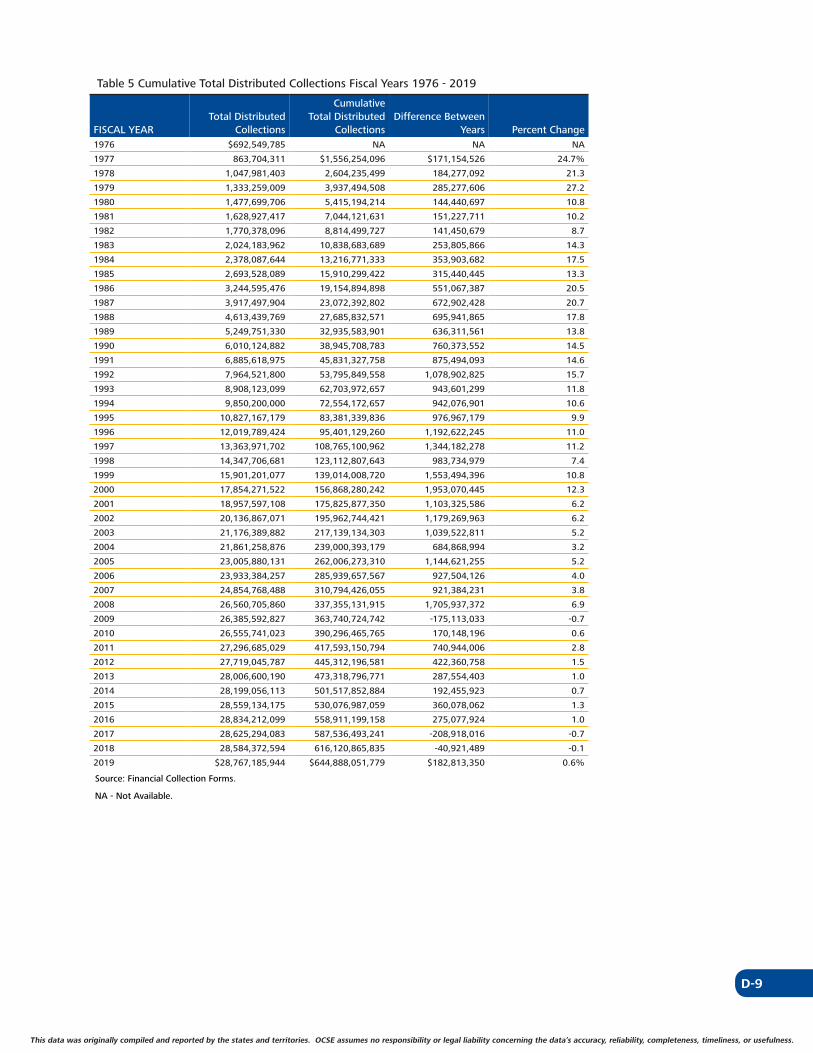
D-9
This data was originally compiled and reported by the states and territories. OCSE assumes no responsibility or legal liability concerning the data’s accuracy, reliability, completeness, timeliness, or usefulness. This data was originally compiled and reported by the states and territories. OCSE assumes no responsibility or legal liability concerning the data’s accuracy, reliability, completeness, timeliness, or usefulness.
Table 5 Cumulative Total Distributed Collections Fiscal Years 1976 - 2019
Cumulative Total Distributed Total Distributed Difference Between
FISCAL YEAR Collections Collections Years Percent Change1976 $692,549,785 NA NA NA
1977 863,704,311 $1,556,254,096 $171,154,526 24.7%
1978 1,047,981,403 2,604,235,499 184,277,092 21.3
1979 1,333,259,009 3,937,494,508 285,277,606 27.2
1980 1,477,699,706 5,415,194,214 144,440,697 10.8
1981 1,628,927,417 7,044,121,631 151,227,711 10.2
1982 1,770,378,096 8,814,499,727 141,450,679 8.7
1983 2,024,183,962 10,838,683,689 253,805,866 14.3
1984 2,378,087,644 13,216,771,333 353,903,682 17.5
1985 2,693,528,089 15,910,299,422 315,440,445 13.3
1986 3,244,595,476 19,154,894,898 551,067,387 20.5
1987 3,917,497,904 23,072,392,802 672,902,428 20.7
1988 4,613,439,769 27,685,832,571 695,941,865 17.8
1989 5,249,751,330 32,935,583,901 636,311,561 13.8
1990 6,010,124,882 38,945,708,783 760,373,552 14.5
1991 6,885,618,975 45,831,327,758 875,494,093 14.6
1992 7,964,521,800 53,795,849,558 1,078,902,825 15.7
1993 8,908,123,099 62,703,972,657 943,601,299 11.8
1994 9,850,200,000 72,554,172,657 942,076,901 10.6
1995 10,827,167,179 83,381,339,836 976,967,179 9.9
1996 12,019,789,424 95,401,129,260 1,192,622,245 11.0
1997 13,363,971,702 108,765,100,962 1,344,182,278 11.2
1998 14,347,706,681 123,112,807,643 983,734,979 7.4
1999 15,901,201,077 139,014,008,720 1,553,494,396 10.8
2000 17,854,271,522 156,868,280,242 1,953,070,445 12.3
2001 18,957,597,108 175,825,877,350 1,103,325,586 6.2
2002 20,136,867,071 195,962,744,421 1,179,269,963 6.2
2003 21,176,389,882 217,139,134,303 1,039,522,811 5.2
2004 21,861,258,876 239,000,393,179 684,868,994 3.2
2005 23,005,880,131 262,006,273,310 1,144,621,255 5.2
2006 23,933,384,257 285,939,657,567 927,504,126 4.0
2007 24,854,768,488 310,794,426,055 921,384,231 3.8
2008 26,560,705,860 337,355,131,915 1,705,937,372 6.9
2009 26,385,592,827 363,740,724,742 -175,113,033 -0.7
2010 26,555,741,023 390,296,465,765 170,148,196 0.6
2011 27,296,685,029 417,593,150,794 740,944,006 2.8
2012 27,719,045,787 445,312,196,581 422,360,758 1.5
2013 28,006,600,190 473,318,796,771 287,554,403 1.0
2014 28,199,056,113 501,517,852,884 192,455,923 0.7
2015 28,559,134,175 530,076,987,059 360,078,062 1.3
2016 28,834,212,099 558,911,199,158 275,077,924 1.0
2017 28,625,294,083 587,536,493,241 -208,918,016 -0.7
2018 28,584,372,594 616,120,865,835 -40,921,489 -0.1
2019 $28,767,185,944 $644,888,051,779 $182,813,350 0.6%
Source: Financial Collection Forms.
NA - Not Available.
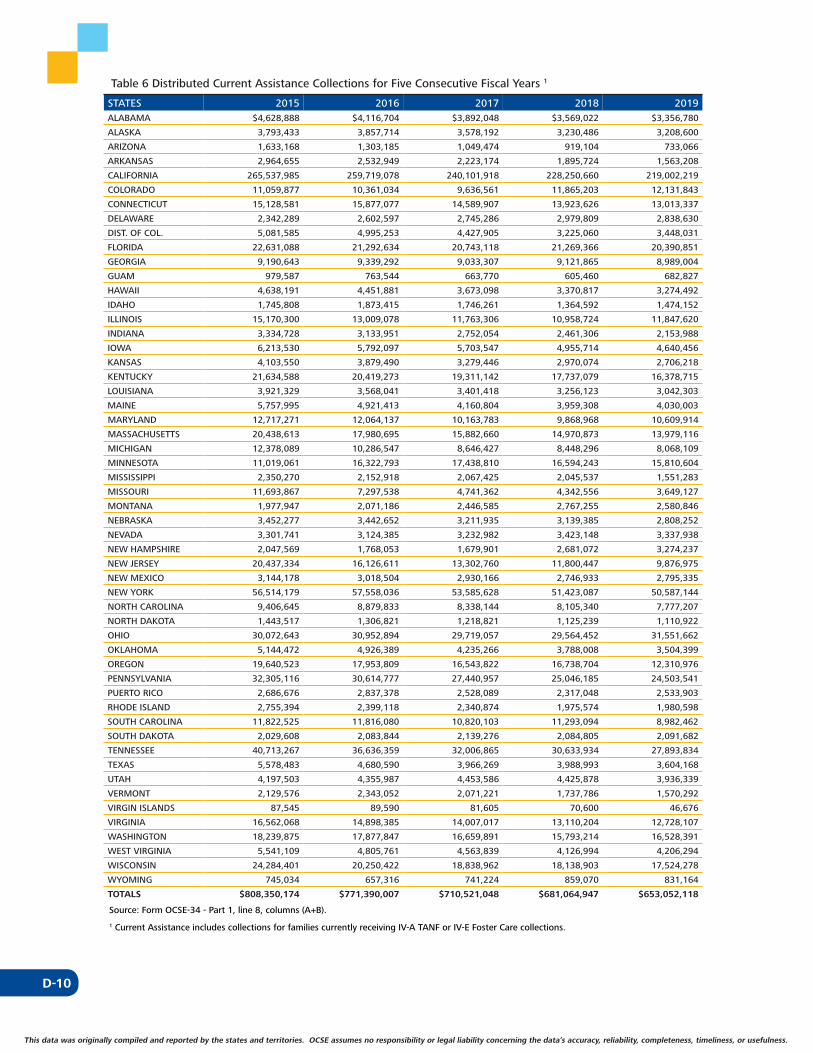
D-10
This data was originally compiled and reported by the states and territories. OCSE assumes no responsibility or legal liability concerning the data’s accuracy, reliability, completeness, timeliness, or usefulness.
Table 6 Distributed Current Assistance Collections for Five Consecutive Fiscal Years 1
STATES 2015 2016 2017 2018 2019ALABAMA $4,628,888 $4,116,704 $3,892,048 $3,569,022 $3,356,780
ALASKA 3,793,433 3,857,714 3,578,192 3,230,486 3,208,600
ARIZONA 1,633,168 1,303,185 1,049,474 919,104 733,066
ARKANSAS 2,964,655 2,532,949 2,223,174 1,895,724 1,563,208
CALIFORNIA 265,537,985 259,719,078 240,101,918 228,250,660 219,002,219
COLORADO 11,059,877 10,361,034 9,636,561 11,865,203 12,131,843
CONNECTICUT 15,128,581 15,877,077 14,589,907 13,923,626 13,013,337
DELAWARE 2,342,289 2,602,597 2,745,286 2,979,809 2,838,630
DIST. OF COL. 5,081,585 4,995,253 4,427,905 3,225,060 3,448,031
FLORIDA 22,631,088 21,292,634 20,743,118 21,269,366 20,390,851
GEORGIA 9,190,643 9,339,292 9,033,307 9,121,865 8,989,004
GUAM 979,587 763,544 663,770 605,460 682,827
HAWAII 4,638,191 4,451,881 3,673,098 3,370,817 3,274,492
IDAHO 1,745,808 1,873,415 1,746,261 1,364,592 1,474,152
ILLINOIS 15,170,300 13,009,078 11,763,306 10,958,724 11,847,620
INDIANA 3,334,728 3,133,951 2,752,054 2,461,306 2,153,988
IOWA 6,213,530 5,792,097 5,703,547 4,955,714 4,640,456
KANSAS 4,103,550 3,879,490 3,279,446 2,970,074 2,706,218
KENTUCKY 21,634,588 20,419,273 19,311,142 17,737,079 16,378,715
LOUISIANA 3,921,329 3,568,041 3,401,418 3,256,123 3,042,303
MAINE 5,757,995 4,921,413 4,160,804 3,959,308 4,030,003
MARYLAND 12,717,271 12,064,137 10,163,783 9,868,968 10,609,914
MASSACHUSETTS 20,438,613 17,980,695 15,882,660 14,970,873 13,979,116
MICHIGAN 12,378,089 10,286,547 8,646,427 8,448,296 8,068,109
MINNESOTA 11,019,061 16,322,793 17,438,810 16,594,243 15,810,604
MISSISSIPPI 2,350,270 2,152,918 2,067,425 2,045,537 1,551,283
MISSOURI 11,693,867 7,297,538 4,741,362 4,342,556 3,649,127
MONTANA 1,977,947 2,071,186 2,446,585 2,767,255 2,580,846
NEBRASKA 3,452,277 3,442,652 3,211,935 3,139,385 2,808,252
NEVADA 3,301,741 3,124,385 3,232,982 3,423,148 3,337,938
NEW HAMPSHIRE 2,047,569 1,768,053 1,679,901 2,681,072 3,274,237
NEW JERSEY 20,437,334 16,126,611 13,302,760 11,800,447 9,876,975
NEW MEXICO 3,144,178 3,018,504 2,930,166 2,746,933 2,795,335
NEW YORK 56,514,179 57,558,036 53,585,628 51,423,087 50,587,144
NORTH CAROLINA 9,406,645 8,879,833 8,338,144 8,105,340 7,777,207
NORTH DAKOTA 1,443,517 1,306,821 1,218,821 1,125,239 1,110,922
OHIO 30,072,643 30,952,894 29,719,057 29,564,452 31,551,662
OKLAHOMA 5,144,472 4,926,389 4,235,266 3,788,008 3,504,399
OREGON 19,640,523 17,953,809 16,543,822 16,738,704 12,310,976
PENNSYLVANIA 32,305,116 30,614,777 27,440,957 25,046,185 24,503,541
PUERTO RICO 2,686,676 2,837,378 2,528,089 2,317,048 2,533,903
RHODE ISLAND 2,755,394 2,399,118 2,340,874 1,975,574 1,980,598
SOUTH CAROLINA 11,822,525 11,816,080 10,820,103 11,293,094 8,982,462
SOUTH DAKOTA 2,029,608 2,083,844 2,139,276 2,084,805 2,091,682
TENNESSEE 40,713,267 36,636,359 32,006,865 30,633,934 27,893,834
TEXAS 5,578,483 4,680,590 3,966,269 3,988,993 3,604,168
UTAH 4,197,503 4,355,987 4,453,586 4,425,878 3,936,339
VERMONT 2,129,576 2,343,052 2,071,221 1,737,786 1,570,292
VIRGIN ISLANDS 87,545 89,590 81,605 70,600 46,676
VIRGINIA 16,562,068 14,898,385 14,007,017 13,110,204 12,728,107
WASHINGTON 18,239,875 17,877,847 16,659,891 15,793,214 16,528,391
WEST VIRGINIA 5,541,109 4,805,761 4,563,839 4,126,994 4,206,294
WISCONSIN 24,284,401 20,250,422 18,838,962 18,138,903 17,524,278
WYOMING 745,034 657,316 741,224 859,070 831,164
TOTALS $808,350,174 $771,390,007 $710,521,048 $681,064,947 $653,052,118
Source: Form OCSE-34 - Part 1, line 8, columns (A+B).
1 Current Assistance includes collections for families currently receiving IV-A TANF or IV-E Foster Care collections.
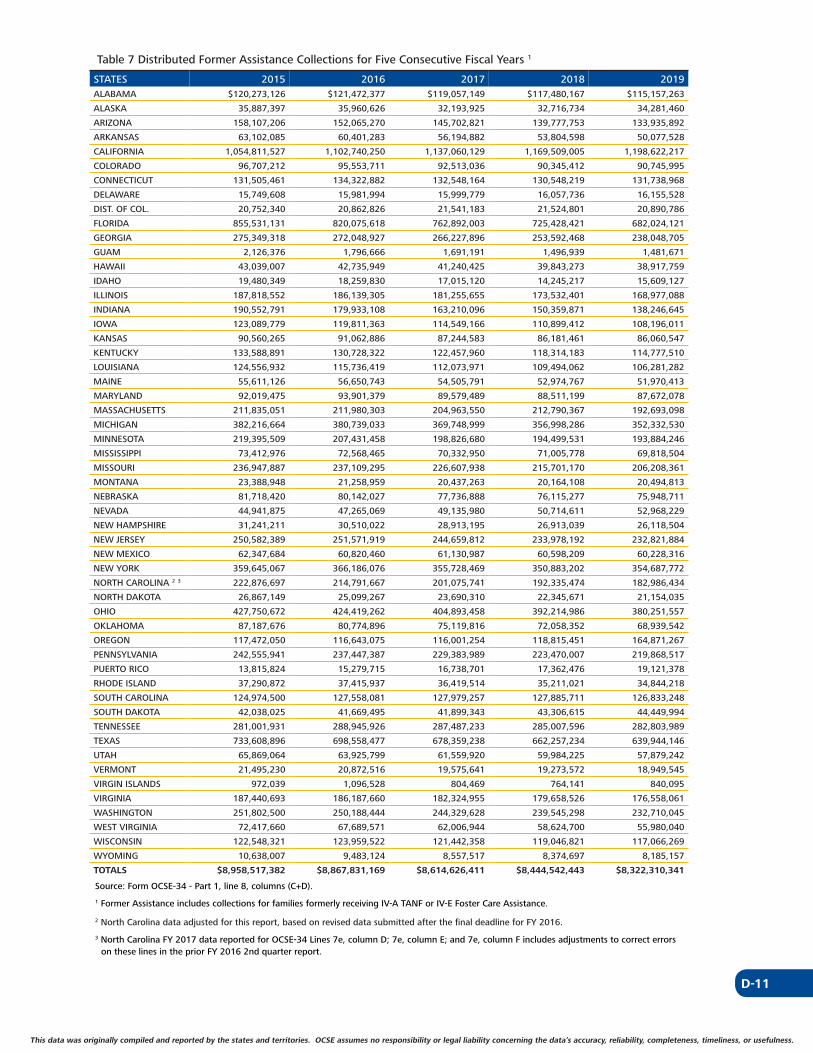
D-11
This data was originally compiled and reported by the states and territories. OCSE assumes no responsibility or legal liability concerning the data’s accuracy, reliability, completeness, timeliness, or usefulness. This data was originally compiled and reported by the states and territories. OCSE assumes no responsibility or legal liability concerning the data’s accuracy, reliability, completeness, timeliness, or usefulness.
Table 7 Distributed Former Assistance Collections for Five Consecutive Fiscal Years 1
STATES 2015 2016 2017 2018 2019ALABAMA $120,273,126 $121,472,377 $119,057,149 $117,480,167 $115,157,263
ALASKA 35,887,397 35,960,626 32,193,925 32,716,734 34,281,460
ARIZONA 158,107,206 152,065,270 145,702,821 139,777,753 133,935,892
ARKANSAS 63,102,085 60,401,283 56,194,882 53,804,598 50,077,528
CALIFORNIA 1,054,811,527 1,102,740,250 1,137,060,129 1,169,509,005 1,198,622,217
COLORADO 96,707,212 95,553,711 92,513,036 90,345,412 90,745,995
CONNECTICUT 131,505,461 134,322,882 132,548,164 130,548,219 131,738,968
DELAWARE 15,749,608 15,981,994 15,999,779 16,057,736 16,155,528
DIST. OF COL. 20,752,340 20,862,826 21,541,183 21,524,801 20,890,786
FLORIDA 855,531,131 820,075,618 762,892,003 725,428,421 682,024,121
GEORGIA 275,349,318 272,048,927 266,227,896 253,592,468 238,048,705
GUAM 2,126,376 1,796,666 1,691,191 1,496,939 1,481,671
HAWAII 43,039,007 42,735,949 41,240,425 39,843,273 38,917,759
IDAHO 19,480,349 18,259,830 17,015,120 14,245,217 15,609,127
ILLINOIS 187,818,552 186,139,305 181,255,655 173,532,401 168,977,088
INDIANA 190,552,791 179,933,108 163,210,096 150,359,871 138,246,645
IOWA 123,089,779 119,811,363 114,549,166 110,899,412 108,196,011
KANSAS 90,560,265 91,062,886 87,244,583 86,181,461 86,060,547
KENTUCKY 133,588,891 130,728,322 122,457,960 118,314,183 114,777,510
LOUISIANA 124,556,932 115,736,419 112,073,971 109,494,062 106,281,282
MAINE 55,611,126 56,650,743 54,505,791 52,974,767 51,970,413
MARYLAND 92,019,475 93,901,379 89,579,489 88,511,199 87,672,078
MASSACHUSETTS 211,835,051 211,980,303 204,963,550 212,790,367 192,693,098
MICHIGAN 382,216,664 380,739,033 369,748,999 356,998,286 352,332,530
MINNESOTA 219,395,509 207,431,458 198,826,680 194,499,531 193,884,246
MISSISSIPPI 73,412,976 72,568,465 70,332,950 71,005,778 69,818,504
MISSOURI 236,947,887 237,109,295 226,607,938 215,701,170 206,208,361
MONTANA 23,388,948 21,258,959 20,437,263 20,164,108 20,494,813
NEBRASKA 81,718,420 80,142,027 77,736,888 76,115,277 75,948,711
NEVADA 44,941,875 47,265,069 49,135,980 50,714,611 52,968,229
NEW HAMPSHIRE 31,241,211 30,510,022 28,913,195 26,913,039 26,118,504
NEW JERSEY 250,582,389 251,571,919 244,659,812 233,978,192 232,821,884
NEW MEXICO 62,347,684 60,820,460 61,130,987 60,598,209 60,228,316
NEW YORK 359,645,067 366,186,076 355,728,469 350,883,202 354,687,772
NORTH CAROLINA 2 3 222,876,697 214,791,667 201,075,741 192,335,474 182,986,434
NORTH DAKOTA 26,867,149 25,099,267 23,690,310 22,345,671 21,154,035
OHIO 427,750,672 424,419,262 404,893,458 392,214,986 380,251,557
OKLAHOMA 87,187,676 80,774,896 75,119,816 72,058,352 68,939,542
OREGON 117,472,050 116,643,075 116,001,254 118,815,451 164,871,267
PENNSYLVANIA 242,555,941 237,447,387 229,383,989 223,470,007 219,868,517
PUERTO RICO 13,815,824 15,279,715 16,738,701 17,362,476 19,121,378
RHODE ISLAND 37,290,872 37,415,937 36,419,514 35,211,021 34,844,218
SOUTH CAROLINA 124,974,500 127,558,081 127,979,257 127,885,711 126,833,248
SOUTH DAKOTA 42,038,025 41,669,495 41,899,343 43,306,615 44,449,994
TENNESSEE 281,001,931 288,945,926 287,487,233 285,007,596 282,803,989
TEXAS 733,608,896 698,558,477 678,359,238 662,257,234 639,944,146
UTAH 65,869,064 63,925,799 61,559,920 59,984,225 57,879,242
VERMONT 21,495,230 20,872,516 19,575,641 19,273,572 18,949,545
VIRGIN ISLANDS 972,039 1,096,528 804,469 764,141 840,095
VIRGINIA 187,440,693 186,187,660 182,324,955 179,658,526 176,558,061
WASHINGTON 251,802,500 250,188,444 244,329,628 239,545,298 232,710,045
WEST VIRGINIA 72,417,660 67,689,571 62,006,944 58,624,700 55,980,040
WISCONSIN 122,548,321 123,959,522 121,442,358 119,046,821 117,066,269
WYOMING 10,638,007 9,483,124 8,557,517 8,374,697 8,185,157
TOTALS $8,958,517,382 $8,867,831,169 $8,614,626,411 $8,444,542,443 $8,322,310,341
Source: Form OCSE-34 - Part 1, line 8, columns (C+D).
1 Former Assistance includes collections for families formerly receiving IV-A TANF or IV-E Foster Care Assistance.
2 North Carolina data adjusted for this report, based on revised data submitted after the final deadline for FY 2016.
3 North Carolina FY 2017 data reported for OCSE-34 Lines 7e, column D; 7e, column E; and 7e, column F includes adjustments to correct errors on these lines in the prior FY 2016 2nd quarter report.
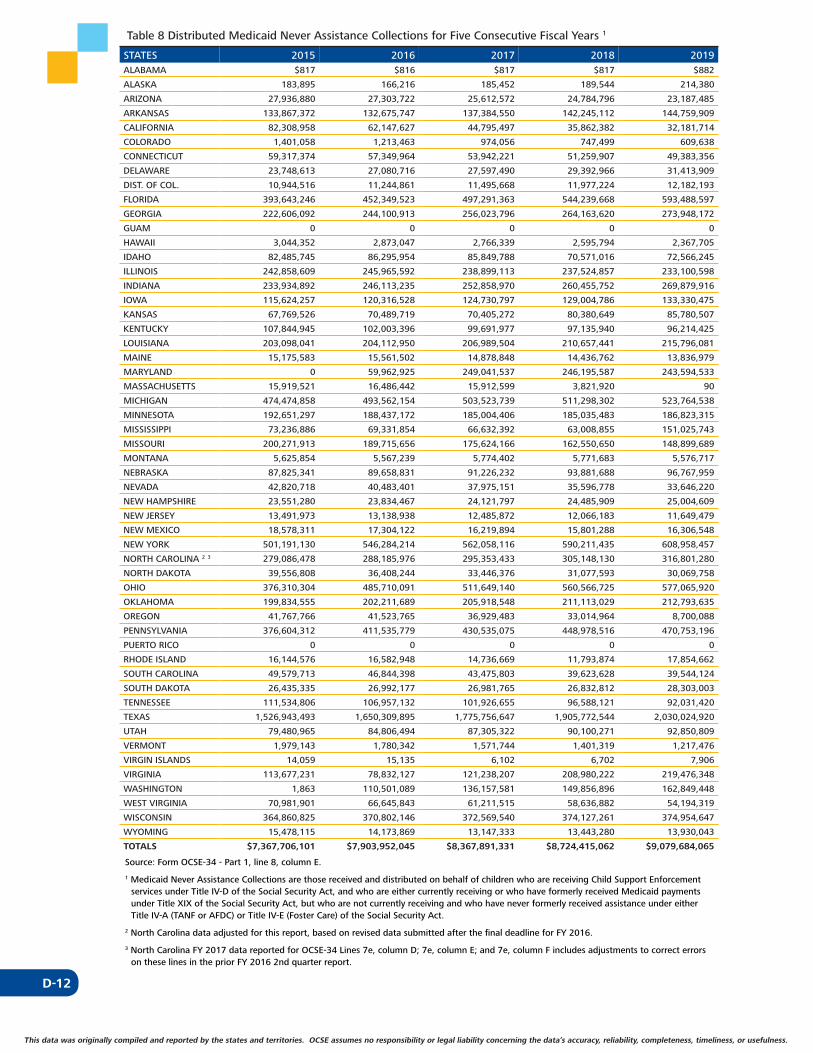
D-12
This data was originally compiled and reported by the states and territories. OCSE assumes no responsibility or legal liability concerning the data’s accuracy, reliability, completeness, timeliness, or usefulness.
Table 8 Distributed Medicaid Never Assistance Collections for Five Consecutive Fiscal Years 1
STATES 2015 2016 2017 2018 2019ALABAMA $817 $816 $817 $817 $882
ALASKA 183,895 166,216 185,452 189,544 214,380
ARIZONA 27,936,880 27,303,722 25,612,572 24,784,796 23,187,485
ARKANSAS 133,867,372 132,675,747 137,384,550 142,245,112 144,759,909
CALIFORNIA 82,308,958 62,147,627 44,795,497 35,862,382 32,181,714
COLORADO 1,401,058 1,213,463 974,056 747,499 609,638
CONNECTICUT 59,317,374 57,349,964 53,942,221 51,259,907 49,383,356
DELAWARE 23,748,613 27,080,716 27,597,490 29,392,966 31,413,909
DIST. OF COL. 10,944,516 11,244,861 11,495,668 11,977,224 12,182,193
FLORIDA 393,643,246 452,349,523 497,291,363 544,239,668 593,488,597
GEORGIA 222,606,092 244,100,913 256,023,796 264,163,620 273,948,172
GUAM 0 0 0 0 0
HAWAII 3,044,352 2,873,047 2,766,339 2,595,794 2,367,705
IDAHO 82,485,745 86,295,954 85,849,788 70,571,016 72,566,245
ILLINOIS 242,858,609 245,965,592 238,899,113 237,524,857 233,100,598
INDIANA 233,934,892 246,113,235 252,858,970 260,455,752 269,879,916
IOWA 115,624,257 120,316,528 124,730,797 129,004,786 133,330,475
KANSAS 67,769,526 70,489,719 70,405,272 80,380,649 85,780,507
KENTUCKY 107,844,945 102,003,396 99,691,977 97,135,940 96,214,425
LOUISIANA 203,098,041 204,112,950 206,989,504 210,657,441 215,796,081
MAINE 15,175,583 15,561,502 14,878,848 14,436,762 13,836,979
MARYLAND 0 59,962,925 249,041,537 246,195,587 243,594,533
MASSACHUSETTS 15,919,521 16,486,442 15,912,599 3,821,920 90
MICHIGAN 474,474,858 493,562,154 503,523,739 511,298,302 523,764,538
MINNESOTA 192,651,297 188,437,172 185,004,406 185,035,483 186,823,315
MISSISSIPPI 73,236,886 69,331,854 66,632,392 63,008,855 151,025,743
MISSOURI 200,271,913 189,715,656 175,624,166 162,550,650 148,899,689
MONTANA 5,625,854 5,567,239 5,774,402 5,771,683 5,576,717
NEBRASKA 87,825,341 89,658,831 91,226,232 93,881,688 96,767,959
NEVADA 42,820,718 40,483,401 37,975,151 35,596,778 33,646,220
NEW HAMPSHIRE 23,551,280 23,834,467 24,121,797 24,485,909 25,004,609
NEW JERSEY 13,491,973 13,138,938 12,485,872 12,066,183 11,649,479
NEW MEXICO 18,578,311 17,304,122 16,219,894 15,801,288 16,306,548
NEW YORK 501,191,130 546,284,214 562,058,116 590,211,435 608,958,457
NORTH CAROLINA 2 3 279,086,478 288,185,976 295,353,433 305,148,130 316,801,280
NORTH DAKOTA 39,556,808 36,408,244 33,446,376 31,077,593 30,069,758
OHIO 376,310,304 485,710,091 511,649,140 560,566,725 577,065,920
OKLAHOMA 199,834,555 202,211,689 205,918,548 211,113,029 212,793,635
OREGON 41,767,766 41,523,765 36,929,483 33,014,964 8,700,088
PENNSYLVANIA 376,604,312 411,535,779 430,535,075 448,978,516 470,753,196
PUERTO RICO 0 0 0 0 0
RHODE ISLAND 16,144,576 16,582,948 14,736,669 11,793,874 17,854,662
SOUTH CAROLINA 49,579,713 46,844,398 43,475,803 39,623,628 39,544,124
SOUTH DAKOTA 26,435,335 26,992,177 26,981,765 26,832,812 28,303,003
TENNESSEE 111,534,806 106,957,132 101,926,655 96,588,121 92,031,420
TEXAS 1,526,943,493 1,650,309,895 1,775,756,647 1,905,772,544 2,030,024,920
UTAH 79,480,965 84,806,494 87,305,322 90,100,271 92,850,809
VERMONT 1,979,143 1,780,342 1,571,744 1,401,319 1,217,476
VIRGIN ISLANDS 14,059 15,135 6,102 6,702 7,906
VIRGINIA 113,677,231 78,832,127 121,238,207 208,980,222 219,476,348
WASHINGTON 1,863 110,501,089 136,157,581 149,856,896 162,849,448
WEST VIRGINIA 70,981,901 66,645,843 61,211,515 58,636,882 54,194,319
WISCONSIN 364,860,825 370,802,146 372,569,540 374,127,261 374,954,647
WYOMING 15,478,115 14,173,869 13,147,333 13,443,280 13,930,043
TOTALS $7,367,706,101 $7,903,952,045 $8,367,891,331 $8,724,415,062 $9,079,684,065
Source: Form OCSE-34 - Part 1, line 8, column E.
1 Medicaid Never Assistance Collections are those received and distributed on behalf of children who are receiving Child Support Enforcement services under Title IV-D of the Social Security Act, and who are either currently receiving or who have formerly received Medicaid payments under Title XIX of the Social Security Act, but who are not currently receiving and who have never formerly received assistance under either Title IV-A (TANF or AFDC) or Title IV-E (Foster Care) of the Social Security Act.
2 North Carolina data adjusted for this report, based on revised data submitted after the final deadline for FY 2016.
3 North Carolina FY 2017 data reported for OCSE-34 Lines 7e, column D; 7e, column E; and 7e, column F includes adjustments to correct errors on these lines in the prior FY 2016 2nd quarter report.
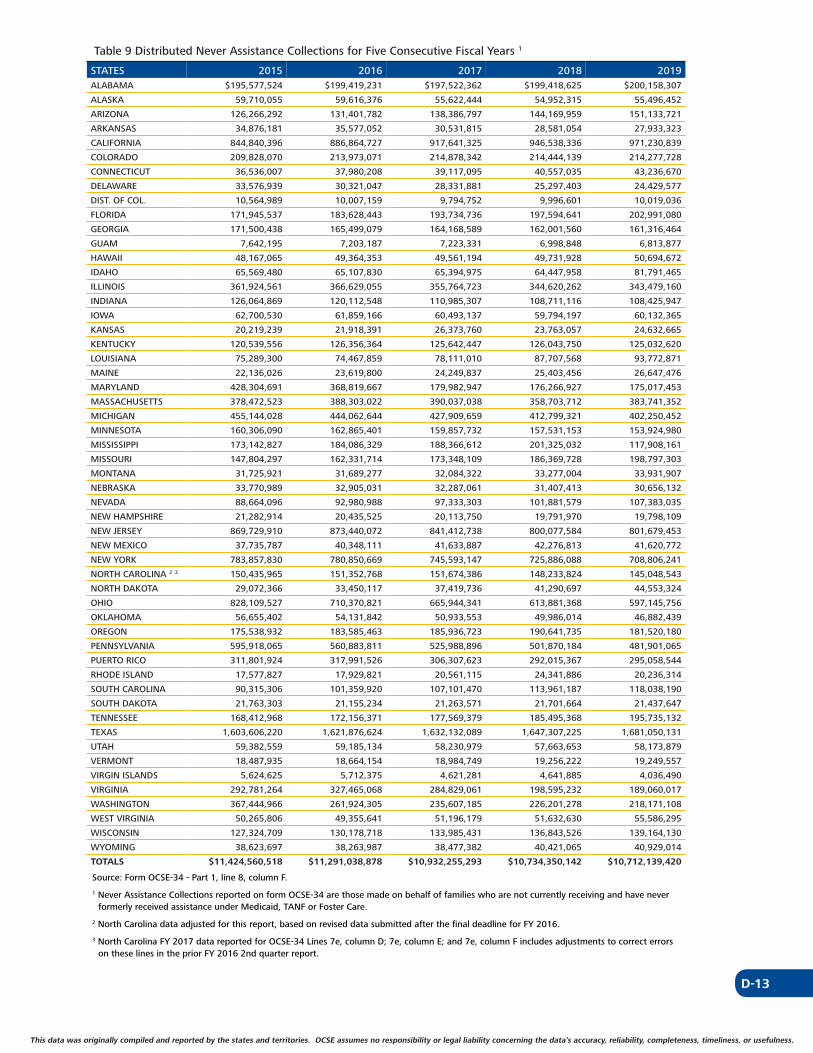
D-13
This data was originally compiled and reported by the states and territories. OCSE assumes no responsibility or legal liability concerning the data’s accuracy, reliability, completeness, timeliness, or usefulness. This data was originally compiled and reported by the states and territories. OCSE assumes no responsibility or legal liability concerning the data’s accuracy, reliability, completeness, timeliness, or usefulness.
Table 9 Distributed Never Assistance Collections for Five Consecutive Fiscal Years 1
STATES 2015 2016 2017 2018 2019ALABAMA $195,577,524 $199,419,231 $197,522,362 $199,418,625 $200,158,307
ALASKA 59,710,055 59,616,376 55,622,444 54,952,315 55,496,452
ARIZONA 126,266,292 131,401,782 138,386,797 144,169,959 151,133,721
ARKANSAS 34,876,181 35,577,052 30,531,815 28,581,054 27,933,323
CALIFORNIA 844,840,396 886,864,727 917,641,325 946,538,336 971,230,839
COLORADO 209,828,070 213,973,071 214,878,342 214,444,139 214,277,728
CONNECTICUT 36,536,007 37,980,208 39,117,095 40,557,035 43,236,670
DELAWARE 33,576,939 30,321,047 28,331,881 25,297,403 24,429,577
DIST. OF COL. 10,564,989 10,007,159 9,794,752 9,996,601 10,019,036
FLORIDA 171,945,537 183,628,443 193,734,736 197,594,641 202,991,080
GEORGIA 171,500,438 165,499,079 164,168,589 162,001,560 161,316,464
GUAM 7,642,195 7,203,187 7,223,331 6,998,848 6,813,877
HAWAII 48,167,065 49,364,353 49,561,194 49,731,928 50,694,672
IDAHO 65,569,480 65,107,830 65,394,975 64,447,958 81,791,465
ILLINOIS 361,924,561 366,629,055 355,764,723 344,620,262 343,479,160
INDIANA 126,064,869 120,112,548 110,985,307 108,711,116 108,425,947
IOWA 62,700,530 61,859,166 60,493,137 59,794,197 60,132,365
KANSAS 20,219,239 21,918,391 26,373,760 23,763,057 24,632,665
KENTUCKY 120,539,556 126,356,364 125,642,447 126,043,750 125,032,620
LOUISIANA 75,289,300 74,467,859 78,111,010 87,707,568 93,772,871
MAINE 22,136,026 23,619,800 24,249,837 25,403,456 26,647,476
MARYLAND 428,304,691 368,819,667 179,982,947 176,266,927 175,017,453
MASSACHUSETTS 378,472,523 388,303,022 390,037,038 358,703,712 383,741,352
MICHIGAN 455,144,028 444,062,644 427,909,659 412,799,321 402,250,452
MINNESOTA 160,306,090 162,865,401 159,857,732 157,531,153 153,924,980
MISSISSIPPI 173,142,827 184,086,329 188,366,612 201,325,032 117,908,161
MISSOURI 147,804,297 162,331,714 173,348,109 186,369,728 198,797,303
MONTANA 31,725,921 31,689,277 32,084,322 33,277,004 33,931,907
NEBRASKA 33,770,989 32,905,031 32,287,061 31,407,413 30,656,132
NEVADA 88,664,096 92,980,988 97,333,303 101,881,579 107,383,035
NEW HAMPSHIRE 21,282,914 20,435,525 20,113,750 19,791,970 19,798,109
NEW JERSEY 869,729,910 873,440,072 841,412,738 800,077,584 801,679,453
NEW MEXICO 37,735,787 40,348,111 41,633,887 42,276,813 41,620,772
NEW YORK 783,857,830 780,850,669 745,593,147 725,886,088 708,806,241
NORTH CAROLINA 2 3 150,435,965 151,352,768 151,674,386 148,233,824 145,048,543
NORTH DAKOTA 29,072,366 33,450,117 37,419,736 41,290,697 44,553,324
OHIO 828,109,527 710,370,821 665,944,341 613,881,368 597,145,756
OKLAHOMA 56,655,402 54,131,842 50,933,553 49,986,014 46,882,439
OREGON 175,538,932 183,585,463 185,936,723 190,641,735 181,520,180
PENNSYLVANIA 595,918,065 560,883,811 525,988,896 501,870,184 481,901,065
PUERTO RICO 311,801,924 317,991,526 306,307,623 292,015,367 295,058,544
RHODE ISLAND 17,577,827 17,929,821 20,561,115 24,341,886 20,236,314
SOUTH CAROLINA 90,315,306 101,359,920 107,101,470 113,961,187 118,038,190
SOUTH DAKOTA 21,763,303 21,155,234 21,263,571 21,701,664 21,437,647
TENNESSEE 168,412,968 172,156,371 177,569,379 185,495,368 195,735,132
TEXAS 1,603,606,220 1,621,876,624 1,632,132,089 1,647,307,225 1,681,050,131
UTAH 59,382,559 59,185,134 58,230,979 57,663,653 58,173,879
VERMONT 18,487,935 18,664,154 18,984,749 19,256,222 19,249,557
VIRGIN ISLANDS 5,624,625 5,712,375 4,621,281 4,641,885 4,036,490
VIRGINIA 292,781,264 327,465,068 284,829,061 198,595,232 189,060,017
WASHINGTON 367,444,966 261,924,305 235,607,185 226,201,278 218,171,108
WEST VIRGINIA 50,265,806 49,355,641 51,196,179 51,632,630 55,586,295
WISCONSIN 127,324,709 130,178,718 133,985,431 136,843,526 139,164,130
WYOMING 38,623,697 38,263,987 38,477,382 40,421,065 40,929,014
TOTALS $11,424,560,518 $11,291,038,878 $10,932,255,293 $10,734,350,142 $10,712,139,420
Source: Form OCSE-34 - Part 1, line 8, column F.
1 Never Assistance Collections reported on form OCSE-34 are those made on behalf of families who are not currently receiving and have never formerly received assistance under Medicaid, TANF or Foster Care.
2 North Carolina data adjusted for this report, based on revised data submitted after the final deadline for FY 2016.
3 North Carolina FY 2017 data reported for OCSE-34 Lines 7e, column D; 7e, column E; and 7e, column F includes adjustments to correct errors on these lines in the prior FY 2016 2nd quarter report.

D-14
This data was originally compiled and reported by the states and territories. OCSE assumes no responsibility or legal liability concerning the data’s accuracy, reliability, completeness, timeliness, or usefulness.
Table 10 Distributed TANF/Foster Care Collections for Five Consecutive Fiscal Years
STATES 2015 2016 2017 2018 2019ALABAMA $11,866,629 $11,026,090 $10,292,180 $9,393,891 $8,529,751
ALASKA 11,047,815 11,180,573 9,583,148 9,173,098 9,444,453
ARIZONA 12,806,086 11,150,590 10,538,350 9,807,786 9,053,615
ARKANSAS 5,862,510 5,352,344 4,703,689 4,261,236 3,488,475
CALIFORNIA 454,792,804 448,537,956 427,790,246 415,634,049 402,853,778
COLORADO 15,847,128 14,783,293 13,947,796 15,968,693 16,138,515
CONNECTICUT 34,395,970 36,025,546 34,301,741 32,543,798 31,606,269
DELAWARE 4,231,441 4,729,990 4,673,111 4,967,384 4,798,504
DIST. OF COL. 6,974,125 6,721,929 6,567,618 5,346,601 5,450,622
FLORIDA 39,239,021 37,288,460 36,017,082 36,657,914 34,772,377
GEORGIA 20,118,024 19,702,156 18,846,684 18,163,916 17,451,439
GUAM 1,023,652 811,630 713,515 508,683 608,601
HAWAII 9,229,365 9,068,979 8,083,852 7,435,522 7,068,088
IDAHO 3,085,253 2,953,547 2,965,835 2,358,067 2,582,637
ILLINOIS 32,939,150 30,258,669 28,333,951 26,157,163 26,248,532
INDIANA 15,167,190 14,120,063 13,002,999 12,064,877 11,062,635
IOWA 19,960,437 18,531,928 17,836,093 16,031,922 15,367,413
KANSAS 13,920,809 13,244,257 11,494,310 10,470,184 10,179,278
KENTUCKY 37,970,475 37,277,146 34,723,634 32,649,784 31,420,239
LOUISIANA 9,643,273 8,808,209 8,579,148 7,831,422 7,906,999
MAINE 16,579,471 15,851,212 14,102,981 13,288,135 12,774,835
MARYLAND 22,101,929 22,290,841 17,093,500 17,934,721 19,230,584
MASSACHUSETTS 38,364,936 35,130,651 32,600,454 29,179,086 28,239,404
MICHIGAN 47,401,715 43,809,101 39,122,042 36,514,963 34,356,501
MINNESOTA 24,254,359 27,038,836 26,835,740 25,177,394 23,873,161
MISSISSIPPI 4,946,270 4,699,471 4,183,654 4,335,999 3,597,264
MISSOURI 32,616,068 28,101,045 23,613,760 21,497,138 19,841,097
MONTANA 3,888,836 3,649,012 4,053,562 4,501,547 4,337,597
NEBRASKA 6,655,579 6,477,800 6,125,757 5,931,388 5,628,952
NEVADA 9,138,524 9,390,207 9,606,768 9,525,888 9,707,913
NEW HAMPSHIRE 4,156,340 3,921,106 3,438,395 4,320,732 4,861,423
NEW JERSEY 40,058,979 36,410,605 34,373,345 32,095,774 29,788,243
NEW MEXICO 8,023,383 7,672,625 7,551,090 7,384,772 7,521,920
NEW YORK 102,005,984 103,639,023 97,174,285 92,917,787 93,172,729
NORTH CAROLINA 18,536,328 17,736,743 16,637,352 15,887,470 14,862,773
NORTH DAKOTA 3,910,527 3,611,794 3,304,242 3,201,485 3,021,715
OHIO 62,761,071 64,039,831 60,637,147 59,641,599 60,320,683
OKLAHOMA 15,063,510 14,542,366 13,329,362 11,793,546 11,197,506
OREGON 31,007,182 32,174,686 30,203,381 30,980,723 22,907,756
PENNSYLVANIA 46,857,369 45,062,388 40,799,421 38,106,076 37,205,648
PUERTO RICO 3,439,385 3,926,895 3,664,643 3,343,347 3,692,052
RHODE ISLAND 4,810,255 4,490,799 4,310,607 3,700,011 3,676,030
SOUTH CAROLINA 15,693,164 15,606,778 14,233,441 14,837,468 13,549,535
SOUTH DAKOTA 3,714,730 3,624,628 3,765,172 3,853,354 3,720,549
TENNESSEE 56,637,363 53,731,899 48,326,122 46,429,794 42,341,913
TEXAS 37,829,097 34,495,654 31,601,931 29,847,045 27,517,805
UTAH 7,982,027 8,039,147 7,818,739 7,793,037 7,139,880
VERMONT 2,510,255 2,676,000 2,410,463 2,008,049 1,820,468
VIRGIN ISLANDS 146,691 154,540 130,723 123,115 118,463
VIRGINIA 41,151,884 39,312,034 36,153,147 35,373,474 33,918,767
WASHINGTON 48,477,946 48,344,271 45,853,958 43,444,949 42,307,110
WEST VIRGINIA 8,018,937 7,397,210 6,985,678 6,335,090 6,564,939
WISCONSIN 29,466,851 24,969,223 23,261,371 22,228,888 21,404,115
WYOMING 1,802,549 1,637,377 1,642,120 1,740,319 1,599,168
TOTALS $1,560,130,651 $1,515,229,153 $1,417,939,335 $1,362,700,153 $1,311,850,718
Source: Form OCSE-34 - Part 1, line 8, columns (A+B) + line 7b, columns (C+D).
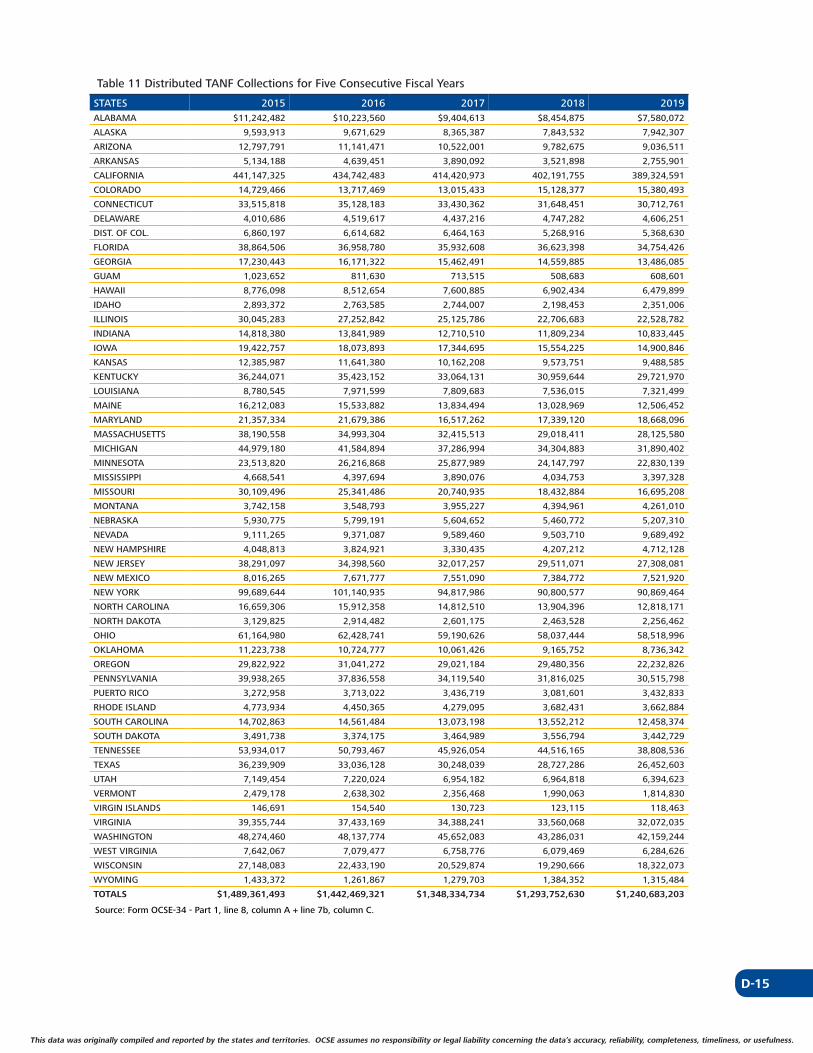
D-15
This data was originally compiled and reported by the states and territories. OCSE assumes no responsibility or legal liability concerning the data’s accuracy, reliability, completeness, timeliness, or usefulness. This data was originally compiled and reported by the states and territories. OCSE assumes no responsibility or legal liability concerning the data’s accuracy, reliability, completeness, timeliness, or usefulness.
Table 11 Distributed TANF Collections for Five Consecutive Fiscal Years
STATES 2015 2016 2017 2018 2019ALABAMA $11,242,482 $10,223,560 $9,404,613 $8,454,875 $7,580,072
ALASKA 9,593,913 9,671,629 8,365,387 7,843,532 7,942,307
ARIZONA 12,797,791 11,141,471 10,522,001 9,782,675 9,036,511
ARKANSAS 5,134,188 4,639,451 3,890,092 3,521,898 2,755,901
CALIFORNIA 441,147,325 434,742,483 414,420,973 402,191,755 389,324,591
COLORADO 14,729,466 13,717,469 13,015,433 15,128,377 15,380,493
CONNECTICUT 33,515,818 35,128,183 33,430,362 31,648,451 30,712,761
DELAWARE 4,010,686 4,519,617 4,437,216 4,747,282 4,606,251
DIST. OF COL. 6,860,197 6,614,682 6,464,163 5,268,916 5,368,630
FLORIDA 38,864,506 36,958,780 35,932,608 36,623,398 34,754,426
GEORGIA 17,230,443 16,171,322 15,462,491 14,559,885 13,486,085
GUAM 1,023,652 811,630 713,515 508,683 608,601
HAWAII 8,776,098 8,512,654 7,600,885 6,902,434 6,479,899
IDAHO 2,893,372 2,763,585 2,744,007 2,198,453 2,351,006
ILLINOIS 30,045,283 27,252,842 25,125,786 22,706,683 22,528,782
INDIANA 14,818,380 13,841,989 12,710,510 11,809,234 10,833,445
IOWA 19,422,757 18,073,893 17,344,695 15,554,225 14,900,846
KANSAS 12,385,987 11,641,380 10,162,208 9,573,751 9,488,585
KENTUCKY 36,244,071 35,423,152 33,064,131 30,959,644 29,721,970
LOUISIANA 8,780,545 7,971,599 7,809,683 7,536,015 7,321,499
MAINE 16,212,083 15,533,882 13,834,494 13,028,969 12,506,452
MARYLAND 21,357,334 21,679,386 16,517,262 17,339,120 18,668,096
MASSACHUSETTS 38,190,558 34,993,304 32,415,513 29,018,411 28,125,580
MICHIGAN 44,979,180 41,584,894 37,286,994 34,304,883 31,890,402
MINNESOTA 23,513,820 26,216,868 25,877,989 24,147,797 22,830,139
MISSISSIPPI 4,668,541 4,397,694 3,890,076 4,034,753 3,397,328
MISSOURI 30,109,496 25,341,486 20,740,935 18,432,884 16,695,208
MONTANA 3,742,158 3,548,793 3,955,227 4,394,961 4,261,010
NEBRASKA 5,930,775 5,799,191 5,604,652 5,460,772 5,207,310
NEVADA 9,111,265 9,371,087 9,589,460 9,503,710 9,689,492
NEW HAMPSHIRE 4,048,813 3,824,921 3,330,435 4,207,212 4,712,128
NEW JERSEY 38,291,097 34,398,560 32,017,257 29,511,071 27,308,081
NEW MEXICO 8,016,265 7,671,777 7,551,090 7,384,772 7,521,920
NEW YORK 99,689,644 101,140,935 94,817,986 90,800,577 90,869,464
NORTH CAROLINA 16,659,306 15,912,358 14,812,510 13,904,396 12,818,171
NORTH DAKOTA 3,129,825 2,914,482 2,601,175 2,463,528 2,256,462
OHIO 61,164,980 62,428,741 59,190,626 58,037,444 58,518,996
OKLAHOMA 11,223,738 10,724,777 10,061,426 9,165,752 8,736,342
OREGON 29,822,922 31,041,272 29,021,184 29,480,356 22,232,826
PENNSYLVANIA 39,938,265 37,836,558 34,119,540 31,816,025 30,515,798
PUERTO RICO 3,272,958 3,713,022 3,436,719 3,081,601 3,432,833
RHODE ISLAND 4,773,934 4,450,365 4,279,095 3,682,431 3,662,884
SOUTH CAROLINA 14,702,863 14,561,484 13,073,198 13,552,212 12,458,374
SOUTH DAKOTA 3,491,738 3,374,175 3,464,989 3,556,794 3,442,729
TENNESSEE 53,934,017 50,793,467 45,926,054 44,516,165 38,808,536
TEXAS 36,239,909 33,036,128 30,248,039 28,727,286 26,452,603
UTAH 7,149,454 7,220,024 6,954,182 6,964,818 6,394,623
VERMONT 2,479,178 2,638,302 2,356,468 1,990,063 1,814,830
VIRGIN ISLANDS 146,691 154,540 130,723 123,115 118,463
VIRGINIA 39,355,744 37,433,169 34,388,241 33,560,068 32,072,035
WASHINGTON 48,274,460 48,137,774 45,652,083 43,286,031 42,159,244
WEST VIRGINIA 7,642,067 7,079,477 6,758,776 6,079,469 6,284,626
WISCONSIN 27,148,083 22,433,190 20,529,874 19,290,666 18,322,073
WYOMING 1,433,372 1,261,867 1,279,703 1,384,352 1,315,484
TOTALS $1,489,361,493 $1,442,469,321 $1,348,334,734 $1,293,752,630 $1,240,683,203
Source: Form OCSE-34 - Part 1, line 8, column A + line 7b, column C.

D-16
This data was originally compiled and reported by the states and territories. OCSE assumes no responsibility or legal liability concerning the data’s accuracy, reliability, completeness, timeliness, or usefulness.
Table 12 Distributed Foster Care Collections for Five Consecutive Fiscal Years
STATES 2015 2016 2017 2018 2019ALABAMA $624,147 $802,530 $887,567 $939,016 $949,679
ALASKA 1,453,902 1,508,944 1,217,761 1,329,566 1,502,146
ARIZONA 8,295 9,119 16,349 25,111 17,104
ARKANSAS 728,322 712,893 813,597 739,338 732,574
CALIFORNIA 13,645,479 13,795,473 13,369,273 13,442,294 13,529,187
COLORADO 1,117,662 1,065,824 932,363 840,316 758,022
CONNECTICUT 880,152 897,363 871,379 895,347 893,508
DELAWARE 220,755 210,373 235,895 220,102 192,253
DIST. OF COL. 113,928 107,247 103,455 77,685 81,992
FLORIDA 374,515 329,680 84,474 34,516 17,951
GEORGIA 2,887,581 3,530,834 3,384,193 3,604,031 3,965,354
GUAM 0 0 0 0 0
HAWAII 453,267 556,325 482,967 533,088 588,189
IDAHO 191,881 189,962 221,828 159,614 231,631
ILLINOIS 2,893,867 3,005,827 3,208,165 3,450,480 3,719,750
INDIANA 348,810 278,074 292,489 255,643 229,190
IOWA 537,680 458,035 491,398 477,697 466,567
KANSAS 1,534,822 1,602,877 1,332,102 896,433 690,693
KENTUCKY 1,726,404 1,853,994 1,659,503 1,690,140 1,698,269
LOUISIANA 862,728 836,610 769,465 295,407 585,500
MAINE 367,388 317,330 268,487 259,166 268,383
MARYLAND 744,595 611,455 576,238 595,601 562,488
MASSACHUSETTS 174,378 137,347 184,941 160,675 113,824
MICHIGAN 2,422,535 2,224,207 1,835,048 2,210,080 2,466,099
MINNESOTA 740,539 821,968 957,751 1,029,597 1,043,022
MISSISSIPPI 277,729 301,777 293,578 301,246 199,936
MISSOURI 2,506,572 2,759,559 2,872,825 3,064,254 3,145,889
MONTANA 146,678 100,219 98,335 106,586 76,587
NEBRASKA 724,804 678,609 521,105 470,616 421,642
NEVADA 27,259 19,120 17,308 22,178 18,421
NEW HAMPSHIRE 107,527 96,185 107,960 113,520 149,295
NEW JERSEY 1,767,882 2,012,045 2,356,088 2,584,703 2,480,162
NEW MEXICO 7,118 848 0 0 0
NEW YORK 2,316,340 2,498,088 2,356,299 2,117,210 2,303,265
NORTH CAROLINA 1,877,022 1,824,385 1,824,842 1,983,074 2,044,602
NORTH DAKOTA 780,702 697,312 703,067 737,957 765,253
OHIO 1,596,091 1,611,090 1,446,521 1,604,155 1,801,687
OKLAHOMA 3,839,772 3,817,589 3,267,936 2,627,794 2,461,164
OREGON 1,184,260 1,133,414 1,182,197 1,500,367 674,930
PENNSYLVANIA 6,919,104 7,225,830 6,679,881 6,290,051 6,689,850
PUERTO RICO 166,427 213,873 227,924 261,746 259,219
RHODE ISLAND 36,321 40,434 31,512 17,580 13,146
SOUTH CAROLINA 990,301 1,045,294 1,160,243 1,285,256 1,091,161
SOUTH DAKOTA 222,992 250,453 300,183 296,560 277,820
TENNESSEE 2,703,346 2,938,432 2,400,068 1,913,629 3,533,377
TEXAS 1,589,188 1,459,526 1,353,892 1,119,759 1,065,202
UTAH 832,573 819,123 864,557 828,219 745,257
VERMONT 31,077 37,698 53,995 17,986 5,638
VIRGIN ISLANDS 0 0 0 0 0
VIRGINIA 1,796,140 1,878,865 1,764,906 1,813,406 1,846,732
WASHINGTON 203,486 206,497 201,875 158,918 147,866
WEST VIRGINIA 376,870 317,733 226,902 255,621 280,313
WISCONSIN 2,318,768 2,536,033 2,731,497 2,938,222 3,082,042
WYOMING 369,177 375,510 362,417 355,967 283,684
TOTALS $70,769,158 $72,759,832 $69,604,601 $68,947,523 $71,167,515
Source: Form OCSE-34 - Part 1, line 8, column B + line 7b, column D.
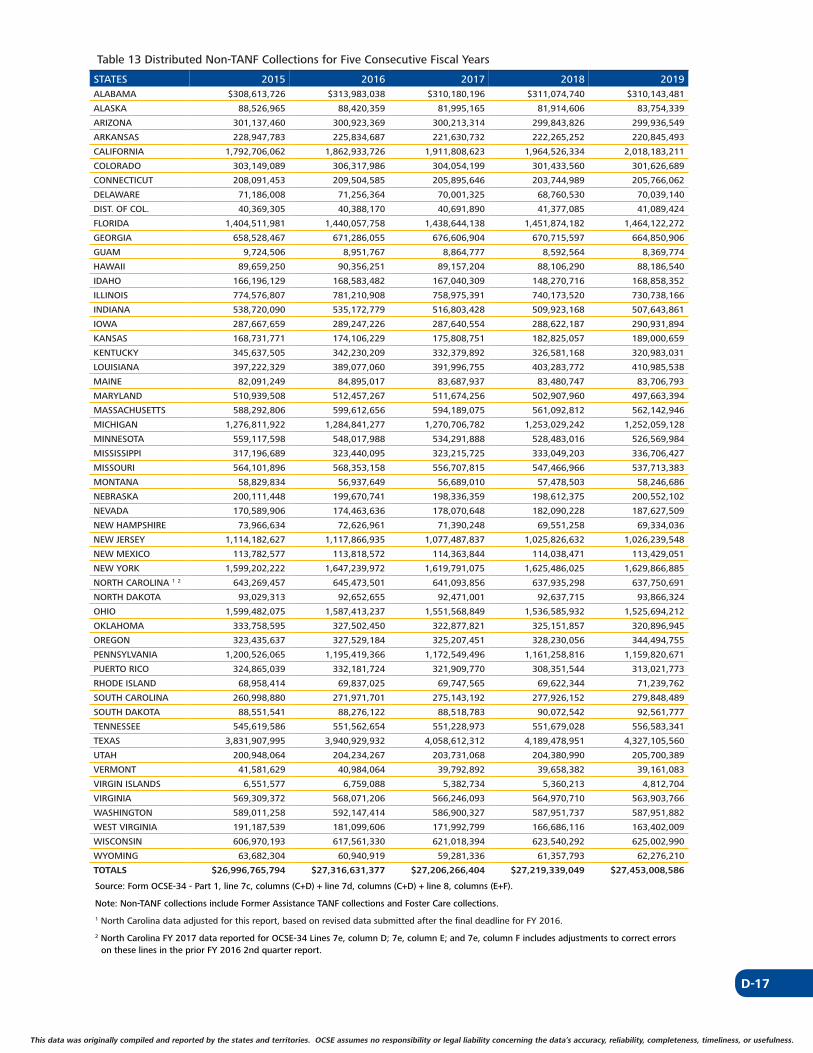
D-17
This data was originally compiled and reported by the states and territories. OCSE assumes no responsibility or legal liability concerning the data’s accuracy, reliability, completeness, timeliness, or usefulness. This data was originally compiled and reported by the states and territories. OCSE assumes no responsibility or legal liability concerning the data’s accuracy, reliability, completeness, timeliness, or usefulness.
Table 13 Distributed Non-TANF Collections for Five Consecutive Fiscal Years
STATES 2015 2016 2017 2018 2019ALABAMA $308,613,726 $313,983,038 $310,180,196 $311,074,740 $310,143,481
ALASKA 88,526,965 88,420,359 81,995,165 81,914,606 83,754,339
ARIZONA 301,137,460 300,923,369 300,213,314 299,843,826 299,936,549
ARKANSAS 228,947,783 225,834,687 221,630,732 222,265,252 220,845,493
CALIFORNIA 1,792,706,062 1,862,933,726 1,911,808,623 1,964,526,334 2,018,183,211
COLORADO 303,149,089 306,317,986 304,054,199 301,433,560 301,626,689
CONNECTICUT 208,091,453 209,504,585 205,895,646 203,744,989 205,766,062
DELAWARE 71,186,008 71,256,364 70,001,325 68,760,530 70,039,140
DIST. OF COL. 40,369,305 40,388,170 40,691,890 41,377,085 41,089,424
FLORIDA 1,404,511,981 1,440,057,758 1,438,644,138 1,451,874,182 1,464,122,272
GEORGIA 658,528,467 671,286,055 676,606,904 670,715,597 664,850,906
GUAM 9,724,506 8,951,767 8,864,777 8,592,564 8,369,774
HAWAII 89,659,250 90,356,251 89,157,204 88,106,290 88,186,540
IDAHO 166,196,129 168,583,482 167,040,309 148,270,716 168,858,352
ILLINOIS 774,576,807 781,210,908 758,975,391 740,173,520 730,738,166
INDIANA 538,720,090 535,172,779 516,803,428 509,923,168 507,643,861
IOWA 287,667,659 289,247,226 287,640,554 288,622,187 290,931,894
KANSAS 168,731,771 174,106,229 175,808,751 182,825,057 189,000,659
KENTUCKY 345,637,505 342,230,209 332,379,892 326,581,168 320,983,031
LOUISIANA 397,222,329 389,077,060 391,996,755 403,283,772 410,985,538
MAINE 82,091,249 84,895,017 83,687,937 83,480,747 83,706,793
MARYLAND 510,939,508 512,457,267 511,674,256 502,907,960 497,663,394
MASSACHUSETTS 588,292,806 599,612,656 594,189,075 561,092,812 562,142,946
MICHIGAN 1,276,811,922 1,284,841,277 1,270,706,782 1,253,029,242 1,252,059,128
MINNESOTA 559,117,598 548,017,988 534,291,888 528,483,016 526,569,984
MISSISSIPPI 317,196,689 323,440,095 323,215,725 333,049,203 336,706,427
MISSOURI 564,101,896 568,353,158 556,707,815 547,466,966 537,713,383
MONTANA 58,829,834 56,937,649 56,689,010 57,478,503 58,246,686
NEBRASKA 200,111,448 199,670,741 198,336,359 198,612,375 200,552,102
NEVADA 170,589,906 174,463,636 178,070,648 182,090,228 187,627,509
NEW HAMPSHIRE 73,966,634 72,626,961 71,390,248 69,551,258 69,334,036
NEW JERSEY 1,114,182,627 1,117,866,935 1,077,487,837 1,025,826,632 1,026,239,548
NEW MEXICO 113,782,577 113,818,572 114,363,844 114,038,471 113,429,051
NEW YORK 1,599,202,222 1,647,239,972 1,619,791,075 1,625,486,025 1,629,866,885
NORTH CAROLINA 1 2 643,269,457 645,473,501 641,093,856 637,935,298 637,750,691
NORTH DAKOTA 93,029,313 92,652,655 92,471,001 92,637,715 93,866,324
OHIO 1,599,482,075 1,587,413,237 1,551,568,849 1,536,585,932 1,525,694,212
OKLAHOMA 333,758,595 327,502,450 322,877,821 325,151,857 320,896,945
OREGON 323,435,637 327,529,184 325,207,451 328,230,056 344,494,755
PENNSYLVANIA 1,200,526,065 1,195,419,366 1,172,549,496 1,161,258,816 1,159,820,671
PUERTO RICO 324,865,039 332,181,724 321,909,770 308,351,544 313,021,773
RHODE ISLAND 68,958,414 69,837,025 69,747,565 69,622,344 71,239,762
SOUTH CAROLINA 260,998,880 271,971,701 275,143,192 277,926,152 279,848,489
SOUTH DAKOTA 88,551,541 88,276,122 88,518,783 90,072,542 92,561,777
TENNESSEE 545,619,586 551,562,654 551,228,973 551,679,028 556,583,341
TEXAS 3,831,907,995 3,940,929,932 4,058,612,312 4,189,478,951 4,327,105,560
UTAH 200,948,064 204,234,267 203,731,068 204,380,990 205,700,389
VERMONT 41,581,629 40,984,064 39,792,892 39,658,382 39,161,083
VIRGIN ISLANDS 6,551,577 6,759,088 5,382,734 5,360,213 4,812,704
VIRGINIA 569,309,372 568,071,206 566,246,093 564,970,710 563,903,766
WASHINGTON 589,011,258 592,147,414 586,900,327 587,951,737 587,951,882
WEST VIRGINIA 191,187,539 181,099,606 171,992,799 166,686,116 163,402,009
WISCONSIN 606,970,193 617,561,330 621,018,394 623,540,292 625,002,990
WYOMING 63,682,304 60,940,919 59,281,336 61,357,793 62,276,210
TOTALS $26,996,765,794 $27,316,631,377 $27,206,266,404 $27,219,339,049 $27,453,008,586
Source: Form OCSE-34 - Part 1, line 7c, columns (C+D) + line 7d, columns (C+D) + line 8, columns (E+F).
Note: Non-TANF collections include Former Assistance TANF collections and Foster Care collections.
1 North Carolina data adjusted for this report, based on revised data submitted after the final deadline for FY 2016.
2 North Carolina FY 2017 data reported for OCSE-34 Lines 7e, column D; 7e, column E; and 7e, column F includes adjustments to correct errors on these lines in the prior FY 2016 2nd quarter report.
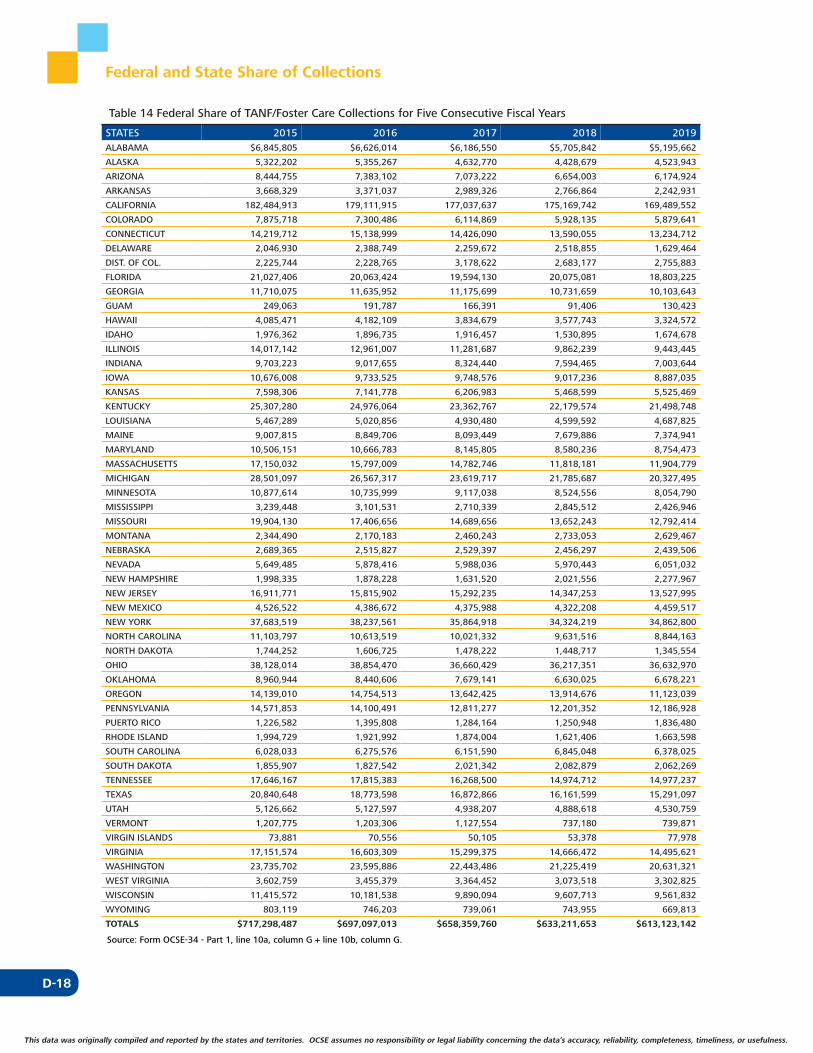
D-18
This data was originally compiled and reported by the states and territories. OCSE assumes no responsibility or legal liability concerning the data’s accuracy, reliability, completeness, timeliness, or usefulness.
Federal and State Share of Collections
Table 14 Federal Share of TANF/Foster Care Collections for Five Consecutive Fiscal Years
STATES 2015 2016 2017 2018 2019ALABAMA $6,845,805 $6,626,014 $6,186,550 $5,705,842 $5,195,662
ALASKA 5,322,202 5,355,267 4,632,770 4,428,679 4,523,943
ARIZONA 8,444,755 7,383,102 7,073,222 6,654,003 6,174,924
ARKANSAS 3,668,329 3,371,037 2,989,326 2,766,864 2,242,931
CALIFORNIA 182,484,913 179,111,915 177,037,637 175,169,742 169,489,552
COLORADO 7,875,718 7,300,486 6,114,869 5,928,135 5,879,641
CONNECTICUT 14,219,712 15,138,999 14,426,090 13,590,055 13,234,712
DELAWARE 2,046,930 2,388,749 2,259,672 2,518,855 1,629,464
DIST. OF COL. 2,225,744 2,228,765 3,178,622 2,683,177 2,755,883
FLORIDA 21,027,406 20,063,424 19,594,130 20,075,081 18,803,225
GEORGIA 11,710,075 11,635,952 11,175,699 10,731,659 10,103,643
GUAM 249,063 191,787 166,391 91,406 130,423
HAWAII 4,085,471 4,182,109 3,834,679 3,577,743 3,324,572
IDAHO 1,976,362 1,896,735 1,916,457 1,530,895 1,674,678
ILLINOIS 14,017,142 12,961,007 11,281,687 9,862,239 9,443,445
INDIANA 9,703,223 9,017,655 8,324,440 7,594,465 7,003,644
IOWA 10,676,008 9,733,525 9,748,576 9,017,236 8,887,035
KANSAS 7,598,306 7,141,778 6,206,983 5,468,599 5,525,469
KENTUCKY 25,307,280 24,976,064 23,362,767 22,179,574 21,498,748
LOUISIANA 5,467,289 5,020,856 4,930,480 4,599,592 4,687,825
MAINE 9,007,815 8,849,706 8,093,449 7,679,886 7,374,941
MARYLAND 10,506,151 10,666,783 8,145,805 8,580,236 8,754,473
MASSACHUSETTS 17,150,032 15,797,009 14,782,746 11,818,181 11,904,779
MICHIGAN 28,501,097 26,567,317 23,619,717 21,785,687 20,327,495
MINNESOTA 10,877,614 10,735,999 9,117,038 8,524,556 8,054,790
MISSISSIPPI 3,239,448 3,101,531 2,710,339 2,845,512 2,426,946
MISSOURI 19,904,130 17,406,656 14,689,656 13,652,243 12,792,414
MONTANA 2,344,490 2,170,183 2,460,243 2,733,053 2,629,467
NEBRASKA 2,689,365 2,515,827 2,529,397 2,456,297 2,439,506
NEVADA 5,649,485 5,878,416 5,988,036 5,970,443 6,051,032
NEW HAMPSHIRE 1,998,335 1,878,228 1,631,520 2,021,556 2,277,967
NEW JERSEY 16,911,771 15,815,902 15,292,235 14,347,253 13,527,995
NEW MEXICO 4,526,522 4,386,672 4,375,988 4,322,208 4,459,517
NEW YORK 37,683,519 38,237,561 35,864,918 34,324,219 34,862,800
NORTH CAROLINA 11,103,797 10,613,519 10,021,332 9,631,516 8,844,163
NORTH DAKOTA 1,744,252 1,606,725 1,478,222 1,448,717 1,345,554
OHIO 38,128,014 38,854,470 36,660,429 36,217,351 36,632,970
OKLAHOMA 8,960,944 8,440,606 7,679,141 6,630,025 6,678,221
OREGON 14,139,010 14,754,513 13,642,425 13,914,676 11,123,039
PENNSYLVANIA 14,571,853 14,100,491 12,811,277 12,201,352 12,186,928
PUERTO RICO 1,226,582 1,395,808 1,284,164 1,250,948 1,836,480
RHODE ISLAND 1,994,729 1,921,992 1,874,004 1,621,406 1,663,598
SOUTH CAROLINA 6,028,033 6,275,576 6,151,590 6,845,048 6,378,025
SOUTH DAKOTA 1,855,907 1,827,542 2,021,342 2,082,879 2,062,269
TENNESSEE 17,646,167 17,815,383 16,268,500 14,974,712 14,977,237
TEXAS 20,840,648 18,773,598 16,872,866 16,161,599 15,291,097
UTAH 5,126,662 5,127,597 4,938,207 4,888,618 4,530,759
VERMONT 1,207,775 1,203,306 1,127,554 737,180 739,871
VIRGIN ISLANDS 73,881 70,556 50,105 53,378 77,978
VIRGINIA 17,151,574 16,603,309 15,299,375 14,666,472 14,495,621
WASHINGTON 23,735,702 23,595,886 22,443,486 21,225,419 20,631,321
WEST VIRGINIA 3,602,759 3,455,379 3,364,452 3,073,518 3,302,825
WISCONSIN 11,415,572 10,181,538 9,890,094 9,607,713 9,561,832
WYOMING 803,119 746,203 739,061 743,955 669,813
TOTALS $717,298,487 $697,097,013 $658,359,760 $633,211,653 $613,123,142
Source: Form OCSE-34 - Part 1, line 10a, column G + line 10b, column G.

D-19
This data was originally compiled and reported by the states and territories. OCSE assumes no responsibility or legal liability concerning the data’s accuracy, reliability, completeness, timeliness, or usefulness. This data was originally compiled and reported by the states and territories. OCSE assumes no responsibility or legal liability concerning the data’s accuracy, reliability, completeness, timeliness, or usefulness.
Table 15 State Share of TANF/Foster Care Collections for Five Consecutive Fiscal Years
STATES 2015 2016 2017 2018 2019ALABAMA $3,077,091 $2,857,334 $2,631,224 $2,281,058 $2,032,582
ALASKA 5,322,197 5,355,263 4,632,765 4,428,675 4,523,939
ARIZONA 3,890,558 3,329,469 3,142,290 2,866,677 2,670,405
ARKANSAS 1,507,078 1,444,730 1,300,134 1,137,273 938,079
CALIFORNIA 182,484,905 179,111,905 177,037,629 175,169,733 169,489,546
COLORADO 7,563,843 7,093,219 6,109,981 5,928,126 5,879,631
CONNECTICUT 14,219,707 15,138,991 14,426,083 13,590,046 13,234,705
DELAWARE 1,769,832 1,967,896 1,909,466 1,944,826 1,201,925
DIST. OF COL. 2,225,737 2,228,755 1,362,268 1,149,934 1,181,096
FLORIDA 14,182,586 13,006,337 12,474,823 12,414,124 12,087,566
GEORGIA 5,783,312 5,589,735 5,285,785 4,934,998 4,838,155
GUAM 203,777 156,917 136,140 74,786 43,473
HAWAII 3,736,605 3,565,406 3,146,348 2,953,368 2,841,179
IDAHO 778,148 765,723 763,527 620,144 679,713
ILLINOIS 13,597,403 12,507,664 10,709,908 9,574,576 9,327,071
INDIANA 4,883,703 4,522,370 4,148,496 3,984,227 3,614,370
IOWA 8,546,187 7,992,798 7,432,558 6,402,114 5,941,993
KANSAS 5,819,151 5,620,512 4,835,506 4,521,535 4,151,361
KENTUCKY 10,876,994 10,541,664 9,794,723 8,984,643 8,498,109
LOUISIANA 3,343,814 3,049,965 2,986,157 2,622,252 2,524,211
MAINE 5,549,093 5,271,417 4,477,922 4,256,525 4,055,529
MARYLAND 10,506,141 10,666,776 8,145,797 8,580,230 8,754,468
MASSACHUSETTS 17,150,026 15,796,999 14,782,740 11,818,177 11,904,772
MICHIGAN 14,985,473 13,931,642 12,634,646 11,844,581 11,212,451
MINNESOTA 10,877,604 10,735,992 9,117,030 8,524,550 8,054,779
MISSISSIPPI 1,163,173 1,080,121 921,364 915,907 750,099
MISSOURI 11,465,657 10,100,702 8,549,791 7,477,989 6,767,853
MONTANA 1,213,158 1,156,278 1,292,417 1,447,203 1,382,541
NEBRASKA 2,359,189 2,401,738 2,348,900 2,217,914 2,200,103
NEVADA 3,128,462 3,175,049 3,271,334 3,110,076 3,276,902
NEW HAMPSHIRE 1,998,329 1,878,223 1,631,513 2,021,549 2,277,958
NEW JERSEY 16,911,762 15,815,894 15,292,225 14,347,242 13,527,988
NEW MEXICO 1,972,436 1,847,053 1,776,110 1,667,547 1,711,971
NEW YORK 37,683,513 38,237,551 35,864,906 34,324,210 34,862,792
NORTH CAROLINA 5,750,781 5,409,305 4,962,719 4,614,186 4,324,631
NORTH DAKOTA 1,744,246 1,606,712 1,478,214 1,448,712 1,345,546
OHIO 22,740,460 23,342,534 22,165,676 21,471,961 21,431,654
OKLAHOMA 5,422,595 5,398,719 5,132,237 4,689,809 4,027,487
OREGON 7,932,503 8,163,337 7,518,464 7,956,867 6,656,755
PENNSYLVANIA 13,548,281 13,010,626 11,930,471 11,344,290 11,137,340
PUERTO RICO 1,009,757 1,142,025 1,050,673 1,023,504 658,649
RHODE ISLAND 1,994,720 1,889,970 1,799,075 1,530,019 1,500,941
SOUTH CAROLINA 2,505,422 2,553,315 2,476,165 2,717,745 2,577,361
SOUTH DAKOTA 1,738,024 1,713,522 1,657,838 1,680,902 1,574,248
TENNESSEE 9,505,959 9,571,829 8,775,372 7,776,295 7,760,333
TEXAS 15,060,556 14,087,592 13,160,715 12,251,902 10,986,781
UTAH 2,139,018 2,172,513 2,126,467 2,069,279 1,968,681
VERMONT 1,028,430 1,029,171 942,870 641,500 633,058
VIRGIN ISLANDS 60,449 57,731 40,995 43,676 25,991
VIRGINIA 17,151,568 16,603,300 15,299,366 14,666,461 14,495,614
WASHINGTON 23,707,233 23,595,879 22,443,479 21,225,414 20,631,312
WEST VIRGINIA 1,446,657 1,382,734 1,321,416 1,122,983 1,140,039
WISCONSIN 8,175,250 7,303,503 7,013,161 6,740,275 6,543,661
WYOMING 803,112 746,198 739,053 743,949 669,803
TOTALS $574,241,665 $558,722,603 $526,406,932 $503,896,544 $486,529,200
Source: Form OCSE-34 - Part 1, line 7b, column G - (lines 10a, column G + 10b, column G).
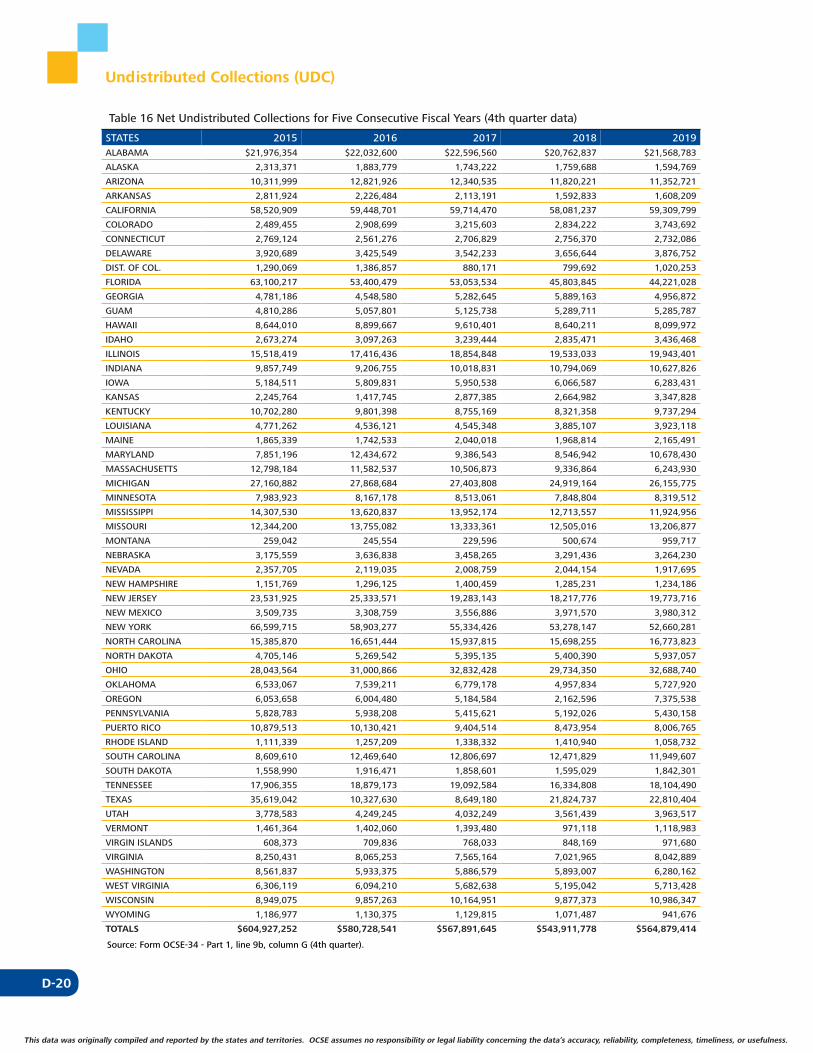
D-20
This data was originally compiled and reported by the states and territories. OCSE assumes no responsibility or legal liability concerning the data’s accuracy, reliability, completeness, timeliness, or usefulness.
Undistributed Collections (UDC)
Table 16 Net Undistributed Collections for Five Consecutive Fiscal Years (4th quarter data)
STATES 2015 2016 2017 2018 2019ALABAMA $21,976,354 $22,032,600 $22,596,560 $20,762,837 $21,568,783
ALASKA 2,313,371 1,883,779 1,743,222 1,759,688 1,594,769
ARIZONA 10,311,999 12,821,926 12,340,535 11,820,221 11,352,721
ARKANSAS 2,811,924 2,226,484 2,113,191 1,592,833 1,608,209
CALIFORNIA 58,520,909 59,448,701 59,714,470 58,081,237 59,309,799
COLORADO 2,489,455 2,908,699 3,215,603 2,834,222 3,743,692
CONNECTICUT 2,769,124 2,561,276 2,706,829 2,756,370 2,732,086
DELAWARE 3,920,689 3,425,549 3,542,233 3,656,644 3,876,752
DIST. OF COL. 1,290,069 1,386,857 880,171 799,692 1,020,253
FLORIDA 63,100,217 53,400,479 53,053,534 45,803,845 44,221,028
GEORGIA 4,781,186 4,548,580 5,282,645 5,889,163 4,956,872
GUAM 4,810,286 5,057,801 5,125,738 5,289,711 5,285,787
HAWAII 8,644,010 8,899,667 9,610,401 8,640,211 8,099,972
IDAHO 2,673,274 3,097,263 3,239,444 2,835,471 3,436,468
ILLINOIS 15,518,419 17,416,436 18,854,848 19,533,033 19,943,401
INDIANA 9,857,749 9,206,755 10,018,831 10,794,069 10,627,826
IOWA 5,184,511 5,809,831 5,950,538 6,066,587 6,283,431
KANSAS 2,245,764 1,417,745 2,877,385 2,664,982 3,347,828
KENTUCKY 10,702,280 9,801,398 8,755,169 8,321,358 9,737,294
LOUISIANA 4,771,262 4,536,121 4,545,348 3,885,107 3,923,118
MAINE 1,865,339 1,742,533 2,040,018 1,968,814 2,165,491
MARYLAND 7,851,196 12,434,672 9,386,543 8,546,942 10,678,430
MASSACHUSETTS 12,798,184 11,582,537 10,506,873 9,336,864 6,243,930
MICHIGAN 27,160,882 27,868,684 27,403,808 24,919,164 26,155,775
MINNESOTA 7,983,923 8,167,178 8,513,061 7,848,804 8,319,512
MISSISSIPPI 14,307,530 13,620,837 13,952,174 12,713,557 11,924,956
MISSOURI 12,344,200 13,755,082 13,333,361 12,505,016 13,206,877
MONTANA 259,042 245,554 229,596 500,674 959,717
NEBRASKA 3,175,559 3,636,838 3,458,265 3,291,436 3,264,230
NEVADA 2,357,705 2,119,035 2,008,759 2,044,154 1,917,695
NEW HAMPSHIRE 1,151,769 1,296,125 1,400,459 1,285,231 1,234,186
NEW JERSEY 23,531,925 25,333,571 19,283,143 18,217,776 19,773,716
NEW MEXICO 3,509,735 3,308,759 3,556,886 3,971,570 3,980,312
NEW YORK 66,599,715 58,903,277 55,334,426 53,278,147 52,660,281
NORTH CAROLINA 15,385,870 16,651,444 15,937,815 15,698,255 16,773,823
NORTH DAKOTA 4,705,146 5,269,542 5,395,135 5,400,390 5,937,057
OHIO 28,043,564 31,000,866 32,832,428 29,734,350 32,688,740
OKLAHOMA 6,533,067 7,539,211 6,779,178 4,957,834 5,727,920
OREGON 6,053,658 6,004,480 5,184,584 2,162,596 7,375,538
PENNSYLVANIA 5,828,783 5,938,208 5,415,621 5,192,026 5,430,158
PUERTO RICO 10,879,513 10,130,421 9,404,514 8,473,954 8,006,765
RHODE ISLAND 1,111,339 1,257,209 1,338,332 1,410,940 1,058,732
SOUTH CAROLINA 8,609,610 12,469,640 12,806,697 12,471,829 11,949,607
SOUTH DAKOTA 1,558,990 1,916,471 1,858,601 1,595,029 1,842,301
TENNESSEE 17,906,355 18,879,173 19,092,584 16,334,808 18,104,490
TEXAS 35,619,042 10,327,630 8,649,180 21,824,737 22,810,404
UTAH 3,778,583 4,249,245 4,032,249 3,561,439 3,963,517
VERMONT 1,461,364 1,402,060 1,393,480 971,118 1,118,983
VIRGIN ISLANDS 608,373 709,836 768,033 848,169 971,680
VIRGINIA 8,250,431 8,065,253 7,565,164 7,021,965 8,042,889
WASHINGTON 8,561,837 5,933,375 5,886,579 5,893,007 6,280,162
WEST VIRGINIA 6,306,119 6,094,210 5,682,638 5,195,042 5,713,428
WISCONSIN 8,949,075 9,857,263 10,164,951 9,877,373 10,986,347
WYOMING 1,186,977 1,130,375 1,129,815 1,071,487 941,676
TOTALS $604,927,252 $580,728,541 $567,891,645 $543,911,778 $564,879,414
Source: Form OCSE-34 - Part 1, line 9b, column G (4th quarter).
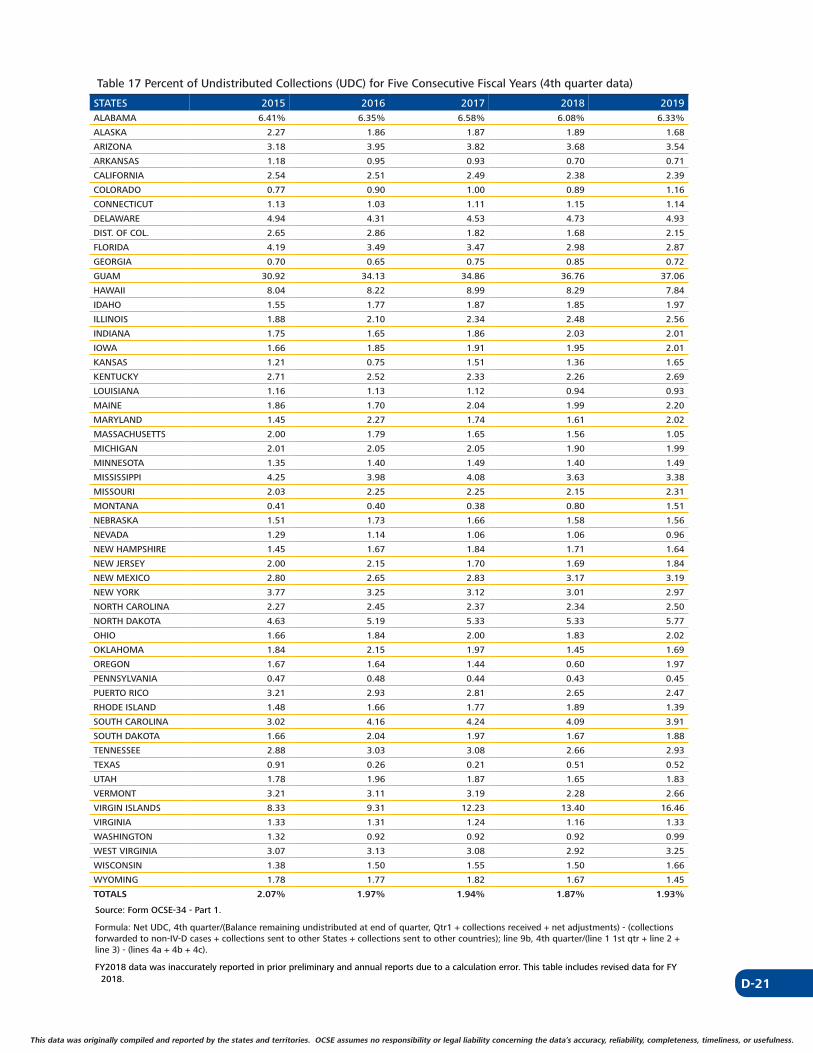
D-21
This data was originally compiled and reported by the states and territories. OCSE assumes no responsibility or legal liability concerning the data’s accuracy, reliability, completeness, timeliness, or usefulness. This data was originally compiled and reported by the states and territories. OCSE assumes no responsibility or legal liability concerning the data’s accuracy, reliability, completeness, timeliness, or usefulness.
Table 17 Percent of Undistributed Collections (UDC) for Five Consecutive Fiscal Years (4th quarter data)
STATES 2015 2016 2017 2018 2019ALABAMA 6.41% 6.35% 6.58% 6.08% 6.33%
ALASKA 2.27 1.86 1.87 1.89 1.68
ARIZONA 3.18 3.95 3.82 3.68 3.54
ARKANSAS 1.18 0.95 0.93 0.70 0.71
CALIFORNIA 2.54 2.51 2.49 2.38 2.39
COLORADO 0.77 0.90 1.00 0.89 1.16
CONNECTICUT 1.13 1.03 1.11 1.15 1.14
DELAWARE 4.94 4.31 4.53 4.73 4.93
DIST. OF COL. 2.65 2.86 1.82 1.68 2.15
FLORIDA 4.19 3.49 3.47 2.98 2.87
GEORGIA 0.70 0.65 0.75 0.85 0.72
GUAM 30.92 34.13 34.86 36.76 37.06
HAWAII 8.04 8.22 8.99 8.29 7.84
IDAHO 1.55 1.77 1.87 1.85 1.97
ILLINOIS 1.88 2.10 2.34 2.48 2.56
INDIANA 1.75 1.65 1.86 2.03 2.01
IOWA 1.66 1.85 1.91 1.95 2.01
KANSAS 1.21 0.75 1.51 1.36 1.65
KENTUCKY 2.71 2.52 2.33 2.26 2.69
LOUISIANA 1.16 1.13 1.12 0.94 0.93
MAINE 1.86 1.70 2.04 1.99 2.20
MARYLAND 1.45 2.27 1.74 1.61 2.02
MASSACHUSETTS 2.00 1.79 1.65 1.56 1.05
MICHIGAN 2.01 2.05 2.05 1.90 1.99
MINNESOTA 1.35 1.40 1.49 1.40 1.49
MISSISSIPPI 4.25 3.98 4.08 3.63 3.38
MISSOURI 2.03 2.25 2.25 2.15 2.31
MONTANA 0.41 0.40 0.38 0.80 1.51
NEBRASKA 1.51 1.73 1.66 1.58 1.56
NEVADA 1.29 1.14 1.06 1.06 0.96
NEW HAMPSHIRE 1.45 1.67 1.84 1.71 1.64
NEW JERSEY 2.00 2.15 1.70 1.69 1.84
NEW MEXICO 2.80 2.65 2.83 3.17 3.19
NEW YORK 3.77 3.25 3.12 3.01 2.97
NORTH CAROLINA 2.27 2.45 2.37 2.34 2.50
NORTH DAKOTA 4.63 5.19 5.33 5.33 5.77
OHIO 1.66 1.84 2.00 1.83 2.02
OKLAHOMA 1.84 2.15 1.97 1.45 1.69
OREGON 1.67 1.64 1.44 0.60 1.97
PENNSYLVANIA 0.47 0.48 0.44 0.43 0.45
PUERTO RICO 3.21 2.93 2.81 2.65 2.47
RHODE ISLAND 1.48 1.66 1.77 1.89 1.39
SOUTH CAROLINA 3.02 4.16 4.24 4.09 3.91
SOUTH DAKOTA 1.66 2.04 1.97 1.67 1.88
TENNESSEE 2.88 3.03 3.08 2.66 2.93
TEXAS 0.91 0.26 0.21 0.51 0.52
UTAH 1.78 1.96 1.87 1.65 1.83
VERMONT 3.21 3.11 3.19 2.28 2.66
VIRGIN ISLANDS 8.33 9.31 12.23 13.40 16.46
VIRGINIA 1.33 1.31 1.24 1.16 1.33
WASHINGTON 1.32 0.92 0.92 0.92 0.99
WEST VIRGINIA 3.07 3.13 3.08 2.92 3.25
WISCONSIN 1.38 1.50 1.55 1.50 1.66
WYOMING 1.78 1.77 1.82 1.67 1.45
TOTALS 2.07% 1.97% 1.94% 1.87% 1.93%
Source: Form OCSE-34 - Part 1.
Formula: Net UDC, 4th quarter/(Balance remaining undistributed at end of quarter, Qtr1 + collections received + net adjustments) - (collections forwarded to non-IV-D cases + collections sent to other States + collections sent to other countries); line 9b, 4th quarter/(line 1 1st qtr + line 2 + line 3) - (lines 4a + 4b + 4c).
FY2018 data was inaccurately reported in prior preliminary and annual reports due to a calculation error. This table includes revised data for FY 2018.
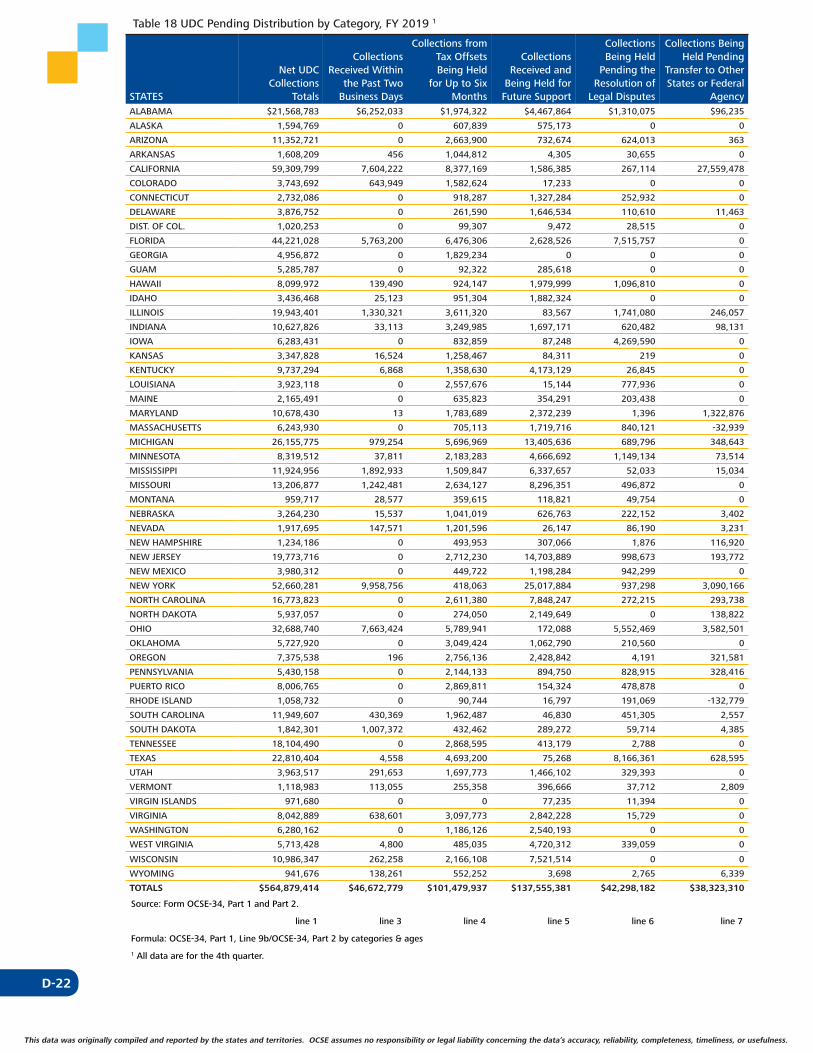
D-22
This data was originally compiled and reported by the states and territories. OCSE assumes no responsibility or legal liability concerning the data’s accuracy, reliability, completeness, timeliness, or usefulness.
Table 18 UDC Pending Distribution by Category, FY 2019 1
STATES
Net UDC Collections
Totals
Collections Received Within
the Past Two Business Days
Collections from Tax Offsets Being Held
for Up to Six Months
Collections Received and
Being Held for Future Support
Collections Being Held
Pending the Resolution of
Legal Disputes
Collections Being Held Pending
Transfer to Other States or Federal
AgencyALABAMA $21,568,783 $6,252,033 $1,974,322 $4,467,864 $1,310,075 $96,235
ALASKA 1,594,769 0 607,839 575,173 0 0
ARIZONA 11,352,721 0 2,663,900 732,674 624,013 363
ARKANSAS 1,608,209 456 1,044,812 4,305 30,655 0
CALIFORNIA 59,309,799 7,604,222 8,377,169 1,586,385 267,114 27,559,478
COLORADO 3,743,692 643,949 1,582,624 17,233 0 0
CONNECTICUT 2,732,086 0 918,287 1,327,284 252,932 0
DELAWARE 3,876,752 0 261,590 1,646,534 110,610 11,463
DIST. OF COL. 1,020,253 0 99,307 9,472 28,515 0
FLORIDA 44,221,028 5,763,200 6,476,306 2,628,526 7,515,757 0
GEORGIA 4,956,872 0 1,829,234 0 0 0
GUAM 5,285,787 0 92,322 285,618 0 0
HAWAII 8,099,972 139,490 924,147 1,979,999 1,096,810 0
IDAHO 3,436,468 25,123 951,304 1,882,324 0 0
ILLINOIS 19,943,401 1,330,321 3,611,320 83,567 1,741,080 246,057
INDIANA 10,627,826 33,113 3,249,985 1,697,171 620,482 98,131
IOWA 6,283,431 0 832,859 87,248 4,269,590 0
KANSAS 3,347,828 16,524 1,258,467 84,311 219 0
KENTUCKY 9,737,294 6,868 1,358,630 4,173,129 26,845 0
LOUISIANA 3,923,118 0 2,557,676 15,144 777,936 0
MAINE 2,165,491 0 635,823 354,291 203,438 0
MARYLAND 10,678,430 13 1,783,689 2,372,239 1,396 1,322,876
MASSACHUSETTS 6,243,930 0 705,113 1,719,716 840,121 -32,939
MICHIGAN 26,155,775 979,254 5,696,969 13,405,636 689,796 348,643
MINNESOTA 8,319,512 37,811 2,183,283 4,666,692 1,149,134 73,514
MISSISSIPPI 11,924,956 1,892,933 1,509,847 6,337,657 52,033 15,034
MISSOURI 13,206,877 1,242,481 2,634,127 8,296,351 496,872 0
MONTANA 959,717 28,577 359,615 118,821 49,754 0
NEBRASKA 3,264,230 15,537 1,041,019 626,763 222,152 3,402
NEVADA 1,917,695 147,571 1,201,596 26,147 86,190 3,231
NEW HAMPSHIRE 1,234,186 0 493,953 307,066 1,876 116,920
NEW JERSEY 19,773,716 0 2,712,230 14,703,889 998,673 193,772
NEW MEXICO 3,980,312 0 449,722 1,198,284 942,299 0
NEW YORK 52,660,281 9,958,756 418,063 25,017,884 937,298 3,090,166
NORTH CAROLINA 16,773,823 0 2,611,380 7,848,247 272,215 293,738
NORTH DAKOTA 5,937,057 0 274,050 2,149,649 0 138,822
OHIO 32,688,740 7,663,424 5,789,941 172,088 5,552,469 3,582,501
OKLAHOMA 5,727,920 0 3,049,424 1,062,790 210,560 0
OREGON 7,375,538 196 2,756,136 2,428,842 4,191 321,581
PENNSYLVANIA 5,430,158 0 2,144,133 894,750 828,915 328,416
PUERTO RICO 8,006,765 0 2,869,811 154,324 478,878 0
RHODE ISLAND 1,058,732 0 90,744 16,797 191,069 -132,779
SOUTH CAROLINA 11,949,607 430,369 1,962,487 46,830 451,305 2,557
SOUTH DAKOTA 1,842,301 1,007,372 432,462 289,272 59,714 4,385
TENNESSEE 18,104,490 0 2,868,595 413,179 2,788 0
TEXAS 22,810,404 4,558 4,693,200 75,268 8,166,361 628,595
UTAH 3,963,517 291,653 1,697,773 1,466,102 329,393 0
VERMONT 1,118,983 113,055 255,358 396,666 37,712 2,809
VIRGIN ISLANDS 971,680 0 0 77,235 11,394 0
VIRGINIA 8,042,889 638,601 3,097,773 2,842,228 15,729 0
WASHINGTON 6,280,162 0 1,186,126 2,540,193 0 0
WEST VIRGINIA 5,713,428 4,800 485,035 4,720,312 339,059 0
WISCONSIN 10,986,347 262,258 2,166,108 7,521,514 0 0
WYOMING 941,676 138,261 552,252 3,698 2,765 6,339
TOTALS $564,879,414 $46,672,779 $101,479,937 $137,555,381 $42,298,182 $38,323,310
Source: Form OCSE-34, Part 1 and Part 2.
line 1 line 3 line 4 line 5 line 6 line 7
Formula: OCSE-34, Part 1, Line 9b/OCSE-34, Part 2 by categories & ages
1 All data are for the 4th quarter.
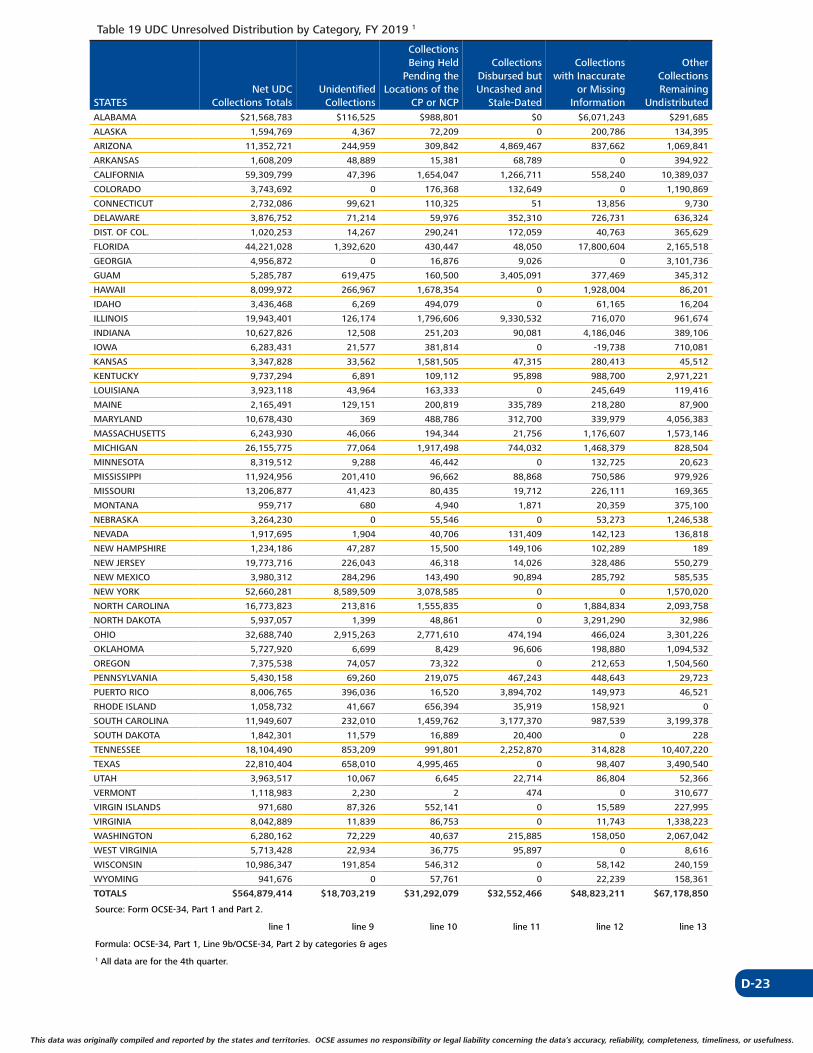
D-23
This data was originally compiled and reported by the states and territories. OCSE assumes no responsibility or legal liability concerning the data’s accuracy, reliability, completeness, timeliness, or usefulness. This data was originally compiled and reported by the states and territories. OCSE assumes no responsibility or legal liability concerning the data’s accuracy, reliability, completeness, timeliness, or usefulness.
Table 19 UDC Unresolved Distribution by Category, FY 2019 1
STATESNet UDC
Collections TotalsUnidentified
Collections
Collections Being Held
Pending the Locations of the
CP or NCP
Collections Disbursed but Uncashed and
Stale-Dated
Collections with Inaccurate
or Missing Information
Other Collections Remaining
UndistributedALABAMA $21,568,783 $116,525 $988,801 $0 $6,071,243 $291,685
ALASKA 1,594,769 4,367 72,209 0 200,786 134,395
ARIZONA 11,352,721 244,959 309,842 4,869,467 837,662 1,069,841
ARKANSAS 1,608,209 48,889 15,381 68,789 0 394,922
CALIFORNIA 59,309,799 47,396 1,654,047 1,266,711 558,240 10,389,037
COLORADO 3,743,692 0 176,368 132,649 0 1,190,869
CONNECTICUT 2,732,086 99,621 110,325 51 13,856 9,730
DELAWARE 3,876,752 71,214 59,976 352,310 726,731 636,324
DIST. OF COL. 1,020,253 14,267 290,241 172,059 40,763 365,629
FLORIDA 44,221,028 1,392,620 430,447 48,050 17,800,604 2,165,518
GEORGIA 4,956,872 0 16,876 9,026 0 3,101,736
GUAM 5,285,787 619,475 160,500 3,405,091 377,469 345,312
HAWAII 8,099,972 266,967 1,678,354 0 1,928,004 86,201
IDAHO 3,436,468 6,269 494,079 0 61,165 16,204
ILLINOIS 19,943,401 126,174 1,796,606 9,330,532 716,070 961,674
INDIANA 10,627,826 12,508 251,203 90,081 4,186,046 389,106
IOWA 6,283,431 21,577 381,814 0 -19,738 710,081
KANSAS 3,347,828 33,562 1,581,505 47,315 280,413 45,512
KENTUCKY 9,737,294 6,891 109,112 95,898 988,700 2,971,221
LOUISIANA 3,923,118 43,964 163,333 0 245,649 119,416
MAINE 2,165,491 129,151 200,819 335,789 218,280 87,900
MARYLAND 10,678,430 369 488,786 312,700 339,979 4,056,383
MASSACHUSETTS 6,243,930 46,066 194,344 21,756 1,176,607 1,573,146
MICHIGAN 26,155,775 77,064 1,917,498 744,032 1,468,379 828,504
MINNESOTA 8,319,512 9,288 46,442 0 132,725 20,623
MISSISSIPPI 11,924,956 201,410 96,662 88,868 750,586 979,926
MISSOURI 13,206,877 41,423 80,435 19,712 226,111 169,365
MONTANA 959,717 680 4,940 1,871 20,359 375,100
NEBRASKA 3,264,230 0 55,546 0 53,273 1,246,538
NEVADA 1,917,695 1,904 40,706 131,409 142,123 136,818
NEW HAMPSHIRE 1,234,186 47,287 15,500 149,106 102,289 189
NEW JERSEY 19,773,716 226,043 46,318 14,026 328,486 550,279
NEW MEXICO 3,980,312 284,296 143,490 90,894 285,792 585,535
NEW YORK 52,660,281 8,589,509 3,078,585 0 0 1,570,020
NORTH CAROLINA 16,773,823 213,816 1,555,835 0 1,884,834 2,093,758
NORTH DAKOTA 5,937,057 1,399 48,861 0 3,291,290 32,986
OHIO 32,688,740 2,915,263 2,771,610 474,194 466,024 3,301,226
OKLAHOMA 5,727,920 6,699 8,429 96,606 198,880 1,094,532
OREGON 7,375,538 74,057 73,322 0 212,653 1,504,560
PENNSYLVANIA 5,430,158 69,260 219,075 467,243 448,643 29,723
PUERTO RICO 8,006,765 396,036 16,520 3,894,702 149,973 46,521
RHODE ISLAND 1,058,732 41,667 656,394 35,919 158,921 0
SOUTH CAROLINA 11,949,607 232,010 1,459,762 3,177,370 987,539 3,199,378
SOUTH DAKOTA 1,842,301 11,579 16,889 20,400 0 228
TENNESSEE 18,104,490 853,209 991,801 2,252,870 314,828 10,407,220
TEXAS 22,810,404 658,010 4,995,465 0 98,407 3,490,540
UTAH 3,963,517 10,067 6,645 22,714 86,804 52,366
VERMONT 1,118,983 2,230 2 474 0 310,677
VIRGIN ISLANDS 971,680 87,326 552,141 0 15,589 227,995
VIRGINIA 8,042,889 11,839 86,753 0 11,743 1,338,223
WASHINGTON 6,280,162 72,229 40,637 215,885 158,050 2,067,042
WEST VIRGINIA 5,713,428 22,934 36,775 95,897 0 8,616
WISCONSIN 10,986,347 191,854 546,312 0 58,142 240,159
WYOMING 941,676 0 57,761 0 22,239 158,361
TOTALS $564,879,414 $18,703,219 $31,292,079 $32,552,466 $48,823,211 $67,178,850
Source: Form OCSE-34, Part 1 and Part 2.
line 1 line 9 line 10 line 11 line 12 line 13
Formula: OCSE-34, Part 1, Line 9b/OCSE-34, Part 2 by categories & ages
1 All data are for the 4th quarter.
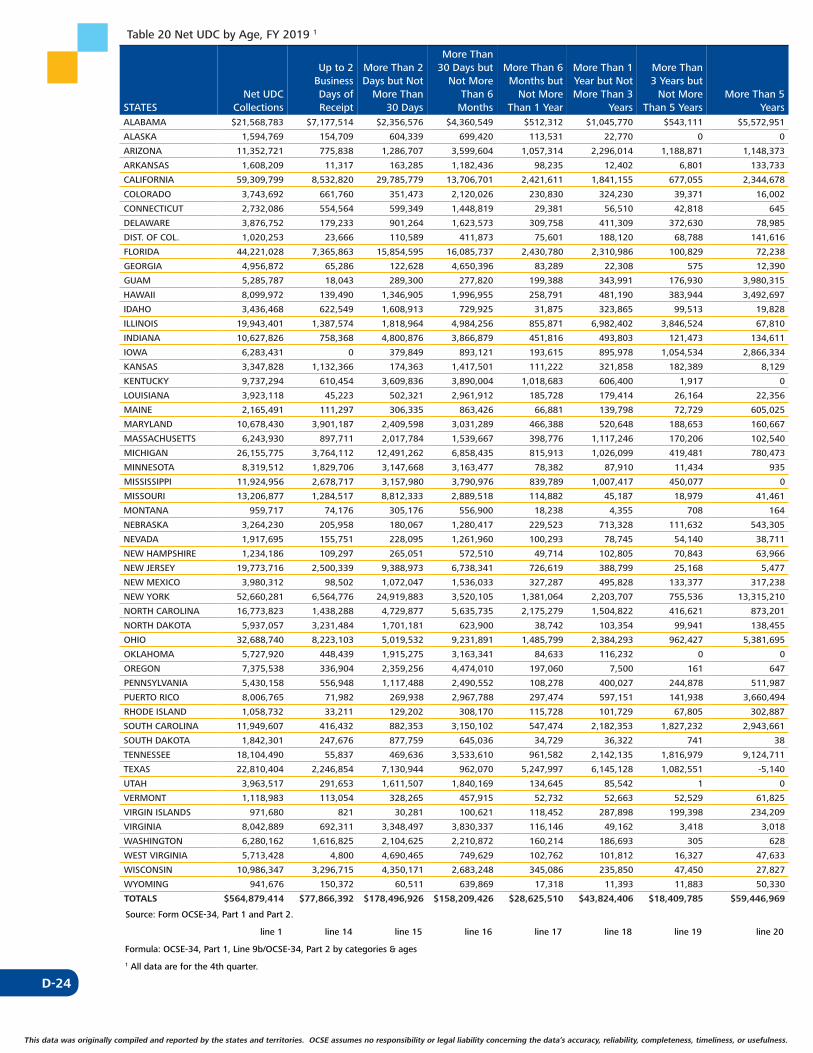
D-24
This data was originally compiled and reported by the states and territories. OCSE assumes no responsibility or legal liability concerning the data’s accuracy, reliability, completeness, timeliness, or usefulness.
Table 20 Net UDC by Age, FY 2019 1
More Than
STATESNet UDC
Collections
Up to 2 Business Days of Receipt
More Than 2 Days but Not
More Than 30 Days
30 Days but Not More
Than 6 Months
More Than 6 Months but
Not More Than 1 Year
More Than 1 Year but Not More Than 3
Years
More Than 3 Years but
Not More Than 5 Years
More Than 5 Years
ALABAMA $21,568,783 $7,177,514 $2,356,576 $4,360,549 $512,312 $1,045,770 $543,111 $5,572,951
ALASKA 1,594,769 154,709 604,339 699,420 113,531 22,770 0 0
ARIZONA 11,352,721 775,838 1,286,707 3,599,604 1,057,314 2,296,014 1,188,871 1,148,373
ARKANSAS 1,608,209 11,317 163,285 1,182,436 98,235 12,402 6,801 133,733
CALIFORNIA 59,309,799 8,532,820 29,785,779 13,706,701 2,421,611 1,841,155 677,055 2,344,678
COLORADO 3,743,692 661,760 351,473 2,120,026 230,830 324,230 39,371 16,002
CONNECTICUT 2,732,086 554,564 599,349 1,448,819 29,381 56,510 42,818 645
DELAWARE 3,876,752 179,233 901,264 1,623,573 309,758 411,309 372,630 78,985
DIST. OF COL. 1,020,253 23,666 110,589 411,873 75,601 188,120 68,788 141,616
FLORIDA 44,221,028 7,365,863 15,854,595 16,085,737 2,430,780 2,310,986 100,829 72,238
GEORGIA 4,956,872 65,286 122,628 4,650,396 83,289 22,308 575 12,390
GUAM 5,285,787 18,043 289,300 277,820 199,388 343,991 176,930 3,980,315
HAWAII 8,099,972 139,490 1,346,905 1,996,955 258,791 481,190 383,944 3,492,697
IDAHO 3,436,468 622,549 1,608,913 729,925 31,875 323,865 99,513 19,828
ILLINOIS 19,943,401 1,387,574 1,818,964 4,984,256 855,871 6,982,402 3,846,524 67,810
INDIANA 10,627,826 758,368 4,800,876 3,866,879 451,816 493,803 121,473 134,611
IOWA 6,283,431 0 379,849 893,121 193,615 895,978 1,054,534 2,866,334
KANSAS 3,347,828 1,132,366 174,363 1,417,501 111,222 321,858 182,389 8,129
KENTUCKY 9,737,294 610,454 3,609,836 3,890,004 1,018,683 606,400 1,917 0
LOUISIANA 3,923,118 45,223 502,321 2,961,912 185,728 179,414 26,164 22,356
MAINE 2,165,491 111,297 306,335 863,426 66,881 139,798 72,729 605,025
MARYLAND 10,678,430 3,901,187 2,409,598 3,031,289 466,388 520,648 188,653 160,667
MASSACHUSETTS 6,243,930 897,711 2,017,784 1,539,667 398,776 1,117,246 170,206 102,540
MICHIGAN 26,155,775 3,764,112 12,491,262 6,858,435 815,913 1,026,099 419,481 780,473
MINNESOTA 8,319,512 1,829,706 3,147,668 3,163,477 78,382 87,910 11,434 935
MISSISSIPPI 11,924,956 2,678,717 3,157,980 3,790,976 839,789 1,007,417 450,077 0
MISSOURI 13,206,877 1,284,517 8,812,333 2,889,518 114,882 45,187 18,979 41,461
MONTANA 959,717 74,176 305,176 556,900 18,238 4,355 708 164
NEBRASKA 3,264,230 205,958 180,067 1,280,417 229,523 713,328 111,632 543,305
NEVADA 1,917,695 155,751 228,095 1,261,960 100,293 78,745 54,140 38,711
NEW HAMPSHIRE 1,234,186 109,297 265,051 572,510 49,714 102,805 70,843 63,966
NEW JERSEY 19,773,716 2,500,339 9,388,973 6,738,341 726,619 388,799 25,168 5,477
NEW MEXICO 3,980,312 98,502 1,072,047 1,536,033 327,287 495,828 133,377 317,238
NEW YORK 52,660,281 6,564,776 24,919,883 3,520,105 1,381,064 2,203,707 755,536 13,315,210
NORTH CAROLINA 16,773,823 1,438,288 4,729,877 5,635,735 2,175,279 1,504,822 416,621 873,201
NORTH DAKOTA 5,937,057 3,231,484 1,701,181 623,900 38,742 103,354 99,941 138,455
OHIO 32,688,740 8,223,103 5,019,532 9,231,891 1,485,799 2,384,293 962,427 5,381,695
OKLAHOMA 5,727,920 448,439 1,915,275 3,163,341 84,633 116,232 0 0
OREGON 7,375,538 336,904 2,359,256 4,474,010 197,060 7,500 161 647
PENNSYLVANIA 5,430,158 556,948 1,117,488 2,490,552 108,278 400,027 244,878 511,987
PUERTO RICO 8,006,765 71,982 269,938 2,967,788 297,474 597,151 141,938 3,660,494
RHODE ISLAND 1,058,732 33,211 129,202 308,170 115,728 101,729 67,805 302,887
SOUTH CAROLINA 11,949,607 416,432 882,353 3,150,102 547,474 2,182,353 1,827,232 2,943,661
SOUTH DAKOTA 1,842,301 247,676 877,759 645,036 34,729 36,322 741 38
TENNESSEE 18,104,490 55,837 469,636 3,533,610 961,582 2,142,135 1,816,979 9,124,711
TEXAS 22,810,404 2,246,854 7,130,944 962,070 5,247,997 6,145,128 1,082,551 -5,140
UTAH 3,963,517 291,653 1,611,507 1,840,169 134,645 85,542 1 0
VERMONT 1,118,983 113,054 328,265 457,915 52,732 52,663 52,529 61,825
VIRGIN ISLANDS 971,680 821 30,281 100,621 118,452 287,898 199,398 234,209
VIRGINIA 8,042,889 692,311 3,348,497 3,830,337 116,146 49,162 3,418 3,018
WASHINGTON 6,280,162 1,616,825 2,104,625 2,210,872 160,214 186,693 305 628
WEST VIRGINIA 5,713,428 4,800 4,690,465 749,629 102,762 101,812 16,327 47,633
WISCONSIN 10,986,347 3,296,715 4,350,171 2,683,248 345,086 235,850 47,450 27,827
WYOMING 941,676 150,372 60,511 639,869 17,318 11,393 11,883 50,330
TOTALS $564,879,414 $77,866,392 $178,496,926 $158,209,426 $28,625,510 $43,824,406 $18,409,785 $59,446,969
Source: Form OCSE-34, Part 1 and Part 2.
line 1 line 14 line 15 line 16 line 17 line 18 line 19 line 20
Formula: OCSE-34, Part 1, Line 9b/OCSE-34, Part 2 by categories & ages
1 All data are for the 4th quarter.
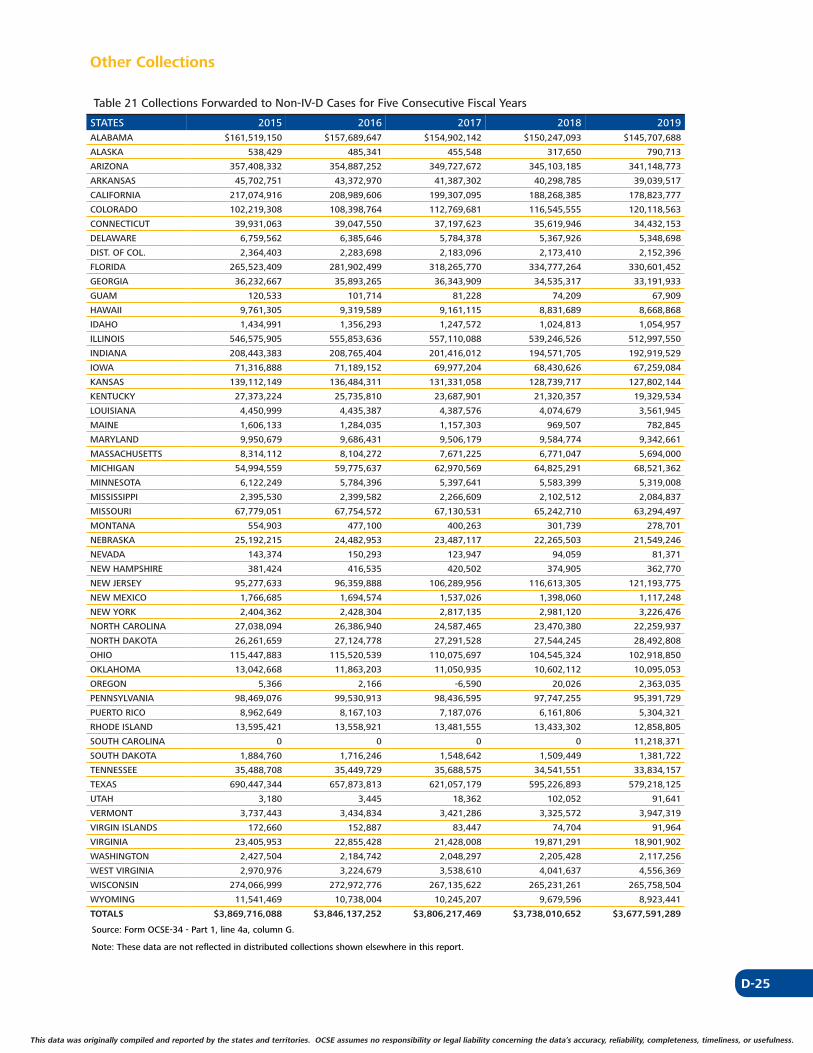
D-25
This data was originally compiled and reported by the states and territories. OCSE assumes no responsibility or legal liability concerning the data’s accuracy, reliability, completeness, timeliness, or usefulness. This data was originally compiled and reported by the states and territories. OCSE assumes no responsibility or legal liability concerning the data’s accuracy, reliability, completeness, timeliness, or usefulness.
Other Collections
Table 21 Collections Forwarded to Non-IV-D Cases for Five Consecutive Fiscal Years
STATES 2015 2016 2017 2018 2019ALABAMA $161,519,150 $157,689,647 $154,902,142 $150,247,093 $145,707,688
ALASKA 538,429 485,341 455,548 317,650 790,713
ARIZONA 357,408,332 354,887,252 349,727,672 345,103,185 341,148,773
ARKANSAS 45,702,751 43,372,970 41,387,302 40,298,785 39,039,517
CALIFORNIA 217,074,916 208,989,606 199,307,095 188,268,385 178,823,777
COLORADO 102,219,308 108,398,764 112,769,681 116,545,555 120,118,563
CONNECTICUT 39,931,063 39,047,550 37,197,623 35,619,946 34,432,153
DELAWARE 6,759,562 6,385,646 5,784,378 5,367,926 5,348,698
DIST. OF COL. 2,364,403 2,283,698 2,183,096 2,173,410 2,152,396
FLORIDA 265,523,409 281,902,499 318,265,770 334,777,264 330,601,452
GEORGIA 36,232,667 35,893,265 36,343,909 34,535,317 33,191,933
GUAM 120,533 101,714 81,228 74,209 67,909
HAWAII 9,761,305 9,319,589 9,161,115 8,831,689 8,668,868
IDAHO 1,434,991 1,356,293 1,247,572 1,024,813 1,054,957
ILLINOIS 546,575,905 555,853,636 557,110,088 539,246,526 512,997,550
INDIANA 208,443,383 208,765,404 201,416,012 194,571,705 192,919,529
IOWA 71,316,888 71,189,152 69,977,204 68,430,626 67,259,084
KANSAS 139,112,149 136,484,311 131,331,058 128,739,717 127,802,144
KENTUCKY 27,373,224 25,735,810 23,687,901 21,320,357 19,329,534
LOUISIANA 4,450,999 4,435,387 4,387,576 4,074,679 3,561,945
MAINE 1,606,133 1,284,035 1,157,303 969,507 782,845
MARYLAND 9,950,679 9,686,431 9,506,179 9,584,774 9,342,661
MASSACHUSETTS 8,314,112 8,104,272 7,671,225 6,771,047 5,694,000
MICHIGAN 54,994,559 59,775,637 62,970,569 64,825,291 68,521,362
MINNESOTA 6,122,249 5,784,396 5,397,641 5,583,399 5,319,008
MISSISSIPPI 2,395,530 2,399,582 2,266,609 2,102,512 2,084,837
MISSOURI 67,779,051 67,754,572 67,130,531 65,242,710 63,294,497
MONTANA 554,903 477,100 400,263 301,739 278,701
NEBRASKA 25,192,215 24,482,953 23,487,117 22,265,503 21,549,246
NEVADA 143,374 150,293 123,947 94,059 81,371
NEW HAMPSHIRE 381,424 416,535 420,502 374,905 362,770
NEW JERSEY 95,277,633 96,359,888 106,289,956 116,613,305 121,193,775
NEW MEXICO 1,766,685 1,694,574 1,537,026 1,398,060 1,117,248
NEW YORK 2,404,362 2,428,304 2,817,135 2,981,120 3,226,476
NORTH CAROLINA 27,038,094 26,386,940 24,587,465 23,470,380 22,259,937
NORTH DAKOTA 26,261,659 27,124,778 27,291,528 27,544,245 28,492,808
OHIO 115,447,883 115,520,539 110,075,697 104,545,324 102,918,850
OKLAHOMA 13,042,668 11,863,203 11,050,935 10,602,112 10,095,053
OREGON 5,366 2,166 -6,590 20,026 2,363,035
PENNSYLVANIA 98,469,076 99,530,913 98,436,595 97,747,255 95,391,729
PUERTO RICO 8,962,649 8,167,103 7,187,076 6,161,806 5,304,321
RHODE ISLAND 13,595,421 13,558,921 13,481,555 13,433,302 12,858,805
SOUTH CAROLINA 0 0 0 0 11,218,371
SOUTH DAKOTA 1,884,760 1,716,246 1,548,642 1,509,449 1,381,722
TENNESSEE 35,488,708 35,449,729 35,688,575 34,541,551 33,834,157
TEXAS 690,447,344 657,873,813 621,057,179 595,226,893 579,218,125
UTAH 3,180 3,445 18,362 102,052 91,641
VERMONT 3,737,443 3,434,834 3,421,286 3,325,572 3,947,319
VIRGIN ISLANDS 172,660 152,887 83,447 74,704 91,964
VIRGINIA 23,405,953 22,855,428 21,428,008 19,871,291 18,901,902
WASHINGTON 2,427,504 2,184,742 2,048,297 2,205,428 2,117,256
WEST VIRGINIA 2,970,976 3,224,679 3,538,610 4,041,637 4,556,369
WISCONSIN 274,066,999 272,972,776 267,135,622 265,231,261 265,758,504
WYOMING 11,541,469 10,738,004 10,245,207 9,679,596 8,923,441
TOTALS $3,869,716,088 $3,846,137,252 $3,806,217,469 $3,738,010,652 $3,677,591,289
Source: Form OCSE-34 - Part 1, line 4a, column G.
Note: These data are not reflected in distributed collections shown elsewhere in this report.
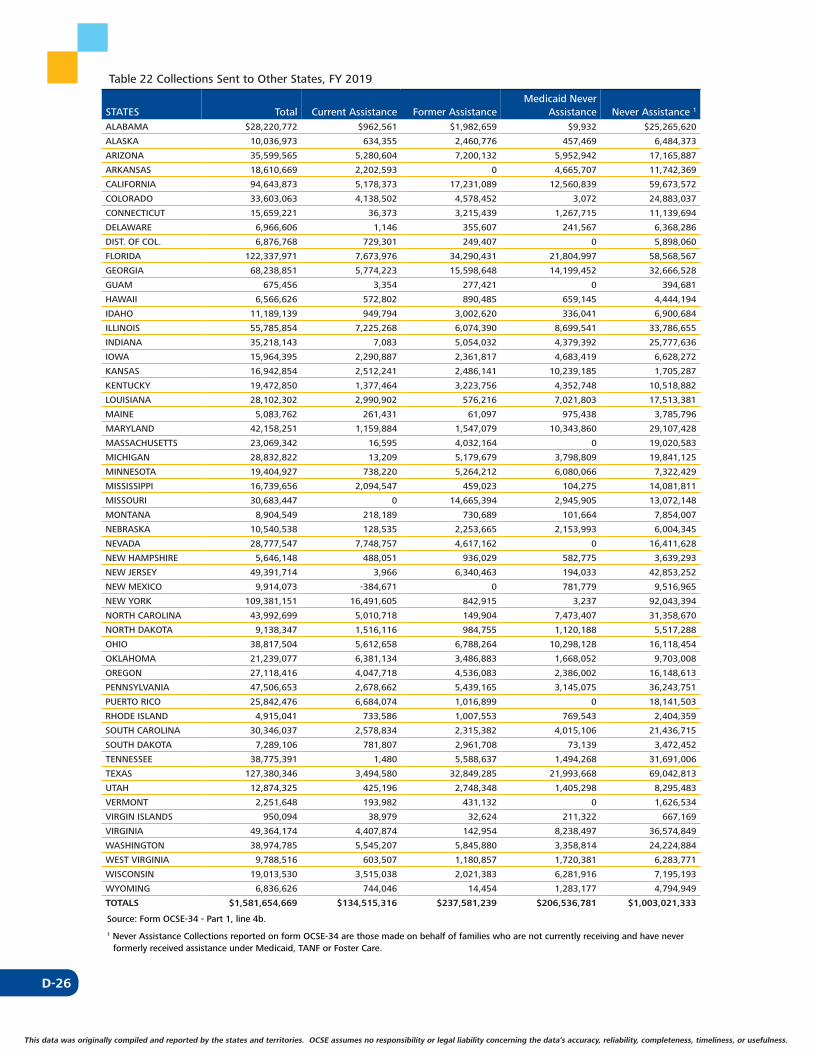
D-26
This data was originally compiled and reported by the states and territories. OCSE assumes no responsibility or legal liability concerning the data’s accuracy, reliability, completeness, timeliness, or usefulness.
Table 22 Collections Sent to Other States, FY 2019
STATES Total Current Assistance Former AssistanceMedicaid Never
Assistance Never Assistance 1
ALABAMA $28,220,772 $962,561 $1,982,659 $9,932 $25,265,620
ALASKA 10,036,973 634,355 2,460,776 457,469 6,484,373
ARIZONA 35,599,565 5,280,604 7,200,132 5,952,942 17,165,887
ARKANSAS 18,610,669 2,202,593 0 4,665,707 11,742,369
CALIFORNIA 94,643,873 5,178,373 17,231,089 12,560,839 59,673,572
COLORADO 33,603,063 4,138,502 4,578,452 3,072 24,883,037
CONNECTICUT 15,659,221 36,373 3,215,439 1,267,715 11,139,694
DELAWARE 6,966,606 1,146 355,607 241,567 6,368,286
DIST. OF COL. 6,876,768 729,301 249,407 0 5,898,060
FLORIDA 122,337,971 7,673,976 34,290,431 21,804,997 58,568,567
GEORGIA 68,238,851 5,774,223 15,598,648 14,199,452 32,666,528
GUAM 675,456 3,354 277,421 0 394,681
HAWAII 6,566,626 572,802 890,485 659,145 4,444,194
IDAHO 11,189,139 949,794 3,002,620 336,041 6,900,684
ILLINOIS 55,785,854 7,225,268 6,074,390 8,699,541 33,786,655
INDIANA 35,218,143 7,083 5,054,032 4,379,392 25,777,636
IOWA 15,964,395 2,290,887 2,361,817 4,683,419 6,628,272
KANSAS 16,942,854 2,512,241 2,486,141 10,239,185 1,705,287
KENTUCKY 19,472,850 1,377,464 3,223,756 4,352,748 10,518,882
LOUISIANA 28,102,302 2,990,902 576,216 7,021,803 17,513,381
MAINE 5,083,762 261,431 61,097 975,438 3,785,796
MARYLAND 42,158,251 1,159,884 1,547,079 10,343,860 29,107,428
MASSACHUSETTS 23,069,342 16,595 4,032,164 0 19,020,583
MICHIGAN 28,832,822 13,209 5,179,679 3,798,809 19,841,125
MINNESOTA 19,404,927 738,220 5,264,212 6,080,066 7,322,429
MISSISSIPPI 16,739,656 2,094,547 459,023 104,275 14,081,811
MISSOURI 30,683,447 0 14,665,394 2,945,905 13,072,148
MONTANA 8,904,549 218,189 730,689 101,664 7,854,007
NEBRASKA 10,540,538 128,535 2,253,665 2,153,993 6,004,345
NEVADA 28,777,547 7,748,757 4,617,162 0 16,411,628
NEW HAMPSHIRE 5,646,148 488,051 936,029 582,775 3,639,293
NEW JERSEY 49,391,714 3,966 6,340,463 194,033 42,853,252
NEW MEXICO 9,914,073 -384,671 0 781,779 9,516,965
NEW YORK 109,381,151 16,491,605 842,915 3,237 92,043,394
NORTH CAROLINA 43,992,699 5,010,718 149,904 7,473,407 31,358,670
NORTH DAKOTA 9,138,347 1,516,116 984,755 1,120,188 5,517,288
OHIO 38,817,504 5,612,658 6,788,264 10,298,128 16,118,454
OKLAHOMA 21,239,077 6,381,134 3,486,883 1,668,052 9,703,008
OREGON 27,118,416 4,047,718 4,536,083 2,386,002 16,148,613
PENNSYLVANIA 47,506,653 2,678,662 5,439,165 3,145,075 36,243,751
PUERTO RICO 25,842,476 6,684,074 1,016,899 0 18,141,503
RHODE ISLAND 4,915,041 733,586 1,007,553 769,543 2,404,359
SOUTH CAROLINA 30,346,037 2,578,834 2,315,382 4,015,106 21,436,715
SOUTH DAKOTA 7,289,106 781,807 2,961,708 73,139 3,472,452
TENNESSEE 38,775,391 1,480 5,588,637 1,494,268 31,691,006
TEXAS 127,380,346 3,494,580 32,849,285 21,993,668 69,042,813
UTAH 12,874,325 425,196 2,748,348 1,405,298 8,295,483
VERMONT 2,251,648 193,982 431,132 0 1,626,534
VIRGIN ISLANDS 950,094 38,979 32,624 211,322 667,169
VIRGINIA 49,364,174 4,407,874 142,954 8,238,497 36,574,849
WASHINGTON 38,974,785 5,545,207 5,845,880 3,358,814 24,224,884
WEST VIRGINIA 9,788,516 603,507 1,180,857 1,720,381 6,283,771
WISCONSIN 19,013,530 3,515,038 2,021,383 6,281,916 7,195,193
WYOMING 6,836,626 744,046 14,454 1,283,177 4,794,949
TOTALS $1,581,654,669 $134,515,316 $237,581,239 $206,536,781 $1,003,021,333
Source: Form OCSE-34 - Part 1, line 4b.
1 Never Assistance Collections reported on form OCSE-34 are those made on behalf of families who are not currently receiving and have never formerly received assistance under Medicaid, TANF or Foster Care.
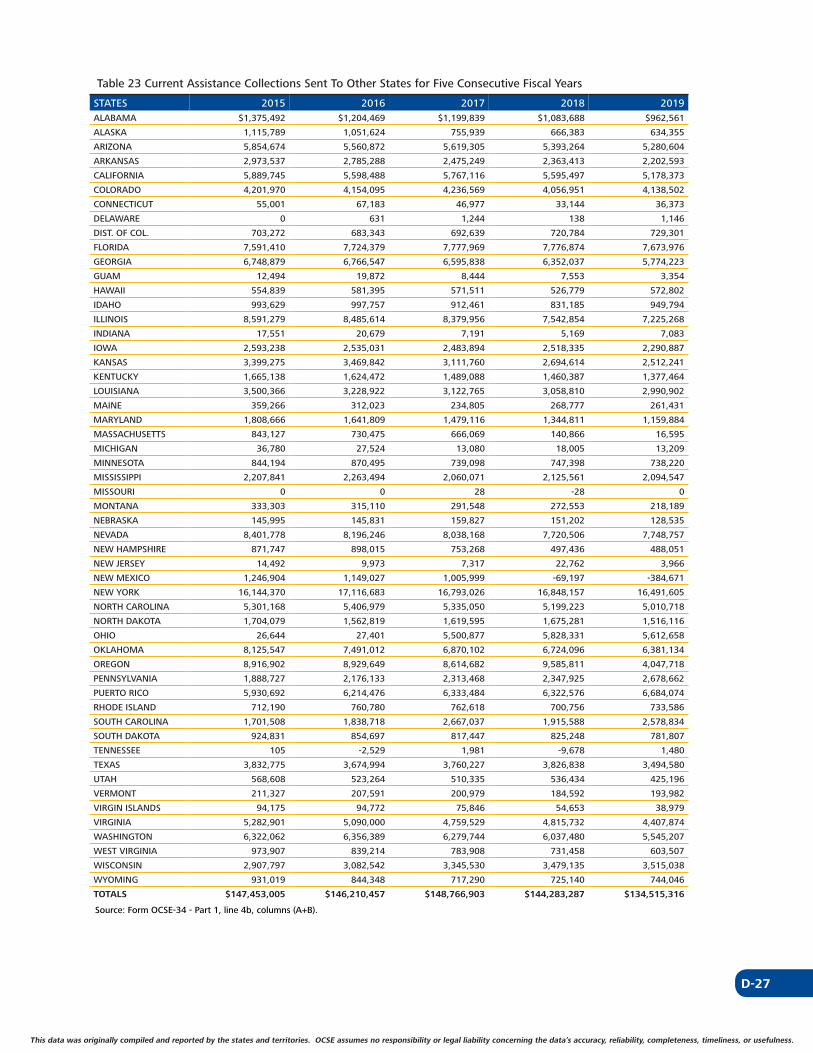
D-27
This data was originally compiled and reported by the states and territories. OCSE assumes no responsibility or legal liability concerning the data’s accuracy, reliability, completeness, timeliness, or usefulness. This data was originally compiled and reported by the states and territories. OCSE assumes no responsibility or legal liability concerning the data’s accuracy, reliability, completeness, timeliness, or usefulness.
Table 23 Current Assistance Collections Sent To Other States for Five Consecutive Fiscal Years
STATES 2015 2016 2017 2018 2019ALABAMA $1,375,492 $1,204,469 $1,199,839 $1,083,688 $962,561
ALASKA 1,115,789 1,051,624 755,939 666,383 634,355
ARIZONA 5,854,674 5,560,872 5,619,305 5,393,264 5,280,604
ARKANSAS 2,973,537 2,785,288 2,475,249 2,363,413 2,202,593
CALIFORNIA 5,889,745 5,598,488 5,767,116 5,595,497 5,178,373
COLORADO 4,201,970 4,154,095 4,236,569 4,056,951 4,138,502
CONNECTICUT 55,001 67,183 46,977 33,144 36,373
DELAWARE 0 631 1,244 138 1,146
DIST. OF COL. 703,272 683,343 692,639 720,784 729,301
FLORIDA 7,591,410 7,724,379 7,777,969 7,776,874 7,673,976
GEORGIA 6,748,879 6,766,547 6,595,838 6,352,037 5,774,223
GUAM 12,494 19,872 8,444 7,553 3,354
HAWAII 554,839 581,395 571,511 526,779 572,802
IDAHO 993,629 997,757 912,461 831,185 949,794
ILLINOIS 8,591,279 8,485,614 8,379,956 7,542,854 7,225,268
INDIANA 17,551 20,679 7,191 5,169 7,083
IOWA 2,593,238 2,535,031 2,483,894 2,518,335 2,290,887
KANSAS 3,399,275 3,469,842 3,111,760 2,694,614 2,512,241
KENTUCKY 1,665,138 1,624,472 1,489,088 1,460,387 1,377,464
LOUISIANA 3,500,366 3,228,922 3,122,765 3,058,810 2,990,902
MAINE 359,266 312,023 234,805 268,777 261,431
MARYLAND 1,808,666 1,641,809 1,479,116 1,344,811 1,159,884
MASSACHUSETTS 843,127 730,475 666,069 140,866 16,595
MICHIGAN 36,780 27,524 13,080 18,005 13,209
MINNESOTA 844,194 870,495 739,098 747,398 738,220
MISSISSIPPI 2,207,841 2,263,494 2,060,071 2,125,561 2,094,547
MISSOURI 0 0 28 -28 0
MONTANA 333,303 315,110 291,548 272,553 218,189
NEBRASKA 145,995 145,831 159,827 151,202 128,535
NEVADA 8,401,778 8,196,246 8,038,168 7,720,506 7,748,757
NEW HAMPSHIRE 871,747 898,015 753,268 497,436 488,051
NEW JERSEY 14,492 9,973 7,317 22,762 3,966
NEW MEXICO 1,246,904 1,149,027 1,005,999 -69,197 -384,671
NEW YORK 16,144,370 17,116,683 16,793,026 16,848,157 16,491,605
NORTH CAROLINA 5,301,168 5,406,979 5,335,050 5,199,223 5,010,718
NORTH DAKOTA 1,704,079 1,562,819 1,619,595 1,675,281 1,516,116
OHIO 26,644 27,401 5,500,877 5,828,331 5,612,658
OKLAHOMA 8,125,547 7,491,012 6,870,102 6,724,096 6,381,134
OREGON 8,916,902 8,929,649 8,614,682 9,585,811 4,047,718
PENNSYLVANIA 1,888,727 2,176,133 2,313,468 2,347,925 2,678,662
PUERTO RICO 5,930,692 6,214,476 6,333,484 6,322,576 6,684,074
RHODE ISLAND 712,190 760,780 762,618 700,756 733,586
SOUTH CAROLINA 1,701,508 1,838,718 2,667,037 1,915,588 2,578,834
SOUTH DAKOTA 924,831 854,697 817,447 825,248 781,807
TENNESSEE 105 -2,529 1,981 -9,678 1,480
TEXAS 3,832,775 3,674,994 3,760,227 3,826,838 3,494,580
UTAH 568,608 523,264 510,335 536,434 425,196
VERMONT 211,327 207,591 200,979 184,592 193,982
VIRGIN ISLANDS 94,175 94,772 75,846 54,653 38,979
VIRGINIA 5,282,901 5,090,000 4,759,529 4,815,732 4,407,874
WASHINGTON 6,322,062 6,356,389 6,279,744 6,037,480 5,545,207
WEST VIRGINIA 973,907 839,214 783,908 731,458 603,507
WISCONSIN 2,907,797 3,082,542 3,345,530 3,479,135 3,515,038
WYOMING 931,019 844,348 717,290 725,140 744,046
TOTALS $147,453,005 $146,210,457 $148,766,903 $144,283,287 $134,515,316
Source: Form OCSE-34 - Part 1, line 4b, columns (A+B).

D-28
This data was originally compiled and reported by the states and territories. OCSE assumes no responsibility or legal liability concerning the data’s accuracy, reliability, completeness, timeliness, or usefulness.
Table 24 Former Assistance Collections Sent To Other States for Five Consecutive Fiscal Years
STATES 2015 2016 2017 2018 2019ALABAMA $2,068,416 $2,147,503 $2,074,887 $2,028,826 $1,982,659
ALASKA 3,306,007 2,982,154 2,660,779 2,484,355 2,460,776
ARIZONA 6,925,102 6,789,779 7,040,792 6,947,842 7,200,132
ARKANSAS 7,060 2,339 36,362 0 0
CALIFORNIA 12,462,310 13,615,829 14,554,390 15,487,175 17,231,089
COLORADO 5,195,997 4,979,042 4,873,364 4,768,176 4,578,452
CONNECTICUT 3,668,227 3,439,939 3,268,852 3,082,240 3,215,439
DELAWARE 354,683 397,826 355,026 447,835 355,607
DIST. OF COL. 257,896 258,988 287,417 284,534 249,407
FLORIDA 32,226,756 33,198,502 33,207,073 33,662,382 34,290,431
GEORGIA 15,366,929 16,014,061 16,418,626 15,991,082 15,598,648
GUAM 265,969 271,451 261,913 245,870 277,421
HAWAII 998,272 1,004,115 995,622 896,418 890,485
IDAHO 3,519,496 3,502,014 3,400,803 2,806,504 3,002,620
ILLINOIS 5,493,045 5,604,484 5,897,726 5,770,019 6,074,390
INDIANA 6,583,907 6,419,466 5,891,873 5,483,755 5,054,032
IOWA 2,639,660 2,559,391 2,552,983 2,403,177 2,361,817
KANSAS 2,317,134 2,565,961 2,668,244 2,608,159 2,486,141
KENTUCKY 3,338,725 3,381,065 3,349,240 3,289,389 3,223,756
LOUISIANA 504,692 426,896 465,974 516,621 576,216
MAINE 78,792 52,344 45,295 50,032 61,097
MARYLAND 1,797,880 1,746,186 1,711,770 1,693,928 1,547,079
MASSACHUSETTS 8,755,098 8,622,814 8,601,740 2,869,977 4,032,164
MICHIGAN 6,149,047 5,673,645 5,594,994 5,563,766 5,179,679
MINNESOTA 5,972,608 5,673,584 5,370,043 5,259,203 5,264,212
MISSISSIPPI 409,366 426,749 391,846 431,336 459,023
MISSOURI 14,042,324 14,695,053 14,842,198 14,906,918 14,665,394
MONTANA 888,304 806,938 832,255 818,554 730,689
NEBRASKA 2,742,003 2,720,000 2,398,833 2,331,894 2,253,665
NEVADA 4,004,502 4,219,056 4,342,446 4,384,986 4,617,162
NEW HAMPSHIRE 764,939 780,383 855,496 865,835 936,029
NEW JERSEY 6,010,355 6,174,940 6,387,048 6,528,299 6,340,463
NEW MEXICO 0 0 0 0 0
NEW YORK 1,341,875 1,159,922 1,013,045 845,130 842,915
NORTH CAROLINA 125,876 162,756 179,213 179,041 149,904
NORTH DAKOTA 1,160,069 1,042,081 973,555 911,936 984,755
OHIO 5,982,310 5,790,224 6,805,106 6,872,790 6,788,264
OKLAHOMA 3,505,232 3,329,720 3,046,646 3,174,054 3,486,883
OREGON 1,303,941 1,158,171 1,166,271 1,123,115 4,536,083
PENNSYLVANIA 4,931,297 5,321,410 5,546,176 5,358,399 5,439,165
PUERTO RICO 412,116 493,050 772,404 885,727 1,016,899
RHODE ISLAND 1,033,810 1,008,225 976,348 923,309 1,007,553
SOUTH CAROLINA 134,670 147,779 104,867 95,138 2,315,382
SOUTH DAKOTA 2,988,162 2,844,041 2,972,172 2,881,681 2,961,708
TENNESSEE 5,070,310 5,595,983 5,973,195 5,484,913 5,588,637
TEXAS 34,195,687 34,133,535 33,875,693 33,136,299 32,849,285
UTAH 2,392,430 2,487,092 2,544,189 2,543,934 2,748,348
VERMONT 489,110 399,998 416,858 419,076 431,132
VIRGIN ISLANDS 48,993 70,024 34,865 23,039 32,624
VIRGINIA 185,276 213,171 150,981 161,446 142,954
WASHINGTON 5,727,447 5,857,403 5,884,565 5,878,376 5,845,880
WEST VIRGINIA 1,496,175 1,364,806 1,217,252 1,157,454 1,180,857
WISCONSIN 2,240,414 2,105,820 2,044,582 2,041,690 2,021,383
WYOMING 31,765 13,096 11,733 10,687 14,454
TOTALS $233,912,466 $235,850,804 $237,345,626 $229,016,321 $237,581,239
Source: Form OCSE-34 - Part 1, line 4b, columns (C+D).

D-29
This data was originally compiled and reported by the states and territories. OCSE assumes no responsibility or legal liability concerning the data’s accuracy, reliability, completeness, timeliness, or usefulness. This data was originally compiled and reported by the states and territories. OCSE assumes no responsibility or legal liability concerning the data’s accuracy, reliability, completeness, timeliness, or usefulness.
Table 25 Medicaid Never Assistance Collections Sent To Other States for Five Consecutive Fiscal Years
STATES 2015 2016 2017 2018 2019ALABAMA $7,715 $9,277 $10,973 $11,263 $9,932
ALASKA 513,348 598,757 522,938 514,409 457,469
ARIZONA 5,795,140 5,761,447 5,687,987 6,132,551 5,952,942
ARKANSAS 4,692,532 4,723,671 4,738,437 4,920,772 4,665,707
CALIFORNIA 13,251,357 12,947,213 13,373,590 12,856,675 12,560,839
COLORADO 5,477 9,520 10,341 7,863 3,072
CONNECTICUT 1,185,483 1,168,316 1,178,402 1,173,834 1,267,715
DELAWARE 81,476 124,959 139,830 181,630 241,567
DIST. OF COL. 0 0 0 0 0
FLORIDA 16,528,093 18,399,413 19,278,419 20,732,291 21,804,997
GEORGIA 11,807,792 12,685,097 13,458,895 13,727,566 14,199,452
GUAM 0 0 0 0 0
HAWAII 689,983 657,661 695,359 669,197 659,145
IDAHO 291,565 239,629 254,879 252,554 336,041
ILLINOIS 7,924,409 8,310,277 8,553,844 8,437,349 8,699,541
INDIANA 2,969,168 3,375,318 3,813,802 4,281,542 4,379,392
IOWA 4,326,751 4,386,967 4,503,598 4,492,269 4,683,419
KANSAS 6,278,184 7,750,526 8,809,543 9,506,570 10,239,185
KENTUCKY 4,451,717 4,420,562 4,494,791 4,512,323 4,352,748
LOUISIANA 6,543,268 6,268,371 6,679,852 6,834,462 7,021,803
MAINE 736,734 866,055 976,364 1,046,321 975,438
MARYLAND 0 2,507,114 10,280,760 10,389,791 10,343,860
MASSACHUSETTS 658,320 670,696 667,846 148,642 0
MICHIGAN 3,640,577 3,693,211 3,748,337 3,737,720 3,798,809
MINNESOTA 5,662,286 5,847,106 5,874,450 6,147,068 6,080,066
MISSISSIPPI 99,865 92,232 101,946 131,331 104,275
MISSOURI 2,664,525 2,911,957 2,978,318 2,962,316 2,945,905
MONTANA 162,975 199,198 185,361 141,168 101,664
NEBRASKA 1,785,455 1,813,473 1,917,293 1,987,690 2,153,993
NEVADA 0 0 0 0 0
NEW HAMPSHIRE 935,567 989,928 948,043 584,466 582,775
NEW JERSEY 82,930 148,891 159,376 197,208 194,033
NEW MEXICO 441,243 617,621 645,127 631,368 781,779
NEW YORK 13,012 777 9,042 0 3,237
NORTH CAROLINA 7,976,923 7,839,267 7,712,992 7,521,021 7,473,407
NORTH DAKOTA 1,116,996 1,126,615 1,086,881 1,112,821 1,120,188
OHIO 1,560,119 3,661,144 9,642,724 10,236,497 10,298,128
OKLAHOMA 934,172 1,080,429 1,119,944 1,330,764 1,668,052
OREGON 3,741,251 3,659,108 3,607,421 3,421,954 2,386,002
PENNSYLVANIA 1,590,073 2,023,739 2,308,304 2,722,309 3,145,075
PUERTO RICO 0 0 0 0 0
RHODE ISLAND 617,919 682,980 785,789 751,727 769,543
SOUTH CAROLINA 54,289 56,585 66,037 55,498 4,015,106
SOUTH DAKOTA 102,776 85,703 82,748 99,932 73,139
TENNESSEE 1,246,992 1,431,964 1,146,951 1,549,134 1,494,268
TEXAS 21,057,748 20,603,836 21,427,820 21,839,755 21,993,668
UTAH 1,770,084 1,675,089 1,577,767 1,402,456 1,405,298
VERMONT 0 0 0 0 0
VIRGIN ISLANDS 311,309 312,936 229,636 242,006 211,322
VIRGINIA 0 0 0 8,428,417 8,238,497
WASHINGTON 3,791,312 3,917,970 3,793,171 3,637,529 3,358,814
WEST VIRGINIA 1,861,327 1,755,918 1,782,154 1,740,441 1,720,381
WISCONSIN 5,487,911 5,717,314 5,952,177 6,035,103 6,281,916
WYOMING 1,536,106 1,335,009 1,289,870 1,322,284 1,283,177
TOTALS $158,984,254 $169,160,846 $188,310,129 $200,799,857 $206,536,781
Source: Form OCSE-34 - Part 1, line 4b, column E.
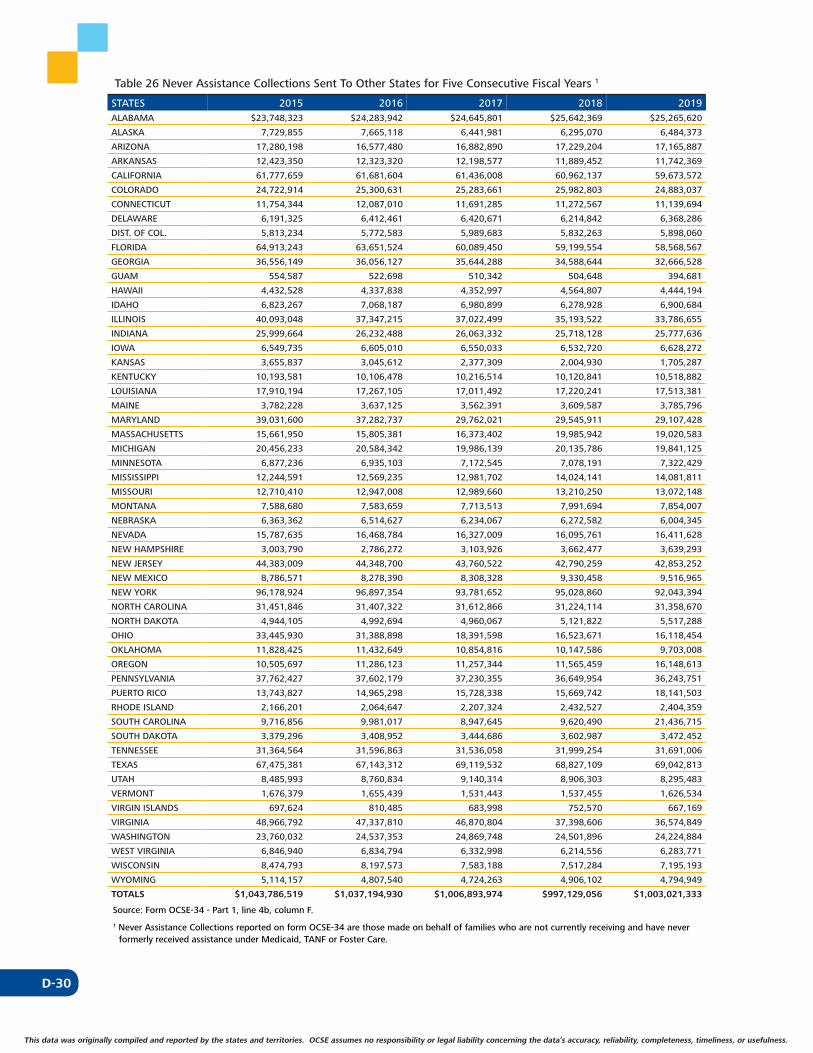
D-30
This data was originally compiled and reported by the states and territories. OCSE assumes no responsibility or legal liability concerning the data’s accuracy, reliability, completeness, timeliness, or usefulness.
Table 26 Never Assistance Collections Sent To Other States for Five Consecutive Fiscal Years 1
STATES 2015 2016 2017 2018 2019ALABAMA $23,748,323 $24,283,942 $24,645,801 $25,642,369 $25,265,620
ALASKA 7,729,855 7,665,118 6,441,981 6,295,070 6,484,373
ARIZONA 17,280,198 16,577,480 16,882,890 17,229,204 17,165,887
ARKANSAS 12,423,350 12,323,320 12,198,577 11,889,452 11,742,369
CALIFORNIA 61,777,659 61,681,604 61,436,008 60,962,137 59,673,572
COLORADO 24,722,914 25,300,631 25,283,661 25,982,803 24,883,037
CONNECTICUT 11,754,344 12,087,010 11,691,285 11,272,567 11,139,694
DELAWARE 6,191,325 6,412,461 6,420,671 6,214,842 6,368,286
DIST. OF COL. 5,813,234 5,772,583 5,989,683 5,832,263 5,898,060
FLORIDA 64,913,243 63,651,524 60,089,450 59,199,554 58,568,567
GEORGIA 36,556,149 36,056,127 35,644,288 34,588,644 32,666,528
GUAM 554,587 522,698 510,342 504,648 394,681
HAWAII 4,432,528 4,337,838 4,352,997 4,564,807 4,444,194
IDAHO 6,823,267 7,068,187 6,980,899 6,278,928 6,900,684
ILLINOIS 40,093,048 37,347,215 37,022,499 35,193,522 33,786,655
INDIANA 25,999,664 26,232,488 26,063,332 25,718,128 25,777,636
IOWA 6,549,735 6,605,010 6,550,033 6,532,720 6,628,272
KANSAS 3,655,837 3,045,612 2,377,309 2,004,930 1,705,287
KENTUCKY 10,193,581 10,106,478 10,216,514 10,120,841 10,518,882
LOUISIANA 17,910,194 17,267,105 17,011,492 17,220,241 17,513,381
MAINE 3,782,228 3,637,125 3,562,391 3,609,587 3,785,796
MARYLAND 39,031,600 37,282,737 29,762,021 29,545,911 29,107,428
MASSACHUSETTS 15,661,950 15,805,381 16,373,402 19,985,942 19,020,583
MICHIGAN 20,456,233 20,584,342 19,986,139 20,135,786 19,841,125
MINNESOTA 6,877,236 6,935,103 7,172,545 7,078,191 7,322,429
MISSISSIPPI 12,244,591 12,569,235 12,981,702 14,024,141 14,081,811
MISSOURI 12,710,410 12,947,008 12,989,660 13,210,250 13,072,148
MONTANA 7,588,680 7,583,659 7,713,513 7,991,694 7,854,007
NEBRASKA 6,363,362 6,514,627 6,234,067 6,272,582 6,004,345
NEVADA 15,787,635 16,468,784 16,327,009 16,095,761 16,411,628
NEW HAMPSHIRE 3,003,790 2,786,272 3,103,926 3,662,477 3,639,293
NEW JERSEY 44,383,009 44,348,700 43,760,522 42,790,259 42,853,252
NEW MEXICO 8,786,571 8,278,390 8,308,328 9,330,458 9,516,965
NEW YORK 96,178,924 96,897,354 93,781,652 95,028,860 92,043,394
NORTH CAROLINA 31,451,846 31,407,322 31,612,866 31,224,114 31,358,670
NORTH DAKOTA 4,944,105 4,992,694 4,960,067 5,121,822 5,517,288
OHIO 33,445,930 31,388,898 18,391,598 16,523,671 16,118,454
OKLAHOMA 11,828,425 11,432,649 10,854,816 10,147,586 9,703,008
OREGON 10,505,697 11,286,123 11,257,344 11,565,459 16,148,613
PENNSYLVANIA 37,762,427 37,602,179 37,230,355 36,649,954 36,243,751
PUERTO RICO 13,743,827 14,965,298 15,728,338 15,669,742 18,141,503
RHODE ISLAND 2,166,201 2,064,647 2,207,324 2,432,527 2,404,359
SOUTH CAROLINA 9,716,856 9,981,017 8,947,645 9,620,490 21,436,715
SOUTH DAKOTA 3,379,296 3,408,952 3,444,686 3,602,987 3,472,452
TENNESSEE 31,364,564 31,596,863 31,536,058 31,999,254 31,691,006
TEXAS 67,475,381 67,143,312 69,119,532 68,827,109 69,042,813
UTAH 8,485,993 8,760,834 9,140,314 8,906,303 8,295,483
VERMONT 1,676,379 1,655,439 1,531,443 1,537,455 1,626,534
VIRGIN ISLANDS 697,624 810,485 683,998 752,570 667,169
VIRGINIA 48,966,792 47,337,810 46,870,804 37,398,606 36,574,849
WASHINGTON 23,760,032 24,537,353 24,869,748 24,501,896 24,224,884
WEST VIRGINIA 6,846,940 6,834,794 6,332,998 6,214,556 6,283,771
WISCONSIN 8,474,793 8,197,573 7,583,188 7,517,284 7,195,193
WYOMING 5,114,157 4,807,540 4,724,263 4,906,102 4,794,949
TOTALS $1,043,786,519 $1,037,194,930 $1,006,893,974 $997,129,056 $1,003,021,333
Source: Form OCSE-34 - Part 1, line 4b, column F.
1 Never Assistance Collections reported on form OCSE-34 are those made on behalf of families who are not currently receiving and have never formerly received assistance under Medicaid, TANF or Foster Care.

D-31
This data was originally compiled and reported by the states and territories. OCSE assumes no responsibility or legal liability concerning the data’s accuracy, reliability, completeness, timeliness, or usefulness. This data was originally compiled and reported by the states and territories. OCSE assumes no responsibility or legal liability concerning the data’s accuracy, reliability, completeness, timeliness, or usefulness.
Table 27 Collections Sent to Other Countries for Five Consecutive Fiscal Years
STATES 2015 2016 2017 2018 2019ALABAMA $239,206 $208,013 $206,259 $227,070 $249,084
ALASKA 182,384 160,715 124,444 115,586 118,058
ARIZONA 322,915 305,399 261,960 230,034 248,299
ARKANSAS 111,191 137,600 127,211 133,345 137,842
CALIFORNIA 2,828,457 2,941,894 2,896,097 2,390,712 2,726,943
COLORADO 620,735 557,033 506,111 509,111 561,912
CONNECTICUT 429,444 315,652 315,272 325,033 271,286
DELAWARE 0 0 0 0 0
DIST. OF COL. 14,870 28,039 23,510 19,799 20,697
FLORIDA 2,443,658 2,225,761 2,401,643 2,307,644 2,461,454
GEORGIA 1,036,782 1,023,203 900,297 946,737 885,727
GUAM 0 0 0 0 0
HAWAII 55,321 50,817 68,776 62,440 61,955
IDAHO 141,533 135,102 111,956 114,814 140,927
ILLINOIS 1,253,918 1,523,086 1,256,781 926,828 869,642
INDIANA 0 0 0 0 0
IOWA 140,423 140,970 97,167 95,122 89,881
KANSAS 179,732 167,451 144,873 143,839 146,708
KENTUCKY 322,956 322,232 277,885 251,602 251,272
LOUISIANA 263,211 253,910 270,096 228,657 169,067
MAINE 138,108 131,538 137,058 139,052 136,187
MARYLAND 0 0 0 0 0
MASSACHUSETTS 581,792 453,002 393,091 389,669 419,715
MICHIGAN 1,007,743 1,066,002 1,004,307 1,102,435 1,004,888
MINNESOTA 299,656 316,975 259,669 256,897 283,139
MISSISSIPPI 56,031 68,446 63,732 69,981 104,621
MISSOURI 240,283 241,949 245,423 275,405 297,991
MONTANA 122,031 108,011 90,698 135,864 154,097
NEBRASKA 86,829 68,548 69,884 73,166 57,860
NEVADA 409,287 478,298 423,125 403,929 367,409
NEW HAMPSHIRE 0 0 0 0 0
NEW JERSEY 0 0 0 0 0
NEW MEXICO 0 0 0 0 0
NEW YORK 2,871,757 2,744,711 2,641,883 2,679,943 2,593,926
NORTH CAROLINA 597,579 572,229 604,965 632,776 566,363
NORTH DAKOTA 52,838 63,111 65,687 69,695 83,815
OHIO 0 0 0 0 0
OKLAHOMA 373,132 336,175 270,191 238,004 188,972
OREGON 0 0 0 0 249,519
PENNSYLVANIA 663,434 637,600 664,673 622,765 678,370
PUERTO RICO 0 0 0 2,550 4,690
RHODE ISLAND 80,662 75,505 78,387 55,892 84,280
SOUTH CAROLINA 0 0 0 0 77,419
SOUTH DAKOTA 0 8,572 43,284 80,418 76,875
TENNESSEE 315,491 266,765 338,396 330,996 290,501
TEXAS 3,362,864 3,327,241 3,479,695 3,560,042 3,369,914
UTAH 139,630 126,813 141,431 101,677 109,668
VERMONT 0 0 0 0 0
VIRGIN ISLANDS 0 0 0 0 0
VIRGINIA 0 0 0 0 0
WASHINGTON 1,264,974 1,154,486 1,093,735 1,273,429 1,207,249
WEST VIRGINIA 93,171 75,490 64,368 76,762 59,130
WISCONSIN 0 0 0 0 0
WYOMING 71,880 51,303 73,775 93,791 85,973
TOTALS $23,415,908 $22,869,647 $22,237,795 $21,693,511 $21,963,325
Source: Form OCSE-34 - Part 1, line 4c, column G.
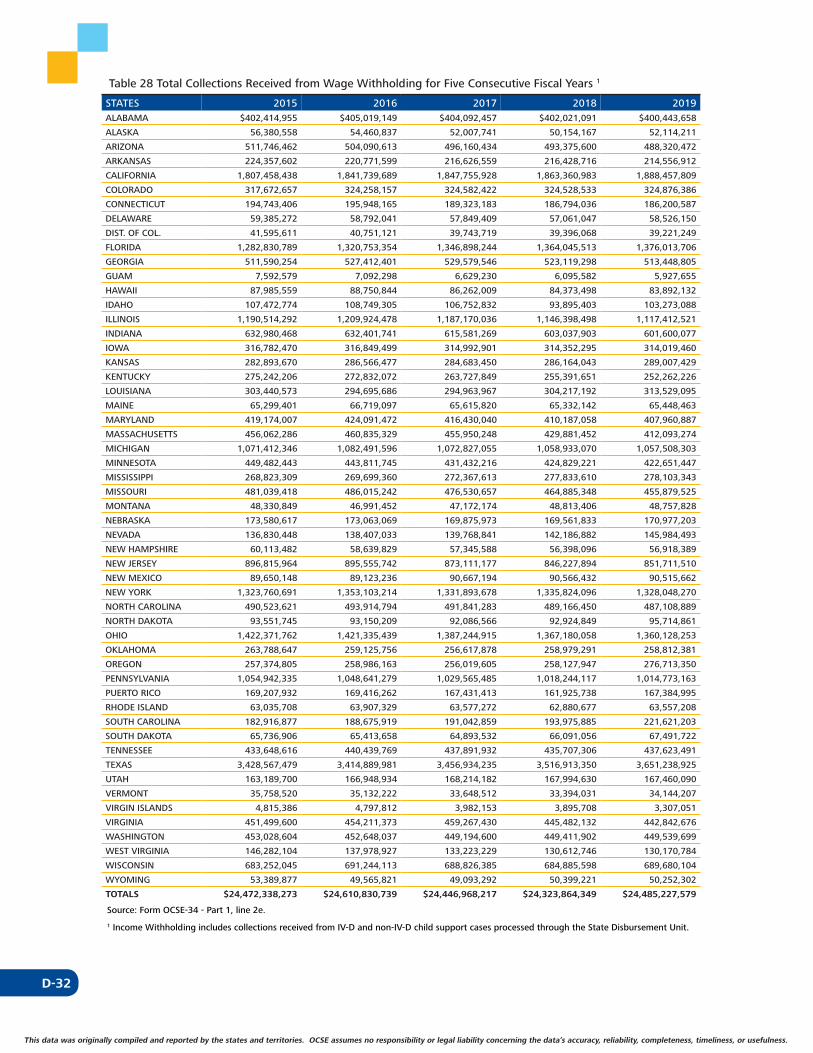
D-32
This data was originally compiled and reported by the states and territories. OCSE assumes no responsibility or legal liability concerning the data’s accuracy, reliability, completeness, timeliness, or usefulness.
Table 28 Total Collections Received from Wage Withholding for Five Consecutive Fiscal Years 1
STATES 2015 2016 2017 2018 2019ALABAMA $402,414,955 $405,019,149 $404,092,457 $402,021,091 $400,443,658
ALASKA 56,380,558 54,460,837 52,007,741 50,154,167 52,114,211
ARIZONA 511,746,462 504,090,613 496,160,434 493,375,600 488,320,472
ARKANSAS 224,357,602 220,771,599 216,626,559 216,428,716 214,556,912
CALIFORNIA 1,807,458,438 1,841,739,689 1,847,755,928 1,863,360,983 1,888,457,809
COLORADO 317,672,657 324,258,157 324,582,422 324,528,533 324,876,386
CONNECTICUT 194,743,406 195,948,165 189,323,183 186,794,036 186,200,587
DELAWARE 59,385,272 58,792,041 57,849,409 57,061,047 58,526,150
DIST. OF COL. 41,595,611 40,751,121 39,743,719 39,396,068 39,221,249
FLORIDA 1,282,830,789 1,320,753,354 1,346,898,244 1,364,045,513 1,376,013,706
GEORGIA 511,590,254 527,412,401 529,579,546 523,119,298 513,448,805
GUAM 7,592,579 7,092,298 6,629,230 6,095,582 5,927,655
HAWAII 87,985,559 88,750,844 86,262,009 84,373,498 83,892,132
IDAHO 107,472,774 108,749,305 106,752,832 93,895,403 103,273,088
ILLINOIS 1,190,514,292 1,209,924,478 1,187,170,036 1,146,398,498 1,117,412,521
INDIANA 632,980,468 632,401,741 615,581,269 603,037,903 601,600,077
IOWA 316,782,470 316,849,499 314,992,901 314,352,295 314,019,460
KANSAS 282,893,670 286,566,477 284,683,450 286,164,043 289,007,429
KENTUCKY 275,242,206 272,832,072 263,727,849 255,391,651 252,262,226
LOUISIANA 303,440,573 294,695,686 294,963,967 304,217,192 313,529,095
MAINE 65,299,401 66,719,097 65,615,820 65,332,142 65,448,463
MARYLAND 419,174,007 424,091,472 416,430,040 410,187,058 407,960,887
MASSACHUSETTS 456,062,286 460,835,329 455,950,248 429,881,452 412,093,274
MICHIGAN 1,071,412,346 1,082,491,596 1,072,827,055 1,058,933,070 1,057,508,303
MINNESOTA 449,482,443 443,811,745 431,432,216 424,829,221 422,651,447
MISSISSIPPI 268,823,309 269,699,360 272,367,613 277,833,610 278,103,343
MISSOURI 481,039,418 486,015,242 476,530,657 464,885,348 455,879,525
MONTANA 48,330,849 46,991,452 47,172,174 48,813,406 48,757,828
NEBRASKA 173,580,617 173,063,069 169,875,973 169,561,833 170,977,203
NEVADA 136,830,448 138,407,033 139,768,841 142,186,882 145,984,493
NEW HAMPSHIRE 60,113,482 58,639,829 57,345,588 56,398,096 56,918,389
NEW JERSEY 896,815,964 895,555,742 873,111,177 846,227,894 851,711,510
NEW MEXICO 89,650,148 89,123,236 90,667,194 90,566,432 90,515,662
NEW YORK 1,323,760,691 1,353,103,214 1,331,893,678 1,335,824,096 1,328,048,270
NORTH CAROLINA 490,523,621 493,914,794 491,841,283 489,166,450 487,108,889
NORTH DAKOTA 93,551,745 93,150,209 92,086,566 92,924,849 95,714,861
OHIO 1,422,371,762 1,421,335,439 1,387,244,915 1,367,180,058 1,360,128,253
OKLAHOMA 263,788,647 259,125,756 256,617,878 258,979,291 258,812,381
OREGON 257,374,805 258,986,163 256,019,605 258,127,947 276,713,350
PENNSYLVANIA 1,054,942,335 1,048,641,279 1,029,565,485 1,018,244,117 1,014,773,163
PUERTO RICO 169,207,932 169,416,262 167,431,413 161,925,738 167,384,995
RHODE ISLAND 63,035,708 63,907,329 63,577,272 62,880,677 63,557,208
SOUTH CAROLINA 182,916,877 188,675,919 191,042,859 193,975,885 221,621,203
SOUTH DAKOTA 65,736,906 65,413,658 64,893,532 66,091,056 67,491,722
TENNESSEE 433,648,616 440,439,769 437,891,932 435,707,306 437,623,491
TEXAS 3,428,567,479 3,414,889,981 3,456,934,235 3,516,913,350 3,651,238,925
UTAH 163,189,700 166,948,934 168,214,182 167,994,630 167,460,090
VERMONT 35,758,520 35,132,222 33,648,512 33,394,031 34,144,207
VIRGIN ISLANDS 4,815,386 4,797,812 3,982,153 3,895,708 3,307,051
VIRGINIA 451,499,600 454,211,373 459,267,430 445,482,132 442,842,676
WASHINGTON 453,028,604 452,648,037 449,194,600 449,411,902 449,539,699
WEST VIRGINIA 146,282,104 137,978,927 133,223,229 130,612,746 130,170,784
WISCONSIN 683,252,045 691,244,113 688,826,385 684,885,598 689,680,104
WYOMING 53,389,877 49,565,821 49,093,292 50,399,221 50,252,302
TOTALS $24,472,338,273 $24,610,830,739 $24,446,968,217 $24,323,864,349 $24,485,227,579
Source: Form OCSE-34 - Part 1, line 2e.
1 Income Withholding includes collections received from IV-D and non-IV-D child support cases processed through the State Disbursement Unit.
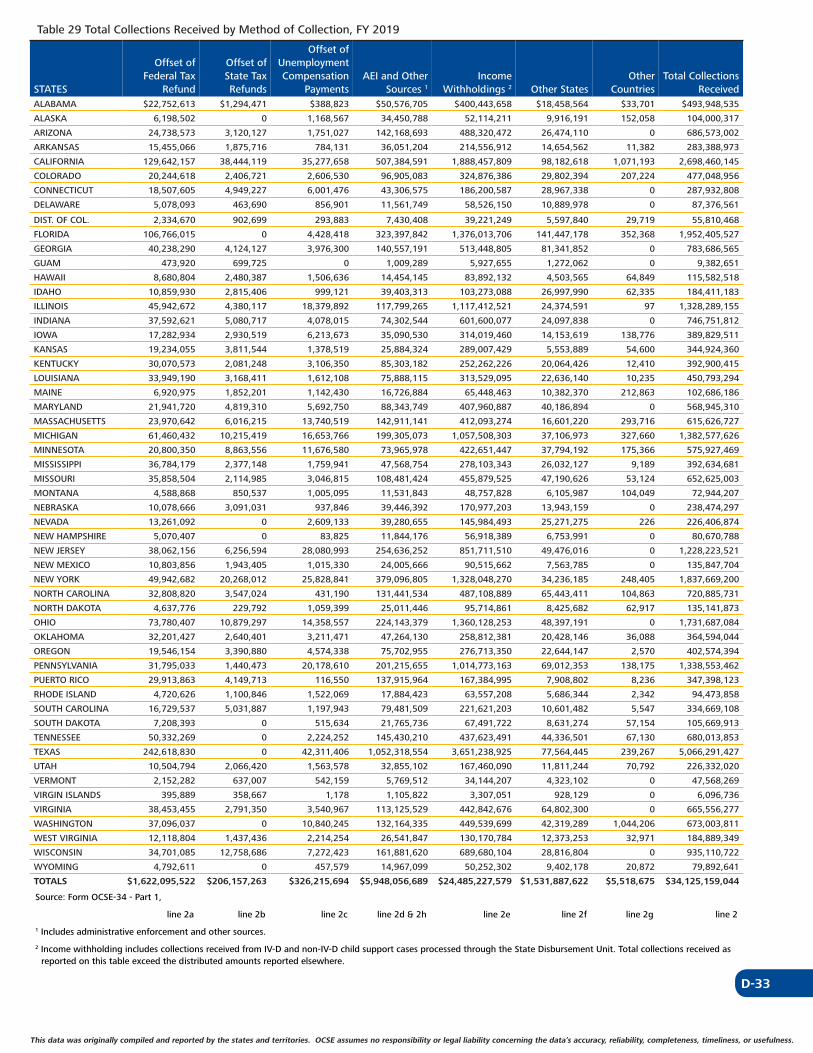
D-33
This data was originally compiled and reported by the states and territories. OCSE assumes no responsibility or legal liability concerning the data’s accuracy, reliability, completeness, timeliness, or usefulness. This data was originally compiled and reported by the states and territories. OCSE assumes no responsibility or legal liability concerning the data’s accuracy, reliability, completeness, timeliness, or usefulness.
Table 29 Total Collections Received by Method of Collection, FY 2019
STATES
Offset of Federal Tax
Refund
Offset of State Tax Refunds
Offset of Unemployment Compensation
PaymentsAEI and Other
Sources 1
Income Withholdings 2 Other States
Other Countries
Total Collections Received
ALABAMA $22,752,613 $1,294,471 $388,823 $50,576,705 $400,443,658 $18,458,564 $33,701 $493,948,535
ALASKA 6,198,502 0 1,168,567 34,450,788 52,114,211 9,916,191 152,058 104,000,317
ARIZONA 24,738,573 3,120,127 1,751,027 142,168,693 488,320,472 26,474,110 0 686,573,002
ARKANSAS 15,455,066 1,875,716 784,131 36,051,204 214,556,912 14,654,562 11,382 283,388,973
CALIFORNIA 129,642,157 38,444,119 35,277,658 507,384,591 1,888,457,809 98,182,618 1,071,193 2,698,460,145
COLORADO 20,244,618 2,406,721 2,606,530 96,905,083 324,876,386 29,802,394 207,224 477,048,956
CONNECTICUT 18,507,605 4,949,227 6,001,476 43,306,575 186,200,587 28,967,338 0 287,932,808
DELAWARE 5,078,093 463,690 856,901 11,561,749 58,526,150 10,889,978 0 87,376,561
DIST. OF COL. 2,334,670 902,699 293,883 7,430,408 39,221,249 5,597,840 29,719 55,810,468
FLORIDA 106,766,015 0 4,428,418 323,397,842 1,376,013,706 141,447,178 352,368 1,952,405,527
GEORGIA 40,238,290 4,124,127 3,976,300 140,557,191 513,448,805 81,341,852 0 783,686,565
GUAM 473,920 699,725 0 1,009,289 5,927,655 1,272,062 0 9,382,651
HAWAII 8,680,804 2,480,387 1,506,636 14,454,145 83,892,132 4,503,565 64,849 115,582,518
IDAHO 10,859,930 2,815,406 999,121 39,403,313 103,273,088 26,997,990 62,335 184,411,183
ILLINOIS 45,942,672 4,380,117 18,379,892 117,799,265 1,117,412,521 24,374,591 97 1,328,289,155
INDIANA 37,592,621 5,080,717 4,078,015 74,302,544 601,600,077 24,097,838 0 746,751,812
IOWA 17,282,934 2,930,519 6,213,673 35,090,530 314,019,460 14,153,619 138,776 389,829,511
KANSAS 19,234,055 3,811,544 1,378,519 25,884,324 289,007,429 5,553,889 54,600 344,924,360
KENTUCKY 30,070,573 2,081,248 3,106,350 85,303,182 252,262,226 20,064,426 12,410 392,900,415
LOUISIANA 33,949,190 3,168,411 1,612,108 75,888,115 313,529,095 22,636,140 10,235 450,793,294
MAINE 6,920,975 1,852,201 1,142,430 16,726,884 65,448,463 10,382,370 212,863 102,686,186
MARYLAND 21,941,720 4,819,310 5,692,750 88,343,749 407,960,887 40,186,894 0 568,945,310
MASSACHUSETTS 23,970,642 6,016,215 13,740,519 142,911,141 412,093,274 16,601,220 293,716 615,626,727
MICHIGAN 61,460,432 10,215,419 16,653,766 199,305,073 1,057,508,303 37,106,973 327,660 1,382,577,626
MINNESOTA 20,800,350 8,863,556 11,676,580 73,965,978 422,651,447 37,794,192 175,366 575,927,469
MISSISSIPPI 36,784,179 2,377,148 1,759,941 47,568,754 278,103,343 26,032,127 9,189 392,634,681
MISSOURI 35,858,504 2,114,985 3,046,815 108,481,424 455,879,525 47,190,626 53,124 652,625,003
MONTANA 4,588,868 850,537 1,005,095 11,531,843 48,757,828 6,105,987 104,049 72,944,207
NEBRASKA 10,078,666 3,091,031 937,846 39,446,392 170,977,203 13,943,159 0 238,474,297
NEVADA 13,261,092 0 2,609,133 39,280,655 145,984,493 25,271,275 226 226,406,874
NEW HAMPSHIRE 5,070,407 0 83,825 11,844,176 56,918,389 6,753,991 0 80,670,788
NEW JERSEY 38,062,156 6,256,594 28,080,993 254,636,252 851,711,510 49,476,016 0 1,228,223,521
NEW MEXICO 10,803,856 1,943,405 1,015,330 24,005,666 90,515,662 7,563,785 0 135,847,704
NEW YORK 49,942,682 20,268,012 25,828,841 379,096,805 1,328,048,270 34,236,185 248,405 1,837,669,200
NORTH CAROLINA 32,808,820 3,547,024 431,190 131,441,534 487,108,889 65,443,411 104,863 720,885,731
NORTH DAKOTA 4,637,776 229,792 1,059,399 25,011,446 95,714,861 8,425,682 62,917 135,141,873
OHIO 73,780,407 10,879,297 14,358,557 224,143,379 1,360,128,253 48,397,191 0 1,731,687,084
OKLAHOMA 32,201,427 2,640,401 3,211,471 47,264,130 258,812,381 20,428,146 36,088 364,594,044
OREGON 19,546,154 3,390,880 4,574,338 75,702,955 276,713,350 22,644,147 2,570 402,574,394
PENNSYLVANIA 31,795,033 1,440,473 20,178,610 201,215,655 1,014,773,163 69,012,353 138,175 1,338,553,462
PUERTO RICO 29,913,863 4,149,713 116,550 137,915,964 167,384,995 7,908,802 8,236 347,398,123
RHODE ISLAND 4,720,626 1,100,846 1,522,069 17,884,423 63,557,208 5,686,344 2,342 94,473,858
SOUTH CAROLINA 16,729,537 5,031,887 1,197,943 79,481,509 221,621,203 10,601,482 5,547 334,669,108
SOUTH DAKOTA 7,208,393 0 515,634 21,765,736 67,491,722 8,631,274 57,154 105,669,913
TENNESSEE 50,332,269 0 2,224,252 145,430,210 437,623,491 44,336,501 67,130 680,013,853
TEXAS 242,618,830 0 42,311,406 1,052,318,554 3,651,238,925 77,564,445 239,267 5,066,291,427
UTAH 10,504,794 2,066,420 1,563,578 32,855,102 167,460,090 11,811,244 70,792 226,332,020
VERMONT 2,152,282 637,007 542,159 5,769,512 34,144,207 4,323,102 0 47,568,269
VIRGIN ISLANDS 395,889 358,667 1,178 1,105,822 3,307,051 928,129 0 6,096,736
VIRGINIA 38,453,455 2,791,350 3,540,967 113,125,529 442,842,676 64,802,300 0 665,556,277
WASHINGTON 37,096,037 0 10,840,245 132,164,335 449,539,699 42,319,289 1,044,206 673,003,811
WEST VIRGINIA 12,118,804 1,437,436 2,214,254 26,541,847 130,170,784 12,373,253 32,971 184,889,349
WISCONSIN 34,701,085 12,758,686 7,272,423 161,881,620 689,680,104 28,816,804 0 935,110,722
WYOMING 4,792,611 0 457,579 14,967,099 50,252,302 9,402,178 20,872 79,892,641
TOTALS $1,622,095,522 $206,157,263 $326,215,694 $5,948,056,689 $24,485,227,579 $1,531,887,622 $5,518,675 $34,125,159,044
Source: Form OCSE-34 - Part 1,
line 2a line 2b line 2c line 2d & 2h line 2e line 2f line 2g line 2
1 Includes administrative enforcement and other sources.
2 Income withholding includes collections received from IV-D and non-IV-D child support cases processed through the State Disbursement Unit. Total collections received as reported on this table exceed the distributed amounts reported elsewhere.
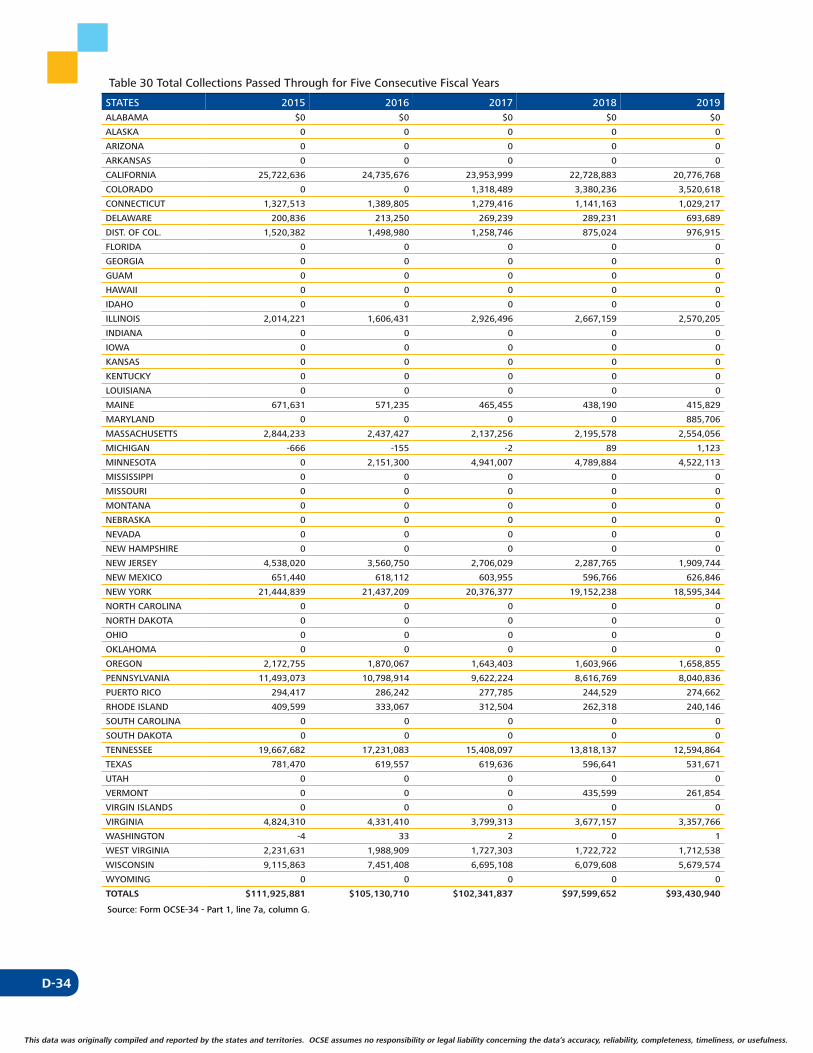
D-34
This data was originally compiled and reported by the states and territories. OCSE assumes no responsibility or legal liability concerning the data’s accuracy, reliability, completeness, timeliness, or usefulness.
Table 30 Total Collections Passed Through for Five Consecutive Fiscal Years
STATES 2015 2016 2017 2018 2019ALABAMA $0 $0 $0 $0 $0
ALASKA 0 0 0 0 0
ARIZONA 0 0 0 0 0
ARKANSAS 0 0 0 0 0
CALIFORNIA 25,722,636 24,735,676 23,953,999 22,728,883 20,776,768
COLORADO 0 0 1,318,489 3,380,236 3,520,618
CONNECTICUT 1,327,513 1,389,805 1,279,416 1,141,163 1,029,217
DELAWARE 200,836 213,250 269,239 289,231 693,689
DIST. OF COL. 1,520,382 1,498,980 1,258,746 875,024 976,915
FLORIDA 0 0 0 0 0
GEORGIA 0 0 0 0 0
GUAM 0 0 0 0 0
HAWAII 0 0 0 0 0
IDAHO 0 0 0 0 0
ILLINOIS 2,014,221 1,606,431 2,926,496 2,667,159 2,570,205
INDIANA 0 0 0 0 0
IOWA 0 0 0 0 0
KANSAS 0 0 0 0 0
KENTUCKY 0 0 0 0 0
LOUISIANA 0 0 0 0 0
MAINE 671,631 571,235 465,455 438,190 415,829
MARYLAND 0 0 0 0 885,706
MASSACHUSETTS 2,844,233 2,437,427 2,137,256 2,195,578 2,554,056
MICHIGAN -666 -155 -2 89 1,123
MINNESOTA 0 2,151,300 4,941,007 4,789,884 4,522,113
MISSISSIPPI 0 0 0 0 0
MISSOURI 0 0 0 0 0
MONTANA 0 0 0 0 0
NEBRASKA 0 0 0 0 0
NEVADA 0 0 0 0 0
NEW HAMPSHIRE 0 0 0 0 0
NEW JERSEY 4,538,020 3,560,750 2,706,029 2,287,765 1,909,744
NEW MEXICO 651,440 618,112 603,955 596,766 626,846
NEW YORK 21,444,839 21,437,209 20,376,377 19,152,238 18,595,344
NORTH CAROLINA 0 0 0 0 0
NORTH DAKOTA 0 0 0 0 0
OHIO 0 0 0 0 0
OKLAHOMA 0 0 0 0 0
OREGON 2,172,755 1,870,067 1,643,403 1,603,966 1,658,855
PENNSYLVANIA 11,493,073 10,798,914 9,622,224 8,616,769 8,040,836
PUERTO RICO 294,417 286,242 277,785 244,529 274,662
RHODE ISLAND 409,599 333,067 312,504 262,318 240,146
SOUTH CAROLINA 0 0 0 0 0
SOUTH DAKOTA 0 0 0 0 0
TENNESSEE 19,667,682 17,231,083 15,408,097 13,818,137 12,594,864
TEXAS 781,470 619,557 619,636 596,641 531,671
UTAH 0 0 0 0 0
VERMONT 0 0 0 435,599 261,854
VIRGIN ISLANDS 0 0 0 0 0
VIRGINIA 4,824,310 4,331,410 3,799,313 3,677,157 3,357,766
WASHINGTON -4 33 2 0 1
WEST VIRGINIA 2,231,631 1,988,909 1,727,303 1,722,722 1,712,538
WISCONSIN 9,115,863 7,451,408 6,695,108 6,079,608 5,679,574
WYOMING 0 0 0 0 0
TOTALS $111,925,881 $105,130,710 $102,341,837 $97,599,652 $93,430,940
Source: Form OCSE-34 - Part 1, line 7a, column G.
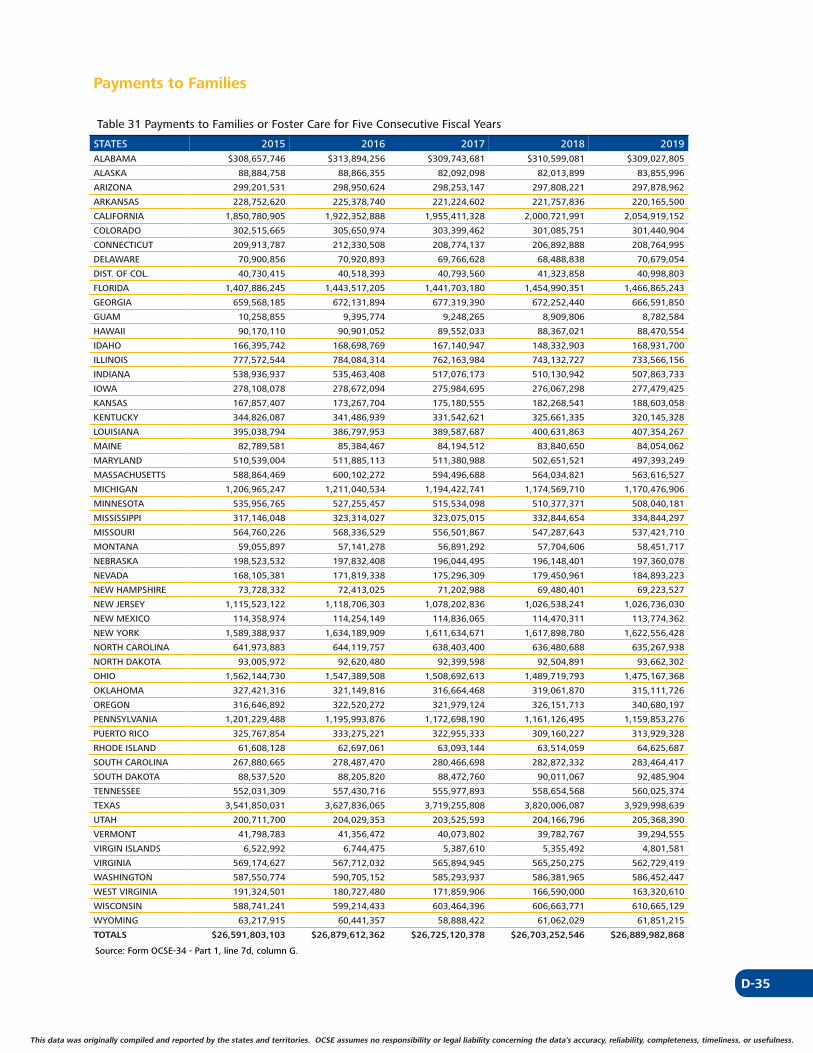
D-35
This data was originally compiled and reported by the states and territories. OCSE assumes no responsibility or legal liability concerning the data’s accuracy, reliability, completeness, timeliness, or usefulness. This data was originally compiled and reported by the states and territories. OCSE assumes no responsibility or legal liability concerning the data’s accuracy, reliability, completeness, timeliness, or usefulness.
Payments to Families
Table 31 Payments to Families or Foster Care for Five Consecutive Fiscal Years
STATES 2015 2016 2017 2018 2019ALABAMA $308,657,746 $313,894,256 $309,743,681 $310,599,081 $309,027,805
ALASKA 88,884,758 88,866,355 82,092,098 82,013,899 83,855,996
ARIZONA 299,201,531 298,950,624 298,253,147 297,808,221 297,878,962
ARKANSAS 228,752,620 225,378,740 221,224,602 221,757,836 220,165,500
CALIFORNIA 1,850,780,905 1,922,352,888 1,955,411,328 2,000,721,991 2,054,919,152
COLORADO 302,515,665 305,650,974 303,399,462 301,085,751 301,440,904
CONNECTICUT 209,913,787 212,330,508 208,774,137 206,892,888 208,764,995
DELAWARE 70,900,856 70,920,893 69,766,628 68,488,838 70,679,054
DIST. OF COL. 40,730,415 40,518,393 40,793,560 41,323,858 40,998,803
FLORIDA 1,407,886,245 1,443,517,205 1,441,703,180 1,454,990,351 1,466,865,243
GEORGIA 659,568,185 672,131,894 677,319,390 672,252,440 666,591,850
GUAM 10,258,855 9,395,774 9,248,265 8,909,806 8,782,584
HAWAII 90,170,110 90,901,052 89,552,033 88,367,021 88,470,554
IDAHO 166,395,742 168,698,769 167,140,947 148,332,903 168,931,700
ILLINOIS 777,572,544 784,084,314 762,163,984 743,132,727 733,566,156
INDIANA 538,936,937 535,463,408 517,076,173 510,130,942 507,863,733
IOWA 278,108,078 278,672,094 275,984,695 276,067,298 277,479,425
KANSAS 167,857,407 173,267,704 175,180,555 182,268,541 188,603,058
KENTUCKY 344,826,087 341,486,939 331,542,621 325,661,335 320,145,328
LOUISIANA 395,038,794 386,797,953 389,587,687 400,631,863 407,354,267
MAINE 82,789,581 85,384,467 84,194,512 83,840,650 84,054,062
MARYLAND 510,539,004 511,885,113 511,380,988 502,651,521 497,393,249
MASSACHUSETTS 588,864,469 600,102,272 594,496,688 564,034,821 563,616,527
MICHIGAN 1,206,965,247 1,211,040,534 1,194,422,741 1,174,569,710 1,170,476,906
MINNESOTA 535,956,765 527,255,457 515,534,098 510,377,371 508,040,181
MISSISSIPPI 317,146,048 323,314,027 323,075,015 332,844,654 334,844,297
MISSOURI 564,760,226 568,336,529 556,501,867 547,287,643 537,421,710
MONTANA 59,055,897 57,141,278 56,891,292 57,704,606 58,451,717
NEBRASKA 198,523,532 197,832,408 196,044,495 196,148,401 197,360,078
NEVADA 168,105,381 171,819,338 175,296,309 179,450,961 184,893,223
NEW HAMPSHIRE 73,728,332 72,413,025 71,202,988 69,480,401 69,223,527
NEW JERSEY 1,115,523,122 1,118,706,303 1,078,202,836 1,026,538,241 1,026,736,030
NEW MEXICO 114,358,974 114,254,149 114,836,065 114,470,311 113,774,362
NEW YORK 1,589,388,937 1,634,189,909 1,611,634,671 1,617,898,780 1,622,556,428
NORTH CAROLINA 641,973,883 644,119,757 638,403,400 636,480,688 635,267,938
NORTH DAKOTA 93,005,972 92,620,480 92,399,598 92,504,891 93,662,302
OHIO 1,562,144,730 1,547,389,508 1,508,692,613 1,489,719,793 1,475,167,368
OKLAHOMA 327,421,316 321,149,816 316,664,468 319,061,870 315,111,726
OREGON 316,646,892 322,520,272 321,979,124 326,151,713 340,680,197
PENNSYLVANIA 1,201,229,488 1,195,993,876 1,172,698,190 1,161,126,495 1,159,853,276
PUERTO RICO 325,767,854 333,275,221 322,955,333 309,160,227 313,929,328
RHODE ISLAND 61,608,128 62,697,061 63,093,144 63,514,059 64,625,687
SOUTH CAROLINA 267,880,665 278,487,470 280,466,698 282,872,332 283,464,417
SOUTH DAKOTA 88,537,520 88,205,820 88,472,760 90,011,067 92,485,904
TENNESSEE 552,031,309 557,430,716 555,977,893 558,654,568 560,025,374
TEXAS 3,541,850,031 3,627,836,065 3,719,255,808 3,820,006,087 3,929,998,639
UTAH 200,711,700 204,029,353 203,525,593 204,166,796 205,368,390
VERMONT 41,798,783 41,356,472 40,073,802 39,782,767 39,294,555
VIRGIN ISLANDS 6,522,992 6,744,475 5,387,610 5,355,492 4,801,581
VIRGINIA 569,174,627 567,712,032 565,894,945 565,250,275 562,729,419
WASHINGTON 587,550,774 590,705,152 585,293,937 586,381,965 586,452,447
WEST VIRGINIA 191,324,501 180,727,480 171,859,906 166,590,000 163,320,610
WISCONSIN 588,741,241 599,214,433 603,464,396 606,663,771 610,665,129
WYOMING 63,217,915 60,441,357 58,888,422 61,062,029 61,851,215
TOTALS $26,591,803,103 $26,879,612,362 $26,725,120,378 $26,703,252,546 $26,889,982,868
Source: Form OCSE-34 - Part 1, line 7d, column G.
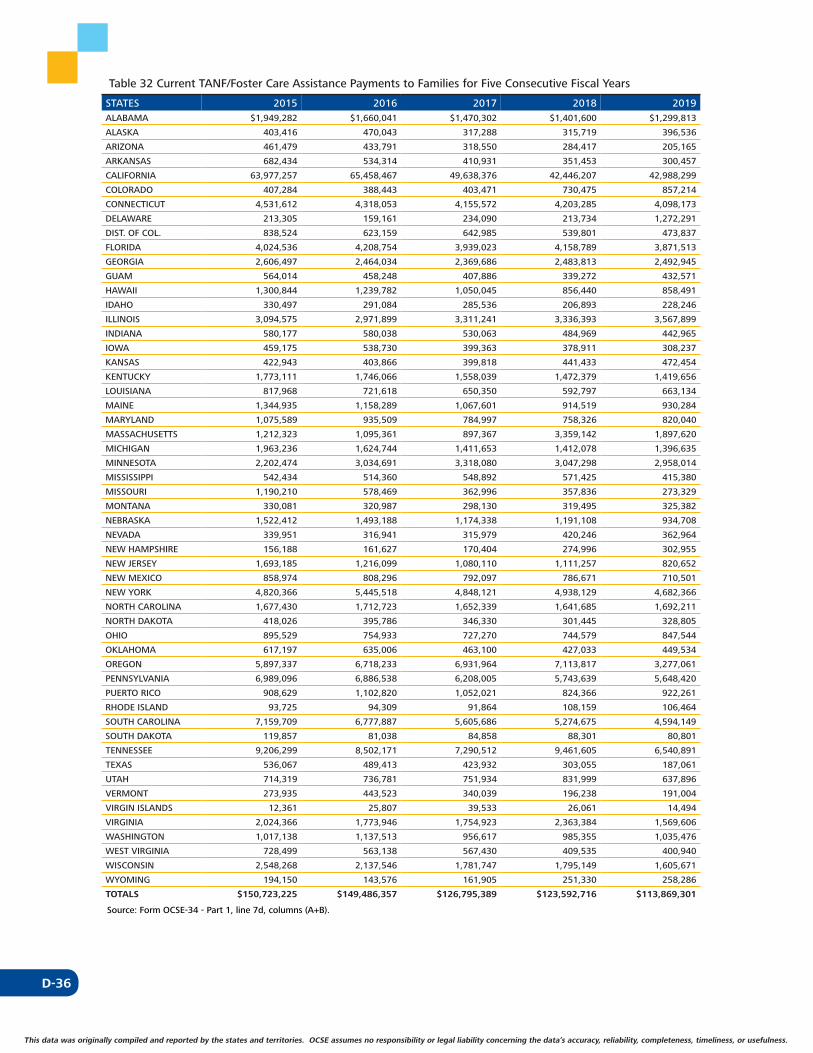
D-36
This data was originally compiled and reported by the states and territories. OCSE assumes no responsibility or legal liability concerning the data’s accuracy, reliability, completeness, timeliness, or usefulness.
Table 32 Current TANF/Foster Care Assistance Payments to Families for Five Consecutive Fiscal Years
STATES 2015 2016 2017 2018 2019ALABAMA $1,949,282 $1,660,041 $1,470,302 $1,401,600 $1,299,813
ALASKA 403,416 470,043 317,288 315,719 396,536
ARIZONA 461,479 433,791 318,550 284,417 205,165
ARKANSAS 682,434 534,314 410,931 351,453 300,457
CALIFORNIA 63,977,257 65,458,467 49,638,376 42,446,207 42,988,299
COLORADO 407,284 388,443 403,471 730,475 857,214
CONNECTICUT 4,531,612 4,318,053 4,155,572 4,203,285 4,098,173
DELAWARE 213,305 159,161 234,090 213,734 1,272,291
DIST. OF COL. 838,524 623,159 642,985 539,801 473,837
FLORIDA 4,024,536 4,208,754 3,939,023 4,158,789 3,871,513
GEORGIA 2,606,497 2,464,034 2,369,686 2,483,813 2,492,945
GUAM 564,014 458,248 407,886 339,272 432,571
HAWAII 1,300,844 1,239,782 1,050,045 856,440 858,491
IDAHO 330,497 291,084 285,536 206,893 228,246
ILLINOIS 3,094,575 2,971,899 3,311,241 3,336,393 3,567,899
INDIANA 580,177 580,038 530,063 484,969 442,965
IOWA 459,175 538,730 399,363 378,911 308,237
KANSAS 422,943 403,866 399,818 441,433 472,454
KENTUCKY 1,773,111 1,746,066 1,558,039 1,472,379 1,419,656
LOUISIANA 817,968 721,618 650,350 592,797 663,134
MAINE 1,344,935 1,158,289 1,067,601 914,519 930,284
MARYLAND 1,075,589 935,509 784,997 758,326 820,040
MASSACHUSETTS 1,212,323 1,095,361 897,367 3,359,142 1,897,620
MICHIGAN 1,963,236 1,624,744 1,411,653 1,412,078 1,396,635
MINNESOTA 2,202,474 3,034,691 3,318,080 3,047,298 2,958,014
MISSISSIPPI 542,434 514,360 548,892 571,425 415,380
MISSOURI 1,190,210 578,469 362,996 357,836 273,329
MONTANA 330,081 320,987 298,130 319,495 325,382
NEBRASKA 1,522,412 1,493,188 1,174,338 1,191,108 934,708
NEVADA 339,951 316,941 315,979 420,246 362,964
NEW HAMPSHIRE 156,188 161,627 170,404 274,996 302,955
NEW JERSEY 1,693,185 1,216,099 1,080,110 1,111,257 820,652
NEW MEXICO 858,974 808,296 792,097 786,671 710,501
NEW YORK 4,820,366 5,445,518 4,848,121 4,938,129 4,682,366
NORTH CAROLINA 1,677,430 1,712,723 1,652,339 1,641,685 1,692,211
NORTH DAKOTA 418,026 395,786 346,330 301,445 328,805
OHIO 895,529 754,933 727,270 744,579 847,544
OKLAHOMA 617,197 635,006 463,100 427,033 449,534
OREGON 5,897,337 6,718,233 6,931,964 7,113,817 3,277,061
PENNSYLVANIA 6,989,096 6,886,538 6,208,005 5,743,639 5,648,420
PUERTO RICO 908,629 1,102,820 1,052,021 824,366 922,261
RHODE ISLAND 93,725 94,309 91,864 108,159 106,464
SOUTH CAROLINA 7,159,709 6,777,887 5,605,686 5,274,675 4,594,149
SOUTH DAKOTA 119,857 81,038 84,858 88,301 80,801
TENNESSEE 9,206,299 8,502,171 7,290,512 9,461,605 6,540,891
TEXAS 536,067 489,413 423,932 303,055 187,061
UTAH 714,319 736,781 751,934 831,999 637,896
VERMONT 273,935 443,523 340,039 196,238 191,004
VIRGIN ISLANDS 12,361 25,807 39,533 26,061 14,494
VIRGINIA 2,024,366 1,773,946 1,754,923 2,363,384 1,569,606
WASHINGTON 1,017,138 1,137,513 956,617 985,355 1,035,476
WEST VIRGINIA 728,499 563,138 567,430 409,535 400,940
WISCONSIN 2,548,268 2,137,546 1,781,747 1,795,149 1,605,671
WYOMING 194,150 143,576 161,905 251,330 258,286
TOTALS $150,723,225 $149,486,357 $126,795,389 $123,592,716 $113,869,301
Source: Form OCSE-34 - Part 1, line 7d, columns (A+B).
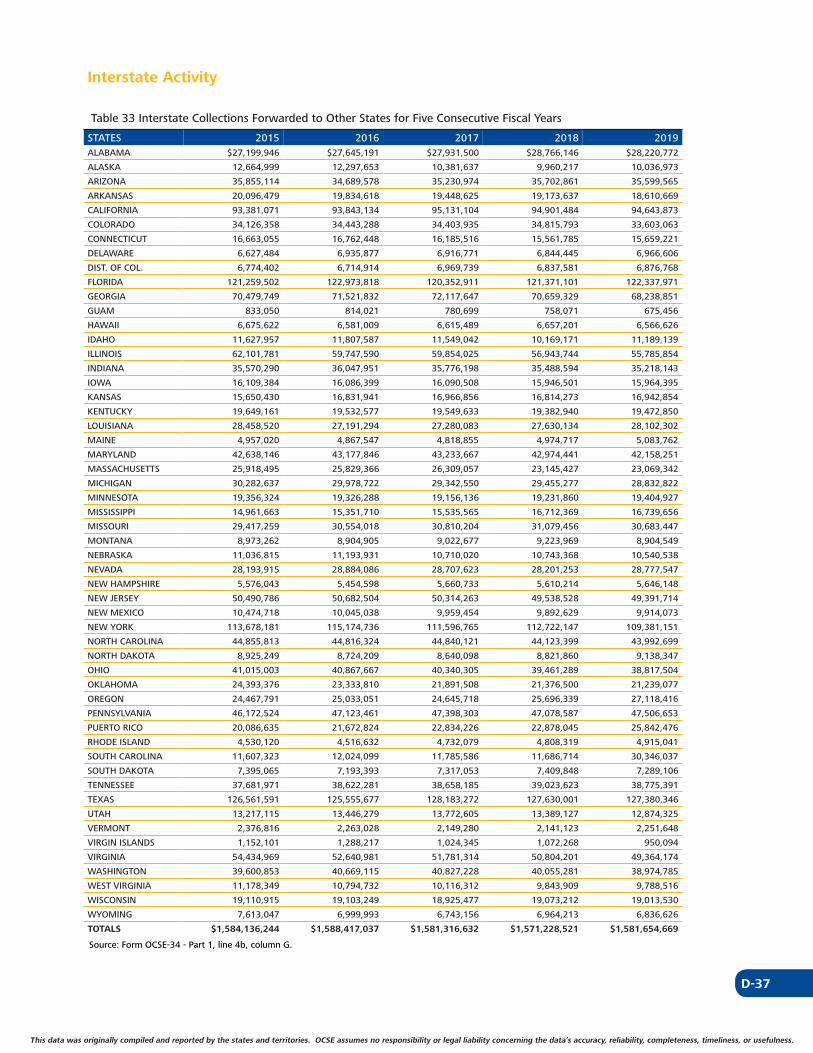
D-37
This data was originally compiled and reported by the states and territories. OCSE assumes no responsibility or legal liability concerning the data’s accuracy, reliability, completeness, timeliness, or usefulness. This data was originally compiled and reported by the states and territories. OCSE assumes no responsibility or legal liability concerning the data’s accuracy, reliability, completeness, timeliness, or usefulness.
Interstate Activity
Table 33 Interstate Collections Forwarded to Other States for Five Consecutive Fiscal Years
STATES 2015 2016 2017 2018 2019ALABAMA $27,199,946 $27,645,191 $27,931,500 $28,766,146 $28,220,772
ALASKA 12,664,999 12,297,653 10,381,637 9,960,217 10,036,973
ARIZONA 35,855,114 34,689,578 35,230,974 35,702,861 35,599,565
ARKANSAS 20,096,479 19,834,618 19,448,625 19,173,637 18,610,669
CALIFORNIA 93,381,071 93,843,134 95,131,104 94,901,484 94,643,873
COLORADO 34,126,358 34,443,288 34,403,935 34,815,793 33,603,063
CONNECTICUT 16,663,055 16,762,448 16,185,516 15,561,785 15,659,221
DELAWARE 6,627,484 6,935,877 6,916,771 6,844,445 6,966,606
DIST. OF COL. 6,774,402 6,714,914 6,969,739 6,837,581 6,876,768
FLORIDA 121,259,502 122,973,818 120,352,911 121,371,101 122,337,971
GEORGIA 70,479,749 71,521,832 72,117,647 70,659,329 68,238,851
GUAM 833,050 814,021 780,699 758,071 675,456
HAWAII 6,675,622 6,581,009 6,615,489 6,657,201 6,566,626
IDAHO 11,627,957 11,807,587 11,549,042 10,169,171 11,189,139
ILLINOIS 62,101,781 59,747,590 59,854,025 56,943,744 55,785,854
INDIANA 35,570,290 36,047,951 35,776,198 35,488,594 35,218,143
IOWA 16,109,384 16,086,399 16,090,508 15,946,501 15,964,395
KANSAS 15,650,430 16,831,941 16,966,856 16,814,273 16,942,854
KENTUCKY 19,649,161 19,532,577 19,549,633 19,382,940 19,472,850
LOUISIANA 28,458,520 27,191,294 27,280,083 27,630,134 28,102,302
MAINE 4,957,020 4,867,547 4,818,855 4,974,717 5,083,762
MARYLAND 42,638,146 43,177,846 43,233,667 42,974,441 42,158,251
MASSACHUSETTS 25,918,495 25,829,366 26,309,057 23,145,427 23,069,342
MICHIGAN 30,282,637 29,978,722 29,342,550 29,455,277 28,832,822
MINNESOTA 19,356,324 19,326,288 19,156,136 19,231,860 19,404,927
MISSISSIPPI 14,961,663 15,351,710 15,535,565 16,712,369 16,739,656
MISSOURI 29,417,259 30,554,018 30,810,204 31,079,456 30,683,447
MONTANA 8,973,262 8,904,905 9,022,677 9,223,969 8,904,549
NEBRASKA 11,036,815 11,193,931 10,710,020 10,743,368 10,540,538
NEVADA 28,193,915 28,884,086 28,707,623 28,201,253 28,777,547
NEW HAMPSHIRE 5,576,043 5,454,598 5,660,733 5,610,214 5,646,148
NEW JERSEY 50,490,786 50,682,504 50,314,263 49,538,528 49,391,714
NEW MEXICO 10,474,718 10,045,038 9,959,454 9,892,629 9,914,073
NEW YORK 113,678,181 115,174,736 111,596,765 112,722,147 109,381,151
NORTH CAROLINA 44,855,813 44,816,324 44,840,121 44,123,399 43,992,699
NORTH DAKOTA 8,925,249 8,724,209 8,640,098 8,821,860 9,138,347
OHIO 41,015,003 40,867,667 40,340,305 39,461,289 38,817,504
OKLAHOMA 24,393,376 23,333,810 21,891,508 21,376,500 21,239,077
OREGON 24,467,791 25,033,051 24,645,718 25,696,339 27,118,416
PENNSYLVANIA 46,172,524 47,123,461 47,398,303 47,078,587 47,506,653
PUERTO RICO 20,086,635 21,672,824 22,834,226 22,878,045 25,842,476
RHODE ISLAND 4,530,120 4,516,632 4,732,079 4,808,319 4,915,041
SOUTH CAROLINA 11,607,323 12,024,099 11,785,586 11,686,714 30,346,037
SOUTH DAKOTA 7,395,065 7,193,393 7,317,053 7,409,848 7,289,106
TENNESSEE 37,681,971 38,622,281 38,658,185 39,023,623 38,775,391
TEXAS 126,561,591 125,555,677 128,183,272 127,630,001 127,380,346
UTAH 13,217,115 13,446,279 13,772,605 13,389,127 12,874,325
VERMONT 2,376,816 2,263,028 2,149,280 2,141,123 2,251,648
VIRGIN ISLANDS 1,152,101 1,288,217 1,024,345 1,072,268 950,094
VIRGINIA 54,434,969 52,640,981 51,781,314 50,804,201 49,364,174
WASHINGTON 39,600,853 40,669,115 40,827,228 40,055,281 38,974,785
WEST VIRGINIA 11,178,349 10,794,732 10,116,312 9,843,909 9,788,516
WISCONSIN 19,110,915 19,103,249 18,925,477 19,073,212 19,013,530
WYOMING 7,613,047 6,999,993 6,743,156 6,964,213 6,836,626
TOTALS $1,584,136,244 $1,588,417,037 $1,581,316,632 $1,571,228,521 $1,581,654,669
Source: Form OCSE-34 - Part 1, line 4b, column G.
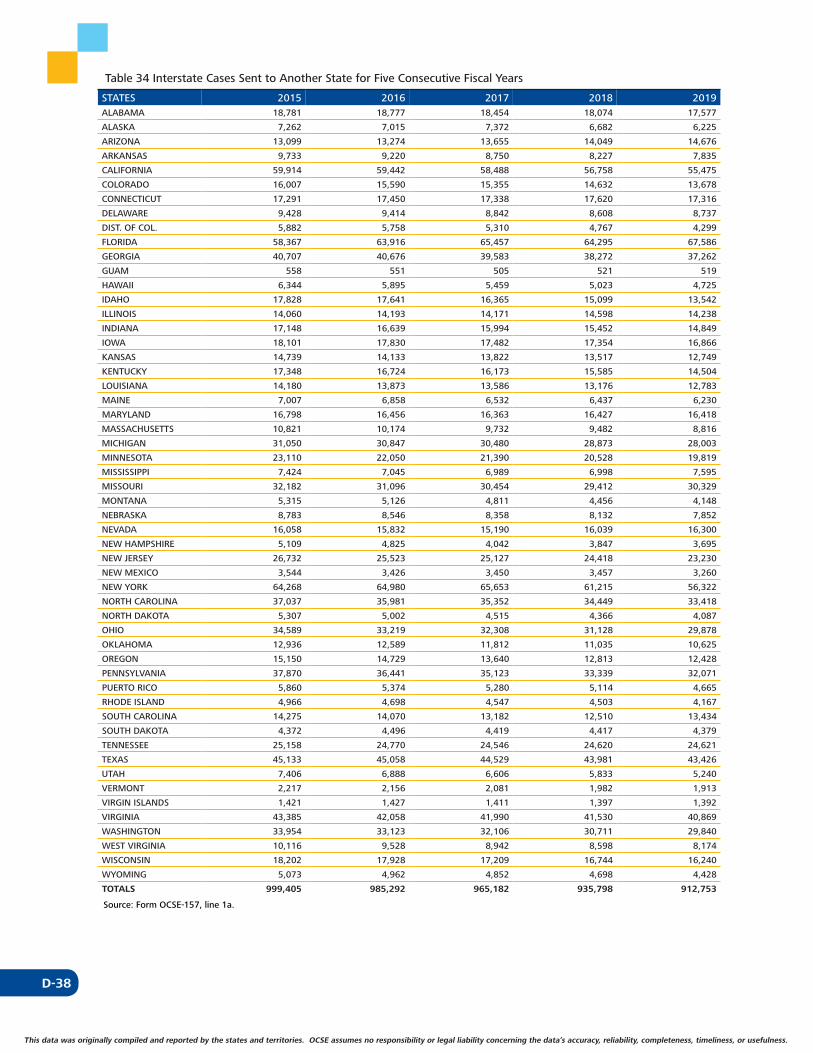
D-38
This data was originally compiled and reported by the states and territories. OCSE assumes no responsibility or legal liability concerning the data’s accuracy, reliability, completeness, timeliness, or usefulness.
Table 34 Interstate Cases Sent to Another State for Five Consecutive Fiscal Years
STATES 2015 2016 2017 2018 2019ALABAMA 18,781 18,777 18,454 18,074 17,577
ALASKA 7,262 7,015 7,372 6,682 6,225
ARIZONA 13,099 13,274 13,655 14,049 14,676
ARKANSAS 9,733 9,220 8,750 8,227 7,835
CALIFORNIA 59,914 59,442 58,488 56,758 55,475
COLORADO 16,007 15,590 15,355 14,632 13,678
CONNECTICUT 17,291 17,450 17,338 17,620 17,316
DELAWARE 9,428 9,414 8,842 8,608 8,737
DIST. OF COL. 5,882 5,758 5,310 4,767 4,299
FLORIDA 58,367 63,916 65,457 64,295 67,586
GEORGIA 40,707 40,676 39,583 38,272 37,262
GUAM 558 551 505 521 519
HAWAII 6,344 5,895 5,459 5,023 4,725
IDAHO 17,828 17,641 16,365 15,099 13,542
ILLINOIS 14,060 14,193 14,171 14,598 14,238
INDIANA 17,148 16,639 15,994 15,452 14,849
IOWA 18,101 17,830 17,482 17,354 16,866
KANSAS 14,739 14,133 13,822 13,517 12,749
KENTUCKY 17,348 16,724 16,173 15,585 14,504
LOUISIANA 14,180 13,873 13,586 13,176 12,783
MAINE 7,007 6,858 6,532 6,437 6,230
MARYLAND 16,798 16,456 16,363 16,427 16,418
MASSACHUSETTS 10,821 10,174 9,732 9,482 8,816
MICHIGAN 31,050 30,847 30,480 28,873 28,003
MINNESOTA 23,110 22,050 21,390 20,528 19,819
MISSISSIPPI 7,424 7,045 6,989 6,998 7,595
MISSOURI 32,182 31,096 30,454 29,412 30,329
MONTANA 5,315 5,126 4,811 4,456 4,148
NEBRASKA 8,783 8,546 8,358 8,132 7,852
NEVADA 16,058 15,832 15,190 16,039 16,300
NEW HAMPSHIRE 5,109 4,825 4,042 3,847 3,695
NEW JERSEY 26,732 25,523 25,127 24,418 23,230
NEW MEXICO 3,544 3,426 3,450 3,457 3,260
NEW YORK 64,268 64,980 65,653 61,215 56,322
NORTH CAROLINA 37,037 35,981 35,352 34,449 33,418
NORTH DAKOTA 5,307 5,002 4,515 4,366 4,087
OHIO 34,589 33,219 32,308 31,128 29,878
OKLAHOMA 12,936 12,589 11,812 11,035 10,625
OREGON 15,150 14,729 13,640 12,813 12,428
PENNSYLVANIA 37,870 36,441 35,123 33,339 32,071
PUERTO RICO 5,860 5,374 5,280 5,114 4,665
RHODE ISLAND 4,966 4,698 4,547 4,503 4,167
SOUTH CAROLINA 14,275 14,070 13,182 12,510 13,434
SOUTH DAKOTA 4,372 4,496 4,419 4,417 4,379
TENNESSEE 25,158 24,770 24,546 24,620 24,621
TEXAS 45,133 45,058 44,529 43,981 43,426
UTAH 7,406 6,888 6,606 5,833 5,240
VERMONT 2,217 2,156 2,081 1,982 1,913
VIRGIN ISLANDS 1,421 1,427 1,411 1,397 1,392
VIRGINIA 43,385 42,058 41,990 41,530 40,869
WASHINGTON 33,954 33,123 32,106 30,711 29,840
WEST VIRGINIA 10,116 9,528 8,942 8,598 8,174
WISCONSIN 18,202 17,928 17,209 16,744 16,240
WYOMING 5,073 4,962 4,852 4,698 4,428
TOTALS 999,405 985,292 965,182 935,798 912,753
Source: Form OCSE-157, line 1a.

D-39
This data was originally compiled and reported by the states and territories. OCSE assumes no responsibility or legal liability concerning the data’s accuracy, reliability, completeness, timeliness, or usefulness. This data was originally compiled and reported by the states and territories. OCSE assumes no responsibility or legal liability concerning the data’s accuracy, reliability, completeness, timeliness, or usefulness.
Table 35 Interstate Cases Received From Another State for Five Consecutive Fiscal Years
STATES 2015 2016 2017 2018 2019ALABAMA 21,812 21,632 21,414 20,696 20,611
ALASKA 4,940 4,800 4,525 4,082 3,922
ARIZONA 20,117 19,951 20,181 19,705 19,178
ARKANSAS 10,234 9,942 9,609 9,244 8,923
CALIFORNIA 46,265 45,800 45,351 44,171 43,041
COLORADO 16,129 16,065 15,968 15,308 14,767
CONNECTICUT 8,827 8,583 8,233 7,367 7,118
DELAWARE 5,922 5,868 5,636 5,460 5,499
DIST. OF COL. 6,548 6,094 6,064 5,732 5,800
FLORIDA 60,614 59,255 58,556 57,234 53,699
GEORGIA 35,718 36,747 37,485 35,398 34,435
GUAM 441 413 434 415 436
HAWAII 5,896 5,861 5,724 5,522 5,358
IDAHO 7,161 6,896 6,780 6,647 6,522
ILLINOIS 39,118 39,855 39,931 38,193 37,338
INDIANA 18,639 18,319 17,921 17,437 17,083
IOWA 9,639 9,594 9,349 9,196 9,120
KANSAS 12,237 12,220 11,819 11,749 11,314
KENTUCKY 13,653 13,738 13,539 13,623 13,448
LOUISIANA 20,973 20,711 20,529 20,017 19,579
MAINE 2,902 2,806 2,743 2,656 2,625
MARYLAND 16,640 16,634 16,412 16,011 15,343
MASSACHUSETTS 11,988 11,615 11,237 11,826 11,598
MICHIGAN 25,906 25,311 24,884 23,849 22,459
MINNESOTA 9,222 9,095 8,981 8,817 8,618
MISSISSIPPI 15,791 14,730 14,269 13,517 13,298
MISSOURI 19,946 19,679 19,279 18,800 18,377
MONTANA 4,996 4,871 4,706 4,223 3,931
NEBRASKA 6,130 6,128 6,139 5,924 5,764
NEVADA 13,932 13,637 13,061 12,746 12,326
NEW HAMPSHIRE 3,104 3,081 2,832 2,770 2,704
NEW JERSEY 19,872 19,203 18,479 17,206 16,583
NEW MEXICO 6,932 6,968 6,705 6,667 6,360
NEW YORK 50,616 50,713 50,807 46,018 39,565
NORTH CAROLINA 26,378 25,899 26,055 25,557 24,893
NORTH DAKOTA 3,544 3,519 3,380 3,196 3,236
OHIO 26,877 26,369 25,723 24,617 24,108
OKLAHOMA 15,789 14,738 14,413 13,690 13,538
OREGON 17,942 17,375 16,781 15,257 15,488
PENNSYLVANIA 21,121 20,749 20,095 19,429 18,809
PUERTO RICO 20,564 18,728 19,924 20,634 21,310
RHODE ISLAND 2,535 2,494 2,387 2,286 2,271
SOUTH CAROLINA 22,158 22,212 21,692 21,147 20,287
SOUTH DAKOTA 3,709 3,627 3,557 3,469 3,367
TENNESSEE 20,560 21,109 21,020 20,715 20,700
TEXAS 68,052 66,445 61,513 60,497 60,263
UTAH 6,239 6,141 6,022 5,690 5,553
VERMONT 1,002 964 896 899 937
VIRGIN ISLANDS 1,357 1,362 1,389 1,421 1,462
VIRGINIA 23,213 22,727 22,505 22,110 21,521
WASHINGTON 21,273 20,987 20,326 19,468 18,515
WEST VIRGINIA 6,907 6,596 6,234 5,958 5,757
WISCONSIN 10,870 10,712 10,516 10,217 10,107
WYOMING 3,172 3,030 2,897 2,721 2,652
TOTALS 896,122 882,598 866,907 837,204 811,516
Source: Form OCSE-157, line 1b.
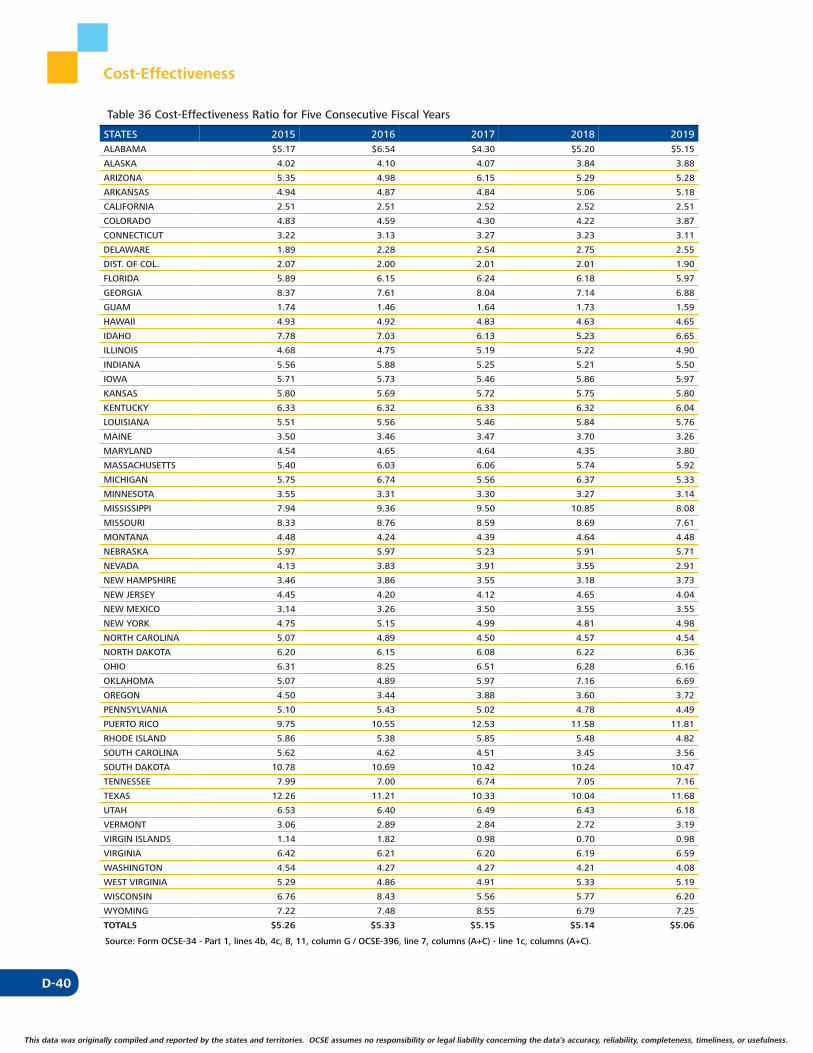
D-40
This data was originally compiled and reported by the states and territories. OCSE assumes no responsibility or legal liability concerning the data’s accuracy, reliability, completeness, timeliness, or usefulness.
Cost-Effectiveness
Table 36 Cost-Effectiveness Ratio for Five Consecutive Fiscal Years
STATES 2015 2016 2017 2018 2019ALABAMA $5.17 $6.54 $4.30 $5.20 $5.15
ALASKA 4.02 4.10 4.07 3.84 3.88
ARIZONA 5.35 4.98 6.15 5.29 5.28
ARKANSAS 4.94 4.87 4.84 5.06 5.18
CALIFORNIA 2.51 2.51 2.52 2.52 2.51
COLORADO 4.83 4.59 4.30 4.22 3.87
CONNECTICUT 3.22 3.13 3.27 3.23 3.11
DELAWARE 1.89 2.28 2.54 2.75 2.55
DIST. OF COL. 2.07 2.00 2.01 2.01 1.90
FLORIDA 5.89 6.15 6.24 6.18 5.97
GEORGIA 8.37 7.61 8.04 7.14 6.88
GUAM 1.74 1.46 1.64 1.73 1.59
HAWAII 4.93 4.92 4.83 4.63 4.65
IDAHO 7.78 7.03 6.13 5.23 6.65
ILLINOIS 4.68 4.75 5.19 5.22 4.90
INDIANA 5.56 5.88 5.25 5.21 5.50
IOWA 5.71 5.73 5.46 5.86 5.97
KANSAS 5.80 5.69 5.72 5.75 5.80
KENTUCKY 6.33 6.32 6.33 6.32 6.04
LOUISIANA 5.51 5.56 5.46 5.84 5.76
MAINE 3.50 3.46 3.47 3.70 3.26
MARYLAND 4.54 4.65 4.64 4.35 3.80
MASSACHUSETTS 5.40 6.03 6.06 5.74 5.92
MICHIGAN 5.75 6.74 5.56 6.37 5.33
MINNESOTA 3.55 3.31 3.30 3.27 3.14
MISSISSIPPI 7.94 9.36 9.50 10.85 8.08
MISSOURI 8.33 8.76 8.59 8.69 7.61
MONTANA 4.48 4.24 4.39 4.64 4.48
NEBRASKA 5.97 5.97 5.23 5.91 5.71
NEVADA 4.13 3.83 3.91 3.55 2.91
NEW HAMPSHIRE 3.46 3.86 3.55 3.18 3.73
NEW JERSEY 4.45 4.20 4.12 4.65 4.04
NEW MEXICO 3.14 3.26 3.50 3.55 3.55
NEW YORK 4.75 5.15 4.99 4.81 4.98
NORTH CAROLINA 5.07 4.89 4.50 4.57 4.54
NORTH DAKOTA 6.20 6.15 6.08 6.22 6.36
OHIO 6.31 8.25 6.51 6.28 6.16
OKLAHOMA 5.07 4.89 5.97 7.16 6.69
OREGON 4.50 3.44 3.88 3.60 3.72
PENNSYLVANIA 5.10 5.43 5.02 4.78 4.49
PUERTO RICO 9.75 10.55 12.53 11.58 11.81
RHODE ISLAND 5.86 5.38 5.85 5.48 4.82
SOUTH CAROLINA 5.62 4.62 4.51 3.45 3.56
SOUTH DAKOTA 10.78 10.69 10.42 10.24 10.47
TENNESSEE 7.99 7.00 6.74 7.05 7.16
TEXAS 12.26 11.21 10.33 10.04 11.68
UTAH 6.53 6.40 6.49 6.43 6.18
VERMONT 3.06 2.89 2.84 2.72 3.19
VIRGIN ISLANDS 1.14 1.82 0.98 0.70 0.98
VIRGINIA 6.42 6.21 6.20 6.19 6.59
WASHINGTON 4.54 4.27 4.27 4.21 4.08
WEST VIRGINIA 5.29 4.86 4.91 5.33 5.19
WISCONSIN 6.76 8.43 5.56 5.77 6.20
WYOMING 7.22 7.48 8.55 6.79 7.25
TOTALS $5.26 $5.33 $5.15 $5.14 $5.06
Source: Form OCSE-34 - Part 1, lines 4b, 4c, 8, 11, column G / OCSE-396, line 7, columns (A+C) - line 1c, columns (A+C).
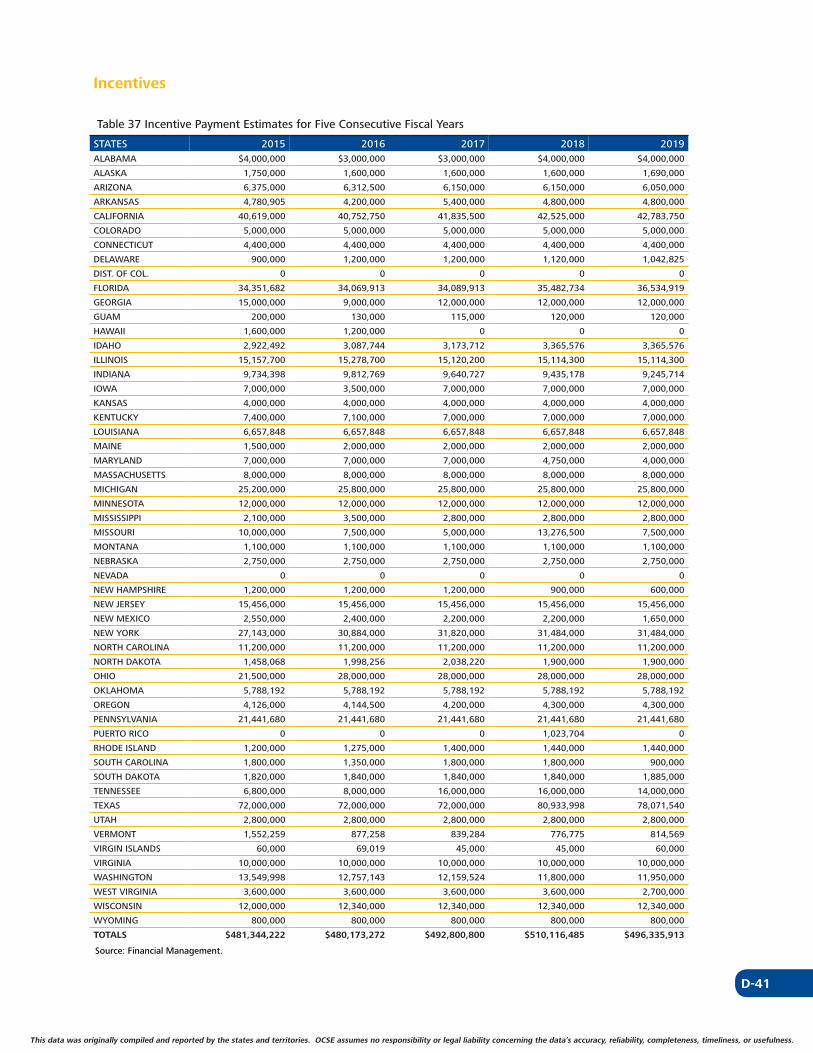
D-41
This data was originally compiled and reported by the states and territories. OCSE assumes no responsibility or legal liability concerning the data’s accuracy, reliability, completeness, timeliness, or usefulness. This data was originally compiled and reported by the states and territories. OCSE assumes no responsibility or legal liability concerning the data’s accuracy, reliability, completeness, timeliness, or usefulness.
Incentives
Table 37 Incentive Payment Estimates for Five Consecutive Fiscal Years
STATES 2015 2016 2017 2018 2019ALABAMA $4,000,000 $3,000,000 $3,000,000 $4,000,000 $4,000,000
ALASKA 1,750,000 1,600,000 1,600,000 1,600,000 1,690,000
ARIZONA 6,375,000 6,312,500 6,150,000 6,150,000 6,050,000
ARKANSAS 4,780,905 4,200,000 5,400,000 4,800,000 4,800,000
CALIFORNIA 40,619,000 40,752,750 41,835,500 42,525,000 42,783,750
COLORADO 5,000,000 5,000,000 5,000,000 5,000,000 5,000,000
CONNECTICUT 4,400,000 4,400,000 4,400,000 4,400,000 4,400,000
DELAWARE 900,000 1,200,000 1,200,000 1,120,000 1,042,825
DIST. OF COL. 0 0 0 0 0
FLORIDA 34,351,682 34,069,913 34,089,913 35,482,734 36,534,919
GEORGIA 15,000,000 9,000,000 12,000,000 12,000,000 12,000,000
GUAM 200,000 130,000 115,000 120,000 120,000
HAWAII 1,600,000 1,200,000 0 0 0
IDAHO 2,922,492 3,087,744 3,173,712 3,365,576 3,365,576
ILLINOIS 15,157,700 15,278,700 15,120,200 15,114,300 15,114,300
INDIANA 9,734,398 9,812,769 9,640,727 9,435,178 9,245,714
IOWA 7,000,000 3,500,000 7,000,000 7,000,000 7,000,000
KANSAS 4,000,000 4,000,000 4,000,000 4,000,000 4,000,000
KENTUCKY 7,400,000 7,100,000 7,000,000 7,000,000 7,000,000
LOUISIANA 6,657,848 6,657,848 6,657,848 6,657,848 6,657,848
MAINE 1,500,000 2,000,000 2,000,000 2,000,000 2,000,000
MARYLAND 7,000,000 7,000,000 7,000,000 4,750,000 4,000,000
MASSACHUSETTS 8,000,000 8,000,000 8,000,000 8,000,000 8,000,000
MICHIGAN 25,200,000 25,800,000 25,800,000 25,800,000 25,800,000
MINNESOTA 12,000,000 12,000,000 12,000,000 12,000,000 12,000,000
MISSISSIPPI 2,100,000 3,500,000 2,800,000 2,800,000 2,800,000
MISSOURI 10,000,000 7,500,000 5,000,000 13,276,500 7,500,000
MONTANA 1,100,000 1,100,000 1,100,000 1,100,000 1,100,000
NEBRASKA 2,750,000 2,750,000 2,750,000 2,750,000 2,750,000
NEVADA 0 0 0 0 0
NEW HAMPSHIRE 1,200,000 1,200,000 1,200,000 900,000 600,000
NEW JERSEY 15,456,000 15,456,000 15,456,000 15,456,000 15,456,000
NEW MEXICO 2,550,000 2,400,000 2,200,000 2,200,000 1,650,000
NEW YORK 27,143,000 30,884,000 31,820,000 31,484,000 31,484,000
NORTH CAROLINA 11,200,000 11,200,000 11,200,000 11,200,000 11,200,000
NORTH DAKOTA 1,458,068 1,998,256 2,038,220 1,900,000 1,900,000
OHIO 21,500,000 28,000,000 28,000,000 28,000,000 28,000,000
OKLAHOMA 5,788,192 5,788,192 5,788,192 5,788,192 5,788,192
OREGON 4,126,000 4,144,500 4,200,000 4,300,000 4,300,000
PENNSYLVANIA 21,441,680 21,441,680 21,441,680 21,441,680 21,441,680
PUERTO RICO 0 0 0 1,023,704 0
RHODE ISLAND 1,200,000 1,275,000 1,400,000 1,440,000 1,440,000
SOUTH CAROLINA 1,800,000 1,350,000 1,800,000 1,800,000 900,000
SOUTH DAKOTA 1,820,000 1,840,000 1,840,000 1,840,000 1,885,000
TENNESSEE 6,800,000 8,000,000 16,000,000 16,000,000 14,000,000
TEXAS 72,000,000 72,000,000 72,000,000 80,933,998 78,071,540
UTAH 2,800,000 2,800,000 2,800,000 2,800,000 2,800,000
VERMONT 1,552,259 877,258 839,284 776,775 814,569
VIRGIN ISLANDS 60,000 69,019 45,000 45,000 60,000
VIRGINIA 10,000,000 10,000,000 10,000,000 10,000,000 10,000,000
WASHINGTON 13,549,998 12,757,143 12,159,524 11,800,000 11,950,000
WEST VIRGINIA 3,600,000 3,600,000 3,600,000 3,600,000 2,700,000
WISCONSIN 12,000,000 12,340,000 12,340,000 12,340,000 12,340,000
WYOMING 800,000 800,000 800,000 800,000 800,000
TOTALS $481,344,222 $480,173,272 $492,800,800 $510,116,485 $496,335,913
Source: Financial Management.

D-42
This data was originally compiled and reported by the states and territories. OCSE assumes no responsibility or legal liability concerning the data’s accuracy, reliability, completeness, timeliness, or usefulness.
Table 38 Incentive Payment Actuals for Five Consecutive Fiscal Years
STATES 2015 2016 2017 2018 2019ALABAMA $5,406,073 $5,422,863 $3,812,262 $5,476,050 $5,491,249
ALASKA 1,761,758 1,721,796 1,576,068 1,563,148 1,632,714
ARIZONA 6,299,172 6,026,009 6,147,926 6,161,703 6,185,080
ARKANSAS 5,399,278 5,220,615 5,228,497 5,462,041 5,488,602
CALIFORNIA 40,765,180 41,167,696 41,997,177 43,247,644 44,564,375
COLORADO 5,523,010 5,432,247 5,315,800 5,384,611 5,369,315
CONNECTICUT 4,065,649 5,040,492 4,949,478 4,920,498 5,027,821
DELAWARE 1,072,619 1,247,156 1,272,264 1,324,252 1,384,673
DIST. OF COL. 887,620 888,997 937,164 889,558 867,498
FLORIDA 34,132,161 34,667,104 34,842,844 35,731,704 36,572,720
GEORGIA 15,126,648 15,316,577 15,581,056 15,653,621 15,739,776
GUAM 137,289 119,967 116,527 109,149 108,422
HAWAII 1,703,052 1,693,568 1,672,086 1,667,272 1,698,495
IDAHO 3,365,575 3,389,122 3,381,752 2,989,899 3,332,777
ILLINOIS 15,344,454 15,164,504 15,228,098 14,991,429 14,694,067
INDIANA 12,276,236 12,206,235 11,953,626 12,011,021 12,155,210
IOWA 7,124,990 7,012,654 7,049,923 7,115,447 7,296,552
KANSAS 4,235,687 4,311,692 4,316,939 4,568,327 4,807,209
KENTUCKY 7,787,380 7,540,411 7,343,199 7,252,240 7,230,293
LOUISIANA 8,804,825 8,402,709 8,512,215 8,831,860 9,103,233
MAINE 1,988,755 1,975,641 1,934,659 1,981,490 1,961,734
MARYLAND 8,062,854 8,740,064 11,056,878 10,855,338 10,723,600
MASSACHUSETTS 10,838,551 10,860,531 10,863,421 10,212,404 10,053,080
MICHIGAN 26,565,835 26,725,656 26,896,610 26,975,518 27,300,432
MINNESOTA 12,143,926 11,603,854 11,457,845 11,499,410 11,704,049
MISSISSIPPI 5,357,222 5,371,670 5,421,464 5,688,221 6,822,529
MISSOURI 12,611,568 12,355,161 11,993,181 11,772,059 11,569,204
MONTANA 1,185,760 1,114,918 1,129,169 1,191,955 1,196,028
NEBRASKA 4,795,353 4,730,849 4,718,019 4,807,951 4,963,231
NEVADA 3,505,324 3,476,014 3,577,253 3,690,431 3,695,032
NEW HAMPSHIRE 1,565,003 1,243,516 1,535,138 1,507,571 1,577,070
NEW JERSEY 17,049,578 16,869,048 16,509,102 16,370,699 16,318,259
NEW MEXICO 2,319,333 2,247,144 2,315,673 2,291,518 2,361,754
NEW YORK 31,484,142 32,936,544 32,332,191 33,133,417 33,999,313
NORTH CAROLINA 14,675,156 14,309,773 14,259,825 14,458,422 14,749,886
NORTH DAKOTA 2,170,547 2,048,523 2,015,597 2,031,399 2,068,333
OHIO 30,387,844 31,283,967 31,302,812 32,116,114 32,635,856
OKLAHOMA 7,768,873 7,347,282 7,476,810 7,656,404 7,733,024
OREGON 6,485,433 6,103,817 6,195,163 6,390,391 6,723,803
PENNSYLVANIA 25,608,815 25,580,338 25,664,855 25,595,947 25,768,611
PUERTO RICO 4,094,817 4,185,179 4,124,534 4,026,639 4,263,084
RHODE ISLAND 1,545,310 1,547,610 1,520,824 1,462,257 1,515,957
SOUTH CAROLINA 5,433,588 5,406,683 5,443,569 5,226,875 5,636,987
SOUTH DAKOTA 2,074,742 2,020,397 2,044,076 2,102,803 2,199,351
TENNESSEE 12,446,708 12,323,227 12,288,914 12,345,964 12,430,445
TEXAS 74,555,173 75,635,533 79,070,335 83,608,063 87,771,210
UTAH 4,425,076 4,549,230 4,526,567 4,615,142 4,711,819
VERMONT 833,963 808,105 779,219 780,025 799,253
VIRGIN ISLANDS 71,901 52,266 22,623 54,341 50,477
VIRGINIA 11,639,522 11,012,454 11,523,413 12,817,303 13,045,389
WASHINGTON 11,113,608 12,052,377 12,327,914 12,650,670 12,891,141
WEST VIRGINIA 4,274,455 3,906,139 3,707,086 3,694,914 3,649,458
WISCONSIN 14,464,752 14,448,003 14,628,864 14,868,693 15,157,342
WYOMING 1,237,857 1,136,073 1,101,496 1,168,178 1,203,178
TOTALS $556,000,000 $558,000,000 $563,000,000 $575,000,000 $588,000,000
Source: Financial Management.
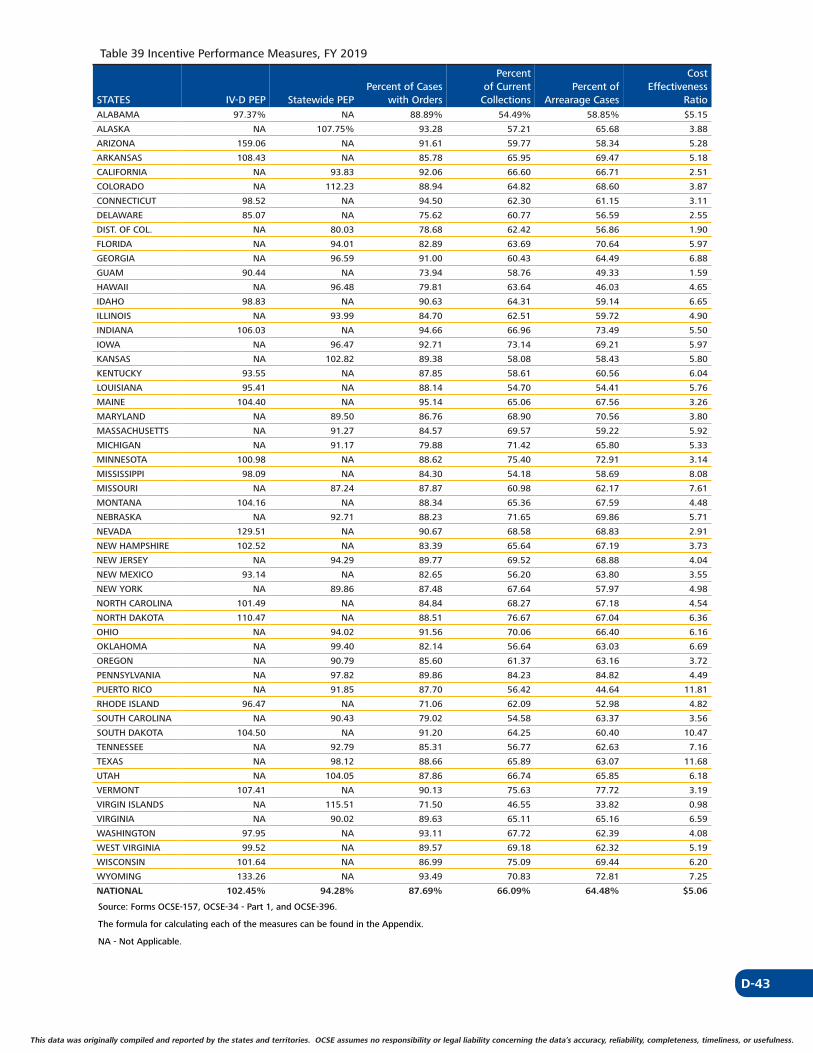
D-43
This data was originally compiled and reported by the states and territories. OCSE assumes no responsibility or legal liability concerning the data’s accuracy, reliability, completeness, timeliness, or usefulness. This data was originally compiled and reported by the states and territories. OCSE assumes no responsibility or legal liability concerning the data’s accuracy, reliability, completeness, timeliness, or usefulness.
Table 39 Incentive Performance Measures, FY 2019
Percent Cost Percent of Cases of Current Percent of Effectiveness
STATES IV-D PEP Statewide PEP with Orders Collections Arrearage Cases RatioALABAMA 97.37% NA 88.89% 54.49% 58.85% $5.15
ALASKA NA 107.75% 93.28 57.21 65.68 3.88
ARIZONA 159.06 NA 91.61 59.77 58.34 5.28
ARKANSAS 108.43 NA 85.78 65.95 69.47 5.18
CALIFORNIA NA 93.83 92.06 66.60 66.71 2.51
COLORADO NA 112.23 88.94 64.82 68.60 3.87
CONNECTICUT 98.52 NA 94.50 62.30 61.15 3.11
DELAWARE 85.07 NA 75.62 60.77 56.59 2.55
DIST. OF COL. NA 80.03 78.68 62.42 56.86 1.90
FLORIDA NA 94.01 82.89 63.69 70.64 5.97
GEORGIA NA 96.59 91.00 60.43 64.49 6.88
GUAM 90.44 NA 73.94 58.76 49.33 1.59
HAWAII NA 96.48 79.81 63.64 46.03 4.65
IDAHO 98.83 NA 90.63 64.31 59.14 6.65
ILLINOIS NA 93.99 84.70 62.51 59.72 4.90
INDIANA 106.03 NA 94.66 66.96 73.49 5.50
IOWA NA 96.47 92.71 73.14 69.21 5.97
KANSAS NA 102.82 89.38 58.08 58.43 5.80
KENTUCKY 93.55 NA 87.85 58.61 60.56 6.04
LOUISIANA 95.41 NA 88.14 54.70 54.41 5.76
MAINE 104.40 NA 95.14 65.06 67.56 3.26
MARYLAND NA 89.50 86.76 68.90 70.56 3.80
MASSACHUSETTS NA 91.27 84.57 69.57 59.22 5.92
MICHIGAN NA 91.17 79.88 71.42 65.80 5.33
MINNESOTA 100.98 NA 88.62 75.40 72.91 3.14
MISSISSIPPI 98.09 NA 84.30 54.18 58.69 8.08
MISSOURI NA 87.24 87.87 60.98 62.17 7.61
MONTANA 104.16 NA 88.34 65.36 67.59 4.48
NEBRASKA NA 92.71 88.23 71.65 69.86 5.71
NEVADA 129.51 NA 90.67 68.58 68.83 2.91
NEW HAMPSHIRE 102.52 NA 83.39 65.64 67.19 3.73
NEW JERSEY NA 94.29 89.77 69.52 68.88 4.04
NEW MEXICO 93.14 NA 82.65 56.20 63.80 3.55
NEW YORK NA 89.86 87.48 67.64 57.97 4.98
NORTH CAROLINA 101.49 NA 84.84 68.27 67.18 4.54
NORTH DAKOTA 110.47 NA 88.51 76.67 67.04 6.36
OHIO NA 94.02 91.56 70.06 66.40 6.16
OKLAHOMA NA 99.40 82.14 56.64 63.03 6.69
OREGON NA 90.79 85.60 61.37 63.16 3.72
PENNSYLVANIA NA 97.82 89.86 84.23 84.82 4.49
PUERTO RICO NA 91.85 87.70 56.42 44.64 11.81
RHODE ISLAND 96.47 NA 71.06 62.09 52.98 4.82
SOUTH CAROLINA NA 90.43 79.02 54.58 63.37 3.56
SOUTH DAKOTA 104.50 NA 91.20 64.25 60.40 10.47
TENNESSEE NA 92.79 85.31 56.77 62.63 7.16
TEXAS NA 98.12 88.66 65.89 63.07 11.68
UTAH NA 104.05 87.86 66.74 65.85 6.18
VERMONT 107.41 NA 90.13 75.63 77.72 3.19
VIRGIN ISLANDS NA 115.51 71.50 46.55 33.82 0.98
VIRGINIA NA 90.02 89.63 65.11 65.16 6.59
WASHINGTON 97.95 NA 93.11 67.72 62.39 4.08
WEST VIRGINIA 99.52 NA 89.57 69.18 62.32 5.19
WISCONSIN 101.64 NA 86.99 75.09 69.44 6.20
WYOMING 133.26 NA 93.49 70.83 72.81 7.25
NATIONAL 102.45% 94.28% 87.69% 66.09% 64.48% $5.06
Source: Forms OCSE-157, OCSE-34 - Part 1, and OCSE-396.
The formula for calculating each of the measures can be found in the Appendix.
NA - Not Applicable.

D-44
This data was originally compiled and reported by the states and territories. OCSE assumes no responsibility or legal liability concerning the data’s accuracy, reliability, completeness, timeliness, or usefulness.
Medical Support
Table 40 Distributed as Medical Support Payments for Five Consecutive Fiscal Years
STATES 2015 2016 2017 2018 2019ALABAMA $492,090 $204,090 $493,770 $475,460 $491,226
ALASKA 45,623 24,047 23,421 24,936 29,509
ARIZONA 1,764,196 1,749,069 1,595,949 1,611,707 1,534,377
ARKANSAS 557,111 614,218 571,717 566,249 577,942
CALIFORNIA 2,475,134 2,611,046 2,593,006 2,799,913 2,797,387
COLORADO 7,858 7,124 3,939 5,733 5,701
CONNECTICUT 2,368,736 1,108,514 858,262 660,411 572,133
DELAWARE 59,069 62,493 49,351 52,249 65,982
DIST. OF COL. 641,152 635,206 666,312 691,693 627,349
FLORIDA 654,765 759,252 889,087 1,052,540 1,138,615
GEORGIA 674,450 687,433 705,214 700,814 744,264
GUAM 36,463 18,919 27,496 25,249 21,895
HAWAII 652,848 530,576 456,698 404,009 379,230
IDAHO 131,130 175,802 185,213 144,841 154,898
ILLINOIS 570,712 583,614 600,722 1,399,543 2,497,589
INDIANA 363,417 289,409 257,318 278,411 224,749
IOWA 9,365,176 10,442,737 11,364,042 12,212,520 13,019,887
KANSAS 1,377,716 1,320,492 1,080,017 1,036,566 900,049
KENTUCKY 1,184,371 1,099,056 1,018,716 1,051,610 928,608
LOUISIANA 1,409,348 1,413,188 1,420,107 1,572,522 1,970,652
MAINE 487,483 497,662 384,511 375,947 399,218
MARYLAND 398,466 478,156 444,526 393,224 470,442
MASSACHUSETTS 656,948 616,755 596,417 420,115 433,522
MICHIGAN 73,762,488 77,111,040 79,151,722 81,344,138 84,397,654
MINNESOTA 24,230,809 22,751,749 21,011,298 20,050,044 20,399,826
MISSISSIPPI 594,290 643,887 692,661 779,129 837,060
MISSOURI 587,951 610,316 580,261 546,229 572,503
MONTANA 105,125 118,922 98,620 95,188 120,558
NEBRASKA 2,563,300 2,761,835 2,903,980 3,080,822 3,288,951
NEVADA 2,177,011 2,309,906 2,447,540 2,414,705 2,445,402
NEW HAMPSHIRE 206,882 186,471 170,045 154,812 151,545
NEW JERSEY 356,931 378,691 367,857 401,905 326,034
NEW MEXICO 296,588 385,211 322,816 366,411 378,275
NEW YORK 11,186,255 14,968,986 9,430,153 8,955,176 8,523,613
NORTH CAROLINA 261,754 305,719 255,342 274,821 282,576
NORTH DAKOTA 169,313 156,608 147,919 168,897 164,853
OHIO 39,229,942 41,866,556 44,687,278 48,818,426 52,782,903
OKLAHOMA 5,430,556 5,457,955 5,131,723 4,961,552 4,722,612
OREGON 12,756,412 11,617,812 9,863,979 8,803,673 6,691,929
PENNSYLVANIA 3,243,671 3,318,372 3,075,189 2,925,769 2,689,943
PUERTO RICO 5,814 9,323 6,458 15,683 4,482
RHODE ISLAND 7,761,493 7,485,734 6,979,445 6,394,553 6,885,420
SOUTH CAROLINA 1 0 0 0 0 3,692
SOUTH DAKOTA 134,820 153,866 132,015 151,048 159,905
TENNESSEE 1,089,476 939,917 863,801 817,687 767,978
TEXAS 276,681,859 299,149,139 324,890,701 354,529,149 381,777,589
UTAH 288,837 266,422 277,306 368,644 290,641
VERMONT 56,896 71,115 59,129 71,853 57,532
VIRGIN ISLANDS 30 502 190 0 0
VIRGINIA 6,942 5,908 6,116 5,808 9,472
WASHINGTON 1,024,050 1,127,727 1,120,783 1,122,952 1,109,192
WEST VIRGINIA 600,928 942,314 705,400 511,983 490,936
WISCONSIN 19,303,490 18,790,461 17,510,984 16,825,662 14,043,364
WYOMING 397,399 384,719 301,652 288,781 331,772
TOTALS $510,885,574 $540,206,041 $559,478,174 $593,201,762 $624,693,436
Source: Form OCSE-34 - Part 1, line 7c, column G.
1 South Carolina does not currently distinguish the type of payment going to the family and so includes medical support payments to families in their reporting of "Payments to Families or Foster Care" rather than separately as "Distributed as Medical Support Payments", which is the data source of this table.
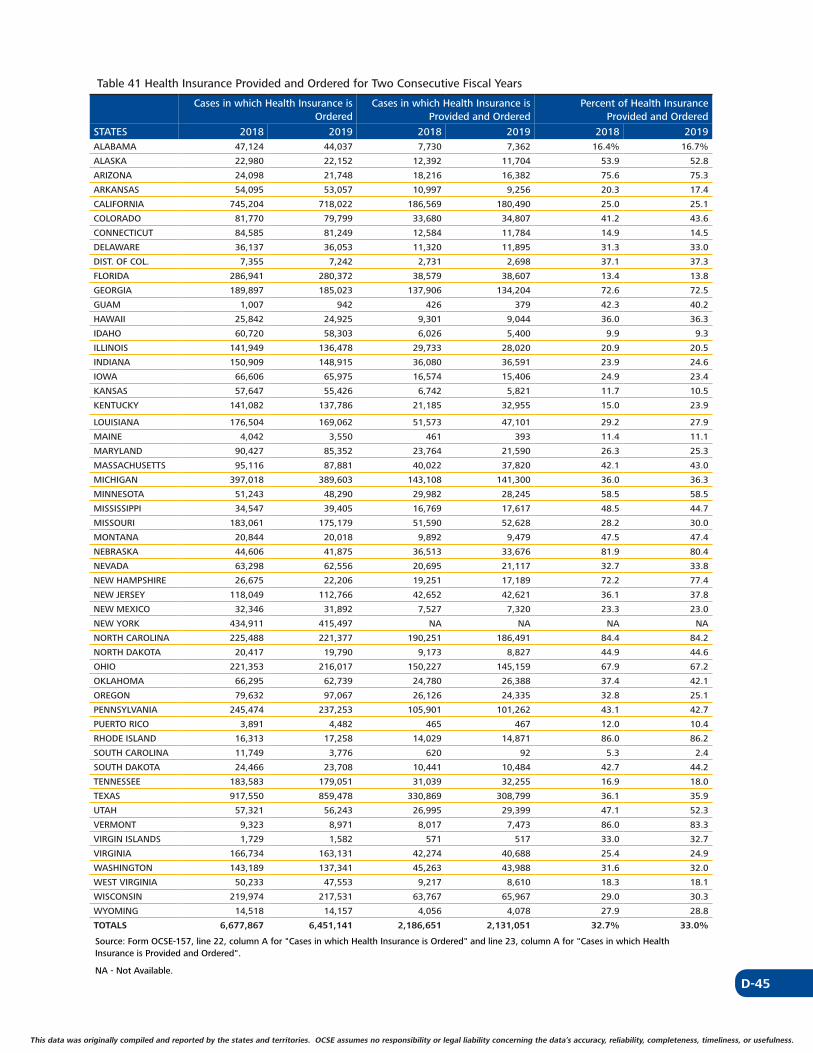
D-45
This data was originally compiled and reported by the states and territories. OCSE assumes no responsibility or legal liability concerning the data’s accuracy, reliability, completeness, timeliness, or usefulness. This data was originally compiled and reported by the states and territories. OCSE assumes no responsibility or legal liability concerning the data’s accuracy, reliability, completeness, timeliness, or usefulness.
Table 41 Health Insurance Provided and Ordered for Two Consecutive Fiscal Years
Cases in which Health Insurance is Ordered
Cases in which Health Insurance is Provided and Ordered
Percent of Health Insurance Provided and Ordered
STATES 2018 2019 2018 2019 2018 2019ALABAMA 47,124 44,037 7,730 7,362 16.4% 16.7%
ALASKA 22,980 22,152 12,392 11,704 53.9 52.8
ARIZONA 24,098 21,748 18,216 16,382 75.6 75.3
ARKANSAS 54,095 53,057 10,997 9,256 20.3 17.4
CALIFORNIA 745,204 718,022 186,569 180,490 25.0 25.1
COLORADO 81,770 79,799 33,680 34,807 41.2 43.6
CONNECTICUT 84,585 81,249 12,584 11,784 14.9 14.5
DELAWARE 36,137 36,053 11,320 11,895 31.3 33.0
DIST. OF COL. 7,355 7,242 2,731 2,698 37.1 37.3
FLORIDA 286,941 280,372 38,579 38,607 13.4 13.8
GEORGIA 189,897 185,023 137,906 134,204 72.6 72.5
GUAM 1,007 942 426 379 42.3 40.2
HAWAII 25,842 24,925 9,301 9,044 36.0 36.3
IDAHO 60,720 58,303 6,026 5,400 9.9 9.3
ILLINOIS 141,949 136,478 29,733 28,020 20.9 20.5
INDIANA 150,909 148,915 36,080 36,591 23.9 24.6
IOWA 66,606 65,975 16,574 15,406 24.9 23.4
KANSAS 57,647 55,426 6,742 5,821 11.7 10.5
KENTUCKY 141,082 137,786 21,185 32,955 15.0 23.9
LOUISIANA 176,504 169,062 51,573 47,101 29.2 27.9
MAINE 4,042 3,550 461 393 11.4 11.1
MARYLAND 90,427 85,352 23,764 21,590 26.3 25.3
MASSACHUSETTS 95,116 87,881 40,022 37,820 42.1 43.0
MICHIGAN 397,018 389,603 143,108 141,300 36.0 36.3
MINNESOTA 51,243 48,290 29,982 28,245 58.5 58.5
MISSISSIPPI 34,547 39,405 16,769 17,617 48.5 44.7
MISSOURI 183,061 175,179 51,590 52,628 28.2 30.0
MONTANA 20,844 20,018 9,892 9,479 47.5 47.4
NEBRASKA 44,606 41,875 36,513 33,676 81.9 80.4
NEVADA 63,298 62,556 20,695 21,117 32.7 33.8
NEW HAMPSHIRE 26,675 22,206 19,251 17,189 72.2 77.4
NEW JERSEY 118,049 112,766 42,652 42,621 36.1 37.8
NEW MEXICO 32,346 31,892 7,527 7,320 23.3 23.0
NEW YORK 434,911 415,497 NA NA NA NA
NORTH CAROLINA 225,488 221,377 190,251 186,491 84.4 84.2
NORTH DAKOTA 20,417 19,790 9,173 8,827 44.9 44.6
OHIO 221,353 216,017 150,227 145,159 67.9 67.2
OKLAHOMA 66,295 62,739 24,780 26,388 37.4 42.1
OREGON 79,632 97,067 26,126 24,335 32.8 25.1
PENNSYLVANIA 245,474 237,253 105,901 101,262 43.1 42.7
PUERTO RICO 3,891 4,482 465 467 12.0 10.4
RHODE ISLAND 16,313 17,258 14,029 14,871 86.0 86.2
SOUTH CAROLINA 11,749 3,776 620 92 5.3 2.4
SOUTH DAKOTA 24,466 23,708 10,441 10,484 42.7 44.2
TENNESSEE 183,583 179,051 31,039 32,255 16.9 18.0
TEXAS 917,550 859,478 330,869 308,799 36.1 35.9
UTAH 57,321 56,243 26,995 29,399 47.1 52.3
VERMONT 9,323 8,971 8,017 7,473 86.0 83.3
VIRGIN ISLANDS 1,729 1,582 571 517 33.0 32.7
VIRGINIA 166,734 163,131 42,274 40,688 25.4 24.9
WASHINGTON 143,189 137,341 45,263 43,988 31.6 32.0
WEST VIRGINIA 50,233 47,553 9,217 8,610 18.3 18.1
WISCONSIN 219,974 217,531 63,767 65,967 29.0 30.3
WYOMING 14,518 14,157 4,056 4,078 27.9 28.8
TOTALS 6,677,867 6,451,141 2,186,651 2,131,051 32.7% 33.0%
Source: Form OCSE-157, line 22, column A for "Cases in which Health Insurance is Ordered" and line 23, column A for "Cases in which Health Insurance is Provided and Ordered".
NA - Not Available.
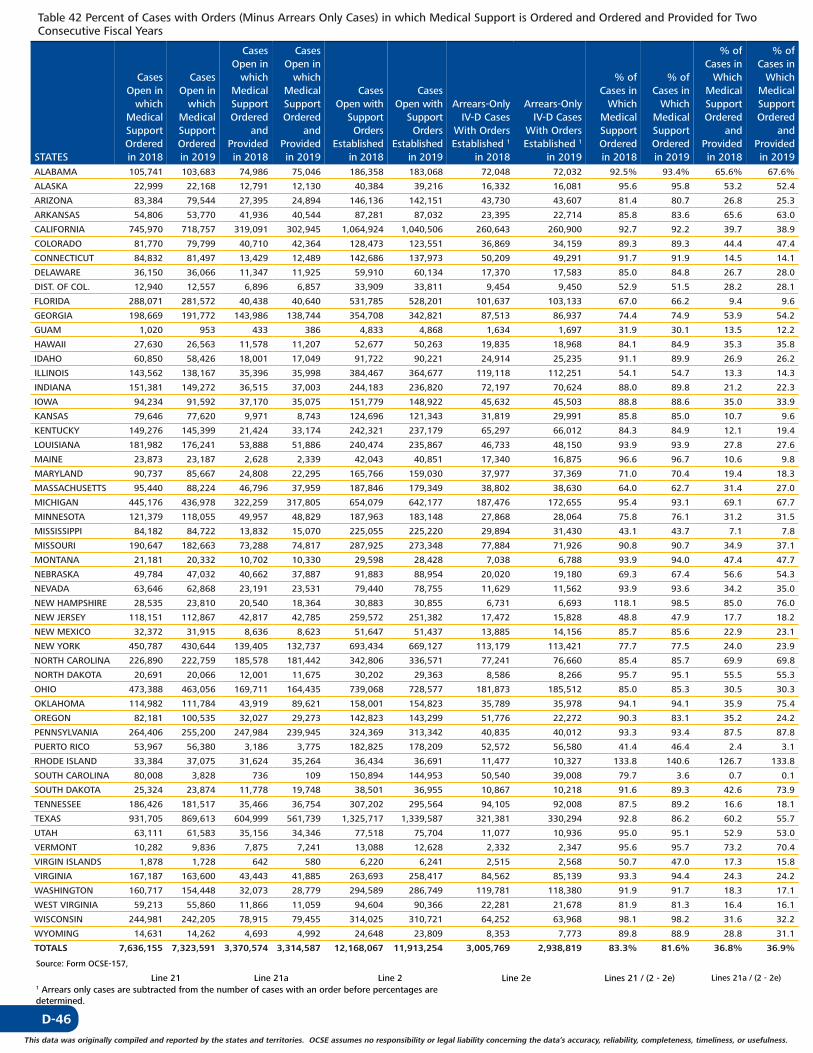
D-46
This data was originally compiled and reported by the states and territories. OCSE assumes no responsibility or legal liability concerning the data’s accuracy, reliability, completeness, timeliness, or usefulness.
Table 42 Percent of Cases with Orders (Minus Arrears Only Cases) in which Medical Support is Ordered and Ordered and Provided for Two Consecutive Fiscal Years
STATES
Cases Open in
which Medical Support Ordered in 2018
Cases Open in
which Medical Support Ordered in 2019
Cases Open in
which Medical Support Ordered
and Provided in 2018
Cases Open in
which Medical Support Ordered
and Provided in 2019
Cases Open with
Support Orders
Established in 2018
Cases Open with
Support Orders
Established in 2019
Arrears-Only IV-D Cases
With Orders Established
in 2018
1
Arrears-Only IV-D Cases
With Orders Established
in 2019
1
% of Cases in
Which Medical Support Ordered in 2018
% of Cases in
Which Medical Support Ordered in 2019
% of Cases in
Which Medical Support Ordered
and Provided in 2018
% of Cases in
Which Medical Support Ordered
and Provided in 2019
ALABAMA 105,741 103,683 74,986 75,046 186,358 183,068 72,048 72,032 92.5% 93.4% 65.6% 67.6%
ALASKA 22,999 22,168 12,791 12,130 40,384 39,216 16,332 16,081 95.6 95.8 53.2 52.4
ARIZONA 83,384 79,544 27,395 24,894 146,136 142,151 43,730 43,607 81.4 80.7 26.8 25.3
ARKANSAS 54,806 53,770 41,936 40,544 87,281 87,032 23,395 22,714 85.8 83.6 65.6 63.0
CALIFORNIA 745,970 718,757 319,091 302,945 1,064,924 1,040,506 260,643 260,900 92.7 92.2 39.7 38.9
COLORADO 81,770 79,799 40,710 42,364 128,473 123,551 36,869 34,159 89.3 89.3 44.4 47.4
CONNECTICUT 84,832 81,497 13,429 12,489 142,686 137,973 50,209 49,291 91.7 91.9 14.5 14.1
DELAWARE 36,150 36,066 11,347 11,925 59,910 60,134 17,370 17,583 85.0 84.8 26.7 28.0
DIST. OF COL. 12,940 12,557 6,896 6,857 33,909 33,811 9,454 9,450 52.9 51.5 28.2 28.1
FLORIDA 288,071 281,572 40,438 40,640 531,785 528,201 101,637 103,133 67.0 66.2 9.4 9.6
GEORGIA 198,669 191,772 143,986 138,744 354,708 342,821 87,513 86,937 74.4 74.9 53.9 54.2
GUAM 1,020 953 433 386 4,833 4,868 1,634 1,697 31.9 30.1 13.5 12.2
HAWAII 27,630 26,563 11,578 11,207 52,677 50,263 19,835 18,968 84.1 84.9 35.3 35.8
IDAHO 60,850 58,426 18,001 17,049 91,722 90,221 24,914 25,235 91.1 89.9 26.9 26.2
ILLINOIS 143,562 138,167 35,396 35,998 384,467 364,677 119,118 112,251 54.1 54.7 13.3 14.3
INDIANA 151,381 149,272 36,515 37,003 244,183 236,820 72,197 70,624 88.0 89.8 21.2 22.3
IOWA 94,234 91,592 37,170 35,075 151,779 148,922 45,632 45,503 88.8 88.6 35.0 33.9
KANSAS 79,646 77,620 9,971 8,743 124,696 121,343 31,819 29,991 85.8 85.0 10.7 9.6
KENTUCKY 149,276 145,399 21,424 33,174 242,321 237,179 65,297 66,012 84.3 84.9 12.1 19.4
LOUISIANA 181,982 176,241 53,888 51,886 240,474 235,867 46,733 48,150 93.9 93.9 27.8 27.6
MAINE 23,873 23,187 2,628 2,339 42,043 40,851 17,340 16,875 96.6 96.7 10.6 9.8
MARYLAND 90,737 85,667 24,808 22,295 165,766 159,030 37,977 37,369 71.0 70.4 19.4 18.3
MASSACHUSETTS 95,440 88,224 46,796 37,959 187,846 179,349 38,802 38,630 64.0 62.7 31.4 27.0
MICHIGAN 445,176 436,978 322,259 317,805 654,079 642,177 187,476 172,655 95.4 93.1 69.1 67.7
MINNESOTA 121,379 118,055 49,957 48,829 187,963 183,148 27,868 28,064 75.8 76.1 31.2 31.5
MISSISSIPPI 84,182 84,722 13,832 15,070 225,055 225,220 29,894 31,430 43.1 43.7 7.1 7.8
MISSOURI 190,647 182,663 73,288 74,817 287,925 273,348 77,884 71,926 90.8 90.7 34.9 37.1
MONTANA 21,181 20,332 10,702 10,330 29,598 28,428 7,038 6,788 93.9 94.0 47.4 47.7
NEBRASKA 49,784 47,032 40,662 37,887 91,883 88,954 20,020 19,180 69.3 67.4 56.6 54.3
NEVADA 63,646 62,868 23,191 23,531 79,440 78,755 11,629 11,562 93.9 93.6 34.2 35.0
NEW HAMPSHIRE 28,535 23,810 20,540 18,364 30,883 30,855 6,731 6,693 118.1 98.5 85.0 76.0
NEW JERSEY 118,151 112,867 42,817 42,785 259,572 251,382 17,472 15,828 48.8 47.9 17.7 18.2
NEW MEXICO 32,372 31,915 8,636 8,623 51,647 51,437 13,885 14,156 85.7 85.6 22.9 23.1
NEW YORK 450,787 430,644 139,405 132,737 693,434 669,127 113,179 113,421 77.7 77.5 24.0 23.9
NORTH CAROLINA 226,890 222,759 185,578 181,442 342,806 336,571 77,241 76,660 85.4 85.7 69.9 69.8
NORTH DAKOTA 20,691 20,066 12,001 11,675 30,202 29,363 8,586 8,266 95.7 95.1 55.5 55.3
OHIO 473,388 463,056 169,711 164,435 739,068 728,577 181,873 185,512 85.0 85.3 30.5 30.3
OKLAHOMA 114,982 111,784 43,919 89,621 158,001 154,823 35,789 35,978 94.1 94.1 35.9 75.4
OREGON 82,181 100,535 32,027 29,273 142,823 143,299 51,776 22,272 90.3 83.1 35.2 24.2
PENNSYLVANIA 264,406 255,200 247,984 239,945 324,369 313,342 40,835 40,012 93.3 93.4 87.5 87.8
PUERTO RICO 53,967 56,380 3,186 3,775 182,825 178,209 52,572 56,580 41.4 46.4 2.4 3.1
RHODE ISLAND 33,384 37,075 31,624 35,264 36,434 36,691 11,477 10,327 133.8 140.6 126.7 133.8
SOUTH CAROLINA 80,008 3,828 736 109 150,894 144,953 50,540 39,008 79.7 3.6 0.7 0.1
SOUTH DAKOTA 25,324 23,874 11,778 19,748 38,501 36,955 10,867 10,218 91.6 89.3 42.6 73.9
TENNESSEE 186,426 181,517 35,466 36,754 307,202 295,564 94,105 92,008 87.5 89.2 16.6 18.1
TEXAS 931,705 869,613 604,999 561,739 1,325,717 1,339,587 321,381 330,294 92.8 86.2 60.2 55.7
UTAH 63,111 61,583 35,156 34,346 77,518 75,704 11,077 10,936 95.0 95.1 52.9 53.0
VERMONT 10,282 9,836 7,875 7,241 13,088 12,628 2,332 2,347 95.6 95.7 73.2 70.4
VIRGIN ISLANDS 1,878 1,728 642 580 6,220 6,241 2,515 2,568 50.7 47.0 17.3 15.8
VIRGINIA 167,187 163,600 43,443 41,885 263,693 258,417 84,562 85,139 93.3 94.4 24.3 24.2
WASHINGTON 160,717 154,448 32,073 28,779 294,589 286,749 119,781 118,380 91.9 91.7 18.3 17.1
WEST VIRGINIA 59,213 55,860 11,866 11,059 94,604 90,366 22,281 21,678 81.9 81.3 16.4 16.1
WISCONSIN 244,981 242,205 78,915 79,455 314,025 310,721 64,252 63,968 98.1 98.2 31.6 32.2
WYOMING 14,631 14,262 4,693 4,992 24,648 23,809 8,353 7,773 89.8 88.9 28.8 31.1
TOTALS 7,636,155 7,323,591 3,370,574 3,314,587 12,168,067 11,913,254 3,005,769 2,938,819 83.3% 81.6% 36.8% 36.9%
Source: Form OCSE-157,
Line 21 Line 21a Line 2 Line 2e Lines 21 / (2 - 2e) Lines 21a / (2 - 2e)1 Arrears only cases are subtracted from the number of cases with an order before percentages are determined.
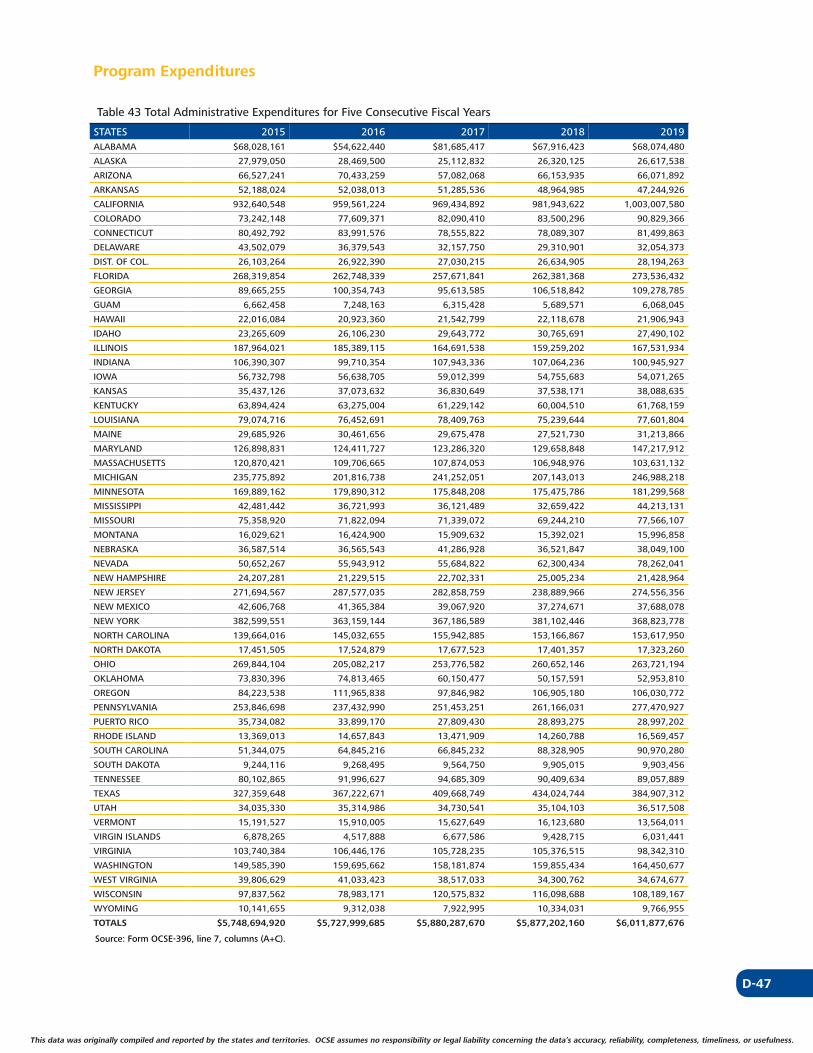
D-47
This data was originally compiled and reported by the states and territories. OCSE assumes no responsibility or legal liability concerning the data’s accuracy, reliability, completeness, timeliness, or usefulness. This data was originally compiled and reported by the states and territories. OCSE assumes no responsibility or legal liability concerning the data’s accuracy, reliability, completeness, timeliness, or usefulness.
Program Expenditures
Table 43 Total Administrative Expenditures for Five Consecutive Fiscal Years
STATES 2015 2016 2017 2018 2019ALABAMA $68,028,161 $54,622,440 $81,685,417 $67,916,423 $68,074,480
ALASKA 27,979,050 28,469,500 25,112,832 26,320,125 26,617,538
ARIZONA 66,527,241 70,433,259 57,082,068 66,153,935 66,071,892
ARKANSAS 52,188,024 52,038,013 51,285,536 48,964,985 47,244,926
CALIFORNIA 932,640,548 959,561,224 969,434,892 981,943,622 1,003,007,580
COLORADO 73,242,148 77,609,371 82,090,410 83,500,296 90,829,366
CONNECTICUT 80,492,792 83,991,576 78,555,822 78,089,307 81,499,863
DELAWARE 43,502,079 36,379,543 32,157,750 29,310,901 32,054,373
DIST. OF COL. 26,103,264 26,922,390 27,030,215 26,634,905 28,194,263
FLORIDA 268,319,854 262,748,339 257,671,841 262,381,368 273,536,432
GEORGIA 89,665,255 100,354,743 95,613,585 106,518,842 109,278,785
GUAM 6,662,458 7,248,163 6,315,428 5,689,571 6,068,045
HAWAII 22,016,084 20,923,360 21,542,799 22,118,678 21,906,943
IDAHO 23,265,609 26,106,230 29,643,772 30,765,691 27,490,102
ILLINOIS 187,964,021 185,389,115 164,691,538 159,259,202 167,531,934
INDIANA 106,390,307 99,710,354 107,943,336 107,064,236 100,945,927
IOWA 56,732,798 56,638,705 59,012,399 54,755,683 54,071,265
KANSAS 35,437,126 37,073,632 36,830,649 37,538,171 38,088,635
KENTUCKY 63,894,424 63,275,004 61,229,142 60,004,510 61,768,159
LOUISIANA 79,074,716 76,452,691 78,409,763 75,239,644 77,601,804
MAINE 29,685,926 30,461,656 29,675,478 27,521,730 31,213,866
MARYLAND 126,898,831 124,411,727 123,286,320 129,658,848 147,217,912
MASSACHUSETTS 120,870,421 109,706,665 107,874,053 106,948,976 103,631,132
MICHIGAN 235,775,892 201,816,738 241,252,051 207,143,013 246,988,218
MINNESOTA 169,889,162 179,890,312 175,848,208 175,475,786 181,299,568
MISSISSIPPI 42,481,442 36,721,993 36,121,489 32,659,422 44,213,131
MISSOURI 75,358,920 71,822,094 71,339,072 69,244,210 77,566,107
MONTANA 16,029,621 16,424,900 15,909,632 15,392,021 15,996,858
NEBRASKA 36,587,514 36,565,543 41,286,928 36,521,847 38,049,100
NEVADA 50,652,267 55,943,912 55,684,822 62,300,434 78,262,041
NEW HAMPSHIRE 24,207,281 21,229,515 22,702,331 25,005,234 21,428,964
NEW JERSEY 271,694,567 287,577,035 282,858,759 238,889,966 274,556,356
NEW MEXICO 42,606,768 41,365,384 39,067,920 37,274,671 37,688,078
NEW YORK 382,599,551 363,159,144 367,186,589 381,102,446 368,823,778
NORTH CAROLINA 139,664,016 145,032,655 155,942,885 153,166,867 153,617,950
NORTH DAKOTA 17,451,505 17,524,879 17,677,523 17,401,357 17,323,260
OHIO 269,844,104 205,082,217 253,776,582 260,652,146 263,721,194
OKLAHOMA 73,830,396 74,813,465 60,150,477 50,157,591 52,953,810
OREGON 84,223,538 111,965,838 97,846,982 106,905,180 106,030,772
PENNSYLVANIA 253,846,698 237,432,990 251,453,251 261,166,031 277,470,927
PUERTO RICO 35,734,082 33,899,170 27,809,430 28,893,275 28,997,202
RHODE ISLAND 13,369,013 14,657,843 13,471,909 14,260,788 16,569,457
SOUTH CAROLINA 51,344,075 64,845,216 66,845,232 88,328,905 90,970,280
SOUTH DAKOTA 9,244,116 9,268,495 9,564,750 9,905,015 9,903,456
TENNESSEE 80,102,865 91,996,627 94,685,309 90,409,634 89,057,889
TEXAS 327,359,648 367,222,671 409,668,749 434,024,744 384,907,312
UTAH 34,035,330 35,314,986 34,730,541 35,104,103 36,517,508
VERMONT 15,191,527 15,910,005 15,627,649 16,123,680 13,564,011
VIRGIN ISLANDS 6,878,265 4,517,888 6,677,586 9,428,715 6,031,441
VIRGINIA 103,740,384 106,446,176 105,728,235 105,376,515 98,342,310
WASHINGTON 149,585,390 159,695,662 158,181,874 159,855,434 164,450,677
WEST VIRGINIA 39,806,629 41,033,423 38,517,033 34,300,762 34,674,677
WISCONSIN 97,837,562 78,983,171 120,575,832 116,098,688 108,189,167
WYOMING 10,141,655 9,312,038 7,922,995 10,334,031 9,766,955
TOTALS $5,748,694,920 $5,727,999,685 $5,880,287,670 $5,877,202,160 $6,011,877,676
Source: Form OCSE-396, line 7, columns (A+C).

D-48
This data was originally compiled and reported by the states and territories. OCSE assumes no responsibility or legal liability concerning the data’s accuracy, reliability, completeness, timeliness, or usefulness.
Table 44 Federal Share of Administrative Expenditures for Five Consecutive Fiscal Years
STATES 2015 2016 2017 2018 2019ALABAMA $42,258,587 $33,410,809 $51,272,377 $42,184,841 $41,350,069
ALASKA 17,377,174 17,733,871 15,518,470 16,295,483 16,452,176
ARIZONA 42,534,411 39,476,809 33,544,068 40,119,700 39,153,510
ARKANSAS 30,977,810 30,753,324 30,272,328 28,475,284 27,900,461
CALIFORNIA 588,734,225 606,413,591 612,215,599 620,016,288 633,747,730
COLORADO 44,893,300 47,639,010 50,879,670 51,810,196 56,647,382
CONNECTICUT 50,221,242 52,530,440 48,942,841 48,634,943 50,885,910
DELAWARE 28,075,263 23,111,517 20,344,115 18,801,228 20,464,226
DIST. OF COL. 16,887,850 17,319,487 17,225,751 17,151,499 18,452,697
FLORIDA 156,410,689 150,927,764 147,564,073 149,358,952 156,420,997
GEORGIA 58,883,383 65,413,461 61,502,060 65,269,433 63,537,933
GUAM 4,354,972 4,782,834 4,168,181 3,736,546 3,994,725
HAWAII 14,408,275 12,893,472 13,328,663 13,551,456 13,622,355
IDAHO 13,426,459 15,192,200 17,470,239 18,084,078 15,922,188
ILLINOIS 114,157,509 112,312,803 98,664,776 100,122,379 98,101,780
INDIANA 64,950,071 59,784,386 65,476,782 65,112,500 60,629,758
IOWA 33,186,647 32,398,544 33,921,550 31,946,676 31,043,126
KANSAS 20,748,505 23,808,597 24,308,227 23,714,590 21,309,393
KENTUCKY 36,991,394 35,584,249 35,533,769 34,988,282 35,850,973
LOUISIANA 46,997,473 45,123,514 46,896,277 49,215,751 50,678,765
MAINE 17,682,384 18,594,509 18,157,151 17,494,070 19,987,928
MARYLAND 80,828,489 78,660,426 77,733,523 82,230,553 93,320,604
MASSACHUSETTS 70,003,562 63,446,404 61,478,787 62,586,435 61,137,835
MICHIGAN 138,331,830 115,446,587 141,725,907 119,075,440 145,260,796
MINNESOTA 104,252,432 110,747,462 108,044,828 107,894,018 111,999,174
MISSISSIPPI 28,037,754 13,509,769 16,083,270 21,555,219 29,180,666
MISSOURI 40,035,297 37,457,202 52,495,734 37,137,938 40,140,827
MONTANA 9,713,458 10,073,890 9,717,756 9,422,888 9,812,675
NEBRASKA 19,326,310 20,107,082 22,613,322 20,614,672 20,609,343
NEVADA 31,620,302 34,821,971 35,189,911 39,550,663 50,310,310
NEW HAMPSHIRE 14,133,978 12,979,964 13,966,132 14,818,313 11,927,441
NEW JERSEY 170,944,853 184,391,384 178,154,028 153,896,698 174,577,608
NEW MEXICO 27,917,857 26,317,599 23,730,978 24,589,487 24,818,118
NEW YORK 231,107,760 217,327,183 218,392,665 226,873,783 221,657,791
NORTH CAROLINA 83,873,142 87,372,279 91,653,052 94,115,990 95,065,320
NORTH DAKOTA 10,469,276 10,608,902 11,090,115 10,524,874 10,453,692
OHIO 160,043,530 116,872,930 150,846,385 154,845,279 156,349,683
OKLAHOMA 43,704,459 44,478,228 34,571,859 29,283,805 31,129,309
OREGON 51,394,408 70,660,734 60,873,048 66,295,902 65,589,997
PENNSYLVANIA 153,779,531 143,168,124 152,240,972 156,844,134 168,277,795
PUERTO RICO 23,243,774 21,385,442 17,920,366 15,713,912 16,951,659
RHODE ISLAND 8,031,550 8,766,675 7,954,260 8,461,718 9,985,441
SOUTH CAROLINA 33,361,558 42,123,608 43,015,745 57,095,570 54,406,972
SOUTH DAKOTA 4,787,476 4,784,665 4,951,047 5,192,611 5,180,037
TENNESSEE 52,867,893 60,717,775 62,476,683 59,450,574 58,512,357
TEXAS 166,285,572 193,705,963 221,174,960 230,640,439 197,978,298
UTAH 21,768,997 22,443,291 22,922,157 23,168,707 23,807,195
VERMONT 9,438,246 10,017,895 9,799,820 10,116,055 8,495,029
VIRGIN ISLANDS 4,539,655 2,981,805 4,407,207 4,633,962 3,980,752
VIRGINIA 60,566,527 62,833,715 62,784,155 61,355,603 56,186,536
WASHINGTON 89,684,357 96,926,435 96,612,037 97,584,584 100,434,022
WEST VIRGINIA 23,896,375 24,706,058 23,045,243 20,262,503 20,509,285
WISCONSIN 55,209,112 43,111,347 70,227,691 62,241,113 57,824,027
WYOMING 6,693,491 6,145,946 5,206,838 6,583,504 6,074,898
TOTALS $3,474,050,434 $3,444,303,931 $3,560,307,448 $3,550,741,121 $3,618,099,574
Source: Form OCSE-396, line 7, columns (B+D).

D-49
This data was originally compiled and reported by the states and territories. OCSE assumes no responsibility or legal liability concerning the data’s accuracy, reliability, completeness, timeliness, or usefulness. This data was originally compiled and reported by the states and territories. OCSE assumes no responsibility or legal liability concerning the data’s accuracy, reliability, completeness, timeliness, or usefulness.
Table 45 State Share of Administrative Expenditures for Five Consecutive Fiscal Years
STATES 2015 2016 2017 2018 2019ALABAMA $25,769,574 $21,211,631 $30,413,040 $25,731,582 $26,724,411
ALASKA 10,601,876 10,735,629 9,594,362 10,024,642 10,165,362
ARIZONA 23,992,830 30,956,450 23,538,000 26,034,235 26,918,382
ARKANSAS 21,210,214 21,284,689 21,013,208 20,489,701 19,344,465
CALIFORNIA 343,906,323 353,147,633 357,219,293 361,927,334 369,259,850
COLORADO 28,348,848 29,970,361 31,210,740 31,690,100 34,181,984
CONNECTICUT 30,271,550 31,461,136 29,612,981 29,454,364 30,613,953
DELAWARE 15,426,816 13,268,026 11,813,635 10,509,673 11,590,147
DIST. OF COL. 9,215,414 9,602,903 9,804,464 9,483,406 9,741,566
FLORIDA 111,909,165 111,820,575 110,107,768 113,022,416 117,115,435
GEORGIA 30,781,872 34,941,282 34,111,525 41,249,409 45,740,852
GUAM 2,307,486 2,465,329 2,147,247 1,953,025 2,073,320
HAWAII 7,607,809 8,029,888 8,214,136 8,567,222 8,284,588
IDAHO 9,839,150 10,914,030 12,173,533 12,681,613 11,567,914
ILLINOIS 73,806,512 73,076,312 66,026,762 59,136,823 69,430,154
INDIANA 41,440,236 39,925,968 42,466,554 41,951,736 40,316,169
IOWA 23,546,151 24,240,161 25,090,849 22,809,007 23,028,139
KANSAS 14,688,621 13,265,035 12,522,422 13,823,581 16,779,242
KENTUCKY 26,903,030 27,690,755 25,695,373 25,016,228 25,917,186
LOUISIANA 32,077,243 31,329,177 31,513,486 26,023,893 26,923,039
MAINE 12,003,542 11,867,147 11,518,327 10,027,660 11,225,938
MARYLAND 46,070,342 45,751,301 45,552,797 47,428,295 53,897,308
MASSACHUSETTS 50,866,859 46,260,261 46,395,266 44,362,541 42,493,297
MICHIGAN 97,444,062 86,370,151 99,526,144 88,067,573 101,727,422
MINNESOTA 65,636,730 69,142,850 67,803,380 67,581,768 69,300,394
MISSISSIPPI 14,443,688 23,212,224 20,038,219 11,104,203 15,032,465
MISSOURI 35,323,623 34,364,892 18,843,338 32,106,272 37,425,280
MONTANA 6,316,163 6,351,010 6,191,876 5,969,133 6,184,183
NEBRASKA 17,261,204 16,458,461 18,673,606 15,907,175 17,439,757
NEVADA 19,031,965 21,121,941 20,494,911 22,749,771 27,951,731
NEW HAMPSHIRE 10,073,303 8,249,551 8,736,199 10,186,921 9,501,523
NEW JERSEY 100,749,714 103,185,651 104,704,731 84,993,268 99,978,748
NEW MEXICO 14,688,911 15,047,785 15,336,942 12,685,184 12,869,960
NEW YORK 151,491,791 145,831,961 148,793,924 154,228,663 147,165,987
NORTH CAROLINA 55,790,874 57,660,376 64,289,833 59,050,877 58,552,630
NORTH DAKOTA 6,982,229 6,915,977 6,587,408 6,876,483 6,869,568
OHIO 109,800,574 88,209,287 102,930,197 105,806,867 107,371,511
OKLAHOMA 30,125,937 30,335,237 25,578,618 20,873,786 21,824,501
OREGON 32,829,130 41,305,104 36,973,934 40,609,278 40,440,775
PENNSYLVANIA 100,067,167 94,264,866 99,212,279 104,321,897 109,193,132
PUERTO RICO 12,490,308 12,513,728 9,889,064 13,179,363 12,045,543
RHODE ISLAND 5,337,463 5,891,168 5,517,649 5,799,070 6,584,016
SOUTH CAROLINA 17,982,517 22,721,608 23,829,487 31,233,335 36,563,308
SOUTH DAKOTA 4,456,640 4,483,830 4,613,703 4,712,404 4,723,419
TENNESSEE 27,234,972 31,278,852 32,208,626 30,959,060 30,545,532
TEXAS 161,074,076 173,516,708 188,493,789 203,384,305 186,929,014
UTAH 12,266,333 12,871,695 11,808,384 11,935,396 12,710,313
VERMONT 5,753,281 5,892,110 5,827,829 6,007,625 5,068,982
VIRGIN ISLANDS 2,338,610 1,536,083 2,270,379 4,794,753 2,050,689
VIRGINIA 43,173,857 43,612,461 42,944,080 44,020,912 42,155,774
WASHINGTON 59,901,033 62,769,227 61,569,837 62,270,850 64,016,655
WEST VIRGINIA 15,910,254 16,327,365 15,471,790 14,038,259 14,165,392
WISCONSIN 42,628,450 35,871,824 50,348,141 53,857,575 50,365,140
WYOMING 3,448,164 3,166,092 2,716,157 3,750,527 3,692,057
TOTALS $2,274,644,486 $2,283,695,754 $2,319,980,222 $2,326,461,039 $2,393,778,102
Source: Form OCSE-396, line 7, columns (A+C) - line 7, columns (B+D).
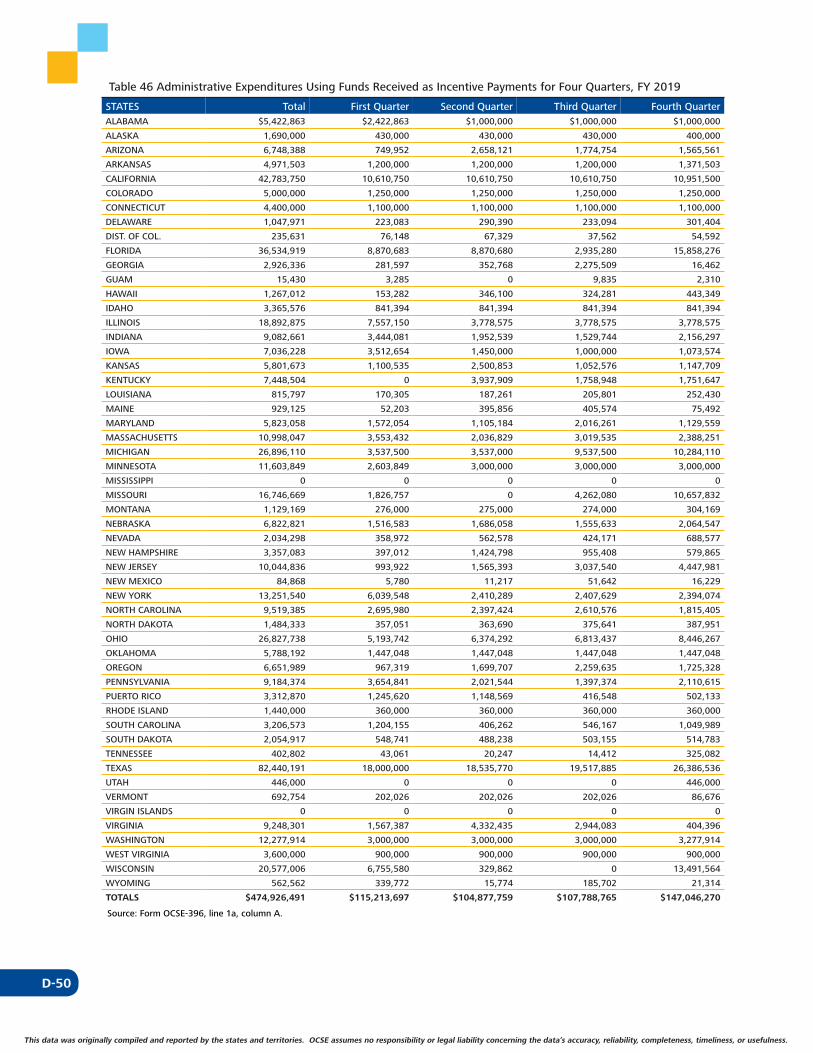
D-50
This data was originally compiled and reported by the states and territories. OCSE assumes no responsibility or legal liability concerning the data’s accuracy, reliability, completeness, timeliness, or usefulness.
Table 46 Administrative Expenditures Using Funds Received as Incentive Payments for Four Quarters, FY 2019
STATES Total First Quarter Second Quarter Third Quarter Fourth QuarterALABAMA $5,422,863 $2,422,863 $1,000,000 $1,000,000 $1,000,000
ALASKA 1,690,000 430,000 430,000 430,000 400,000
ARIZONA 6,748,388 749,952 2,658,121 1,774,754 1,565,561
ARKANSAS 4,971,503 1,200,000 1,200,000 1,200,000 1,371,503
CALIFORNIA 42,783,750 10,610,750 10,610,750 10,610,750 10,951,500
COLORADO 5,000,000 1,250,000 1,250,000 1,250,000 1,250,000
CONNECTICUT 4,400,000 1,100,000 1,100,000 1,100,000 1,100,000
DELAWARE 1,047,971 223,083 290,390 233,094 301,404
DIST. OF COL. 235,631 76,148 67,329 37,562 54,592
FLORIDA 36,534,919 8,870,683 8,870,680 2,935,280 15,858,276
GEORGIA 2,926,336 281,597 352,768 2,275,509 16,462
GUAM 15,430 3,285 0 9,835 2,310
HAWAII 1,267,012 153,282 346,100 324,281 443,349
IDAHO 3,365,576 841,394 841,394 841,394 841,394
ILLINOIS 18,892,875 7,557,150 3,778,575 3,778,575 3,778,575
INDIANA 9,082,661 3,444,081 1,952,539 1,529,744 2,156,297
IOWA 7,036,228 3,512,654 1,450,000 1,000,000 1,073,574
KANSAS 5,801,673 1,100,535 2,500,853 1,052,576 1,147,709
KENTUCKY 7,448,504 0 3,937,909 1,758,948 1,751,647
LOUISIANA 815,797 170,305 187,261 205,801 252,430
MAINE 929,125 52,203 395,856 405,574 75,492
MARYLAND 5,823,058 1,572,054 1,105,184 2,016,261 1,129,559
MASSACHUSETTS 10,998,047 3,553,432 2,036,829 3,019,535 2,388,251
MICHIGAN 26,896,110 3,537,500 3,537,000 9,537,500 10,284,110
MINNESOTA 11,603,849 2,603,849 3,000,000 3,000,000 3,000,000
MISSISSIPPI 0 0 0 0 0
MISSOURI 16,746,669 1,826,757 0 4,262,080 10,657,832
MONTANA 1,129,169 276,000 275,000 274,000 304,169
NEBRASKA 6,822,821 1,516,583 1,686,058 1,555,633 2,064,547
NEVADA 2,034,298 358,972 562,578 424,171 688,577
NEW HAMPSHIRE 3,357,083 397,012 1,424,798 955,408 579,865
NEW JERSEY 10,044,836 993,922 1,565,393 3,037,540 4,447,981
NEW MEXICO 84,868 5,780 11,217 51,642 16,229
NEW YORK 13,251,540 6,039,548 2,410,289 2,407,629 2,394,074
NORTH CAROLINA 9,519,385 2,695,980 2,397,424 2,610,576 1,815,405
NORTH DAKOTA 1,484,333 357,051 363,690 375,641 387,951
OHIO 26,827,738 5,193,742 6,374,292 6,813,437 8,446,267
OKLAHOMA 5,788,192 1,447,048 1,447,048 1,447,048 1,447,048
OREGON 6,651,989 967,319 1,699,707 2,259,635 1,725,328
PENNSYLVANIA 9,184,374 3,654,841 2,021,544 1,397,374 2,110,615
PUERTO RICO 3,312,870 1,245,620 1,148,569 416,548 502,133
RHODE ISLAND 1,440,000 360,000 360,000 360,000 360,000
SOUTH CAROLINA 3,206,573 1,204,155 406,262 546,167 1,049,989
SOUTH DAKOTA 2,054,917 548,741 488,238 503,155 514,783
TENNESSEE 402,802 43,061 20,247 14,412 325,082
TEXAS 82,440,191 18,000,000 18,535,770 19,517,885 26,386,536
UTAH 446,000 0 0 0 446,000
VERMONT 692,754 202,026 202,026 202,026 86,676
VIRGIN ISLANDS 0 0 0 0 0
VIRGINIA 9,248,301 1,567,387 4,332,435 2,944,083 404,396
WASHINGTON 12,277,914 3,000,000 3,000,000 3,000,000 3,277,914
WEST VIRGINIA 3,600,000 900,000 900,000 900,000 900,000
WISCONSIN 20,577,006 6,755,580 329,862 0 13,491,564
WYOMING 562,562 339,772 15,774 185,702 21,314
TOTALS $474,926,491 $115,213,697 $104,877,759 $107,788,765 $147,046,270
Source: Form OCSE-396, line 1a, column A.

D-51
This data was originally compiled and reported by the states and territories. OCSE assumes no responsibility or legal liability concerning the data’s accuracy, reliability, completeness, timeliness, or usefulness. This data was originally compiled and reported by the states and territories. OCSE assumes no responsibility or legal liability concerning the data’s accuracy, reliability, completeness, timeliness, or usefulness.
Table 47 Non-IV-D Costs for Five Consecutive Fiscal Years
STATES 2015 2016 2017 2018 2019ALABAMA $704,906 $646,583 $672,792 $704,730 $688,248
ALASKA 0 0 0 0 0
ARIZONA 1,081,966 689,622 794,443 807,721 764,536
ARKANSAS 513,324 440,818 430,781 361,170 281,850
CALIFORNIA 441,477 429,659 330,362 278,626 281,159
COLORADO 0 0 0 0 0
CONNECTICUT 0 0 0 0 0
DELAWARE 37,318 35,434 34,101 32,582 31,895
DIST. OF COL. 0 0 0 0 0
FLORIDA 1,989,757 2,271,524 1,806,210 1,476,979 1,385,168
GEORGIA 0 0 0 0 0
GUAM 1,740 691 524 -3,799 562
HAWAII 599,442 -641,481 21,393 28,612 -12,646
IDAHO 0 0 0 0 0
ILLINOIS 1,665,479 1,742,503 1,201,707 1,373,341 1,404,189
INDIANA 353,291 182,373 167,221 148,279 142,067
IOWA 52,640 50,517 51,958 48,875 45,258
KANSAS 1,197,595 1,142,160 1,075,159 984,128 805,898
KENTUCKY 166,061 115,393 110,442 98,953 119,218
LOUISIANA 14,951 15,296 15,606 14,630 13,379
MAINE 7,636 -60,707 71,551 4,558 3,209
MARYLAND 37,264 31,330 31,170 25,762 13,597
MASSACHUSETTS 6,682 6,221 4,047 1,728 981
MICHIGAN 0 0 0 0 0
MINNESOTA 0 0 0 0 0
MISSISSIPPI 0 0 0 0 0
MISSOURI 157,132 179,593 175,560 153,679 194,588
MONTANA 0 0 0 0 0
NEBRASKA 106,190 116,079 100,370 87,549 79,202
NEVADA 199,032 201,784 283,373 253,657 337,703
NEW HAMPSHIRE 0 0 0 0 0
NEW JERSEY 878,302 937,467 1,038,836 681,874 917,680
NEW MEXICO 432,061 975,641 1,357,108 240,472 784,029
NEW YORK 0 0 0 0 0
NORTH CAROLINA 126,374 132,556 112,865 166,232 136,096
NORTH DAKOTA 361,329 432,799 482,403 560,600 647,743
OHIO 0 0 0 0 0
OKLAHOMA 76,317 76,360 74,984 75,522 73,969
OREGON 0 0 0 0 0
PENNSYLVANIA 134,405 93,359 117,647 104,750 105,620
PUERTO RICO 0 0 0 0 0
RHODE ISLAND 0 0 0 0 0
SOUTH CAROLINA 0 0 0 0 0
SOUTH DAKOTA 0 0 0 0 0
TENNESSEE 0 0 0 0 0
TEXAS 1,151,948 1,002,862 830,301 783,928 829,926
UTAH 20 19 61 495 667
VERMONT 0 0 0 0 0
VIRGIN ISLANDS 0 0 0 0 0
VIRGINIA 147,598 110,953 140,264 176,899 190,483
WASHINGTON 0 0 0 0 0
WEST VIRGINIA 0 0 0 0 0
WISCONSIN 471,290 156,266 901,678 459,000 469,618
WYOMING 0 0 0 0 0
TOTALS $13,113,527 $11,513,674 $12,434,917 $10,131,532 $10,735,892
Source: Form OCSE-396, line 1c, columns (A+C).
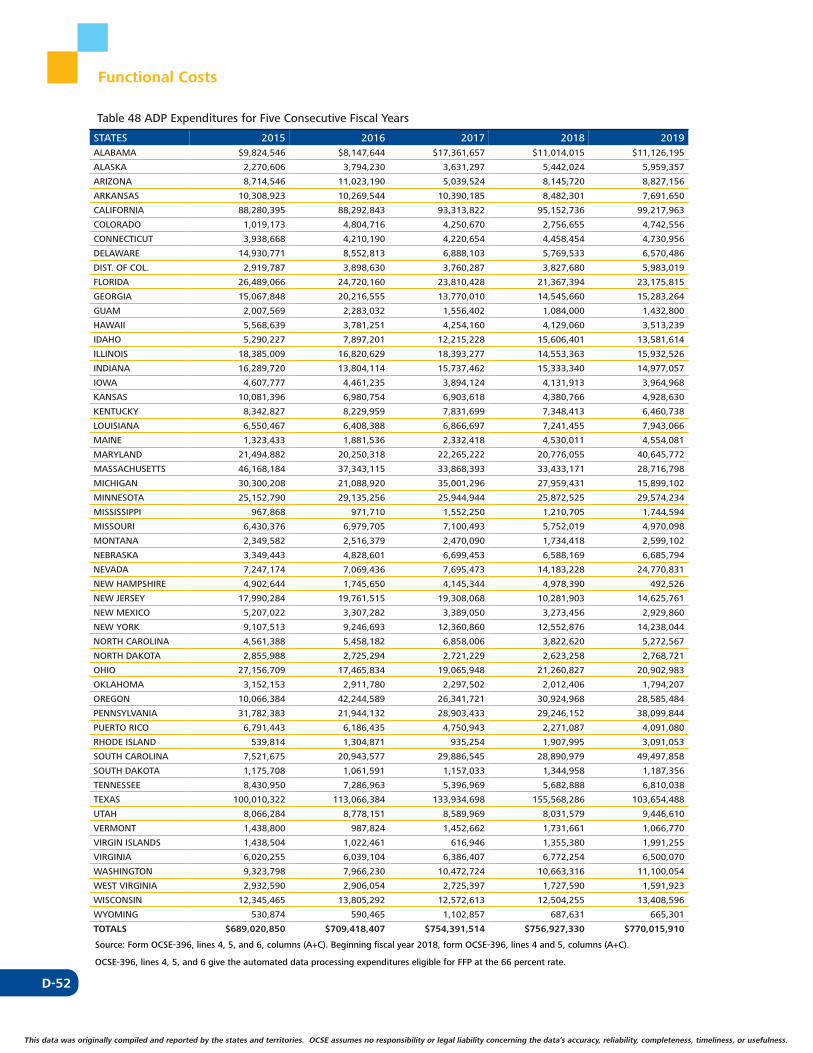
D-52
This data was originally compiled and reported by the states and territories. OCSE assumes no responsibility or legal liability concerning the data’s accuracy, reliability, completeness, timeliness, or usefulness.
Functional Costs
Table 48 ADP Expenditures for Five Consecutive Fiscal Years
STATES 2015 2016 2017 2018 2019ALABAMA $9,824,546 $8,147,644 $17,361,657 $11,014,015 $11,126,195
ALASKA 2,270,606 3,794,230 3,631,297 5,442,024 5,959,357
ARIZONA 8,714,546 11,023,190 5,039,524 8,145,720 8,827,156
ARKANSAS 10,308,923 10,269,544 10,390,185 8,482,301 7,691,650
CALIFORNIA 88,280,395 88,292,843 93,313,822 95,152,736 99,217,963
COLORADO 1,019,173 4,804,716 4,250,670 2,756,655 4,742,556
CONNECTICUT 3,938,668 4,210,190 4,220,654 4,458,454 4,730,956
DELAWARE 14,930,771 8,552,813 6,888,103 5,769,533 6,570,486
DIST. OF COL. 2,919,787 3,898,630 3,760,287 3,827,680 5,983,019
FLORIDA 26,489,066 24,720,160 23,810,428 21,367,394 23,175,815
GEORGIA 15,067,848 20,216,555 13,770,010 14,545,660 15,283,264
GUAM 2,007,569 2,283,032 1,556,402 1,084,000 1,432,800
HAWAII 5,568,639 3,781,251 4,254,160 4,129,060 3,513,239
IDAHO 5,290,227 7,897,201 12,215,228 15,606,401 13,581,614
ILLINOIS 18,385,009 16,820,629 18,393,277 14,553,363 15,932,526
INDIANA 16,289,720 13,804,114 15,737,462 15,333,340 14,977,057
IOWA 4,607,777 4,461,235 3,894,124 4,131,913 3,964,968
KANSAS 10,081,396 6,980,754 6,903,618 4,380,766 4,928,630
KENTUCKY 8,342,827 8,229,959 7,831,699 7,348,413 6,460,738
LOUISIANA 6,550,467 6,408,388 6,866,697 7,241,455 7,943,066
MAINE 1,323,433 1,881,536 2,332,418 4,530,011 4,554,081
MARYLAND 21,494,882 20,250,318 22,265,222 20,776,055 40,645,772
MASSACHUSETTS 46,168,184 37,343,115 33,868,393 33,433,171 28,716,798
MICHIGAN 30,300,208 21,088,920 35,001,296 27,959,431 15,899,102
MINNESOTA 25,152,790 29,135,256 25,944,944 25,872,525 29,574,234
MISSISSIPPI 967,868 971,710 1,552,250 1,210,705 1,744,594
MISSOURI 6,430,376 6,979,705 7,100,493 5,752,019 4,970,098
MONTANA 2,349,582 2,516,379 2,470,090 1,734,418 2,599,102
NEBRASKA 3,349,443 4,828,601 6,699,453 6,588,169 6,685,794
NEVADA 7,247,174 7,069,436 7,695,473 14,183,228 24,770,831
NEW HAMPSHIRE 4,902,644 1,745,650 4,145,344 4,978,390 492,526
NEW JERSEY 17,990,284 19,761,515 19,308,068 10,281,903 14,625,761
NEW MEXICO 5,207,022 3,307,282 3,389,050 3,273,456 2,929,860
NEW YORK 9,107,513 9,246,693 12,360,860 12,552,876 14,238,044
NORTH CAROLINA 4,561,388 5,458,182 6,858,006 3,822,620 5,272,567
NORTH DAKOTA 2,855,988 2,725,294 2,721,229 2,623,258 2,768,721
OHIO 27,156,709 17,465,834 19,065,948 21,260,827 20,902,983
OKLAHOMA 3,152,153 2,911,780 2,297,502 2,012,406 1,794,207
OREGON 10,066,384 42,244,589 26,341,721 30,924,968 28,585,484
PENNSYLVANIA 31,782,383 21,944,132 28,903,433 29,246,152 38,099,844
PUERTO RICO 6,791,443 6,186,435 4,750,943 2,271,087 4,091,080
RHODE ISLAND 539,814 1,304,871 935,254 1,907,995 3,091,053
SOUTH CAROLINA 7,521,675 20,943,577 29,886,545 28,890,979 49,497,858
SOUTH DAKOTA 1,175,708 1,061,591 1,157,033 1,344,958 1,187,356
TENNESSEE 8,430,950 7,286,963 5,396,969 5,682,888 6,810,038
TEXAS 100,010,322 113,066,384 133,934,698 155,568,286 103,654,488
UTAH 8,066,284 8,778,151 8,589,969 8,031,579 9,446,610
VERMONT 1,438,800 987,824 1,452,662 1,731,661 1,066,770
VIRGIN ISLANDS 1,438,504 1,022,461 616,946 1,355,380 1,991,255
VIRGINIA 6,020,255 6,039,104 6,386,407 6,772,254 6,500,070
WASHINGTON 9,323,798 7,966,230 10,472,724 10,663,316 11,100,054
WEST VIRGINIA 2,932,590 2,906,054 2,725,397 1,727,590 1,591,923
WISCONSIN 12,345,465 13,805,292 12,572,613 12,504,255 13,408,596
WYOMING 530,874 590,465 1,102,857 687,631 665,301
TOTALS $689,020,850 $709,418,407 $754,391,514 $756,927,330 $770,015,910
Source: Form OCSE-396, lines 4, 5, and 6, columns (A+C). Beginning fiscal year 2018, form OCSE-396, lines 4 and 5, columns (A+C).
OCSE-396, lines 4, 5, and 6 give the automated data processing expenditures eligible for FFP at the 66 percent rate.
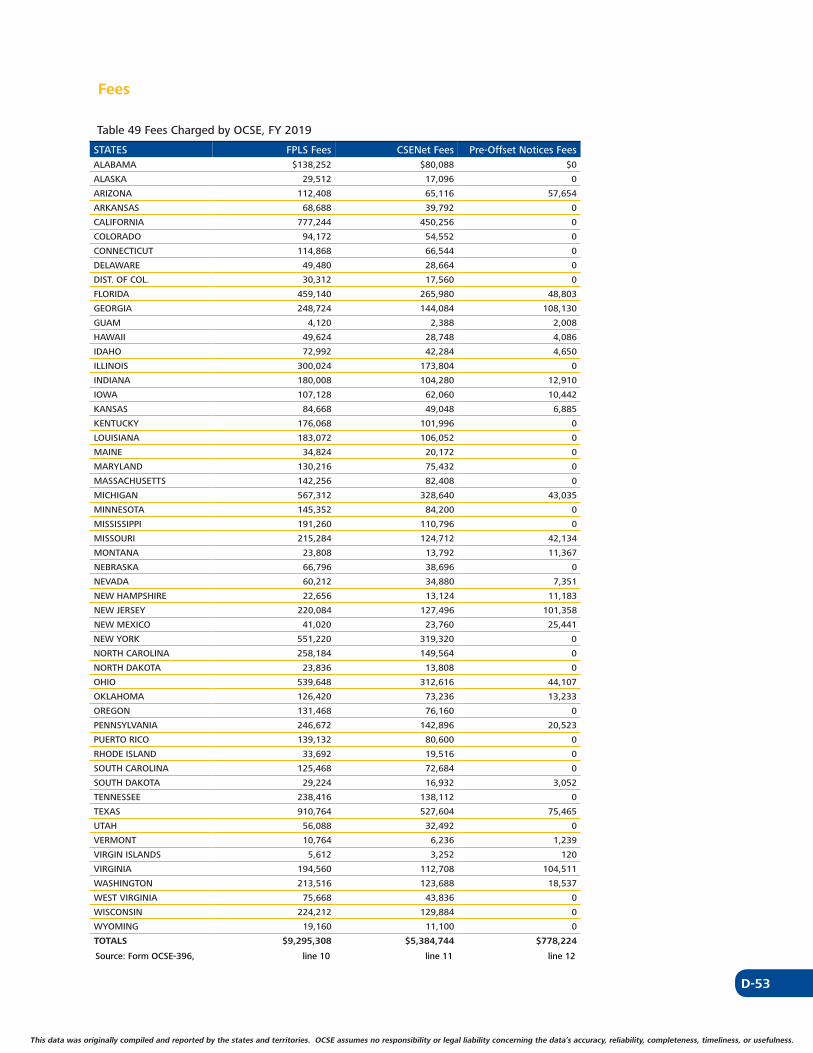
D-53
This data was originally compiled and reported by the states and territories. OCSE assumes no responsibility or legal liability concerning the data’s accuracy, reliability, completeness, timeliness, or usefulness. This data was originally compiled and reported by the states and territories. OCSE assumes no responsibility or legal liability concerning the data’s accuracy, reliability, completeness, timeliness, or usefulness.
Fees
Table 49 Fees Charged by OCSE, FY 2019
STATES FPLS Fees CSENet Fees Pre-Offset Notices FeesALABAMA $138,252 $80,088 $0
ALASKA 29,512 17,096 0
ARIZONA 112,408 65,116 57,654
ARKANSAS 68,688 39,792 0
CALIFORNIA 777,244 450,256 0
COLORADO 94,172 54,552 0
CONNECTICUT 114,868 66,544 0
DELAWARE 49,480 28,664 0
DIST. OF COL. 30,312 17,560 0
FLORIDA 459,140 265,980 48,803
GEORGIA 248,724 144,084 108,130
GUAM 4,120 2,388 2,008
HAWAII 49,624 28,748 4,086
IDAHO 72,992 42,284 4,650
ILLINOIS 300,024 173,804 0
INDIANA 180,008 104,280 12,910
IOWA 107,128 62,060 10,442
KANSAS 84,668 49,048 6,885
KENTUCKY 176,068 101,996 0
LOUISIANA 183,072 106,052 0
MAINE 34,824 20,172 0
MARYLAND 130,216 75,432 0
MASSACHUSETTS 142,256 82,408 0
MICHIGAN 567,312 328,640 43,035
MINNESOTA 145,352 84,200 0
MISSISSIPPI 191,260 110,796 0
MISSOURI 215,284 124,712 42,134
MONTANA 23,808 13,792 11,367
NEBRASKA 66,796 38,696 0
NEVADA 60,212 34,880 7,351
NEW HAMPSHIRE 22,656 13,124 11,183
NEW JERSEY 220,084 127,496 101,358
NEW MEXICO 41,020 23,760 25,441
NEW YORK 551,220 319,320 0
NORTH CAROLINA 258,184 149,564 0
NORTH DAKOTA 23,836 13,808 0
OHIO 539,648 312,616 44,107
OKLAHOMA 126,420 73,236 13,233
OREGON 131,468 76,160 0
PENNSYLVANIA 246,672 142,896 20,523
PUERTO RICO 139,132 80,600 0
RHODE ISLAND 33,692 19,516 0
SOUTH CAROLINA 125,468 72,684 0
SOUTH DAKOTA 29,224 16,932 3,052
TENNESSEE 238,416 138,112 0
TEXAS 910,764 527,604 75,465
UTAH 56,088 32,492 0
VERMONT 10,764 6,236 1,239
VIRGIN ISLANDS 5,612 3,252 120
VIRGINIA 194,560 112,708 104,511
WASHINGTON 213,516 123,688 18,537
WEST VIRGINIA 75,668 43,836 0
WISCONSIN 224,212 129,884 0
WYOMING 19,160 11,100 0
TOTALS $9,295,308 $5,384,744 $778,224
Source: Form OCSE-396, line 10 line 11 line 12
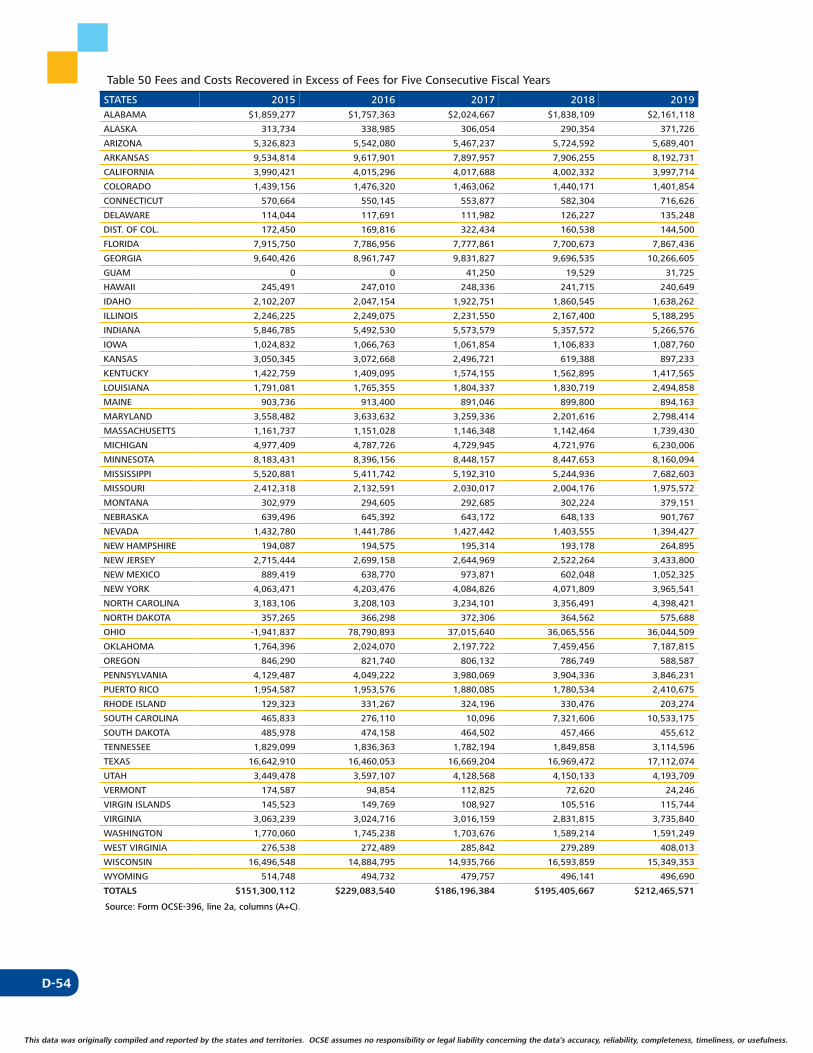
D-54
This data was originally compiled and reported by the states and territories. OCSE assumes no responsibility or legal liability concerning the data’s accuracy, reliability, completeness, timeliness, or usefulness.
Table 50 Fees and Costs Recovered in Excess of Fees for Five Consecutive Fiscal Years
STATES 2015 2016 2017 2018 2019ALABAMA $1,859,277 $1,757,363 $2,024,667 $1,838,109 $2,161,118
ALASKA 313,734 338,985 306,054 290,354 371,726
ARIZONA 5,326,823 5,542,080 5,467,237 5,724,592 5,689,401
ARKANSAS 9,534,814 9,617,901 7,897,957 7,906,255 8,192,731
CALIFORNIA 3,990,421 4,015,296 4,017,688 4,002,332 3,997,714
COLORADO 1,439,156 1,476,320 1,463,062 1,440,171 1,401,854
CONNECTICUT 570,664 550,145 553,877 582,304 716,626
DELAWARE 114,044 117,691 111,982 126,227 135,248
DIST. OF COL. 172,450 169,816 322,434 160,538 144,500
FLORIDA 7,915,750 7,786,956 7,777,861 7,700,673 7,867,436
GEORGIA 9,640,426 8,961,747 9,831,827 9,696,535 10,266,605
GUAM 0 0 41,250 19,529 31,725
HAWAII 245,491 247,010 248,336 241,715 240,649
IDAHO 2,102,207 2,047,154 1,922,751 1,860,545 1,638,262
ILLINOIS 2,246,225 2,249,075 2,231,550 2,167,400 5,188,295
INDIANA 5,846,785 5,492,530 5,573,579 5,357,572 5,266,576
IOWA 1,024,832 1,066,763 1,061,854 1,106,833 1,087,760
KANSAS 3,050,345 3,072,668 2,496,721 619,388 897,233
KENTUCKY 1,422,759 1,409,095 1,574,155 1,562,895 1,417,565
LOUISIANA 1,791,081 1,765,355 1,804,337 1,830,719 2,494,858
MAINE 903,736 913,400 891,046 899,800 894,163
MARYLAND 3,558,482 3,633,632 3,259,336 2,201,616 2,798,414
MASSACHUSETTS 1,161,737 1,151,028 1,146,348 1,142,464 1,739,430
MICHIGAN 4,977,409 4,787,726 4,729,945 4,721,976 6,230,006
MINNESOTA 8,183,431 8,396,156 8,448,157 8,447,653 8,160,094
MISSISSIPPI 5,520,881 5,411,742 5,192,310 5,244,936 7,682,603
MISSOURI 2,412,318 2,132,591 2,030,017 2,004,176 1,975,572
MONTANA 302,979 294,605 292,685 302,224 379,151
NEBRASKA 639,496 645,392 643,172 648,133 901,767
NEVADA 1,432,780 1,441,786 1,427,442 1,403,555 1,394,427
NEW HAMPSHIRE 194,087 194,575 195,314 193,178 264,895
NEW JERSEY 2,715,444 2,699,158 2,644,969 2,522,264 3,433,800
NEW MEXICO 889,419 638,770 973,871 602,048 1,052,325
NEW YORK 4,063,471 4,203,476 4,084,826 4,071,809 3,965,541
NORTH CAROLINA 3,183,106 3,208,103 3,234,101 3,356,491 4,398,421
NORTH DAKOTA 357,265 366,298 372,306 364,562 575,688
OHIO -1,941,837 78,790,893 37,015,640 36,065,556 36,044,509
OKLAHOMA 1,764,396 2,024,070 2,197,722 7,459,456 7,187,815
OREGON 846,290 821,740 806,132 786,749 588,587
PENNSYLVANIA 4,129,487 4,049,222 3,980,069 3,904,336 3,846,231
PUERTO RICO 1,954,587 1,953,576 1,880,085 1,780,534 2,410,675
RHODE ISLAND 129,323 331,267 324,196 330,476 203,274
SOUTH CAROLINA 465,833 276,110 10,096 7,321,606 10,533,175
SOUTH DAKOTA 485,978 474,158 464,502 457,466 455,612
TENNESSEE 1,829,099 1,836,363 1,782,194 1,849,858 3,114,596
TEXAS 16,642,910 16,460,053 16,669,204 16,969,472 17,112,074
UTAH 3,449,478 3,597,107 4,128,568 4,150,133 4,193,709
VERMONT 174,587 94,854 112,825 72,620 24,246
VIRGIN ISLANDS 145,523 149,769 108,927 105,516 115,744
VIRGINIA 3,063,239 3,024,716 3,016,159 2,831,815 3,735,840
WASHINGTON 1,770,060 1,745,238 1,703,676 1,589,214 1,591,249
WEST VIRGINIA 276,538 272,489 285,842 279,289 408,013
WISCONSIN 16,496,548 14,884,795 14,935,766 16,593,859 15,349,353
WYOMING 514,748 494,732 479,757 496,141 496,690
TOTALS $151,300,112 $229,083,540 $186,196,384 $195,405,667 $212,465,571
Source: Form OCSE-396, line 2a, columns (A+C).
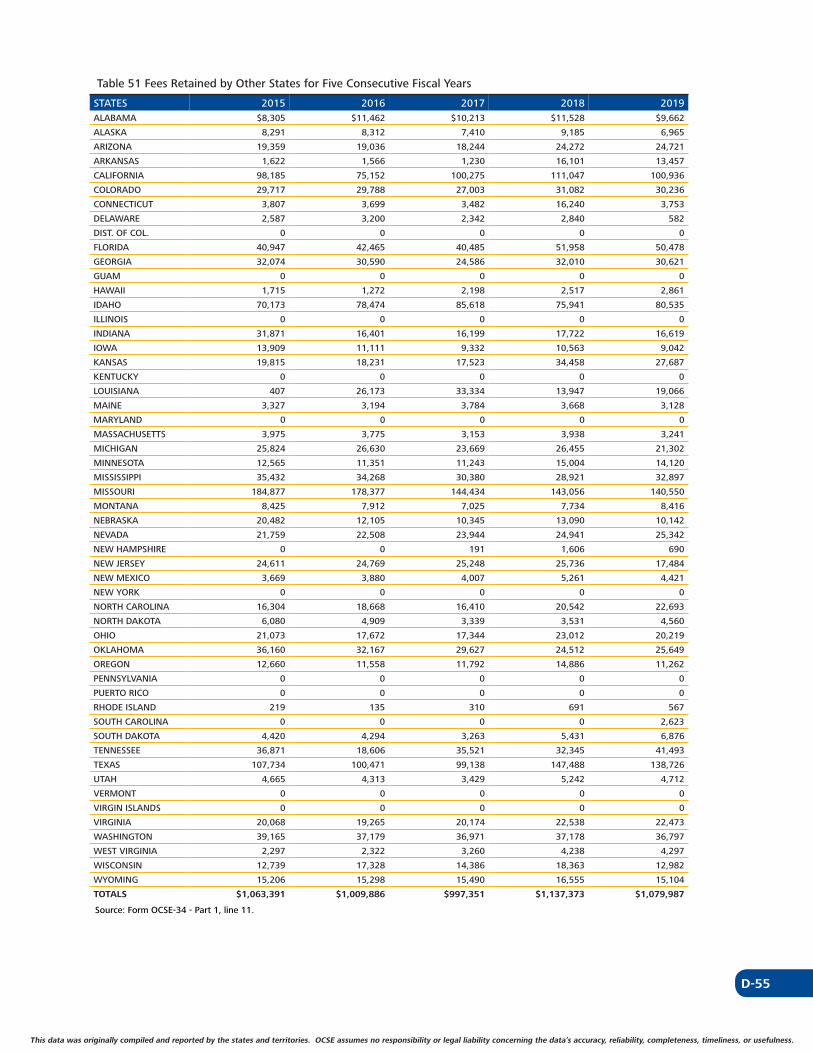
D-55
This data was originally compiled and reported by the states and territories. OCSE assumes no responsibility or legal liability concerning the data’s accuracy, reliability, completeness, timeliness, or usefulness. This data was originally compiled and reported by the states and territories. OCSE assumes no responsibility or legal liability concerning the data’s accuracy, reliability, completeness, timeliness, or usefulness.
Table 51 Fees Retained by Other States for Five Consecutive Fiscal Years
STATES 2015 2016 2017 2018 2019ALABAMA $8,305 $11,462 $10,213 $11,528 $9,662
ALASKA 8,291 8,312 7,410 9,185 6,965
ARIZONA 19,359 19,036 18,244 24,272 24,721
ARKANSAS 1,622 1,566 1,230 16,101 13,457
CALIFORNIA 98,185 75,152 100,275 111,047 100,936
COLORADO 29,717 29,788 27,003 31,082 30,236
CONNECTICUT 3,807 3,699 3,482 16,240 3,753
DELAWARE 2,587 3,200 2,342 2,840 582
DIST. OF COL. 0 0 0 0 0
FLORIDA 40,947 42,465 40,485 51,958 50,478
GEORGIA 32,074 30,590 24,586 32,010 30,621
GUAM 0 0 0 0 0
HAWAII 1,715 1,272 2,198 2,517 2,861
IDAHO 70,173 78,474 85,618 75,941 80,535
ILLINOIS 0 0 0 0 0
INDIANA 31,871 16,401 16,199 17,722 16,619
IOWA 13,909 11,111 9,332 10,563 9,042
KANSAS 19,815 18,231 17,523 34,458 27,687
KENTUCKY 0 0 0 0 0
LOUISIANA 407 26,173 33,334 13,947 19,066
MAINE 3,327 3,194 3,784 3,668 3,128
MARYLAND 0 0 0 0 0
MASSACHUSETTS 3,975 3,775 3,153 3,938 3,241
MICHIGAN 25,824 26,630 23,669 26,455 21,302
MINNESOTA 12,565 11,351 11,243 15,004 14,120
MISSISSIPPI 35,432 34,268 30,380 28,921 32,897
MISSOURI 184,877 178,377 144,434 143,056 140,550
MONTANA 8,425 7,912 7,025 7,734 8,416
NEBRASKA 20,482 12,105 10,345 13,090 10,142
NEVADA 21,759 22,508 23,944 24,941 25,342
NEW HAMPSHIRE 0 0 191 1,606 690
NEW JERSEY 24,611 24,769 25,248 25,736 17,484
NEW MEXICO 3,669 3,880 4,007 5,261 4,421
NEW YORK 0 0 0 0 0
NORTH CAROLINA 16,304 18,668 16,410 20,542 22,693
NORTH DAKOTA 6,080 4,909 3,339 3,531 4,560
OHIO 21,073 17,672 17,344 23,012 20,219
OKLAHOMA 36,160 32,167 29,627 24,512 25,649
OREGON 12,660 11,558 11,792 14,886 11,262
PENNSYLVANIA 0 0 0 0 0
PUERTO RICO 0 0 0 0 0
RHODE ISLAND 219 135 310 691 567
SOUTH CAROLINA 0 0 0 0 2,623
SOUTH DAKOTA 4,420 4,294 3,263 5,431 6,876
TENNESSEE 36,871 18,606 35,521 32,345 41,493
TEXAS 107,734 100,471 99,138 147,488 138,726
UTAH 4,665 4,313 3,429 5,242 4,712
VERMONT 0 0 0 0 0
VIRGIN ISLANDS 0 0 0 0 0
VIRGINIA 20,068 19,265 20,174 22,538 22,473
WASHINGTON 39,165 37,179 36,971 37,178 36,797
WEST VIRGINIA 2,297 2,322 3,260 4,238 4,297
WISCONSIN 12,739 17,328 14,386 18,363 12,982
WYOMING 15,206 15,298 15,490 16,555 15,104
TOTALS $1,063,391 $1,009,886 $997,351 $1,137,373 $1,079,987
Source: Form OCSE-34 - Part 1, line 11.
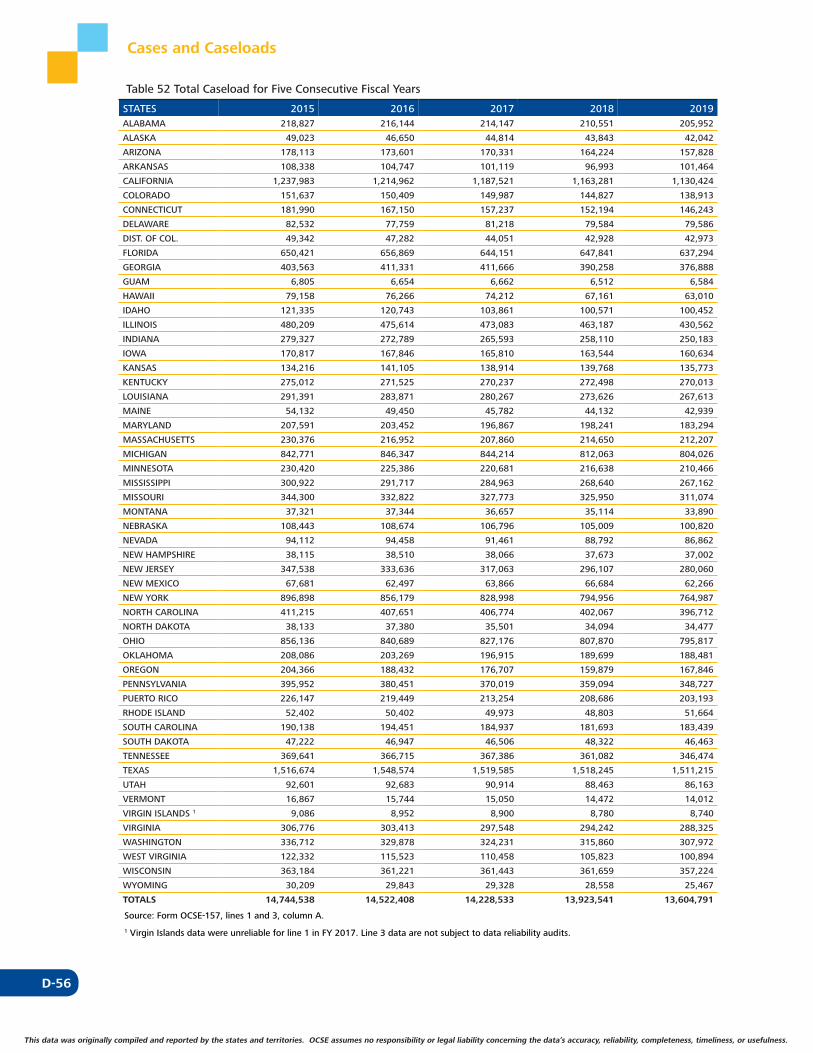
D-56
This data was originally compiled and reported by the states and territories. OCSE assumes no responsibility or legal liability concerning the data’s accuracy, reliability, completeness, timeliness, or usefulness.
Cases and Caseloads
Table 52 Total Caseload for Five Consecutive Fiscal Years
STATES 2015 2016 2017 2018 2019ALABAMA 218,827 216,144 214,147 210,551 205,952
ALASKA 49,023 46,650 44,814 43,843 42,042
ARIZONA 178,113 173,601 170,331 164,224 157,828
ARKANSAS 108,338 104,747 101,119 96,993 101,464
CALIFORNIA 1,237,983 1,214,962 1,187,521 1,163,281 1,130,424
COLORADO 151,637 150,409 149,987 144,827 138,913
CONNECTICUT 181,990 167,150 157,237 152,194 146,243
DELAWARE 82,532 77,759 81,218 79,584 79,586
DIST. OF COL. 49,342 47,282 44,051 42,928 42,973
FLORIDA 650,421 656,869 644,151 647,841 637,294
GEORGIA 403,563 411,331 411,666 390,258 376,888
GUAM 6,805 6,654 6,662 6,512 6,584
HAWAII 79,158 76,266 74,212 67,161 63,010
IDAHO 121,335 120,743 103,861 100,571 100,452
ILLINOIS 480,209 475,614 473,083 463,187 430,562
INDIANA 279,327 272,789 265,593 258,110 250,183
IOWA 170,817 167,846 165,810 163,544 160,634
KANSAS 134,216 141,105 138,914 139,768 135,773
KENTUCKY 275,012 271,525 270,237 272,498 270,013
LOUISIANA 291,391 283,871 280,267 273,626 267,613
MAINE 54,132 49,450 45,782 44,132 42,939
MARYLAND 207,591 203,452 196,867 198,241 183,294
MASSACHUSETTS 230,376 216,952 207,860 214,650 212,207
MICHIGAN 842,771 846,347 844,214 812,063 804,026
MINNESOTA 230,420 225,386 220,681 216,638 210,466
MISSISSIPPI 300,922 291,717 284,963 268,640 267,162
MISSOURI 344,300 332,822 327,773 325,950 311,074
MONTANA 37,321 37,344 36,657 35,114 33,890
NEBRASKA 108,443 108,674 106,796 105,009 100,820
NEVADA 94,112 94,458 91,461 88,792 86,862
NEW HAMPSHIRE 38,115 38,510 38,066 37,673 37,002
NEW JERSEY 347,538 333,636 317,063 296,107 280,060
NEW MEXICO 67,681 62,497 63,866 66,684 62,266
NEW YORK 896,898 856,179 828,998 794,956 764,987
NORTH CAROLINA 411,215 407,651 406,774 402,067 396,712
NORTH DAKOTA 38,133 37,380 35,501 34,094 34,477
OHIO 856,136 840,689 827,176 807,870 795,817
OKLAHOMA 208,086 203,269 196,915 189,699 188,481
OREGON 204,366 188,432 176,707 159,879 167,846
PENNSYLVANIA 395,952 380,451 370,019 359,094 348,727
PUERTO RICO 226,147 219,449 213,254 208,686 203,193
RHODE ISLAND 52,402 50,402 49,973 48,803 51,664
SOUTH CAROLINA 190,138 194,451 184,937 181,693 183,439
SOUTH DAKOTA 47,222 46,947 46,506 48,322 46,463
TENNESSEE 369,641 366,715 367,386 361,082 346,474
TEXAS 1,516,674 1,548,574 1,519,585 1,518,245 1,511,215
UTAH 92,601 92,683 90,914 88,463 86,163
VERMONT 16,867 15,744 15,050 14,472 14,012
VIRGIN ISLANDS 1 9,086 8,952 8,900 8,780 8,740
VIRGINIA 306,776 303,413 297,548 294,242 288,325
WASHINGTON 336,712 329,878 324,231 315,860 307,972
WEST VIRGINIA 122,332 115,523 110,458 105,823 100,894
WISCONSIN 363,184 361,221 361,443 361,659 357,224
WYOMING 30,209 29,843 29,328 28,558 25,467
TOTALS 14,744,538 14,522,408 14,228,533 13,923,541 13,604,791
Source: Form OCSE-157, lines 1 and 3, column A.
1 Virgin Islands data were unreliable for line 1 in FY 2017. Line 3 data are not subject to data reliability audits.

D-57
This data was originally compiled and reported by the states and territories. OCSE assumes no responsibility or legal liability concerning the data’s accuracy, reliability, completeness, timeliness, or usefulness. This data was originally compiled and reported by the states and territories. OCSE assumes no responsibility or legal liability concerning the data’s accuracy, reliability, completeness, timeliness, or usefulness.
Table 53 Cases Open at the End of the Fiscal Year for Five Consecutive Fiscal Years
STATES 2015 2016 2017 2018 2019ALABAMA 218,827 216,144 214,147 210,551 205,952
ALASKA 49,023 46,650 44,814 43,843 42,042
ARIZONA 174,932 170,491 167,310 161,390 155,163
ARKANSAS 108,338 104,747 101,119 96,993 101,464
CALIFORNIA 1,237,737 1,214,712 1,187,333 1,163,115 1,130,263
COLORADO 151,634 150,405 149,982 144,823 138,911
CONNECTICUT 181,198 166,495 156,616 151,957 146,004
DELAWARE 82,497 77,728 81,176 79,531 79,526
DIST. OF COL. 49,342 47,282 44,051 42,928 42,973
FLORIDA 650,352 656,801 644,056 647,758 637,208
GEORGIA 403,410 411,151 411,491 390,096 376,729
GUAM 6,805 6,654 6,662 6,512 6,584
HAWAII 79,114 76,222 74,168 67,118 62,975
IDAHO 119,477 118,870 102,955 99,741 99,554
ILLINOIS 480,137 475,543 473,011 463,157 430,537
INDIANA 279,327 272,789 265,593 258,110 250,183
IOWA 170,817 167,846 165,810 163,544 160,634
KANSAS 134,195 141,082 138,895 139,748 135,754
KENTUCKY 274,976 271,491 270,200 272,440 269,967
LOUISIANA 291,391 283,871 280,267 273,626 267,613
MAINE 54,132 49,450 45,782 44,132 42,939
MARYLAND 207,591 203,452 196,867 198,241 183,294
MASSACHUSETTS 230,131 216,777 207,687 214,565 212,084
MICHIGAN 842,709 846,279 844,133 811,980 803,941
MINNESOTA 227,783 222,472 216,908 212,822 206,671
MISSISSIPPI 300,922 291,717 284,963 268,640 267,162
MISSOURI 344,291 332,815 327,766 325,944 311,074
MONTANA 35,652 35,446 34,666 33,215 32,180
NEBRASKA 108,443 108,674 106,796 105,009 100,820
NEVADA 94,112 94,458 91,461 88,792 86,862
NEW HAMPSHIRE 38,113 38,509 38,066 37,673 37,002
NEW JERSEY 347,424 333,535 316,969 296,048 280,019
NEW MEXICO 61,501 62,497 63,844 66,641 62,238
NEW YORK 896,713 856,038 828,866 794,832 764,878
NORTH CAROLINA 411,215 407,651 406,774 402,067 396,712
NORTH DAKOTA 36,456 35,807 33,930 32,649 33,176
OHIO 856,107 840,653 827,116 807,823 795,775
OKLAHOMA 208,086 203,269 196,915 189,699 188,481
OREGON 203,488 187,756 176,149 159,700 167,398
PENNSYLVANIA 395,940 380,439 370,004 359,081 348,714
PUERTO RICO 226,147 219,449 213,254 208,686 203,193
RHODE ISLAND 52,335 50,369 49,953 48,782 51,637
SOUTH CAROLINA 190,138 194,451 184,937 181,693 183,433
SOUTH DAKOTA 38,458 40,326 40,742 42,195 40,521
TENNESSEE 369,641 366,632 367,379 361,077 346,468
TEXAS 1,516,487 1,548,329 1,519,357 1,517,974 1,510,947
UTAH 92,593 92,678 90,909 88,461 86,161
VERMONT 16,864 15,740 15,045 14,469 14,011
VIRGIN ISLANDS 1 9,073 8,939 8,887 8,767 8,729
VIRGINIA 306,776 303,413 297,548 294,242 288,325
WASHINGTON 336,712 329,878 324,231 315,860 307,972
WEST VIRGINIA 122,317 115,509 110,445 105,805 100,887
WISCONSIN 363,152 361,169 361,406 361,623 357,182
WYOMING 27,947 27,600 27,085 26,313 25,466
TOTALS 14,712,978 14,499,150 14,206,496 13,902,481 13,586,388
Source: Form OCSE-157, line 1.
1 Virgin Islands data were unreliable for line 1 in FY 2017.
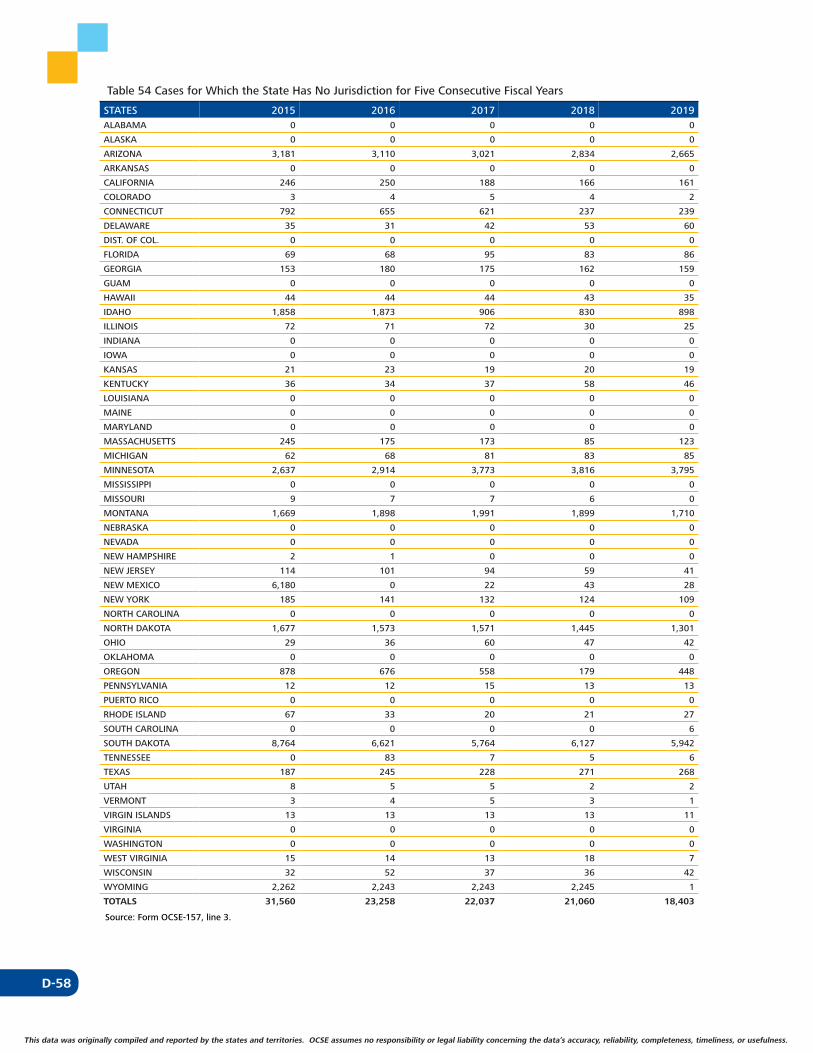
D-58
This data was originally compiled and reported by the states and territories. OCSE assumes no responsibility or legal liability concerning the data’s accuracy, reliability, completeness, timeliness, or usefulness.
Table 54 Cases for Which the State Has No Jurisdiction for Five Consecutive Fiscal Years
STATES 2015 2016 2017 2018 2019ALABAMA 0 0 0 0 0
ALASKA 0 0 0 0 0
ARIZONA 3,181 3,110 3,021 2,834 2,665
ARKANSAS 0 0 0 0 0
CALIFORNIA 246 250 188 166 161
COLORADO 3 4 5 4 2
CONNECTICUT 792 655 621 237 239
DELAWARE 35 31 42 53 60
DIST. OF COL. 0 0 0 0 0
FLORIDA 69 68 95 83 86
GEORGIA 153 180 175 162 159
GUAM 0 0 0 0 0
HAWAII 44 44 44 43 35
IDAHO 1,858 1,873 906 830 898
ILLINOIS 72 71 72 30 25
INDIANA 0 0 0 0 0
IOWA 0 0 0 0 0
KANSAS 21 23 19 20 19
KENTUCKY 36 34 37 58 46
LOUISIANA 0 0 0 0 0
MAINE 0 0 0 0 0
MARYLAND 0 0 0 0 0
MASSACHUSETTS 245 175 173 85 123
MICHIGAN 62 68 81 83 85
MINNESOTA 2,637 2,914 3,773 3,816 3,795
MISSISSIPPI 0 0 0 0 0
MISSOURI 9 7 7 6 0
MONTANA 1,669 1,898 1,991 1,899 1,710
NEBRASKA 0 0 0 0 0
NEVADA 0 0 0 0 0
NEW HAMPSHIRE 2 1 0 0 0
NEW JERSEY 114 101 94 59 41
NEW MEXICO 6,180 0 22 43 28
NEW YORK 185 141 132 124 109
NORTH CAROLINA 0 0 0 0 0
NORTH DAKOTA 1,677 1,573 1,571 1,445 1,301
OHIO 29 36 60 47 42
OKLAHOMA 0 0 0 0 0
OREGON 878 676 558 179 448
PENNSYLVANIA 12 12 15 13 13
PUERTO RICO 0 0 0 0 0
RHODE ISLAND 67 33 20 21 27
SOUTH CAROLINA 0 0 0 0 6
SOUTH DAKOTA 8,764 6,621 5,764 6,127 5,942
TENNESSEE 0 83 7 5 6
TEXAS 187 245 228 271 268
UTAH 8 5 5 2 2
VERMONT 3 4 5 3 1
VIRGIN ISLANDS 13 13 13 13 11
VIRGINIA 0 0 0 0 0
WASHINGTON 0 0 0 0 0
WEST VIRGINIA 15 14 13 18 7
WISCONSIN 32 52 37 36 42
WYOMING 2,262 2,243 2,243 2,245 1
TOTALS 31,560 23,258 22,037 21,060 18,403
Source: Form OCSE-157, line 3.

D-59
This data was originally compiled and reported by the states and territories. OCSE assumes no responsibility or legal liability concerning the data’s accuracy, reliability, completeness, timeliness, or usefulness. This data was originally compiled and reported by the states and territories. OCSE assumes no responsibility or legal liability concerning the data’s accuracy, reliability, completeness, timeliness, or usefulness.
Table 55 Total Caseload by Current Assistance for Five Consecutive Fiscal Years
STATES 2015 2016 2017 2018 2019ALABAMA 17,732 15,789 14,709 13,593 12,407
ALASKA 6,462 5,008 4,887 4,619 4,302
ARIZONA 10,939 9,639 8,727 7,836 6,729
ARKANSAS 7,892 7,109 6,223 5,495 5,132
CALIFORNIA 327,971 297,057 273,501 252,182 233,419
COLORADO 15,764 15,659 16,461 16,172 15,333
CONNECTICUT 16,174 14,531 13,023 11,795 10,731
DELAWARE 8,722 6,957 8,271 7,863 7,062
DIST. OF COL. 13,311 12,467 8,338 8,764 8,593
FLORIDA 46,817 43,783 42,208 40,839 37,026
GEORGIA 21,550 21,421 22,212 21,251 20,470
GUAM 391 338 233 240 156
HAWAII 12,890 11,879 11,099 10,358 9,569
IDAHO 3,580 3,595 2,979 2,565 2,401
ILLINOIS 68,052 56,297 48,757 44,961 41,338
INDIANA 9,629 9,057 8,685 6,996 7,520
IOWA 15,195 15,019 13,818 12,725 11,986
KANSAS 13,038 12,166 9,673 9,112 7,609
KENTUCKY 35,263 36,303 37,985 36,019 31,750
LOUISIANA 20,633 20,586 20,099 19,592 17,389
MAINE 4,840 4,017 3,404 3,186 3,163
MARYLAND 19,345 16,694 14,652 16,533 14,801
MASSACHUSETTS 27,112 23,099 21,466 21,794 27,643
MICHIGAN 51,252 39,464 37,487 33,956 32,444
MINNESOTA 25,537 26,574 26,316 24,068 21,838
MISSISSIPPI 11,915 10,523 9,998 7,945 7,187
MISSOURI 30,784 21,451 19,377 18,549 15,602
MONTANA 4,631 5,235 5,391 5,419 4,830
NEBRASKA 6,650 6,760 4,896 7,264 6,025
NEVADA 6,616 7,736 7,629 7,035 6,190
NEW HAMPSHIRE 3,685 3,473 4,489 5,070 5,110
NEW JERSEY 33,285 25,902 21,396 18,233 15,696
NEW MEXICO 7,048 6,989 7,208 7,011 6,614
NEW YORK 136,203 129,063 116,679 106,887 97,377
NORTH CAROLINA 28,967 27,713 27,117 26,557 25,110
NORTH DAKOTA 3,022 3,100 3,074 2,971 2,839
OHIO 90,538 87,081 82,582 80,484 82,538
OKLAHOMA 19,170 18,434 18,070 16,088 15,243
OREGON 27,382 20,825 19,181 17,326 20,981
PENNSYLVANIA 50,677 44,715 38,366 35,624 34,226
PUERTO RICO 27,034 25,139 23,685 22,268 21,723
RHODE ISLAND 5,392 4,469 4,031 3,706 3,609
SOUTH CAROLINA 22,689 21,848 20,329 18,487 15,934
SOUTH DAKOTA 7,062 8,023 7,904 5,858 6,104
TENNESSEE 55,322 50,663 47,039 42,608 40,248
TEXAS 46,624 43,440 41,459 39,677 31,288
UTAH 6,498 6,793 6,598 5,985 5,337
VERMONT 2,927 2,707 2,781 2,174 2,105
VIRGIN ISLANDS 886 810 744 669 585
VIRGINIA 36,300 34,208 34,191 32,867 31,263
WASHINGTON 33,369 31,520 29,506 28,809 27,187
WEST VIRGINIA 11,734 11,676 11,396 11,170 10,951
WISCONSIN 31,292 28,120 27,829 26,814 25,296
WYOMING 2,441 2,490 2,607 2,421 2,194
TOTALS 1,550,234 1,415,414 1,320,765 1,238,490 1,160,203
Source: Form OCSE-157, lines 1 and 3, column B.
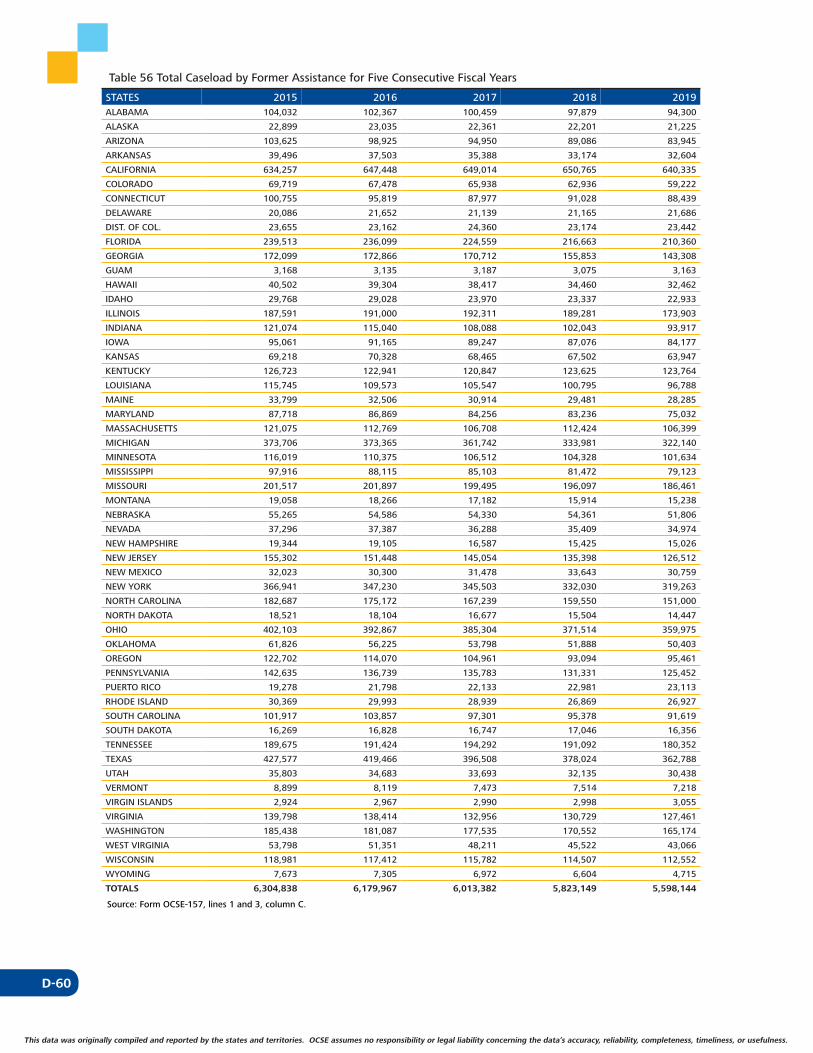
D-60
This data was originally compiled and reported by the states and territories. OCSE assumes no responsibility or legal liability concerning the data’s accuracy, reliability, completeness, timeliness, or usefulness.
Table 56 Total Caseload by Former Assistance for Five Consecutive Fiscal Years
STATES 2015 2016 2017 2018 2019ALABAMA 104,032 102,367 100,459 97,879 94,300
ALASKA 22,899 23,035 22,361 22,201 21,225
ARIZONA 103,625 98,925 94,950 89,086 83,945
ARKANSAS 39,496 37,503 35,388 33,174 32,604
CALIFORNIA 634,257 647,448 649,014 650,765 640,335
COLORADO 69,719 67,478 65,938 62,936 59,222
CONNECTICUT 100,755 95,819 87,977 91,028 88,439
DELAWARE 20,086 21,652 21,139 21,165 21,686
DIST. OF COL. 23,655 23,162 24,360 23,174 23,442
FLORIDA 239,513 236,099 224,559 216,663 210,360
GEORGIA 172,099 172,866 170,712 155,853 143,308
GUAM 3,168 3,135 3,187 3,075 3,163
HAWAII 40,502 39,304 38,417 34,460 32,462
IDAHO 29,768 29,028 23,970 23,337 22,933
ILLINOIS 187,591 191,000 192,311 189,281 173,903
INDIANA 121,074 115,040 108,088 102,043 93,917
IOWA 95,061 91,165 89,247 87,076 84,177
KANSAS 69,218 70,328 68,465 67,502 63,947
KENTUCKY 126,723 122,941 120,847 123,625 123,764
LOUISIANA 115,745 109,573 105,547 100,795 96,788
MAINE 33,799 32,506 30,914 29,481 28,285
MARYLAND 87,718 86,869 84,256 83,236 75,032
MASSACHUSETTS 121,075 112,769 106,708 112,424 106,399
MICHIGAN 373,706 373,365 361,742 333,981 322,140
MINNESOTA 116,019 110,375 106,512 104,328 101,634
MISSISSIPPI 97,916 88,115 85,103 81,472 79,123
MISSOURI 201,517 201,897 199,495 196,097 186,461
MONTANA 19,058 18,266 17,182 15,914 15,238
NEBRASKA 55,265 54,586 54,330 54,361 51,806
NEVADA 37,296 37,387 36,288 35,409 34,974
NEW HAMPSHIRE 19,344 19,105 16,587 15,425 15,026
NEW JERSEY 155,302 151,448 145,054 135,398 126,512
NEW MEXICO 32,023 30,300 31,478 33,643 30,759
NEW YORK 366,941 347,230 345,503 332,030 319,263
NORTH CAROLINA 182,687 175,172 167,239 159,550 151,000
NORTH DAKOTA 18,521 18,104 16,677 15,504 14,447
OHIO 402,103 392,867 385,304 371,514 359,975
OKLAHOMA 61,826 56,225 53,798 51,888 50,403
OREGON 122,702 114,070 104,961 93,094 95,461
PENNSYLVANIA 142,635 136,739 135,783 131,331 125,452
PUERTO RICO 19,278 21,798 22,133 22,981 23,113
RHODE ISLAND 30,369 29,993 28,939 26,869 26,927
SOUTH CAROLINA 101,917 103,857 97,301 95,378 91,619
SOUTH DAKOTA 16,269 16,828 16,747 17,046 16,356
TENNESSEE 189,675 191,424 194,292 191,092 180,352
TEXAS 427,577 419,466 396,508 378,024 362,788
UTAH 35,803 34,683 33,693 32,135 30,438
VERMONT 8,899 8,119 7,473 7,514 7,218
VIRGIN ISLANDS 2,924 2,967 2,990 2,998 3,055
VIRGINIA 139,798 138,414 132,956 130,729 127,461
WASHINGTON 185,438 181,087 177,535 170,552 165,174
WEST VIRGINIA 53,798 51,351 48,211 45,522 43,066
WISCONSIN 118,981 117,412 115,782 114,507 112,552
WYOMING 7,673 7,305 6,972 6,604 4,715
TOTALS 6,304,838 6,179,967 6,013,382 5,823,149 5,598,144
Source: Form OCSE-157, lines 1 and 3, column C.

D-61
This data was originally compiled and reported by the states and territories. OCSE assumes no responsibility or legal liability concerning the data’s accuracy, reliability, completeness, timeliness, or usefulness. This data was originally compiled and reported by the states and territories. OCSE assumes no responsibility or legal liability concerning the data’s accuracy, reliability, completeness, timeliness, or usefulness.
Table 57 Total Caseload by Never Assistance for Five Consecutive Fiscal Years
STATES 2015 2016 2017 2018 2019ALABAMA 97,063 97,988 98,979 99,079 99,245
ALASKA 19,662 18,607 17,566 17,023 16,515
ARIZONA 63,549 65,037 66,654 67,302 67,154
ARKANSAS 60,950 60,135 59,508 58,324 63,728
CALIFORNIA 275,755 270,457 265,006 260,334 256,670
COLORADO 66,154 67,272 67,588 65,719 64,358
CONNECTICUT 65,061 56,800 56,237 49,371 47,073
DELAWARE 53,724 49,150 51,808 50,556 50,838
DIST. OF COL. 12,376 11,653 11,353 10,990 10,938
FLORIDA 364,091 376,987 377,384 390,339 389,908
GEORGIA 209,914 217,044 218,742 213,154 213,110
GUAM 3,246 3,181 3,242 3,197 3,265
HAWAII 25,766 25,083 24,696 22,343 20,979
IDAHO 87,987 88,120 76,912 74,669 75,118
ILLINOIS 224,566 228,317 232,015 228,945 215,321
INDIANA 148,624 148,692 148,820 149,071 148,746
IOWA 60,561 61,662 62,745 63,743 64,471
KANSAS 51,960 58,611 60,776 63,154 64,217
KENTUCKY 113,026 112,281 111,405 112,854 114,499
LOUISIANA 155,013 153,712 154,621 153,239 153,436
MAINE 15,493 12,927 11,464 11,465 11,491
MARYLAND 100,528 99,889 97,959 98,472 93,461
MASSACHUSETTS 82,189 81,084 79,686 80,432 78,165
MICHIGAN 417,813 433,518 444,985 444,126 449,442
MINNESOTA 88,864 88,437 87,853 88,242 86,994
MISSISSIPPI 191,091 193,079 189,862 179,223 180,852
MISSOURI 111,999 109,474 108,901 111,304 109,011
MONTANA 13,632 13,843 14,084 13,781 13,822
NEBRASKA 46,528 47,328 47,570 43,384 42,989
NEVADA 50,200 49,335 47,544 46,348 45,698
NEW HAMPSHIRE 15,086 15,932 16,990 17,178 16,866
NEW JERSEY 158,951 156,286 150,613 142,476 137,852
NEW MEXICO 28,610 25,208 25,180 26,030 24,893
NEW YORK 393,754 379,886 366,816 356,039 348,347
NORTH CAROLINA 199,561 204,766 212,418 215,960 220,602
NORTH DAKOTA 16,590 16,176 15,750 15,619 17,191
OHIO 363,495 360,741 359,290 355,872 353,304
OKLAHOMA 127,090 128,610 125,047 121,723 122,835
OREGON 54,282 53,537 52,565 49,459 51,404
PENNSYLVANIA 202,640 198,997 195,870 192,139 189,049
PUERTO RICO 179,835 172,512 167,436 163,437 158,357
RHODE ISLAND 16,641 15,940 17,003 18,228 21,128
SOUTH CAROLINA 65,532 68,746 67,307 67,828 75,886
SOUTH DAKOTA 23,891 22,096 21,855 25,418 24,003
TENNESSEE 124,644 124,628 126,055 127,382 125,874
TEXAS 1,042,473 1,085,668 1,081,618 1,100,544 1,117,139
UTAH 50,300 51,207 50,623 50,343 50,388
VERMONT 5,041 4,918 4,796 4,784 4,689
VIRGIN ISLANDS 5,276 5,175 5,166 5,113 5,100
VIRGINIA 130,678 130,791 130,401 130,646 129,601
WASHINGTON 117,905 117,271 117,190 116,499 115,611
WEST VIRGINIA 56,800 52,496 50,851 49,131 46,877
WISCONSIN 212,911 215,689 217,832 220,338 219,376
WYOMING 20,095 20,048 19,749 19,533 18,558
TOTALS 6,889,466 6,927,027 6,894,386 6,861,902 6,846,444
Source: Form OCSE-157, lines 1 and 3, column D.
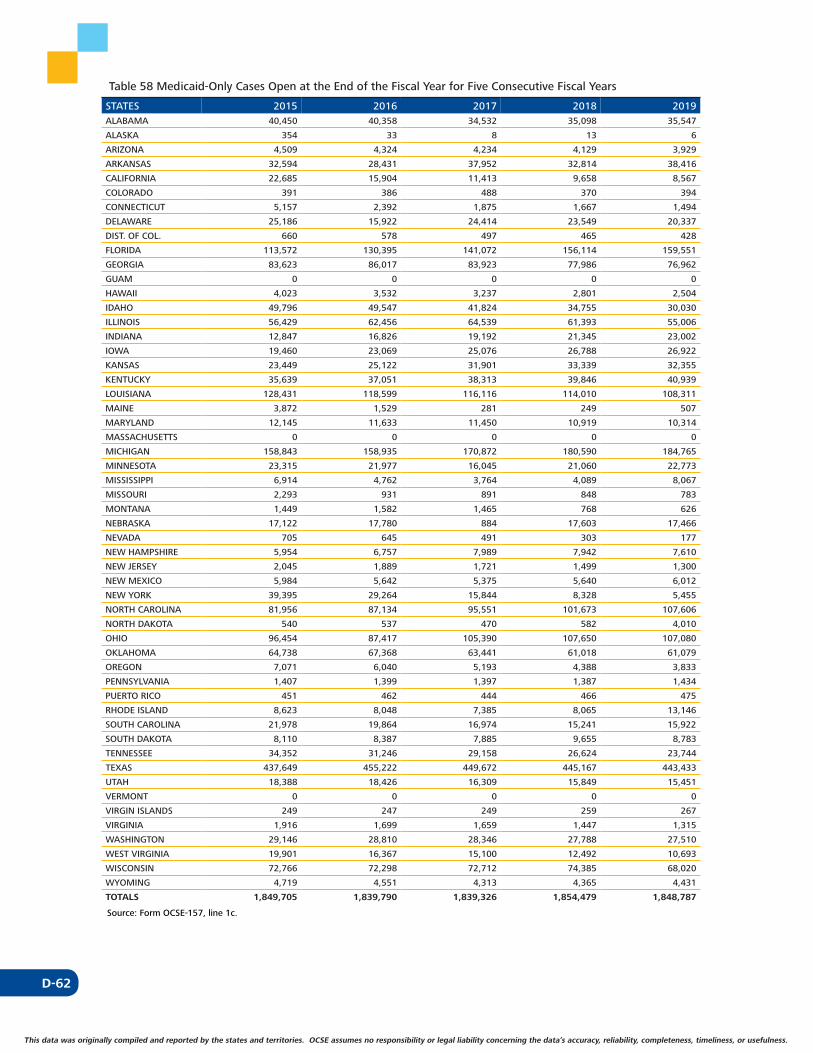
D-62
This data was originally compiled and reported by the states and territories. OCSE assumes no responsibility or legal liability concerning the data’s accuracy, reliability, completeness, timeliness, or usefulness.
Table 58 Medicaid-Only Cases Open at the End of the Fiscal Year for Five Consecutive Fiscal Years
STATES 2015 2016 2017 2018 2019ALABAMA 40,450 40,358 34,532 35,098 35,547
ALASKA 354 33 8 13 6
ARIZONA 4,509 4,324 4,234 4,129 3,929
ARKANSAS 32,594 28,431 37,952 32,814 38,416
CALIFORNIA 22,685 15,904 11,413 9,658 8,567
COLORADO 391 386 488 370 394
CONNECTICUT 5,157 2,392 1,875 1,667 1,494
DELAWARE 25,186 15,922 24,414 23,549 20,337
DIST. OF COL. 660 578 497 465 428
FLORIDA 113,572 130,395 141,072 156,114 159,551
GEORGIA 83,623 86,017 83,923 77,986 76,962
GUAM 0 0 0 0 0
HAWAII 4,023 3,532 3,237 2,801 2,504
IDAHO 49,796 49,547 41,824 34,755 30,030
ILLINOIS 56,429 62,456 64,539 61,393 55,006
INDIANA 12,847 16,826 19,192 21,345 23,002
IOWA 19,460 23,069 25,076 26,788 26,922
KANSAS 23,449 25,122 31,901 33,339 32,355
KENTUCKY 35,639 37,051 38,313 39,846 40,939
LOUISIANA 128,431 118,599 116,116 114,010 108,311
MAINE 3,872 1,529 281 249 507
MARYLAND 12,145 11,633 11,450 10,919 10,314
MASSACHUSETTS 0 0 0 0 0
MICHIGAN 158,843 158,935 170,872 180,590 184,765
MINNESOTA 23,315 21,977 16,045 21,060 22,773
MISSISSIPPI 6,914 4,762 3,764 4,089 8,067
MISSOURI 2,293 931 891 848 783
MONTANA 1,449 1,582 1,465 768 626
NEBRASKA 17,122 17,780 884 17,603 17,466
NEVADA 705 645 491 303 177
NEW HAMPSHIRE 5,954 6,757 7,989 7,942 7,610
NEW JERSEY 2,045 1,889 1,721 1,499 1,300
NEW MEXICO 5,984 5,642 5,375 5,640 6,012
NEW YORK 39,395 29,264 15,844 8,328 5,455
NORTH CAROLINA 81,956 87,134 95,551 101,673 107,606
NORTH DAKOTA 540 537 470 582 4,010
OHIO 96,454 87,417 105,390 107,650 107,080
OKLAHOMA 64,738 67,368 63,441 61,018 61,079
OREGON 7,071 6,040 5,193 4,388 3,833
PENNSYLVANIA 1,407 1,399 1,397 1,387 1,434
PUERTO RICO 451 462 444 466 475
RHODE ISLAND 8,623 8,048 7,385 8,065 13,146
SOUTH CAROLINA 21,978 19,864 16,974 15,241 15,922
SOUTH DAKOTA 8,110 8,387 7,885 9,655 8,783
TENNESSEE 34,352 31,246 29,158 26,624 23,744
TEXAS 437,649 455,222 449,672 445,167 443,433
UTAH 18,388 18,426 16,309 15,849 15,451
VERMONT 0 0 0 0 0
VIRGIN ISLANDS 249 247 249 259 267
VIRGINIA 1,916 1,699 1,659 1,447 1,315
WASHINGTON 29,146 28,810 28,346 27,788 27,510
WEST VIRGINIA 19,901 16,367 15,100 12,492 10,693
WISCONSIN 72,766 72,298 72,712 74,385 68,020
WYOMING 4,719 4,551 4,313 4,365 4,431
TOTALS 1,849,705 1,839,790 1,839,326 1,854,479 1,848,787
Source: Form OCSE-157, line 1c.
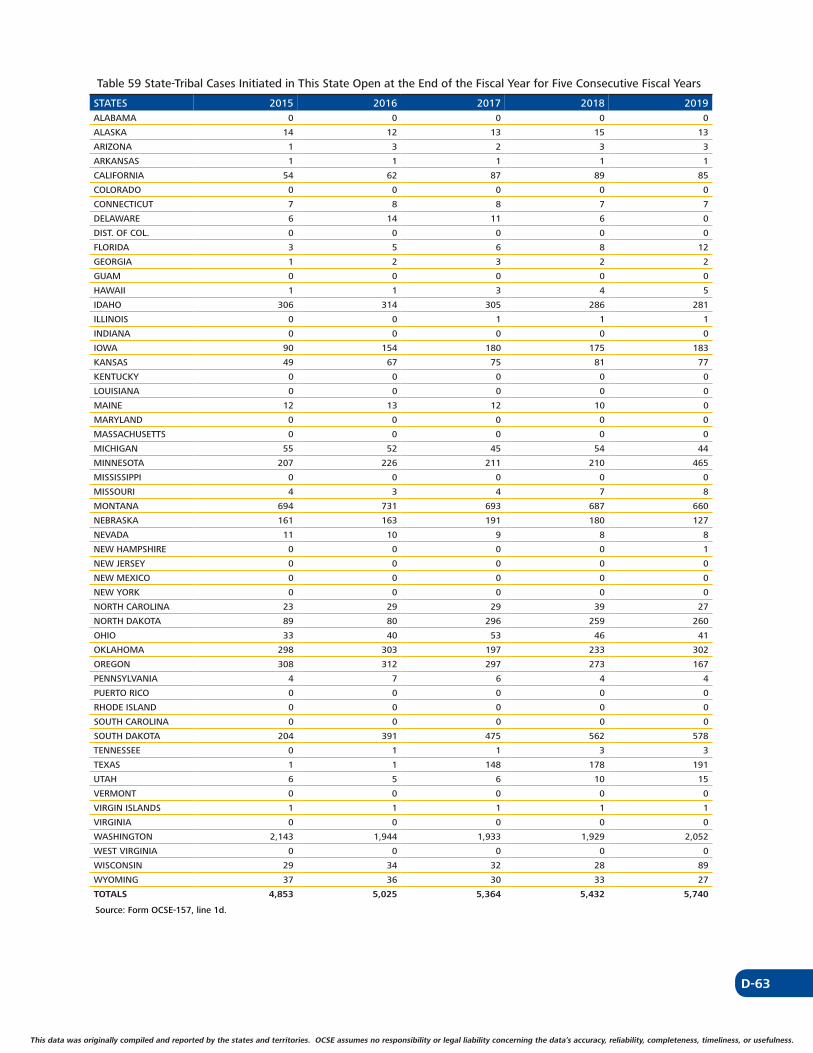
D-63
This data was originally compiled and reported by the states and territories. OCSE assumes no responsibility or legal liability concerning the data’s accuracy, reliability, completeness, timeliness, or usefulness. This data was originally compiled and reported by the states and territories. OCSE assumes no responsibility or legal liability concerning the data’s accuracy, reliability, completeness, timeliness, or usefulness.
Table 59 State-Tribal Cases Initiated in This State Open at the End of the Fiscal Year for Five Consecutive Fiscal Years
STATES 2015 2016 2017 2018 2019ALABAMA 0 0 0 0 0
ALASKA 14 12 13 15 13
ARIZONA 1 3 2 3 3
ARKANSAS 1 1 1 1 1
CALIFORNIA 54 62 87 89 85
COLORADO 0 0 0 0 0
CONNECTICUT 7 8 8 7 7
DELAWARE 6 14 11 6 0
DIST. OF COL. 0 0 0 0 0
FLORIDA 3 5 6 8 12
GEORGIA 1 2 3 2 2
GUAM 0 0 0 0 0
HAWAII 1 1 3 4 5
IDAHO 306 314 305 286 281
ILLINOIS 0 0 1 1 1
INDIANA 0 0 0 0 0
IOWA 90 154 180 175 183
KANSAS 49 67 75 81 77
KENTUCKY 0 0 0 0 0
LOUISIANA 0 0 0 0 0
MAINE 12 13 12 10 0
MARYLAND 0 0 0 0 0
MASSACHUSETTS 0 0 0 0 0
MICHIGAN 55 52 45 54 44
MINNESOTA 207 226 211 210 465
MISSISSIPPI 0 0 0 0 0
MISSOURI 4 3 4 7 8
MONTANA 694 731 693 687 660
NEBRASKA 161 163 191 180 127
NEVADA 11 10 9 8 8
NEW HAMPSHIRE 0 0 0 0 1
NEW JERSEY 0 0 0 0 0
NEW MEXICO 0 0 0 0 0
NEW YORK 0 0 0 0 0
NORTH CAROLINA 23 29 29 39 27
NORTH DAKOTA 89 80 296 259 260
OHIO 33 40 53 46 41
OKLAHOMA 298 303 197 233 302
OREGON 308 312 297 273 167
PENNSYLVANIA 4 7 6 4 4
PUERTO RICO 0 0 0 0 0
RHODE ISLAND 0 0 0 0 0
SOUTH CAROLINA 0 0 0 0 0
SOUTH DAKOTA 204 391 475 562 578
TENNESSEE 0 1 1 3 3
TEXAS 1 1 148 178 191
UTAH 6 5 6 10 15
VERMONT 0 0 0 0 0
VIRGIN ISLANDS 1 1 1 1 1
VIRGINIA 0 0 0 0 0
WASHINGTON 2,143 1,944 1,933 1,929 2,052
WEST VIRGINIA 0 0 0 0 0
WISCONSIN 29 34 32 28 89
WYOMING 37 36 30 33 27
TOTALS 4,853 5,025 5,364 5,432 5,740
Source: Form OCSE-157, line 1d.
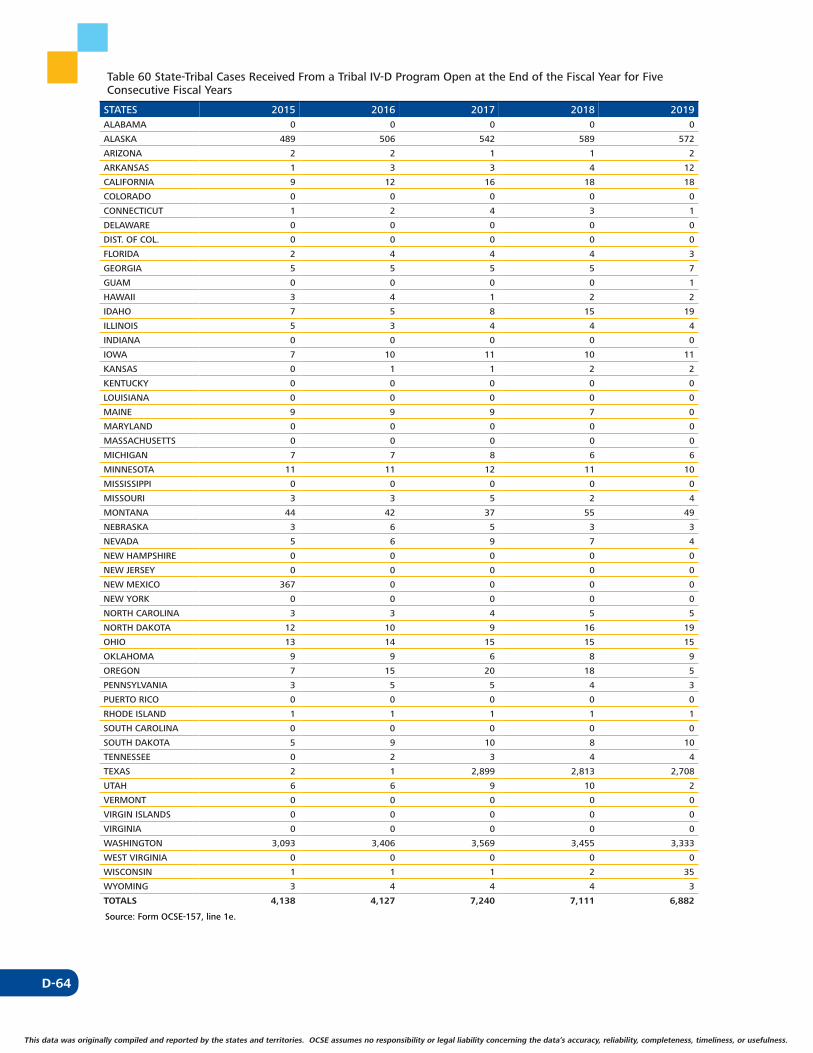
D-64
This data was originally compiled and reported by the states and territories. OCSE assumes no responsibility or legal liability concerning the data’s accuracy, reliability, completeness, timeliness, or usefulness.
Table 60 State-Tribal Cases Received From a Tribal IV-D Program Open at the End of the Fiscal Year for Five Consecutive Fiscal Years
STATES 2015 2016 2017 2018 2019ALABAMA 0 0 0 0 0
ALASKA 489 506 542 589 572
ARIZONA 2 2 1 1 2
ARKANSAS 1 3 3 4 12
CALIFORNIA 9 12 16 18 18
COLORADO 0 0 0 0 0
CONNECTICUT 1 2 4 3 1
DELAWARE 0 0 0 0 0
DIST. OF COL. 0 0 0 0 0
FLORIDA 2 4 4 4 3
GEORGIA 5 5 5 5 7
GUAM 0 0 0 0 1
HAWAII 3 4 1 2 2
IDAHO 7 5 8 15 19
ILLINOIS 5 3 4 4 4
INDIANA 0 0 0 0 0
IOWA 7 10 11 10 11
KANSAS 0 1 1 2 2
KENTUCKY 0 0 0 0 0
LOUISIANA 0 0 0 0 0
MAINE 9 9 9 7 0
MARYLAND 0 0 0 0 0
MASSACHUSETTS 0 0 0 0 0
MICHIGAN 7 7 8 6 6
MINNESOTA 11 11 12 11 10
MISSISSIPPI 0 0 0 0 0
MISSOURI 3 3 5 2 4
MONTANA 44 42 37 55 49
NEBRASKA 3 6 5 3 3
NEVADA 5 6 9 7 4
NEW HAMPSHIRE 0 0 0 0 0
NEW JERSEY 0 0 0 0 0
NEW MEXICO 367 0 0 0 0
NEW YORK 0 0 0 0 0
NORTH CAROLINA 3 3 4 5 5
NORTH DAKOTA 12 10 9 16 19
OHIO 13 14 15 15 15
OKLAHOMA 9 9 6 8 9
OREGON 7 15 20 18 5
PENNSYLVANIA 3 5 5 4 3
PUERTO RICO 0 0 0 0 0
RHODE ISLAND 1 1 1 1 1
SOUTH CAROLINA 0 0 0 0 0
SOUTH DAKOTA 5 9 10 8 10
TENNESSEE 0 2 3 4 4
TEXAS 2 1 2,899 2,813 2,708
UTAH 6 6 9 10 2
VERMONT 0 0 0 0 0
VIRGIN ISLANDS 0 0 0 0 0
VIRGINIA 0 0 0 0 0
WASHINGTON 3,093 3,406 3,569 3,455 3,333
WEST VIRGINIA 0 0 0 0 0
WISCONSIN 1 1 1 2 35
WYOMING 3 4 4 4 3
TOTALS 4,138 4,127 7,240 7,111 6,882
Source: Form OCSE-157, line 1e.
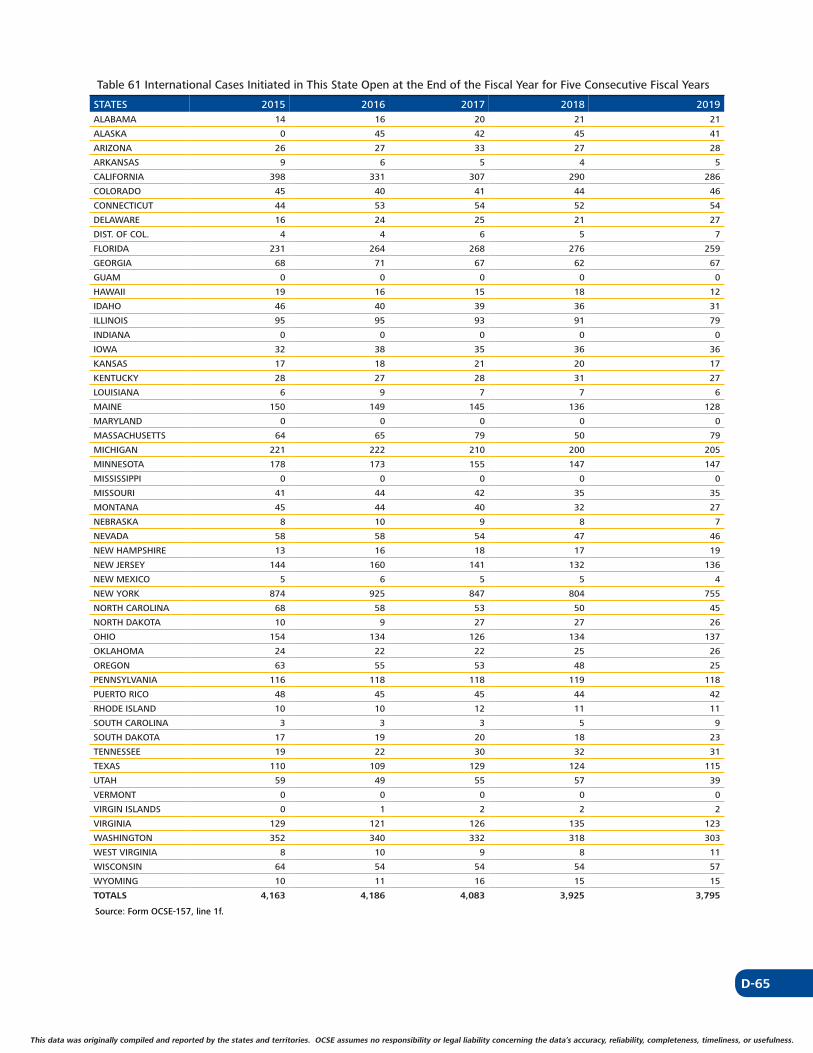
D-65
This data was originally compiled and reported by the states and territories. OCSE assumes no responsibility or legal liability concerning the data’s accuracy, reliability, completeness, timeliness, or usefulness. This data was originally compiled and reported by the states and territories. OCSE assumes no responsibility or legal liability concerning the data’s accuracy, reliability, completeness, timeliness, or usefulness.
Table 61 International Cases Initiated in This State Open at the End of the Fiscal Year for Five Consecutive Fiscal Years
STATES 2015 2016 2017 2018 2019ALABAMA 14 16 20 21 21
ALASKA 0 45 42 45 41
ARIZONA 26 27 33 27 28
ARKANSAS 9 6 5 4 5
CALIFORNIA 398 331 307 290 286
COLORADO 45 40 41 44 46
CONNECTICUT 44 53 54 52 54
DELAWARE 16 24 25 21 27
DIST. OF COL. 4 4 6 5 7
FLORIDA 231 264 268 276 259
GEORGIA 68 71 67 62 67
GUAM 0 0 0 0 0
HAWAII 19 16 15 18 12
IDAHO 46 40 39 36 31
ILLINOIS 95 95 93 91 79
INDIANA 0 0 0 0 0
IOWA 32 38 35 36 36
KANSAS 17 18 21 20 17
KENTUCKY 28 27 28 31 27
LOUISIANA 6 9 7 7 6
MAINE 150 149 145 136 128
MARYLAND 0 0 0 0 0
MASSACHUSETTS 64 65 79 50 79
MICHIGAN 221 222 210 200 205
MINNESOTA 178 173 155 147 147
MISSISSIPPI 0 0 0 0 0
MISSOURI 41 44 42 35 35
MONTANA 45 44 40 32 27
NEBRASKA 8 10 9 8 7
NEVADA 58 58 54 47 46
NEW HAMPSHIRE 13 16 18 17 19
NEW JERSEY 144 160 141 132 136
NEW MEXICO 5 6 5 5 4
NEW YORK 874 925 847 804 755
NORTH CAROLINA 68 58 53 50 45
NORTH DAKOTA 10 9 27 27 26
OHIO 154 134 126 134 137
OKLAHOMA 24 22 22 25 26
OREGON 63 55 53 48 25
PENNSYLVANIA 116 118 118 119 118
PUERTO RICO 48 45 45 44 42
RHODE ISLAND 10 10 12 11 11
SOUTH CAROLINA 3 3 3 5 9
SOUTH DAKOTA 17 19 20 18 23
TENNESSEE 19 22 30 32 31
TEXAS 110 109 129 124 115
UTAH 59 49 55 57 39
VERMONT 0 0 0 0 0
VIRGIN ISLANDS 0 1 2 2 2
VIRGINIA 129 121 126 135 123
WASHINGTON 352 340 332 318 303
WEST VIRGINIA 8 10 9 8 11
WISCONSIN 64 54 54 54 57
WYOMING 10 11 16 15 15
TOTALS 4,163 4,186 4,083 3,925 3,795
Source: Form OCSE-157, line 1f.
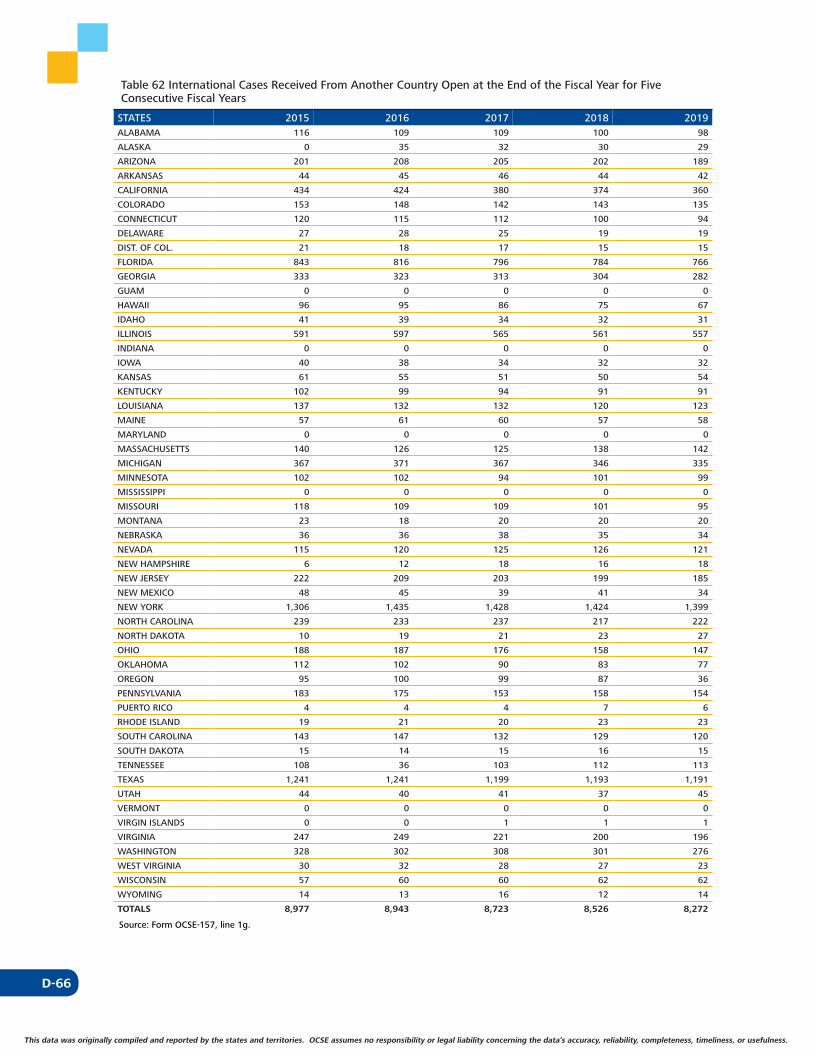
D-66
This data was originally compiled and reported by the states and territories. OCSE assumes no responsibility or legal liability concerning the data’s accuracy, reliability, completeness, timeliness, or usefulness.
Table 62 International Cases Received From Another Country Open at the End of the Fiscal Year for Five Consecutive Fiscal Years
STATES 2015 2016 2017 2018 2019ALABAMA 116 109 109 100 98
ALASKA 0 35 32 30 29
ARIZONA 201 208 205 202 189
ARKANSAS 44 45 46 44 42
CALIFORNIA 434 424 380 374 360
COLORADO 153 148 142 143 135
CONNECTICUT 120 115 112 100 94
DELAWARE 27 28 25 19 19
DIST. OF COL. 21 18 17 15 15
FLORIDA 843 816 796 784 766
GEORGIA 333 323 313 304 282
GUAM 0 0 0 0 0
HAWAII 96 95 86 75 67
IDAHO 41 39 34 32 31
ILLINOIS 591 597 565 561 557
INDIANA 0 0 0 0 0
IOWA 40 38 34 32 32
KANSAS 61 55 51 50 54
KENTUCKY 102 99 94 91 91
LOUISIANA 137 132 132 120 123
MAINE 57 61 60 57 58
MARYLAND 0 0 0 0 0
MASSACHUSETTS 140 126 125 138 142
MICHIGAN 367 371 367 346 335
MINNESOTA 102 102 94 101 99
MISSISSIPPI 0 0 0 0 0
MISSOURI 118 109 109 101 95
MONTANA 23 18 20 20 20
NEBRASKA 36 36 38 35 34
NEVADA 115 120 125 126 121
NEW HAMPSHIRE 6 12 18 16 18
NEW JERSEY 222 209 203 199 185
NEW MEXICO 48 45 39 41 34
NEW YORK 1,306 1,435 1,428 1,424 1,399
NORTH CAROLINA 239 233 237 217 222
NORTH DAKOTA 10 19 21 23 27
OHIO 188 187 176 158 147
OKLAHOMA 112 102 90 83 77
OREGON 95 100 99 87 36
PENNSYLVANIA 183 175 153 158 154
PUERTO RICO 4 4 4 7 6
RHODE ISLAND 19 21 20 23 23
SOUTH CAROLINA 143 147 132 129 120
SOUTH DAKOTA 15 14 15 16 15
TENNESSEE 108 36 103 112 113
TEXAS 1,241 1,241 1,199 1,193 1,191
UTAH 44 40 41 37 45
VERMONT 0 0 0 0 0
VIRGIN ISLANDS 0 0 1 1 1
VIRGINIA 247 249 221 200 196
WASHINGTON 328 302 308 301 276
WEST VIRGINIA 30 32 28 27 23
WISCONSIN 57 60 60 62 62
WYOMING 14 13 16 12 14
TOTALS 8,977 8,943 8,723 8,526 8,272
Source: Form OCSE-157, line 1g.

D-67
This data was originally compiled and reported by the states and territories. OCSE assumes no responsibility or legal liability concerning the data’s accuracy, reliability, completeness, timeliness, or usefulness. This data was originally compiled and reported by the states and territories. OCSE assumes no responsibility or legal liability concerning the data’s accuracy, reliability, completeness, timeliness, or usefulness.
Table 63 Cases With Medical Coverage Received from Any Source for Five Consecutive Fiscal Years
STATES 2015 2016 2017 2018 2019ALABAMA 238,676 235,841 214,456 211,856 209,626
ALASKA 25,810 24,957 23,960 23,201 22,022
ARIZONA 40,328 35,474 33,542 31,231 28,564
ARKANSAS 70,713 66,554 70,745 70,239 72,092
CALIFORNIA 710,431 624,904 576,109 545,755 515,887
COLORADO 79,983 83,105 86,804 90,156 89,015
CONNECTICUT 96,306 35,325 29,685 28,154 25,781
DELAWARE 52,627 47,524 51,666 51,801 50,699
DIST. OF COL. 32,842 31,430 27,848 27,870 28,206
FLORIDA 279,631 291,219 311,285 330,063 334,688
GEORGIA 285,868 291,259 291,932 280,199 271,252
GUAM 728 670 609 558 512
HAWAII 21,255 19,365 17,729 15,788 14,295
IDAHO 69,668 68,255 57,965 49,992 45,016
ILLINOIS 47,959 50,235 51,705 51,002 50,485
INDIANA 203,814 202,471 199,822 195,336 194,767
IOWA 109,910 109,722 109,381 107,844 105,129
KANSAS 83,727 68,410 81,910 84,425 81,574
KENTUCKY 73,671 36,364 33,873 32,407 49,023
LOUISIANA 237,794 227,456 220,973 213,735 205,871
MAINE 7,991 6,366 5,277 4,802 6,151
MARYLAND 0 0 0 0 0
MASSACHUSETTS 68,790 62,008 59,715 64,070 45,585
MICHIGAN 560,335 548,236 552,658 541,731 538,736
MINNESOTA 74,020 69,746 65,740 61,006 59,126
MISSISSIPPI 0 0 0 0 0
MISSOURI 78,321 88,840 92,688 95,692 98,003
MONTANA 17,218 16,674 14,323 13,196 12,400
NEBRASKA 35,395 35,167 32,535 29,418 27,037
NEVADA 29,548 30,377 31,066 31,639 32,283
NEW HAMPSHIRE 16,598 15,076 27,647 27,204 26,365
NEW JERSEY 92,559 91,767 85,532 77,743 67,986
NEW MEXICO 25,372 23,350 22,180 22,564 23,012
NEW YORK 343,661 321,266 288,560 248,212 241,777
NORTH CAROLINA 301,412 296,300 297,460 294,951 291,213
NORTH DAKOTA 20,497 19,962 19,352 18,921 21,053
OHIO 531,761 498,534 514,729 501,733 491,841
OKLAHOMA 44,013 44,833 41,897 39,466 37,602
OREGON 91,410 76,389 66,064 61,968 22,719
PENNSYLVANIA 333,862 323,337 302,775 305,256 295,942
PUERTO RICO 21 43 36 40 41
RHODE ISLAND 41,539 39,495 39,314 38,539 41,026
SOUTH CAROLINA 29,572 20,436 20,344 18,697 55,326
SOUTH DAKOTA 27,625 29,241 29,024 30,301 29,006
TENNESSEE 261,938 258,694 258,708 248,538 234,477
TEXAS 1,004,557 1,009,835 987,118 979,432 959,186
UTAH 42,004 42,797 42,154 41,225 40,009
VERMONT 1,870 1,859 1,851 1,857 1,847
VIRGIN ISLANDS 128 134 123 90 81
VIRGINIA 2 24,144 25,733 26,487 27,001
WASHINGTON 14,418 13,913 13,416 12,951 11,773
WEST VIRGINIA 65,374 57,345 54,290 49,046 44,029
WISCONSIN 212,591 210,994 209,344 208,507 196,389
WYOMING 1,725 1,475 1,124 1,251 1,435
TOTALS 7,137,868 6,829,173 6,694,776 6,538,145 6,374,961
Source: Form OCSE-157, line 35.
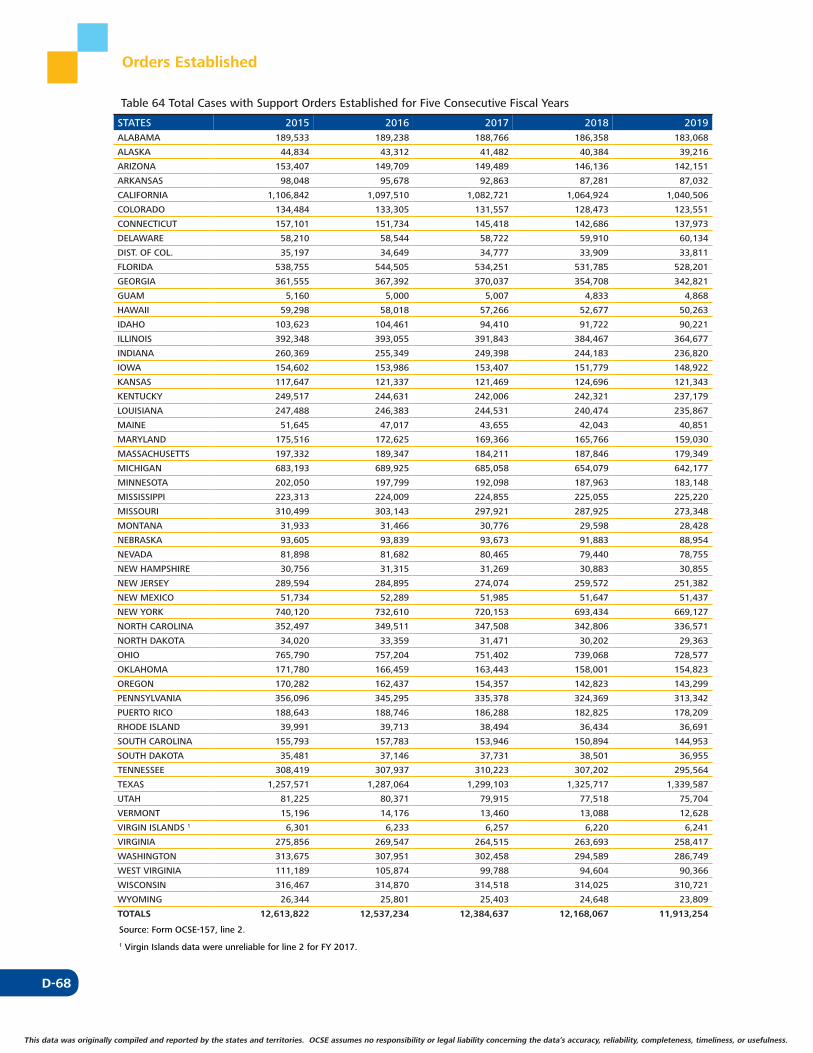
D-68
This data was originally compiled and reported by the states and territories. OCSE assumes no responsibility or legal liability concerning the data’s accuracy, reliability, completeness, timeliness, or usefulness.
Orders Established
Table 64 Total Cases with Support Orders Established for Five Consecutive Fiscal Years
STATES 2015 2016 2017 2018 2019ALABAMA 189,533 189,238 188,766 186,358 183,068
ALASKA 44,834 43,312 41,482 40,384 39,216
ARIZONA 153,407 149,709 149,489 146,136 142,151
ARKANSAS 98,048 95,678 92,863 87,281 87,032
CALIFORNIA 1,106,842 1,097,510 1,082,721 1,064,924 1,040,506
COLORADO 134,484 133,305 131,557 128,473 123,551
CONNECTICUT 157,101 151,734 145,418 142,686 137,973
DELAWARE 58,210 58,544 58,722 59,910 60,134
DIST. OF COL. 35,197 34,649 34,777 33,909 33,811
FLORIDA 538,755 544,505 534,251 531,785 528,201
GEORGIA 361,555 367,392 370,037 354,708 342,821
GUAM 5,160 5,000 5,007 4,833 4,868
HAWAII 59,298 58,018 57,266 52,677 50,263
IDAHO 103,623 104,461 94,410 91,722 90,221
ILLINOIS 392,348 393,055 391,843 384,467 364,677
INDIANA 260,369 255,349 249,398 244,183 236,820
IOWA 154,602 153,986 153,407 151,779 148,922
KANSAS 117,647 121,337 121,469 124,696 121,343
KENTUCKY 249,517 244,631 242,006 242,321 237,179
LOUISIANA 247,488 246,383 244,531 240,474 235,867
MAINE 51,645 47,017 43,655 42,043 40,851
MARYLAND 175,516 172,625 169,366 165,766 159,030
MASSACHUSETTS 197,332 189,347 184,211 187,846 179,349
MICHIGAN 683,193 689,925 685,058 654,079 642,177
MINNESOTA 202,050 197,799 192,098 187,963 183,148
MISSISSIPPI 223,313 224,009 224,855 225,055 225,220
MISSOURI 310,499 303,143 297,921 287,925 273,348
MONTANA 31,933 31,466 30,776 29,598 28,428
NEBRASKA 93,605 93,839 93,673 91,883 88,954
NEVADA 81,898 81,682 80,465 79,440 78,755
NEW HAMPSHIRE 30,756 31,315 31,269 30,883 30,855
NEW JERSEY 289,594 284,895 274,074 259,572 251,382
NEW MEXICO 51,734 52,289 51,985 51,647 51,437
NEW YORK 740,120 732,610 720,153 693,434 669,127
NORTH CAROLINA 352,497 349,511 347,508 342,806 336,571
NORTH DAKOTA 34,020 33,359 31,471 30,202 29,363
OHIO 765,790 757,204 751,402 739,068 728,577
OKLAHOMA 171,780 166,459 163,443 158,001 154,823
OREGON 170,282 162,437 154,357 142,823 143,299
PENNSYLVANIA 356,096 345,295 335,378 324,369 313,342
PUERTO RICO 188,643 188,746 186,288 182,825 178,209
RHODE ISLAND 39,991 39,713 38,494 36,434 36,691
SOUTH CAROLINA 155,793 157,783 153,946 150,894 144,953
SOUTH DAKOTA 35,481 37,146 37,731 38,501 36,955
TENNESSEE 308,419 307,937 310,223 307,202 295,564
TEXAS 1,257,571 1,287,064 1,299,103 1,325,717 1,339,587
UTAH 81,225 80,371 79,915 77,518 75,704
VERMONT 15,196 14,176 13,460 13,088 12,628
VIRGIN ISLANDS 1 6,301 6,233 6,257 6,220 6,241
VIRGINIA 275,856 269,547 264,515 263,693 258,417
WASHINGTON 313,675 307,951 302,458 294,589 286,749
WEST VIRGINIA 111,189 105,874 99,788 94,604 90,366
WISCONSIN 316,467 314,870 314,518 314,025 310,721
WYOMING 26,344 25,801 25,403 24,648 23,809
TOTALS 12,613,822 12,537,234 12,384,637 12,168,067 11,913,254
Source: Form OCSE-157, line 2.
1 Virgin Islands data were unreliable for line 2 for FY 2017.
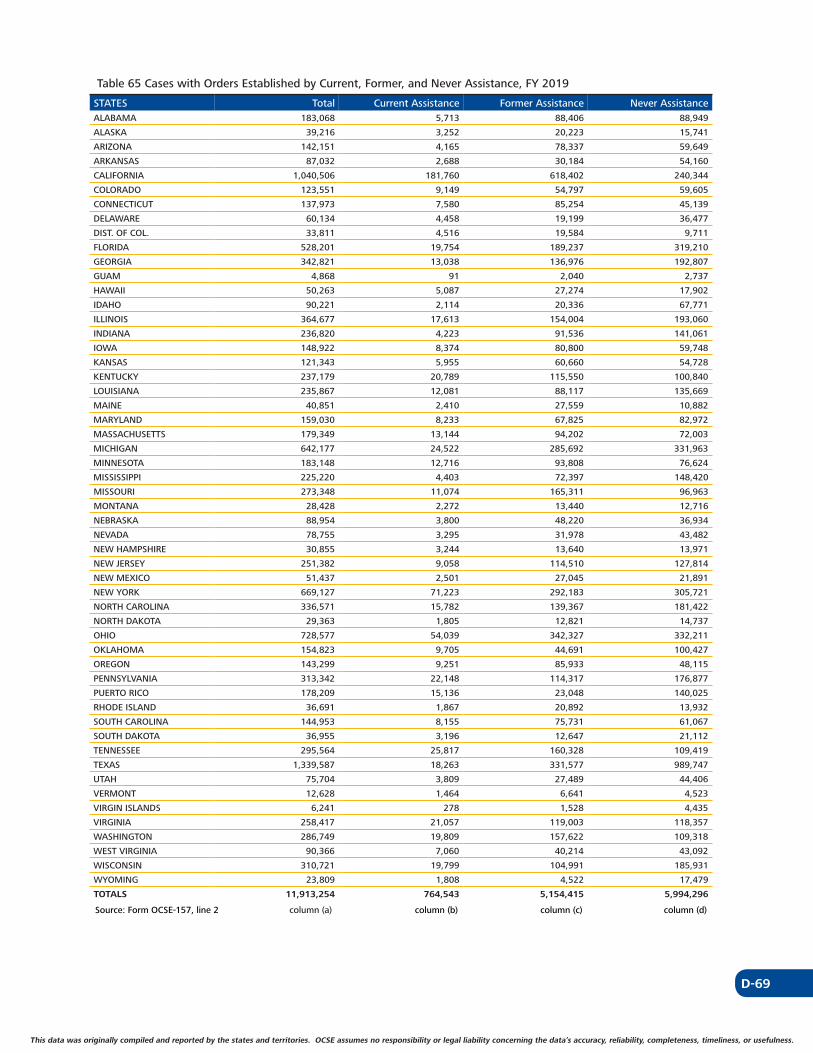
D-69
This data was originally compiled and reported by the states and territories. OCSE assumes no responsibility or legal liability concerning the data’s accuracy, reliability, completeness, timeliness, or usefulness. This data was originally compiled and reported by the states and territories. OCSE assumes no responsibility or legal liability concerning the data’s accuracy, reliability, completeness, timeliness, or usefulness.
Table 65 Cases with Orders Established by Current, Former, and Never Assistance, FY 2019
STATES Total Current Assistance Former Assistance Never AssistanceALABAMA 183,068 5,713 88,406 88,949
ALASKA 39,216 3,252 20,223 15,741
ARIZONA 142,151 4,165 78,337 59,649
ARKANSAS 87,032 2,688 30,184 54,160
CALIFORNIA 1,040,506 181,760 618,402 240,344
COLORADO 123,551 9,149 54,797 59,605
CONNECTICUT 137,973 7,580 85,254 45,139
DELAWARE 60,134 4,458 19,199 36,477
DIST. OF COL. 33,811 4,516 19,584 9,711
FLORIDA 528,201 19,754 189,237 319,210
GEORGIA 342,821 13,038 136,976 192,807
GUAM 4,868 91 2,040 2,737
HAWAII 50,263 5,087 27,274 17,902
IDAHO 90,221 2,114 20,336 67,771
ILLINOIS 364,677 17,613 154,004 193,060
INDIANA 236,820 4,223 91,536 141,061
IOWA 148,922 8,374 80,800 59,748
KANSAS 121,343 5,955 60,660 54,728
KENTUCKY 237,179 20,789 115,550 100,840
LOUISIANA 235,867 12,081 88,117 135,669
MAINE 40,851 2,410 27,559 10,882
MARYLAND 159,030 8,233 67,825 82,972
MASSACHUSETTS 179,349 13,144 94,202 72,003
MICHIGAN 642,177 24,522 285,692 331,963
MINNESOTA 183,148 12,716 93,808 76,624
MISSISSIPPI 225,220 4,403 72,397 148,420
MISSOURI 273,348 11,074 165,311 96,963
MONTANA 28,428 2,272 13,440 12,716
NEBRASKA 88,954 3,800 48,220 36,934
NEVADA 78,755 3,295 31,978 43,482
NEW HAMPSHIRE 30,855 3,244 13,640 13,971
NEW JERSEY 251,382 9,058 114,510 127,814
NEW MEXICO 51,437 2,501 27,045 21,891
NEW YORK 669,127 71,223 292,183 305,721
NORTH CAROLINA 336,571 15,782 139,367 181,422
NORTH DAKOTA 29,363 1,805 12,821 14,737
OHIO 728,577 54,039 342,327 332,211
OKLAHOMA 154,823 9,705 44,691 100,427
OREGON 143,299 9,251 85,933 48,115
PENNSYLVANIA 313,342 22,148 114,317 176,877
PUERTO RICO 178,209 15,136 23,048 140,025
RHODE ISLAND 36,691 1,867 20,892 13,932
SOUTH CAROLINA 144,953 8,155 75,731 61,067
SOUTH DAKOTA 36,955 3,196 12,647 21,112
TENNESSEE 295,564 25,817 160,328 109,419
TEXAS 1,339,587 18,263 331,577 989,747
UTAH 75,704 3,809 27,489 44,406
VERMONT 12,628 1,464 6,641 4,523
VIRGIN ISLANDS 6,241 278 1,528 4,435
VIRGINIA 258,417 21,057 119,003 118,357
WASHINGTON 286,749 19,809 157,622 109,318
WEST VIRGINIA 90,366 7,060 40,214 43,092
WISCONSIN 310,721 19,799 104,991 185,931
WYOMING 23,809 1,808 4,522 17,479
TOTALS 11,913,254 764,543 5,154,415 5,994,296
Source: Form OCSE-157, line 2 column (a) column (b) column (c) column (d)
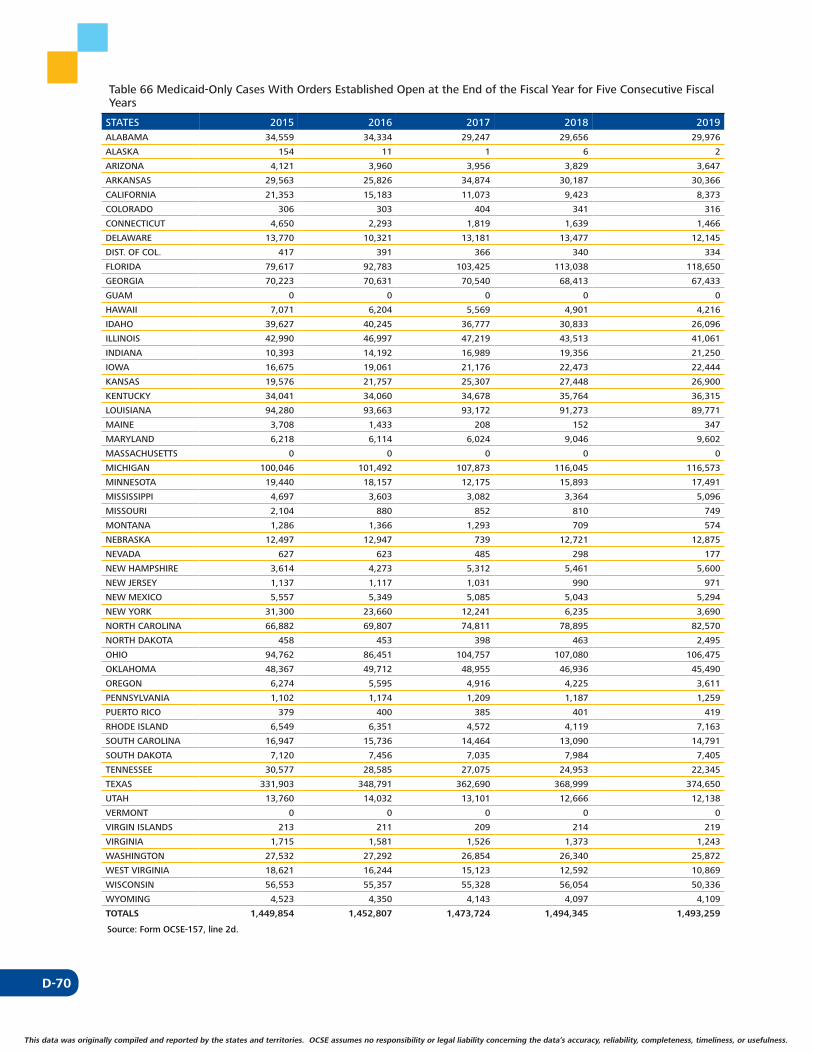
D-70
This data was originally compiled and reported by the states and territories. OCSE assumes no responsibility or legal liability concerning the data’s accuracy, reliability, completeness, timeliness, or usefulness.
Table 66 Medicaid-Only Cases With Orders Established Open at the End of the Fiscal Year for Five Consecutive Fiscal Years
STATES 2015 2016 2017 2018 2019ALABAMA 34,559 34,334 29,247 29,656 29,976
ALASKA 154 11 1 6 2
ARIZONA 4,121 3,960 3,956 3,829 3,647
ARKANSAS 29,563 25,826 34,874 30,187 30,366
CALIFORNIA 21,353 15,183 11,073 9,423 8,373
COLORADO 306 303 404 341 316
CONNECTICUT 4,650 2,293 1,819 1,639 1,466
DELAWARE 13,770 10,321 13,181 13,477 12,145
DIST. OF COL. 417 391 366 340 334
FLORIDA 79,617 92,783 103,425 113,038 118,650
GEORGIA 70,223 70,631 70,540 68,413 67,433
GUAM 0 0 0 0 0
HAWAII 7,071 6,204 5,569 4,901 4,216
IDAHO 39,627 40,245 36,777 30,833 26,096
ILLINOIS 42,990 46,997 47,219 43,513 41,061
INDIANA 10,393 14,192 16,989 19,356 21,250
IOWA 16,675 19,061 21,176 22,473 22,444
KANSAS 19,576 21,757 25,307 27,448 26,900
KENTUCKY 34,041 34,060 34,678 35,764 36,315
LOUISIANA 94,280 93,663 93,172 91,273 89,771
MAINE 3,708 1,433 208 152 347
MARYLAND 6,218 6,114 6,024 9,046 9,602
MASSACHUSETTS 0 0 0 0 0
MICHIGAN 100,046 101,492 107,873 116,045 116,573
MINNESOTA 19,440 18,157 12,175 15,893 17,491
MISSISSIPPI 4,697 3,603 3,082 3,364 5,096
MISSOURI 2,104 880 852 810 749
MONTANA 1,286 1,366 1,293 709 574
NEBRASKA 12,497 12,947 739 12,721 12,875
NEVADA 627 623 485 298 177
NEW HAMPSHIRE 3,614 4,273 5,312 5,461 5,600
NEW JERSEY 1,137 1,117 1,031 990 971
NEW MEXICO 5,557 5,349 5,085 5,043 5,294
NEW YORK 31,300 23,660 12,241 6,235 3,690
NORTH CAROLINA 66,882 69,807 74,811 78,895 82,570
NORTH DAKOTA 458 453 398 463 2,495
OHIO 94,762 86,451 104,757 107,080 106,475
OKLAHOMA 48,367 49,712 48,955 46,936 45,490
OREGON 6,274 5,595 4,916 4,225 3,611
PENNSYLVANIA 1,102 1,174 1,209 1,187 1,259
PUERTO RICO 379 400 385 401 419
RHODE ISLAND 6,549 6,351 4,572 4,119 7,163
SOUTH CAROLINA 16,947 15,736 14,464 13,090 14,791
SOUTH DAKOTA 7,120 7,456 7,035 7,984 7,405
TENNESSEE 30,577 28,585 27,075 24,953 22,345
TEXAS 331,903 348,791 362,690 368,999 374,650
UTAH 13,760 14,032 13,101 12,666 12,138
VERMONT 0 0 0 0 0
VIRGIN ISLANDS 213 211 209 214 219
VIRGINIA 1,715 1,581 1,526 1,373 1,243
WASHINGTON 27,532 27,292 26,854 26,340 25,872
WEST VIRGINIA 18,621 16,244 15,123 12,592 10,869
WISCONSIN 56,553 55,357 55,328 56,054 50,336
WYOMING 4,523 4,350 4,143 4,097 4,109
TOTALS 1,449,854 1,452,807 1,473,724 1,494,345 1,493,259
Source: Form OCSE-157, line 2d.
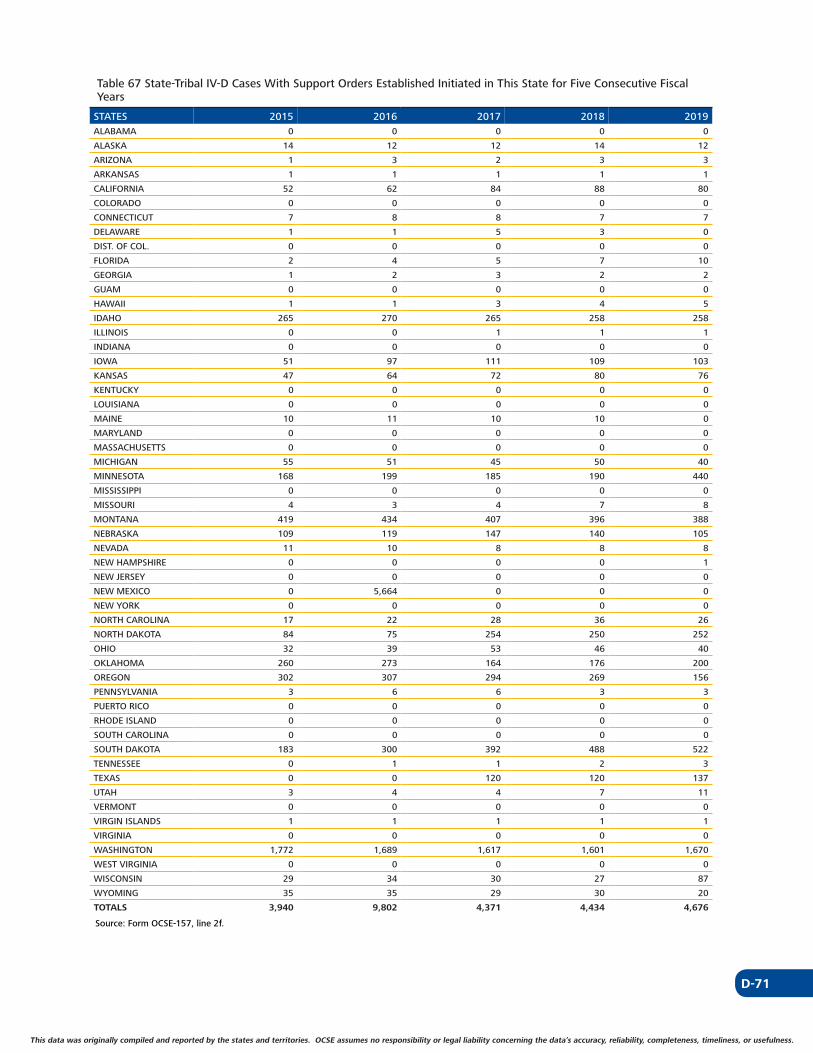
D-71
This data was originally compiled and reported by the states and territories. OCSE assumes no responsibility or legal liability concerning the data’s accuracy, reliability, completeness, timeliness, or usefulness. This data was originally compiled and reported by the states and territories. OCSE assumes no responsibility or legal liability concerning the data’s accuracy, reliability, completeness, timeliness, or usefulness.
Table 67 State-Tribal IV-D Cases With Support Orders Established Initiated in This State for Five Consecutive Fiscal Years
STATES 2015 2016 2017 2018 2019ALABAMA 0 0 0 0 0
ALASKA 14 12 12 14 12
ARIZONA 1 3 2 3 3
ARKANSAS 1 1 1 1 1
CALIFORNIA 52 62 84 88 80
COLORADO 0 0 0 0 0
CONNECTICUT 7 8 8 7 7
DELAWARE 1 1 5 3 0
DIST. OF COL. 0 0 0 0 0
FLORIDA 2 4 5 7 10
GEORGIA 1 2 3 2 2
GUAM 0 0 0 0 0
HAWAII 1 1 3 4 5
IDAHO 265 270 265 258 258
ILLINOIS 0 0 1 1 1
INDIANA 0 0 0 0 0
IOWA 51 97 111 109 103
KANSAS 47 64 72 80 76
KENTUCKY 0 0 0 0 0
LOUISIANA 0 0 0 0 0
MAINE 10 11 10 10 0
MARYLAND 0 0 0 0 0
MASSACHUSETTS 0 0 0 0 0
MICHIGAN 55 51 45 50 40
MINNESOTA 168 199 185 190 440
MISSISSIPPI 0 0 0 0 0
MISSOURI 4 3 4 7 8
MONTANA 419 434 407 396 388
NEBRASKA 109 119 147 140 105
NEVADA 11 10 8 8 8
NEW HAMPSHIRE 0 0 0 0 1
NEW JERSEY 0 0 0 0 0
NEW MEXICO 0 5,664 0 0 0
NEW YORK 0 0 0 0 0
NORTH CAROLINA 17 22 28 36 26
NORTH DAKOTA 84 75 254 250 252
OHIO 32 39 53 46 40
OKLAHOMA 260 273 164 176 200
OREGON 302 307 294 269 156
PENNSYLVANIA 3 6 6 3 3
PUERTO RICO 0 0 0 0 0
RHODE ISLAND 0 0 0 0 0
SOUTH CAROLINA 0 0 0 0 0
SOUTH DAKOTA 183 300 392 488 522
TENNESSEE 0 1 1 2 3
TEXAS 0 0 120 120 137
UTAH 3 4 4 7 11
VERMONT 0 0 0 0 0
VIRGIN ISLANDS 1 1 1 1 1
VIRGINIA 0 0 0 0 0
WASHINGTON 1,772 1,689 1,617 1,601 1,670
WEST VIRGINIA 0 0 0 0 0
WISCONSIN 29 34 30 27 87
WYOMING 35 35 29 30 20
TOTALS 3,940 9,802 4,371 4,434 4,676
Source: Form OCSE-157, line 2f.
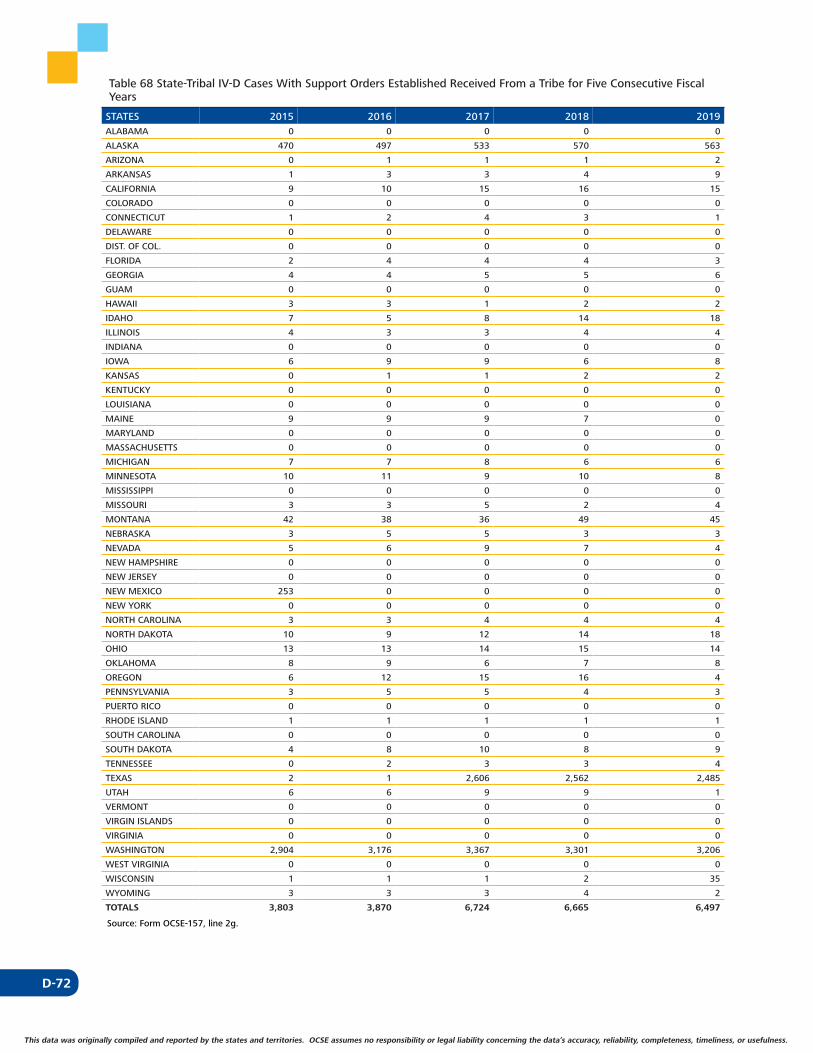
D-72
This data was originally compiled and reported by the states and territories. OCSE assumes no responsibility or legal liability concerning the data’s accuracy, reliability, completeness, timeliness, or usefulness.
Table 68 State-Tribal IV-D Cases With Support Orders Established Received From a Tribe for Five Consecutive Fiscal Years
STATES 2015 2016 2017 2018 2019ALABAMA 0 0 0 0 0
ALASKA 470 497 533 570 563
ARIZONA 0 1 1 1 2
ARKANSAS 1 3 3 4 9
CALIFORNIA 9 10 15 16 15
COLORADO 0 0 0 0 0
CONNECTICUT 1 2 4 3 1
DELAWARE 0 0 0 0 0
DIST. OF COL. 0 0 0 0 0
FLORIDA 2 4 4 4 3
GEORGIA 4 4 5 5 6
GUAM 0 0 0 0 0
HAWAII 3 3 1 2 2
IDAHO 7 5 8 14 18
ILLINOIS 4 3 3 4 4
INDIANA 0 0 0 0 0
IOWA 6 9 9 6 8
KANSAS 0 1 1 2 2
KENTUCKY 0 0 0 0 0
LOUISIANA 0 0 0 0 0
MAINE 9 9 9 7 0
MARYLAND 0 0 0 0 0
MASSACHUSETTS 0 0 0 0 0
MICHIGAN 7 7 8 6 6
MINNESOTA 10 11 9 10 8
MISSISSIPPI 0 0 0 0 0
MISSOURI 3 3 5 2 4
MONTANA 42 38 36 49 45
NEBRASKA 3 5 5 3 3
NEVADA 5 6 9 7 4
NEW HAMPSHIRE 0 0 0 0 0
NEW JERSEY 0 0 0 0 0
NEW MEXICO 253 0 0 0 0
NEW YORK 0 0 0 0 0
NORTH CAROLINA 3 3 4 4 4
NORTH DAKOTA 10 9 12 14 18
OHIO 13 13 14 15 14
OKLAHOMA 8 9 6 7 8
OREGON 6 12 15 16 4
PENNSYLVANIA 3 5 5 4 3
PUERTO RICO 0 0 0 0 0
RHODE ISLAND 1 1 1 1 1
SOUTH CAROLINA 0 0 0 0 0
SOUTH DAKOTA 4 8 10 8 9
TENNESSEE 0 2 3 3 4
TEXAS 2 1 2,606 2,562 2,485
UTAH 6 6 9 9 1
VERMONT 0 0 0 0 0
VIRGIN ISLANDS 0 0 0 0 0
VIRGINIA 0 0 0 0 0
WASHINGTON 2,904 3,176 3,367 3,301 3,206
WEST VIRGINIA 0 0 0 0 0
WISCONSIN 1 1 1 2 35
WYOMING 3 3 3 4 2
TOTALS 3,803 3,870 6,724 6,665 6,497
Source: Form OCSE-157, line 2g.
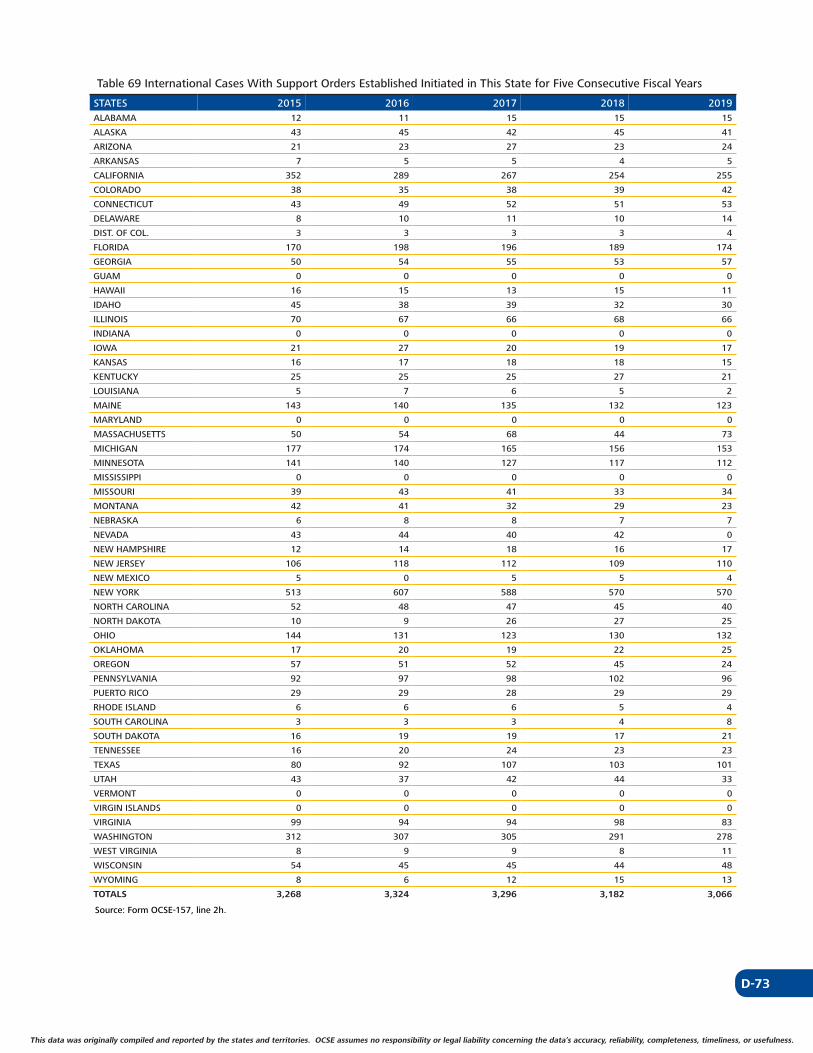
D-73
This data was originally compiled and reported by the states and territories. OCSE assumes no responsibility or legal liability concerning the data’s accuracy, reliability, completeness, timeliness, or usefulness. This data was originally compiled and reported by the states and territories. OCSE assumes no responsibility or legal liability concerning the data’s accuracy, reliability, completeness, timeliness, or usefulness.
Table 69 International Cases With Support Orders Established Initiated in This State for Five Consecutive Fiscal Years
STATES 2015 2016 2017 2018 2019ALABAMA 12 11 15 15 15
ALASKA 43 45 42 45 41
ARIZONA 21 23 27 23 24
ARKANSAS 7 5 5 4 5
CALIFORNIA 352 289 267 254 255
COLORADO 38 35 38 39 42
CONNECTICUT 43 49 52 51 53
DELAWARE 8 10 11 10 14
DIST. OF COL. 3 3 3 3 4
FLORIDA 170 198 196 189 174
GEORGIA 50 54 55 53 57
GUAM 0 0 0 0 0
HAWAII 16 15 13 15 11
IDAHO 45 38 39 32 30
ILLINOIS 70 67 66 68 66
INDIANA 0 0 0 0 0
IOWA 21 27 20 19 17
KANSAS 16 17 18 18 15
KENTUCKY 25 25 25 27 21
LOUISIANA 5 7 6 5 2
MAINE 143 140 135 132 123
MARYLAND 0 0 0 0 0
MASSACHUSETTS 50 54 68 44 73
MICHIGAN 177 174 165 156 153
MINNESOTA 141 140 127 117 112
MISSISSIPPI 0 0 0 0 0
MISSOURI 39 43 41 33 34
MONTANA 42 41 32 29 23
NEBRASKA 6 8 8 7 7
NEVADA 43 44 40 42 0
NEW HAMPSHIRE 12 14 18 16 17
NEW JERSEY 106 118 112 109 110
NEW MEXICO 5 0 5 5 4
NEW YORK 513 607 588 570 570
NORTH CAROLINA 52 48 47 45 40
NORTH DAKOTA 10 9 26 27 25
OHIO 144 131 123 130 132
OKLAHOMA 17 20 19 22 25
OREGON 57 51 52 45 24
PENNSYLVANIA 92 97 98 102 96
PUERTO RICO 29 29 28 29 29
RHODE ISLAND 6 6 6 5 4
SOUTH CAROLINA 3 3 3 4 8
SOUTH DAKOTA 16 19 19 17 21
TENNESSEE 16 20 24 23 23
TEXAS 80 92 107 103 101
UTAH 43 37 42 44 33
VERMONT 0 0 0 0 0
VIRGIN ISLANDS 0 0 0 0 0
VIRGINIA 99 94 94 98 83
WASHINGTON 312 307 305 291 278
WEST VIRGINIA 8 9 9 8 11
WISCONSIN 54 45 45 44 48
WYOMING 8 6 12 15 13
TOTALS 3,268 3,324 3,296 3,182 3,066
Source: Form OCSE-157, line 2h.
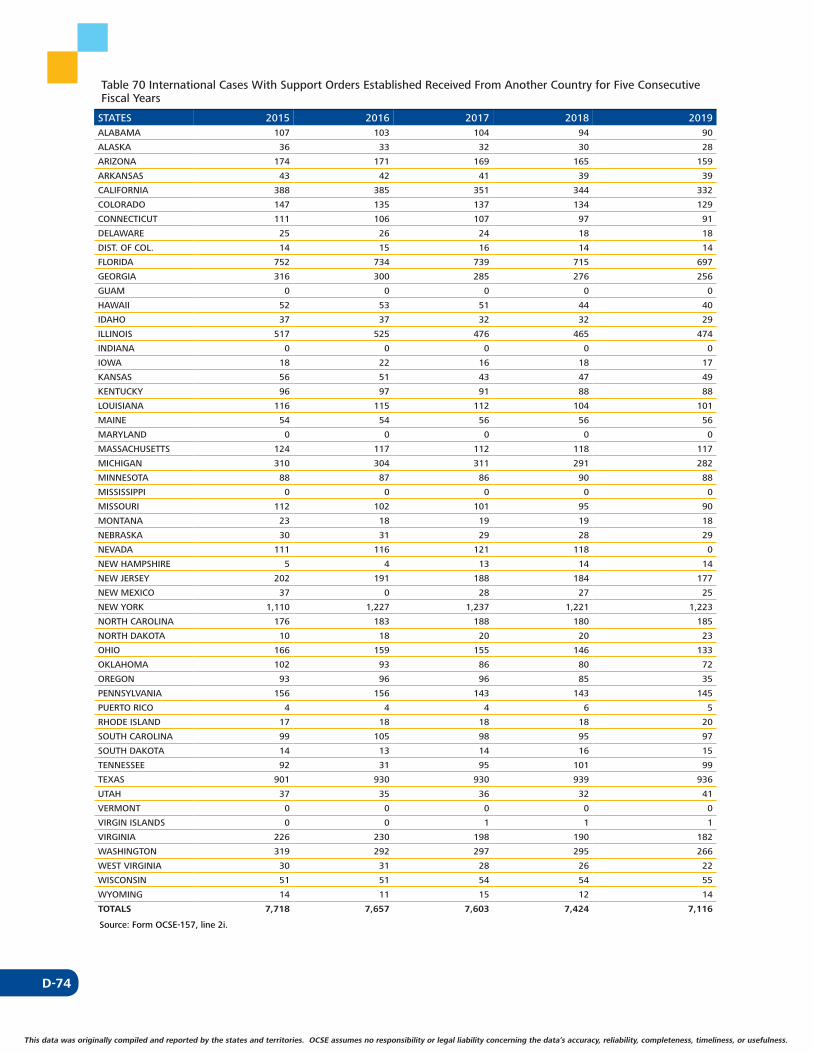
D-74
This data was originally compiled and reported by the states and territories. OCSE assumes no responsibility or legal liability concerning the data’s accuracy, reliability, completeness, timeliness, or usefulness.
Table 70 International Cases With Support Orders Established Received From Another Country for Five Consecutive Fiscal Years
STATES 2015 2016 2017 2018 2019ALABAMA 107 103 104 94 90
ALASKA 36 33 32 30 28
ARIZONA 174 171 169 165 159
ARKANSAS 43 42 41 39 39
CALIFORNIA 388 385 351 344 332
COLORADO 147 135 137 134 129
CONNECTICUT 111 106 107 97 91
DELAWARE 25 26 24 18 18
DIST. OF COL. 14 15 16 14 14
FLORIDA 752 734 739 715 697
GEORGIA 316 300 285 276 256
GUAM 0 0 0 0 0
HAWAII 52 53 51 44 40
IDAHO 37 37 32 32 29
ILLINOIS 517 525 476 465 474
INDIANA 0 0 0 0 0
IOWA 18 22 16 18 17
KANSAS 56 51 43 47 49
KENTUCKY 96 97 91 88 88
LOUISIANA 116 115 112 104 101
MAINE 54 54 56 56 56
MARYLAND 0 0 0 0 0
MASSACHUSETTS 124 117 112 118 117
MICHIGAN 310 304 311 291 282
MINNESOTA 88 87 86 90 88
MISSISSIPPI 0 0 0 0 0
MISSOURI 112 102 101 95 90
MONTANA 23 18 19 19 18
NEBRASKA 30 31 29 28 29
NEVADA 111 116 121 118 0
NEW HAMPSHIRE 5 4 13 14 14
NEW JERSEY 202 191 188 184 177
NEW MEXICO 37 0 28 27 25
NEW YORK 1,110 1,227 1,237 1,221 1,223
NORTH CAROLINA 176 183 188 180 185
NORTH DAKOTA 10 18 20 20 23
OHIO 166 159 155 146 133
OKLAHOMA 102 93 86 80 72
OREGON 93 96 96 85 35
PENNSYLVANIA 156 156 143 143 145
PUERTO RICO 4 4 4 6 5
RHODE ISLAND 17 18 18 18 20
SOUTH CAROLINA 99 105 98 95 97
SOUTH DAKOTA 14 13 14 16 15
TENNESSEE 92 31 95 101 99
TEXAS 901 930 930 939 936
UTAH 37 35 36 32 41
VERMONT 0 0 0 0 0
VIRGIN ISLANDS 0 0 1 1 1
VIRGINIA 226 230 198 190 182
WASHINGTON 319 292 297 295 266
WEST VIRGINIA 30 31 28 26 22
WISCONSIN 51 51 54 54 55
WYOMING 14 11 15 12 14
TOTALS 7,718 7,657 7,603 7,424 7,116
Source: Form OCSE-157, line 2i.

D-75
This data was originally compiled and reported by the states and territories. OCSE assumes no responsibility or legal liability concerning the data’s accuracy, reliability, completeness, timeliness, or usefulness. This data was originally compiled and reported by the states and territories. OCSE assumes no responsibility or legal liability concerning the data’s accuracy, reliability, completeness, timeliness, or usefulness.
Paternities
Table 71 Total Number of Paternities Established or Acknowledged for Five Consecutive Fiscal Years
STATES 2015 2016 2017 2018 2019ALABAMA 5,854 5,918 5,222 4,577 4,410
ALASKA 3,775 3,755 3,243 3,347 3,367
ARIZONA 46,617 47,656 49,001 52,315 49,456
ARKANSAS 12,595 11,896 11,146 12,372 11,786
CALIFORNIA 191,101 186,631 174,589 164,088 159,106
COLORADO 13,194 13,260 12,662 12,410 12,886
CONNECTICUT 20,453 18,467 17,456 16,988 16,929
DELAWARE 2,289 1,854 1,702 1,925 1,510
DIST. OF COL. 7,657 6,971 6,971 6,167 4,442
FLORIDA 92,229 96,019 96,053 94,736 93,109
GEORGIA 42,384 44,991 46,147 43,759 44,500
GUAM 790 778 805 809 832
HAWAII 9,434 9,235 8,807 9,020 8,604
IDAHO 8,976 9,024 7,550 5,734 6,835
ILLINOIS 58,335 56,279 60,144 57,576 56,265
INDIANA 5,164 5,272 4,658 4,130 4,030
IOWA 12,418 12,533 12,350 12,120 11,798
KANSAS 20,855 22,474 21,087 19,380 19,426
KENTUCKY 7,686 8,351 8,229 7,456 7,325
LOUISIANA 4,701 4,202 3,697 3,298 3,384
MAINE 4,806 4,230 4,073 4,474 4,340
MARYLAND 6,169 5,251 4,945 4,337 3,925
MASSACHUSETTS 19,786 19,301 20,978 20,268 21,308
MICHIGAN 54,685 48,866 47,127 44,810 44,141
MINNESOTA 24,000 23,611 16,648 21,989 21,590
MISSISSIPPI 21,432 15,854 13,077 16,419 29,726
MISSOURI 32,053 29,315 28,374 28,261 28,113
MONTANA 4,115 4,249 3,910 3,903 3,502
NEBRASKA 9,787 9,616 9,333 9,330 9,144
NEVADA 1,946 1,739 1,941 14,493 15,010
NEW HAMPSHIRE 982 954 719 704 3,501
NEW JERSEY 36,618 35,764 34,346 32,509 31,875
NEW MEXICO 3,781 3,690 3,907 3,836 3,308
NEW YORK 99,346 114,911 118,969 114,572 109,321
NORTH CAROLINA 57,027 64,502 60,695 60,760 62,689
NORTH DAKOTA 5,803 5,810 5,689 5,574 6,366
OHIO 53,170 53,955 52,189 51,130 51,275
OKLAHOMA 19,405 19,663 17,797 17,680 15,631
OREGON 15,473 15,200 15,554 14,752 13,076
PENNSYLVANIA 64,175 62,135 56,556 59,812 58,544
PUERTO RICO 21,854 19,824 17,379 14,515 14,112
RHODE ISLAND 1,410 1,134 828 866 639
SOUTH CAROLINA 22,981 21,539 21,311 19,899 20,170
SOUTH DAKOTA 4,027 3,938 3,897 3,936 3,808
TENNESSEE 51,812 50,394 48,790 47,839 46,502
TEXAS 172,260 168,419 165,783 157,815 157,084
UTAH 9,996 9,991 9,583 9,218 9,199
VERMONT 789 726 641 594 514
VIRGIN ISLANDS 77 68 58 91 32
VIRGINIA 30,531 30,145 29,106 30,599 30,011
WASHINGTON 30,634 32,732 33,223 32,039 29,122
WEST VIRGINIA 9,483 8,287 8,638 7,935 7,915
WISCONSIN 25,252 24,893 24,566 23,714 23,580
WYOMING 2,305 2,471 2,353 2,320 2,199
TOTALS 1,484,477 1,478,743 1,434,502 1,413,200 1,401,272
Source: Form OCSE-157, lines 10 and 16, column A.
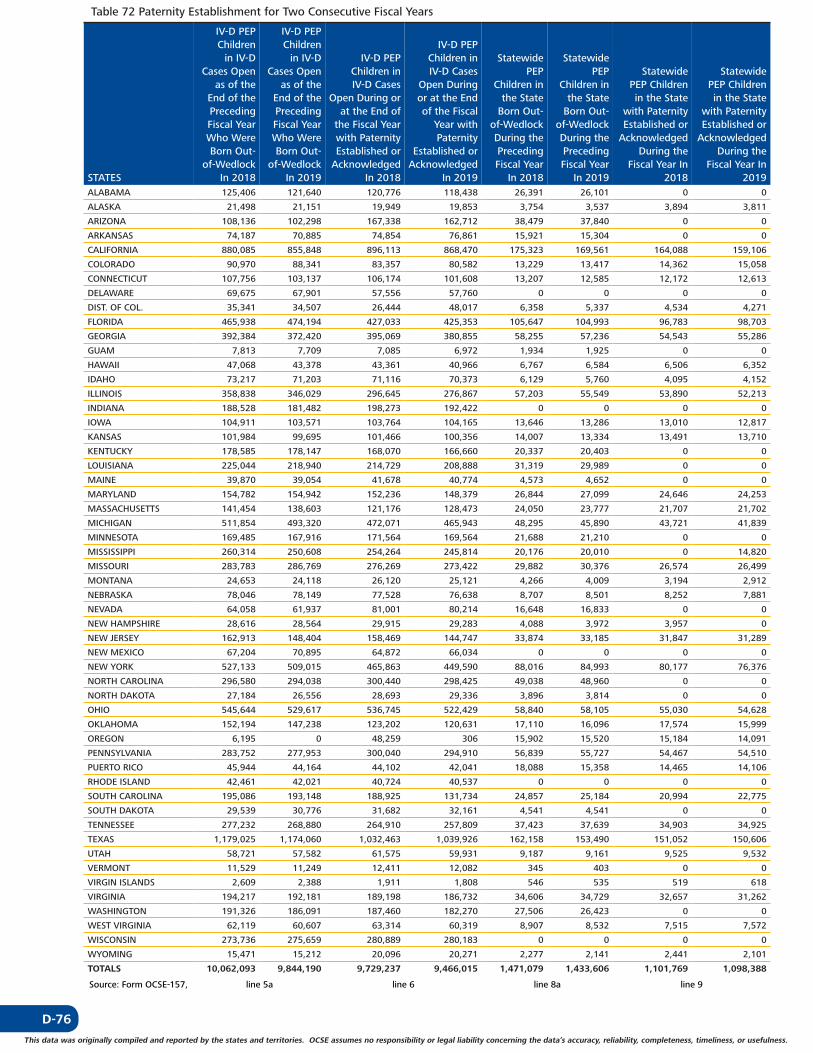
D-76
This data was originally compiled and reported by the states and territories. OCSE assumes no responsibility or legal liability concerning the data’s accuracy, reliability, completeness, timeliness, or usefulness.
Table 72 Paternity Establishment for Two Consecutive Fiscal Years
STATES
IV-D PEP Children
in IV-D Cases Open
as of the End of the Preceding Fiscal Year Who Were Born Out-
of-Wedlock In 2018
IV-D PEP Children
in IV-D Cases Open
as of the End of the Preceding Fiscal Year Who Were Born Out-
of-Wedlock In 2019
IV-D PEP Children in IV-D Cases
Open During or at the End of
the Fiscal Year with Paternity Established or
Acknowledged In 2018
IV-D PEP Children in IV-D Cases
Open During or at the End of the Fiscal
Year with Paternity
Established or Acknowledged
In 2019
Statewide PEP
Children in the State
Born Out-of-Wedlock During the Preceding Fiscal Year
In 2018
Statewide PEP
Children in the State
Born Out-of-Wedlock During the Preceding Fiscal Year
In 2019
Statewide PEP Children in the State
with Paternity Established or
Acknowledged During the
Fiscal Year In 2018
Statewide PEP Children in the State
with Paternity Established or
Acknowledged During the
Fiscal Year In 2019
ALABAMA 125,406 121,640 120,776 118,438 26,391 26,101 0 0
ALASKA 21,498 21,151 19,949 19,853 3,754 3,537 3,894 3,811
ARIZONA 108,136 102,298 167,338 162,712 38,479 37,840 0 0
ARKANSAS 74,187 70,885 74,854 76,861 15,921 15,304 0 0
CALIFORNIA 880,085 855,848 896,113 868,470 175,323 169,561 164,088 159,106
COLORADO 90,970 88,341 83,357 80,582 13,229 13,417 14,362 15,058
CONNECTICUT 107,756 103,137 106,174 101,608 13,207 12,585 12,172 12,613
DELAWARE 69,675 67,901 57,556 57,760 0 0 0 0
DIST. OF COL. 35,341 34,507 26,444 48,017 6,358 5,337 4,534 4,271
FLORIDA 465,938 474,194 427,033 425,353 105,647 104,993 96,783 98,703
GEORGIA 392,384 372,420 395,069 380,855 58,255 57,236 54,543 55,286
GUAM 7,813 7,709 7,085 6,972 1,934 1,925 0 0
HAWAII 47,068 43,378 43,361 40,966 6,767 6,584 6,506 6,352
IDAHO 73,217 71,203 71,116 70,373 6,129 5,760 4,095 4,152
ILLINOIS 358,838 346,029 296,645 276,867 57,203 55,549 53,890 52,213
INDIANA 188,528 181,482 198,273 192,422 0 0 0 0
IOWA 104,911 103,571 103,764 104,165 13,646 13,286 13,010 12,817
KANSAS 101,984 99,695 101,466 100,356 14,007 13,334 13,491 13,710
KENTUCKY 178,585 178,147 168,070 166,660 20,337 20,403 0 0
LOUISIANA 225,044 218,940 214,729 208,888 31,319 29,989 0 0
MAINE 39,870 39,054 41,678 40,774 4,573 4,652 0 0
MARYLAND 154,782 154,942 152,236 148,379 26,844 27,099 24,646 24,253
MASSACHUSETTS 141,454 138,603 121,176 128,473 24,050 23,777 21,707 21,702
MICHIGAN 511,854 493,320 472,071 465,943 48,295 45,890 43,721 41,839
MINNESOTA 169,485 167,916 171,564 169,564 21,688 21,210 0 0
MISSISSIPPI 260,314 250,608 254,264 245,814 20,176 20,010 0 14,820
MISSOURI 283,783 286,769 276,269 273,422 29,882 30,376 26,574 26,499
MONTANA 24,653 24,118 26,120 25,121 4,266 4,009 3,194 2,912
NEBRASKA 78,046 78,149 77,528 76,638 8,707 8,501 8,252 7,881
NEVADA 64,058 61,937 81,001 80,214 16,648 16,833 0 0
NEW HAMPSHIRE 28,616 28,564 29,915 29,283 4,088 3,972 3,957 0
NEW JERSEY 162,913 148,404 158,469 144,747 33,874 33,185 31,847 31,289
NEW MEXICO 67,204 70,895 64,872 66,034 0 0 0 0
NEW YORK 527,133 509,015 465,863 449,590 88,016 84,993 80,177 76,376
NORTH CAROLINA 296,580 294,038 300,440 298,425 49,038 48,960 0 0
NORTH DAKOTA 27,184 26,556 28,693 29,336 3,896 3,814 0 0
OHIO 545,644 529,617 536,745 522,429 58,840 58,105 55,030 54,628
OKLAHOMA 152,194 147,238 123,202 120,631 17,110 16,096 17,574 15,999
OREGON 6,195 0 48,259 306 15,902 15,520 15,184 14,091
PENNSYLVANIA 283,752 277,953 300,040 294,910 56,839 55,727 54,467 54,510
PUERTO RICO 45,944 44,164 44,102 42,041 18,088 15,358 14,465 14,106
RHODE ISLAND 42,461 42,021 40,724 40,537 0 0 0 0
SOUTH CAROLINA 195,086 193,148 188,925 131,734 24,857 25,184 20,994 22,775
SOUTH DAKOTA 29,539 30,776 31,682 32,161 4,541 4,541 0 0
TENNESSEE 277,232 268,880 264,910 257,809 37,423 37,639 34,903 34,925
TEXAS 1,179,025 1,174,060 1,032,463 1,039,926 162,158 153,490 151,052 150,606
UTAH 58,721 57,582 61,575 59,931 9,187 9,161 9,525 9,532
VERMONT 11,529 11,249 12,411 12,082 345 403 0 0
VIRGIN ISLANDS 2,609 2,388 1,911 1,808 546 535 519 618
VIRGINIA 194,217 192,181 189,198 186,732 34,606 34,729 32,657 31,262
WASHINGTON 191,326 186,091 187,460 182,270 27,506 26,423 0 0
WEST VIRGINIA 62,119 60,607 63,314 60,319 8,907 8,532 7,515 7,572
WISCONSIN 273,736 275,659 280,889 280,183 0 0 0 0
WYOMING 15,471 15,212 20,096 20,271 2,277 2,141 2,441 2,101
TOTALS 10,062,093 9,844,190 9,729,237 9,466,015 1,471,079 1,433,606 1,101,769 1,098,388
Source: Form OCSE-157, line 5a line 6 line 8a line 9
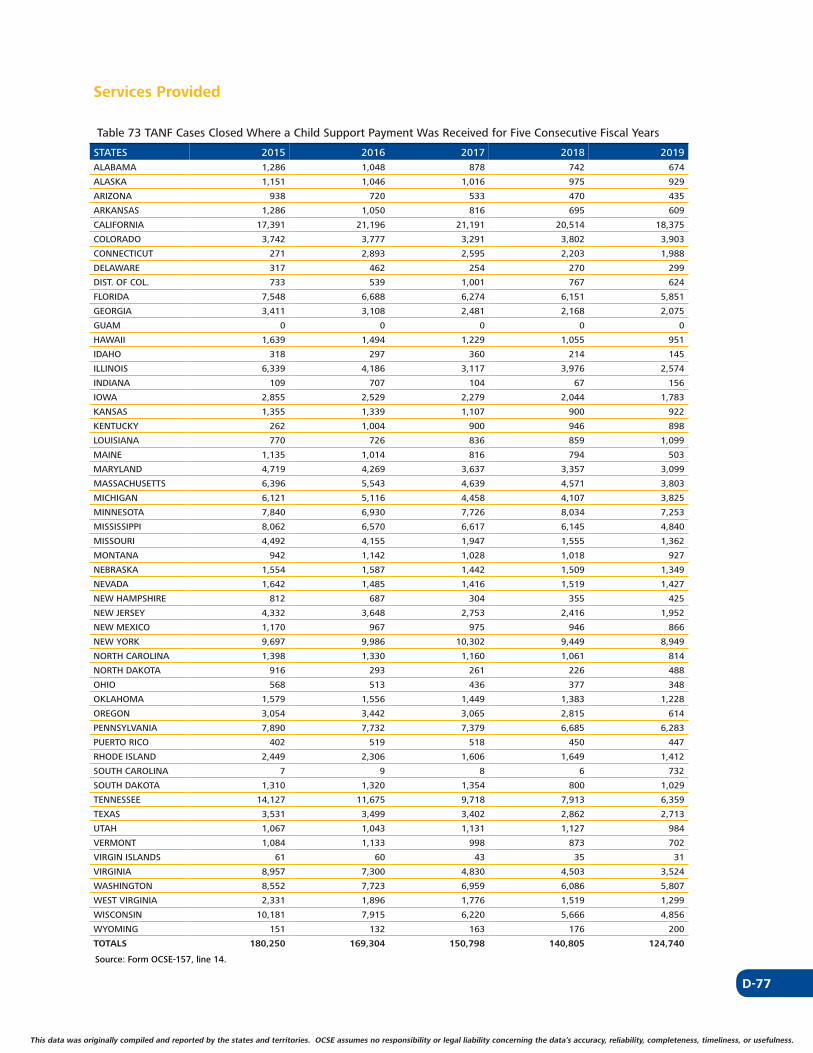
D-77
This data was originally compiled and reported by the states and territories. OCSE assumes no responsibility or legal liability concerning the data’s accuracy, reliability, completeness, timeliness, or usefulness. This data was originally compiled and reported by the states and territories. OCSE assumes no responsibility or legal liability concerning the data’s accuracy, reliability, completeness, timeliness, or usefulness.
Services Provided
Table 73 TANF Cases Closed Where a Child Support Payment Was Received for Five Consecutive Fiscal Years
STATES 2015 2016 2017 2018 2019ALABAMA 1,286 1,048 878 742 674
ALASKA 1,151 1,046 1,016 975 929
ARIZONA 938 720 533 470 435
ARKANSAS 1,286 1,050 816 695 609
CALIFORNIA 17,391 21,196 21,191 20,514 18,375
COLORADO 3,742 3,777 3,291 3,802 3,903
CONNECTICUT 271 2,893 2,595 2,203 1,988
DELAWARE 317 462 254 270 299
DIST. OF COL. 733 539 1,001 767 624
FLORIDA 7,548 6,688 6,274 6,151 5,851
GEORGIA 3,411 3,108 2,481 2,168 2,075
GUAM 0 0 0 0 0
HAWAII 1,639 1,494 1,229 1,055 951
IDAHO 318 297 360 214 145
ILLINOIS 6,339 4,186 3,117 3,976 2,574
INDIANA 109 707 104 67 156
IOWA 2,855 2,529 2,279 2,044 1,783
KANSAS 1,355 1,339 1,107 900 922
KENTUCKY 262 1,004 900 946 898
LOUISIANA 770 726 836 859 1,099
MAINE 1,135 1,014 816 794 503
MARYLAND 4,719 4,269 3,637 3,357 3,099
MASSACHUSETTS 6,396 5,543 4,639 4,571 3,803
MICHIGAN 6,121 5,116 4,458 4,107 3,825
MINNESOTA 7,840 6,930 7,726 8,034 7,253
MISSISSIPPI 8,062 6,570 6,617 6,145 4,840
MISSOURI 4,492 4,155 1,947 1,555 1,362
MONTANA 942 1,142 1,028 1,018 927
NEBRASKA 1,554 1,587 1,442 1,509 1,349
NEVADA 1,642 1,485 1,416 1,519 1,427
NEW HAMPSHIRE 812 687 304 355 425
NEW JERSEY 4,332 3,648 2,753 2,416 1,952
NEW MEXICO 1,170 967 975 946 866
NEW YORK 9,697 9,986 10,302 9,449 8,949
NORTH CAROLINA 1,398 1,330 1,160 1,061 814
NORTH DAKOTA 916 293 261 226 488
OHIO 568 513 436 377 348
OKLAHOMA 1,579 1,556 1,449 1,383 1,228
OREGON 3,054 3,442 3,065 2,815 614
PENNSYLVANIA 7,890 7,732 7,379 6,685 6,283
PUERTO RICO 402 519 518 450 447
RHODE ISLAND 2,449 2,306 1,606 1,649 1,412
SOUTH CAROLINA 7 9 8 6 732
SOUTH DAKOTA 1,310 1,320 1,354 800 1,029
TENNESSEE 14,127 11,675 9,718 7,913 6,359
TEXAS 3,531 3,499 3,402 2,862 2,713
UTAH 1,067 1,043 1,131 1,127 984
VERMONT 1,084 1,133 998 873 702
VIRGIN ISLANDS 61 60 43 35 31
VIRGINIA 8,957 7,300 4,830 4,503 3,524
WASHINGTON 8,552 7,723 6,959 6,086 5,807
WEST VIRGINIA 2,331 1,896 1,776 1,519 1,299
WISCONSIN 10,181 7,915 6,220 5,666 4,856
WYOMING 151 132 163 176 200
TOTALS 180,250 169,304 150,798 140,805 124,740
Source: Form OCSE-157, line 14.
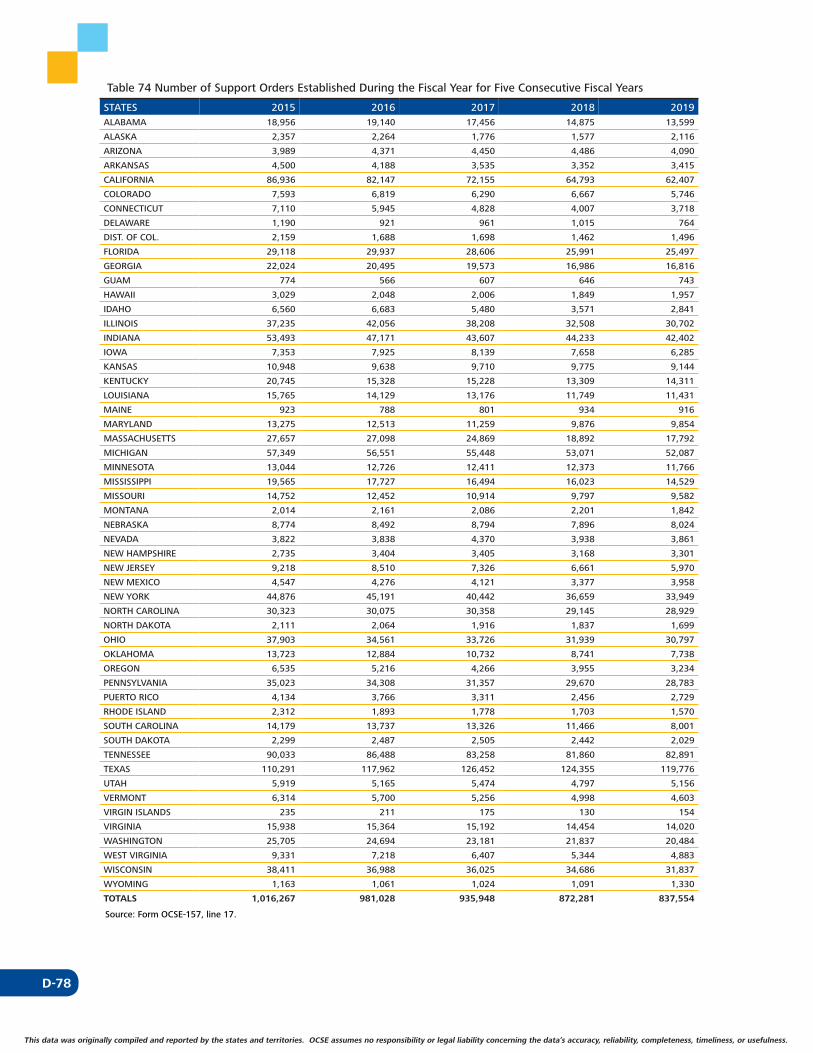
D-78
This data was originally compiled and reported by the states and territories. OCSE assumes no responsibility or legal liability concerning the data’s accuracy, reliability, completeness, timeliness, or usefulness.
Table 74 Number of Support Orders Established During the Fiscal Year for Five Consecutive Fiscal Years
STATES 2015 2016 2017 2018 2019ALABAMA 18,956 19,140 17,456 14,875 13,599
ALASKA 2,357 2,264 1,776 1,577 2,116
ARIZONA 3,989 4,371 4,450 4,486 4,090
ARKANSAS 4,500 4,188 3,535 3,352 3,415
CALIFORNIA 86,936 82,147 72,155 64,793 62,407
COLORADO 7,593 6,819 6,290 6,667 5,746
CONNECTICUT 7,110 5,945 4,828 4,007 3,718
DELAWARE 1,190 921 961 1,015 764
DIST. OF COL. 2,159 1,688 1,698 1,462 1,496
FLORIDA 29,118 29,937 28,606 25,991 25,497
GEORGIA 22,024 20,495 19,573 16,986 16,816
GUAM 774 566 607 646 743
HAWAII 3,029 2,048 2,006 1,849 1,957
IDAHO 6,560 6,683 5,480 3,571 2,841
ILLINOIS 37,235 42,056 38,208 32,508 30,702
INDIANA 53,493 47,171 43,607 44,233 42,402
IOWA 7,353 7,925 8,139 7,658 6,285
KANSAS 10,948 9,638 9,710 9,775 9,144
KENTUCKY 20,745 15,328 15,228 13,309 14,311
LOUISIANA 15,765 14,129 13,176 11,749 11,431
MAINE 923 788 801 934 916
MARYLAND 13,275 12,513 11,259 9,876 9,854
MASSACHUSETTS 27,657 27,098 24,869 18,892 17,792
MICHIGAN 57,349 56,551 55,448 53,071 52,087
MINNESOTA 13,044 12,726 12,411 12,373 11,766
MISSISSIPPI 19,565 17,727 16,494 16,023 14,529
MISSOURI 14,752 12,452 10,914 9,797 9,582
MONTANA 2,014 2,161 2,086 2,201 1,842
NEBRASKA 8,774 8,492 8,794 7,896 8,024
NEVADA 3,822 3,838 4,370 3,938 3,861
NEW HAMPSHIRE 2,735 3,404 3,405 3,168 3,301
NEW JERSEY 9,218 8,510 7,326 6,661 5,970
NEW MEXICO 4,547 4,276 4,121 3,377 3,958
NEW YORK 44,876 45,191 40,442 36,659 33,949
NORTH CAROLINA 30,323 30,075 30,358 29,145 28,929
NORTH DAKOTA 2,111 2,064 1,916 1,837 1,699
OHIO 37,903 34,561 33,726 31,939 30,797
OKLAHOMA 13,723 12,884 10,732 8,741 7,738
OREGON 6,535 5,216 4,266 3,955 3,234
PENNSYLVANIA 35,023 34,308 31,357 29,670 28,783
PUERTO RICO 4,134 3,766 3,311 2,456 2,729
RHODE ISLAND 2,312 1,893 1,778 1,703 1,570
SOUTH CAROLINA 14,179 13,737 13,326 11,466 8,001
SOUTH DAKOTA 2,299 2,487 2,505 2,442 2,029
TENNESSEE 90,033 86,488 83,258 81,860 82,891
TEXAS 110,291 117,962 126,452 124,355 119,776
UTAH 5,919 5,165 5,474 4,797 5,156
VERMONT 6,314 5,700 5,256 4,998 4,603
VIRGIN ISLANDS 235 211 175 130 154
VIRGINIA 15,938 15,364 15,192 14,454 14,020
WASHINGTON 25,705 24,694 23,181 21,837 20,484
WEST VIRGINIA 9,331 7,218 6,407 5,344 4,883
WISCONSIN 38,411 36,988 36,025 34,686 31,837
WYOMING 1,163 1,061 1,024 1,091 1,330
TOTALS 1,016,267 981,028 935,948 872,281 837,554
Source: Form OCSE-157, line 17.

D-79
This data was originally compiled and reported by the states and territories. OCSE assumes no responsibility or legal liability concerning the data’s accuracy, reliability, completeness, timeliness, or usefulness. This data was originally compiled and reported by the states and territories. OCSE assumes no responsibility or legal liability concerning the data’s accuracy, reliability, completeness, timeliness, or usefulness.
Table 75 Number of Cases in Which a Collection Was Made on an Obligation for Five Consecutive Fiscal Years
STATES 2015 2016 2017 2018 2019ALABAMA 137,798 138,317 136,193 133,357 130,751
ALASKA 33,638 33,249 32,438 31,066 30,651
ARIZONA 105,276 104,223 104,654 102,773 99,837
ARKANSAS 82,806 80,991 78,217 75,828 73,302
CALIFORNIA 711,114 716,474 712,781 706,182 696,807
COLORADO 116,098 115,289 112,993 111,300 108,805
CONNECTICUT 88,529 89,605 86,585 84,616 83,976
DELAWARE 30,082 30,320 30,249 29,737 29,325
DIST. OF COL. 19,908 19,745 19,912 19,524 19,035
FLORIDA 471,818 466,165 461,109 456,355 454,898
GEORGIA 246,698 248,036 247,512 242,562 236,844
GUAM 3,471 3,239 3,082 2,987 2,847
HAWAII 25,196 24,180 23,308 22,673 22,571
IDAHO 64,032 64,366 63,017 59,529 56,166
ILLINOIS 249,145 256,293 251,062 244,172 240,378
INDIANA 194,758 193,912 186,221 180,428 176,080
IOWA 134,569 132,837 130,673 128,483 125,476
KANSAS 79,337 80,776 80,891 81,438 81,688
KENTUCKY 165,559 162,918 158,216 152,869 149,651
LOUISIANA 138,623 136,050 137,104 137,094 136,744
MAINE 35,517 35,234 34,238 33,564 32,682
MARYLAND 149,882 148,057 144,521 140,001 135,486
MASSACHUSETTS 137,870 136,441 133,103 123,145 118,813
MICHIGAN 429,696 446,279 443,321 439,280 435,159
MINNESOTA 157,961 153,994 150,592 146,795 142,838
MISSISSIPPI 153,619 156,440 154,703 155,524 155,447
MISSOURI 222,393 218,858 211,273 205,393 205,849
MONTANA 26,538 25,442 25,029 24,721 24,058
NEBRASKA 74,603 74,213 73,847 73,268 72,746
NEVADA 64,577 65,155 66,074 65,708 65,281
NEW HAMPSHIRE 22,601 22,392 21,928 21,297 21,063
NEW JERSEY 226,223 224,647 218,776 209,161 204,507
NEW MEXICO 38,702 38,612 38,658 37,957 37,514
NEW YORK 459,619 456,729 447,365 436,996 427,984
NORTH CAROLINA 276,695 274,274 270,552 265,887 260,155
NORTH DAKOTA 25,915 25,364 24,580 23,659 22,830
OHIO 563,837 556,088 544,824 534,890 525,303
OKLAHOMA 129,142 128,230 124,020 120,740 116,705
OREGON 114,351 112,863 109,773 107,990 96,652
PENNSYLVANIA 297,063 291,571 284,803 284,567 277,598
PUERTO RICO 112,513 112,770 109,035 104,478 105,249
RHODE ISLAND 24,163 23,486 22,495 21,450 21,398
SOUTH CAROLINA 109,299 110,536 115,234 109,236 92,748
SOUTH DAKOTA 30,060 29,909 29,545 29,821 29,627
TENNESSEE 227,015 227,279 225,218 221,907 219,907
TEXAS 946,748 960,422 977,621 987,048 991,460
UTAH 62,229 61,581 60,147 58,630 56,991
VERMONT 13,084 12,698 12,093 11,713 11,302
VIRGIN ISLANDS 3,175 3,205 2,682 2,406 2,308
VIRGINIA 225,356 223,976 219,627 214,937 209,948
WASHINGTON 244,299 240,293 234,131 228,280 221,758
WEST VIRGINIA 73,180 70,314 66,605 62,651 60,423
WISCONSIN 227,919 227,240 224,496 220,837 213,937
WYOMING 24,402 23,487 22,711 22,821 22,201
TOTALS 9,028,701 9,015,064 8,899,837 8,749,731 8,593,759
Source: Form OCSE-157, line 18.
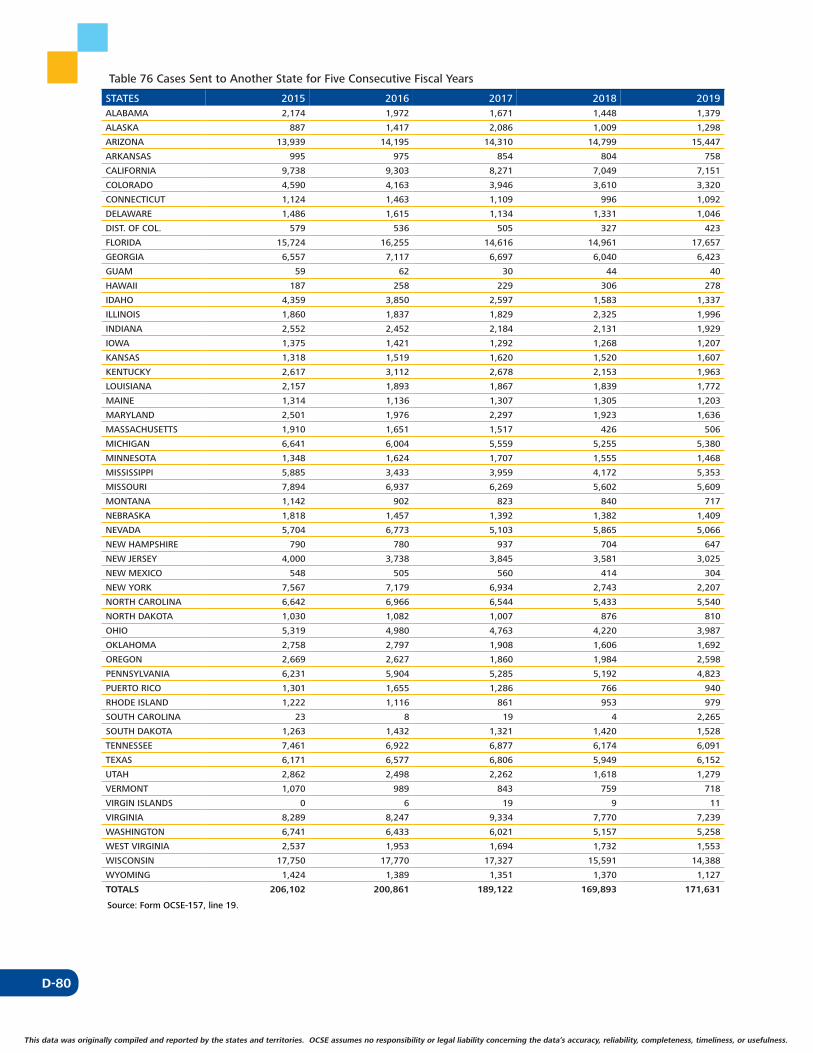
D-80
This data was originally compiled and reported by the states and territories. OCSE assumes no responsibility or legal liability concerning the data’s accuracy, reliability, completeness, timeliness, or usefulness.
Table 76 Cases Sent to Another State for Five Consecutive Fiscal Years
STATES 2015 2016 2017 2018 2019ALABAMA 2,174 1,972 1,671 1,448 1,379
ALASKA 887 1,417 2,086 1,009 1,298
ARIZONA 13,939 14,195 14,310 14,799 15,447
ARKANSAS 995 975 854 804 758
CALIFORNIA 9,738 9,303 8,271 7,049 7,151
COLORADO 4,590 4,163 3,946 3,610 3,320
CONNECTICUT 1,124 1,463 1,109 996 1,092
DELAWARE 1,486 1,615 1,134 1,331 1,046
DIST. OF COL. 579 536 505 327 423
FLORIDA 15,724 16,255 14,616 14,961 17,657
GEORGIA 6,557 7,117 6,697 6,040 6,423
GUAM 59 62 30 44 40
HAWAII 187 258 229 306 278
IDAHO 4,359 3,850 2,597 1,583 1,337
ILLINOIS 1,860 1,837 1,829 2,325 1,996
INDIANA 2,552 2,452 2,184 2,131 1,929
IOWA 1,375 1,421 1,292 1,268 1,207
KANSAS 1,318 1,519 1,620 1,520 1,607
KENTUCKY 2,617 3,112 2,678 2,153 1,963
LOUISIANA 2,157 1,893 1,867 1,839 1,772
MAINE 1,314 1,136 1,307 1,305 1,203
MARYLAND 2,501 1,976 2,297 1,923 1,636
MASSACHUSETTS 1,910 1,651 1,517 426 506
MICHIGAN 6,641 6,004 5,559 5,255 5,380
MINNESOTA 1,348 1,624 1,707 1,555 1,468
MISSISSIPPI 5,885 3,433 3,959 4,172 5,353
MISSOURI 7,894 6,937 6,269 5,602 5,609
MONTANA 1,142 902 823 840 717
NEBRASKA 1,818 1,457 1,392 1,382 1,409
NEVADA 5,704 6,773 5,103 5,865 5,066
NEW HAMPSHIRE 790 780 937 704 647
NEW JERSEY 4,000 3,738 3,845 3,581 3,025
NEW MEXICO 548 505 560 414 304
NEW YORK 7,567 7,179 6,934 2,743 2,207
NORTH CAROLINA 6,642 6,966 6,544 5,433 5,540
NORTH DAKOTA 1,030 1,082 1,007 876 810
OHIO 5,319 4,980 4,763 4,220 3,987
OKLAHOMA 2,758 2,797 1,908 1,606 1,692
OREGON 2,669 2,627 1,860 1,984 2,598
PENNSYLVANIA 6,231 5,904 5,285 5,192 4,823
PUERTO RICO 1,301 1,655 1,286 766 940
RHODE ISLAND 1,222 1,116 861 953 979
SOUTH CAROLINA 23 8 19 4 2,265
SOUTH DAKOTA 1,263 1,432 1,321 1,420 1,528
TENNESSEE 7,461 6,922 6,877 6,174 6,091
TEXAS 6,171 6,577 6,806 5,949 6,152
UTAH 2,862 2,498 2,262 1,618 1,279
VERMONT 1,070 989 843 759 718
VIRGIN ISLANDS 0 6 19 9 11
VIRGINIA 8,289 8,247 9,334 7,770 7,239
WASHINGTON 6,741 6,433 6,021 5,157 5,258
WEST VIRGINIA 2,537 1,953 1,694 1,732 1,553
WISCONSIN 17,750 17,770 17,327 15,591 14,388
WYOMING 1,424 1,389 1,351 1,370 1,127
TOTALS 206,102 200,861 189,122 169,893 171,631
Source: Form OCSE-157, line 19.
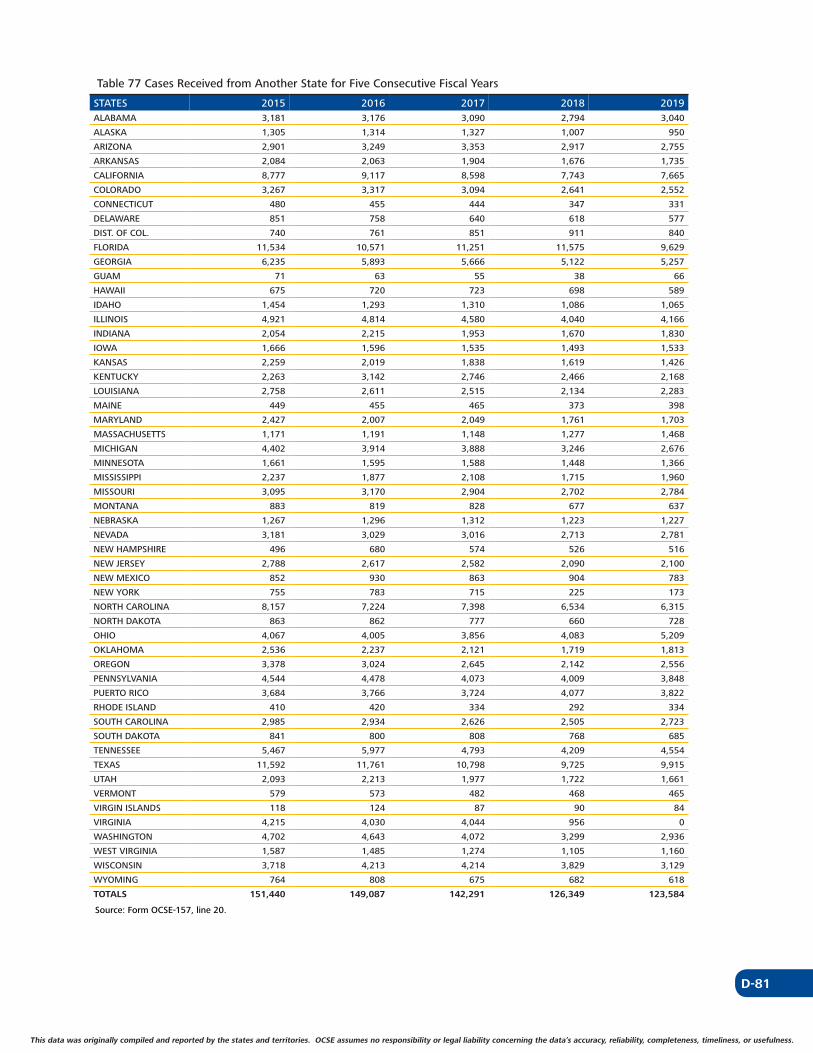
D-81
This data was originally compiled and reported by the states and territories. OCSE assumes no responsibility or legal liability concerning the data’s accuracy, reliability, completeness, timeliness, or usefulness. This data was originally compiled and reported by the states and territories. OCSE assumes no responsibility or legal liability concerning the data’s accuracy, reliability, completeness, timeliness, or usefulness.
Table 77 Cases Received from Another State for Five Consecutive Fiscal Years
STATES 2015 2016 2017 2018 2019ALABAMA 3,181 3,176 3,090 2,794 3,040
ALASKA 1,305 1,314 1,327 1,007 950
ARIZONA 2,901 3,249 3,353 2,917 2,755
ARKANSAS 2,084 2,063 1,904 1,676 1,735
CALIFORNIA 8,777 9,117 8,598 7,743 7,665
COLORADO 3,267 3,317 3,094 2,641 2,552
CONNECTICUT 480 455 444 347 331
DELAWARE 851 758 640 618 577
DIST. OF COL. 740 761 851 911 840
FLORIDA 11,534 10,571 11,251 11,575 9,629
GEORGIA 6,235 5,893 5,666 5,122 5,257
GUAM 71 63 55 38 66
HAWAII 675 720 723 698 589
IDAHO 1,454 1,293 1,310 1,086 1,065
ILLINOIS 4,921 4,814 4,580 4,040 4,166
INDIANA 2,054 2,215 1,953 1,670 1,830
IOWA 1,666 1,596 1,535 1,493 1,533
KANSAS 2,259 2,019 1,838 1,619 1,426
KENTUCKY 2,263 3,142 2,746 2,466 2,168
LOUISIANA 2,758 2,611 2,515 2,134 2,283
MAINE 449 455 465 373 398
MARYLAND 2,427 2,007 2,049 1,761 1,703
MASSACHUSETTS 1,171 1,191 1,148 1,277 1,468
MICHIGAN 4,402 3,914 3,888 3,246 2,676
MINNESOTA 1,661 1,595 1,588 1,448 1,366
MISSISSIPPI 2,237 1,877 2,108 1,715 1,960
MISSOURI 3,095 3,170 2,904 2,702 2,784
MONTANA 883 819 828 677 637
NEBRASKA 1,267 1,296 1,312 1,223 1,227
NEVADA 3,181 3,029 3,016 2,713 2,781
NEW HAMPSHIRE 496 680 574 526 516
NEW JERSEY 2,788 2,617 2,582 2,090 2,100
NEW MEXICO 852 930 863 904 783
NEW YORK 755 783 715 225 173
NORTH CAROLINA 8,157 7,224 7,398 6,534 6,315
NORTH DAKOTA 863 862 777 660 728
OHIO 4,067 4,005 3,856 4,083 5,209
OKLAHOMA 2,536 2,237 2,121 1,719 1,813
OREGON 3,378 3,024 2,645 2,142 2,556
PENNSYLVANIA 4,544 4,478 4,073 4,009 3,848
PUERTO RICO 3,684 3,766 3,724 4,077 3,822
RHODE ISLAND 410 420 334 292 334
SOUTH CAROLINA 2,985 2,934 2,626 2,505 2,723
SOUTH DAKOTA 841 800 808 768 685
TENNESSEE 5,467 5,977 4,793 4,209 4,554
TEXAS 11,592 11,761 10,798 9,725 9,915
UTAH 2,093 2,213 1,977 1,722 1,661
VERMONT 579 573 482 468 465
VIRGIN ISLANDS 118 124 87 90 84
VIRGINIA 4,215 4,030 4,044 956 0
WASHINGTON 4,702 4,643 4,072 3,299 2,936
WEST VIRGINIA 1,587 1,485 1,274 1,105 1,160
WISCONSIN 3,718 4,213 4,214 3,829 3,129
WYOMING 764 808 675 682 618
TOTALS 151,440 149,087 142,291 126,349 123,584
Source: Form OCSE-157, line 20.
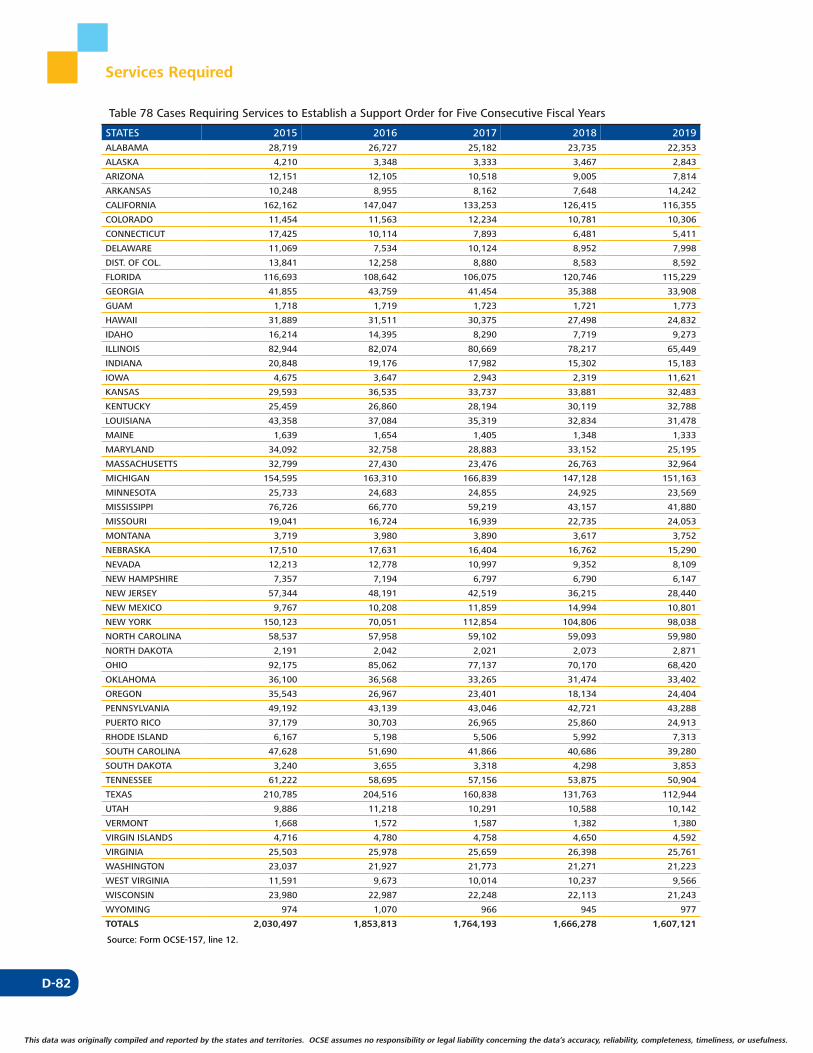
D-82
This data was originally compiled and reported by the states and territories. OCSE assumes no responsibility or legal liability concerning the data’s accuracy, reliability, completeness, timeliness, or usefulness.
Services Required
Table 78 Cases Requiring Services to Establish a Support Order for Five Consecutive Fiscal Years
STATES 2015 2016 2017 2018 2019ALABAMA 28,719 26,727 25,182 23,735 22,353
ALASKA 4,210 3,348 3,333 3,467 2,843
ARIZONA 12,151 12,105 10,518 9,005 7,814
ARKANSAS 10,248 8,955 8,162 7,648 14,242
CALIFORNIA 162,162 147,047 133,253 126,415 116,355
COLORADO 11,454 11,563 12,234 10,781 10,306
CONNECTICUT 17,425 10,114 7,893 6,481 5,411
DELAWARE 11,069 7,534 10,124 8,952 7,998
DIST. OF COL. 13,841 12,258 8,880 8,583 8,592
FLORIDA 116,693 108,642 106,075 120,746 115,229
GEORGIA 41,855 43,759 41,454 35,388 33,908
GUAM 1,718 1,719 1,723 1,721 1,773
HAWAII 31,889 31,511 30,375 27,498 24,832
IDAHO 16,214 14,395 8,290 7,719 9,273
ILLINOIS 82,944 82,074 80,669 78,217 65,449
INDIANA 20,848 19,176 17,982 15,302 15,183
IOWA 4,675 3,647 2,943 2,319 11,621
KANSAS 29,593 36,535 33,737 33,881 32,483
KENTUCKY 25,459 26,860 28,194 30,119 32,788
LOUISIANA 43,358 37,084 35,319 32,834 31,478
MAINE 1,639 1,654 1,405 1,348 1,333
MARYLAND 34,092 32,758 28,883 33,152 25,195
MASSACHUSETTS 32,799 27,430 23,476 26,763 32,964
MICHIGAN 154,595 163,310 166,839 147,128 151,163
MINNESOTA 25,733 24,683 24,855 24,925 23,569
MISSISSIPPI 76,726 66,770 59,219 43,157 41,880
MISSOURI 19,041 16,724 16,939 22,735 24,053
MONTANA 3,719 3,980 3,890 3,617 3,752
NEBRASKA 17,510 17,631 16,404 16,762 15,290
NEVADA 12,213 12,778 10,997 9,352 8,109
NEW HAMPSHIRE 7,357 7,194 6,797 6,790 6,147
NEW JERSEY 57,344 48,191 42,519 36,215 28,440
NEW MEXICO 9,767 10,208 11,859 14,994 10,801
NEW YORK 150,123 70,051 112,854 104,806 98,038
NORTH CAROLINA 58,537 57,958 59,102 59,093 59,980
NORTH DAKOTA 2,191 2,042 2,021 2,073 2,871
OHIO 92,175 85,062 77,137 70,170 68,420
OKLAHOMA 36,100 36,568 33,265 31,474 33,402
OREGON 35,543 26,967 23,401 18,134 24,404
PENNSYLVANIA 49,192 43,139 43,046 42,721 43,288
PUERTO RICO 37,179 30,703 26,965 25,860 24,913
RHODE ISLAND 6,167 5,198 5,506 5,992 7,313
SOUTH CAROLINA 47,628 51,690 41,866 40,686 39,280
SOUTH DAKOTA 3,240 3,655 3,318 4,298 3,853
TENNESSEE 61,222 58,695 57,156 53,875 50,904
TEXAS 210,785 204,516 160,838 131,763 112,944
UTAH 9,886 11,218 10,291 10,588 10,142
VERMONT 1,668 1,572 1,587 1,382 1,380
VIRGIN ISLANDS 4,716 4,780 4,758 4,650 4,592
VIRGINIA 25,503 25,978 25,659 26,398 25,761
WASHINGTON 23,037 21,927 21,773 21,271 21,223
WEST VIRGINIA 11,591 9,673 10,014 10,237 9,566
WISCONSIN 23,980 22,987 22,248 22,113 21,243
WYOMING 974 1,070 966 945 977
TOTALS 2,030,497 1,853,813 1,764,193 1,666,278 1,607,121
Source: Form OCSE-157, line 12.
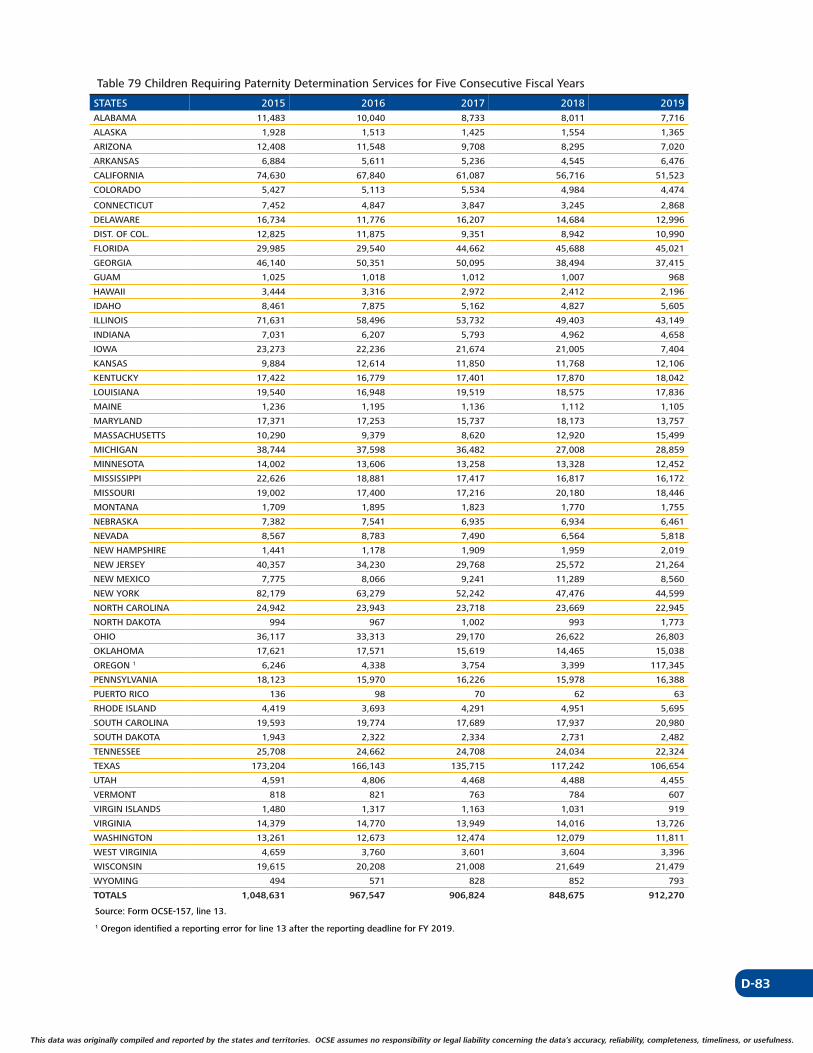
D-83
This data was originally compiled and reported by the states and territories. OCSE assumes no responsibility or legal liability concerning the data’s accuracy, reliability, completeness, timeliness, or usefulness. This data was originally compiled and reported by the states and territories. OCSE assumes no responsibility or legal liability concerning the data’s accuracy, reliability, completeness, timeliness, or usefulness.
Table 79 Children Requiring Paternity Determination Services for Five Consecutive Fiscal Years
STATES 2015 2016 2017 2018 2019ALABAMA 11,483 10,040 8,733 8,011 7,716
ALASKA 1,928 1,513 1,425 1,554 1,365
ARIZONA 12,408 11,548 9,708 8,295 7,020
ARKANSAS 6,884 5,611 5,236 4,545 6,476
CALIFORNIA 74,630 67,840 61,087 56,716 51,523
COLORADO 5,427 5,113 5,534 4,984 4,474
CONNECTICUT 7,452 4,847 3,847 3,245 2,868
DELAWARE 16,734 11,776 16,207 14,684 12,996
DIST. OF COL. 12,825 11,875 9,351 8,942 10,990
FLORIDA 29,985 29,540 44,662 45,688 45,021
GEORGIA 46,140 50,351 50,095 38,494 37,415
GUAM 1,025 1,018 1,012 1,007 968
HAWAII 3,444 3,316 2,972 2,412 2,196
IDAHO 8,461 7,875 5,162 4,827 5,605
ILLINOIS 71,631 58,496 53,732 49,403 43,149
INDIANA 7,031 6,207 5,793 4,962 4,658
IOWA 23,273 22,236 21,674 21,005 7,404
KANSAS 9,884 12,614 11,850 11,768 12,106
KENTUCKY 17,422 16,779 17,401 17,870 18,042
LOUISIANA 19,540 16,948 19,519 18,575 17,836
MAINE 1,236 1,195 1,136 1,112 1,105
MARYLAND 17,371 17,253 15,737 18,173 13,757
MASSACHUSETTS 10,290 9,379 8,620 12,920 15,499
MICHIGAN 38,744 37,598 36,482 27,008 28,859
MINNESOTA 14,002 13,606 13,258 13,328 12,452
MISSISSIPPI 22,626 18,881 17,417 16,817 16,172
MISSOURI 19,002 17,400 17,216 20,180 18,446
MONTANA 1,709 1,895 1,823 1,770 1,755
NEBRASKA 7,382 7,541 6,935 6,934 6,461
NEVADA 8,567 8,783 7,490 6,564 5,818
NEW HAMPSHIRE 1,441 1,178 1,909 1,959 2,019
NEW JERSEY 40,357 34,230 29,768 25,572 21,264
NEW MEXICO 7,775 8,066 9,241 11,289 8,560
NEW YORK 82,179 63,279 52,242 47,476 44,599
NORTH CAROLINA 24,942 23,943 23,718 23,669 22,945
NORTH DAKOTA 994 967 1,002 993 1,773
OHIO 36,117 33,313 29,170 26,622 26,803
OKLAHOMA 17,621 17,571 15,619 14,465 15,038
OREGON 1 6,246 4,338 3,754 3,399 117,345
PENNSYLVANIA 18,123 15,970 16,226 15,978 16,388
PUERTO RICO 136 98 70 62 63
RHODE ISLAND 4,419 3,693 4,291 4,951 5,695
SOUTH CAROLINA 19,593 19,774 17,689 17,937 20,980
SOUTH DAKOTA 1,943 2,322 2,334 2,731 2,482
TENNESSEE 25,708 24,662 24,708 24,034 22,324
TEXAS 173,204 166,143 135,715 117,242 106,654
UTAH 4,591 4,806 4,468 4,488 4,455
VERMONT 818 821 763 784 607
VIRGIN ISLANDS 1,480 1,317 1,163 1,031 919
VIRGINIA 14,379 14,770 13,949 14,016 13,726
WASHINGTON 13,261 12,673 12,474 12,079 11,811
WEST VIRGINIA 4,659 3,760 3,601 3,604 3,396
WISCONSIN 19,615 20,208 21,008 21,649 21,479
WYOMING 494 571 828 852 793
TOTALS 1,048,631 967,547 906,824 848,675 912,270
Source: Form OCSE-157, line 13.
1 Oregon identified a reporting error for line 13 after the reporting deadline for FY 2019.
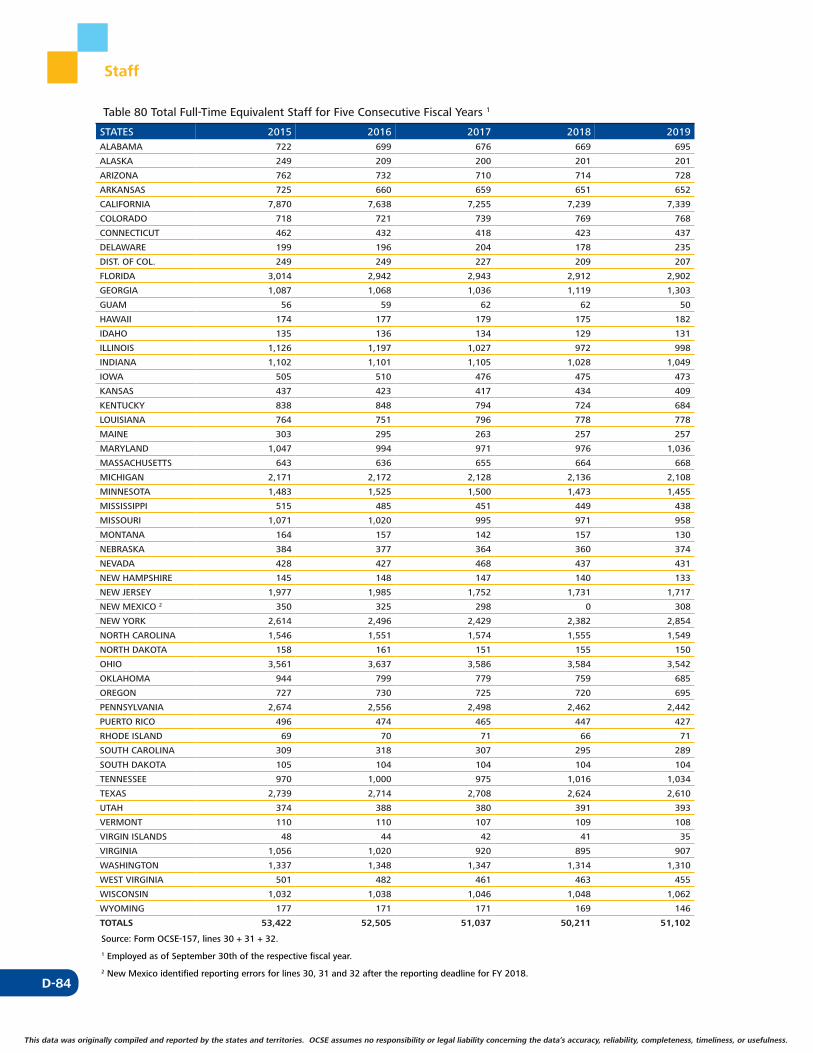
D-84
This data was originally compiled and reported by the states and territories. OCSE assumes no responsibility or legal liability concerning the data’s accuracy, reliability, completeness, timeliness, or usefulness.
Staff
Table 80 Total Full-Time Equivalent Staff for Five Consecutive Fiscal Years 1
STATES 2015 2016 2017 2018 2019ALABAMA 722 699 676 669 695
ALASKA 249 209 200 201 201
ARIZONA 762 732 710 714 728
ARKANSAS 725 660 659 651 652
CALIFORNIA 7,870 7,638 7,255 7,239 7,339
COLORADO 718 721 739 769 768
CONNECTICUT 462 432 418 423 437
DELAWARE 199 196 204 178 235
DIST. OF COL. 249 249 227 209 207
FLORIDA 3,014 2,942 2,943 2,912 2,902
GEORGIA 1,087 1,068 1,036 1,119 1,303
GUAM 56 59 62 62 50
HAWAII 174 177 179 175 182
IDAHO 135 136 134 129 131
ILLINOIS 1,126 1,197 1,027 972 998
INDIANA 1,102 1,101 1,105 1,028 1,049
IOWA 505 510 476 475 473
KANSAS 437 423 417 434 409
KENTUCKY 838 848 794 724 684
LOUISIANA 764 751 796 778 778
MAINE 303 295 263 257 257
MARYLAND 1,047 994 971 976 1,036
MASSACHUSETTS 643 636 655 664 668
MICHIGAN 2,171 2,172 2,128 2,136 2,108
MINNESOTA 1,483 1,525 1,500 1,473 1,455
MISSISSIPPI 515 485 451 449 438
MISSOURI 1,071 1,020 995 971 958
MONTANA 164 157 142 157 130
NEBRASKA 384 377 364 360 374
NEVADA 428 427 468 437 431
NEW HAMPSHIRE 145 148 147 140 133
NEW JERSEY 1,977 1,985 1,752 1,731 1,717
NEW MEXICO 2 350 325 298 0 308
NEW YORK 2,614 2,496 2,429 2,382 2,854
NORTH CAROLINA 1,546 1,551 1,574 1,555 1,549
NORTH DAKOTA 158 161 151 155 150
OHIO 3,561 3,637 3,586 3,584 3,542
OKLAHOMA 944 799 779 759 685
OREGON 727 730 725 720 695
PENNSYLVANIA 2,674 2,556 2,498 2,462 2,442
PUERTO RICO 496 474 465 447 427
RHODE ISLAND 69 70 71 66 71
SOUTH CAROLINA 309 318 307 295 289
SOUTH DAKOTA 105 104 104 104 104
TENNESSEE 970 1,000 975 1,016 1,034
TEXAS 2,739 2,714 2,708 2,624 2,610
UTAH 374 388 380 391 393
VERMONT 110 110 107 109 108
VIRGIN ISLANDS 48 44 42 41 35
VIRGINIA 1,056 1,020 920 895 907
WASHINGTON 1,337 1,348 1,347 1,314 1,310
WEST VIRGINIA 501 482 461 463 455
WISCONSIN 1,032 1,038 1,046 1,048 1,062
WYOMING 177 171 171 169 146
TOTALS 53,422 52,505 51,037 50,211 51,102
Source: Form OCSE-157, lines 30 + 31 + 32.
1 Employed as of September 30th of the respective fiscal year.
2 New Mexico identified reporting errors for lines 30, 31 and 32 after the reporting deadline for FY 2018.
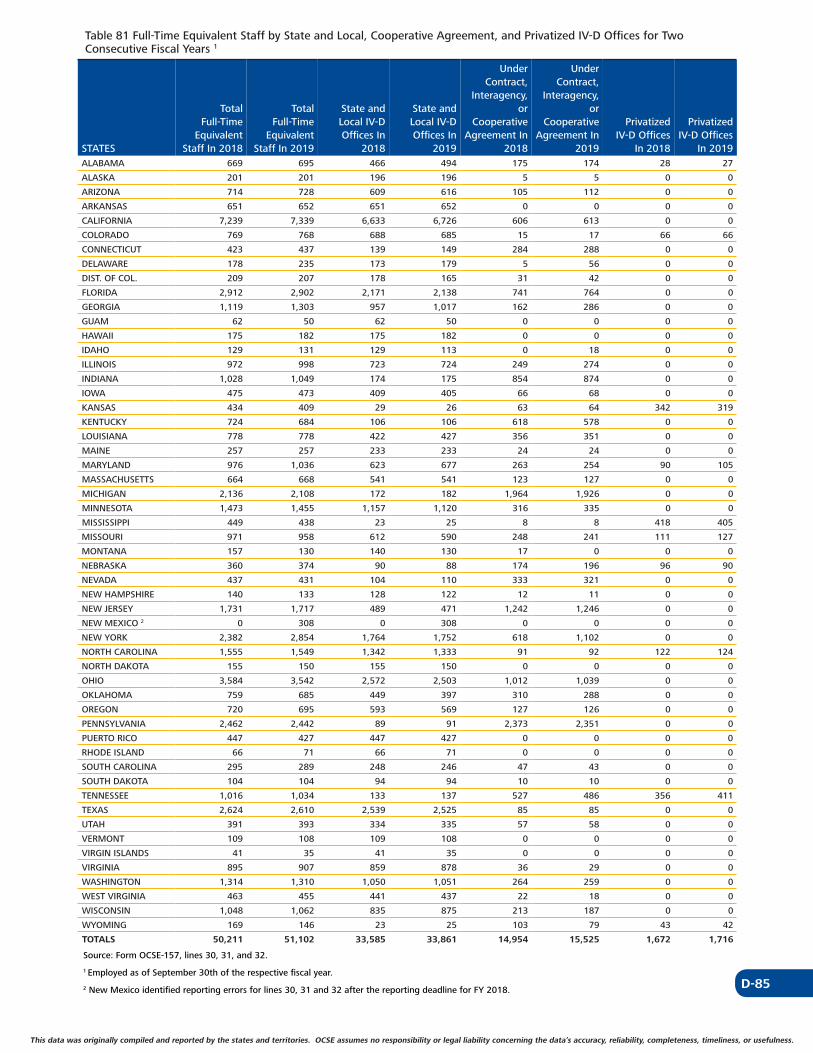
D-85
This data was originally compiled and reported by the states and territories. OCSE assumes no responsibility or legal liability concerning the data’s accuracy, reliability, completeness, timeliness, or usefulness. This data was originally compiled and reported by the states and territories. OCSE assumes no responsibility or legal liability concerning the data’s accuracy, reliability, completeness, timeliness, or usefulness.
Table 81 Full-Time Equivalent Staff by State and Local, Cooperative Agreement, and Privatized IV-D Offices for Two Consecutive Fiscal Years 1
STATES
Total Full-Time
Equivalent Staff In 2018
Total Full-Time
Equivalent Staff In 2019
State and Local IV-D Offices In
2018
State and Local IV-D Offices In
2019
Under Contract,
Interagency, or
Cooperative Agreement In
2018
Under Contract,
Interagency, or
Cooperative Agreement In
2019
Privatized IV-D Offices
In 2018
Privatized IV-D Offices
In 2019ALABAMA 669 695 466 494 175 174 28 27
ALASKA 201 201 196 196 5 5 0 0
ARIZONA 714 728 609 616 105 112 0 0
ARKANSAS 651 652 651 652 0 0 0 0
CALIFORNIA 7,239 7,339 6,633 6,726 606 613 0 0
COLORADO 769 768 688 685 15 17 66 66
CONNECTICUT 423 437 139 149 284 288 0 0
DELAWARE 178 235 173 179 5 56 0 0
DIST. OF COL. 209 207 178 165 31 42 0 0
FLORIDA 2,912 2,902 2,171 2,138 741 764 0 0
GEORGIA 1,119 1,303 957 1,017 162 286 0 0
GUAM 62 50 62 50 0 0 0 0
HAWAII 175 182 175 182 0 0 0 0
IDAHO 129 131 129 113 0 18 0 0
ILLINOIS 972 998 723 724 249 274 0 0
INDIANA 1,028 1,049 174 175 854 874 0 0
IOWA 475 473 409 405 66 68 0 0
KANSAS 434 409 29 26 63 64 342 319
KENTUCKY 724 684 106 106 618 578 0 0
LOUISIANA 778 778 422 427 356 351 0 0
MAINE 257 257 233 233 24 24 0 0
MARYLAND 976 1,036 623 677 263 254 90 105
MASSACHUSETTS 664 668 541 541 123 127 0 0
MICHIGAN 2,136 2,108 172 182 1,964 1,926 0 0
MINNESOTA 1,473 1,455 1,157 1,120 316 335 0 0
MISSISSIPPI 449 438 23 25 8 8 418 405
MISSOURI 971 958 612 590 248 241 111 127
MONTANA 157 130 140 130 17 0 0 0
NEBRASKA 360 374 90 88 174 196 96 90
NEVADA 437 431 104 110 333 321 0 0
NEW HAMPSHIRE 140 133 128 122 12 11 0 0
NEW JERSEY 1,731 1,717 489 471 1,242 1,246 0 0
NEW MEXICO 2 0 308 0 308 0 0 0 0
NEW YORK 2,382 2,854 1,764 1,752 618 1,102 0 0
NORTH CAROLINA 1,555 1,549 1,342 1,333 91 92 122 124
NORTH DAKOTA 155 150 155 150 0 0 0 0
OHIO 3,584 3,542 2,572 2,503 1,012 1,039 0 0
OKLAHOMA 759 685 449 397 310 288 0 0
OREGON 720 695 593 569 127 126 0 0
PENNSYLVANIA 2,462 2,442 89 91 2,373 2,351 0 0
PUERTO RICO 447 427 447 427 0 0 0 0
RHODE ISLAND 66 71 66 71 0 0 0 0
SOUTH CAROLINA 295 289 248 246 47 43 0 0
SOUTH DAKOTA 104 104 94 94 10 10 0 0
TENNESSEE 1,016 1,034 133 137 527 486 356 411
TEXAS 2,624 2,610 2,539 2,525 85 85 0 0
UTAH 391 393 334 335 57 58 0 0
VERMONT 109 108 109 108 0 0 0 0
VIRGIN ISLANDS 41 35 41 35 0 0 0 0
VIRGINIA 895 907 859 878 36 29 0 0
WASHINGTON 1,314 1,310 1,050 1,051 264 259 0 0
WEST VIRGINIA 463 455 441 437 22 18 0 0
WISCONSIN 1,048 1,062 835 875 213 187 0 0
WYOMING 169 146 23 25 103 79 43 42
TOTALS 50,211 51,102 33,585 33,861 14,954 15,525 1,672 1,716
Source: Form OCSE-157, lines 30, 31, and 32.
1 Employed as of September 30th of the respective fiscal year.
2 New Mexico identified reporting errors for lines 30, 31 and 32 after the reporting deadline for FY 2018.
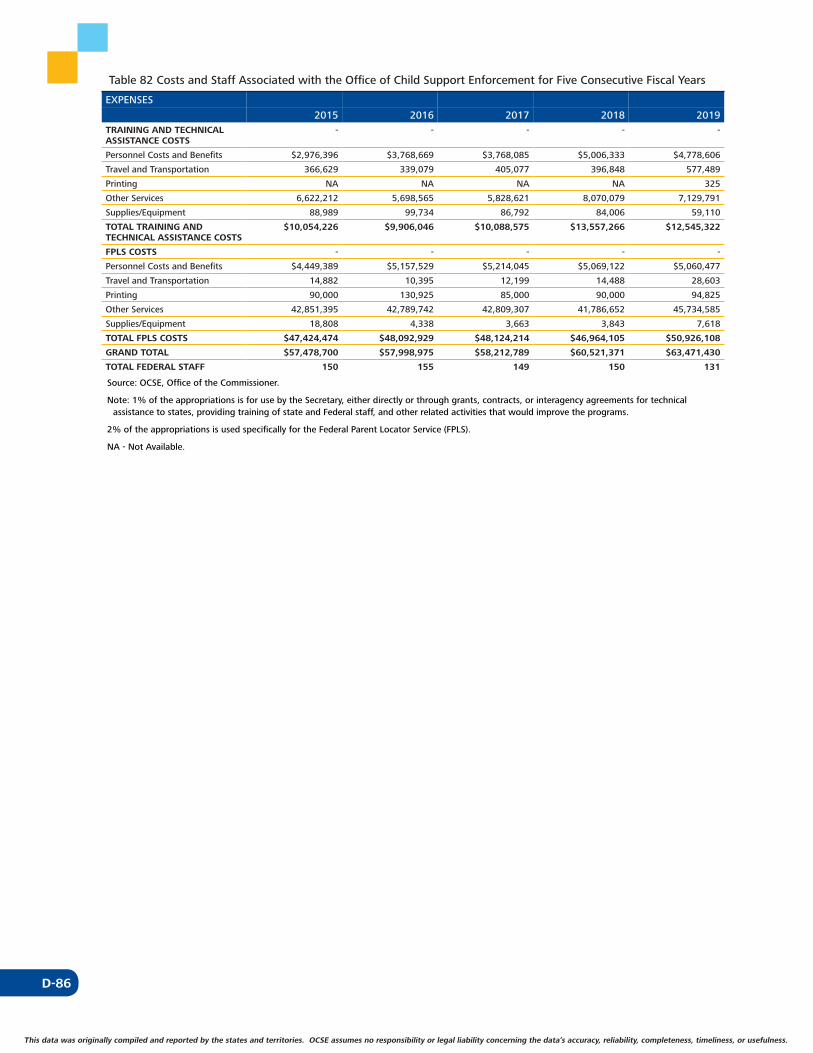
D-86
This data was originally compiled and reported by the states and territories. OCSE assumes no responsibility or legal liability concerning the data’s accuracy, reliability, completeness, timeliness, or usefulness.
Table 82 Costs and Staff Associated with the Office of Child Support Enforcement for Five Consecutive Fiscal Years
EXPENSES
2015 2016 2017 2018 2019TRAINING AND TECHNICAL ASSISTANCE COSTS
- - - - -
Personnel Costs and Benefits $2,976,396 $3,768,669 $3,768,085 $5,006,333 $4,778,606
Travel and Transportation 366,629 339,079 405,077 396,848 577,489
Printing NA NA NA NA 325
Other Services 6,622,212 5,698,565 5,828,621 8,070,079 7,129,791
Supplies/Equipment 88,989 99,734 86,792 84,006 59,110
TOTAL TRAINING AND TECHNICAL ASSISTANCE COSTS
$10,054,226 $9,906,046 $10,088,575 $13,557,266 $12,545,322
FPLS COSTS - - - - -
Personnel Costs and Benefits $4,449,389 $5,157,529 $5,214,045 $5,069,122 $5,060,477
Travel and Transportation 14,882 10,395 12,199 14,488 28,603
Printing 90,000 130,925 85,000 90,000 94,825
Other Services 42,851,395 42,789,742 42,809,307 41,786,652 45,734,585
Supplies/Equipment 18,808 4,338 3,663 3,843 7,618
TOTAL FPLS COSTS $47,424,474 $48,092,929 $48,124,214 $46,964,105 $50,926,108
GRAND TOTAL $57,478,700 $57,998,975 $58,212,789 $60,521,371 $63,471,430
TOTAL FEDERAL STAFF 150 155 149 150 131
Source: OCSE, Office of the Commissioner.
Note: 1% of the appropriations is for use by the Secretary, either directly or through grants, contracts, or interagency agreements for technical assistance to states, providing training of state and Federal staff, and other related activities that would improve the programs.
2% of the appropriations is used specifically for the Federal Parent Locator Service (FPLS).
NA - Not Available.
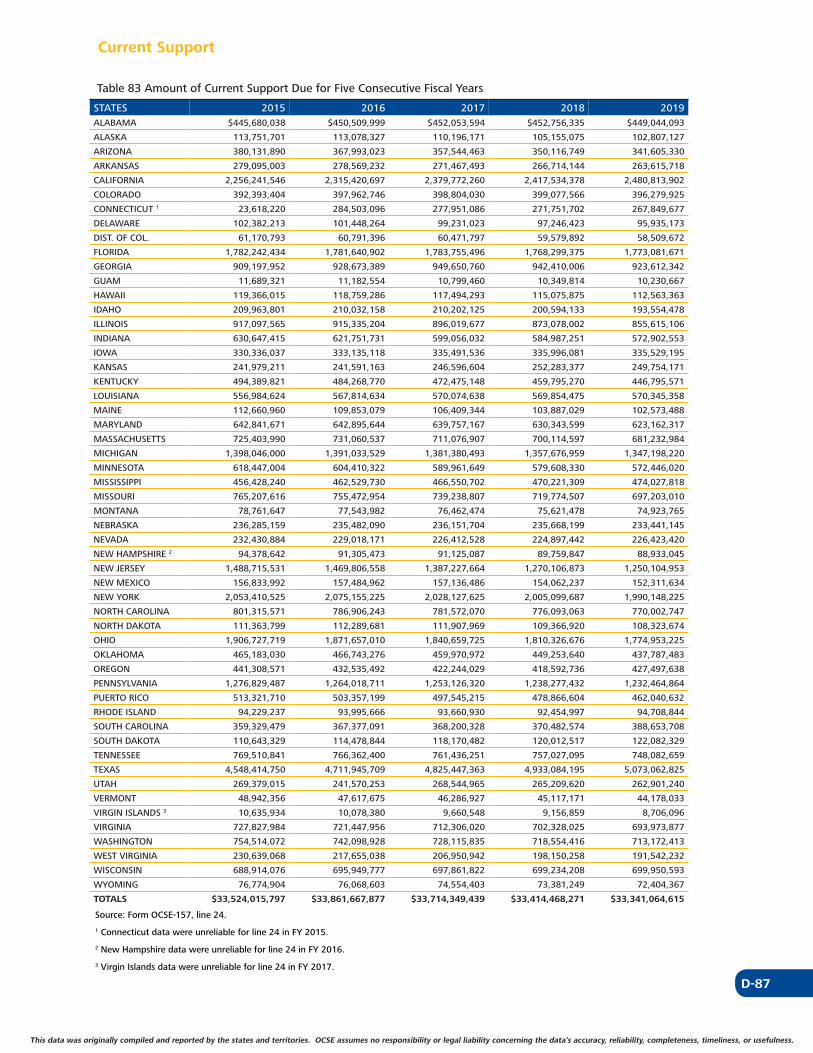
D-87
This data was originally compiled and reported by the states and territories. OCSE assumes no responsibility or legal liability concerning the data’s accuracy, reliability, completeness, timeliness, or usefulness. This data was originally compiled and reported by the states and territories. OCSE assumes no responsibility or legal liability concerning the data’s accuracy, reliability, completeness, timeliness, or usefulness.
Current Support
Table 83 Amount of Current Support Due for Five Consecutive Fiscal Years
STATES 2015 2016 2017 2018 2019ALABAMA $445,680,038 $450,509,999 $452,053,594 $452,756,335 $449,044,093
ALASKA 113,751,701 113,078,327 110,196,171 105,155,075 102,807,127
ARIZONA 380,131,890 367,993,023 357,544,463 350,116,749 341,605,330
ARKANSAS 279,095,003 278,569,232 271,467,493 266,714,144 263,615,718
CALIFORNIA 2,256,241,546 2,315,420,697 2,379,772,260 2,417,534,378 2,480,813,902
COLORADO 392,393,404 397,962,746 398,804,030 399,077,566 396,279,925
CONNECTICUT 1 23,618,220 284,503,096 277,951,086 271,751,702 267,849,677
DELAWARE 102,382,213 101,448,264 99,231,023 97,246,423 95,935,173
DIST. OF COL. 61,170,793 60,791,396 60,471,797 59,579,892 58,509,672
FLORIDA 1,782,242,434 1,781,640,902 1,783,755,496 1,768,299,375 1,773,081,671
GEORGIA 909,197,952 928,673,389 949,650,760 942,410,006 923,612,342
GUAM 11,689,321 11,182,554 10,799,460 10,349,814 10,230,667
HAWAII 119,366,015 118,759,286 117,494,293 115,075,875 112,563,363
IDAHO 209,963,801 210,032,158 210,202,125 200,594,133 193,554,478
ILLINOIS 917,097,565 915,335,204 896,019,677 873,078,002 855,615,106
INDIANA 630,647,415 621,751,731 599,056,032 584,987,251 572,902,553
IOWA 330,336,037 333,135,118 335,491,536 335,996,081 335,529,195
KANSAS 241,979,211 241,591,163 246,596,604 252,283,377 249,754,171
KENTUCKY 494,389,821 484,268,770 472,475,148 459,795,270 446,795,571
LOUISIANA 556,984,624 567,814,634 570,074,638 569,854,475 570,345,358
MAINE 112,660,960 109,853,079 106,409,344 103,887,029 102,573,488
MARYLAND 642,841,671 642,895,644 639,757,167 630,343,599 623,162,317
MASSACHUSETTS 725,403,990 731,060,537 711,076,907 700,114,597 681,232,984
MICHIGAN 1,398,046,000 1,391,033,529 1,381,380,493 1,357,676,959 1,347,198,220
MINNESOTA 618,447,004 604,410,322 589,961,649 579,608,330 572,446,020
MISSISSIPPI 456,428,240 462,529,730 466,550,702 470,221,309 474,027,818
MISSOURI 765,207,616 755,472,954 739,238,807 719,774,507 697,203,010
MONTANA 78,761,647 77,543,982 76,462,474 75,621,478 74,923,765
NEBRASKA 236,285,159 235,482,090 236,151,704 235,668,199 233,441,145
NEVADA 232,430,884 229,018,171 226,412,528 224,897,442 226,423,420
NEW HAMPSHIRE 2 94,378,642 91,305,473 91,125,087 89,759,847 88,933,045
NEW JERSEY 1,488,715,531 1,469,806,558 1,387,227,664 1,270,106,873 1,250,104,953
NEW MEXICO 156,833,992 157,484,962 157,136,486 154,062,237 152,311,634
NEW YORK 2,053,410,525 2,075,155,225 2,028,127,625 2,005,099,687 1,990,148,225
NORTH CAROLINA 801,315,571 786,906,243 781,572,070 776,093,063 770,002,747
NORTH DAKOTA 111,363,799 112,289,681 111,907,969 109,366,920 108,323,674
OHIO 1,906,727,719 1,871,657,010 1,840,659,725 1,810,326,676 1,774,953,225
OKLAHOMA 465,183,030 466,743,276 459,970,972 449,253,640 437,787,483
OREGON 441,308,571 432,535,492 422,244,029 418,592,736 427,497,638
PENNSYLVANIA 1,276,829,487 1,264,018,711 1,253,126,320 1,238,277,432 1,232,464,864
PUERTO RICO 513,321,710 503,357,199 497,545,215 478,866,604 462,040,632
RHODE ISLAND 94,229,237 93,995,666 93,660,930 92,454,997 94,708,844
SOUTH CAROLINA 359,329,479 367,377,091 368,200,328 370,482,574 388,653,708
SOUTH DAKOTA 110,643,329 114,478,844 118,170,482 120,012,517 122,082,329
TENNESSEE 769,510,841 766,362,400 761,436,251 757,027,095 748,082,659
TEXAS 4,548,414,750 4,711,945,709 4,825,447,363 4,933,084,195 5,073,062,825
UTAH 269,379,015 241,570,253 268,544,965 265,209,620 262,901,240
VERMONT 48,942,356 47,617,675 46,286,927 45,117,171 44,178,033
VIRGIN ISLANDS 3 10,635,934 10,078,380 9,660,548 9,156,859 8,706,096
VIRGINIA 727,827,984 721,447,956 712,306,020 702,328,025 693,973,877
WASHINGTON 754,514,072 742,098,928 728,115,835 718,554,416 713,172,413
WEST VIRGINIA 230,639,068 217,655,038 206,950,942 198,150,258 191,542,232
WISCONSIN 688,914,076 695,949,777 697,861,822 699,234,208 699,950,593
WYOMING 76,774,904 76,068,603 74,554,403 73,381,249 72,404,367
TOTALS $33,524,015,797 $33,861,667,877 $33,714,349,439 $33,414,468,271 $33,341,064,615
Source: Form OCSE-157, line 24.
1 Connecticut data were unreliable for line 24 in FY 2015.
2 New Hampshire data were unreliable for line 24 in FY 2016.
3 Virgin Islands data were unreliable for line 24 in FY 2017.
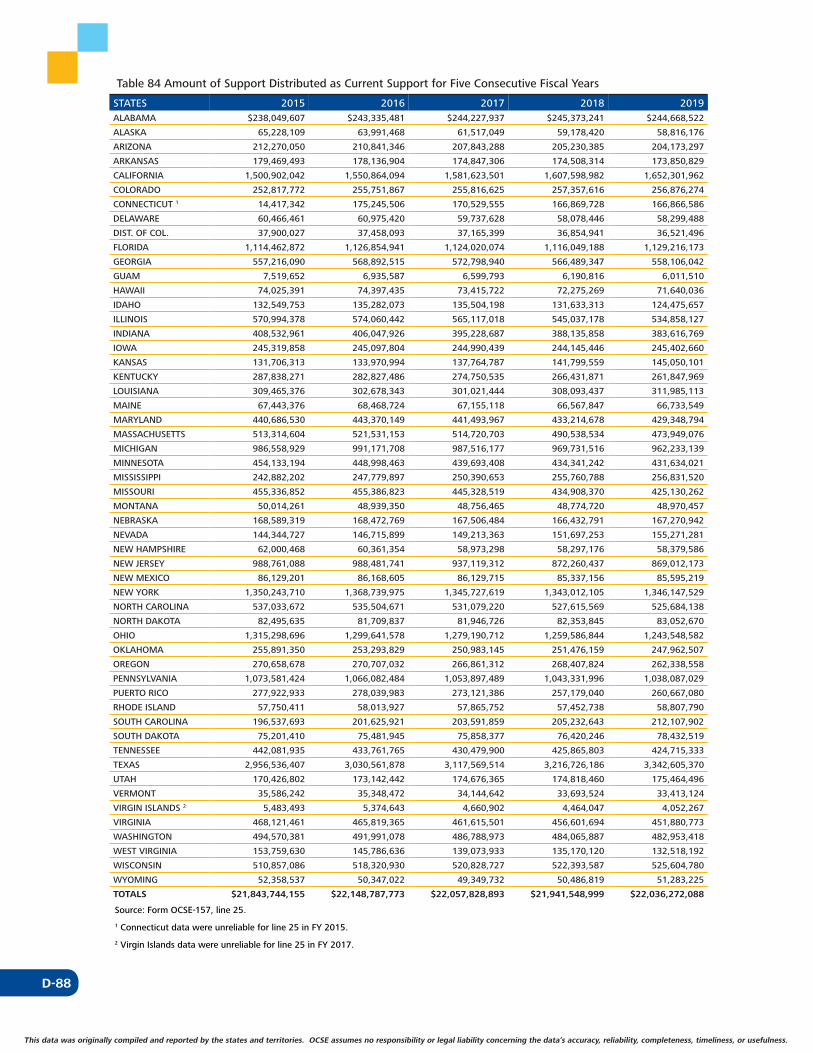
D-88
This data was originally compiled and reported by the states and territories. OCSE assumes no responsibility or legal liability concerning the data’s accuracy, reliability, completeness, timeliness, or usefulness.
Table 84 Amount of Support Distributed as Current Support for Five Consecutive Fiscal Years
STATES 2015 2016 2017 2018 2019ALABAMA $238,049,607 $243,335,481 $244,227,937 $245,373,241 $244,668,522
ALASKA 65,228,109 63,991,468 61,517,049 59,178,420 58,816,176
ARIZONA 212,270,050 210,841,346 207,843,288 205,230,385 204,173,297
ARKANSAS 179,469,493 178,136,904 174,847,306 174,508,314 173,850,829
CALIFORNIA 1,500,902,042 1,550,864,094 1,581,623,501 1,607,598,982 1,652,301,962
COLORADO 252,817,772 255,751,867 255,816,625 257,357,616 256,876,274
CONNECTICUT 1 14,417,342 175,245,506 170,529,555 166,869,728 166,866,586
DELAWARE 60,466,461 60,975,420 59,737,628 58,078,446 58,299,488
DIST. OF COL. 37,900,027 37,458,093 37,165,399 36,854,941 36,521,496
FLORIDA 1,114,462,872 1,126,854,941 1,124,020,074 1,116,049,188 1,129,216,173
GEORGIA 557,216,090 568,892,515 572,798,940 566,489,347 558,106,042
GUAM 7,519,652 6,935,587 6,599,793 6,190,816 6,011,510
HAWAII 74,025,391 74,397,435 73,415,722 72,275,269 71,640,036
IDAHO 132,549,753 135,282,073 135,504,198 131,633,313 124,475,657
ILLINOIS 570,994,378 574,060,442 565,117,018 545,037,178 534,858,127
INDIANA 408,532,961 406,047,926 395,228,687 388,135,858 383,616,769
IOWA 245,319,858 245,097,804 244,990,439 244,145,446 245,402,660
KANSAS 131,706,313 133,970,994 137,764,787 141,799,559 145,050,101
KENTUCKY 287,838,271 282,827,486 274,750,535 266,431,871 261,847,969
LOUISIANA 309,465,376 302,678,343 301,021,444 308,093,437 311,985,113
MAINE 67,443,376 68,468,724 67,155,118 66,567,847 66,733,549
MARYLAND 440,686,530 443,370,149 441,493,967 433,214,678 429,348,794
MASSACHUSETTS 513,314,604 521,531,153 514,720,703 490,538,534 473,949,076
MICHIGAN 986,558,929 991,171,708 987,516,177 969,731,516 962,233,139
MINNESOTA 454,133,194 448,998,463 439,693,408 434,341,242 431,634,021
MISSISSIPPI 242,882,202 247,779,897 250,390,653 255,760,788 256,831,520
MISSOURI 455,336,852 455,386,823 445,328,519 434,908,370 425,130,262
MONTANA 50,014,261 48,939,350 48,756,465 48,774,720 48,970,457
NEBRASKA 168,589,319 168,472,769 167,506,484 166,432,791 167,270,942
NEVADA 144,344,727 146,715,899 149,213,363 151,697,253 155,271,281
NEW HAMPSHIRE 62,000,468 60,361,354 58,973,298 58,297,176 58,379,586
NEW JERSEY 988,761,088 988,481,741 937,119,312 872,260,437 869,012,173
NEW MEXICO 86,129,201 86,168,605 86,129,715 85,337,156 85,595,219
NEW YORK 1,350,243,710 1,368,739,975 1,345,727,619 1,343,012,105 1,346,147,529
NORTH CAROLINA 537,033,672 535,504,671 531,079,220 527,615,569 525,684,138
NORTH DAKOTA 82,495,635 81,709,837 81,946,726 82,353,845 83,052,670
OHIO 1,315,298,696 1,299,641,578 1,279,190,712 1,259,586,844 1,243,548,582
OKLAHOMA 255,891,350 253,293,829 250,983,145 251,476,159 247,962,507
OREGON 270,658,678 270,707,032 266,861,312 268,407,824 262,338,558
PENNSYLVANIA 1,073,581,424 1,066,082,484 1,053,897,489 1,043,331,996 1,038,087,029
PUERTO RICO 277,922,933 278,039,983 273,121,386 257,179,040 260,667,080
RHODE ISLAND 57,750,411 58,013,927 57,865,752 57,452,738 58,807,790
SOUTH CAROLINA 196,537,693 201,625,921 203,591,859 205,232,643 212,107,902
SOUTH DAKOTA 75,201,410 75,481,945 75,858,377 76,420,246 78,432,519
TENNESSEE 442,081,935 433,761,765 430,479,900 425,865,803 424,715,333
TEXAS 2,956,536,407 3,030,561,878 3,117,569,514 3,216,726,186 3,342,605,370
UTAH 170,426,802 173,142,442 174,676,365 174,818,460 175,464,496
VERMONT 35,586,242 35,348,472 34,144,642 33,693,524 33,413,124
VIRGIN ISLANDS 2 5,483,493 5,374,643 4,660,902 4,464,047 4,052,267
VIRGINIA 468,121,461 465,819,365 461,615,501 456,601,694 451,880,773
WASHINGTON 494,570,381 491,991,078 486,788,973 484,065,887 482,953,418
WEST VIRGINIA 153,759,630 145,786,636 139,073,933 135,170,120 132,518,192
WISCONSIN 510,857,086 518,320,930 520,828,727 522,393,587 525,604,780
WYOMING 52,358,537 50,347,022 49,349,732 50,486,819 51,283,225
TOTALS $21,843,744,155 $22,148,787,773 $22,057,828,893 $21,941,548,999 $22,036,272,088
Source: Form OCSE-157, line 25.
1 Connecticut data were unreliable for line 25 in FY 2015.
2 Virgin Islands data were unreliable for line 25 in FY 2017.
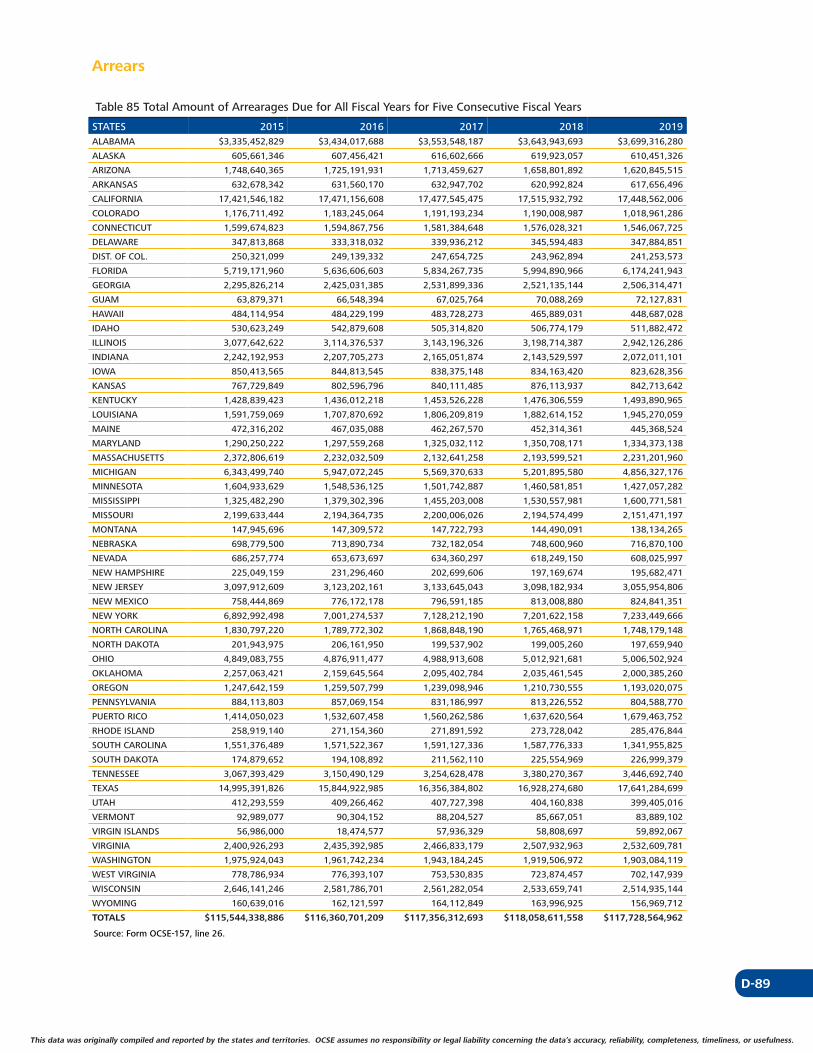
D-89
This data was originally compiled and reported by the states and territories. OCSE assumes no responsibility or legal liability concerning the data’s accuracy, reliability, completeness, timeliness, or usefulness. This data was originally compiled and reported by the states and territories. OCSE assumes no responsibility or legal liability concerning the data’s accuracy, reliability, completeness, timeliness, or usefulness.
Arrears
Table 85 Total Amount of Arrearages Due for All Fiscal Years for Five Consecutive Fiscal Years
STATES 2015 2016 2017 2018 2019ALABAMA $3,335,452,829 $3,434,017,688 $3,553,548,187 $3,643,943,693 $3,699,316,280
ALASKA 605,661,346 607,456,421 616,602,666 619,923,057 610,451,326
ARIZONA 1,748,640,365 1,725,191,931 1,713,459,627 1,658,801,892 1,620,845,515
ARKANSAS 632,678,342 631,560,170 632,947,702 620,992,824 617,656,496
CALIFORNIA 17,421,546,182 17,471,156,608 17,477,545,475 17,515,932,792 17,448,562,006
COLORADO 1,176,711,492 1,183,245,064 1,191,193,234 1,190,008,987 1,018,961,286
CONNECTICUT 1,599,674,823 1,594,867,756 1,581,384,648 1,576,028,321 1,546,067,725
DELAWARE 347,813,868 333,318,032 339,936,212 345,594,483 347,884,851
DIST. OF COL. 250,321,099 249,139,332 247,654,725 243,962,894 241,253,573
FLORIDA 5,719,171,960 5,636,606,603 5,834,267,735 5,994,890,966 6,174,241,943
GEORGIA 2,295,826,214 2,425,031,385 2,531,899,336 2,521,135,144 2,506,314,471
GUAM 63,879,371 66,548,394 67,025,764 70,088,269 72,127,831
HAWAII 484,114,954 484,229,199 483,728,273 465,889,031 448,687,028
IDAHO 530,623,249 542,879,608 505,314,820 506,774,179 511,882,472
ILLINOIS 3,077,642,622 3,114,376,537 3,143,196,326 3,198,714,387 2,942,126,286
INDIANA 2,242,192,953 2,207,705,273 2,165,051,874 2,143,529,597 2,072,011,101
IOWA 850,413,565 844,813,545 838,375,148 834,163,420 823,628,356
KANSAS 767,729,849 802,596,796 840,111,485 876,113,937 842,713,642
KENTUCKY 1,428,839,423 1,436,012,218 1,453,526,228 1,476,306,559 1,493,890,965
LOUISIANA 1,591,759,069 1,707,870,692 1,806,209,819 1,882,614,152 1,945,270,059
MAINE 472,316,202 467,035,088 462,267,570 452,314,361 445,368,524
MARYLAND 1,290,250,222 1,297,559,268 1,325,032,112 1,350,708,171 1,334,373,138
MASSACHUSETTS 2,372,806,619 2,232,032,509 2,132,641,258 2,193,599,521 2,231,201,960
MICHIGAN 6,343,499,740 5,947,072,245 5,569,370,633 5,201,895,580 4,856,327,176
MINNESOTA 1,604,933,629 1,548,536,125 1,501,742,887 1,460,581,851 1,427,057,282
MISSISSIPPI 1,325,482,290 1,379,302,396 1,455,203,008 1,530,557,981 1,600,771,581
MISSOURI 2,199,633,444 2,194,364,735 2,200,006,026 2,194,574,499 2,151,471,197
MONTANA 147,945,696 147,309,572 147,722,793 144,490,091 138,134,265
NEBRASKA 698,779,500 713,890,734 732,182,054 748,600,960 716,870,100
NEVADA 686,257,774 653,673,697 634,360,297 618,249,150 608,025,997
NEW HAMPSHIRE 225,049,159 231,296,460 202,699,606 197,169,674 195,682,471
NEW JERSEY 3,097,912,609 3,123,202,161 3,133,645,043 3,098,182,934 3,055,954,806
NEW MEXICO 758,444,869 776,172,178 796,591,185 813,008,880 824,841,351
NEW YORK 6,892,992,498 7,001,274,537 7,128,212,190 7,201,622,158 7,233,449,666
NORTH CAROLINA 1,830,797,220 1,789,772,302 1,868,848,190 1,765,468,971 1,748,179,148
NORTH DAKOTA 201,943,975 206,161,950 199,537,902 199,005,260 197,659,940
OHIO 4,849,083,755 4,876,911,477 4,988,913,608 5,012,921,681 5,006,502,924
OKLAHOMA 2,257,063,421 2,159,645,564 2,095,402,784 2,035,461,545 2,000,385,260
OREGON 1,247,642,159 1,259,507,799 1,239,098,946 1,210,730,555 1,193,020,075
PENNSYLVANIA 884,113,803 857,069,154 831,186,997 813,226,552 804,588,770
PUERTO RICO 1,414,050,023 1,532,607,458 1,560,262,586 1,637,620,564 1,679,463,752
RHODE ISLAND 258,919,140 271,154,360 271,891,592 273,728,042 285,476,844
SOUTH CAROLINA 1,551,376,489 1,571,522,367 1,591,127,336 1,587,776,333 1,341,955,825
SOUTH DAKOTA 174,879,652 194,108,892 211,562,110 225,554,969 226,999,379
TENNESSEE 3,067,393,429 3,150,490,129 3,254,628,478 3,380,270,367 3,446,692,740
TEXAS 14,995,391,826 15,844,922,985 16,356,384,802 16,928,274,680 17,641,284,699
UTAH 412,293,559 409,266,462 407,727,398 404,160,838 399,405,016
VERMONT 92,989,077 90,304,152 88,204,527 85,667,051 83,889,102
VIRGIN ISLANDS 56,986,000 18,474,577 57,936,329 58,808,697 59,892,067
VIRGINIA 2,400,926,293 2,435,392,985 2,466,833,179 2,507,932,963 2,532,609,781
WASHINGTON 1,975,924,043 1,961,742,234 1,943,184,245 1,919,506,972 1,903,084,119
WEST VIRGINIA 778,786,934 776,393,107 753,530,835 723,874,457 702,147,939
WISCONSIN 2,646,141,246 2,581,786,701 2,561,282,054 2,533,659,741 2,514,935,144
WYOMING 160,639,016 162,121,597 164,112,849 163,996,925 156,969,712
TOTALS $115,544,338,886 $116,360,701,209 $117,356,312,693 $118,058,611,558 $117,728,564,962
Source: Form OCSE-157, line 26.

D-90
This data was originally compiled and reported by the states and territories. OCSE assumes no responsibility or legal liability concerning the data’s accuracy, reliability, completeness, timeliness, or usefulness.
Table 86 Total Amount of Support Distributed as Arrears for Five Consecutive Fiscal Years
STATES 2015 2016 2017 2018 2019ALABAMA $122,784,073 $121,268,129 $115,334,428 $115,102,774 $114,488,235
ALASKA 41,152,927 42,005,615 35,704,407 37,349,341 39,480,409
ARIZONA 96,250,882 94,571,021 94,824,860 95,269,681 95,469,883
ARKANSAS 66,842,292 64,976,273 62,837,628 63,246,641 61,486,547
CALIFORNIA 837,118,054 852,618,496 849,680,354 860,087,048 856,939,756
COLORADO 89,170,813 88,691,291 86,042,528 83,188,418 83,965,861
CONNECTICUT 5,284,667 83,285,784 80,345,599 79,744,152 80,477,159
DELAWARE 19,741,427 20,541,146 20,351,243 21,098,588 21,625,401
DIST. OF COL. 13,608,381 13,936,022 14,337,755 14,003,518 14,050,360
FLORIDA 406,463,771 429,300,778 426,603,834 447,315,947 445,356,863
GEORGIA 169,220,865 171,198,796 172,128,413 170,282,267 168,656,943
GUAM 3,370,868 3,027,403 2,971,993 2,872,581 2,637,512
HAWAII 28,192,680 28,342,623 27,346,920 26,775,554 27,167,482
IDAHO 45,921,313 45,610,862 43,562,864 41,844,539 40,456,213
ILLINOIS 262,880,108 261,855,680 247,630,901 244,317,441 245,897,062
INDIANA 168,887,118 167,256,284 159,151,822 158,150,674 158,515,547
IOWA 75,389,029 76,926,393 75,458,707 73,875,415 72,547,616
KANSAS 56,734,600 58,747,231 58,372,960 59,185,583 62,269,147
KENTUCKY 116,183,044 109,687,151 106,691,715 104,984,992 102,895,688
LOUISIANA 118,393,730 114,768,402 118,772,184 123,170,874 126,009,972
MAINE 33,704,426 34,271,774 32,569,367 32,337,344 31,830,141
MARYLAND 123,078,636 122,290,300 123,698,408 118,318,774 115,940,837
MASSACHUSETTS 133,912,881 133,401,484 131,878,241 128,834,373 142,825,693
MICHIGAN 344,328,596 340,493,362 332,844,306 327,294,985 330,012,906
MINNESOTA 139,901,665 136,451,860 131,680,835 129,366,759 128,907,210
MISSISSIPPI 95,653,113 98,595,204 95,166,720 101,665,150 103,288,589
MISSOURI 231,421,529 229,002,699 219,163,477 216,657,849 211,512,670
MONTANA 17,914,897 16,626,663 16,926,752 17,940,450 17,714,118
NEBRASKA 50,066,617 48,869,803 48,383,246 49,539,816 49,665,101
NEVADA 49,036,974 50,321,385 50,991,827 51,497,678 52,885,154
NEW HAMPSHIRE 20,049,735 20,162,465 19,849,589 19,578,262 19,745,000
NEW JERSEY 206,935,510 207,022,076 215,151,417 223,758,366 225,240,457
NEW MEXICO 41,493,714 41,085,664 41,022,917 41,342,887 40,715,978
NEW YORK 475,674,773 496,950,938 483,092,582 481,603,079 501,673,170
NORTH CAROLINA 162,135,067 164,356,602 161,456,920 161,903,246 162,311,293
NORTH DAKOTA 20,741,230 20,849,119 19,873,963 19,737,143 20,043,786
OHIO 365,583,226 370,062,999 357,194,782 358,461,939 361,033,278
OKLAHOMA 115,910,655 112,211,599 106,885,215 106,142,204 105,726,991
OREGON 89,679,453 94,403,948 92,743,146 96,609,408 96,179,967
PENNSYLVANIA 176,791,734 174,466,063 164,372,847 161,845,444 163,221,765
PUERTO RICO 64,470,748 72,315,119 69,647,640 69,695,096 72,785,037
RHODE ISLAND 19,344,018 19,597,684 19,605,325 19,459,658 19,619,854
SOUTH CAROLINA 92,232,538 92,011,096 94,083,518 95,449,359 92,233,532
SOUTH DAKOTA 20,121,250 19,991,336 20,288,510 21,291,144 21,558,444
TENNESSEE 190,006,235 194,427,235 186,120,764 184,421,547 187,395,732
TEXAS 994,266,664 1,024,058,399 1,053,158,870 1,082,008,340 1,091,575,921
UTAH 47,684,145 48,398,666 46,494,734 46,238,367 46,289,179
VERMONT 10,932,458 10,697,535 10,340,837 10,252,620 10,049,811
VIRGIN ISLANDS 2,281,833 2,631,570 1,700,632 1,871,921 1,716,233
VIRGINIA 177,936,611 176,348,783 174,070,957 175,694,509 177,638,175
WASHINGTON 167,921,516 173,796,535 171,214,898 171,456,569 169,896,000
WEST VIRGINIA 55,494,737 52,233,433 48,580,710 47,192,281 47,301,106
WISCONSIN 141,216,113 139,685,476 138,658,392 138,295,525 135,522,185
WYOMING 18,407,082 17,151,770 16,270,525 17,205,622 17,041,092
TOTALS $7,639,921,021 $7,803,856,024 $7,693,333,984 $7,746,833,742 $7,791,490,061
Source: Form OCSE-157, line 27.

D-91
This data was originally compiled and reported by the states and territories. OCSE assumes no responsibility or legal liability concerning the data’s accuracy, reliability, completeness, timeliness, or usefulness. This data was originally compiled and reported by the states and territories. OCSE assumes no responsibility or legal liability concerning the data’s accuracy, reliability, completeness, timeliness, or usefulness.
Table 87 Cases with Arrears Due for Five Consecutive Fiscal Years
STATES 2015 2016 2017 2018 2019ALABAMA 188,697 185,745 184,609 183,264 181,171
ALASKA 42,686 42,896 42,214 41,180 40,515
ARIZONA 142,241 137,501 135,077 132,725 128,662
ARKANSAS 101,577 98,345 95,505 92,470 89,363
CALIFORNIA 883,955 880,141 872,403 858,669 846,287
COLORADO 134,885 132,368 129,945 128,545 125,081
CONNECTICUT 127,579 127,496 124,263 121,411 118,783
DELAWARE 44,060 44,281 44,364 43,154 42,503
DIST. OF COL. 28,185 27,886 27,654 26,913 26,348
FLORIDA 534,923 515,878 515,925 512,478 504,940
GEORGIA 310,149 311,551 315,364 313,147 304,887
GUAM 4,365 4,245 4,195 4,181 4,162
HAWAII 48,145 47,566 46,572 45,876 43,465
IDAHO 84,037 83,642 81,943 74,125 72,179
ILLINOIS 318,329 314,349 309,490 303,710 301,638
INDIANA 239,121 233,432 227,437 220,831 216,547
IOWA 134,674 133,237 132,430 131,577 128,936
KANSAS 109,159 108,655 108,432 109,287 109,030
KENTUCKY 217,516 211,844 207,161 202,620 198,819
LOUISIANA 193,864 196,593 199,158 197,555 197,317
MAINE 46,892 45,313 44,229 42,824 41,110
MARYLAND 169,842 163,695 160,982 156,595 151,383
MASSACHUSETTS 176,150 168,461 160,426 161,544 159,579
MICHIGAN 562,419 554,108 548,163 536,982 525,129
MINNESOTA 186,000 179,267 173,626 169,227 163,714
MISSISSIPPI 199,973 203,430 201,144 202,070 202,986
MISSOURI 277,756 270,403 261,633 254,224 243,858
MONTANA 33,725 33,144 32,763 32,159 30,458
NEBRASKA 77,626 77,114 76,808 76,761 74,891
NEVADA 85,945 84,826 83,893 81,605 80,311
NEW HAMPSHIRE 28,286 28,189 27,752 26,905 26,338
NEW JERSEY 276,818 273,135 264,663 252,338 242,945
NEW MEXICO 49,349 49,461 49,970 49,119 49,173
NEW YORK 606,251 601,440 588,260 580,267 564,967
NORTH CAROLINA 323,409 318,247 313,820 310,095 303,986
NORTH DAKOTA 29,870 29,469 29,142 27,568 26,235
OHIO 635,602 624,976 618,864 608,232 596,527
OKLAHOMA 175,140 176,415 166,348 160,468 155,356
OREGON 157,605 153,138 149,015 141,486 135,435
PENNSYLVANIA 283,124 274,727 265,642 257,094 250,989
PUERTO RICO 166,984 168,639 169,684 168,530 164,462
RHODE ISLAND 35,938 35,567 35,383 33,979 33,574
SOUTH CAROLINA 150,804 147,890 148,038 146,273 144,341
SOUTH DAKOTA 35,353 36,280 36,724 37,524 37,339
TENNESSEE 281,591 281,005 280,691 281,762 280,399
TEXAS 1,113,027 1,142,508 1,155,037 1,162,622 1,172,938
UTAH 76,185 75,197 72,875 70,310 67,619
VERMONT 14,886 14,038 13,228 12,757 12,274
VIRGIN ISLANDS 1 5,447 5,329 5,195 5,025 4,884
VIRGINIA 278,692 272,733 268,313 263,218 258,844
WASHINGTON 321,395 316,989 309,498 301,344 293,682
WEST VIRGINIA 96,168 90,901 87,178 81,795 77,574
WISCONSIN 265,593 259,628 254,248 250,714 242,269
WYOMING 27,796 27,011 26,334 25,794 25,391
TOTALS 11,139,788 11,020,324 10,883,710 10,712,928 10,521,593
Source: Form OCSE-157, line 28.
1 Virgin Islands data were unreliable for line 28 in FY 2017.
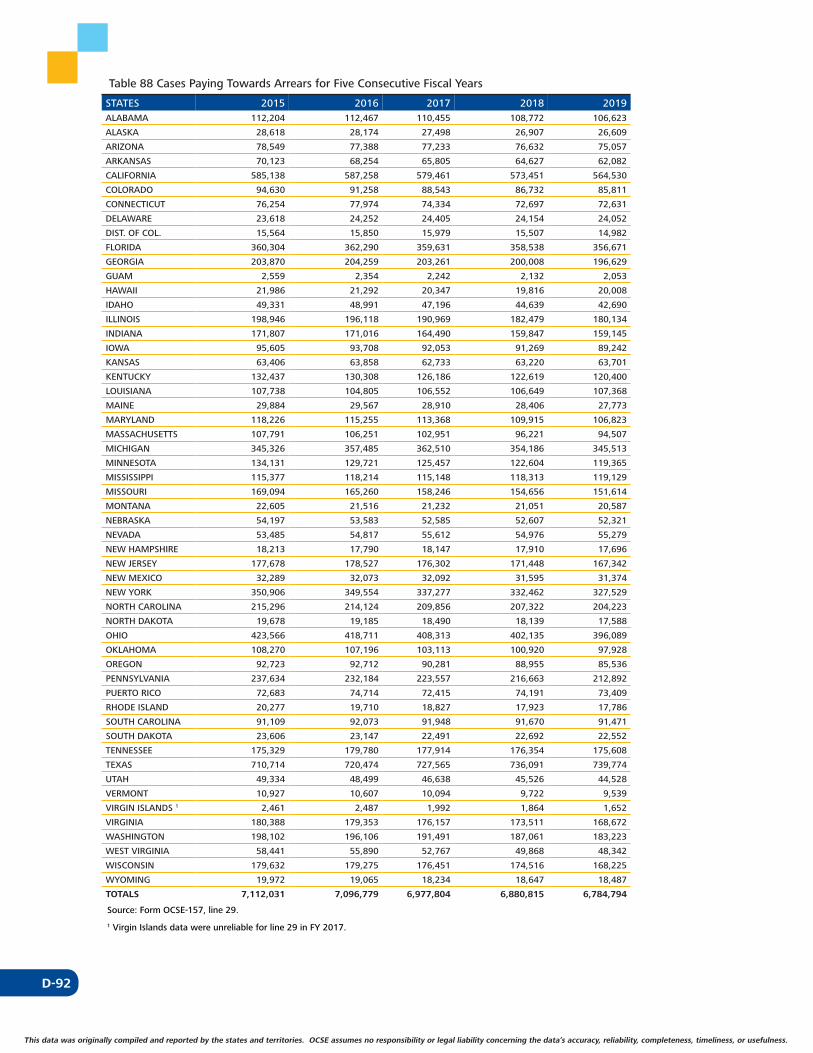
D-92
This data was originally compiled and reported by the states and territories. OCSE assumes no responsibility or legal liability concerning the data’s accuracy, reliability, completeness, timeliness, or usefulness.
Table 88 Cases Paying Towards Arrears for Five Consecutive Fiscal Years
STATES 2015 2016 2017 2018 2019ALABAMA 112,204 112,467 110,455 108,772 106,623
ALASKA 28,618 28,174 27,498 26,907 26,609
ARIZONA 78,549 77,388 77,233 76,632 75,057
ARKANSAS 70,123 68,254 65,805 64,627 62,082
CALIFORNIA 585,138 587,258 579,461 573,451 564,530
COLORADO 94,630 91,258 88,543 86,732 85,811
CONNECTICUT 76,254 77,974 74,334 72,697 72,631
DELAWARE 23,618 24,252 24,405 24,154 24,052
DIST. OF COL. 15,564 15,850 15,979 15,507 14,982
FLORIDA 360,304 362,290 359,631 358,538 356,671
GEORGIA 203,870 204,259 203,261 200,008 196,629
GUAM 2,559 2,354 2,242 2,132 2,053
HAWAII 21,986 21,292 20,347 19,816 20,008
IDAHO 49,331 48,991 47,196 44,639 42,690
ILLINOIS 198,946 196,118 190,969 182,479 180,134
INDIANA 171,807 171,016 164,490 159,847 159,145
IOWA 95,605 93,708 92,053 91,269 89,242
KANSAS 63,406 63,858 62,733 63,220 63,701
KENTUCKY 132,437 130,308 126,186 122,619 120,400
LOUISIANA 107,738 104,805 106,552 106,649 107,368
MAINE 29,884 29,567 28,910 28,406 27,773
MARYLAND 118,226 115,255 113,368 109,915 106,823
MASSACHUSETTS 107,791 106,251 102,951 96,221 94,507
MICHIGAN 345,326 357,485 362,510 354,186 345,513
MINNESOTA 134,131 129,721 125,457 122,604 119,365
MISSISSIPPI 115,377 118,214 115,148 118,313 119,129
MISSOURI 169,094 165,260 158,246 154,656 151,614
MONTANA 22,605 21,516 21,232 21,051 20,587
NEBRASKA 54,197 53,583 52,585 52,607 52,321
NEVADA 53,485 54,817 55,612 54,976 55,279
NEW HAMPSHIRE 18,213 17,790 18,147 17,910 17,696
NEW JERSEY 177,678 178,527 176,302 171,448 167,342
NEW MEXICO 32,289 32,073 32,092 31,595 31,374
NEW YORK 350,906 349,554 337,277 332,462 327,529
NORTH CAROLINA 215,296 214,124 209,856 207,322 204,223
NORTH DAKOTA 19,678 19,185 18,490 18,139 17,588
OHIO 423,566 418,711 408,313 402,135 396,089
OKLAHOMA 108,270 107,196 103,113 100,920 97,928
OREGON 92,723 92,712 90,281 88,955 85,536
PENNSYLVANIA 237,634 232,184 223,557 216,663 212,892
PUERTO RICO 72,683 74,714 72,415 74,191 73,409
RHODE ISLAND 20,277 19,710 18,827 17,923 17,786
SOUTH CAROLINA 91,109 92,073 91,948 91,670 91,471
SOUTH DAKOTA 23,606 23,147 22,491 22,692 22,552
TENNESSEE 175,329 179,780 177,914 176,354 175,608
TEXAS 710,714 720,474 727,565 736,091 739,774
UTAH 49,334 48,499 46,638 45,526 44,528
VERMONT 10,927 10,607 10,094 9,722 9,539
VIRGIN ISLANDS 1 2,461 2,487 1,992 1,864 1,652
VIRGINIA 180,388 179,353 176,157 173,511 168,672
WASHINGTON 198,102 196,106 191,491 187,061 183,223
WEST VIRGINIA 58,441 55,890 52,767 49,868 48,342
WISCONSIN 179,632 179,275 176,451 174,516 168,225
WYOMING 19,972 19,065 18,234 18,647 18,487
TOTALS 7,112,031 7,096,779 6,977,804 6,880,815 6,784,794
Source: Form OCSE-157, line 29.
1 Virgin Islands data were unreliable for line 29 in FY 2017.
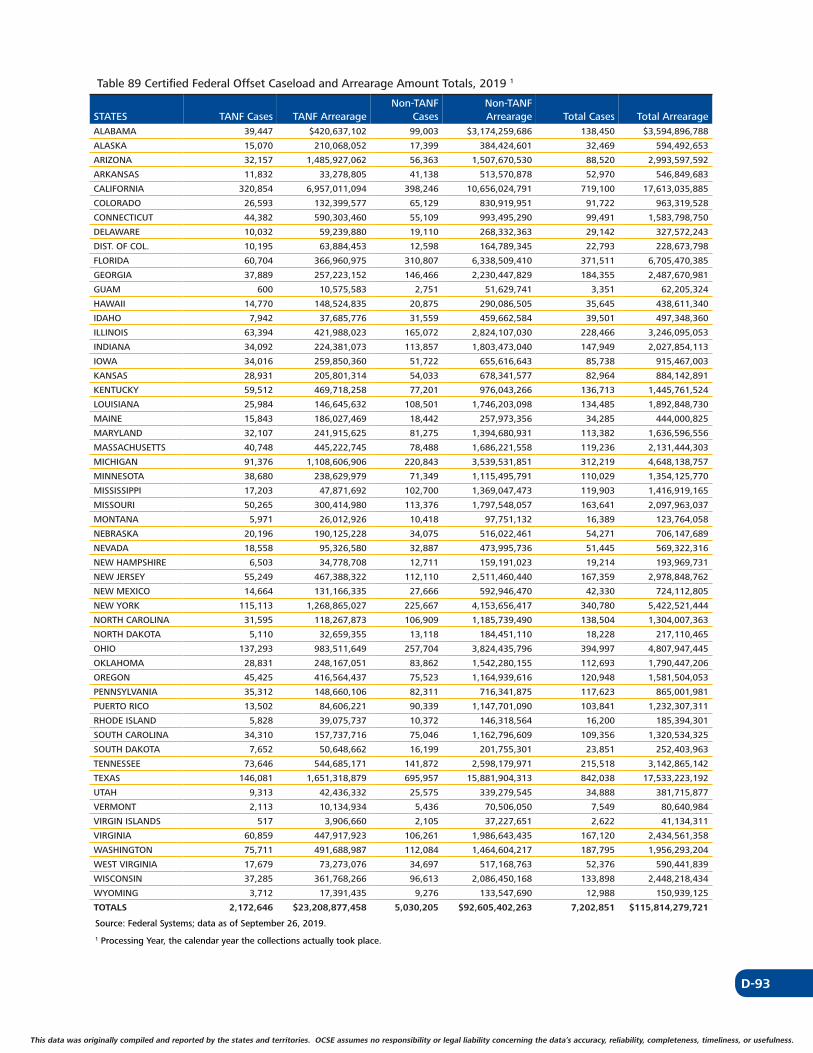
D-93
This data was originally compiled and reported by the states and territories. OCSE assumes no responsibility or legal liability concerning the data’s accuracy, reliability, completeness, timeliness, or usefulness. This data was originally compiled and reported by the states and territories. OCSE assumes no responsibility or legal liability concerning the data’s accuracy, reliability, completeness, timeliness, or usefulness.
Table 89 Certified Federal Offset Caseload and Arrearage Amount Totals, 2019 1
Non-TANF Non-TANF STATES TANF Cases TANF Arrearage Cases Arrearage Total Cases Total ArrearageALABAMA 39,447 $420,637,102 99,003 $3,174,259,686 138,450 $3,594,896,788
ALASKA 15,070 210,068,052 17,399 384,424,601 32,469 594,492,653
ARIZONA 32,157 1,485,927,062 56,363 1,507,670,530 88,520 2,993,597,592
ARKANSAS 11,832 33,278,805 41,138 513,570,878 52,970 546,849,683
CALIFORNIA 320,854 6,957,011,094 398,246 10,656,024,791 719,100 17,613,035,885
COLORADO 26,593 132,399,577 65,129 830,919,951 91,722 963,319,528
CONNECTICUT 44,382 590,303,460 55,109 993,495,290 99,491 1,583,798,750
DELAWARE 10,032 59,239,880 19,110 268,332,363 29,142 327,572,243
DIST. OF COL. 10,195 63,884,453 12,598 164,789,345 22,793 228,673,798
FLORIDA 60,704 366,960,975 310,807 6,338,509,410 371,511 6,705,470,385
GEORGIA 37,889 257,223,152 146,466 2,230,447,829 184,355 2,487,670,981
GUAM 600 10,575,583 2,751 51,629,741 3,351 62,205,324
HAWAII 14,770 148,524,835 20,875 290,086,505 35,645 438,611,340
IDAHO 7,942 37,685,776 31,559 459,662,584 39,501 497,348,360
ILLINOIS 63,394 421,988,023 165,072 2,824,107,030 228,466 3,246,095,053
INDIANA 34,092 224,381,073 113,857 1,803,473,040 147,949 2,027,854,113
IOWA 34,016 259,850,360 51,722 655,616,643 85,738 915,467,003
KANSAS 28,931 205,801,314 54,033 678,341,577 82,964 884,142,891
KENTUCKY 59,512 469,718,258 77,201 976,043,266 136,713 1,445,761,524
LOUISIANA 25,984 146,645,632 108,501 1,746,203,098 134,485 1,892,848,730
MAINE 15,843 186,027,469 18,442 257,973,356 34,285 444,000,825
MARYLAND 32,107 241,915,625 81,275 1,394,680,931 113,382 1,636,596,556
MASSACHUSETTS 40,748 445,222,745 78,488 1,686,221,558 119,236 2,131,444,303
MICHIGAN 91,376 1,108,606,906 220,843 3,539,531,851 312,219 4,648,138,757
MINNESOTA 38,680 238,629,979 71,349 1,115,495,791 110,029 1,354,125,770
MISSISSIPPI 17,203 47,871,692 102,700 1,369,047,473 119,903 1,416,919,165
MISSOURI 50,265 300,414,980 113,376 1,797,548,057 163,641 2,097,963,037
MONTANA 5,971 26,012,926 10,418 97,751,132 16,389 123,764,058
NEBRASKA 20,196 190,125,228 34,075 516,022,461 54,271 706,147,689
NEVADA 18,558 95,326,580 32,887 473,995,736 51,445 569,322,316
NEW HAMPSHIRE 6,503 34,778,708 12,711 159,191,023 19,214 193,969,731
NEW JERSEY 55,249 467,388,322 112,110 2,511,460,440 167,359 2,978,848,762
NEW MEXICO 14,664 131,166,335 27,666 592,946,470 42,330 724,112,805
NEW YORK 115,113 1,268,865,027 225,667 4,153,656,417 340,780 5,422,521,444
NORTH CAROLINA 31,595 118,267,873 106,909 1,185,739,490 138,504 1,304,007,363
NORTH DAKOTA 5,110 32,659,355 13,118 184,451,110 18,228 217,110,465
OHIO 137,293 983,511,649 257,704 3,824,435,796 394,997 4,807,947,445
OKLAHOMA 28,831 248,167,051 83,862 1,542,280,155 112,693 1,790,447,206
OREGON 45,425 416,564,437 75,523 1,164,939,616 120,948 1,581,504,053
PENNSYLVANIA 35,312 148,660,106 82,311 716,341,875 117,623 865,001,981
PUERTO RICO 13,502 84,606,221 90,339 1,147,701,090 103,841 1,232,307,311
RHODE ISLAND 5,828 39,075,737 10,372 146,318,564 16,200 185,394,301
SOUTH CAROLINA 34,310 157,737,716 75,046 1,162,796,609 109,356 1,320,534,325
SOUTH DAKOTA 7,652 50,648,662 16,199 201,755,301 23,851 252,403,963
TENNESSEE 73,646 544,685,171 141,872 2,598,179,971 215,518 3,142,865,142
TEXAS 146,081 1,651,318,879 695,957 15,881,904,313 842,038 17,533,223,192
UTAH 9,313 42,436,332 25,575 339,279,545 34,888 381,715,877
VERMONT 2,113 10,134,934 5,436 70,506,050 7,549 80,640,984
VIRGIN ISLANDS 517 3,906,660 2,105 37,227,651 2,622 41,134,311
VIRGINIA 60,859 447,917,923 106,261 1,986,643,435 167,120 2,434,561,358
WASHINGTON 75,711 491,688,987 112,084 1,464,604,217 187,795 1,956,293,204
WEST VIRGINIA 17,679 73,273,076 34,697 517,168,763 52,376 590,441,839
WISCONSIN 37,285 361,768,266 96,613 2,086,450,168 133,898 2,448,218,434
WYOMING 3,712 17,391,435 9,276 133,547,690 12,988 150,939,125
TOTALS 2,172,646 $23,208,877,458 5,030,205 $92,605,402,263 7,202,851 $115,814,279,721
Source: Federal Systems; data as of September 26, 2019.
1 Processing Year, the calendar year the collections actually took place.
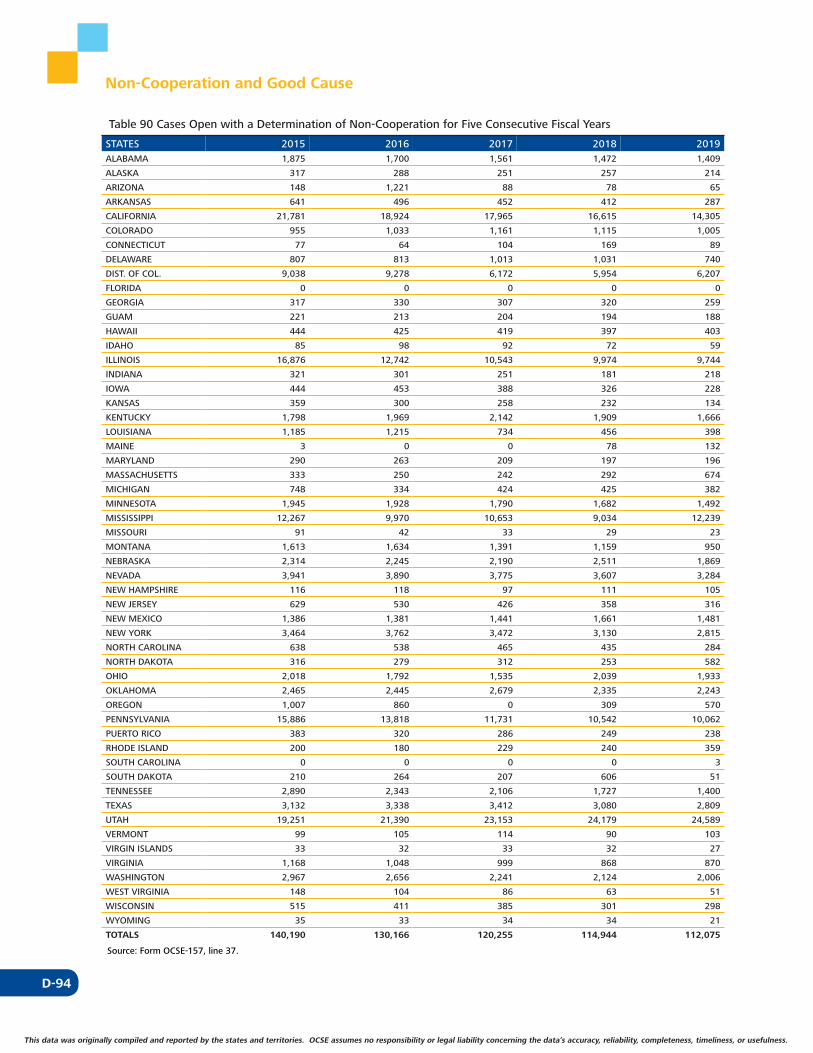
D-94
This data was originally compiled and reported by the states and territories. OCSE assumes no responsibility or legal liability concerning the data’s accuracy, reliability, completeness, timeliness, or usefulness.
Non-Cooperation and Good Cause
Table 90 Cases Open with a Determination of Non-Cooperation for Five Consecutive Fiscal Years
STATES 2015 2016 2017 2018 2019ALABAMA 1,875 1,700 1,561 1,472 1,409
ALASKA 317 288 251 257 214
ARIZONA 148 1,221 88 78 65
ARKANSAS 641 496 452 412 287
CALIFORNIA 21,781 18,924 17,965 16,615 14,305
COLORADO 955 1,033 1,161 1,115 1,005
CONNECTICUT 77 64 104 169 89
DELAWARE 807 813 1,013 1,031 740
DIST. OF COL. 9,038 9,278 6,172 5,954 6,207
FLORIDA 0 0 0 0 0
GEORGIA 317 330 307 320 259
GUAM 221 213 204 194 188
HAWAII 444 425 419 397 403
IDAHO 85 98 92 72 59
ILLINOIS 16,876 12,742 10,543 9,974 9,744
INDIANA 321 301 251 181 218
IOWA 444 453 388 326 228
KANSAS 359 300 258 232 134
KENTUCKY 1,798 1,969 2,142 1,909 1,666
LOUISIANA 1,185 1,215 734 456 398
MAINE 3 0 0 78 132
MARYLAND 290 263 209 197 196
MASSACHUSETTS 333 250 242 292 674
MICHIGAN 748 334 424 425 382
MINNESOTA 1,945 1,928 1,790 1,682 1,492
MISSISSIPPI 12,267 9,970 10,653 9,034 12,239
MISSOURI 91 42 33 29 23
MONTANA 1,613 1,634 1,391 1,159 950
NEBRASKA 2,314 2,245 2,190 2,511 1,869
NEVADA 3,941 3,890 3,775 3,607 3,284
NEW HAMPSHIRE 116 118 97 111 105
NEW JERSEY 629 530 426 358 316
NEW MEXICO 1,386 1,381 1,441 1,661 1,481
NEW YORK 3,464 3,762 3,472 3,130 2,815
NORTH CAROLINA 638 538 465 435 284
NORTH DAKOTA 316 279 312 253 582
OHIO 2,018 1,792 1,535 2,039 1,933
OKLAHOMA 2,465 2,445 2,679 2,335 2,243
OREGON 1,007 860 0 309 570
PENNSYLVANIA 15,886 13,818 11,731 10,542 10,062
PUERTO RICO 383 320 286 249 238
RHODE ISLAND 200 180 229 240 359
SOUTH CAROLINA 0 0 0 0 3
SOUTH DAKOTA 210 264 207 606 51
TENNESSEE 2,890 2,343 2,106 1,727 1,400
TEXAS 3,132 3,338 3,412 3,080 2,809
UTAH 19,251 21,390 23,153 24,179 24,589
VERMONT 99 105 114 90 103
VIRGIN ISLANDS 33 32 33 32 27
VIRGINIA 1,168 1,048 999 868 870
WASHINGTON 2,967 2,656 2,241 2,124 2,006
WEST VIRGINIA 148 104 86 63 51
WISCONSIN 515 411 385 301 298
WYOMING 35 33 34 34 21
TOTALS 140,190 130,166 120,255 114,944 112,075
Source: Form OCSE-157, line 37.
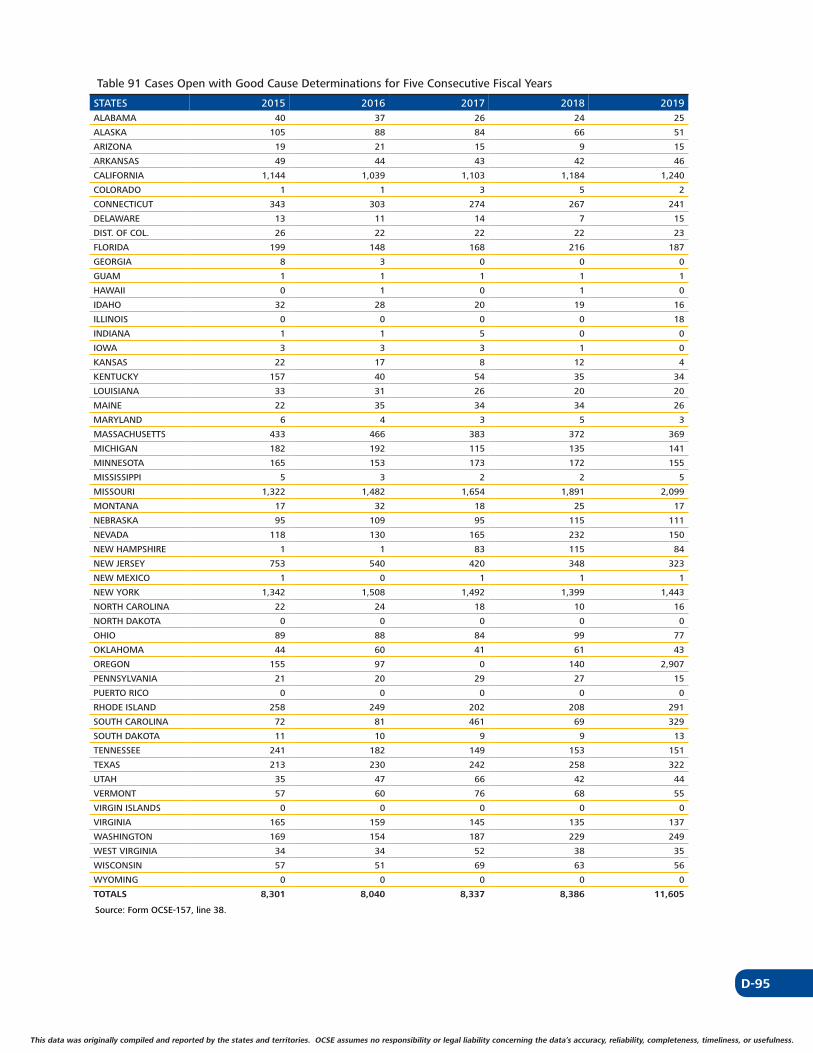
D-95
This data was originally compiled and reported by the states and territories. OCSE assumes no responsibility or legal liability concerning the data’s accuracy, reliability, completeness, timeliness, or usefulness. This data was originally compiled and reported by the states and territories. OCSE assumes no responsibility or legal liability concerning the data’s accuracy, reliability, completeness, timeliness, or usefulness.
Table 91 Cases Open with Good Cause Determinations for Five Consecutive Fiscal Years
STATES 2015 2016 2017 2018 2019ALABAMA 40 37 26 24 25
ALASKA 105 88 84 66 51
ARIZONA 19 21 15 9 15
ARKANSAS 49 44 43 42 46
CALIFORNIA 1,144 1,039 1,103 1,184 1,240
COLORADO 1 1 3 5 2
CONNECTICUT 343 303 274 267 241
DELAWARE 13 11 14 7 15
DIST. OF COL. 26 22 22 22 23
FLORIDA 199 148 168 216 187
GEORGIA 8 3 0 0 0
GUAM 1 1 1 1 1
HAWAII 0 1 0 1 0
IDAHO 32 28 20 19 16
ILLINOIS 0 0 0 0 18
INDIANA 1 1 5 0 0
IOWA 3 3 3 1 0
KANSAS 22 17 8 12 4
KENTUCKY 157 40 54 35 34
LOUISIANA 33 31 26 20 20
MAINE 22 35 34 34 26
MARYLAND 6 4 3 5 3
MASSACHUSETTS 433 466 383 372 369
MICHIGAN 182 192 115 135 141
MINNESOTA 165 153 173 172 155
MISSISSIPPI 5 3 2 2 5
MISSOURI 1,322 1,482 1,654 1,891 2,099
MONTANA 17 32 18 25 17
NEBRASKA 95 109 95 115 111
NEVADA 118 130 165 232 150
NEW HAMPSHIRE 1 1 83 115 84
NEW JERSEY 753 540 420 348 323
NEW MEXICO 1 0 1 1 1
NEW YORK 1,342 1,508 1,492 1,399 1,443
NORTH CAROLINA 22 24 18 10 16
NORTH DAKOTA 0 0 0 0 0
OHIO 89 88 84 99 77
OKLAHOMA 44 60 41 61 43
OREGON 155 97 0 140 2,907
PENNSYLVANIA 21 20 29 27 15
PUERTO RICO 0 0 0 0 0
RHODE ISLAND 258 249 202 208 291
SOUTH CAROLINA 72 81 461 69 329
SOUTH DAKOTA 11 10 9 9 13
TENNESSEE 241 182 149 153 151
TEXAS 213 230 242 258 322
UTAH 35 47 66 42 44
VERMONT 57 60 76 68 55
VIRGIN ISLANDS 0 0 0 0 0
VIRGINIA 165 159 145 135 137
WASHINGTON 169 154 187 229 249
WEST VIRGINIA 34 34 52 38 35
WISCONSIN 57 51 69 63 56
WYOMING 0 0 0 0 0
TOTALS 8,301 8,040 8,337 8,386 11,605
Source: Form OCSE-157, line 38.
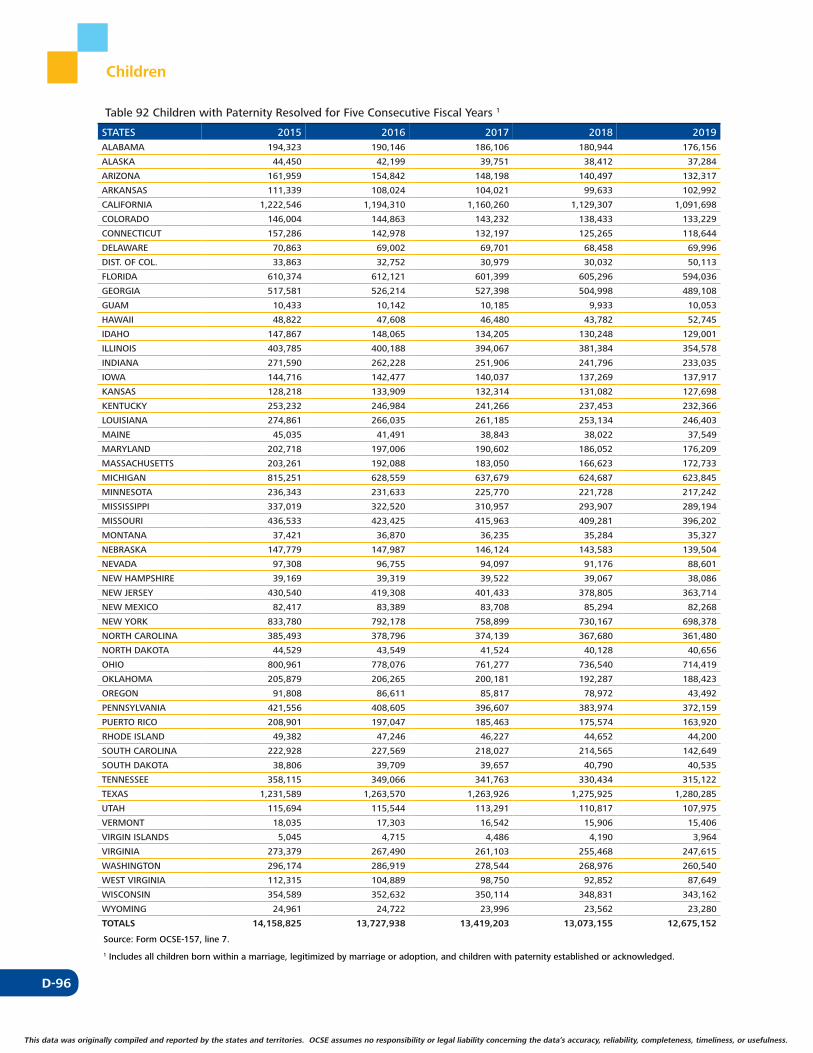
D-96
This data was originally compiled and reported by the states and territories. OCSE assumes no responsibility or legal liability concerning the data’s accuracy, reliability, completeness, timeliness, or usefulness.
Children
Table 92 Children with Paternity Resolved for Five Consecutive Fiscal Years 1
STATES 2015 2016 2017 2018 2019ALABAMA 194,323 190,146 186,106 180,944 176,156
ALASKA 44,450 42,199 39,751 38,412 37,284
ARIZONA 161,959 154,842 148,198 140,497 132,317
ARKANSAS 111,339 108,024 104,021 99,633 102,992
CALIFORNIA 1,222,546 1,194,310 1,160,260 1,129,307 1,091,698
COLORADO 146,004 144,863 143,232 138,433 133,229
CONNECTICUT 157,286 142,978 132,197 125,265 118,644
DELAWARE 70,863 69,002 69,701 68,458 69,996
DIST. OF COL. 33,863 32,752 30,979 30,032 50,113
FLORIDA 610,374 612,121 601,399 605,296 594,036
GEORGIA 517,581 526,214 527,398 504,998 489,108
GUAM 10,433 10,142 10,185 9,933 10,053
HAWAII 48,822 47,608 46,480 43,782 52,745
IDAHO 147,867 148,065 134,205 130,248 129,001
ILLINOIS 403,785 400,188 394,067 381,384 354,578
INDIANA 271,590 262,228 251,906 241,796 233,035
IOWA 144,716 142,477 140,037 137,269 137,917
KANSAS 128,218 133,909 132,314 131,082 127,698
KENTUCKY 253,232 246,984 241,266 237,453 232,366
LOUISIANA 274,861 266,035 261,185 253,134 246,403
MAINE 45,035 41,491 38,843 38,022 37,549
MARYLAND 202,718 197,006 190,602 186,052 176,209
MASSACHUSETTS 203,261 192,088 183,050 166,623 172,733
MICHIGAN 815,251 628,559 637,679 624,687 623,845
MINNESOTA 236,343 231,633 225,770 221,728 217,242
MISSISSIPPI 337,019 322,520 310,957 293,907 289,194
MISSOURI 436,533 423,425 415,963 409,281 396,202
MONTANA 37,421 36,870 36,235 35,284 35,327
NEBRASKA 147,779 147,987 146,124 143,583 139,504
NEVADA 97,308 96,755 94,097 91,176 88,601
NEW HAMPSHIRE 39,169 39,319 39,522 39,067 38,086
NEW JERSEY 430,540 419,308 401,433 378,805 363,714
NEW MEXICO 82,417 83,389 83,708 85,294 82,268
NEW YORK 833,780 792,178 758,899 730,167 698,378
NORTH CAROLINA 385,493 378,796 374,139 367,680 361,480
NORTH DAKOTA 44,529 43,549 41,524 40,128 40,656
OHIO 800,961 778,076 761,277 736,540 714,419
OKLAHOMA 205,879 206,265 200,181 192,287 188,423
OREGON 91,808 86,611 85,817 78,972 43,492
PENNSYLVANIA 421,556 408,605 396,607 383,974 372,159
PUERTO RICO 208,901 197,047 185,463 175,574 163,920
RHODE ISLAND 49,382 47,246 46,227 44,652 44,200
SOUTH CAROLINA 222,928 227,569 218,027 214,565 142,649
SOUTH DAKOTA 38,806 39,709 39,657 40,790 40,535
TENNESSEE 358,115 349,066 341,763 330,434 315,122
TEXAS 1,231,589 1,263,570 1,263,926 1,275,925 1,280,285
UTAH 115,694 115,544 113,291 110,817 107,975
VERMONT 18,035 17,303 16,542 15,906 15,406
VIRGIN ISLANDS 5,045 4,715 4,486 4,190 3,964
VIRGINIA 273,379 267,490 261,103 255,468 247,615
WASHINGTON 296,174 286,919 278,544 268,976 260,540
WEST VIRGINIA 112,315 104,889 98,750 92,852 87,649
WISCONSIN 354,589 352,632 350,114 348,831 343,162
WYOMING 24,961 24,722 23,996 23,562 23,280
TOTALS 14,158,825 13,727,938 13,419,203 13,073,155 12,675,152
Source: Form OCSE-157, line 7.
1 Includes all children born within a marriage, legitimized by marriage or adoption, and children with paternity established or acknowledged.

D-97
This data was originally compiled and reported by the states and territories. OCSE assumes no responsibility or legal liability concerning the data’s accuracy, reliability, completeness, timeliness, or usefulness. This data was originally compiled and reported by the states and territories. OCSE assumes no responsibility or legal liability concerning the data’s accuracy, reliability, completeness, timeliness, or usefulness.
Table 93 Total Number of Children in IV-D Cases for Five Consecutive Fiscal Years
STATES 2015 2016 2017 2018 2019ALABAMA 199,755 194,701 189,820 184,048 178,613
ALASKA 46,378 43,712 41,203 39,966 38,649
ARIZONA 172,779 164,677 156,537 147,555 138,419
ARKANSAS 118,495 114,043 109,744 104,872 111,820
CALIFORNIA 1,300,157 1,265,153 1,224,178 1,188,815 1,145,951
COLORADO 154,426 152,919 151,690 146,315 140,523
CONNECTICUT 164,738 147,825 136,044 128,510 121,512
DELAWARE 87,119 80,538 85,282 82,833 81,709
DIST. OF COL. 45,495 43,544 39,299 38,095 59,980
FLORIDA 667,152 669,861 656,368 660,681 648,077
GEORGIA 542,222 553,455 554,882 527,927 511,194
GUAM 11,508 11,232 11,286 11,061 11,176
HAWAII 73,318 69,337 65,621 59,964 55,457
IDAHO 156,328 155,940 139,367 135,076 134,606
ILLINOIS 508,241 488,288 475,573 462,673 426,272
INDIANA 278,973 268,747 257,988 247,011 237,905
IOWA 168,009 164,737 161,741 158,297 145,324
KANSAS 138,443 146,900 144,524 143,253 140,219
KENTUCKY 271,662 265,366 260,496 257,419 252,872
LOUISIANA 298,454 286,573 280,705 271,715 264,239
MAINE 73,828 67,255 62,056 59,754 58,049
MARYLAND 220,367 214,511 206,544 204,424 190,158
MASSACHUSETTS 220,152 207,874 198,349 200,996 198,214
MICHIGAN 881,557 881,343 877,852 845,634 839,204
MINNESOTA 250,210 245,095 239,540 235,564 230,153
MISSISSIPPI 370,473 354,840 344,663 322,548 319,863
MISSOURI 456,080 441,300 433,604 429,940 415,029
MONTANA 39,138 38,771 38,067 37,061 36,088
NEBRASKA 155,245 155,522 153,262 151,379 146,186
NEVADA 105,747 105,395 101,476 97,639 94,312
NEW HAMPSHIRE 41,271 41,506 41,438 41,033 40,116
NEW JERSEY 473,528 456,279 433,961 407,084 387,615
NEW MEXICO 90,566 91,828 93,351 97,061 91,248
NEW YORK 911,570 852,562 809,082 776,146 741,625
NORTH CAROLINA 418,908 413,936 411,497 405,532 400,475
NORTH DAKOTA 45,318 44,275 42,270 40,850 42,191
OHIO 839,537 813,463 792,221 764,571 742,412
OKLAHOMA 223,500 223,836 215,800 206,752 203,461
OREGON 205,544 187,199 181,286 156,729 163,304
PENNSYLVANIA 529,302 509,296 496,245 481,997 468,672
PUERTO RICO 209,031 197,145 185,533 175,636 163,982
RHODE ISLAND 54,192 51,240 50,856 49,956 53,763
SOUTH CAROLINA 249,907 254,491 242,144 238,333 163,988
SOUTH DAKOTA 41,137 42,501 42,416 44,507 43,110
TENNESSEE 383,824 373,762 366,485 354,486 337,477
TEXAS 1,742,807 1,773,253 1,736,585 1,723,910 1,706,007
UTAH 120,278 120,337 117,742 115,292 112,411
VERMONT 18,884 18,151 17,353 16,719 16,049
VIRGIN ISLANDS 7,296 6,782 6,402 5,933 5,597
VIRGINIA 287,806 282,305 275,103 269,529 261,392
WASHINGTON 311,531 301,786 293,191 283,195 274,547
WEST VIRGINIA 116,942 108,642 102,354 96,471 91,027
WISCONSIN 374,304 372,936 371,218 370,587 364,746
WYOMING 25,502 25,341 24,874 24,480 24,117
TOTALS 15,898,934 15,562,306 15,147,168 14,727,814 14,271,105
Source: Form OCSE-157, line 4.

D-98
This data was originally compiled and reported by the states and territories. OCSE assumes no responsibility or legal liability concerning the data’s accuracy, reliability, completeness, timeliness, or usefulness.
Table 94 Number of Children Determined Eligible For Medicaid for Five Consecutive Fiscal Years
STATES 2015 2016 2017 2018 2019ALABAMA 126,113 121,992 103,694 101,730 99,628
ALASKA 6,168 6,042 5,746 4,878 4,487
ARIZONA 25,265 23,275 21,677 20,062 18,822
ARKANSAS 69,561 54,800 76,233 63,339 70,722
CALIFORNIA 516,559 440,969 388,064 354,017 325,166
COLORADO 1,910 2,701 4,873 2,981 2,326
CONNECTICUT 14,712 6,460 4,811 4,006 3,413
DELAWARE 52,790 36,786 51,983 50,132 43,468
DIST. OF COL. 27,386 26,717 24,150 24,114 24,850
FLORIDA 192,697 186,367 178,272 176,018 169,075
GEORGIA 306,549 309,637 309,785 294,279 285,155
GUAM 0 0 0 0 0
HAWAII 0 0 0 0 0
IDAHO 75,147 74,457 62,764 50,383 41,907
ILLINOIS 305,141 291,916 282,956 255,323 237,362
INDIANA 18,746 25,224 28,843 31,950 34,362
IOWA 114,727 116,372 117,106 115,350 111,772
KANSAS 61,996 47,682 75,955 75,029 70,024
KENTUCKY 118,658 120,703 127,791 131,279 131,816
LOUISIANA 248,559 223,935 212,248 203,993 193,825
MAINE 11,432 9,192 7,632 6,931 8,721
MARYLAND 0 0 0 0 0
MASSACHUSETTS 56,672 42,651 37,228 39,378 42,348
MICHIGAN 495,667 477,932 486,556 491,953 487,676
MINNESOTA 100,413 89,866 46,415 62,434 67,734
MISSISSIPPI 0 0 0 0 0
MISSOURI 22,276 16,039 14,660 14,172 13,422
MONTANA 9,880 9,388 5,241 3,858 2,941
NEBRASKA 83,490 82,332 76,566 66,340 63,092
NEVADA 58,471 56,817 54,565 52,332 50,139
NEW HAMPSHIRE 21,985 23,596 27,069 26,617 25,895
NEW JERSEY 42,423 34,131 28,714 25,105 22,695
NEW MEXICO 27,006 24,634 23,113 23,827 24,814
NEW YORK 290,567 260,202 215,262 184,841 162,968
NORTH CAROLINA 302,642 295,442 296,415 294,748 292,588
NORTH DAKOTA 558 539 477 552 5,343
OHIO 411,316 372,563 400,385 393,825 379,836
OKLAHOMA 129,705 131,465 123,727 116,682 113,470
OREGON 154,266 148,950 117,818 79,240 20
PENNSYLVANIA 297,849 291,498 246,538 276,091 267,594
PUERTO RICO 69 98 83 82 73
RHODE ISLAND 40,176 38,105 38,183 37,855 41,278
SOUTH CAROLINA 25,195 28,469 27,846 25,755 37,088
SOUTH DAKOTA 21,873 23,187 22,561 24,130 21,013
TENNESSEE 279,480 272,545 282,448 218,010 230,223
TEXAS 838,090 826,567 797,708 781,980 756,079
UTAH 60,134 60,149 56,000 53,300 49,846
VERMONT 0 0 0 0 0
VIRGIN ISLANDS 2 2 2 0 0
VIRGINIA 17 155,651 157,641 158,668 157,659
WASHINGTON 155,549 150,111 143,744 136,910 130,558
WEST VIRGINIA 67,195 60,034 55,596 48,634 43,388
WISCONSIN 172,952 167,720 166,888 170,798 151,773
WYOMING 6,383 5,767 5,376 5,608 5,833
TOTALS 6,466,417 6,271,677 6,039,408 5,779,519 5,524,287
Source: Form OCSE-157, line 33.
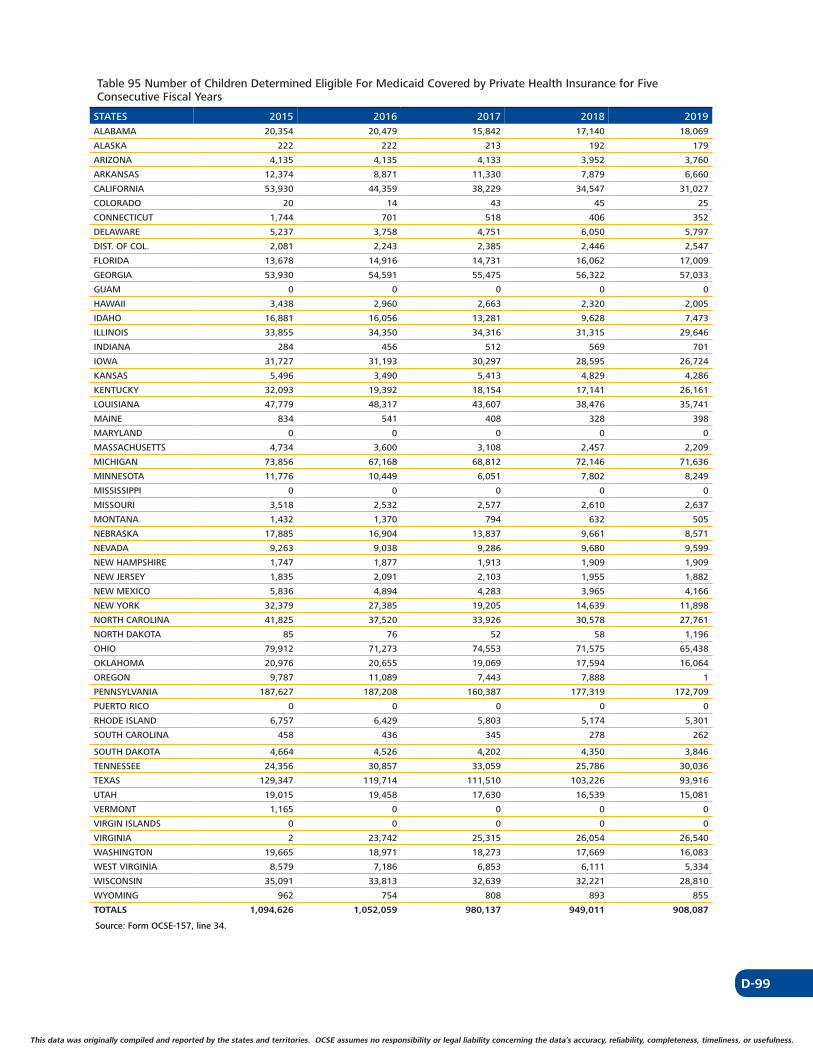
D-99
This data was originally compiled and reported by the states and territories. OCSE assumes no responsibility or legal liability concerning the data’s accuracy, reliability, completeness, timeliness, or usefulness. This data was originally compiled and reported by the states and territories. OCSE assumes no responsibility or legal liability concerning the data’s accuracy, reliability, completeness, timeliness, or usefulness.
Table 95 Number of Children Determined Eligible For Medicaid Covered by Private Health Insurance for Five Consecutive Fiscal Years
STATES 2015 2016 2017 2018 2019ALABAMA 20,354 20,479 15,842 17,140 18,069
ALASKA 222 222 213 192 179
ARIZONA 4,135 4,135 4,133 3,952 3,760
ARKANSAS 12,374 8,871 11,330 7,879 6,660
CALIFORNIA 53,930 44,359 38,229 34,547 31,027
COLORADO 20 14 43 45 25
CONNECTICUT 1,744 701 518 406 352
DELAWARE 5,237 3,758 4,751 6,050 5,797
DIST. OF COL. 2,081 2,243 2,385 2,446 2,547
FLORIDA 13,678 14,916 14,731 16,062 17,009
GEORGIA 53,930 54,591 55,475 56,322 57,033
GUAM 0 0 0 0 0
HAWAII 3,438 2,960 2,663 2,320 2,005
IDAHO 16,881 16,056 13,281 9,628 7,473
ILLINOIS 33,855 34,350 34,316 31,315 29,646
INDIANA 284 456 512 569 701
IOWA 31,727 31,193 30,297 28,595 26,724
KANSAS 5,496 3,490 5,413 4,829 4,286
KENTUCKY 32,093 19,392 18,154 17,141 26,161
LOUISIANA 47,779 48,317 43,607 38,476 35,741
MAINE 834 541 408 328 398
MARYLAND 0 0 0 0 0
MASSACHUSETTS 4,734 3,600 3,108 2,457 2,209
MICHIGAN 73,856 67,168 68,812 72,146 71,636
MINNESOTA 11,776 10,449 6,051 7,802 8,249
MISSISSIPPI 0 0 0 0 0
MISSOURI 3,518 2,532 2,577 2,610 2,637
MONTANA 1,432 1,370 794 632 505
NEBRASKA 17,885 16,904 13,837 9,661 8,571
NEVADA 9,263 9,038 9,286 9,680 9,599
NEW HAMPSHIRE 1,747 1,877 1,913 1,909 1,909
NEW JERSEY 1,835 2,091 2,103 1,955 1,882
NEW MEXICO 5,836 4,894 4,283 3,965 4,166
NEW YORK 32,379 27,385 19,205 14,639 11,898
NORTH CAROLINA 41,825 37,520 33,926 30,578 27,761
NORTH DAKOTA 85 76 52 58 1,196
OHIO 79,912 71,273 74,553 71,575 65,438
OKLAHOMA 20,976 20,655 19,069 17,594 16,064
OREGON 9,787 11,089 7,443 7,888 1
PENNSYLVANIA 187,627 187,208 160,387 177,319 172,709
PUERTO RICO 0 0 0 0 0
RHODE ISLAND 6,757 6,429 5,803 5,174 5,301
SOUTH CAROLINA 458 436 345 278 262
SOUTH DAKOTA 4,664 4,526 4,202 4,350 3,846
TENNESSEE 24,356 30,857 33,059 25,786 30,036
TEXAS 129,347 119,714 111,510 103,226 93,916
UTAH 19,015 19,458 17,630 16,539 15,081
VERMONT 1,165 0 0 0 0
VIRGIN ISLANDS 0 0 0 0 0
VIRGINIA 2 23,742 25,315 26,054 26,540
WASHINGTON 19,665 18,971 18,273 17,669 16,083
WEST VIRGINIA 8,579 7,186 6,853 6,111 5,334
WISCONSIN 35,091 33,813 32,639 32,221 28,810
WYOMING 962 754 808 893 855
TOTALS 1,094,626 1,052,059 980,137 949,011 908,087
Source: Form OCSE-157, line 34.
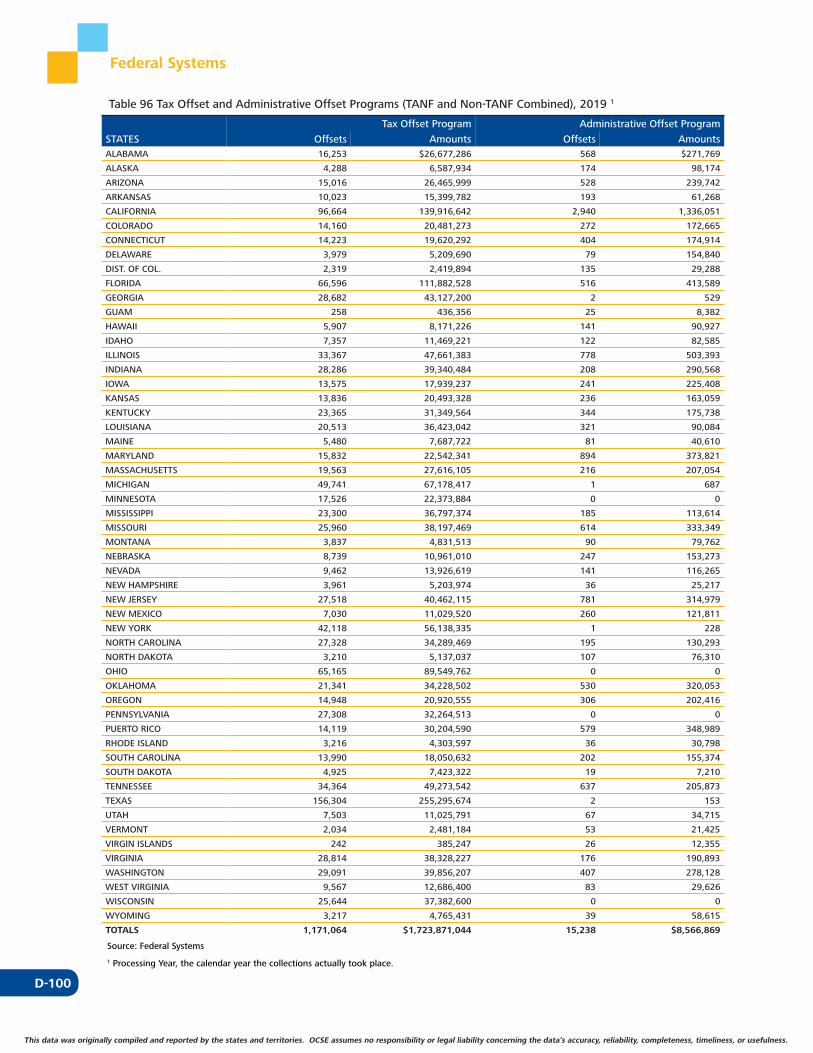
D-100
This data was originally compiled and reported by the states and territories. OCSE assumes no responsibility or legal liability concerning the data’s accuracy, reliability, completeness, timeliness, or usefulness.
Federal Systems
Table 96 Tax Offset and Administrative Offset Programs (TANF and Non-TANF Combined), 2019 1
Tax Offset Program Administrative Offset Program
STATES Offsets Amounts Offsets AmountsALABAMA 16,253 $26,677,286 568 $271,769
ALASKA 4,288 6,587,934 174 98,174
ARIZONA 15,016 26,465,999 528 239,742
ARKANSAS 10,023 15,399,782 193 61,268
CALIFORNIA 96,664 139,916,642 2,940 1,336,051
COLORADO 14,160 20,481,273 272 172,665
CONNECTICUT 14,223 19,620,292 404 174,914
DELAWARE 3,979 5,209,690 79 154,840
DIST. OF COL. 2,319 2,419,894 135 29,288
FLORIDA 66,596 111,882,528 516 413,589
GEORGIA 28,682 43,127,200 2 529
GUAM 258 436,356 25 8,382
HAWAII 5,907 8,171,226 141 90,927
IDAHO 7,357 11,469,221 122 82,585
ILLINOIS 33,367 47,661,383 778 503,393
INDIANA 28,286 39,340,484 208 290,568
IOWA 13,575 17,939,237 241 225,408
KANSAS 13,836 20,493,328 236 163,059
KENTUCKY 23,365 31,349,564 344 175,738
LOUISIANA 20,513 36,423,042 321 90,084
MAINE 5,480 7,687,722 81 40,610
MARYLAND 15,832 22,542,341 894 373,821
MASSACHUSETTS 19,563 27,616,105 216 207,054
MICHIGAN 49,741 67,178,417 1 687
MINNESOTA 17,526 22,373,884 0 0
MISSISSIPPI 23,300 36,797,374 185 113,614
MISSOURI 25,960 38,197,469 614 333,349
MONTANA 3,837 4,831,513 90 79,762
NEBRASKA 8,739 10,961,010 247 153,273
NEVADA 9,462 13,926,619 141 116,265
NEW HAMPSHIRE 3,961 5,203,974 36 25,217
NEW JERSEY 27,518 40,462,115 781 314,979
NEW MEXICO 7,030 11,029,520 260 121,811
NEW YORK 42,118 56,138,335 1 228
NORTH CAROLINA 27,328 34,289,469 195 130,293
NORTH DAKOTA 3,210 5,137,037 107 76,310
OHIO 65,165 89,549,762 0 0
OKLAHOMA 21,341 34,228,502 530 320,053
OREGON 14,948 20,920,555 306 202,416
PENNSYLVANIA 27,308 32,264,513 0 0
PUERTO RICO 14,119 30,204,590 579 348,989
RHODE ISLAND 3,216 4,303,597 36 30,798
SOUTH CAROLINA 13,990 18,050,632 202 155,374
SOUTH DAKOTA 4,925 7,423,322 19 7,210
TENNESSEE 34,364 49,273,542 637 205,873
TEXAS 156,304 255,295,674 2 153
UTAH 7,503 11,025,791 67 34,715
VERMONT 2,034 2,481,184 53 21,425
VIRGIN ISLANDS 242 385,247 26 12,355
VIRGINIA 28,814 38,328,227 176 190,893
WASHINGTON 29,091 39,856,207 407 278,128
WEST VIRGINIA 9,567 12,686,400 83 29,626
WISCONSIN 25,644 37,382,600 0 0
WYOMING 3,217 4,765,431 39 58,615
TOTALS 1,171,064 $1,723,871,044 15,238 $8,566,869
Source: Federal Systems
1 Processing Year, the calendar year the collections actually took place.
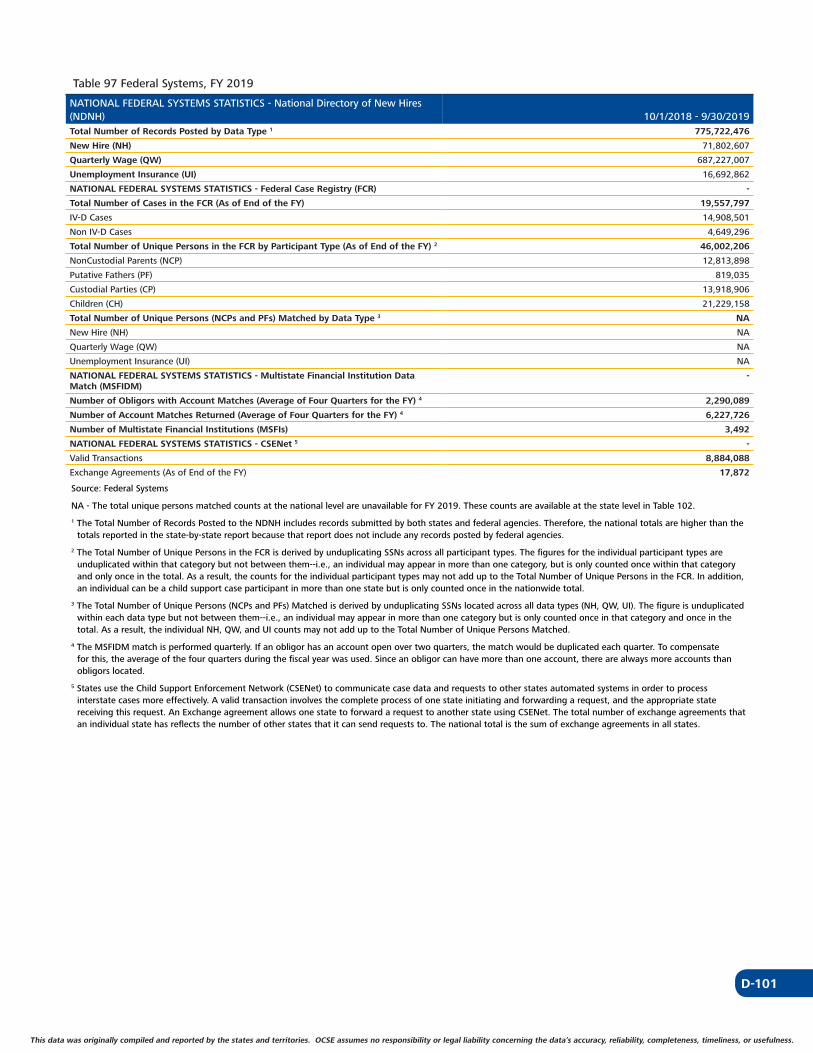
D-101
This data was originally compiled and reported by the states and territories. OCSE assumes no responsibility or legal liability concerning the data’s accuracy, reliability, completeness, timeliness, or usefulness. This data was originally compiled and reported by the states and territories. OCSE assumes no responsibility or legal liability concerning the data’s accuracy, reliability, completeness, timeliness, or usefulness.
Table 97 Federal Systems, FY 2019
NATIONAL FEDERAL SYSTEMS STATISTICS - National Directory of New Hires (NDNH) 10/1/2018 - 9/30/2019Total Number of Records Posted by Data Type 1 775,722,476
New Hire (NH) 71,802,607
Quarterly Wage (QW) 687,227,007
Unemployment Insurance (UI) 16,692,862
NATIONAL FEDERAL SYSTEMS STATISTICS - Federal Case Registry (FCR) -
Total Number of Cases in the FCR (As of End of the FY) 19,557,797
IV-D Cases 14,908,501
Non IV-D Cases 4,649,296
Total Number of Unique Persons in the FCR by Participant Type (As of End of the FY) 2 46,002,206
NonCustodial Parents (NCP) 12,813,898
Putative Fathers (PF) 819,035
Custodial Parties (CP) 13,918,906
Children (CH) 21,229,158
Total Number of Unique Persons (NCPs and PFs) Matched by Data Type 3 NA
New Hire (NH) NA
Quarterly Wage (QW) NA
Unemployment Insurance (UI) NA
NATIONAL FEDERAL SYSTEMS STATISTICS - Multistate Financial Institution Data -Match (MSFIDM)
Number of Obligors with Account Matches (Average of Four Quarters for the FY) 4 2,290,089
Number of Account Matches Returned (Average of Four Quarters for the FY) 4 6,227,726
Number of Multistate Financial Institutions (MSFIs) 3,492
NATIONAL FEDERAL SYSTEMS STATISTICS - CSENet 5 -
Valid Transactions 8,884,088
Exchange Agreements (As of End of the FY) 17,872
Source: Federal Systems
NA - The total unique persons matched counts at the national level are unavailable for FY 2019. These counts are available at the state level in Table 102.
1 The Total Number of Records Posted to the NDNH includes records submitted by both states and federal agencies. Therefore, the national totals are higher than the totals reported in the state-by-state report because that report does not include any records posted by federal agencies.
2 The Total Number of Unique Persons in the FCR is derived by unduplicating SSNs across all participant types. The figures for the individual participant types are unduplicated within that category but not between them--i.e., an individual may appear in more than one category, but is only counted once within that category and only once in the total. As a result, the counts for the individual participant types may not add up to the Total Number of Unique Persons in the FCR. In addition, an individual can be a child support case participant in more than one state but is only counted once in the nationwide total.
3 The Total Number of Unique Persons (NCPs and PFs) Matched is derived by unduplicating SSNs located across all data types (NH, QW, UI). The figure is unduplicated within each data type but not between them--i.e., an individual may appear in more than one category but is only counted once in that category and once in the total. As a result, the individual NH, QW, and UI counts may not add up to the Total Number of Unique Persons Matched.
4 The MSFIDM match is performed quarterly. If an obligor has an account open over two quarters, the match would be duplicated each quarter. To compensate for this, the average of the four quarters during the fiscal year was used. Since an obligor can have more than one account, there are always more accounts than obligors located.
5 States use the Child Support Enforcement Network (CSENet) to communicate case data and requests to other states automated systems in order to process interstate cases more effectively. A valid transaction involves the complete process of one state initiating and forwarding a request, and the appropriate state receiving this request. An Exchange agreement allows one state to forward a request to another state using CSENet. The total number of exchange agreements that an individual state has reflects the number of other states that it can send requests to. The national total is the sum of exchange agreements in all states.
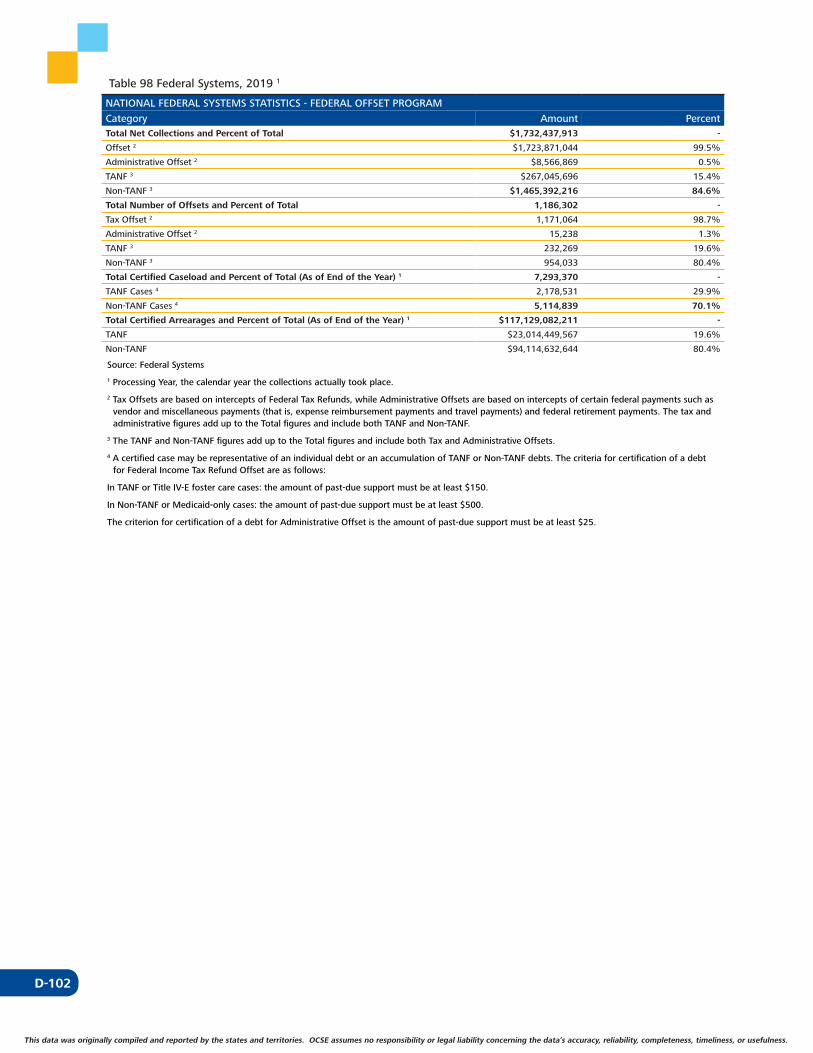
D-102
This data was originally compiled and reported by the states and territories. OCSE assumes no responsibility or legal liability concerning the data’s accuracy, reliability, completeness, timeliness, or usefulness.
Table 98 Federal Systems, 2019 1
NATIONAL FEDERAL SYSTEMS STATISTICS - FEDERAL OFFSET PROGRAM
Category Amount PercentTotal Net Collections and Percent of Total $1,732,437,913 -
Offset 2 $1,723,871,044 99.5%
Administrative Offset 2 $8,566,869 0.5%
TANF 3 $267,045,696 15.4%
Non-TANF 3 $1,465,392,216 84.6%
Total Number of Offsets and Percent of Total 1,186,302 -
Tax Offset 2 1,171,064 98.7%
Administrative Offset 2 15,238 1.3%
TANF 3 232,269 19.6%
Non-TANF 3 954,033 80.4%
Total Certified Caseload and Percent of Total (As of End of the Year) 1 7,293,370 -
TANF Cases 4 2,178,531 29.9%
Non-TANF Cases 4 5,114,839 70.1%
Total Certified Arrearages and Percent of Total (As of End of the Year) 1 $117,129,082,211 -
TANF $23,014,449,567 19.6%
Non-TANF $94,114,632,644 80.4%
Source: Federal Systems
1 Processing Year, the calendar year the collections actually took place.
2 Tax Offsets are based on intercepts of Federal Tax Refunds, while Administrative Offsets are based on intercepts of certain federal payments such as vendor and miscellaneous payments (that is, expense reimbursement payments and travel payments) and federal retirement payments. The tax and administrative figures add up to the Total figures and include both TANF and Non-TANF.
3 The TANF and Non-TANF figures add up to the Total figures and include both Tax and Administrative Offsets.
4 A certified case may be representative of an individual debt or an accumulation of TANF or Non-TANF debts. The criteria for certification of a debt for Federal Income Tax Refund Offset are as follows:
In TANF or Title IV-E foster care cases: the amount of past-due support must be at least $150.
In Non-TANF or Medicaid-only cases: the amount of past-due support must be at least $500.
The criterion for certification of a debt for Administrative Offset is the amount of past-due support must be at least $25.
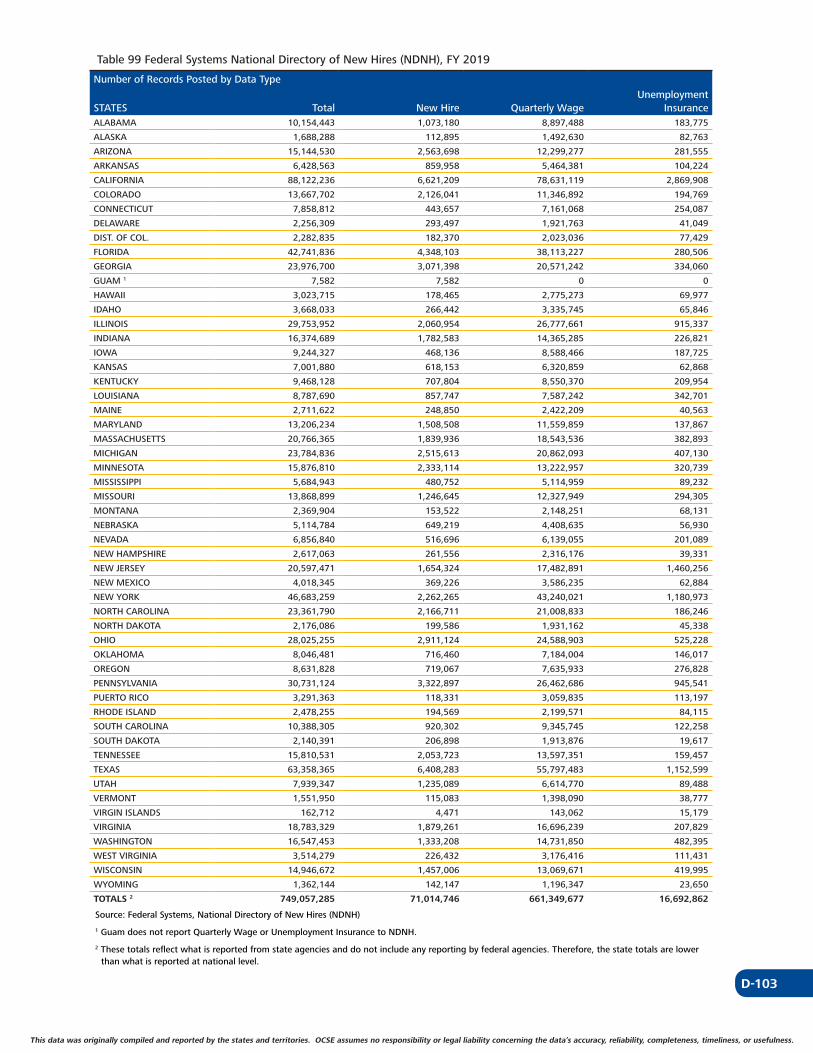
D-103
This data was originally compiled and reported by the states and territories. OCSE assumes no responsibility or legal liability concerning the data’s accuracy, reliability, completeness, timeliness, or usefulness. This data was originally compiled and reported by the states and territories. OCSE assumes no responsibility or legal liability concerning the data’s accuracy, reliability, completeness, timeliness, or usefulness.
Table 99 Federal Systems National Directory of New Hires (NDNH), FY 2019
Number of Records Posted by Data Type
STATESALABAMA 10,154,443 1,073,180 8,897,488 183,775
Total New Hire Quarterly WageUnemployment
Insurance
ALASKA 1,688,288 112,895 1,492,630 82,763
ARIZONA 15,144,530 2,563,698 12,299,277 281,555
ARKANSAS 6,428,563 859,958 5,464,381 104,224
CALIFORNIA 88,122,236 6,621,209 78,631,119 2,869,908
COLORADO 13,667,702 2,126,041 11,346,892 194,769
CONNECTICUT 7,858,812 443,657 7,161,068 254,087
DELAWARE 2,256,309 293,497 1,921,763 41,049
DIST. OF COL. 2,282,835 182,370 2,023,036 77,429
FLORIDA 42,741,836 4,348,103 38,113,227 280,506
GEORGIA 23,976,700 3,071,398 20,571,242 334,060
GUAM 1 7,582 7,582 0 0
HAWAII 3,023,715 178,465 2,775,273 69,977
IDAHO 3,668,033 266,442 3,335,745 65,846
ILLINOIS 29,753,952 2,060,954 26,777,661 915,337
INDIANA 16,374,689 1,782,583 14,365,285 226,821
IOWA 9,244,327 468,136 8,588,466 187,725
KANSAS 7,001,880 618,153 6,320,859 62,868
KENTUCKY 9,468,128 707,804 8,550,370 209,954
LOUISIANA 8,787,690 857,747 7,587,242 342,701
MAINE 2,711,622 248,850 2,422,209 40,563
MARYLAND 13,206,234 1,508,508 11,559,859 137,867
MASSACHUSETTS 20,766,365 1,839,936 18,543,536 382,893
MICHIGAN 23,784,836 2,515,613 20,862,093 407,130
MINNESOTA 15,876,810 2,333,114 13,222,957 320,739
MISSISSIPPI 5,684,943 480,752 5,114,959 89,232
MISSOURI 13,868,899 1,246,645 12,327,949 294,305
MONTANA 2,369,904 153,522 2,148,251 68,131
NEBRASKA 5,114,784 649,219 4,408,635 56,930
NEVADA 6,856,840 516,696 6,139,055 201,089
NEW HAMPSHIRE 2,617,063 261,556 2,316,176 39,331
NEW JERSEY 20,597,471 1,654,324 17,482,891 1,460,256
NEW MEXICO 4,018,345 369,226 3,586,235 62,884
NEW YORK 46,683,259 2,262,265 43,240,021 1,180,973
NORTH CAROLINA 23,361,790 2,166,711 21,008,833 186,246
NORTH DAKOTA 2,176,086 199,586 1,931,162 45,338
OHIO 28,025,255 2,911,124 24,588,903 525,228
OKLAHOMA 8,046,481 716,460 7,184,004 146,017
OREGON 8,631,828 719,067 7,635,933 276,828
PENNSYLVANIA 30,731,124 3,322,897 26,462,686 945,541
PUERTO RICO 3,291,363 118,331 3,059,835 113,197
RHODE ISLAND 2,478,255 194,569 2,199,571 84,115
SOUTH CAROLINA 10,388,305 920,302 9,345,745 122,258
SOUTH DAKOTA 2,140,391 206,898 1,913,876 19,617
TENNESSEE 15,810,531 2,053,723 13,597,351 159,457
TEXAS 63,358,365 6,408,283 55,797,483 1,152,599
UTAH 7,939,347 1,235,089 6,614,770 89,488
VERMONT 1,551,950 115,083 1,398,090 38,777
VIRGIN ISLANDS 162,712 4,471 143,062 15,179
VIRGINIA 18,783,329 1,879,261 16,696,239 207,829
WASHINGTON 16,547,453 1,333,208 14,731,850 482,395
WEST VIRGINIA 3,514,279 226,432 3,176,416 111,431
WISCONSIN 14,946,672 1,457,006 13,069,671 419,995
WYOMING 1,362,144 142,147 1,196,347 23,650
TOTALS 2 749,057,285 71,014,746 661,349,677 16,692,862
Source: Federal Systems, National Directory of New Hires (NDNH)
1 Guam does not report Quarterly Wage or Unemployment Insurance to NDNH.
2 These totals reflect what is reported from state agencies and do not include any reporting by federal agencies. Therefore, the state totals are lower than what is reported at national level.
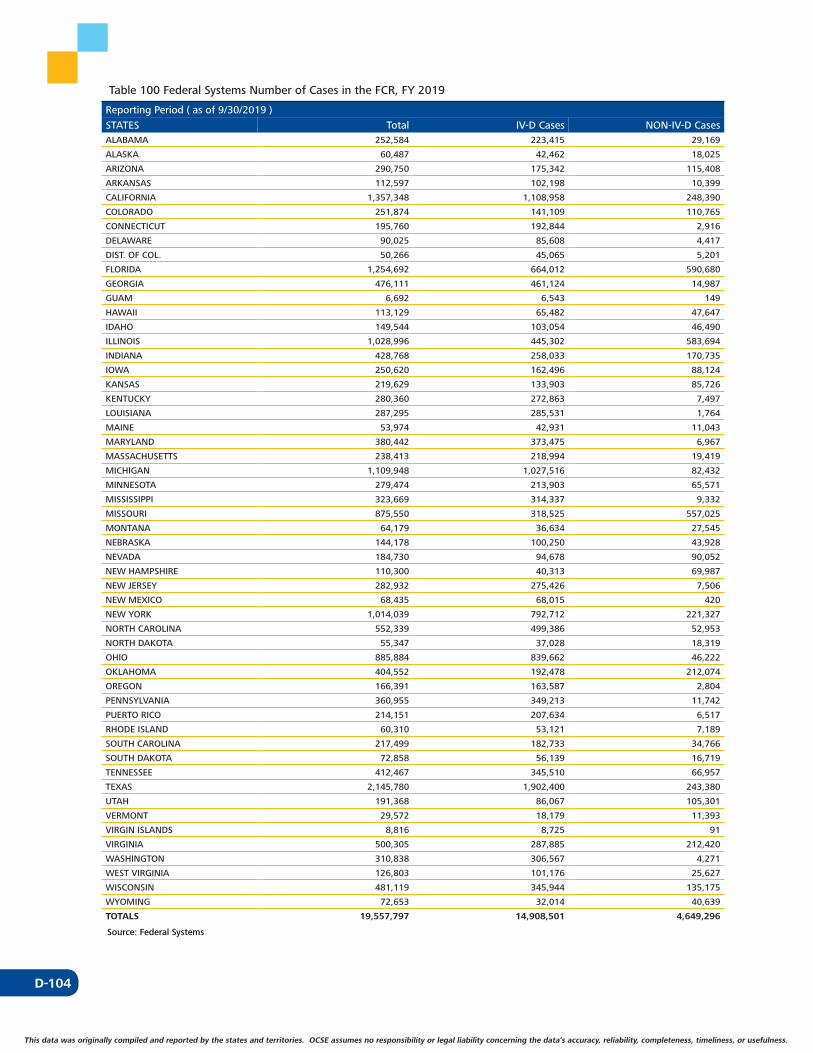
D-104
This data was originally compiled and reported by the states and territories. OCSE assumes no responsibility or legal liability concerning the data’s accuracy, reliability, completeness, timeliness, or usefulness.
Table 100 Federal Systems Number of Cases in the FCR, FY 2019
Reporting Period ( as of 9/30/2019 )
STATES Total IV-D Cases NON-IV-D CasesALABAMA 252,584 223,415 29,169
ALASKA 60,487 42,462 18,025
ARIZONA 290,750 175,342 115,408
ARKANSAS 112,597 102,198 10,399
CALIFORNIA 1,357,348 1,108,958 248,390
COLORADO 251,874 141,109 110,765
CONNECTICUT 195,760 192,844 2,916
DELAWARE 90,025 85,608 4,417
DIST. OF COL. 50,266 45,065 5,201
FLORIDA 1,254,692 664,012 590,680
GEORGIA 476,111 461,124 14,987
GUAM 6,692 6,543 149
HAWAII 113,129 65,482 47,647
IDAHO 149,544 103,054 46,490
ILLINOIS 1,028,996 445,302 583,694
INDIANA 428,768 258,033 170,735
IOWA 250,620 162,496 88,124
KANSAS 219,629 133,903 85,726
KENTUCKY 280,360 272,863 7,497
LOUISIANA 287,295 285,531 1,764
MAINE 53,974 42,931 11,043
MARYLAND 380,442 373,475 6,967
MASSACHUSETTS 238,413 218,994 19,419
MICHIGAN 1,109,948 1,027,516 82,432
MINNESOTA 279,474 213,903 65,571
MISSISSIPPI 323,669 314,337 9,332
MISSOURI 875,550 318,525 557,025
MONTANA 64,179 36,634 27,545
NEBRASKA 144,178 100,250 43,928
NEVADA 184,730 94,678 90,052
NEW HAMPSHIRE 110,300 40,313 69,987
NEW JERSEY 282,932 275,426 7,506
NEW MEXICO 68,435 68,015 420
NEW YORK 1,014,039 792,712 221,327
NORTH CAROLINA 552,339 499,386 52,953
NORTH DAKOTA 55,347 37,028 18,319
OHIO 885,884 839,662 46,222
OKLAHOMA 404,552 192,478 212,074
OREGON 166,391 163,587 2,804
PENNSYLVANIA 360,955 349,213 11,742
PUERTO RICO 214,151 207,634 6,517
RHODE ISLAND 60,310 53,121 7,189
SOUTH CAROLINA 217,499 182,733 34,766
SOUTH DAKOTA 72,858 56,139 16,719
TENNESSEE 412,467 345,510 66,957
TEXAS 2,145,780 1,902,400 243,380
UTAH 191,368 86,067 105,301
VERMONT 29,572 18,179 11,393
VIRGIN ISLANDS 8,816 8,725 91
VIRGINIA 500,305 287,885 212,420
WASHINGTON 310,838 306,567 4,271
WEST VIRGINIA 126,803 101,176 25,627
WISCONSIN 481,119 345,944 135,175
WYOMING 72,653 32,014 40,639
TOTALS 19,557,797 14,908,501 4,649,296
Source: Federal Systems
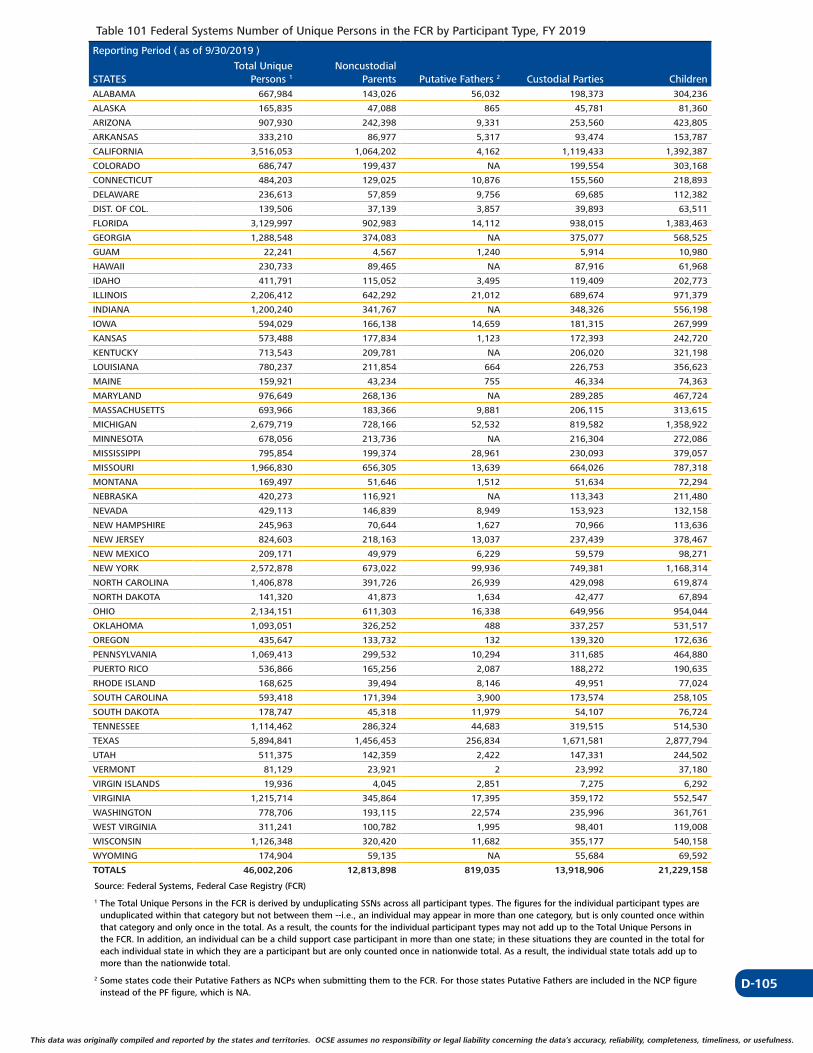
D-105
This data was originally compiled and reported by the states and territories. OCSE assumes no responsibility or legal liability concerning the data’s accuracy, reliability, completeness, timeliness, or usefulness. This data was originally compiled and reported by the states and territories. OCSE assumes no responsibility or legal liability concerning the data’s accuracy, reliability, completeness, timeliness, or usefulness.
Table 101 Federal Systems Number of Unique Persons in the FCR by Participant Type, FY 2019
Reporting Period ( as of 9/30/2019 )
STATESTotal Unique
Persons 1
Noncustodial Parents Putative Fathers 2 Custodial Parties Children
ALABAMA 667,984 143,026 56,032 198,373 304,236
ALASKA 165,835 47,088 865 45,781 81,360
ARIZONA 907,930 242,398 9,331 253,560 423,805
ARKANSAS 333,210 86,977 5,317 93,474 153,787
CALIFORNIA 3,516,053 1,064,202 4,162 1,119,433 1,392,387
COLORADO 686,747 199,437 NA 199,554 303,168
CONNECTICUT 484,203 129,025 10,876 155,560 218,893
DELAWARE 236,613 57,859 9,756 69,685 112,382
DIST. OF COL. 139,506 37,139 3,857 39,893 63,511
FLORIDA 3,129,997 902,983 14,112 938,015 1,383,463
GEORGIA 1,288,548 374,083 NA 375,077 568,525
GUAM 22,241 4,567 1,240 5,914 10,980
HAWAII 230,733 89,465 NA 87,916 61,968
IDAHO 411,791 115,052 3,495 119,409 202,773
ILLINOIS 2,206,412 642,292 21,012 689,674 971,379
INDIANA 1,200,240 341,767 NA 348,326 556,198
IOWA 594,029 166,138 14,659 181,315 267,999
KANSAS 573,488 177,834 1,123 172,393 242,720
KENTUCKY 713,543 209,781 NA 206,020 321,198
LOUISIANA 780,237 211,854 664 226,753 356,623
MAINE 159,921 43,234 755 46,334 74,363
MARYLAND 976,649 268,136 NA 289,285 467,724
MASSACHUSETTS 693,966 183,366 9,881 206,115 313,615
MICHIGAN 2,679,719 728,166 52,532 819,582 1,358,922
MINNESOTA 678,056 213,736 NA 216,304 272,086
MISSISSIPPI 795,854 199,374 28,961 230,093 379,057
MISSOURI 1,966,830 656,305 13,639 664,026 787,318
MONTANA 169,497 51,646 1,512 51,634 72,294
NEBRASKA 420,273 116,921 NA 113,343 211,480
NEVADA 429,113 146,839 8,949 153,923 132,158
NEW HAMPSHIRE 245,963 70,644 1,627 70,966 113,636
NEW JERSEY 824,603 218,163 13,037 237,439 378,467
NEW MEXICO 209,171 49,979 6,229 59,579 98,271
NEW YORK 2,572,878 673,022 99,936 749,381 1,168,314
NORTH CAROLINA 1,406,878 391,726 26,939 429,098 619,874
NORTH DAKOTA 141,320 41,873 1,634 42,477 67,894
OHIO 2,134,151 611,303 16,338 649,956 954,044
OKLAHOMA 1,093,051 326,252 488 337,257 531,517
OREGON 435,647 133,732 132 139,320 172,636
PENNSYLVANIA 1,069,413 299,532 10,294 311,685 464,880
PUERTO RICO 536,866 165,256 2,087 188,272 190,635
RHODE ISLAND 168,625 39,494 8,146 49,951 77,024
SOUTH CAROLINA 593,418 171,394 3,900 173,574 258,105
SOUTH DAKOTA 178,747 45,318 11,979 54,107 76,724
TENNESSEE 1,114,462 286,324 44,683 319,515 514,530
TEXAS 5,894,841 1,456,453 256,834 1,671,581 2,877,794
UTAH 511,375 142,359 2,422 147,331 244,502
VERMONT 81,129 23,921 2 23,992 37,180
VIRGIN ISLANDS 19,936 4,045 2,851 7,275 6,292
VIRGINIA 1,215,714 345,864 17,395 359,172 552,547
WASHINGTON 778,706 193,115 22,574 235,996 361,761
WEST VIRGINIA 311,241 100,782 1,995 98,401 119,008
WISCONSIN 1,126,348 320,420 11,682 355,177 540,158
WYOMING 174,904 59,135 NA 55,684 69,592
TOTALS 46,002,206 12,813,898 819,035 13,918,906 21,229,158
Source: Federal Systems, Federal Case Registry (FCR)
1 The Total Unique Persons in the FCR is derived by unduplicating SSNs across all participant types. The figures for the individual participant types are unduplicated within that category but not between them --i.e., an individual may appear in more than one category, but is only counted once within that category and only once in the total. As a result, the counts for the individual participant types may not add up to the Total Unique Persons in the FCR. In addition, an individual can be a child support case participant in more than one state; in these situations they are counted in the total for each individual state in which they are a participant but are only counted once in nationwide total. As a result, the individual state totals add up to more than the nationwide total.
2 Some states code their Putative Fathers as NCPs when submitting them to the FCR. For those states Putative Fathers are included in the NCP figure instead of the PF figure, which is NA.
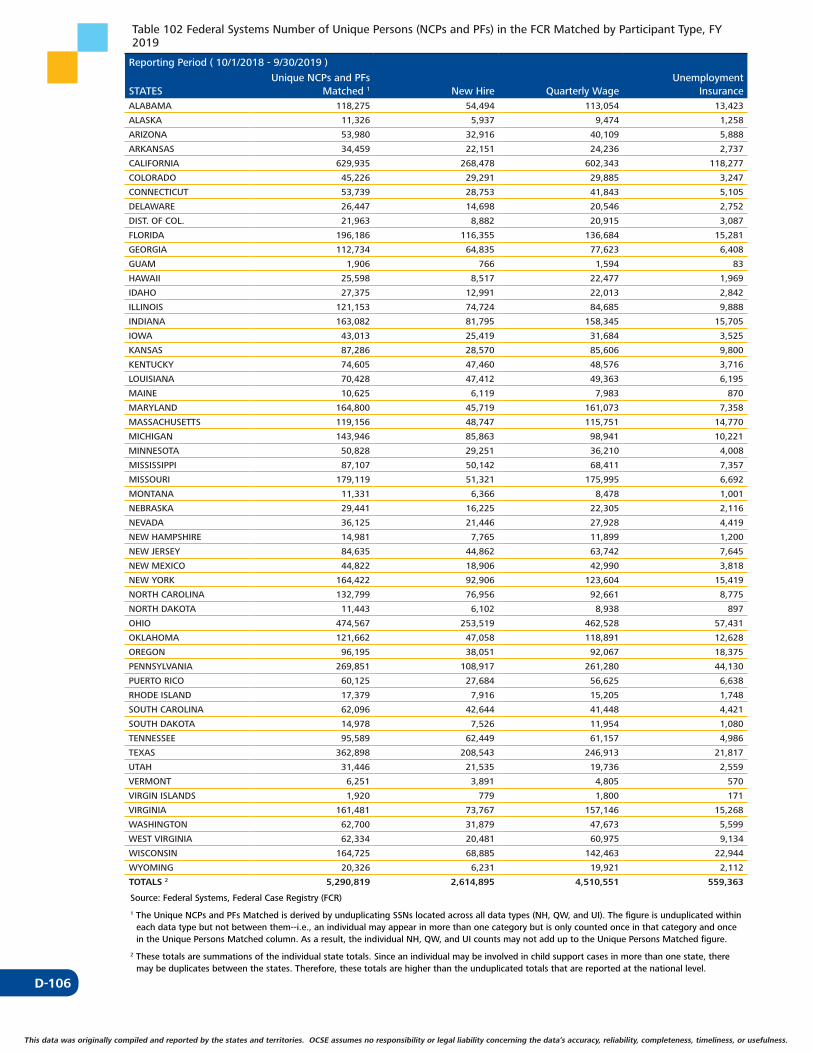
D-106
This data was originally compiled and reported by the states and territories. OCSE assumes no responsibility or legal liability concerning the data’s accuracy, reliability, completeness, timeliness, or usefulness.
Table 102 Federal Systems Number of Unique Persons (NCPs and PFs) in the FCR Matched by Participant Type, FY 2019
Reporting Period ( 10/1/2018 - 9/30/2019 )
STATESALABAMA 118,275 54,494 113,054 13,423
Unique NCPs and PFs Matched 1 New Hire Quarterly Wage
Unemployment Insurance
ALASKA 11,326 5,937 9,474 1,258
ARIZONA 53,980 32,916 40,109 5,888
ARKANSAS 34,459 22,151 24,236 2,737
CALIFORNIA 629,935 268,478 602,343 118,277
COLORADO 45,226 29,291 29,885 3,247
CONNECTICUT 53,739 28,753 41,843 5,105
DELAWARE 26,447 14,698 20,546 2,752
DIST. OF COL. 21,963 8,882 20,915 3,087
FLORIDA 196,186 116,355 136,684 15,281
GEORGIA 112,734 64,835 77,623 6,408
GUAM 1,906 766 1,594 83
HAWAII 25,598 8,517 22,477 1,969
IDAHO 27,375 12,991 22,013 2,842
ILLINOIS 121,153 74,724 84,685 9,888
INDIANA 163,082 81,795 158,345 15,705
IOWA 43,013 25,419 31,684 3,525
KANSAS 87,286 28,570 85,606 9,800
KENTUCKY 74,605 47,460 48,576 3,716
LOUISIANA 70,428 47,412 49,363 6,195
MAINE 10,625 6,119 7,983 870
MARYLAND 164,800 45,719 161,073 7,358
MASSACHUSETTS 119,156 48,747 115,751 14,770
MICHIGAN 143,946 85,863 98,941 10,221
MINNESOTA 50,828 29,251 36,210 4,008
MISSISSIPPI 87,107 50,142 68,411 7,357
MISSOURI 179,119 51,321 175,995 6,692
MONTANA 11,331 6,366 8,478 1,001
NEBRASKA 29,441 16,225 22,305 2,116
NEVADA 36,125 21,446 27,928 4,419
NEW HAMPSHIRE 14,981 7,765 11,899 1,200
NEW JERSEY 84,635 44,862 63,742 7,645
NEW MEXICO 44,822 18,906 42,990 3,818
NEW YORK 164,422 92,906 123,604 15,419
NORTH CAROLINA 132,799 76,956 92,661 8,775
NORTH DAKOTA 11,443 6,102 8,938 897
OHIO 474,567 253,519 462,528 57,431
OKLAHOMA 121,662 47,058 118,891 12,628
OREGON 96,195 38,051 92,067 18,375
PENNSYLVANIA 269,851 108,917 261,280 44,130
PUERTO RICO 60,125 27,684 56,625 6,638
RHODE ISLAND 17,379 7,916 15,205 1,748
SOUTH CAROLINA 62,096 42,644 41,448 4,421
SOUTH DAKOTA 14,978 7,526 11,954 1,080
TENNESSEE 95,589 62,449 61,157 4,986
TEXAS 362,898 208,543 246,913 21,817
UTAH 31,446 21,535 19,736 2,559
VERMONT 6,251 3,891 4,805 570
VIRGIN ISLANDS 1,920 779 1,800 171
VIRGINIA 161,481 73,767 157,146 15,268
WASHINGTON 62,700 31,879 47,673 5,599
WEST VIRGINIA 62,334 20,481 60,975 9,134
WISCONSIN 164,725 68,885 142,463 22,944
WYOMING 20,326 6,231 19,921 2,112
TOTALS 2 5,290,819 2,614,895 4,510,551 559,363
Source: Federal Systems, Federal Case Registry (FCR)
1 The Unique NCPs and PFs Matched is derived by unduplicating SSNs located across all data types (NH, QW, and UI). The figure is unduplicated within each data type but not between them--i.e., an individual may appear in more than one category but is only counted once in that category and once in the Unique Persons Matched column. As a result, the individual NH, QW, and UI counts may not add up to the Unique Persons Matched figure.
2 These totals are summations of the individual state totals. Since an individual may be involved in child support cases in more than one state, there may be duplicates between the states. Therefore, these totals are higher than the unduplicated totals that are reported at the national level.
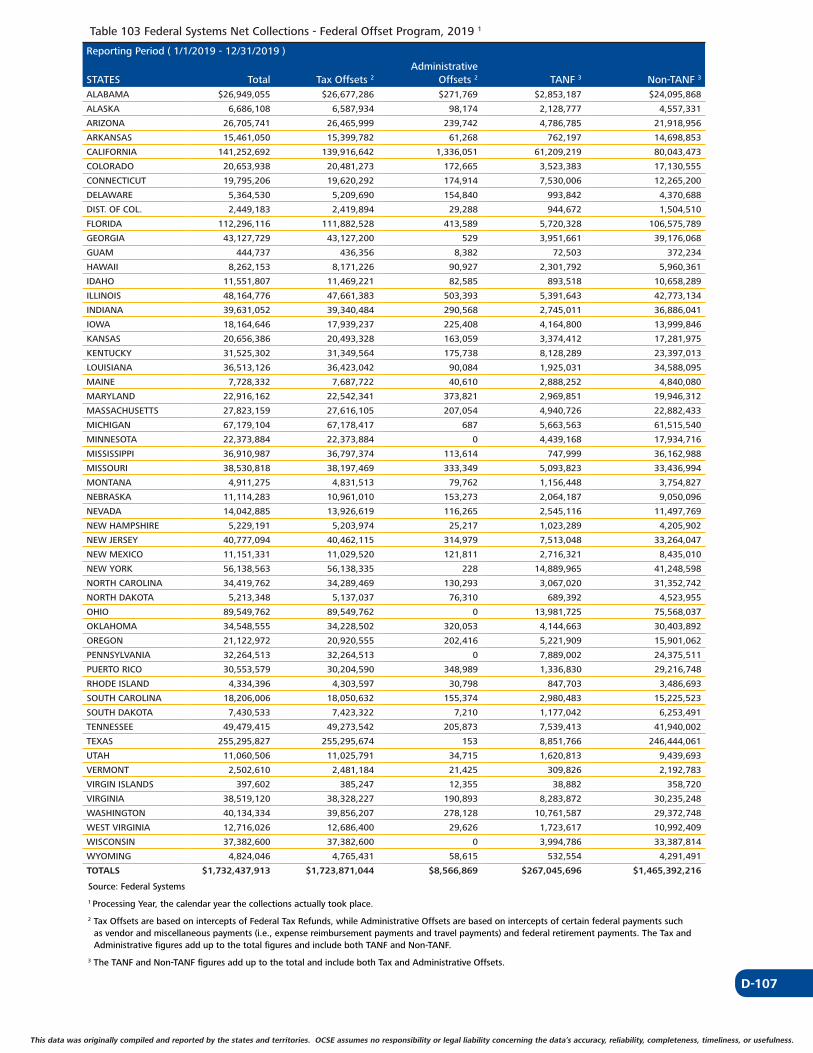
D-107
This data was originally compiled and reported by the states and territories. OCSE assumes no responsibility or legal liability concerning the data’s accuracy, reliability, completeness, timeliness, or usefulness. This data was originally compiled and reported by the states and territories. OCSE assumes no responsibility or legal liability concerning the data’s accuracy, reliability, completeness, timeliness, or usefulness.
Table 103 Federal Systems Net Collections - Federal Offset Program, 2019 1
Reporting Period ( 1/1/2019 - 12/31/2019 )
STATES Total Tax Offsets 2
Administrative Offsets 2 TANF 3 Non-TANF 3
ALABAMA $26,949,055 $26,677,286 $271,769 $2,853,187 $24,095,868
ALASKA 6,686,108 6,587,934 98,174 2,128,777 4,557,331
ARIZONA 26,705,741 26,465,999 239,742 4,786,785 21,918,956
ARKANSAS 15,461,050 15,399,782 61,268 762,197 14,698,853
CALIFORNIA 141,252,692 139,916,642 1,336,051 61,209,219 80,043,473
COLORADO 20,653,938 20,481,273 172,665 3,523,383 17,130,555
CONNECTICUT 19,795,206 19,620,292 174,914 7,530,006 12,265,200
DELAWARE 5,364,530 5,209,690 154,840 993,842 4,370,688
DIST. OF COL. 2,449,183 2,419,894 29,288 944,672 1,504,510
FLORIDA 112,296,116 111,882,528 413,589 5,720,328 106,575,789
GEORGIA 43,127,729 43,127,200 529 3,951,661 39,176,068
GUAM 444,737 436,356 8,382 72,503 372,234
HAWAII 8,262,153 8,171,226 90,927 2,301,792 5,960,361
IDAHO 11,551,807 11,469,221 82,585 893,518 10,658,289
ILLINOIS 48,164,776 47,661,383 503,393 5,391,643 42,773,134
INDIANA 39,631,052 39,340,484 290,568 2,745,011 36,886,041
IOWA 18,164,646 17,939,237 225,408 4,164,800 13,999,846
KANSAS 20,656,386 20,493,328 163,059 3,374,412 17,281,975
KENTUCKY 31,525,302 31,349,564 175,738 8,128,289 23,397,013
LOUISIANA 36,513,126 36,423,042 90,084 1,925,031 34,588,095
MAINE 7,728,332 7,687,722 40,610 2,888,252 4,840,080
MARYLAND 22,916,162 22,542,341 373,821 2,969,851 19,946,312
MASSACHUSETTS 27,823,159 27,616,105 207,054 4,940,726 22,882,433
MICHIGAN 67,179,104 67,178,417 687 5,663,563 61,515,540
MINNESOTA 22,373,884 22,373,884 0 4,439,168 17,934,716
MISSISSIPPI 36,910,987 36,797,374 113,614 747,999 36,162,988
MISSOURI 38,530,818 38,197,469 333,349 5,093,823 33,436,994
MONTANA 4,911,275 4,831,513 79,762 1,156,448 3,754,827
NEBRASKA 11,114,283 10,961,010 153,273 2,064,187 9,050,096
NEVADA 14,042,885 13,926,619 116,265 2,545,116 11,497,769
NEW HAMPSHIRE 5,229,191 5,203,974 25,217 1,023,289 4,205,902
NEW JERSEY 40,777,094 40,462,115 314,979 7,513,048 33,264,047
NEW MEXICO 11,151,331 11,029,520 121,811 2,716,321 8,435,010
NEW YORK 56,138,563 56,138,335 228 14,889,965 41,248,598
NORTH CAROLINA 34,419,762 34,289,469 130,293 3,067,020 31,352,742
NORTH DAKOTA 5,213,348 5,137,037 76,310 689,392 4,523,955
OHIO 89,549,762 89,549,762 0 13,981,725 75,568,037
OKLAHOMA 34,548,555 34,228,502 320,053 4,144,663 30,403,892
OREGON 21,122,972 20,920,555 202,416 5,221,909 15,901,062
PENNSYLVANIA 32,264,513 32,264,513 0 7,889,002 24,375,511
PUERTO RICO 30,553,579 30,204,590 348,989 1,336,830 29,216,748
RHODE ISLAND 4,334,396 4,303,597 30,798 847,703 3,486,693
SOUTH CAROLINA 18,206,006 18,050,632 155,374 2,980,483 15,225,523
SOUTH DAKOTA 7,430,533 7,423,322 7,210 1,177,042 6,253,491
TENNESSEE 49,479,415 49,273,542 205,873 7,539,413 41,940,002
TEXAS 255,295,827 255,295,674 153 8,851,766 246,444,061
UTAH 11,060,506 11,025,791 34,715 1,620,813 9,439,693
VERMONT 2,502,610 2,481,184 21,425 309,826 2,192,783
VIRGIN ISLANDS 397,602 385,247 12,355 38,882 358,720
VIRGINIA 38,519,120 38,328,227 190,893 8,283,872 30,235,248
WASHINGTON 40,134,334 39,856,207 278,128 10,761,587 29,372,748
WEST VIRGINIA 12,716,026 12,686,400 29,626 1,723,617 10,992,409
WISCONSIN 37,382,600 37,382,600 0 3,994,786 33,387,814
WYOMING 4,824,046 4,765,431 58,615 532,554 4,291,491
TOTALS $1,732,437,913 $1,723,871,044 $8,566,869 $267,045,696 $1,465,392,216
Source: Federal Systems
1 Processing Year, the calendar year the collections actually took place.
2 Tax Offsets are based on intercepts of Federal Tax Refunds, while Administrative Offsets are based on intercepts of certain federal payments such as vendor and miscellaneous payments (i.e., expense reimbursement payments and travel payments) and federal retirement payments. The Tax and Administrative figures add up to the total figures and include both TANF and Non-TANF.
3 The TANF and Non-TANF figures add up to the total and include both Tax and Administrative Offsets.
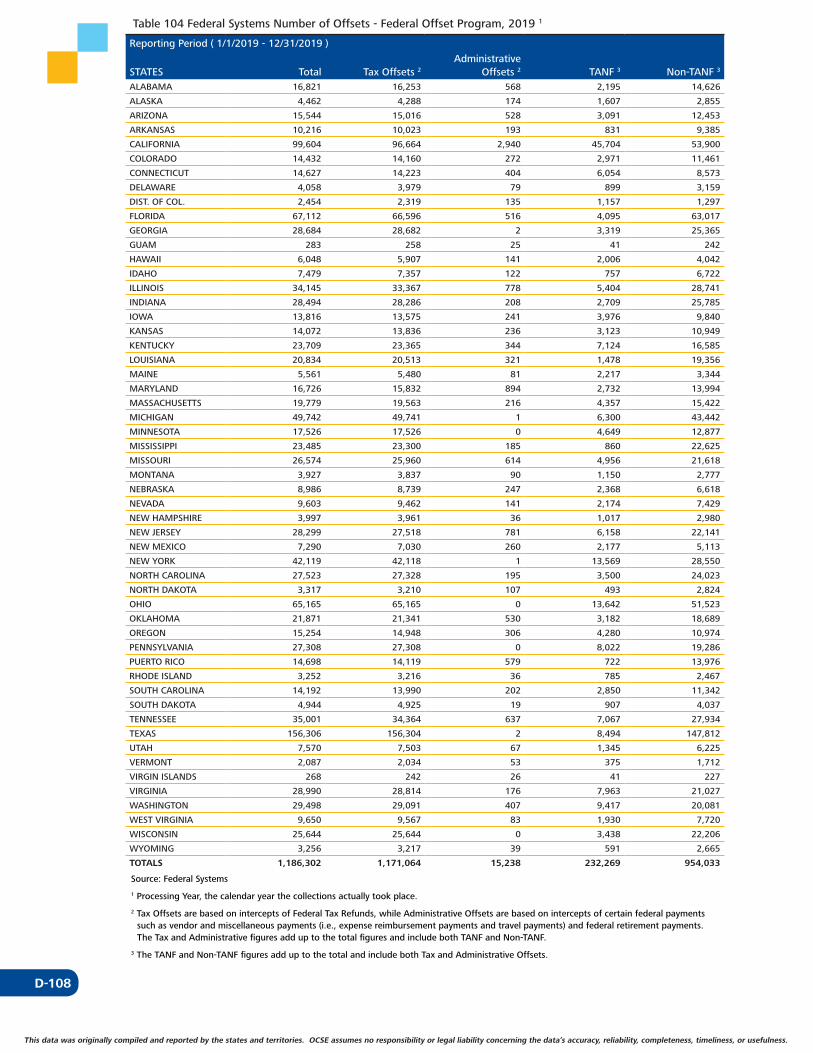
D-108
This data was originally compiled and reported by the states and territories. OCSE assumes no responsibility or legal liability concerning the data’s accuracy, reliability, completeness, timeliness, or usefulness.
Table 104 Federal Systems Number of Offsets - Federal Offset Program, 2019 1
Reporting Period ( 1/1/2019 - 12/31/2019 )
STATES Total Tax Offsets 2
Administrative Offsets 2 TANF 3 Non-TANF 3
ALABAMA 16,821 16,253 568 2,195 14,626
ALASKA 4,462 4,288 174 1,607 2,855
ARIZONA 15,544 15,016 528 3,091 12,453
ARKANSAS 10,216 10,023 193 831 9,385
CALIFORNIA 99,604 96,664 2,940 45,704 53,900
COLORADO 14,432 14,160 272 2,971 11,461
CONNECTICUT 14,627 14,223 404 6,054 8,573
DELAWARE 4,058 3,979 79 899 3,159
DIST. OF COL. 2,454 2,319 135 1,157 1,297
FLORIDA 67,112 66,596 516 4,095 63,017
GEORGIA 28,684 28,682 2 3,319 25,365
GUAM 283 258 25 41 242
HAWAII 6,048 5,907 141 2,006 4,042
IDAHO 7,479 7,357 122 757 6,722
ILLINOIS 34,145 33,367 778 5,404 28,741
INDIANA 28,494 28,286 208 2,709 25,785
IOWA 13,816 13,575 241 3,976 9,840
KANSAS 14,072 13,836 236 3,123 10,949
KENTUCKY 23,709 23,365 344 7,124 16,585
LOUISIANA 20,834 20,513 321 1,478 19,356
MAINE 5,561 5,480 81 2,217 3,344
MARYLAND 16,726 15,832 894 2,732 13,994
MASSACHUSETTS 19,779 19,563 216 4,357 15,422
MICHIGAN 49,742 49,741 1 6,300 43,442
MINNESOTA 17,526 17,526 0 4,649 12,877
MISSISSIPPI 23,485 23,300 185 860 22,625
MISSOURI 26,574 25,960 614 4,956 21,618
MONTANA 3,927 3,837 90 1,150 2,777
NEBRASKA 8,986 8,739 247 2,368 6,618
NEVADA 9,603 9,462 141 2,174 7,429
NEW HAMPSHIRE 3,997 3,961 36 1,017 2,980
NEW JERSEY 28,299 27,518 781 6,158 22,141
NEW MEXICO 7,290 7,030 260 2,177 5,113
NEW YORK 42,119 42,118 1 13,569 28,550
NORTH CAROLINA 27,523 27,328 195 3,500 24,023
NORTH DAKOTA 3,317 3,210 107 493 2,824
OHIO 65,165 65,165 0 13,642 51,523
OKLAHOMA 21,871 21,341 530 3,182 18,689
OREGON 15,254 14,948 306 4,280 10,974
PENNSYLVANIA 27,308 27,308 0 8,022 19,286
PUERTO RICO 14,698 14,119 579 722 13,976
RHODE ISLAND 3,252 3,216 36 785 2,467
SOUTH CAROLINA 14,192 13,990 202 2,850 11,342
SOUTH DAKOTA 4,944 4,925 19 907 4,037
TENNESSEE 35,001 34,364 637 7,067 27,934
TEXAS 156,306 156,304 2 8,494 147,812
UTAH 7,570 7,503 67 1,345 6,225
VERMONT 2,087 2,034 53 375 1,712
VIRGIN ISLANDS 268 242 26 41 227
VIRGINIA 28,990 28,814 176 7,963 21,027
WASHINGTON 29,498 29,091 407 9,417 20,081
WEST VIRGINIA 9,650 9,567 83 1,930 7,720
WISCONSIN 25,644 25,644 0 3,438 22,206
WYOMING 3,256 3,217 39 591 2,665
TOTALS 1,186,302 1,171,064 15,238 232,269 954,033
Source: Federal Systems
1 Processing Year, the calendar year the collections actually took place.
2 Tax Offsets are based on intercepts of Federal Tax Refunds, while Administrative Offsets are based on intercepts of certain federal payments such as vendor and miscellaneous payments (i.e., expense reimbursement payments and travel payments) and federal retirement payments. The Tax and Administrative figures add up to the total figures and include both TANF and Non-TANF.
3 The TANF and Non-TANF figures add up to the total and include both Tax and Administrative Offsets.
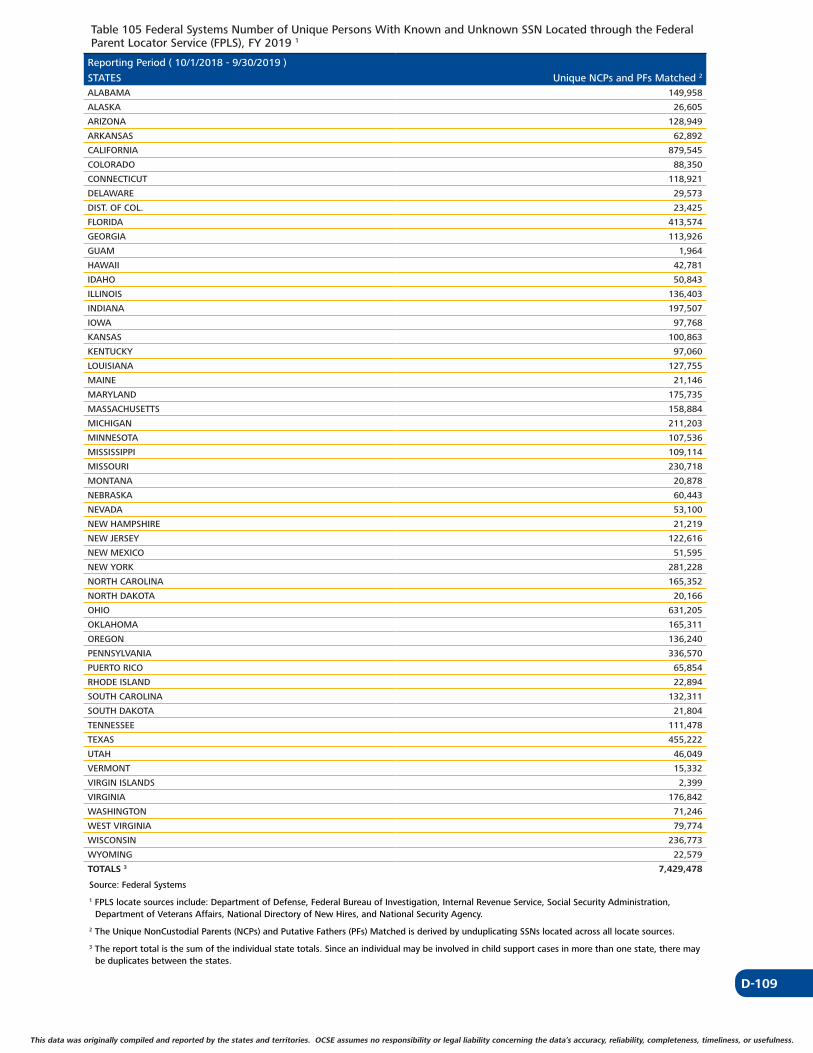
D-109
This data was originally compiled and reported by the states and territories. OCSE assumes no responsibility or legal liability concerning the data’s accuracy, reliability, completeness, timeliness, or usefulness. This data was originally compiled and reported by the states and territories. OCSE assumes no responsibility or legal liability concerning the data’s accuracy, reliability, completeness, timeliness, or usefulness.
Table 105 Federal Systems Number of Unique Persons With Known and Unknown SSN Located through the Federal Parent Locator Service (FPLS), FY 2019 1
Reporting Period ( 10/1/2018 - 9/30/2019 )
STATESALABAMA
Unique NCPs and PFs Matched 149,958
2
ALASKA 26,605
ARIZONA 128,949
ARKANSAS 62,892
CALIFORNIA 879,545
COLORADO 88,350
CONNECTICUT 118,921
DELAWARE 29,573
DIST. OF COL. 23,425
FLORIDA 413,574
GEORGIA 113,926
GUAM 1,964
HAWAII 42,781
IDAHO 50,843
ILLINOIS 136,403
INDIANA 197,507
IOWA 97,768
KANSAS 100,863
KENTUCKY 97,060
LOUISIANA 127,755
MAINE 21,146
MARYLAND 175,735
MASSACHUSETTS 158,884
MICHIGAN 211,203
MINNESOTA 107,536
MISSISSIPPI 109,114
MISSOURI 230,718
MONTANA 20,878
NEBRASKA 60,443
NEVADA 53,100
NEW HAMPSHIRE 21,219
NEW JERSEY 122,616
NEW MEXICO 51,595
NEW YORK 281,228
NORTH CAROLINA 165,352
NORTH DAKOTA 20,166
OHIO 631,205
OKLAHOMA 165,311
OREGON 136,240
PENNSYLVANIA 336,570
PUERTO RICO 65,854
RHODE ISLAND 22,894
SOUTH CAROLINA 132,311
SOUTH DAKOTA 21,804
TENNESSEE 111,478
TEXAS 455,222
UTAH 46,049
VERMONT 15,332
VIRGIN ISLANDS 2,399
VIRGINIA 176,842
WASHINGTON 71,246
WEST VIRGINIA 79,774
WISCONSIN 236,773
WYOMING 22,579
TOTALS 3 7,429,478
Source: Federal Systems
1 FPLS locate sources include: Department of Defense, Federal Bureau of Investigation, Internal Revenue Service, Social Security Administration, Department of Veterans Affairs, National Directory of New Hires, and National Security Agency.
2 The Unique NonCustodial Parents (NCPs) and Putative Fathers (PFs) Matched is derived by unduplicating SSNs located across all locate sources.
3 The report total is the sum of the individual state totals. Since an individual may be involved in child support cases in more than one state, there may be duplicates between the states.
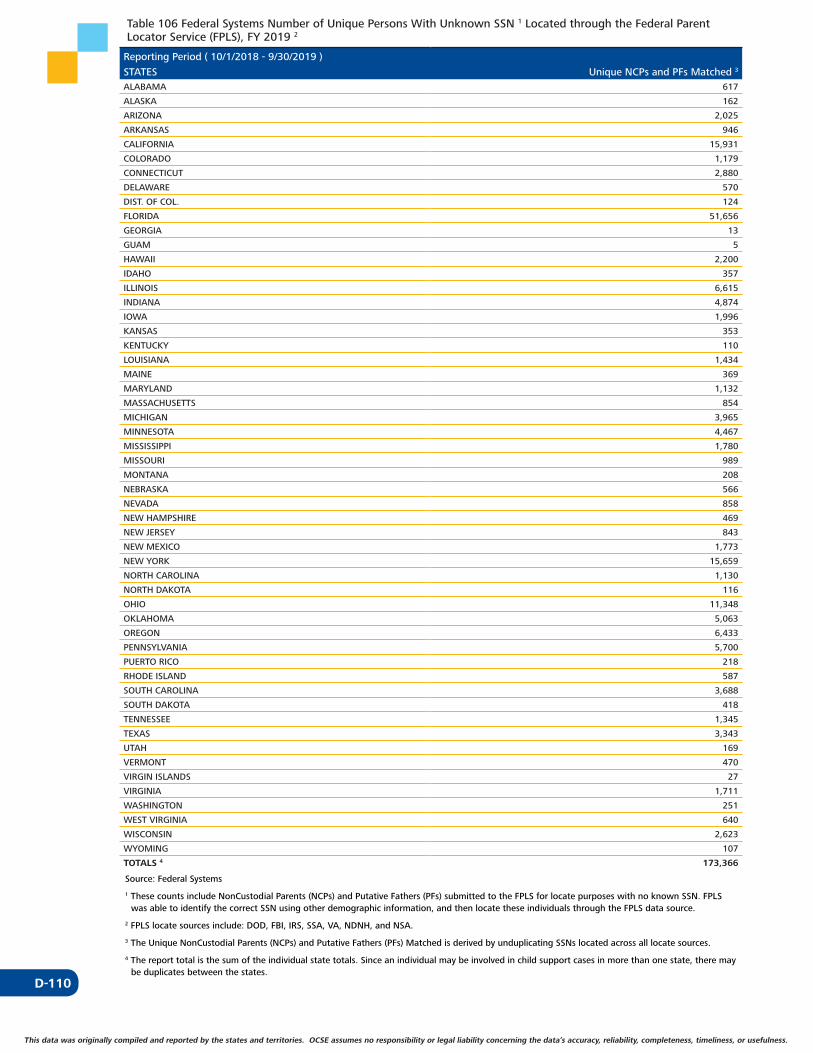
D-110
This data was originally compiled and reported by the states and territories. OCSE assumes no responsibility or legal liability concerning the data’s accuracy, reliability, completeness, timeliness, or usefulness.
Table 106 Federal Systems Number of Unique Persons With Unknown SSN 1 Located through the Federal Parent Locator Service (FPLS), FY 2019 2
Reporting Period ( 10/1/2018 - 9/30/2019 )
STATESALABAMA
Unique NCPs and PFs Matched 617
3
ALASKA 162
ARIZONA 2,025
ARKANSAS 946
CALIFORNIA 15,931
COLORADO 1,179
CONNECTICUT 2,880
DELAWARE 570
DIST. OF COL. 124
FLORIDA 51,656
GEORGIA 13
GUAM 5
HAWAII 2,200
IDAHO 357
ILLINOIS 6,615
INDIANA 4,874
IOWA 1,996
KANSAS 353
KENTUCKY 110
LOUISIANA 1,434
MAINE 369
MARYLAND 1,132
MASSACHUSETTS 854
MICHIGAN 3,965
MINNESOTA 4,467
MISSISSIPPI 1,780
MISSOURI 989
MONTANA 208
NEBRASKA 566
NEVADA 858
NEW HAMPSHIRE 469
NEW JERSEY 843
NEW MEXICO 1,773
NEW YORK 15,659
NORTH CAROLINA 1,130
NORTH DAKOTA 116
OHIO 11,348
OKLAHOMA 5,063
OREGON 6,433
PENNSYLVANIA 5,700
PUERTO RICO 218
RHODE ISLAND 587
SOUTH CAROLINA 3,688
SOUTH DAKOTA 418
TENNESSEE 1,345
TEXAS 3,343
UTAH 169
VERMONT 470
VIRGIN ISLANDS 27
VIRGINIA 1,711
WASHINGTON 251
WEST VIRGINIA 640
WISCONSIN 2,623
WYOMING 107
TOTALS 4 173,366
Source: Federal Systems
1 These counts include NonCustodial Parents (NCPs) and Putative Fathers (PFs) submitted to the FPLS for locate purposes with no known SSN. FPLS was able to identify the correct SSN using other demographic information, and then locate these individuals through the FPLS data source.
2 FPLS locate sources include: DOD, FBI, IRS, SSA, VA, NDNH, and NSA.
3 The Unique NonCustodial Parents (NCPs) and Putative Fathers (PFs) Matched is derived by unduplicating SSNs located across all locate sources.
4 The report total is the sum of the individual state totals. Since an individual may be involved in child support cases in more than one state, there may be duplicates between the states.

E-1
GLOSSARY
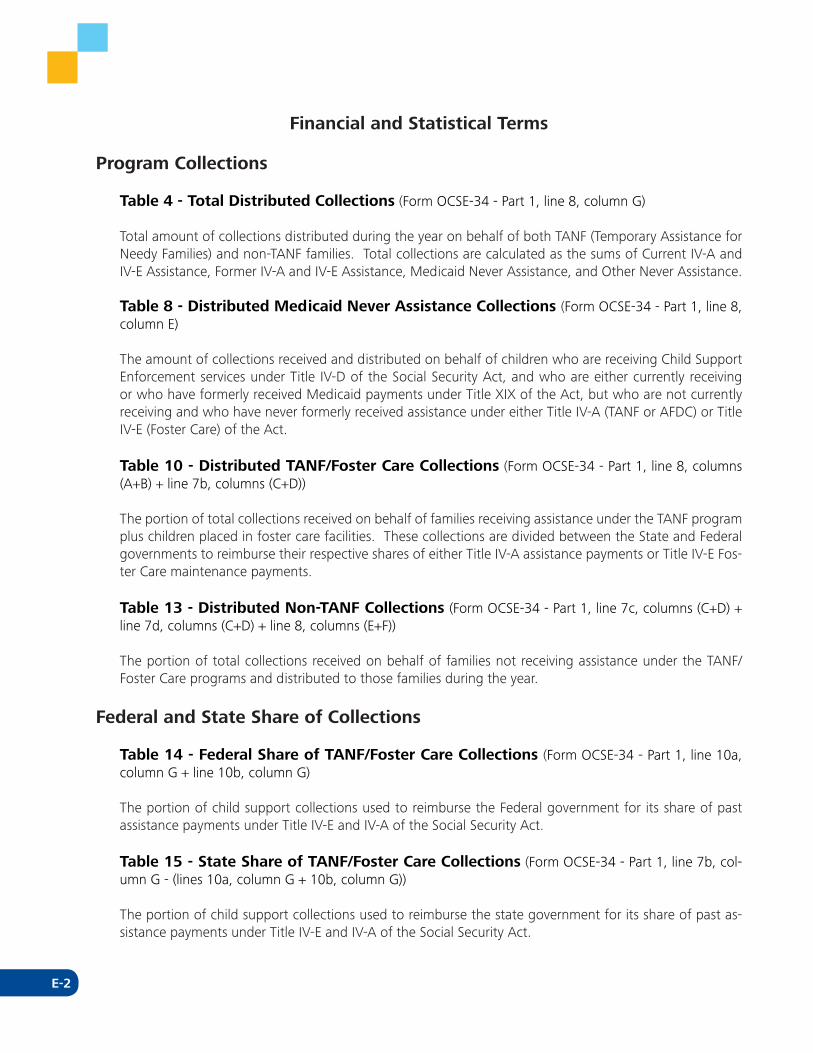
E-2
Financial and Statistical Terms
Program Collections
Table 4 - Total Distributed Collections (Form OCSE-34 - Part 1, line 8, column G)
Total amount of collections distributed during the year on behalf of both TANF (Temporary Assistance for Needy Families) and non-TANF families. Total collections are calculated as the sums of Current IV-A and IV-E Assistance, Former IV-A and IV-E Assistance, Medicaid Never Assistance, and Other Never Assistance.
Table 8 - Distributed Medicaid Never Assistance Collections (Form OCSE-34 - Part 1, line 8, column E)
The amount of collections received and distributed on behalf of children who are receiving Child Support Enforcement services under Title IV-D of the Social Security Act, and who are either currently receiving or who have formerly received Medicaid payments under Title XIX of the Act, but who are not currently receiving and who have never formerly received assistance under either Title IV-A (TANF or AFDC) or Title IV-E (Foster Care) of the Act.
Table 10 - Distributed TANF/Foster Care Collections (Form OCSE-34 - Part 1, line 8, columns (A+B) + line 7b, columns (C+D))
The portion of total collections received on behalf of families receiving assistance under the TANF program plus children placed in foster care facilities. These collections are divided between the State and Federal governments to reimburse their respective shares of either Title IV-A assistance payments or Title IV-E Fos-ter Care maintenance payments.
Table 13 - Distributed Non-TANF Collections (Form OCSE-34 - Part 1, line 7c, columns (C+D) + line 7d, columns (C+D) + line 8, columns (E+F))
The portion of total collections received on behalf of families not receiving assistance under the TANF/Foster Care programs and distributed to those families during the year.
Federal and State Share of Collections
Table 14 - Federal Share of TANF/Foster Care Collections (Form OCSE-34 - Part 1, line 10a, column G + line 10b, column G)
The portion of child support collections used to reimburse the Federal government for its share of past assistance payments under Title IV-E and IV-A of the Social Security Act.
Table 15 - State Share of TANF/Foster Care Collections (Form OCSE-34 - Part 1, line 7b, col-umn G - (lines 10a, column G + 10b, column G))
The portion of child support collections used to reimburse the state government for its share of past as-sistance payments under Title IV-E and IV-A of the Social Security Act.
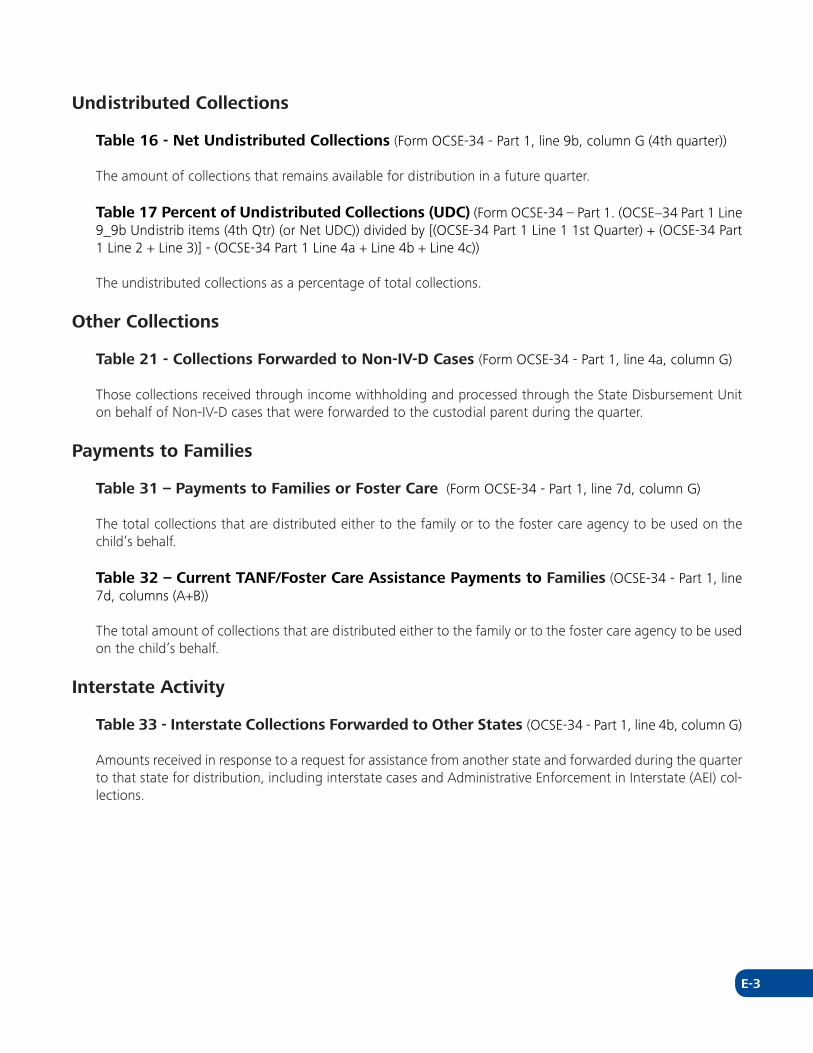
E-3
Undistributed Collections
Table 16 - Net Undistributed Collections (Form OCSE-34 - Part 1, line 9b, column G (4th quarter))
The amount of collections that remains available for distribution in a future quarter.
Table 17 Percent of Undistributed Collections (UDC) (Form OCSE-34 – Part 1. (OCSE−34 Part 1 Line 9_9b Undistrib items (4th Qtr) (or Net UDC)) divided by [(OCSE-34 Part 1 Line 1 1st Quarter) + (OCSE-34 Part 1 Line 2 + Line 3)] - (OCSE-34 Part 1 Line 4a + Line 4b + Line 4c))
The undistributed collections as a percentage of total collections.
Other Collections
Table 21 - Collections Forwarded to Non-IV-D Cases (Form OCSE-34 - Part 1, line 4a, column G)
Those collections received through income withholding and processed through the State Disbursement Unit on behalf of Non-IV-D cases that were forwarded to the custodial parent during the quarter.
Payments to Families
Table 31 – Payments to Families or Foster Care (Form OCSE-34 - Part 1, line 7d, column G)
The total collections that are distributed either to the family or to the foster care agency to be used on the child’s behalf.
Table 32 – Current TANF/Foster Care Assistance Payments to Families (OCSE-34 - Part 1, line 7d, columns (A+B))
The total amount of collections that are distributed either to the family or to the foster care agency to be used on the child’s behalf.
Interstate Activity
Table 33 - Interstate Collections Forwarded to Other States (OCSE-34 - Part 1, line 4b, column G)
Amounts received in response to a request for assistance from another state and forwarded during the quarter to that state for distribution, including interstate cases and Administrative Enforcement in Interstate (AEI) col-lections.
E-4
Cost-Effectiveness
Table 36 – Cost Effectiveness Ratio (OCSE-34 - Part 1, lines 4b, 4c, 8, 11, column G / OCSE-396, line 7, columns (A+C) - line 1c, columns (A+C))
The total of collections forwarded to other states, plus total collections distributed, plus fees retained by other states, divided by total current quarter claims and total prior quarter adjustments minus Non-IV-D cost.
Incentives
Tables 37 and 38 - Incentive Payment Estimates and Actuals (Financial Management)
The amount of money states earn for running an efficient child support program. This amount is estimated prior to the start of the fiscal year and is reported by the state on a quarterly basis. Actual incentive amounts are computed after the end of the fiscal year and appropriate adjustments are made in state grant awards.
Medical Support
Table 40 - Distributed as Medical Support Payments for Five Consecutive Fiscal Years (Form OCSE-34 - Part 1, line 7c, column G)
The portion of any collection that corresponds to any amount specifically designated in a support order for medical support. To the extent that medical support has been assigned to the state, medical support collec-tions must be forwarded to the Medicaid agency for distribution in accordance with current regulations un-der Title XIX of the Social Security Act (Medicaid). Otherwise, the amount must be forwarded to the family.
Table 41 Health Insurance Provided and Ordered for Two Consecutive Fiscal Years (Form OCSE-157, line 22, column A for "Cases in which Health Insurance is Ordered" for previous FY and current FY, respectively; and OCSE-157, line 23, column A for "Cases in which Health Insurance is Provided and Or-dered" for previous FY and current FY, respectively; Percent of Health Insurance Provided and Ordered previ-ous FY = OCSE-157, Line 23, column A (previous FY) divided by OCSE-157, line 22, column A, and Percent of Health Insurance Provided and Ordered current FY = OCSE-157, Line 23, column A (current FY) divided by OCSE-157, line 22, column A)
The number of cases open at the end of the fiscal year in which health insurance is ordered and the number of cases open at the end of the fiscal year in which health insurance is provided and ordered.
Program Expenditures
Table 43 – Total Administrative Expenditures (Form OCSE-396 line 7, columns (A+C))
Total amount of expenditures eligible for Federal funding that is claimed by the state during the year for the administration of the Child Support Enforcement program. Including all amounts claimed during the year, whether expended during the current or a previous fiscal year. The amounts being reported have been reduced by the amount of program income (fees and costs recovered in excess of fees and interest earned and other program income) received by the states.
Table 44 - Federal Share of Administrative Expenditures (Form OCSE-396 line 7, columns (B+D))
Net Federal Share of current quarter claims plus prior quarter adjustments.
E-5
Table 45 - State Share of Administrative Expenditures (Form OCSE-396 line 7, columns (A+C) - line 7, columns (B+D))
Total State share of current quarter expenditures plus prior quarter adjustments minus federal FPLS fees.
Table 47 - Non-IV-D Costs (Form OCSE-396 line 1c, columns (A+C))
The amount of administrative expenditures attributable to the collecting, entering, maintaining, and process-ing information relative to non-IV-D child support cases in the state case registry and to the processing of non-IV-D child support collections through the State Disbursement Unit. Non-IV-D cases are those for which there is no assignment of support rights to the state or where the State has not received an application for Title IV-D services.
Functional Costs
Table 48 - ADP Expenditures (Form OCSE-396 lines 4, 5, and 6, columns (A+C))
Expenditures made in accordance with the terms of an approved ADP for the planning, design, development, implementation, enhancement, or operation of an automated Statewide Child Support Enforcement System (CSES).
Cases and Caseloads
Table 52 - Total Caseload (Form OCSE-157, lines 1 and 3, column A)
The number of IV-D cases open on the last day of the fiscal year, including the number of open cases at the end of the fiscal year as a result of requests for assistance received from other states.
Table 54 - Cases for Which the State Has No Jurisdiction (Form OCSE-157, line 3)
Open cases on the last day of the fiscal year over which the state has no jurisdiction. This includes cases that involve an individual over whom the IV-D agency has no civil jurisdiction available to pursue or effectuate any child support actions.
Orders Established
Table 64 - Total Cases with Support Orders Established (Form OCSE-157, line 2)
The number of IV-D cases open on the last day of the fiscal year that have support orders established. Includes cases with orders entered prior to the case becoming an IV-D case, as well as cases with orders established by the IV-D agency. Judgments for arrears, regardless of whether there is a payment schedule or an order for ongoing support, are also included.
Paternities
Table 71 - Total Number of Paternities Established or Acknowledged (Form OCSE-157, lines 10 and 16, column A)
The number of children born out-of-wedlock in the reporting state for which paternity has been acknowl-edged during the fiscal year. Include children with paternity acknowledged through the state’s voluntary in
E-6
hospital acknowledgment program and other acknowledgment processes. Also reported is the number of children in cases in the IV-D caseload for whom paternity was established or acknowledged during the fiscal year.
Table 72 - Paternity Establishment for Two Consecutive Fiscal Years (Form OCSE-157, lines 5a, 6, 8a, and 9)
The number of children in the IV-D caseload in cases open at the end of the current fiscal year who were born out-of-wedlock. Also the number of children born out of wedlock in the IV-D caseload in cases open at the end of the fiscal year who have paternity established or acknowledged.
The total number of children who were born out-of-wedlock in the state during the fiscal year. Also in-cluded is the number of minor children who were born out-of-wedlock in the state for whom paternity has been established or acknowledged during the fiscal year.
Services Provided
Table 73 – TANF Cases Closed Where a Child Support Payment was Received (Form OCSE-157, line 14)
Includes all cases terminated from TANF during the fiscal year in which there was any child support collec-tion in the month of termination.
Table 74 - Number of Support Orders Established During the Fiscal Year (Form OCSE-157, line 17)
The number of cases in which support orders were established by the IV-D agency during the fiscal year. Includes support orders established for medical support or health insurance.
Table 75 - Number of Cases in Which a Collection Was Made on an Obligation (Form OCSE-157, line 18)
The number of cases for which one or more collections were made during the fiscal year. Included are cases where no support order is established but a voluntary payment was made.
Table 76 - Cases Sent to Another State (Form OCSE-157, line 19)
The number of interstate cases the reporting state sent to other states during the fiscal year. Includes cases submitted for location, establishment of paternity or support order, enforcement of support, or any other IV-D activity.
Table 77 - Cases Received from Another State (Form OCSE-157, line 20)
The number of interstate cases received from another state during the fiscal year.
Services Required
Table 78 - Cases Requiring Services to Establish a Support Order (Form OCSE-157, line 12)
Total number of IV-D cases open at the end of the fiscal year that need services to establish a support order.
E-7
Table 79 - Children Requiring Paternity Determination Services (Form OCSE-157, line 13)
The number of children in cases that are open at the end of the fiscal year who required paternity establish-ment. This includes all children whose paternity has not been established and children in the process of hav-ing paternity established. If there is more than one putative father for a child, this child is only counted once.
Staff
Table 81 – Full-Time Equivalent Staff by State and Local, Cooperative Agreements, and Privatized IV-D Offices (Form OCSE-157, lines 30, 31, and 32)
The total number of FTE staff employed by the state and local IV-D agencies.
The total number of FTE staff employed by an agency (public or private) working under a cooperative agree-ment with the IV-D agency.
The total number of FTE staff employed by privatized IV-D agencies.
Current Support
Table 83 - Amount of Current Support Due (Form OCSE-157, line 24)
The total amount of current support by current, former and never assistance for the fiscal year for all IV-D cases includes total voluntary collections.
Table 84 - Amount of Support Distributed as Current Support (Form OCSE-157, line 25)
The total amount of support distributed as current support during the fiscal year for all IV-D cases. Voluntary payments are considered current support and should be included even though there is no order to require payment.
Arrears
Table 85 – Total Amount of Arrearages Due for all Fiscal Years (Form OCSE-157, line 26)
The total amount of arrears due and unpaid as of the end of the fiscal year for all fiscal years, including the fiscal year covered by the report. Interest and penalties on arrearages may be included.
Table 86 - Total Amount of Support Distributed as Arrears (Form OCSE-157, line 27)
The total amount of support distributed this fiscal year as arrearages. This amount includes judgments ordered and paid this fiscal year for prior year support.
Tables 87 and 88 - Cases with Arrears Due and Cases Paying Towards Arrears (Form OCSE-157, lines 28 and 29)
The number of cases with arrears due during the fiscal year, including cases closed during the fiscal year with arrearages.
The number of cases in which there was at least one payment toward arrears during the fiscal year and the total number of IV-D cases in which payments of past-due child support were received during the fiscal year.
E-8
Part or all of the payments were distributed to the family to which the past-due child support was owed.
Non-Cooperation and Good Cause
Table 90 - Cases Open with a Determination of Non-Cooperation (Form OCSE-157, line 37)
The number of IV-D TANF cases open at the end of the fiscal year in which a determination was made that the custodial parent refused to cooperate with state agencies in identifying and locating the noncustodial parent.
Table 91 - Cases Open with Good Cause Determinations (Form OCSE-157, line 38)
The number of cases open during the fiscal year in which it was determined by the state that the custo-dial parent has a good cause for refusing to cooperate with state agencies in identifying and locating the noncustodial parent.
Children
Table 92 - Children with Paternity Resolved (Form OCSE-157, line 7)
The number of children in the IV-D caseload open at the end of the fiscal year with paternity resolved. In-clude all children born within a marriage, legitimized by marriage or adoption and children with paternity.
Table 93 - Total Number of Children in IV-D Cases (Form OCSE-157, line 4)
The number of children in the IV-D caseload in cases open at the end of the fiscal year. This includes those children who are under age 18.
E-9
Tribal Reporting Terms
Percentage Collected from Tribal Sources (Optional Reporting)
This is the proportion of total collections that was collected from Tribal sources. These are collections that were distributed or sent to another jurisdiction for distribution during the federal fiscal year, that were from a Tribal source that would not have been collected if the Tribal program did not exist. It would include collections from various sources such as per capita payments and Tribal casinos.
Tribal Unemployment Rate (Optional Reporting)
This is an optional reporting line, and may be obtained from an actual study or report such as the Bureau of Indian Affairs (BIA) Labor Force Report, or other Tribal calculations based on Tribal members, Tribal child support caseload, or other appropriate group.
Tribal Joblessness Rate (Optional Reporting)
The joblessness rate is an alternative measure of unemployment. No standard definitions were provided. Tribes may choose how to calculate this measure.

E-10
This page is intentionally left blank
F-1
INCENTIVE Formulas
INCENTIVE FORMULAS and FORMS
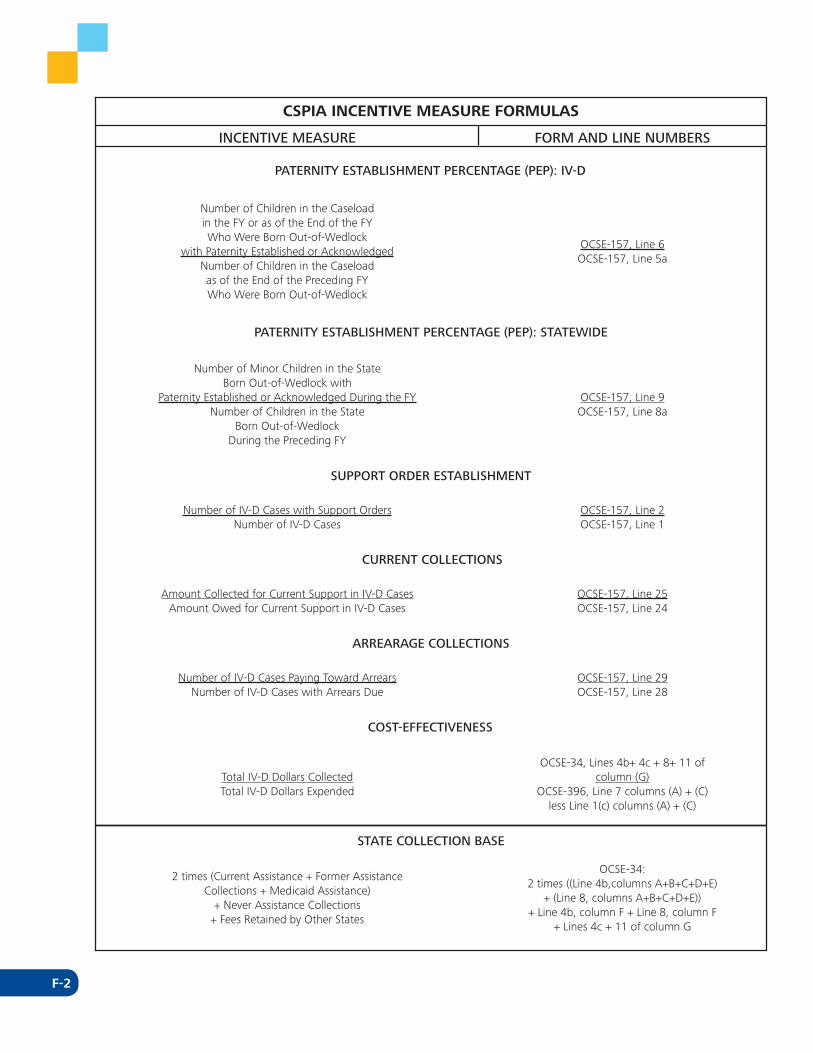
F-2
CSPIA INCENTIVE MEASURE FORMULAS
INCENTIVE MEASURE FORM AND LINE NUMBERS
PATERNITY ESTABLISHMENT PERCENTAGE (PEP): IV-D
Number of Children in the Caseloadin the FY or as of the End of the FYWho Were Born Out-of-Wedlock
with Paternity Established or AcknowledgedOCSE-157, Line 6
Number of Children in the Caseloadas of the End of the Preceding FYWho Were Born Out-of-Wedlock
OCSE-157, Line 5a
PATERNITY ESTABLISHMENT PERCENTAGE (PEP): STATEWIDE
Number of Minor Children in the StateBorn Out-of-Wedlock with
Paternity Established or Acknowledged During the FY OCSE-157, Line 9Number of Children in the State
Born Out-of-WedlockDuring the Preceding FY
OCSE-157, Line 8a
SUPPORT ORDER ESTABLISHMENT
Number of IV-D Cases with Support Orders OCSE-157, Line 2Number of IV-D Cases OCSE-157, Line 1
CURRENT COLLECTIONS
Amount Collected for Current Support in IV-D Cases OCSE-157, Line 25Amount Owed for Current Support in IV-D Cases OCSE-157, Line 24
ARREARAGE COLLECTIONS
Number of IV-D Cases Paying Toward Arrears OCSE-157, Line 29Number of IV-D Cases with Arrears Due OCSE-157, Line 28
COST-EFFECTIVENESS
Total IV-D Dollars CollectedOCSE-34, Lines 4b+ 4c + 8+ 11 of
column (G)Total IV-D Dollars Expended OCSE-396, Line 7 columns (A) + (C)
less Line 1(c) columns (A) + (C)
STATE COLLECTION BASE
2 times (Current Assistance + Former AssistanceCollections + Medicaid Assistance)
+ Never Assistance Collections+ Fees Retained by Other States
OCSE-34:2 times ((Line 4b,columns A+B+C+D+E)
+ (Line 8, columns A+B+C+D+E))+ Line 4b, column F + Line 8, column F
+ Lines 4c + 11 of column G
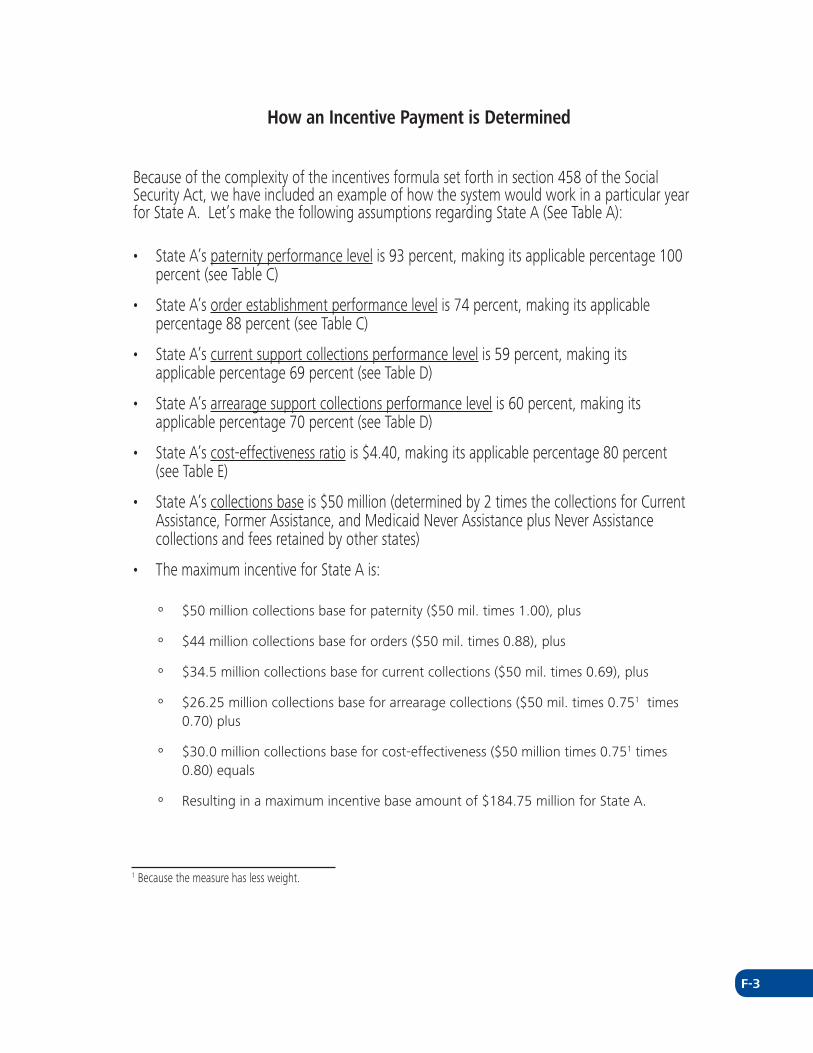
F-3
How an Incentive Payment is Determined
Because of the complexity of the incentives formula set forth in section 458 of the Social Security Act, we have included an example of how the system would work in a particular year for State A. Let’s make the following assumptions regarding State A (See Table A):
• State A’s paternity performance level is 93 percent, making its applicable percentage 100 percent (see Table C)
• State A’s order establishment performance level is 74 percent, making its applicable percentage 88 percent (see Table C)
• State A’s current support collections performance level is 59 percent, making its applicable percentage 69 percent (see Table D)
• State A’s arrearage support collections performance level is 60 percent, making its applicable percentage 70 percent (see Table D)
• State A’s cost-effectiveness ratio is $4.40, making its applicable percentage 80 percent (see Table E)
• State A’s collections base is $50 million (determined by 2 times the collections for Current Assistance, Former Assistance, and Medicaid Never Assistance plus Never Assistance collections and fees retained by other states)
• The maximum incentive for State A is:
ɻ $50 million collections base for paternity ($50 mil. times 1.00), plus
ɻ $44 million collections base for orders ($50 mil. times 0.88), plus
ɻ $34.5 million collections base for current collections ($50 mil. times 0.69), plus
ɻ $26.25 million collections base for arrearage collections ($50 mil. times 0.75 times 0.70) plus
1
ɻ $30.0 million collections base for cost-effectiveness ($50 million times 0.751 times 0.80) equals
ɻ Resulting in a maximum incentive base amount of $184.75 million for State A.
1 Because the measure has less weight.

F-4
Table A
• We must now determine what is State A’s share of the $318.75 million. It is 58 percent ($184.75 divided by $318.75).
We must now make some assumptions regarding the other States. Let’s assume that there are only two other States in our country--and the maximum incentive base amount is $84 million for State B and $50 million for State C, making the total maximum incentive base amount $318.75 million for all three States (See Table B).
MeasureState A’s
Performance Level
Applicable Percentage based on
PerformanceWeight
State A’s Collection Base (assumed to be $50,000,000)
Paternity Establishment 93% 100% 1.00 $50,000,000Order Establishment 74% 88% 1.00 $44,000,000Current Collections 59% 69% 1.00 $34,500,000Arrearage Collections 60% 70% .75 $26,250,000Cost-Effectiveness $4.40 80% .75 $30,000,000
State A’s Maximum Incentive Base Amount -- -- -- $184,750,000
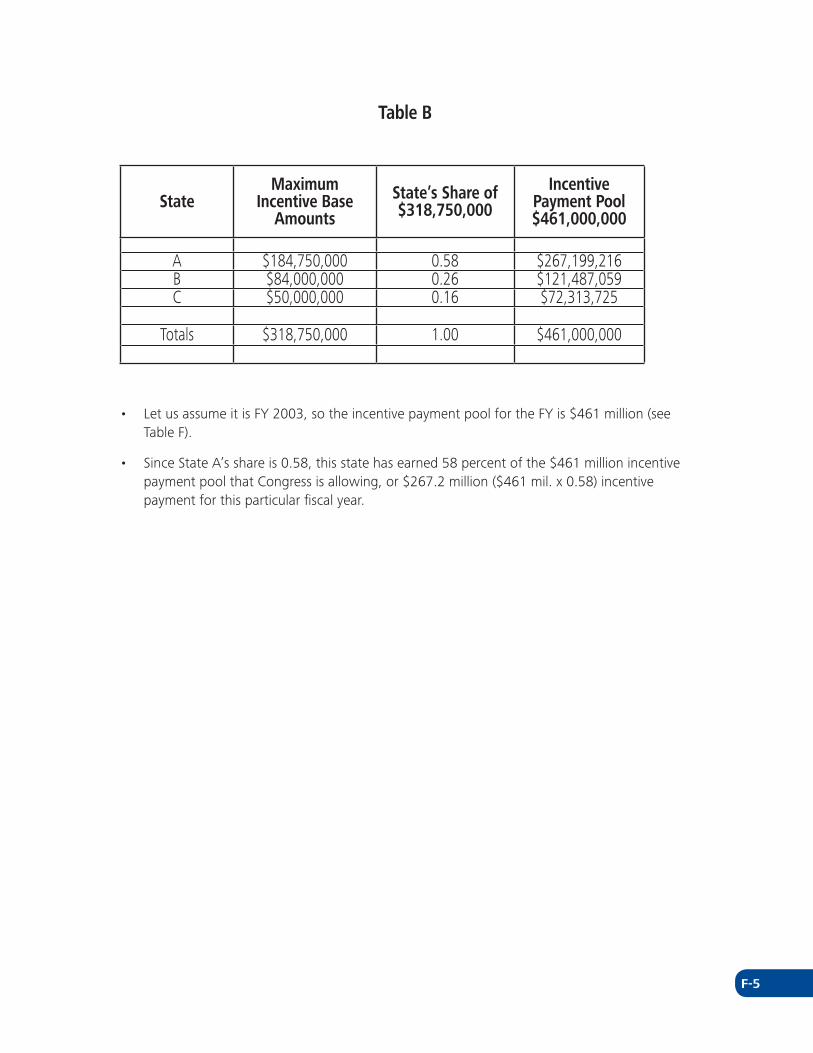
F-5
Table B
StateMaximum
Incentive Base Amounts
State’s Share of $318,750,000
Incentive Payment Pool $461,000,000
A $184,750,000 0.58 $267,199,216B $84,000,000 0.26 $121,487,059C $50,000,000 0.16 $72,313,725
Totals $318,750,000 1.00 $461,000,000
• Let us assume it is FY 2003, so the incentive payment pool for the FY is $461 million (see Table F).
• Since State A’s share is 0.58, this state has earned 58 percent of the $461 million incentive payment pool that Congress is allowing, or $267.2 million ($461 mil. x 0.58) incentive payment for this particular fiscal year.
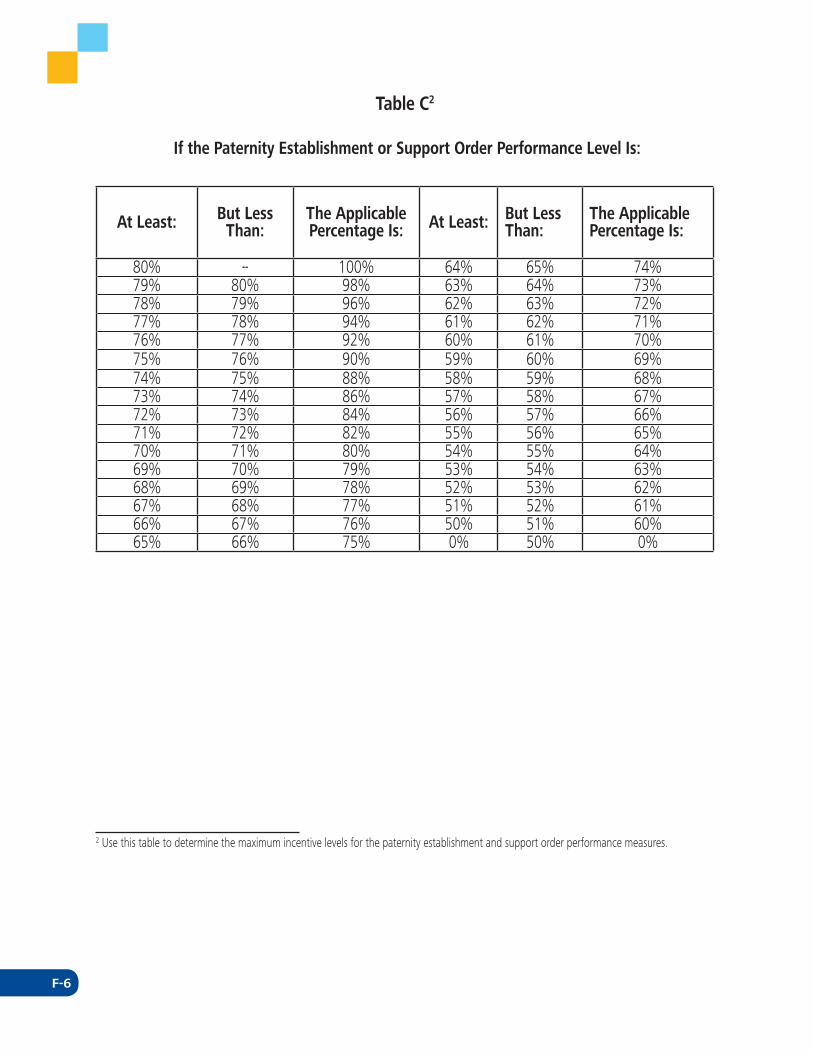
F-6
Table C2
At Least: But Less Than:
The Applicable Percentage Is: At Least: But Less
Than:The Applicable Percentage Is:
80% -- 100% 64% 65% 74%79% 80% 98% 63% 64% 73%78% 79% 96% 62% 63% 72%77% 78% 94% 61% 62% 71%76% 77% 92% 60% 61% 70%75% 76% 90% 59% 60% 69%74% 75% 88% 58% 59% 68%73% 74% 86% 57% 58% 67%72% 73% 84% 56% 57% 66%71% 72% 82% 55% 56% 65%70% 71% 80% 54% 55% 64%69% 70% 79% 53% 54% 63%68% 69% 78% 52% 53% 62%67% 68% 77% 51% 52% 61%66% 67% 76% 50% 51% 60%65% 66% 75% 0% 50% 0%
If the Paternity Establishment or Support Order Performance Level Is:
2 Use this table to determine the maximum incentive levels for the paternity establishment and support order performance measures.
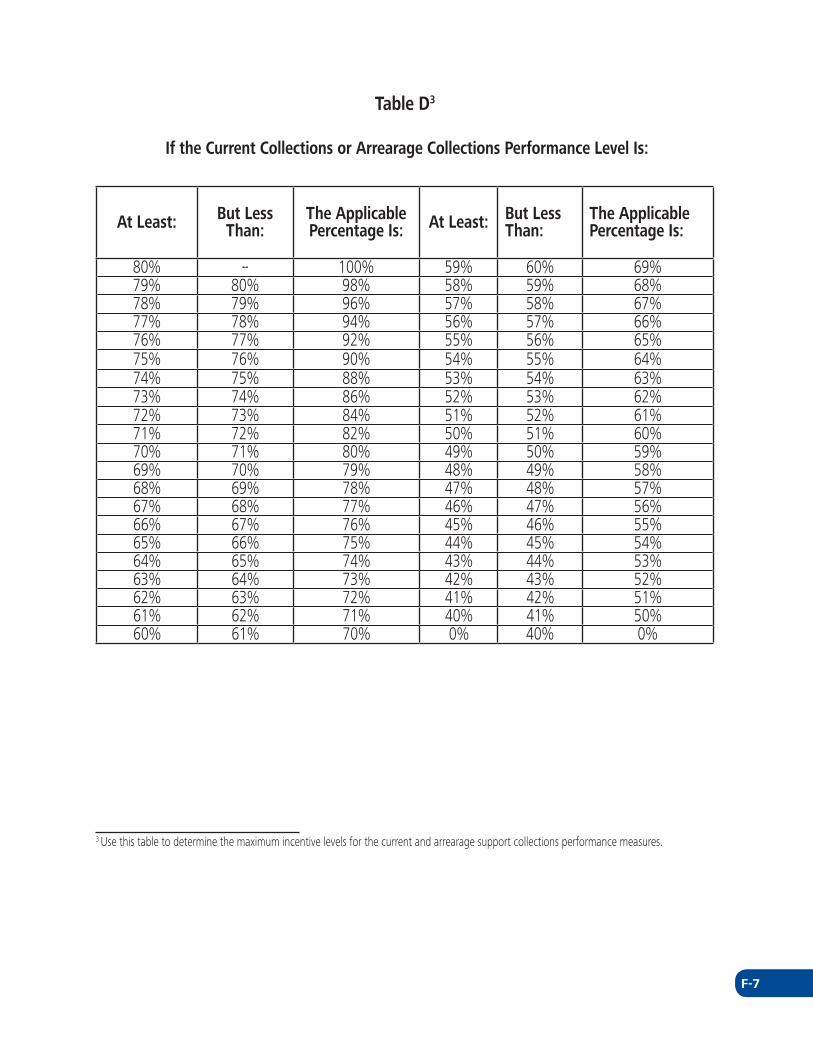
F-7
Table D3
If the Current Collections or Arrearage Collections Performance Level Is:
At Least: But Less Than:
The Applicable Percentage Is: At Least: But Less
Than:The Applicable Percentage Is:
80% -- 100% 59% 60% 69%79% 80% 98% 58% 59% 68%78% 79% 96% 57% 58% 67%77% 78% 94% 56% 57% 66%76% 77% 92% 55% 56% 65%75% 76% 90% 54% 55% 64%74% 75% 88% 53% 54% 63%73% 74% 86% 52% 53% 62%72% 73% 84% 51% 52% 61%71% 72% 82% 50% 51% 60%70% 71% 80% 49% 50% 59%69% 70% 79% 48% 49% 58%68% 69% 78% 47% 48% 57%67% 68% 77% 46% 47% 56%66% 67% 76% 45% 46% 55%65% 66% 75% 44% 45% 54%64% 65% 74% 43% 44% 53%63% 64% 73% 42% 43% 52%62% 63% 72% 41% 42% 51%61% 62% 71% 40% 41% 50%60% 61% 70% 0% 40% 0%
3 Use this table to determine the maximum incentive levels for the current and arrearage support collections performance measures.
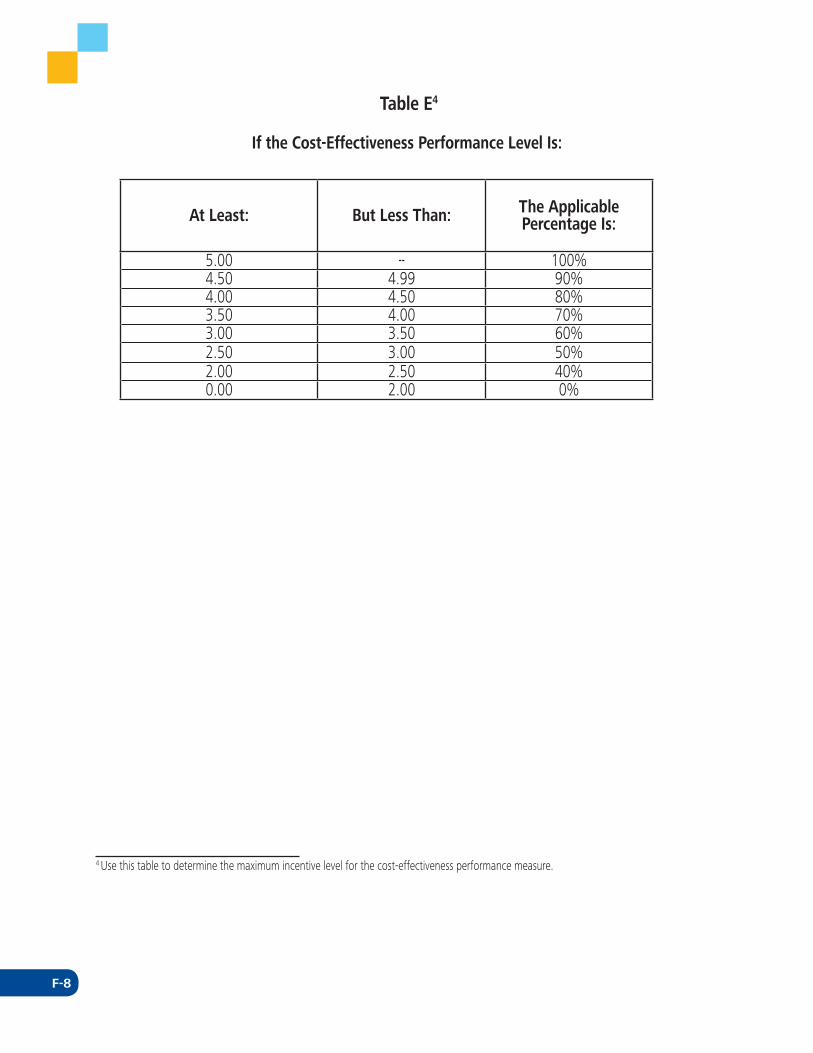
F-8
Table E4
If the Cost-Effectiveness Performance Level Is:
At Least: But Less Than: The Applicable Percentage Is:
5.00 -- 100%4.50 4.99 90%4.00 4.50 80%3.50 4.00 70%3.00 3.50 60%2.50 3.00 50%2.00 2.50 40%0.00 2.00 0%
4 Use this table to determine the maximum incentive level for the cost-effectiveness performance measure.
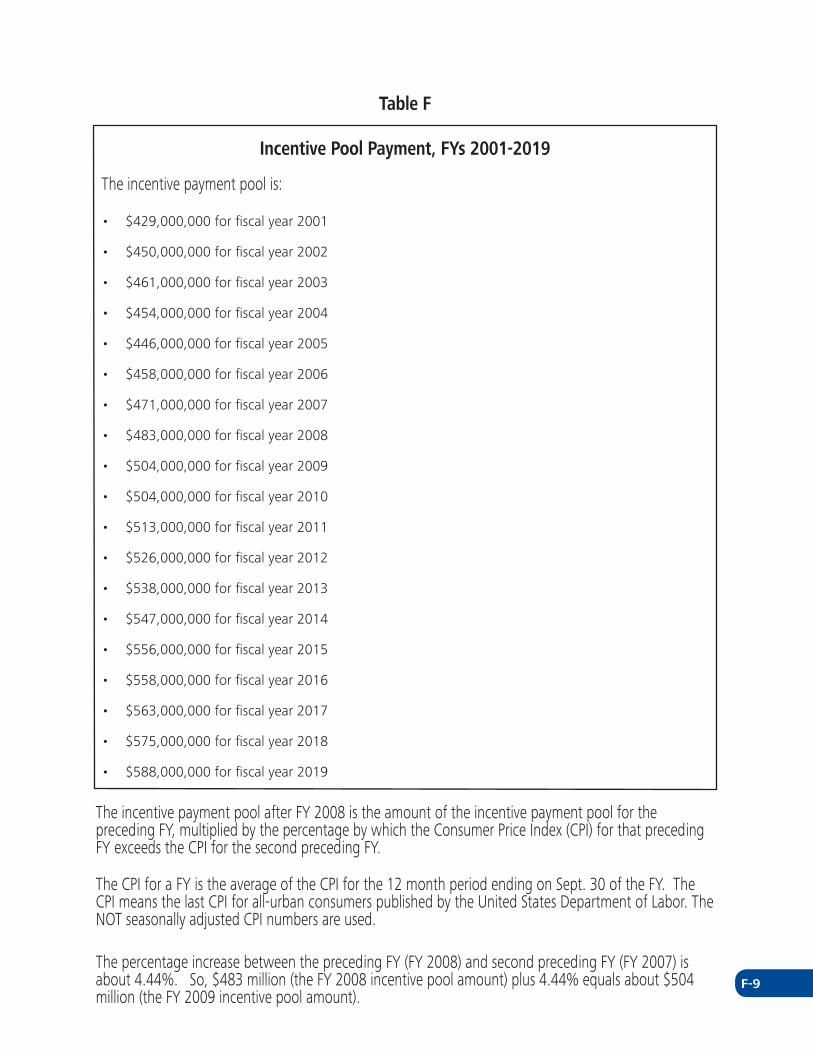
F-9
Table F
Incentive Pool Payment, FYs 2001-2019
The incentive payment pool is:
• $429,000,000 for fiscal year 2001
• $450,000,000 for fiscal year 2002
• $461,000,000 for fiscal year 2003
• $454,000,000 for fiscal year 2004
• $446,000,000 for fiscal year 2005
• $458,000,000 for fiscal year 2006
• $471,000,000 for fiscal year 2007
• $483,000,000 for fiscal year 2008
• $504,000,000 for fiscal year 2009
• $504,000,000 for fiscal year 2010
• $513,000,000 for fiscal year 2011
• $526,000,000 for fiscal year 2012
• $538,000,000 for fiscal year 2013
• $547,000,000 for fiscal year 2014
• $556,000,000 for fiscal year 2015
• $558,000,000 for fiscal year 2016
• $563,000,000 for fiscal year 2017
• $575,000,000 for fiscal year 2018
• $588,000,000 for fiscal year 2019
The incentive payment pool after FY 2008 is the amount of the incentive payment pool for the preceding FY, multiplied by the percentage by which the Consumer Price Index (CPI) for that preceding FY exceeds the CPI for the second preceding FY.
The CPI for a FY is the average of the CPI for the 12 month period ending on Sept. 30 of the FY. The CPI means the last CPI for all-urban consumers published by the United States Department of Labor. The NOT seasonally adjusted CPI numbers are used.
The percentage increase between the preceding FY (FY 2008) and second preceding FY (FY 2007) is about 4.44%. So, $483 million (the FY 2008 incentive pool amount) plus 4.44% equals about $504 million (the FY 2009 incentive pool amount).
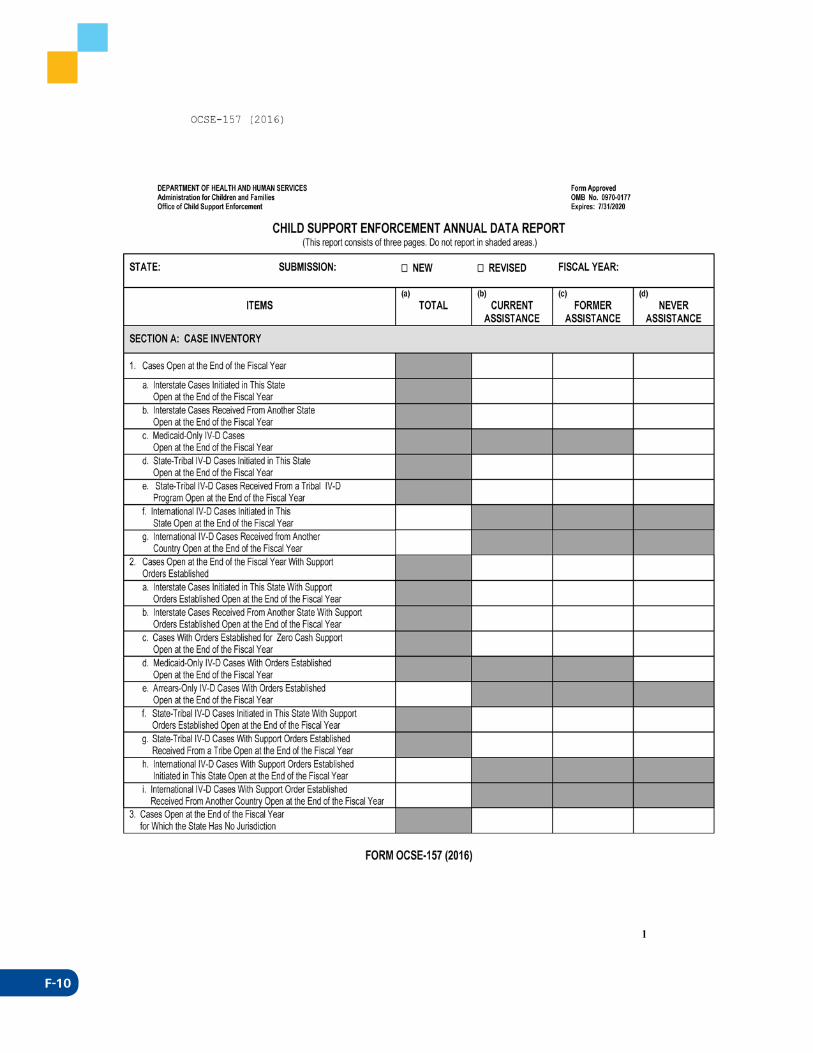
F-10
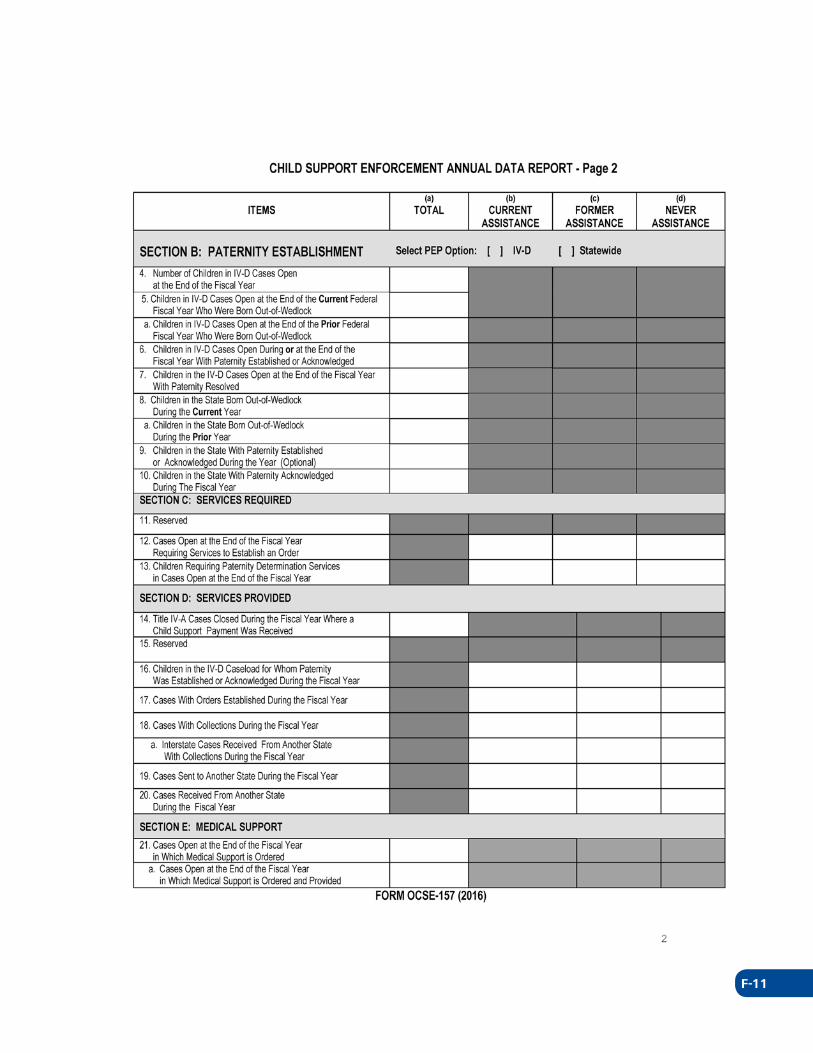
F-11
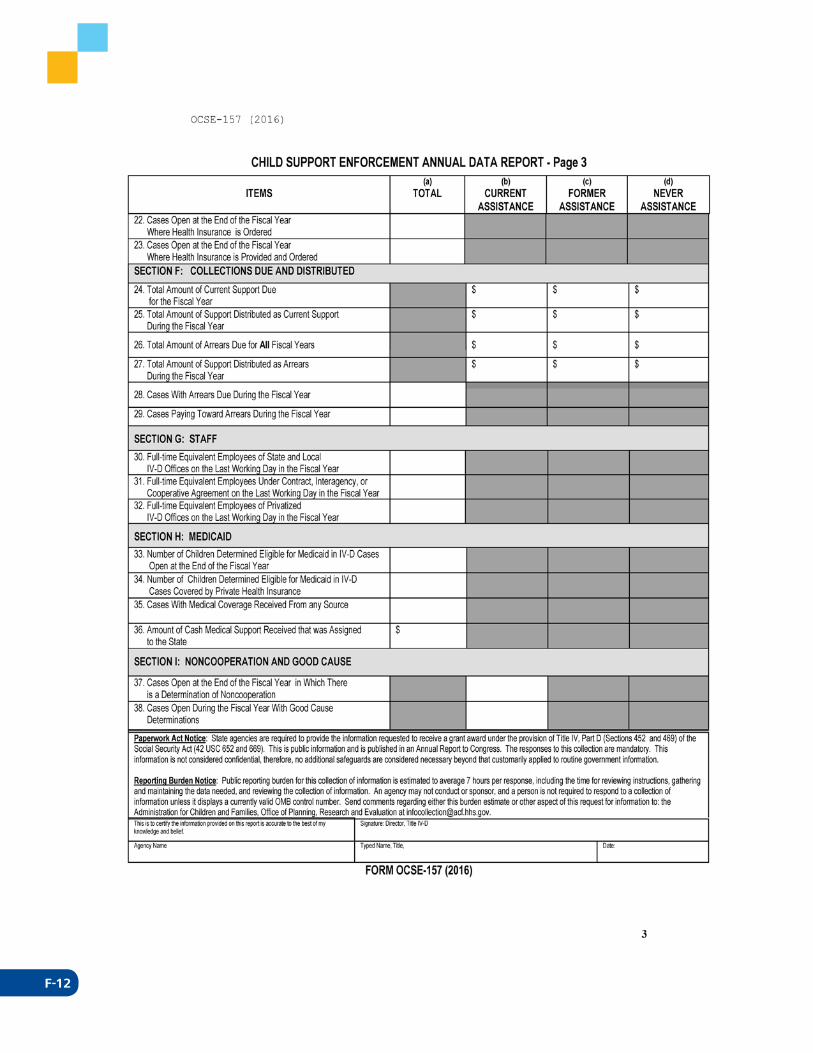
F-12
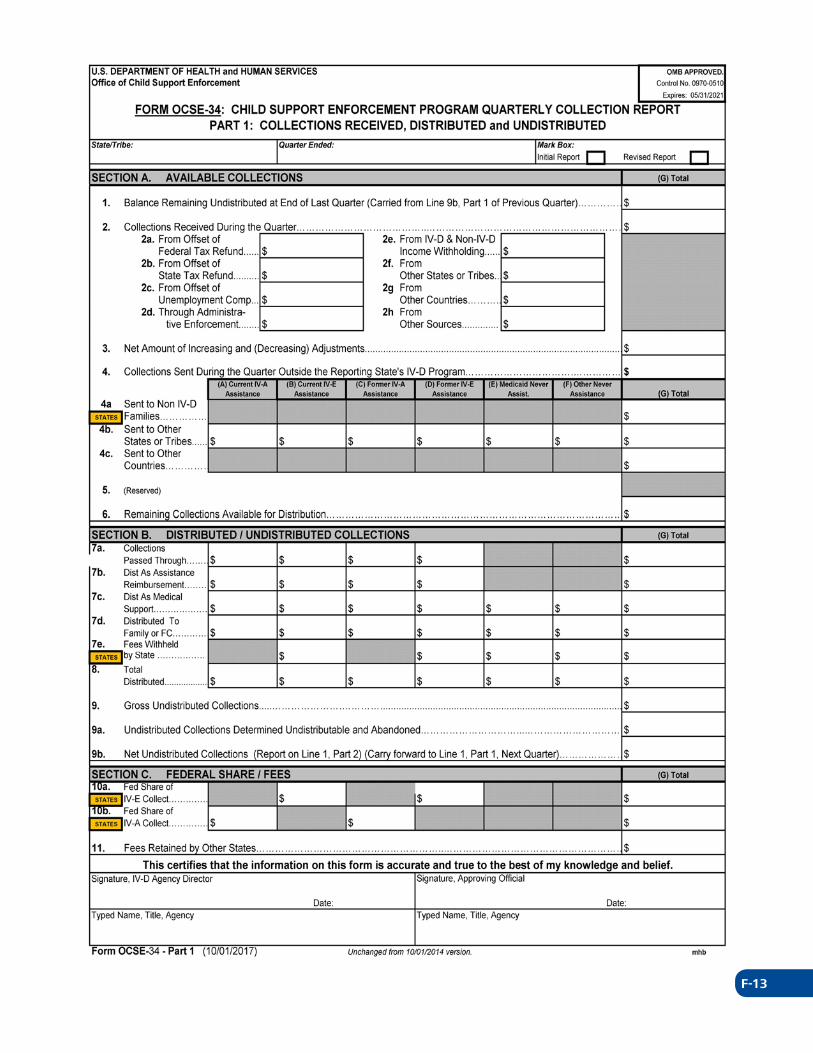
F-13
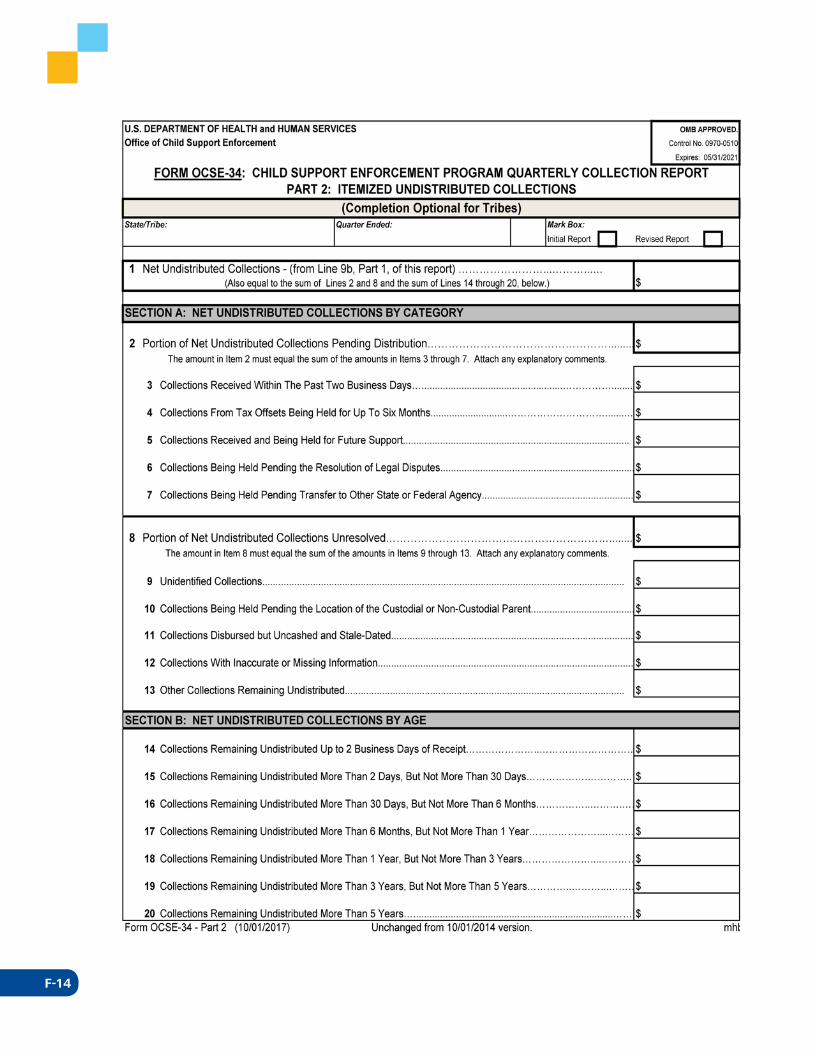
F-14
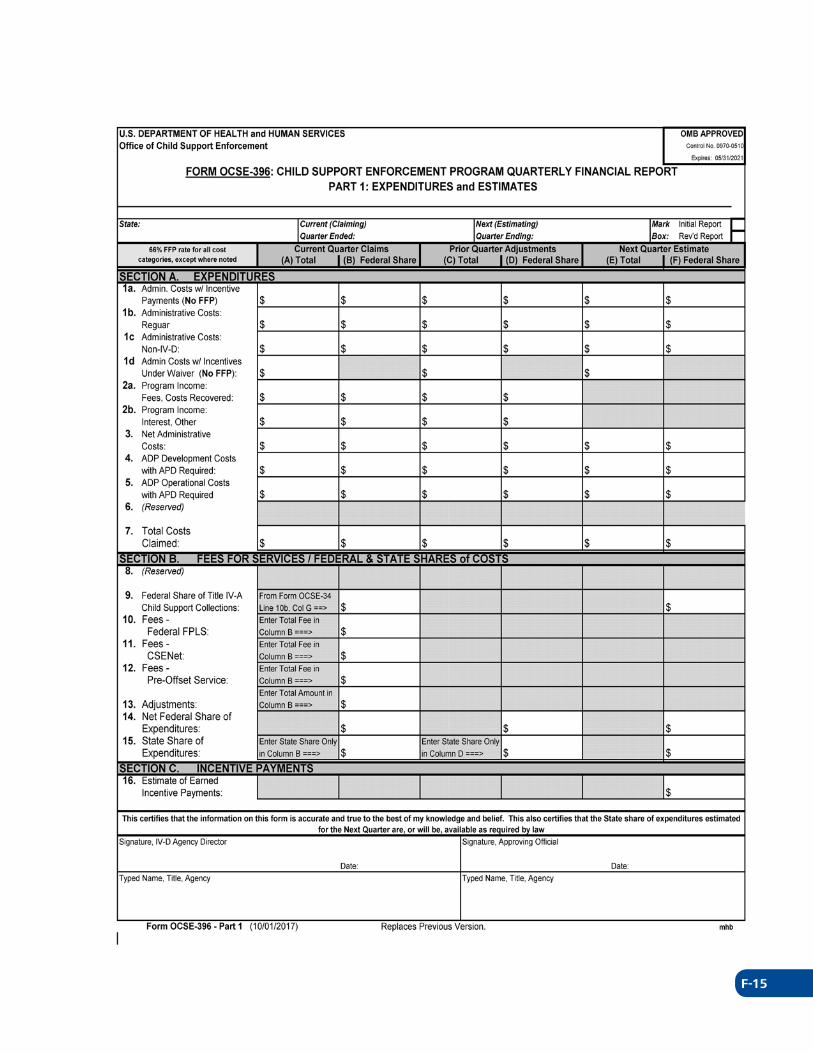
F-15
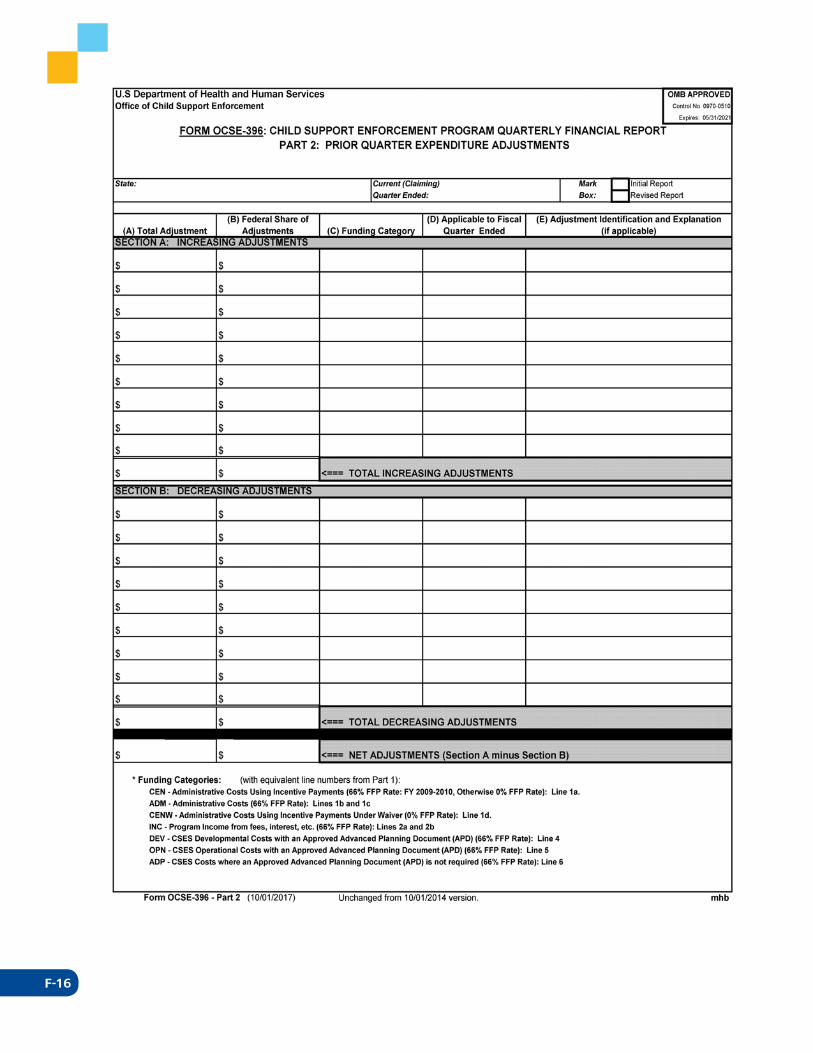
F-16
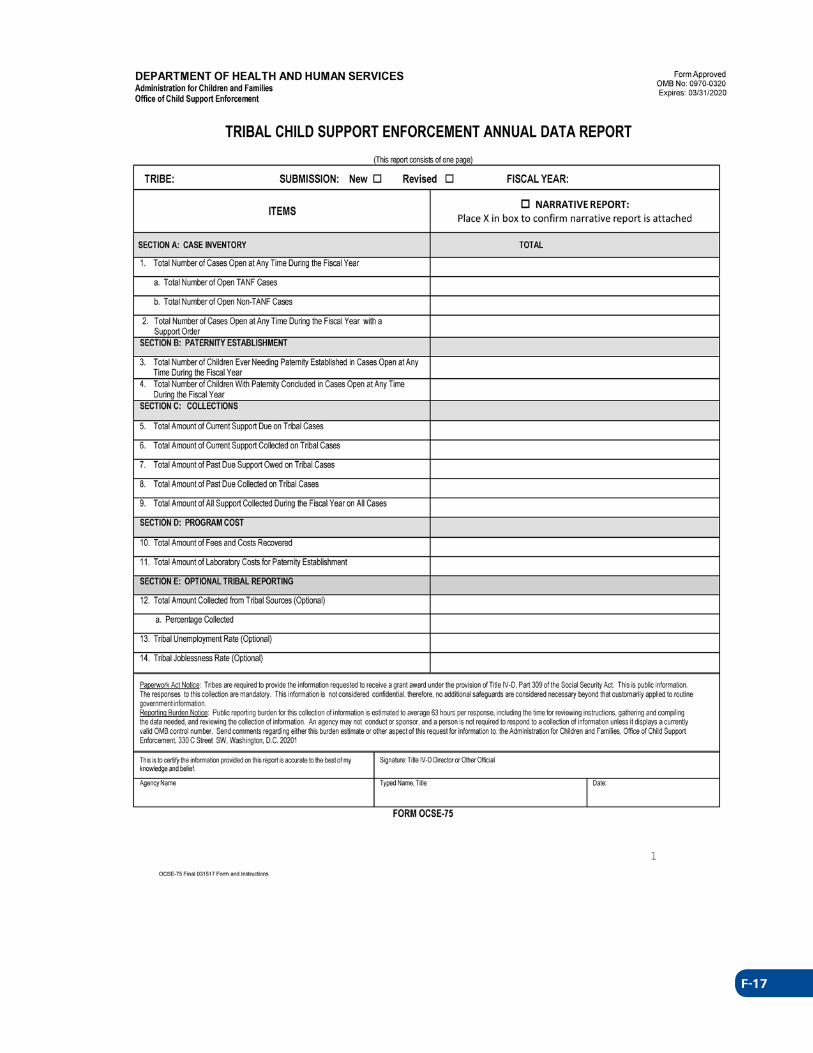
F-17