Drug Enforcement Administration - AltGov2
752
Drug Enforcement Administration Microgram Journal, 2003-2008 Collected by AltGov2 www.altgov2.org
-
Upload
khangminh22 -
Category
Documents
-
view
1 -
download
0
Transcript of Drug Enforcement Administration - AltGov2

Drug Enforcement Administration
Microgram Journal, 2003-2008
Collected by AltGov2
www.altgov2.org
U.S. Department of JusticeDrug Enforcement Administration
www.dea.gov
Microgram Journal
To Assist and Serve Scientists Concerned with the Detection and Analysis of Controlled Substances and Other Abused Substances for Forensic / Law Enforcement Purposes.
Published by: The Drug Enforcement Administration Office of Forensic Sciences Washington, DC 20537
The U.S. Attorney General has determined that the publication of this periodical is necessary in the transaction of the public business required by the Department of Justice. Information, instructions, and disclaimers are published in the first issue of each year.
Volume 1 Numbers 1-2 Posted On-Line At: January - June 2003 www.dea.gov/programs/forensicsci/microgram/index.html
1
Brought to you by AltGov2 [www.altgov2.org]
Contents
2003 Information and Instructions for Microgram Journal 3
Disclaimers 7
Osmolality - A Novel and Sensitive Tool for Detection of Tampering of Beverages 8Adulterated with Ethanol, γ-Butyrolactone, and 1,4-Butanediol, and for Detectionof Dilution-Tampered Demerol Syringes
James F. Wesley
Psychotria Viridis –A Botanical Source of Dimethyltryptamine (DMT) 18Robert D. Blackledge and Charlotte M. Taylor
Evaluation of Ninhydrin Analogues and Other Electron-Deficient Compounds as 23Spray Reagents for Drugs on Thin Layer Chromatograms
Myriam Azoury , Avraham Zelkowicz , Zafrir Goren , and Joseph Almog
Instrumental Separation of 3,4-Methylenedioxyamphetamine (MDA) from 321-(3,4-Methylenedioxyphenyl)-2-propanol, a Co-Eluting Compound
Barbara A. Vohlken and Stephen M. Layton
Potency of Cannabis Seized in Central Florida During June 2002 37 Christina J. Newell
A Study of Acids Used for the Acidified Cobalt Thiocyanate Test for Cocaine Base 40Anna L. Deakin
1,4-Butanediol (BD) - Forensic Profile 44Agnes D. Garcia and Allen J. Catterton
Detection and Analysis of Drugs of Forensic Interest, 1992 - 2001; A Literature Review 55Robert F.X. Klein and Patrick A. Hays
Cover Art: “Ball and Stick” Model of Heroin (Courtesy of Patrick A. Hays, DEA Special Testing and Research Laboratory, Dulles, VA)
Microgram Journal, Volume 1, Numbers 1-2 (January - June 2003) 2
Brought to you by AltGov2 [www.altgov2.org]
2003 Information and Instructions for Microgram Journal
[Editor’s Preface: The following information and instructions are derived from the Microgram website < http://www.dea.gov/programs/forensicsci/microgram/index.html >, and are provided here for the convenience of those subscribers who do not have access to the Internet. Updates of this material will henceforth be published only in the respective January issues for each year.]
General Information Microgram Journal is a quarterly periodical published by the U.S. Drug Enforcement Administration's Office of Forensic Sciences, and is intended to assist and serve scientists concerned with the detection and analyses of controlled substances and other abused substances for forensic/law enforcement purposes.
Subscriptions to Microgram Journal Microgram Journal is unclassified, and is published on the DEA public access website (see the above URL). Private citizens should use the website to access Microgram Journal. Professional scientific and law enforcement personnel may either use the website or request a subscription. Subscriptions are available electronically and in hard copy. Electronic subscriptions require Internet access. The publications themselves will not be sent electronically to any subscriber; rather, an email notification will be sent to the subscriber when the respective issue is posted on the website. Requests for hard copies are strongly discouraged, and should be limited to those offices that do not have access to the Internet, require hard copies for their libraries, or have some other valid reason (Note: “For my personal collection” is not considered to be a valid reason). Requests for hard copies are limited to one per office, and should also include formal justification. Note that due to publication delays beyond the control of the Office of Forensic Sciences, hard copies will arrive from 30 to 90 days after electronic posting on the website.
Requests to be added to the subscription list should be submitted via email to the Microgram Editor at: [email protected] If email submission is not possible, requests should be mailed to: Microgram Editor, Drug Enforcement Administration, Office of Forensic Sciences, 2401 Jefferson Davis Highway, Alexandria, VA 22301. All requests to be added to the Microgram mailing list should include the following Subscriber Contact Information:
* The Full Name and Mailing Address of Submitting Laboratory or Office;
* The Full Name, Title (Laboratory Director, Assistant Special Agent in Charge, Librarian, etc.), Phone Number, FAX Number, and Preferred email Address of the Submitting Individual (Note that subscriptions are mailed to titles, not names, in order to avoid subscription problems arising from future personnel changes);
* If available, the generic email address for the Submitting Laboratory or Office;
* If a generic email address is not available, one official or private email address for an individual who is likely to be a long-term employee, who has a stable email address, and who will be responsible for forwarding Microgram information to all of the other employees in the requestor’s Office (Note that only one email address per Office will be honored); and
* If requesting a hard copy mailing, justification.
Requests to be removed from the Microgram subscription list, or to change an existing subscription, should also be sent to the Microgram Editor. Such requests should included all of the pertinent Subscriber Contact Information detailed above, and also should provide the email and/or hard mail address currently being utilized for the requestor’s subscription.
Microgram Journal, Volume 1, Numbers 1-2 (January - June 2003) 3
Brought to you by AltGov2 [www.altgov2.org]
Note that, due to mailing delays and/or publication timeframes, subscription requests/changes may take as long as 90 days to implement.
Subscription Costs Subscriptions to Microgram Journal are free.
Submissions to Microgram Journal Microgram Journal presents peer reviewed, full length Scientific Research Articles and Technical Notes on the detection and analyses of controlled substances and other abused substances for forensic/law enforcement purposes.
Manuscripts are accepted both from within and outside of DEA, and reviewers for the Journal are both internal (from within DEA) and external.
All submissions must be in English. Because Microgram Journal is unclassified, case sensitive information should not be submitted! All submissions should, whenever possible, be submitted electronically, as straight email or as an IBM® PC-compatible Corel WordPerfect® or Microsoft Word® attachment, to: [email protected] Current versions of Corel WordPerfect® or Microsoft Word® (defined as having release dates less than 5 years old) should be utilized. If electronic (email) submission is not possible, submissions may be mailed to: Microgram Editor, Drug Enforcement Administration, Office of Forensic Sciences, 2401 Jefferson Davis Highway, Alexandria, VA 22301. Hard-copy manuscripts should be submitted in triplicate, and should also be accompanied by an electronic version (written in either Corel WordPerfect® or Microsoft Word®) on a 3 ½ inch IBM® PC-compatible diskette, 100 MB iomega® zip diskette, or an IBM® PC-compatible compact disk. Note that diskettes should be mailed in an irradiation-proof protective sleeve, and the mailing envelope should be marked: "Warning - Contains Electronic Media - Do Not Irradiate." Hard-copy manuscripts should be printed in black ink using a laser or ink jet printer, double-spaced, on one side of 8 1/2" x 11" or A4 high quality white bond paper. A Times New Roman/12-point font is preferred for all submissions (electronic or hard copy). Each page, including illustrations, should have a one-inch (25 mm) margin on all sides. The pages should be numbered, but not stapled together.
Note that mailed submissions may be subject to lengthy handling delays beyond the control of the Office of Forensic Sciences, and electronic media sent through the mail may be destroyed en route by sanitizing procedures, despite protective measures and written warnings.
All submissions should include the following Author Contact Information: The Full Name and Address of Submitting Laboratory or Office, and the Full Name, Phone Number, FAX Number, and Preferred email Address of the Submitting Author.
Scientific Research Articles are formal, full length reports detailing original research in the detection and analysis of suspected controlled substances for forensic/law enforcement purposes, excluding in post-ingestion human/animal biological matrices (blood, urine, meconium, sweat, hair, etc.) Technical Notes are shorter communications concentrating on a specific drug (or drug class), unusual case, novel procedure or method, or minor original research. Each article/note should be a "stand-alone" work; serial publications will not be considered. Similarly, articles/notes which essentially duplicate existing literature will not be considered unless the presented data reflect significant advances in instrumentation made since the original publication(s) (however, see: Dual Publications, below). All submissions will be subjected to full peer review, and authors will be notified of the results of the review(s) within three months after the manuscript is received by the Office of Forensic Sciences.
The following guidelines should be used for all Articles (Technical Notes should follow an abbreviated version as appropriate):
Microgram Journal, Volume 1, Numbers 1-2 (January - June 2003) 4
Brought to you by AltGov2 [www.altgov2.org]
Cover Letter - Provide the Author Contact Information and pertinent correspondence (if any) for the Editor.
Title - Should be specific and amenable to indexing; they should not include acronyms or abbreviations except for very common instrumental technique acronyms (e.g., GC/MS or HPLC) and/or very common drug acronyms (e.g., MDMA or PCP). Titles should be sufficiently informative that the readership should not have to read the Abstract or the Introduction to understand the focus of the article. If the manuscript reflects work previously presented at a scientific meeting, a statement detailing that presentation should be included as a footnote to the Title.
Author(s)/Affiliation(s) - The author's full name (including middle initial(s)) and title, and the full name and address of the laboratory or office should immediately follow the title. The author's degree level may be included if desired, but is not required (however, multiple authors should all include or all exclude this information). If there are several authors from two or more laboratories or offices, each set of authors should be listed separately, followed by their corresponding laboratory name and address (that is, Authors I, Laboratory I, Authors II, Laboratory II, etc.) Excessive authorship should be avoided. If there is more than one author, the primary author should be indicated with a superscripted asterisk. The name, phone numbers (Voice and FAX), preferred email address, and (if different from the laboratory or office address) the full mailing address of the contact person should be included on the title page. [Note that the provided email address will be listed under the primary author’s address information.]
Abstract - State the purpose, procedures, and principal findings of the paper, in 120 words or less. Avoid the use of abbreviations, and use only common acronyms as defined under "Titles". Note that the abstract will be provided to Chemical Abstracts.
Keyword List - A minimum of five (maximum ten) abstracting keywords should be included.
Introduction - Briefly state the issue or problem. Detail existing practice in the topic area, and explain the shortcomings (if any) in what has been previously reported and/or what is being currently done in the field; that is, compare and contrast the selected methodology with previous and/or existing methods. Provide theoretical and practical background for novel or rarely utilized experimental or instrumental methods. Include pertinent references (avoid "Personal Communications").
Experimental (Chemicals, Instrumentation, Procedures) - Detail the chemicals, instruments, and procedures utilized (including experimental parameters). However, USE CAUTION IN DETAILING SYNTHESES OF CONTROLLED OR ABUSED SUBSTANCES, especially novel syntheses to known controlled substances, or syntheses of novel substances that may be subject to abuse, that are not yet well known in the scientific and/or underground literature. [In such cases, a simple statement should be included to the effect that: "Experimental details on this synthesis are not provided, in accordance with Journal policy."] Similar cautions should be followed when discussing commercial sources of abused substances.
Results and Discussion - Present findings in a logical, easily followed sequence. Describe what was done, and where appropriate what conclusions can be drawn. Compare and contrast the findings with previous studies and/or current practice. Discuss any problems and/or unresolved issues.
Conclusions - Optional - Summarized results should be included only for complex articles. Conclusions should not merely duplicate the Abstract or a summary paragraph in the Results and Discussion section.
Acknowledgments - Should be brief, and include the full name, affiliation, and specific contribution made by each cited individual.
References - Articles and notes should have all textual citations collected in an endnotes list. Within the text, references should be consecutively numbered either with superscripted Arabic numerals or in-line with Arabic numerals within parentheses (author’s choice), in accordance with their first appearance. Multiple references
Microgram Journal, Volume 1, Numbers 1-2 (January - June 2003) 5
Brought to you by AltGov2 [www.altgov2.org]
should be comma delineated. Within the endnotes list, references should be consecutively numbered with Arabic numerals, as follows: Number, Period, Indent, Citation. Reference format should adhere to the Uniform Requirements for Manuscripts Submitted to Biomedical Journals (Note: This is the same reference format utilized in the Selected Reference Citations in Microgram Bulletin, and also by the Journal of Forensic Sciences). Journal titles may be either spelled out in full or abbreviated using standard CASSI abbreviations. Due to their inherently transitory nature, use of website URL's as references are discouraged (but permitted if absolutely necessary). As previously noted, Personal Communications should not be utilized; however, if unavoidable, utilize the following format: Full Name, Title, Affiliation (Laboratory or Office), Location (City and State, plus Nation if not the United States), Personal Communication, Year.
Table and Figures - All Tables and Figures should be appended onto the end of the article (not imbedded in the text). Tables and Figures should be consecutively numbered with Arabic numerals, in accordance with their first citation in the text. Each Table and Figure should be "stand-alone"; that is, include sufficient descriptive information such that the reader will not have to refer back to the text to understand the Table or Figure. The Header should include the Table or Figure number and a concise title. Explanatory material, definitions of acronyms and/or abbreviations, and/or references within the Table or Figure should be designated by superscripted, lower case letters in alphabetical order, and included in dedicated footnotes at the bottom of the respective Table or Figure. Unless color is needed to enhance differentiation of the depicted material, all Tables and Figures should be in black and white (that is, avoid frivolous use of color for "artistic" purposes). Figures of spectra, chromatograms, charts, graphs, etc., should have clear and legibly labeled axes, but should not include instrument generated printoffs of experimental parameter lists.
Manuscripts submitted to Microgram Journal are required to be finished, professional quality efforts. Authors should ensure clarity, brevity, and pertinence of all information. Attention to detail in formatting, grammar, and spelling is as important as the accuracy of the presented facts. Authors are specially cautioned to conduct careful literature reviews prior to submission. At the Editor's discretion, “rough drafts” or otherwise clearly substandard and/or inappropriate manuscripts will be returned to the author(s) without review.
Manuscripts will not be retyped, but "final" versions are subject to minor to moderate Editorial rewrite to improve presentation clarity or to reformat to current Microgram Journal style.
Dual Publication - Re-publication of articles or notes of particular interest to the Microgram Journal readership will be considered if the article was originally published in a journal that is not easily accessed, and the primary author has obtained explicit, written copyright exclusion from the original publisher and consent from all co-authors. Examples include exact English translations of articles or notes originally published in a non-English language journal, unclassified and non-sensitive articles or notes originally published in a restricted journal or on a password protected website, or unclassified and non-sensitive articles or notes originally published in limited distribution newsletters or Proceedings. In general, any article or note that was published in English in a mainstream journal is not a candidate for re-publication in Microgram Journal. Authors interested in re-publishing previously published articles or notes in Microgram Journal should discuss the issue with the Microgram Editor before submitting.
Note that re-published articles should not be included as "new" articles in the respective author(s)' Curriculum Vitae.
Publication Costs - There are no costs (to the contributor) associated with publication in Microgram Journal.
Reprints - Microgram Journal does not provide reprints to authors. However, articles in Microgram Journal are not copyrighted and may be photocopied as needed.
Microgram Journal, Volume 1, Numbers 1-2 (January - June 2003) 6
Brought to you by AltGov2 [www.altgov2.org]
DISCLAIMERS
1) All material published in Microgram Journal is reviewed prior to publication. However, the reliability and accuracy of all published information are the responsibility of the respective contributors, and publication in Microgram Journal implies no endorsement by the United States Department of Justice or the Drug Enforcement Administration.
2) Due to the ease of scanning, copying, electronic manipulation, and/or reprinting, only the posted copies of Microgram Journal (on www.dea.gov) are absolutely valid. All other copies, whether electronic or hard, are necessarily suspect unless verified against the posted versions.
3) WARNING!: Due to the often lengthy time delays between the actual dates of seizures and their subsequent reporting in Microgram Journal, and also because of the often wide variety of seizure types with superficially similar physical attributes, published material cannot be utilized to visually identify controlled substances currently circulating in clandestine markets. The United States Department of Justice and the Drug Enforcement Administration assume no liability for the use or misuse of the information published in Microgram Journal.
* * * * *
Microgram Journal, Volume 1, Numbers 1-2 (January - June 2003) 7
Brought to you by AltGov2 [www.altgov2.org]
Osmolality - A Novel and Sensitive Tool for Detection of Tampering of Beverages Adulterated with Ethanol, γ-Butyrolactone, and 1,4-Butanediol,
and for Detection of Dilution-Tampered Demerol Syringes
James F. Wesley Monroe County Public Safety Lab
524 Public Safety Building Rochester, NY 14614
[email: [email protected]]
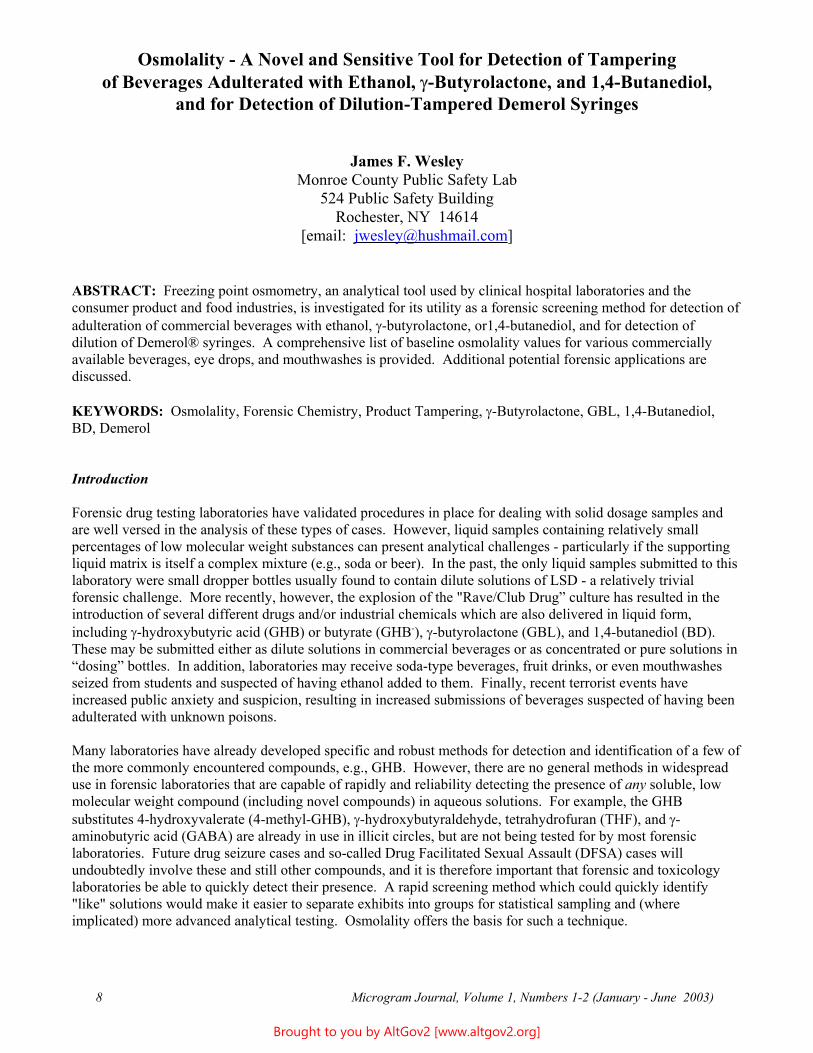
ABSTRACT: Freezing point osmometry, an analytical tool used by clinical hospital laboratories and the consumer product and food industries, is investigated for its utility as a forensic screening method for detection of adulteration of commercial beverages with ethanol, γ-butyrolactone, or1,4-butanediol, and for detection of dilution of Demerol® syringes. A comprehensive list of baseline osmolality values for various commercially available beverages, eye drops, and mouthwashes is provided. Additional potential forensic applications are discussed.
KEYWORDS: Osmolality, Forensic Chemistry, Product Tampering, γ-Butyrolactone, GBL, 1,4-Butanediol, BD, Demerol
Introduction
Forensic drug testing laboratories have validated procedures in place for dealing with solid dosage samples and are well versed in the analysis of these types of cases. However, liquid samples containing relatively small percentages of low molecular weight substances can present analytical challenges - particularly if the supporting liquid matrix is itself a complex mixture (e.g., soda or beer). In the past, the only liquid samples submitted to this laboratory were small dropper bottles usually found to contain dilute solutions of LSD - a relatively trivial forensic challenge. More recently, however, the explosion of the "Rave/Club Drug” culture has resulted in the introduction of several different drugs and/or industrial chemicals which are also delivered in liquid form, including γ-hydroxybutyric acid (GHB) or butyrate (GHB-), γ-butyrolactone (GBL), and 1,4-butanediol (BD). These may be submitted either as dilute solutions in commercial beverages or as concentrated or pure solutions in “dosing” bottles. In addition, laboratories may receive soda-type beverages, fruit drinks, or even mouthwashes seized from students and suspected of having ethanol added to them. Finally, recent terrorist events have increased public anxiety and suspicion, resulting in increased submissions of beverages suspected of having been adulterated with unknown poisons.
Many laboratories have already developed specific and robust methods for detection and identification of a few of the more commonly encountered compounds, e.g., GHB. However, there are no general methods in widespread use in forensic laboratories that are capable of rapidly and reliability detecting the presence of any soluble, low molecular weight compound (including novel compounds) in aqueous solutions. For example, the GHB substitutes 4-hydroxyvalerate (4-methyl-GHB), γ-hydroxybutyraldehyde, tetrahydrofuran (THF), and γ-aminobutyric acid (GABA) are already in use in illicit circles, but are not being tested for by most forensic laboratories. Future drug seizure cases and so-called Drug Facilitated Sexual Assault (DFSA) cases will undoubtedly involve these and still other compounds, and it is therefore important that forensic and toxicology laboratories be able to quickly detect their presence. A rapid screening method which could quickly identify "like" solutions would make it easier to separate exhibits into groups for statistical sampling and (where implicated) more advanced analytical testing. Osmolality offers the basis for such a technique.
Microgram Journal, Volume 1, Numbers 1-2 (January - June 2003) 8
Brought to you by AltGov2 [www.altgov2.org]
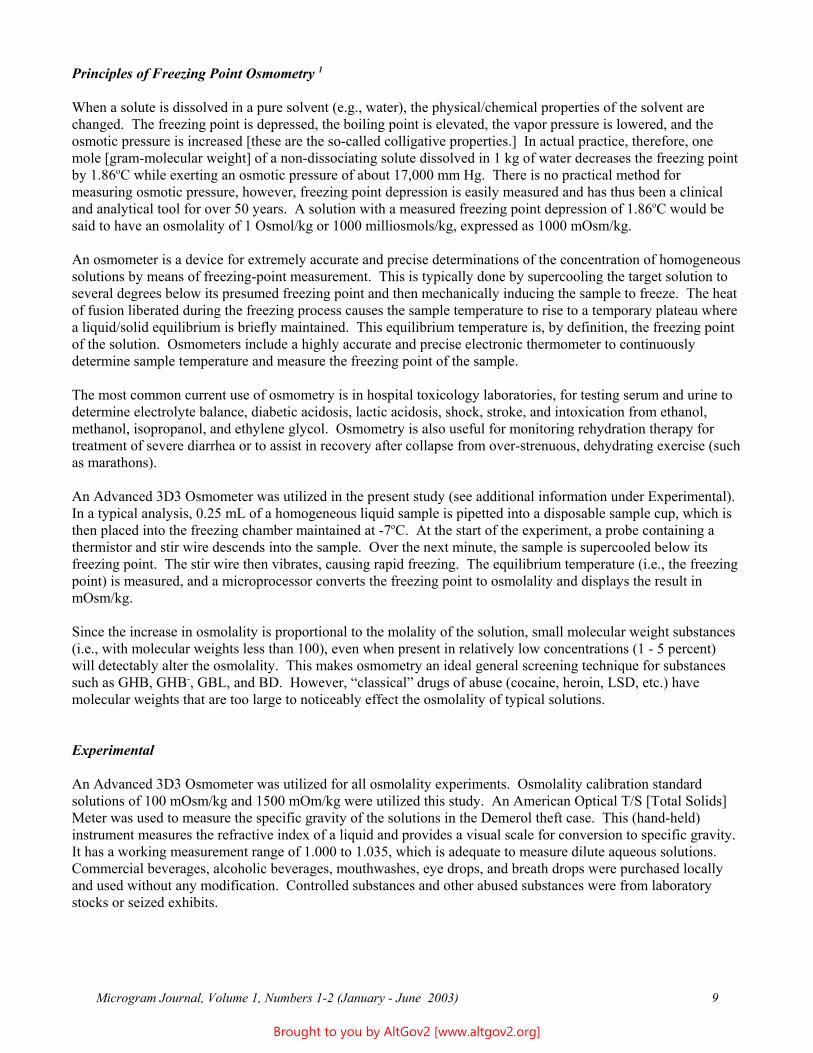
Principles of Freezing Point Osmometry 1
When a solute is dissolved in a pure solvent (e.g., water), the physical/chemical properties of the solvent are changed. The freezing point is depressed, the boiling point is elevated, the vapor pressure is lowered, and the osmotic pressure is increased [these are the so-called colligative properties.] In actual practice, therefore, one mole [gram-molecular weight] of a non-dissociating solute dissolved in 1 kg of water decreases the freezing point by 1.86oC while exerting an osmotic pressure of about 17,000 mm Hg. There is no practical method for measuring osmotic pressure, however, freezing point depression is easily measured and has thus been a clinical and analytical tool for over 50 years. A solution with a measured freezing point depression of 1.86oC would be said to have an osmolality of 1 Osmol/kg or 1000 milliosmols/kg, expressed as 1000 mOsm/kg.
An osmometer is a device for extremely accurate and precise determinations of the concentration of homogeneous solutions by means of freezing-point measurement. This is typically done by supercooling the target solution to several degrees below its presumed freezing point and then mechanically inducing the sample to freeze. The heat of fusion liberated during the freezing process causes the sample temperature to rise to a temporary plateau where a liquid/solid equilibrium is briefly maintained. This equilibrium temperature is, by definition, the freezing point of the solution. Osmometers include a highly accurate and precise electronic thermometer to continuously determine sample temperature and measure the freezing point of the sample.
The most common current use of osmometry is in hospital toxicology laboratories, for testing serum and urine to determine electrolyte balance, diabetic acidosis, lactic acidosis, shock, stroke, and intoxication from ethanol, methanol, isopropanol, and ethylene glycol. Osmometry is also useful for monitoring rehydration therapy for treatment of severe diarrhea or to assist in recovery after collapse from over-strenuous, dehydrating exercise (such as marathons).
An Advanced 3D3 Osmometer was utilized in the present study (see additional information under Experimental). In a typical analysis, 0.25 mL of a homogeneous liquid sample is pipetted into a disposable sample cup, which is then placed into the freezing chamber maintained at -7oC. At the start of the experiment, a probe containing a thermistor and stir wire descends into the sample. Over the next minute, the sample is supercooled below its freezing point. The stir wire then vibrates, causing rapid freezing. The equilibrium temperature (i.e., the freezing point) is measured, and a microprocessor converts the freezing point to osmolality and displays the result in mOsm/kg.
Since the increase in osmolality is proportional to the molality of the solution, small molecular weight substances (i.e., with molecular weights less than 100), even when present in relatively low concentrations (1 - 5 percent) will detectably alter the osmolality. This makes osmometry an ideal general screening technique for substances such as GHB, GHB-, GBL, and BD. However, “classical” drugs of abuse (cocaine, heroin, LSD, etc.) have molecular weights that are too large to noticeably effect the osmolality of typical solutions.
Experimental
An Advanced 3D3 Osmometer was utilized for all osmolality experiments. Osmolality calibration standard solutions of 100 mOsm/kg and 1500 mOm/kg were utilized this study. An American Optical T/S [Total Solids] Meter was used to measure the specific gravity of the solutions in the Demerol theft case. This (hand-held) instrument measures the refractive index of a liquid and provides a visual scale for conversion to specific gravity. It has a working measurement range of 1.000 to 1.035, which is adequate to measure dilute aqueous solutions. Commercial beverages, alcoholic beverages, mouthwashes, eye drops, and breath drops were purchased locally and used without any modification. Controlled substances and other abused substances were from laboratory stocks or seized exhibits.
Microgram Journal, Volume 1, Numbers 1-2 (January - June 2003) 9
Brought to you by AltGov2 [www.altgov2.org]
Advanced 3D3 Osmometer Evaluation: 2
Because most forensic chemists are unfamiliar with osmometry, the following details on the Advanced 3D3 Osmometer utilized in this study are provided as background. This instrument occupies approximately one square foot of counter space and weighs 25 lbs. It is solid state, consumes 150 watts an hour during operation, and has a small volume cooling bath design that allows for calibration and analysis within 15 minutes after powering up. The calibration is stored in RAM if power is disconnected.
The usable measurement range is 0 - 4000 mOsm/kg (more concentrated solutions can be measured after dilution). A full range of calibration standard solutions of known osmolality are supplied and validated by the manufacturer.
The instrument uses disposable 0.25 mL cuvettes (reusable cuvettes are also available). There is no auto-carousel on this model, but higher level models and other manufacturers provide this feature (some can handle up to 30 samples per hour). A typical experiment takes 2-3 minutes start to finish, and uses 0.25 mL sample. The sample is not destroyed by the osmolality analysis, and can be thawed and reanalyzed.
Results and Discussion
Linearity
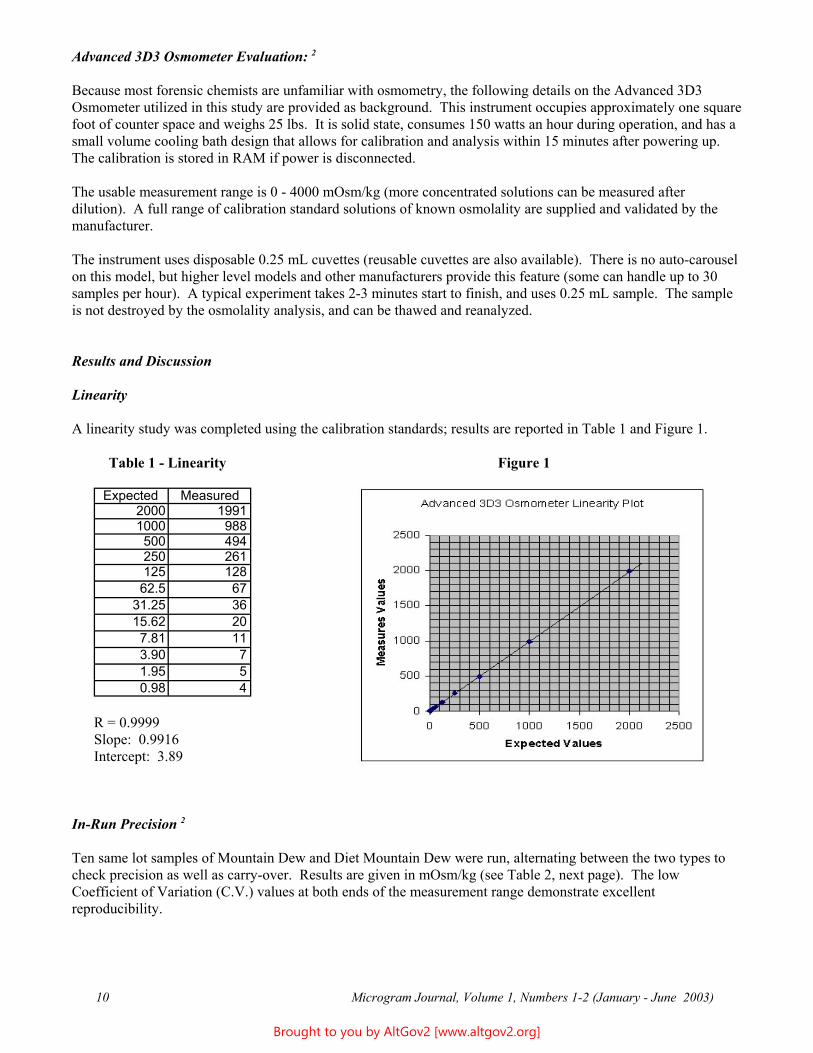
A linearity study was completed using the calibration standards; results are reported in Table 1 and Figure 1.
Table 1 - Linearity Figure 1
Expected Measured 2000 1991 1000 988 500 494 250 261 125 128 62.5 67
31.25 36 15.62 20 7.81 11 3.90 7 1.95 5 0.98 4
R = 0.9999 Slope: 0.9916 Intercept: 3.89
In-Run Precision 2
Ten same lot samples of Mountain Dew and Diet Mountain Dew were run, alternating between the two types to check precision as well as carry-over. Results are given in mOsm/kg (see Table 2, next page). The low Coefficient of Variation (C.V.) values at both ends of the measurement range demonstrate excellent reproducibility.
Microgram Journal, Volume 1, Numbers 1-2 (January - June 2003) 10
Brought to you by AltGov2 [www.altgov2.org]
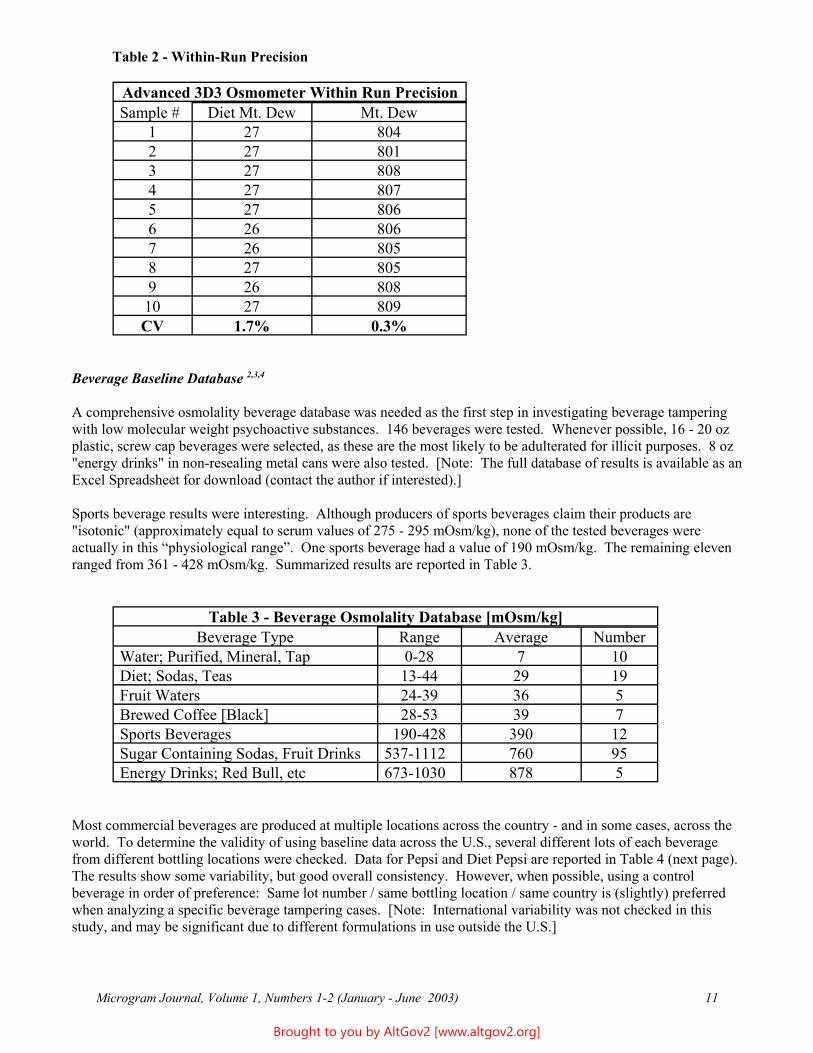
Table 2 - Within-Run Precision
Advanced 3D3 Osmometer Within Run Precision Sample # Diet Mt. Dew Mt. Dew
1 27 804 2 27 801 3 27 808 4 27 807 5 27 806 6 26 806 7 26 805 8 27 805 9 26 808 10 27 809 CV 1.7% 0.3%
Beverage Baseline Database 2,3,4
A comprehensive osmolality beverage database was needed as the first step in investigating beverage tampering with low molecular weight psychoactive substances. 146 beverages were tested. Whenever possible, 16 - 20 oz plastic, screw cap beverages were selected, as these are the most likely to be adulterated for illicit purposes. 8 oz "energy drinks" in non-resealing metal cans were also tested. [Note: The full database of results is available as an Excel Spreadsheet for download (contact the author if interested).]
Sports beverage results were interesting. Although producers of sports beverages claim their products are "isotonic" (approximately equal to serum values of 275 - 295 mOsm/kg), none of the tested beverages were actually in this “physiological range”. One sports beverage had a value of 190 mOsm/kg. The remaining eleven ranged from 361 - 428 mOsm/kg. Summarized results are reported in Table 3.
Table 3 - Beverage Osmolality Database [mOsm/kg] Beverage Type Range Average Number
Water; Purified, Mineral, Tap 0-28 7 10 Diet; Sodas, Teas 13-44 29 19 Fruit Waters 24-39 36 5 Brewed Coffee [Black] 28-53 39 7 Sports Beverages 190-428 390 12 Sugar Containing Sodas, Fruit Drinks 537-1112 760 95 Energy Drinks; Red Bull, etc 673-1030 878 5
Most commercial beverages are produced at multiple locations across the country - and in some cases, across the world. To determine the validity of using baseline data across the U.S., several different lots of each beverage from different bottling locations were checked. Data for Pepsi and Diet Pepsi are reported in Table 4 (next page). The results show some variability, but good overall consistency. However, when possible, using a control beverage in order of preference: Same lot number / same bottling location / same country is (slightly) preferred when analyzing a specific beverage tampering cases. [Note: International variability was not checked in this study, and may be significant due to different formulations in use outside the U.S.]
Microgram Journal, Volume 1, Numbers 1-2 (January - June 2003) 11
Brought to you by AltGov2 [www.altgov2.org]
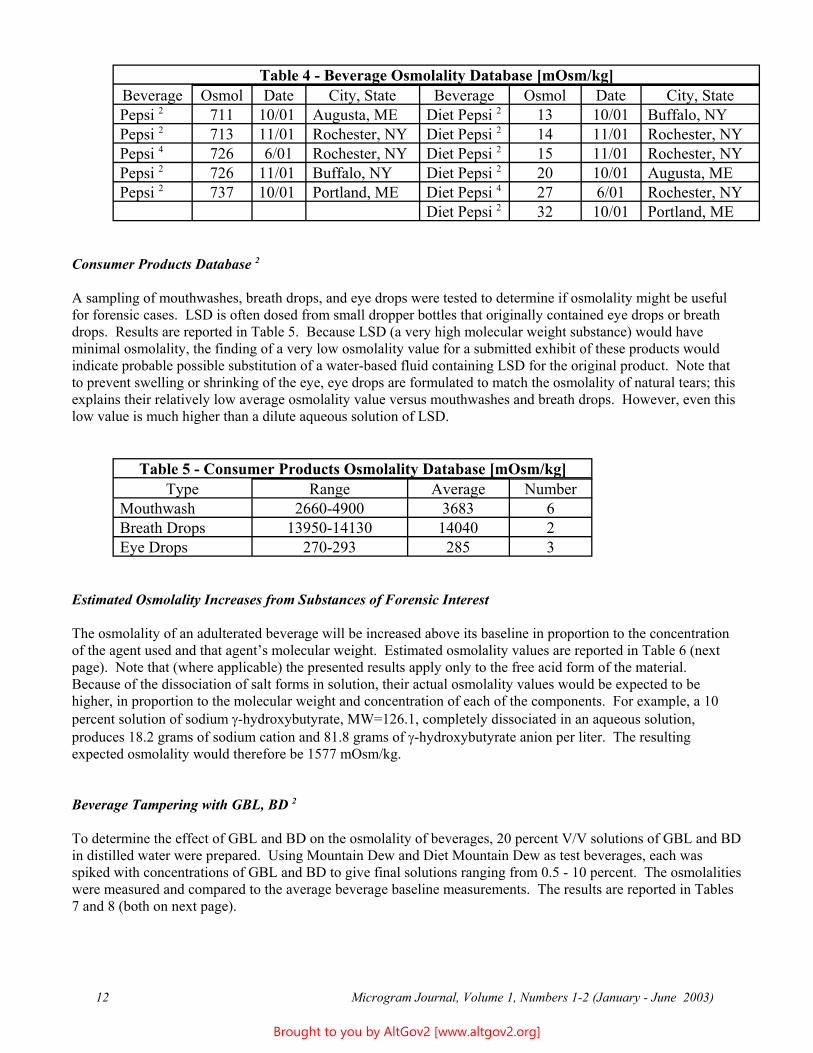
Table 4 - Beverage Osmolality Database [mOsm/kg] Beverage Osmol Date City, State Beverage Osmol Date City, State Pepsi 2 711 10/01 Augusta, ME Diet Pepsi 2 13 10/01 Buffalo, NY Pepsi 2 713 11/01 Rochester, NY Diet Pepsi 2 14 11/01 Rochester, NY Pepsi 4 726 6/01 Rochester, NY Diet Pepsi 2 15 11/01 Rochester, NY Pepsi 2 726 11/01 Buffalo, NY Diet Pepsi 2 20 10/01 Augusta, ME Pepsi 2 737 10/01 Portland, ME Diet Pepsi 4 27 6/01 Rochester, NY
Diet Pepsi 2 32 10/01 Portland, ME
Consumer Products Database 2
A sampling of mouthwashes, breath drops, and eye drops were tested to determine if osmolality might be useful for forensic cases. LSD is often dosed from small dropper bottles that originally contained eye drops or breath drops. Results are reported in Table 5. Because LSD (a very high molecular weight substance) would have minimal osmolality, the finding of a very low osmolality value for a submitted exhibit of these products would indicate probable possible substitution of a water-based fluid containing LSD for the original product. Note that to prevent swelling or shrinking of the eye, eye drops are formulated to match the osmolality of natural tears; this explains their relatively low average osmolality value versus mouthwashes and breath drops. However, even this low value is much higher than a dilute aqueous solution of LSD.
Table 5 - Consumer Products Osmolality Database [mOsm/kg] Type Range Average Number
Mouthwash 2660-4900 3683 6 Breath Drops 13950-14130 14040 2 Eye Drops 270-293 285 3
Estimated Osmolality Increases from Substances of Forensic Interest
The osmolality of an adulterated beverage will be increased above its baseline in proportion to the concentration of the agent used and that agent’s molecular weight. Estimated osmolality values are reported in Table 6 (next page). Note that (where applicable) the presented results apply only to the free acid form of the material. Because of the dissociation of salt forms in solution, their actual osmolality values would be expected to be higher, in proportion to the molecular weight and concentration of each of the components. For example, a 10 percent solution of sodium γ-hydroxybutyrate, MW=126.1, completely dissociated in an aqueous solution, produces 18.2 grams of sodium cation and 81.8 grams of γ-hydroxybutyrate anion per liter. The resulting expected osmolality would therefore be 1577 mOsm/kg.
Beverage Tampering with GBL, BD 2
To determine the effect of GBL and BD on the osmolality of beverages, 20 percent V/V solutions of GBL and BD in distilled water were prepared. Using Mountain Dew and Diet Mountain Dew as test beverages, each was spiked with concentrations of GBL and BD to give final solutions ranging from 0.5 - 10 percent. The osmolalities were measured and compared to the average beverage baseline measurements. The results are reported in Tables 7 and 8 (both on next page).
Microgram Journal, Volume 1, Numbers 1-2 (January - June 2003) 12
Brought to you by AltGov2 [www.altgov2.org]
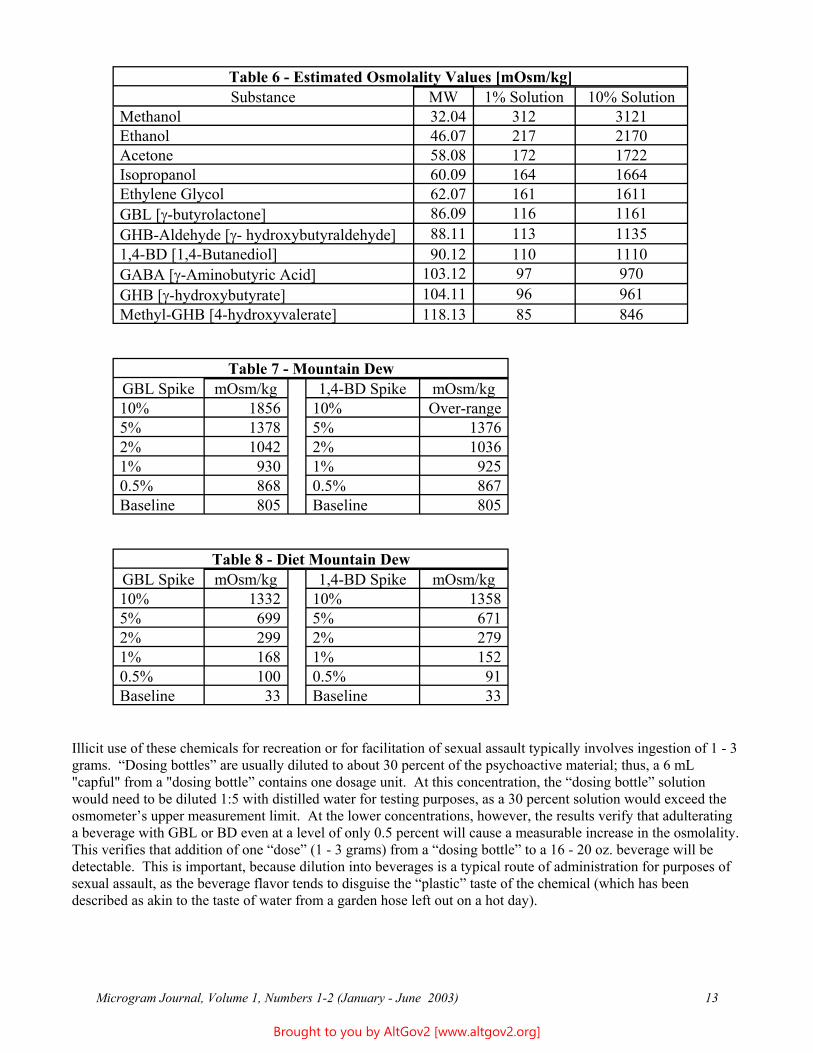
Table 6 - Estimated Osmolality Values [mOsm/kg] Substance MW 1% Solution 10% Solution
Methanol 32.04 312 3121 Ethanol 46.07 217 2170 Acetone 58.08 172 1722 Isopropanol 60.09 164 1664 Ethylene Glycol 62.07 161 1611 GBL [γ-butyrolactone] 86.09 116 1161 GHB-Aldehyde [γ- hydroxybutyraldehyde] 88.11 113 1135 1,4-BD [1,4-Butanediol] 90.12 110 1110 GABA [γ-Aminobutyric Acid] 103.12 97 970 GHB [γ-hydroxybutyrate] 104.11 96 961 Methyl-GHB [4-hydroxyvalerate] 118.13 85 846
Table 7 - Mountain Dew GBL Spike mOsm/kg 1,4-BD Spike mOsm/kg 10% 1856 10% Over-range 5% 1378 5% 1376 2% 1042 2% 1036 1% 930 1% 925 0.5% 868 0.5% 867 Baseline 805 Baseline 805
Table 8 - Diet Mountain Dew GBL Spike mOsm/kg 1,4-BD Spike mOsm/kg 10% 1332 10% 1358 5% 699 5% 671 2% 299 2% 279 1% 168 1% 152 0.5% 100 0.5% 91 Baseline 33 Baseline 33
Illicit use of these chemicals for recreation or for facilitation of sexual assault typically involves ingestion of 1 - 3 grams. “Dosing bottles” are usually diluted to about 30 percent of the psychoactive material; thus, a 6 mL "capful" from a "dosing bottle” contains one dosage unit. At this concentration, the “dosing bottle” solution would need to be diluted 1:5 with distilled water for testing purposes, as a 30 percent solution would exceed the osmometer’s upper measurement limit. At the lower concentrations, however, the results verify that adulterating a beverage with GBL or BD even at a level of only 0.5 percent will cause a measurable increase in the osmolality. This verifies that addition of one “dose” (1 - 3 grams) from a “dosing bottle” to a 16 - 20 oz. beverage will be detectable. This is important, because dilution into beverages is a typical route of administration for purposes of sexual assault, as the beverage flavor tends to disguise the “plastic” taste of the chemical (which has been described as akin to the taste of water from a garden hose left out on a hot day).
Microgram Journal, Volume 1, Numbers 1-2 (January - June 2003) 13
Brought to you by AltGov2 [www.altgov2.org]
Ethanol in Soda-Type Beverages 2
Numerous reports have indicated that some high school students occasionally "spike" their lunch beverages with alcoholic beverages. We therefore investigated the effect of ethanol on beverage osmolality. One oz [30 mL] of 80 proof vodka was added to 20 oz [590 mL] bottles of Mountain Dew and Diet Mountain Dew. Vodka was selected because it has almost no odor, and it is therefore the alcoholic beverage of choice for surreptitious adulteration by underage drinkers. One oz was selected as the minimum amount of alcohol that would probably be used, as being equivalent to one mixed bar drink. Actual adulteration amounts would likely be higher. The results are as follows:
Mountain Dew: Baseline - 807 mOsm/kg, With Vodka Spike - 1174 mOsm/kg Diet Mountain Dew: Baseline - 26 mOsm/kg, With Vodka Spike - 332 mOsm/kg
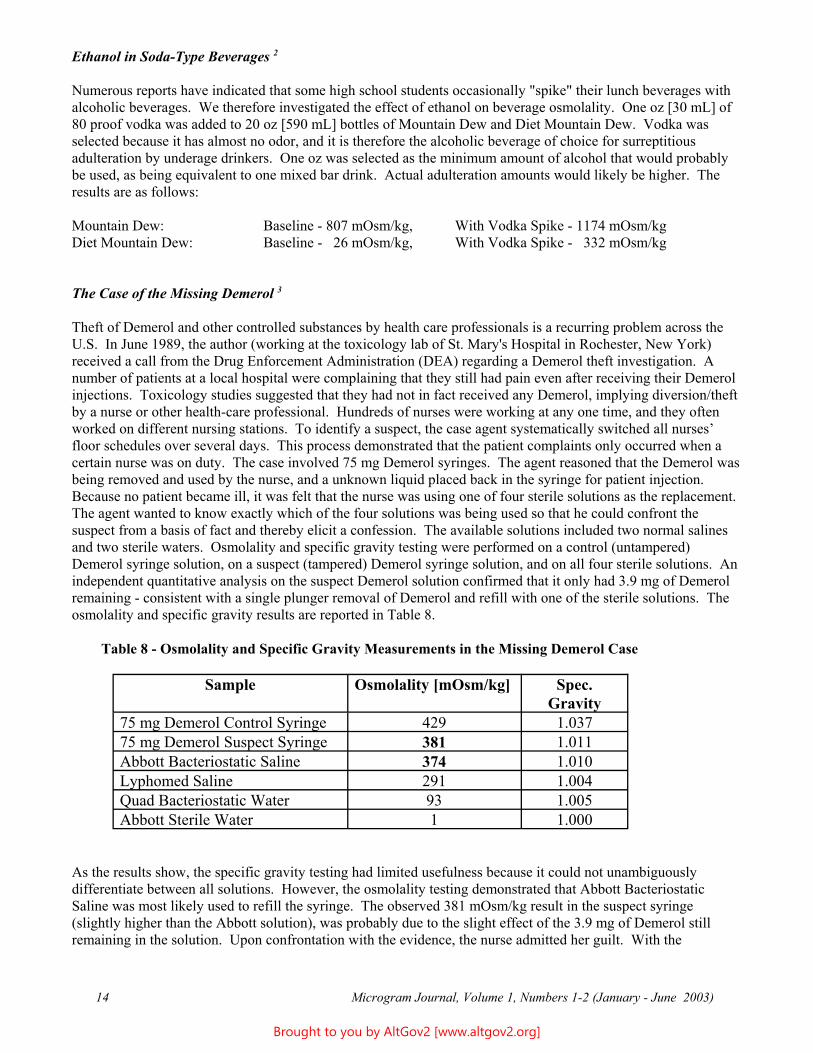
The Case of the Missing Demerol 3
Theft of Demerol and other controlled substances by health care professionals is a recurring problem across the U.S. In June 1989, the author (working at the toxicology lab of St. Mary's Hospital in Rochester, New York) received a call from the Drug Enforcement Administration (DEA) regarding a Demerol theft investigation. A number of patients at a local hospital were complaining that they still had pain even after receiving their Demerol injections. Toxicology studies suggested that they had not in fact received any Demerol, implying diversion/theft by a nurse or other health-care professional. Hundreds of nurses were working at any one time, and they often worked on different nursing stations. To identify a suspect, the case agent systematically switched all nurses’ floor schedules over several days. This process demonstrated that the patient complaints only occurred when a certain nurse was on duty. The case involved 75 mg Demerol syringes. The agent reasoned that the Demerol was being removed and used by the nurse, and a unknown liquid placed back in the syringe for patient injection. Because no patient became ill, it was felt that the nurse was using one of four sterile solutions as the replacement. The agent wanted to know exactly which of the four solutions was being used so that he could confront the suspect from a basis of fact and thereby elicit a confession. The available solutions included two normal salines and two sterile waters. Osmolality and specific gravity testing were performed on a control (untampered) Demerol syringe solution, on a suspect (tampered) Demerol syringe solution, and on all four sterile solutions. An independent quantitative analysis on the suspect Demerol solution confirmed that it only had 3.9 mg of Demerol remaining - consistent with a single plunger removal of Demerol and refill with one of the sterile solutions. The osmolality and specific gravity results are reported in Table 8.
Table 8 - Osmolality and Specific Gravity Measurements in the Missing Demerol Case
Sample Osmolality [mOsm/kg] Spec. Gravity
75 mg Demerol Control Syringe 429 1.037 75 mg Demerol Suspect Syringe 381 1.011 Abbott Bacteriostatic Saline 374 1.010 Lyphomed Saline 291 1.004 Quad Bacteriostatic Water 93 1.005 Abbott Sterile Water 1 1.000
As the results show, the specific gravity testing had limited usefulness because it could not unambiguously differentiate between all solutions. However, the osmolality testing demonstrated that Abbott Bacteriostatic Saline was most likely used to refill the syringe. The observed 381 mOsm/kg result in the suspect syringe (slightly higher than the Abbott solution), was probably due to the slight effect of the 3.9 mg of Demerol still remaining in the solution. Upon confrontation with the evidence, the nurse admitted her guilt. With the
Microgram Journal, Volume 1, Numbers 1-2 (January - June 2003) 14
Brought to you by AltGov2 [www.altgov2.org]
exception of osmolality, no other laboratory method available at that time could have been employed to differentiate between different brands of saline and water. Osmolality would clearly be a useful technique for similar, current cases of controlled substance thefts from hospitals, pharmacies, doctors’ offices, and similar stocks.
Additional Potential Forensic Applications
Identification of Sugar-Based Beverages Substituted for Diet Beverages 2,4
The accidental or purposeful substitution of a sugar-based beverage for a diet (sugarless) beverage can be harmful to a diabetic individual. Several different lots of Pepsi and Diet Pepsi were tested to determine if it would be possible to differentiate the sugar based beverage from the diet beverage. The results are as follows:
Pepsi: 711-737 mOsm/kg (n=5) Diet Pepsi: 13-32 mOsm/kg (n=6)
Although only 11 different lots were tested, there is clearly enough difference between the two types of beverages to allow a reasonable determination of diet versus sugar-based.
Poisoning of Domestic Pets’ Water with Ethylene Glycol
Dogs and cats are very sensitive to the poisonous effects of antifreeze (which contains ethylene glycol). Fatal amounts are 1.4 mL/kg for cats and 6.6 mL/kg for dogs 5. The sweet odor and taste of ethylene glycol makes it very attractive to animals, and it is therefore a particularly insidious poison. Osmolality is a very useful initial screen for suspect solutions in that it will detect the presence of ethylene glycol (and also other alcohols) at very low levels in water. Based on ethylene glycol's molecular weight of 62.02, a 1 percent solution in water would read 161 mOsm/kg, versus a typical tap water value of approximately 3 mOsm/kg.
Identification of Water 2,3,4
Water is submitted on occasion to crime laboratories. Although osmolality cannot detect the presence of large molecular weight compounds in water at low concentrations [i.e., most “classic” street drugs], it is an excellent tool to identify that a submitted solution is water. Most waters tested ranged from 0 - 8 mOsm/kg. Only high-mineral content spring waters had higher values, up to 28 mOsm/kg. Non-water solvents will not freeze and no result will be obtained. Any polar solvent mixed into water will greatly increase its osmolality. Acids and bases that have been added to the water will increase the osmolality and also give a pH change. For example, a solution of 1 mL of Chlorox [5 percent hypochlorite] in 100 mL of distilled water, has a pH of 10.5 and an osmolality of 43 mOsm/kg. A solution of 1 mL of 12N HCl in 100 mL of distilled water has a pH of 1.0 and an osmolality of 243 mOsm/kg. A 1 percent solution of ethanol in distilled water has a osmolality of 158 mOsm/kg.
Field Testing
With results available within 15 minutes after plug-in, on only 0.25 mL of sample, the Advanced 3D3 Osmometer instrument used in this study (or any equivalent osmometer) can be easily adapted for field testing at large concert events from police D.U.I. vans. This would allow rapid beverage screening before submission of case samples to the crime lab.
Microgram Journal, Volume 1, Numbers 1-2 (January - June 2003) 15
Brought to you by AltGov2 [www.altgov2.org]
Limitations
“Date-Rape” Benzodiazepines in Solution 2
As previously mentioned, the high molecular weight of common “classic” street drugs, and their low concentration in submitted solutions, makes osmolality an ineffective screening tool for their identification. For example, a single methylphenidate (Ritalin) tablet containing 5 mg of active drug and weighing 91 mg, produced a measured osmolality of only 11 mOsm/kg when dissolved in 30 mL distilled water. Therefore, osmolality is not viable for detection of drink tampering with, e.g., flunitrazepam (Rohypnol) or other sedative benzodiazepines that are employed for drug facilitated sexual assault.
Urine in Beverages 6
Beverages are occasionally maliciously adulterated with urine. The osmolality of an individual's urine varies widely [50 - 1400 mOsm/kg] and greatly depends on the person’s degree of hydration. Urea, the compound of highest concentration in the urine, varies from 0.7 - 3.3 g/100 mL, and is a better indicator of tampering than osmolality. Although a typical random urine volume of 4 - 8 oz [118 - 237 mL] may be produced, let us assume 1 oz [30 mL] was introduced into a 50 oz pot of coffee[1480 mL]. The resulting urea levels would be 14 - 67 mg/100 mL. This is easily measured with a typical urea analysis method, which usually have a dynamic range of 2 - 212 mg/100 mL.
Saliva in Beverages 3
Similarly, beverages are occasionally maliciously adulterated with saliva. Amylase, which is present in very high levels in saliva [20,000 units/100 mL], is a better indicator of beverage adulteration with saliva versus osmolality. A typical 0.5 mL “spit” volume in an 8 oz [237 mL] cup of coffee would result in a measured amylase of 422 units/100 mL. This is easily measured with an amylase method having a dynamic range of 1-200 units/100 mL.
Conclusions
With ever increasing case loads and limited personnel resources, crime laboratories need efficient new tools to process the disturbing increases in liquid sample submissions. Osmolality, an effective analytical tool of the hospital laboratory and food and consumer products industries, is a low cost, rapid, facile, and non-destructive screening tool for forensic chemists and toxicologists.
Acknowledgements
Special thanks to Don Wiggin from Advanced Instruments for the loan of the 3D3 osmometer, and to the Rochester Institute of Technology and Drug ID Systems for providing the samples for testing.
References
1. The Advanced Osmometer Model 3D3 User's Guide, Advanced Instruments Inc, Norwood, MA (2000).
2. J. Wesley, Unpublished Data, Drug ID Systems, Inc., Rochester, NY using an Advanced 3D3 Osmometer (2001).
Microgram Journal, Volume 1, Numbers 1-2 (January - June 2003) 16
Brought to you by AltGov2 [www.altgov2.org]
3. J. Wesley, Unpublished Data, St. Mary's Hospital Toxicology Lab, Rochester, NY using an Advanced 3D2 Osmometer (1985-1990).
4. T. Senosi, Rochester Institute of Technology, Rochester, NY using an Advanced Wide Range 3W2 Osmometer (2000-2001).
5. L. Tilley, The Five Minute Veterinary Consultant, 2nd Ed. (2000).
6. N. Tietz, Fundamentals of Clinical Chemistry, 3rd Ed, W.B. Saunders Co. p. 961 (1987).
* * * * *
Microgram Journal, Volume 1, Numbers 1-2 (January - June 2003) 17
Brought to you by AltGov2 [www.altgov2.org]
Psychotria Viridis - A Botanical Source of Dimethyltryptamine (DMT)
Robert D. Blackledge, M.S.* Naval Criminal Investigative Service Regional Forensic Laboratory
3405 Welles Street, Suite 3 San Diego, CA 92136-5018
[e-mail: [email protected]]
Charlotte M. Taylor, Ph.D. Missouri Botanical Garden
P.O. Box 299 St. Louis, MO 63166-0299
[e-mail: [email protected]]
ABSTRACT: Dimethyltryptamine was identified by GC/MS in a sample of dried leafy material that was subsequently identified as Psychotria viridis (Rubiaceae), a tropical shrub native to Central and South America that has ethnobotanical use as a hallucinogen by many indigenous peoples of tropical South America. The botanical characteristics of Psychotria viridis are illustrated and described.
KEYWORDS: Psychotria viridis, Dimethyltryptamine, DMT, Banisteriopsis caapi, Ayahuasca
Introduction
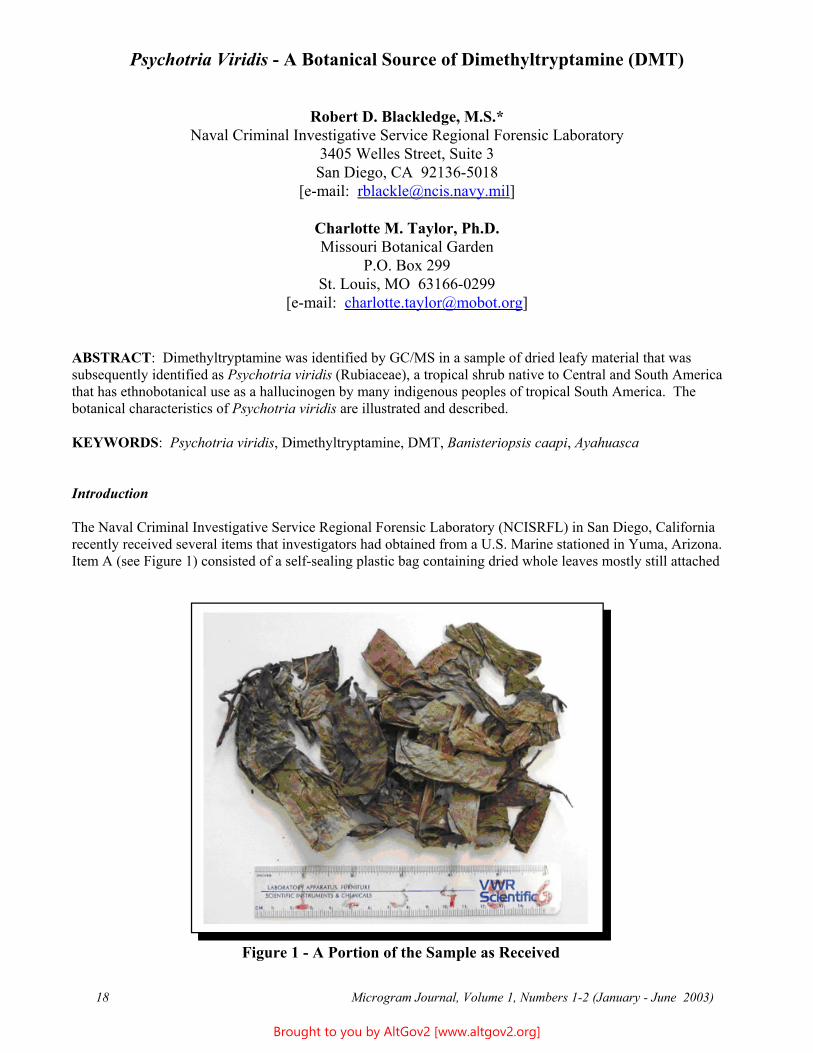
The Naval Criminal Investigative Service Regional Forensic Laboratory (NCISRFL) in San Diego, California recently received several items that investigators had obtained from a U.S. Marine stationed in Yuma, Arizona. Item A (see Figure 1) consisted of a self-sealing plastic bag containing dried whole leaves mostly still attached
Figure 1 - A Portion of the Sample as Received
Microgram Journal, Volume 1, Numbers 1-2 (January - June 2003) 18
Brought to you by AltGov2 [www.altgov2.org]
to stem pieces. Analysis by macro and microscopic examination indicated that the material clearly was not marijuana, nor were there any visible signs that anything had been added to the leaves.
Experimental
Approximately 1 gram of dried leaf material was placed in a glass beaker and covered with about 3 mLs of methanol. The beaker was then heated on a hot plate in a fume hood. When the methanol volume had been reduced to about 0.5 mL, the beaker was removed from the hot plate and 1:L of the remaining extract was injected into a Hewlett-Packard 5890 Gas Chromatograph (Palo Alto, CA) equipped with a 5971 Mass Selective Detector and fitted with an HP-1 capillary column (crosslinked methyl silicone, 20 m x 0.25 mm i.d. x 2.65 :m film thickness). The column oven temperature was programmed from an initial temperature of 70/ C (held for 2 min) to 200/ C at 10/ C/min, then held at 200/ C for the final 2 minutes.
Results
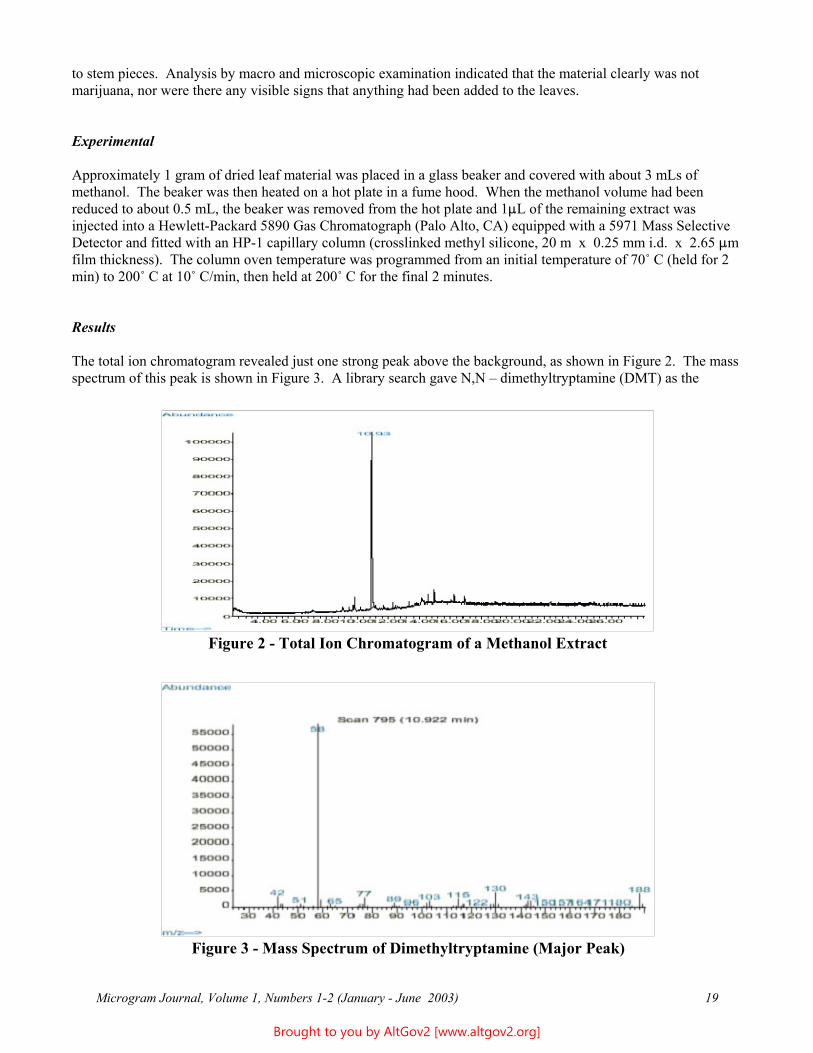
The total ion chromatogram revealed just one strong peak above the background, as shown in Figure 2. The mass spectrum of this peak is shown in Figure 3. A library search gave N,N – dimethyltryptamine (DMT) as the
Figure 2 - Total Ion Chromatogram of a Methanol Extract
Figure 3 - Mass Spectrum of Dimethyltryptamine (Major Peak)
Microgram Journal, Volume 1, Numbers 1-2 (January - June 2003) 19
Brought to you by AltGov2 [www.altgov2.org]
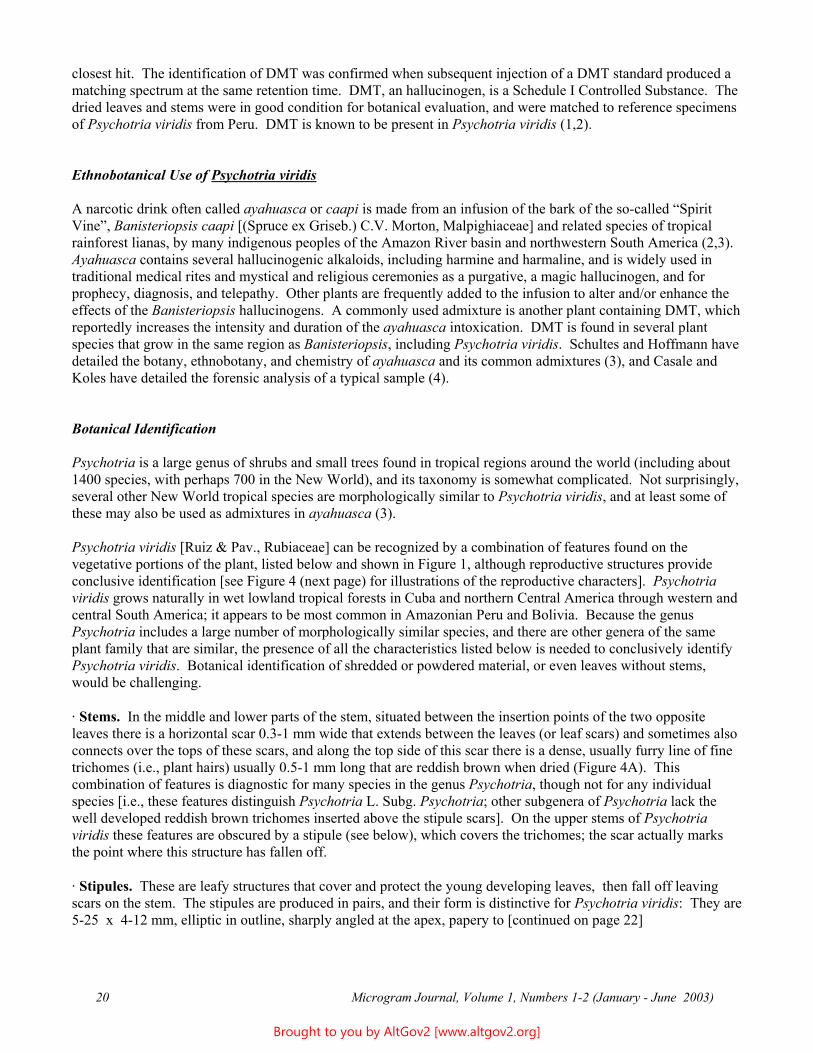
closest hit. The identification of DMT was confirmed when subsequent injection of a DMT standard produced a matching spectrum at the same retention time. DMT, an hallucinogen, is a Schedule I Controlled Substance. The dried leaves and stems were in good condition for botanical evaluation, and were matched to reference specimens of Psychotria viridis from Peru. DMT is known to be present in Psychotria viridis (1,2).
Ethnobotanical Use of Psychotria viridis
A narcotic drink often called ayahuasca or caapi is made from an infusion of the bark of the so-called “Spirit Vine”, Banisteriopsis caapi [(Spruce ex Griseb.) C.V. Morton, Malpighiaceae] and related species of tropical rainforest lianas, by many indigenous peoples of the Amazon River basin and northwestern South America (2,3). Ayahuasca contains several hallucinogenic alkaloids, including harmine and harmaline, and is widely used in traditional medical rites and mystical and religious ceremonies as a purgative, a magic hallucinogen, and for prophecy, diagnosis, and telepathy. Other plants are frequently added to the infusion to alter and/or enhance the effects of the Banisteriopsis hallucinogens. A commonly used admixture is another plant containing DMT, which reportedly increases the intensity and duration of the ayahuasca intoxication. DMT is found in several plant species that grow in the same region as Banisteriopsis, including Psychotria viridis. Schultes and Hoffmann have detailed the botany, ethnobotany, and chemistry of ayahuasca and its common admixtures (3), and Casale and Koles have detailed the forensic analysis of a typical sample (4).
Botanical Identification
Psychotria is a large genus of shrubs and small trees found in tropical regions around the world (including about 1400 species, with perhaps 700 in the New World), and its taxonomy is somewhat complicated. Not surprisingly, several other New World tropical species are morphologically similar to Psychotria viridis, and at least some of these may also be used as admixtures in ayahuasca (3).
Psychotria viridis [Ruiz & Pav., Rubiaceae] can be recognized by a combination of features found on the vegetative portions of the plant, listed below and shown in Figure 1, although reproductive structures provide conclusive identification [see Figure 4 (next page) for illustrations of the reproductive characters]. Psychotria viridis grows naturally in wet lowland tropical forests in Cuba and northern Central America through western and central South America; it appears to be most common in Amazonian Peru and Bolivia. Because the genus Psychotria includes a large number of morphologically similar species, and there are other genera of the same plant family that are similar, the presence of all the characteristics listed below is needed to conclusively identify Psychotria viridis. Botanical identification of shredded or powdered material, or even leaves without stems, would be challenging.
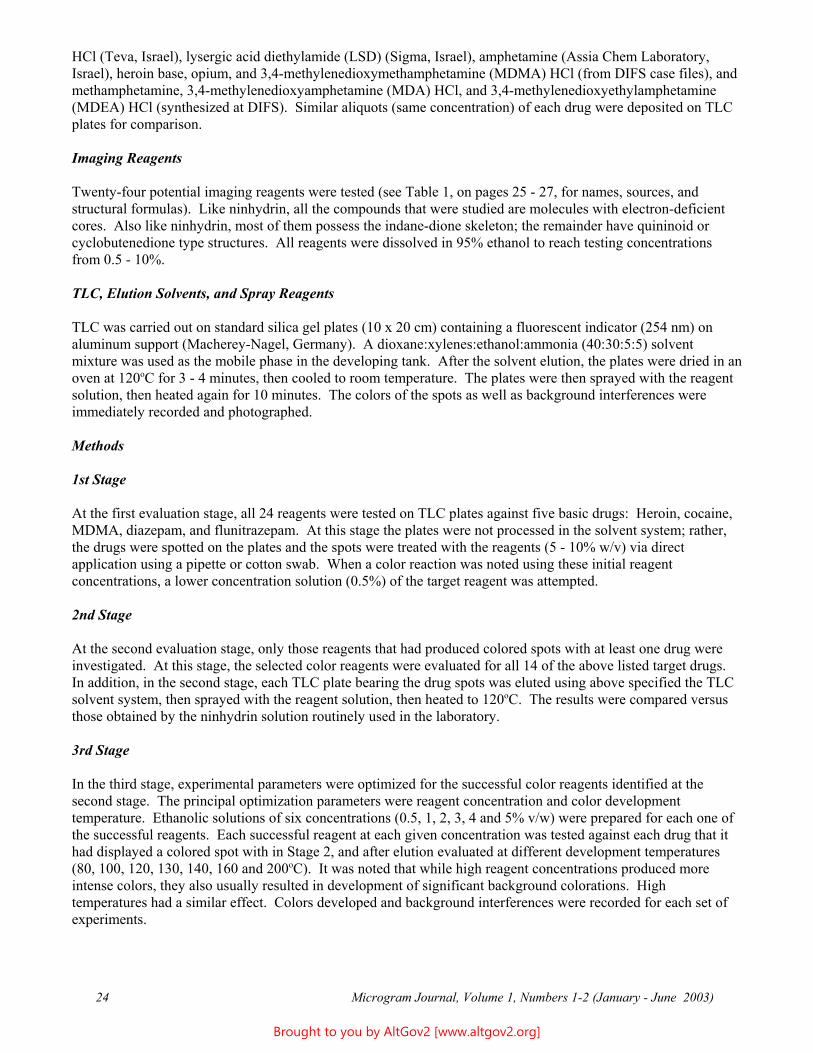
A Stems. In the middle and lower parts of the stem, situated between the insertion points of the two opposite leaves there is a horizontal scar 0.3-1 mm wide that extends between the leaves (or leaf scars) and sometimes also connects over the tops of these scars, and along the top side of this scar there is a dense, usually furry line of fine trichomes (i.e., plant hairs) usually 0.5-1 mm long that are reddish brown when dried (Figure 4A). This combination of features is diagnostic for many species in the genus Psychotria, though not for any individual species [i.e., these features distinguish Psychotria L. Subg. Psychotria; other subgenera of Psychotria lack the well developed reddish brown trichomes inserted above the stipule scars]. On the upper stems of Psychotria viridis these features are obscured by a stipule (see below), which covers the trichomes; the scar actually marks the point where this structure has fallen off.
A Stipules. These are leafy structures that cover and protect the young developing leaves, then fall off leaving scars on the stem. The stipules are produced in pairs, and their form is distinctive for Psychotria viridis: They are 5-25 x 4-12 mm, elliptic in outline, sharply angled at the apex, papery to [continued on page 22]
Microgram Journal, Volume 1, Numbers 1-2 (January - June 2003) 20
Brought to you by AltGov2 [www.altgov2.org]
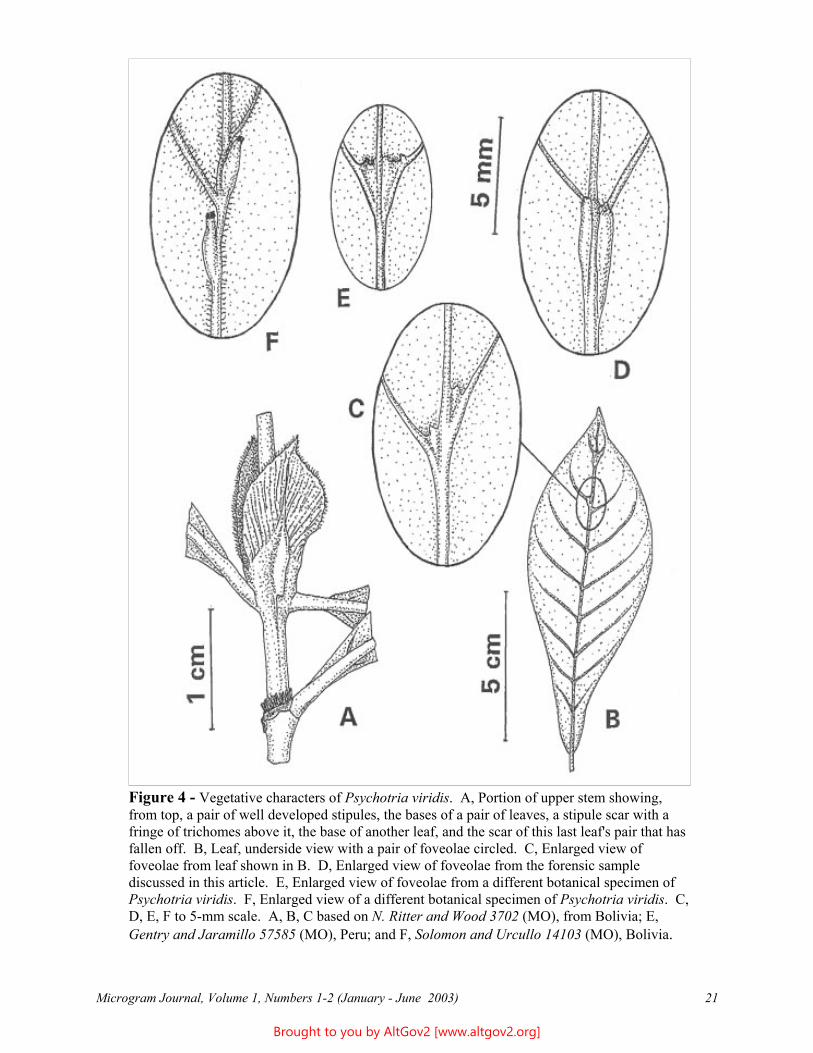
Figure 4 - Vegetative characters of Psychotria viridis. A, Portion of upper stem showing, from top, a pair of well developed stipules, the bases of a pair of leaves, a stipule scar with a fringe of trichomes above it, the base of another leaf, and the scar of this last leaf's pair that has fallen off. B, Leaf, underside view with a pair of foveolae circled. C, Enlarged view of foveolae from leaf shown in B. D, Enlarged view of foveolae from the forensic sample discussed in this article. E, Enlarged view of foveolae from a different botanical specimen of Psychotria viridis. F, Enlarged view of a different botanical specimen of Psychotria viridis. C, D, E, F to 5-mm scale. A, B, C based on N. Ritter and Wood 3702 (MO), from Bolivia; E, Gentry and Jaramillo 57585 (MO), Peru; and F, Solomon and Urcullo 14103 (MO), Bolivia.
Microgram Journal, Volume 1, Numbers 1-2 (January - June 2003) 21
Brought to you by AltGov2 [www.altgov2.org]
membranaceous in texture, ciliate (i.e., fringed) along the upper margins, and longitudinally flanged or winged along the middle (Figure 4A). However, stipule shape and size is quite variable among different plants, and also depends on the stipule's developmental stage and other factors such as whether the stem that produced it is reproductive or vegetative.
A Leaves. These (Figure 4B) are opposite in arrangement (i.e., produced in pairs along the stems), generally 5-15 x 2-6 cm, in outline generally elliptic or often widest above the middle, usually sharply angled at base and apex, papery in texture, overall smooth or infrequently with microscropic plant hairs on the lower surface, have 5-10 pairs of secondary veins, and on the lower surface usually have foveolae (see next item). The leaves are borne on petioles (i.e., leaf stalks) generally 1-10 mm long. When dry, the leaves of Psychotria viridis usually are gray or reddish brown. The leaves of Psychotria viridis are similar to a few other New World species of Psychotria.
A Foveolae. These are small pockets found on the lower leaf surface near the junction of the secondary (i.e., side) veins with the central vein. They function as shelter for tiny invertebrates such as mites that live on the plant leaf. These mites apparently often are symbiotic with the plant, taking shelter in these structures and eating fungi and herbivorous invertebrates that can damage the leaf. The foveolae (also called domatia) are distinctive for Psychotria viridis and a few related species: They are generally 1.5-5 mm long and 0.5-1 mm wide at the top, conical and tapered to a closed base, open and truncate or variously ornamented at the top, and situated along the sides of the central vein with the opening usually near a secondary vein (Figure 4C). These foveolae vary in shape among different plants (Figure 4C, 4D, 4E, 4F), and in number on individual leaves, and may not even be present on some leaves. Most often each leaf bears at least one pair of foveolae, which may be close to the apex; the foveolae are often more numerous on leaves from vegetative stems than on those from reproductive stems.
Conclusions
How does a U.S. Marine obtain plant material that grows in the Amazon basin? The suspect refused to cooperate, but an Internet sales contact was the most likely source. Psychotria viridis leaves in various forms (whole, broken, finely powdered, shredded) reportedly exported from Peru are offered for sale on the Internet.
References
1. Bruneton J. Pharmacognosy Phytochemistry Medicinal Plants, 2nd. ed. Lavoisier Publishing Inc. (c/o Springer-Verlag), Secaucus, NJ, 1999 (transl. C.K. Hatton).
2. Duke JA, Vásquez, R. Amazonian Ethnobotanical Dictionary. CRC Press, Boca Raton, FL, 1994.
3. Schultes RE, Hoffmann A. The Botany and Chemistry of Hallucinogens, 2nd ed. Charles C. Thomas, Springfield, IL, 1980.
4. Casale JF, Koles JE. Analysis of ayahuasca (‘Santo Daime’). Microgram 1995;28(9):296.
Microgram Journal, Volume 1, Numbers 1-2 (January - June 2003) 22
Brought to you by AltGov2 [www.altgov2.org]
Evaluation of Ninhydrin Analogues and Other Electron-Deficient Compounds as Spray Reagents for Drugs on Thin Layer Chromatograms
Myriam Azoury*, Avraham Zelkowicz, and Zafrir Goren Division of Identification and Forensic Sciences
Analytical Chemistry Laboratory Israel Police National Headquarters
Jerusalem 91906, Israel [email: [email protected]]
Joseph Almog Casali Institute of Applied Chemistry
The Hebrew University of Jerusalem, Israel
ABSTRACT: Twenty-four electron-deficient compounds were evaluated as potential spray color-reagents for basic drugs on TLC plates. Two of them, 4-chloro-7-nitro-2,1,3-benzoxadiazole and 5,6-dimethoxyninhydrin, were superior to ninhydrin with respect to sensitivity and selectivity, and offer considerable potential.
KEYWORDS: Thin Layer Chromatography, TLC, Spray Reagents, Ninhydrin, Illicit Drugs
Introduction
Since the discovery by Dutt and Teo1 that spraying thin layer chromatographic (TLC) plates bearing drug spots with ninhydrin produces a variety of colors that can distinguish between many drugs, this reagent has been intensively used in this laboratory. The colors that are produced with ninhydrin, when correlated with the specific migration values (Rf) for each spot on specific TLC plates and using select solvent systems, greatly enhance the specificity of TLC for various drugs.
In forensic laboratories, the main use of ninhydrin as a spray reagent has been for detection of fingerprints, especially on porous surfaces such as paper and cardboard.2-4 However, despite its great utility, research has continued to develop even more sensitive or selective reagents. Over the last two decades a significant number of ninhydrin analogous and similar, electron deficient compounds have been synthesized and evaluated as fingerprint reagents. Some of these new reagents have displayed superior properties versus ninhydrin in their sensitivity to amino acids and latent fingerprints, particularly in the fluorescence mode.2-7
The aim of the present study was to evaluate some of these new fingerprint detection reagents for drug detection on TLC plates. The development of new, more intense, or fluorescent colors for various drugs would increase the overall specificity and sensitivity of drug-screening TLC. Such reagents could also discriminate between drugs that produce the same color with ninhydrin.
Experimental
Drugs
The controlled substances examined in this study included the following pharmaceutical and illicit drugs: Cocaine HCl and morphine HCl (Merck, Germany), diazepam, flunitrazepam, codeine phosphate, and methadone
Microgram Journal, Volume 1, Numbers 1-2 (January - June 2003) 23
Brought to you by AltGov2 [www.altgov2.org]
HCl (Teva, Israel), lysergic acid diethylamide (LSD) (Sigma, Israel), amphetamine (Assia Chem Laboratory, Israel), heroin base, opium, and 3,4-methylenedioxymethamphetamine (MDMA) HCl (from DIFS case files), and methamphetamine, 3,4-methylenedioxyamphetamine (MDA) HCl, and 3,4-methylenedioxyethylamphetamine (MDEA) HCl (synthesized at DIFS). Similar aliquots (same concentration) of each drug were deposited on TLC plates for comparison.
Imaging Reagents
Twenty-four potential imaging reagents were tested (see Table 1, on pages 25 - 27, for names, sources, and structural formulas). Like ninhydrin, all the compounds that were studied are molecules with electron-deficient cores. Also like ninhydrin, most of them possess the indane-dione skeleton; the remainder have quininoid or cyclobutenedione type structures. All reagents were dissolved in 95% ethanol to reach testing concentrations from 0.5 - 10%.
TLC, Elution Solvents, and Spray Reagents
TLC was carried out on standard silica gel plates (10 x 20 cm) containing a fluorescent indicator (254 nm) on aluminum support (Macherey-Nagel, Germany). A dioxane:xylenes:ethanol:ammonia (40:30:5:5) solvent mixture was used as the mobile phase in the developing tank. After the solvent elution, the plates were dried in an oven at 120oC for 3 - 4 minutes, then cooled to room temperature. The plates were then sprayed with the reagent solution, then heated again for 10 minutes. The colors of the spots as well as background interferences were immediately recorded and photographed.
Methods
1st Stage
At the first evaluation stage, all 24 reagents were tested on TLC plates against five basic drugs: Heroin, cocaine, MDMA, diazepam, and flunitrazepam. At this stage the plates were not processed in the solvent system; rather, the drugs were spotted on the plates and the spots were treated with the reagents (5 - 10% w/v) via direct application using a pipette or cotton swab. When a color reaction was noted using these initial reagent concentrations, a lower concentration solution (0.5%) of the target reagent was attempted.
2nd Stage
At the second evaluation stage, only those reagents that had produced colored spots with at least one drug were investigated. At this stage, the selected color reagents were evaluated for all 14 of the above listed target drugs. In addition, in the second stage, each TLC plate bearing the drug spots was eluted using above specified the TLC solvent system, then sprayed with the reagent solution, then heated to 120oC. The results were compared versus those obtained by the ninhydrin solution routinely used in the laboratory.
3rd Stage
In the third stage, experimental parameters were optimized for the successful color reagents identified at the second stage. The principal optimization parameters were reagent concentration and color development temperature. Ethanolic solutions of six concentrations (0.5, 1, 2, 3, 4 and 5% v/w) were prepared for each one of the successful reagents. Each successful reagent at each given concentration was tested against each drug that it had displayed a colored spot with in Stage 2, and after elution evaluated at different development temperatures (80, 100, 120, 130, 140, 160 and 200oC). It was noted that while high reagent concentrations produced more intense colors, they also usually resulted in development of significant background colorations. High temperatures had a similar effect. Colors developed and background interferences were recorded for each set of experiments.
Microgram Journal, Volume 1, Numbers 1-2 (January - June 2003) 24
Brought to you by AltGov2 [www.altgov2.org]
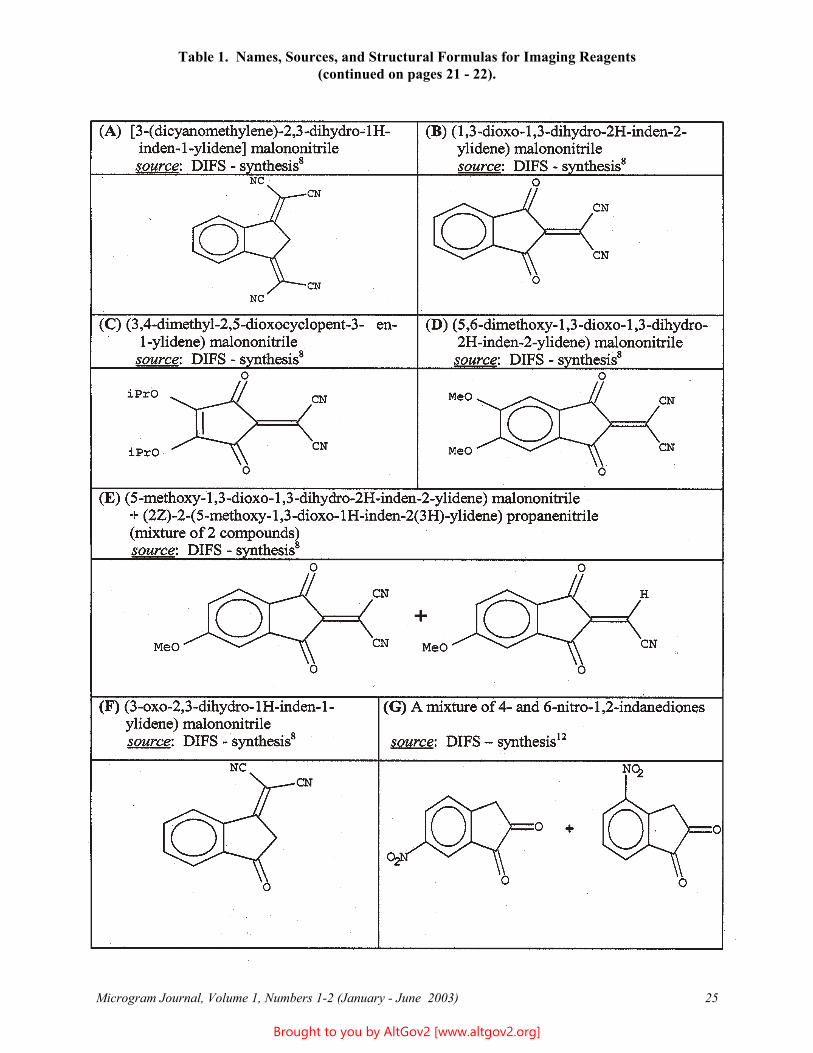
Table 1. Names, Sources, and Structural Formulas for Imaging Reagents (continued on pages 21 - 22).
Microgram Journal, Volume 1, Numbers 1-2 (January - June 2003) 25
Brought to you by AltGov2 [www.altgov2.org]
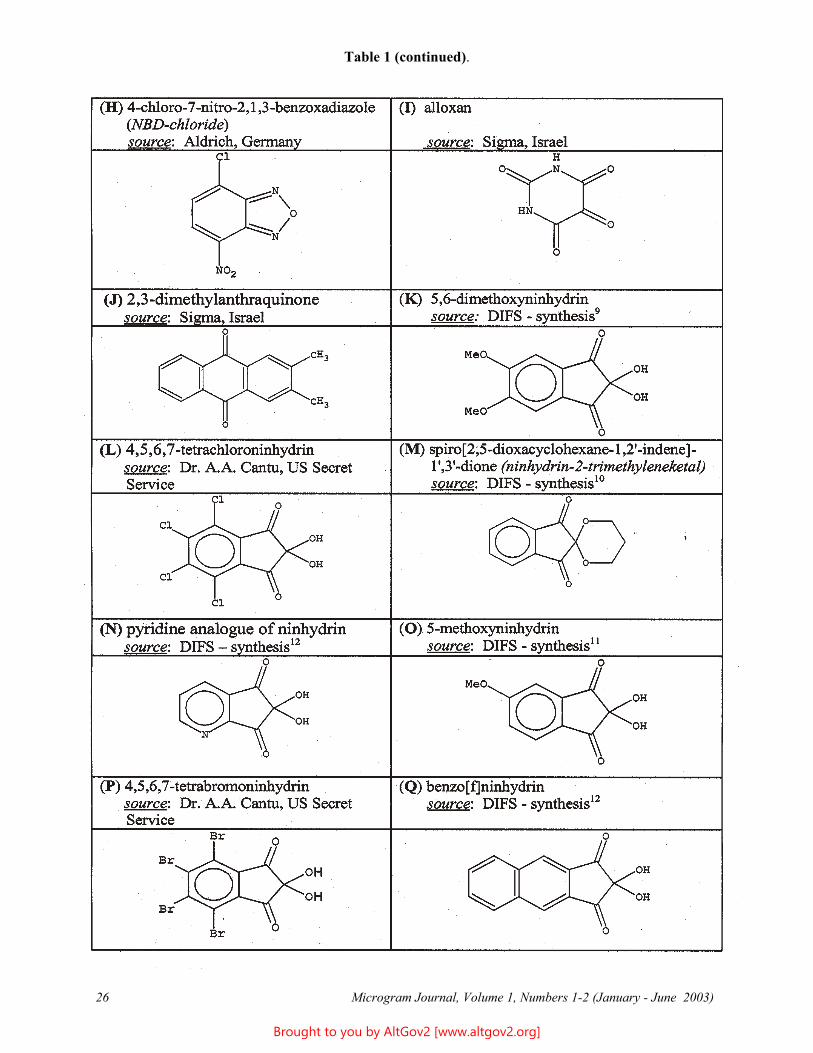
Table 1 (continued).
Microgram Journal, Volume 1, Numbers 1-2 (January - June 2003) 26
Brought to you by AltGov2 [www.altgov2.org]
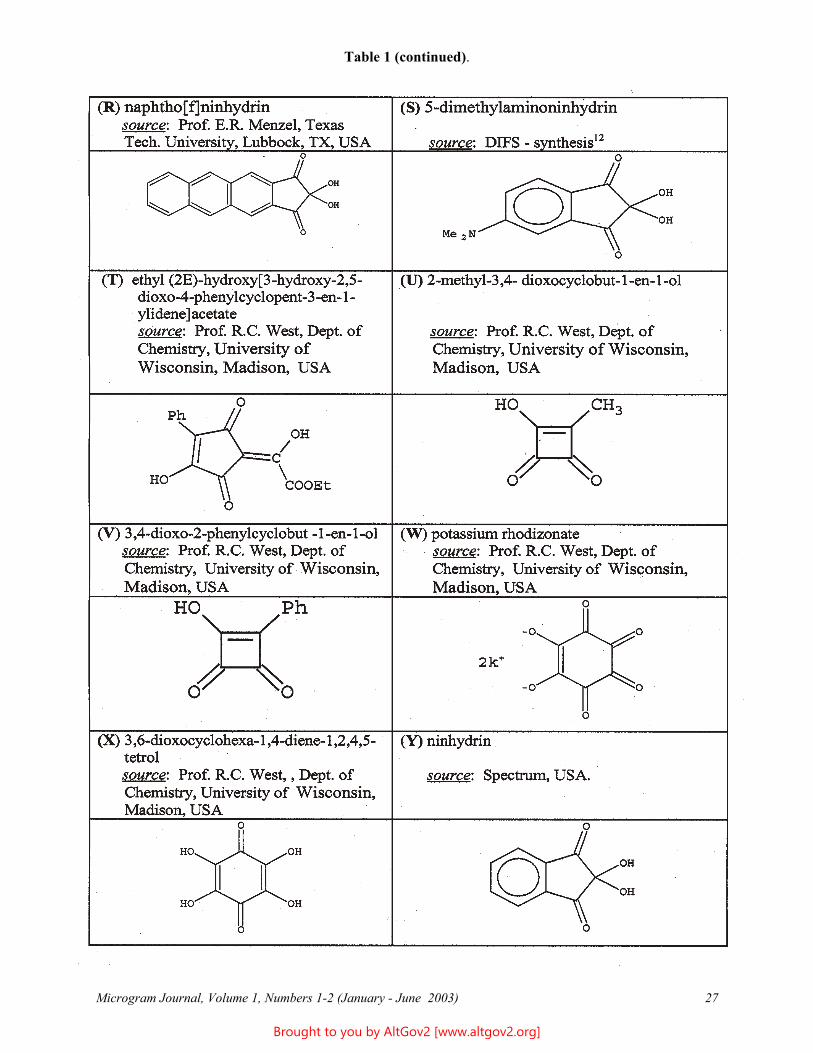
Table 1 (continued).
Microgram Journal, Volume 1, Numbers 1-2 (January - June 2003) 27
Brought to you by AltGov2 [www.altgov2.org]
Results and Discussion
Five of the twenty-four reagents examined at the first evaluation stage yielded a color reaction with at least one drug (see Table 2, next page). These were reagents E (mixture of 5-methoxy-1,3-dioxo-1,3-dihydro-2H-inden-2-ylidene) malononitrile and (2Z)-2-(5-methoxy-1,3-dioxo-1H-inden-2(3H)-ylidene) propanenitrile, F (3-oxo-2,3-dihydro-1H-inden-1-ylidene) malononitrile, H (4-chloro-7-nitro-2,1,3-benzoxadiazole), K (5,6-dimethoxy-ninhydrin), and O (5-methoxyninhydrin). Seven of the twenty-four compounds gave no visible reaction, and the remainder were rejected because of the development of intense background coloration.
At the second stage, the five preliminarily successful reagents listed above were evaluated for all 14 drugs. The results are summarized in Table 3 (see page 30), and are detailed below:
Reagent E (a mixture of 5-methoxy-1,3-dioxo-1,3-dihydro-2H-inden-2-ylidene)malononitrile and (2Z)-2-(5-methoxy-1,3-dioxo-1H-inden-2(3H)-ylidene)propanenitrile), at working concentrations of 1 - 5% w/v: A yellow background is observed and the sensitivity is low; therefore, the colored spots are weak in comparison with the background.
Reagent F ((3-oxo-2,3-dihydro-1H-inden-1-ylidene)malononitrile), at a working concentration of 2% w/v: Intense brown-red spots are observed, mostly with amphetamines. In contrast, opiates (heroin, morphine) and cocaine produce only low intensity red colored spots. No reaction is observed with LSD. At low drug concentrations, the red colored background interferes with the colored spots.
Reagent H (4-chloro-7-nitro-2,1,3-benzoxadiazole), at working concentrations of 1.5 - 2% w/v: Intense brown-purple spots are formed with amphetamines, yellow spots with narcotine and papaverine in opium, blue spots with heroin, and brown spots with cocaine. An intense color reaction is also observed with LSD. In general, the colors obtained are very similar to the colors developed with ninhydrin, but the sensitivity of H is higher; therefore, a lower reagent concentration is required.
Reagent K (5,6-dimethoxyninhydrin), at a working concentration of 0.5% w/v: Very intense spots are formed with amphetamines, LSD and methadone. Opiates (heroin, morphine) produce weak purple spots. Strong purple spots are formed by MDMA and MDEA. Amphetamine and MDA yield milky-yellow spots.
Reagent O (5-methoxyninhydrin), at a working concentration of 2.5% w/v: Intense purple spots are formed with amphetamines, while opiates and LSD produce only very weak purple spots. In addition, a pink background discoloration is observed.
Of the five above reagents, H and K showed better performance versus the other three, and were therefore selected for further investigation. Optimization trials were carried out with both H and K at various concentrations and color development temperatures. The optimized parameters for H are: A 3% solution (w/v) with color development at 120oC. Under these conditions, opiates (heroin, morphine) can also be detected. The optimized conditions for K are: A 0.5-1% solution (w/v) with color development at 120oC. Under these conditions, only amphetamines show strong color reactions. It is noted for comparison that ninhydrin is typically utilized as a 10% solution.
Conclusions
4-Chloro-7-nitro-2,1,3-benzoxadiazole and 4,6-dimethoxyninhydrin both show good potential as spray reagents for drugs on chromatographic plates. Both reagents show some advantage over ninhydrin in their reactivity, developing more intense colors at lower reagent concentrations. Furthermore, 5,6-dimethoxyninhydrin also produces two different colors with different amphetamines: Purple spots are formed by (continued on page 30)
Microgram Journal, Volume 1, Numbers 1-2 (January - June 2003) 28
Brought to you by AltGov2 [www.altgov2.org]
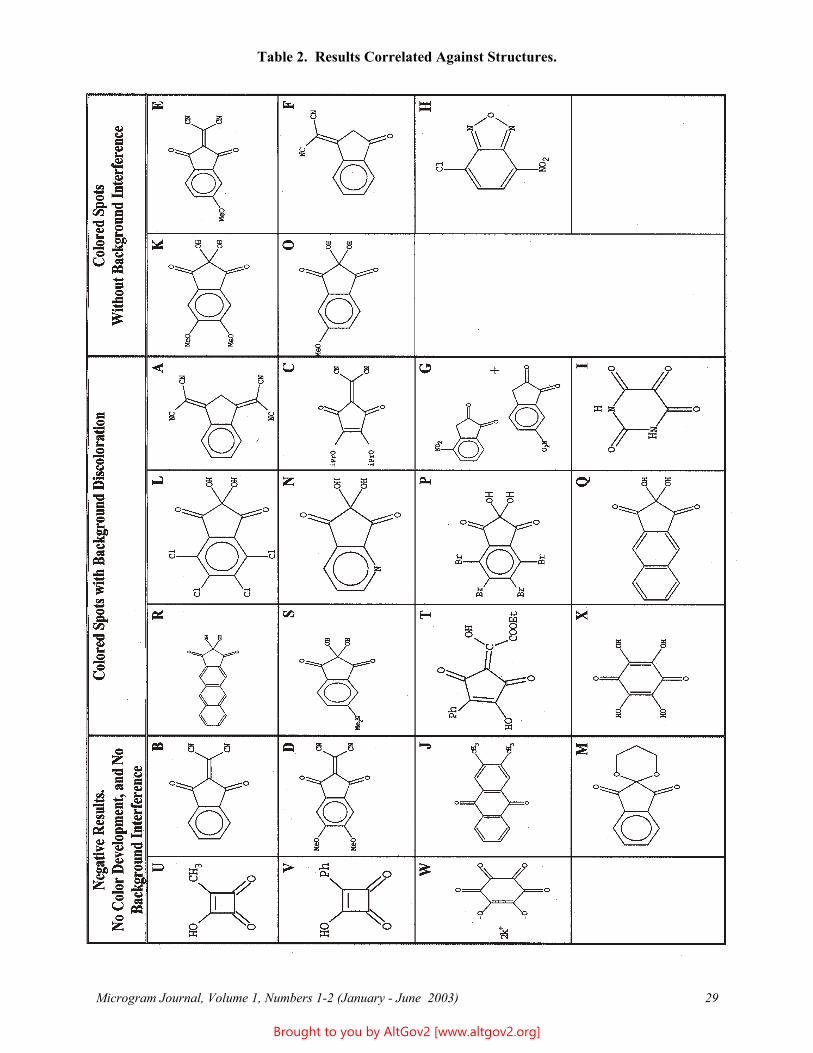
Table 2. Results Correlated Against Structures.
Microgram Journal, Volume 1, Numbers 1-2 (January - June 2003) 29
Brought to you by AltGov2 [www.altgov2.org]
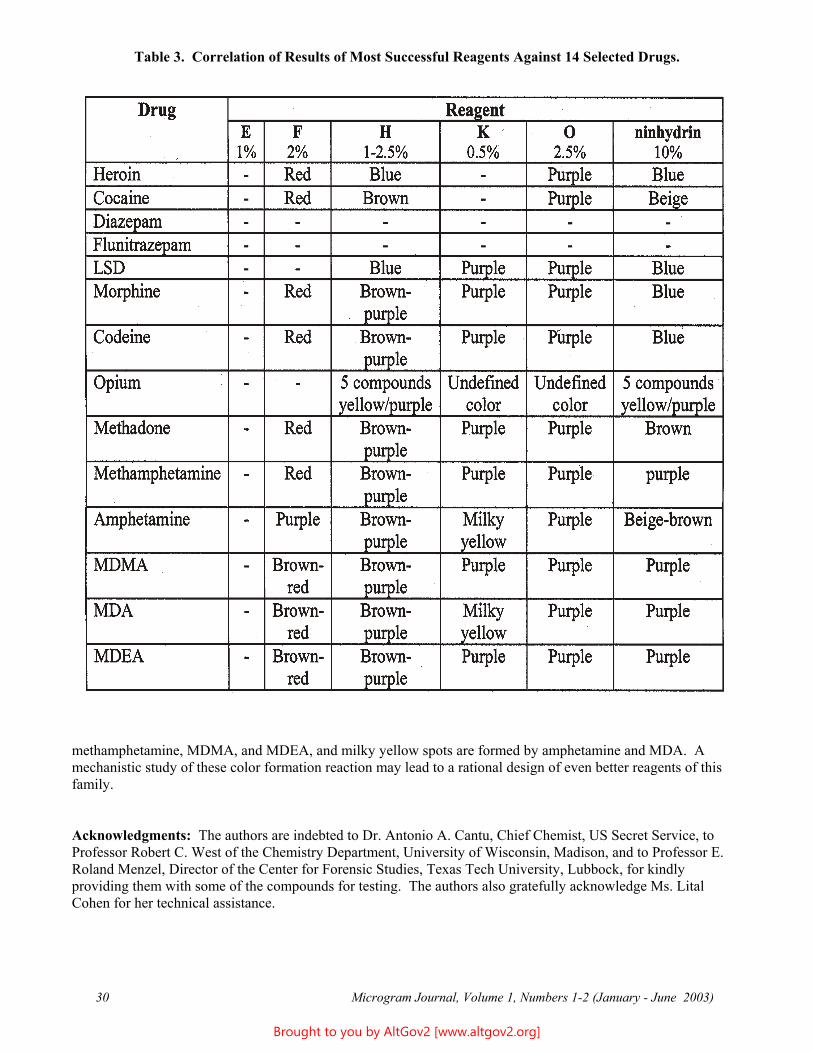
Table 3. Correlation of Results of Most Successful Reagents Against 14 Selected Drugs.
methamphetamine, MDMA, and MDEA, and milky yellow spots are formed by amphetamine and MDA. A mechanistic study of these color formation reaction may lead to a rational design of even better reagents of this family.
Acknowledgments: The authors are indebted to Dr. Antonio A. Cantu, Chief Chemist, US Secret Service, to Professor Robert C. West of the Chemistry Department, University of Wisconsin, Madison, and to Professor E. Roland Menzel, Director of the Center for Forensic Studies, Texas Tech University, Lubbock, for kindly providing them with some of the compounds for testing. The authors also gratefully acknowledge Ms. Lital Cohen for her technical assistance.
Microgram Journal, Volume 1, Numbers 1-2 (January - June 2003) 30
Brought to you by AltGov2 [www.altgov2.org]
References
1. Dutt MC, Teo TP. Use of ninhydrin as a spray reagent for the detection of some basic drugs on thin-layer chromatograms. J Chromatography 1980;195:133.
2. Joullie MM, Thompson TR, Nemeroff NH. Ninhydrin and ninhydrin analogues. Syntheses and applications. Tetrahedron 1991;47:8791 (and references therein).
23. Almog J. Fingerprint development by ninhydrin and its analogues. Advances in Fingerprint Technology,
nd ed. Lee and Gaensslen, Editors, CRC Press, 2001 (and references therein).
4. Kent T, Editor. Manual of Fingerprint Development Techniques, 2nd ed. Sandridge, Home Office, 1998.
5. Lennard CJ, Margot PA, Stoilovic M, Warrener RN. Applications of ninhydrin analogues to the development of latent fingerprints on paper surfaces. Presented at the International Forensic Symposium on Latent Prints, FBI Academy, Quantico, Virginia, July 1987.
6. Lee HC, Gaensslen RE. Methods of latent fingerprint development. Advances in Fingerprint Technology, 2nd ed. Lee and Gaensslen, Editors, CRC Press, 2001 (and references therein).
7. Hark RR, Hauze DB, Petrovskaia O, Joullie MM. Synthetic studies of novel ninhydrin analogs. J Org Chem 2001;79:1632.
8. Fatiadi AJ. New applications of malononitrile in organic chemistry. Synthesis 1978(Part 1):165.
9. Almog J. Reagents for chemical development of latent fingerprints: Vicinal triketones - Their reaction with amino acids and with latent fingerprints on paper. J Forensic Sci 1987;32(6):1565.
10. Schonberg A, Singer E, Eschenhof B, Hoyer GA. Reaction of ninhydrin and of 1,2,3-indanetrione with compounds with two functional groups. A contribution to the formation of spiro compounds from ninhydrin. Chem Ber 1978;111:3058.
11. Almog J, Hirshfeld A. 5-Methoxyninhydrin: A reagent for chemical development of latent fingerprints that is compatible with the copper-vapor laser. J Forensic Sci 1988;33:1027.
12. Almog J, Hirshfeld A, Frank A, Sterling J, Leonov D. Aminoninhydrins: Fingerprint reagents with direct fluorogenic activity-preliminary studies. J Forensic Sci 1991;36(1):104.
* * * * *
Microgram Journal, Volume 1, Numbers 1-2 (January - June 2003) 31
Brought to you by AltGov2 [www.altgov2.org]
Technical Note
Instrumental Separation of 3,4-Methylenedioxyamphetamine (MDA) from 1-(3,4-Methylenedioxyphenyl)-2-propanol, a Co-Eluting Compound
Barbara A. Vohlken* and Stephen M. Layton Florida Department of Law Enforcement
Tampa Regional Crime Laboratory 4211-A North Lois Avenue
Tampa, FL 33614 [email: [email protected]]
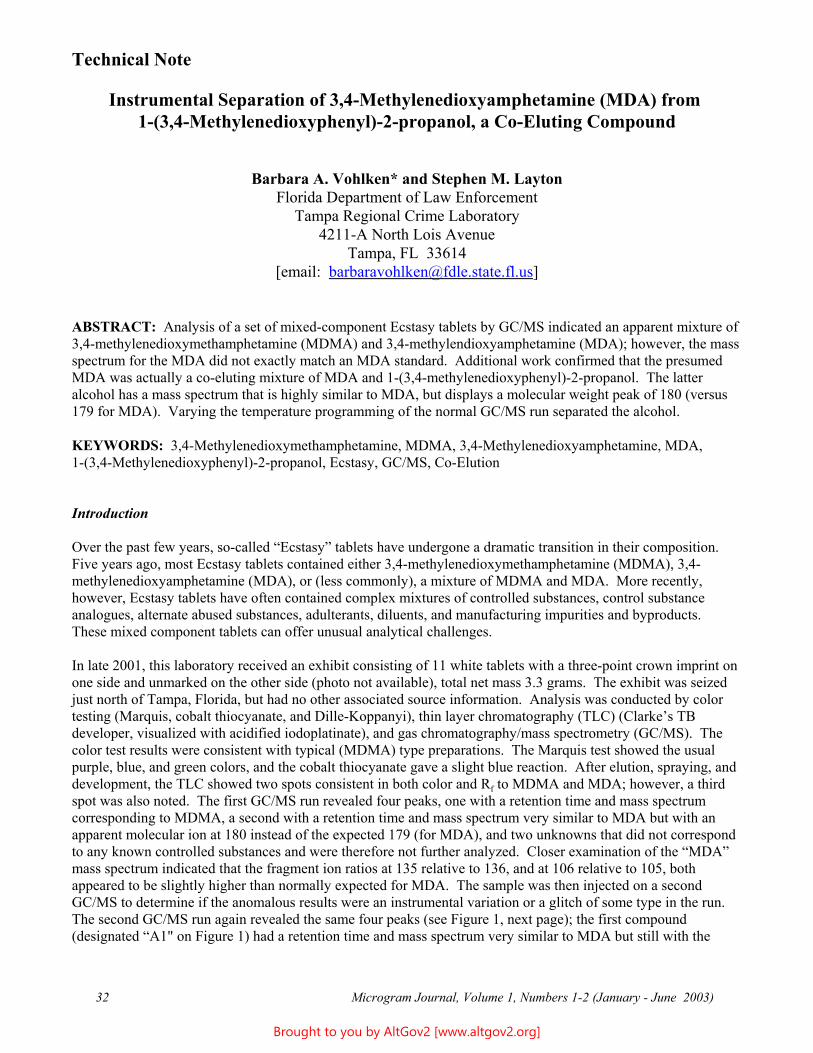
ABSTRACT: Analysis of a set of mixed-component Ecstasy tablets by GC/MS indicated an apparent mixture of 3,4-methylenedioxymethamphetamine (MDMA) and 3,4-methylendioxyamphetamine (MDA); however, the mass spectrum for the MDA did not exactly match an MDA standard. Additional work confirmed that the presumed MDA was actually a co-eluting mixture of MDA and 1-(3,4-methylenedioxyphenyl)-2-propanol. The latter alcohol has a mass spectrum that is highly similar to MDA, but displays a molecular weight peak of 180 (versus 179 for MDA). Varying the temperature programming of the normal GC/MS run separated the alcohol.
KEYWORDS: 3,4-Methylenedioxymethamphetamine, MDMA, 3,4-Methylenedioxyamphetamine, MDA, 1-(3,4-Methylenedioxyphenyl)-2-propanol, Ecstasy, GC/MS, Co-Elution
Introduction
Over the past few years, so-called “Ecstasy” tablets have undergone a dramatic transition in their composition. Five years ago, most Ecstasy tablets contained either 3,4-methylenedioxymethamphetamine (MDMA), 3,4-methylenedioxyamphetamine (MDA), or (less commonly), a mixture of MDMA and MDA. More recently, however, Ecstasy tablets have often contained complex mixtures of controlled substances, control substance analogues, alternate abused substances, adulterants, diluents, and manufacturing impurities and byproducts. These mixed component tablets can offer unusual analytical challenges.
In late 2001, this laboratory received an exhibit consisting of 11 white tablets with a three-point crown imprint on one side and unmarked on the other side (photo not available), total net mass 3.3 grams. The exhibit was seized just north of Tampa, Florida, but had no other associated source information. Analysis was conducted by color testing (Marquis, cobalt thiocyanate, and Dille-Koppanyi), thin layer chromatography (TLC) (Clarke’s TB developer, visualized with acidified iodoplatinate), and gas chromatography/mass spectrometry (GC/MS). The color test results were consistent with typical (MDMA) type preparations. The Marquis test showed the usual purple, blue, and green colors, and the cobalt thiocyanate gave a slight blue reaction. After elution, spraying, and development, the TLC showed two spots consistent in both color and Rf to MDMA and MDA; however, a third spot was also noted. The first GC/MS run revealed four peaks, one with a retention time and mass spectrum corresponding to MDMA, a second with a retention time and mass spectrum very similar to MDA but with an apparent molecular ion at 180 instead of the expected 179 (for MDA), and two unknowns that did not correspond to any known controlled substances and were therefore not further analyzed. Closer examination of the “MDA” mass spectrum indicated that the fragment ion ratios at 135 relative to 136, and at 106 relative to 105, both appeared to be slightly higher than normally expected for MDA. The sample was then injected on a second GC/MS to determine if the anomalous results were an instrumental variation or a glitch of some type in the run. The second GC/MS run again revealed the same four peaks (see Figure 1, next page); the first compound (designated “A1" on Figure 1) had a retention time and mass spectrum very similar to MDA but still with the
Microgram Journal, Volume 1, Numbers 1-2 (January - June 2003) 32
Brought to you by AltGov2 [www.altgov2.org]
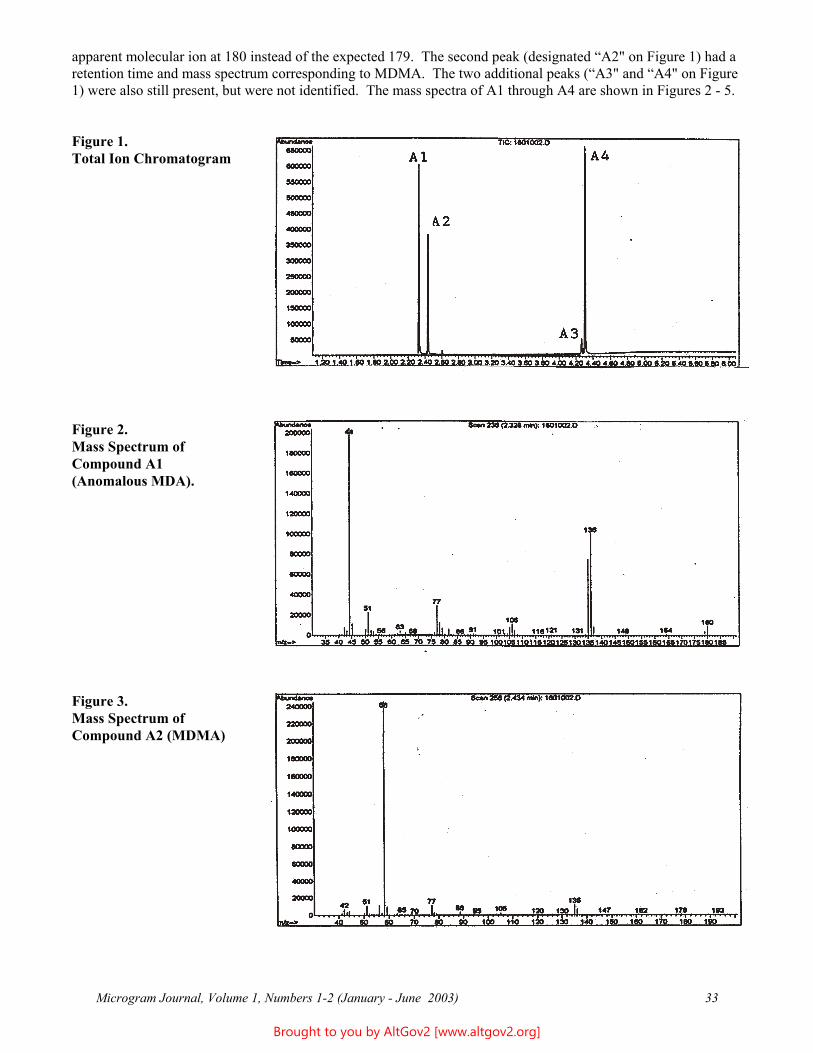
apparent molecular ion at 180 instead of the expected 179. The second peak (designated “A2" on Figure 1) had a retention time and mass spectrum corresponding to MDMA. The two additional peaks (“A3" and “A4" on Figure 1) were also still present, but were not identified. The mass spectra of A1 through A4 are shown in Figures 2 - 5.
Figure 1.Total Ion Chromatogram
Figure 2. Mass Spectrum of Compound A1 (Anomalous MDA).
Figure 3.Mass Spectrum ofCompound A2 (MDMA)
Microgram Journal, Volume 1, Numbers 1-2 (January - June 2003) 33
Brought to you by AltGov2 [www.altgov2.org]
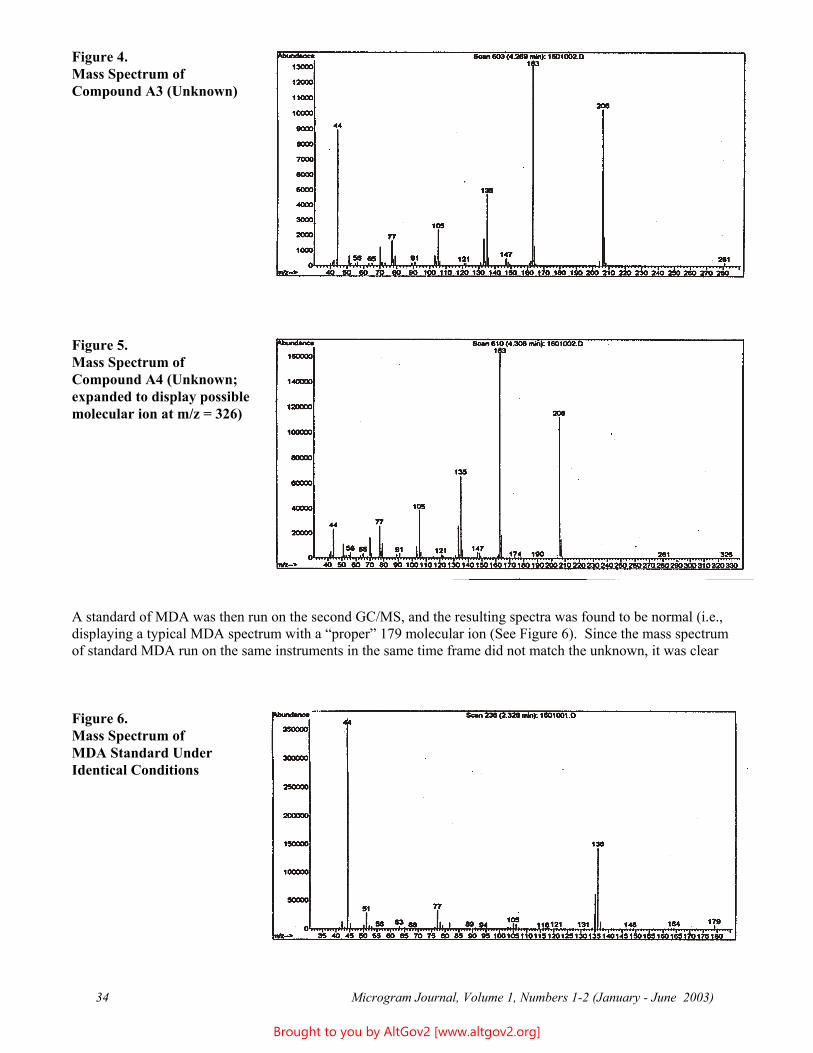
Figure 4.Mass Spectrum ofCompound A3 (Unknown)
Figure 5.Mass Spectrum ofCompound A4 (Unknown;expanded to display possiblemolecular ion at m/z = 326)
A standard of MDA was then run on the second GC/MS, and the resulting spectra was found to be normal (i.e., displaying a typical MDA spectrum with a “proper” 179 molecular ion (See Figure 6). Since the mass spectrum of standard MDA run on the same instruments in the same time frame did not match the unknown, it was clear
Figure 6. Mass Spectrum of MDA Standard Under Identical Conditions
Microgram Journal, Volume 1, Numbers 1-2 (January - June 2003) 34
Brought to you by AltGov2 [www.altgov2.org]
that this could not be a simple instrumental variation of the MDA spectrum. A literature search of mass spectra found no matches. The question then arose: Was the second component actually an unknown substance, or was the anomalous spectrum the result of a compound co-eluting with MDA? The presence of a third compound by TLC analysis suggested the possibility of a co-eluter.
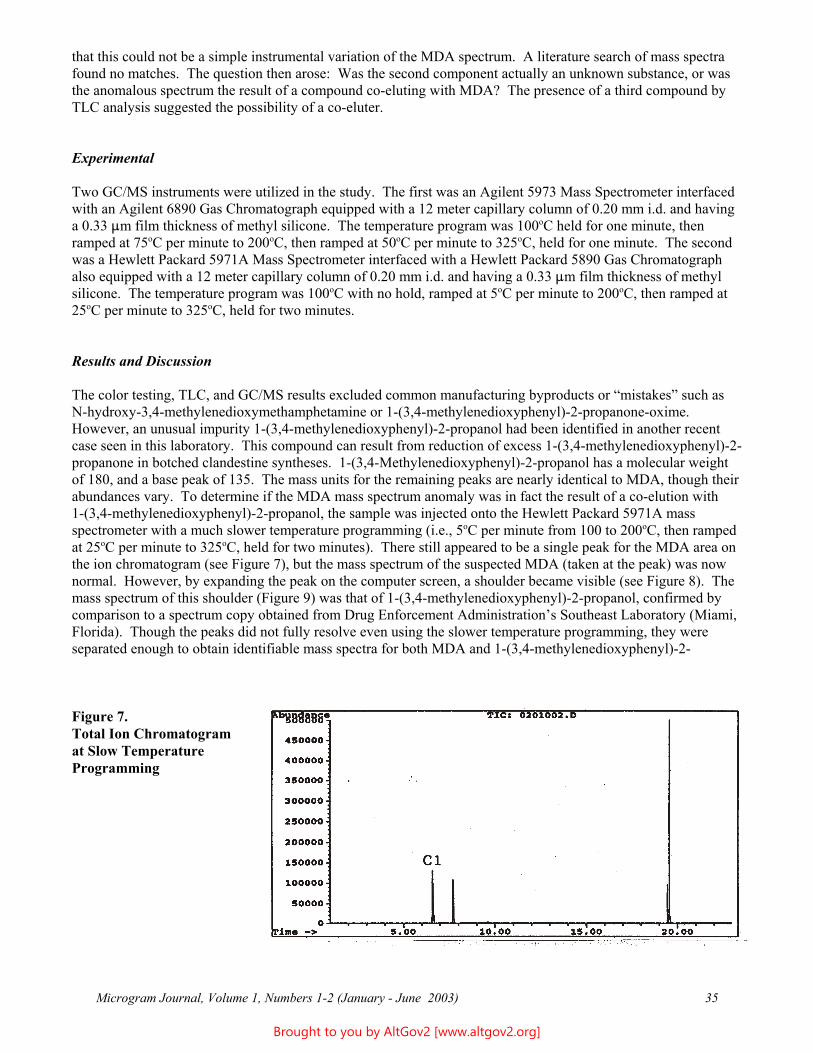
Experimental
Two GC/MS instruments were utilized in the study. The first was an Agilent 5973 Mass Spectrometer interfaced with an Agilent 6890 Gas Chromatograph equipped with a 12 meter capillary column of 0.20 mm i.d. and having a 0.33 :m film thickness of methyl silicone. The temperature program was 100oC held for one minute, then ramped at 75oC per minute to 200oC, then ramped at 50oC per minute to 325oC, held for one minute. The second was a Hewlett Packard 5971A Mass Spectrometer interfaced with a Hewlett Packard 5890 Gas Chromatograph also equipped with a 12 meter capillary column of 0.20 mm i.d. and having a 0.33 :m film thickness of methyl silicone. The temperature program was 100oC with no hold, ramped at 5oC per minute to 200oC, then ramped at 25oC per minute to 325oC, held for two minutes.
Results and Discussion
The color testing, TLC, and GC/MS results excluded common manufacturing byproducts or “mistakes” such as N-hydroxy-3,4-methylenedioxymethamphetamine or 1-(3,4-methylenedioxyphenyl)-2-propanone-oxime. However, an unusual impurity 1-(3,4-methylenedioxyphenyl)-2-propanol had been identified in another recent case seen in this laboratory. This compound can result from reduction of excess 1-(3,4-methylenedioxyphenyl)-2-propanone in botched clandestine syntheses. 1-(3,4-Methylenedioxyphenyl)-2-propanol has a molecular weight of 180, and a base peak of 135. The mass units for the remaining peaks are nearly identical to MDA, though their abundances vary. To determine if the MDA mass spectrum anomaly was in fact the result of a co-elution with 1-(3,4-methylenedioxyphenyl)-2-propanol, the sample was injected onto the Hewlett Packard 5971A mass spectrometer with a much slower temperature programming (i.e., 5oC per minute from 100 to 200oC, then ramped at 25oC per minute to 325oC, held for two minutes). There still appeared to be a single peak for the MDA area on the ion chromatogram (see Figure 7), but the mass spectrum of the suspected MDA (taken at the peak) was now normal. However, by expanding the peak on the computer screen, a shoulder became visible (see Figure 8). The mass spectrum of this shoulder (Figure 9) was that of 1-(3,4-methylenedioxyphenyl)-2-propanol, confirmed by comparison to a spectrum copy obtained from Drug Enforcement Administration’s Southeast Laboratory (Miami, Florida). Though the peaks did not fully resolve even using the slower temperature programming, they were separated enough to obtain identifiable mass spectra for both MDA and 1-(3,4-methylenedioxyphenyl)-2-
Figure 7. Total Ion Chromatogram at Slow Temperature Programming
Microgram Journal, Volume 1, Numbers 1-2 (January - June 2003) 35
Brought to you by AltGov2 [www.altgov2.org]
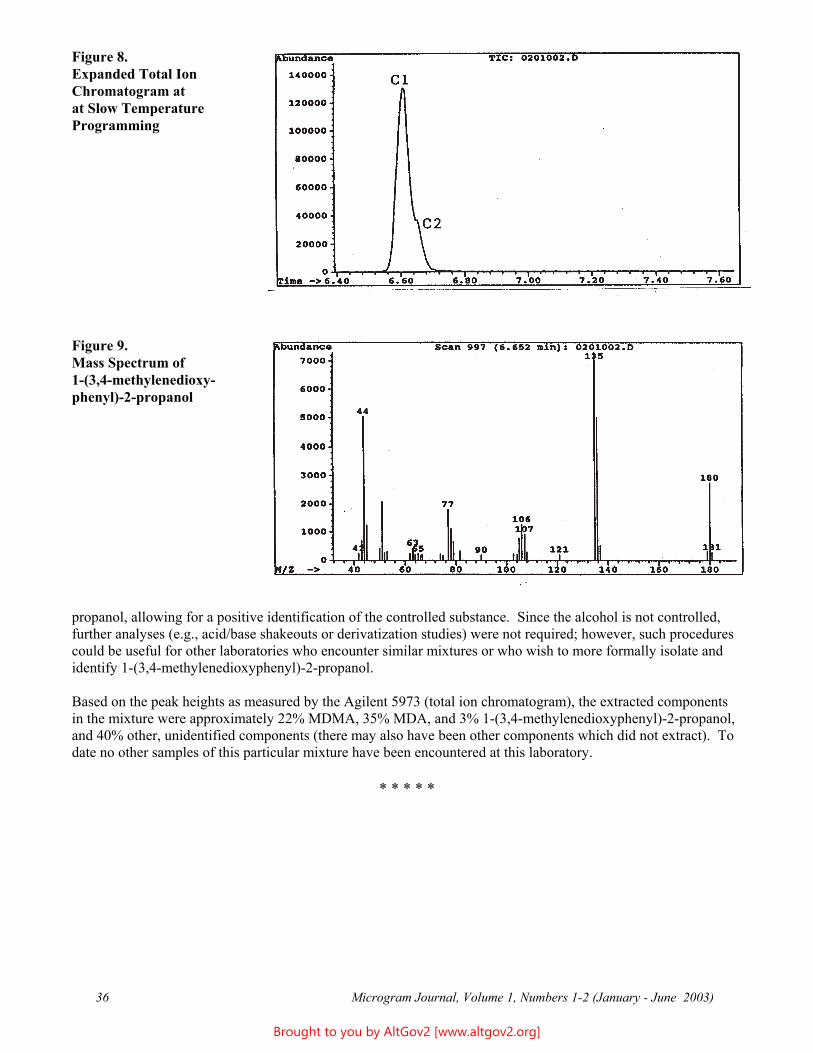
Figure 8. Expanded Total Ion Chromatogram at at Slow Temperature Programming
Figure 9. Mass Spectrum of 1-(3,4-methylenedioxy-phenyl)-2-propanol
propanol, allowing for a positive identification of the controlled substance. Since the alcohol is not controlled, further analyses (e.g., acid/base shakeouts or derivatization studies) were not required; however, such procedures could be useful for other laboratories who encounter similar mixtures or who wish to more formally isolate and identify 1-(3,4-methylenedioxyphenyl)-2-propanol.
Based on the peak heights as measured by the Agilent 5973 (total ion chromatogram), the extracted components in the mixture were approximately 22% MDMA, 35% MDA, and 3% 1-(3,4-methylenedioxyphenyl)-2-propanol, and 40% other, unidentified components (there may also have been other components which did not extract). To date no other samples of this particular mixture have been encountered at this laboratory.
* * * * *
Microgram Journal, Volume 1, Numbers 1-2 (January - June 2003) 36
Brought to you by AltGov2 [www.altgov2.org]
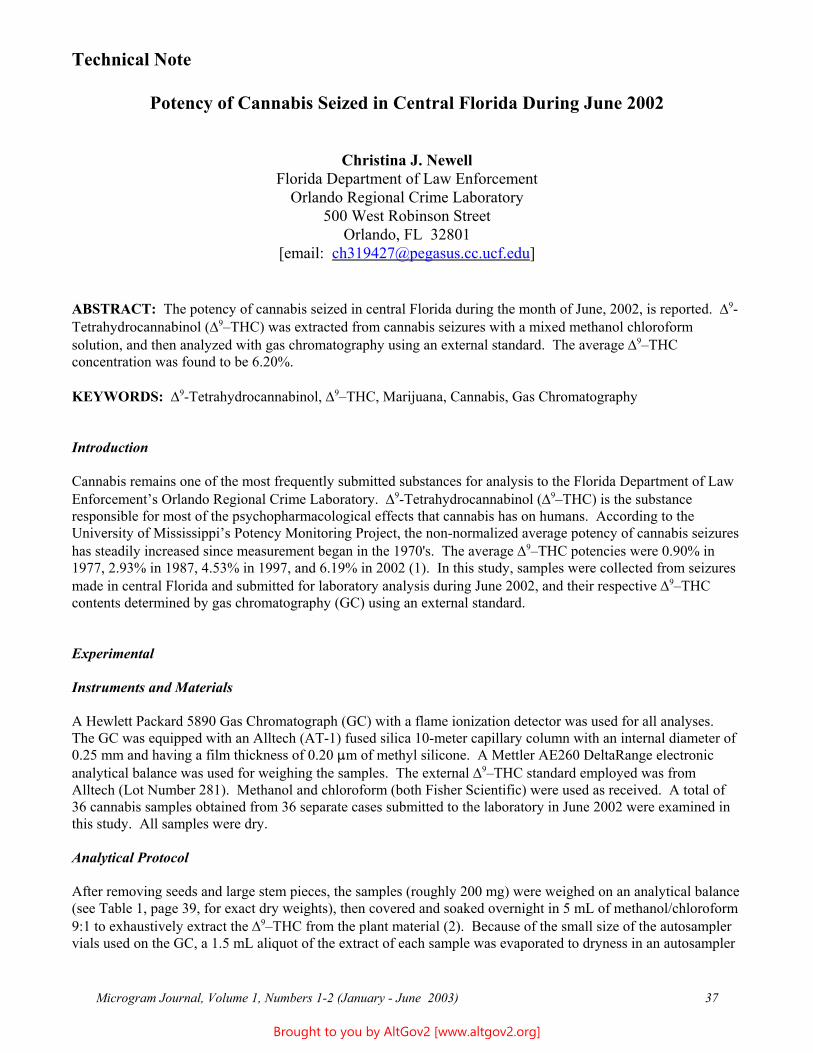
Technical Note
Potency of Cannabis Seized in Central Florida During June 2002
Christina J. Newell Florida Department of Law Enforcement
Orlando Regional Crime Laboratory 500 West Robinson Street
Orlando, FL 32801 [email: [email protected]]
ABSTRACT: The potency of cannabis seized in central Florida during the month of June, 2002, is reported. ∆9-Tetrahydrocannabinol (∆9–THC) was extracted from cannabis seizures with a mixed methanol chloroform solution, and then analyzed with gas chromatography using an external standard. The average ∆9–THC concentration was found to be 6.20%.
KEYWORDS: ∆9-Tetrahydrocannabinol, ∆9–THC, Marijuana, Cannabis, Gas Chromatography
Introduction
Cannabis remains one of the most frequently submitted substances for analysis to the Florida Department of Law Enforcement’s Orlando Regional Crime Laboratory. ∆9-Tetrahydrocannabinol (∆9–THC) is the substance responsible for most of the psychopharmacological effects that cannabis has on humans. According to the University of Mississippi’s Potency Monitoring Project, the non-normalized average potency of cannabis seizures has steadily increased since measurement began in the 1970's. The average ∆9–THC potencies were 0.90% in 1977, 2.93% in 1987, 4.53% in 1997, and 6.19% in 2002 (1). In this study, samples were collected from seizures made in central Florida and submitted for laboratory analysis during June 2002, and their respective ∆9–THC contents determined by gas chromatography (GC) using an external standard.
Experimental
Instruments and Materials
A Hewlett Packard 5890 Gas Chromatograph (GC) with a flame ionization detector was used for all analyses. The GC was equipped with an Alltech (AT-1) fused silica 10-meter capillary column with an internal diameter of 0.25 mm and having a film thickness of 0.20 :m of methyl silicone. A Mettler AE260 DeltaRange electronic analytical balance was used for weighing the samples. The external ∆9–THC standard employed was from Alltech (Lot Number 281). Methanol and chloroform (both Fisher Scientific) were used as received. A total of 36 cannabis samples obtained from 36 separate cases submitted to the laboratory in June 2002 were examined in this study. All samples were dry.
Analytical Protocol
After removing seeds and large stem pieces, the samples (roughly 200 mg) were weighed on an analytical balance (see Table 1, page 39, for exact dry weights), then covered and soaked overnight in 5 mL of methanol/chloroform 9:1 to exhaustively extract the ∆9–THC from the plant material (2). Because of the small size of the autosampler vials used on the GC, a 1.5 mL aliquot of the extract of each sample was evaporated to dryness in an autosampler
Microgram Journal, Volume 1, Numbers 1-2 (January - June 2003) 37
Brought to you by AltGov2 [www.altgov2.org]
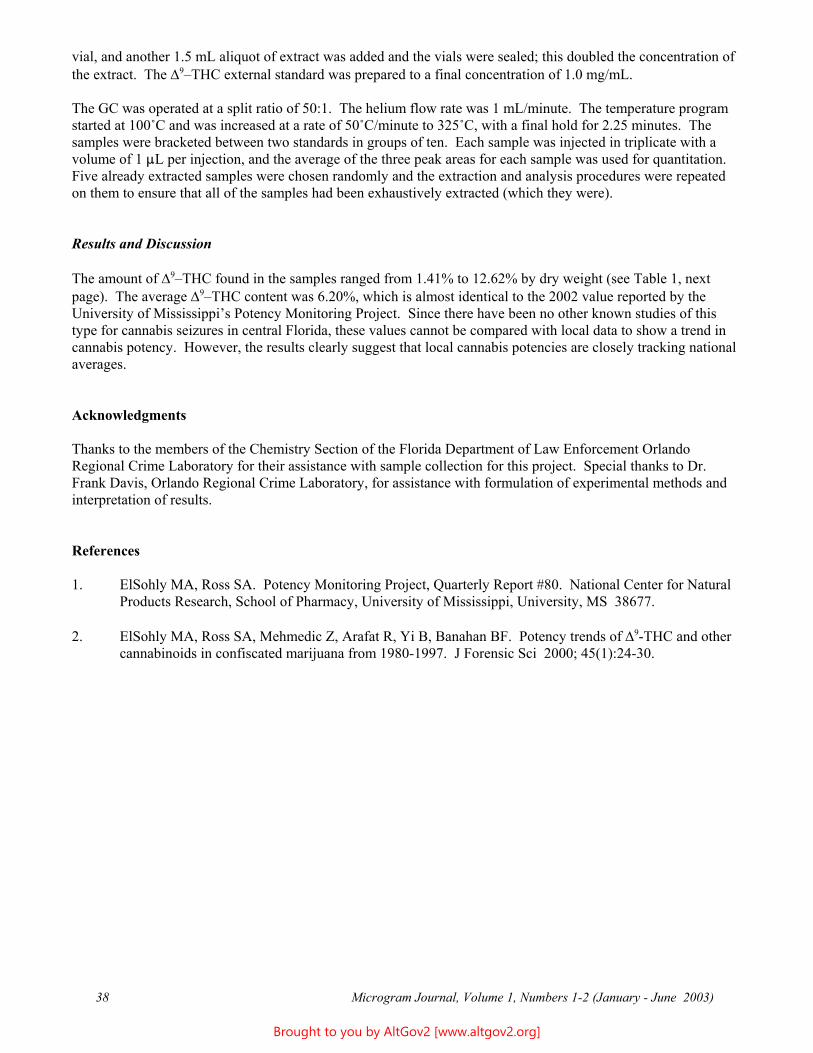
vial, and another 1.5 mL aliquot of extract was added and the vials were sealed; this doubled the concentration of the extract. The ∆9–THC external standard was prepared to a final concentration of 1.0 mg/mL.
The GC was operated at a split ratio of 50:1. The helium flow rate was 1 mL/minute. The temperature program started at 100/C and was increased at a rate of 50/C/minute to 325/C, with a final hold for 2.25 minutes. The samples were bracketed between two standards in groups of ten. Each sample was injected in triplicate with a volume of 1 :L per injection, and the average of the three peak areas for each sample was used for quantitation. Five already extracted samples were chosen randomly and the extraction and analysis procedures were repeated on them to ensure that all of the samples had been exhaustively extracted (which they were).
Results and Discussion
The amount of ∆9–THC found in the samples ranged from 1.41% to 12.62% by dry weight (see Table 1, next page). The average ∆9–THC content was 6.20%, which is almost identical to the 2002 value reported by the University of Mississippi’s Potency Monitoring Project. Since there have been no other known studies of this type for cannabis seizures in central Florida, these values cannot be compared with local data to show a trend in cannabis potency. However, the results clearly suggest that local cannabis potencies are closely tracking national averages.
Acknowledgments
Thanks to the members of the Chemistry Section of the Florida Department of Law Enforcement Orlando Regional Crime Laboratory for their assistance with sample collection for this project. Special thanks to Dr. Frank Davis, Orlando Regional Crime Laboratory, for assistance with formulation of experimental methods and interpretation of results.
References
1. ElSohly MA, Ross SA. Potency Monitoring Project, Quarterly Report #80. National Center for Natural Products Research, School of Pharmacy, University of Mississippi, University, MS 38677.
2. ElSohly MA, Ross SA, Mehmedic Z, Arafat R, Yi B, Banahan BF. Potency trends of ∆9-THC and other cannabinoids in confiscated marijuana from 1980-1997. J Forensic Sci 2000; 45(1):24-30.
Microgram Journal, Volume 1, Numbers 1-2 (January - June 2003) 38
Brought to you by AltGov2 [www.altgov2.org]
Table 1. Amount of ∆9-THC found in Central Florida Cannabis Samples
Microgram Journal, Volume 1, Numbers 1-2 (January - June 2003) 39
Brought to you by AltGov2 [www.altgov2.org]
Technical Note
A Study of Acids Used for the Acidified Cobalt Thiocyanate Test for Cocaine Base
Anna L. Deakin Florida Department of Law Enforcement
Tampa Regional Crime Laboratory 4211 North Lois Avenue
Tampa, FL 33611 [email: [email protected]]
ABSTRACT: Four acids (hydrochloric, sulfuric, nitric, and acetic) were used as acidifying reagents in the “one well” cobalt thiocyanate test for cocaine base. Concentrated sulfuric, nitric, and acetic acids were found to be equally fast as concentrated hydrochloric acid (the standard acid used in the test). In addition, dilute (down to 0.1 N) hydrochloric acid was found to be as effective as concentrated hydrochloric acid. Only concentrated hydrochloric acid gave a transient blue color upon addition to the cobalt thiocyanate reagent. A number of other controlled substances, adulterants, and diluents were also tested and confirmed to not give false positives with sulfuric, nitric, acetic, or dilute hydrochloric acids.
KEYWORDS: Cocaine, Cobalt Thiocyanate, Acidified Cobalt Thiocyanate, Spot Tests, Color Tests
Introduction
The cobalt thiocyanate color test is widely used in forensic laboratories to determine the presence of cocaine salt, i.e., cocaine hydrochloride (1,2). However, the test requires a water soluble form of cocaine, and is ineffective for testing cocaine base. Therefore, a modified version of the test, the acidified cobalt thiocyanate test, is used to determine for the presence of cocaine base. The addition of an acid to the reagent allows the cocaine base to dissolve, and the color reaction can proceed. A sustained blue colored precipitate is a positive test.
There are two general procedures for running these tests. The first is to have two separate solutions prepared (one “normal” and the second acidified) and use them in two separate spot wells of a standard porcelain spot plate. The other is to run the normal (non-acidified) test first, observe for any color change, and if none then add a small amount of acid to the spot well, and again observe for any color change. This latter technique is referred to as the “one-well” method.
A literature search found that the only documented acid used for this “one well” test is concentrated hydrochloric acid (HCl). However, there is a complication when using this acid in that when it is first introduced to the cobalt thiocyanate solution, the color of the solution temporarily turns from pink to blue even if cocaine base is not present- and blue is also the characteristic color change observed for cocaine. Although this change is only temporary (as well as distinguishable to the trained eye), and there is no blue colored precipitate, it can be confusing to novices, and can potentially give ambiguous results with samples containing only trace amounts of cocaine. The latter problem can be an issue with commercial field test-kits.
In this study, a series of acids commonly utilized in most forensic/analytical laboratories were used to perform the “one well” test for cocaine base. A variety of other controlled and non-controlled substances were also studied using the same acids. In addition, the concentration of HCl used for the “one well” test was also studied to determine if the test would still be effective if a diluted version was used.
Microgram Journal, Volume 1, Numbers 1-2 (January - June 2003) 40
Brought to you by AltGov2 [www.altgov2.org]
Experimental
Chemicals
Chemicals were purchased from the following vendors.
Benzocaine Mallinckrodt Lidocaine K&K Loaborat ories Caffeine Mat heson Coleman and Bell Mannit ol Mallinckrodt Cobalt T hiocyanat e Sigma-Aldrich Met ham phet amine (case sam ple) Cocaine HCl and Base Sigma-Aldrich Nicot inamide JT Baker Chem ical Co. Diphenhydramine HCl Sigma-Aldrich Nit ric Acid Fisher Ephedrine Sigma-Aldrich P hencyclidine (P CP ) US P harmacopeia Glacial Acet ic Acid Fisher P rocaine JT Baker Chemical Co. Glucose Mallinckrodt P seudoephedrine Sigma-Aldrich Heroin (case sample) Quinine HCl Mat heson Coleman and Bell Hydrochloric Acid Fisher Sodium Bicarbonat e Fisher Inosit ol East man Sulfuric Acid Fisher Lact ose Mallinckrodt T et racaine K&K Loaborat ories
Prepared Reagents
Cobalt thiocyanate reagent: 2 grams of cobalt thiocyanate were dissolved in 100 mL distilled water.
Acidified cobalt thiocyanate reagent: 2 mL of concentrated HCl were added to 98 mL of above cobalt thiocyanate reagent.
Procedure
Several controlled and non-controlled substances were studied, as well as numerous case samples of cocaine base. For each sample, the following procedure was followed:
1. Add a few drops of the cobalt thiocyanate reagent to five (A-E) wells on a spot plate.
2. Add the acidified cobalt thiocyanate reagent to one well (F).
3. Add a few micrograms of solid chemical to each spot well.
4. Observe color changes (if any).
5. Add one drop of each concentrated acid to each designated well (hydrochloric to (B), sulfuric to (C), nitric to (D), and acetic to (E)).
6. Observe any new color changes in wells (B) through (E).
The effect of the concentration of HCl added to the cobalt thiocyanate solution was separately studied. Two to three drops of the cobalt thiocyanate reagent were added to several wells of a spot plate. One drop of HCl (of varying concentrations) was added to each well.
Results and Discussion
It was found that all four acids (hydrochloric, sulfuric, nitric, and acetic) produced the same test results for cocaine base (see Table 1, next page). All four concentrated acids were equally fast. In addition, no false
Microgram Journal, Volume 1, Numbers 1-2 (January - June 2003) 41
Brought to you by AltGov2 [www.altgov2.org]
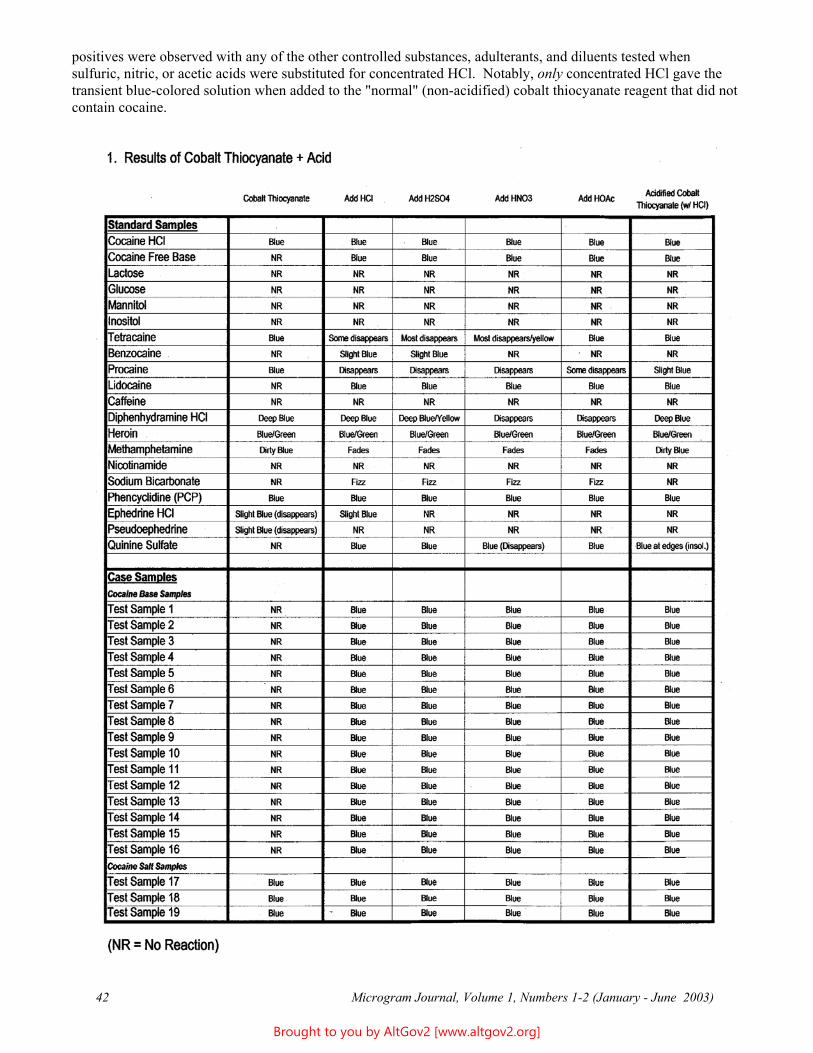
positives were observed with any of the other controlled substances, adulterants, and diluents tested when sulfuric, nitric, or acetic acids were substituted for concentrated HCl. Notably, only concentrated HCl gave the transient blue-colored solution when added to the "normal" (non-acidified) cobalt thiocyanate reagent that did not contain cocaine.
Microgram Journal, Volume 1, Numbers 1-2 (January - June 2003) 42
Brought to you by AltGov2 [www.altgov2.org]
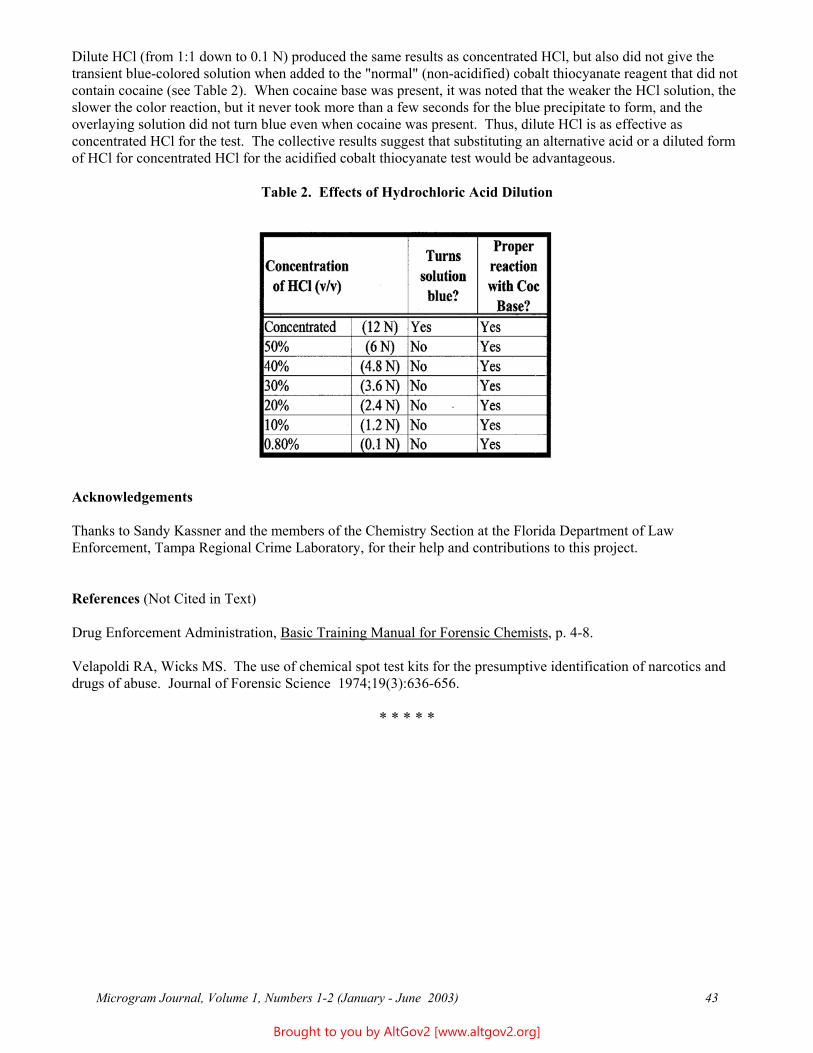
Dilute HCl (from 1:1 down to 0.1 N) produced the same results as concentrated HCl, but also did not give the transient blue-colored solution when added to the "normal" (non-acidified) cobalt thiocyanate reagent that did not contain cocaine (see Table 2). When cocaine base was present, it was noted that the weaker the HCl solution, the slower the color reaction, but it never took more than a few seconds for the blue precipitate to form, and the overlaying solution did not turn blue even when cocaine was present. Thus, dilute HCl is as effective as concentrated HCl for the test. The collective results suggest that substituting an alternative acid or a diluted form of HCl for concentrated HCl for the acidified cobalt thiocyanate test would be advantageous.
Table 2. Effects of Hydrochloric Acid Dilution
Acknowledgements
Thanks to Sandy Kassner and the members of the Chemistry Section at the Florida Department of Law Enforcement, Tampa Regional Crime Laboratory, for their help and contributions to this project.
References (Not Cited in Text)
Drug Enforcement Administration, Basic Training Manual for Forensic Chemists, p. 4-8.
Velapoldi RA, Wicks MS. The use of chemical spot test kits for the presumptive identification of narcotics anddrugs of abuse. Journal of Forensic Science 1974;19(3):636-656.
* * * * *
Microgram Journal, Volume 1, Numbers 1-2 (January - June 2003) 43
Brought to you by AltGov2 [www.altgov2.org]
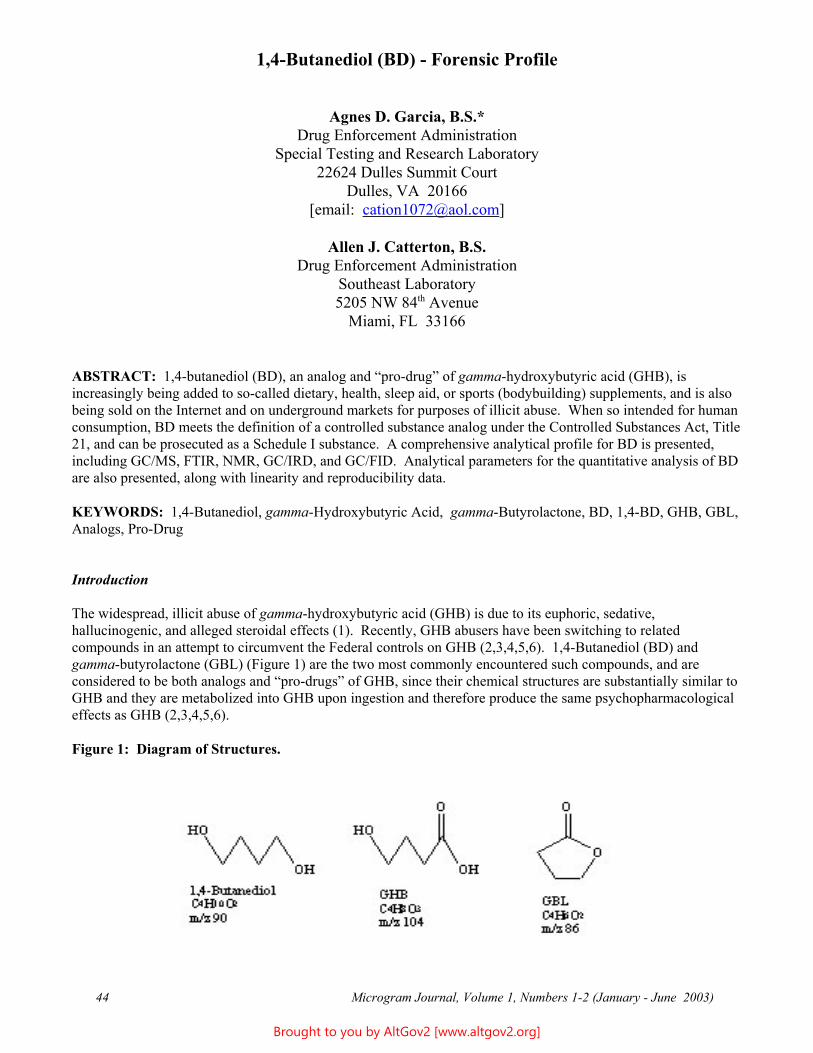
1,4-Butanediol (BD) - Forensic Profile
Agnes D. Garcia, B.S.* Drug Enforcement Administration
Special Testing and Research Laboratory 22624 Dulles Summit Court
Dulles, VA 20166 [email: [email protected]]
Allen J. Catterton, B.S. Drug Enforcement Administration
Southeast Laboratory 5205 NW 84th Avenue
Miami, FL 33166
ABSTRACT: 1,4-butanediol (BD), an analog and “pro-drug” of gamma-hydroxybutyric acid (GHB), is increasingly being added to so-called dietary, health, sleep aid, or sports (bodybuilding) supplements, and is also being sold on the Internet and on underground markets for purposes of illicit abuse. When so intended for human consumption, BD meets the definition of a controlled substance analog under the Controlled Substances Act, Title 21, and can be prosecuted as a Schedule I substance. A comprehensive analytical profile for BD is presented, including GC/MS, FTIR, NMR, GC/IRD, and GC/FID. Analytical parameters for the quantitative analysis of BD are also presented, along with linearity and reproducibility data.
KEYWORDS: 1,4-Butanediol, gamma-Hydroxybutyric Acid, gamma-Butyrolactone, BD, 1,4-BD, GHB, GBL, Analogs, Pro-Drug
Introduction
The widespread, illicit abuse of gamma-hydroxybutyric acid (GHB) is due to its euphoric, sedative, hallucinogenic, and alleged steroidal effects (1). Recently, GHB abusers have been switching to related compounds in an attempt to circumvent the Federal controls on GHB (2,3,4,5,6). 1,4-Butanediol (BD) and gamma-butyrolactone (GBL) (Figure 1) are the two most commonly encountered such compounds, and are considered to be both analogs and “pro-drugs” of GHB, since their chemical structures are substantially similar to GHB and they are metabolized into GHB upon ingestion and therefore produce the same psychopharmacological effects as GHB (2,3,4,5,6).
Figure 1: Diagram of Structures.
Microgram Journal, Volume 1, Numbers 1-2 (January - June 2003) 44
Brought to you by AltGov2 [www.altgov2.org]
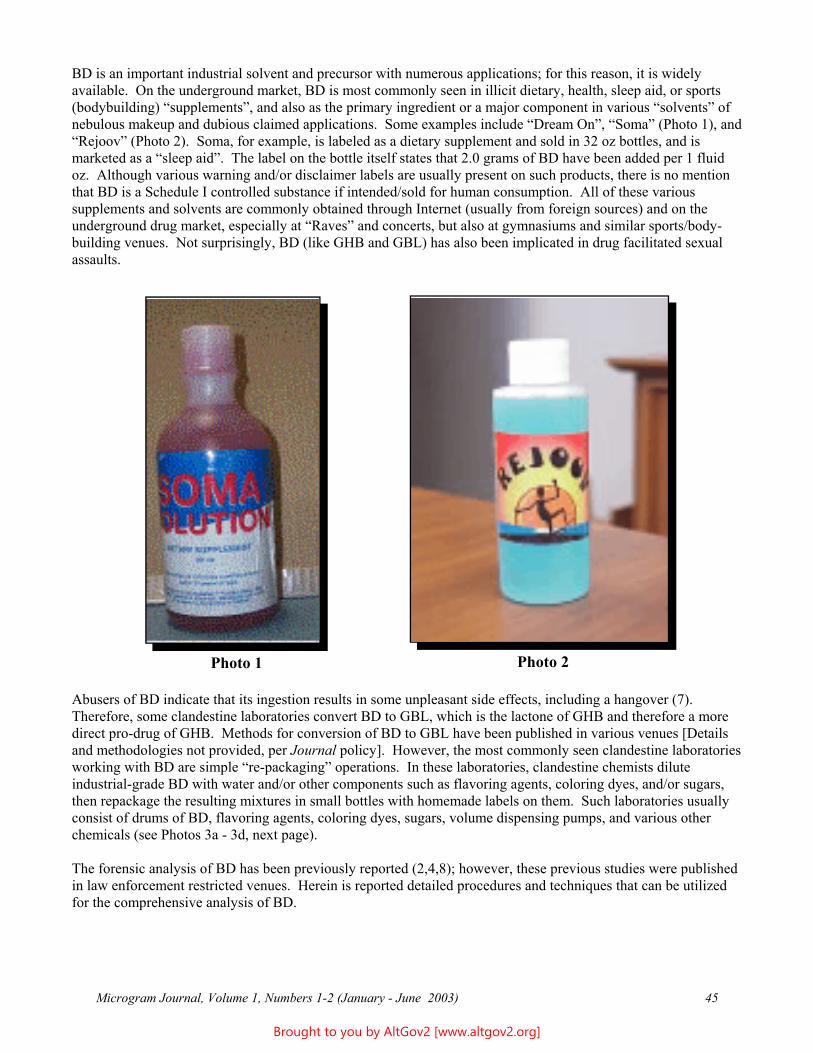
BD is an important industrial solvent and precursor with numerous applications; for this reason, it is widely available. On the underground market, BD is most commonly seen in illicit dietary, health, sleep aid, or sports (bodybuilding) “supplements”, and also as the primary ingredient or a major component in various “solvents” of nebulous makeup and dubious claimed applications. Some examples include “Dream On”, “Soma” (Photo 1), and “Rejoov” (Photo 2). Soma, for example, is labeled as a dietary supplement and sold in 32 oz bottles, and is marketed as a “sleep aid”. The label on the bottle itself states that 2.0 grams of BD have been added per 1 fluid oz. Although various warning and/or disclaimer labels are usually present on such products, there is no mention that BD is a Schedule I controlled substance if intended/sold for human consumption. All of these various supplements and solvents are commonly obtained through Internet (usually from foreign sources) and on the underground drug market, especially at “Raves” and concerts, but also at gymnasiums and similar sports/body-building venues. Not surprisingly, BD (like GHB and GBL) has also been implicated in drug facilitated sexual assaults.
Photo 1 Photo 2
Abusers of BD indicate that its ingestion results in some unpleasant side effects, including a hangover (7). Therefore, some clandestine laboratories convert BD to GBL, which is the lactone of GHB and therefore a more direct pro-drug of GHB. Methods for conversion of BD to GBL have been published in various venues [Details and methodologies not provided, per Journal policy]. However, the most commonly seen clandestine laboratories working with BD are simple “re-packaging” operations. In these laboratories, clandestine chemists dilute industrial-grade BD with water and/or other components such as flavoring agents, coloring dyes, and/or sugars, then repackage the resulting mixtures in small bottles with homemade labels on them. Such laboratories usually consist of drums of BD, flavoring agents, coloring dyes, sugars, volume dispensing pumps, and various other chemicals (see Photos 3a - 3d, next page).
The forensic analysis of BD has been previously reported (2,4,8); however, these previous studies were published in law enforcement restricted venues. Herein is reported detailed procedures and techniques that can be utilized for the comprehensive analysis of BD.
Microgram Journal, Volume 1, Numbers 1-2 (January - June 2003) 45
Brought to you by AltGov2 [www.altgov2.org]
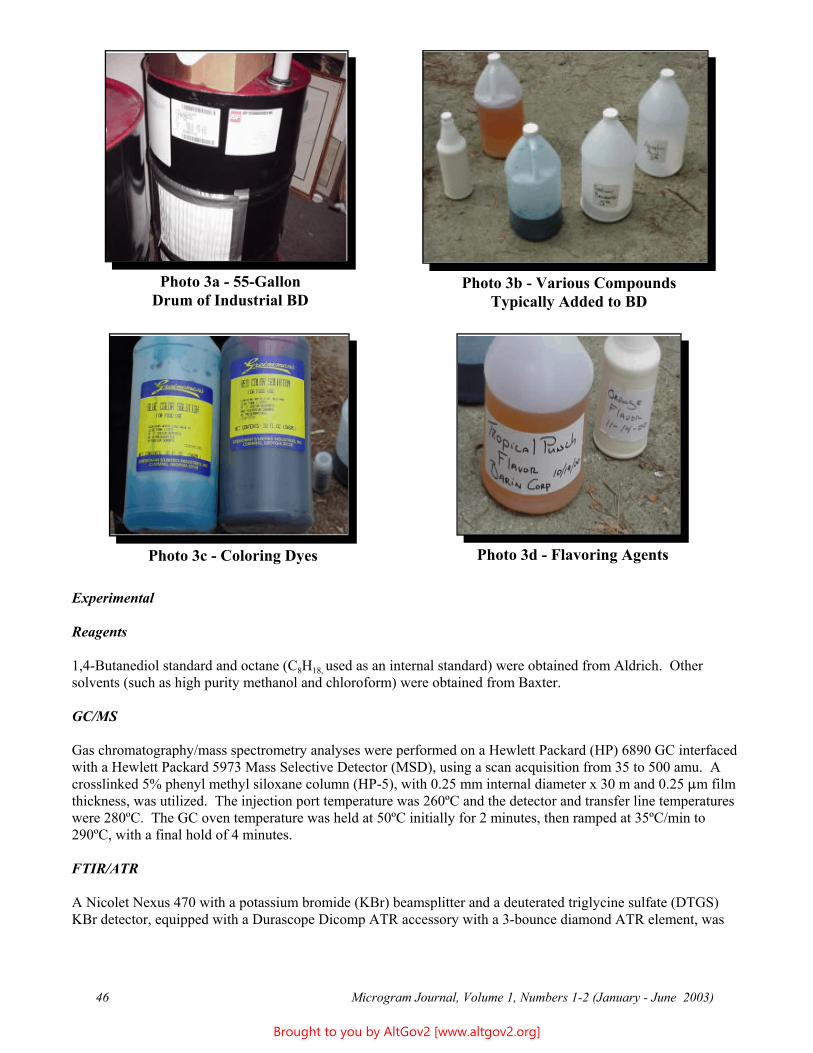
Photo 3a - 55-Gallon Photo 3b - Various CompoundsDrum of Industrial BD Typically Added to BD
Photo 3c - Coloring Dyes Photo 3d - Flavoring Agents
Experimental
Reagents
1,4-Butanediol standard and octane (C8H18, used as an internal standard) were obtained from Aldrich. Other solvents (such as high purity methanol and chloroform) were obtained from Baxter.
GC/MS
Gas chromatography/mass spectrometry analyses were performed on a Hewlett Packard (HP) 6890 GC interfaced with a Hewlett Packard 5973 Mass Selective Detector (MSD), using a scan acquisition from 35 to 500 amu. A crosslinked 5% phenyl methyl siloxane column (HP-5), with 0.25 mm internal diameter x 30 m and 0.25 :m film thickness, was utilized. The injection port temperature was 260ºC and the detector and transfer line temperatures were 280ºC. The GC oven temperature was held at 50ºC initially for 2 minutes, then ramped at 35ºC/min to 290ºC, with a final hold of 4 minutes.
FTIR/ATR
A Nicolet Nexus 470 with a potassium bromide (KBr) beamsplitter and a deuterated triglycine sulfate (DTGS) KBr detector, equipped with a Durascope Dicomp ATR accessory with a 3-bounce diamond ATR element, was
Microgram Journal, Volume 1, Numbers 1-2 (January - June 2003) 46
Brought to you by AltGov2 [www.altgov2.org]
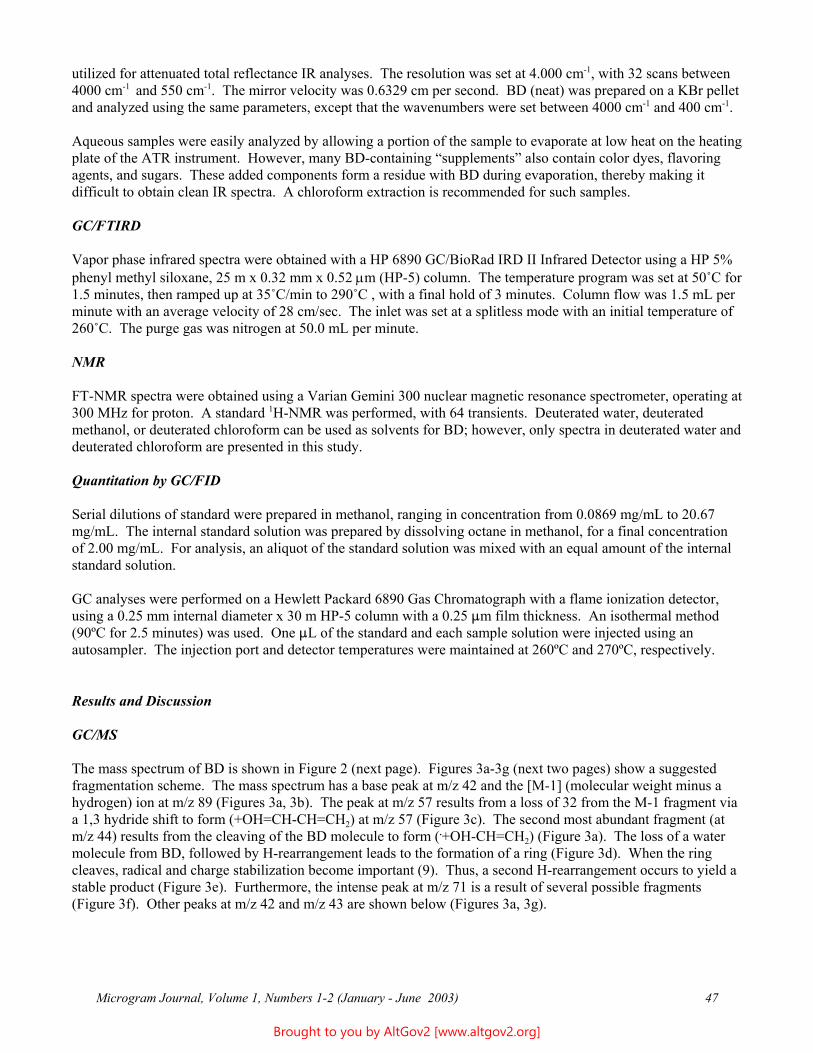
utilized for attenuated total reflectance IR analyses. The resolution was set at 4.000 cm-1, with 32 scans between 4000 cm-1 and 550 cm-1. The mirror velocity was 0.6329 cm per second. BD (neat) was prepared on a KBr pellet and analyzed using the same parameters, except that the wavenumbers were set between 4000 cm-1 and 400 cm-1.
Aqueous samples were easily analyzed by allowing a portion of the sample to evaporate at low heat on the heating plate of the ATR instrument. However, many BD-containing “supplements” also contain color dyes, flavoring agents, and sugars. These added components form a residue with BD during evaporation, thereby making it difficult to obtain clean IR spectra. A chloroform extraction is recommended for such samples.
GC/FTIRD
Vapor phase infrared spectra were obtained with a HP 6890 GC/BioRad IRD II Infrared Detector using a HP 5% phenyl methyl siloxane, 25 m x 0.32 mm x 0.52 µm (HP-5) column. The temperature program was set at 50/C for 1.5 minutes, then ramped up at 35/C/min to 290/C , with a final hold of 3 minutes. Column flow was 1.5 mL per minute with an average velocity of 28 cm/sec. The inlet was set at a splitless mode with an initial temperature of 260/C. The purge gas was nitrogen at 50.0 mL per minute.
NMR
FT-NMR spectra were obtained using a Varian Gemini 300 nuclear magnetic resonance spectrometer, operating at 300 MHz for proton. A standard 1H-NMR was performed, with 64 transients. Deuterated water, deuterated methanol, or deuterated chloroform can be used as solvents for BD; however, only spectra in deuterated water and deuterated chloroform are presented in this study.
Quantitation by GC/FID
Serial dilutions of standard were prepared in methanol, ranging in concentration from 0.0869 mg/mL to 20.67 mg/mL. The internal standard solution was prepared by dissolving octane in methanol, for a final concentration of 2.00 mg/mL. For analysis, an aliquot of the standard solution was mixed with an equal amount of the internal standard solution.
GC analyses were performed on a Hewlett Packard 6890 Gas Chromatograph with a flame ionization detector, using a 0.25 mm internal diameter x 30 m HP-5 column with a 0.25 :m film thickness. An isothermal method (90ºC for 2.5 minutes) was used. One :L of the standard and each sample solution were injected using an autosampler. The injection port and detector temperatures were maintained at 260ºC and 270ºC, respectively.
Results and Discussion
GC/MS
The mass spectrum of BD is shown in Figure 2 (next page). Figures 3a-3g (next two pages) show a suggested fragmentation scheme. The mass spectrum has a base peak at m/z 42 and the [M-1] (molecular weight minus a hydrogen) ion at m/z 89 (Figures 3a, 3b). The peak at m/z 57 results from a loss of 32 from the M-1 fragment via a 1,3 hydride shift to form (+OH=CH-CH=CH2) at m/z 57 (Figure 3c). The second most abundant fragment (at m/z 44) results from the cleaving of the BD molecule to form (.+OH-CH=CH2) (Figure 3a). The loss of a water molecule from BD, followed by H-rearrangement leads to the formation of a ring (Figure 3d). When the ring cleaves, radical and charge stabilization become important (9). Thus, a second H-rearrangement occurs to yield a stable product (Figure 3e). Furthermore, the intense peak at m/z 71 is a result of several possible fragments (Figure 3f). Other peaks at m/z 42 and m/z 43 are shown below (Figures 3a, 3g).
Microgram Journal, Volume 1, Numbers 1-2 (January - June 2003) 47
Brought to you by AltGov2 [www.altgov2.org]
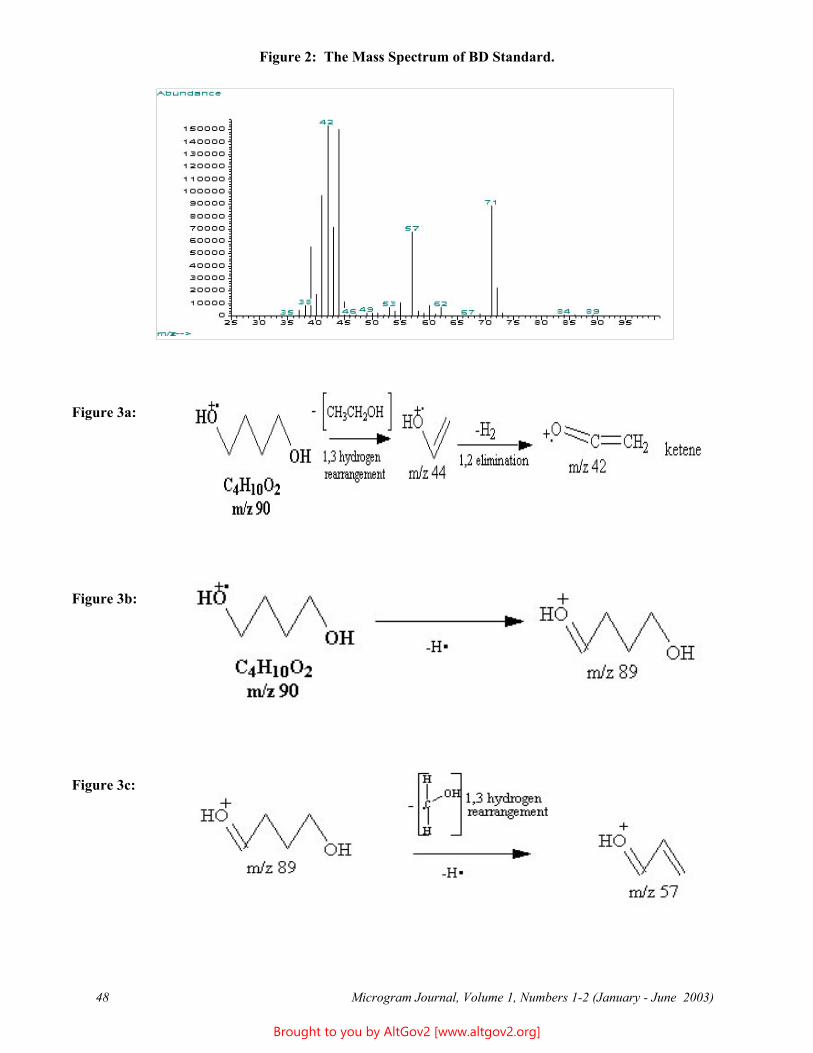
Figure 2: The Mass Spectrum of BD Standard.
Figure 3a:
Figure 3b:
Figure 3c:
Microgram Journal, Volume 1, Numbers 1-2 (January - June 2003) 48
Brought to you by AltGov2 [www.altgov2.org]
Figure 3d:
Figure 3e:
Figure 3f:
Figure 3g:
FTIR/ATR
The FTIR/ATR spectrum of BD (Figure 4a, next page) has significant bands at 2936 and 2867 cm-1. The 2936 cm-1 peak is due to the asymmetric stretching of the methylene groups, while the symmetric stretching of the methylene groups causes the weaker 2867 cm-1 peak. Wagging of the methylene groups causes a series of bands from 1380 to 1150 cm-1. The broad band at 3300 cm-1 is due to inter- and intramolecular hydrogen bonding. The most prominent peak is at 1048 cm-1 and is due to the two primary alcohol groups (10).
Microgram Journal, Volume 1, Numbers 1-2 (January - June 2003) 49
Brought to you by AltGov2 [www.altgov2.org]
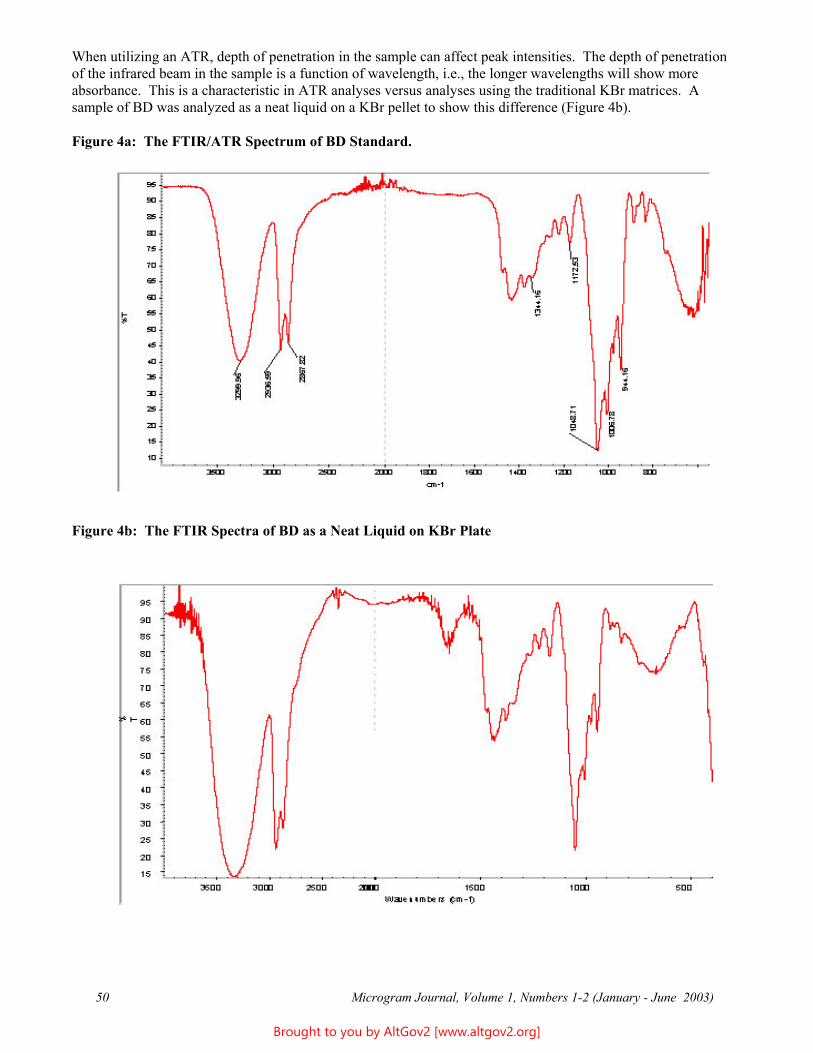
When utilizing an ATR, depth of penetration in the sample can affect peak intensities. The depth of penetration of the infrared beam in the sample is a function of wavelength, i.e., the longer wavelengths will show more absorbance. This is a characteristic in ATR analyses versus analyses using the traditional KBr matrices. A sample of BD was analyzed as a neat liquid on a KBr pellet to show this difference (Figure 4b).
Figure 4a: The FTIR/ATR Spectrum of BD Standard.
Figure 4b: The FTIR Spectra of BD as a Neat Liquid on KBr Plate
Microgram Journal, Volume 1, Numbers 1-2 (January - June 2003) 50
Brought to you by AltGov2 [www.altgov2.org]
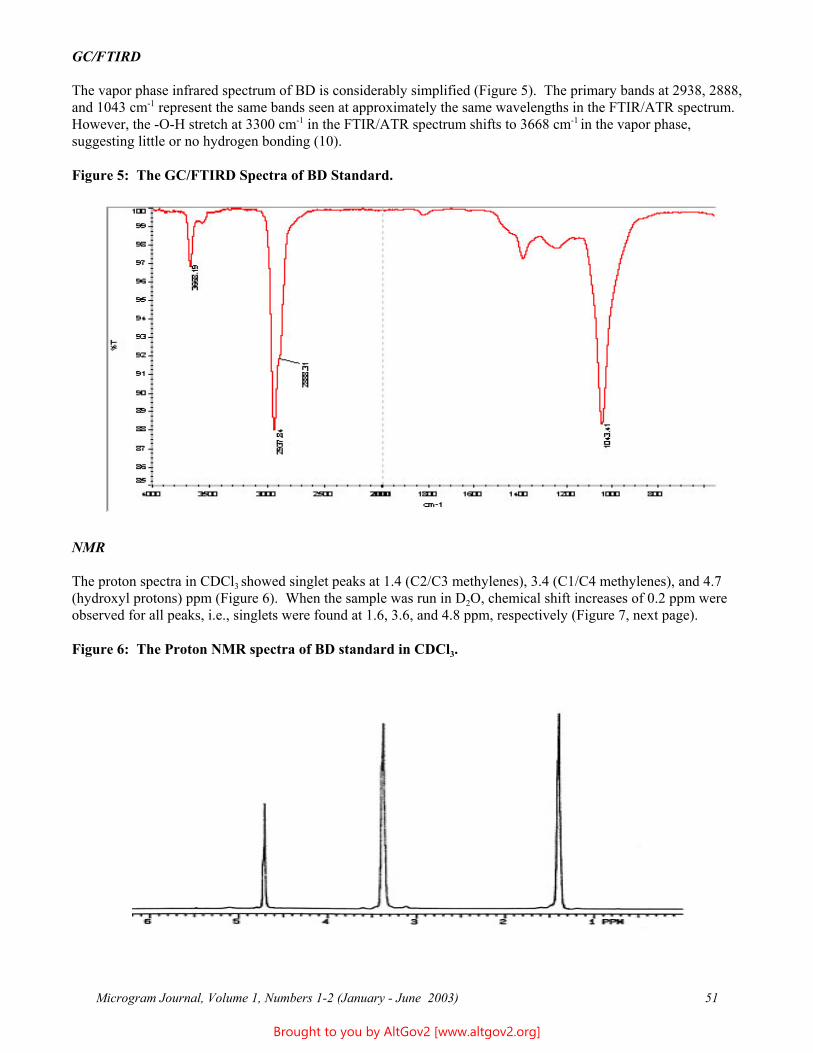
GC/FTIRD
The vapor phase infrared spectrum of BD is considerably simplified (Figure 5). The primary bands at 2938, 2888, and 1043 cm-1 represent the same bands seen at approximately the same wavelengths in the FTIR/ATR spectrum. However, the -O-H stretch at 3300 cm-1 in the FTIR/ATR spectrum shifts to 3668 cm-1 in the vapor phase, suggesting little or no hydrogen bonding (10).
Figure 5: The GC/FTIRD Spectra of BD Standard.
NMR
The proton spectra in CDCl3 showed singlet peaks at 1.4 (C2/C3 methylenes), 3.4 (C1/C4 methylenes), and 4.7 (hydroxyl protons) ppm (Figure 6). When the sample was run in D2O, chemical shift increases of 0.2 ppm were observed for all peaks, i.e., singlets were found at 1.6, 3.6, and 4.8 ppm, respectively (Figure 7, next page).
Figure 6: The Proton NMR spectra of BD standard in CDCl3.
Microgram Journal, Volume 1, Numbers 1-2 (January - June 2003) 51
Brought to you by AltGov2 [www.altgov2.org]
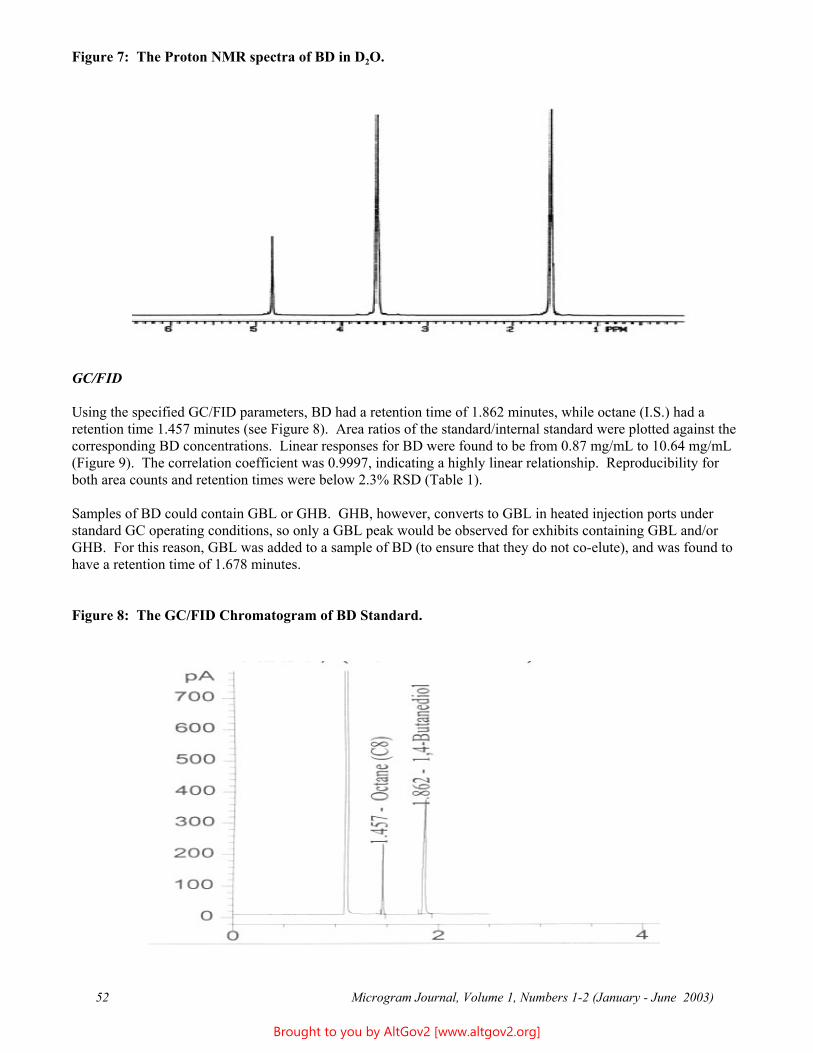
Figure 7: The Proton NMR spectra of BD in D2O.
GC/FID
Using the specified GC/FID parameters, BD had a retention time of 1.862 minutes, while octane (I.S.) had a retention time 1.457 minutes (see Figure 8). Area ratios of the standard/internal standard were plotted against the corresponding BD concentrations. Linear responses for BD were found to be from 0.87 mg/mL to 10.64 mg/mL (Figure 9). The correlation coefficient was 0.9997, indicating a highly linear relationship. Reproducibility for both area counts and retention times were below 2.3% RSD (Table 1).
Samples of BD could contain GBL or GHB. GHB, however, converts to GBL in heated injection ports under standard GC operating conditions, so only a GBL peak would be observed for exhibits containing GBL and/or GHB. For this reason, GBL was added to a sample of BD (to ensure that they do not co-elute), and was found to have a retention time of 1.678 minutes.
Figure 8: The GC/FID Chromatogram of BD Standard.
Microgram Journal, Volume 1, Numbers 1-2 (January - June 2003) 52
Brought to you by AltGov2 [www.altgov2.org]
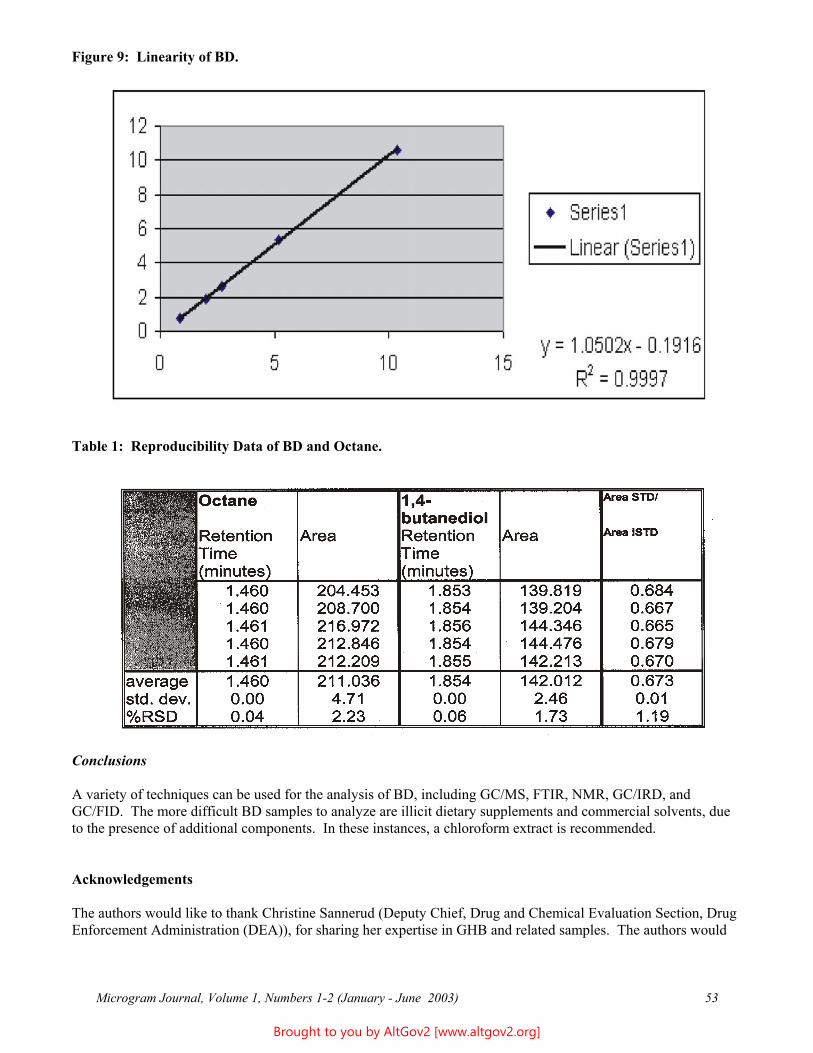
Figure 9: Linearity of BD.
Table 1: Reproducibility Data of BD and Octane.
Conclusions
A variety of techniques can be used for the analysis of BD, including GC/MS, FTIR, NMR, GC/IRD, and GC/FID. The more difficult BD samples to analyze are illicit dietary supplements and commercial solvents, due to the presence of additional components. In these instances, a chloroform extract is recommended.
Acknowledgements
The authors would like to thank Christine Sannerud (Deputy Chief, Drug and Chemical Evaluation Section, Drug Enforcement Administration (DEA)), for sharing her expertise in GHB and related samples. The authors would
Microgram Journal, Volume 1, Numbers 1-2 (January - June 2003) 53
Brought to you by AltGov2 [www.altgov2.org]
also like to acknowledge Senior Forensic Chemist Donald Cooper (DEA Special Testing and Research Laboratory, Dulles, VA) and Forensic Chemist Walter Rodriguez (DEA Southeast Laboratory, Miami, FL), for their time and expertise in helping interpret the mass spectrum of BD. Special thanks also goes to Task Force Officer Brian Ballard (Atlanta, GA) for supplying Rejoov and BD clandestine laboratory pictures and valuable information on Internet purchases. Gratitude also goes to Forensic Chemist Amy Bederka (County Bureau of Identification, Raleigh City, NC) for useful conversations and pictures regarding Rejoov samples.
References
1. For a general review, see: Hornfeldt CS, Lothridge K, Downs JCU. Forensic Science Communications 2002;4(1):(No Page Numbers); reprinted in: Microgram 2002;35(4):102.
2. Chew S. 1,4-Butanediol in Liquid Exhibit. Microgram 1997;30(7):154-159.
3. Morris JA. Analogs of GHB. Part 1: Theoretical perspective. J Clan Lab Invest Chem Assoc 2000;10(2):18-20.
4. Morris JA. Analogs of GHB. Part 2: Analytical perspective. J Clan Lab Invest Chem Assoc 2001;11(1):16.
5. Anonymous. Information Bulletin: GHB Analogs - GBL, BD, GHV, and GVL. NDIC Publication 2002-L0424-003 www.usdoj.gov/ndic/pubs/1621/index.htm
6. McCauley HA, Machal AC, Ciolino LA, Mesmer MZ, Satzger RD. GHB, GBL, BD: A recipe for disaster. Proceedings of the American Academy of Forensic Sciences 2000;6:43.
7. Ballard B (Task Force Officer, Drug Enforcement Administration, Atlanta Division), Personal Communication, 2000.
8. Walker L. Maple syrup and 1,4-butanediol. J Clan Lab Invest Chem Assoc 2000;10(3):13-16.
9. McLafferty FW. Interpretation of Mass Spectra 3rd Edition University Science Books:1980.
10. Colthup NB, Daly LH, Wiberley SE. Introduction to Infrared and Raman Spectroscopy, 2nd Ed., Academic Press, Inc.:1975, pp. 220-320.
* * * * *
Microgram Journal, Volume 1, Numbers 1-2 (January - June 2003) 54
Brought to you by AltGov2 [www.altgov2.org]
Detection and Analysis of Drugs of Forensic Interest, 1992 - 2001; A Literature Review
Robert F.X. Klein, Ph.D.* U.S. Drug Enforcement Administration
Office of Forensic Sciences Laboratory Support Section
2401 Jefferson Davis Highway Alexandria, VA 22301
[email: [email protected]]
Patrick A. Hays, B.S. U.S. Drug Enforcement Administration
Special Testing and Research Laboratory 22624 Dulles Summit Court
Dulles, VA 20166
ABSTRACT: The scientific literature of the detection and analysis of drugs of forensic interest, as published from 1992 through 2001, is reviewed. 1,377 references are included.
KEYWORDS: Forensic Chemistry, Analytical Chemistry, Illicit Drugs, Controlled Substances, Review
Introduction
This review presents a 10 year survey of the detection and analysis of drugs of forensic interest, as published in the mainstream scientific literature from 1992 through 2001. Analyses of drugs in post-ingestion biological matrices are not included, except for select studies which provide structural, spectral, and/or analytical data above and beyond routine toxicological “screening” techniques. In addition, due to their inherently transitory nature, Internet references are not included. Finally, forensic association newsletters and “underground” publications are not included.
Articles are first organized by overall focus, and subcategorized (where applicable) by specific drug or drug class, or instrumental technique. The focus categories are as follows:
* Previous Reviews and Overviews* Analyses of Specific Drugs and Drug Groups
- Illicit Drugs- Select Adulterants and Diluents- Occluded Solvents
* Simultaneous Analyses of Drugs in the Presence of Select Adulterants and Diluents * Instrumentation Focus * Analytical Artifacts * Qualitative Tests* Sampling Plans * Source Determination/Impurity Profiling * Source Determination/Stable Isotope Analyses * Comparative Analyses * Reference Standards
Microgram Journal, Volume 1, Numbers 1-2 (January - June 2003) 55
Brought to you by AltGov2 [www.altgov2.org]
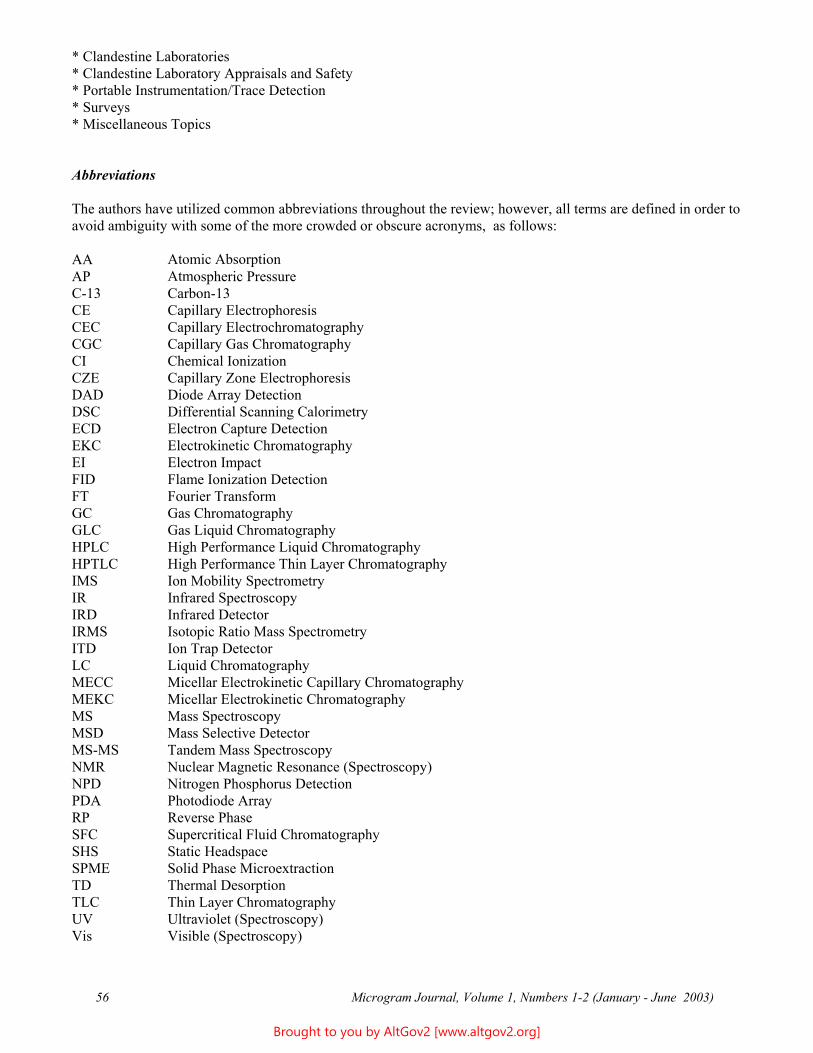
* Clandestine Laboratories* Clandestine Laboratory Appraisals and Safety * Portable Instrumentation/Trace Detection * Surveys * Miscellaneous Topics
Abbreviations
The authors have utilized common abbreviations throughout the review; however, all terms are defined in order to avoid ambiguity with some of the more crowded or obscure acronyms, as follows:
AA AP C-13 CE CEC CGC CI CZE DAD DSC ECD EKC EI FID FT GC GLC HPLC HPTLC IMS IR IRD IRMS ITD LC MECC MEKC MS MSD MS-MS NMR NPD PDA RP SFC SHS SPME TD TLC UV Vis
Atomic Absorption Atmospheric Pressure Carbon-13 Capillary Electrophoresis Capillary Electrochromatography Capillary Gas Chromatography Chemical Ionization Capillary Zone Electrophoresis Diode Array Detection Differential Scanning Calorimetry Electron Capture Detection Electrokinetic Chromatography Electron Impact Flame Ionization Detection Fourier Transform Gas Chromatography Gas Liquid Chromatography High Performance Liquid Chromatography High Performance Thin Layer Chromatography Ion Mobility Spectrometry Infrared Spectroscopy Infrared Detector Isotopic Ratio Mass Spectrometry Ion Trap Detector Liquid Chromatography Micellar Electrokinetic Capillary Chromatography Micellar Electrokinetic Chromatography Mass Spectroscopy Mass Selective Detector Tandem Mass Spectroscopy Nuclear Magnetic Resonance (Spectroscopy) Nitrogen Phosphorus Detection Photodiode Array Reverse Phase Supercritical Fluid Chromatography Static Headspace Solid Phase Microextraction Thermal Desorption Thin Layer Chromatography Ultraviolet (Spectroscopy) Visible (Spectroscopy)
Microgram Journal, Volume 1, Numbers 1-2 (January - June 2003) 56
Brought to you by AltGov2 [www.altgov2.org]
Previous Reviews and Overviews
The forensic analysis of illicit drugs has been the subject of a number of minor review articles and monographs over the past 10 years (1,2,3,4,5,6,7,8,9). In addition, several articles have given more general overviews of the field (10,11). Systematic approaches to substance identification have also been presented (12,13,14), and a number of scientific working groups are currently establishing national/international standards for forensic analysis of illicit drugs (15,16,17(see also:18)). Finally, forensic chemistry has been the subject of several textbooks and chapters in textbooks (19,20,21,22,23,24,25,26).
Analyses of Specific Drugs and Drug Groups
An immense amount of analytical data has been published over the past 10 years for drugs of abuse. “Comprehensive” data compilations (defined in this context as three or more analytical profiles in a specific study) have been previously provided for virtually all “traditional” drugs of abuse, but a number of updated compilations have been provided which reflect improvements in existing instrumentation and/or the advent of new instrumental techniques. In addition, “comprehensive” data compilations have been provided for a number of new drugs of abuse; these include previously unknown “designer,” “analog,” or “homolog” drugs, and also various pharmaceuticals or industrial chemicals which either had not been previously subject to abuse, or had been only rarely encountered in illicit settings. Furthermore, hundreds of studies which analyzed either specific drugs of abuse or groups of structurally related drugs of abuse, but only by one or two select analytical techniques, have also been provided. [Note that multiple citations are organized as follows: reviews, then overviews, then comprehensive studies, then by specific analytical techniques (alphabetized), and finally in reverse date order (most recent citation first).]
Controlled Substances: Over the past 10 years, the following substances were the subjects of moderate to comprehensive analytical profiling: alkyl nitrites (inhalants) (comprehensive) (27), by GC-IR (28), and by headspace GC/MS (29); Amanita Muscaria by ion-interaction HPLC (30); amphetamine by CE (31), by CE and LC (32), by GC-MS (role of self-protonation) (33), by HPLC (after acetylation) (34), by HPLC using chiral crown ether coated reversed-phase packing (35), and by HPLC using a two-dimensional column-switching chromatographic system with on-line derivatization (36); amphetamine and methamphetamine - (general review of the syntheses and analyses of phenylacetone, amphetamine, and methamphetamine) (37), in abuser’s clothing by HPLC with UV and fluorescence detection (38), by CE with cyclodextrins to determine isomers (39), by GC and GC-MS versus internal standards (40), by GC-CI/MS (following derivatization with perfluorinated acid chlorides) (41), by headspace sampling and GC-MS (analysis of betel) (42), by HPLC (43,44), by HPLC for quantitation of clandestinely produced mixtures (45,46), by MS (47), by micro-Raman scattering (48), by surface enhanced Raman scattering detection after modification with 2-mercaptonicotinic acid (49), and by UV/Vis spectrophotometry after derivatization with 1,2-naphthoquinone-4-sulfonic acid (50); amphetamines (review of biological/forensic issues (includes amphetamine and methamphetamine analogues)) (51), by CE (52,53), by CE (chiral) (54), by CE with added anionic chiral selectors (55), by CE and LC (56), by color tests, TLC, GC/MS, GC/IR, plus GC/IR/MS of N-acetyl derivatives (differentiation of side chain isomers of ring-substituted amphetamines (4-Me, 4-OMe, 3,4-MD- amphetamine and methamphetamine)) (57), by CZE (58), by CZE with added cyclodextrins (59), by EI-MS (N-substituted amphetamines) (60), by GC (61), by GC, HPLC, and MS (62), by GC-FTIR (63), by GC/MS (64,65), by GC-MS (differentiation of acylated derivatives of methamphetamine and regioisomeric phenethylamines) (66,67), by HPLC with added cyclodextrins and using a chiral stationary phase (68), by HPLC with fluorimetric detection (69), by HPLC after derivatization with chloroformates (70), by LC with fluorimetric detection after precolumn derivatization with (+)-1-(9-fluorenyl)ethylchloroformate (71), by MECC (72), by negative-ion CI-MS (73), by carbon dioxide negative-ion CI-MS (74), by SFC (75), by SFC, HPLC, GC, and CZE (76), by TLC with diazonium salts as visualization reagents (77), and by GC/FID using n-alkanes and other indirect reference standards when no internal standard is available (78); ayahuasca by GC and GC/MSD (79); barbiturates by HPLC with PDA-UV detection (80), by HPLC using 3-(18-naphthalimido)-propyl-modified silyl silica gel as a stationary phase (81), by micro-HPLC with post-column photochemical derivatization (82), by ion-trap and quadrupole MS (83), by IR and MS (84), by mercurimetric potentiometric
Microgram Journal, Volume 1, Numbers 1-2 (January - June 2003) 57
Brought to you by AltGov2 [www.altgov2.org]
determination using a solid-state iodide ion-selective electrode (85), by micellar LC (86,87), by SPME and CE (88), by SPME and ion-trap GC-MS (89), by a thermally tuned tandem column (separation of barbiturates and phenylthiohydantoin amino acids) (90), and by two-dimensional overpressured layer chromatography (91); benzodiazepines by CE (92), by electrospray probe/MS (93), by free zone electrophoresis (94), by FT-Raman and FT-IR (95), by HPLC (nitrazepam, diazepam, and medazepam) (96), by HPLC (clorazepate, diazepam, and diltiazem in pharmaceuticals) (97), by HPLC-DAD (98,99), by HPLC using diode-array, electrochemical, and thermospray MS detection (100), by HPLC/electrospray MS-MS (101), by HPTLC (diazepam, chlordiazepoxide, and midazolam) (102), by MECC (103,104), by SERS after adsorption on the Ag colloidal surface (diazepam and nitrazepam) (105), by LC (alprazolam) (106), by microcolumn LC using a cholesteryl-10-undecenoate bonded phase (107), by RP-LC (flurazepam) (108), and by automated SPME-LC/EI-MS (109); 1-benzyl-1-n-butyl-barbituric acid (comprehensive) (110); bromazepam by flow injection stopped-flow kinetic determination (111); 4-bromo-2,5-dimethoxyphenethylamine (2C-B or NEXUS) and related compounds (overview) (112), (comprehensive) (113,114), by GC/MS and HPLC (115), by GC-MS and NMR (including analysis of derivatized samples) (116), and by LC and GC/MS (117,118,119); bufotenine (comprehensive) (120,121), and by GC/MS after BSTFA derivatization (122); bufotenine, psilocybin and related indole alkaloids by CE (123), by GC/CI-MS (124), by GC/IRD (125,126), by GC/MS (includes general overview) (127), and by MS (128); [“Love Stone” (contains bufotenine) (overview) (129), (overview and GC/MS) (130), and by GC/MS (comparison with Chinese “Chan Su”) (131)]; cathinone (alpha-aminopropiophenone) (review with 79 refs) (132), (comprehensive) (133), by NMR (enantiomeric determination of N-acetylcathinone) (134), and by spectrophotometric detection (135); 2-chloro-4,5-methylenedioxymethamphetamine (comprehensive) (136); clenbuterol by CE (chiral analysis with added CD’s) (137), by EKC (epinephrine, terbutaline, clenbuterol, and salbutamol) (138), by flow-injection fluorimetry (139), by GC after derivatization and electrospray MS (140), and by RP-HPLC (141); cocaine by CE (simultaneous analysis of coca alkaloids and sugars in illicit cocaine) (142), by free-zone CE (143), by DSC (and GC/FID) (144), by FT-IR and HPTLC (145), by flow injection analysis with amperometric detection (146), by FTIR, GC/MS, and quantitative GC (cocaine HCl in wax) (147), by GC (cocaine base) (148), by GC/MS after field testing (149), by HPLC (150,151), by HPLC and GLC (152), by an ISFET device, GC, and UV (153), by LC/AP-CI-MS (154), by MS (evaluation of fragmentation patterns (155), by collision induced dissociation MS (156), by MECC (157), by Raman microspectroscopy (158,159), by SPME/GC/MS (methylbenzoate from cocaine) (160), by TLC, GC, UV, and GC/MS (identification of cocaine in samples in the presence of other local anesthetics) (161), and by transmission and internal reflection IR (cocaine base versus HCl) (162,163); cocaine analogs by NMR (164), cocaine base (comprehensive) (165); cocaine-N-oxide by LC and MS (166); coca tea by solid-phase extraction followed by GC-MS (167); codeine by chemiluminescence (168), by LC and LC-MS/MS (169), and by NMR (170); codeine pharmaceuticals by CE (171), by free solution CE (172), and by HPLC (173); creatine (comprehensive) (174,175), and by TLC/densitometry (176); cyclofenil (comprehensive) (177); cyclohexyl nitrite (comprehensive) (178); dexfenfluramine by HPLC on a chiral column (179); diazepam by ion-trap and quadrupole mass spectroscopy (180), and by polarography (181); dihydroetorphine and etorphine (comprehensive) (182); 2,5-dimethoxy-4-ethylthiophenethylamine (2CT-2) by IR, GC/IRD, and GC/MS (183); 2,5-dimethoxy-4-(N)-propylthio-phenethylamine (2C-T-7) (comprehensive) (184); dimethpramide (comprehensive) (185,186,187); dimethylaminorex (comprehensive) (188); dimethylamphetamine by GC, IR, and UV/VIS (stability study) (189), by GC/MS, HS-GC/MS, and LC-ESI/MS (analysis of dimethylamphetamine pyrolysis products) (190); dragon’s blood incense (overview) (191), and by GC/MS (192); ergot alkaloids (review) (193), determination and isolation by LC (194), by LC with fluorescence detection (195), and determination of ergonovine maleate by flow injection analysis with chemiluminescence detection (196); etonitazene (comprehensive) (197); fenethylline by IR, UV, and TLC (198), and by TLC, UV/VIS, and toolmarks (199); fentanyl (review) (200), and by cyclic voltametry (201); fentanyl and fentanyl analogs (review) (202), by RP-HPLC (203), and by GC, GC/MS, and IR (204); Flos Daturae by CE (205); flunitrazepam (Rohypnol) (overview) (206), (comprehensive) (207,208), by color testing (screening) (209), by derivatization followed by TLC with fluorescence detection (urine screening focus) (210), by FTIR, FT-Raman, and NMR (degradation study) (211), and by screening techniques (overview) (212); 4-fluorophenylacetone, 4-fluoroamphetamine and 4-fluoromethamphetamine (comprehensive) (213); para-fluorofentanyl (comprehensive) (214), heroin by bioluminescent assay (215), by CZE (216), by rapid GC (217), by GC/MS, FTIR, and TLC (for determination of heroin base in heroin citrate) (218), by HPLC (degradation study) (219), by IR and TLC (220), by continuous flow IRMS (221), by MECC
Microgram Journal, Volume 1, Numbers 1-2 (January - June 2003) 58
Brought to you by AltGov2 [www.altgov2.org]
(222,223), by NMR (224), and by TLC (225); heroin and related morphine alkaloids by HPCE (226); heroin and amphetamine by CE (227); human chorionic gonadotropin (beta subunit) by MS (228); gamma-hydroxybutyric acid (GHB) or gamma-hydroxybutyrate (review) (229), (overview) (230), (comprehensive) (231,232,233), by free zone CE with direct UV detection of GHB (234), by color testing (235), by FTIR and color testing (236), by GC/MS after extraction on a SPME fiber and derivatization with BSTFA (237), by ICP-atomic emission and MS (includes ephedrine) (238), by IR using a 3-bounce diamond ATR element (239), by microcrystal testing with cupric nitrate/silver nitrate solution (240), by NMR (241), and by SPME -GC/quadrupole ion trap spectrometry (242); gamma-hydroxybutyric acid (GHB) and gamma-butyrolactone (GBL) (interconversion study) (243,244), by CE and HPLC (245), by GC/MS with BSTFA derivatization (246), by HPLC (247), by HPLC/UV-VIS and HPLC/thermospray MS (248), gamma-butyrolactone in wine by GC/MS (249); gamma-hydroxybutyric acid (GHB), gamma-butyrolactone (GBL), 1,4-butanediol (BD), tetrahydrofuran (THF), and/or GHB/GBL analogs (overview, comprehensive) (250), (overview of analysis of GHB, GBL, and BD) (251), (overview of GHB, GABA, and various analogs) (252), by CE (253), (comprehensive) (BD in a liquid exhibit) (254), and by GC/MS and FT-IR (BD) (255); N-(2-hydroxyethyl)-amphetamine (comprehensive) (256,257); N-hydroxy-3,4-methylenedioxyamphetamine by GC-FTIR after derivatization (258); N-hydroxy-3,4-methylenedioxymethamphetamine (comprehensive) (259), and by GC and GC/MS (260); imazalil (comprehensive) (261); imipramine by flow-injection extraction - spectrophotometric determination with methyl orange (262); jimson weed (overview and analysis by GC/MS: 263); ketamine (comprehensive) (264), and by GC and GC/MS (265); khat (Catha Edulis) by GC and GC/MS after derivatization with (R)-(+)-alpha-methoxy-alpha-(trifluoromethyl)phenylacetic acid (266), by GC/MS (267,268,269), by GC/MS/MS (270), by HPLC and TLC (271), and by NMR (272); lorazepam by UV (273); lysergic acid diethylamide (LSD) (review) (274), (overview, comprehensive) (275), (comprehensive) (276), by enzyme immunoassay and immunoaffinity extraction and HPLC-MS (277), by GC (278), by GC/MS using electronic pressure controls and pulsed split injection (279), by GC/MS/FTIR (280), by GLC (281), by HPLC (282), by HPLC and GLC (283), by MECC (284), by NMR (285), and by automated TLC (286); LSD and psilocin - by GC/MS and GC/MS-MS (287); marijuana and related cannabinoids by botanical and microscopic examination and GC/FID (288), by CEC (289,290), by DNA analysis (291,292), by the Duquenois-Levine test (on charred marijuana residue) (293), by fluoroimmunoassay (294), by GC and GC-FTIR (includes ephedrine and pseudoephedrine) (295,296), by GC, HPLC, and TLC (297), by GC/FID (versus cannabidiol as a reference standard (298), (versus cannabinol as a reference standard) (299), by GC/MS (300,301), by HPLC (302,303), by HPLC (seeds) (304), by HPLC of neutral cannabinoids of marijuana and hashish after supercritical fluid extraction (305), by LC/MS and LC/MS-MS (306), by plant propagation (determination of viability of stem cuttings) (307), by SFC/AP-CI-MS (308), by TLC and botanical characterization of morphological features (309), by monoclonal antibody (against tetrahydrocannabinolic acid) (310), and by GC/MS (butyl cannabinoids in marijuana) (311); mescaline in hallucinogenic Cactaccae by ion-interaction HPLC (312), and in peyote by GC/MS (comparison of 6 different extraction procedures) (313); methamphetamine (and related compounds) comprehensive (314), by CE (chiral analysis) (315), by diasteriomeric salt formation (316), by FT-Raman (317), by GC, HPLC, and/or CE following derivatization (for enantiomer determination) (318), by full scan GC-ion trap EI- and CI-MS (319), by GC/MS (improving ion mass ratio performance at low concentrations through internal standard selection) (320), by HPLC with circular dichroism detection for determination of enantiomers (321), by IR (chiral analysis) (322,323), by NMR (chiral analysis) (324), by TD-IMS and SIMPLISMA (325), and by CE with UV and LIF detection (326); methaqualone (review) (327), and by color testing (includes mecloqualone) (328); methcathinone (ephedrone) (review) (329), (comprehensive) (330), by GC and GC/MS (methcathinone and some designer analogues) (331), by GC and GC/MS after chiral derivatization with S-(-)-(trifluoroacetyl)-prolyl chloride (332), by GC/MS (333), and by animal testing (potency comparison of enantiomers; includes syntheses) (334); methcathinone and cathinone (comprehensive) (335); 4-methoxyamphetamine (PMA) and 4-methoxymethamphetamine (PMMA) (comprehensive) (336), and 2-, 3-, 4-PMA, PMMA, and P2P (comprehensive) (337); 3-methoxy-4,5-methylenedioxyamphetamine (comprehensive) (338,339); 2,3-methylenedioxyamphetamines (comprehensive) (340); 2,3- and 3,4-methylenedioxyamphetamines (combined studies) by GC/MS-MS (341,342), by LC and MS (343,344); 3,4-methylenedioxyamphetamines (MDA’s) (general review of the syntheses and analyses of MDA’s and precursors and related compounds) (345), (comprehensive) (346), by C-13 solid-state NMR (347), by CE (348,349), by field testing (350), bt FT-IR (for tablets) (351), by FT-IR microscope (352), by FTIR and GC/MS (353), by GC (tablets) (354), by GC and GC/MS
Microgram Journal, Volume 1, Numbers 1-2 (January - June 2003) 59
Brought to you by AltGov2 [www.altgov2.org]
(355), by GC/MS (356), by HPLC with fluorimetric detection (357), by HPLC with fluorometric detection, using added cyclodextrins (chiral analysis) (358), by HPTLC using 0-benzenesulfonamido-p-benzoquinone for detection (359), by LC (360), by ion trap MS (361), by LC-MS with thermospray, electrospray, and APCI interfaces (362), by RP-LC, GC, and EI-MS methods (363), by NIR and HPLC (of tablets, including MDEA and amphetamines) (364,365), by NMR (366,367), by Raman (368,369), and by SERS (370); methylenedioxycathinones (comprehensive) (371), and by melting points (372); methylenedioxyethylamphetamine (MDEA) (comprehensive) (373,374,375); methylenedioxymethamphetamine (MDMA) (comprehensive) (“crystal” MDMA) (376), by CE (377), by FTIR (for determination of hydration polymorphism) (378 and 379), by C-13 NMR (380), by FTIR (MDMA phosphate) (381), by HPLC (382), and by X-ray crystallography (383); (3,4-methylenedioxyphenyl)-2-butanamines (MBDB’s) (comprehensive) (384), by GC/MS and LC (385,386,387,388), and a comparative study of N,N-dimethyl-3,4-methylenedioxyamphetamine and N-methyl-1-(3,4-methylenedioxyphenyl)-2-butanamine (389); 3-methylfentanyl (comprehensive) (390); 4-methylfentanyl (comprehensive) (391); methylmethaqualone by NMR (392); methylphenidate by CE (393); 1-(4-methyl-phenyl)ethylamine (comprehensive) (394); N-methyl-1-phenylethylamine (comprehensive) (395,396); 4-methylthioamphetamine (comprehensive) (397,398), by GC/MS and FTIR (399), and by LC-MS/MS (400); midazolam by UV/Vis (401); morphine by aqueous and nonaqueous CE (for quantitative determination of morphine in pharmaceuticals) (402), by flow-injection analysis with spectrophotometric determination (403), by HPLC with chemiluminescence detection (404), with a fluoride-selective electrode following derivatization with 1-fluoro-2,4-dinitrobenzene (405), and by displacement TLC (406); nandralone-para-hexyloxyphenyl-propionate (comprehensive) (407); nootropics/“smart drugs” (overview) (408); opiate alkaloids by CEC (409), by high-resolution electrospray ionization – IMS/MS (evaluation of opiate separation) (410), by HPLC (hydrocodone in Tussionex) (411), and by HPTLC (oxycodone in pharmaceutical solutions) (412); opium (overview of characterization methodologies: 413), by CE (414), by non-aqueous CE (415), by CE-TOF-MS (416), by GC (quantitative determination of opium alkaloids in opium) (417), by GC/MS (narcotine and papaverine in seeds) (418), by HPLC (419), by RP-HPLC on a base-deactivated stationary phase (420), by HPLC of Sep-Pak C-18 cartridge extracts (421), by MECC (422), by pyrolysis-GC (423), by synchronous excitation spectrofluorimetry (424), by TLC-UV densitometric and GC-MSD methods (425), by UV/VIS (for morphine in opium) (426), and by GC/FID, GC/MS, and GC/FTIR (headspace constituents of opium) (427); opium alkaloids by CE with acidic potassium permanganate chemiluminescence detection (428), by CZE (429), by flow-injection analysis using soluble manganese(IV) for chemiluminescence detection (430), by GC/MS after oxime-TMS derivatization (431), by GC/MS (6-acetylmorphine) (432), by HPLC using porous and non-porous stationary phases (433), by HPLC-DAD (stability of morphine containing solutions) (434), by RP-HPLC (codeine and ethyl morphine HCl in pharmaceutical tablets) (435), by LC (for acetylsalicylic acid, caffeine, and codeine phosphate in pharmaceuticals) (436), (for acetylsalicylic acid, caffeine, codeine, paracetamol, pyridoxine, and thiamine in pharmaceuticals) (437), (for paracetamol, caffeine, and codeine phosphate in pharmaceuticals) (438), by RP-LC (papaverine in tablets) (439), by spectrofluororimetric detection (acetylsalicylic acid and codeine in pharmaceuticals) (440), and by spectrophotometric detection (of noscapine with bromocresol green in chloroform) (441); opium, morphine, and heroin (combined study) (comprehensive) (442); oxazepam by automatic kinetic determination (443); pentobarbital by GC/MS (444), and by HPLC (445); phencyclidine (and 1-piperidinocyclohexane-carbonitrile) (review) (446), by IMS (447), and by IR after liquid-liquid extraction from case samples (448); alpha-phenethylamine (comprehensive) (449,450), beta-phenethylamine (overview) (451,452), and by GC/MS, FTIR, and GC/IR (453); phenobarbital by CE (tablets) (454), by LC (for determination of scopalamine, hyoscyamine and phenobarbital in tablets) (455), by multivariate spectrophotometric calibration (for simultaneous determination of phenobarbital and phenytoin in tablets) (456), and by spectrophotometric determination (457); phenylpropylmethylamine (comprehensive) (458); piperazines (comprehensive) (459); psilocybe mushrooms by DNA (460,461), by IMS and GC/MS (462), by GC/MS and HPLC/UV (463), by morphological, microscopic, microchemical, and HPLC with 266 nm UV detection (464), by TLC, GC/MS, and LC/MS (465), and by TLC and GC/MS (psilocin and psilocybin in developmental mushrooms) (466); Salvia Divinorum by GC/MS (467); secobarbital using C-13 labelled secobarbital as an internal standard (468); sibutramine (comprehensive) (469); steroids (overview) (470), (overview, comprehensive) (471), (comprehensive) (472), by EI, CI, and CI/tandem MS (473), by GC (474), by GC/MS (475), by GC/MS after SFC isolation from aqueous matrices (476), by GC-MS and NMR after derivatization with N-methyl-N-alkylsilyltrifluoroacetamide-I-2 (477), by GLC (478), by HPLC with cyclodextrin coated columns (479), by
Microgram Journal, Volume 1, Numbers 1-2 (January - June 2003) 60
Brought to you by AltGov2 [www.altgov2.org]
HPLC with UV/Vis-particle beam MS (480), by HPLC-FTIR (481), by HPTLC and HPLC (482), by MS (of tert butyldimethylsilyl ether derivatives) (483), by MS/MS (484), by quadrupole ion trap tandem MS (485), by 13C - NMR (486), by MECC (487), by MECC, gradient HPLC, and capillary GC (488), by capillary SFC with FID and ECD (489), and by TLC (490); telazol (comprehensive) (491,492); terbinafine (comprehensive) (493), and by UV and nonacqueous voltametry (494); triazolam by TD-GC (495); tricyclic antidepressants - by electrogenerated chemiluminescence (496); and tryptamines by chemiluminescence (497).
Adulterants, Diluents and Precursors (general overviews of essential chemicals and precursors) (498,499), by GC, HPLC, and CE (500), by LC (for determination of non-UV detectable organic impurities) (501), by various analytical techniques (for determination of “secondary” drugs present in cocaine, heroin, marijuana and phencyclidine) (502); acetaminophen by Raman microprobe spectroscopy (503); acetic acid (in acetic anhydride) by NMR (504), dextromethorphan by MEKC (dextromethorphan, pseudoephedrine and guaifenesin) (505); diethylaminoethylaniline (comprehensive) (506), cis- and trans-2,5-dimethoxy-4,beta-dimethyl-beta-nitrostyrenes by FTIR/Raman (507); dimethylsulfone (overview) (508), (removal by sublimation) (509,510), by GC/MS, IR and GC/IR (in amphetamine and methamphetamine samples) (511); dimethyl terephthalate (and dimethyl phthalate) (comprehensive) (512), differentiation of dimethylterephthalate from dimethylisophthalate by GC/FTIR (513), identification of dimethyl terephthalate in cocaine samples (comprehensive) (514); dipyrone in pharmaceuticals with a flow cell containing gold electrodes (515); ephedrine/pseudoephedrine comprehensive (516), by CE, UV, NMR, and MS (for chiral recognition of the enantiomers of ephedrine derivatives) (517), by CE on a chip with amperometric detection (for chiral analysis) (518), by acetonitrile modified CZE (for ephedrine in ephedra callus) (519), by derivative spectrophotometry and ratio spectra derivative spectrophotometry (for simultaneous determination of pseudoephedrine, dexbrompheniramine, and loratadine) (520), by differential-derivative spectroscopy (assay of ephedrine/theophylline containing pharmaceuticals) (521), by an ephedrine based electrode (522), by a double-membrane ephedrine selective electrode (523), by flow injection - pulse amperometric detection (524), by GC (for determination of pseudoephedrine and diphenhydramine) (525), by GC/MS (for determination of ephedrine alkaloids and tetramethylpyrazine in ephedra sinica Stapf) (526), by HPLC (for determination of ephedrine, pseudoephedrine, norephedrine, and methylephedrine in Chinese folk medications) (527), by HPLC using chiral stationary phases (for separation of the enantiomers of ephedrine, norephedrine, and pseudoephedrine) (528), by HPLC and CE (discrimination of ephedrine and pseudoephedrine) (529), by HPTLC (for simultaneous determination of pseudoephedrine and cetirizine in pharmaceuticals) (530), by LC (for N-methylephedrine, after derivatization with 9-fluorenylmethyl chloroformate) (531), by LC (for determination of pseudoephedrine and carbinoxamine pharmaceuticals) (532), by proton NMR (for determination of ephedrine, pseudoephedrine, and norephedrine in bulk and dosage mixtures) (533), by RP-HPLC-UV (with data analysis to handle quantitation of overlapping peaks) (534), by SPE-LC/UV (for determination of 7 ephedrine alkaloids in herbal products) (535), by TLC and FTIR (for determination of pseudoephedrine in a pseudoephedrine/chlorpheniramine pharmaceutical) (536), and by impregnated TLC (for direct resolution of (+/-)-ephedrine and atropine) (537); ethoxy-1-(2-nitro-1-propenzyl)benzenes by FTIR and Raman (538); guaifenesin by HPLC (539); 3-hydroxy-N-phenyl-2-naphthalene carboxamide (comprehensive) (540); lactitol in cocaine by NMR and IR (541); 4-(N-methyl-acetamido)-antipyrine (comprehensive) (542); paracetamol by FTIR (543), by ion chromatography (544), by reflectance NIR spectroscopy (545), by NIR transmittance spectroscopy (546), and by simultaneous stopped-flow determination and FTIR (for paracetamol, acetylsalicylic acid and caffeine in pharmaceutical formulations) (547); pheniramines by CZE (for pheniramine, chlorpheniramine, and brompheniramine) (548), and by an imprinted sensor (for chlorpheniramine) (549); phenylpropanolamine by HPLC in pharmaceutical preparations (using 4-dimethylaminobenzaldehyde) (550); procaine by spectrophotometry (using p-dimethylaminobenzaldehyde) (551); quinine by flow-injection chemiluminescence (552), and by HPLC with polarimetric detection (553); safrole by SFC extraction and GC/MS (for determination of safrole and related allylbenzenes in sassafras) (554); sugars by GC after derivatization with trimethylsilylimidazole (for quantitation of sugars in drug samples) (555), theophylline by adsorptive cathodic stripping voltammetry (556), by a flow fluoroimmunosensor (557), by micellar LC and spectrophotometric detection (558), and by UV and HPLC (559); thiamine by cathodic stripping voltametry (560), by cyclic voltametry and HPLC with amperometric detection (561), by flow injection turbidimetric determination using silicotungstic acid (562), and by spectrofluorometry (563); and triprolidine by a kinetic method based on oxidation w/ KMnO4, with spectrophotometric determination (564).
Microgram Journal, Volume 1, Numbers 1-2 (January - June 2003) 61
Brought to you by AltGov2 [www.altgov2.org]
Occluded Solvents in cocaine by GC/MS (565), in cocaine and heroin by headspace - GC/FID and GC/MS (566), and by SHS-GC/MS (567); in methamphetamine by SPME/GC-MS (characterization of volatile components) (568); and in pharmaceuticals (overview, emphasizing headspace - CGC and impurity profiling) (569), by CGC (570), by wide-bore CGC (571), by CGC-ITD (572), and by automated SHS - CGC-MS (573).
Simultaneous Analyses of Drugs and Adulterants/Diluents
A number of studies have been reported which allow simultaneous identification and quantitation of mixtures of controlled substances and adulterants without separating them into individual components. In general, such techniques may be only employed in select geographical areas in which the submitted exhibits are reasonably consistent (that is, routinely the same adulterants and diluents, at or below a threshold percentage). In most cases, they allow much more rapid sample analysis and throughput without unduly compromising the identification of the controlled substance. Such techniques have been utilized for: cocaine by IR (574,575), by Raman (576,577), by spectrometric methods (578), and by sequential second-derivative spectroscopy (579); and pharmaceuticals by NIR and Raman (580), and by spectrophotometry in conjunction with PLS-1 and PLS-2 data processing methods (581); and for determination of interferences by common diluents in street-level drugs by micro-FTIR (582).
Instrumentation Focus
In addition to the above studies which concentrated on specific drugs or drug groups, there have been a large number of studies which focused on specific instrumental techniques, analyzing two or more unrelated drugs or drug types in order to illustrate the utility of the described methodology, including: capillary electrophoresis: (general reviews) (583,584,585,586,587,588,589,590,591, 592,593,594,595,596,597), (general overview and reviews) (598,599), (general overview, comparing various CE techniques) (600), (review for court admissibility) (601), for separation and permanganate chemiluminescence on-line detection of some alkaloids with beta cyclodextrin as an additive (602), for on-chip separation of amphetamine and related compounds labeled with 4-fluoro-7-nitrobenzofurazane (603), for enantioselective separations of various amphetamines and methylenedioxyamphetamines using cyclodextrins (604,605), for analysis and confirmation of synthetic anorexics in adulterated traditional Chinese medicines (606), for chiral analysis of drugs (607), for chiral identification of drug isomers (608), for chiral analysis of basic drugs using oligosaccharides (609), for chiral separation of basic drug racemates using linear, neutral polysaccharides (610), for chiral resolution of cationic drugs of forensic interest with mixtures of neutral and anionic cyclodextrins (611), for chiral separation of enantiomers of drugs using beta-cyclodextrin (612), for chiral separation of drug stereoisomers with cyclodextrins (613), for chiral separation of basic drugs using ionic and neutral polysaccharides (614), for ultra-fast chiral separation of basic drugs (615), for illicit drug seizures (616), for CE-TOF/MS of drugs of abuse (617,618), for separation of enantiomers of basic drugs (by affinity CE using a partial filling technique and "1-acid glycoprotein as chiral selector) (619), for separation and identification of amphetamines, methadone, venlafaxine, and tropane alkaloids by CE-electrospray MS (620), for separation and identification of designer drugs with CE-ionspray MS (621), for determination of drug-related impurities (622), for analysis of heroin and amphetamine (623), for simultaneous chiral analysis of methamphetamine and related compounds (624), for routine analysis of methamphetamine, amphetamine, MDA, MDMA, MDEA and cocaine with dynamically coated capillaries (625), for analysis of basic pharmaceuticals by CE in coated capillaries with on-line MS detection (626), for quantitation of common illicit drugs (627,628), for chiral separation of selegiline, methamphetamine, and ephedrine using a neutral beta-cyclodextrin epichlorhydrin polymer (629), for tropane alkaloids in a plant extract (630), for CE-DAD-electrospray MS of tropane alkaloids, hyoscyamine, scopolamine, and plant extracts (631), CEC: (introductory overview) (632), for simultaneous separation of acidic, basic, and neutral organic compounds, including strong and moderate acids and bases (633), for analysis of drugs of forensic interest (634); CZE: characterization of drugs of forensic interest by CZE/electrospray ionization MS (635), for chiral separation of amphetamine and phenylephrine, using cyclodextrins (636), for chiral separation of basic drugs using cyclodextrins (637), and for chiral separation of some basic drugs (influence of the buffer organic cation) (638); EKC: for chiral separation of
Microgram Journal, Volume 1, Numbers 1-2 (January - June 2003) 62
Brought to you by AltGov2 [www.altgov2.org]
drugs by electrokinetic chromatography (639), for separation of enantiomers and geometric isomers using a charged cyclodextrin (640), and for chiral separation of neutral and basic enantiomers using anionic cyclodextrins (641); MECC: (general review) (642), for chiral differentiation of pharmacologically active substances by cyclodextrin-modified MECC using a bile salt (643), for analysis of controlled substances, using different micelles (644), and for analysis of phenethylamines (645); MEKC: for separation of sympathomimetic amines of abuse and related compounds (646); non-aqueous CE: for analysis of drugs (647,648,649,650), for analysis of drugs by nonaqueous CE with electrochemical detection (651), and for analysis of tropane alkaloids and amphetamine derivatives (652); polymethod: characterisation of retention in micellar HPLC, in MEKC and in MEKC with reduced flow (653), complementary use of CZE and MECC for mutual confirmation of results in forensic drug analysis (654), and the study of the CZE behavior of selected drugs and its comparison with other analytical techniques for their formulation assay (655); general: CE using polyacrylamide-coated columns (656,657), effect of methanol in sample solution on an electropherogram (658), evaluation of the use of cyclodextrins in chiral separation of basic drug substances by CE (659), improved chiral separation of basic compounds using beta-cyclodextrin and tetraalkylammonium reagents (660), quantitative aspects of the application of CE to the analysis of pharmaceuticals and drug related impurities (661), separation selectivity in chiral and achiral CE with mixed cyclodextrins (662), and use of large-volume sample stacking for selected drugs of forensic significance (663); fluorescence spectroscopy (review) (664); gas chromatography and gas chromatography/mass spectrometry: (general reviews (books)) (665,666), to distinguish amphetamine, methamphetamine, and 3,4-methylenedioxymethamphet-amine from other sympathomimetic amines following derivatization with propyl chloroformate (GC/CI-MS) (667), to distinguish and quantify the enantiomers of amphetamines, phenol alkylamines, and hydroxyamines following stereospecific derivatization (CGC/MS) (668), for enhanced detection of trace-level controlled substances using GC/MS with pulsed splitless injections (669), for the quantitation of cocaine, heroin, diazepam, methaqualone, codeine, and oxycodone (GC) (670), forensic analysis by GC with dual MS and NPD detection (671), by GC with surface ionization detection (672), using isotopic analogues as internal standards (673,674,675), by MS and electrospray ionization MS (676), with a programmable temperature vaporizing injector and cold on-column injector (677) by rapid GC (678), by secondary electrospray IMS/MS (679), by TLC and GC/MS (680), by wide-bore column GC-NPD (681), a dual internal standard method for screening by GLC at the one percent level (682), internal quality control of a general GC drug screen in forensic toxicology (683), use of MSD’s for identification of unknowns (684), normalization of residual ions after removal of the base peak in EI-MS (polydrug study) (685), practical determination of GC–MS limits of detection (686), sample concentrator for sensitivity enhancement in chromatographic analyses (687), SPME-GC (review) (688), and trace analysis by splitless GC/MS (689); high-performance liquid chromatography (and tandem HPLC techniques): general overview (690), (recent progress in HPLC analyses for drugs of abuse) (691), for analyses of barbiturates, LSD, MDA, and psilocybin (HPLC using continuous online post-elution photoirradiation with diode-array UV or thermospray-MS detection) (692), to separate and identify cocaine, morphine, heroin, codeine, papaverine, benzocaine, procaine, and lidocaine (HPLC-DAD) (693), for the rapid analysis of illicit heroin and cocaine samples (HPLC-DAD and CGC/NPD) (694), for assaying morphine and hydromorphone in pharmaceuticals (695), for direct chiral resolution of phenylalkylamines (using a crown ether chiral stationary phase (includes amphetamine and cathinone)) (696), for the simultaneous determination of triprolidine, pseudoephedrine, paracetamol, and dextromethorphan (697), for drug screening (698), for analysis of drugs of forensic interest (RP-HPLC) (699), for analysis of alkaloid drugs of forensic interest (RP-HPLC-PDA) (700), for analysis of some alkaloids on unmodified silica gel with aqueous-organic solvent mixtures (701), for determination of alkaloids in foods (multi-detector HPLC) (702), for detection in the forensic sciences (LC-PDA) (703), to determine the enantiomeric composition of abused drugs (704), for determination of illicit drugs and related substances (HPLC with an electrochemical coulometric-array detector) (705), for forensic analyses (on-line HPLC/FAB-MS) (706), for purity testing for tropane alkaloids (707), for resolution of racemic drugs (using a new chiral column based on silica-immobilized cellobiohydrolase) (708), to study the effects of chromatographic conditions on the retention indices of forensically relevant substances (RPHPLC) (709), and for analysis of pharmaceuticals and drugs (HPLC using unmodified silica and polar solvents) (710); HPLC retention indices: (711,712,713); infrared and Raman spectroscopy: (minor review of IR and Raman for detection of narcotics) (714), (general review of Raman of narcotics and explosives) (715), FTIR and microcrystal tests for rapid identification of drugs (716), FTIR microspectrophotometry of illicit drugs (sample preparation) (717), FT-NIR for validation of controlled substance identifications (718), NIR for identification of
Microgram Journal, Volume 1, Numbers 1-2 (January - June 2003) 63
Brought to you by AltGov2 [www.altgov2.org]
drugs and various adulterants/diluents (719), NIR, FT-Raman, and DR-FTIR for non-destructive identification of Chinese traditional drugs (720), GC-FTIR for screening of hallucinogenic and stimulant amphetamines (721), vapor-phase FTIR for identification of novel illicit amphetamines (722), HPTLC-FTIR for identification of LSD, MBDB and atropine (723), use of a diamond anvil cell with a beam condenser and an FTIR microscope for analyses of some particulate drug mixtures (including cocaine, heroin, and methamphetamine) (724), internal reflectance spectra library (725), FT-Raman for nondestructive determination of raw plant medicinal drugs (726), filtered fiber optic Raman probes for analysis of illicit drugs (727), micro-Raman for identification of narcotics (including opium alkaloids) (728), SERRS for drug analysis (729), and evaluation of silver substrates for SERRS of cocaine and other stimulant drugs (730); ion chromatography: for determination of ionic compounds, exicipients, and contaminants in drug evidence (731); microscopy: (general overview) (732), and videomicroscopy (733); nuclear magnetic resonance spectroscopy: (general review) (734), for assessing drug enantiomeric composition (including amphetamine) (735), for chiral identification and determination of ephedrine, pseudoephedrine, methamphetamine, and methcathinone (includes GC analyses) (736), to identify impurities in drug substances (by LC-NMR) (737), and for routine analyses (738,739); phosphorimetry: of barbital, codeine, morphine, and practolol after labelling with dansyl chloride (740); robotics and/or specialized computer programs: (overview and review) (741), for automated CGC heroin analysis (742), combined Rf and UV library search software for TLC and RPTLC (743), a computerized IR search system (744), for optimized analysis of heroin by RP-HPLC (745), to evaluate an HPLC column’s performance (746), and to optimize gradient and isocratic HPLC analyses (747); supercritical fluid chromatography: (general reviews) (748,749), and for extraction of tropane alkaloids (including cocaine) from E. coca extracts (750); thin layer chromatography: (general review) (751), TLC/DAD for forensic analyses (752), overpressured TLC (for determination of morphine, codeine, heroin, opium alkaloids, nicotine, amphetamine, cocaine, and LSD) (753), TLC for separation of cocaine, pramocaine, fentanyl, and diphenhydramine (754), and TLC with a special visualization reagent for tertiary amines (including dimethylamphetamine, flunitrazepam, methamphetamine, methaqualone, nicotine, theophylline, triazolam, and others) (755); and miscellaneous: Comparison of IR and MS for drug analyses (756).
Analytical Artifacts
GC and GC/MS are the current methods of choice for routine screening, identification and quantitation of controlled substances. However, the use of high-temperature injectors can produce artifacts via unimolecular rearrangements of and/or intermolecular reactions between the various components (including even the injection solvent). Artifacts are also possible in other techniques. Over the past 10 years, artifacts have been reported for: cannabinoids: nitrites in cannabinoid analyses (urine testing focus) (757,758,759); cocaine: determination of ecgonidine methyl ester vapor pressure (760), identification of methyl esters of ecgonine as injection port produced artifacts from cocaine base (crack) exhibits (761); heroin: identification of a heroin/chloroform-impurity reaction product (762); morphine and codeine: hydromorphone and hydrocodone interference in GC/MS assays for morphine and codeine (763); phenethylamines: artifacts in the GC analysis of amphetamine and MDA (764), GC/MS identification of amine-solvent condensation products formed during analysis of drugs of abuse (from ethanol with amphetamine, MDA, and beta-phenethylamine) (765,766), conversion of ephedrine to methamphetamine and methamphetamine-like compounds during and prior to GC/MS analyses of heptafluorobutyrate and carbethoxyhexafluorobutyrate derivatives (urine testing focus) (767) identification of a GC/MS artifact peak as methamphetamine (768), matrix effects in the IR of methamphetamine salts (769,770), and a procedure for eliminating interferences from ephedrine and related compounds in the GC/MS analysis of amphetamine and methamphetamine (771); piperonal: an artifact in the GC analysis of piperonal (772); and miscellaneous: influence of large amounts of drugs on the peak areas of their coinjected deuterated analogues measured with APCI-LC-MS (773), and a simple software procedure to determine if a GC/MS blank injection is contaminated (774).
Microgram Journal, Volume 1, Numbers 1-2 (January - June 2003) 64
Brought to you by AltGov2 [www.altgov2.org]
Qualitative Tests
Spot tests are a mainstay of forensic analysis of controlled substances, and offer a reliable means for very rapid screening of submitted exhibits. Over the past 10 years, the following qualitative testing studies were reported: (general overview) (775), (textbook) (776), (review of color comparisons in forensic science, including drug color tests) (777), for anhydrous ammonia (778), for cocaine (mechanistic study of the Scott Ruybal test) (779), for drugs of abuse (12 spot tests) (780), for lithium (781), for pemoline, fenozolone, and thozalinone (color tests) (782), and for red phosphorus (783,784,785).
Sampling Plans
Large drug seizures are almost invariably comprised of multiple units of a standard container size (for example, several thousand 1 kilogram packages of cocaine). Comprehensive analysis of such seizures is a daunting and prodigiously labor intensive task; therefore, statistically based sampling plans are utilized that enable valid assessment of an entire shipment based on analyses of a select number of representative, randomly selected exhibits. The classic study in this field (by Frank, Hinkley, and Hoffman) was reported in 1991, but is included here as critical background (786). Over the past 10 years, the following additional studies were reported: (overviews and general discussions) (787,788,789,790,791), a case studies of heroin (792,793,794).
Source Determination/Impurity Profiling
Determination of synthetic route origin (including processing variants) and/or geographical origin is important for developing tactical and strategic intelligence. Historically, source determination has been conducted by in-depth impurity profiling; that is, determining discriminatory marker compounds and/or ratios of marker compounds which are characteristic of origin. More recently, trace element analyses and (especially) stable isotope analyses (vide infra) have increased the confidence of geographical sourcing; this aspect of source determination is rapidly expanding. Finally, increasingly sophisticated pattern recognition techniques (often neural network based) have been employed to handle the enormous databases generated by source determination programs. A large number of source determination studies have been reported over the past 10 years: (general discussions) (795,796), (pattern recognition techniques screening for drugs of abuse (illicit amphetamines) with GC-FTIR) (797); amphetamines: systematic approach to profiling amphetamines (798), automated GC method for amphetamine profiling (799), amphetamine profiling in the UK (800), from arylpropenes with acetonitrile and sulfuric acid (Ritter reaction) (801), of Leuckardt amphetamine (802,803,804,805), from 1-phenyl-2-nitropropene (806,807), improved data processing for amphetamine profiling (808), from phenylacetone synthesized from phenylacetic acid (Leukardt reaction) (809), and a pan-European method for profiling amphetamines (810); amphetamines and marijuana: of impurities (811); cocaine: reviews (812,813,814), comprehensive profiling (815,816,817,818), of 2-carbomethoxy-3-alkyloxy- and heteroaroyloxy substituted tropanes in cocaine (819), of 2-carbomethoxy-3-oxo analogs in cocaine (820,821), of chlorinated cocaines from cocaine treated with bleach (822, see also:823), of cuscohygrine in cocaine (824), of heteroaroyl analogs in cocaine (825), of 1-hydroxy-tropacocaine in cocaine (826), of hygrine in cocaine (827), of hygrine and cuscohygrine in cocaine (828), of norcocaine in cocaine (829), of occluded solvents in cocaine (effects of microwave radiation on solvent profiles) (830), of pharmaceutical cocaine (831), of pseudococaine in cocaine (832), of trace metals in cocaine (833), of trimethoxy analogs of cocaine, cinnamoylcocaine, and tropacocaine in cocaine (834), of truxillines in cocaine (835), of truxillines and similar high molecular weight impurities in cocaine (836), of illicit cocaine by X-ray Diffractometry (also GC and GC/MSD) (837); cocaine and heroin: (combined studies) of trace metals in cocaine and heroin (838,839,840,841,842,843,844,845,846), and by palynology (pollen analysis) (847); of occluded solvents in cocaine and heroin (848); ephedrine: by microscopic examination (849); fentanyl: prepared from 1-phenethyl-4-piperidone (850); heroin: overview (851), (review) (852), of acid and neutral impurities in heroin (853), of anions and cations in heroin (854,855), of basic byproducts and adulterants in heroin (856), of impurities in heroin (857,858,859,860,861), of metal contamination in heroin (862), of O6-monoacetylmorphine in “homebake” heroin (863), of trace elements in heroin by ICP-MS (864,865), of trace organic impurities (866);
Microgram Journal, Volume 1, Numbers 1-2 (January - June 2003) 65
Brought to you by AltGov2 [www.altgov2.org]
marijuana: of cannabidiol and delta-9-THC in stored marijuana (867), of impurities in hashish (868,869), of impurities in marijuana (870,871,872), of natural constituents in marijuana (reviews) (873,874), and of marijuana DNA (875,876,877,878,879,880,881,882,883); methamphetamine: review (UNDCP) (884), overview (885), generic articles on impurity profiling (886,887), of N-acetylmethamphetamine in illicit methamphetamine (888), of chloroephedrine and aziridines in methamphetamine (889), of impurities in methamphetamine (890,891), of inorganic impurities in methamphetamine (892), of methamphetamine synthesized from allylbenzene (893,894,895), of impurities in methamphetamine synthesized via HI/red P (896), of methamphetamine synthesized via HI/red P (focusing on reaction byproducts of common cold tablet ingredients) (897,898), of methamphetamine containing a hydrocarbon wax (899), of methamphetamine synthesized from pseudoephedrine tablets (900), of trace elements in methamphetamine (901), of methamphetamine seized in Australia (overview and development of a national database) (902), of methamphetamine seized in Japan (903,904, and overview: 905), and of methamphetamine seized in Korea (906); 4-methoxyamphetamine: of impurities (907); methylenedioxyamphetamines: overview of approach in Australia (908), of impurities in methylenedioxymethamphetamine (909,910), of precursors, intermediates, and reaction byproducts for methylenedioxymethamphetamine (911), of impurities in methylenedioxymethamphetamine and amphetamine (912), of impurities in methylenedioxyamphetamine and methylenedioxymethamphetamine (913,914), determination of synthetic route markers for methylenedioxyamphetamine and methylenedioxymethamphetamine (915), of methylenedioxymethamphetamine tablets by logo and headspace comparisons (916), of commercially available methylenedioxyphenylacetone (917), from the Ritter reaction (using safrole) (918), of methylenedioxyphenylacetone and methylenedioxyamphetamine synthesized from isosafrole (919,920), and of methylenedioxyamphetamine synthesized from nitoethane and piperonal (921); nicotine: (overview of tobacco smoke) (922); opium: of opium alkaloids (for origin determination) (923), of proteins in opium latex (924); pharmaceuticals: overview (925), of impurities (926,927,928); phenyl-2-propanone: of illicit phenylacetone synthesized from phenylacetic acid with acetic anhydride versus lead (II) acetate (929); precursors: of essential oils used as precursors in the synthesis of phenethylamine-type designer drugs (930), and testosterone undecanoate: of impurities (931).
Source Determination/Stable Isotope Analyses
Historically, processing origin could be reasonably correlated with geographical origin. However, the expansion of drug producing regions and the concommitant convergence of processing techniques, along with the international exchange or sale of precursors (for example, 3,4-methylenedioxyphenylacetone) or crudely refined controlled substances (for example, morphine or heroin base) across the world, have mandated more sophisticated analyses. Because the natural abundances of the stable isotopes of hydrogen, carbon, nitrogen, and oxygen vary across the world, and their incorporation into natural products is unaffected by subsequent illicit processing, stable isotope analyses offer a powerful tool for determining “true” geographic origin (that is, not indirectly inferred based on processing methodology). Recent advances in instrumentation (notably isotopic ratio mass spectrometry and high field nuclear magnetic resonance spectroscopy) have enabled the determination of the isotopic makeup of controlled substances with reasonable precision and accuracy. To date, only cocaine and heroin have been subjected to comprehensive studies; however, this field is expected to expand to other controlled substances over the next decade. Recent reports include: (overviews) (932,933,934); cocaine: by carbon-13 isotope analysis: (935,936), by IRMS and trace alkaloid analysis (937); cocaine and heroin: by IRMS (938), by site specific deuterium-NMR (939); and heroin: by GC/IRMS (940), and by GC/MS and GC/IRMS (941).
Comparative Analyses
Establishing commonality of origin between 2 or more exhibits requires systematic application of detailed impurity profiling. Comparative analysis does not require formal determination of synthetic, processing, or geographical origin, but rather determination of “degree of match” between profiles (usually trace-level chromatographic analyses; however, establishment of synthetic, processing, or geographical origin is a common spinoff of comparative analysis protocols). Studies reported over the past 10 years include: (general overviews)
Microgram Journal, Volume 1, Numbers 1-2 (January - June 2003) 66
Brought to you by AltGov2 [www.altgov2.org]
(942,943); amphetamine: computerized comparisons of Leuckart amphetamine (944); cocaine: (overview of methodologies) (945), database for comparison (946), by CGC/ECD (947), by CGC/NPD (948), comparison of crack cocaine by matching fracture lines between pieces (949), cocaine comparison court case (950), by rapid GC (951), by HPLC-DAD (952), by a neural network (953); hashish: by HPLC, GC, and AA (954); heroin: (general overview) (955), by CGC (956), computerized comparison (957), predictive model (958), harmonization study for retrospective comparisons (959,960), of SWA heroin by GC (961); marijuana: comparison by RAPD and HPLC (962); methaqualone: tablets by NIR reflectance spectra (963); methylenedioxymethamphetamine: by natural isotope abundances (964); opium: by RAPD, HPLC, and ELISA (965), pharmaceuticals: evaluation of neural networks (966); and tablets and capsules: indices of physical characteristics (967,968).
Reference Standards
Accurate analyses of controlled substances and related analogs require high purity standards, including isotopically labelled analogs. Structurally related compounds are also needed as internal standards for chromatographic analyses. Reports over the past 10 years include: (general reviews) (969,970); bufotenine (and related tryptamines): (971), butalbital: (972); cannabinoids: (973,974); cocaine: (975,976), aza analogs of cocaine (977), deuterium-labelled cocaine, cocaethylene and metabolites (978), cocaine by one step esterification of benzoylecgonine (979), 6- and 7-hydroxylated cocaines (980), C-3 alkyl analogs of cocaine (981); lysergic acid diethylamide (982,983); d- and l-methamphetamine: via optical resolution (984), “Ice” methamphetamine (985); methcathinone: (986); methohexital: (987); morphine: (988,989); polydrug: (N-ethylmethylenedioxyamphetamine, N-hydroxymethylenedioxyamphetamine, mecloqualone, 4-methylaminorex, phendimetrazine, and phenmetrazine) (990), (O6-monoacetylmorphine, methamphetamine, methylenedioxyamphetamine, methylenedioxymethamphetamine, methylenedioxyethylamphetamine, and N-methyl-3,4-methylenedioxyphenyl-2-butanamine, from seized drugs) (991), and a reference garden of hallucinogenic and narcotic plants in Australia (992); (1S,2S)-pseudoephedrine: (993); and psilocybin and O-acetyl psilocybin (994).
Clandestine Laboratories
The illicit production of drugs is a dynamic and constantly changing field. Reports over the past 10 years included: (general review) (995), amphetamine (996,997,998), failed synthesis of amphetamine (999), amphetamine in methamphetamine (1000), analyses of inorganic components found in clandestine drug laboratory evidence (1001), arsenic oxide (potential reagent in methamphetamine synthesis) (1002), Birch reduction (general review) (1003) (overview of developments in the midwestern US (1004), cocaine (1005,1006), concealment and trafficking (1007), 2,5-dimethoxy-4-ethylthiophenethylamine (2C-T-2) (1008), ephedra (1009,1010), ephedrine and/or pseudoephedrine (1011,1012), etonitazene (1013), fentanyl (1014), freons in methamphetamine production (1015,1016,1017), hash oil (1018,1019), heroin (acetylated opium) (1020), heroin (review) (1021), hydriodic acid for methamphetamine production (1022,1023,1024), hypophosphorus acid for methamphetamine production (1025), inorganic acids (1026,1027), iodine (GC/MS identification) (1028,1029), lysergic acid amide from morning glory seeds (1030), lysergic acid diethylamide (1031), marijuana (1032,1033), methadone (1034), methamphetamine (1035,1036,1037,1038,1039,1040,1041), methamphetamine (by dissolving metal reduction) (1042,1043,1044), methamphetamine in Taiwan (1045), methaqualone and analogs (1046), methcathinone (1047), methylenedioxymethamphetamine (1048), methylenedioxyphenethylamines (1049), morphine (by dealkylation of codeine) (1050), overview of illicit drug production in the Czech Republic from the 70's through the 90's (1051), phencyclidines (1052,1053,1054), phenylacetone and methylenedioxyphenylacetone (1055,1056), piperonal (1057), polydrug (methamphetamine, phenylacetone, methylenedioxyamphetamine, and methaqualone) (1058), steroids (1059), substitution of white phosphorus for red phosphorus in hydriodic acid reduction laboratories in Idaho (1060), delta-9-THC precursors (1061), delta-9-THC acetate (1062), unusual defense to charge of MDMA manufacture (1063), and an unusual designer drug laboratory (polydrug) (1064).
Microgram Journal, Volume 1, Numbers 1-2 (January - June 2003) 67
Brought to you by AltGov2 [www.altgov2.org]
Clandestine Laboratory Appraisals and Safety
The rapid expansion of clandestine laboratories in the US over the past 15 years has resulted in a large number of studies concerning proper assessment and safe dismantling, including reports on: assessment and remediation of contaminated sites (1065), clandestine laboratory production capabilities (1066), confined space laboratories (1067,1068,1069,1070), decontamination of biohazardous evidence (1071), determination of occupational exposure to cocaine by crime lab personnel (1072), determination of volumes in clandestine laboratory reaction vessels (1073), environmental impact and adverse health effects of the clandestine manufacture of methamphetamine (1074), field methods to render safe pressurized tanks of ammonia at clandestine labs (1075,1076), hydrogen sulfide fatality (1077), OSHA and NIOSH regulations (1078,1079), phosphine gas exposure from a methamphetamine laboratory investigation (1080), phosphine gas fatalities (1081,1082), phosphine gas detection and monitoring instrumentation (1083), safety training for clandestine laboratory investigators (1084,1085), supplier of 22-liter flasks put on notice (1086), training (1087,1088), triacetonetriperoxide causes explosion during analysis (1089), and useful websites for personnel involved in forensic laboratories and/or clandestine laboratories (1090).
Portable Instrumentation/Trace Detection
New world trade agreements and the easing of formerly restrictive national and international borders have resulted in dramatic increases in cargo transshipping and personal travel, thereby complicating drug inspection and interdiction efforts at POE’s. The need for rapid and accurate screening, and high sample throughput, requires on-site equipment capable of assessing humans, animals, and a vast array of shipping containers. In addition, on-site equipment is needed for proper assessment of clandestine laboratories. However, the typical size and operational requirements of most laboratory instrumentation preclude their use in field settings. This has resulted in a growing industry dedicated to development of man-portable, field rugged equipment for detection and identification of controlled substances. Many of the pertinent studies are proprietary, but a large number have nonetheless been reported over the past 10 years: general: (reviews) (1091,1092,1093,1094,1095), (general assessments) (1096,1097,1098,1099), appraisal of drug detection scenarios - operational analysis for drug detection (1100), and determination of high-risk cargo (1101); amperometric assay: for opiates (1102); biosensor technologies for the detection of illegal drugs (1103,1104,1105,1106,1107), antibody-based field kits for cocaine and heroin (1108), a fiber-optic cocaine biosensor (1109), an ISFET device for cocaine analysis (1110), the use of heroin esterase in the development of a biosensor (1111), and use of recombinant DNA in the design of a heroin sensor (1112); calibration standards: for narcotics detection devices (1113); correlated column micro-GC: for the detection of contraband drugs in cargo containers (1114); field ion spectrometry: (1115); gamma ray detectors: (1116,1117,1118); gas sensor arrays for drug “aroma” detection (1119); immunoassay based detection systems: (1120,1121) and similar technologies (1122); DRUGWIPE: (1123); ion mobility spectrometers: (1124,1125,1126,1127,1128), detection of cocaine and heroin by a custom built IMS (1129), detection of drugs of abuse in Customs scenarios using IMS (1130), use of fluorescence spotting to identify areas for IMS (1131), detection of methamphetamine and ephedrine in abandoned clandestine laboratories with IMS (1132), differentiation of methamphetamine versus nicotine using IMS (1133), DSP techniques for narcotic detection using IMS (1134), field applications of IMS (1135,1136), and use of SPME with IMS (1137); ion trap mobility spectrometers: (1138,1139,1140); laser-based near- and mid-IR: (1141); neutron-based technologies: (1142,1143,1144,1145,1146,1147,1148,1149,1150,1151), combined neutron and gamma ray detection (1152), evaluation of neutron techniques for illicit substance detection (1153,1154,1155), and pulsed fast neutron analysis (1156,1157); N-14 nuclear quadrupole resonance: (1158,1159,1160,1161); particle detection: cocaine phenomenology study (1162), confidence in the detection of cocaine particulates by IONSCAN and SENTOR systems (1163), particle generators for testing of particle detection equipment (1164), particle size distribution of cocaine HCl (1165), particle size analysis of six illicit heroin preparations seized in the UK (1166), use of methylene blue as a simulant for cocaine HCl and heroin HCl (1167), test material for narcotics detection equipment (1168), and voltametric determination of cocaine microparticles (1169); piezoelectric ringing: (1170); portable GC/MS: for clandestine laboratory investigations (1171,1172); Raman spectroscopy: (1173,1174,1175), minor review of applications (1176), near-IR Raman to identify illegal drugs in
Microgram Journal, Volume 1, Numbers 1-2 (January - June 2003) 68
Brought to you by AltGov2 [www.altgov2.org]
solid mixtures (1177), and Raman microscopy for direct 2-D imaging of explosives and drugs (1178); human screening: of internal body packers by magnetic resonance (1179), of internal body packers by X-ray scanning (1180), of packages on persons by X-ray imaging (1181,1182), of prisoners in the Canadian Correctional Service by IMS and ion trap mobility spectroscopy (1183), and a survey of current portal technology for screening people for illicit substances (1184); SENTOR: recent developments (1185); solid-state gas sensors: (1186); surface ionization detection: (1187); surface acoustic wave (SAW) detectors: detection of taggants and volatiles by SAW/GC (1188), and portable detection system for illicit materials based on SAW resonators (1189); surface sampling: detection of drugs on vehicle surfaces (general study) (1190), and study of surface sampling procedures for improved sampling/detection protocols (1191); tandem mass spectrometry (CONDOR): (1192,1193); testbeds: chemical vapor test-beds (1194), and a nonintrusive inspection technology testbed (1195); TOF-MALDI mass spectrometry: (1196); vapor detection: analysis of volatiles from cocaine (1197,1198,1199), analysis of vapors from cocaine and heroin with the aid of SPME (1200), cocaine and heroin vapor pressures (1201), detection of cocaine in cargo containers by high volume vapor sampling (field test) (1202), and formation of methyl benzoate from cocaine HCl under different temperatures and relative humidities (1203); and X-ray technologies (1204,1205).
Surveys
Critical to total threat assessments and the monitoring the effectiveness of counter-narcotics efforts are surveys of drug use and related topics. Over the past 10 years, surveys have been reported for: amphetamine: of global amphetamine abuse (1206,1207), and of amphetamine type drugs used in Bulgaria (1208); cocaine: of adulterants in cocaine in Rome in 1996 and 1997 by GC and GC/MS (1209), of cocaine seized in Spain 1985-1993 (1210), of intralaboratory precision of cocaine analysis by CGC (1211), and of occluded solvents in cocaine 1986 - 1991 (1212); designer drugs: (review) (1213), of amphetamine-type designer drugs in Europe (1990-1996) (1214), of designer drugs in Canada (1215), of designer drugs in the European Union (1216,1217), and of designer drugs in Italy (1218); drug use (general): global trends - 2000 (1219), global trends - 1999 (1220), of drug abuse in Hungary (1221), of Irish drug seizures (1222), of drug usage in San Diego County 19901997 (1223), of drug contents of powders and other illicit preparations in the UK (1224), of drugs imported into the UK (1225), and of drug abuse in Western Denmark during the eighties (1226); flunitrazepam: of Rohypnol Tablets (1227); heroin: of heroin in Australia (in Sydney in 1997) (1228), of heroin in Denmark, 1981-1992 (1229), of heroin seized in France (1230), of heroin in Israel during 1992 (1231), of noscapine in heroin in Slovenia, 1997 - 1999 (1232), of heroin seized in Spain (1233), of heroin in Andaluza, Spain (1234), of heroin in the UK, 1984 to 1989 (1235), of retail level heroin purchases in the US during 1992 (1236), of the cutting of heroin in the US in the 1990's (1237), and of cutting of heroin in New York City (1238); LSD: of LSD blotter papers logos (1239); marijuana: of the THC content of cannabis cultivated in Austria (1240), of recent developments in Europe concerning licit cultivation of cannabis (1241), of the cannabinoid content of marijuana seized in Greece (1242), of delta-(9)-THC content in cannabis of Greek origin (1243), the potency of cannabis in New Zealand, 1976 to 1996 (1244), of cannibis resin and cannibis seized in the Republic of Ireland (1245), of trends in illicit cannabis cultivation in the UK and Northern Ireland (1246), of potency trends of )9-THC and other cannabinoids in confiscated marijuana from 1980-1997 in the US (1247), of the global situation of cannabis consumption, trafficking, and production (1248), and of recent developments in cultivation and quality of illicit cannabis (worldwide) (1249); methylenedioxyamphetamines: of MDMA, MDA, MDEA, NEXUS, and MBDB tablets seen in southwestern Spain (1250,1251), and of MDMA, MDEA, and MBDB tablets seen in the United States (1252,1253,1254,1255); polydrug: of heroin, cocaine, and cannabis from British Columbia (1256), and of heroin and cocaine seized in a Swiss town (1257); UNDCP Reports (by year): World Drug Report - 2000 (1258), List of Narcotic Drugs under International Control (INCB “Yellow List”) - 1999 (1259), (INCB “Green List”) - 1999 (1260), (INCB “Red List”) - 1999 (1261), Report of the International Narcotics Control Board 1999 (1262), Manufacture of Narcotic Drugs, Psychotropic Substances, and their Precursors - 1999 (1263), Narcotic Drugs Estimated World Requirements - 1999 (1264), Precursors and Chemicals Frequently Used in the Illicit Manufacture of Narcotic Drugs and Psychotropic Substances - 1999 (1265), Psychotropic Substances Statistics - 1999 (1266), Terminology and Information on Drugs - 1999 (1267), the World Drug Report - 1997 (1268), and Supply of and Trafficking in Narcotic Drugs and Psychotropic Substances - 1996 (1269);
Microgram Journal, Volume 1, Numbers 1-2 (January - June 2003) 69
Brought to you by AltGov2 [www.altgov2.org]
miscellaneous: of adolescents’ use of embalming fluid with marijuana and tobacco (1270), and of crime laboratory proficiency testing results 1978-1991 (1271).
Miscellaneous Topics
The following topics of peripheral interest to the analysis and detection of drugs of forensic interest were also reported from 1992 - 2001: angel trumpet: overview (1272); amphetamine: a review of U.S. statutes on methamphetamine and how they led to an increase in illicit amphetamine production (1273); ayahuasca: notes on an Ayahuasca court case in Holland (1274,1275); barbiturates: charge transfer complexes with phenytoin (1276); canines: use of activated charcoal to circumvent canine detection of concealed narcotics (1277), analysis of volatile drug components and their relevance to canine alerts (1278), characterization of the Auburn Olfactometer (1279), of cocaine on currency (1280), drug money and detection by canines (1281,1282), scientific protocol to evaluate and certify odor detection by canines (1283), and sensitivity of canines to cocaine HCl and methylbenzoate (1284); (traditional) Chinese medications: overview (1285), manufacturing flaws and misuse of Chinese herbal medicines (1286), determination of some active components in Chinese medicial preparations by CE (1287), screening of Chinese proprietary medications for undeclared therapeutic substances by HPLC and GC/MS (1288), identification of Western medicines as adulterants in Chinese herbal medicines by HPLC and GC/MS (includes diazepam) (1289), screening for chemical drugs used to adulterate in rheumatic and analgesic traditional Chinese medicine by HPLC-DAD (includes diazepam and phenylbutazone) (1290), determination of adulterated chemical drugs in rheumatic and analgesic traditional Chinese medicine by MEKC (includes diazepam and phenylbutazone) (1291), determination of clobenzorex HCl and diazepam adulterated in anorexiant traditional Chinese medicines by MECC (1292), and determination of fluoxymesterone, methyltestosterone and testosterone in adulterated Chinese herbal preparations by HPLC (1293); cocaine: alkaloid content in Erythroxylum Coca tissue during reproductive development (1294), the base-catalyzed C-2 exchange and epimerization of 3-beta substituted 8-methyl-8-azabicyclo[3.2.1]octane-2-carboxylates (1295), biomass accumulation and alkaloid content in leaves of Erythroxylum Coca and Erythroxylum Novogranatense Var Novogranatense grown in soil with varying pH (1296), effects of cyanoacrylate processing (for fingerprinting) on cocaine HCl trace analysis (1297), gas phase detection of cocaine by means of immunoanalysis (1298), protest against cocaine base sentencing (1299), SFC extraction of cocaine from coca leaf (1300), solubility of cocaine in gasoline (1301), and stability of cocaine in Agua Rica/Agua Madre (1302); (analysis for) controlled substances on currency: comprehensive review (covers cocaine, heroin, THC, and phethylamines) (1303), cocaine on currency (1304,1305), cocaine on currency by GC-MS (1306), cocaine on currency by IONSCAN IMS and LC/MS with electrospray ionization or by GC-ITD/MS (1307), analysis of drugs on currency by GC/MS (1308), by MS/MS, TD-MS, and APCI-MS (1309), by tandem MS (CONDOR) (1310,1311), and screening of currency by TD/APCI-MS (1312); designer drugs (unusual): dihydrobenzofuran analogues of hallucinogens (1313), lactam analogs of fentanyl (1314), methylenedioxyisoquinolines (1315), synthesis and pharmacological evaluation of ring-methylated 3,4-methylenedioxyamphetamines (1316), reference directory of designer drugs (1317), 1,2,3,4-tetrahydro-isoquinoline analogs of phenylalkylamine stimulants and hallucinogens (1318,1319), and the texts by Ann and Alexander Shulgin (1320,1321); dextromethorphan: (overview) (1322); dimethylamphetamine: mechanistic study of preparation from methylephedrine (1323); ephedrine: extraction of ephedrine from ephedra by SFC (1324); heroin: homogenization of illicit heroin samples prior to analysis (1325); inhalants: general discussions of inhalants and solvent abuse (1326,1327,1328); Internet: discussion of internet resources for forensic science (1329,1330); lysergic acid diethylamide: detection of LSD on blotter papers after processing for fingerprints (1331), and stability of LSD under various storage conditions (1332); marijuana: botanical considerations for forensic investigation of marijuana (1333), embalming fluid-soaked marijuana (compare to Elwood/Fry article) (1334), filtering effects of various household fabrics on the pollen content of hash oil (1335), identification and quantitation of 11-nor-delta(9)-tetrahydrocannabivarin-9-carboxylic acid (1336), manufacture of Cannabis Sativa for legitimate applications (1337), mineral nutrition of Cannabis Sativa L. (1338), and comments on the naming of the Duquenois and related tests for cannabis (1339); mass spectrometry: archive of mass spectral data files on CD-ROM and a computerized database (1340), ion ratio instability of a GC/MS system (1341), and poor reproducibility of in-source collisional AP MS of drugs (1342); methadone: claim that DEA chemists erred in calculating quantity of methadone that could be synthesized from precursor chemicals (1343; and response: 1344); nightshade alkaloids: historical review (1345); opium: historical review (1346), biodiversity of Papaver
Microgram Journal, Volume 1, Numbers 1-2 (January - June 2003) 70
Brought to you by AltGov2 [www.altgov2.org]
Somniferum L. (1347), and determination of loss on drying of opium samples using microwave ovens (1348); oxycodone: overview (1349); phencyclidine: ionic associates of phencyclidine with sulfophthaleins and azo dyes (1350); polydrug: hypnotics and sedatives not belonging to the classes of barbiturates and benzodiazepines (1351); poppy tea: case study/overview (1352); thebaine: synthesis from codeine methyl ether (1353); other topics: analysis of clandestine drug records (1354), analysis of drugs in unconventional samples (1355), analysis of false positives in drug proficiency testing (1356), analysis of a fruit juice extract that was suspected to be a narcotic beverage by GC/MS (1357), analysis of plastic packaging to trace the source of illicit drugs (1358), computerized management of a forensic analytical laboratory (1359,1360), considerations for planning and site preparation for modern laboratory instrumentation (1361,1362), development of a forensic evidence protection kit (1363), drug smuggling techniques and problems associated with analysis (1364), drug smuggling by internal body carries (1365), environmental impact of illicit narcotics cultivation and processing (1366,1367), expert evidence and forensic misconceptions of the nature of exact science (1368), GC/MS guide to ignitable liquids (1369), modification of an extraction procedure for acidic and neutral drugs (1370), neural networks in forensic science (overview/general discussion) (1371), protecting group chemistry (1372), separation and identification of drugs of abuse in drug cottons by HPLC coupled with electrochemical array detectors (1373), solid phase extraction for systematic toxicological analysis (1374), the UNDCP Dictionary of Narcotics (1375, and addendum: 1376); and an overview of the United Nations International Narcotics Control Board (1377).
References
1. Klein RFX, Hays PA. Research on drug evidence. Proceedings, 13th INTERPOL ForensicScience Symposium, Lyon, France (2001).
2. Brettell TA, Inman K, Rudin N, Saferstein R. Forensic science. Anal Chem 2001;73(12):2735.
3. Brettell TA, Inman K, Rudin N, Saferstein R. Forensic science. Anal Chem 1999;71(12):235R.
4. Klein RFX, Hays PA. Research on drug evidence. Proceedings, 12th INTERPOL ForensicScience Symposium, Lyon, France (1998).
5. Brettell TA, Saferstein R. Forensic science. Anal Chem 1997;69(12):123R.
6. Klein RFX. Research on drug evidence. Proceedings, 11th ICPO-INTERPOL Forensic Science Symposium, Lyon, France (1995).
7. Brettell TA, Saferstein R. Forensic science. Anal Chem 1995;67(12):273.
8. Brettell TA, Saferstein R. Forensic science. Anal Chem 1993;65(12):293r.
9. Sobol SP. Research on drug evidence. Proceedings, 10th ICPO-INTERPOL Forensic Science Symposium (1992).
10. Moffat AC. Drugs of abuse. Science Justice 2000;40(2):89.
11. Malcolm M, Gutfriend M. Chemistry against crime. Can Chem News 1996;48(9):13.
12. Hartstra J, Franke JP, de Zeeuw RA. How to approach substance identification in qualitativebioanalysis. J Chromatogr B 2000;739:125.
13. United Nations International Drug Control Programme. Monograph: Rapid Testing Methods of Drugs of Abuse - 1995. New York, NY:1995.
14. Narcotics Division, Pharmaceutical and Medical Safety Bureau, Ministry of Health and Welfare, Japan. Monograph: Manual for Identification of Abused Drugs. Tokyo, Japan:1998
Microgram Journal, Volume 1, Numbers 1-2 (January - June 2003) 71
Brought to you by AltGov2 [www.altgov2.org]
15. Anonymous. The Scientific Working Group for the Analysis of Seized Drugs (SWGDRUG). Microgram 2001;34(6):136. (Note: Most current iteration within review timeframe; updates many previous reports not listed here.)
16. Janovsky TJ, Bono JP. The Scientific Working Group for the Analysis of Forensic Drug Samples (SWGDRUG) - Discussion of SWGDRUG recommendations. Proceedings of the American Academy of Forensic Sciences 2001;7:26. (Note: Most current iteration within review timeframe; updates many previous reports not listed here.)
17. United Nations International Drug Control Programme. Monograph: Recommended Guidelines for Quality Assurance and Good Laboratory Practices - 1995. New York, NY:1995.
18. United Nations International Drug Control Programme. Monograph: Glossary of Terms for Quality Assurance and Good Laboratory Practices - 1995. New York, NY:1995.
19. Saferstein R. Criminalistics: An introduction to Forensic Science, Seventh Ed., Prentice Hall, 2001.
20. Liu RH, Gadzala DE. Handbook of drug analysis: Applications in forensic and clinical laboratories. American Chemical Society Publications, Washington, DC, 1997.
21. Cole, MD. Drugs of Abuse, in: Crime Scene to Court: The Essentials of Forensic Science. White, P, Ed. Royal Society of Chemistry:1998 (London).
22. Europol Drugs Unit. Manual of the Production of Synthetic Drugs. 1998 (The Hague).
23. Cole MD, Caddy B. The Analysis of Drugs of Abuse: An Instruction Manual. Ellis-Horwood:1995 (New York).
24. Saferstein R. Criminalistics: An introduction to forensic science. 6th Ed. Englewood Cliffs, NJ. Princeton Hall:1997.
25. Adamovics JA. Analysis of addictive and misused drugs. New York, NY. Marcel Dekker, Inc.:1995.
26. Mills T, Roberson JC, McCrudy H, Wall W. Instrumental data for drug identification. 2nd Ed. Vol. 5. New York, NY. Elsevier:1992.
27. Juhala JA. The identification of alkyl nitrites. J Can Soc Forensic Sci 1992;25(1):17.
28. Kurz ME, Witherspoon JR, Savage S, Johns S. Analysis of alkyl nitrites by gas chromatography-infrared spectroscopy. J Forensic Sci 1992;37(6):1662.
29. Ripani L, Nichetti D, Rossi A, Schiavone S. In-depth headspace GC/MS analysis of alkyl nitrites. J Can Soc Forensic Sci 1999;32(4):141.
30. Gennaro MC, Giacosa D, Gioannini E, Angelino S. Hallucinogenic species in Amanita Muscaria determination of muscimol and ibotenic acid by ion-interaction HPLC. J Liq Chromatogr & Rel Tech 1997;20(3):413.
31. Trenerry VC, Robertson J, Wells RJ. Analysis of illicit amphetamine seizures by capillary electrophoresis. J Chromatogr A 1995;708:169.
32. Sadeghipour F, Varesio E, Gilroud C, Rivier L, Veuthey JL. Analysis of amphetamine by capillary electrophoresis and liquid chromatography: Application to drug seizures and
Microgram Journal, Volume 1, Numbers 1-2 (January - June 2003) 72
Brought to you by AltGov2 [www.altgov2.org]
cross-validation. Forensic Sci Int 1997;86(1-2):1.
33. Kotai L, Keszler A, Kazinczy B. The role of self-protonation under direct GC-MS determination of amphetamine hydrochloride. Chromatographia 2001;53(7-8):447.
34. Veress T. Determination of amphetamine by HPLC after acetylation. J Forensic Sci 2000;45(1):161.
35. Makino Y, Ohta S, Hirobe M. Enantiomeric separation of amphetamine by high-performance liquid chromatography using chiral crown ether coated reversed-phase packing: Application to forensic analysis. Forensic Sci Int 1996;78(1):65.
36. Pastor-Navarro MD, Porras-Serrano R, Herraez-Hernandez R, Campins-Falco P. Automated determination of amphetamine enantiomers using a two-dimensional column-switching chromatographic system for derivatization and separation. Analyst 1998;123(2):319.
37. Clandestine Laboratory Investigating Chemists Association. Monograph: Review of the Syntheses and Analyses of P2P, Amphetamine, and Methamphetamine. Fresno, CA:1993.
38. AlDirbashi OY, Ikeda K, Takahashi M, Kuroda N, Ikeda S, Nakashima K. Drugs of abuse in a non-conventional sample; detection of methamphetamine and its main metabolite, amphetamine in abusers’ clothes by HPLC with UV and fluorescence detection. Biomed Chromatogr 2001;15(7):457.
39. Walker JA, Marche HL. Isomer determination of illicit methamphetamine and amphetamine street samples using cyclodextrin modified free zone capillary electrophoresis. Proceedings of the American Academy of Forensic Sciences 1997;3:23.
40. Valtier S, Cody JT. Evaluation of internal standards for the analysis of amphetamine and methamphetamine. J Anal Toxicol 1995;19:375.
41. Dasgupta A, Gardner C. Distinguishing amphetamine and methamphetamine from other interfering sympathomimetic amines after various fluoro derivatization and analysis by gas chromatography - chemical ionization mass spectrometry. J Forensic Sci 1995;40(6):1077.
42. Wang SM, Ling YC, Tsai LC, Giang YS. Headspace sampling and gas chromatographic mass spectrometric determination of amphetamine and methamphetamine in betel. J Chromatogr A 1995;715(2):325.
43. Longo M, Martines C, Rolandi L, Cavallaro A. Simple and fast determination of some phenethylamines in illicit tablets by base-deactivated reversed phase HPLC. J Liq Chromatogr 1994;17:649.
44. Sadeghipour F, Giroud C, Rivier L, Veuthey JL. Rapid determination of amphetamines by high-performance liquid chromatography with UV detection. J Chromatogr A 1997;761(1-2):71.
45. Malone JV. HPLC Quantitation of clandestinely manufactured mixtures of amphetamine and methamphetamine. J Clan Lab Invest Chem Assoc 1998;8(4):26.
46. Malone JV. HPLC Quantitation of clandestinely manufactured mixtures of amphetamine and methamphetamine. Microgram 1998;31(11):304.
47. Hideg Z, Dinya Z. A simple and rapid method for the identification of amphetamine and methamphetamine hydrochlorides by mass spectrometry. Anal Lett 1993;26:2637.
Microgram Journal, Volume 1, Numbers 1-2 (January - June 2003) 73
Brought to you by AltGov2 [www.altgov2.org]
48. Zhao J, Chen D, Zhang P, Lu F, Xie H, Li H. Vibrational studies of amphetamine and methamphetamine by micro-Raman scattering. Guangpuxue Yu Guangpu Fenxi 1999;19(5):687.
49. Sulk RA, Corcoran RC, Carron KT. Surface enhanced Raman scattering detection of amphetamine and methamphetamine by modification with 2-mercaptonicotinic acid. Appl Spectrosc 1999;53(8):954.
50. Falco PC, Legua CM, Cabeza AS, Serrano RP. Derivatization of amphetamine and methamphetamine with 1,2-naphthoquinone-4-sulfonic acid into solid-phase extraction cartridges. Determination of amphetamine in pharmaceutical and urine samples. Analyst 1997;122(7):673.
51. Logan BK. Amphetamines: An update on forensic issues. J Anal Toxicol 2001;25(5):400.
52. Varesio E, Veuthey J-L. Chiral separation of amphetamines by high-performance capillary electrophoresis. J Chromatogr A 1995;717(1-2):219.
53. Lurie IS, Bethea MJ, McKibben TD, Pelligrini P, Sahai R, Weinberger R. Routine analysis of methamphetamine, amphetamine, and related compounds using capillary electrophoresis. Proceedings of the American Academy of Forensic Sciences 2000;6:41.
54. Varesio E, Gauvrit JY, Longeray R, Lanteri P, Veuthey JL. Central composite design in the chiral analysis of amphetamines by capillary electrophoresis. Electrophoresis 1997;18:931.
55. Lurie IS, Odeneal II NG, McKibben TD, Casale JF. Effects of various anionic chiral selectors on the capillary electrophesis separation of chiral phenethylamines and achiral neutral impurities present in illicit methamphetamine. Electrophoresis 1998;19:2918.
56. Di Pietra AM, Gotti R, Del Borrello ED, Pomponio R, Cavrini V. Analysis of amphetamine and congeners in illicit samples by liquid chromatography and capillary electrophoresis. J Anal Toxicol 2001;25(2):99.
57. Soine WH, Duncan W, Lambert R, Middleberg R, Finley H, O’Neil DJ. Differentiation of side chain isomers of ring-substituted amphetamines using gas chromatography/infrared/mass spectrometry (GC/IR/MS). J Forensic Sci 1992;37(2):513.
58. Esseiva P, Lock E, Gueniat O, Cole MD. Identification and quantification of amphetamine and analogues by capillary zone electrophoresis. Science Justice 1997;37(2):113.
59. Cladrowarunge S, Hirz R, Kenndler E, Rizzi A. Enantiomeric separation of amphetamine related drugs by capillary zone electrophoresis using native and derivatized beta-cyclodextrin as chiral additives. J Chromatogr A 1995;710(2):339.
60. Kaufman MS, Hatzis AC. Electron impact mass spectrometry of N-substituted amphetamines. Microgram 1996;29(7):179.
61. Van Bocxlaer JF, Lambert WE, Thienpont L, De Leenheer AP. Quantitative determination of amphetamine and alpha-phenethylamine enantiomers in judicial samples using capillary gas chromatography. J Anal Toxicol 1997;21(1):5.
62. Madden JE, Pearson JR, Rowe JE. Differentiation of side chain isomers of methamphetamine using gas chromatography, high-performance liquid chromatography, and mass spectrometry. Forensic Sci Int 1993;61(2,3):169.
Microgram Journal, Volume 1, Numbers 1-2 (January - June 2003) 74
Brought to you by AltGov2 [www.altgov2.org]
63. Dimmick I, Meyer E, Van Bocxlaer J, Lambert W, DeLeenheer A. Application of gas chromatography-Fourier transform infrared spectrometry to the analysis of amphetamine analogues. J Chromatogr A 1998;819(1-2):155.
64. Melgar R, Kelly RC. A novel GC/MS derivatization method for amphetamines. J Anal Toxicol 1993;17:399.
65. Hensley D, Cody JT. Simultaneous determination of amphetamine, methamphetamine, methylenedioxyamphetamine (MDA), methylenedioxymethamphetamine (MDMA), and methylenedioxyethylamphetamine (MDEA) enantiomers by GC-MS. J Anal Toxicol 1999;23(6):518.
66. Clark CR, Valaer AK, Noggle FT, DeRuiter J. GC-MS Differentiation of acylated derivatives of methamphetamine and regioisomeric phenethylamines. Microgram 1995;28:118.
67. Clark CR, DeRuiter J, Valaer AK, Noggle FT. GC-MS analysis of acylated derivatives of methamphetamine and regioisomeric phenethylamines. J Chromatogr Sci 1995;33(9):485.
68. Rizzi AM, Hirz R, Cladrowa-Runge S, Jonsson H. Enantiomeric separation of amphetamine, methamphetamine, and ring substituted amphetamines by means of a beta-cyclodextrin-chiral stationary phase. Chromatographia 1994;39:131.
69. Mancinelli R, Gentili S, Guiducci MS, Macchia T. Simple and reliable high-performance liquid chromatography fluorimetric procedure for the determination of amphetamine-derived designer drugs. J Chromatogr B 1999;735(2):243.
70. Herraez-Hernandez R, Campins-Falco P, Tortajada-Genaro LA. Chiral determination of amphetamine and related compounds using chloroformates for derivatization and high-performance liquid chromatography. Analyst 1998;123(10):2131.
71. Chen Y-P, Hsu M-C, Chien CS. Analysis of forensic samples using precolumn derivatization with (+)-1-(9-fluorenyl)ethylchloroformate and liquid chromatography with fluorimetric detection. J Chromatogr A 1994;672:135.
72. Lurie IS. Micellar electrokinetic capillary chromatography of the enantiomers of amphetamines, methamphetamine, and their hydroxyphenethylamine precursors. J Chromatogr 1992;605:269.
73. Kaufman MS, Hatzis AC, Stuart JG. Negative-ion chemical ionization of amphetamine derivatives. J Mass Spec 1996;31(8):913.
74. Thurbide KB, Elson CM, Sim PG. Discrimination of structural isomers of amphetamine using carbon dioxide negative-ion chemical ionization mass spectrometry. Spectroscopy 1997;13(2):151.
75. Cole MD, McAvoy Y. The analysis of amphetamines by supercritical fluid chromatography with silica gel and poly-(styrenedivinylbenzene) packed columns. Proceedings of the American Academy of Forensic Sciences 1997;3:23.
76. McAvoy Y, Cole MD, Gueniat O. Analysis of amphetamines by supercritical fluid chromatography, high-performance liquid chromatography, gas chromatography and capillary zone electrophoresis; a preliminary comparison. Forensic Sci Int 1999;102(1):13.
77. Munro CH, White PC. Evaluation of diazonium salts as visualization reagents for the thin layer chromatographic characterization of amphetamines. Science Justice 1995;35:37.
Microgram Journal, Volume 1, Numbers 1-2 (January - June 2003) 75
Brought to you by AltGov2 [www.altgov2.org]
78. Poortman Van Der Meer AJ, Van Egmond HE. Quantitation of amphetamine-type compounds for which no reference compound is available: The validation of a theoretical model. Science Justice 2001;41(3):185.
79. Casale JF, Koles JE. Analysis of ayahuasca (‘Santo Daime’). Microgram 1995;28(9):296.
80. Ryan TW. Resolution of the non-specific spectra of barbiturates by UV-photodiode array detection II. Effects of sample concentration on spectral matching accuracy. J Liq Chromatogr 1993;16:33.
81. Kuroda N, Inoue K, Mayahara K, Nakashima K, Akiyama S. Application of 3-(18-naphthalimido) propyl-modified silyl silica gel as a stationary phase in high-performance liquid chromatography of barbiturates and diasteromeric compounds. J Liq Chromatogr Relat Technol 1996;19(1718):2867.
82. Garcia-Borregon PF, Lores M, Cela R. Analysis of barbiturates by micro-high-performance liquid chromatography with post-column photochemical derivatization. J Chromatogr A 2000;870(1-2):39.
83. Roy M. Analysis of barbiturates using ion trap and quadrupole mass spectrometers: A comparison. J Can Soc Forensic Sci 1994;27:19.
84. Cai X-L, Wu G-P. Spectral research on the identification of a mixture of barbiturates. Guangpu Shiyanshi 2001;18(5):591.
85. Hassan SSM, Elnemma EM, El Naby EH. Mercurimetric potentiometric determination of barbiturates using a solid-state iodide ion-selective electrode. Anal Lett 1997;30(6):1081.
86. Rukhadze MD, Bezarashvili GS, Sebiskveradze MV, Meyer VR. Separation of barbiturates with micellar liquid chromatography and optimization by a second order mathematical design. J Chromatogr A 1998;805(1-2):45.
87. Cuenca-Benito M, Sagrado S, Villanueva-Camanas RM, Medina-Hernandez MJ. Quantitative retention-structure and retention-activity relationships of barbiturates by micellar liquid chromatography. J Chromatogr A 1998;814(1-2):121.
88. Li S, Weber SG. Determination of barbiturates by solid phase microextraction and capillary electrophoresis. Anal Chem 1997;69(6):1217.
89. Hall BJ, Brodbelt JS. Determination of barbiturates by solid-phase microextraction (SPME) and ion trap gas chromatography mass spectrometry. J Chromatogr A 1997;777(2):275.
90. Mao Y, Carr PW. Separation of barbiturates and phenylthiohydantoin amino acids using the thermally tuned tandem column concept. Anal Chem 2001;73(8):1821.
91. Fater Z, Szabady B, Nyiredy S. Two-dimensional overpressured layer chromatographic separation of barbiturate derivatives. J Planar Chromatogr 1995;8:145.
92. Tomita M, Okuyama T. Application of capillary electrophoresis to the simultaneous screening and quantitation of benzodiazepines. J Chromatogr B 1996;678(2):331.
93. Chen Y, Hu A. Simultaneous determination of trace benzodiazepines from drinks by using direct electrospray probe/mass spectrometry (DEP/MS). Forensic Sci Int 1999;103(2):79.
Microgram Journal, Volume 1, Numbers 1-2 (January - June 2003) 76
Brought to you by AltGov2 [www.altgov2.org]
94. Almirall JR, Garcia AD. Quantitative determination of common benzodiazepines by free zone electrophoresis. Proceedings of the American Academy of Forensic Sciences 2000;6:22.
95. Neville GA, Beckstead HD, Shurvell HF. A Fourier transform-Raman and infrared vibrational study of delorazepam, fludiazepam, flurazepam, and tetrazepam. J Pharm Sci 1994;83:143.
96. Sultan SM, El-Mubarak AH. High performance liquid chromatographic method for the separation and quantitation of some psychotherapeutic benzodiazepines optimized by the modified simplex procedure. Talanta 1996;43:569.
97. Gil-Agusti M, Carda-Broch S, Garcia-Alvarez-Coque M, Esteve-Romero J. Use of micellar mobile phases for the chromatographic determination of clorazepate, diazepam, and diltiazem in pharmaceuticals. J Chromatogr Sci 2000;38(12):521.
98. Shimamine M, Masunari T, Nakahara Y. Identification of drugs of abuse by diode-array detection I. Screening test and identification of benzodiazepines by HPLC-DAD with ICOS software system. Eisei Shikensho Hokoku 1993;111:47.
99. He W, Parissis N, Kiratzidis T. Determination of benzodiazepines in forensic samples by HPLC with photo-diode array detection. J Forensic Sci 1998;43(5):1061.
100. Lurie IS, Cooper DA, Klein RFX. High-performance liquid chromatographic analysis of benzodiazepines using diode-array, electrochemical, and thermospray mass spectrometric detection. J Chromatogr A 1992;598:59.
101. Kleinschnitz M, Herderich M, Schreier P. Determination of 1,4-benzodiazepines by high-performance liquid chromatography electrospray tandem mass spectrometry. J Chromatogr B 1996;676(1):61.
102. Saelzer R, Gody G, Vega M, De Diego M, Godoy R, Rios G. Instrumental planar chromatographic determination of benzodiazepines: Comparison with liquid chromatography and gas chromatography. JAOAC Int 2001;84(4):1287.
103. Boonkerd S, Detaevernier MR, Vindevogel J, Michotte Y. Migration behaviour of benzodiazepines in micellar electrokinetic chromatography. J Chromatogr A 1996;756(1-2):279.
104. Renougonnord MF, David K. Optimized micellar electrokinetic chromatographic separation of benzodiazepines. J Chromatogr A 1996;735(1-2):249.
105. Cinta S, Iliescu T, Astilean S, David L, Cozar O, Kiefer W. 1,4-Benzodiazepine drugs adsorption on the Ag colloidal surface. J Mol Struct 1999;482-483:685.
106. Beaulieu N, Graham SJ, Sears RW, Lovering EG. Liquid chromatographic determination of alprazolam and related impurities in the drug substance. JAOAC Int 1992;75(5):801.
107. Catabay A, Taniguchi M, Jinno K, Pesek JJ, Williamsen E. Separation of 1,4-benzodiazepines and analogues using cholesteryl-10-undecenoate bonded phase in microcolumn liquid chromatography. J Chromatogr Sci 1998;36(3):111.
108. Bargo ES. Liquid chromatographic determination of flurazepam hydrochloride in bulk drug and dosage forms: Collaborative study. JAOAC Int 1992;75(2):240.
109. Yuan H, Mester Z, Lord H, Pawliszyn J. Automated in-tube solid-phase microextraction coupled with liquid chromatography - electrospray ionization mass spectrometry for the determination of selected benzodiazepines. J Anal Toxic 2000;24(8):718.
Microgram Journal, Volume 1, Numbers 1-2 (January - June 2003) 77
Brought to you by AltGov2 [www.altgov2.org]
110. Ohta H, Suzuki Y, Sugita R, Suzuki S, Ogasawara K. A confiscation case involving a novel barbiturate designer drug. J Can Soc Forens Sci 2000;33(3):103. [Author’s Note: The drug was identified as 1-benzyl-1-n-butylbarbituric acid.]
111. Sultan SM. Flow injection stopped-flow kinetic determination of the anxiolytic sedative bromazepam in dosage forms. Analyst 1992;117(4):773.
112. Angelos SA, Raney JK. Analysis of samples of 4-bromo-2,5-dimethoxyphenethylamine (Nexus) an analogue of 4-bromo-2,5-dimethoxyamphetamine (DOB). Proceedings of the American Academy of Forensic Sciences 1996;2:18.
113. Noggle FT, DeRuiter J, Clark CR. Analytical profiles of 4-bromo-2,5-dimethoxy-phenethylamine (NEXUS) and related precursor chemicals. Microgram 1994;27:343.
114. Giroud C, Augsburger M, Rivier L, Mangin P, Sadeghipour E, Varesio E, Veuthey JL, Kamalaprija PM. 2C-B: A new psychoactive phenylethylamine recently discovered in ecstasy tablets sold on the Swiss black market. J Anal Toxicol 1998;22(5):345.
115. DeRuiter J, Clark CR, Noggle FT. Gas chromatographic–mass spectrometric and high-performance liquid chromatographic analyses of the bromination products of the regioisomeric dimethoxyphenethylamines: Differentiation of NEXUS from five positional isomers. J Chromatogr Sci 1998;36(1):23.
116. deBoer D, Gijzels MJ, Bosman IJ, Maes RAA. More data about the new psychoactive drug 2CB. J Anal Toxicol 1999;23(3):227.
117. DeRuiter J, Holston P, Clark CR, Noggle FT. Liquid chromatographic and mass spectral methods of identification for regioisomeric dimethoxyamphetamines and brominated dimethoxyamphetamines. J Chromatogr Sci 1998;36(2):73.
118. DeRuiter J, Clark CR, Noggle FT. Analysis of the bromination products of the isomeric dimethoxyphenethylamines: Differentiation of ‘Nexus’ from five positional isomers. Microgram 1997;30(5):96.
119. DeRuiter J, Clark CR, Noggle FT. LC and GC-MS analysis of 4-bromo-2,5-dimethoxy-phenethylamine (Nexus) and 2-propanamine and 2-butanamine analogs. J Chomatogr Sci 1995;33(10):583.
120. Chamakura RP. Bufotenine - A hallucinogen in ancient snuff powders of South America and a drug of abuse on the streets of New York. Forensic Sci Rev 1994;6:1.
121. Chamakura RP. Bufotenine. Microgram 1993;26:185.
122. Burke AA, Liptak AD, Oberdorf CA. BSTFA derivatization of bufotenine. Proceedings of the American Academy of Forensic Sciences 1998;4:34.
123. Pedersen Bjergaard S, Rasmussen KE, Sannes E. Strategies for the capillary electrophoretic separation of indole alkaloids in Psilocybe Semilanceata. Electrophoresis 1998;19(1):27.
124. Montgomery MA, LeBeau MA. Differentiation of bufotenine and psilocin by GC/MS(CI). Proceedings of the American Academy of Forensic Sciences 2000;6:22.
125. Phelan CP. Identification of psilocin and bufotenine via GC/IRD. Microgram 1999;32(2):83.
Microgram Journal, Volume 1, Numbers 1-2 (January - June 2003) 78
Brought to you by AltGov2 [www.altgov2.org]
126. Phelan CP. Identification of psilocin and bufotenine via GC/IRD. Proceedings of the International Association of Forensic Sciences 15th Triennial Meeting 1999:66.
127. Chamakura RP. Tryptamines. Microgram 1994;27:316.
128. Vohlken BA. Bufotenine and psilocin mass spectral distinctions. Microgram 1993;26:233.
129. Chamakura RP. “Love stone” - A hallucinogenic, an aphrodisiac, and a deadly poison. Proceedings of the American Academy of Forensic Sciences 1996;2:48.
130. Chamakura RP. ‘Love Stone’ - A hallucinogen, an aphrodisiac, and a deadly poison. Microgram 1998;31(5):127.
131. Barry TL, Petzinger G, Zito SW. GC/MS Comparison of the West Indian aphrodisiac ‘Love Stone’ to the Chinese medication ‘Chan Su’: Bufotenine and related bufadienolides. J Forensic Sci 1996;41(6):1068.
132. Kalix P. Cathinone - a natural amphetamine. Pharm Toxicol 1992;70:77.
133. Lee MM. The identification of cathinone in khat (Catha Edulis): A time study. J Forensic Sci 1995;40(1):116.
134. Benshafrut R, Rothchild R. NMR studies of drugs. Enantiomeric excess determination of Nacetylcathinone with Eu(HFC)3 Spectrosc Lett 1992;25(7):1097.
135. Al Obaid AM, Al Tamrah SA, Aly FA, Alwarthan AA. Determination of (S)-(-)-cathinone by spectrophotometric detection. J Pharm Biomed Anal 1998;17(2):321.
136. Lewis RJ, Reed D, Service AG, Langford AM. The identification of 2-chloro-4,5-methylenedioxymethylamphetamine in an illicit drug seizure. J Forensic Sci 2000;45(5):1119.
137. Chankvetadze B, Lomsadze K, Bergenthal D, Breitkreutz J, Bergander K, Blaschke G. Mechanistic study on the opposite migration order of clenbuterol enantiomers in capillary electrophoresis with beta-cyclodextrin and single isomer heptakis(2,3-diacetyl-6-sulfo)-beta-cyclodextrin. Electrophoresis 2001;22(15):3178.
138. Garcia-Ruiz C, Marina ML. Fast enantiomeric separation of basic drugs by electrokinetic chromatography. Application to the quantitation of terbutaline in a pharmaceutical preparation. Electrophoresis 2001;22(15):3191.
139. Lopez-Erroz C, Vinas P, Cerdan FJ, Hernandez-Cordoba M. Determination of clenbuterol in pharmaceutical preparations by reaction with o-phthaldehyde using a flow-injection fluorimetric procedure. Talanta 2000;53(1):47.
140. Krawczeniuk AS. Identification of clenbuterol: GC-derivatization techniques and electrospray mass spectrometry. Microgram 1996;29(8):210.
141. Ozkan Y, Ozkan SA, AboulEnein HY. Determination of clenbuterol HCl in human serum, pharmaceuticals, and in drug dissolution studies by RP-HPLC. J Liq Chromatogr Rel Tech 2001;24(5):679.
142. Ishii H, Morishita M, Yamad H, Iwasa S, Yajima T. Simultaneous analysis of coca alkaloids and sugars in illicit cocaine using capillary electrophoresis. J Forensic Sci 2001;46(3):490.
Microgram Journal, Volume 1, Numbers 1-2 (January - June 2003) 79
Brought to you by AltGov2 [www.altgov2.org]
143. Krawczeniuk AS, Bravenec VA. Quantitative determination of cocaine in illicit powders by free zone capillary electrophoresis. J Forensic Sci 1998;43(4):738.
144. Gueniat O, Hartmann S. Profiling of illicit cocaine samples by Differential Scanning Calorimetry (DSC). Proceedings of the International Association of Forensic Sciences 13th Triennial Meeting 1993;5:214.
145. Saha U, Mazumdar KK, Sanyal M, Chakraburty NN. Determination of cocaine in suspected narcotic substances by FTIR and HPTLC methods. Microgram 1996;29(3):64.
146. Fernandez-Abedul MT, Costa-Garcia A. Flow injection analysis with amperometric detection of cocaine in confiscated samples. Anal Chim Acta 1996;328(1):67.
147. Jellema R. Analysis of cocaine hydrochloride in wax. Microgram 2001;34(7):183.
148. Krueger ST. New application for the quantitation of cocaine base by gas chromatography. J Forensic Sci 1994;39(1):177.
149. LoDico CP, Lowe RH, Caplan YH. GC/MS confirmation of cocaine sampled by AccuPRESS Surface drug test kits. Proceedings of the American Academy of Forensic Sciences 1996;2:19.
150. Glass RL, Johnson EL. Comparison of high performance liquid chromatographic analyses of cocaine in Coca leaves. J Liq Chromatogr 1993;16:3543.
151. MacGregor RR, Fowler JS, Wolf AP. Determination of the enantiomeric composition of samples of cocaine by normal-phase high performance liquid chromatography with UV detection. J Chromatogr 1992;590:354.
152. Atay O, Oztop F. Quantitative determination by using HPLC and GLC methods for cocaine HCl in synthetic binary mixtures with procaine HCl, lidocaine HCl and caffeine. Anal Letters 1997;30(3):565.
153. Campanella L, Colapicchioni C, Tomassetti M, Dezzi S. Comparison of three analytical methods for cocaine analysis of illicit powders. J Pharm Biomed Anal 1996;14(8-10):1047.
154. Nishikawa M, Nakajima K, Tatsuno M, Kasuya F, Igarashi K, Fukui M, Tsuchihashi H. The analysis of cocaine and its metabolites by liquid chromatography/atmospheric pressure chemical ionization-mass spectrometry (LC/APCI-MS). Forensic Sci Int 1994;66:149.
155. Smith RM. The mass spectrum of cocaine. J Forensic Sci 1997;42(3):475.
156. Wang PP, Bartlett MG. Collision-induced dissociation mass spectra of cocaine, and its metabolites and pyrolysis products. J Mass Spec 1998;33(10):961.
157. Trenerry VC, Robertson J, Wells RJ. The determination of cocaine and related substances by micellar electrokinetic capillary chromatography. Electrophoresis 1994;15:103.
158. Brettell TA, Cole DA. The forensic identification of cocaine free base (crack) by Raman microspectroscopy. Proceedings of the American Academy of Forensic Sciences 1999;5:45.
159. Brettell TA, Cole DA. The forensic identification of illicit cocaine by Raman microspectroscopy. Proceedings of the American Academy of Forensic Sciences 1999;5:28.
160. Hsu Y-L, Walton J, Lopez C, Rose S, Furton KG. The analysis of drug odor signatures and free fraction drugs from plasma using SPME/GC/MS. Proceedings of the American Academy of
Microgram Journal, Volume 1, Numbers 1-2 (January - June 2003) 80
Brought to you by AltGov2 [www.altgov2.org]
Forensic Sciences 2001;7:52.
161. Pantea A, Pop A, Dogaru S. Identification of cocaine in samples also containing other local anesthetics. Rev Chim (Bucharest) 1996;47(6):580.
162. Koulis CV, Reffner JA, Bibby AM. Comparison of transmission and internal reflectance infrared spectra of cocaine. J Forensic Sci 2001;46(4):822.
163. Reffner JA, Bracken VA, Koulis CV. Comparison of transmission and internal reflection infrared spectra for forensic analysis. Proceedings of the American Academy of Forensic Sciences 2001;7:50.
164. Airaksinen AJ, Tuppurainen KA, Lotjonen SE, Niemitz M, Yu MX, Vepsalainen JJ, Laatikainen R, Hiltunen J, Bergstrom KA. Nuclear magnetic resonance and molecular orbital study of some cocaine analogues. Tetrahedron 1999;55(34):10537.
165. Elsherbini SH. Cocaine base identification and quantification. Forensic Sci Rev 1998;10(1):1.
166. Wang PP, Bartlett MG. Identification and quantitation of cocaine N-oxide: A thermally labile metabolite of cocaine. J Anal Toxicol 1999;23(1):62.
167. Jenkins AJ, Llosa T, Montoya I, Cone EJ. Identification and quantitation of alkaloids in coca tea. Forensic Sci Int 1996;77(3):179.
168. Christie TJ, Hanway RH, Paulls DA, Townsend A. Chemiluminescence determination of codeine by permanganate oxidation. Anal Proc 1995;32(3):91.
169. Liu SY, Woo SO, Holmes MJ, Koh HL. LC and LC-MS-MS analyses of undeclared codeine in antiasthmatic Chinese proprietary medicine. J Pharm Biomed Anal 2000;22(3):481.
170. Nair NM, Jackson GE, Campbell WE. Structural assignment of the opium alkaloid codeine via 2D NMR techniques. Spec Letts 1997;30:497.
171. Stubberud KP, Astrom O. Separation of ibuprofen, codeine phosphate, their degradation products and impurities by capillary electrophoresis. II. Validation. J Chromatogr A 1998;826(1):95.
172. Haque A. Stewart JT. Simultaneous determination of codeine, butalbital, and aspirin by free solution capillary electrophoresis. J Liq Chromatogr and Rel Tech 1999;22(8):1193.
173. Ragonese R, Mulholland M, Kalman J. Full and fractionated experimental designs for robustness testing in the high-performance liquid chromatographic analysis of codeine phosphate, pseudoephedrine hydrochloride and chlorpheniramine maleate in a pharmaceutical preparation. J Chromatogr A 2000;870(1-2):45.
174. Churchill KT. Creatine; an analytical profile. Microgram 2000;33:223.
175. Chew S, Chappell J. Analytical update on creatine. Microgram 2001;34(2):33.
176. Wagner SD, Kaufer SW, Sherma J. Quantification of creatine in nutrition supplements by thin layer chromatography-densitometry with thermochemical activation of fluorescence quenching. J Liq Chromatogr Rel Tech 2001;24(16):2525.
177. Callahan SA, Latham DJ, Dawson BA, Black DB, Cyr TD, Ethier J-C, By AW, Neville GA. Identification of an unusual police exhibit as cyclofenil, a gonad-stimulating substance.
Microgram Journal, Volume 1, Numbers 1-2 (January - June 2003) 81
Brought to you by AltGov2 [www.altgov2.org]
Microgram 1997;30(7):145.
178. Dearmore IK. Cyclohexyl nitrite encounter. J Forensic Sci 1999;44(1):197.
179. Ferretti R, Gallinella B, Latorre F, Lusi A. Direct high-performance liquid chromatography resolution on a chiral column of dexfenfluramine and its impurities in bulk raw drug and pharmaceutical formulations. J Chromatogr A 1996;731(1-2):340.
180. Fitzgerald RL, O’Neal CL, Hart BJ, Poklis A, Harold DA. Comparison of an ion trap and a quadrupole mass spectrometer using diazepam as a model compound. Anal Toxicol 1997;21(6):445.
181. Garcia MG, Garcia A, Gonzalez I. Extraction and electrochemical quantification of the active ingredient (diazepam) in pharmaceutical products. Talanta 1993;40(12):1775.
182. Hays PA. Dihydroetorphine and etorphine. Microgram 1998;31(9):234.
183. Stall J. 2,5-Dimethoxy-4-ethylthiophenethylamine (2C-T-2). J Clan Lab Invest Chem Assoc 1999;9(1):15.
184. Zimmerman MM. The identification of 2,5-dimethoxy-4-(N)-propylthiophenethylamine (2C-T-7). Microgram 2001;34(7):169.
185. Dawson BA, Black DB, Cyr TD, Neville GA, Shurvell HF. Spectroscopic characterization and proof of structure for dimethpramide. Can J App Spect 1995;40(5):131.
186. Dawson BA, Black DB, Cyr TD, Ethier J-C, By AW, Beckstead HD, Neville GA. Structural elucidation of unusual police exhibits. I. Dimethpramide (Dimetcarb). Forensic Sci Int 1995;71(3):169.
187. Latham D, Callahan S, Dawson BA, Black DB, Cyr T, Ethier JC, By A, Beckstead HD, Neville GA. Identification of an unusual police exhibit as dimethpramide. Microgram 1994;27:227.
188. Noggle FT, Clark CR, DeRuiter J. Liquid chromatographic and spectral analysis of the stereoisomers of dimethylaminorex. JAOAC Int 1992;75(3):423.
189. Bailey VA, Buer LO. The stability of dimethylamphetamine upon exposure to heat, air, and moisture. Microgram 1993;26:96.
190. Sato M, Hida M, Nagase H. Analysis of the pyrolysis products of dimethylamphetamine. J Anal Toxicol 2001;25(5):304.
191. Ford SL, Steiner RR, Thiericke R, Young R, Soine WH. Dragon’s blood incense: Misbranded as a drug of abuse? Forensic Sci Int 2001;115(1-2):1
192. Steiner RR. Dragon's blood incense. Microgram 1997;30(11):258.
193. Flieger M, Wurst M, Shelby R. Ergot alkaloids - Sources, structures, and analytical methods. Folia Microbiologica 1997;42(1):3.
194. Ware GM, Price G, Carter Jr L, Eitenmiller RR. Liquid chromatographic preparative method for isolating ergot alkaloids, using a particle-loaded membrane extracting disk. JAOAC Int 2000;83(6):1395.
Microgram Journal, Volume 1, Numbers 1-2 (January - June 2003) 82
Brought to you by AltGov2 [www.altgov2.org]
195. Scott PM, Lombaert GA, Pellaers P, Bacler S, Lappi J. Ergot alkaloids in grain foods sold in Canada. JAOAC Int 1992;75(5):773.
196. Mestre YF, Band BF, Zamora LL, Calatayud JM. Flow injection analysis - direct chemiluminescence determination of ergonovine maleate enhanced by hexadecyl-pyridinium chloride. Analyst 1999;124(3):413.
197. Sorokin VI, Ponkratov KV, Drozdov MA. Etonitazene encountered in Moscow. Microgram 1999;32(9):239.
198. Al-Hussaini SR. Counterfeit Captagon: An analytical study. Science Justice 1996;36(3):139.
199. Al-Gharably N, Al-Obaid AR. The characterization of counterfeit Captagon tablets. J Forensic Sci Soc 1994;34:165.
200. Poklis A. Fentanyl: A review for clinical and analytical toxicologists. Clinical Toxicology 1995;33(5):439.
201. Guo H, Hu N, Lin S. Adsorptive stripping voltametric properties of fentanyl at Hg electrode. Talanta 1994;41(11):1929.
202. Clandestine Laboratory Investigating Chemists Association. Monograph: A Review of the Syntheses and Analyses of Fentanyl and its Analogues. Fresno, CA:1996.
203. Lurie IS, Allen AC. Reversed-phase high performance liquid chromatographic separation of fentanyl homologues and analogues II. Variables affecting hydrophobic group contribution. J Chromatogr 1992;292:283.
204. Ohta H, Suzaki S, Ogasawara K. Studies on fentanyl and related compounds. IV. Chromatographic and spectrometric discrimination of fentanyl and its derivatives. J Anal Toxicol 1999;23(4):280.
205. Ye NS, Zhu RH, Gu XX, Zou H. Determination of scopolamine, atropine and anisodamine in Flos daturae by capillary electrophoresis. Biomedical Chromatography 2001;15(8):509.
206. Churchill KT. Roofies. Microgram 1995;28(10):329.
207. Chociay J, Szarka J, McBride C. Procedure for the identification of flunitrazepam tablets (Rohypnol). Microgram 1999;32(2):75.
208. Rucker C. Chemical screening and identification techniques for flunitrazepam. Microgram 1998;31(7):198.
209. McKibben T. Simple and rapid color screening tests for flunitrazepam (Rohypnol). J Forensic Sci 1999;44(2):396.
210. Rochholz G, Ahrens B, Schutz H. Modified screening procedure with fluorescence detection for flunitrazepam. Arzneimittel Forschung 1994;44(1):469.
211. Neville GA, Beckstead HD, Black DB, Dawson BA, Shurvell HF. Vibrational and NMR spectroscopic study of aged flurazepam mono- and dihydrochloride salts for content identity. J Pharm Sci 1994;83(9):1274.
212. Rucker CL. Chemical screening and identification techniques for flunitrazepam. Proceedings of the American Academy of Forensic Sciences 1999;5:40.
Microgram Journal, Volume 1, Numbers 1-2 (January - June 2003) 83
Brought to you by AltGov2 [www.altgov2.org]
213. Alexander GL. Characterization of aromatic fluoro-analogs of phenylacetone, amphetamine, and methamphetamine. Microgram 1994;27:268.
214. Poortman-van der Meer AJ, Huizer H. First encounter with p-fluorofentanyl in the Netherlands. Toxichem + Krimtech 1996;63(1):7.
215. Holt P-J, Bruce NC, Lowe CR. Bioluminescent assay for heroin and its metabolites. Anal Chem 1996;68(11):1877.
216. Trenerry VC, Wells RJ. The analysis of illicit heroin seizures by capillary zone electrophoresis. J Chromatogr Sci 1994;32(1):1.
217. Hu SH, Liu YL, Ju JY. A method for the simultaneous quantitation of seized heroin using pyrene as internal standard and qualitative analysis of its adulterants by GC/MS. Proceedings of the American Academy of Forensic Sciences 1995;1:18.
218. Aizenman N, Ravreby M. Detecting heroin in heroin citrate residues. Microgram 1994;27:182.
219. Wijesekera ARL, Abeysinghe DMUJ, Pathirana KC. Studies of the degradation of heroin. Forensic Sci Int 1994;67(3):147.
220. Burla R, Avraham S, Glattstein, B, Levy S. Separation of heroin from several adulterants in illicit powders. Microgram 1995;28(9):300.
221. Besacier F. Isotope fingerprints of illicit heroin samples. Presentation - 5th Canadian Continuous-Flow Isotope Ratio Mass Spectrometry Workshop; Ottawa, Canada; 1998.
222. Lurie IS. Application of micellar electrokinetic capillary chromatography to the analysis of illicit heroin seizures. J Chromatogr A 1997;780:265.
223. Walker JA, Krueger ST, Lurie IS, Marche HL, Newby N. Analysis of heroin drug seizures by micellar electrokinetic capillary chromatography (MECC). J Forensic Sci 1995;40(1):6.
224. Suryaprakash N, Azoury M, Goren Z, Jelinek R. Identification of heroin in street doses using 1D-TOCSY nuclear magnetic resonance. J Forensic Sci 2000;45(5):963.
225. Kalia A, Sharm RM, Singh G, Kaur S, Verma RS. Analysis of heroin and its adulterants by thin layer chromatography. Indian J Forensic Sci 1992;6:95.
226. Visky D, Kraszni M, Hosztafi S, Noszal B. HPCE analysis of hydrolysing morphine derivatives. Quantitation of decomposition rate and mobility. Chromatographia 2000;51(5/6):294.
227. Krough M, Brekke S, Tonnesen F, Rasmussen KE. Analysis of drug seizures of heroin and amphetamine by capillary electrophoresis. J Chromatogr A 1994;674:235.
228. Liu CL, Bowers LD. Mass spectrometric characterization of the beta-subunit of human chorionic gonadotropin. J Mass Spec 1997;32(1):33.
229. Clandestine Laboratory Investigating Chemists Association. Monograph: GHB. Fresno, CA:2000.
230. Lewis A, Smith E. gamma-Hydroxybutyrate: From the 60's to the present. Proceedings of the American Academy of Forensic Sciences 2000;6:43.
Microgram Journal, Volume 1, Numbers 1-2 (January - June 2003) 84
Brought to you by AltGov2 [www.altgov2.org]
231. Walker L. Identification of the potassium salt of gamma-hydroxybutyric acid (GHB). J Clan Lab Invest Chem Assoc 1999;9(1):17.
232. Bommarito C. Analytical profile of gamma-hydroxybutyric acid (GHB). J Clan Lab Invest Chem Assoc 1993;3:10.
233. Krawczeniuk A. The occurrence of gamma-hydroxybutyric acid (GHB) in a steroid seizure. Microgram 1993;26(7):160.
234. Krawczeniuk AS. Direct detection of gamma-hydroxybutyrate: A new recreational drug via free zone capillary electrophoresis. Proceedings of the American Academy of Forensic Sciences 1998;4:34.
235. Koppenhaver DJ. GHB color test. Microgram 1997;30(6):130.
236. Morris, JA. Extraction of GHB for FTIR analysis and a new color test for gamma-butyrolactone (GBL). Microgram 1999;32(8):215.
237. Garcia AD, Shannon M, Almirall JR. Fast analysis of gamma-hydroxybutyric acid (GHB) by in-situ derivatization on an SPME fiber. Proceedings of the American Academy of Forensic Sciences 1999;5:45.
238. Wolnik KA, Keitkemper DT, Crowe JB, Barnes BS, Brueggemeyer TW. Application of inductively coupled plasma atomic emission and mass spectrometry to forensic analysis of sodium gamma-hydroxy butyrate and ephedrine hydrochloride. J Anal Atomic Spect 1995;10:177.
239. Catterton AJ. Identification of sodium gamma-hydroxybutyrate (NaGHB) by infrared spectroscopy, utilizing a 3 bounce diamond ATR element. Microgram 2001;34(1):15.
240. Andera KM, Evans HK, Wojcik CM. Microchemical identification of gamma-hydroxybutyrate (GHB). J Forensic Sci 2000;45(3):665.
241. Chew SL. Identification and quantitation of GHB by nuclear magnetic resonance spectroscopy. Proceedings of the American Academy of Forensic Sciences 1999;5:41.
242. Blair S, Song M, Hall B, Brodbelt J. Determination of gamma-hydroxybutyrate in water and human urine by solid phase microextraction – gas chromatography/quadrupole ion trap spectrometry. J Forensic Sci 2001;46(3):688.
243. Ciolino LA, Mesmer MZ, Satzger RD, Machal AC, McCauley HA, Mohrhaus AS. The chemical interconversion of GHB and GBL: Forensic issues and implications. J Forensic Sci 2001;46(6):1315.
244. Ciolino LA, Mesmer MZ. Bridging the gap between GHB and GBL: Forensic issues of interconversion. Proceedings of the American Academy of Forensic Sciences 2000;6:44.
245. Garcia AD, Lurie IS, Hulett L, Almirall JR. Quantitation of gamma-hydroxybutyric acid and gamma-butyrolactone using capillary electrophoresis and high performance liquid chromatography. Proceedings of the American Academy of Forensic Sciences 2001;7:28.
246. Naisbitt GH, Murdock DS, McDaniel SR, Hopkins BJ, McNair JM. GHB determination by GCMS without complication or ambiguity from GBL. Proceedings of the American Academy of Forensic Sciences 2001;7:28.
Microgram Journal, Volume 1, Numbers 1-2 (January - June 2003) 85
Brought to you by AltGov2 [www.altgov2.org]
247. Beyerle TH. Optimum high performance liquid chromatography parameters for the quantitation of gamma-hydroxybutyrate and gamma-butyrolactone. Proceedings of the American Academy of Forensic Sciences 2000;6:44.
248. Mesmer MZ, Satzger RD. Determination of gamma-hydroxybutyrate (GHB) and gamma butyrolactone (GBL) by HPLC/UV-VIS spectrophotometry and HPLC/thermospray mass spectrometry. J Forensic Sci 1998;43(3):489 [published erratum appears in J Forensic Sci 1998;43(6):1259].
249. Vose J, Tighe T, Schwartz M, Buel E. Detection of gamma-butyrolactone (GBL) as a natural component in wine. J Forensic Sci 2001;46(5):1164.
250. Morris JA. Analogs of GHB. Part 2: Analytical perspective. J Clan Lab Invest Chem Assoc 2001;11(1):16.
251. McCauley HA, Machal AC, Ciolino LA, Mesmer MZ, Satzger RD. GHB, GBL, BD: A recipe for disaster. Proceedings of the American Academy of Forensic Sciences 2000;6:43.
252. Morris JA. Analogs of GHB. Part 1: Theoretical perspective. J Clan Lab Invest Chem Assoc 2000;10(2):18.
253. Northrop DM. GHB analysis by capillary electrophoresis. Proceedings of the American Academy of Forensic Sciences 2001;7:27.
254. Chew SL. 1,4-Butanediol in liquid exhibit. Microgram 1997;30(7):154.
255. Walker L. Maple syrup and 1,4-butanediol. J Clan Lab Invest Chem Assoc 2000;10(3):13.
256. Cyr T, Dawson B, By A, Neville G, Shurvell H. Structural elucidation of unusual police exhibits. II: Identification and spectral characterization of N-(2-hydroxyethyl)amphetamine hydrochloride. J Forensic Sci 1996;41(4):608.
257. Carpenter J, Hugel J, Weaver K. The identification of N-(2-hydroxyethyl)amphetamine. J Can Soc Forens Sci 1993;26:143.
258. Pakulniewicz KJ. The use of derivatives to identify N-hydroxy-3,4-methylenedioxy-amphetamine by GC-FTIR. Proceedings of the American Academy of Forensic Sciences 1995;1:22.
259. Noggle FT, Clark CR, DeRuiter J, Cain P. Analytical Properties of N-hydroxy-3,4-methylenedioxymethamphetamine (‘Flea’): A Potential New Street Drug. Microgram 1996;29(1):10.
260. Smith RM, Koch MG. Thermal decomposition of N-hydroxy-3,4-methylenedioxyamphetamine during GC and GC/MS analysis. Microgram 1995;28:199.
261. Hays PA, Koles JE, Morello DR. Imazalil sulfate. Microgram 1995;28(12):389.
262. Perez-Ruiz T, Martinez-Lozano C, Sanz A, Alonso C. Flow-injection extraction spectrophotometric determination of imipramine in pharmaceuticals with methyl orange. Talanta 1994;41(9):1523.
263. Koverman G. Identification of scopolamine and hyoscyamine in jimson weed (Datura Stramonium). Microgram 1993;26:122.
Microgram Journal, Volume 1, Numbers 1-2 (January - June 2003) 86
Brought to you by AltGov2 [www.altgov2.org]
264. Rees DK, Wasem SE. The identification and quantitation of ketamine hydrochloride. Microgram 2000;33(7):163.
265. Licata M, Pierini G, Popoli G. A fatal ketamine poisoning. J Forensic Sci 1994;39(5):1314.
266. LeBelle M, Lauriault G, Lavoie A. Chiral carboxylic acids as derivatizing agents for the determination of the alkaloids of khat. Proceedings of the International Association of Forensic Sciences 13th Triennial Meeting 1993;5:238.
267. Ripani L, Schiavone S, Garofano L. GC/MS identification of Catha Edulis stimulant-active principles. Forensic Sci Int 1996;78(1):39.
268. LeBelle MJ, Lauriault G, Lavoie A. Gas chromatographic-mass spectrometric identification of chiral derivatives of the alkaloids of khat. Forensic Sci Int 1993;61(1):53.
269. Morselli O, Bovolenta A, Ripani L, Garofano L. Gas-chromatography/mass spectrometry determination of the active principles of Catha Edulis. African Vegetable. Microgram 1992;25:290.
270. Deters KS. Identification of khat using GC/MS/MS. Proceedings of the American Academy of Forensic Sciences 1997;3:22.
271. Mathys K, Brenneisen R. HPLC and TLC profiles of phenylalkylamines of khat (Catha Edulis Forsk) confiscated in Switzerland. Pharm Acta Helv 1993;5:53.
272. Dawson BA, Black DB, Lavoie A, LeBelle MJ. Nuclear magnetic resonance identification of the phenethylamine alkaloids of khat using a chiral solvating agent. J Forensic Sci 1994;39:1026.
273. Archontaki HA, Atamian K, Panderi IE, Gikas EE. Kinetic study on the acidic hydrolysis of lorazepam by a zero-crossing first-order derivative UV-spectrophotometric technique. Talanta 1999;48(3):685.
274. Clandestine Laboratory Investigating Chemists Association. Monograph: LSD. Fresno, CA:1999.
275. Paul BD, Smith ML. LSD - An overview on drug action and detection. Forensic Sci Rev 1999;11(2):157.
276. Kilmer SD. The isolation and identification of lysergic acid diethylamide (LSD) from sugar cubes and a liquid substrate. J Forensic Sci 1994;39:860.
277. Webb KS, Baker PB, Cassells NP, Francis JM, Johnston DE, Lancaster SL, Minty PS, Reed GD, White SA. The analysis of lysergide (LSD): The development of novel enzyme immunoassay and immunoaffinity extraction procedures together with an HPLC-MS confirmation procedure. J Forensic Sci 1996;41(6):938.
278. Ripani L, Schiavone S, Garofano L. GC quantitative determination of illicit LSD. J Forensic Sci 1994;39(2):512.
279. Blackwell TM. Identification of LSD on single blotter paper via GC/MS using electronic pressure controls and pulsed split injection. Microgram 1998;31(2):51.
280. Gilbert MW, Lothridge K. The differentiation of LSD and LAMPA by capillary GC/MS/FTIR. Proceedings of the International Association of Forensic Sciences 14th Triennial Meeting 1996;2:356.
Microgram Journal, Volume 1, Numbers 1-2 (January - June 2003) 87
Brought to you by AltGov2 [www.altgov2.org]
281. Morales R. Quantitative analysis of lysergic acid diethylamide by gas liquid chromatography. Microgram 1993;26:129.
282. Veress T. Study of the extraction of LSD from illicit blotters for HPLC determination. J Forensic Sci 1993;38:1105.
283. Heagy JA, Moriwaki WM, Chan, KT. LSD extraction from blotter paper. Microgram 1995;28:85.
284. Djordjevic MN, Fitzpatrick F, Houdiere F. Separation of D-lysergic acid diethylamide derivatives using micellar electrokinetic capillary chromatography. Electrophoresis 2000;21(4):724.
285. Salamone S, Li Z, McNally AJ, Vitone S, Wu RS. Epimerization studies of LSD using 1H nuclear magnetic resonance (NMR) spectroscopy. J Anal Toxicol 1997;21(6):492.
286. Jeger AN, Briellmann TA. Robotic TLC-sampling by quantification of LSD trips. Proceedings of the International Association of Forensic Sciences 13th Triennial Meeting 1993;5:262.
287. Anderson P, Ehorn CA. Rapid confirmation of hallucinogens after minimal sample preparation by GC/MS and GC/MS/MS. Proceedings of the American Academy of Forensic Sciences. 1999;5:43.
288. Moreno E, Roca I, Peso A, del Menendez M. Clandestine plantation of cannabis sativa in Spain. Microgram 2001;34(4):67.
289. Lurie IS, Meyers RP, Conver TS. Capillary electrochromatography of cannabinoids. Anal Chem 1998;70(15):3255.
290. Lurie IS, Meyers RP, Conver TS. Capillary electrochromatography of cannabinoids. Proceedings of the American Academy of Forensic Sciences. 1999;5:42.
291. Kohjyouma M, Lee I-J, Iida O, Sekita S, Satake M, Makino Y. DNA analysis of Cannabis Sativa L. DNA Takei 2000;8:87.
292. Linacre A, Thorpe J. Detection and identification of cannabis by DNA. Forensic Sci Int 1998;91:71.
293. Sochocki RE. Purifying charred marihuana residue for the Duquenois-Levine test. Microgram 1997;30(8):181.
294. Bacigalupo MA, Ius A, Meroni G, Grassi G, Moschella A. Time-resolved fluoroimmunoassay for delta-(9)-tetrahydrocannabinol as applied to early discrimination of Cannabis Sativa plants. J Agric and Food Chem 1999;47(7):2743.
295. Oulton SR. Separation and identification of ephedrine, pseudoephedrine, and methamphetamine mixtures. Microgram 1997;30(12):289.
296. Oulton SR. Separation and identification of ephedrine, pseudoephedrine, and methamphetamine mixtures. J Clan Lab Invest Chem Assoc 1997;7(4):19.
297. Debruyne D, Albessard F, Bigot MC, Moulin M. Comparison of three advanced chromatographic techniques for Cannabis identification. Bull Narc 1994;46(2):109.
Microgram Journal, Volume 1, Numbers 1-2 (January - June 2003) 88
Brought to you by AltGov2 [www.altgov2.org]
298. Huizer H, Poortman-van der Meer AJ. A contribution to the improvement of accuracy in the quantitation of THC. Proceedings of the International Association of Forensic Sciences 15th Triennial Meeting 1999:64.
299. Poortman-van der Meer AJ, Huizer H. A contribution to the improvement of accuracy in the quantitation of THC. Forensic Sci Int 1999;101(1):1.
300. Doig MV, Andela R. Analysis of pharmacologically active cannabinoids by GC-MS. Chromatographia 2000;52(Suppl S):S101.
301. Ross SA, Mehmedic Z, Murphy TP, El Sohly MA. GC-MS analysis of the total delta-9-THC content of both drug- and fiber-type cannabis seeds. J Anal Toxic 2000;24(8):715.
302. Zoller O, Rhyn P, Zimmerli B. High-performance liquid chromatographic determination of delta-(9)-tetrahydrocannabinol and the corresponding acid in hemp containing foods with special regard to the fluorescence properties of delta-(9)-tetrahydrocannabinol. J Chromatogr A 2000;872(1-2):101.
303. Rustichelli C, Ferioli V, Baraldi M, Zanoli P, Gamberini G. Analysis of cannabinoids in fiber hemp plant varieties (Cannabis Sativa L.) by high-performance liquid chromatography. Chromatographia 1998;48(3-4):215.
304. Matsunaga T, Ano M, Watanabe K, Yamamoto I, Yoshimura H. Analysis of nitrogen containing compounds p-coumaroyltyramine and feruloyltyramine for discrimination of Cannabis seeds by HPLC. Jpn J Toxicol Environ Health 1997;43(4):215.
305. Veress T. Sample preparation by supercritical fluid extraction for quantitation. A model based on the diffusion layer theory for determination of extraction time. J Chromatogr A 1994;668:285.
306. Ndjoko K, Wolfender JL, Hostettmann K. Analysis of cannabinoids by liquid chromatographythermospray mass spectrometry and liquid chromatography-tandem mass spectrometry. Chromatographia 1998;47(1-2):72.
307. Taylor R, Lydon J, Anderson JD. Anatomy and viability of Cannabis Sativa stem cuttings with and without adventitious roots. J Forensic Sci 1994;39:769.
308. Bäckström B, Cole MD, Carrott MJ, Jones DC, Davidson G, Coleman K. A preliminary study of the analysis of Cannabis by supercritical fluid chromatography with atmospheric pressure chemical ionization mass spectrometric detection. Science Justice 1997;37(2):91.
309. Hauber DJ. Marijuana analysis with recording of botanical features present and without the environmental pollutants of the Duquenois-Levine test. J Forensic Sci 1992;37(6):1656.
310. Tanaka H, Shoyama Y. Monoclonal antibody against tetrahydrocannabinolic acid distinguishes Cannabis Sativa samples from different plant species. Forensic Sci Int 1999;106:135.
311. Smith RM. Identification of butyl cannabinoids in marijuana. J Forensic Sci 1997;42(4):610.
312. Gennaro MC, Gioannini E, Giacosa D, Siccardi D. Determination of mescaline in hallucinogenic Cactaccae by ion-interaction HPLC. Anal Lett 1996;29(13):2399.
313. Maloney DC. Extraction of mescaline from peyote. Microgram 2001;34(8):205.
Microgram Journal, Volume 1, Numbers 1-2 (January - June 2003) 89
Brought to you by AltGov2 [www.altgov2.org]
314. Yap ATW, Chen SX, Lee TK. An approach to the analysis of methamphetamine in illicit “ice” seizures. Proceedings of the International Association of Forensic Sciences 15th Triennial Meeting 1999:58.
315. Bokor I, Trenerry VC, Scheelings P. Separation and quantitation of optical isomers of methylamphetamine samples by capillary electrophoresis. Forensic Sci Int 1997;85(3):177.
316. Kozma D, Madarasz Z, Kassai C, Fogassy E. Optical resolution of N-methylamphet-amine via diastereomeric salt formation with 2R,3R-O,O’-di-p-toluoyltartaric acid. Chirality 1999;11(5-6):373.
317. Tsuchihashi H, Katagi M, Nishikawa M, Tatsuno M, Nishioka H, Nara A, Nishio E, Petty C. Determination of methamphetamine and its related compounds using Fourier transform Raman spectroscopy. Appl Spectrosc 1997;51(12):1796.
318. Jirovsky D, Lemr K, Sevcik J, Smysl B, Stransky Z. Methamphetamine - Properties and analytical methods of enantiomer determination. Forensic Sci Int 1998;96(1):61.
319. Wu AH, Onigbinde TA, Wong SS, Johnson KG. Identification of methamphetamine and over the counter sympathomimetic amines by full scan GC-ion trap MS with electron impact and chemical ionization. J Anal Toxicol 1992;16:137.
320. Urry FM, Kushnir M, Nelson G, McDowell M, Jennison T. Improving ion mass ratio performance at low concentrations in methamphetamine GC-MS assay through internal standard selection. J Anal Toxicol 1996;20(7):592.
321. Kobayashi K, Kanamori T, Iwata Y, Kishi T. Determination of methamphetamine and its related compounds enantiomer ratios by high performance liquid chromatography with circular dichroism (CD) detection. Proceedings of the International Association of Forensic Sciences 15th Triennial Meeting 1999:64.
322. Chappell JS. Infrared discrimination of enantiomerically enriched and racemic samples of methamphetamine salts. Analyst 1997;122(8):755.
323. Chappell JS. A novel infrared method for the determination of the enantiomeric composition of methamphetamine salts. Proceedings of the American Academy of Forensic Sciences 1998;4:32.
324. Kram TC, Lurie IS. The determination of enantiomeric composition of methamphetamine by 1HNMR spectroscopy. Forensic Sci Int 1992;55(2):131.
325. Reese ES, Harrington PdB. The analysis of methamphetamine hydrochloride by thermal desorption ion mobility spectrometry and SIMPLISMA. J Forensic Sci 1999;44(1):68.
326. Kuroda N, Nomura R, Al Dirbashi O, Akiyama S, Nakashima K. Determination of methamphetamine and related compounds by capillary electrophoresis with UV and laser-induced fluorescence detection. J Chromatogr A 1998;798(1-2):325.
327. Clandestine Laboratory Investigating Chemists Association. Monograph: Methaqualone. Fresno, CA:2000.
328. United Nations International Drug Control Programme (Scientific Section). Monograph: Studies on Colour Tests for Field Detection of Narcotic Drugs and Psychotropic Substances Under International Control (No. II). Screening Colour Tests and Specific Colour Test for the Detection of Non-Barbiturate Sedatives and Hypnotics Methaqualone and Mecloqualone - 1996. New York, NY:1996.
Microgram Journal, Volume 1, Numbers 1-2 (January - June 2003) 90
Brought to you by AltGov2 [www.altgov2.org]
329. Clandestine Laboratory Investigating Chemists Association. Monograph: A Review of the Syntheses and Analyses of Methcathinone and its Analogues. Fresno, CA:1998.
330. Semkin EP, Sorokin VI, Savenko VG. Examination of ephedrone. Microgram 1993;26:11.
331. DeRuiter J, Hayes L, Valaer A, Clark CR, Noggle FT. Methcathinone and designer analogues: Synthesis, stereochemical analysis, and analytical properties. J Chromatogr Sci 1994;32(12):552.
332. Noggle FT, DeRuiter J, Hayes L, Clark CR. Stereochemical analysis of methcathinone prepared by oxidation of ephedrines and pseudoephedrines. Microgram 1994;27:119.
333. Noggle FT, DeRuiter J, Valaer A, Clark CR. GC-MS analysis of methcathinone and its major decomposition product. Microgram 1994;27:106.
334. Glennon RA, Young R, Martin BR, Dal Cason TA. Methcathinone (‘Cat’): An enantiomeric potency comparison. Pharm Biochem Behav 1995;50:601.
335. Dal Cason TA. The identification of cathinone and methcathinone. Microgram 1992;25(12):313.
336. Dal Cason TA. The identification of 4-methoxyamphetamine (PMA) and 4methoxymethamphetamine (PMMA). Microgram 2000;33(8):207.
337. Dal Cason TA. A re-examination of the mono-methoxy positional ring isomers of amphetamine, methamphetamine, and phenyl-2-propanone. Forensic Sci Int 2001;119(2):168.
338. Clark CR, Noggle FT, DeRuiter J. Analysis of methoxy MDA derivatives synthesized from nutmeg oil and 3-methoxy-4,5-methylenedioxybenzaldehyde. Microgram 1995;28(11):358.
339. Clark CR, DeRuiter J, Noggle FT. Analysis of 1-(3-methoxy-4,5-methylenedioxyphenyl)-2-propanamine (MMDA) derivatives synthesized from nutmeg oil and 3-methoxy-4,5-methylenedioxybenzaldehyde. J Chomatogr Sci 1996;34(l):34.
340. Casale JF, Hays PA, Klein RFX. Synthesis and characterization of the 2,3-methylenedioxy-amphetamines. J Forensic Sci 1995;40(3):391.
341. Borth S, Hansel W, Rosner P, Junge T. Synthesis of 2,3- and 3,4-methylenedioxyphenyl-alkylamines and their regioisomeric differentiation by mass spectral analysis using GC-MS-MS. Forensic Sci Int 2000;114(3):139.
342. Borth S, Hansel W, Rosner P, Junge T. Regioisomeric differentiation of 2,3- and 3,4-methylenedioxy ring-substituted phenylalkylamines by gas chromatography/tandem mass spectrometry. J Mass Spectrom 2000;35(6):705.
343. Clark CR, Noggle FT, Holston PL, DeRuiter J. Methods of differentiation for regioisomeric 2,3-and 3,4-methylenedioxyphenalkylamines by liquid chromatography and mass spectrometry. Microgram 1998;31(9):244.
344. DeRuiter J, Holston PL, Clark CR, Noggle FT. Liquid chromatographic and mass spectral methods of identification for the regioisomeric 2,3- and 3,4-methylenedioxyphenalkylamines. J Chromatogr Sci 1998;36(3):131.
345. Clandestine Laboratory Investigating Chemists Association. Monograph: Structure-Activity Relationships, Synthesis, Precursor Preparation, and Analysis of MDMA and its Analogs and
Microgram Journal, Volume 1, Numbers 1-2 (January - June 2003) 91
Brought to you by AltGov2 [www.altgov2.org]
Homologues. Fresno, CA:1994.
346. Furnari C, Ottaviano V, Rosati F, Tondi V. Identification of 3,4-methylenedioxyamphetamine analogs encountered in clandestine tablets. Forensic Sci Int 1998;92:49.
347. Lee GSH, Taylor RC, Wilson M. C-13 Solid state nuclear magnetic resonance (NMR) spectroscopy - A non-destructive method for determining the nature and quality of illicit substances. Proceedings of the International Association of Forensic Sciences 15th Triennial Meeting 1999:60.
348. Garcia AD, Lurie IS. Quantitation of 3,4-methylenedioxymethamphetamine and related compounds using capillary electrophoresis. Proceedings of the American Academy of Forensic Sciences 2000;6:40.
349. Varesio E, Gauvrit JY, Longeray R, Lanteri P, Veuthey JL. Optimization of fast CE analyses of ecstasy derivatives by use of experimental designs. Chromatographia 1999;50(3/4):195.
350. Wesley JF. Cops and crime lab unite to improve street MDMA identification. Proceedings of the American Academy of Forensic Sciences 2001;7:29.
351. Rashed AM, Anderson RA, King LA. Ecstasy profiling using Fourier transform infrared spectroscopy. Proceedings of the International Association of Forensic Sciences 15th Triennial Meeting 1999:59.
352. Fox J. The analysis of ecstasy (MDMA analogs and homologs) using an FT/IR spectrophotometer with microscope attachment. Microgram 1998;31(12):344.
353. Mizrachi N, Burla R, Sonenfeld D, Goren Z. The separation and identification of 3,4-methylenedioxyamphetamine derivatives (MDA, MDMA, MDEA and MBDB) in tablets. Microgram 1999;32(1):16.
354. Sherlock K, Wolff K, Hay AWM, Conner M. Analysis of illicit ecstasy tablets: Implications for clinical management in the accident and emergency department. J Accident Emergency Med 1999;16(3):194.
355. Morselli O, Bovolenta A, Ripani L, Garofano L, Schiavone S. Designer drugs in the Italian clandestine market: Situation and new analytical problems. Microgram 1994;27(1):28.
356. Baudot P, Dresch M, Dzierzynski M, Vicherat A. Identification of 3,4-methylenedioxy-amphetamine derivatives by capillary gas chromatography-mass spectrometry with an ion trap detector. Ann Falsif Expert Chim Toxicol 1996;89(937):255.
357. Sadeghipour F, Veuthey JL. Sensitive and selective determination of methylenedioxylated amphetamines by high-performance liquid chromatography with fluorimetric detection. J Chromatogr A 1997;787(1-2):137.
358. Sadeghipour F, Veuthey JL. Enantiomeric separation of four methylenedioxylated amphetamines on beta-cyclodextrin chiral stationary phases. Chromatographia 1998;47(5-6):285.
359. Pisternick W, Guendisch D, Kovar K-A. HPTLC discrimination of 3,4-methylenedioxy-amphetamines of the ecstasy group using 0-benzenesulfonamido-p-benzoquinone as detection reagent. J Planar Chromatogr-Mod TLC 1996;9(4):286.
360. Herraez-Hernandez R, Campins-Falco P, Verdu-Andres J. Sensitive determination of methylenedioxylated amphetamines by liquid chromatography. Analyst 2001;126(5):581.
Microgram Journal, Volume 1, Numbers 1-2 (January - June 2003) 92
Brought to you by AltGov2 [www.altgov2.org]
361. Garofano L, Santaro M, Patri P, Guidugli F, Bollani T, Favretto D, Traldi P. Ion trap mass spectrometry for the characterization of N-methyl-1-(3,4-methylenedioxyphenyl)-2-butanamine and N-ethyl-3,4-methylenedioxyamphetamine, two widely distributed street drugs. Rapid Commun Mass Spectrom 1998;12(12):779.
362. Verweij AMA, Lipman PJL. Comparison of mass spectrometric ionization techniques for the analysis of phenethylamines. J Chromatogr Sci 1996;34(8):379.
363. Aalberg L, DeRuiter J, Noggle FT, Sippola E, Clark CR. Chromatographic and mass spectral methods of identification for the side-chain and ring regioisomers of methylenedioxymethamphetamine. J Chromatogr Sci 2000;38(8):329.
364. Sondermann N, Kovar K-A. Identification of ecstasy in complex matrices using near-infrared spectroscopy. Forensic Sci Int 1999;102(2-3):133.
365. Sondermann N, Kovar K-A. Screening experiments of ecstasy street samples using near infrared spectroscopy. Forensic Sci Int 1999;106(3):147.
366. Burns DT, Lewis RJ, Stevenson P. Determination of 3,4-methylenedioxyamphetamine analogues (“Ecstasy”) by proton nuclear magnetic resonance spectroscopy. Anal Chim Acta 1997;339(3):259.
367. Dal Cason TA, Meyers JA, Lankin DC. Proton and carbon-13 NMR assignments of 3,4-methylenedioxyamphetamine (MDA) and some analogues of MDA. Forensic Sci Int 1997;86(1-2):15 (published erratum appears: Forensic Sci Int 1997;87(2):175).
368. Bell SEJ, Burns DT, Dennis AC, Speers JS. Rapid analysis of ecstasy and related phenethylamines in seized tablets by Raman spectroscopy. Analyst 2000;125(3):541.
369. Bell SEJ, Burns DT, Dennis AC, Matchett LJ, Speers JS. Composition profiling of seized ecstasy tablets by Raman spectroscopy. Analyst 2000;125(10):1811.
370. Sagmuller B, Schwarze B, Brehm G, Schneider S. Application of SERS spectroscopy to the identification of (3,4-methylenedioxy)amphetamine in forensic samples utilizing matrix stabilized silver halides. Analyst 2001;126(11):2066.
371. Dal Cason TA. The characterization of some 3,4-methylenedioxycathinone (MDCATH) homologs. Forensic Sci Int 1997;87(1):9.
372. Dal Cason TA, Young R, Glennon RA. Cathinone: An investigation of several n-alkyl and methylenedioxy- substituted analogs. Pharmacol Biochem Behav 1997;58(4):1109.
373. Dawson BA, Black DB, Cyr TD, Ethier J-C, By AW, Neville GA, Shurvell HF. Structural elucidation of unusual police exhibits. III. Identification of 3,4-methylenedioxyethyl-amphetamine (MDEA) hydrochloride in “Ecstasy” street tablets. Can J Anal Sci Spectrosc 1997;42(3):84.
374. Callahan SA, Latham DJ, Dawson BA, Black DB, Cyr TD, Ethier J-C, By AW, Neville GA. Identification of 3,4-methylenedioxyethylamphetamine hydrochloride in street tablets. Microgram 1996;29(5):119.
375. Veress T, Gal T, Nagy G, Nagy J, Korosi A. Analytical study on illegally produced 3,4-methylenedioxy-N-ethylamphetamine. Microgram 1994;27(2):48.
376. Soltis BH, Panusky DD, Pedrini D. Crystal MDMA. Microgram 2001;34(3):59.
Microgram Journal, Volume 1, Numbers 1-2 (January - June 2003) 93
Brought to you by AltGov2 [www.altgov2.org]
377. Frost M, Kohler H, Blaschke G. Analysis of ecstasy by capillary electrophoresis. Int J Legal Med 1996;109:53.
378. Chappell J, Lee M. Hydration polymorphism of 3,4-methylenedioxymethamphetamine hydrochloride. Microgram 1999;32(5):159.
379. Chappell J. Hydration polymorphism of 3,4-methylenedioxymethamphetamine hydrochloride and other amine drug salts. Proceedings of the American Academy of Forensic Sciences 2000;6:41.
380. Lee GSH, Craig DC, Kannangara GSK, Dawson M, Conn C, Robertson J, Wilson MA. Analysis of 3,4-methylenedioxy-N-methylamphetamine (MDMA) in “ecstasy” tablets by 13C solid state nuclear magnetic resonance (NMR) spectroscopy. J Forensic Sci 1999;44(4):761.
381. Chappell JS. Identification of the phosphate salt of 3,4-methylenedioxymethamphet-amine. Microgram 1999;32(4):143.
382. Chan KB. A normal phase HPLC method for the quantitation of MDMA in illicit ecstasy tablets. Microgram 2001;34(9):237.
383. Morimoto BH, Lovell S, Kahr B. Ecstasy: 3,4-Methylenedioxymethamphetamine (MDMA). Acta Crystallogr C 1998;54:229.
384. Rosner P, Junge T. N-Methyl-1-(3,4-methylenedioxyphenyl)-2-butanamine, a representative of a new class of street drugs. Microgram 1994;27:411.
385. Clark CR, DeRuiter J, Valaer A, Noggle FT. Gas chromatographic-mass spectrometric and liquid chromatographic analysis of designer butanamines related to MDMA. J Chromatogr Sci 1995;33(6):328.
386. Clark CR, DeRuiter J, Noggle Jr FT, Valaer A. Identification of 1-(3,4-methylenedioxy-phenyl)-2-butanamines related to MDMA. Microgram 1995;28:154.
387. Clark CR, DeRuiter J, Noggle FT. Chromatographic and mass spectrometric methods for the differentiation of N-methyl-l-(3,4-methylenedioxyphenyl)-2-butanamine from regioisomeric derivatives. J Chromatogr Sci 1996;34(5):230.
388. Noggle FT, Clark CR, DeRuiter J. Chromatographic and mass spectrometric analysis of N-methyl-1-(3,4-methylenedioxyphenyl)-2-butanamine and regioisomeric derivatives. Microgram 1995;28(10):321.
389. Bovolenta A, Morselli O. Italian clandestine drug market: MDEA, MDMMA, and MBDB in street tablets. Microgram 1997;30(1):14.
390. Sorokin VI, Semkin EP, Savilov AP. Expert examination of 3-methylfentanyl. Microgram 1994;27:221.
391. Micovic IV, Ivanovic MD, Vuckovic SM, Prostan MS, Dosen-Micovic L, Kiricojevic VD. The synthesis and preliminary pharmacological evaluation of 4-methylfentanyl. Bioorg Med Chem Lett 2000;10(17):2011.
392. Angelos SA, Lankin DC, Meyers JA, Raney JK. The structural identification of a methyl analog of methaqualone via 2-dimensional NMR techniques. J Forensic Sci 1993;38(2):455.
Microgram Journal, Volume 1, Numbers 1-2 (January - June 2003) 94
Brought to you by AltGov2 [www.altgov2.org]
393. Denk OA, Watson DG, Skellern GG. Chiral analysis of methylphenidate and dextromoramide by capillary electrophoresis. J Chromatogr B 2001;761(1):61.
394. Groombridge CJ, Hooker RH. The identification of 1-(4-methylphenyl)ethylamine in a drug seizure. Microgram 1996;29(2):38.
395. Serennes G, Chabrillat M, Deyris I, Bettochi A. N-methyl-1-phenylethylamine in tablets. Microgram 1998;31(2):44.
396. Clark CC. The identification of N-methyl-1-phenylethylamine. Microgram 1993;26:90.
397. Poortman AJ, Lock E. Analytical profile of 4-methylthioamphetamine (4-MTA), a new street drug. Forensic Sci Int 1999;100(3):221.
398. Groombridge CR. The identification of 4-methylthioamphetamine in a drug seizure. Microgram 1998;31(5):150.
399. Poortman-van der Meer AJ. The identification of 4-methylthioamphetamine. Microgram 1998;31(6):174.
400. Decaestecker T, DeLetter E, Clauwaert K, Bouche MP, Lambert W, VanBocxlaer J, Piette M, VandenEeckhout E, VanPeteghem C, DeLeenheer A. Fatal 4-MTA intoxication: Development of a liquid chromatographic-tandem mass spectrometric assay for multiple matrices. J Anal Toxicol 2001;25(8):659.
401. Pfendt LB, Janjic TJ, Popovic GV. Study of protolytic, hydrolytic and solubility equilibria of midazolam. Analyst 1995;120(8):2145.
402. Bjornsdottir I, Hansen SH. Comparison of aqueous and nonaqueous capillary electrophoresis for quantitative determination of morphine in pharmaceuticals. J Pharm Biomed Anal 1997;15:1083.
403. Fitsev IM, Garifzyanov AR. Spectrophotometric determination of morphine by flow-injection analysis. Anal Chem 1998;53(2):195.
404. Amiott E, Andrews ARJ. Morphine determination by HPLC with improved chemiluminescence detection using a conventional silica based column. J Liq Chromatogr Relat Technol 1997;20(2):311.
405. Hassan SS, El-Naby EH, Elnemma EM. Kinetic determination of morphine in illicit powders using a fluoride-selective electrode based on the reaction with 1-fluoro-2,4-dinitrobenzene. Mikrochim Acta 1996;124(1-2):55.
406. Kalasz H, Hosztafi S, Csermely T, Gotz H, Szabo MG. Displacement thin layer chromatography of morphine and its semi-synthetic derivatives. J Liq Chromatogr & Rel Tech 1996;19(1):23.
407. Shepherd III EJ. Analysis of nandralone-p-hexyloxyphenylpropionate. Microgram 1995;28:111.
408. Chamakura RP. Nootropics/smart drugs. Proceedings of the American Academy of Forensic Sciences 1997;3:22.
409. Lim JT, Zare RN, Bailey CG, Rakestraw DJ, Yan C. Separation of related opiate compounds using capillary electrochromatography. Electrophoresis 2000;21(4):737.
Microgram Journal, Volume 1, Numbers 1-2 (January - June 2003) 95
Brought to you by AltGov2 [www.altgov2.org]
410. Matz LM, Hill HH. Evaluation of opiate separation by high-resolution electrospray ionization – ion mobility spectrometry/mass spectrometry. Anal Chem 2001;73(8):1664.
411. Hadzija BW, Shrewsbury RP, Cody JT. Determination of hydrocodone in Tussionex extended-release suspension by high-performance liquid chromatography (HPLC). J Forensic Sci 1996;41(5):878.
412. Salomies HEM, Salo PK. Determination of oxycodone hydrochloride in oral solutions by high-performance thin-layer chromatography/densitometry. JAOAC Int 2000;83(6):1497.
413. Remberg B, Nikiforov A, Buchbauer G. Fifty years of development of opium characterization methods. Bull Narc 1994;46(2):79.
414. Bjornsdottir I, Hansen SH. Determination of opium alkaloids in opium by capillary electrophoresis. J Pharm Biomed Anal 1995;13:687.
415. Bjornsdottir I, Hansen SH. Determination of opium alkaloids in crude opium using non-aqueous capillary electrophoresis. J Pharm Biomed Anal 1995;13(12):1473.
416. Lazar IM, Naisbitt G, Lee ML. Capillary electrophoresis time-of-flight mass spectrometry of an opium powder. Chromatographia 1999;50(3-4):188.
417. Mandal S, Naqvi AA, Thakur RS. A gas chromatographic method for the quantitative determination of opium alkaloids from plant. Indian J Pharm Sci 1993;55(1):25.
418. Paul BD, Dreka C, Knight ES, Smith ML. Gas chromatographic/mass spectrometric detection of narcotine papaverine and thebaine in seeds of Papaver Somniferum. Planta Medica 1996;62:544.
419. Budvari Barany Z, Szasz G, Gyimesi Forras K. Optimized and validated HPLC methods for compendial quality assessment. 2 Opium alkaloids. J Liq Chromatogr & Rel Tech 1997;20(19):3257.
420. Krenn L, Glantschnig S, Sorgner U. Determination of the five major opium alkaloids by reversed-phase high-performance liquid chromatography on a base-deactivated stationary phase. Chromatographia 1998;47(1-2):21.
421. Zhanpin W. A simple and rapid method for the extraction of five major alkaloids from opium. Forensic Sci Int 1994;64(2,3):103.
422. Trenerry VC, Wells RJ, Robertson J. Determination of morphine and related alkaloids in crude morphine poppy straw and opium preparations by micellar electrokinetic capillary chromatography. J Chromatogr A 1995;718(1):217.
423. Mitsui T, Hida M, Fujimura Y. Determination of the total amount of morphine alkaloids in opium by pyrolysis-gas chromatography using principal component analysis. J Anal Appl Pyrolysis 1995;32:205.
424. Baudot P, Bourbonneux C, Viriot ML, Carre MC, Andre JC. Synchronous excitation spectrofluorimetry of morphine derivatives and opium II: Papaverine, noscapine, and codeine. Ann Falsif Expert Chim Toxicol 1995;88(930):19.
425. Popa DS, Oprean R, Curea E, Preda N. TLC-UV densitometric and GC-MSD methods for simultaneous quantification of morphine and codeine in poppy capsules. J Pharm Biomed Anal 1998;18(4-5):645.
Microgram Journal, Volume 1, Numbers 1-2 (January - June 2003) 96
Brought to you by AltGov2 [www.altgov2.org]
426. Saha U, Sanyal M, Roy L, Sarkar B, Majumdar K. A simple method for extraction and spectrophotometric quantitation of morphine in raw opium. Microgram 1998;31(11):310.
427. Buchbauer G, Remberg B, Nikiforov A. Headspace constituents of opium. Planta Medica 1994;60(2):181.
428. Barnett NW, Hindson BJ, Lewis SW. Determination of morphine, oripavine and pseudomorphine using capillary electrophoresis with acidic potassium permanganate chemiluminescence detection. Analyst 1999;125(1):91.
429. Proksa B. Separation of morphine and its oxidation products by capillary zone electrophoresis. J Pharm Biomed Anal 1999;20(1-2):179.
430. Barnett NW, Hindson BJ, Lewis SW, Jones P, Worsfold PJ. Soluble manganese(IV); A new chemiluminescence reagent. Analyst 2001;126(10):1636. [Note: Includes morphine and codeine.]
431. Cremese M, Wu AHB, Cassella G, O’Connor E, Rymut K, Hill DW. Improved GC/MS analysis of opiates with use of oxime-TMS derivatives. J Forensic Sci 1998;43(6):1220.
432. Kushnir MM, Crockett DK, Nelson G, Urry FM. Comparison of four derivatizing reagents for 6acetylmorphine GC-MS analysis. J Anal Toxicol 1999;23(4):262.
433. Krenn L, Boros B, Ohmacht R, Jelinek L. HPLC separation of opium alkaloids on porous and non-porous stationary phases. Chromatographia 2000;51(Part 2, Suppl S):S175.
434. Nassr S, Brunet M, Lavoie P, Brazier JL. HPLC-DAD method for studying the stability of solutions containing morphine, dexamethasone, haloperidol, midazolam, famotidine, metoclopramide, and dimenhydrinate. J Liq Chromatogr Related Technol 2001;24(2):265.
435. Degim T, Akay C, Buyukafsar K, Cevheroglu S. Simultaneous determination of codeine and ethyl morphine HCl in tablet formulations using LC. J Pharm Biomed Anal 2001;26(1):15.
436. Altun ML, Ceyhan T, Kartal M, Atay T, Ozdemir N, Cevheroglu S. LC method for the analysis of acetylsalicylic acid, caffeine, and codeine phosphate in pharmaceutical preparations. J Pharm Biomed Anal 2001;25(1):93.
437. Ramos-Martos N, Aguirre-Gomez F, Molina-Diaz A, Capitan-Vallvey LF. Application of liquid chromatography to the simultaneous determination of acetylsalicylic acid, caffeine, codeine, paracetamol, pyridoxine, and thiamine in pharmaceutical preparations. JAOAC Int 2001;84(3):676.
438. Kartal M. LC method for the analysis of paracetamol, caffeine and codeine phosphate in pharmaceutical preparations. J Pharm Biomed Anal 2001;26(5-6):857.
439. Boberic-Borojevic D, Radulovic D, Ivanovic D, Ristic P. Simultaneous assay of ephedrine hydrochloride, theophylline, papaverine hydrochloride and hydroxyzine hydrochloride in tablets using RP-LC. J Pharm Biomed Anal 1999;21(1):15.
440. Martos NR, Diaz AM, Navalon A, Capitan-Vallvey LF. Spectrofluororimetric determination of acetylsalicylic acid and codeine mixtures in pharmaceuticals. Anal Lett 2001;34(4):579.
441. Saad B, Sultan SM, Suliman FEO. Ion-association method for the spectrophotometric determination of the antitussive drug noscapine. Talanta 1997;44:53.
Microgram Journal, Volume 1, Numbers 1-2 (January - June 2003) 97
Brought to you by AltGov2 [www.altgov2.org]
442. United Nations International Drug Control Programme (Scientific Section). Monograph: Recommended methods for testing opium, morphine, and heroin. New York, NY:1998.
443. Carmona M, Silva M, Perez-Bendito D. Automatic kinetic determination of oxazepam by the continuous addition of reagent technique. Talanta 1992;39(9):1175.
444. Liu RH, Foster G, Cone EJ, Kumar SD. Selecting an appropriate isotopic internal standard for gas chromatography/mass spectrometry analysis of drugs of abuse - Pentobarbital example. J Forensic Sci 1995;40(6):983.
445. Morley JA, Elrod L. Determination of pentobarbital and pentobarbital sodium in bulk drug substance and dosage forms by high performance liquid chromatography. J Pharm Biomed Anal 1997;16(1):119.
446. Clandestine Laboratory Investigating Chemists Association. Monograph: PCP. Fresno, CA:1995.
447. Brown PA, Skinner HF. Application of ion mobility spectrometry for the detection of phencyclidine and intermediate, 1-piperidinocyclohexane-carbonitrile. Proceedings of the American Academy of Forensic Sciences 1997;3:12.
448. Summerhays LR, Best WM. An effective liquid-liquid extraction procedure for isolating PCP from case samples. Proceedings of the American Academy of Forensic Sciences 1995;1:20.
449. King LA, Poortman-van der Meer AJ, Huizer H. l-Phenylethylamines: A new series of illicit drugs? Forensic Sci Int 1996;77(3):141.
450. Meyer E, Van Bocxlaer J, Lambert W, Thienpont L, De Leenheer A. alpha-Phenethylamine identified in judicial samples. Forensic Sci Int 1995;76(2):159.
451. Massetti J. $-Phenethylamine: 4th quarter - 1998. J Clan Lab Invest Chem Assoc 1999;9(1):11.
452. Massetti J. beta-Phenethylamine in suspected methamphetamine samples. Proceedings of the International Association of Forensic Sciences 15th Triennial Meeting 1999:57.
453. Massetti J. $-Phenethylamine. J Clan Lab Invest Chem Assoc 1998;8(3):10.
454. Haque A, Xu XH, Stewart JT. Determination of ephedrine, theophylline and phenobarbital in a tablet dosage form by capillary electrophoresis. J Pharm Biomed Anal 1999;21(5):1063.
455. Ting S. Liquid chromatographic determination of scopalamine, hyoscyamine and phenobarbital in tablets. JAOAC Int 1997;80(2):331.
456. Goicoechea HC, Olivieri AC. Simultaneous determination of phenobarbital and phenytoin in tablet preparations by multivariate spectrophotometric calibration. Talanta 1998;47(1):103.
457. Prasad CVN, Gautam A, Bharadwaj V, Parimoo P. Differential derivative spectrophotometric determination of phenobarbitone and phenytoin sodium in combined tablet preparations. Talanta 1997;44:917.
458. Hays PA, McKibben T, Koles JE, Bethea MJ. Phenylpropylmethylamine. Microgram 1998;31(10):269.
459. de Boer D, Bosman IJ, Hidvegi E, Manzoni C, Benko AA, dos Reys LJAL, Maes RAA. Piperazine-like compounds: A new group of designer drugs-of-abuse on the European market.
Microgram Journal, Volume 1, Numbers 1-2 (January - June 2003) 98
Brought to you by AltGov2 [www.altgov2.org]
Forensic Sci Int 2001;121(1-2):47.
460. Lee JCI, Cole M, Linacre A. Identification of members of the genera Panaeolus and Psilocybe by a DNA test; A preliminary test for hallucinogenic fungi. Forensic Sci Int 2000;112:123.
461. Lee JCI, Cole M, Linacre A. Identification of hallucinogenic fungi from the genera Psilocybe and Panaelus by amplified fragment polymorphism. Electrophoresis 2000;21(8):1484.
462. Keller T, Schneider A, Regenscheit P, Dirnhofer R, Rüker T, Jaspers J, Kisser W. Analysis of psilocybin and psilocin in Psilocybe Subcubensis GUZMÁN by ion mobility spectrometry and gas chromatography-mass spectrometry. Forensic Sci Int 1999;99(2):93.
463. Mahler, H, Daldrup T. Quick detection of psilocin in mushroom culture substrates. GTFCh-Symposium: Toxikologische Aspekte der Sterbehilfe - Neue Drogen: Chemische, Analytische und Toxikologische Aspekte, Beitraege zum Symposium der Gesellschaft fuer Toxikologische und Forensische Chemie, 12th, Mosbach, Germany, Apr. 26 - 28, 2001 2001;(Pub 2001):242.
464. Musshoff F, Madea B, Beike J. Hallucinogenic mushrooms on the German market - simple instructions for examination and identification. Forensic Sci Int 2000;113(1-3):389.
465. Gross ST, Almirall JR. The analysis of the Psilocybe Cyanescens (Wakefield) mushroom. Proceedings of the American Academy of Forensic Sciences. 1999;5:42.
466. Gross ST. Detecting psychoactive drugs in the developmental stages of mushrooms. J Forensic Sci 2000;45(3):527.
467. Giroud C, Felber G, Augsburger M, Horisberger B, Rivier L, Mangin P. Salvia Divinorum: A hallucinogenic mint which might become a new recreational drug in Switzerland. Forensic Sci Int 2000;112(2-3):143.
468. Chang W-T, Lin D-L, Low I-A, Liu RH. 13C4-Secobarbital as the internal standard for the quantitative determination of secobarbital - A critical evaluation. J Forensic Sci 2000;45(3):659.
469. Blackledge RD, Sorenson PD. The identification of sibutramine. Microgram 2000;33(1):18.
470. Bono JP, Tolliver JM. Chemical and pharmacological aspects of anabolic steroids. Proceedings of the American Academy of Forensic Sciences 1995;1:21.
471. Koverman G. Analysis of anabolic steroids. Microgram 1993;26:248.
472. Chiong DM, Consuegra-Rodriguez E, Almirall JR. The analysis and identification of steroids. J Forensic Sci 1992;37(2):488.
473. Cairns T, Siegmund EG, Rader B. Analysis of testosterone esters by tandem mass spectrometry. JAOAC Int 1993;76(2):306.
474. Maroge W. Use of acetone in GC quantitation of some anabolic steroids in vegetable oils. Microgram 1994;27:356.
475. Musshoff F, Daldrup T, Ritsch M. Black market in anabolic steroids - analysis of illegally distributed products. J Forensic Sci 1997;42(6):1119.
476. Ashraf-Khorassani M, Taylor LT. Feasibility of on-line supercritical fluid extraction of steroids from aqueous-based matrices with analysis via gas chromatography-mass spectrometry. J Chromatogr Sci 2000;38(11):477.
Microgram Journal, Volume 1, Numbers 1-2 (January - June 2003) 99
Brought to you by AltGov2 [www.altgov2.org]
477. Maume D, LeBizec B, Marchand P, Montrade MP, Andre F. N-methyl-N-alkylsilyl-trifluoroacetamide-I-2 as new derivatization reagent for anabolic steroid control. Analyst 1998;123(12):2645.
478. Clark CC. The GLC quantitation of some anabolic steroids in vegetable oil preparations. Microgram 1992;25:255.
479. Caerhati T, Forgacs E. Effect of beta-cyclodextrin derivatives on the retention of steroidal drugs. J Chromatogr B 1996;681(1):205.
480. Mesmer MZ, Satzger RD. Determination of anabolic steroids by HPLC with UV/Vis-particle beam mass spectrometry. J Chromatogr Sci 1997;35(1):38.
481. Dwyer J, Chapman AE, Liu X. Analysis of steroids by combined chromatography-infrared spectroscopy. LC-GC 1995;13:240.
482. Nascimento ES, Salvadori MC, Ribeiro-Neto LM. Determination of synthetic estrogens in illegal veterinary formulations by HPTLC and HPLC. J Chromatogr Sci 1996;34(7):330.
483. Steffenrud S. Mass spectrometry of anabolic steroids as their tert-butyldimethylsilyl ether derivatives. Rapid Commun Mass Spectrom 1996;10:1698.
484. Cairns T, Siegmund EG, Rader B. Analysis of testosterone esters by tandem mass spectrometry. JAOAC Int 1993;76:306.
485. Bowers LD, Borts DJ. Separation and confirmation of anabolic steroids with quadrupole ion trap tandem mass spectrometry. J Chromatogr B 1996;687(1):69.
486. Guiney LB. Quantitation of testosterone propionate and boldenone by 13C - NMR. Microgram 1995;28(9):285.
487. Lin WC, Sue CC, Kuei CH. Separation of anabolic steroids by micellar electrokinetic capillary chromatography. Chromatographia 1999;49(7/8):454.
488. Lurie IS, Sperling AR, Meyers RP. The determination of anabolic steroids by MECC, gradient HPLC, and capillary GC. J Forensic Sci 1994;39(1):74.
489. Baiocchi C, Giacosa D, Roggero MA, Marengo E. Analysis of steroids by capillary supercritical fluid chromatography with flame-ionization and electron-capture detectors. J Chromatogr Sci 1996;34(9):399.
490. Morley M, Matkovich C. Screening of steroids by thin layer chromatography. Microgram 1993;26:214.
491. Gagliano A, Smith PR, Hays PA, Cooper DA, Moore JM. The analysis of telazol: A tiletamine/zolazepam mixture. Microgram 1999;32(1):26.
492. Gagliano A, Smith PR, Hays PA, Cooper DA, Moore JM. The analysis of telazol: A tiletamine/zolazepam mixture. Proceedings of the American Academy of Forensic Sciences 1999;5:41.
493. Hays PA. Terbinafine hydrochloride. Microgram 1999;32(1):11.
494. Cardoso SG, Schapoval EES. UV spectrophotometry and nonacqueous determination of terbinafine hydrochloride in dosage forms. JAOAC Int 1999;82(4):830.
Microgram Journal, Volume 1, Numbers 1-2 (January - June 2003) 100
Brought to you by AltGov2 [www.altgov2.org]
495. Hida M, Mitsui T, Ohtani H, Tsuge S. Determination of triazolam in a drug tablet by thermal desorption gas chromatography. J Chromatogr A 1997;761(1-2):332.
496. Greenway GM, Dolman SJL. Analysis of tricyclic antidepressants using electrogenerated chemiluminescence. Analyst 1999;124(5):771.
497. Cepas J, Silva M, Perez-Bendito D. Sensitive peroxyoxalate chemiluminescence determination of psychotropic indole derivatives. Analyst 1996;121(1):49.
498. United Nations International Drug Control Programme (Scientific Section). Monograph: Basic Information on Essential Chemicals/Precursors of the 1988 Convention for Use by Law Enforcement Oficers - 1995. New York, NY:1995.
499. United Nations International Drug Control Programme (Scientific Section). Monograph: Data Sheets on Substances Frequently Used in the Illicit Manufacture of Psychotropic Substances 1993. New York, NY:1993.
500. Walker JA, Geer L, Matkovich C. Screening for the presence of adulterants in illicit drug samples: Comparing and contrasting GC, HPLC and CE. Proceedings of the American Academy of Forensic Sciences 1998;4:33.
501. McCrossen SD, Bryant DK, Cook BR, Richards JJ. Comparison of LC detection methods in the investigation of non-UV detectable organic impurities in a drug substance. J Pharm Biomed Anal 1998;17:455.
502. Mauterer C, Sparks MF, Liu, RH. Frequency and trend of secondary drugs present in cocaine, heroin, marijuana, and phencyclidine samples. Proceedings of the American Academy of Forensic Sciences 1998;4:38.
503. Pestaner JP, Mullick FG, Centeno JA. Characterization of acetaminophen: Molecular microanalysis with Raman microprobe spectroscopy. J Forensic Sci 1996;41(6):1060.
504. Hays PA, Cooper DA. Determination of the weight percent of acetic acid in acetic anhydride by 1H-nuclear magnetic resonance (NMR) spectroscopy. Microgram 2000;33(8):160.
505. Xu XH, Stewart JT. MEKC determination of guaifensin, pseudoephedrine, and dextromethorphan in a capsule dosage form. J Liq Chromatogr and Rel Tech 2000;23(1):1.
506. Knox ME, Fukayama B, Haas JS, Alcaraz A, Andresen BD. Identification of diethylaminoethylaniline in a clandestine laboratory reaction mixture. Microgram 1993;26:28.
507. By A, Neville GA, Shurvell HF. Fourier transform infrared/Raman differentiation and characterization of cis- and trans-2,5-dimethoxy-4,beta-dimethyl-beta-nitrostyrenes: Precursors to the street drug STP. J Forensic Sci 1992;37(2):503.
508. Goldberg G. Dimethylsulfone: The most common diluent in today’s methamphetamine. Proceedings of the International Association of Forensic Sciences 15th Triennial Meeting 1999:66.
509. Morales R. The use of heat to eliminate dimethyl sulfone from amphetamine and methamphetamine hydrochloride samples. Microgram 1999;32(1):10.
510. Sorgen GJ. Sublimation of dimethyl sulfone. Microgram 1998;31(11):308.
Microgram Journal, Volume 1, Numbers 1-2 (January - June 2003) 101
Brought to you by AltGov2 [www.altgov2.org]
511. Ely RA, Ed. Dimethyl sulfone identified in amphetamine and methamphetamine samples. J Clan Lab Invest Chem Assoc 1996;6(1):12.
512. Cooper SD, Toske SG. Identification and differentiation of dimethyl terephthalate and its geometrical isomer dimethyl phthalate. Microgram 1996;29(12):307.
513. Blackwell TM. The differentiation of dimethylterephthalate from dimethylisophthalate via GC/FTIR. Microgram 1998;31(2):62.
514. Matkovich CE. Identification of dimethyl terephthalate in cocaine samples. Microgram 1996;29(12):316.
515. Munoz RAA, Matos RC, Angnes L. Amperometric determination of dipyrone in pharmaceutical formulations with a flow cell containing gold electrodes from recordable compact disks. Journal of Pharmaceutical Science 2001;90(12):1972.
516. Betz JM, Gay ML, Mossoba MM, Adams S, Portz BS. Chiral gas chromatographic determination of ephedrine-type alkaloids in dietary supplements containing Ma Huang. JAOAC Int 1997;80(2):303.
517. Hellriegel C, Handel H, Wedig M, Steinhauer S, Sorgel F, Albert K, Holzgrabe U. Study on the chiral recognition of the enantiomers of ephedrine derivatives with neutral and sulfated heptakis(2,3-O-diacetyl)-beta-cyclodextrins using capillary electrophoresis, UV, nuclear magnetic resonance spectroscopy and mass spectrometry. J Chromatogr A 2001;914(1-2):315.
518. Schwarz MA, Hauser PC. Rapid chiral on-chip separation with simplified amperometric detection. J Chromatogr A 2001;928(2):225.
519. Li G, Zhang Z, Chen X, Hu Z, Zhao Z, Hooper M. Analysis of ephedrine in ephedra callus by acetonitrile modified capillary zone electrophoresis. Talanta 1999;48(5):1023.
520. Onur F, Yucesoy C, Dermi S, Kartal M, Kokdil G. Simultaneous determination of pseudoephedrine sulfate, dexbrompheniramine maleate and loratadine in pharmaceutical preparations using derivative spectrophotometry and ratio spectra derivative spectrophotometry. Talanta 2000;51(2):269.
521. Erk N. Assay of ephedrine hydrochloride and theophylline in pharmaceutical formulations by differential-derivative spectroscopy. J Pharm Biomed Anal 2000;23(2-3):255.
522. Chamorro PR, Diaz RC. Determination of ephedrine in pharmaceutical preparations with a double-membrane selective electrode based on ephedrine-5-nitrobarbiturate. Analyst 1992;117(12):1905.
523. Chamorro PR, Diaz RC. A double-membrane ephedrine selective electrode based on ephedrinetetraphenylborate in poly(vinyl chloride) resin. Talanta 1993;40(9):1461.
524. Cookeas EG, Efstathiou CE. Flow injection - pulse amperometric detection of ephedrine at a cobalt phthalocyanine modified carbon paste electrode. Analyst 2000;125(6):1147.
525. Raj SV, Kapadia SU, Argekar AP. Simultaneous determination of pseudoephedrine hydrochloride and diphenhydramine hydrochloride in cough syrup by gas chromatography (GC). Talanta 1998;46(1):221.
526. Li HX, Ding MY, Lv K, Yu JY. Separation and determination of ephedrine alkaloids and tetramethylpyrazine in ephedra sinica Stapf by gas chromatography-mass spectrometry. J
Microgram Journal, Volume 1, Numbers 1-2 (January - June 2003) 102
Brought to you by AltGov2 [www.altgov2.org]
Chromatogr Sci 2001;39(9):370.
527. Okamura N, Miki H, Harada T, Yamashita S, Masaoka Y, Nakamoto Y, Tsuguma M, Yoshitomi H, Yagi A. Simultaneous determination of ephedrine, pseudoephedrine, norephedrine and methylephedrine in Kampo medicines by high-performance liquid chromatography. J Pharm Biomed Anal 1999;20(1-2):363.
528. Zhang XH, Ouyang J, Yang YP. A simple method for chiral separation of ephedrines using (R)-1-naphthylglycine and 3,5-dinitrobenzoic acid as stationary phase. Anal Lett 2001;34(11):1851.
529. Iwanicki RM, Maier K, Zlotnick JA, Liu RH, Kuo T-L, Tagliaro F. Separation of enantiomeric ephedrine and pseudoephedrine - high pressure liquid chromatography and capillary electrophoresis. J Forensic Sci 1999;44(3):470.
530. Makhija SN, Vavia PR. Stability indicating HPTLC method for the simultaneous determination of pseudoephedrine and cetirizine in pharmaceutical formulations. J Pharm Biomed Anal 2001;25(3-4):663.
531. Herraez-Hernandez R, Campins-Falco P. Derivatization of tertiary amphetamines with 9fluorenylmethyl chloroformate for liquid chromatography: Determination of N-methylephedrine. Analyst 2000;125(6):1071.
532. Mansour AM. Determination of pseudoephedrine hydrochloride and carbinoxamine maleate in combination drug formulation by liquid chromatography. JAOAC Int 1998;81(5):958.
533. Hanna GM. Determination of ephedrine, pseudoephedrine, and norephedrine in mixtures (bulk and dosage forms) by proton nuclear magnetic resonance spectroscopy. JAOAC Int 1995;78(4):946.
534. Verdu-Andres J, Herraez-Hernandez R, Campins-Falco P. Analysis of enantiomers giving partially overlapped peaks by using different treatments of the chromatographic ultraviolet signals: Quantification of pseudoephedrine enantiomers. J Chromatogr A 2001;930(1-2):95.
535. Hurlbut JA, Carr JR, Singleton ER, Faul KC, Madson MR, Storey JM, Thomas TL. Solid-phase extraction cleanup and liquid chromatography with ultraviolet detection of ephedrine alkaloids in herbal products. JAOAC Int 1998;81(6):1121.
536. Moses AJ. Determination of pseudoephedrine from a mixture of pseudoephedrine and chlorpheniramine. J Clan Lab Invest Chem Assoc 1998;8(4):11.
537. Bhushan R, Martens J, Arora M. Direct resolution of (+/-)-ephedrine and atropine into their enantiomers by impregnated TLC. Biomed Chromatogr 2001;15(3):151.
538. Neville GA, By A, Shurvell HF. FTIR and Raman differentiation and characterization of cis-(Z)-and trans-(E)-monoethoxy-1-(2-nitro-1-propenzyl) benzenes - Precursors to the monoethoxyamphetamine “designer” street drugs. J Can Soc Forensic Sci 1992;25(1):31.
539. Wilcox ML, Stewart JT. HPLC determination of guaifenesin with selected medications on underivatized silica with an aqueous-organic phase. J Pharm Biomed Anal 2000;23(5):909.
540. Carr S, Cooper D. 3-Hydroxy-N-phenyl-2-naphthalene carboxamide. Microgram 1992;25:182.
541. Groombridge CJ. Diet “Coke”? Identification of lactitol as an unusual cocaine cutting substance. Microgram 2001;34(7):174.
Microgram Journal, Volume 1, Numbers 1-2 (January - June 2003) 103
Brought to you by AltGov2 [www.altgov2.org]
542. MacLaren F, Cooper D. 4-(N-Methylacetamido)-antipyrine. Microgram 1992;25:164.
543. Bouhsain Z, Garrigues S, de la Guardia M. Flow injection - Fourier transform infrared spectrometric determination of paracetamol in pharmaceuticals. Analyst 1996;121(5):635.
544. Perez JL, Bello MA. Determination of paracetamol in dosage forms by non-suppressed ion chromatography. Talanta 1999;48(5):1199.
545. Trafford AD, Jee RD, Moffat AC, Graham P. A rapid quantitative assay of intact paracetamol tablets by reflectance near-infrared spectroscopy. Analyst 1999;124(2):163.
546. Eustaquio A, Graham P, Jee RD, Moffat AC, Trafford AD. Quantification of paracetamol in intact tablets using near-infrared transmittance spectroscopy. Analyst 1998;123(11):2303.
547. Bouhsain Z, Garrigues S, de la Guardia M. Simultaneous stopped-flow determination of paracetamol, acetylsalicylic acid and caffeine in pharmaceutical formulations by Fourier transform infrared spectrometry with partial least squares data treatment. Analyst 1996;121(12):1935.
548. Wu H-L, Huang C-H, Chen S-H, Wu S-M. Chiral quantitation of pheniramine, chlorpheniramine, and brompheniramine maleates by capillary zone electrophoresis. J Chromatogr Sci 1999;37(1):24.
549. Chen W, Liu F, Zhang X, Li KA, Tong S. The specificity of a chlorphenamine-imprinted polymer and its application. Talanta 2001;55(1):29.
550. Rind FMA, Khuhawar MY, Rajper AD. HPLC determination of phenylpropanolamine in pharmaceutical preparations using 4-dimethylaminobenzaldehyde as a derivatizing reagent. J Pharm Biomed Anal 2001;26(2):331.
551. Liu LD, Liu Y, Wang HY, Sun Y, Ma L, Tang B. Use of p-dimethylaminobenzaldehyde as a colored reagent for determination of procaine hydrochloride by spectrophotometry. Talanta 2000;52(6):991.
552. Li B, Zhang Z, Wu M. Flow-injection chemiluminescence determination of quinine using on-line electrogenerated cobalt(III) as oxidant. Talanta 2000;51(3):515.
553. Sanchez FG, Diaz AN, Pareja AG, Montiel GC. Determination of (-)-quinine and (+)-quinidine by liquid chromatography with diode-laser polarimetric detection. JAOAC Int 1999;82(6):1308.
554. Heikes DL. SFE with GC and MS determination of safrole and related allylbenzenes in sassafras teas. J Chromatogr Sci 1994;32(7):253.
555. Fuelster RG. Quantitation of sugars in street drug samples. J Forensic Sci 1992;37(1):77.
556. Shubietah RM, Zuhri AZA, Fogg AG. Adsorptive cathodic stripping voltammetric determination of theophylline at a hanging mercury drop electrode. Analyst 1994;119(9):1967.
557. Rico CM, Fernandez MdP, Gutierrez AM, Conde MCP, Camara C. Development of a flow fluoroimmunosensor for determination of theophylline. Analyst 1995;120(10):2589.
558. Perez Martinez I, Sagrado S, Medina Hernandez MJ. Determination of theophylline in pharmaceuticals by micellar liquid chromatography and spectrophotometric detection. J Liq Chromatogr & Rel Tech 1996;19(12):1957.
Microgram Journal, Volume 1, Numbers 1-2 (January - June 2003) 104
Brought to you by AltGov2 [www.altgov2.org]
559. Abdel-Hay MH, El-Din MS, Abuirjeie MA. Simultaneous determination of theophylline and guaiphenesin by third-derivative ultraviolet spectrophotometry and high-performance liquid chromatography. Analyst 1992;117(2):157.
560. Ciszewski A, Wang J. Determination of thiamine by cathodic stripping voltametry. Analyst 1992;117(6):985.
561. Hart JP, Norman MD, Tsang S. Voltametric behaviour of Vitamin B1 (Thiamine) at a glassy carbon electrode and its determination in multivitamin tablets using anion-exchange liquid chromatography with amperometric detection under basic conditions. Analyst 1995;120(4):1059.
562. Costa-Neto CO, Pereira AV, Aniceto C, Fatibello-Filho O. Flow injection turbidimetric determination of thiamine in pharmaceutical formulations using silicotungstic acid as precipitant reagent. Talanta 1999;48(3):659.
563. Chen Q-Y, Li DH, Yang HH, Zhu QZ, Zheng H, Xu JG. Novel spectrofluorometric method for the determination of thiamine with iron(III) tetrasulfonatophthalocyanine as a catalyst. Analyst 1999;124(5):771.
564. Metwally FH. Kinetic spectrophotometric methods for the quantitation of triprolidine in bulk and in drug formulations. J Pharm Biomed Anal 2001;26(2):265.
565. Dejarme LE, Lawhon SJ, Ray P, Kuhlman MR. Analysis of the volatile organic compounds in seized cocaine. Proc SPIE-Int Soc Opt Eng 1997;2937 (Chemistry- and Biology-Based. Technologies for Contraband Detection):2.
566. Cartier J, Gueniat O, Cole MD. Headspace analysis of solvents in cocaine and heroin samples. Science Justice 1997;37(3):175.
567. Morello DR, Meyers RP. Qualitative and quantitative determination of residual solvents in illicit cocaine HCl and heroin HCl. J Forensic Sci 1995;40(6):9.
568. Vu D-TT. SPME/GC-MS characterization of volatiles associated with methamphetamine: Toward the development of a pseudomethamphetamine training material. J Forensic Sci 2001;46(5):1014.
569. Mulligan KJ, Brueggemeyer TW, Crockett DF, Schepman JB. Review: Analysis of organic volatile impurities as a forensic tool for the examination of bulk pharmaceuticals. J Chromatogr B 1996;686:85.
570. Li QC, Cohen KA, Zhuang G. A capillary gas chromatographic procedure for the analysis of nine common residual solvents in water-insoluble bulk pharmaceuticals. J Chromatogr Sci 1998;36(3):119.
571. Kersten BS. Drug matrix effect on the determination of residual solvents in bulk pharmaceuticals by wide-bore capillary gas chromatography. J Chromatogr Sci 1992;30(4):115.
572. Schuberth J. Volatile organic compounds determined in pharmaceutical products by full evaporation technique and capillary gas chromatography ion-trap detection. Anal Chem 1996;68(8):1317.
573. Mulligan K, McCauley H. Factors that influence the determination of residual solvents in pharmaceuticals by automated static headspace sampling coupled to capillary GC-MS. J Chromatogr Sci 1995;33(1):49.
Microgram Journal, Volume 1, Numbers 1-2 (January - June 2003) 105
Brought to you by AltGov2 [www.altgov2.org]
574. Morales R. The use of specific infrared absorption bands to distinguish cocaine base and cocaine HCl when mixed with known adulterants or diluents. Microgram 2000;33(9):247.
575. Lópéz-Artíguez M, Cameán A, Repetto M. Unequivocal identification of several common adulterants and diluents in street samples of cocaine by infrared spectroscopy. J Forensic Sci 1995;40(4):602.
576. Ryder AG, O’Connor GM, Glynn TJ. Quantitative analysis of cocaine in solid mixtures using Raman spectroscopy and chemometric methods. J Raman Spectrosc 2000;31(3):221.
577. Carter JC, Brewer WE, Angel SM. Raman spectroscopy for the in situ identification of cocaine and selected adulterants. Appl Spectrosc 2000;54:1876.
578. Atay O, Oztop F. Quantitative determination for cocaine HCl in synthetic binary mixtures by using spectrophotometric methods. Anal Letters 1998;31(15):2663.
579. Cruz A, Lopez-Rivadulla M, Bermejo AM, Sanchez I, Fernandez P. Sequential second-derivative spectroscopy of cocaine and adulterants in street drug samples. Part I: Cocaine, procaine, and lidocaine. Anal Lett 1994;27(14):2663.
580. Ryder AG, O’Connor GM, Glynn TJ. Identifications and quantitative measurements of narcotics in solid mixtures using near-IR raman spectroscopy and multivariate analysis. J Forensic Sci 1999;44(5):1013.
581. Bautista RD, Jimenez AI, Jimenez F, Arias JJ. Resolution of ternary and quaternary mixtures of drugs in pharmaceutical preparations by use of spectrophotometric data in conjunction with PLS-1 and PLS-2 data processing methods. Anal Lett 1996;29(15):2645.
582. Wielbo D, Tebbett IR. The use of micro-Fourier ransform infrared spectroscopy for the rapid identification of street drugs: Determination of interference by common diluents. J Forensic Sci Soc 1993;33:25.
583. Lemos NP, Bortolotti F, Manetto G, Anderson RA, Cittadini F, Tagliaro F. Capillary electrophoresis: A new tool in forensic medicine and science. Science Justice 2001;41(3):203.
584. Lurie IS. Application of capillary electrophoresis to the analysis of seized drugs. Am Lab 1996;28(2):26.
585. Lurie IS. Capillary electrophoresis for drug analysis. Proc SPIE - Int Soc Opt Eng 1999;3576:125.
586. Garcia AD, Almirall JR, Lurie IS. A comprehensive review of the analysis of controlled substances by capillary electrophoresis, using free zone, MECC, and cyclodextrin systems. Proceedings of the American Academy of Forensic Sciences 2000;6:23.
587. McCord BR, Lurie IS, Buel E, Hudson JC, Northrop DM, Robertson JM, Seto Y, Sinha SK, Schoeniger JS, Tagliaro F, Trenarry VC, Xu X. Forensic applications of capillary electrophoresis. Proceedings of the American Academy of Forensic Sciences 2000;6:9.
588. Thormann W, Wey AB, Lurie IS, Gerber H, Byland C, Malik N, Hochmeister M, Gehrig C. Capillary electrophoresis in clinical and forensic analysis: Recent advances and breakthrough to routine applications. Electrophoresis 1999;20(15-16):3203.
589. Thormann W, Caslavska J. Capillary electrophoresis in drug analysis. Electrophoresis 1998;19(16-17):2691.
Microgram Journal, Volume 1, Numbers 1-2 (January - June 2003) 106
Brought to you by AltGov2 [www.altgov2.org]
590. Deyl Z, Mikšik I, Tagliaro F. Advances in capillary electrophoresis. Forensic Sci Int 1998;92(2-3):89.
591. Tagliaro F, Manetto G, Crivellente F, Smith FP. A brief introduction to capillary electrophoresis. Forensic Sci Int 1998;92:75.
592. Lurie IS. Application of capillary electrophoresis to the analysis of seized drugs. American Laboratory 1996;January:26.
593. Tagliaro F, Turrina S, Smith FP. Capillary electrophoresis: Principles and applications in illicit drug analysis. Forensic Sci Int 1996;77(3):211.
594. Tagliaro F, Smith FR. Capillary electrophoresis: A new analytical tool. Bulletin of the International Association of Forensic Toxicologists 1996;26(2):25.
595. Lurie IS. Analysis of seized drugs by capillary electrophoresis. In: Adamovics, JA, editor. Analysis of Addictive Misused Drugs. New York, 1995:151.
596. Northrup DM, McCord BR, Butler JM. Forensic applications of capillary electrophoresis. J Capillary Electrophor 1994;1:158.
597. Thormann W, Molteni S, Caslavska J, Schmutz A. Clinical and forensic applications of capillary electrophoresis. Electrophoresis 1994;15:3.
598. Thormann W, Lurie IS, McCord B, Marti U, Cenni B, Malik N. Advances of capillary electrophoresis in clinical and forensic analysis (1999-2000). Electrophoresis 2001;22(19):4216.
599. Marina ML, Torre M. Capillary Electrophoresis. Talanta 1994;41(9):1411.
600. Hilhorst MJ, Somsen GW, deJong GJ. Capillary electrokinetic separation techniques for profiling of drugs and related products. Electrophoresis 2001;22(12):2542.
601. Kuffner Jr CA, Marchi E, Morgado JM, Rubio CR. Capillary electrophoresis and Daubert: Time for admission. Anal Chem News and Features 1996 April 1;241A.
602. Gong ZL, Zhang Y, Zhang H, Cheng JK. Capillary electrophoresis separation and permanganate chemiluminescence on-line detection of some alkaloids with beta-cyclodextrin as an additive. J Chromatogr A 1999;855(1):329.
603. Wallenborg S, Arnold D, Lurie I, Bailey C. On-chip separation of amphetamine and related compounds labeled with 4-fluoro-7-nitrobenzofurazane. Electrophoresis 2000;21(15):3257.
604. Salvador A, Varesio E, Dreux M, Veuthey JL. Binding constant dependency of amphetamines with various commercial methylated beta-cyclodextrins. Electrophoresis 1999;20:2670.
605. Garcia AD, Lurie IS. Simultaneous chiral determination and quantitation of methamphetamine and related compounds using capillary electrophoresis. Proceedings of the International Association of Forensic Sciences 15th Triennial Meeting 1999:58.
606. Ku YR, Chang YS, Wen KC, Ho LK. Analysis and confirmation of synthetic anorexics in adulterated traditional Chinese medicines by high-performance capillary electrophoresis. J Chromatogr A 1999;848(1-2):537.
607. Fanali S, Aturki Z, Desiderio C. New strategies for chiral analysis of drugs by capillary electrophoresis. Forensic Sci Int 1998;92(2-3):137.
Microgram Journal, Volume 1, Numbers 1-2 (January - June 2003) 107
Brought to you by AltGov2 [www.altgov2.org]
608. Fanali S. Identification of chiral drug isomers by capillary electrophoresis. J Chromatogr A 1996;735(1-2):77.
609. Dhulst A, Verbeke N. Chiral analysis of basic drugs by oligosaccharide-mediated capillary electrophoresis. J Chromatogr A 1996;735(1-2):283.
610. Gotti R, Pomponio R, Cavrini V. Linear, neutral polysaccharides as chiral selectors in enantioresolution of basic drug racemates by capillary electrophoresis. Chromatographia 2000;52(5/6):273.
611. Lurie IS, Klein RFX, Dal Cason T, LeBelle M, Brenneisen R, Weinberger R. Chiral resolution of cationic drugs of forensic interest by capillary electrophoresis with mixtures of neutral and anionic cyclodextrins. Anal Chem 1994;66:4019.
612. Koppenhoefer B, Epperlein U, Christian B, Lin B, Ji Y, Chen Y. Separation of enantiomers of drugs by capillary electrophoresis. 3. beta-Cyclodextrin as chiral solvating agent. J Chromatogr A 1996;735(1-2):333.
613. Peterson TE. Separation of drug stereoisomers by capillary electrophoresis with cyclodextrins. J Chromatogr 1993;630:353.
614. Nishi H. Enantiomer separation of basic drugs by capillary electrophoresis using ionic and neutral polysaccharides as chiral selectors. J Chromatogr A 1996;735(1-2):345.
615. Aumatell A, Guttman A. Ultra-fast chiral separation of basic drugs by capillary electrophoresis. J Chromatogr A 1995;717(1-2):229.
616. Lurie IS. Capillary electrophoresis of illicit drug seizures. Forensic Sci Int 1998;92:125.
617. Naisbitt GH, Lazar JM, Lee ML. Analysis of drugs of abuse by capillary electrophoresis coupled to time-of-flight mass spectrometry. Proceedings of the American Academy of Forensic Sciences 1998;4:38.
618. Lazar IM, Naisbitt G, Lee ML. Capillary electrophoresis-time-of-flight mass spectrometry of drugs of abuse. Analyst 1998;123(7):1449.
619. Tanaka Y, Terabe S. Separation of the enantiomers of basic drugs by affinity capillary electrophoresis using a partial filling technique and "1-acid glycoprotein as chiral selector. Chromatographia 1997;43(3-4):119.
620. Cherkaoui S, Rudaz S, Varesio E, Veuthey JL. On-line capillary electrophoresis-electrospray mass spectrometry for the stereoselective analysis of drugs and metabolites. Electrophoresis 2001;22(15):3308.
621. Gaus H-J, Gögüs ZZ, Schmeer K, Behnke B, Kovar K-A, Bayer E. Separation and identification of designer drugs with capillary electrophoresis and on-line connection with ionspray mass spectrometry. J Chromatogr A 1996;735(1-2):221.
622. Altria KD. Determination of drug-related impurities by capillary electrophoresis. J Chromatogr A 1996;735(1-2):43.
623. Krogh M, Brekke S, Tonnesen F, Rasmussen KT. Analysis of drug seizures of heroin and amphetamine by capillary electrophoresis. J Chromatogr Adv 1994;674:235.
Microgram Journal, Volume 1, Numbers 1-2 (January - June 2003) 108
Brought to you by AltGov2 [www.altgov2.org]
624. Chinaka S, Tanaka S, Takayama N, Komai K, Ohshima T, Ueda K. Simultaneous chiral analysis of methamphetamine and related compounds by capillary electrophoresis. J Chromatogr B 2000;749(1):111.
625. Lurie IS Bethea MJ, McKibben TD, Hays PA, Pellegrini P, Sahai R, Garcia AD, Weinberger R. Use of dynamically coated capillaries for the routine analysis of methamphetamine, amphetamine, MDA, MDMA, MDEA, and cocaine using capillary electrophoresis. J Forensic Sci 2001;46(5):1025.
626. Belder D, Stockigt D. Analysis of basic pharmaceuticals by capillary electrophoresis in coated capillaries and on-line mass spectrometric detection. J Chromatogr A 1996;752(1-2):271.
627. Walker JA, Marché HL, Newby N, Bechtold EJ. A free zone capillary electrophoresis method for the quantitation of common illicit drug samples. J Forensic Sci 1996;41(5):824.
628. Walker JA, Marche HL, Newby N, Bechtold EJ. A free zone capillary electrophoresis method for the quantitation of common illicit drug samples. Proceedings of the American Academy of Forensic Sciences 1996;2:28.
629. Gavcik J, Stransky Z, Ingelse BA, Lemr K. Capillary electrophoretic enantioseparation of selegiline, methamphetamine, and ephedrine using a neutral beta-cyclodextrin epichlorhydrin polymer. J Pharm Biomed Anal 1996;14(8-10):1089.
630. Cherkaoui S, Mateus L, Christen P, Veuthey JL. Nonaqueous capillary electrophoresis for the analysis of selected tropane alkaloids in a plant extract. Chromatographia 1999;49:54.
631. Mateus L, Cherkaoui S, Christen P, Veuthey JL. Capillary electrophoresis - diode array detection - electrospray mass spectrometry; tropane alkaloids; hyoscyamine; scopolamine; plant extracts. Electrophoresis 1999;20(17):3402.
632. Dittmann MM, Rozing GP. Capillary electrochromatography - A high-efficiency micro-separation technique. J Chromatogr A 1996;744:63.
633. Lurie IS, Conver TS, Ford VL. Simultaneous separation of acidic, basic, and neutral organic compounds, including strong and moderate acids and bases, by capillary electrochromatography. Anal Chem 1998;70:4563.
634. Lurie IS, Conver TS, Meyers RP, Bailey CG, Anex DS. Capillary Electrochromatography of Drugs of Forensic Interest. Proceedings of the International Association of Forensic Sciences 15th Triennial Meeting 1999:59.
635. Curcuruto O, Zaramella A, Hamdan M. Capillary zone electrophoresis/electrospray ionization mass spectrometry for the characterization of drugs of forensic interest. Rapid Communication in Mass Spectrometry 1995;9:1487.
636. Wang Z, Sun YL, Sun ZP. Enantiomeric separation of amphetamine and phenylephrine by cyclodextrin-mediated capillary zone electrophoresis. J Chromatogr A 1996;735(1-2):295.
637. Nielen MWF. Chiral separation of basic drugs using cyclodextrin-modified capillary zone electrophoresis. Anal Chem 1993;65:885.
638. Dong YY, Sun Y, Sun Z. Influence of the buffer organic cation on the chiral separation of some basic drugs by capillary zone electrophoresis. J High Resol Chromatogr 1998;21(8):445.
Microgram Journal, Volume 1, Numbers 1-2 (January - June 2003) 109
Brought to you by AltGov2 [www.altgov2.org]
639. Nishi H. Enantiomer separation of drugs by electrokinetic chromatography. J Chromatogr A 1996;735(1-2):57.
640. Janini GM, Muschik GM, Issaq HJ. Electrokinetic chromatography in suppressed electroosmotic flow environment: Use of a charged cyclodextrin for the separation of enantiomers and geometric isomers. Electrophoresis 1996;17(10):1575.
641. Tanaka Y, Yanagawa M, Terabe S. Separation of neutral and basic enantiomers by cyclodextrin electrokinetic chromatography using anionic cyclodextrin derivatives as chiral pseudostationary phases. J High Resol Chromatogr 1996;19:421.
642. Nishi H, Terabe S. Micellar electrokinetic chromatography - Perspectives in drug analysis. J Chromatogr A 1996;735(1-2):3.
643. Aumatell A, Wells R. Enantiomeric differentiation of a wide range of pharmacologically active substances by cyclodextrin-modified micellar electrokinetic capillary chromatography using a bile salt. J Chromatogr A 1994;688:329.
644. Walker JA. The advantages of different micelles in the micellar electrokinetic capillary chromatography (MECC) of controlled substances. Proceedings of the American Academy of Forensic Sciences 1995;1:23.
645. Gil-Agusti M, Torres-Lapasio JR, Garcia-Alvarez-Coque MC, Esteve-Romero J. Comparison of the performance of butanol and pentanol as modifiers in the micellar chromatographic determination of some phenethylamines. J Chromatogr A 2000;866(1):35.
646. Kuroda N, Sata D, Ohyama K, Wada M, Nakahara Y, Nakashima K. Separation of sympathomimetic amines of abuse and related compounds by micellar electrokinetic chromatography. Chem Pharm Bull 2001;49(7):905.
647. Cherkaoui S, Geiser L, Veuthey JL. Rapid separation of basic drugs by nonaqueous capillary electrophoresis. Chromatographia 2000;52(7-8):403.
648. Bjornsdottir I, Hansen SH. Fast separation of 16 seizure drug substances using non-aqueous capillary electrophoresis. J Biochem Biophys Methods 1999;38:155.
649. Porras SP, Valko IE, Jyske P, Riekkola ML. Effect of electrolyte and solvent composition on capillary electropheretic separation of some pharmaceuticals in non-aqueous media. J Biochem Biophys Methods 1999;38:89.
650. Leung GNW, Tang HPO, Tso TSC, Wan TSM. Separation of basic drugs with non-aqueous capillary electrophoresis. J Chromatogr A 1996;738(1):141.
651. Backofen U, Matysik FM, HoffmanW, Lunte CE. Analysis of illicit drugs by nonaqueous capillary electrophoresis and electrochemical detection. Fresenius J Anal Chem 2000;367:359.
652. Cherkaoui S, Varesio E, Christen P, Veuthey JL. Selectivity manipulation using nonaqueous capillary electrophoresis. Application to tropane alkaloids and amphetamine derivatives. Electrophoresis 1998;19(16-17):2900.
653. Jandera P, Fischer J, Jebava J, Effenberger H. Characterisation of retention in micellar high-performance liquid chromatography, in micellar electrokinetic chromatography and in micellar electrokinetic chromatography with reduced flow. J Chromatogr A 2001;914(1-2):233.
Microgram Journal, Volume 1, Numbers 1-2 (January - June 2003) 110
Brought to you by AltGov2 [www.altgov2.org]
654. Tagliaro F, Smith FP, Turrina S, Equisetto V, Marigo M. Complementary use of capillary zone electrophoresis and micellar electrokinetic capillary chromatography for mutual confirmation of results in forensic drug analysis. J Chromatogr A 1996;735(1-2):227.
655. McGrath G, McClean S, Okane E, Smyth WF, Tagliaro F. Study of the capillary zone electrophoretic behaviour of selected drugs and its comparison with other analytical techniques for their formulation assay. J Chromatogr A 1996;735(1-2):237.
656. Jinno K, Han YH, Sawada H. Analysis of toxic drugs by capillary electrophoresis using polyacrylamide-coated columns. Electrophoresis 1997;18(2):284.
657. Jinno K, Han Y, Sawada H, Taniguchi M. Capillary electrophoretic separation of toxic drugs using a polyacrylamide-coated capillary. Chromatographia 1997;46(5-6):309.
658. Tomita M, Okuyama T. Analysis of drugs by capillary electrophoresis: Effect of methanol in sample solution on the electropherogram. Hochudoku 1993;11:140.
659. Bjornsdottir I, Hansen SH. Evaluation of the use of cyclodextrins in chiral separation of basic drug substances by capillary electrophoresis. Chirality 1995;7(4):219.
660. Quang C, Khaledi MG. Improved chiral separation of basic compounds in capillary electrophoresis using beta-cyclodextrin and tetraalkylammonium reagents. Anal Chem 1993;65:3354.
661. Altria KD. Quantitative aspects of the application of capillary electrophoresis to the analysis of pharmaceuticals and drug related impurities. J Chromatogr 1993;646:245.
662. Lurie IS. Separation selectivity in chiral and achiral capillary electrophoresis with mixed cyclodextrins. J Chromatogr A 1997;792:297.
663. McGrath G, Smyth WF. Large-volume sample stacking of selected drugs of forensic significance by capillary electrophoresis. J Chromatogr B 1996;681(1):125.
664. Siegel JA. Application of fluorescence spectroscopy to forensic science. Forensic Sci Rev 1996;8(1):1.
665. Cone EJ, Deyl Z, Eds. Toxicological and forensic applications of chromatography. Elsevier (Amsterdam, The Netherlands):1992.
666. Tebbet IR, Ed. Gas chromatography in forensic sciences. Chicester, UK. Ellis-Horwood Ltd.:1992.
667. Dasgupta A, Hart AP. Distinguishing amphetamine, methamphetamine, and 3,4-methylenedioxymethamphetamine from other sympathomimetic amines after rapid derivatization with propyl chloroformate and analysis by gas chromatography-chemical ionization mass spectrometry. J Forensic Sci 1997;42(1):106.
668. Shin H-S, Donike M. Stereospecific derivatization of amphetamines, phenol alkylamines, and hydroxyamines and quantification of the enantiomers by capillary GC/MS. Anal Chem 1996;68:3015.
669. Dallabetta-Keller T. Trace analysis by GC/MS using pulsed splitless injections. Proceedings -NOBCChE 2001;28:4.
Microgram Journal, Volume 1, Numbers 1-2 (January - June 2003) 111
Brought to you by AltGov2 [www.altgov2.org]
670. Clark CC. A basic program for the quantitation of cocaine, heroin, diazepam, methaqualone, codeine, and oxycodone on the HP 5890A gas chromatograph. Microgram 1994;27:70.
671. Aebi B, Bernhard W. Gas chromatography with dual mass spectrometric and nitrogen-phosphorus specific detection: A new powerful tool for forensic analysis. Forensic Sci Int 1999;102:91.
672. Hattori H, Yamada T, Suzuki O. Gas chromatography with surface ionization detection in forensic analysis. J Chromatogr A 1994;674:15.
673. Chang W-T, Lin DL, Liu RH. Isotopic analogs as internal standards for quantitative analyses by GC/MS – Evaluation of cross-contribution to ions designated for the analyte and the isotopic internal standard. Forensic Sci Int 2001;121(3):174. [Note: Focus is on drugs and metabolites in biological matrices.]
674. Whiting TC, Liu RH. Isotopic analogues as internal standards for quantitative analyses of drugs and metabolites by GC-MS - Non-linear calibration approaches. J Anal Toxicol 2001;25(3):179.
675. Dent BR, Vannoort RW. GC-MS Analysis of drugs with deuterated internal standards - The New Zealand perspective. Forensic Toxicol Proc Int Meet Assoc Forensic Toxicol 26th 1992:57.
676. Selby DS, Guilhaus M, Murby J, Wells RJ. Direct quantification of alkaloid mixtures by electrospray ionization mass spectrometry. J Mass Spec 1998;33(12):1232.
677. Japp M, Vinall M, Osselton MD. Assessment of a programmable temperature vaporizing (PTV) injector and cold on-column injector for analysis of drugs in forensic samples. Forensic Toxicol Proc Int Meet Assoc Forensic Toxicol 26th. 1992:222
678. Williams TA, Riddle M, Morgan SL, Brewer WE. Rapid gas chromatographic analysis of drugs of forensic interest. J Chromatogr Sci 1999;37(6):210.
679. Wu C, Siems WF, Hill HH. Secondary electrospray ionization ion mobility spectroscopy/mass spectrometry of illicit drugs. Anal Chem 2000;72(2):396.
680. Lillsunde P, Korte T. Thin-layer chromatographic screening and gas chromatographic/mass spectrometric confirmation in the analysis of abused drugs. Anal Addict Misused Drugs 1995:221.
681. Terada M, Shinozuka T, Yasuda M, Yanagida J, Wakasugi C. Simultaneous determination of acidic and neutral drugs by wide-bore column gas chromatography with nitrogen-phosphorus detection. Hochudoku 1992;10:142.
682. Echevarria PA. A dual internal standard method for screening by gas-liquid chromatography at a one percent level. Microgram 1995;28:54.
683. Malcolm MJ, Hudson JC, Proulx JGF, Sharp ME, Whiting C. Internal quality control of a general GC drug screen in forensic toxicology: Experience questions proposals. J Can Soc Forensic Sci 1995;28(3):215.
684. Stimpfl T, Vycudilik W. Identification of the general unknown. Application of mass selective detectors in forensic toxicology. J Anal Toxicol 2000;24(1):32.
685. Steeves JB, Gagne HM, Buel E. Normalization of residual ions after removal of the base peak in electron impact mass spectrometry. J Forensic Sci 2000;45(4):882.
Microgram Journal, Volume 1, Numbers 1-2 (January - June 2003) 112
Brought to you by AltGov2 [www.altgov2.org]
686. Underwood PJ, Kananen GE, Armitage EK. A practical approach to determination of laboratory GC–MS limits of detection. Anal Toxicol 1997;21(1):12.
687. Galipo RC, Morgan SL, Brewer WE. A sample concentrator for sensitivity enhancement in chromatographic analyses. Anal Chem 1998;70(10):2191.
688. Furton KG, Wang J, Hsu Y-L, Walton J, Almirall JR. The use of solid-phase microextraction gas chromatography in forensic analysis. J Chromatogr Sci 2000;38(7):297.
689. Dallabetta-Keller T. Trace analysis by GC/MS using pulsed splitless injections. Microgram 1999;32(5):168.
690. Machiroux R. Physics and chemistry in police investigations. Bulletin de la Societe Royale des Sciences de Liege 2001;70(3):137.
691. Nakahara Y. Recent progress in HPLC analysis for drugs of abuse. Jpn J Toxicol Environ Health 1993;39:369.
692. Lurie IS, Cooper DA, Krull IS. High-performance liquid chromatography using continuous online post-elution photoirradiation with subsequent diode-array UV or thermospray mass spectrometric detection. J Chromatogr 1993;629:143.
693. Dueñas EV, Forero ME. Standardized methods to separate and identify cocaine, morphine, heroin, codeine, papaverine, benzocaine, procaine, lidocaine by high-efficiency liquid chromatography with diode array detector (HPLC-DAD). Microgram 1996;29(8):207.
694. Hernandez AF, Pla A, Moliz J, Gil F, Gonzalvo MC, Villanueva E. Application of the combined use of HPLC/diode array detection and capillary GC/nitrogen phosphorus detection for the rapid analysis of illicit heroin and cocaine samples. J Forensic Sci 1992;37:1276.
695. Smet E, VanderWeken G, Baeyens WRG, Remon JP. A validated HPLC method for assay of morphine hydrochloride and hydromorphone hydrochloride in pharmaceutical preparations. Chromatographia 2001;53(1-2):35.
696. Aboul-Enein HY, Serignese V. Direct chiral resolution of phenylalkylamines using a crown ether chiral stationary phase. Biomed Chromatogr 1997;11(1):7.
697. Deorsi D, Gagliardi L, Bolasco A, Tonelli D. Simultaneous determination of triprolidine, pseudoephedrine, paracetamol, and dextromethorphan by HPLC. Chromatographia 1996;43(9-10):496.
698. Elliot SP, Hale KA. Applications of an HPLC-DAD drug-screening system based on retention indices and UV spectra. J Anal Toxicol 1998;22:279.
699. Lurie IS. Reversed-phase high-performance liquid chromatography analysis of drugs of forensic interest. In: Adamovics, JA, editor. Analysis of Addictive Misused Drugs. New York, 1995:51.
700. Theodoridis G, Papadoyannis I, Vasilikiotis G, Tsoukali-Papadopoulou H. Reversed-phase high-performance liquid chromatography-photodiode-array analysis of alkaloid drugs of forensic interest. J Chromatogr 1995;668:253.
701. Golkiewicz W, Kuczynski J, Markowski W, Jusniak L. High-performance liquid chromatography of some alkaloids on unmodified silica gel with aqueous-organic solvent mixtures. J Chromatogr A 1994;686:85.
Microgram Journal, Volume 1, Numbers 1-2 (January - June 2003) 113
Brought to you by AltGov2 [www.altgov2.org]
702. Lin LA. Detection of alkaloids in foods with a multi-detector high-performance liquid chromatographic system. J Chromatogr 1993;632:69.
703. Logan BK. Liquid chromatography with photodiode array spectrophotometric detection in the forensic sciences. Anal Chim Acta 1994;288:111.
704. Sellers JK, Duffitt GL, Gaines ML, Liu RH. High performance liquid chromatographic analysis of enantiomeric composition of abused drugs. Forensic Sci Rev 1996;8(2):91.
705. Achilli G, Cellerino GP, Deril GVM, Tagliaro F. Determination of illicit drugs and related substances by high-performance liquid chromatography with an electrochemical coulometric-array detector. J Chromatogr A 1996;729(1-2):273.
706. Sato K, Kumazawa T, Katsumata Y. On-line high-performance liquid chromatography-fast atom bombardment mass spectrometry in forensic analysis. J Chromatogr A 1994;674:127.
707. Szasz G, Budvari-Barany Z, Gyimesi-Forras K. Optimized and validated HPLC methods for compedial quality assessment. IV. Non-chiral and chiral purity tests for Solanaceous (Tropane) alkaloids. J Liq Chromatogr and Rel Tech 1999;22(5):747.
708. Hermansson J, Grahn A. Resolution of racemic drugs on a new chiral column based on silica-immobilized cellobiohydrolase. Characterization of the basic properties of the column. J Chromatogr A 1994;687:45.
709. Wu MT, Aderjan R. The effect of chromatographic conditions on the retention indices of forensically relevant substances in reversed-phase HPLC. J Liq Chromatogr & Rel Tech 1996;19(12):1967.
710. Binder SR. High-performance liquid chromatography using unmodified silica with polar solvents. Anal Addict Misused Drugs 1995:133.
711. Hill DW, Kind AJ. Reversed-phase solvent-gradient HPLC retention indexes of drugs. Anal Toxicol 1994;18:233.
712. Bogusz M, Erkens M. Reversed-phase high-performance liquid chromatographic database of retention indices and UV spectra of toxicologically relevant substances and its interlaboratory use. J Chromatogr A 1994;674:97.
713. Bogusz M, Erkens M, Franke JP, De Zeeuw RA. Interlaboratory applicability of a retention index library of drugs for screening by reversed phase HPLC in systematic toxicological analysis. J Liq Chromatogr 1993;16:1341.
714. Kishi T, Ohtsuru O. Applications of IR and Raman spectroscopy in drug analysis. Nippon Sekigaisen Gakkaishi 1998;8(2):70.
715. Sands HS, Hayward IP, Kirkbride TE, Bennett R, Lacey RJ, Batchelder DN. UV-excited resonance Raman spectroscopy of narcotics and explosives. J Forensic Sci 1998;43(3):509.
716. Wielbo D, Tebbett IR. The use of microcrystal tests in conjunction with Fourier transform infrared spectroscopy for the rapid identification of street drugs. J Forensic Sci 1992;37(4):1134.
717. Gal T, Veress T, Ambrus I. Sample preparation of illicit drugs for FT-IR microspectrophotometry. Mikrochim Acta Suppl 1997;14:377.
Microgram Journal, Volume 1, Numbers 1-2 (January - June 2003) 114
Brought to you by AltGov2 [www.altgov2.org]
718. Blackledge RD. Forensic application of FT-NIR in controlled substance validation. Proceedings of the American Academy of Forensic Sciences 1998;4:41.
719. Kohn WH, Jeger AN. Identification of drugs by their near infrared spectra. J Forensic Sci 1992;37(1):35.
720. Sun S, Yu J, Hu X. New research in the non-destructive identification of Chinese traditional drugs with molecular spectroscopy. Guangpuxue Yu Guangpu Fenxi 1999;19(6):841.
721. Praisler M, Dirinck I, Van Bocxlaer JF, DeLenheer AP, Massart DL. Computer-aided screening for hallucinogenic and stimulant amphetamines with gas chromatography-Fourier transform infrared spectroscopy (GC-FTIR). J Anal Toxicol 2001;25(1):45.
722. Praisler M, Dirinck I, Van Bocxlaer J, De Leenheer A, Massart DL. Identification of novel illicit amphetamines from vapor-phase FTIR spectra - a chemometrical solution. Talanta 2000;53:155.
723. Pfeifer AM, Kovar KA. Identification of LSD, MBDB and atropine in real samples with on-line HPTLC-FTIR coupling. J Planar Chromatogr 1995;8:388.
724. Suzuki EM. Fourier transform infrared analyses of some particulate drug mixtures using a diamond anvil cell with a beam condenser and an infrared microscope. J Forensic Sci 1992;37(2):467.
725. Koulis CV, Hymes KJ, Rawlins JL. A new infrared spectral library of controlled and noncontrolled drug standards using internal reflection spectroscopy. J Forensic Sci 2000;45(4):876.
726. Sun S, Zhou Q, Xuan Z, Wang Z, Yu J. Undamaged determination of raw plant medicinal drugs with Fourier transform Raman spectroscopy. Fenxi Huaxue 2000;28(2):211.
727. Angel SM, Carter JC, Stratis DN, Marquardt BJ, Brewer WE. Some new uses for filtered fiber-optic Raman probes: In-situ drug identification and in situ and remote Raman imaging. J Raman Spectrosc 1999;30(9):795.
728. Zhao J, Zhang P, Chen D, Zhang Y, Lu F, Xie H, Li H. Studies of narcotics by micro-Raman spectroscopy. Guangpuxue Yu Guangpu Fenxi 1999;19(6):837.
729. Horvath E, Mink J, Kristof J. Surface-enhanced Raman spectroscopy as a technique for drug analysis. Mikrochim Acta Suppl 1997;14 (Progress in Fourier Transform Spectroscopy):745.
730. Perez R, Ruperez A, Laserna JJ. Evaluation of silver substrates for surface-enhanced Raman detection of drugs banned in sport practices. Anal Chim Acta 1998;376(2):255.
731. Delaney P, Selavka CM. All charged up: Review and forensic applications of ion chromatography. Proceedings of the American Academy of Forensic Sciences 1997;3:10
732. McCrone WC. Chemical problem solving without FTIR, EDX, NMR, XRD, etc., or Why I still use the polarized light microscope, PLM. Microscope 2000;48(3):155.
733. Hueske EE, Weaver TW. The application of videomicroscopy to the analysis of controlled substances. Microgram 1992;25:189.
734. Groombridge CJ. NMR spectroscopy in forensic science. Annual Reports on NMR Spectroscopy 1996;32:215.
Microgram Journal, Volume 1, Numbers 1-2 (January - June 2003) 115
Brought to you by AltGov2 [www.altgov2.org]
735. Thunhorst M, Holzgrabe U. Utilizing NMR spectroscopy for assessing drug enantiomeric composition. Mag Res Chem 1998;36(3):211.
736. LeBelle MJ, Savard C, Dawson BA, Black DB, Katyal LK, Zrcek F, By AW. Chiral identification and determination of ephedrine, pseudoephedrine, methamphetamine, and methcathinone by gas chromatography and nuclear magnetic resonance. Forensic Sci Int 1995;71(3):215
737. Roberts JK, Smith RJ. Use of liquid chromatography - nuclear magnetic resonance spectroscopy for the identification of impurities in drug substances. J Chromatogr A 1994;677:385.
738. Phelan CP. Quantitation of illicit drugs in routine forensic analysis via NMR. Microgram 1999;32(11):312.
739. Schafer T, Schonberger T. Computer assisted analysis and comparison of synthetic drug substances containing tablets by nuclear magnetic resonance spectroscopy. Proceedings of the International Association of Forensic Sciences 15th Triennial Meeting 1999:66.
740. Tong A-J, Wu Y-G, Li L-D. Room temperature phosphorimetry studies of some addictive drugs following dansyl chloride labelling. Talanta 1996;43:1429.
741. de Kanel J, Korbar T. Robotics and the analysis of drugs of abuse. In: Adamovics, JA, Editor. Analysis of Addictive Misused Drugs. New York, 1995:267.
742. Pakulniewicz KJ, Town J. A robotic procedure for the capillary gas chromatographic quantitation of heroin. LC-GC 1995;13:116.
743. Ojanpera I, Nokua J, Vuori E, Sunila P, Sippola E. Combined dual-system RF and UV library search software: Application to forensic drug analysis by TLC and RPTLC. J Planar Chromatogr - Mod TLC 1997;10(4):281.
744. Davidson AW. Computerized infrared search system. Microgram 1992;25:298.
745. Grogg-Sulser K, Helmlin H, Clerc J. Qualitative and quantitative determination of illicit heroin street samples by reversed-phase high-performance liquid chromatography: Method development by CARTAGO-S. J Chromatogr A 1995;692:121.
746. Bravenec VA. A post run macro for the evaluation of an HPLC column's performance and reproducibility. Microgram 1995;28:220.
747. Wrisley L. Use of computer simulations in the development of gradient and isocratic high-performance liquid chromatography methods for analysis of drug compounds and synthetic intermediates. J Chromatogr 1993;628:191.
748. Cole MD, Janhunan KA. An evaluation of supercitical fluid chromatography as an analytical technique for forensic science. Proceedings of the American Academy of Forensic Sciences 1999;5:55.
749. McAvoy Y, Bäckström B, Janhunen K, Stewart A, Cole MD. Supercritical fluid chromatography in forensic science: A critical appraisal. Forensic Sci Int 1999;99(2):107.
750. Brachet A, Mateus L, Cherkaoui S, Christen P, Gauvrit J-Y, Lanteri P, Veuthey J-L. Application of central composite designs in the supercritical fluid extraction of tropane alkaloids in plant extracts. Analusis 1999;27:772.
Microgram Journal, Volume 1, Numbers 1-2 (January - June 2003) 116
Brought to you by AltGov2 [www.altgov2.org]
751. Jeger AN, Briellmann TA. Quantitative applications of TLC in forensic science. J Planar Chromatogr - Mod TLC 1994;7 157.
752. Spangenberg B, Ahrens B, Klein KF. TLC analysis in forensic sciences using a diode array detector. Chromatographia 2001;53(Part 2, Suppl S):S438.
753. Pothier J, Galand N, Viel C. Determination of some narcotic and toxic alkaloidal compounds by overpressured thin-layer chromatography with ethyl acetate as eluent. J Chromatogr 1993;634(2):356.
754. Tandon R. Separation of cocaine pramocaine, fentanyl, and diphenhydramine, some common drugs, by thin layer chromatography. Microgram 1992;25:168.
755. Kato N, Ogamo A. A TLC visualization reagent for dimethylamphetamine and other abused tertiary amines. Science and Justice 2001;41(4):239.
756. Kalasinsky KS, Levine B, Smith ML, Platoff Jr GE. Comparison of infrared and mass spectroscopies for drug analysis. Crit Rev Anal Chem 1993;23:441.
757. ElSohly MA, Feng S, Murphy TP. Improved procedure for overcoming nitrite interferences in GC-MS procedures for cannabinoids - The authors' reply. J Anal Toxicol 1998;22(3):256.
758. Frederick DL. Improved procedure for overcoming nitrite interferences in GC-MS procedures for cannabinoids. J Anal Toxicol 1998;22(3):255.
759. El Sohly MA, Feng S, Kopycki WJ, Murphy TP, Jones AB, Davis A, Carr D. A procedure to overcome interferences caused by the adulterant ‘Klear’ in the GC-MS analysis of 11-nor-Delta-(9)-THC-9-COOH. J Anal Toxicol 1997;21(3):240.
760. Neudorfl N, Hupé M, Pilon P, Lawrence AH. Determination of ecgonidine methyl ester vapor pressure using a dynamic gas blending system and gas chromatographic analysis. Anal Chem 1997;69(20):4283.
761. Casale JF. Methyl esters of ecgonine: Injection-port produced artifacts from cocaine base (crack) exhibits. J Forensic Sci 1992;37(5):1295.
762. Clark JD. Identification of a heroin/chloroform-impurity reaction product. Microgram 1994;27:385.
763. Fenton J, Mummert J, Childers M. Hydromorphone and hydrocodone interference in GC/MS assays for morphine and codeine. J Anal Toxicol 1994;18:159.
764. Poortman-van der Meer AJ. Artifacts in the GC analysis of amphetamine and MDA. Microgram 1996;29(4):91.
765. Clark CR, DeRuiter J, Noggle FT. GC-MS Identification of amine-solvent condensation products formed during analysis of drugs of abuse. J Chromatogr Sci 1992;30:399.
766. Clark CR, Noggle FT, DeRuiter J. Alcohol-amine condensation products formed during the GCMS analysis of drugs of abuse. Microgram 1992;25:330.
767. Wu AHB, Wong SS, Johnson KG, Ballatore A, Seifert, Jr WE. The conversion of ephedrine to methamphetamine and methamphetamine-like compounds during and prior to gas chromatographic/mass spectrometric analysis of CB and HFB derivatives. Biol Mass Spectrom 1992;21(6):278.
Microgram Journal, Volume 1, Numbers 1-2 (January - June 2003) 117
Brought to you by AltGov2 [www.altgov2.org]
768. Hornbeck CL, Carrig JE, Czarny RJ. Detection of a GC/MS artifact peak as methamphetamine. J Anal Toxicol 1993;17:257.
769. Chappell JS. Matrix effects in the infrared examination of methamphetamine salts. Forensic Sci Int 1995;75(1):1.
770. Chappell J. Some aspects to the infrared identification of methamphetamine and other amine salts. Proceedings of the American Academy of Forensic Sciences 1995;1:20.
771. ElSohly MA, Stanford DF, Sherman D, Shah H, Bernot D, Turner CE. A procedure for eliminating interferences from ephedrine and related compounds in the GC/MS analysis of amphetamine and methamphetamine. J Anal Toxicol 1992;16:109.
772. Verweij AMA, Poortman-van der Meer AJ. A note about an artifact in GC analysis of piperonal. Microgram 1992;25:160.
773. Bogusz MJ. Large amounts of drugs may considerably influence the peak areas of their coinjected deuterated analogues measured with APCI-LC-MS. J Anal Toxicol 1997;21 246.
774. Waggoner Jr RW. A simple procedure that allows software to determine if a GC/MS blank injection is contaminated. J Forensic Sci 1996;41(4):681.
775. Hourigan J, Ascano MP. Microcrystal test and quality control procedures employed at the LAPD Narcotics Analysis Unit. Proceedings of the American Academy of Forensic Sciences 2000;6:53.
776. Jungreis E. Spot test analysis: Clinical, environmental, forensic, and geochemical applications. 2nd Ed. Wiley-Interscience:1996
777. Thornton JI. Visual color comparisons in forensic science. Forensic Sci Rev 1997;9(1):37. (Note: This is an extensive review, including drug color tests.)
778. Smiley JC, Hickmon T, Karr C. Analysis of anhydrous ammonia via precipitation of ammonium salt. J Clan Lab Invest Chem Assoc 2001;11(1):31.
779. Hurst TK, Allison J, Siegel JA. An analysis of the chemistry of the Scott Ruybal test for cocaine. Proceedings of the American Academy of Forensic Sciences 2001;7:30.
780. O'Neal CL, Crouch DJ, Fatah AA. Validation of twelve chemical spot tests for the detection of drugs of abuse. Forensic Sci Int 2000;109:189.
781. Anderson OC. Lithium spot test. J Clan Lab Invest Chem Assoc 2000;10(3):11.
782. United Nations International Drug Control Programme (Scientific Section). Monograph: Screening Colour Tests for the Detection of Psychostimulants Pemoline, Fenozolone, and Thozalinone - 1995. New York, NY:1995.
783. Schieferecke J. Red phosphorus analysis using a gas chromatograph/mass spectrometer. J Clan Lab Invest Chem Assoc 2000;10(3):12.
784. Schieferecke J. Red phosphorus analysis using a gas chromatograph/mass spectrometer. Microgram 2000;33(12):339.
785. Christian D. Ammonium molybdate crystal test for phosphorus. J Clan Lab Invest Chem Assoc 1997;7:28.
Microgram Journal, Volume 1, Numbers 1-2 (January - June 2003) 118
Brought to you by AltGov2 [www.altgov2.org]
786. Frank RS, Hinkley SW, Hoffman CG. Representative sampling of drug seizures in multiple containers. J Forensic Sci 1991;36:350.
787. Coulson SA, Coxon A, Buckleton JS. How many samples from a drug seizure need to be analyzed? J Forensic Sci 2001;46(6):1456.
788. Aitken CGG. Sampling - how big a sample? J Forensic Sci 1999;44(4):750.
789. Aitken CGG. Statistics and the evaluation of evidence for forensic scientists. John Wiley and Sons, Inc., Chicheter, UK:1995.
790. Colon M, Rodriguez G, Orlando-Diaz R. Representative sampling of ‘street’ drug exhibits. J Forensic Sci 1993;38:641.
791. Curran JM, Triggs CM, Buckleton J. Sampling in forensic comparison problems. Science Justice 1998;38:101.
792. Tzidony D, Ravreby M. A statistical approach to drug sampling: A case study. J Forensic Sci 1992;37(6):1541.
793. Azoury M, Grader-Sageev D, Avraham S. Evaluation of a sampling procedure for heroin street doses. J Forensic Sci 1998;43(6):1203.
794. Chow ST, Lee TK, Saw CG, Soon TW, Ng TL. The homogenization of illicit heroin samples: An empirical and statistical approach. J Forensic Sci 1993;38(4):885.
795. United Nations International Drug Control Programme (Scientific Section). Monograph: Drug characterization/impurity profiling; background and concepts. United Nations (New York, NY):2000.
796. Wilson WL. Report of the consultative meeting on chemical characterization/profiling of drug seizures - Vienna, 30 November - 2 December 1992. United Nations International Drug Control Programme, Technical Services Division, 1992.
797. Praisler M, Dirinck I, Van Bocxlaer J, De Leenheer A, Massart DL. Pattern recognition techniques screening for drugs of abuse with gas chromatography - Fourier transform infrared spectroscopy. Talanta 2000;53:177.
798. Pikkarainen A-L. Systematic approach to the profiling analysis of illicit amphetamine. Forensic Sci Int 1996;82(2):141.
799. Karkkainen M, Sippola E, Pikkarainen A-L, Rautio T, Himberg K. Automated gas chromatographic amphetamine profiling. Forensic Sci Int 1994;69(1):55.
800. King LA, Clarke K, Orpet AJ. Amphetamine profiling in the UK. Forensic Sci Int 1994;69(1):65.
801. Noggle FT, Clark CR, DeRuiter J. GC-MS and liquid chromatographic analysis of amphetamine and amphetamine-type products formed in the reaction of arylpropenes with acetonitrile and sulfuric acid. Microgram 1995;28:12.
802. Krawczyk W, Parczewski A. Application of chemometric methods in searching for illicit Leuckart amphetamine sources. Analytica Chimica Acta 2001;446:107.
Microgram Journal, Volume 1, Numbers 1-2 (January - June 2003) 119
Brought to you by AltGov2 [www.altgov2.org]
803. Kirkbride KP, Ward AD, Jenkins NF, Klass G, Coumbaros JC. Synthesis of 4-methyl-5-arylpyrimidines: Route specific markers for the Leuckardt preparation of amphetamine, 4methoxyamphetamine, and 4-methylthioamphetamine. Forensic Sci Int 2001;115(1-2):53.
804. Jonson CSL, Artizzu N. Factors influencing the extraction of impurities from Leuckart amphetamine. Forensic Sci Int 1998;93(2-2):99.
805. Jonson CSL, Stromberg L. Two-level classification of Leuckart amphetamine. Forensic Sci Int 1994;69(1):31.
806. DeRuiter J, Clark CR, FT. Gas chromatographic and mass spectral analysis of amphetamine products synthesized from 1-phenyl-2-nitropropene. J Chromatogr Sci 1994;32:511.
807. Noggle FT, DeRuiter J, Clark CR. GC-MS analysis of products by-products and impurities in the synthesis of amphetamine from 1-phenyl-2-nitropropene. Microgram 1994;27:153.
808. Jonson CSL. Amphetamine profiling - Improvements in data processing. Forensic Sci Int 1994;69(1):45.
809. Forbes IJ, Kirkbride KP. The origin of alkenes in illicit amphetamine: An examination of the illicit synthesis of phenyl-2-propanone. J Forensic Sci 1992;37(5):1311.
810. Ballany J, Caddy B, Cole M, Finnon Y, Aalberg L, Janhunen K, Sippola E, Andersson K, Bertler C, Dahlen J, Kopp I, Dujourdy L, Lock E, Margot P, Huizer H, Poortman A, Kaa E, Lopes A. Development of a harmonised pan-European method for the profiling of amphetamines. Science Justice 2001;41(3):193.
811. Cole MD, Backstrom B, Carrott MC, Jones DC. Profiling of drug samples using supercritical fluid chromatography. Proceedings of the American Academy of Forensic Sciences 1996;2:27.
812. Moore JM, Casale JF. Cocaine profiling methodology - Recent advances. Forensic Sci Rev 1998;10(1):13.
813. Casale JF, Morello DR, Moore JM. Signature profiling of trace components in illicit cocaine samples for tactical and strategic law enforcement purposes. Proceedings, Harnessing Technology to Support the National Drug Control Strategy, August 18-21, 1997, Chicago, Illinois; pps. 1317 - 1323.
814. Moore JM, Casale JF, Fodor G, Jones AB. Detection and characterization of cocaine and related tropane alkaloids in coca leaf, cocaine, and biological specimens. Forensic Sci Rev 1995;7(2):77.
815. Casale JF, Morello DR, Moore JM. Signature profiling of trace components in illicit cocaine samples for tactical and strategic law enforcement purposes. Proceedings of the International Association of Forensic Sciences 15th Triennial Meeting 1999:60.
816. Moore JM, Casale JF. In-depth chromatographic analyses of illicit cocaine and its precursor Coca leaves. J Chromatogr A 1994;674(1-2):165.
817. Moore JM, Casale JF, Klein RFX, Cooper DA, Lydon J. Determination and in-depth chromatographic analyses of alkaloids in South American and greenhouse-cultivated Coca leaves. J Chromatogr 1994;659(1):163.
818. Dang VB, Levillain P, Galliot M, Fabiani P, Lich NP. Analysis of cocaine in drug seizures. Ann Falsif Expert Chim Toxicol 1992;85:149.
Microgram Journal, Volume 1, Numbers 1-2 (January - June 2003) 120
Brought to you by AltGov2 [www.altgov2.org]
819. Casale JF, Moore JM, Odeneal NG. Comparative determination of 2-carbomethoxy-3-alkyloxy-and heteroaroyloxy-substituted tropanes in illicit South American cocaine using capillary gas chromatography - single ion monitoring. J Forensic Sci 1998;43(l):125.
820. Casale JF, Moore JM. Lesser alkaloids of cocaine-bearing plants. Part III: 2-Carbomethoxy-3-oxo substituted tropane esters: Detection and gas chromatographic-mass spectrometric characterization of new minor alkaloids found in South American Erythroxylum Coca Var Coca. J Chromatogr A 1996;756(1-2):185.
821. Casale JF, Moore JM. Lesser alkaloids of cocaine-bearing plants. Part II: 3-Oxo-substituted tropane esters: Detection and mass spectral characterization of minor alkaloids found in South American Erythroxylum Coca Var Coca. J Chromatogr A 1996;749(1-2):173.
822. Casale JF, Moore JM, Cooper DA. Novel chlorinated tropanes derived from the treatment of cocaine with sodium hypochlorite. J Forensic Sci 1995;40:816.
823. Carpenter A, Laing RR. Cocaine in bleach: Destroying the evidence (Identification of degradation products). Microgram 1994;27:249.
824. Glass RL, Johnson MB. Analysis of cuscohygrine in Coca leaves by high performance liquid chromatography. J Liq Chromatogr & Rel Tech 1996;19(11):1777.
825. Moore JM, Casale JF. Lesser alkaloids of cocaine-bearing plants. Part I: Nicotinoyl-, 2'-pyrroloyl, and 2'- and 3'-furanoylecgonine methyl ester - Isolation and mass spectral characterization of four new alkaloids of South American Erythroxylum Coca Var Coca. J Forensic Sci 1997;42(2):246.
826. Moore JM, Hays PA, Cooper DA, Casale JF, Lydon J. 1-Hydroxytropacocaine: An abundant new alkaloid of greenhouse cultivated Erythroxylum Novogranatense Var Novogranatense. Phytochem 1994;36:357.
827. Moore JM, Casale JF, Hays PA, Klein RFX, Cooper DA. Hygrine, bona fide alkaloid or artifact: Its chemical reduction novel di-heptafluorobutyrylation and sensitive detection in South American coca leaves using capillary gas chromatography-electron capture detection. J Chromatogr A 1995;704:483.
828. Glass RL. Analysis of hygrine and cuscohygrine in Coca leaves using gas chromatography and high-performance liquid chromatography. J Agric and Food Chem 1997;45(8):3114.
829. Kumar A, Kiser WO. Identification and quantitation of norcocaine in illicit cocaine samples. J Forensic Sci 1995;40:464.
830. Morello DR, Casale JF, Stevenson ML, Klein RFX. The effects of microwave irradiation on occluded solvents in illicitly produced cocaine hydrochloride. J Forensic Sci 2000;45(5):1126.
831. Casale JF, Moore JM. An in-depth analysis of pharmaceutical cocaine: Cocaethylene and other impurities. J Pharm Sci 1994;83:1186.
832. Casale JF, Moore JM. Detection and determination of pseudococaine in Coca leaves and illicit cocaine samples. J Forensic Sci 1994;39:1537.
833. Bermejo-Barrera P, Moreda-Pineiro A, Moreda-Pineiro J, Bermejo-Barrera A, Bermejo-Barrera AM. A study of illicit cocaine seizure classification by pattern recognition techniques applied to metal data. J Forensic Sci 1999;44(2):270.
Microgram Journal, Volume 1, Numbers 1-2 (January - June 2003) 121
Brought to you by AltGov2 [www.altgov2.org]
834. Casale JF, Moore JM. 3',4',5'-Trimethoxy-substituted analogs of cocaine, cis/trans-cinnamoylcocaine and tropacocaine: Characterization and quantitation of new alkaloids in coca leaf, coca paste, and refined illicit cocaine. J Forensic Sci 1994;39(2):462.
835. Moore JM, Casale JF, Cooper DA. Comparative determination of total isomeric truxillines in illicit refined South American cocaine hydrochloride using capillary gas chromatography electron capture detection. J Chromatogr A 1996;756(1-2):193.
836. Lurie IS, Hays PA, Casale JF, Moore JM, Castell DM, Chan KC, Issaq HJ. Capillary electrophoresis analysis of isomeric truxillines and other high molecular weight impurities in illicit cocaine. Electrophoresis 1998;19(1):51.
837. Cortis G, Chessa C. The X-Ray Diffractometry, a method for cocaine samples classification. Proceedings of the International Association of Forensic Sciences 14th Triennial Meeting 1996;2:365.
838. Violante N, Quaglia MG, Lopez A, Caroli S. Characterization of cocaine and heroin samples as a function of their trace element content: An analytical pilot study. J Microchem 1992;45:79.
839. Bermejo-Barrera P, Moreda-Piñeiro A, Moreda-Piñeiro J, Bermejo-Barrera A. Application of rapid electrothermal atomic absorption spectrometric methods to the determination of Ag, Al, Cd and Mn in cocaine and heroin samples. Fresenius J Anal Chem 1997;358(7-8):844.
840. Bermejo-Barrera P, Moreda-Piñeiro A, Moreda-Piñeiro J, Bermejo-Barrera A. Direct determination of nickel in heroin and cocaine by electrothermal atomic absorption spectrometry using deuterium arc background correction combined with chemical modification. J Anal At Spectrom 1995;10:1011.
841. Bermejo-Barrera P, Moreda-Pineiro A, Moreda-Pineiro J, Bermejo-Barrera A. Determination of traces of chromium in cocaine and heroin by flameless atomic absorption spectrometry. Talanta 1996;43(1):77.
842. Bermejo-Barrera P, Moreda-Pineiro A, Moreda-Pineiro J, Bermejo-Barrera A. Effectiveness of palladium as a chemical modifier for the direct silver and manganese determination in cocaine and heroin by electrothermal atomic absorption spectrometry. Talanta 1996;43:1783.
843. Bermejo-Barrera P, Moreda-Pineiro A, Moreda-Pineiro J, Bermejo-Barrera A. Copper determination in cocaine and heroin by electrothermal atomic absorption spectrometry using palladium - magnesium nitrate and nitric acid as chemical modifiers. Quim Anal 1995;14:201.
844. Bermejo-Barrera P, Moreda-Pineiro A, Moreda-Pineiro J, Bermejo-Barrera A. Determination of traces of cadmium in cocaine and heroin by electrothermal atomic absorption spectrometry. Quim Anal 1997;16:35.
845. Bermejo-Barrera P, Moreda-Piñeiro A, Moreda-Piñeiro J, Bermejo-Barrera A. Determination of lead in illicit drugs by electrothermal atomic absorption spectrometry using palladium as chemical modifier. Anal Chim Acta 1995;310:355.
846. Bermejo-Barrera P, Moreda-Piñeiro A, Moreda-Piñeiro J, Bermejo-Barrera A. Determination of aluminum and strontium in illicit drugs by electrothermal atomic absorption spectrometry. Analusis 1996;24:263.
847. Stanley EA. Application of palynology to establish the provenance and travel history of illicit drugs. Microscope 1992;40:149.
Microgram Journal, Volume 1, Numbers 1-2 (January - June 2003) 122
Brought to you by AltGov2 [www.altgov2.org]
848. Cole MD. Occluded solvent analysis as a basis for heroin and cocaine sample differentiation. Forensic Sci Rev 1998;10(2):113.
849. Crowe JB, Platek SF, Ranieri N, Heitkemper DT, Wolnik KA. Microscopic examination of ephedrine HCl; identifying sources of manufacturers. Proceedings of the American Academy of Forensic Sciences 1996;2:16.
850. Noggle FT, Andurkar SV, Clark CR, DeRuiter J. GC-MS analysis of fentanyl synthesized from 1-phenethyl-4-piperidone. Microgram 1993;26:285.
851. Cooper DA. The chemistry of heroin signature. Proceedings of the International Association of Forensic Sciences 15th Triennial Meeting 1999:61.
852. Esseiva P, Guéniat O. The concept of drug intelligence in heroin investigation: The problem of the evaluation of “profiling evidence.” The proposal of a sequence of analysis and a scheme of interpretation for court purposes. Presentation - 1st European Meeting of Forensic Science; Lausanne, Switzerland; 1997.
853. Lurie IS, Chan KC, Spratley TK, Casale JF, Issaq HJ. Separation and detection of acid/neutral impurities in illicit heroin via capillary electrophoresis. J Chromatogr B, Biomed Applic 1995;669:3.
854. Lurie IS, Odeneal NG. The analysis of cations and anions in illicit heroin using capillary electrophoresis with indirect UV detection. Part II: Application to process determination. Proceedings of the American Academy of Forensic Sciences 1998;4:33.
855. Lurie IS. The analysis of cations and anions in illicit heroin using capillary electrophoresis with indirect UV detection. J Capillary Electrophor 1996;3:237.
856. Naess O, Rasmussen KE. Micellar electrokinetic chromatography of charged and neutral drugs in acidic running buffers containing a zwitterionic surfactant sulfonic acids or sodium dodecyl sulphate - Separation of heroin basic by-products and adulterants. J Chromatogr A 1997;760(2):245.
857. Lurie IS, Anex DS, Fintschenko Y, Choi W-L. Profiling of impurities in heroin by capillary electrochromatography and laser induced fluorescence detection. J Chromatogr A 2001;924(1-2):421.
858. Macchia M, Manetto G, Mori C, Papi C, DiPietro N, Salotti V, Bortolotti F, Tagliaro F. Use of beta-cyclodextrin in the capillary zone electrophoresis separation of the components of clandestine heroin preparations. J Chromatogr A 2001;924(1-2):499.
859. Neumann H. Vergleichende heroin analyse mit der capillar-GC: Bestimmung charakteristischer kenngressen. Toxichem Krimtech 1992;59:121.
860. Besacier F, Chaudron-Thozet H. Chemical profiling of illicit heroin samples. Forensic Sci Rev 1999;11(2):105.
861. Johnston A, King LA. Heroin profiling: Predicting the country of origin of seized heroin. Forensic Sci Int 1998;95(1):47.
862. Infante F, Dominguez E, Trujillo D, Luna A. Metal contamination in illicit samples of heroin. J Forensic Sci 1999;44(1):110.
Microgram Journal, Volume 1, Numbers 1-2 (January - June 2003) 123
Brought to you by AltGov2 [www.altgov2.org]
863. Sibley JA. Formation of 0-6-acetylmorphine in the 'Homebake' preparation of heroin. Forensic Sci Int 1996;77(3):159.
864. Wells RJ, Skopec SV, Iavetz R, Robertson J. Trace element analysis of heroin by ICP-MS. Chemistry in Australia 1995;62(7):14.
865. Myors R, Wells RJ, Skopec SV, Iavetz R, Skopec Z, Crisp P, Ekangaki A, Robertson J. Preliminary investigation of heroin fingerprinting using trace element concentrations. Anal Commun 1998;35(12):403.
866. Myors RB, Crisp PT, Skopec SV, Wells RJ. Investigation of heroin profiling using trace organic impurities. Analyst 2001;126(5):679.
867. Ross SA, El Sohly MA. CBN and delta-9-THC concentration ratio as an indicator for the age of stored marijuana samples. Bull Narc 1997/1998;(49(1,2)/50(1,2)):139.
868. Rustichelli C, Ferioli V, Vezzalini F, Rossi MC, Ganberini G. Simultaneous separation and identification of hashish constituents by coupled liquid chromatography-mass spectrometry (HPLC-MS). Chromatographia 1996;43(3/4):129.
869. Hida M, Mitsui T, Minami Y, Fujimura Y. Classification of hashish by pyrolysis-gas chromatography. J Anal Appl Pyrolysis 1995;32:197.
870. Ross SA, Parker M, Arafat R, Lovett K, ElSohly MA. The analysis of confiscated marijuana samples for different cannabinoids using GC/FID. Amer Lab 1996;16;F.
871. Gigliano GS, Di Finizio A. The Cannabis Sativa L. fingerprint as a tool in forensic investigation. Bull Narc 1997/1998;(49(1,2)/50(1,2)):129.
872. Lehmann T, Brenneisen R. High performance liquid chromatographic profiling of Cannabis products. J Liq Chromatogr 1995;18:689.
873. Ross SA, ElSohly MA. Constituents of Cannabis Sativa L. XXVII, a review of the natural constituents: 1980 - 1994. Zagazig J Pharm Sci 1995;4(2):1.
874. Ross SA, ElSohly MA. Constituents of Cannabis Sativa L. XXVIII. A review of the natural constituents, 1980-1994. J Nat Prod 1996;59(1):49.
875. Gigliano GS, Caputo P, Cozzolino S. Ribosomal DNA analysis as a tool to identify specimens of Cannabis Sativa L. of forensic interest. Science Justice 1997;37:171.
876. Gigliano GS. Identification of Cannabis Sativa L. (Cannabaceae) using restriction profiles of the internal transcribed spacer II (ITS2). Science Justice 1998;38:225.
877. Gigliano GS, DiFinizio A. Approccio molecolare nelle indagini forensi su Cannabis Sativa L. Delpinosa ns 1994;36:15.
878. Gigliano GS. Restriction profiles of trnL (UAA) intron as a tool in Cannabis Sativa L. identification. Delpinosa ns 1995;37:85.
879. Gigliano GS. Preliminary data on the usefulness of internal transcribed spacer I (ITS1) sequence in the Cannabis Sativa L. identification. J Forensic Sci 1999;44(3):475.
880. Gigliano GS. trnL (UAA) intron sequence: An ideal molecule for Cannabis Sativa L. identification in the forensic investigations. Delpinosa ns 1997;39:3.
Microgram Journal, Volume 1, Numbers 1-2 (January - June 2003) 124
Brought to you by AltGov2 [www.altgov2.org]
881. Coyle HM, Divakaran K, Jachimowicz E, Ladd C, Lee HC. Individualization of marijuana (cannabis sativa) samples for forensic applications and narcotics enforcement. Proceedings of the American Academy of Forensic Sciences 2001;7:30.
882. Jagadish V, Robertson J, Gibbs A. RAPD analysis distinguishes Cannabis Sativa samples from different sources. Forensic Sci Int 1996;79(2):113.
883. Gigliano GS, DiFinizio A, Caputo P, Cozzolino S. Cannabis fingerprints by using random amplified polymorphic DNA (RAPD). Delpinosa ns 1995;37:35.
884. Remberg B, Stead AH. Drug characterization/impurity profiling, with special focus on methamphetamine: Recent work of the United Nations International Drug Control Programme. Bull Narc 1999;51(1,2):97.
885. United Nations International Drug Control Programme (Scientific Section). Monograph: A Practical Guide to Methamphetamine Characterization/Impurity Profiling: Method Procedures, Mass Spectral Data of Selected Impurities, and Literature References - 2000. New York, NY:2000.
886. Inoue T. Discrimination of abused drug samples by impurity profiling analysis (chemical fingerprint). Jpn J Forensic Toxicol 1992;10:204.
887. Kobayashi K, Iwata Y, Kanamori T, Inoue H, Kishi T. Analysis of impurities in methamphetamine and impurity profiling. Reports of the National Research Institute of Police Science, Research on Forensic Science 1994;69:97.
888. Conn C, Dawson M, Baker A, Keegan J, Fryirs B. Identification of N-acetylmethamphetamine in a sample of illicitly synthesized methamphetamine. J Forensic Sci 1996;41(4):645.
889. Lekskulchai V, Carter K, Poklis A, Soine W. GC-MS analysis of methamphetamine impurities: Reactivity of (+)- or (-)-chloroephedrine and cis- or trans-1,2-dimethyl-3-phenylaziridine. J Anal Toxicol 2000;24:602.
890. Lurie IS, Bailey CG, Anex DS, Bethea MJ, McKibben TD, Casale JF. Profiling of impurities in illicit methamphetamine by high-performance liquid chromatography and capillary electrochromatography. J Chromatogr A 2000;870:53.
891. Noggle FT, Clark CR, DeRuiter J. Characterization of methamphetamine and synthetic by-products in clandestine samples: A case report. Microgram 1994;27:253.
892. Marumo Y, Inoue T, Seta S. Analysis of inorganic impurities in seized methamphetamine samples. Forensic Sci Int 1994;69(1):89-95.
893. Noggle FT, Clark CR, DeRuiter J. Gas chromatographic and mass spectral analysis of methamphetamine synthesized from allylbenzene. J Chromatogr Sci 1995;33(4):153.
894. Noggle FT, Clark CR, DeRuiter J. GC-MS and LC of addition products formed from the reaction of allylbenzene and related arylpropenes with acetonitrile and sulfuric acid. J Chromatogr Sci 1995;33(5):256.
895. Noggle FT, Clark CR, DeRuiter J. Evaluation of allylbenzene as a precursor for the synthesis of methamphetamine. Microgram 1994;27:302.
896. Windahl KL, McTigue MJ, Pearson JR, Pratt SJ, Rowe JE, Sear EM. Investigation of the impurities found in methamphetamine synthesized from pseudoephedrine by reduction with
Microgram Journal, Volume 1, Numbers 1-2 (January - June 2003) 125
Brought to you by AltGov2 [www.altgov2.org]
hydriodic acid and red phosphorus. Forensic Sci Int 1995;76(2):97.
897. Oulton SR, Skinner HF. Reaction byproducts of common cold tablet ingredients via hydriodic acid/red phosphorus. Microgram 1999;32(10):257.
898. Oulton SR, Skinner HF. Reaction byproducts of common cold tablet ingredients via hydriodic acid/red phosphorus. J Clan Lab Invest Chem Assoc 1999;9(4):21.
899. DeFrancesco JV. Analysis of methamphetamine hydrochloride exhibits containing a hydrocarbon wax. Microgram 1999;32(12):357.
900. Melgoza L. Impurities in methamphetamine manufactured from over-the-counter pseudoephedrine tablet preparations. J Clan Lab Invest Chem Assoc 1999;9(2-3):21.
901. Muratsu S, Fukui S, Maeda T, Matsushita T, Hasegawa H, Sakurai Y, Shimoda O, Kaizaki S, Ninomiya T. Trace elemental analysis of illicit methamphetamines using total reflection X-ray fluorescence spectroscopy. J Health Sci 1999;45:166.
902. Perkal M, Ng YL, Pearson JR. Impurity profiling of methylamphetamine in Australia and the development of a national drug database. Forensic Sci Int 1994;69 77.
903. Tanaka K, Ohmori T, Inoue T, Seta S. Impurity profile analysis of illicit methamphetamine by capillary gas chromatography. J Forensic Sci 1994;39(2):500.
904. Tanaka K, Ohmori T, Inoue T, Seta S. Analysis of impurities in illicit methamphetamine. Forensic Sci Int 1992;56(2):157.
905. Inoue T, Tanaka K, Ohmori T, Togawa Y, Seta S. Impurity profiling analysis of methamphetamine seized in Japan. Forensic Sci Int 1994;69(1):97.
906. Yoo YC, Chung HS, Choi HK, Kim EM, Kim SC, Kim SW. Identification and profiles of impurities in illicit methamphetamine in Korea. Proceedings of the 35th TIAFT Meeting, Padova, 1997:183.
907. Coumbaros JC, Kirkbride KP, Klass G. Application of solid-phase microextraction to the profiling of an illicit drug: Manufacturing impurities in illicit 4-methoxyamphetamine. J Forensic Sci 1999;44(6):1237.
908. Dawson M, Armitage S, Roux C, Robertson J, Goulding J. An Australian approach to ecstasy profiling. Proceedings of the International Association of Forensic Sciences 15th Triennial Meeting 1999:61.
909. Rashed AM, Anderson RA, King LA. Solid-phase extraction for profiling of ecstasy tablets. J Forensic Sci 2000;45(2):413.
910. Rashed AM, Anderson RA, King LA. Solid-phase extraction for profiling of ecstasy tablets. Proceedings of the American Academy of Forensic Sciences 1999;5:26.
911. Renton RJ, Cowie JS, Oon MCH. A study of the precursors, intermediates, and reaction by-products in the synthesis of 3,4-methylenedioxymethylamphetamine and its application to forensic drug analysis. Forensic Sci Int 1993;60(1,2):189.
912. Kongshaug KE, Pedersen-Bjergaard S, Rasmussen KE, Krogh M. Solid-phase microextraction/capillary gas chromatography for the profiling of confiscated ecstasy and amphetamine. Chromatographia 1999;50(3-4):247.
Microgram Journal, Volume 1, Numbers 1-2 (January - June 2003) 126
Brought to you by AltGov2 [www.altgov2.org]
913. Verweij AMA. Impurities in illicit drug preparations: 3,4-(Methylenedioxy)amphetamine and 3,4-(methylenedioxy)methylamphetamine. Forensic Sci Rev 1992;4(2):137.
914. Bohn M, Bohn G. Weakly basic impurities in illegally manufactured 3,4-methylenedioxyamphetamine and 3,4-methylenedioxymethamphetamine. Proceedings of the International Association of Forensic Sciences 13th Triennial Meeting 1993;5:211.
915. Bohn M, Bohn G, Blaschke G. Synthesis markers in illegally manufactured 3,4-methylenedioxyamphetamine and 3,4-methylenedioxymethamphetamine. Int J Legal Med 1993;106:19.
916. Vu D-TV. Logo and headspace comparison for source determination of ecstasy seizures. Microgram 2001;34(9):244.
917. Verweij AMA, Sprong AGA. A note about some impurities in commercially available piperonylmethylketone. Microgram 1993;26:209.
918. Laing RR, Dawson B. Identification of the major product from the Ritter reaction using safrole. J Clan Lab Invest Chem Assoc 1997;7(2):22.
919. Clark CR, DeRuiter J, Andurkar S, Noggle FT. Analysis of 3,4-methylenedioxyphenyl-2-propanone and 3,4-methylenedioxyamphetamine prepared from isosafrole. J Chromatogr Sci 1994;32:393.
920. Clark CR, Noggle FT. GC-MS Analysis of products intermediates and by-products in the synthesis of MDA from isosafrole. Microgram 1994;27:188.
921. Verweij AMA. Verunreinigungen, die bei der herstellung von 3,4-methylendioxyamphetamin (MDA) durch kondensation von nitroethan und piperonal aufgefunden waren. Arch Kriminol 1992;190:24.
922. Rogers JC, Winkler LS, Borgerding MF. Chromatographic profiling as a tool in the comparison and evaluation of complex mixtures. J Chromatogr Sci 1997;35(5):193.
923. Remberg B, Krenn L, Kopp B, Buchbauer G, Nikiforov A. Principal component analysis (PCA) of opium alkaloid contents for origin determination. Pharmazie 1994;49:766.
924. Decker G, Wanner G, Zenk MH, Lottspeich F. Characterization of proteins in latex of the opium poppy (Papaver Somniferum) using two-dimensional gel electrophoresis and microsequencing. Electrophoresis 2000;21(16):3500.
925. Gorog S, Babjak M, Balogh G, Brlik J, Csehi A, Dravecz F, Gazdag M, Horvath P, Lauko A, Varga K. Drug impurity profiling strategies. Talanta 1997;44:1517.
926. Flurer CL, Wolnik KA. Chemical profiling of pharmaceuticals by capillary electrophoresis in the determination of drug origin. J Chromatogr A 1994;674:153.
927. Goosens EC, Stegman KH, Dejong D, Dejong GJ, Brinkman UAT. Investigation of on-line reversed-phase liquid chromatography gas chromatography mass spectrometry as a tool for the identification of impurities in drug substances. Analyst 1996;121(1):61.
928. Berridge JC. Impurities in drug substances and drug products: New approaches to quantification and qualification. J Pharm Biomed Anal 1995;14(1-2):7.
Microgram Journal, Volume 1, Numbers 1-2 (January - June 2003) 127
Brought to you by AltGov2 [www.altgov2.org]
929. Allen AC, Stevenson ML, Nakamura SM, Ely, RA. Differentiation of illicit phenyl-2-propanone synthesized from phenylacetic acid with acetic anhydride versus lead (II) acetate. J Forensic Sci 1992;37(1):301.
930. Verweij AMA. Impurities in illicit drug preparations (XXIV): Spectroscopic properties of some compounds present in essential oils used as starting compounds in the synthesis of designer drugs of the phenethylamine type. Microgram 1995;28:224.
931. Somsen GW, Gooijer C, Brinkman UAT, Velthorst NH, Visser T. Coupling of LC and FT-IR: Impurity profiling of testosterone undecanoate. Appl Spectrosc 1992;46:1514.
932. Ihle E, Schmidt HL. Multielement isotope analysis on drugs of abuse. Possibility for their origin assignment. Isot Environ Health Stud 1996;32:226.
933. Ihle E, Schmidt HL. Multi element and on line stable isotope analysis in illicit drug characterisation. 1st European Meeting of Forensic Science, Lausanne, Switzerland, 1997.
934. Brazier JL. Use of isotope ratios in forensic analysis. In: Ynon Jehuda, Editor. Forensic Applications of Mass Spectrometry. Boca Raton: CRC Press Inc. 1995:259.
935. Besacier F, Guilluy R, Brazier JL, Chaudron-Thozet H, Girard J, Lamotte A. Isotopic analysis of 13C as a tool for comparison and origin assignment of seized heroin samples. J Forensic Sci 1997;42(3):429.
936. Dautraix S, Guilluy R, Chaudron-Thozet H, Brazier JL, Lamotte A. C-13 Isotopic analysis of an acetaminophen and diacetylmorphine mixture. J Chromatogr A 1996;756(1-2):203.
937. Ehleringer J, Lott M, Casale J, Ford V. Tracing the geographic origin of cocaine. Nature 2000;408:311.
938. Ehleringer JR, Cooper DA, Lott MJ, Cook CS. Geo-location of heroin and cocaine by stable isotope ratios. Forensic Sci Int 1999;106:27.
939. Hays PA, Remaud GS, Jamin E, Martin Y-L. Geographic origin determination of heroin and cocaine using site-specific isotopic ratio deuterium NMR. J Forensic Sci 2000;45(3):552.
940. Besacier F, Chaudron-Thozet H, Lascaux F, Rousseau-Tsangaris M. Application du couplage chromatographie gazeuse-spectrométrie de masse istopique de l’azote à l’analyse d’échantillons de drogues. Analusis 1999;27:17.
941. Desage M, Guilluy R, Brazier JL, Chaudron H, Girard J, Cherpin H, J Jumeau J. Gas chromatography with mass spectrometry or isotope-ratio mass spectrometry in studying the geographical origin of heroin. Anal Chim Acta 1991;247:249.
942. Huizer H. A contribution to comparison. Forensic Sci Int 1994;69(1):17.
943. Perillo BA, Klein RFX, Franzosa ES. Recent advances by the US Drug Enforcement Administration in drug signature and comparative analysis. Forensic Sci Int 1994;69(1):1.
944. Jonson CSL, Stromberg L. Computer aided retrieval of common-batch members in Leuckart amphetamine profiling. J Forensic Sci 1993;38(6):1472.
945. Meyers RP, Moore JM, Casale JF, Lurie IS. The use of multiple methods for cocaine comparison analysis. Proceedings of the American Academy of Forensic Sciences 1995;1:21.
Microgram Journal, Volume 1, Numbers 1-2 (January - June 2003) 128
Brought to you by AltGov2 [www.altgov2.org]
946. Janzen KE, Fernando AR, Walter L. A database for comparison of illicit cocaine samples. Forensic Sci Int 1994;69(1):23.
947. Moore JM, Cooper DA. The application of capillary gas chromatography - electron capture detection in the comparative analyses of illicit cocaine samples. J Forensic Sci 1993;38(6):1286.
948. Janzen KE, Walter L, Fernando AR. Comparison analysis of illicit cocaine samples. J Forensic Sci 1992;37(2):436.
949. Ausili PT. Crack, cracked? or broken? Proceedings of the American Academy of Forensic Sciences 1996;2:17.
950. Moore JM, Meyers RP, Jimenez MD. The anatomy of a cocaine comparison case: A prosecutorial and chemistry perspective. J Forensic Sci 1993;38(6):1305.
951. Ensing JG, Racamy C, de Zeeuw RA. A rapid gas chromatographic method for the fingerprinting of illicit cocaine samples. J Forensic Sci 1992;37(2):446.
952. Stein K, Kraatz A. Comparative study of illegal cocaine samples with high pressure liquid chromatography and photodiode array detection. Arch Kriminol 1996;197:16.
953. Casale JF, Watterson JW. A computerized neural network method for pattern recognition of cocaine signatures. J Forensic Sci 1993;38(2):292.
954. Ferioli V, Rustichelli C, Pavesi G, Gamberini G. Analytical characterization of hashish samples. Chromatographia 2000;52(1-2):39.
955. Besacier F, Chaudron-Thozet H, Rousseau-Tsangaris M, Girard J, Lamotte A. Comparative chemical analyses of drug samples: General approach and application to heroin. Forensic Sci Int 1997;85(2):113.
956. Neumann H. Comparison of heroin by capillary gas chromatography in Germany. Forensic Sci Int 1994;69(1):7.
957. Klemenc S. In common batch searching of illicit heroin samples - evaluation of data by chemometrics methods. Forensic Sci Int 2001;115(1-2):43.
958. Janhunen K, Cole MD. Development of a predictive model for batch membership of street samples of heroin. Forensic Sci Int 1999;102:1.
959. Stromberg L, Lundberg L, Neumann H, Bobon B, Huizer H, van der Stelt NW. Heroin impurity profiling. A harmonization study for retrospective comparisons. Forensic Sci Int 2000;114(2):67.
960. Stromberg L, Lundberg L, Neumann H, Bobon B, Huizer H, van der Stelt NW. Heroin impurity profiling: A harmonization study for retrospective comparisons. Statens Kriminaltekniska Laboratorium (Sweden), Bundeskriminalamt (Germany), Gerechtelijk Laboratorium (The Netherlands) December l997.
961. Stromberg L. The retrospective retrieval of common-batch links in gas chromatographic profiling of southwest Asian street heroin. 1st European Meeting of Forensic Science, Lausanne, Switzerland, 1997.
962. Gillan R, Cole MD, Linacre A, Thorpe JW, Watson ND. Comparison of Cannabis Sativa by random amplification of polymorphic DNA (RAPD):and HPLC of cannabinoids: A preliminary
Microgram Journal, Volume 1, Numbers 1-2 (January - June 2003) 129
Brought to you by AltGov2 [www.altgov2.org]
study. Science Justice 1995;35(3):169.
963. Van Zyl EF, Louw M. The differentiation of illicit methaqualone tablet formulations using principal component and soft independant modeling of class analogy analysis of their near-infrared reflectance spectra. J Forensic Sci 1995;40(6):1072.
964. Mas F, Beemsterboer B, Veltkamp AC, Verweij AMA. Determination of ‘common batch’ members in a set of confiscated 3,4-(methylenedioxy)methylamphetamine samples by measuring the natural isotope abundances: A preliminary study. Forensic Sci Int 1995;71(3):225.
965. Shoyama Y, Kawachi F, Tanaka H, Nakai R, Shibata T, Nishi K. Genetic and alkaloid analysis of Papaver species and their F1 hybrid by RAPD, HPLC, and ELISA. Forensic Sci Int 1998;91:207.
966. Welsh WJ, Lin W, Tersigni SH, Collantes E, Duta R, Carey MS, Zielinski WL, Brower J, Spencer JA, Layloff TP. Pharmaceutical fingerprinting: Evaluation of neural networks and chemometric techniques for distinguishing among same-product manufacturers. Anal Chem 1996;68(19):3473.
967. Franzosa ES, Harper CW (US Drug Enforcement Administration Special Testing and Research Laboratory McLean VA USA). The logo index for tablets and capsules, 5th Edition, 2000; US. Department of Justice Drug, Enforcement Administration (Arlington, Virginia) [Supercedes previous editions dated 1997, 1995, 1990, and 1988].
968. EUROPOL: Working-group precursors and synthetic drugs logo project synthetic drugs catalogue 1997 edition. EUROPOL Drugs Unit The Hague 1997; File No 2521-15r2.
969. Hays PA. Authentication procedures for reference drug standards. Microgram 1994;27:14.
970. Hays PA. Authentication of reference drug standards in the forensic laboratory. Proceedings of the American Academy of Forensic Sciences 1995;1:22.
971. Somei M, Yamada F, Kurauchi T, Nagahama Y, Hasegawa M, Yamada K, Teranishi S, Sato H, Kaneko C. The chemistry of indoles. CIII. Simple syntheses of serotonin, N-methylserotonin, bufotenine, 5-methoxy-N-methyltryptamine, bufobutanoic acid, N-(indol-3-yl)-methyl-5-methoxy-N-methyltryptamine, and lespedamine based on 1-hydroxyindole chemistry. Chem Pharm Bull 2001;49(1):87.
972. Chang WT, Liu RH. Mechanistic studies on the use of H-2- and C-13- analogues as internal standards in selected ion monitoring GC-MS quantitative determination - Butalbital example. J Anal Toxicol 2001;25(8):659.
973. Harrington PE, Stergiades IA, Erickson J, Makriyannis A, Tius MA. Synthesis of functionalized cannabinoids. J Org Chem 2000;65(20):6576.
974. Kachensky DF. Preparation of racemic (-) and (+)-11-nor-delta(9)-tetrahydrocannabinol-9-carboxylic Acid. J Org Chem 1997;62(20):7065.
975. Lee JC, Lee K, Cha JK. Enantioselective synthesis of unnatural (S)-(+)-cocaine. J Organic Chem 2000;65(15):4773.
976. Lin RH, Castells J, Rapoport H. Enantiospecific synthesis of natural (-)-cocaine and unnatural (+)-cocaine from D- and L-glutamic acid. J Org Chem 1998;63(12):4069.
Microgram Journal, Volume 1, Numbers 1-2 (January - June 2003) 130
Brought to you by AltGov2 [www.altgov2.org]
977. Teerhuis NM, Hiemstra H, Speckamp WN. Synthesis of enantiopure aza-analogues of cocaine. Tetrahedron Letters 1997;38(1):159.
978. Everhart ET, Jacob P, Mendelson J, Jones RT. The synthesis of deuterium-labelled cocaine, cocaethylene and metabolites. J Labelled Compounds and Radiopharmaceuticals 1999;42(13):1265.
979. Paul BD, Dreka C, Summers JL, Smith ML. One-step esterification of benzoylecgonine with dimethylformamide-dipropylacetal or dimethylformamide-disopropylacetal in the presence of pyridine. J Anal Toxicol 1996;20(6):506.
980. Kozikowski AP, Simoni D, Manfredini S, Roberti M, Stoelwinder J. Synthesis of the 6- and 7-hydroxylated cocaines and pseudococaines. Tetrahedron Letters 1996;37(30):5333.
981. Deng SM, Huang DW, Landry DW. Synthesis of C-3 alkyl analogs of cocaine. Tetrahedron Lett 2001;42(36):6259.
982. Neville GA, Beckstead HD, Black DB, Dawson BA, Ethier JC. USP Lysergic acid diethylamide tartrate (Lot 1): Authentic substance recharacterized for authentication of a house supply of lysergide (LSD) tartrate. Can J Appl Spectrosc 1992;37:149.
983. Li ZY, GocSzkutnicka K, McNally AJ, Pilcher I, Polakowski S, Vitone S, Wu RS, Salamone SJ. New synthesis and characterization of (+)-lysergic acid diethylamide (LSD): Derivatives and the development of a microparticle-based immunoassay for the detection of LSD and its metabolites. Bioconjugate Chemistry 1997;8(6):896.
984. Kozma D, Fogassy E. Solvent-free optical resolution of N-methylamphetamine by distillation after partial diastereoisomeric salt formation. Chirality 2001;13(8):428.
985. Rager K, Williams G, Traughber M, Melgoza L. “Ice” recrystallized from street methamphetamine samples. J Clan Lab Invest Chem Assoc 2000;10(2):13.
986. Cozzi NV, Ruoho AE. Radiosynthesis of [H-3]methcathinone, an inhibitor of nonamine reuptake transporters. J Labelled Compounds and Radiopharmaceuticals 1998;41(10):927.
987. Brunner H. Narcotic drug methohexital: Synthesis by enantioselective catalysis. Chirality 2001;13(8):420.
988. Mulzer J, Trauner D. Practical synthesis of (-)-morphine. Chirality 1999;11(5-6):475.
989. White JD, Hrnciar P, Stappenbeck F. Asymmetric synthesis of (+)-morphine; the phenanthrene route revisited. J Org Chem 1997;62(16):5250.
990. Shimamine M, Takahashi K, Nakahara Y. Identification of psychotropic substances. IX. Preparation and various analytical data of reference standards of new psychotropic substances: N-ethylmethylenedioxyamphetamine, N-hydroxymethylenedioxyamphetamine, mecloqualone, 4methylaminorex, phendimetrazine, and phenmetrazine. Eisei Shikensho Hokoku 1993;111:66.
991. Cham KB. The identification, purification, and authentication of some reference drug standards. Microgram 2001;34(8):214.
992. Fiddian SE. The establishment of a research and reference garden for hallucinogenic and narcotic plants. Proceedings of the International Association of Forensic Sciences 13th Triennial Meeting 1993;5:242.
Microgram Journal, Volume 1, Numbers 1-2 (January - June 2003) 131
Brought to you by AltGov2 [www.altgov2.org]
993. Reddy GV, Rao GV, Sreevani V, Iyengar DS. An enantioselective synthesis of (1S,2S)-pseudoephedrine. Tetrahedron Letters 2000;41(6):953.
994. Nichols DE, Frescas S. Improvements to the synthesis of psilocybin and a facile method for preparing the O-acetyl prodrug of psilocin. Synthesis - Stuttgart 1999;(6):935.
995. United Nations International Drug Control Programme. Monograph: Clandestine Manufacture of Substances under International Control - Revised in 1998. New York, NY:1998.
996. Bakouri E, Van Rijn A. Dismantling of clandestine laboratory in Greece. Science Justice 2001;41(3):213.
997. Guiney LB. Synthesis of amphetamine via isopropyl nitrite. Microgram 1992;25 295.
998. Cody JT. Enantiomeric composition of amphetamine and methamphetamine derived from the precursor compound famprofazone. Forensic Sci Int 1996;80(3):189.
999. Angelos SA, Raney JK. An unsuccessful clandestine synthesis of amphetamine. Proceedings of the International Association of Forensic Sciences 14th Triennial Meeting 1996;2:310.
1000. Massetti J. Amphetamine in suspected methamphetamine samples. J Clan Lab Invest Chem Assoc 1995;5(4):9.
1001. McKibben T. Analyses of inorganic components found in clandestine drug laboratory evidence. J Clan Lab Invest Chem Assoc 1995;5(4):19.
1002. Culshaw PN. Arsenic oxide: A potential reagent in methylamphetamine synthesis? J Clan Lab Invest Chem Assoc 2001;11(2):13.
1003. Clandestine Laboratory Investigating Chemists Association. Monograph: A Review of the Birch Reduction Method. Fresno, CA:1998.
1004. Angelos SA, Raney JK. Methamphetamine by the Birch reduction. Proceedings of the International Association of Forensic Sciences 15th Triennial Meeting 1999:61.
1005. Casale JF. Illicit production of cocaine. Proceedings of the American Academy of Forensic Sciences Annual Meeting 1997;3:2a.
1006. Casale JF, Klein, RFX. Illicit production of cocaine. Forensic Sci Rev 1993;5(2):95.
1007. Reader B. Concealment and trafficking of illicit drugs. Science and Justice: 1995 Annual General Meeting of the Forensic Science Society (summary). 1996;36(2):123.
1008. Poortman-van der Meer AJ. The synthesis of 2,5-dimethoxy-4-ethylthiophenethylamine (2C-T-2). A case report. J Clan Lab Invest Chem Assoc 1999;9(4):17.
1009. Andrews KM. Ephedra's role as a precursor in the clandestine manufacture of methamphetamine. J Forensic Sci 1995;40:551.
1010. Hutchinson K, Andrews KM. The use and availability of Ephedra products in the United States. Microgram 1995;28:256.
1011. Farnsworth R. Former Idaho chemistry professor suspected of synthesizing pseudoephedrine and ephedrine via benzaldehyde and nitroethane. J Clan Lab Invest Chem Assoc 2000;10(1):8.
Microgram Journal, Volume 1, Numbers 1-2 (January - June 2003) 132
Brought to you by AltGov2 [www.altgov2.org]
1012. Willers-Russo LJ. Possible new pseudoephedrine source discovered. J Clan Lab Invest Chem Assoc 2000;10(2):14.
1013. Sorokin VI. Illegal synthesis of etonitazene. J Clan Lab Invest Chem Assoc 1999;9(2-3):20.
1014. Angelos SA, Raney JK. Clandestine manufacture of fentanyl. Proceedings of the International Association of Forensic Sciences 14th Triennial Meeting 1996;2:312.
1015. Oulton S. Dichlorofluoroethane in the clandestine manufacture of methamphetamine. Microgram 1996;29(10):261.
1016. Oulton S. Dichlorofluoroethane in the clandestine manufacture of methamphetamine. J Clan Lab Invest Chem Assoc 1996;6(4):16.
1017. Massetti J, Kalchik M. Freon solvent mixtures at clandestine methamphetamine laboratories. Proceedings of the American Academy of Forensic Sciences 1998;4:36.
1018. Hugel J, Pearson M. Marihuana extraction using a modified iso-2 apparatus. J Clan Lab Invest Chem Assoc 2000;10(1):27.
1019. Nolan SL, Bedford KR, Valentine MD. Making a hash of it. Proceedings of the International Association of Forensic Sciences 13th Triennial Meeting 1993;5:246.
1020. Sorokin VI, Orlova OS. The method of acetylated opium manufacturing. J Clan Lab Invest Chem Assoc 1996;6(1):14.
1021. Cooper DA. From the opium poppy field to heroin. Proceedings of the American Academy of Forensic Sciences 1999;5:3.
1022. Henderson BA, Comparin JH. Clandestine manufacture of hydriodic acid via iodine, red phosphorus, and hydrochloric acid. Microgram 1994;27:382.
1023. Skinner HF, Oulton SR. Identification and quantitation of hydriodic acid manufactured from iodine, red phosphorus, and water. J Clan Lab Invest Chem Assoc 1995;5(4):12.
1024. Skinner HF, Oulton SR. Identification and quantitation of hydriodic acid manufactured from iodine, red phosphorus, and water. Microgram 1995;29(11):349.
1025. Massetti J. Hypophosphorous acid use increases at California clandestine methamphetamine labs. J Clan Lab Invest Chem Assoc 1997;7(3):6.
1026. Oulton SR, Skinner HF. Identification of common inorganic acids encountered at clandestine laboratories. Microgram 1998;31(10):277.
1027. Oulton SR, Skinner HF. Identification of common inorganic acids encountered at clandestine laboratories. J Clan Lab Invest Chem Assoc 1998;8(4):17.
1028. Worley D, Schieferecke J, Baer J. GC/MS identification of iodine - Part one. Microgram 2001;34(5):110.
1029. Schieferecke J. GC/MS identification of iodine - Part two. Microgram 2001;34(5):112.
1030. Shanks KS. Clandestine extraction of lysergic acid amide (LSA) from morning glory seeds. J Clan Lab Invest Chem Assoc 2001;11(2):15.
Microgram Journal, Volume 1, Numbers 1-2 (January - June 2003) 133
Brought to you by AltGov2 [www.altgov2.org]
1031. Hugel J. The planned manufacture of LSD from the fungus Claviceps Paspali. J Clan Lab Invest Chem Assoc 1998;8(1):27.
1032. Cain P, Yip S. Notification of a new presentation of Cannabis seized in the United Kingdom. Microgram 1997;30(10):2.
1033. Huizer H. Netherweed, hemp cultivation in the Netherlands. Proceedings of the International Association of Forensic Sciences 13th Triennial Meeting 1993;5:250.
1034. Angelos SA, Raney JK. Clandestine manufacture of methadone. Proceedings of the International Association of Forensic Sciences 14th Triennial Meeting 1996;2:374.
1035. Ely RA. Methamphetamine labs, syntheses and safety: A 1-year retrospect. Proceedings of the International Association of Forensic Sciences 15th Triennial Meeting 1999:56.
1036. Fifka P. Pervitin (methamphetamine) production in Slovak Republic. J Clan Lab Invest Chem Assoc 1996;6(2):13.
1037. Popovich GL. Instant methamphetamine. J Clan Lab Invest Chem Assoc 1995;5(3):7.
1038. Popovich GL. A new reducing agent for ephedrine. Microgram 1995;28:79.
1039. Skinner HF. Methamphetamine synthesis via reductive alkylation hydrogenolysis of phenyl-2-propanone with N-benzylmethylamine. Forensic Sci Int 1993;60(1,2):155.
1040. Angelos SA, Raney JK. Lithium-ammonia reduction of pseudoephedrine to methamphetamine. Proceedings of the American Academy of Forensic Sciences 1998;4:35.
1041. Angelos SA, Raney JK. Sodium-ammonia reduction of ephedrine to methamphetamine. Proceedings of the American Academy of Forensic Sciences 1996;2:28.
1042. DeFrancesco JV, James KA, Kleekamp VA. The effect of reaction conditions on ring reduction in the clandestine laboratory Birch reduction of d-pseudoephedrine HCl to d-methamphetamine. Proceedings of the International Association of Forensic Sciences 15th Triennial Meeting 1999:63.
1043. Dal Cason TA. Perspectives on ‘Nazi Dope’ and the mythical ‘Nazi Patent’. J Clan Lab Invest Chem Assoc 1997;7(2):13.
1044. Dawson N. The sodium-ammonia 'Nazi' method of methamphetamine synthesis: An historical overview, methodology, and case reviews. J Clan Lab Invest Chem Assoc 1995;5(3):12.
1045. Chen L, Wu SM. A study of clandestine synthesizing methods of illicit methamphet-amine in Taiwan - The 2nd report. Proceedings of the American Academy of Forensic Sciences 1995;1:23.
1046. van Zyl EF. A survey of reported synthesis of methaqualone and some positional and structural isomers. Forensic Sci Int 2001;122(2-3):142.
1047. Sorokin VI, Drozdov MA. Synthesis of aminopropiophenon in Russia. J Clan Lab Invest Chem Assoc 2000;10(1):16.
1048. Poortman A. Unusual manufacturing of MDMA in the Netherlands. J Clan Lab Invest Chem Assoc 1998;8(1):25.
Microgram Journal, Volume 1, Numbers 1-2 (January - June 2003) 134
Brought to you by AltGov2 [www.altgov2.org]
1049. Pearson JR, Rowe JE. Explorations with ecstacy and amphetamine derivatives. J Clan Lab Invest Chem Assoc 1998;8(1):29.
1050. Conn C, Smith M, Dawson M. A study of the O-dealkylation reaction of codeine using pyridinium hydrochloride. Proceedings of the International Association of Forensic Sciences 15th Triennial Meeting 1999:62.
1051. Novakova E. Illicit drugs manufactured in Czech Republic. Analytical experiences. Proceedings of the International Association of Forensic Sciences 13th Triennial Meeting 1993;5:252.
1052. Haerer M, Kovar K. Designer-drugs of the phencyclidine series. Pharmazie in Unserer Zeit 1994;23(1):52.
1053. Allen AC, Robles J, Dovenski W, Calderon S. PCP: A review of synthetic methods for forensic clandestine investigation. Forensic Sci Int 1993;61(2,3):85.
1054. Lodge BA, Duhaime R, Zamecnik J, MacMurray P, Brousseau R. New street analogs of phencyclidine. Forensic Sci Int 1992;55(1):13.
1055. Poortman-van der Meer AJ. P-2-P and MDP-2-P converted to cyclic ketals: A new meaning to protective chemistry. J Clan Lab Invest Chem Assoc 2000;10(1):17.
1056. Hanel HF. Substitute bases for sodium acetate in the clandestine synthesis of phenyl-2-propanone (P2P). Microgram 1992;25:236.
1057. Stein D. Use of heliotrope oil as a precursor source for piperonal. J Clan Lab Invest Chem Assoc 1996;6(3):17.
1058. Maloney BJ. Case study: Clandestine laboratory; Kansas City, Missouri. J Clan Lab Invest Chem Assoc 1999;9(1):13.
1059. Clacher F, Clark K. Illicit steroid laboratories. Science and Justice: 1995 Annual General Meeting of the Forensic Science Society (summary). 1996;36(2):123.
1060. Cutler R. White phosphorus replacing red phosphorus in Idaho. J Clan Lab Invest Chem Assoc 1998;8(1):3.
1061. Mitchell WJ, Pearson JR, White MJ. Clandestine manufacture of tetrahydrocannabinol precursors. J Clan Lab Invest Chem Assoc 1999;9(2-3):29.
1062. Valentine MD. delta-9-Tetrahydrocannabinol acetate from acetylation of Cannabis oil. Science Justice 1996;36(3):195.
1063. King LA, Clarke K, Scott RJ. Unusual defense to charge of MDMA manufacture. J Clan Lab Invest Chem Assoc 1995;5(3):6.
1064. Moriwaki W. An unusual “designer drug” laboratory. Proceedings of the American Academy of Forensic Sciences 1995;1:22.
1065. Lazarus B. Clandestine laboratory contaminated properties: Assessment and remediation strategies. J Clan Lab Invest Chem Assoc 2000;10(2):21.
1066. Angelos SA, Bono JP. Production capabilities of clandestine methamphetamine laboratories. Proceedings of the American Academy of Forensic Sciences. 1999;5:43.
Microgram Journal, Volume 1, Numbers 1-2 (January - June 2003) 135
Brought to you by AltGov2 [www.altgov2.org]
1067. Counts JW. When is a confined space not a confined space? J Clan Lab Invest Chem Assoc 1997;7(1):19.
1068. Johnson LF. Confined spaces as training grounds. J Clan Lab Invest Chem Assoc 1997;7(2):4.
1069. Von Ruden D. Using ventilation blowers in confined spaces. J Clan Lab Invest Chem Assoc 1997;7(2):3.
1070. Lazarus B. OSHA amendments to the permit-required confined space standard. J Clan Lab Invest Chem Assoc 1999;9(2-3):14.
1071. Heagy JA. Decontamination of biohazardous evidence by autoclaving. Microgram 1992;25:238.
1072. Le SD, Taylor RW, Vidal D, Lovas JJ, Ting E. Occupational exposure to cocaine involving crime lab personnel. J Forensic Sci 1992;37(4):959.
1073. Lomonte JN. Determination of volumes in laboratory vessels. J Forensic Sci 1992;37(5):1380.
1074. Irvine GD, Chin L. The environmental impact and adverse health effects of the clandestine manufacture of methamphetamine. Substance Use & Misuse 1997;32(12/13):1811.
1075. Kummerlowe D. Field tested methods to render safe 5-gallon pressurized tanks of ammonia gas associated with clandestine drug labs. J Clan Lab Invest Chem Assoc 1997;7(2):14.
1076. Kummerlowe D. Initial considerations for handling 5-gallon pressurized tanks of ammonia gas associated with clandestine drug labs. J Clan Lab Invest Chem Assoc 1996;6(4):23.
1077. Anjaria MB. 'Cook' fails Chem 101; hydrogen sulfide fatality. J Clan Lab Invest Chem Assoc 1997;7(3):5.
1078. Lazarus B. The new revised OSHA respiratory protection standard. J Clan Lab Invest Chem Assoc 1998;8(4):13.
1079. Conibear SA. What NIOSH's new respirator certification regulation means for you. J Clan Lab Invest Chem Assoc 1997;7(1):21.
1080. Burgess JL. Phosphine exposure from a methamphetamine laboratory investigation. Clin Toxicol 2001;39(2):165.
1081. Willers-Russo LJ. Three fatalities involving phosphine gas, produced as a result of methamphetamine manufacturing. J Forensic Sci 1999;44(3):647.
1082. Willers-Russo LJ. Three fatalities involving phosphine gas produced as a result of methamphetamine manufacturing. Proceedings of the American Academy of Forensic Sciences 1998;4:37.
1083. Cameron M. A review of real-time monitoring instrumentation for the detection of phosphine gas. J Clan Lab Invest Chem Assoc 2001;11(3):18.
1084. White MJ. Safety training for clandestine laboratory investigators. Australian Criminal Intelligence Digest 1994:44.
1085. Boyd V. Dealing with heat stress; basic precautions can prevent workers in hot environments from becoming victims of serious heat-related illnesses. J Clan Lab Invest Chem Assoc
Microgram Journal, Volume 1, Numbers 1-2 (January - June 2003) 136
Brought to you by AltGov2 [www.altgov2.org]
1996;6(4):18.
1086. Hammer C. 22-Liter heating mantle manufacturer noticed. J Clan Lab Invest Chem Assoc 2000;10(3):5.
1087. Lazarus B. OSHA training requirements for clandestine laboratory enforcement teams. J Clan Lab Invest Chem Assoc 2000;10(1):19.
1088. White MJ. Clandestine drug laboratories: Impact and outcomes of state and national training initiatives. J Clan Lab Invest Chem Assoc 2000;10(4):11.
1089. White GM. An explosive drug case. J Forensic Sci 1992;37(2):652.
1090. Khadka S. Useful internet websites for safety and health professionals. Microgram 1998;31(3):90.
1091. Drolet G. Contraband detection program. Proc SPIE - Int Soc Opt Eng 1997;2937:162.
1092. McCready J, Su CW, Rigdon SW. U.S. Coast Guard: Overview of operational narcotic detection program. Proc SPIE - Int Soc Opt Eng 1997;2937:150.
1093. Fetterolf DD, Donnelly B, Lasswell LD. Portable instrumentation: New weapons in the war against drugs and terrorism. Proc SPIE-Int Soc Opt Eng 1994;2092:40.
1094. Moriwaki WM. Overview of trace evidence collection techniques. Proceedings of the American Academy of Forensic Sciences 1998;4:38.
1095. Fetterolf DD, Donnelly BD, Lasswell LD. Portable Instrumentation: New weapons in the war on drugs. Proceedings of the International Association of Forensic Sciences 13th Triennial Meeting 1993;5:232.
1096. Spradling ML, Hyatt R. Performance assessment of small-package-class non-intrusive inspection systems. Proc SPIE - Int Soc Opt Eng 1997;2936:166.
1097. Ulvick SJ, Cui J, Kunz TD, Hoglund DE, Pilon P, Lawrence AH, Drolet G, Su CW, Rigdon SW, Demirgian JC, Shier P. NDTA narcotics standard development. Proc SPIE - Int Soc Opt Eng 1997;2932:47.
1098. Hoglund DE, Lucero DP. Performance assessment of heroin and cocaine vapor particle detection systems. Proc SPIE - Int Soc Opt Eng 1994;2092:96.
1099. Hall JM, Morgan JF, Sale KE. Numerical modeling of nonintrusive inspection systems. Proc SPIE - Int Soc Opt Eng 1994;2092:342.
1100. Hoopengardner RL, Smith MC. Operational analysis for the drug detection problem. Proc SPIE - Int Soc Opt Eng 1994;2276:13.
1101. Morris LA, Smith DE, Khan SM. Determination of high-risk cargo. Proc SPIE - Int Soc Opt Eng 1994;2276:6.
1102. Holt PJ, Gray S, Bruce NC, Lowe CR. An amperometric opiate assay. Biosensors & Bioelectronics 1995;10:517.
1103. Bower EM. Biologically based detection systems: The time has come for use in contraband detection. Proc SPIE - Int Soc Opt Eng 1997;2937:174.
Microgram Journal, Volume 1, Numbers 1-2 (January - June 2003) 137
Brought to you by AltGov2 [www.altgov2.org]
1104. Shrivastava P, McLean CJ, Aberl F, Bonenberger J, Berg RP, Zimmermann R. Immunosensorbased drug detectors for Customs and other operations. Proc SPIE - Int Soc Opt Eng 1997;2937:183.
1105. Kusterbeck AW, Gauger PR, Charles PT. Portable flow immunosensor for detecting drugs and explosives. Proc SPIE - Int Soc Opt Eng 1997;2937:191.
1106. Hilpert R, Binder F, Grol M, Hallermayer K, Josel HP, Klein C, Maier J, Oberpriller H, Ritter J, Scheller FW. Biosensor technology for the detection of illegal drugs (I): Objectives, preparatory work, and drug enrichment. Proc SPIE-Int Soc Opt Eng 1994;2276:120.
1107. Hilpert R, Bauer C, Binder F, Grol M, Hallermayer K, Josel HP, Klein C, Maier J, Makower A, Oberpriller H, Ritter J. Biosensor technology for the detection of illegal drugs (II): Antibody development and detection techniques. Proc SPIE-Int Soc Opt Eng 1994;2276:128.
1108. Fetterolf DD. Antibody-based field test kits for drugs and explosives. Proceedings of the International Association of Forensic Sciences 13th Triennial Meeting 1993;5:296.
1109. Devine PJ, Anis NA, Wright J, Kim S, Eldefrawi AT, Eldefrawi ME. A fiber-optic cocaine biosensor. Anal Biochem 1995;227:216.
1110. Campanella L, Colapicchioni C, Tomassetti M, Bianco A, Dezzi S. A new ISFET device for cocaine analysis. Sens Actuators B 1995;B24(1-3):188.
1111. Rathbone DA, Holt PJ, Lowe CR, Bruce NC. The use of heroin esterase in the development of an illicit drugs biosensor. Ann NY Acad Sci 1996;799:85.
1112. Rathbone DA, Holt PJ, Bruce NC, Lowe CR. The use of recombinant DNA technology in the design of a highly specific heroin sensor. Ann NY Acad Sci 1995;782:534.
1113. Hoglund D. The reliance of calibration standards for narcotics detection devices. Proceedings, Contraband Trace Chemical Phenomenology Workshop 1992:295.
1114. Holland PM, Mustacich RV, Everson JF, Foreman W, Leone M, Sanders AH, Naumann WJ. Correlated column micro gas chromatography instrumentation for the detection of contraband drugs in cargo containers. Proc SPIE-Int Soc Opt Eng 1994;2276:79.
1115. Carnahan BL, Day S, Kouznetsov V, Tarassov A. Field ion spectrometry: A new technology for cocaine and heroin detection. Proc SPIE - Int Soc Opt Eng 1997;2937:106.
1116. Hussein EM, Gokhale P, Arendtsz NV, Lawrence AH. Inspection of cargo containers using gamma radiation. Proc SPIE - Int Soc Opt Eng 1997;2936:210.
1117. Trower WP, Saunders AW, Shvedunov VI. Carbon camera detection of vehicular-transported bulk narcotics. Proc SPIE - Int Soc Opt Eng 1997;2936:58.
1118. Kirby JA, Lindquist RP. Development of marijuana and tobacco detectors using potassium-40 gamma-ray emissions. Proc SPIE - Int Soc Opt Eng 1994;2276:374.
1119. Barshick SA, Griest WH, Vass AA. Electronic aroma detection technology for forensic and law enforcement applications. Proc SPIE - Int Soc Opt Eng 1997;2941:63.
1120. Chiappini MW, Wendel GJ, Duquette PH, Hamilton MJ, Chudzik SJ, Chappa RA. Fieldable, real-time enzyme immunoassay kits for drugs on surfaces. Proc SPIE - Int Soc Opt Eng 1994;2092:196.
Microgram Journal, Volume 1, Numbers 1-2 (January - June 2003) 138
Brought to you by AltGov2 [www.altgov2.org]
1121. Kusterbeck AW, Judd LL, Yu H, Myles J, Ligler FS. Flow immunosensor detection of explosives and drugs of abuse. Proc SPIE - Int Soc Opt Eng 1994;2092:218.
1122. Leginus JM. Portable sensors for drug and explosive detection. Proc SPIE - Int Soc Opt Eng 1994;2092:360.
1123. Aberl F, Bonenberger J, Berg RP, Zimmermann R, Sachs HW. Traces of illegal drugs on body surfaces: Indicator for consumption or dealing? Proc SPIE - Int Soc Opt Eng 1997;2932:16.
1124. Homstead J, Poziomek EJ. Contraband drug surface chemistry at nanogram levels. Proc SPIE -Int Soc Opt Eng 1997;2937:245.
1125. Brown PA. Field applications of ion-mobility spectrometry. Proc SPIE - Int Soc Opt Eng 1997;2937:154.
1126. Kim LH, Danylewich-May LL, Jadamec JR, Su CW, Rigdon SW, Norwood LJ, Hoglund DE. Cargo contraband screening. Proc SPIE - Int Soc Opt Eng 1994;2276:279.
1127. Ritchie RK, Kuja FJ, Jackson RA, Loveless AJ, Danylewich-May LL. Recent developments in ion mobility spectrometry detection technology. Proc SPIE - Int Soc Opt Eng 1994;2092:76.
1128. Ritchie RK, Thomson PC, Debono RF, Danylewich-May LL, Kim L. Detection of explosives, narcotics, and taggant vapors by an ion mobility spectrometry particle detector. Proc SPIE - Int Soc Opt Eng 1994;2092:87.
1129. Harnois J, Kovar J, Pilon P. Detection of cocaine and heroin using a custom built ion mobility spectrometer. Customs Lab Bull 1992;4(1):11.
1130. Fytche LM, Hupé M, Kovar JB, Pilon P. Ion mobility spectrometry of drugs of abuse in Customs scenarios: Concentration and temperature study. J Forensic Sci 1992;37(6):1550.
1131. Maberry JM, Dedeaux H. Forensic light source and ion mobility spectrometry search for controlled substances. Proceedings of the International Association of Forensic Sciences 15th Triennial Meeting 1999:67.
1132. Brown PA, Comparin JH. Application of the ionscan for the detection of methamphetamine and ephedrine in abandoned clandestine laboratories. NASA Conf Publ (Third International Workshop on Ion Mobility Spectrometry 1994) 1995;3301:245.
1133. DeTulleo A. Methamphetamine versus nicotine detection on the Barringer ion mobility spectrometer. Conf Proc 5th Int Workshop on Ion Mobility Spectrometry, 1996.
1134. Goubran RA, Lawrence AH. DSP techniques for narcotic detection using ion mobility spectrometry. IEEE Instrum Meas Technol Conf 1997;1:404.
1135. Brown PA. Field applications of ion mobility spectrometry. Proc SPIE-Int Soc Opt Eng 1997;2937 (Chemistry-:and Biology-Based Technologies for Contraband Detection):154.
1136. Sobotka AJ. The role of ion mobility spectrometry in the collection of traces of controlled substances by certified Special Agents. Proceedings of the American Academy of Forensic Sciences 1998;4:34.
1137. Orzechowska GE, Poziomek EJ, Tersol V. Use of solid phase microextraction (SPME) with ion mobility spectrometry. Anal Lett 1997;30(7):1437.
Microgram Journal, Volume 1, Numbers 1-2 (January - June 2003) 139
Brought to you by AltGov2 [www.altgov2.org]
1138. McGann WJ. New high-efficiency ion-trap mobility detection system for narcotics. Proc SPIE -Int Soc Opt Eng 1997;2937:78.
1139. McGann WJ, Bradley V, Borsody A, Lepine S. New, high efficiency ion trap mobility detection system for narcotics and explosives. Proc SPIE - Int Soc Opt Eng 1994;2276:424.
1140. McGann WJ, Jenkins A, Ribiero K, Napoli J. New high-efficiency ion trap mobility detection system for narcotics and explosives. Proc SPIE - Int Soc Opt Eng 1994;2092:64.
1141. Clemmer RG, Kelly JF, Martin SW, Mong GM, Sharpe SW. Laser-based detection of chemical contraband. Proc SPIE - Int Soc Opt Eng 1997;2937:46.
1142. Bendahan J, Gozani T. Mobile TNA system to detect explosives and drugs concealed in cars and trucks. Proc SPIE - Int Soc Opt Eng 1998;3575:363.
1143. Brown DR, Gozani T. Thermal neutron analysis technology. Proc SPIE - Int Soc Opt Eng 1997;2936:85.
1144. Turner TO, Su CW, Kaplan CR, Rigdon SW. Portable narcotics detector and the results obtained in field tests. Proc SPIE - Int Soc Opt Eng 1997;2936:95.
1145. Gozani T. Neutron-based nonintrusive inspection techniques. Proc SPIE - Int Soc Opt Eng 1997;2867:174.
1146. Rhodes EA, Dickerman CE, Frey M. Advances in associated-particle neutron probe diagnostics for substance detection. Proc SPIE - Int Soc Opt Eng 1995;2511:2.
1147. Miller TG, Krauss RA. Substance identification using neutron transmission. Proc SPIE - Int Soc Opt Eng 1995;2511:14.
1148. Micklich BJ, Fink CL, Sagalovsky L. Transport simulation and image reconstruction for fast-neutron detection of explosives and narcotics. Proc SPIE - Int Soc Opt Eng 1995;2511:33.
1149. Miller TG. Drug and tobacco detection using neutron transmission/attenuation. Proc SPIE - Int Soc Opt Eng 1994;2276:200.
1150. Turner TO, Pierce RM, Dotson KC, Jadamec JR, Su CW. Portable narcotics detector with identification capability. Proc SPIE - Int Soc Opt Eng 1994;2276:255.
1151. Khan SM. Comparison of neutron-based technologies for the detection of contraband. Proc SPIE - Int Soc Opt Eng 1994;2092:548.
1152. Turner TO, Su CW, Baritelle J, Rhoton B. Three-dimensional container and cargo inspection system. Proc SPIE - Int Soc Opt Eng 1997;2936:48.
1153. Fink CL, Micklich BJ, Yule TJ, Humm P, Sagalovsky L, Martin MM. Evaluation of neutron techniques for illicit substance detection. Nucl Instrum Methods Phys Res Sect B 1995;99(1-4):748.
1154. Womble PC, Schultz FJ, Vourvopoulos G. Nondestructive characterization using pulsed fast-thermal neutrons. Nucl Instrum Methods Phys Res Sect B 1995;99(1-4):757.
1155. Brown DR, Gozani T, Loveman R, Bendahan J, Ryge P, Stevenson J, Liu F, Sivakumar M. Application of pulsed fast neutrons analysis to cargo inspection. Nucl Instrum Methods Phys Res Sect A 1994;353:684.
Microgram Journal, Volume 1, Numbers 1-2 (January - June 2003) 140
Brought to you by AltGov2 [www.altgov2.org]
1156. Brown DR, Coates A, Kuo SN, Loveman R, Pentaleri E, Rynes JC. Cargo inspection system based on pulsed fast neutron analysis. Proc SPIE - Int Soc Opt Eng 1997;2936:76.
1157. Brown DR. Cargo inspection system based on pulsed fast neutron analysis. Proc SPIE - Int Soc Opt Eng 1994;2092:254.
1158. Rayner TJ, West R, Garroway AN, Lyndquist R, Yesinowski JP. Quadrupole resonance spectroscopic study of narcotic materials. Proc SPIE - Int Soc Opt Eng 1997;2937:35.
1159. Rayner TJ, Thorson BD, Beevor S, West R, Krauss RA. Explosives detection with quadrupole resonance analysis. Proc SPIE - Int Soc Opt Eng 1997;2936:22.
1160. Shaw JD, Moeller CR, Magnuson EE, Sheldon AG. Quadrupole resonance scanner for narcotics detection. Proc SPIE - Int Soc Opt Eng 1994;2276:150.
1161. Garroway AN, Buess ML, Yesinowski JP, Miller JB. Narcotics and explosives detection by 14N pure nuclear quadrupole resonance. Proc SPIE - Int Soc Opt Eng 1994;2092:318.
1162. Su CW, Rigdon SW, Ricard S, Hoglund DE, Drolet G, Neudorfl P, Hupe M, Kunz TD, Ulvick SJ, Demirgian JC, Shier P, Wingo J. Cocaine phenomenology study: Results of a third in a series of field trials. Proc SPIE - Int Soc Opt Eng 1997;2932:4.
1163. Jadamec JR, Su CW, Rigdon SW, Norwood LJ, Kaplan CR. Confidence in the detection of cocaine particulates. Proc SPIE - Int Soc Opt Eng 1994;2276:24.
1164. Davies JP, Hallowell SF, Hoglund DE. Particle generators for the calibration and testing of narcotic and explosive vapor/particle detection systems. Proc SPIE - Int Soc Opt Eng 1994;2092:137.
1165. Kuhlman MR, Gooding RE, Kogan VG, Bridges C. Particle size distribution of cocaine hydrochloride. Proc SPIE - Int Soc Opt Eng 1997;2937:251.
1166. Holt P-J. Particle size analysis of six illicit heroin preparations seized in the UK. Forensic Sci Int 1996;81(1):17.
1167. Patrick JC, Orzechowska, GE, Poziomek EJ. Use of methylene blue as a simulant for the physical properties of cocaine HCl and heroin HCl. Proc SPIE - Int Soc Opt Eng 1997;2937:258.
1168. Pilon P, Hupé M, Chauhan M, Lawrence A. Development of test material for narcotics detection equipment: Sand/drug mixtures. J Forensic Sci 1996;4(3):371.
1169. Komorsky-Lovri E, Gali I, Penovski R. Voltametric determination of cocaine microparticles. Electroanalysis 1999;11(2):120.
1170. Rayner TJ, Magnuson EE, West R, Lyndquist R. Narcotics detection using piezoelectric ringing. Proc SPIE - Int Soc Opt Eng 1997;2936:31.
1171. Matejczyk RJ. Clandestine laboratory scene investigation and processing using portable GC/MS. Proc SPIE - Int Soc Opt Eng 1997;2941:140.
1172. Matejczyk RJ, Dempsey P. Clandestine laboratory investigation using portable GC/MS. Proceedings of the American Academy of Forensic Sciences 1996;2:17.
Microgram Journal, Volume 1, Numbers 1-2 (January - June 2003) 141
Brought to you by AltGov2 [www.altgov2.org]
1173. Smith WE, White PC, Lacey RJ. Surface enhanced resonance Raman scattering: A sensitive and selective technique for contraband detection. Proc SPIE - Int Soc Opt Eng 1997;2937:66.
1174. Lacey RJ, Hayward IP, Sands HS, Batchelder DN. Characterization and identification of contraband using UV-resonant Raman spectroscopy. Proc SPIE - Int Soc Opt Eng 1997;2937:100.
1175. Lacey RJ. Some advances in the use of Raman spectroscopy in security screening applications. IEE Conf Publ 1997;437:10.
1176. Whitley A, Barnett S. Advances and useful applications of Raman spectroscopy, imaging, and remote sensing. Proc SPIE-Int Soc Opt Eng 1998;3261:250.
1177. Ryder AG, O’Connor GM, Glynn TJ. Near-IR Raman spectroscopy as a tool for the identification of illegal drugs in solid mixtures. Proceedings of the European Union Symposium Fighting Crime Through Technology, London, UK:1998.
1178. Batchelder DN, Cheng C, Hayward IP, Lacey RJ, Pitt GD, Sheldon TG. Raman microscopy and direct 2-D imaging of explosives and drugs. Contraband and Cargo Inspection Technology International Symposium, Washington, DC:1992.
1179. Burnett LJ, Magnuson EE, Sheldon AG, Kumar S. Screening technologies for detection of swallowed packages of narcotics. Proc SPIE - Int Soc Opt Eng 1997;2932:98.
1180. Bogusz M, Althoff H, Erkens M, Maier R, Hofmann R. Internally concealed cocaine: Analytical and diagnostic aspects. J Forensic Sci 1995;40(5):811.
1181. Smith GJ. Detection of contraband concealed on the body using x-ray imaging. Proc SPIE - Int Soc Opt Eng 1997;2932:115.
1182. Smith SW. SECURE personnel screening system: Field trials and new developments. Proc SPIE - Int Soc Opt Eng 1997;2932:121.
1183. Roberts J, Rochefort J. Strategies for the detection of drugs within the Correctional Service Canada: Research and development initiatives. Proc SPIE - Int Soc Opt Eng 1997;2937:138.
1184. Hallowell SF. Screening people for illicit substances: A survey of current portal technology. Talanta 2001;54(3):447.
1185. Wendel GJ, Jadamec JR, Su C-W. Recent developments in the SENTOR drug detection system. Proc SPIE-Int Soc Opt Eng 1994;2276:98.
1186. Grimaldi V, Politano JL. Illicit material detector based on gas sensors and neural networks. Proc SPIE - Int Soc Opt Eng 1997;2937:90.
1187. Nacson S, Walker H, Chang A, Siu T, McNelles L, Uffe M. Portable instrument for detection of illicit drugs. Proc SPIE - Int Soc Opt Eng 1997;2937:120.
1188. Staples EJ, Watson GW, McGuirre DS, Williams D. SAW/GC detection of taggants and other volatile compounds associated with contraband materials. Proc SPIE - Int Soc Opt Eng 1997;2937:57.
1189. Watson G, Horton W, Staples E. Portable detection system for illicit materials based on SAW resonators. Proc - IEEE Ultrason Symp 1992;1:269.
Microgram Journal, Volume 1, Numbers 1-2 (January - June 2003) 142
Brought to you by AltGov2 [www.altgov2.org]
1190. Wilson R, Brittain AH. Study to investigate the trace levels of contamination on surfaces when narcotic contraband is concealed in a vehicle. Proc SPIE - Int Soc Opt Eng 1997;2932:27.
1191. Patrick JC, Poziomek EJ. Advancement of contraband drug detection through improved surface-sampling procedures. Proc SPIE - Int Soc Opt Eng 1997;2937:130.
1192. Stott WR, Davidson WR, Sleeman R. High-throughput real-time chemical contraband detection. Proc SPIE - Int Soc Opt Eng 1994;2092:53.
1193. Davidson WR, Stott WR, Sleeman R, Akery AK. Synergy or dichotomy: Vapor and particle sampling in the detection of contraband. Proc SPIE - Int Soc Opt Eng 1994;2092:108.
1194. Carlson RM, Bunney L, Williams DN. Hazardous chemicals detection experiment. Proc SPIE -Int Soc Opt Eng 1994;2092:244.
1195. Johnson AJ, Volberding RW, Reiter RF. ARPA nonintrusive (cargo) inspection technology testbed. Proc SPIE - Int Soc Opt Eng 1994;2276:192.
1196. Bryden WA, Benson RC, Ecelberger SA, Phillips TE, Cornish T, Cotter RJ. Tiny TOF-MALDI mass spectrometry for particulate drug and explosives detection. Proc SPIE - Int Soc Opt Eng 1995;2511:153.
1197. Dejarme LE, Lawhon SJ, Ray P, Kuhlman MR. Analysis of volatile organic compounds in seized cocaine hydrochloride. Proc SPIE - Int Soc Opt Eng 1997;2937:2.
1198. Brown ST, Bothe C, Landstrom D. Trace chemical vapors in illicit cocaine production and shipping. Proc SPIE - Int Soc Opt Eng 1994;2276:340.
1199. Robins WH, Wright BW. Analysis of volatile organic compounds from illicit cocaine samples. Proc SPIE - Int Soc Opt Eng 1994;2276:352.
1200. Orzechowska GE, Poziomek EJ, Tersol V, Homstead J. Evaluation of solid-phase microextraction in detection of contraband drug vapors. Proc SPIE - Int Soc Opt Eng 1997;2937:8.
1201. Dindal AB, Buchanan MV, Jenkins RA, Bayne CK. Determination of cocaine and heroin vapor pressures using commercial and illicit samples. Analyst 2000;125(8):1393.
1202. Neudorfl P, Hupe M, Pilon P, Lawrence AH, Drolet G, Su CW, Rigdon SW, Kunz TD, Ulwick S, Hoglund DE, Wingo J, Demirgian JC, Shier P. Detection of cocaine in cargo containers by high-volume vapor sampling: Field test at Port of Miami. Proc SPIE - Int Soc Opt Eng 1997;2937:26.
1203. Dejarme LE, Goodling RE, Lawhon SJ, Ray P, Kuhlman MR. Formation of methyl benzoate from cocaine hydrochloride under different temperatures and humidities. Proc SPIE - Int Soc Opt Eng 1997;2937:19.
1204. Khan SM, Smith DE, Hoglund DE. Assessment of x-ray technology for narcotics detection. Proc SPIE - Int Soc Opt Eng 1994;2276:156.
1205. Khan SM, Smith DE. U.S. Customs Service imaging requirements for x-ray scanners. Proc SPIE - Int Soc Opt Eng 1994;2092:437.
1206. McGregor A. Global amphetamine abuse causes concern. Lancet 1996;348(9041):1579.
Microgram Journal, Volume 1, Numbers 1-2 (January - June 2003) 143
Brought to you by AltGov2 [www.altgov2.org]
1207. United Nations International Drug Control Programme (Analysis and Statistics Section). Monograph: Amphetamine-Type Stimulants: A Global Review - 1996. New York, NY:1996.
1208. United Nations International Drug Control Programme (Scientific Section). Monograph: Psychotropic Substances of the Amphetamine Type Used by Drug Addicts in Bulgaria Synthesis and Medicinal Forms; Analytical Methods of Identification - 1994. New York, NY:1994.
1209. Fucci N, De Giovanni N. Adulterants encountered in the illicit cocaine market. Forensic Sci Int 1998;95(3):247.
1210. Barrio G, Saavedra P, de la Fuente L, Royuela L and the Spanish Group for the Study of the Purity of Seized Drugs. Purity of cocaine seized in Spain 1985-1993: Variations by weight, province, and year of seizure. Forensic Sci Int 1997;85(1):15.
1211. Pakulniewicz KJ, Matkovich CE. Intralaboratory precision of cocaine analysis by capillary gas chromatography. Microgram 1993;26:71.
1212. Fortuna JJ. Statistical analysis of cocaine head-space vapors. Proc SPIE - Int Soc Opt Eng 1994;2092:120.
1213. Henderson G L. Designer drugs. Anal Toxicol Clin Forensic Pharm Chem 1997:685.
1214. King LA. Designer drugs related to amphetamine (1990-1996). J Clan Lab Invest Chem Assoc 1996;6(3):15.
1215. Lodge BA. Canadian designer drugs. Science and Justice: 1995 Annual General Meeting of the Forensic Science Society (summary). 1996;36(2):123.
1216. King LA. New synthetic drugs in the European Union. Science Justice 2001;41(3):200.
1217. King LA, Poortman-van der Meer AJ. New synthetic drugs in the European Union. J Clan Lab Invest Chem Assoc 1998;8(3):13.
1218. Morselli O, Bovolenta A, Ripani L, Santoro M, Coletta C, Ciotola G, Bosio L, Garofano L. Designed [sic] drugs in Italy. Microgram 1999;32(2):51.
1219. United Nations International Drug Control Programme (Analysis and Statistics Section). Monograph: Global Illicit Drug Trends - 2000. New York, NY:2000.
1220. United Nations International Drug Control Programme (Analysis and Statistics Section). Monograph: Global Illicit Drug Trends - 1999. New York, NY:1999.
1221. Lasik A, Antal A, Paczi I. Substances to abuse in the households in Hungary. Proceedings of the International Association of Forensic Sciences 13th Triennial Meeting 1993;5:286.
1222. O’Connell D, Heffron JJA. Rapid analysis of illicit drugs by mass spectrometry: Results from seizures in Ireland. Analyst 1999;125(1):119.
1223. Cole RK. Drug usage in San Diego County 1990-1997. J Forensic Sci 1998;43(5):1101.
1224. King LA. Drug content of powders and other illicit preparations in the UK. Forensic Sci Int 1997;85:135.
Microgram Journal, Volume 1, Numbers 1-2 (January - June 2003) 144
Brought to you by AltGov2 [www.altgov2.org]
1225. King LA. Estimating the proportion of UK drug consumption which is imported on the basis of Customs and Police seizures for particular drugs. Forensic Sci Int 1995;76(3):217.
1226. Kaa E. Drug abuse in Western Denmark during the eighties. I. Drugs of abuse. Forensic Sci Int 1992;55(1):67.
1227. Franzosa ES. Rohypnol Tablets Manufactured Worldwide. Microgram 1996;29(9):242.
1228. Dawson M, Tosi B, Maher L, Swift W. Physical and chemical analysis of street-level heroin seizures. Proceedings of the International Association of Forensic Sciences 15th Triennial Meeting 1999:68.
1229. Kaa E. Impurities, adulterants, and diluents of illicit heroin. Changes during a 12 year period. Forensic Sci Int 1994;64(2,3):171.
1230. Chaudron-Thozet H, Girard J, David JJ. Analysis of heroin seized in France. United Nations International Drug Control Programme Vienna. Bull Narc 1992;44(1):29.
1231. Levy R, Ravreby M, Meirovich L, Shapira-Heiman O. A survey and comparison of heroin seizures in Israel during 1992 by Fourier transform infrared spectrometry. J Forensic Sci 1996;41(1):6.
1232. Klemenc S. Noscapine as an adulterant in illicit heroin samples. Forensic Sci Int 2000;108(1):45.
1233. De La Fuente L, Saavedra P, Barrio G, Royuela L, Vicente J. Spanish group for the study of the purity of seized drugs: Temporal and geographic variations in the characteristics of heroin seized in Spain and their relation with the route of administration. Drug Alcohol Depend 1996;40:185.
1234. Dominguez E, Infante F, Luna A, Trujillo D. Los adulterantes y contaminantes de la heroina de venta callejera en la Communidad Autonoma Andaluza. ed. Sevilla: Junta de Andalucia, 1993.
1235. O’Neil PJ, Pitts JE. Illicitly imported heroin products (1984 to 1989); some physical and chemical features indicative of their origin. J Pharm Pharmacol 1992;44:1.
1236. Anonymous. Domestic monitor program: A partial report on retail level heroin purchases from calendar year 1992, including source areas, cost, purity, and composition. Microgram 1993;26:197
1237. Coomber R. The cutting of heroin in the United States in the 1990's. J Drug Issues 1999;29(1):17.
1238. Furst RT. The re-engineering of heroin: An emerging heroin “cutting” trend in New York City. Addiction Research 2000;8(4):357.
1239. Franzosa ES. Current LSD blotter paper designs. Microgram 1997;30(8):182.
1240. Neuninger H, Saukel J, Witzmann J. The tetrahydrocannabinol (THC) content of Cannabis plants cultivated in Austria. Influence of harvest time and weather. Sci Pharm 1992;60:105.
1241. Mignoni G. Cannabis as a licit crop: Recent developments in Europe. Bull Narc 1997/1998;(49(1,2)/50(1,2)):23.
1242. Stefanidou M, Dona A, Athanaselis S, Papoutsis I, Koutselinis A. The cannabinoid content of marihuana samples seized in Greece and its forensic application. Forensic Sci Int
Microgram Journal, Volume 1, Numbers 1-2 (January - June 2003) 145
Brought to you by AltGov2 [www.altgov2.org]
1998;95(2):153.
1243. Stefanidou M, Athanaselis S, Alevisopoulos G, Papoutsis J, Koutselinis A. Delta-(9)-tetrahydrocannabinol content in cannabis plants of Greek origin. Chem Pharm Bull 2000;48(5):743.
1244. Poulsen HA, Sutherland GJ. The potency of cannabis in New Zealand from 1976 to 1996. Science Justice 2000;40(3):171.
1245. Buchanan BE, O’Connell D. Survey on cannibis resin and cannibis in unsmoked handrolled cigarettes seized in the Republic of Ireland. Science Justice 1998;38(4):221.
1246. Bone C, Waldron SJ. New trends in illicit cannabis cultivation in the United Kingdom of Great Britain and Northern Ireland. Bull Narc 1997/1998;(49(1,2)/50(1,2)):117.
1247. ElSohly MA, Ross SA, Mehmedic Z, Arafat R, Yi B, Banahan BF. Potency trends of )9-THC and other cannabinoids in confiscated marijuana from 1980-1997. J Forensic Sci 2000;45(1):24.
1248. UNDCP Research Section. Cannabis as an illicit crop: A review of the global situation of cannabis consumption, trafficking, and production. Bull Narc 1997/1998;(49(1,2)/50(1,2)):45.
1249. Szendrai K. Cannabis as an illicit crop: Recent developments in cultivation and product quality. Bull Narc 1997/1998;(49(1,2)/50(1,2)):1.
1250. Senac S, Dominguez A, Pujol EP. MDMA, MDA, MDEA, NEXUS, and MBDB tablets seen in southwestern Spain. Microgram 2000;33(12):340.
1251. Sanchez-Sennac C, Perez-Sirvent C, Perez-Carceles D, Osuna E, Sanchez-Quiles C, Luna A. Active compounds and adulterants in street illicit samples of designer drugs from the southwest of Spain. Proceedings of the International Association of Forensic Sciences 15th Triennial Meeting 1999:65.
1252. Franzosa ES. MDMA, MDEA & MBDB tablets seen in the US. Microgram 2001;34(4):80.
1253. Franzosa ES. MDMA, MDEA, and MBDB tablets seen in the US. Microgram 2000;33(6):121.
1254. Franzosa ES. MDMA, MDEA & MBDB tablets seen in the US. Microgram 1999;32(6):190.
1255. Franzosa ES. MDMA, MDEA & MBDB tablets seen in the US. Microgram 1996;29(11):285.
1256. Richer K. Statistical data on drug strengths for heroin, cocaine, and cannabis from British Columbia. Proceedings of the American Academy of Forensic Sciences 2000;6:51.
1257. Guéniat O, Esseiva P, Ribaux O. The systematical profiling of heroin and cocaine seizures in a Swiss town: The elicitation, interpretation of links and the development of a computerized system to improve the investigation. Presentation - 1st European Meeting of Forensic Science; Lausanne, Switzerland; 1997.
1258. United Nations International Drug Control Programme. Monograph: World Drug Report - 2000. Northamptonshire, United Kingdom:2000.
1259. United Nations International Drug Control Programme (International Narcotics Control Board). Monograph: List of Narcotic Drugs under International Control (INCB “Yellow List”) - 1999. New York, NY:1999.
Microgram Journal, Volume 1, Numbers 1-2 (January - June 2003) 146
Brought to you by AltGov2 [www.altgov2.org]
1260. United Nations International Drug Control Programme (International Narcotics Control Board). Monograph: List of Narcotic Drugs under International Control (INCB “Green List”) - 1999. New York, NY:1999.
1261. United Nations International Drug Control Programme (International Narcotics Control Board). Monograph: List of Precursors and Chemicals Frequently Used in the Illicit Manufacture of Narcotic Drugs and Psychotropic Substances under International Control (INCB “Red List”) 1999. New York, NY:1999.
1262. United Nations International Drug Control Programme (International Narcotics Control Board). Monograph: Report of the International Narcotics Control Board - 1999. New York, NY:1999.
1263. United Nations International Drug Control Programme (Treaty and Legal Affairs). Monograph: Manufacture of Narcotic Drugs, Psychotropic Substances, and their Precursors - 1999. New York, NY:1999.
1264. United Nations International Drug Control Programme (International Narcotics Control Board). Monograph: International Narcotics Control Board: Narcotic Drugs Estimated World Requirements - 1999. New York, NY:1999.
1265. United Nations International Drug Control Programme (International Narcotics Control Board). Monograph: International Narcotics Control Board: Precursors and Chemicals Frequently Used in the Illicit Manufacture of Narcotic Drugs and Psychotropic Substances - 1999. New York, NY:1999.
1266. United Nations International Drug Control Programme (International Narcotics Control Board). Monograph: International Narcotics Control Board: Psychotropic Substances - Statistics - 1999. New York, NY:1999.
1267. United Nations International Drug Control Programme. Monograph: Terminology and Information on Drugs - 1999. New York, NY:1999.
1268. United Nations International Drug Control Programme. Monograph: UNDCP World Drug Report - 1997. Northamptonshire, United Kingdom:1997.
1269. United Nations International Drug Control Programme (Analysis and Statistics Section). Monograph: Supply of and Trafficking in Narcotic Drugs and Psychotropic Substances - 1996. New York, NY:1996.
1270. Elwood WN. TCADA research brief: Fry: A study of adolescents’ use of embalming fluid with marijuana and tobacco. J Clan Lab Invest Chem Assoc 1998;8(3):17.
1271. Peterson JL, Markham PN. Crime laboratory proficiency testing results 1978-1991 I: Identification and classification of physical evidence. J Forensic Sci 1995;40(6):994.
1272. Churchill KT. Angel trumpet. Microgram 1995;28:250.
1273. Goldberg G. United States legislative controls and their effect on the revival of amphetamine. Proceedings of the International Association of Forensic Sciences 15th Triennial Meeting 1999:57.
1274. Adelaars A. Freedom of religion versus the psychotropic substance treaty: Notes on the Ayahuasca court case in Holland. J Clan Lab Invest Chem Assoc 2001;11(2):3.
Microgram Journal, Volume 1, Numbers 1-2 (January - June 2003) 147
Brought to you by AltGov2 [www.altgov2.org]
1275. Adelaars A. Court case in Holland against the use of ayahuasca by the Dutch Santo Daime Church. J Clan Lab Invest Chem Assoc 2001;11(3):12.
1276. Saleh GA. Charge-transfer complexes of barbiturates and phenytoin. Talanta 1998;46(1):111.
1277. Vu D-T. On the use of activated charcoal to circumvent canine detection of concealed narcotics Part I. Microgram 2000;33(4):68.
1278. Furton KG, Hsu YA, Luo T, Lopez F, Rose S. Diffusion studies and SPME/GC/MS/MS analysis of volatile drug components and the relevance to detector dog alerts to suspected drug money. Proceedings of the American Academy of Forensic Sciences 1998;4:35.
1279. Hallowell SF, Davies JP, Gresham GL. Qualitative/semiquantitative chemical characterization of the Auburn olfactometer. Proc SPIE - Int Soc Opt Eng 1994;2276:437.
1280. Furton KG, Hsu YL, Luo T, Nayiby A, Lagos P. U.S. currency cocaine speciation and threshold levels of cocaine odor detection by K-9, man, and machines. Proceedings of the American Academy of Forensic Sciences 1997;3:21.
1281. Furton KG, Hong YC, Hsu YL, Rose S. Drug money and detection dogs - What are they really smelling and what does it mean? Proceedings of the American Academy of Forensic Sciences 1996;2:18.
1282. Furton KG, Hsu Y-L, Luo T, Wang J, Rose S. Odor signature of cocaine analyzed by GC/MS and threshold levels of detection for drug detection canines. Proceedings of the International Association of Forensic Sciences 14th Triennial Meeting 1996;2:328.
1283. Walton J, Hsu Y-L, Lopez C, Almirall JR, Rose S, Lothridge K, Furton KG. Development of a scientific protocol to evaluate and certify the sensitivity and reliability of chemical(s) odor detection by canines. Proceedings of the American Academy of Forensic Sciences 2000;6:22.
1284. Waggoner LP, Johnston JM, Williams M, Jackson J, Jones M, Boussom T, Petrousky JA. Canine olfactory sensitivity to cocaine hydrochloride and methyl benzoate. Proc SPIE - Int Soc Opt Eng 1997;2937:216.
1285. Ciolino LA, Turner JA, Fraser DB. Traditional Chinese medicines: The analytical chemist’s challenge or nightmare? Proceedings of the American Academy of Forensic Sciences 1998;4:32.
1286. Fraser DB. Chinese herbal medicines - manufacturing flaws and misuse. Forensic Sci Rev 1998;10(2):67.
1287. Liu HT, Wang KT, Zhang HY, Chen XG, Hu ZD. Electrophoretic behavior study and determination of some active components in Chinese medicial preparations by capillary electrophoresis. Analyst 2000;125(6):1083.
1288. Liu SY, Woo SO, Koh HL. HPLC and GC-MS screening of Chinese proprietary medicines for undeclared therapeutic substances. J Pharm Biomed Anal 2001;24(5-6):983.
1289. Lai SJ, Binder SR, Essien H, Wen KC. Identification of western medicines as adulterants in Chinese herbal medicines using a broad spectrum drug screening HPLC system. J Liq Chromatogr 1995;18:2861.
1290. Ku YR, Tsai MJ, Wen KC. Screening chemical drugs used to adulterate in rheumatic and analgesic traditional Chinese medicine by HPLC-DAD. J Food Drug Anal 1995;3:51.
Microgram Journal, Volume 1, Numbers 1-2 (January - June 2003) 148
Brought to you by AltGov2 [www.altgov2.org]
1291. Ku YR, Tsai MJ, Wen KC. Study on adulterated chemical drugs in rheumatic and analgesic traditional Chinese medicine by MEKC. J Food Drug Anal 1995;3:185.
1292. Ku YR, Tsai MJ, Lin JH, Wen KC. Micellar electrokinetic capillary chromatography of clobenzorex HCl and diazepam adulterated in anorexiant traditional Chinese medicine. Chinese Pharm J 1996;48:157.
1293. Ku YR, Tsai MJ, Wen KC. Determination by high performance liquid chromatography of fluoxymesterone, methyltestosterone and testosterone in adulterated Chinese herbal preparations. J Food Drug Anal 1997;5:121.
1294. Johnson EL. Alkaloid content in Erythroxylum Coca tissue during reproductive development. Phytochemistry 1996;42(1):35.
1295. Casale JF, Lewin AH, Bowen JP. The base-catalyzed C-2 exchange and epimerization of 3-beta substituted 8-methyl-8-azabicyclo[3.2.1]octane-2-carboxylates. I. J Org Chem 1992;57(18):4906.
1296. Johnson EL, Foy CD. Biomass accumulation and alkaloid content in leaves of Erythroxylum Coca and Erythroxylum Novogranatense Var Novogranatense grown in soil with varying pH. J Plant Physiol 1996;149:444.
1297. Morris TA, Michiels AS. Effects of cyanoacrylate processing on cocaine HCl trace analysis. Microgram 2000;33(5):97.
1298. Ziegler T, Eikenberg O, Bilitewski U, Grol M. Gas phase detection of cocaine by means of immunoanalysis. Analyst 1996;121(2):119.
1299. McBay AJ. Cocaine sentencing. J Forensic Sci 1996;41(1):3 (published response appears: Heagy JA. J Forensic Sci 1996;41(6):1086).
1300. Brachet A, Christen P, Gauvrit JY, Longeray R, Lanteri P, Veuthey JL. Experimental design in supercritical fluid extraction of cocaine from coca leaf. J Biochem Biophys Methods 2000;43:353.
1301. O'Donnell JF, Paulson JD. Solubility of cocaine free base and cocaine hydrochloride in gasoline. Microgram 1998;31(2):67.
1302. Casale JF, Meyers RP. The stability of cocaine in Agua Rica/Agua Madre. Microgram 1996;29(7):175.
1303. Sleeman R, Burton R, Carter J, Roberts D, Hulmston P. Drugs on money. Analytical Chemistry 2000;72(11):397A.
1304. Furton KG, Hsu YL, Luo TY, Norelus A, Rose S. Field and laboratory comparison of the sensitivity and reliability of cocaine detection on currency using chemical sensors, humans, K-9's, and SPME/GC/MS/MS analysis. Proc SPIE - Int Soc Opt Eng 1999;3576:41.
1305. Oyler J, Darwin WD, Cone EJ. Cocaine contamination of United States paper currency. J Anal Toxicol 1996;20:213.
1306. Negrusz A, Perry JL, Moore CM. Detection of cocaine on various denominations of United States currency. J Forensic Sci 1998;43(3):626.
Microgram Journal, Volume 1, Numbers 1-2 (January - June 2003) 149
Brought to you by AltGov2 [www.altgov2.org]
1307. Jourdan TH, Wang D. Cocaine contamination of U.S. currency. Proceedings of the American Academy of Forensic Sciences 1997;3:20.
1308. Jenkins AJ. Drug contamination of US paper currency. Forensic Sci Int 2001;121(3):189.
1309. Roberts DJ, Carter JF, Sleeman R, Burton IFA. Application of tandem mass spectrometry to the detection of drugs on cash. Spectrosc Europe 1997;9(6):24.
1310. Bennett G, Sleeman R, Davidson WR, Stott WR. Airport trial of a system for the mass screening of baggage or cargo. Proc SPIE - Int Soc Opt Eng 1994;2276:363.
1311. Bennett G, Sleeman R. Hot money. Proc SPIE - Int Soc Opt Eng 1994;2276:383.
1312. Sleeman R, Burton IFA, Carter JF, Roberts DJ. Rapid screening of banknotes for the presence of controlled substances by thermal desorption atmospheric pressure chemical ionization mass spectrometry. Analyst 1999:124(2):103.
1313. Monte AP, Maronalewicka D, Parker MA, Wainscott DB, Nelson DL, Nichols DE. Dihydrobenzofuran analogues of hallucinogens. 3. Models of 4-substituted (2,5-dimethoxyphenyl)alkylamine derivatives with rigidified methoxy groups. J Med Chem 1996;39(15):2953.
1314. Micovic IV, Roglic GM, Ivanovic MD, Dosenmicovic L, Kiricojevic VD, Popovic JB. The synthesis of lactam analogues of fentanyl. J Chem Soc - Perkin Trans 1996;1(16):2041.
1315. Robak DR. Identification of clandestinely produced methylenedioxyisoquinolines. Microgram 1995;28:46.
1316. Parker MA, Marona Lewicka D, Kurrasch D, Shulgin AT, Nichols DE. Synthesis and pharmacological evaluation of ring-methylated derivatives of 3,4-(methylenedioxy)-amphetamine (MDA). J Med Chem 1998;41(6):1001.
1317. Valter K, Arrizabalaga P. Designer Drugs Directory. Elsevier Science:1998 (NY).
1318. Malmusi L, Dukat M, Young R, Teitler M, Darmani NA, Ahmad B, Smith C, Glennon RA. 1,2,3,4-Tetrahydroisoquinoline analogs of phenylalkylamine stimulants and hallucinogens. Med Chem Res 1996;6(6):400.
1319. Malmusi L, Dukat M, Young R, Teitler M, Darmani NA, Ahmad B, Smith C, Glennon RA. 1,2,3,4-Tetrahydroisoquinoline and related analogs of the phenylalkylamine designer drug MDMA. Med Chem Res 1996;6(6):412.
1320. Shulgin A, Shulgin A. PIHKAL: A Chemical Love Story. Transform Press:1992 (Berkeley).
1321. Shulgin A, Shulgin A. TIHKAL: The Continuation. Transform Press:1997 (Berkeley).
1322. Blackledge RD. “DXM” or dextromethorphan. Microgram 2000;33(1):10.
1323. Dawson M, Williamson K, Maynard P. Hydriodic acid/red phosphorus reduction of N,N-dimethyl-3-phenyl-3-hydroxypropylamine. Proceedings of the International Association of Forensic Sciences 15th Triennial Meeting 1999:61.
1324. Choi YH, Kim J, Kim YC, Yoo KP. Selective extraction of ephedrine from Ephedra Sinica using mixtures of CO2, diethylamine, and methanol. Chromatographia 1999;50(11-12):673.
Microgram Journal, Volume 1, Numbers 1-2 (January - June 2003) 150
Brought to you by AltGov2 [www.altgov2.org]
1325. Chow ST, Lee TK, Saw CG, Soon TW, Ng TL. The homogenisation of illicit heroin samples: An emprical and statistical approach. Proceedings of the International Association of Forensic Sciences 13th Triennial Meeting 1993;5:221.
1326. Hindmarsh KW, Taylor A, Fandrey S. Solvent abuse - Changes in attitudes and knowledge? J Can Soc Forensic Sci 1997;30(1):17.
1327. Flanagan RJ, Ives RJ. Volatile substance abuse. Bull Narc 1994;46(2):49.
1328. United Nations International Drug Control Programme (Analysis and Statistics Section). Monograph: Volatile Substance Abuse - 1997. New York, NY:1997.
1329. Chamakura RP. Forensic science and the internet - Current utilization and future potential. Forensic Sci Rev 1997;9(2):97.
1330. Tessarolo AA, Marignani A. Forensic science and the internet. J Can Soc Forensic Sci 1996;29(2):87.
1331. Pulte L, Mayberry J. Fingerprint processing of blotter paper and its effect on LSD analysis. Microgram 1993;26:246.
1332. Li ZY, McNally AJ, Wang HY, Salamone SJ. Stability study of LSD under various storage conditions. J Anal Toxicol 1998;22(6):520.
1333. Gigliano GS. Cannabis Sativa L. - Botanical problems and molecular approaches in forensic investigations. Forensic Sci Rev 2001;13(1):1.
1334. Holland JA, Nelson L, Ravikumar PR, Elwood WN. Embalming fluid-soaked marijuana: New high or new guise for PCP? J Psychoactive Drugs 1998;30(2):215.
1335. Horrocks M, Bedford KR, Morgan-Smith RK. The filtering effects of various household fabrics on the pollen content of hash oil (cannabis extract). J Forensic Sci 1997;42(2):256.
1336. ElSohly MA, Feng SX, Murphy TP, Warrington AW, Ross S, Nimrod A, Mehmedic Z, Fortner N. Identification and quantitation of 11-nor-delta(9)-tetrahydrocannabivarin-9-carboxylic acid, a major metabolite of delta-9-tetrahydrocannabivarin. J Anal Toxicol 2001;25(6):476.
1337. Hutchinson K. The manufacture of Cannabis Sativa for legitimate applications. J Clan Lab Invest Chem Assoc 1996;6(4):20.
1338. Landi S. Mineral nutrition of Cannabis Sativa L. J Plant Nutr 1997;20(2-3):311.
1339. Mausolf N. The name of the test. Microgram 2001;34(9):235.
1340. Amick GD. Archive of mass spectral data files on recordable CD-ROM’s and creation and maintenance of a searchable computerized database. J Anal Toxic 1999;23(1):46.
1341. Joern WA. Ion ratio instability of a GC/MS system is related to fluctuations in room air flow. J Anal Toxicol 1993;17:122.
1342. Bogusz MJ, Maier RD, Kruger KD, Webb KS, Romeril J, Miller ML. Poor reproducibility of in-source collisional atmospheric pressure ionization mass spectra of toxicologically relevant drugs. J Chromatogr A 1999;844(1-2):409.
Microgram Journal, Volume 1, Numbers 1-2 (January - June 2003) 151
Brought to you by AltGov2 [www.altgov2.org]
1343. Zedeck M. Drug Enforcement Administration (DEA) chemists erred in calculating quantity of methadone that could be synthesized from precursor chemicals. J Forensic Sci 1997;42(2):349.
1344. Hatcher AP, Ryan CR. Response to claim of error by Drug Enforcement Administration (DEA) chemist in calculating quantity of methadone synthesized from precursor chemicals. J Forensic Sci 1997;42(5):963.
1345. Müller JL. Love potions and the ointment of witches: Historical aspects of the nightshade alkaloids. Clinical Toxicol 1998;36(6):617.
1346. Zenk MH, Tabata M. Opium - Its history, merits, and demerits. Nat Med 1996;50(2):86.
1347. Tetenyi P. Biodiversity of Papaver Somniferum L. (opium poppy). International Symposium on Medicinal and Aromatic Plants (Series: Acta Horticulturae) 1995;390:191.
1348. Banerjee S, Agnihotri A, Das G, Chouhan RS, Harit V. Determination of loss on drying or consistency of opium samples using microwave ovens. Bull Narc 1999;51(1,2):119.
1349. Anonymous. Oxycodone (trade names: Tylox, Percodan, Oxycontin). Microgram 2001;34(3):48.
1350. Skalican Z, Kobliha Z, Halamek E. Ionic associates of phencyclidine with sulfophthaleins and azo dyes. Anal Lett 1997;30(7):1349.
1351. Brandenberger H. Hypnotics and sedatives not belonging to the classes of barbiturates and benzodiazepines. Anal Toxicol Clin Forensic Pharm Chem 1997:399.
1352. King MA, McDonough MA, Drummer OH, Berkovic SF. Poppy tea and the baker's first seizure. Lancet 1997;350:716.
1353. Singer RD, Scammells PJ. Alternative Methods for the MnO2 oxidation of codeine methyl ether to thebaine utilizing ionic liquids. Tetrahedron Lett 2001;42(39):6831.
1354. Jensen III CJ. The forensic analysis of clandestine drug records. Forensic Sci Int 1994;66(1):33.
1355. Inoue T, Seta S. Analysis of drugs in unconventional samples. Forensic Sci Rev 1992;4(2):89.
1356. Nichols RG. Drug proficiency test false positives: A lack of critical thought. Science Justice 1997;37(3):191.
1357. Ripani L, Lovera P, Muzi F, Schiavone S. GC/MS Analysis of a fruit juice extract that was suspected to be a narcotic beverage. Microgram 1994;27:149.
1358. Roux C, Bull S, Goulding J, Lennard C. Tracing the source of illicit drugs through plastic packaging - a database. J Forensic Sci 2000;45(1):99.
1359. Azoury M, Meirovich L, Refael E. Computerized management of a forensic analytical laboratory. Microgram 1997;30(12):297.
1360. Smith JB, Jarzen RA. A computerized case management system for the crime laboratory. Proceedings of the American Academy of Forensic Sciences 1995;1:26.
1361. Rothchild R. Some considerations for planning and site preparation for modern laboratory instrumentation. J Clan Lab Invest Chem Assoc 1996;6(1):15.
Microgram Journal, Volume 1, Numbers 1-2 (January - June 2003) 152
Brought to you by AltGov2 [www.altgov2.org]
1362. Rothchild R. Some considerations for planning and site preparation for modern laboratory instrumentation. Microgram 1996;29(3):69.
1363. Acton B, Kelly R. Development of a forensic evidence protection kit. Proc SPIE - Int Soc Opt Eng 1999;3576:14.
1364. O’Gorman M. Unique drug smuggling techniques and the problems associated with analyses. Proceedings of the American Academy of Forensic Sciences 1995;1:21.
1365. Kolusayin Z, Etun G, Seyhan M, Soysal Z, Ko S. Drug smuggling by internal bodily concealment. Proceedings of the International Association of Forensic Sciences 13th Triennial Meeting 1993;5:259.
1366. Armstead L. Illicit narcotics cultivation and processing: The ignored environmental drama. United Nations International Drug Control Programme Vienna. Bull Narc 1992;44(2):9.
1367. Dourojeanni M. Environmental impact of coca cultivation and cocaine production in the Amazon region of Peru. United Nations International Drug Control Programme Vienna. Bull Narc 1992;44(2):37.
1368. Evett IW. Expert evidence and forensic misconceptions of the nature of exact science. Science Justice 1996;36(2):118.
1369. Newman R, Gilbert M, Lothridge K. GC-MS guide to ignitable liquids. CRC Press, New York, 1998.
1370. Sharp ME, Voll LJ. Modification of an extraction procedure for acidic and neutral drugs. Can Soc Forensic Sci 1995;28:171.
1371. Kingston C. Neural networks in forensic science. J Forensic Sci 1992;37(1):252.
1372. McKibben T. Protecting group chemistry. J Clan Lab Invest Chem Assoc 1997;7(4):30.
1373. Huettl P, Koester S, Hoffer L, Gerhardt GA. Separation and identification of drugs of abuse in drug cottons by high performance liquid chromatography coupled with electrochemical array detectors. Electroanalysis 1999;11(5):313.
1374. Chen X-H, Franke J-P, de Zeeuw RA. Solid phase extraction for systematic toxicological analysis. Forensic Sci Rev 1992;4(2):147.
1375. United Nations International Drug Control Programme (Scientific Section). Monograph: Multilingual dictionary of narcotic drugs and psychotropic substances under international control. United Nations (New York, NY):1993.
1376. United Nations International Drug Control Programme (Scientific Section). Monograph: Multilingual dictionary of narcotic drugs and psychotropic substances under international control. Addendum 1. United Nations (New York, NY):1998.
1377. Machata G. The International Narcotics Control Board (INCB or Board). Proceedings of the International Association of Forensic Sciences 13th Triennial Meeting 1993;5:228.
Microgram Journal, Volume 1, Numbers 1-2 (January - June 2003) 153
Brought to you by AltGov2 [www.altgov2.org]
U.S. Department of JusticeDrug Enforcement Administration
www.dea.gov
Microgram Journal
To Assist and Serve Scientists Concerned with the Detection and Analysis of Controlled Substances and Other Abused Substances for Forensic / Law Enforcement Purposes.
Published by: The Drug Enforcement Administration Office of Forensic Sciences Washington, DC 20537
The U.S. Attorney General has determined that the publication of this periodical is necessary in the transaction of the public business required by the Department of Justice. Information, instructions, and disclaimers are published in the first issue of each year.
Volume 1 Numbers 3-4 Posted On-Line At: July - December 2003 www.dea.gov/programs/forensicsci/microgram/index.html
155
Brought to you by AltGov2 [www.altgov2.org]
Contents
Letter to the Editor regarding “Instrumental Separation of 3,4-Methylenedioxyamphetamine 157 (MDA) from 1-(3,4-Methylenedioxyphenyl)-2-propanol, a Co-Eluting Compound”.
The Identification of 5-Methoxy-alpha-methyltryptamine (5-MeO-AMT) 158 Michelle M. Zimmerman
The Identification of N,N-Dimethylamphetamine (DMA) in an Exhibit in Malaysia 163 Kee Bian Chan, Yong Kiong Chong, and Mohamed Nazarudin
Profiling of Ecstasy Tablets Seized in Japan 169 Yukiko Makino, Shingo Kurobane, Kazuyoshi Miyasaka, and Kenichi Nagano
A Rapid Extraction and GC/MS Methodology for the Identification of Psilocyn 177 in Mushroom/Chocolate Concoctions Mohammad Sarwar and John L. McDonald
A Rapid and Simple GC/MS Screening Method for 4-Methoxyphenol in Illicitly 184 Prepared 4-Methoxyamphetamine (PMA) Dieter Waumans, Noël Bruneel, Bas Hermans, and Jan Tytgat
Letrozole (Femara®) 190 Lois C. Geer and Patrick A. Hays
An Overview of DNA Methods for the Identification and Individualization of Marijuana 196 Heather Miller Coyle, Timothy Palmbach, Nicholas Juliano, Carll Ladd, and Henry C. Lee
Report of the Scientific Working Group for the Analysis of Seized Drugs (SWGDRUG) 208 Conference (Montreal) Joseph P. Bono
Note: In order to prevent automated theft of email addresses off the Internet postings of Microgram Journal, unless otherwise requested by the corresponding author, all email addresses reported in the Journal have had the “@” character replaced by “ -at- ”; this will need to be converted back (by hand) before the address can be used.
Cover Art: “Ball and Stick” Model of Cocaine (Courtesy of Patrick A. Hays, DEA Special Testing and Research Laboratory, Dulles, VA)
Microgram Journal, Volume 1, Numbers 3-4 (July - December 2003) 156
Brought to you by AltGov2 [www.altgov2.org]
Letter to the Editor regarding: Vohlken BA, Layton SM. Instrumental Separation of 3,4-Methylene-dioxyamphetamine (MDA) from 1-(3,4-Methylenedioxyphenyl)-2-propanol, a Co-Eluting Compound. Microgram Journal 2003(1-2):32.
Sir:
Some clarifications on the article by authors Vohlken and Layton. The peak annotated as an unknown “A4” is almost certainly di-[1-(3,4 methylenedioxyphenyl -2- propyl)]amine, the dimer of MDA. There is an article in the April, 1985 issue of the Journal of Forensic Sciences about a similar dimer being produced during the synthesis of amphetamine. The behavior of this compound is unusual in that the GC/MS suggests that you have a low molecular weight compound at a long retention time, when in reality you are looking at only half of the molecule. The actual molecular weight is 340 or 341. This compound was synthesized at this laboratory about 15 years ago. Also of note, similar tablets (white, Rolex logo) are shown on the website dancesafe.org and described as containing MDA/MDMA and another, unidentified substance. We had a submission of similar tablets (400) in September, 2001 from the Detroit, Michigan area.
Peter Ausili DEA North Central Laboratory, Chicago, Illinois
* * * * * * * * * * * * * * * * * * * * * * * * *
Microgram Journal, Volume 1, Numbers 3-4 (July - December 2003) 157
Brought to you by AltGov2 [www.altgov2.org]
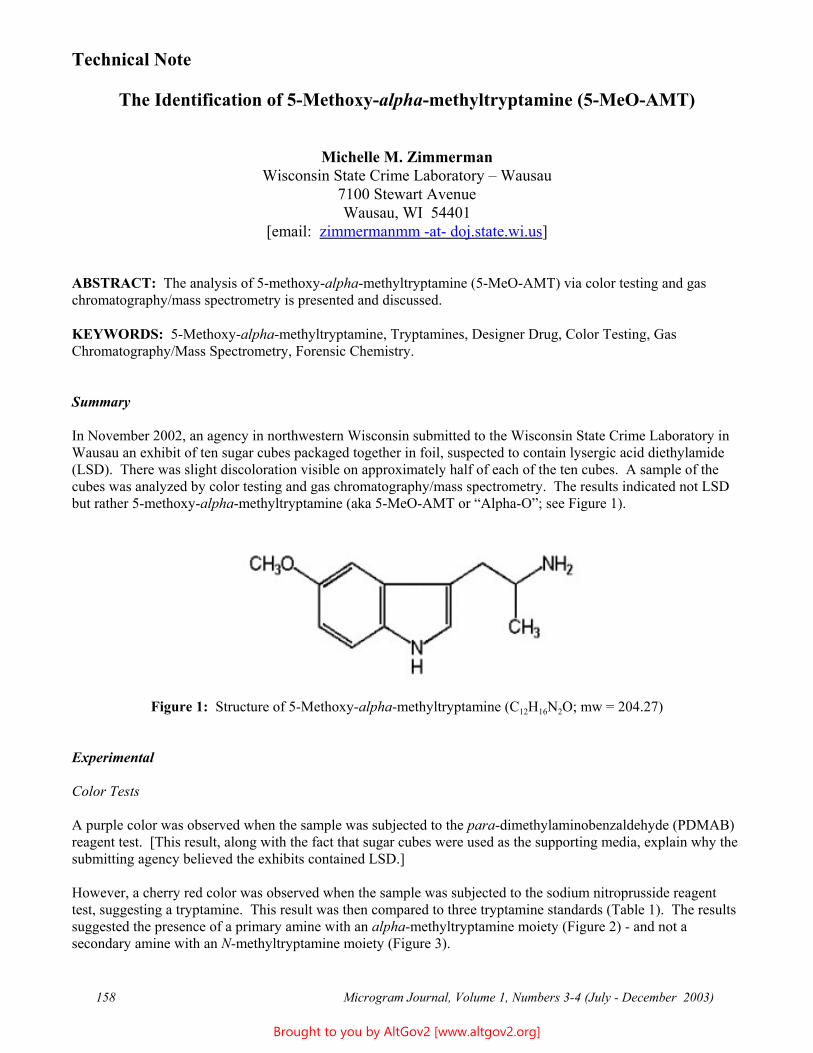
Technical Note
The Identification of 5-Methoxy-alpha-methyltryptamine (5-MeO-AMT)
Michelle M. Zimmerman Wisconsin State Crime Laboratory – Wausau
7100 Stewart Avenue Wausau, WI 54401
[email: zimmermanmm -at- doj.state.wi.us]
ABSTRACT: The analysis of 5-methoxy-alpha-methyltryptamine (5-MeO-AMT) via color testing and gas chromatography/mass spectrometry is presented and discussed.
KEYWORDS: 5-Methoxy-alpha-methyltryptamine, Tryptamines, Designer Drug, Color Testing, Gas Chromatography/Mass Spectrometry, Forensic Chemistry.
Summary
In November 2002, an agency in northwestern Wisconsin submitted to the Wisconsin State Crime Laboratory in Wausau an exhibit of ten sugar cubes packaged together in foil, suspected to contain lysergic acid diethylamide (LSD). There was slight discoloration visible on approximately half of each of the ten cubes. A sample of the cubes was analyzed by color testing and gas chromatography/mass spectrometry. The results indicated not LSD but rather 5-methoxy-alpha-methyltryptamine (aka 5-MeO-AMT or “Alpha-O”; see Figure 1).
Figure 1: Structure of 5-Methoxy-alpha-methyltryptamine (C12H16N2O; mw = 204.27)
Experimental
Color Tests
A purple color was observed when the sample was subjected to the para-dimethylaminobenzaldehyde (PDMAB) reagent test. [This result, along with the fact that sugar cubes were used as the supporting media, explain why the submitting agency believed the exhibits contained LSD.]
However, a cherry red color was observed when the sample was subjected to the sodium nitroprusside reagent test, suggesting a tryptamine. This result was then compared to three tryptamine standards (Table 1). The results suggested the presence of a primary amine with an alpha-methyltryptamine moiety (Figure 2) - and not a secondary amine with an N-methyltryptamine moiety (Figure 3).
Microgram Journal, Volume 1, Numbers 3-4 (July - December 2003) 158
Brought to you by AltGov2 [www.altgov2.org]
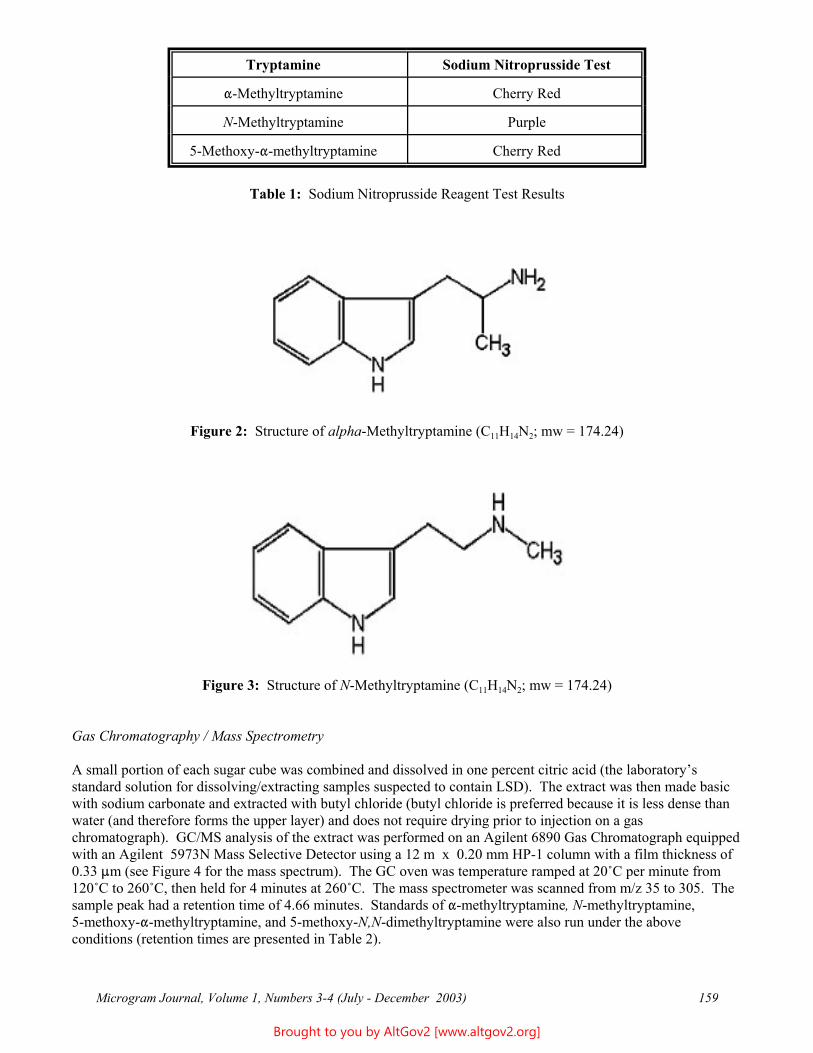
Tryptamine Sodium Nitroprusside Test
"-Methyltryptamine Cherry Red
N-Methyltryptamine Purple
5-Methoxy-"-methyltryptamine Cherry Red
Table 1: Sodium Nitroprusside Reagent Test Results
Figure 2: Structure of alpha-Methyltryptamine (C11H14N2; mw = 174.24)
Figure 3: Structure of N-Methyltryptamine (C11H14N2; mw = 174.24)
Gas Chromatography / Mass Spectrometry
A small portion of each sugar cube was combined and dissolved in one percent citric acid (the laboratory’s standard solution for dissolving/extracting samples suspected to contain LSD). The extract was then made basic with sodium carbonate and extracted with butyl chloride (butyl chloride is preferred because it is less dense than water (and therefore forms the upper layer) and does not require drying prior to injection on a gas chromatograph). GC/MS analysis of the extract was performed on an Agilent 6890 Gas Chromatograph equipped with an Agilent 5973N Mass Selective Detector using a 12 m x 0.20 mm HP-1 column with a film thickness of 0.33 :m (see Figure 4 for the mass spectrum). The GC oven was temperature ramped at 20/C per minute from 120/C to 260/C, then held for 4 minutes at 260/C. The mass spectrometer was scanned from m/z 35 to 305. The sample peak had a retention time of 4.66 minutes. Standards of "-methyltryptamine, N-methyltryptamine, 5-methoxy-"-methyltryptamine, and 5-methoxy-N,N-dimethyltryptamine were also run under the above conditions (retention times are presented in Table 2).
Microgram Journal, Volume 1, Numbers 3-4 (July - December 2003) 159
Brought to you by AltGov2 [www.altgov2.org]
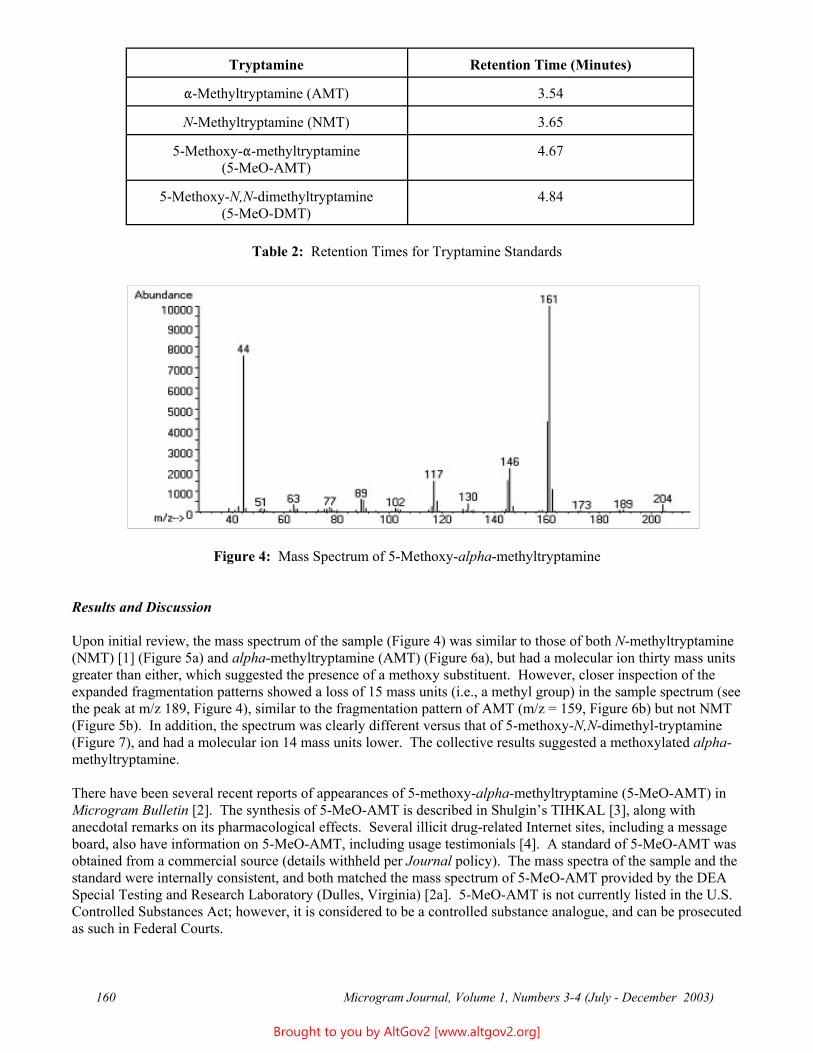
Tryptamine Retention Time (Minutes)
"-Methyltryptamine (AMT) 3.54
N-Methyltryptamine (NMT) 3.65
5-Methoxy-"-methyltryptamine 4.67 (5-MeO-AMT)
5-Methoxy-N,N-dimethyltryptamine 4.84 (5-MeO-DMT)
Table 2: Retention Times for Tryptamine Standards
Figure 4: Mass Spectrum of 5-Methoxy-alpha-methyltryptamine
Results and Discussion
Upon initial review, the mass spectrum of the sample (Figure 4) was similar to those of both N-methyltryptamine (NMT) [1] (Figure 5a) and alpha-methyltryptamine (AMT) (Figure 6a), but had a molecular ion thirty mass units greater than either, which suggested the presence of a methoxy substituent. However, closer inspection of the expanded fragmentation patterns showed a loss of 15 mass units (i.e., a methyl group) in the sample spectrum (see the peak at m/z 189, Figure 4), similar to the fragmentation pattern of AMT (m/z = 159, Figure 6b) but not NMT (Figure 5b). In addition, the spectrum was clearly different versus that of 5-methoxy-N,N-dimethyl-tryptamine (Figure 7), and had a molecular ion 14 mass units lower. The collective results suggested a methoxylated alpha methyltryptamine.
There have been several recent reports of appearances of 5-methoxy-alpha-methyltryptamine (5-MeO-AMT) in Microgram Bulletin [2]. The synthesis of 5-MeO-AMT is described in Shulgin’s TIHKAL [3], along with anecdotal remarks on its pharmacological effects. Several illicit drug-related Internet sites, including a message board, also have information on 5-MeO-AMT, including usage testimonials [4]. A standard of 5-MeO-AMT was obtained from a commercial source (details withheld per Journal policy). The mass spectra of the sample and the standard were internally consistent, and both matched the mass spectrum of 5-MeO-AMT provided by the DEA Special Testing and Research Laboratory (Dulles, Virginia) [2a]. 5-MeO-AMT is not currently listed in the U.S. Controlled Substances Act; however, it is considered to be a controlled substance analogue, and can be prosecuted as such in Federal Courts.
Microgram Journal, Volume 1, Numbers 3-4 (July - December 2003) 160
Brought to you by AltGov2 [www.altgov2.org]
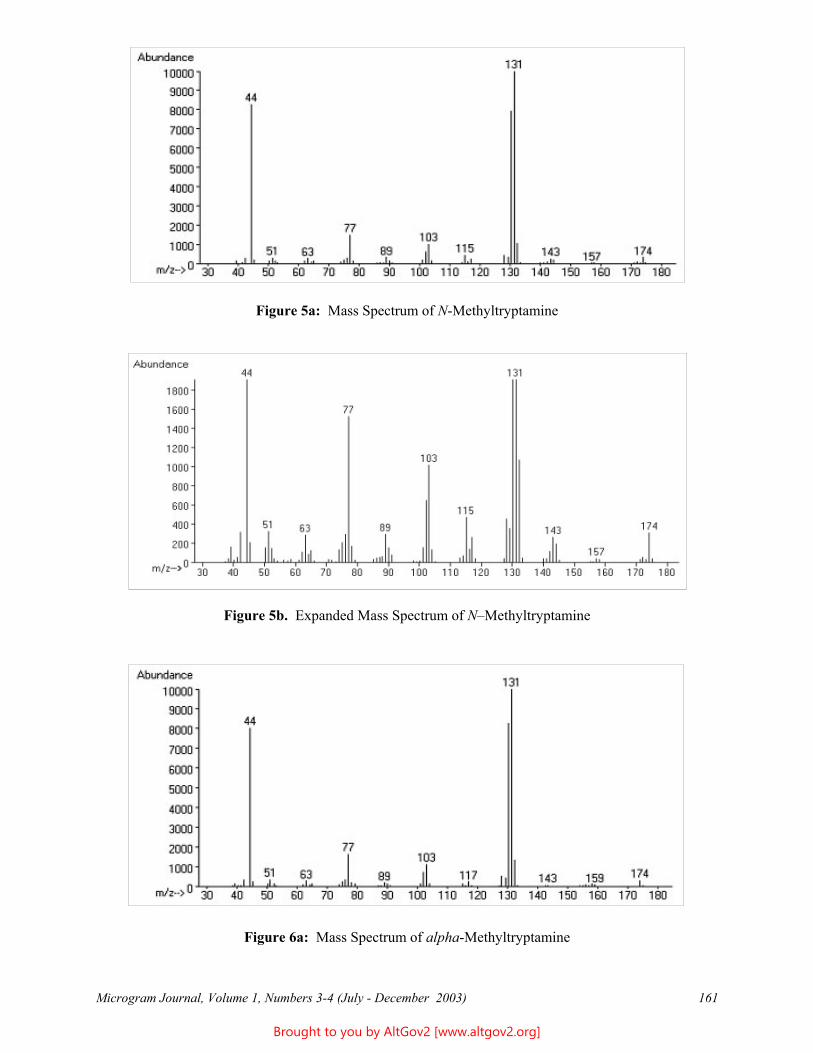
Figure 5a: Mass Spectrum of N-Methyltryptamine
Figure 5b. Expanded Mass Spectrum of N–Methyltryptamine
Figure 6a: Mass Spectrum of alpha-Methyltryptamine
Microgram Journal, Volume 1, Numbers 3-4 (July - December 2003) 161
Brought to you by AltGov2 [www.altgov2.org]
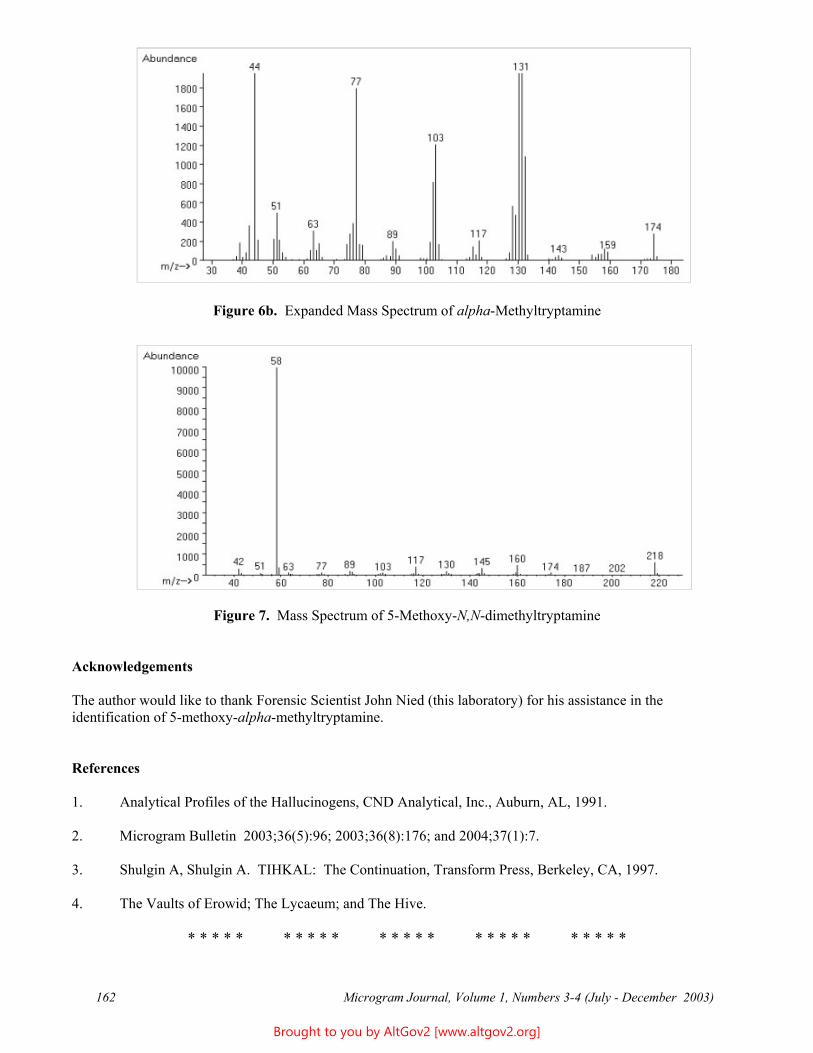
Figure 6b. Expanded Mass Spectrum of alpha-Methyltryptamine
Figure 7. Mass Spectrum of 5-Methoxy-N,N-dimethyltryptamine
Acknowledgements
The author would like to thank Forensic Scientist John Nied (this laboratory) for his assistance in the identification of 5-methoxy-alpha-methyltryptamine.
References
1. Analytical Profiles of the Hallucinogens, CND Analytical, Inc., Auburn, AL, 1991.
2. Microgram Bulletin 2003;36(5):96; 2003;36(8):176; and 2004;37(1):7.
3. Shulgin A, Shulgin A. TIHKAL: The Continuation, Transform Press, Berkeley, CA, 1997.
4. The Vaults of Erowid; The Lycaeum; and The Hive.
* * * * * * * * * * * * * * * * * * * * * * * * *
162 Microgram Journal, Volume 1, Numbers 3-4 (July - December 2003)
Brought to you by AltGov2 [www.altgov2.org]
Technical Note
The Identification of d-N,N-Dimethylamphetamine (DMA) in an Exhibit in Malaysia
Kee Bian Chan*, Yong Kiong Chong, and Mohamed Nazarudin Narcotics Section, Forensic Division Department of Chemistry - Malaysia
Jalan Sultan, 46661 Petaling Jaya Malaysia
[email: kbchan -at- kimia.gov.my]
ABSTRACT: A crystalline substance which was suspected to be methamphetamine hydrochloride was instead determined to be d-N,N-dimethylamphetamine hydrochloride containing traces of methamphetamine hydrochloride. Analytical data (Color Testing, GC/MS, FTIR, HPLC, Melting Point, Optical Rotation) is reported for d-N,N-dimethylamphetamine hydrochloride.
KEYWORDS: d-N,N-Dimethylamphetamine Hydrochloride, Color Test, GC-MS, FTIR, HPLC, Melting Point, Optical Rotation, Forensic Chemistry.
Introduction
This laboratory recently received an exhibit consisting of approximately 200 grams of a white crystalline substance that was suspected to be methamphetamine hydrochloride. Crystalline methamphetamine hydrochloride (known locally by the street name of “syabu”) is very frequently encountered by the Central Laboratory and its nine branch laboratories. However, in this case the substance was instead determined to be d-N,N-dimethylamphetamine hydrochloride with traces of methamphetamine. There have been occasional literature reports of dimethylamphetamine in the United States, some of which included analytical data (vide infra); however, those reports were in a law enforcement restricted periodical (Microgram), and so are not generally available. More recently, crystalline dimethylamphetamine was reported to be a low prevalence drug of abuse in Japan, making its first appearance there in 1998 1. To our knowledge, this is the first report of dimethylamphetamine in Malaysia. Dimethylamphetamine is not currently designated as a controlled substance or “dangerous drug” in Malaysia (that is, like amphetamine or methamphetamine). This paper presents a brief of our analytical findings.
Experimental
Color Test and Reagents
Marquis Reagent and Simon’s Regent: These were prepared from analytical grade reagents according to the standard formulations given in the literature 2.
Microgram Journal, Volume 1, Numbers 3-4 (July - December 2003) 163
Brought to you by AltGov2 [www.altgov2.org]
GC/MS
GC/MS analysis was performed on a Shimadzu QP5050A. Column conditions: 30m x 0.25 mm i.d., film thickness 0.25 :m BPX-5 (5% phenylpolysilphenylene-siloxane), with a temperature program starting at 180 /C (2 min), then ramping 25 /C/min to 250 /C. The injection port temperature was 260 /C, and the detector and transfer-line temperatures were 280 /C.
HPLC
The chromatographic system consisted of a Hewlett Packard Series 1050 HPLC, with a variable UV-detector set at 257 nm and a HP-3396 Series II integrator. The column was a Econosphere (Alltech) 150 mm x 4.6 mm i.d. stainless steel column packed with 5 :m silica. The flow rate was set at 0.8 mL/min. Injections were made via a Rheodyne injection valve with a 20 :L loop. The mobile phase consisted of methanol/water/1N ammonia solution/1N ammonium nitrate (27:3:2:1).
FTIR
Fourier Transfer Infrared Spectroscopy was performed using a Nicolet Magna-IR Spectrometer 550. The resolution was set at 4.000 cm -1, with 32 scans between 4000 cm -1 and 550 cm -1. The sample was determined as a KBr disc.
Melting Point
The melting point was determined using a Buchi B-545 melting point apparatus.
Polarimetry
The optical rotation of two solutions containing 0.048 grams/mL and 0.024 grams/mL of sample in distilled water were measured with a Bellingham & Stanley (London) polarimeter 3. The accuracy of the instrument was checked by determining the specific optical rotation of a sucrose standard solution (9.78 grams/100mL) and comparing with the literature value 4. An analytical grade sucrose from Mayer & Baker was used.
Results and Discussion
Color Tests
Treating the sample with the Marquis reagent gave a color change from orange to brown. A faint blue color developed slowly with the Simon’s reagent. As a tertiary amine, DMA should not produce a color change with Simon’s reagent 5; therefore, this result suggested the low-level presence of a secondary amine (such as methamphetamine) or some other contaminant.
GC/MS
The GC/MS chromatogram showed two peaks – a small peak preceding a much larger one. The mass spectrum of the large peak (Figure 1) was typical of phenethylamines in that it had a dominant parent ion (at m/z = 72) but otherwise only small fragment ions. The spectrum of the primary component was found to be similar to the literature DMA spectra 6,7,8,9, while the small peak was identified as methamphetamine from its mass spectrum and retention time. The low level presence of methamphetamine was consistent with the findings from the color tests.
Microgram Journal, Volume 1, Numbers 3-4 (July - December 2003) 164
Brought to you by AltGov2 [www.altgov2.org]
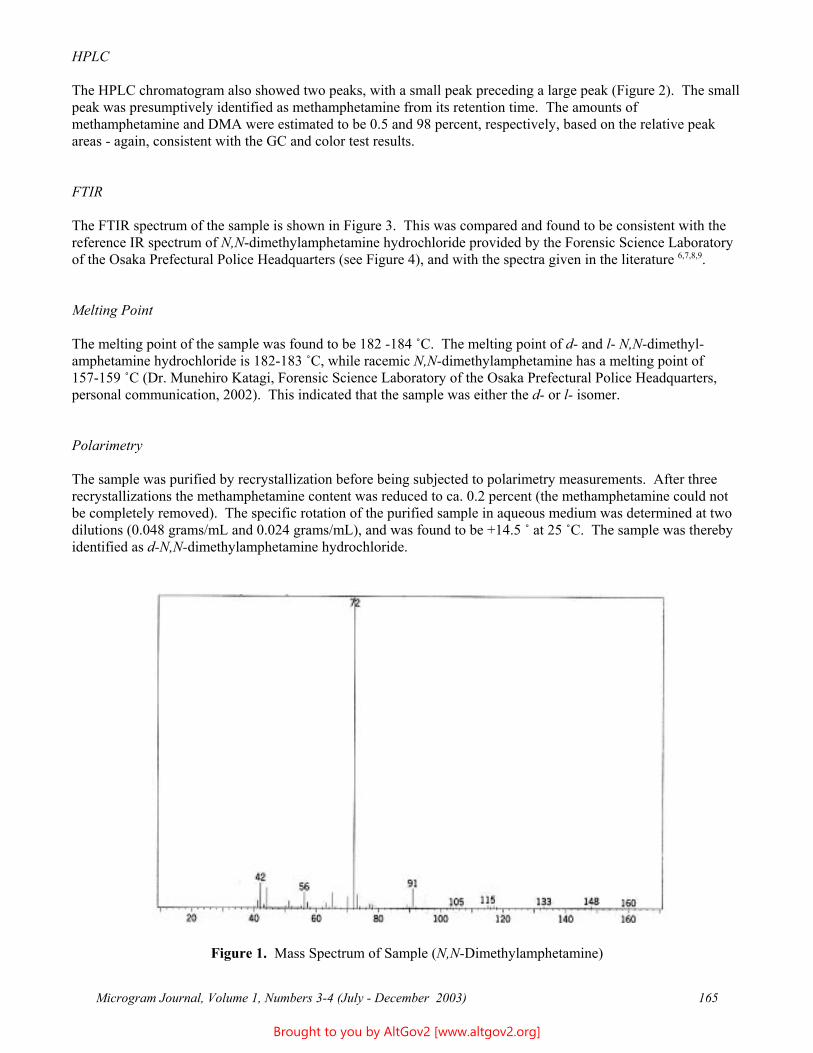
HPLC
The HPLC chromatogram also showed two peaks, with a small peak preceding a large peak (Figure 2). The small peak was presumptively identified as methamphetamine from its retention time. The amounts of methamphetamine and DMA were estimated to be 0.5 and 98 percent, respectively, based on the relative peak areas - again, consistent with the GC and color test results.
FTIR
The FTIR spectrum of the sample is shown in Figure 3. This was compared and found to be consistent with the reference IR spectrum of N,N-dimethylamphetamine hydrochloride provided by the Forensic Science Laboratory of the Osaka Prefectural Police Headquarters (see Figure 4), and with the spectra given in the literature 6,7,8,9.
Melting Point
The melting point of the sample was found to be 182 -184 /C. The melting point of d- and l- N,N-dimethyl-amphetamine hydrochloride is 182-183 /C, while racemic N,N-dimethylamphetamine has a melting point of 157-159 /C (Dr. Munehiro Katagi, Forensic Science Laboratory of the Osaka Prefectural Police Headquarters, personal communication, 2002). This indicated that the sample was either the d- or l- isomer.
Polarimetry
The sample was purified by recrystallization before being subjected to polarimetry measurements. After three recrystallizations the methamphetamine content was reduced to ca. 0.2 percent (the methamphetamine could not be completely removed). The specific rotation of the purified sample in aqueous medium was determined at two dilutions (0.048 grams/mL and 0.024 grams/mL), and was found to be +14.5 / at 25 /C. The sample was thereby identified as d-N,N-dimethylamphetamine hydrochloride.
Figure 1. Mass Spectrum of Sample (N,N-Dimethylamphetamine)
Microgram Journal, Volume 1, Numbers 3-4 (July - December 2003) 165
Brought to you by AltGov2 [www.altgov2.org]
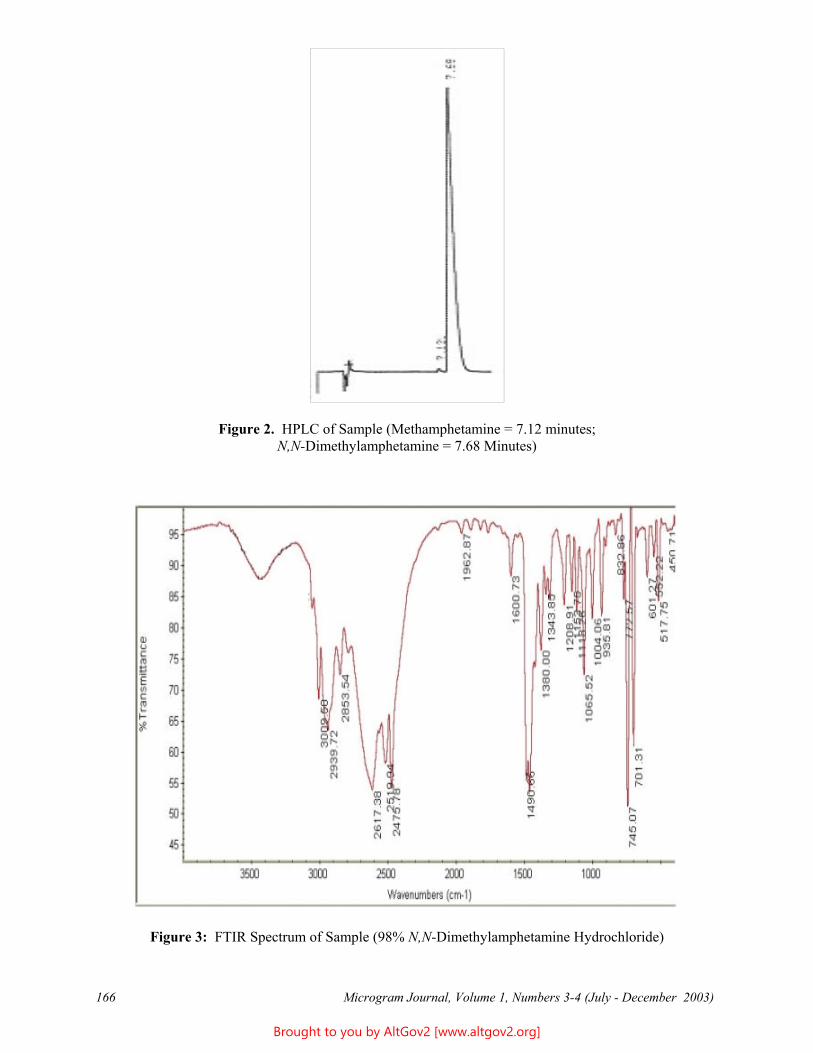
Figure 2. HPLC of Sample (Methamphetamine = 7.12 minutes; N,N-Dimethylamphetamine = 7.68 Minutes)
Figure 3: FTIR Spectrum of Sample (98% N,N-Dimethylamphetamine Hydrochloride)
Microgram Journal, Volume 1, Numbers 3-4 (July - December 2003) 166
Brought to you by AltGov2 [www.altgov2.org]
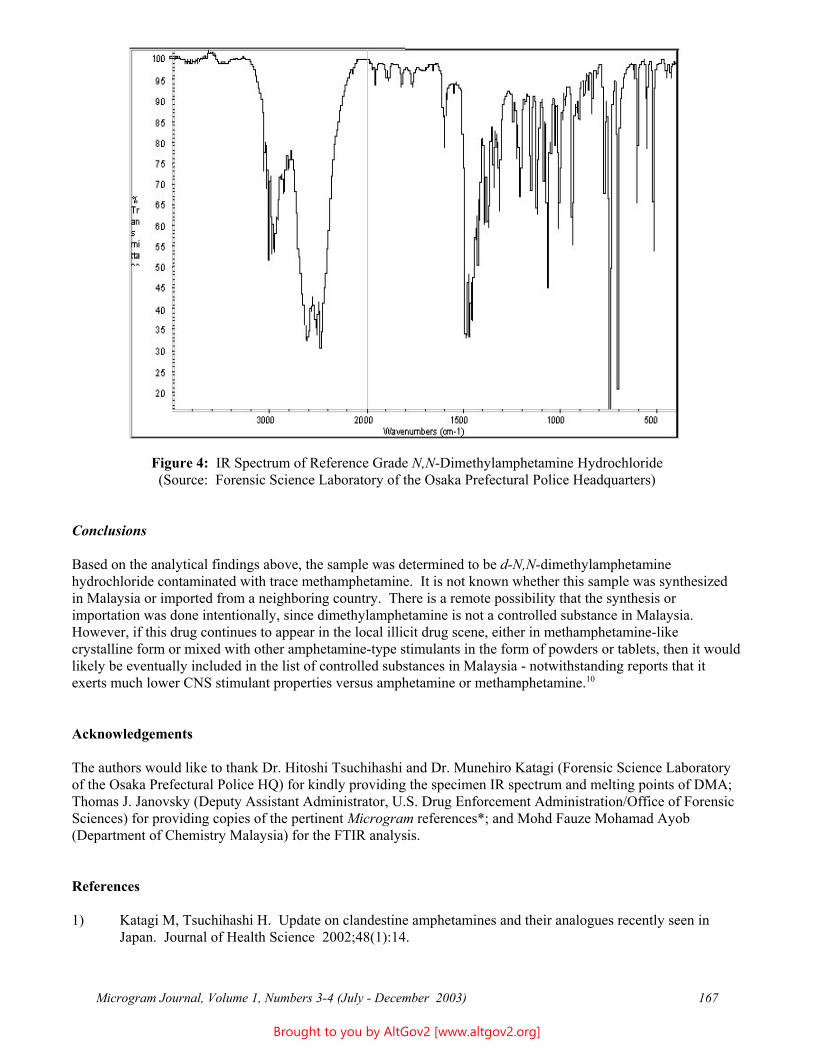
Figure 4: IR Spectrum of Reference Grade N,N-Dimethylamphetamine Hydrochloride (Source: Forensic Science Laboratory of the Osaka Prefectural Police Headquarters)
Conclusions
Based on the analytical findings above, the sample was determined to be d-N,N-dimethylamphetamine hydrochloride contaminated with trace methamphetamine. It is not known whether this sample was synthesized in Malaysia or imported from a neighboring country. There is a remote possibility that the synthesis or importation was done intentionally, since dimethylamphetamine is not a controlled substance in Malaysia. However, if this drug continues to appear in the local illicit drug scene, either in methamphetamine-like crystalline form or mixed with other amphetamine-type stimulants in the form of powders or tablets, then it would likely be eventually included in the list of controlled substances in Malaysia - notwithstanding reports that it exerts much lower CNS stimulant properties versus amphetamine or methamphetamine.10
Acknowledgements
The authors would like to thank Dr. Hitoshi Tsuchihashi and Dr. Munehiro Katagi (Forensic Science Laboratory of the Osaka Prefectural Police HQ) for kindly providing the specimen IR spectrum and melting points of DMA; Thomas J. Janovsky (Deputy Assistant Administrator, U.S. Drug Enforcement Administration/Office of Forensic Sciences) for providing copies of the pertinent Microgram references*; and Mohd Fauze Mohamad Ayob (Department of Chemistry Malaysia) for the FTIR analysis.
References
1) Katagi M, Tsuchihashi H. Update on clandestine amphetamines and their analogues recently seen in Japan. Journal of Health Science 2002;48(1):14.
Microgram Journal, Volume 1, Numbers 3-4 (July - December 2003) 167
Brought to you by AltGov2 [www.altgov2.org]
2) Recommended Methods for Testing Amphetamine and Methamphetamine Manual for Use by National Narcotics Laboratories, United Nations, New York: 1987:16.
3) Morrison RT, Boyd RN. Organic Chemistry. 2nd Ed. Prentice-Hall of India Private Limited, New Delhi: 1969:75.
4) Merck Index, 11th Edition, 1989;1401.
5) Skinner HF. Methamphetamine Synthesis via HI/ red phosphorous reduction of ephedrine. Forensic Science International 1990;48:128.
6) Tackett S, Mills T, Price P. Identification and synthesis of N,N-Dimethylamphetamine. Microgram 1988;21(4):77.*
7) Bono JP. Separation and Identification of Methamphetamine and Dimethylamphetamine. Microgram 1988;21(4):84.*
8) Bailey VA, Buer LO. The stability of dimethylamphetamine upon exposure to heat, air, and moisture. Microgram 1993;26(5):96.*
9) Mills T, Roberson JC, McCrudy H, Wall W. Instrumental data for drug identification. 2nd Ed. Vol. 5. New York, Elsevier: 1992:164.
10) Shulgin A, Shulgin A. PIHKAL: A Chemical Love Story. Transform Press: 1988 (Berkeley, CA): 818 (#142 PEA; phenethylamine).
* Note: All issues of Microgram (November 1967 - March 2002) and the first nine issues of its successor Microgram Bulletin (April - December, 2002) were Law Enforcement Restricted publications, and are therefore unavailable to the general public.
* * * * * * * * * * * * * * * * * * * * * * * * *
168 Microgram Journal, Volume 1, Numbers 3-4 (July - December 2003)
Brought to you by AltGov2 [www.altgov2.org]
Technical Note
Profiling of Ecstasy Tablets Seized in Japan
Yukiko Makino*, Shingo Kurobane, Kazuyoshi Miyasaka, and Kenichi Nagano Narcotics Control Department
Kanto-Shin'etsu Regional Bureau of Health and Welfare Ministry of Health, Labour and Welfare
2-4-14 Nakameguro, Meguro-ku, Tokyo 153-0061 Japan [email: ymakino -at- mbe.nifty.com]
ABSTRACT: 54 Ecstasy tablets seized in Japan during the first half of CY-2002 were analyzed to determine their physical and chemical characteristics and to derive a “snapshot” comparison with seizures made in CY’s 2000 and 2001. For physical characterization, logo, cleavage, coat, vertical view, horizontal view, diameter, thickness, weight, smell, outside color, inside color, color, toughness, capping, and logo were measured, and a photograph was taken. For chemical characterization, the tablet components were identified by GC/MS and HPLC, with quantification by HPLC. The maximum content of 3,4-methylenedioxymethamphetamine was 160 milligrams/tablet. Other tablet components detected were 3,4-methylenedioxyamphetamine, ephedrine, caffeine, ketamine, and methamphetamine. Several trends in the chemical characteristics are presented.
KEYWORDS: 3,4-Methylenedioxymethamphetamine, MDMA, Ecstasy, Characterization, Profiling, Ketamine, Forensic Chemistry.
Introduction
Abuse of 3,4-methylenedioxymethamphetamine (“Ecstasy”) has spread worldwide. Although still a very small percentage relative to worldwide consumption, the number of Ecstasy tablets seized in Japan has been rapidly increasing, with 174,000 tablets seized in 2002 [1]. Ecstasy abuse in Japan is considered to be a very serious problem, similar to methamphetamine abuse. We recently profiled Ecstasy tablets seized in Japan in CY’s 2000 and 2001, and reported the results in the Journal of Health Science [2]. We have continued to profile Ecstasy tablets using the same methodologies presented in the Journal of Health Science’s article [2]. Herein, we present the results of the profiling of Ecstasy tablets seized in Japan during the first half of CY-2002.
Experimental
Chemicals
Methamphetamine hydrochloride, ephedrine hydrochloride, and caffeine were obtained from commercial sources in Japan. 3,4-Methylenedioxyamphetamine hydrochloride (MDA), 3,4-methylenedioxymethamphetamine hydrochloride (MDMA), and 3,4-methylenedioxyethylamphetamine hydrochloride (MDEA) were obtained from the reference collection of the Narcotics Control Department Laboratory. All solvents were of HPLC grade. The 54 tablets that were analyzed in the present study were randomly selected from among seizures forfeited to the Government during the first half of CY-2002.
Physical Characteristics
Fifteen parameters (logo, cleavage, coat, vertical view, horizontal view, diameter, thickness, weight, smell, outside color, inside color, color, toughness, capping, and appearance of logo) were measured to establish the
Microgram Journal, Volume 1, Numbers 3-4 (July - December 2003) 169
Brought to you by AltGov2 [www.altgov2.org]
physical characteristics of each tablet. The tablets were also photographed with a digital camera. An identification number was applied to each tablet, consisting of a logo number, color number, and serial number.
Extraction Procedure
Each tablet was placed in an agate mortar and crushed to a fine powder. A 10 mg portion of the resulting powder was dissolved in 8 mL of phosphate buffer (pH 7.0) by shaking for 5 minutes. The solution was centrifuged for 10 minutes at 3,500 rpm, and 100 :L of the supernatant liquid was transferred to a small autosampler vial for HPLC analysis. Half of the remaining solution (4 mL) was used for the identification of the basic compounds (e.g., ephedrine, MDA, MDMA, etc.), while the other half was used for the identification of the neutral compounds (i.e., caffeine). One mL of 10% Na2CO3 solution was added to adjust the first 4 mL aliquot of solution to pH 10.5, and the mixture was then extracted with 3 mL of chloroform by shaking for 5 minutes. The biphasic solution was then centrifuged at 3,500 rpm for 10 minutes, after which the organic layer was transferred to a vial for GC/MS analysis. The second 4 mL aliquot of solution (still at pH 7.0) was similarly extracted with 3 mL of chloroform, for identification of caffeine by GC/MS.
GC/MS Analysis
A GC/MS equipped with a Hewlett-Packard (HP) 6890 Series Gas Chromatograph, a double-focusing mass spectrometer Mstation (JEOL, Tokyo, Japan), and a data processing XMS system (JEOL, Tokyo, Japan), were used for identification of the components in the tablets. An Ultra-2 fused-silica capillary column (30 m x 0.2 mm with 0.33:m HP) was inserted directly into the ion source of the mass spectrometer, and analysis was performed in the splitless mode with Helium as the carrier gas. The GC temperature programming was run from 50 oC (1 minute) to 300 oC (4 minutes) at 10 oC /minute, with the injection port at 250 oC. Electron-impact ionization mass conditions were set as follows: Ionizing energy, 70 eV; ionization current, 300 :A; and ion-source temperature, 300 oC. Mass spectra were obtained using the scanning mode.
HPLC Analysis
A Shiseido Nanospace HPLC, equipped with a UV detector linked to a data system (S-MC, Shiseido, Tokyo, Japan), was used for qualitative and quantitative analysis of the components in the tablets. Chromatographic separation was achieved using an ODS-type semi-microcolumn (CAPCELL PAK C18 UG 120 S5, 250 mm x 1.5 mm i.d.). The mobile phase used for ephedrine, MDA, MDMA, MDEA, methamphetamine, and ketamine was 5 mmol/L SDS in 20 mmol/L KH2PO4-CH3CN (65:35). The mobile phase used for caffeine was H2O-methanol (7:3). The flow rate was maintained at 0.1 mL/minute. Separation was carried out at 50 oC for ephedrine, MDA, MDMA, MDEA, methamphetamine, and ketamine, and 35 oC for caffeine. The monitoring wavelength was 210 nm for ephedrine, MDA, MDMA, MDEA, methamphetamine, and ketamine, and 254 nm for caffeine. Good linearity for this quantitative analysis was confirmed over the concentration range of 0.1 – 0.8 mg/mL (r2 = 0.9993 – 0.9997 for six compounds).
Results and Discussion
Physical Characteristics
To date, there are few reports concerning the physical or chemical characteristics of Ecstasy tablets in Japan [3,4]. To aid in quick comparison, full-color photographs of all tablets are shown in order of the amount of MDMA or MDA as an active ingredient, followed by a group containing mixed drugs (Figure 1). The characteristic physical properties are listed in Table 1. The diameters ranged from 7.1 – 10.1 mm, the widths ranged from 2.6 – 7.0 mm, and the weights ranged from 105 – 348 mg.
Microgram Journal, Volume 1, Numbers 3-4 (July - December 2003) 170
Brought to you by AltGov2 [www.altgov2.org]
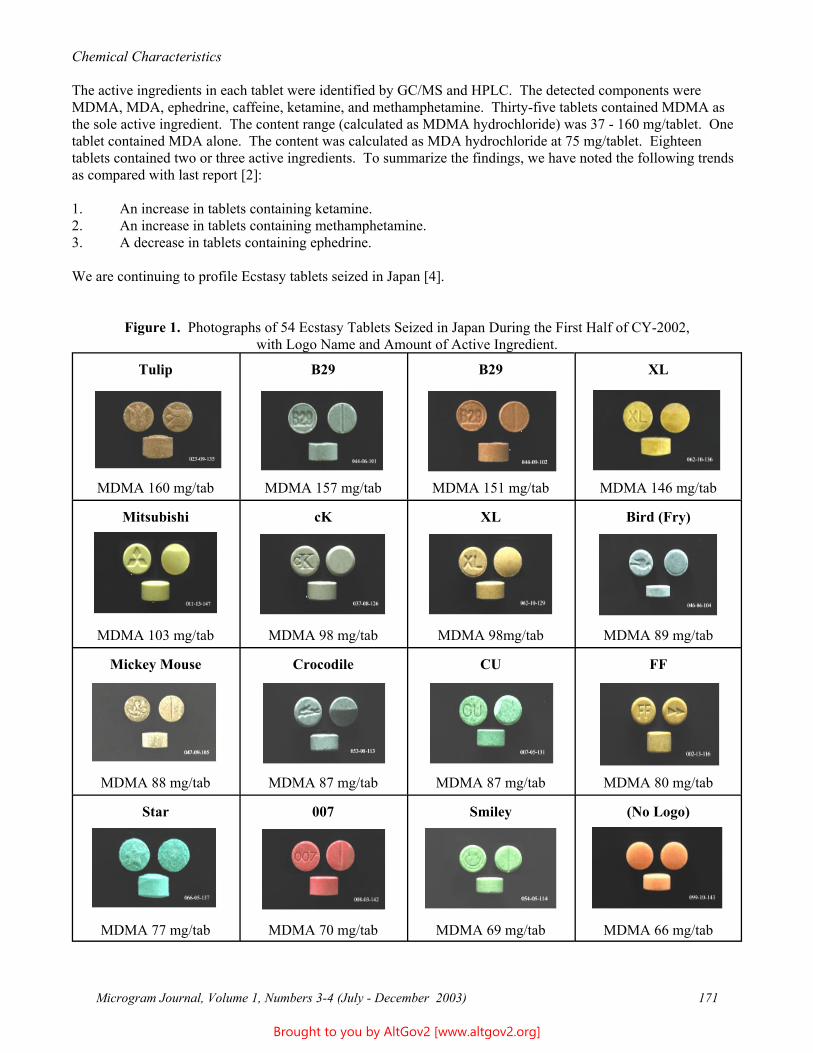
Chemical Characteristics
The active ingredients in each tablet were identified by GC/MS and HPLC. The detected components were MDMA, MDA, ephedrine, caffeine, ketamine, and methamphetamine. Thirty-five tablets contained MDMA as the sole active ingredient. The content range (calculated as MDMA hydrochloride) was 37 - 160 mg/tablet. One tablet contained MDA alone. The content was calculated as MDA hydrochloride at 75 mg/tablet. Eighteen tablets contained two or three active ingredients. To summarize the findings, we have noted the following trends as compared with last report [2]:
1. An increase in tablets containing ketamine. 2. An increase in tablets containing methamphetamine. 3. A decrease in tablets containing ephedrine.
We are continuing to profile Ecstasy tablets seized in Japan [4].
Figure 1. Photographs of 54 Ecstasy Tablets Seized in Japan During the First Half of CY-2002, with Logo Name and Amount of Active Ingredient.
Tulip B29 B29 XL
MDMA 160 mg/tab MDMA 157 mg/tab MDMA 151 mg/tab MDMA 146 mg/tab
Mitsubishi cK XL Bird (Fry)
MDMA 103 mg/tab MDMA 98 mg/tab MDMA 98mg/tab MDMA 89 mg/tab
Mickey Mouse Crocodile CU FF
MDMA 88 mg/tab MDMA 87 mg/tab MDMA 87 mg/tab MDMA 80 mg/tab
Star 007 Smiley (No Logo)
MDMA 77 mg/tab MDMA 70 mg/tab MDMA 69 mg/tab MDMA 66 mg/tab
Microgram Journal, Volume 1, Numbers 3-4 (July - December 2003) 171
Brought to you by AltGov2 [www.altgov2.org]
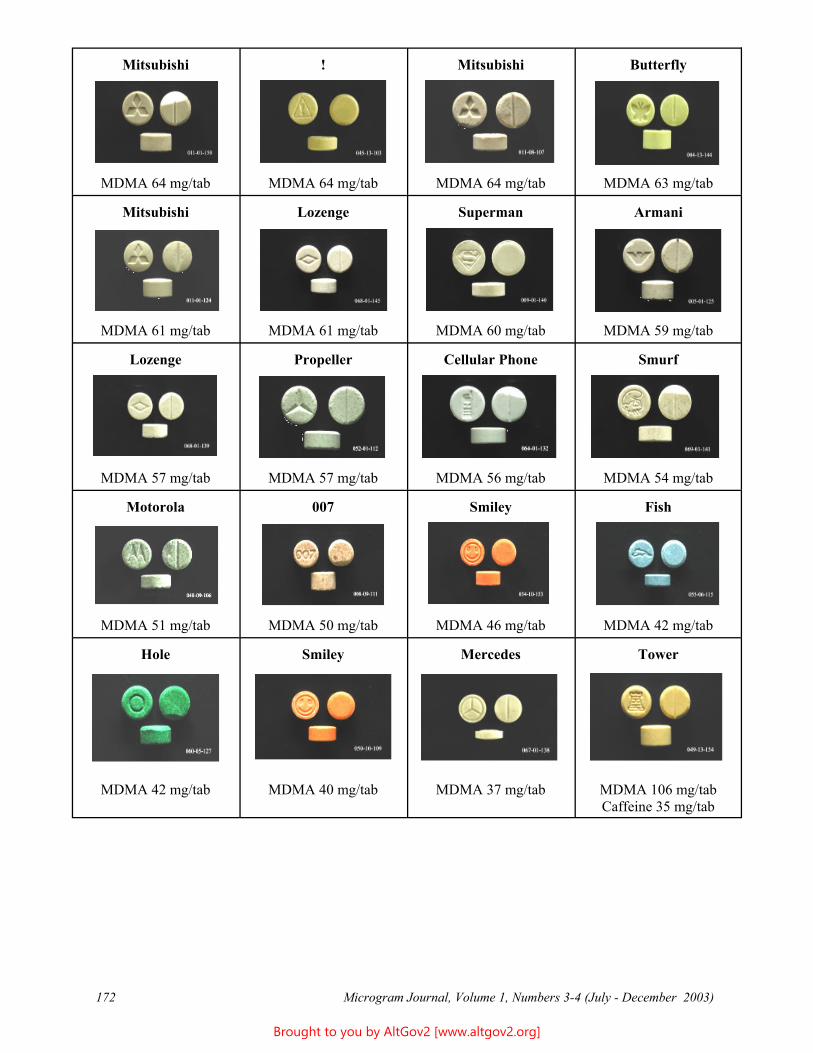
Mitsubishi ! Mitsubishi Butterfly
MDMA 64 mg/tab MDMA 64 mg/tab MDMA 64 mg/tab MDMA 63 mg/tab
Mitsubishi Lozenge Superman Armani
MDMA 61 mg/tab MDMA 61 mg/tab MDMA 60 mg/tab MDMA 59 mg/tab
Lozenge Propeller Cellular Phone Smurf
MDMA 57 mg/tab MDMA 57 mg/tab MDMA 56 mg/tab MDMA 54 mg/tab
Motorola 007 Smiley Fish
MDMA 51 mg/tab MDMA 50 mg/tab MDMA 46 mg/tab MDMA 42 mg/tab
Hole Smiley Mercedes Tower
MDMA 42 mg/tab MDMA 40 mg/tab MDMA 37 mg/tab MDMA 106 mg/tab Caffeine 35 mg/tab
Microgram Journal, Volume 1, Numbers 3-4 (July - December 2003) 172
Brought to you by AltGov2 [www.altgov2.org]
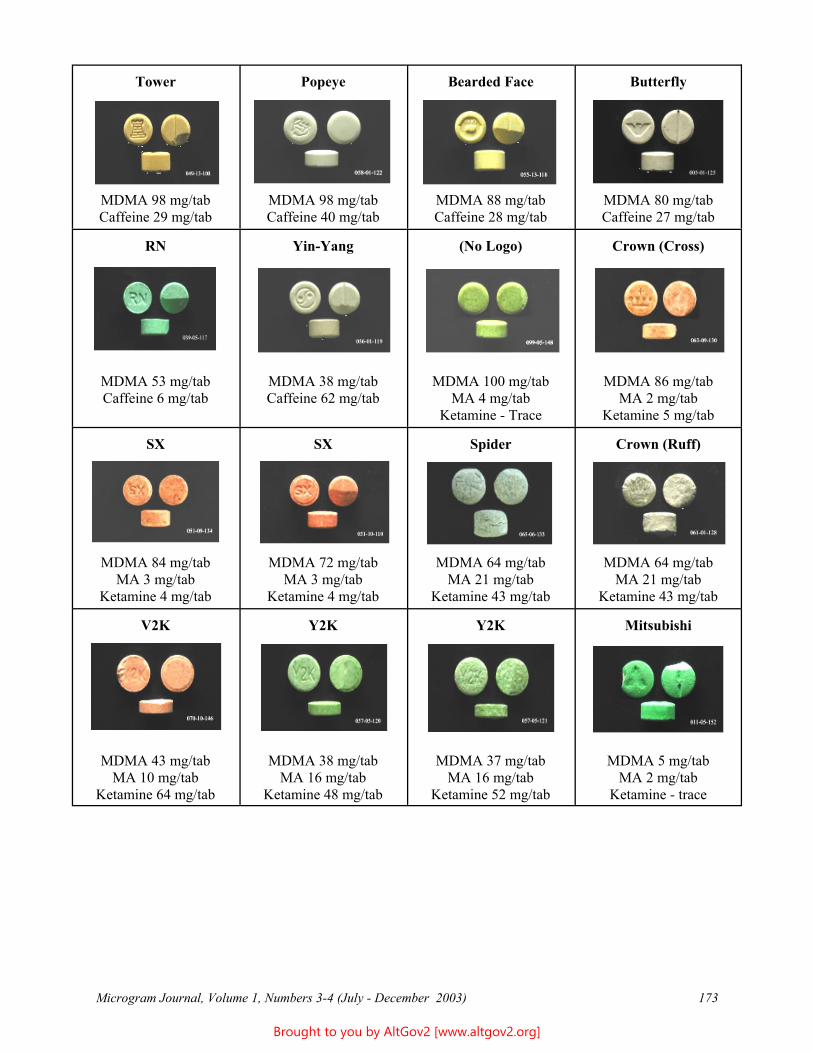
Tower Popeye Bearded Face Butterfly
MDMA 98 mg/tab MDMA 98 mg/tab MDMA 88 mg/tab MDMA 80 mg/tab Caffeine 29 mg/tab Caffeine 40 mg/tab Caffeine 28 mg/tab Caffeine 27 mg/tab
RN Yin-Yang (No Logo) Crown (Cross)
MDMA 53 mg/tab MDMA 38 mg/tab MDMA 100 mg/tab MDMA 86 mg/tab Caffeine 6 mg/tab Caffeine 62 mg/tab MA 4 mg/tab MA 2 mg/tab
Ketamine - Trace Ketamine 5 mg/tab
SX SX Spider Crown (Ruff)
MDMA 84 mg/tab MDMA 72 mg/tab MDMA 64 mg/tab MDMA 64 mg/tab MA 3 mg/tab MA 3 mg/tab MA 21 mg/tab MA 21 mg/tab
Ketamine 4 mg/tab Ketamine 4 mg/tab Ketamine 43 mg/tab Ketamine 43 mg/tab
V2K Y2K Y2K Mitsubishi
MDMA 43 mg/tab MDMA 38 mg/tab MDMA 37 mg/tab MDMA 5 mg/tab MA 10 mg/tab MA 16 mg/tab MA 16 mg/tab MA 2 mg/tab
Ketamine 64 mg/tab Ketamine 48 mg/tab Ketamine 52 mg/tab Ketamine - trace
Microgram Journal, Volume 1, Numbers 3-4 (July - December 2003) 173
Brought to you by AltGov2 [www.altgov2.org]
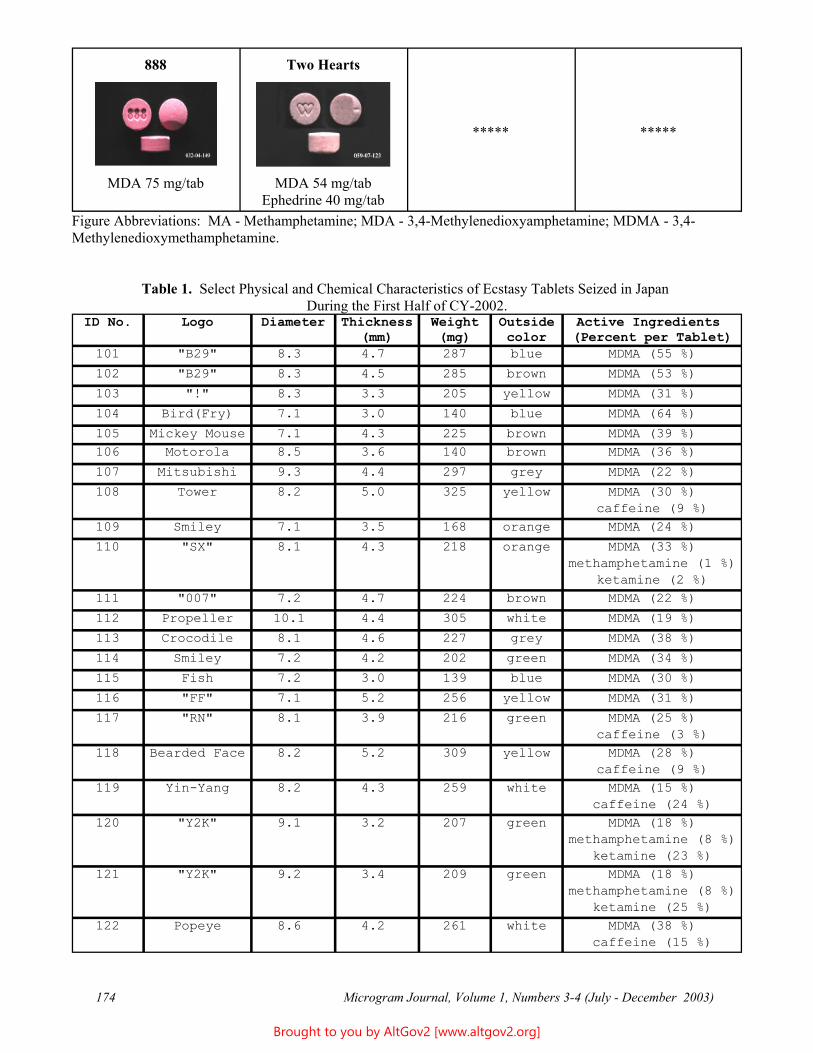
888 Two Hearts
***** *****
MDA 75 mg/tab MDA 54 mg/tab Ephedrine 40 mg/tab
Figure Abbreviations: MA - Methamphetamine; MDA - 3,4-Methylenedioxyamphetamine; MDMA - 3,4-Methylenedioxymethamphetamine.
Table 1. Select Physical and Chemical Characteristics of Ecstasy Tablets Seized in Japan During the First Half of CY-2002.
ID No. Logo Diameter Thickness (mm)
Weight(mg)
Outside color
Active Ingredients(Percent per Tablet)
101 "B29" 8.3 4.7 287 blue MDMA (55 %)
102 "B29" 8.3 4.5 285 brown MDMA (53 %)
103 "!" 8.3 3.3 205 yellow MDMA (31 %)
104 Bird(Fry) 7.1 3.0 140 blue MDMA (64 %)
105 Mickey Mouse 7.1 4.3 225 brown MDMA (39 %)106 Motorola 8.5 3.6 140 brown MDMA (36 %)
107 Mitsubishi 9.3 4.4 297 grey MDMA (22 %)
108 Tower 8.2 5.0 325 yellow MDMA (30 %)caffeine (9 %)
109 Smiley 7.1 3.5 168 orange MDMA (24 %)
110 "SX" 8.1 4.3 218 orange MDMA (33 %)methamphetamine (1 %)
ketamine (2 %)111 "007" 7.2 4.7 224 brown MDMA (22 %)
112 Propeller 10.1 4.4 305 white MDMA (19 %)
113 Crocodile 8.1 4.6 227 grey MDMA (38 %)
114 Smiley 7.2 4.2 202 green MDMA (34 %)
115 Fish 7.2 3.0 139 blue MDMA (30 %)
116 "FF" 7.1 5.2 256 yellow MDMA (31 %)
117 "RN" 8.1 3.9 216 green MDMA (25 %)caffeine (3 %)
118 Bearded Face 8.2 5.2 309 yellow MDMA (28 %)caffeine (9 %)
119 Yin-Yang 8.2 4.3 259 white MDMA (15 %)caffeine (24 %)
120 "Y2K" 9.1 3.2 207 green MDMA (18 %)methamphetamine (8 %)
ketamine (23 %)121 "Y2K" 9.2 3.4 209 green MDMA (18 %)
methamphetamine (8 %)ketamine (25 %)
122 Popeye 8.6 4.2 261 white MDMA (38 %)caffeine (15 %)
174 Microgram Journal, Volume 1, Numbers 3-4 (July - December 2003)
Brought to you by AltGov2 [www.altgov2.org]
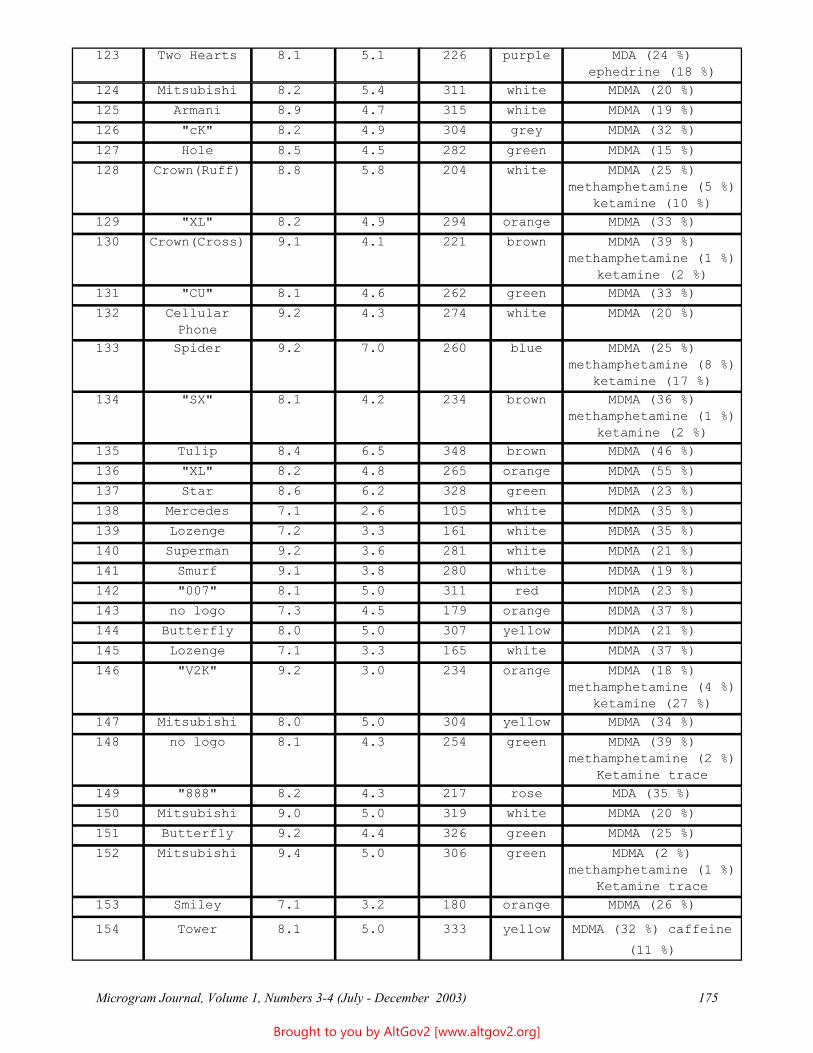
123 Two Hearts 8.1 5.1 226 purple MDA (24 %)ephedrine (18 %)
124 Mitsubishi 8.2 5.4 311 white MDMA (20 %)
125 Armani 8.9 4.7 315 white MDMA (19 %)
126 "cK" 8.2 4.9 304 grey MDMA (32 %)
127 Hole 8.5 4.5 282 green MDMA (15 %)
128 Crown(Ruff) 8.8 5.8 204 white MDMA (25 %)methamphetamine (5 %)
ketamine (10 %)129 "XL" 8.2 4.9 294 orange MDMA (33 %)
130 Crown(Cross) 9.1 4.1 221 brown MDMA (39 %)methamphetamine (1 %)
ketamine (2 %)131 "CU" 8.1 4.6 262 green MDMA (33 %)
132 Cellular Phone
9.2 4.3 274 white MDMA (20 %)
133 Spider 9.2 7.0 260 blue MDMA (25 %)methamphetamine (8 %)
ketamine (17 %)134 "SX" 8.1 4.2 234 brown MDMA (36 %)
methamphetamine (1 %)ketamine (2 %)
135 Tulip 8.4 6.5 348 brown MDMA (46 %)
136 "XL" 8.2 4.8 265 orange MDMA (55 %)
137 Star 8.6 6.2 328 green MDMA (23 %)
138 Mercedes 7.1 2.6 105 white MDMA (35 %)
139 Lozenge 7.2 3.3 161 white MDMA (35 %)
140 Superman 9.2 3.6 281 white MDMA (21 %)
141 Smurf 9.1 3.8 280 white MDMA (19 %)
142 "007" 8.1 5.0 311 red MDMA (23 %)
143 no logo 7.3 4.5 179 orange MDMA (37 %)
144 Butterfly 8.0 5.0 307 yellow MDMA (21 %)
145 Lozenge 7.1 3.3 165 white MDMA (37 %)
146 "V2K" 9.2 3.0 234 orange MDMA (18 %)methamphetamine (4 %)
ketamine (27 %)147 Mitsubishi 8.0 5.0 304 yellow MDMA (34 %)
148 no logo 8.1 4.3 254 green MDMA (39 %)methamphetamine (2 %)
Ketamine trace 149 "888" 8.2 4.3 217 rose MDA (35 %)
150 Mitsubishi 9.0 5.0 319 white MDMA (20 %)
151 Butterfly 9.2 4.4 326 green MDMA (25 %)
152 Mitsubishi 9.4 5.0 306 green MDMA (2 %)methamphetamine (1 %)
Ketamine trace 153 Smiley 7.1 3.2 180 orange MDMA (26 %)
154 Tower 8.1 5.0 333 yellow MDMA (32 %) caffeine
(11 %)
Microgram Journal, Volume 1, Numbers 3-4 (July - December 2003) 175
Brought to you by AltGov2 [www.altgov2.org]
Acknowledgments
The present work was supported by a Health Sciences Research Grant from the Ministry of Health, Labour and Welfare, Japan.
References
1. The General Situation of Administrative Measures against Narcotics and Stimulants Abuse. Edited by The Compliance and Narcotics Division, Pharmaceutical and Food Safety Bureau, Ministry of Health, Labour and Welfare in Japan. 2003.
2. Makino Y, Tanaka S, Kurobane S, Nakauchi M, Terasaki T, Ohta, S. Profiling of illegal amphetamine-type stimulant tablets in Japan. Journal of Health Science 2003;49:129-137.
3. Katagi M, Tsutsumi H, Miki A, Nakajima K, Tsuchihashi H. Analyses of clandestine tablets of amphetamines and their designer drugs encountered in recent Japan. Japanese Journal of Forensic Toxicology 2002;20:303-319.
4. Makino Y. The current situation and future issue of forensic examination of tablet form drugs (Ecstasy). Journal of Police Science 2004;57:111-122.
* * * * * * * * * * * * * * * * * * * * * * * * *
Microgram Journal, Volume 1, Numbers 3-4 (July - December 2003) 176
Brought to you by AltGov2 [www.altgov2.org]
Technical Note
A Rapid Extraction and GC/MS Methodology for the Identification of Psilocyn in Mushroom/Chocolate Concoctions
Mohammad Sarwar*, Ph.D., and John L. McDonald, B.S. Illinois State Police
Division of Forensic Services Forensic Science Center at Chicago
1941 W. Roosevelt Road Chicago, IL 60608
[email: msarwar36 -at- yahoo.com
ABSTRACT: A simple, convenient, and rapid method for the identification of psilocyn in hallucinogenic mushroom/chocolate concoctions is presented. A 10% solution of acetic acid is used to extract psilocyn from the mushrooms. The acidic solution is then basified with solid sodium bicarbonate, then extracted with chloroform. The resulting extract is then back-washed to remove theobromine and caffeine from the chocolate, then concentrated and analyzed by TLC and GC/MS. The method takes about 30 minutes for mushroom/chocolate concoctions. A more simplified version of the method can be used for mushrooms, and takes about 15 minutes.
KEYWORDS: Forensic Science, Psilocyn, Extraction, Psilocybe Mushrooms, Mushroom/Chocolate Concoctions.
Introduction
Psilocyn and psilocybin, and the mushrooms containing these substances, are Schedule I substances under both Federal and Illinois state law. Psilocyn and psilocybin are hallucinogens, which act on the central nervous system to produce changes in perception, mood, and thinking ability. The effects produced by psilocyn and psilocybin are similar to those produced by LSD and mescaline (1-2). Since the mushrooms that produce these hallucinogens are easily cultivated, and spores, growing kits, and information are readily available through the Internet, increasing numbers of mushrooms and mushroom containing preparations (especially mushroom/chocolate concoctions, vide infra) are being encountered in forensic laboratories.
The life cycle of mushrooms has four stages, namely spores, the mycelium, pinhead or the primordial, and the mature fruit. The spores are actually the seeds of the fungi. Mushrooms cannot be classified as plants because they lack a root system, and do not have leaves, flowers, or the main constituent of plants, chlorophyll. Plants get their food through roots and leaves through photosynthesis, while mushrooms get their food or nutrients from the surrounding environment. The four species of mushrooms that contain psilocyn and psilocybin are strophariaceae, bolbitiaceae, coprinaceae, and cortinariaceae (3-5).
Psilocyn, psilocybin, and various other alkaloids are found naturally in all four above listed species of mushrooms. The mature fungi are sold in the underground market in both whole and powdered forms. More recently, various mushroom-containing concoctions have become popular, especially grated or powdered mushrooms in chocolate (6). A number of such cases have been received at this laboratory over the past year.
The most common analytical techniques reported in the literature for analysis of hallucinogenic mushrooms are all based on methanol extraction. In the most common procedure, the mushrooms are simply soaked in methanol overnight, and the resulting extracts condensed to near dryness and then analyzed using TLC and GC/MS (7-8). A more rapid technique involves placing the mushrooms in a closed vial with methanol, heating for a half an hour, then heating to dryness; the resulting residue is taken into 0.1 N sodium hydroxide, then extracted with
Microgram Journal, Volume 1, Numbers 3-4 (July - December 2003) 177
Brought to you by AltGov2 [www.altgov2.org]
butyl chloride. The butyl chloride extract is then back-extracted with 0.1 N sulfuric acid, and the UV spectrum recorded in acidic and basic media. The basic solution is further extracted with butyl chloride, and the extract evaporated to dryness; the resulting powder is then analyzed by IR (9). In another, longer method, the mushrooms are dried at 40 /C in an oven for 16 hours, ground, and then soaked in methanol for 24 hours. The volume is reduced and then analyzed by HPLC (10). In a more rapid method using a buffer extraction, ground mushrooms are triturated in a rotary mixer with 10% ammonium nitrate in methanol for 30 minutes, then two methanol extractions are performed, and the combined methanol extracts analyzed by HPLC (11). Quantitative determination of psilocybin and psilocyn is accomplished by stirring freeze dried mushrooms in methanol for 12 hours, followed by analysis by HPLC and TLC (12). In a more refined method, the mushrooms are extracted with methanol, and the co-extracted sugars then precipitated with acetone; the resulting solution is concentrated prior to analysis by GC/MS (13). The aqueous extraction of psilocyn was achieved by using dilute acetic acid, adjusting the pH with glacial acetic acid, and heating the contents for one hour. The pH of the solution was then raised by the addition of ammonium hydroxide, and psilocyn extracted with diethyl ether. The latter method was also applicable to pure mushrooms but was more time consuming (14).
As noted above, mushroom/chocolate concoctions have become popular. The isolation and identification of psilocyn and psilocybin from mushrooms is somewhat problematic when the mushrooms have been grated or powdered and mixed with chocolate, because chocolate is a complex matrix containing a wide variety of components, many of which are soluble in methanol. Thus, the standard methanolic extraction techniques detailed above are almost inapplicable to mushroom/chocolate concoctions. In one recently described method, the concoction is soaked in dilute sulfuric acid and then washed with chloroform or methylene chloride. The aqueous layer is then basified with sodium hydroxide to pH 10, then extracted with chloroform (15-16). However, a clean peak of psilocyn was not obtainable even after multiple washings. Moreover, psilocyn is unstable at higher pH values (17). A short review on the methods of extraction for psilocyn can be read elsewhere (18).
In general, methanolic extraction procedures are very time consuming. Most procedures either involve an “overnight” extraction or heating. In addition, methanolic extractions of psilocybe mushrooms usually co-extract other indolic compounds (and other methanol soluble components), some of which can mask the psilocyn and psilocybin peaks in GC or GC/MS analyses. And as noted above, methanolic extraction is poorly suited for mushroom/chocolate concoctions. Herein, we present a new method for the extraction of psilocyn from such concoctions. The extraction takes about fifteen minutes for pure mushrooms, and about half an hour for mushroom/chocolate concoctions. In addition, large number of samples can be analyzed in a relatively short period of time.
Materials and Methods
Reagents: (1) A 10% acetic acid by volume (Analytical Reagent); ( 2) Chloroform (A.R.); (3) Sodium bicarbonate (A.R.); (4) Deionized water; and (5) Ehrlichs reagent.
Equipment: GC/MS (HP 6890/5973), centrifuge, pestle and mortar.
Procedure for Pure Mushrooms:
1. About 0.2 to 0.5 gram of mushrooms are transferred into a mortar. 2. The mushrooms are covered with 10 % acetic acid, and ground with the help of a pestle. 3. Another 5 mL of deionized water are added and the mixture is ground into a fine slurry. 4. The slurry is then transferred into a test tube and centrifuged for about 3 minutes. 5. The supernatant is transferred into a small beaker 6. The supernatant is neutralized by adding small amounts of sodium bicarbonate (neutralization is judged to
be complete when the foamy effervescence stops). A little excess bicarbonate is then added. 7. The resulting solution is transferred into a test tube and extracted with an equal amount of chloroform.
Microgram Journal, Volume 1, Numbers 3-4 (July - December 2003) 178
Brought to you by AltGov2 [www.altgov2.org]
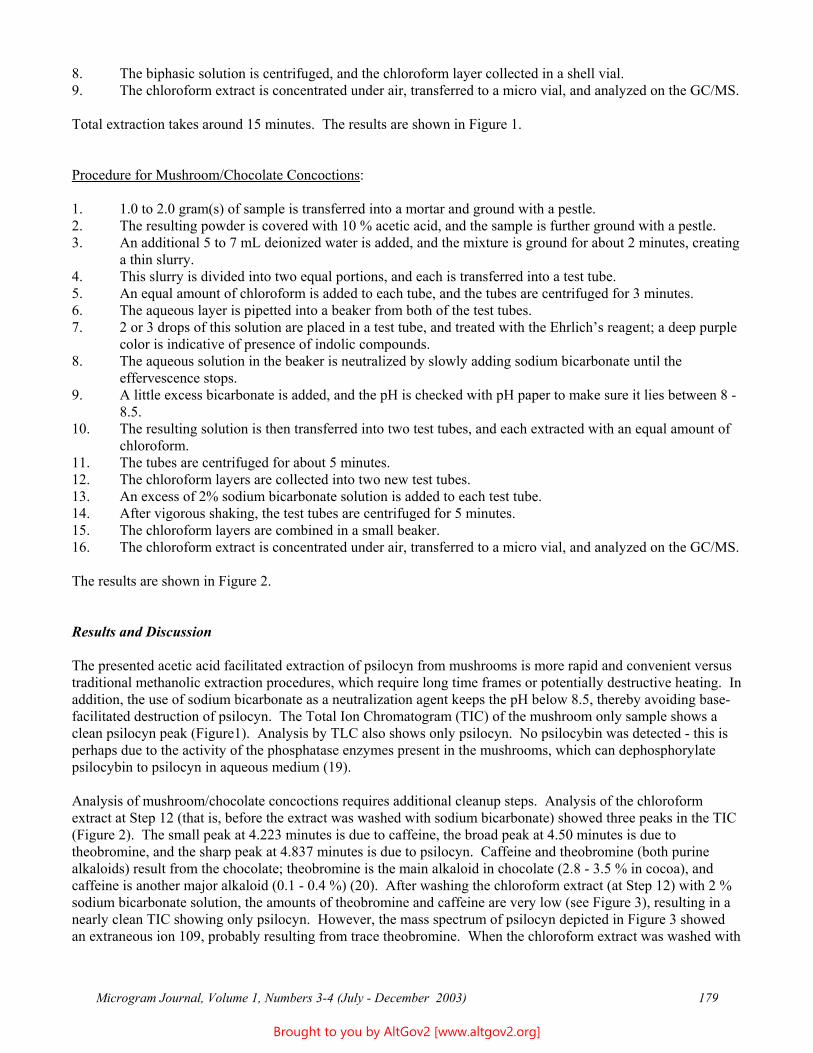
8. The biphasic solution is centrifuged, and the chloroform layer collected in a shell vial. 9. The chloroform extract is concentrated under air, transferred to a micro vial, and analyzed on the GC/MS.
Total extraction takes around 15 minutes. The results are shown in Figure 1.
Procedure for Mushroom/Chocolate Concoctions:
1. 1.0 to 2.0 gram(s) of sample is transferred into a mortar and ground with a pestle. 2. The resulting powder is covered with 10 % acetic acid, and the sample is further ground with a pestle. 3. An additional 5 to 7 mL deionized water is added, and the mixture is ground for about 2 minutes, creating
a thin slurry. 4. This slurry is divided into two equal portions, and each is transferred into a test tube. 5. An equal amount of chloroform is added to each tube, and the tubes are centrifuged for 3 minutes. 6. The aqueous layer is pipetted into a beaker from both of the test tubes. 7. 2 or 3 drops of this solution are placed in a test tube, and treated with the Ehrlich’s reagent; a deep purple
color is indicative of presence of indolic compounds. 8. The aqueous solution in the beaker is neutralized by slowly adding sodium bicarbonate until the
effervescence stops. 9. A little excess bicarbonate is added, and the pH is checked with pH paper to make sure it lies between 8 -
8.5. 10. The resulting solution is then transferred into two test tubes, and each extracted with an equal amount of
chloroform. 11. The tubes are centrifuged for about 5 minutes. 12. The chloroform layers are collected into two new test tubes. 13. An excess of 2% sodium bicarbonate solution is added to each test tube. 14. After vigorous shaking, the test tubes are centrifuged for 5 minutes. 15. The chloroform layers are combined in a small beaker. 16. The chloroform extract is concentrated under air, transferred to a micro vial, and analyzed on the GC/MS.
The results are shown in Figure 2.
Results and Discussion
The presented acetic acid facilitated extraction of psilocyn from mushrooms is more rapid and convenient versus traditional methanolic extraction procedures, which require long time frames or potentially destructive heating. In addition, the use of sodium bicarbonate as a neutralization agent keeps the pH below 8.5, thereby avoiding base-facilitated destruction of psilocyn. The Total Ion Chromatogram (TIC) of the mushroom only sample shows a clean psilocyn peak (Figure1). Analysis by TLC also shows only psilocyn. No psilocybin was detected - this is perhaps due to the activity of the phosphatase enzymes present in the mushrooms, which can dephosphorylate psilocybin to psilocyn in aqueous medium (19).
Analysis of mushroom/chocolate concoctions requires additional cleanup steps. Analysis of the chloroform extract at Step 12 (that is, before the extract was washed with sodium bicarbonate) showed three peaks in the TIC (Figure 2). The small peak at 4.223 minutes is due to caffeine, the broad peak at 4.50 minutes is due to theobromine, and the sharp peak at 4.837 minutes is due to psilocyn. Caffeine and theobromine (both purine alkaloids) result from the chocolate; theobromine is the main alkaloid in chocolate (2.8 - 3.5 % in cocoa), and caffeine is another major alkaloid (0.1 - 0.4 %) (20). After washing the chloroform extract (at Step 12) with 2 % sodium bicarbonate solution, the amounts of theobromine and caffeine are very low (see Figure 3), resulting in a nearly clean TIC showing only psilocyn. However, the mass spectrum of psilocyn depicted in Figure 3 showed an extraneous ion 109, probably resulting from trace theobromine. When the chloroform extract was washed with
Microgram Journal, Volume 1, Numbers 3-4 (July - December 2003) 179
Brought to you by AltGov2 [www.altgov2.org]
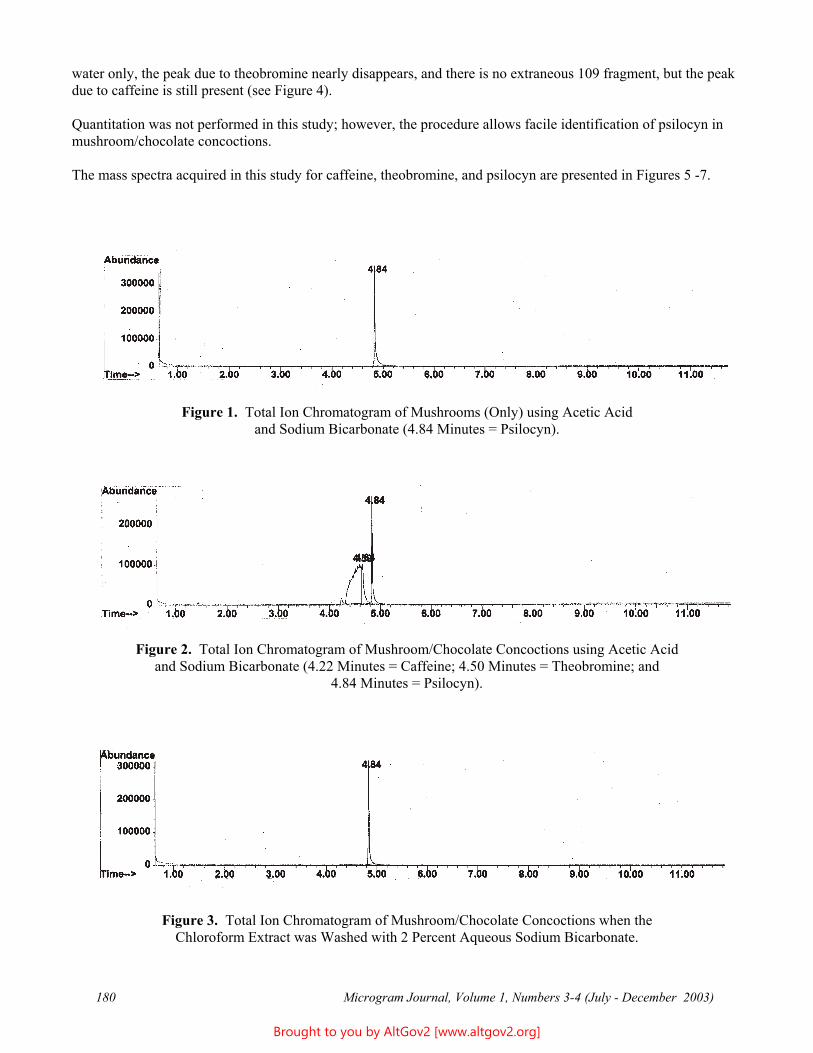
water only, the peak due to theobromine nearly disappears, and there is no extraneous 109 fragment, but the peak due to caffeine is still present (see Figure 4).
Quantitation was not performed in this study; however, the procedure allows facile identification of psilocyn in mushroom/chocolate concoctions.
The mass spectra acquired in this study for caffeine, theobromine, and psilocyn are presented in Figures 5 -7.
Figure 1. Total Ion Chromatogram of Mushrooms (Only) using Acetic Acid and Sodium Bicarbonate (4.84 Minutes = Psilocyn).
Figure 2. Total Ion Chromatogram of Mushroom/Chocolate Concoctions using Acetic Acid and Sodium Bicarbonate (4.22 Minutes = Caffeine; 4.50 Minutes = Theobromine; and
4.84 Minutes = Psilocyn).
Figure 3. Total Ion Chromatogram of Mushroom/Chocolate Concoctions when the Chloroform Extract was Washed with 2 Percent Aqueous Sodium Bicarbonate.
Microgram Journal, Volume 1, Numbers 3-4 (July - December 2003) 180
Brought to you by AltGov2 [www.altgov2.org]
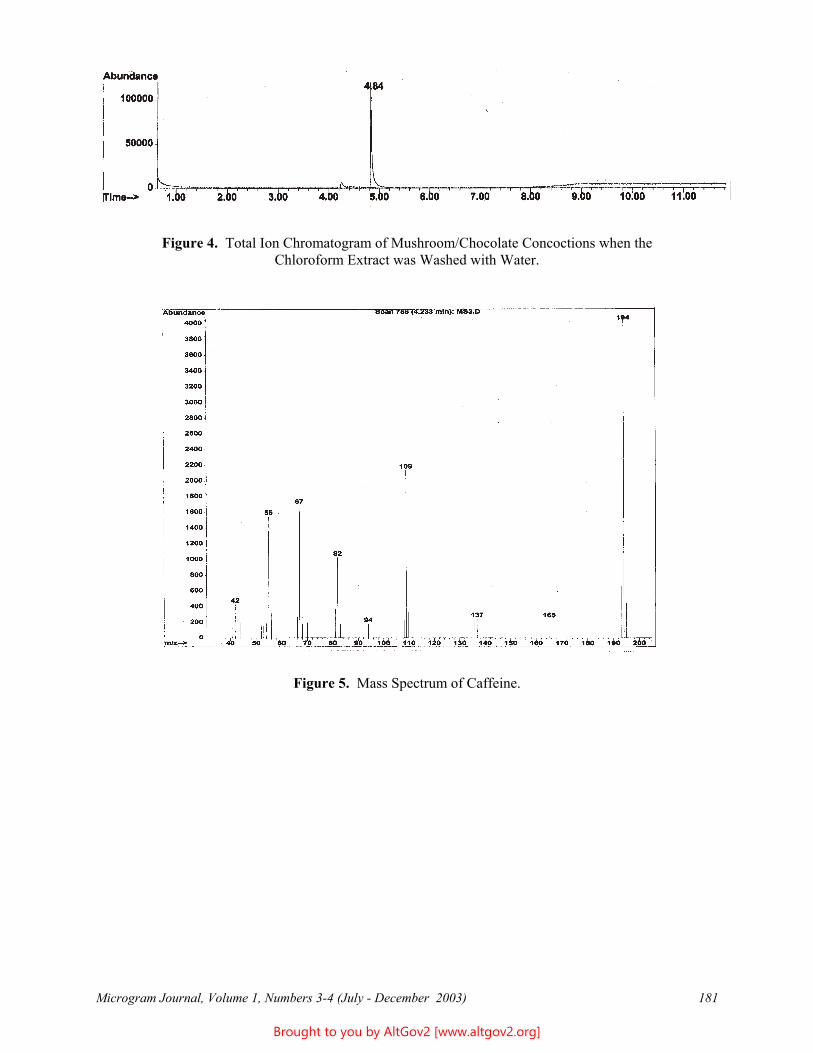
Figure 4. Total Ion Chromatogram of Mushroom/Chocolate Concoctions when the Chloroform Extract was Washed with Water.
Figure 5. Mass Spectrum of Caffeine.
Microgram Journal, Volume 1, Numbers 3-4 (July - December 2003) 181
Brought to you by AltGov2 [www.altgov2.org]
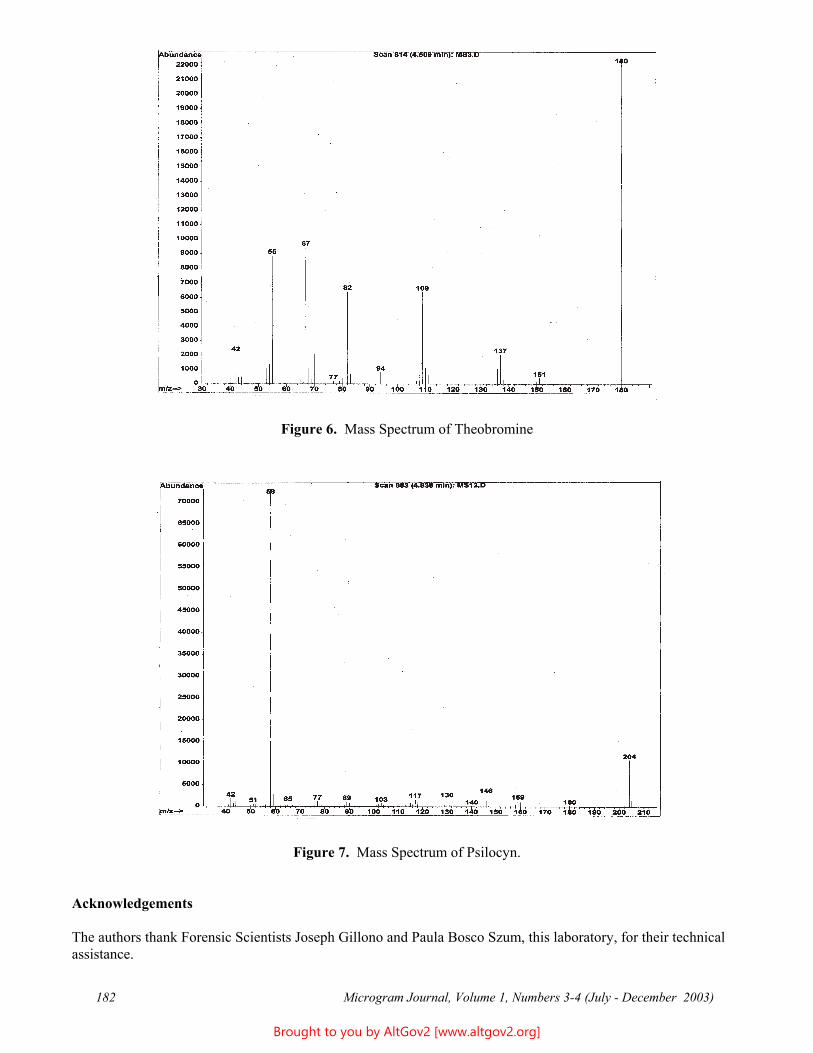
Figure 6. Mass Spectrum of Theobromine
Figure 7. Mass Spectrum of Psilocyn.
Acknowledgements
The authors thank Forensic Scientists Joseph Gillono and Paula Bosco Szum, this laboratory, for their technical assistance.
182 Microgram Journal, Volume 1, Numbers 3-4 (July - December 2003)
Brought to you by AltGov2 [www.altgov2.org]
References
1. Drugs of Abuse. US Department of Justice, Drug Enforcement Administration, 1997 Edition.
2. Aboul-Enein HY. Psilocybin: A pharmaceutical profile. Am Journal of Pharmacy. 1974;146(3):91-95.
3. Kaul TN. Introduction to mushroom science. Enfield, New Hampshire: Science Publishers, Inc., 1972.
4. McKnight KH, McKnight VB. A field guide to mushrooms. Boston: Houghton Mifflin Co., 1987.
5. Ammirati JF, Traquair JA, Horgen PA. Poisonous mushrooms of northern United States and Canada. Minneapolis: University of Minnesota Press, Inc., 1985.
6. Editor. “Homemade” chocolates containing psilocybin mushrooms appearing across the United States. Microgram Bulletin 2003;36(6):111 et seq.
7. Gross TS. Detecting Psychoactive drugs in the developmental stages of mushrooms. J Forensic Sci 2000;45(3):527-537.
8. Gross TS. Psychotropic Drugs in Developmental Mushrooms: A case study review. J Forensic Sci 2002;47(6):1298-1302.
9. Lee RE. Technique for the rapid isolation and identification of psilocyn from psilocybin containing mushrooms. J Forensic Sci 1985;30(3):931-941.
10. Thomson BM. Analysis of psilocybin and psilocyn in mushroom extracts by reversed phase HPLC. J Forensic Sci 1980;25(4):779-785.
11. Christiansen AL, Rasmussen KE, Tonnesen F. Determination of psilocybin in psilocybe Semilanceata using HPLC on silica column. Journal of Chromatography 1981;210:163-167.
12. Beug MW, Bigwood J. Quantitative analysis of psilocybin and psilocyn in psilocybe Baeocystis by HPLC and TLC. Journal of Chromatography 1981;207(3):163-167.
13. Timmons JE. Identification of psilocyn and psilocybin using gas chromatography and mass spectrometry. Microgram 1984;17(2):28-31.
14. Casale JF. An aqueous - organic extraction method for the isolation and identification of psilocyn from hallucinogenic mushrooms. J Forensic Sci 1985;30(1):247-250.
15. Microgram Bulletin. 2003; 36(6):113.
16. Microgram Bulletin 2003;36(8):174.
17. The Merck Index, 13th Ed., Merck and Co., Inc., Whitehouse Station, NJ, No.8016, p. 1418.
18. Sottolano SM, Lurie IS. The quantitation of psilocybin in hallucinogenic mushrooms using HPLC. J Forensic Sci 1983;28(4):929-935.
19. Gartz J. Extraction and analysis of indole derivatives from fungal biomass. Journal of Basic Microbiology 1994;34:17-22.
20. PDR for Herbal Medicines, 2nd Ed., Medical Economics Company, Motvale, NJ. 2000:199.
Microgram Journal, Volume 1, Numbers 3-4 (July - December 2003) 183
Brought to you by AltGov2 [www.altgov2.org]
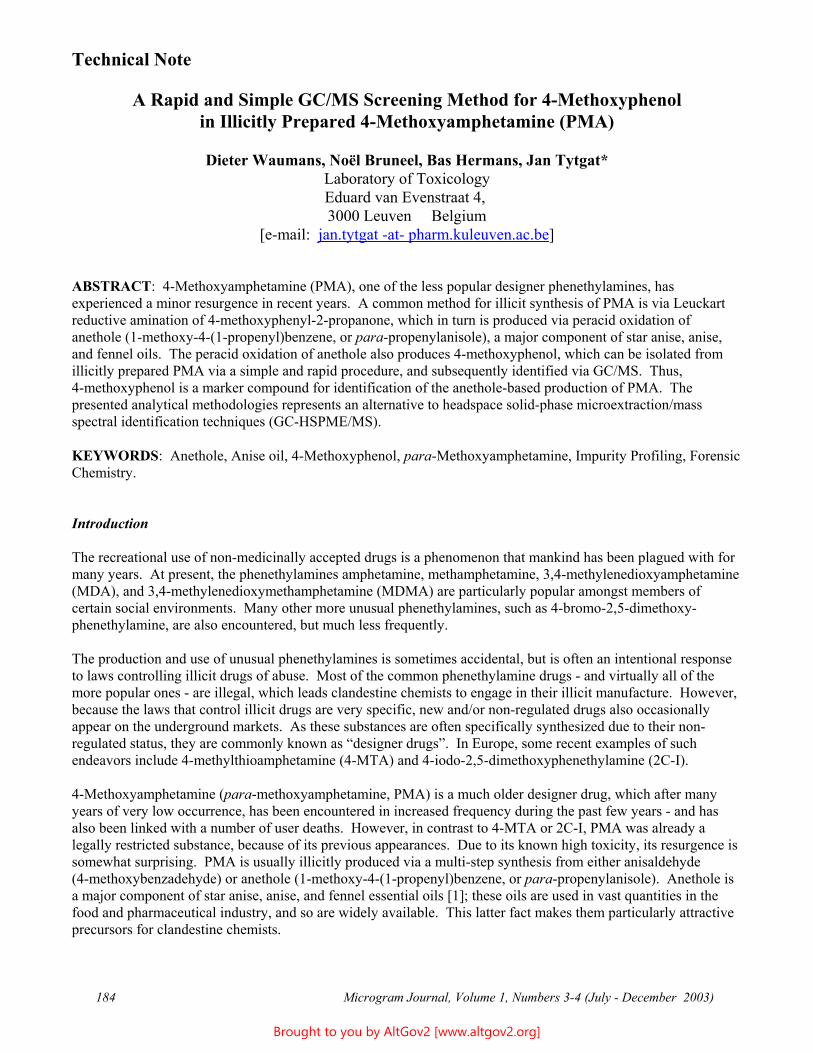
Technical Note
A Rapid and Simple GC/MS Screening Method for 4-Methoxyphenol in Illicitly Prepared 4-Methoxyamphetamine (PMA)
Dieter Waumans, Noël Bruneel, Bas Hermans, Jan Tytgat* Laboratory of Toxicology Eduard van Evenstraat 4, 3000 Leuven Belgium
[e-mail: jan.tytgat -at- pharm.kuleuven.ac.be]
ABSTRACT: 4-Methoxyamphetamine (PMA), one of the less popular designer phenethylamines, has experienced a minor resurgence in recent years. A common method for illicit synthesis of PMA is via Leuckart reductive amination of 4-methoxyphenyl-2-propanone, which in turn is produced via peracid oxidation of anethole (1-methoxy-4-(1-propenyl)benzene, or para-propenylanisole), a major component of star anise, anise, and fennel oils. The peracid oxidation of anethole also produces 4-methoxyphenol, which can be isolated from illicitly prepared PMA via a simple and rapid procedure, and subsequently identified via GC/MS. Thus, 4-methoxyphenol is a marker compound for identification of the anethole-based production of PMA. The presented analytical methodologies represents an alternative to headspace solid-phase microextraction/mass spectral identification techniques (GC-HSPME/MS).
KEYWORDS: Anethole, Anise oil, 4-Methoxyphenol, para-Methoxyamphetamine, Impurity Profiling, Forensic Chemistry.
Introduction
The recreational use of non-medicinally accepted drugs is a phenomenon that mankind has been plagued with for many years. At present, the phenethylamines amphetamine, methamphetamine, 3,4-methylenedioxyamphetamine (MDA), and 3,4-methylenedioxymethamphetamine (MDMA) are particularly popular amongst members of certain social environments. Many other more unusual phenethylamines, such as 4-bromo-2,5-dimethoxy-phenethylamine, are also encountered, but much less frequently.
The production and use of unusual phenethylamines is sometimes accidental, but is often an intentional response to laws controlling illicit drugs of abuse. Most of the common phenethylamine drugs - and virtually all of the more popular ones - are illegal, which leads clandestine chemists to engage in their illicit manufacture. However, because the laws that control illicit drugs are very specific, new and/or non-regulated drugs also occasionally appear on the underground markets. As these substances are often specifically synthesized due to their non-regulated status, they are commonly known as “designer drugs”. In Europe, some recent examples of such endeavors include 4-methylthioamphetamine (4-MTA) and 4-iodo-2,5-dimethoxyphenethylamine (2C-I).
4-Methoxyamphetamine (para-methoxyamphetamine, PMA) is a much older designer drug, which after many years of very low occurrence, has been encountered in increased frequency during the past few years - and has also been linked with a number of user deaths. However, in contrast to 4-MTA or 2C-I, PMA was already a legally restricted substance, because of its previous appearances. Due to its known high toxicity, its resurgence is somewhat surprising. PMA is usually illicitly produced via a multi-step synthesis from either anisaldehyde (4-methoxybenzadehyde) or anethole (1-methoxy-4-(1-propenyl)benzene, or para-propenylanisole). Anethole is a major component of star anise, anise, and fennel essential oils [1]; these oils are used in vast quantities in the food and pharmaceutical industry, and so are widely available. This latter fact makes them particularly attractive precursors for clandestine chemists.
Microgram Journal, Volume 1, Numbers 3-4 (July - December 2003) 184
Brought to you by AltGov2 [www.altgov2.org]
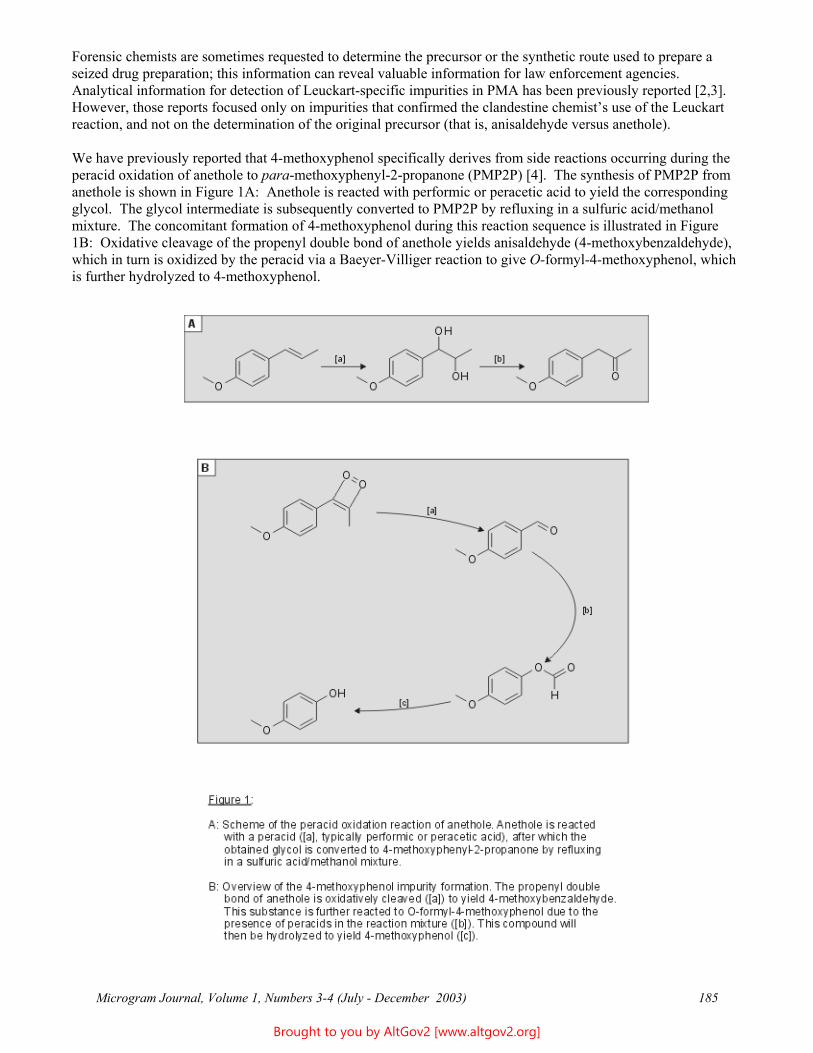
Forensic chemists are sometimes requested to determine the precursor or the synthetic route used to prepare a seized drug preparation; this information can reveal valuable information for law enforcement agencies. Analytical information for detection of Leuckart-specific impurities in PMA has been previously reported [2,3]. However, those reports focused only on impurities that confirmed the clandestine chemist’s use of the Leuckart reaction, and not on the determination of the original precursor (that is, anisaldehyde versus anethole).
We have previously reported that 4-methoxyphenol specifically derives from side reactions occurring during the peracid oxidation of anethole to para-methoxyphenyl-2-propanone (PMP2P) [4]. The synthesis of PMP2P from anethole is shown in Figure 1A: Anethole is reacted with performic or peracetic acid to yield the corresponding glycol. The glycol intermediate is subsequently converted to PMP2P by refluxing in a sulfuric acid/methanol mixture. The concomitant formation of 4-methoxyphenol during this reaction sequence is illustrated in Figure 1B: Oxidative cleavage of the propenyl double bond of anethole yields anisaldehyde (4-methoxybenzaldehyde), which in turn is oxidized by the peracid via a Baeyer-Villiger reaction to give O-formyl-4-methoxyphenol, which is further hydrolyzed to 4-methoxyphenol.
Microgram Journal, Volume 1, Numbers 3-4 (July - December 2003) 185
Brought to you by AltGov2 [www.altgov2.org]
We have previously reported the use of headspace solid-phase microextraction - GC/MS (GC-HSPME/MS) technique for detection of 4-methoxyphenol in illicitly prepared PMA [4]; however, this methodology is not yet generally available in forensic laboratories. Herein we report a more simple and rapid technique for extraction and identification of 4-methoxyphenol.
Experimental
Chemicals
All solvents were analytical grade and were purchased from Acros Organics (Geel, Belgium). Anise oil was obtained from Taiga International NV (Breendonk-Puurs, Belgium). Unless otherwise stated, all other chemical substances were procured from Merck (Darmstadt, Germany).
Instrumentation
Gas Chromatography-Mass Spectrometry (GC/MS) analysis were run using an Agilent 6890 Plus Gas Chromatograph (GC) equipped with an Agilent 5973N Mass Selective Detector (MSD), with electronic pressure programming. For the GC, Helium was used as a carrier gas at a constant flow rate of 1.0 mL/min; the column was a 30 m x 0.25 mm x 0.25 :m VF-5MS Factor-Four capillary (Varian). Oven programming was as follows: 50/C (held for 1 min), 35/C/min to 100/C, 10/C/min to 270/C (held for 5 min). A standard split/splitless liner was applied for liquid injections. The injector temperature was maintained at 280/C. For liquid injections (1 :L), the apparatus was run in splitless or split mode (1:50), depending on the nature of the sample. The mass spectrometer (MS) was operated from 36 to 400 amu in electron impact (EI) mode, with an ionization energy of 70 eV. A solvent delay of 4.00 minutes was applied.
Performic Acid Oxidation of Anethole
A 250 mL round-bottomed flask was equipped with a magnetic stirbar and a thermometer, and charged with a solution of 6.0 grams of anise oil in 30 mL acetone. Performic acid solution (prepared by combining 7.0 grams of 30 % hydrogen peroxide with 25.0 grams of formic acid) was added at such a rate that the reaction mixture temperature did not exceed 38/C. After addition of the performic acid solution, the reaction was allowed to sit for about 12 hours. The resulting mixture was poured into an equal volume of cold distilled water, then extracted with 2 x 50 mL dichloromethane. The yellow organic phase was isolated and washed with 75 mL of distilled water, after which the organic phase was dried over anhydrous sodium sulfate. An aliquot of 1 :L was subsequently injected on the GC/MS.
Sample Preparation
An aliquot of a drug preparation (100 mg for powders, 75 mg for pulverized tablet) was dissolved in 5 mL 0.1 N hydrochloric acid, after which 5 mL dichloromethane was added. The mixture was vigorously shaken for about one minute, after which the organic layer was isolated and dried over anhydrous sodium sulfate. An aliquot of 1 :L was subsequently injected on the GC/MS.
Results and Discussion
4-Methoxyphenol as Specific Peracid Oxidation Marker
We have previously analyzed star anise oil, anise oil, and fennel oil (all natural sources of anethole), and determined that 4-methoxyphenol is not naturally present in any of these essential oils. In addition, there are no literature reports of 4-methoxyphenol being present in these oils. Our analysis of commercial anisaldehyde
Microgram Journal, Volume 1, Numbers 3-4 (July - December 2003) 186
Brought to you by AltGov2 [www.altgov2.org]
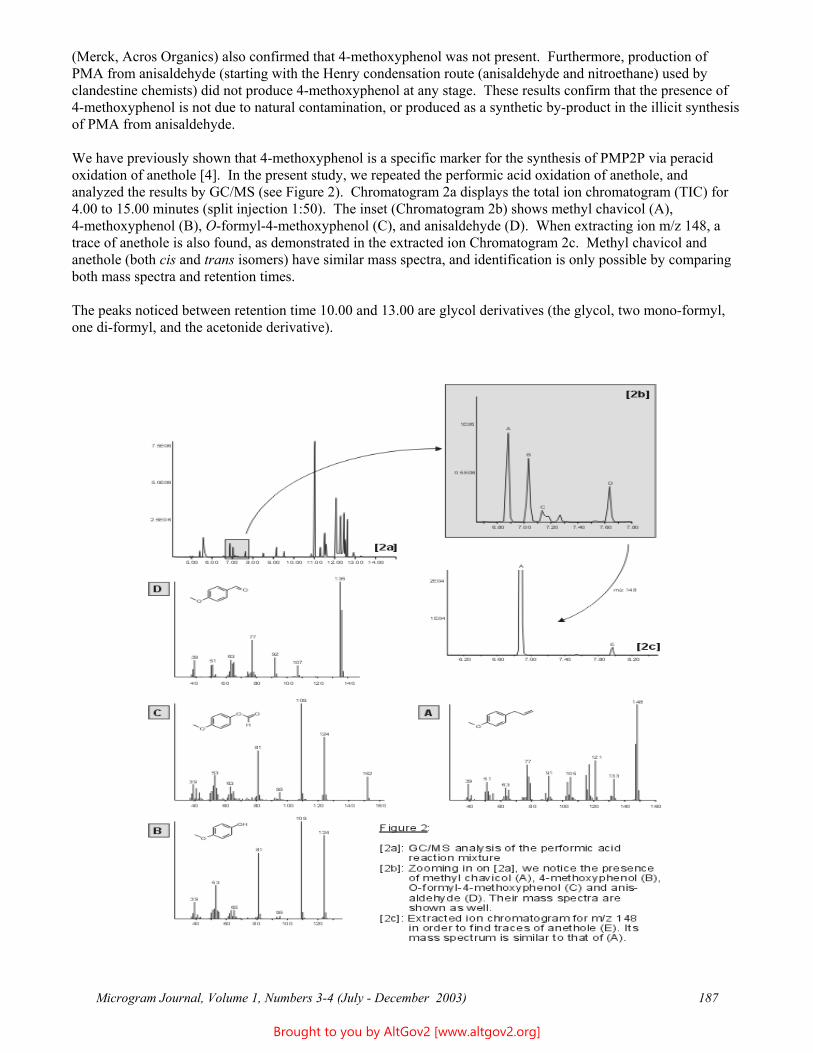
(Merck, Acros Organics) also confirmed that 4-methoxyphenol was not present. Furthermore, production of PMA from anisaldehyde (starting with the Henry condensation route (anisaldehyde and nitroethane) used by clandestine chemists) did not produce 4-methoxyphenol at any stage. These results confirm that the presence of 4-methoxyphenol is not due to natural contamination, or produced as a synthetic by-product in the illicit synthesis of PMA from anisaldehyde.
We have previously shown that 4-methoxyphenol is a specific marker for the synthesis of PMP2P via peracid oxidation of anethole [4]. In the present study, we repeated the performic acid oxidation of anethole, and analyzed the results by GC/MS (see Figure 2). Chromatogram 2a displays the total ion chromatogram (TIC) for 4.00 to 15.00 minutes (split injection 1:50). The inset (Chromatogram 2b) shows methyl chavicol (A), 4-methoxyphenol (B), O-formyl-4-methoxyphenol (C), and anisaldehyde (D). When extracting ion m/z 148, a trace of anethole is also found, as demonstrated in the extracted ion Chromatogram 2c. Methyl chavicol and anethole (both cis and trans isomers) have similar mass spectra, and identification is only possible by comparing both mass spectra and retention times.
The peaks noticed between retention time 10.00 and 13.00 are glycol derivatives (the glycol, two mono-formyl, one di-formyl, and the acetonide derivative).
Microgram Journal, Volume 1, Numbers 3-4 (July - December 2003) 187
Brought to you by AltGov2 [www.altgov2.org]
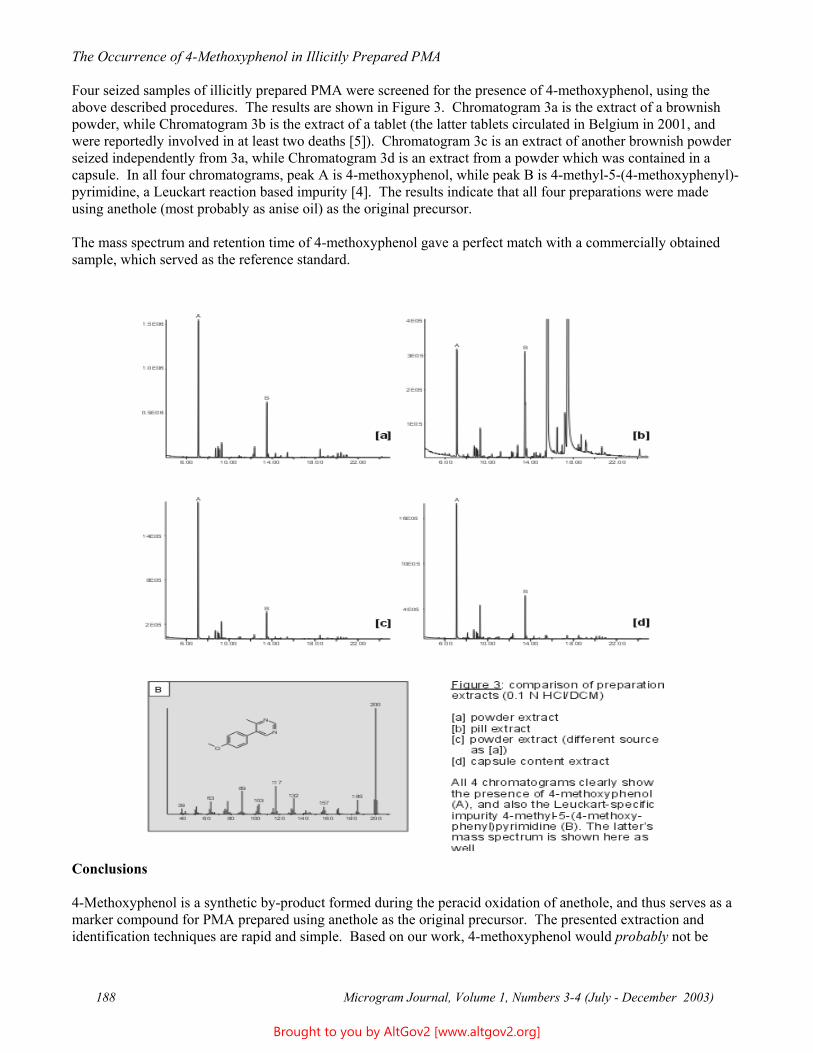
The Occurrence of 4-Methoxyphenol in Illicitly Prepared PMA
Four seized samples of illicitly prepared PMA were screened for the presence of 4-methoxyphenol, using the above described procedures. The results are shown in Figure 3. Chromatogram 3a is the extract of a brownish powder, while Chromatogram 3b is the extract of a tablet (the latter tablets circulated in Belgium in 2001, and were reportedly involved in at least two deaths [5]). Chromatogram 3c is an extract of another brownish powder seized independently from 3a, while Chromatogram 3d is an extract from a powder which was contained in a capsule. In all four chromatograms, peak A is 4-methoxyphenol, while peak B is 4-methyl-5-(4-methoxyphenyl)-pyrimidine, a Leuckart reaction based impurity [4]. The results indicate that all four preparations were made using anethole (most probably as anise oil) as the original precursor.
The mass spectrum and retention time of 4-methoxyphenol gave a perfect match with a commercially obtained sample, which served as the reference standard.
Conclusions
4-Methoxyphenol is a synthetic by-product formed during the peracid oxidation of anethole, and thus serves as a marker compound for PMA prepared using anethole as the original precursor. The presented extraction and identification techniques are rapid and simple. Based on our work, 4-methoxyphenol would probably not be
Microgram Journal, Volume 1, Numbers 3-4 (July - December 2003) 188
Brought to you by AltGov2 [www.altgov2.org]
present if the clandestine chemist performed a distillation to purify the intermediate 4-methoxyphenyl-2-propanone; however, few clandestine chemists perform such steps. In this study, the four illicitly prepared samples of PMA contained impurities from both the peracid oxidation and the Leuckart reductive amination reaction steps.
References
1. Guenther E. The essential oils. Vol IV, pp. 563-570; Vol IV, pp. 634-645; and Vol V, pp. 361-379. D. Van Nostrand Company, New York, 1950.
2. Blachut D, Wojtasiewicz K, Czarnochi ZC. Identification and synthesis of some contaminants present in 4-methoxyamphetamine (PMA) prepared by the Leuckart method. Forensic Sci Int 2003;127:45-62.
3. Coumbaros JC, Kirkbride KP, Klass G. Application of solid-phase microextraction to the profiling of an illicit drug: Manufacturing impurities in illicit 4-methoxyamphetamine (PMA). J Forensic Sci 1999;44(6):1237-1242.
4. Waumans D, Bruneel N, Tytgat J. Anise oil as para-methoxyamphetamine (PMA) precursor. Forensic Sci Int 2003;133:159-170.
5. Voorspoels S, Coucke V, Schepens P. para-Methoxyamphetamine: First fatalities in Belgium. Bulletin of the International Association of Forensic Toxicologists 2002;31(4):12-13.
* * * * * * * * * * * * * * * * * * * * * * * * *
Microgram Journal, Volume 1, Numbers 3-4 (July - December 2003) 189
Brought to you by AltGov2 [www.altgov2.org]
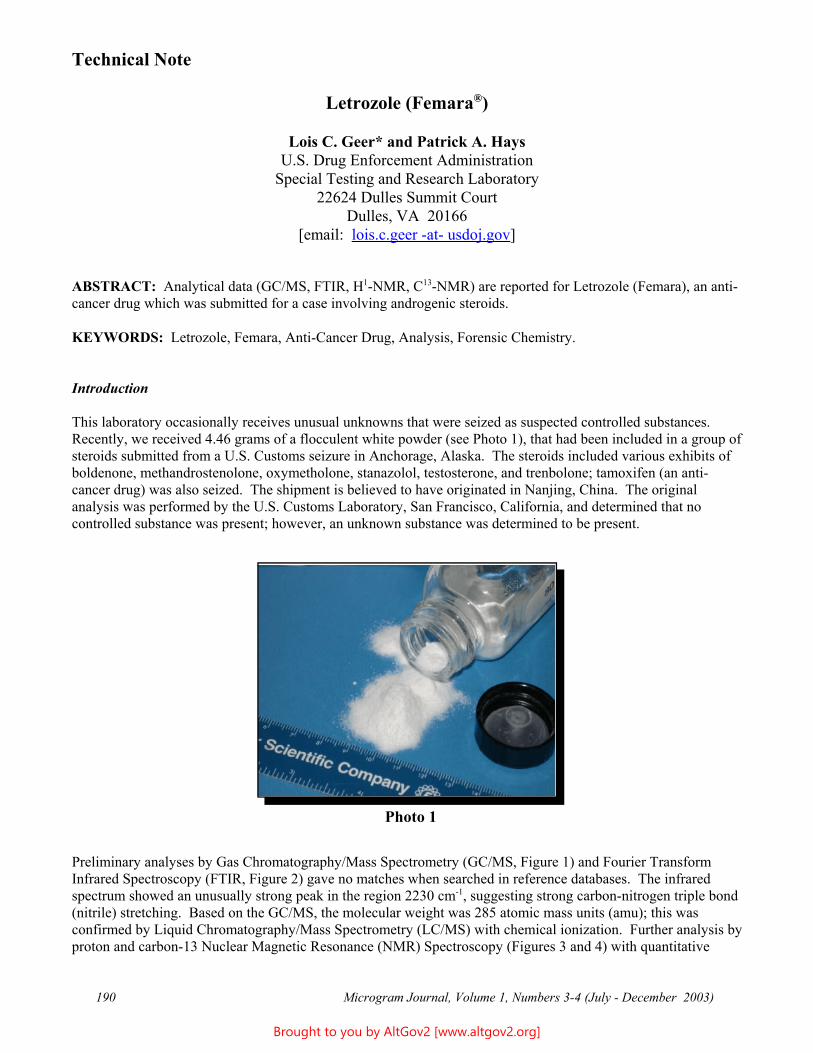
Technical Note
Letrozole (Femara®)
Lois C. Geer* and Patrick A. Hays U.S. Drug Enforcement Administration
Special Testing and Research Laboratory 22624 Dulles Summit Court
Dulles, VA 20166 [email: lois.c.geer -at- usdoj.gov]
ABSTRACT: Analytical data (GC/MS, FTIR, H1-NMR, C13-NMR) are reported for Letrozole (Femara), an anticancer drug which was submitted for a case involving androgenic steroids.
KEYWORDS: Letrozole, Femara, Anti-Cancer Drug, Analysis, Forensic Chemistry.
Introduction
This laboratory occasionally receives unusual unknowns that were seized as suspected controlled substances. Recently, we received 4.46 grams of a flocculent white powder (see Photo 1), that had been included in a group of steroids submitted from a U.S. Customs seizure in Anchorage, Alaska. The steroids included various exhibits of boldenone, methandrostenolone, oxymetholone, stanazolol, testosterone, and trenbolone; tamoxifen (an anticancer drug) was also seized. The shipment is believed to have originated in Nanjing, China. The original analysis was performed by the U.S. Customs Laboratory, San Francisco, California, and determined that no controlled substance was present; however, an unknown substance was determined to be present.
Photo 1
Preliminary analyses by Gas Chromatography/Mass Spectrometry (GC/MS, Figure 1) and Fourier Transform Infrared Spectroscopy (FTIR, Figure 2) gave no matches when searched in reference databases. The infrared spectrum showed an unusually strong peak in the region 2230 cm-1, suggesting strong carbon-nitrogen triple bond (nitrile) stretching. Based on the GC/MS, the molecular weight was 285 atomic mass units (amu); this was confirmed by Liquid Chromatography/Mass Spectrometry (LC/MS) with chemical ionization. Further analysis by proton and carbon-13 Nuclear Magnetic Resonance (NMR) Spectroscopy (Figures 3 and 4) with quantitative
Microgram Journal, Volume 1, Numbers 3-4 (July - December 2003) 190
Brought to you by AltGov2 [www.altgov2.org]
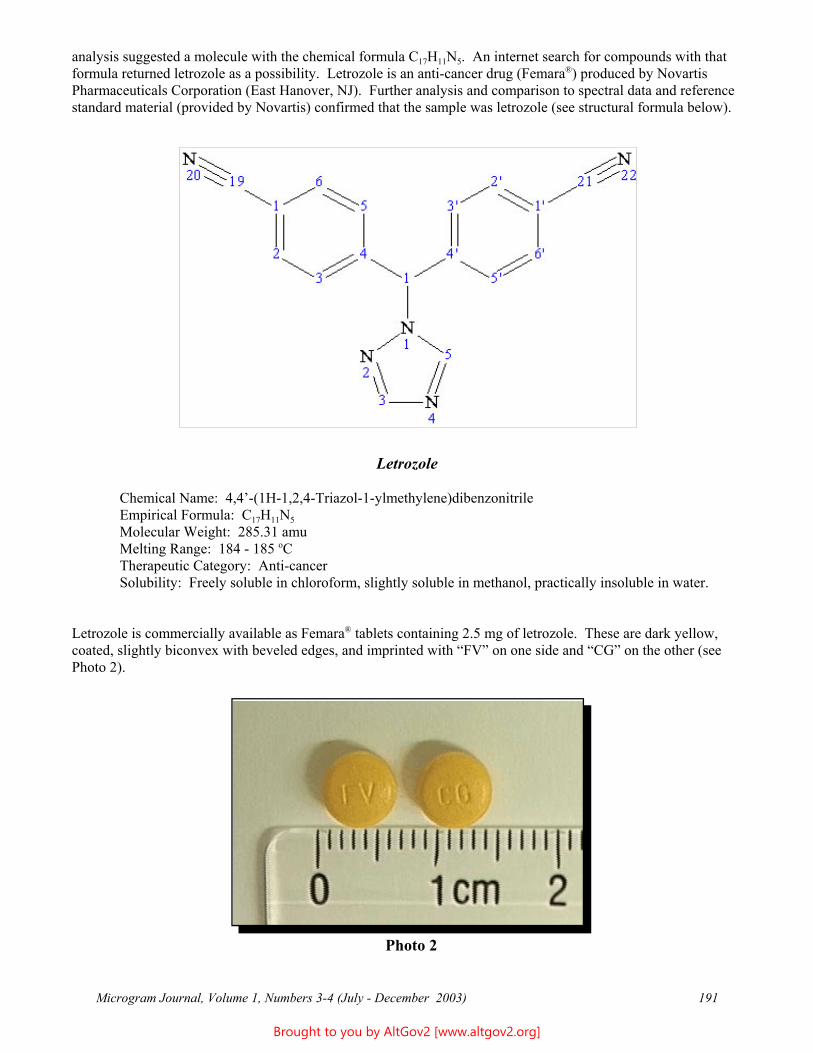
analysis suggested a molecule with the chemical formula C17H11N5. An internet search for compounds with that formula returned letrozole as a possibility. Letrozole is an anti-cancer drug (Femara®) produced by Novartis Pharmaceuticals Corporation (East Hanover, NJ). Further analysis and comparison to spectral data and reference standard material (provided by Novartis) confirmed that the sample was letrozole (see structural formula below).
Letrozole
Chemical Name: 4,4’-(1H-1,2,4-Triazol-1-ylmethylene)dibenzonitrile Empirical Formula: C17H11N5 Molecular Weight: 285.31 amu Melting Range: 184 - 185 oC Therapeutic Category: Anti-cancer Solubility: Freely soluble in chloroform, slightly soluble in methanol, practically insoluble in water.
Letrozole is commercially available as Femara® tablets containing 2.5 mg of letrozole. These are dark yellow, coated, slightly biconvex with beveled edges, and imprinted with “FV” on one side and “CG” on the other (see Photo 2).
Photo 2
Microgram Journal, Volume 1, Numbers 3-4 (July - December 2003) 191
Brought to you by AltGov2 [www.altgov2.org]
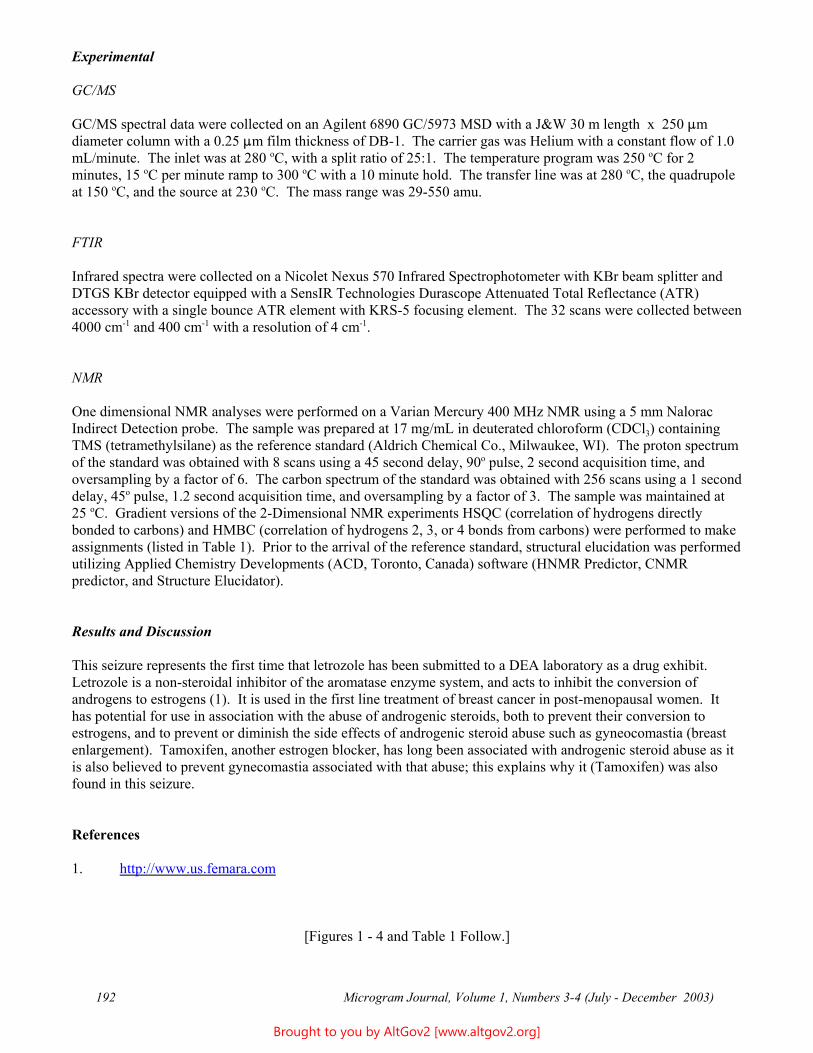
Experimental
GC/MS
GC/MS spectral data were collected on an Agilent 6890 GC/5973 MSD with a J&W 30 m length x 250 :m diameter column with a 0.25 :m film thickness of DB-1. The carrier gas was Helium with a constant flow of 1.0 mL/minute. The inlet was at 280 oC, with a split ratio of 25:1. The temperature program was 250 oC for 2 minutes, 15 oC per minute ramp to 300 oC with a 10 minute hold. The transfer line was at 280 oC, the quadrupole at 150 oC, and the source at 230 oC. The mass range was 29-550 amu.
FTIR
Infrared spectra were collected on a Nicolet Nexus 570 Infrared Spectrophotometer with KBr beam splitter and DTGS KBr detector equipped with a SensIR Technologies Durascope Attenuated Total Reflectance (ATR) accessory with a single bounce ATR element with KRS-5 focusing element. The 32 scans were collected between 4000 cm-1 and 400 cm-1 with a resolution of 4 cm-1.
NMR
One dimensional NMR analyses were performed on a Varian Mercury 400 MHz NMR using a 5 mm Nalorac Indirect Detection probe. The sample was prepared at 17 mg/mL in deuterated chloroform (CDCl3) containing TMS (tetramethylsilane) as the reference standard (Aldrich Chemical Co., Milwaukee, WI). The proton spectrum of the standard was obtained with 8 scans using a 45 second delay, 90o pulse, 2 second acquisition time, and oversampling by a factor of 6. The carbon spectrum of the standard was obtained with 256 scans using a 1 second delay, 45o pulse, 1.2 second acquisition time, and oversampling by a factor of 3. The sample was maintained at 25 oC. Gradient versions of the 2-Dimensional NMR experiments HSQC (correlation of hydrogens directly bonded to carbons) and HMBC (correlation of hydrogens 2, 3, or 4 bonds from carbons) were performed to make assignments (listed in Table 1). Prior to the arrival of the reference standard, structural elucidation was performed utilizing Applied Chemistry Developments (ACD, Toronto, Canada) software (HNMR Predictor, CNMR predictor, and Structure Elucidator).
Results and Discussion
This seizure represents the first time that letrozole has been submitted to a DEA laboratory as a drug exhibit. Letrozole is a non-steroidal inhibitor of the aromatase enzyme system, and acts to inhibit the conversion of androgens to estrogens (1). It is used in the first line treatment of breast cancer in post-menopausal women. It has potential for use in association with the abuse of androgenic steroids, both to prevent their conversion to estrogens, and to prevent or diminish the side effects of androgenic steroid abuse such as gyneocomastia (breast enlargement). Tamoxifen, another estrogen blocker, has long been associated with androgenic steroid abuse as it is also believed to prevent gynecomastia associated with that abuse; this explains why it (Tamoxifen) was also found in this seizure.
References
1. http://www.us.femara.com
[Figures 1 - 4 and Table 1 Follow.]
Microgram Journal, Volume 1, Numbers 3-4 (July - December 2003) 192
Brought to you by AltGov2 [www.altgov2.org]
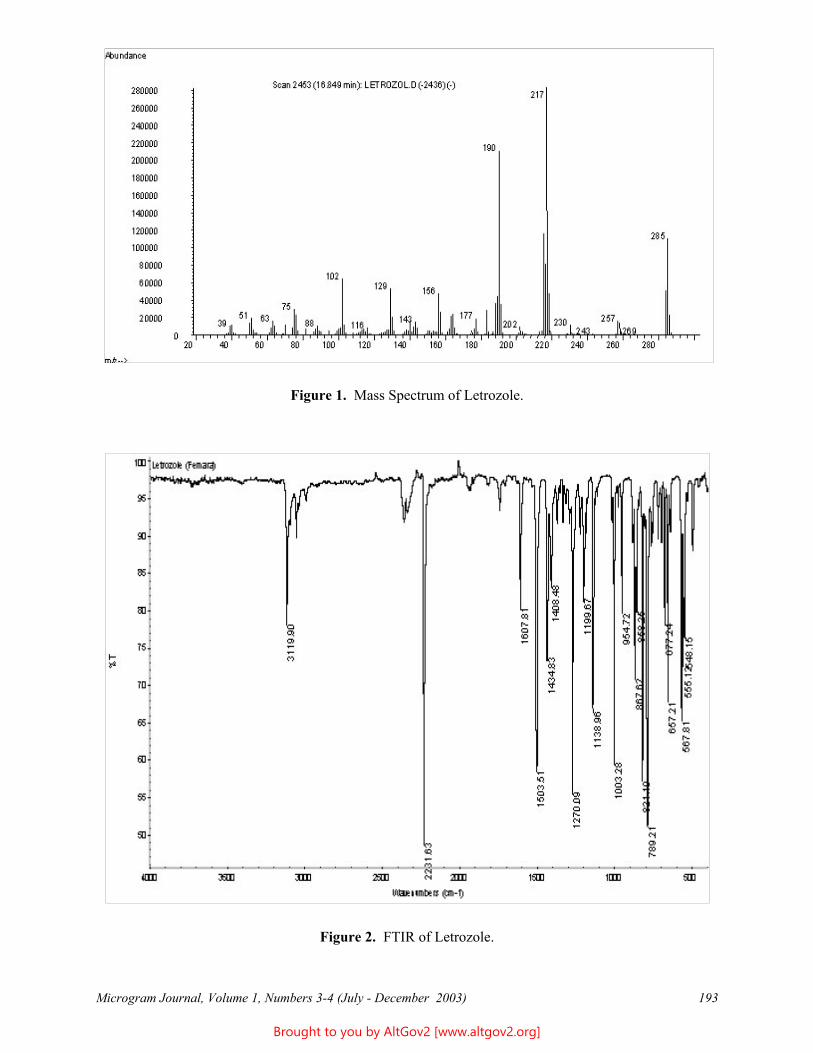
Figure 1. Mass Spectrum of Letrozole.
Figure 2. FTIR of Letrozole.
Microgram Journal, Volume 1, Numbers 3-4 (July - December 2003) 193
Brought to you by AltGov2 [www.altgov2.org]
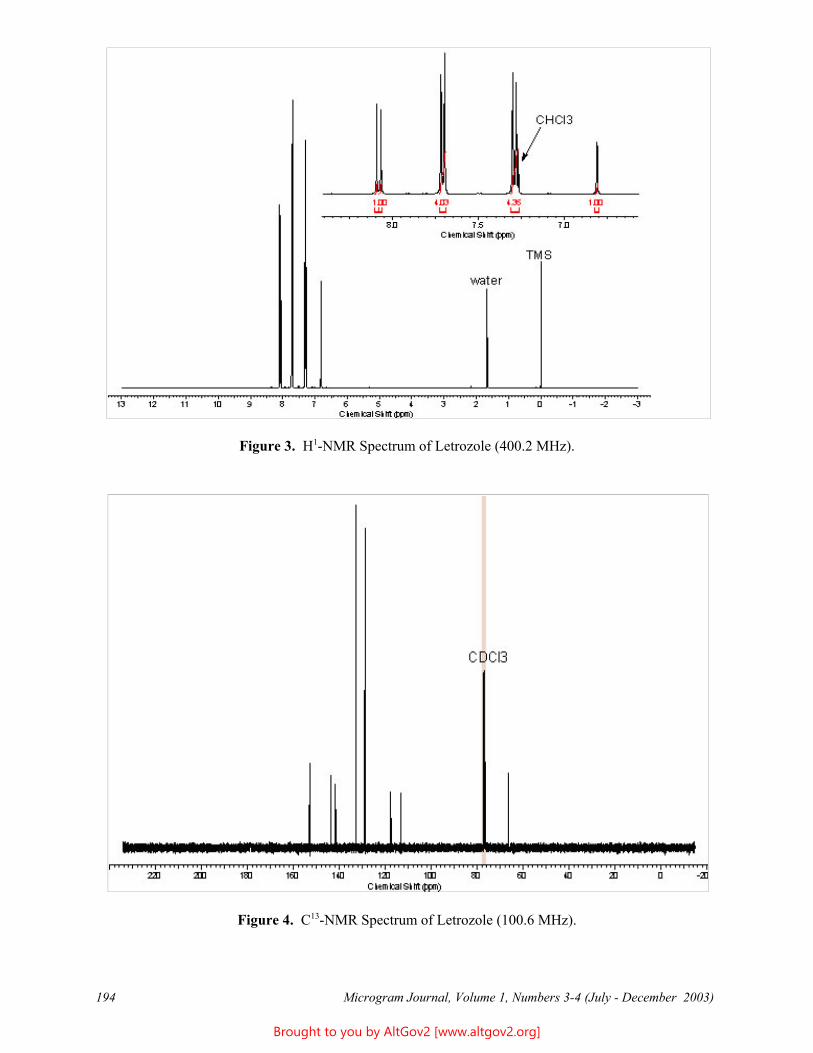
Figure 3. H1-NMR Spectrum of Letrozole (400.2 MHz).
Figure 4. C13-NMR Spectrum of Letrozole (100.6 MHz).
Microgram Journal, Volume 1, Numbers 3-4 (July - December 2003) 194
Brought to you by AltGov2 [www.altgov2.org]
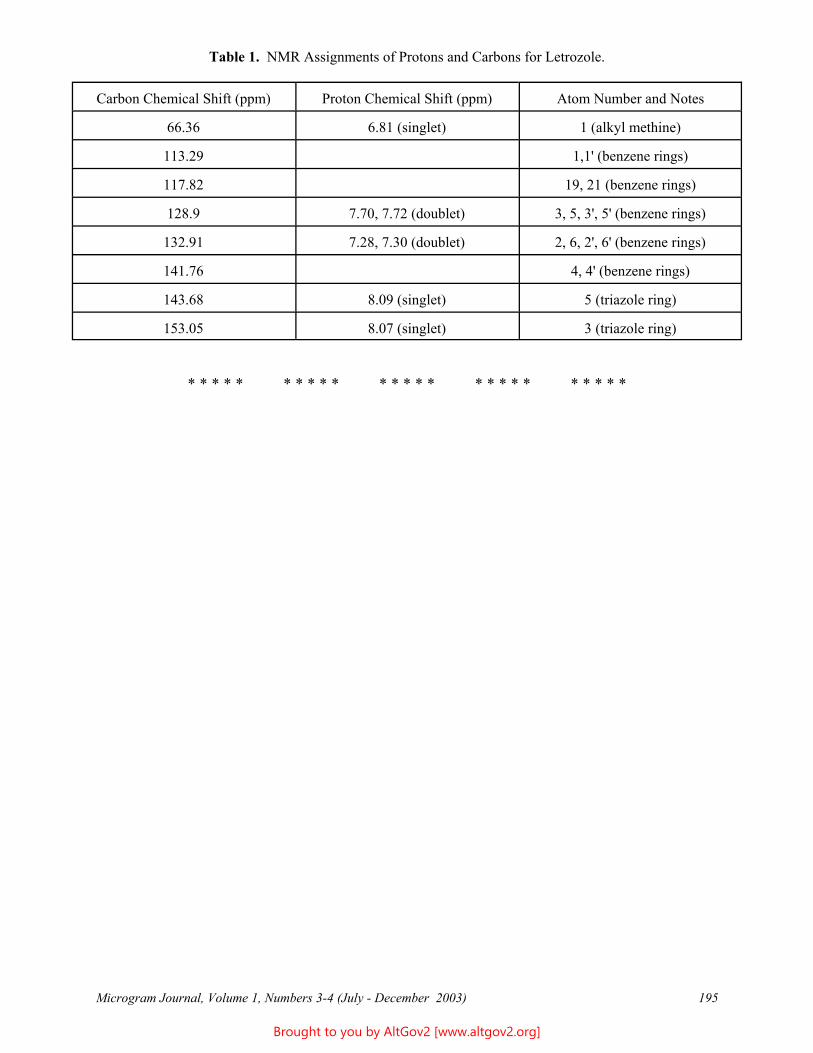
Table 1. NMR Assignments of Protons and Carbons for Letrozole.
Carbon Chemical Shift (ppm) Proton Chemical Shift (ppm) Atom Number and Notes
66.36 6.81 (singlet) 1 (alkyl methine)
113.29 1,1' (benzene rings)
117.82 19, 21 (benzene rings)
128.9 7.70, 7.72 (doublet) 3, 5, 3', 5' (benzene rings)
132.91 7.28, 7.30 (doublet) 2, 6, 2', 6' (benzene rings)
141.76 4, 4' (benzene rings)
143.68 8.09 (singlet) 5 (triazole ring)
153.05 8.07 (singlet) 3 (triazole ring)
* * * * * * * * * * * * * * * * * * * * * * * * *
Microgram Journal, Volume 1, Numbers 3-4 (July - December 2003) 195
Brought to you by AltGov2 [www.altgov2.org]
An Overview of DNA Methods for the Identification and Individualization of Marijuana
Heather Miller Coyle,* Timothy Palmbach, Nicholas Juliano, Carll Ladd, and Henry C. Lee State of Connecticut Department of Public Safety
Division of Scientific Services Forensic Science Laboratory
278 Colony Street Meriden, CT 06451 USA
[email: c4ensic -at- yahoo.com]
[Reprinted with Permission from the Croatian Medical Journal 2003;44(3):315.]
ABSTRACT: The purpose of this review is to summarize the status of DNA-based methods for the identification and individualization of marijuana. In forensics, both identification of a substance as marijuana and the subsequent individualization of a sample may be desired for casework. Marijuana identification methods in the United States primarily include biochemical tests and, less frequently, DNA-based tests. Under special circumstances, DNA-based tests can be useful. For example, if the quantity of seized marijuana is extremely small and/or biochemical tests do not detect any ∆ 9-tetrahydrocannabinol (THC), DNA identification of plant material as Cannabis is still possible. This circumstance can arise when seeds, trace residue, tiny leaf fragments, or fine roots need to be analyzed. Methods for the individualization of marijuana include Amplified Fragment Length Polymorphism (AFLP), Random Amplified Polymorphic DNA (RAPD), and Short Tandem Repeat (STR) techniques that link an evidentiary sample to a source. Marijuana growers propagate their plants either by seed or by cloning. Seed-generated marijuana plants are expected to have unique DNA profiles analogous to a human population. Cloned marijuana plants, however, exhibit identical DNA profiles that allow for tracking of plant material derived from a common genetic lineage. The authors have validated the AFLP method for marijuana samples and are constructing a comparative database of marijuana seizure samples to estimate the expected frequency of a DNA profile match between unrelated plants. Continued development of DNA-based methods for plants can be useful for marijuana and other types of plant evidence in forensics.
KEYWORDS: Cannabis; Polymorphism (Genetics); Polymorphism; Restriction Fragment Length; Random Amplified Polymorphic DNA Technique; Tandem Repeat Sequences.
Cannabis sativa (marijuana) has existed since ancient times and is widely used as a fiber source, a food source, a medicine and a euphoriant (1-4). Marijuana has been used to treat a variety of ailments including glaucoma, pain, nausea, asthma, depression, neuralgia and insomnia (5). Like many crops (e.g. wheat, corn), marijuana was originally a naturally occurring weed species. It was bred and cultivated into a significant cash crop for a multibillion dollar illicit industry. The hallucinogenic properties of marijuana are derived from ∆ 9tetrahydrocannabinol (THC) (6) and potent (high-THC level) marijuana cultivars are sought by the discerning marijuana users (7,8). Before the mid-1970’s, the majority of U.S. marijuana was imported from Mexico. When the U.S. and Mexico co-operated in marijuana eradication programs, a domestic growing industry began in the United States. Most of the highly prized United States cultivars originated from a few breeding stocks from the West Coast (5). Now, seeds for marijuana growers are accessible worldwide via the Internet; seed catalogues are posted with extensive descriptions and price lists (e.g. www.cannabisseeds.org). The extent of genetic variation in marijuana populations is unknown due to the illicit nature of this substance and because growers propagate plants secretively. A survey of marijuana seizure samples using DNA profiling methods could be used to assess levels of genetic diversity within this crop.
Microgram Journal, Volume 1, Numbers 3-4 (July - December 2003) 196
Brought to you by AltGov2 [www.altgov2.org]
There are two main steps in most forensic classification schemes that can be applied to marijuana seizure samples. The first step involves identification of a sample. For marijuana, both biochemical (9,10) and DNA tests (11-12) are available to identify a substance as Cannabis. The second step is individualization (source attribution). For marijuana, several DNA-based methods are under development and will be described in later sections. Biochemical methods to establish geographic origin of a plant have met with variable success (13-17). However, contaminants (18) and packaging (17) have shown a correlation with marijuana source. Biochemical profiling has also successfully differentiated between resinous and textile Cannabis (19), drug subgroups (marijuana, sinsemilla, Thai sticks, ditchweed) (7) and plant gender (20).
Cannabis can be seed-propagated or perpetuated through cloning (1,21,22). Seed-propagated plants are expected to have their own unique genotypes analogous to humans selected from a random population. However, plants that have been propagated through cloning should have identical genotypes like identical twins (21,22). Tracking cloned marijuana based on DNA should be relatively simple; seizure samples with identical profiles should have a common genetic source. The ability to link marijuana growers and users to a common distributor by DNA would be a useful investigative tool for narcotics enforcement. In addition, some forensic cases may be able to link a suspect and victim by matching marijuana samples. The Connecticut State Forensic Science Laboratory, along with several other research groups, is in the process of developing DNA-based methods for the individualization of plant (especially marijuana) samples that are seized from crime scenes. Different DNA-based techniques have different applications, benefits and limitations but all can be utilized to supplement existing forensic methods.
Marijuana Drug Facts
United States teenagers use marijuana more than any other drug according to the U. S. Government Substance Abuse and Mental Health Services Administration (23,24). For example, 20% of teenagers aged 12 to 17 years have used marijuana at least once (23,24). In comparison, only 3% of teenagers have used Ecstasy and approximately 2% report using cocaine (23,24). Marijuana prices vary depending on the quantity and quality of what is sold and where the consumer is geographically located, however; it is estimated that marijuana is a multibillion dollar industry in the United States. One primary source of marijuana is from Mexico where the Border Patrol and U. S. Customs Service seize tons of marijuana worth millions of dollars every year (24). In addition to imported marijuana, the U.S. has a very profitable domestic marijuana growing industry (1,5,24,25).
According to the 2001 National Forensic Laboratory Information System (NFLIS) report, 36% of the analyzed drug items at the national level were identified as Cannabis compared to 33% as cocaine, 11% as methamphetamine and 8% as heroin, respectively (26). Considerable variation exists in drug types reported across different regions of the United States; it should be noted that these differences could result from different law enforcement strategies or laboratory analysis policies. In general, Cannabis is identified in 25% or more of the drug seizures for the United States regardless of geographical region. In 2001, Cannabis estimates for the Midwest, the Northeast, the South and the West were 47%, 36%, 36% and 23%, respectively (26).
In 1977, regional narcotics enforcement squads were replaced by a Statewide Narcotics Task Force in Connecticut (27). The Task Force is authorized to enforce the state laws concerning the manufacture, distribution, sale and possession of narcotics and controlled substances. In addition to enforcement, the Connecticut Statewide Narcotics Task Force collects and provides information regarding drug seizures for Connecticut on an annual basis (25,27). Both indoor and outdoor marijuana grow operations have been identified in Connecticut (25,27). The outdoor grow season in Connecticut begins in April and continues until harvest time in mid-September. The indoor grow season is year-round. The Statewide Narcotics Task Force, in conjunction with the Drug Enforcement Administration (DEA), sponsors and coordinates the Domestic Cannabis Eradication/Suppression Program in Connecticut (25,27). For the first nine months of 2002, statistics for the Statewide Narcotics Task Force domestic Cannabis eradication program indicated while greater numbers of outdoor plots were identified compared to indoor grow operations, the number of plants seized were comparable between indoor and outdoor cultivation plots (Table 1) (27). Indoor grow operations may be increasing in number and scale or are more easily
Microgram Journal, Volume 1, Numbers 3-4 (July - December 2003) 197
Brought to you by AltGov2 [www.altgov2.org]
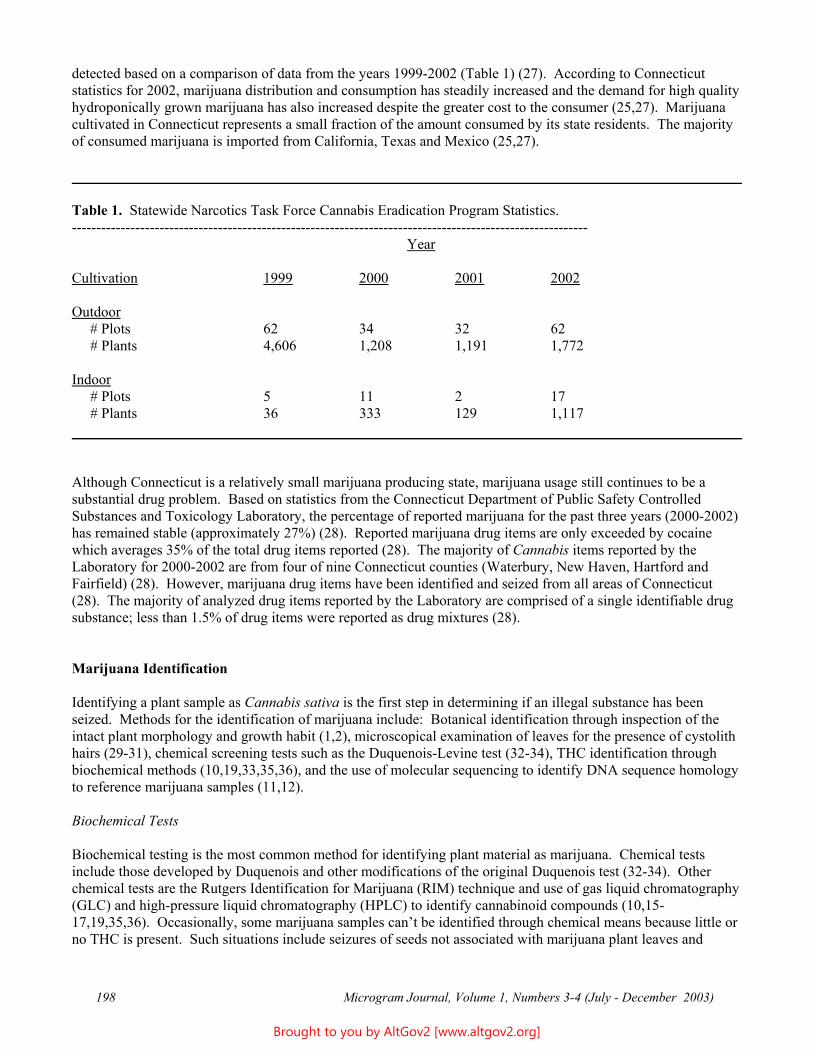
----------------------------------------------------------------------------------------------------------
detected based on a comparison of data from the years 1999-2002 (Table 1) (27). According to Connecticut statistics for 2002, marijuana distribution and consumption has steadily increased and the demand for high quality hydroponically grown marijuana has also increased despite the greater cost to the consumer (25,27). Marijuana cultivated in Connecticut represents a small fraction of the amount consumed by its state residents. The majority of consumed marijuana is imported from California, Texas and Mexico (25,27).
Table 1. Statewide Narcotics Task Force Cannabis Eradication Program Statistics.
Year
Cultivation 1999 2000 2001 2002
Outdoor # Plots 62 34 32 62
# Plants 4,606 1,208 1,191 1,772
Indoor # Plots 5 11 2 17 # Plants 36 333 129 1,117
Although Connecticut is a relatively small marijuana producing state, marijuana usage still continues to be a substantial drug problem. Based on statistics from the Connecticut Department of Public Safety Controlled Substances and Toxicology Laboratory, the percentage of reported marijuana for the past three years (2000-2002) has remained stable (approximately 27%) (28). Reported marijuana drug items are only exceeded by cocaine which averages 35% of the total drug items reported (28). The majority of Cannabis items reported by the Laboratory for 2000-2002 are from four of nine Connecticut counties (Waterbury, New Haven, Hartford and Fairfield) (28). However, marijuana drug items have been identified and seized from all areas of Connecticut (28). The majority of analyzed drug items reported by the Laboratory are comprised of a single identifiable drug substance; less than 1.5% of drug items were reported as drug mixtures (28).
Marijuana Identification
Identifying a plant sample as Cannabis sativa is the first step in determining if an illegal substance has been seized. Methods for the identification of marijuana include: Botanical identification through inspection of the intact plant morphology and growth habit (1,2), microscopical examination of leaves for the presence of cystolith hairs (29-31), chemical screening tests such as the Duquenois-Levine test (32-34), THC identification through biochemical methods (10,19,33,35,36), and the use of molecular sequencing to identify DNA sequence homology to reference marijuana samples (11,12).
Biochemical Tests
Biochemical testing is the most common method for identifying plant material as marijuana. Chemical tests include those developed by Duquenois and other modifications of the original Duquenois test (32-34). Other chemical tests are the Rutgers Identification for Marijuana (RIM) technique and use of gas liquid chromatography (GLC) and high-pressure liquid chromatography (HPLC) to identify cannabinoid compounds (10,15-17,19,35,36). Occasionally, some marijuana samples can’t be identified through chemical means because little or no THC is present. Such situations include seizures of seeds not associated with marijuana plant leaves and
Microgram Journal, Volume 1, Numbers 3-4 (July - December 2003) 198
Brought to you by AltGov2 [www.altgov2.org]
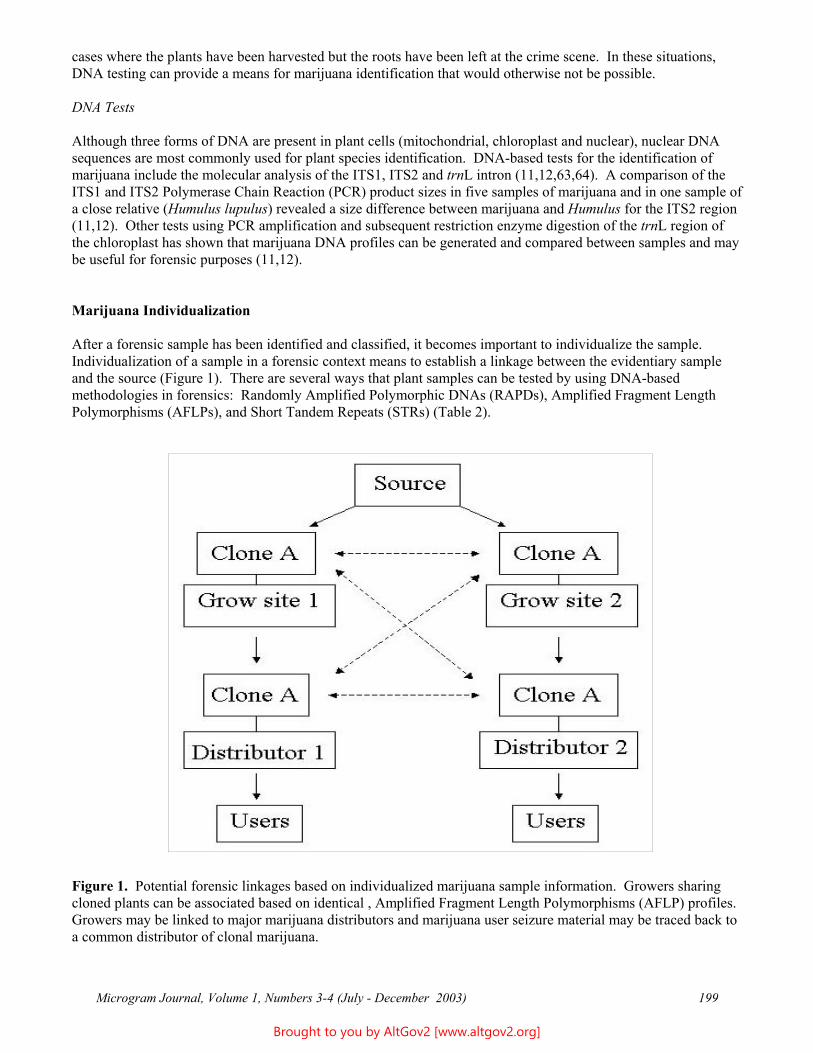
cases where the plants have been harvested but the roots have been left at the crime scene. In these situations, DNA testing can provide a means for marijuana identification that would otherwise not be possible.
DNA Tests
Although three forms of DNA are present in plant cells (mitochondrial, chloroplast and nuclear), nuclear DNA sequences are most commonly used for plant species identification. DNA-based tests for the identification of marijuana include the molecular analysis of the ITS1, ITS2 and trnL intron (11,12,63,64). A comparison of the ITS1 and ITS2 Polymerase Chain Reaction (PCR) product sizes in five samples of marijuana and in one sample of a close relative (Humulus lupulus) revealed a size difference between marijuana and Humulus for the ITS2 region (11,12). Other tests using PCR amplification and subsequent restriction enzyme digestion of the trnL region of the chloroplast has shown that marijuana DNA profiles can be generated and compared between samples and may be useful for forensic purposes (11,12).
Marijuana Individualization
After a forensic sample has been identified and classified, it becomes important to individualize the sample. Individualization of a sample in a forensic context means to establish a linkage between the evidentiary sample and the source (Figure 1). There are several ways that plant samples can be tested by using DNA-based methodologies in forensics: Randomly Amplified Polymorphic DNAs (RAPDs), Amplified Fragment Length Polymorphisms (AFLPs), and Short Tandem Repeats (STRs) (Table 2).
Figure 1. Potential forensic linkages based on individualized marijuana sample information. Growers sharing cloned plants can be associated based on identical , Amplified Fragment Length Polymorphisms (AFLP) profiles. Growers may be linked to major marijuana distributors and marijuana user seizure material may be traced back to a common distributor of clonal marijuana.
Microgram Journal, Volume 1, Numbers 3-4 (July - December 2003) 199
Brought to you by AltGov2 [www.altgov2.org]
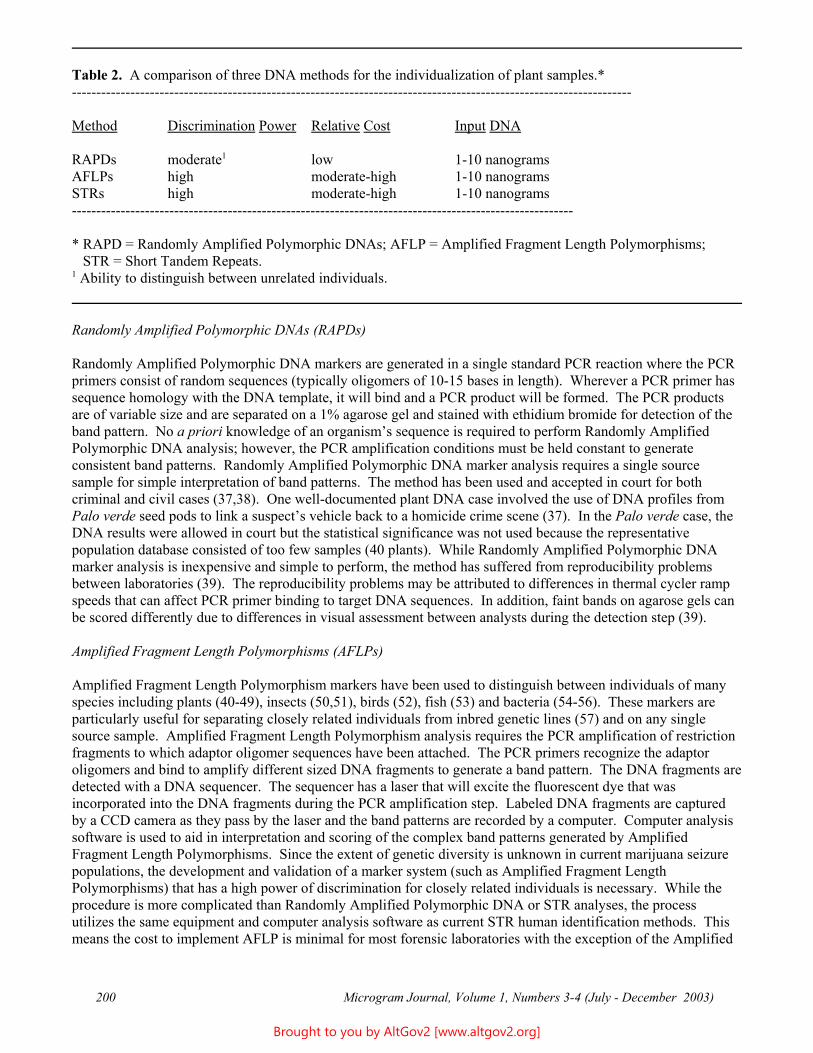
-------------------------------------------------------------------------------------------------------------------
-------------------------------------------------------------------------------------------------------
Table 2. A comparison of three DNA methods for the individualization of plant samples.*
Method Discrimination Power Relative Cost Input DNA
RAPDs moderate1 low 1-10 nanograms AFLPs high moderate-high 1-10 nanograms STRs high moderate-high 1-10 nanograms
* RAPD = Randomly Amplified Polymorphic DNAs; AFLP = Amplified Fragment Length Polymorphisms; STR = Short Tandem Repeats. 1 Ability to distinguish between unrelated individuals.
Randomly Amplified Polymorphic DNAs (RAPDs)
Randomly Amplified Polymorphic DNA markers are generated in a single standard PCR reaction where the PCR primers consist of random sequences (typically oligomers of 10-15 bases in length). Wherever a PCR primer has sequence homology with the DNA template, it will bind and a PCR product will be formed. The PCR products are of variable size and are separated on a 1% agarose gel and stained with ethidium bromide for detection of the band pattern. No a priori knowledge of an organism’s sequence is required to perform Randomly Amplified Polymorphic DNA analysis; however, the PCR amplification conditions must be held constant to generate consistent band patterns. Randomly Amplified Polymorphic DNA marker analysis requires a single source sample for simple interpretation of band patterns. The method has been used and accepted in court for both criminal and civil cases (37,38). One well-documented plant DNA case involved the use of DNA profiles from Palo verde seed pods to link a suspect’s vehicle back to a homicide crime scene (37). In the Palo verde case, the DNA results were allowed in court but the statistical significance was not used because the representative population database consisted of too few samples (40 plants). While Randomly Amplified Polymorphic DNA marker analysis is inexpensive and simple to perform, the method has suffered from reproducibility problems between laboratories (39). The reproducibility problems may be attributed to differences in thermal cycler ramp speeds that can affect PCR primer binding to target DNA sequences. In addition, faint bands on agarose gels can be scored differently due to differences in visual assessment between analysts during the detection step (39).
Amplified Fragment Length Polymorphisms (AFLPs)
Amplified Fragment Length Polymorphism markers have been used to distinguish between individuals of many species including plants (40-49), insects (50,51), birds (52), fish (53) and bacteria (54-56). These markers are particularly useful for separating closely related individuals from inbred genetic lines (57) and on any single source sample. Amplified Fragment Length Polymorphism analysis requires the PCR amplification of restriction fragments to which adaptor oligomer sequences have been attached. The PCR primers recognize the adaptor oligomers and bind to amplify different sized DNA fragments to generate a band pattern. The DNA fragments are detected with a DNA sequencer. The sequencer has a laser that will excite the fluorescent dye that was incorporated into the DNA fragments during the PCR amplification step. Labeled DNA fragments are captured by a CCD camera as they pass by the laser and the band patterns are recorded by a computer. Computer analysis software is used to aid in interpretation and scoring of the complex band patterns generated by Amplified Fragment Length Polymorphisms. Since the extent of genetic diversity is unknown in current marijuana seizure populations, the development and validation of a marker system (such as Amplified Fragment Length Polymorphisms) that has a high power of discrimination for closely related individuals is necessary. While the procedure is more complicated than Randomly Amplified Polymorphic DNA or STR analyses, the process utilizes the same equipment and computer analysis software as current STR human identification methods. This means the cost to implement AFLP is minimal for most forensic laboratories with the exception of the Amplified
Microgram Journal, Volume 1, Numbers 3-4 (July - December 2003) 200
Brought to you by AltGov2 [www.altgov2.org]
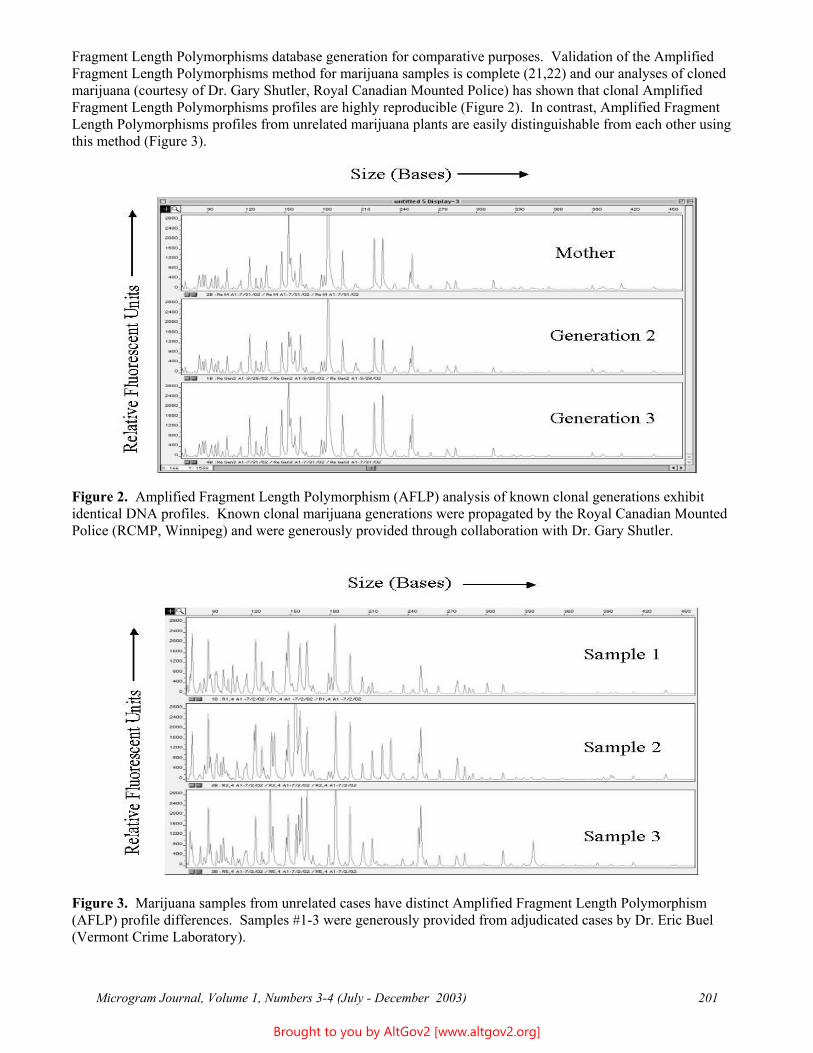
Fragment Length Polymorphisms database generation for comparative purposes. Validation of the Amplified Fragment Length Polymorphisms method for marijuana samples is complete (21,22) and our analyses of cloned marijuana (courtesy of Dr. Gary Shutler, Royal Canadian Mounted Police) has shown that clonal Amplified Fragment Length Polymorphisms profiles are highly reproducible (Figure 2). In contrast, Amplified Fragment Length Polymorphisms profiles from unrelated marijuana plants are easily distinguishable from each other using this method (Figure 3).
Figure 2. Amplified Fragment Length Polymorphism (AFLP) analysis of known clonal generations exhibit identical DNA profiles. Known clonal marijuana generations were propagated by the Royal Canadian Mounted Police (RCMP, Winnipeg) and were generously provided through collaboration with Dr. Gary Shutler.
Figure 3. Marijuana samples from unrelated cases have distinct Amplified Fragment Length Polymorphism (AFLP) profile differences. Samples #1-3 were generously provided from adjudicated cases by Dr. Eric Buel (Vermont Crime Laboratory).
Microgram Journal, Volume 1, Numbers 3-4 (July - December 2003) 201
Brought to you by AltGov2 [www.altgov2.org]
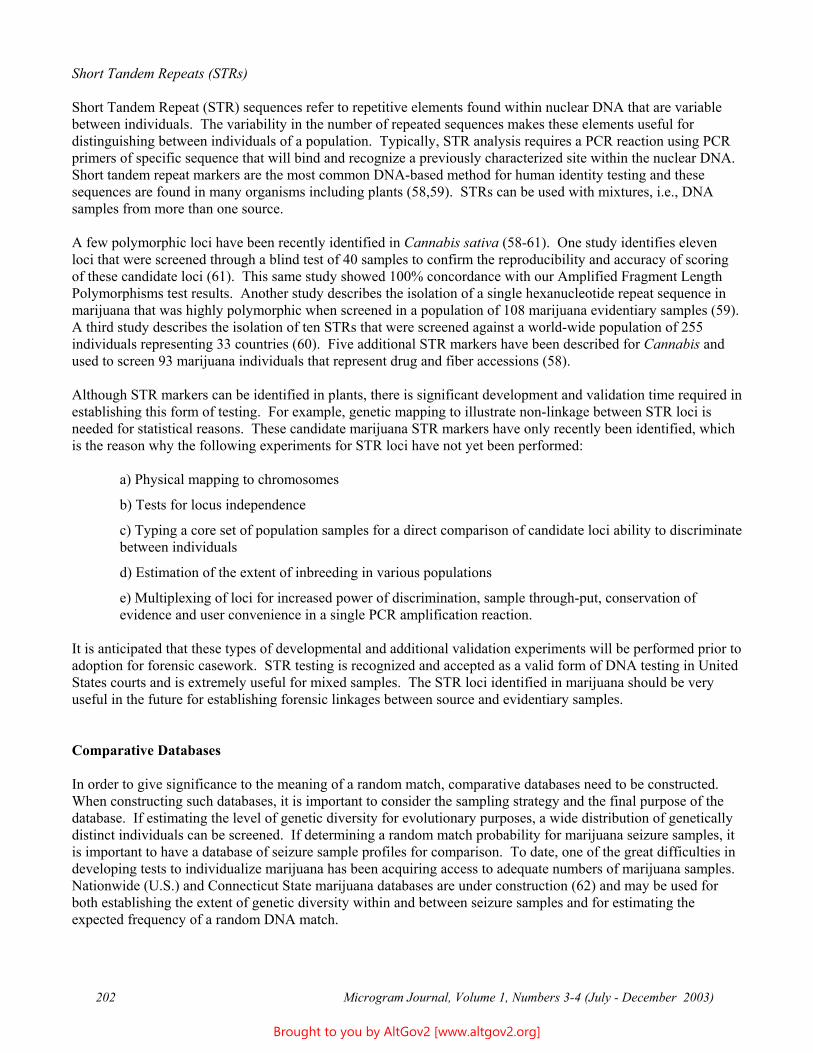
Short Tandem Repeats (STRs)
Short Tandem Repeat (STR) sequences refer to repetitive elements found within nuclear DNA that are variable between individuals. The variability in the number of repeated sequences makes these elements useful for distinguishing between individuals of a population. Typically, STR analysis requires a PCR reaction using PCR primers of specific sequence that will bind and recognize a previously characterized site within the nuclear DNA. Short tandem repeat markers are the most common DNA-based method for human identity testing and these sequences are found in many organisms including plants (58,59). STRs can be used with mixtures, i.e., DNA samples from more than one source.
A few polymorphic loci have been recently identified in Cannabis sativa (58-61). One study identifies eleven loci that were screened through a blind test of 40 samples to confirm the reproducibility and accuracy of scoring of these candidate loci (61). This same study showed 100% concordance with our Amplified Fragment Length Polymorphisms test results. Another study describes the isolation of a single hexanucleotide repeat sequence in marijuana that was highly polymorphic when screened in a population of 108 marijuana evidentiary samples (59). A third study describes the isolation of ten STRs that were screened against a world-wide population of 255 individuals representing 33 countries (60). Five additional STR markers have been described for Cannabis and used to screen 93 marijuana individuals that represent drug and fiber accessions (58).
Although STR markers can be identified in plants, there is significant development and validation time required in establishing this form of testing. For example, genetic mapping to illustrate non-linkage between STR loci is needed for statistical reasons. These candidate marijuana STR markers have only recently been identified, which is the reason why the following experiments for STR loci have not yet been performed:
a) Physical mapping to chromosomes
b) Tests for locus independence
c) Typing a core set of population samples for a direct comparison of candidate loci ability to discriminate between individuals
d) Estimation of the extent of inbreeding in various populations
e) Multiplexing of loci for increased power of discrimination, sample through-put, conservation of evidence and user convenience in a single PCR amplification reaction.
It is anticipated that these types of developmental and additional validation experiments will be performed prior to adoption for forensic casework. STR testing is recognized and accepted as a valid form of DNA testing in United States courts and is extremely useful for mixed samples. The STR loci identified in marijuana should be very useful in the future for establishing forensic linkages between source and evidentiary samples.
Comparative Databases
In order to give significance to the meaning of a random match, comparative databases need to be constructed. When constructing such databases, it is important to consider the sampling strategy and the final purpose of the database. If estimating the level of genetic diversity for evolutionary purposes, a wide distribution of genetically distinct individuals can be screened. If determining a random match probability for marijuana seizure samples, it is important to have a database of seizure sample profiles for comparison. To date, one of the great difficulties in developing tests to individualize marijuana has been acquiring access to adequate numbers of marijuana samples. Nationwide (U.S.) and Connecticut State marijuana databases are under construction (62) and may be used for both establishing the extent of genetic diversity within and between seizure samples and for estimating the expected frequency of a random DNA match.
Microgram Journal, Volume 1, Numbers 3-4 (July - December 2003) 202
Brought to you by AltGov2 [www.altgov2.org]
Conclusion
In the near future, marijuana DNA analysis may be performed in conjunction with chemical identification methods to extend the current capabilities for casework identification on root and seed samples of marijuana. The ability to individualize marijuana samples will further extend the role of DNA in establishing forensic linkages by using plant evidence to link homicides and other types of cases where marijuana samples may be present. The individualizing techniques being developed for marijuana may allow for the identification of a geographic source to aid in the investigation of major marijuana growers and distributors. In particular, cloned marijuana networks may be easily tracked and distributors identified through the common DNA profiles of the seizure samples (21,22,65). In addition, since marijuana samples and drug-generated funds are associated with a wide variety of criminal activities, the applications for marijuana DNA-based tests extend far beyond the obvious use for narcotics enforcement. The success of marijuana DNA typing methods could also become the foundation for using other forms of botanical evidence (grass or tree species) in criminal and civil casework (63-65).
Acknowledgements
The authors are grateful to Dr. Gary Shutler, Janet Hanniman, Sharon Abrams, Chad Johnston, Cst. Giovanni Perisichetti, Cst. Mike Crozier and Steve Towse (Royal Canadian Mounted Police-Winnipeg) for their efforts in producing cloned marijuana and providing extracted DNA. We thank members of the CT Statewide Narcotics Task Force and Captain Peter Warren for their considerable time and effort in collecting samples and providing advice on marijuana propagation. Thank you to Dr. Eric Buel for donating marijuana samples for our study. Thank you to Mr. James Jacewicz, Coordinator of Public Education for the CT Statewide Narcotics Task Force for sharing pre-publication data with us. Thank you to Joselle Germano-Presby, Elizabeth McClure Baker, Eric Carita and Leanne Kushner for their participation in the Amplified Fragment Length Polymorphisms project. Thank you to Nicholas CS Yang for assistance and critical review of the manuscript. A portion of the marijuana project is generously funded by the National Institute of Justice (NIJ grant #2001-IJ-CX-K011).
References
1. Clarke RC. Marijuana Botany-An Advanced Study: The Propagation and Breeding of Distinctive Cannabis. Berkeley (CA): RONIN Publishing; 1981.
2. Frank M; Rosenthal E. Marijuana Grower's Guide. Los Angeles (CA): Red Eye Press; 1990.
3. Flach AJ. Delta-9-tetrahydrocannabinol (THC) in the treatment of end-stage open-angle glaucoma. Trans Am Ophthalmol Soc 2002;100:215-22.
4. Sullivan P. Ottawa seeks source of medical marijuana. JAMC 2000;163:74.
5. Pollan M. The Botany of Desire: A Plant's-eye View of the World. New York (NY): Random House; 2001.
6. Grotenhermen F. Pharmacokinetics and pharmacodynamics of cannabinoids. Clin Pharmacokinet 2003;42:327-60.
7. ElSohly MA, Ross SA, Mehmedic Z, Arafat R, Yi B, Banahan BF III. Potency trends of delta 9-THC and other cannabinoids in confiscated marijuana from 1980-1997. J Forensic Sci 2000;45:24-30.
8. Stamler RT, Fahlman RC, Keele SA. Recent trends in illicit drug trafficking from the Canadian perspective. Bull Narc 1983;35:23-32.
Microgram Journal, Volume 1, Numbers 3-4 (July - December 2003) 203
Brought to you by AltGov2 [www.altgov2.org]
9. Coutts RT, Jones GR. A comparative analysis of Cannabis material. J Forensic Sci 1979;24:291-302.
10. Debruyne D, Albessard F, Bigot MC, Moulin M. Comparison of three advanced chromatographic techniques for cannabis identification. Bull Narc 1994;46:109-21.
11. Siniscalco Gigliano G, Caputo P, Cozzolino S. Ribosomal DNA analysis as a tool for the identification of Cannabis sativa L. Specimens of forensic interest. Science and Justice 1997;37:171-4.
12. Siniscalco Gigliano G. Preliminary data on the usefulness of internal transcribed spacer I (ITS1) sequence in Cannabis sativa L. identification. J Forensic Sci 1999;44:475-7.
13. Harvey DJ. Stability of cannabinoids in dried samples of cannabis dating from around 1896-1905. J Ethnopharmacol 1990;28:117-28.
14. Pitts JE, Neal JD, Gough TA. Some features of Cannabis plants grown in the United Kingdom from seeds of known origin. J Pharm Pharmacol 1992;44:947-51.
15. Hood LV, Barry GT. Headspace volatiles of marihuana and hashish: Gas chromatographic analysis of samples of different geographic origin. J Chromatogr 1978;166:499-506.
16. Brenneisen R, ElSohly MA. Chromatographic and spectroscopic profiles of Cannabis of different origins: Part I. J Forensic Sci 1988;33:1385-404.
17. McDonald PA, Gough TA. Determination of the distribution of cannabinoids in cannabis resin from the Lebanon using HPLC. Part III. J Chromatogr Sci 1984;22:282-4.
18. Taylor DN, Wachsmuth IK, Shangkuan YH, Schmidt EV, Barrett TJ, Schrader JS, et al. Salmonellosis associated with marijuana: A multistate outbreak traced by plasmid fingerprinting. N Engl J Med 1982;306:1249-53.
19. Debruyne D, Moulin M, Bigot MC, Camsonne R. Identification and differentiation of resinous cannabis and textile cannabis: Combined use of HPLC and high-resolution GLC. Bull Narc 1981;33:49-58.
20. Truta E, Gille E, Toth E, Maniu M. Biochemical differences in Cannabis sativa L. depending on sexual phenotype. J Appl Genet 2002;43:451-62.
21. Miller Coyle H, Germano-Presby J, Ladd C, Palmbach T, Lee HC. Tracking clonal marijuana using amplified fragment length polymorphism (AFLP) analysis: An overview. Proceedings of the 13th
International Symposium on Human Identification; 2002 Oct 7-13; Phoenix, AZ. Available from URL: http://www.promega.com Accessed: March 23, 2003.
22. Miller Coyle H, Shutler G, Abrams S, Hanniman J, Neylon S, Ladd C, Palmbach T, Lee H. A simple DNA extraction method for marijuana samples used in amplified fragment length polymorphism (AFLP) analysis. J Forensic Sci 2003;48:343-7.
23. Ducharme L, Ball J. Major drugs of abuse in ED visits, 2000. The DAWN (Drug Abuse Warning Network) Report: 2000.
24. Sullivan K. 'Tis the season for marijuana smugglers. The Hartford Courant. 2002 Dec 21;A1-A6.
25. Connecticut Statewide Narcotics Task Force. Annual Report (Fiscal Year 2000/2001). Meriden (CT): Department of Public Safety, 2001.
Microgram Journal, Volume 1, Numbers 3-4 (July - December 2003) 204
Brought to you by AltGov2 [www.altgov2.org]
26. U.S. Drug Enforcement Administration and National Forensic Laboratory Information System (NFLIS) Annual Report. Washington (DC), 2001.
27. Connecticut Statewide Narcotics Task Force. Statewide Narcotics Task Force Informational Newsletter. Meriden (CT).: Department of Public Safety, 2002.
28. Juliano, N. Cannabis and "other drugs" reported results related to evidence submissions and items analyzed - statistical data extracted from the Laboratory Information Management System (LIMS) charted and interpreted. 2003.
29. Thornton JI, Nakamura GR. The identification of marijuana. J Forensic Science 1972;12:461.
30. Giniscalco Gigliano G. Cannabis sativa L. - Botanical problems and molecular approaches in forensic investigations. Forensic Science Review 2001;13:2-17.
31. Nakamura GR. Forensic aspects of cystolith hairs of Cannabis and other plants. J Assoc Off Anal Chem 1969;52:5-16.
32. Bailey K. The value of the Duquenois test for Cannabis: A survey. J Forensic Science 1979;24:817-41.
33. Butler W. Duquenois-Levine test for marijuana. J Assoc Off Anal Chem 1962;45:597-600.
34. Pitt CG, Hendron RW, Hsia RS. The specificity of the Duquenois color test for marijuana and hashish. J Forensic Sci 1972;17:693-700.
35. Barni Comparini I, Centini F. Packed column chromatography, high resolution gas chromatography and high pressure liquid chromatography in comparison for the analysis of Cannabis constituents. Forensic Sci Int 1983;21:129-37.
36. Lurie IS, Meyers RP, Conver TS. Capillary electrochromatography of cannabinoids. Anal Chem 1998;70:3255-60.
37. Yoon CK. Botanical witness for the prosecution. Science 1993;260:894-5.
38. Congiu L, Chicca M, Cella R, Rossi R, Bernacchia G. The use of random amplified polymorphic DNA (RAPD) markers to identify strawberry varieties: A forensic application. Mol Ecol 2000;9:229-32.
39. Jones CJ, Edwards KJ, Castaglione S, Winfield MO, Sala F, van de Wiel C, Bredemeijer G, Vosman B, Matthes M, Daly A, et al. Reproducibility testing of RAPD, AFLP and SSR markers in plants by a network of European laboratories. Molecular Breeding 1997;3:381-90.
40. Becker J, Vos P, Kuiper M, Salamini F, Heun M. Combined mapping of AFLP and RFLP markers in barley. Mol Gen Genet 1995;249:65-73.
41. Cabrita LF, Aksoy U, Hepaksoy S, Leitão JM. Suitability of isozyme, RAPD and AFLP markers to assess genetic differences and relatedness among fig (Ficus carica L.) clones. Scientia Horticulturae (Amsterdam) 2001;87:261-73.
42. Lamote V, Roldán-Ruiz I, Coart E, De Loose M, Van Bockstaele E. A study of genetic variation in Iris pseudacorus populations using amplified fragment length polymorphisms (AFLPs). Aquatic Botany 2002;73:19-31.
43. Law JR, Donini P, Koebner RMD, Reeves JC, Cooke RJ. DNA profiling and plant variety registration.
Microgram Journal, Volume 1, Numbers 3-4 (July - December 2003) 205
Brought to you by AltGov2 [www.altgov2.org]
III: The statistical assessment of distinctness in wheat using amplified fragment length polymorphism. Euphytica 1998;102:335-42.
44. Lin J-J, Kuo J, Ma J, Saunders JA, Beard HS, MacDonald MH, et al. Identification of molecular markers in soybean-comparing RFLP, RAPD, and AFLP DNA mapping techniques. Plant Molecular Biology Reporter 1996;14:156-69.
45. Loh J, Kiew R, Set O, Gan L, Gan Y. Amplified fragment length polymorphism fingerprinting of 16 banana cultivars (Musa cvs.). Mol Phylogenet Evol 2000;17:360-6.
46. Menz MA, Klein RR, Mullet JE, Obert JA, Unruh NC, Klein PE. A high-density genetic map of Sorghum bicolor (L.) Moench based on 2926 AFLP, RFLP and SSR markers. Plant Mol Biol 2002;48:483-99.
47. Paul S, Wachira FN, Powell W, Waugh R. Diversity and genetic differentiation among populations of Indian and Kenyan tea (Camellia sinensis (L.) O. Kuntze) revealed by AFLP markers. Theor Appl Genet 1997;94:255-63.
48. Peters JL, Constandt H, Neyt P, Cnops G, Zethof J, Zabeau M, Gerats T. A physical amplified fragment-length polymorphism map of Arabidopsis. Plant Physiol 2001;127:1579-89.
49. Saunders JA, Pedroni MJ, Penrose L, Fist T. AFLP DNA analysis of opium poppy. Crop Science 2001;41:1596-601.
50. Parsons YM, Shaw KL. Species boundaries and genetic diversity among Hawaiian crickets of the genus Laupala identified using amplified fragment length polymorphism. Mol Ecol 2001;10:1765-72.
51. Weeks AR, van Opijnen T, Breeuwer JA. AFLP fingerprinting for assessing intraspecific variation and genome mapping in mites. Exp Appl Acarol 2000;24:775-93.
52. Bensch S, Helbig AJ, Salomon M, Seibold I. Amplified fragment length polymorphism analysis identifies hybrids between two subspecies of warblers. Mol Ecol 2002;11:473-81.
53. Liu Z, Nichols A, Li P, Dunham RA. Inheritance and usefulness of AFLP markers in channel catfish (Ictalurus punctatus), blue catfish (I. Furcatus) and their F1, F2 and backcross hybrids. Mol Gen Genet 1998;258:260-8.
54. Avrova AO, Hyman LJ, Toth RL, Toth IK. Application of amplified fragment length polymorphism fingerprinting for taxonomy and identification of the soft rot bacteria Erwinia carotovora and Erwinia chrysanthemi. Appl Environ Microbiol 2002;68:1499-508.
55. Janssen P, Coopman R, Huys G, Swings J, Bleeker M, Vos P, et al. Evaluation of the DNA fingerprinting method AFLP as a new tool in bacterial taxonomy. Microbiology 1996;142(Pt. 7):1881-93.
56. Keim P, Kalif A, Schupp J, Hill K, Travis SE, Richmond K, Adair DM, Hugh-Jones M, Kuske CR, Jackson P. Molecular evolution and diversity in Bacillus anthracis as detected by amplified fragment length polymorphism markers. Journal of Bacteriology 1997;179:818-24.
57. Vos P, Hogers R, Bleeker M, Reijans M, van de Lee T, Hornes M, et al. AFLP: A new technique for DNA fingerprinting. Nucleic Acids Res 1995;23:4407-14.
Microgram Journal, Volume 1, Numbers 3-4 (July - December 2003) 206
Brought to you by AltGov2 [www.altgov2.org]
----------
58. Gilmore S, Peakall R, Robertson J. Short tandem repeat (STR) DNA markers are hypervariable and informative in Cannabis sativa: Implications for forensic investigations. Forensic Sci Int 2003;131(1):65-74.
59. Hsieh H-M, Hou R-J, Tsai L-C, Wei C-S, Liu S-W, Huang L-H, Kuo Y-C, Linacre A, Lee JC-I. A highly polymorphic STR locus in Cannabis sativa. Forensic Sci Int 2003;131:53-8.
60. Zinnamon KN, Keim P. Identification of individual marijuana (Cannabis sativa) plants using short tandem repeat (STR) markers: Forensic applications. Proceedings of the American Academy of Forensic Sciences Annual Meeting; 2003 Feb 17-22; Chicago, IL.
61. Alghanim HJ, Almirall JR. Development of microsatellite markers in Cannabis sativa for DNA typing and genetic relatedness analyses. Analytical and Bioanalytical Chemistry 2003;376(8):1225.
62. Germano-Presby J, Miller Coyle H, Palmbach T, Pagliaro E, Ladd C, Harper A, Lee HC. Development of a nationwide AFLP DNA database for marijuana (Cannabis sativa). Proceedings of the American Academy of Forensic Sciences Annual Meeting; 2003 Feb 17-22; Chicago, IL.
63. Bever R, Golenberg E, Barnes L, Brinkac L, Jones E, Yoshida K. Molecular analysis of botanical trace evidence: Development of techniques. Proceedings of the American Academy of Forensic Sciences Annual Meeting; 2000 Feb 21-26; Reno, NV.
64. Brinkac L, Cimino M, Gross N, Hopkins E, Jones E, Bever R. Analysis of botanical trace evidence. Proceedings of 11th International Symposium on Human Identification; 2000 Oct 10-13; Biloxi, MI.
65. Miller Coyle H, Ladd C, Palmbach T, Lee HC. The green revolution: Botanical contributions to forensics and drug enforcement. Croatian Medical Journal 2001;42:340-5.
Abbreviations: Deoxyribonucleic acid (DNA), amplified fragment length polymorphism (AFLP), short tandem repeat (STR), ∆-9-tetrahydrocannabinol (THC), National Forensic Laboratory Information System (NFLIS), Statewide Narcotics Task Force (SNTF), Drug Enforcement Administration (DEA), internal transcribed spacer (ITS), Rutgers Identification of Marijuana (RIM), gas liquid chromatography (GLC), high pressure liquid chromatography (HPLC), random amplified fragment length polymorphism (RAPD), polymerase chain reaction (PCR), amplified fragment length polymorphism (AFLP).
Terms of Use: Copyright © 2003 by the Croatian Medical Journal. All rights reserved. Apart from any relaxation permitted under national copyright laws, no part of this article may be reproduced, stored in a retrieval system or transmitted in any form or by any means without the prior permission of the copyright owners. Permission is not, however, required for a duplicate publication of the article on condition that a full reference to the source is given. Multiple copying of the contents of the article is always illegal.
* * * * * * * * * * * * * * * * * * * * * * * * *
Microgram Journal, Volume 1, Numbers 3-4 (July - December 2003) 207
Brought to you by AltGov2 [www.altgov2.org]
Report of the Scientific Working Group for the Analysis of Seized Drugs (SWGDRUG) Conference (Montreal)
Montreal, Canada; October 7 - 9, 2003
Joseph P. Bono U.S. Drug Enforcement Administration
Office of Forensic Sciences 2401 Jefferson Davis Highway
Alexandria, VA 22301 [email: [email protected]]
The Scientific Working Group for the Analysis of Seized Drugs (SWGDRUG) is an International Working Group dedicated to the development and implementation of minimum standards for the identification of drug exhibits in forensic science laboratories. The primary objectives for the Group are:
* Promote professional development in forensic drug analysis. * Provide a means for information exchange within the forensic science community. * Provide guidelines for drug examinations and reporting. * Specify requirements for analysts’ knowledge, skills, and abilities. * Establish quality assurance guidelines. * Promote and gain international acceptance of SWGDRUG standards.
The Eighth SWGDRUG Conference was held October 7-9, 2003 in Montreal, Canada. Core committee members in attendance included:
Susan Ballou (National Institute of Standards and Technology, Gaithersburg, Maryland)
Joseph P. Bono (Drug Enforcement Administration, Office of Forensic Sciences, Arlington, Virginia)
Dr. Bob Bramley (Forensic Science Service, Trident Court, Birmingham, England)
Gary Chasteen (California Association of Criminalists, Los Angeles Country Sheriff’s Laboratory, Downey, California)
Dr. Maria Eugenia Forero (National Institute of Legal Medicine and Forensic Science, Bogotá, Colombia)
Richard Gervasoni (American Society of Crime Laboratory Directors, Montgomery County Police Department Laboratory, Rockville, Maryland)
Linda Jackson (Mid-Atlantic Association of Forensic Scientists, Virginia Division of Forensic Sciences, Richmond, Virginia)
Thomas J. Janovsky (Drug Enforcement Administration, Office of Forensic Sciences, Arlington, Virginia)
Dr. Tohru Kishi (National Research Institute of Police Science, Chiba, Japan)
Richard Laing (Health Canada, Burnaby, British Columbia, Canada)
Microgram Journal, Volume 1, Numbers 3-4 (July - December 2003) 208
Brought to you by AltGov2 [www.altgov2.org]
Jack Mario (Northeastern Association of Forensic Scientists and ASTM, Suffolk County CrimeLaboratory, Hauppauge, New York)
Jerry Massetti (Northwestern Association of Forensic Scientists, California Department of Justice,California Criminalistics Institute, Sacramento, California)
Richard Paulas (Mid-Western Association of Forensic Scientists, Illinois State Police, Chicago, Illinois)
Catherine Quinn (Victoria Forensic Science Center, McCleod, Australia)
Dr. Conrad Roberson (South Eastern Association of Forensic Scientists, Georgia Bureau ofInvestigation, Decatur, Georgia)
Dr. Charles “Chris” Tindall (Metropolitan State College Academia, Denver, Colorado)
Eileen Waninger (Federal Bureau of Investigation, Quantico, Virginia)
Dr. Udo Zerell (Bundeskriminalamt, Wiesbaden, Germany)
Etienne van Zyl (South African State Police, Pretoria, South Africa)
Two core committee members were unable to attend the Fall 2003 conference:
Dr. Erkki Sippola (European Network of Forensic Science Institutes (ENFSI), National Bureau of Investigation, Crime Laboratory, Vantaa, Finland)
Dr. Howard Stead (Division for Policy Analysis and Public Affairs, United Nations Office on Drugs and Crime, Vienna, Austria)
The 2003 SWDRUG conference included the addition of two new Core Committee members. Dr. Maria Eugenia Forero and Mr. Etienne van Zyl were welcomed as members of the Core Committee. Dr. Forero will represent South America, and Mr. van Zyl will represent Africa. This is another step in the process of increasing representation of the Core Committee to include a member from every continent.
Accomplishments
The accomplishments of the Montreal Conference included:
1. The three published recommendations on Education and Training, Methods of Analysis, and Quality Assurance were updated. The Education and Training and Methods of Analysis Recommendations were discussed and accepted by the core committee with minor modifications. The Quality Assurance Recommendations are still under review. In order to address the concerns of forensic drug examiners internationally, one significant change was made to the Methods of Analysis for Drug Identification. This change appears in paragraph 3.5.1. The paragraph now reads:
“For exhibits of cannabis that lack sufficient observable macroscopic and microscopic botanical detail (e.g., extracts or residues), the )9-tetrahydrocannabinol (THC) or other cannabinoids must be identified using the principles set forth in sections 3.1 and 3.2.”
2. After review by forensic drug examiners, the core committee approved a recommendation entitled: Code of Professional Practice for Drug Analysts.
Microgram Journal, Volume 1, Numbers 3-4 (July - December 2003) 209
Brought to you by AltGov2 [www.altgov2.org]
3. After review by forensic drug examiners the core committee approved a recommendation entitled: Validation of Analytical Techniques.
4. Review of document entitled: Sampling Seized Drugs for Qualitative Analysis. This document has been returned to the subcommittee for reformatting and will be re-submitted to the forensic community for comment in the near future.
All recommendations described above are included in this report. Also included are the current SWGDRUG Glossary of Terms and contact information for all SWGDRUG Core Committee Members.
SWGDRUG Publication (Part 2)
The Core Committee agreed to publish a second edition of SWGDRUG recommendations which will include the following parts:
Part I Code of Professional Practice
Part II Education and Training
Part III Methods of Analysis A. Sampling for qualitative analysis (Currently under revision for additional comments) B. Drug Identification
Part IV Quality Assurance A. General Practices (Currently being updated) B. Validation of Analytical Techniques
Issues to Be Addressed at the Next SWGDRUG Conference:
1. Accept the “Sampling” recommendation. 2. Complete the review of the “revised” Quality Assurance document. 3. Review a glossary for the inclusion in the publication. 4. Discuss specifics of an index 5. Consider an appendix to the validation document. 6. Consider issues to be addressed at SWGDRUG Part III
a) Uncertainty in quantitative and qualitative analyses b) Quantitation of controlled substances c) Reporting protocols (What should a report say?) d) Clandestine laboratories samples e) Inorganic Chemicals f) Non-controlled substances g) Drug Profiling h) Competence
* * * * * * * * * * * * * * * * * * * * * * * * *
Microgram Journal, Volume 1, Numbers 3-4 (July - December 2003) 210
Brought to you by AltGov2 [www.altgov2.org]
PART I - A CODE OF PROFESSIONAL PRACTICE FOR DRUG ANALYSTS
PREFACE - This Code of Professional Practice has been written specifically for analysts. However, it is important that their managers and the technicians and others who assist them in their work are equally aware of its provisions, and they support the analyst in adhering to these. Where appropriate, the provisions are also equally applicable to the technicians in the approach to their own work.
SECTION 1: INTRODUCTION
1.1 A Code of Professional Practice is intended to provide the framework of ethical values and scientific and legal obligations within which the analyst should operate. Details are also usually provided on how alleged breaches of the Code will be investigated, what sanctions are available and how appeals should be pursued.
1.2 A Code of Professional Practice is essential to analysts and their managers in helping them carry out their duties in a proper manner and in making appropriate decisions when questions of ethics arise.
1.3 A Code of Professional Practice that is enforced and publicly available is also a powerful means of demonstrating the professional expectations of analysts and the reliability of their findings to others in the criminal justice system and the public at large.
1.4 SWGDRUG recommends that all employers of analysts develop a Code of Professional Practice and the means of dealing with breaches of the Code.
1.5 SWGDRUG further recommends that all Codes of Professional Practice for analysts should include, as a minimum, provisions relating to their professional conduct, their casework and the reporting of their results, as provided in Section 2.
SECTION 2: CODE OF PROFESSIONAL PRACTICE
2.1 Professional Conduct
Analysts should:
2.1.1 Act with honesty, integrity and objectivity;
2.1.2 Work only within the bounds of their professional competence;
2.1.3 Take reasonable steps to maintain their competence;
2.1.4 Recognize that their overriding duty is to criminal justice;
2.1.5 Declare to their employer any prior contact or personal involvement, which may give rise to conflict of interest, real or perceived;
2.1.6 Declare to their employer or other appropriate authority any pressure intended to influence the result of an examination.
2.2 Casework
Analysts should:
Microgram Journal, Volume 1, Numbers 3-4 (July - December 2003) 211
Brought to you by AltGov2 [www.altgov2.org]
2.2.1 Ensure and be able to demonstrate that the integrity and security of evidential materials and the information derived from their analysis have been maintained while in their possession;
2.2.2 Ensure that they have a clear understanding of what the customer needs and all the necessary information, relevant evidential materials and facilities available to reach a meaningful conclusion in an appropriate timeframe;
2.2.3 Employ an appropriate analytical approach, using the facilities available;
2.2.4 Make and retain full, contemporaneous, clear and accurate records of all examinations and tests conducted, and conclusions drawn, in sufficient detail to allow meaningful review and assessment of the conclusions by an independent person competent in the field;
2.2.5 Accept responsibility for all casework done by themselves and under their direction;
2.2.6 Conduct all professional activities in a way that protects the health and safety of themselves, coworkers, the public and the environment.
2.3 Reporting
Analysts should:
2.3.1 Present advice and testimony, whether written or oral, in a clear and objective manner;
2.3.2 Be prepared to reconsider and, if necessary, change their conclusions, advice or testimony in light of new information or developments, and take the initiative in informing their employer and customers promptly of any such changes that need to be made;
2.3.3 Take appropriate action if there is potential for, or there has been, a miscarriage of justice due to new circumstances that have come to light, incompetent practice or malpractice;
2.3.4 Preserve customer confidentiality unless officially authorized to do otherwise.
APPENDIX
This appendix gives EXAMPLES to demonstrate the scope of the various provisions of the Code.
Casework
2.2.1 To ensure and be able to demonstrate that the integrity and security of evidential materials and the information derived from their analysis have been maintained while in their possession:
Keeping a record of the chain of custody;Making special note of the security of sealing and packaging of the evidential materials asreceived;Preserving the evidential materials from contamination, adulteration, deterioration, loss or theftby use of appropriate working practices and utilization of suitable storage facilities withcontrolled access;Using a unique identifier for the evidential materials, any sub-sample taken from them and anyaccompanying documentation, that will minimize the risk of misidentification;Keeping the evidential materials in their original condition for future reference, insofar as this ispossible;Securely repackaging and resealing the evidential materials after their examination;
Microgram Journal, Volume 1, Numbers 3-4 (July - December 2003) 212
Brought to you by AltGov2 [www.altgov2.org]
Preserving and returning all original packaging, with original seals intact, where this is possible; Ensuring that access to the evidential materials and all documentation relating to these, before and after their examination, is restricted to authorized personnel.
2.2.2 To ensure that they have a clear understanding of what the customer needs and all the necessary information, relevant evidential materials and facilities available to reach a meaningful conclusion in an appropriate timeframe:
Conferring with the customer, if there is any uncertainty over their requirement;Establishing what work needs to be performed to provide a fit for purpose response to thecustomer’s requirement;Ensuring that all the requisite information and evidential materials have been submitted;Checking that all the necessary accommodation, equipment, materials and skills will be availablewhen required;Declining to do the testing if the customer’s requirement cannot be met.
2.2.3 To employ an appropriate analytical approach, using the facilities available:
Adhering to the SWGDRUG recommendations;Performing only those analyses that are needed to meet the specified customer requirement;Making best use of the available resources in meeting the customer requirement;Ensuring that the identification and quantification of any drug reflects what was present in thematerial submitted.
2.2.4 To make and retain full, contemporaneous, clear and accurate records of all examinations and tests conducted, and conclusions drawn, in sufficient detail to allow meaningful review and assessment of the conclusions by an independent person competent in the field:
Writing legibly;Avoiding use of personal shorthand;Recording all pertinent information at the time it is generated, or as soon as practicable thereafter;Ensuring that there can be no uncertainty about what work has been carried out, how, when,where and by whom;Complying with local jurisdictional requirements;Consistently maintaining well-ordered casefiles and ensuring that these are available for review.
2.2.5 To accept responsibility for all casework done by themselves and under their direction:
Providing suggestions for improvement;Ensuring that all work carried out personally and by others under their direction is in compliancewith the laboratory’s procedures and protocols;Providing clear, documented instructions to persons who do work on their behalf that mightsubsequently be used to support any advice or evidence they give;Defending and justifying all work that is carried out by themselves and by others on their behalf.
2.2.6 To conduct all professional activities in a way that protects the health and safety of themselves, co-workers, the public and the environment:
Being aware of and complying at all times with current health and safety legislation;Ensuring that all relevant risk assessments have been carried out and safe systems of work are inplace and being followed;Ensuring that others in the vicinity of their work are aware of their activities, particularly wherethese involve the investigation of clandestine laboratories, potential exposure to controlled drugs,
Microgram Journal, Volume 1, Numbers 3-4 (July - December 2003) 213
Brought to you by AltGov2 [www.altgov2.org]
especially from bulk seizures, the use of other hazardous materials or the destruction/disposal of drugs and other hazardous materials.
Reporting
2.3.1 To present their advice and testimony, whether written or oral, in a clear and objective manner:
Adhering to the SWGDRUG recommendations;Using lay terms wherever possible;Explaining technical terms so that they can be properly understood;Including only facts and objective interpretations in their advice or evidence that can be justifiedby the work done and the information available;Considering and providing alternative explanations or interpretations for their findings, whereappropriate;Making clear the strengths and any limitations in their advice or evidence;Declaring anything that might undermine the integrity of their evidence or its use (e.g., unsecuredpackaging; possible contamination).
2.3.2 To be prepared to reconsider and, if necessary, change their conclusions, advice or testimony in light of new information or developments, and take the initiative in informing their employer and customers promptly of any such changes that need to be made; Accepting an on-going responsibility for any advice or evidence provided; Immediately bringing to the attention of their employer anything that they have become aware of that might cause them to question the validity of any advice given or evidence provided; Informing the appropriate external authorities (e.g., police, prosecutor) of their concerns; Recording in the casefile all such new information, an assessment of its implications and the actions taken.
2.3.3 To take appropriate action if there is potential for, or there has been, a miscarriage of justice due to new circumstances that have come to light, incompetent practice or malpractice:
Informing their employer about the new circumstances;Informing their employer about relevant concerns they have about the quality of their own workor that of others working under their direction;Advising their employer of any relevant concerns they may have about the work, advice orevidence provided by others;Reporting to their employer any relevant concerns that others may have made (e.g., customercomplaints; criticisms in court);Ensuring that the information is brought to the attention of the appropriate external authority.
2.3.4 To preserve customer confidentiality unless officially authorized to do otherwise:
Not disclosing information about a case unless explicitly authorized to do so by the customer, a court, or other body with the relevant statutory powers; required by the law to disclose specified information to a designated person; or an overriding duty to the court and justice system for such disclosure is recognized.
* * * * * * * * * * * * * * * * * * * * * * * * *
Microgram Journal, Volume 1, Numbers 3-4 (July - December 2003) 214
Brought to you by AltGov2 [www.altgov2.org]
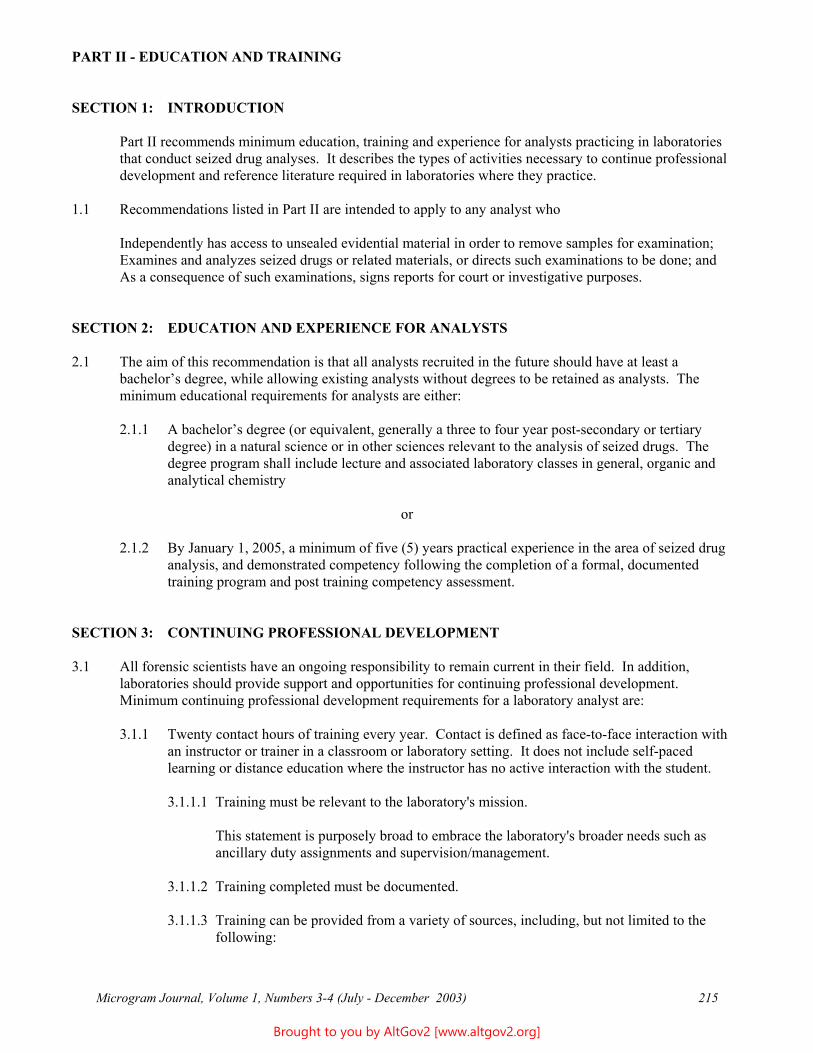
PART II - EDUCATION AND TRAINING
SECTION 1: INTRODUCTION
Part II recommends minimum education, training and experience for analysts practicing in laboratories that conduct seized drug analyses. It describes the types of activities necessary to continue professional development and reference literature required in laboratories where they practice.
1.1 Recommendations listed in Part II are intended to apply to any analyst who
Independently has access to unsealed evidential material in order to remove samples for examination; Examines and analyzes seized drugs or related materials, or directs such examinations to be done; and As a consequence of such examinations, signs reports for court or investigative purposes.
SECTION 2: EDUCATION AND EXPERIENCE FOR ANALYSTS
2.1 The aim of this recommendation is that all analysts recruited in the future should have at least a bachelor’s degree, while allowing existing analysts without degrees to be retained as analysts. The minimum educational requirements for analysts are either:
2.1.1 A bachelor’s degree (or equivalent, generally a three to four year post-secondary or tertiary degree) in a natural science or in other sciences relevant to the analysis of seized drugs. The degree program shall include lecture and associated laboratory classes in general, organic and analytical chemistry
or
2.1.2 By January 1, 2005, a minimum of five (5) years practical experience in the area of seized drug analysis, and demonstrated competency following the completion of a formal, documented training program and post training competency assessment.
SECTION 3: CONTINUING PROFESSIONAL DEVELOPMENT
3.1 All forensic scientists have an ongoing responsibility to remain current in their field. In addition, laboratories should provide support and opportunities for continuing professional development. Minimum continuing professional development requirements for a laboratory analyst are:
3.1.1 Twenty contact hours of training every year. Contact is defined as face-to-face interaction with an instructor or trainer in a classroom or laboratory setting. It does not include self-paced learning or distance education where the instructor has no active interaction with the student.
3.1.1.1 Training must be relevant to the laboratory's mission.
This statement is purposely broad to embrace the laboratory's broader needs such as ancillary duty assignments and supervision/management.
3.1.1.2 Training completed must be documented.
3.1.1.3 Training can be provided from a variety of sources, including, but not limited to the following:
Microgram Journal, Volume 1, Numbers 3-4 (July - December 2003) 215
Brought to you by AltGov2 [www.altgov2.org]
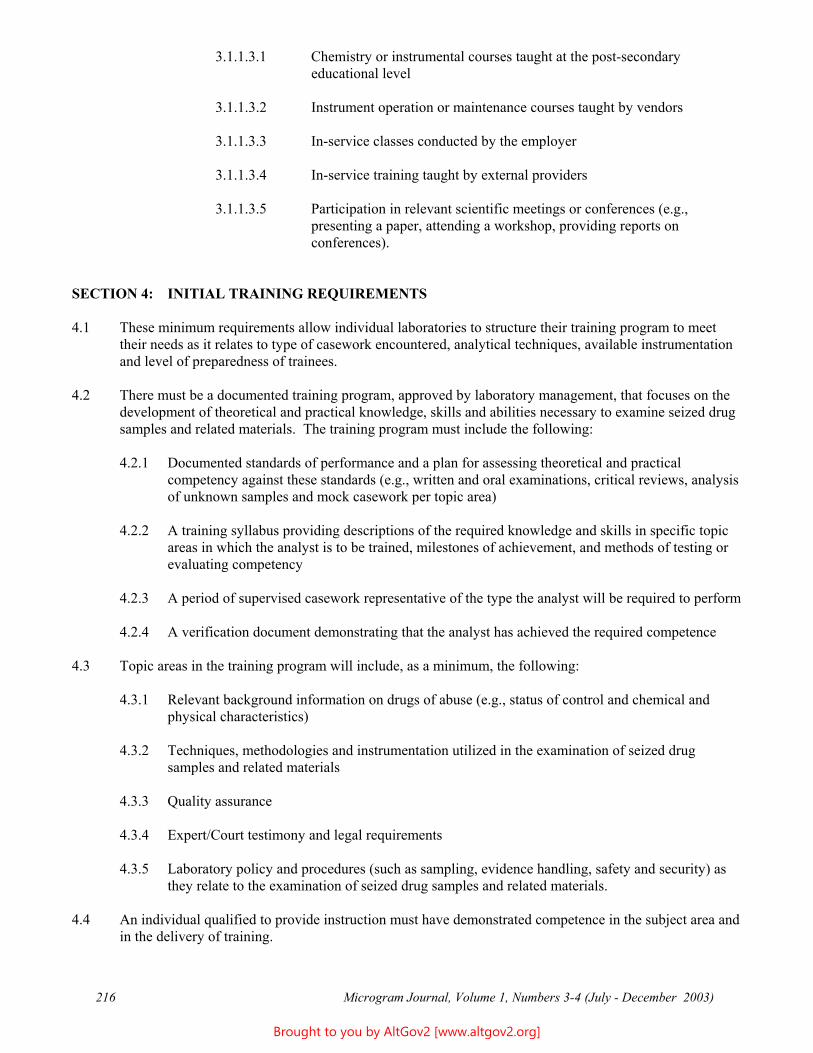
3.1.1.3.1 Chemistry or instrumental courses taught at the post-secondary educational level
3.1.1.3.2 Instrument operation or maintenance courses taught by vendors
3.1.1.3.3 In-service classes conducted by the employer
3.1.1.3.4 In-service training taught by external providers
3.1.1.3.5 Participation in relevant scientific meetings or conferences (e.g., presenting a paper, attending a workshop, providing reports on conferences).
SECTION 4: INITIAL TRAINING REQUIREMENTS
4.1 These minimum requirements allow individual laboratories to structure their training program to meet their needs as it relates to type of casework encountered, analytical techniques, available instrumentation and level of preparedness of trainees.
4.2 There must be a documented training program, approved by laboratory management, that focuses on the development of theoretical and practical knowledge, skills and abilities necessary to examine seized drug samples and related materials. The training program must include the following:
4.2.1 Documented standards of performance and a plan for assessing theoretical and practical competency against these standards (e.g., written and oral examinations, critical reviews, analysis of unknown samples and mock casework per topic area)
4.2.2 A training syllabus providing descriptions of the required knowledge and skills in specific topic areas in which the analyst is to be trained, milestones of achievement, and methods of testing or evaluating competency
4.2.3 A period of supervised casework representative of the type the analyst will be required to perform
4.2.4 A verification document demonstrating that the analyst has achieved the required competence
4.3 Topic areas in the training program will include, as a minimum, the following:
4.3.1 Relevant background information on drugs of abuse (e.g., status of control and chemical and physical characteristics)
4.3.2 Techniques, methodologies and instrumentation utilized in the examination of seized drug samples and related materials
4.3.3 Quality assurance
4.3.4 Expert/Court testimony and legal requirements
4.3.5 Laboratory policy and procedures (such as sampling, evidence handling, safety and security) as they relate to the examination of seized drug samples and related materials.
4.4 An individual qualified to provide instruction must have demonstrated competence in the subject area and in the delivery of training.
Microgram Journal, Volume 1, Numbers 3-4 (July - December 2003) 216
Brought to you by AltGov2 [www.altgov2.org]
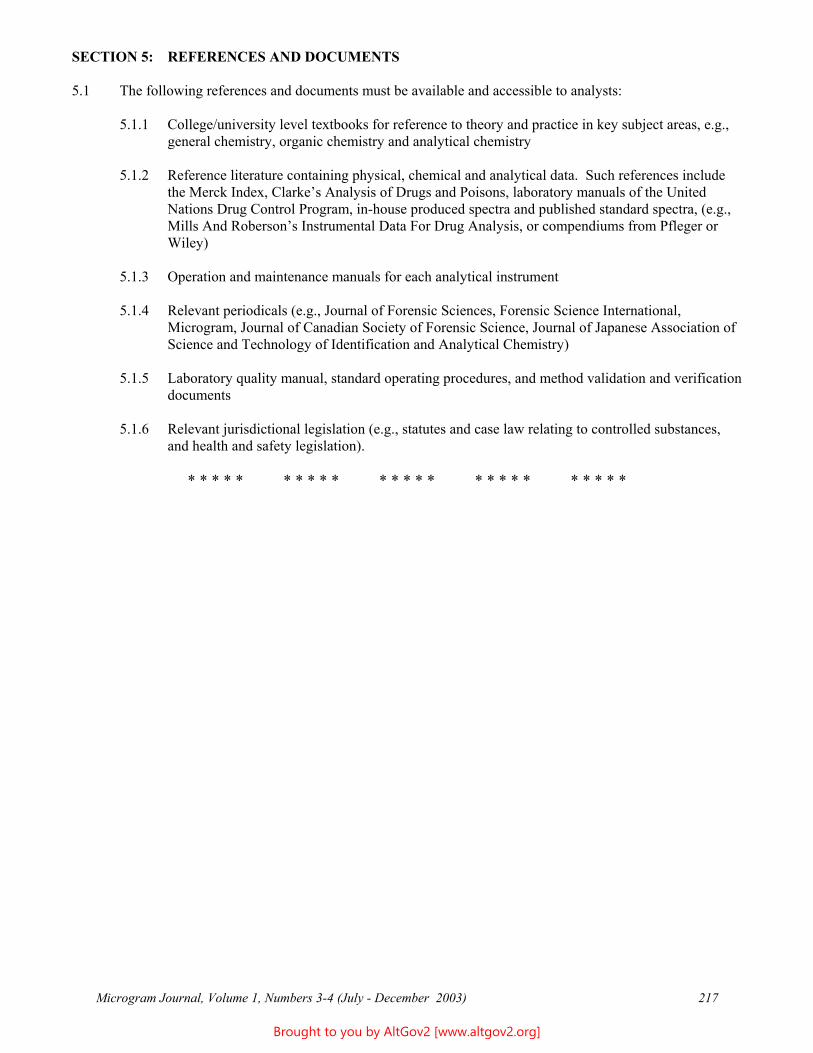
SECTION 5: REFERENCES AND DOCUMENTS
5.1 The following references and documents must be available and accessible to analysts:
5.1.1 College/university level textbooks for reference to theory and practice in key subject areas, e.g., general chemistry, organic chemistry and analytical chemistry
5.1.2 Reference literature containing physical, chemical and analytical data. Such references include the Merck Index, Clarke’s Analysis of Drugs and Poisons, laboratory manuals of the United Nations Drug Control Program, in-house produced spectra and published standard spectra, (e.g., Mills And Roberson’s Instrumental Data For Drug Analysis, or compendiums from Pfleger or Wiley)
5.1.3 Operation and maintenance manuals for each analytical instrument
5.1.4 Relevant periodicals (e.g., Journal of Forensic Sciences, Forensic Science International, Microgram, Journal of Canadian Society of Forensic Science, Journal of Japanese Association of Science and Technology of Identification and Analytical Chemistry)
5.1.5 Laboratory quality manual, standard operating procedures, and method validation and verification documents
5.1.6 Relevant jurisdictional legislation (e.g., statutes and case law relating to controlled substances, and health and safety legislation).
* * * * * * * * * * * * * * * * * * * * * * * * *
Microgram Journal, Volume 1, Numbers 3-4 (July - December 2003) 217
Brought to you by AltGov2 [www.altgov2.org]
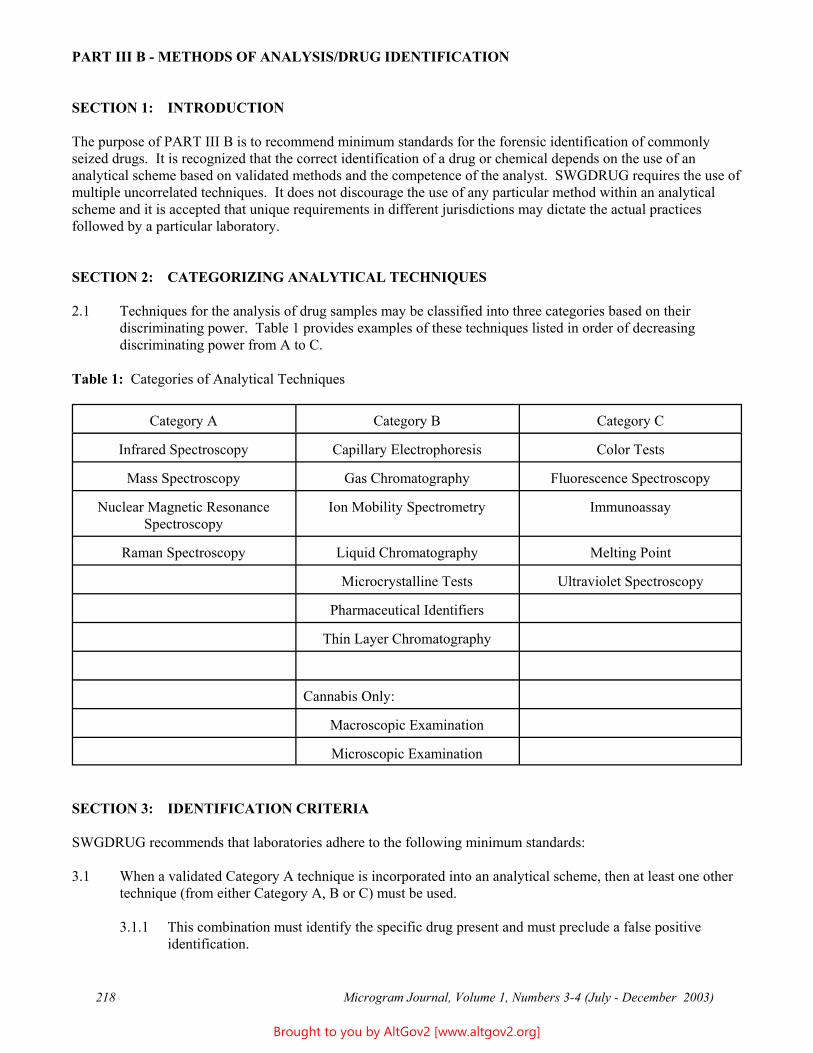
PART III B - METHODS OF ANALYSIS/DRUG IDENTIFICATION
SECTION 1: INTRODUCTION
The purpose of PART III B is to recommend minimum standards for the forensic identification of commonly seized drugs. It is recognized that the correct identification of a drug or chemical depends on the use of an analytical scheme based on validated methods and the competence of the analyst. SWGDRUG requires the use of multiple uncorrelated techniques. It does not discourage the use of any particular method within an analytical scheme and it is accepted that unique requirements in different jurisdictions may dictate the actual practices followed by a particular laboratory.
SECTION 2: CATEGORIZING ANALYTICAL TECHNIQUES
2.1 Techniques for the analysis of drug samples may be classified into three categories based on their discriminating power. Table 1 provides examples of these techniques listed in order of decreasing discriminating power from A to C.
Table 1: Categories of Analytical Techniques
Category A Category B Category C
Infrared Spectroscopy Capillary Electrophoresis Color Tests
Mass Spectroscopy Gas Chromatography Fluorescence Spectroscopy
Nuclear Magnetic Resonance Spectroscopy
Ion Mobility Spectrometry Immunoassay
Raman Spectroscopy Liquid Chromatography Melting Point
Microcrystalline Tests Ultraviolet Spectroscopy
Pharmaceutical Identifiers
Thin Layer Chromatography
Cannabis Only:
Macroscopic Examination
Microscopic Examination
SECTION 3: IDENTIFICATION CRITERIA
SWGDRUG recommends that laboratories adhere to the following minimum standards:
3.1 When a validated Category A technique is incorporated into an analytical scheme, then at least one other technique (from either Category A, B or C) must be used.
3.1.1 This combination must identify the specific drug present and must preclude a false positive identification.
Microgram Journal, Volume 1, Numbers 3-4 (July - December 2003) 218
Brought to you by AltGov2 [www.altgov2.org]
3.1.2 When sample size allows, the second technique should be applied on a separate sampling for quality assurance reasons. When sample size is limited, additional measures should be taken to assure that the results correspond to the correct sample.
3.1.3 All Category A techniques must have data that are reviewable.
3.2 When a Category A technique is not used, then at least three different validated methods must be employed.
3.2.1 These in combination must demonstrate the identity of the specific drug present and must preclude a false positive identification.
3.2.2 Two of the three methods must be based on uncorrelated techniques from Category B.
3.2.3 A minimum of two separate samplings should be used in these three tests. When sample size is limited, additional measures should be taken to assure that the results correspond to the correct sample.
3.3.4 All Category B techniques must have reviewable data.
3.3 For the use of any method to be considered of value, test results must be considered “positive.” While “negative” test results provide useful information for ruling out the presence of a particular drug or drug class, these results have no value toward establishing the forensic identification of a drug.
3.4 In cases where hyphenated techniques are used (e.g., gas chromatography-mass spectrometry, liquid chromatography-diode array ultraviolet spectroscopy), they will be considered as separate techniques provided that the results from each are used.
3.5 Cannabis exhibits tend to have characteristics that are visually recognizable. Macroscopic and microscopic examinations of cannabis will be considered, exceptionally, as uncorrelated techniques from Category B when observations include documented details of botanical features. Additional testing must follow the scheme outlined in sections 3.1 or 3.2.
3.5.1 For exhibits of cannabis that lack sufficient observable macroscopic and microscopic botanical detail (e.g., extracts or residues), ∆9-tetrahydrocannabinol (THC) or other cannabinoids must be identified utilizing the principles set forth in sections 3.1 and 3.2.
3.6 Examples of reviewable data are:
3.6.1 Printed spectra, chromatograms and photographs or photocopies of TLC plates
3.6.2 Contemporaneous documented peer review for microcrystalline tests
3.6.3 Recording of detailed descriptions of morphological characteristics for cannabis (only)
3.6.4 Reference to published data for pharmaceutical identifiers.
SECTION 4: COMMENT
These recommendations are minimum standards for the forensic identification of commonly seized drugs. However, it should be recognized that they may not be sufficient for the identification of all drugs in all circumstances. Within these recommendations, it is up to the individual laboratory’s management to determine which combination of analytical techniques best satisfies the requirements of its jurisdiction.
Microgram Journal, Volume 1, Numbers 3-4 (July - December 2003) 219
Brought to you by AltGov2 [www.altgov2.org]
PART IV A - QUALITY ASSURANCE/GENERAL PRACTICES
[Note: The Recommendations in this Part Are Currently Being Re-Evaluated and Updated]
SECTION 1: INTRODUCTION
Recommendations IN PART IV involving the analysis of seized drugs are limited to qualitative analysis only. Issues involving quantitative analysis will be taken up in a later version.
It is the goal of a laboratory's drug analysis program to provide the customers of the laboratory's services access to quality drug analysis. It is the goal of these guidelines PART IV to provide a quality framework for managing the processing of drug casework, including handling of evidentiary material, management practices, analysis and reporting. These are minimum recommendations for practice.
The term “evidence” has many meanings throughout the international community. In this document it is used to describe drug exhibits which enter a laboratory system.
1.1 QUALITY MANAGEMENT SYSTEM
A documented quality management system must be established and maintained. Personnel responsible for this must be clearly designated and shall have direct access to the highest level of management concerning laboratory policy.
1.1.1 The quality management system must cover all procedures and reports associated with drug analysis.
SECTION 2: PERSONNEL
2.1 JOB DESCRIPTION
The job descriptions for all personnel should include responsibilities, duties and required skills.
2.2 DESIGNATED PERSONNEL AND RESPONSIBILITIES
An individual (however titled) may be responsible for one or more of the following duties:
2.2.1 Quality Assurance Manager: A designated person who is responsible for maintaining the quality management system (including an annual review of the program) and who monitors compliance with the program.
2.2.2 Health & Safety Manager: A designated person who is responsible for maintaining the Laboratory Health and Safety program (including an annual review of the program) and who monitors compliance with the program.
2.2.3 Technical Support Personnel: Individuals who perform basic laboratory duties, but do not analyze evidence.
2.2.4 Technician/Assistant Analyst: A person who analyzes evidence, but does not issue reports for court purposes.
2.2.5 Analyst: A designated person who
Microgram Journal, Volume 1, Numbers 3-4 (July - December 2003) 220
Brought to you by AltGov2 [www.altgov2.org]
2.2.5.1 Examines and analyzes seized drugs or related materials, or directs such examinations tobe done
2.2.5.2 Independently has access to unsealed evidence in order to remove samples from theevidentiary material for examination AND
2.2.5.3 As a consequence of such examinations, signs reports for court or other purposes.
2.2.6 Supervisor: A designated person who has the overall responsibility and authority for thetechnical operations of the drug analysis section. Technical operations include, but are notlimited to protocols, analytical methodology, and technical review of reports.
2.3 QUALIFICATIONS/EDUCATION
2.3.1 Technical Support Personnel will
2.3.1.1 Have education, skills and abilities commensurate with their responsibilities AND
2.3.1.2 Have on-the-job training specific to their position.
2.3.2 Technicians/Assistant Analysts will
2.3.2.1 Have education, skills and abilities commensurate with their responsibilities AND
2.3.2.2 Have on-the-job training specific to their position.
2.3.3 Analysts will have
2.3.3.1 A bachelor’s degree (or equivalent, generally a three to four year post-secondary ortertiary degree) in a natural science or in other sciences relevant to the analysis of seizeddrugs. The degree program shall include lecture and associated laboratory classes ingeneral, organic and analytical chemistry
or
2.3.3.2 By January 1, 2005, a minimum of five (5) years practical experience in the area ofseized drug analysis, and have demonstrated competency following the completion of aformal, documented training program and post training competency assessment.
2.3.4 Supervisors will
2.3.4.1 Meet all the requirements of an analyst (2.3.3),
2.3.4.2 Have a minimum of two (2) years of experience as an analyst in the forensic analysis ofdrugs and
2.3.4.3 Demonstrate knowledge necessary to evaluate analytical results and conclusions.
2.4 INITIAL TRAINING REQUIREMENTS
2.4.1 These minimum requirements allow individual laboratories to structure their training program tomeet their needs as it relates to type of casework encountered, analytical techniques, availableinstrumentation and level of preparedness of trainees.
Microgram Journal, Volume 1, Numbers 3-4 (July - December 2003) 221
Brought to you by AltGov2 [www.altgov2.org]
2.4.2 There must be a documented training program, approved by laboratory management, which focuses on the development of theoretical and practical knowledge, skills and abilities necessary to examine seized drug samples and related materials. The training program must include the following:
2.4.2.1 Documented standards of performance and a plan for assessing theoretical and practical competency against these standards (e.g., written and oral examinations, critical reviews, analysis of unknown samples and mock casework per topic area)
2.4.2.2 A training syllabus providing descriptions of the required knowledge and skills in specific topic areas in which the analyst is to be trained, milestones of achievement, and methods of testing or evaluating competency
2.4.2.3 A period of supervised casework representative of the type the analyst will be required to perform
2.4.2.4 A verification document demonstrating that the analyst has achieved the required competence.
2.5 MAINTAINING COMPETENCE
2.5.1 Minimum annual training required for continuing professional development of analysts is twenty (20) contact hours.
2.5.1.1 Training must be relevant to the laboratory's mission.
2.5.1.2 Training completed must be documented.
SECTION 3: PHYSICAL PLANT
3.1 PHYSICAL PLANT REQUIREMENTS
3.1.1 Laboratories shall provide a healthy, safe and secure environment for its personnel and operations.
3.1.2 Laboratories must contain adequate space to perform required analytical functions and prevent contamination.
3.1.3 Chemical fume hoods must be provided. They must be properly maintained and monitored according to an established schedule.
3.1.4 A laboratory cleaning schedule must be established and implemented.
3.1.5 Adequate facilities must be provided to ensure the proper safekeeping of evidence, standards and records.
3.1.6 Appropriately secured storage must be provided to prevent contamination of chemicals and reagents.
SECTION 4: EVIDENCE CONTROL
Laboratories shall have and follow a documented evidence control system to ensure the integrity of physical
Microgram Journal, Volume 1, Numbers 3-4 (July - December 2003) 222
Brought to you by AltGov2 [www.altgov2.org]
evidence.
4.1 RECEIVING AND IDENTIFYING EVIDENCE
Laboratories must maintain records of requests for analysis and of the respective items of evidence. A unique identifier must be assigned to each case file or record. For chain-of-custody purposes, the evidence shall be compared to the submission documentation, any significant observations of irregularity should be documented in the case file or record, and the submitter informed promptly. This file or record must include, at least, the following:
4.1.1 Submission documents or copies
4.1.2 Identity of party requesting analysis and the date of request
4.1.3 Description of items of evidence submitted for analysis
4.1.4 Identity of the person who delivers the evidence, along with date of submission
4.1.4.1 For evidence not delivered in person, descriptive information regarding mode of delivery and tracking information
4.1.5 Chain of custody record
4.1.6 Unique case identifier
4.2 INTEGRITY OF EVIDENCE
Evidence must be properly secured. Appropriate storage conditions shall ensure that, insofar as possible, the composition of the seized material is not altered. All items must be safeguarded against loss or contamination. Any alteration of the evidence (e.g., repackaging) must be documented in writing. Procedures should be implemented to assure that samples are AND REMAIN properly labeled throughout the analytical process.
4.3 STORAGE OF EVIDENCE
Access to the evidence storage area must be granted only to persons with authorization and access shall be controlled. A system shall be established to document the chain of custody FOR EVIDENCE IN LABORATORY CUSTODY.
4.4 DISPOSITION OF EVIDENCE
Records must be kept regarding the disposition of all items of evidence.
4.5 DOCUMENTATION PROCEDURES
All laboratory records such as results of analyses, measurements, notes, calibrations, chromatograms, spectra and reports shall be retained in a secure fashion.
SECTION 5: ANALYTICAL PROCEDURES
5.1 ANALYTICAL PROCEDURES FOR DRUG ANALYSIS
5.1.1 The laboratory shall have and follow written analytical procedures.
Microgram Journal, Volume 1, Numbers 3-4 (July - December 2003) 223
Brought to you by AltGov2 [www.altgov2.org]
5.1.2 The laboratory shall have in place protocols for the sampling of evidence.
5.1.3 Work practices shall be established to prevent contamination of evidence during analysis.
5.1.4 The laboratory shall monitor the analytical processes using appropriate controls and traceable standards.
5.1.5 The laboratory shall have and follow written guidelines for the acceptance and interpretation of data.
5.1.6 Analytical procedures must be validated in compliance with Section 10.
5.1.7 The analyst shall determine the identity of a drug in a sample, and be assured that the result relates to the right submission. This is best established by the use of at least two appropriate techniques based on different principles and two independent samplings.
5.2 MINIMUM REQUIREMENTS FOR THE VERIFICATION OF DRUG REFERENCE MATERIALS FOR FORENSIC DRUG ANALYSIS.
5.2.1 The identity of certified reference materials should be verified prior to their first use.
5.2.2 The identity of uncertified reference materials must be authenticated prior to use by methods such as mixed melting point determination, Mass Spectrometry, Infrared Spectroscopy, or Nuclear Magnetic Resonance Spectrometry.
5.2.3 Verification must be performed on each new drug lot.
5.2.4 All verification testing must be documented to include the name of the individual who performed the identification, date of verification, verification test data, and reference identification.
SECTION 6: INSTRUMENT/EQUIPMENT PERFORMANCE
6.1 INSTRUMENT PERFORMANCE
Instruments must be routinely monitored to ensure that proper performance is maintained.
6.1.1 Monitoring should include the use of reference standards, test mixtures, calibration standards, blanks, etc.
6.1.2 Instrumentation performance monitoring must be documented.
6.2 EQUIPMENT
Only suitable and properly operating equipment shall be employed. Monitoring of equipment parameters shall be conducted and documented.
6.2.1 The manufacturer's operation manual and other relevant documentation for each piece of equipment should be readily available.
SECTION 7: CHEMICALS AND REAGENTS
7.1 CHEMICALS AND REAGENTS
Microgram Journal, Volume 1, Numbers 3-4 (July - December 2003) 224
Brought to you by AltGov2 [www.altgov2.org]
7.1.1 Chemicals and reagents used in drug testing must be of the appropriate grade for the testsperformed.
7.1.2 There must be written formulations for all chemical reagents produced within the laboratory.
7.1.3 Documentation for reagents prepared within the laboratory must include identity, concentration(when appropriate), date of preparation, identity of the individual preparing the reagents and theexpiration date (if appropriate).
7.1.4 The efficacy of all test reagents must be checked prior to their use in casework. The results ofthese tests should be documented.
7.1.5 Chemical and reagent containers should be dated and initialed when received and also when firstopened.
SECTION 8: CASEWORK DOCUMENTATION, REPORT WRITING AND REVIEW
8.1 CASEWORK
8.1.1 Documentation must contain sufficient information to allow a peer to evaluate case notes andinterpret the data.
8.1.2 Evidence handling documentation should include chain of custody, the initial weight/count ofevidence to be examined (upon receipt by the analyst), information regarding the packaging ofthe evidence upon receipt, a description of the evidence and communications regarding the case.
8.1.3 Analytical documentation should include procedures, standards, blanks, observations, results ofthe tests, and supporting documentation including charts, graphs, and spectra generated during anexamination.
8.1.4 Casework documentation must be preserved according to written laboratory policy.
8.2 REPORT WRITING
8.2.1 Reports issued by the laboratory must meet the requirements of the jurisdiction served. Thesemay include:
8.2.1.1 Identity of the examining laboratory
8.2.1.2 Case identifier
8.2.1.3 Identity of the contributor
8.2.1.4 Date of receipt
8.2.1.5 Date of report
8.2.1.6 Descriptive list of submitted evidence
8.2.1.7 Identity of analyst
8.2.1.8 Results/Conclusions
Microgram Journal, Volume 1, Numbers 3-4 (July - December 2003) 225
Brought to you by AltGov2 [www.altgov2.org]
8.2.1.9 Analytical techniques employed
8.3 CASE REVIEW
8.3.1 The laboratory must have a written policy establishing the protocols for technical andadministrative case review.
8.3.2 The laboratory must have a written policy to determine the course of action should an analyst andreviewer fail to agree.
SECTION 9: PROFICIENCY AND COMPETENCY TESTING
Each laboratory should participate in at least an annual inter-laboratory proficiency testing program and should have written protocols for testing the competency of its laboratory analysts.
9.1 PROFICIENCY TESTING
9.1.1 Laboratories shall perform proficiency testing in order to verify the laboratory's performance incomparison to other laboratories The frequency of the proficiency testing should be at leastannually.
9.1.2 The proficiency testing samples should be representative of the laboratory's normal casework.
9.1.3 The analytical scheme should be in concert with the normal laboratory analysis procedures.
9.2 COMPETENCY TESTING
9.2.1 Laboratories will monitor the competency of their analysts. They should do so at least once ayear. One of the ways of doing this is by participating in competency tests.
9.2.2 Competency testing samples should be representative of the laboratory's normal casework.
9.2.3 The analytical scheme should be in concert with the normal laboratory analysis procedures.
SECTION 10: VALIDATION AND VERIFICATION
10.1 Method validation is required to demonstrate that the method is suitable for its intended purpose.
10.1.1 For qualitative analysis the parameters that need to be checked are specificity, limit of detection,and reproducibility.
10.1.2 Minimum acceptability criteria should be described along with means for demonstratingcompliance.
10.1.3 Validation documentation is required.
10.2 Laboratories adopting methods validated elsewhere should determine their own limit of detection andreproducibility.
Microgram Journal, Volume 1, Numbers 3-4 (July - December 2003) 226
Brought to you by AltGov2 [www.altgov2.org]
SECTION 11: LABORATORY AUDITS
11.1 Audits of laboratory operations should be conducted at least once a year.
11.2 Records of each audit must be maintained and should include the scope, date of the audit, name of the person conducting the audit, findings, and corrective actions taken, if necessary.
SECTION 12: DEFICIENCY OF ANALYSIS
In the course of examining seized drug samples and related materials, laboratories may expect to encounter some operations or results that are deficient in some manner. Each laboratory must have a written policy to deal with such deficiencies.
12.1 This policy must include the following:
12.1.1 A definition of a deficiency as any erroneous analytical result or interpretation, or any unapproved deviation* from an established policy or procedure in an analysis.
* Deviations from established policy must have documented management approval.
12.1.2 A requirement for immediate cessation of the activity or work of the individual involved, if warranted by the seriousness of the deficiency, as defined in the written policy.
12.1.3 A requirement for administrative review of the activity or work of the individual involved.
12.1.4 A requirement for evaluation of the impact this THAT deficiency may have had on other activities of the individual(S) or other analysts.
12.1.5 A requirement for documentation of the follow-up action taken as a result of the review.
12.1.6 A requirement for communication to appropriate employees of any confirmed deficiency which may have implications for their work.
Comment: It should be recognized that to be effective, the definition for "deficiency of analysis" must be relatively broad. As such, deficiencies may have markedly different degrees of seriousness. For example, a misidentification of a controlled substance would be very serious and perhaps require that either the methodology or the analyst be suspended pending appropriate remedial action, as determined by management. However, other deficiencies might be more clerical in nature, requiring a simple correction at the first line supervisory level, without any suspension of methodology or personnel. Thus, it may well be advantageous to identify the differing levels of seriousness for deficiencies and make the action required be commensurate with the seriousness.
SECTION 13: HEALTH AND SAFETY
The laboratory must have a documented health and safety program in place to meet the needs of the laboratory.
13.1 HEALTH AND SAFETY REQUIREMENTS
13.1.1 All personnel should receive appropriate health and safety training.
13.1.2 The drug analysis laboratory shall operate in accordance with laboratory policy and comply with any relevant statutory regulations.
Microgram Journal, Volume 1, Numbers 3-4 (July - December 2003) 227
Brought to you by AltGov2 [www.altgov2.org]
13.1.3 Laboratory health, and safety manual(s) shall be readily available to all laboratory personnel.
13.1.4 Material Safety Data Sheets (MSDS) shall be readily available to all laboratory personnel.
13.1.5 All chemicals, biohazards and supplies must be stored and disposed of according to applicablegovernment regulations and laboratory policy.
13.1.6 Safety hazards such as syringes, items with sharp edges or noxious substances should be solabeled.
SECTION 14: DOCUMENTATION
In addition to casework documentation, the forensic laboratory must maintain documentation on the following topics:
14.1 Test methods/procedures for drug analysis.
14.2 Reference standards (including source and verification).
14.3 Preparation and testing of reagents.
14.4 Evidence handling protocols.
14.5 Equipment calibration and maintenance.
14.6 Equipment inventory (e.g., manufacturer, model, serial number, acquisition date).
14.7 Proficiency testing.
14.8 Personnel training and qualification.
14.9 Quality assurance protocols and audits.
14.10 Health, safety and security protocols.
14.11 Validation data and results.
* * * * * * * * * * * * * * * * * * * * * * * * *
228 Microgram Journal, Volume 1, Numbers 3-4 (July - December 2003)
Brought to you by AltGov2 [www.altgov2.org]
PART IV B - QUALITY ASSURANCE/VALIDATION OF ANALYTICAL METHODS
SECTION 1. INTRODUCTION
1.1 Definition and purpose of Validation
Validation is the confirmation by examination and the provision of objective evidence that the particular requirements for a specific intended use are fulfilled. There are numerous documents that address the topic of validation but there are few validation protocols for methods specific to seized drug analysis.
1.2 Analytical scheme
An analytical scheme must be comprised of validated methods that are appropriate for the analyte.
A) The combinations of methods chosen for a particular analytical scheme must identify the specific drug of interest, preclude a false positive and minimize false negatives.
B) For quantification the method should reliably determine the amount of analyte present.
C) If validated methods are used from published literature or another laboratory’s protocols, then themethods must be verified within each laboratory.
D) Verification should, at a minimum, demonstrate that a representative set of reference materials hasbeen carried through the process and yielded the expected results.
1.3 Individual laboratory responsibility
Each laboratory should determine whether their current standard operating procedures have been validated, verified or require further validation/verification.
1.4 Operational environment
All methods must be validated or verified to demonstrate that they will perform in the normal operational environment when used by individuals expected to utilize the methods on casework.
1.5 Documentation
The entire validation/verification process must be documented and the documentation must be retained. Documentation must include, but is not limited to the following:
Personnel involvedDatesObservations from the processA statement of conclusions and/or recommendationsAuthorization approval signature
1.6 Recommendation
To meet the above requirements, SWGDRUG recommends that laboratories follow the applicable provisions of Section 2 [General Validation Plan] when validating seized drug analytical methods.
Microgram Journal, Volume 1, Numbers 3-4 (July - December 2003) 229
Brought to you by AltGov2 [www.altgov2.org]
SECTION 2. GENERAL VALIDATION PLAN
2.1 Purpose/Scope
This is an introductory statement that will specify what is being tested, the purpose of the testing and the result(s) required for acceptance.
2.1.1 Performance Specification
A list of specific objectives (e.g., trueness and precision) should be determined prior to the validation process.
2.1.2 Process Review
After completion of the validation process the objectives should be revisited to ensure that they have been satisfactorily met.
2.2 Analytical Method
State exactly the method to be validated. It is essential that each step in the method is demonstrated to perform satisfactorily. Steps that constitute a method for the identification and/or quantification of seized drugs may include:
Visual characterization (e.g., macroscopic examination) Determination of quantity of sample, which may include:
WeightVolumeItem count
Sampling (representative or random, dry, homogenized, etc.) Sample preparation
Extraction methodDissolutionDerivatizationCrystallizationTechniques for introducing the sample into the instrumentation
Instrumental parameters and specificationsA list of the instruments and equipment (e.g., balance and glassware) utilizedInstrument conditions
Software applications Calculations
Equation(s) to be usedUnit specificationNumber of measurements requiredReference valuesSignificant figure conventionsConditions for data rejectionUncertainty determination
2.3 Reference materials in validation
Appropriate reference material(s) must be used for qualitative and quantitative procedures.
2.4 Performance Characteristics
Microgram Journal, Volume 1, Numbers 3-4 (July - December 2003) 230
Brought to you by AltGov2 [www.altgov2.org]
2.4.1 Selectivity
Assess the capability of the method to identify/quantify the analyte(s) of interest, whether pure or in a mixture.
2.4.2 Matrix effects
Assess the impact of any interfering components and demonstrate that the method works in the presence of substances that are commonly encountered in seized drug samples (e.g., cutting agents, impurities, by-products and precursors).
2.4.3 Recovery
May be determined for quantitative analysis.
2.4.4 Accuracy
2.4.4.1 Precision (repeatability/reproducibility)
Determine the repeatability and reproducibility of all routine methods. Conditions under which these determinations are made must be specified. [Note: Reproducibility determination may be limited to studies within the same laboratory.]
A) Within the scope of the validation, determine the acceptable limits for repeatabilityand reproducibility.B) For qualitative analysis, run the qualitative method a minimum of ten times.C) For quantitative analysis, run the quantitative method a minimum of ten times.D) Validation criteria for non-routine methods may differ from those stated above.
2.4.4.2 Trueness
Trueness must be determined for quantitative methods to assess systematic error. Trueness can be assessed through various methods such as:
A) Comparison of a method-generated value for the reference material with its knownvalue using replicate measurements at different concentrations.B) Performance of a standard addition method.C) Comparison to proficiency test results.D) Comparison with a different validated analytical method.
2.4.5 Range
Determine the concentration or sample amount limits for which the method is applicable.
2.4.5.1 Limit of detection (LOD)
Limit of Detection (LOD) must be determined for all qualitative methods.
A) Determine the lowest amount of analyte that will be detected and can be identified. B) The results obtained at the LOD are not necessarily quantitatively accurate.
2.4.5.2 Limit of quantitation (LOQ)
Limit of Quantitation (LOQ) must be determined for all quantitative methods. Determine
Microgram Journal, Volume 1, Numbers 3-4 (July - December 2003) 231
Brought to you by AltGov2 [www.altgov2.org]
the lowest concentration that has an acceptable level of uncertainty.
2.4.5.3 Linearity
Linearity must be determined for all quantitative methods.
A) Determine the mathematical relationship (calibration curve) that exists betweenconcentration and response over a selected range of concentrations.B) The LOQ effectively forms the lower end of the working range.C) Determine the level of acceptable variation from the calibration curve at variousconcentrations.D) Determine the upper limits of the working range.
2.4.6 Robustness
Robustness must be determined for both qualitative and quantitative methods. Alter method parameters individually and determine any changes to accuracy.
2.4.7 Ruggedness
Ruggedness may be determined for qualitative or quantitative methods.
Alter the analysts, instrumentation and environment and assess the changes in accuracy.
2.5 Uncertainty
The contribution of random and systematic errors to method result uncertainty must be assessed and the expanded uncertainty derived for quantitative methods.
3. Quality Control
Acceptance criteria for quality control parameters should be adopted prior to implementation of the method.
4. References
A) The Fitness for Purpose of Analytical Methods, A Laboratory Guide to Method Validation andRelated Topics, EURACHEM Guide, 1998.
B) Federal Register, Part VIII, Department of Health and Human Services, March 1995, pp 11259-62.
C) “Validating Analytical Chemistry Methods”, Enigma Analytical Training Course (Version 2000-1),Breckenridge, CO, 2000, pp 8-4, 8-5.
* * * * * * * * * * * * * * * * * * * * * * * * *
232 Microgram Journal, Volume 1, Numbers 3-4 (July - December 2003)
Brought to you by AltGov2 [www.altgov2.org]
SWGDRUG GLOSSARY
These definitions were developed and adopted by the SWGDRUG Core Committee from a variety of sources including The United Nations Glossary of Terms for Quality Assurance and Good Laboratory Practices.
Accreditation Procedure by which an accreditation body formally recognizes that a laboratory or person is competent to carry out specific tasks.
Accreditation Body Independent science-based organization that has the authority to grant accreditation.
Accuracy Trueness and precision compose accuracy.
Analysis Technical operation to determine one or more characteristics of, or to evaluate the performance of, a given product, material, equipment, physical phenomenon, process, or service according to a specified procedure.
Analyst A designated person who:
Examines and analyzes seized drugs or related materials, or directs such examinations to be done. Independently has access to "open" (unsealed) evidence in order to remove samples from the evidence for examination. As a consequence of such examinations, signs reports for court or other purposes.
Audit A review conducted to compare the various aspects of the laboratory’s performance with a standard for that performance.
Blank Specimen or sample not containing the analyte.
Calibration Set of operations that establishes, under specified conditions, the relationship between values indicated by a measuring instrument or measuring system, or values represented by a material measure, and the corresponding known values of a measurand.
Certified Reference Material (CRM) A reference material, one or more of whose property values have been certified by a technical procedure, accompanied by or traceable to a certificate or other documentation that has been issued by a certifying body.
Certifying Body Independent science-based organization that has the competence to grant certification.
Chain of Custody Procedures and documents that account for the integrity of a sample by tracking its handling and storage from its point of collection to its final disposition.
Controls Samples used to determine the validity of the calibration, that is, the linearity and stability of a quantitative test or determination over time. Controls are either prepared from the reference material (separately from the calibrators, that is, weighed or measured separately), purchased, or obtained from a pool of previously analyzed samples. Where possible, controls should be matrix-matched to samples and calibrators.
Control Sample A standard of comparison for verifying or checking the finding of an experiment.
Correlated Techniques Correlated techniques are those that have the same fundamental mechanism of characterization. For example, this would prevent the choice of two gas chromatographic tests both based on a partition mechanism (e.g., methylsiloxane
Microgram Journal, Volume 1, Numbers 3-4 (July - December 2003) 233
Brought to you by AltGov2 [www.altgov2.org]
and phenylmethylsiloxane) or two thin layer chromatographic systems both based on an adsorption mechanism.
Deficiency of Analysis Any erroneous analytical result or interpretation, or any unapproved deviation from an established policy or procedure in an analysis.
False Positive Test result that states that a drug is present when, in fact, such a drug is not present in an amount less than a threshold or designated cut-off concentration.
Health & Safety Manager A designated person who is responsible for maintaining the laboratory health and safety program (including an annual review of the program) and who monitors compliance with the program.
Independent Test Result Result obtained in a manner not influenced by any previous results on the same or similar material.
Laboratory Facilities where analyses are performed by qualified personnel using adequate equipment.
Limit of Detection: Limit of detection (LOD) is the smallest measured content from which it is possible to deduce the presence of the analyte with reasonable statistical certainty.
Limit of Quantitation: The limit of quantitation (LoQ) is the lowest concentration of analyte that can be determined with an acceptable level of precision and trueness.
Linearity: Defines the ability of the method to obtain test results proportional to the concentration of analyte.
Method Detailed, defined procedure for performing an analysis. See Procedure.
Procedure Specified, documented way to perform an activity.
Proficiency Testing Ongoing process in which a series of proficiency samples, the characteristics of which are not known to the participants, are sent to laboratories on a regular basis. Each laboratory is tested for its accuracy in identifying the presence (or concentration) of the drug using its usual procedures.
Qualitative Analysis Test that determines the presence or absence of specific drugs in the sample.
Qualitative Test See Qualitative Analysis
Quality Assurance (QA) System of activities whose purpose is to provide, to the producer or user of a product or a service, the assurance that it meets defined standards of quality with a stated level of confidence.
Quality Assurance Manager A designated person who is responsible for maintaining the quality management system and who monitors compliance with the program.
Quality Management That aspect of the overall management function that determines and implements the quality policy.
Quality Manual Document stating the general quality policies, procedures and practices of an organization.
Microgram Journal, Volume 1, Numbers 3-4 (July - December 2003) 234
Brought to you by AltGov2 [www.altgov2.org]
Quantitative Analysis Procedure to determine the quantity of drug present in a sample.
Quantitative Test See Quantitive Analysis
Range Set of concentrations of analyte in which the error of a method is intended to lie within specified limits.
Reference Material Material or substance one or more properties of which are sufficiently well established to be used for calibrating an apparatus, assessing a measurement method, or assigning values to materials.
Repeatability Closeness of the agreement between the results of successive measurements of the same measurand carried out under the same conditions of measurement.
Report Document containing a formal statement of results of tests carried out by a laboratory.
Representative Sample Statistically, a sample that is similar to the population from which it was drawn. When a sample is representative, it can be used to make inferences about the population. The most effective way to get a representative sample is to use random methods to draw it. Analytically, it is a sample that is a portion of the original material selected in such a way that is possible to relate the analytical results obtained from it to the properties of the original material.
Reproducibility Closeness of agreement between the results of successive measurements of the same analyte in identical material made by the same method under different conditions, e.g., different operators and different laboratories and considerably separated in time.
Robustness The robustness of an analytical procedure is a measure of its capacity to remain unaffected by small, but deliberate variations in method parameters and provides an indication of its reliability during normal usage.
Sample A portion of the whole material to be tested. Statistically, it is a set of data obtained from a population.
Sampling Analytically, the whole set of operations needed to obtain a sample, including planning, collecting, recording, labeling, sealing, shipping, etc. Statistically, it is the process of determining properties of the whole population by collecting and analyzing data from a representative segment of it.
Selectivity Extent to which a method can determine particular analyte(s) in a mixture without interference from the other components in the mixture. A method that is perfectly selective for an analyte or group of analytes is said to be specific.
Specificity See Selectivity.
Standard Operating Procedures (SOPs) A written document which details the method of an operation, analysis, or action whose techniques and procedures are thoroughly prescribed and which is accepted as the method for performing certain routine or repetitive tasks.
Supervisory Chemist A designated person who has the overall responsibility and authority for the technical operations of the drug analysis section.
Microgram Journal, Volume 1, Numbers 3-4 (July - December 2003) 235
Brought to you by AltGov2 [www.altgov2.org]
Technical/Assistant Analyst A person who analyses evidence, but does not issue reports for court purposes.
Technical Support Personnel A person who performs basic laboratory duties, but does not analyze evidence.
Test See Analysis
Traceable Ability to trace the history, application, or location of an entity by means of recordedidentification. See also Chain of Custody.
Traceability The property of a result of a measurement whereby it can be related to appropriate standards, generally international or national standards, through an unbroken chain of comparisons.
Trueness: The closeness of agreement between the average value obtained from a large set of test results and an accepted reference value.
Uncertainty: Parameter associated with the result of a measurement, that characterizes the dispersion of the values that could reasonably be attributed to the measurand.
Validation Confirmation by examination and provision of objective evidence that the particular requirements for a specific intended use are fulfilled.
Verification Confirmation by examination and provision of objective evidence that specified requirements have been fulfilled. (Method works in your lab as well as where it was validated.)
* * * * * * * * * * * * * * * * * * * * * * * * *
Microgram Journal, Volume 1, Numbers 3-4 (July - December 2003) 236
Brought to you by AltGov2 [www.altgov2.org]
U.S. Department of JusticeDrug Enforcement Administration
www.dea.gov
Microgram Journal
To Assist and Serve Scientists Concerned with the Detection and Analysis of Controlled Substances and Other Abused Substances for Forensic / Law Enforcement Purposes.
Published by: The Drug Enforcement Administration Office of Forensic Sciences Washington, DC 20537
The U.S. Attorney General has determined that the publication of this periodical is necessary in the transaction of the public business required by the Department of Justice. Information, instructions, and disclaimers are published in the first issue of each year.
Volume 2 Numbers 1-4 Posted On-Line At:January - December 2004 www.dea.gov/programs/forensicsci/microgram/index.html
Brought to you by AltGov2 [www.altgov2.org]
Contents
Letter to the Editor regarding “A Rapid Extraction and GC/MS Methodology for the 3Identification of Psilocyn in Mushroom/Chocolate Concoctions”.
Anise Oil as a Precursor for 2-Alkoxy-5-methoxybenzaldehydes 4Dieter Waumans, Noël Bruneel, and Jan Tytgat
Diltiazem HCl: An Analytical Profile 11DeMia E. Peters
Hydroxyzine: An Analytical Profile 17Norman G. Odeneal II, John F. Casale, and Heidi L. Wojno
Mass Spectra of Select Benzyl- and Phenyl- Piperazine Designer Drugs 22Hans H. Maurer
The Quantitation of Nimetazepam in Erimin-5 Tablets and Powders 27by Reverse-Phase HPLCYong Kiong Chong, Muzaiyanah Mohd Kaprawi, and Kee Bian Chan
Improvised Explosive Device Disguised as a Smoking Pipe 34Richard T. Ramsey and Pam Woods
Identification and Determination of Carisoprodol in Tablets by Liquid 36Chromatography/Mass SpectrometryAngela S. Mohrhaus and Samuel R. Gratz
Instructions for Authors 42
Note: In order to prevent automated theft of email addresses off the Internet postings of Microgram Journal, all email addresses reported in the Journal have had the “@” character replaced by “ -at- ” (unless requested otherwise by the corresponding author); this will need to be converted back (by hand) before the address can be used.
Cover Art: “Ball and Stick” Model of Methamphetamine (Courtesy of Patrick A. Hays, DEA Special Testing and Research Laboratory, Dulles, VA)
Microgram Journal, Volume 2, Numbers 1-4 (January - December 2004) 2
Brought to you by AltGov2 [www.altgov2.org]
* Letter to the Editor regarding: Mohammad Sarwar and John L. McDonald. A Rapid Extraction and GC/MS Methodology for the Identification of Psilocyn in Mushroom/Chocolate Concoctions. Microgram Journal 2003(3-4):177.
Sir:
While perusing the second issue of the Journal I noted an error in terminology in the article entitled: "A Rapid Extraction and GC/MS Methodology for the Identification of Psilocyn in Mushroom/Chocolate Concoctions" by Mohammad Sarwar and McDonald. The authors twice refer to the taxonomic categories of strophariaceae, bolbitiaceae, coprinaceae, and cortinariaceae as the four "species" of fungi which contain psilocyn and psilocybin. These categories are not species; they are families, as indicated by the suffix -"aceae". Each of these four families contains several genera, and each genus contains multiple species. The family cortinariaceae, for example, contains at least eight genera and well over a thousand different species. This is a small criticism in an otherwise excellent paper, and I congratulate the authors for their work.
Robert Parsons Indian River Crime Laboratory, Fort Pierce, Florida
* * * * * * * * * * * * * * * * * * * * * * * * *
Microgram Journal, Volume 2, Numbers 1-4 (January - December 2004) 3
Brought to you by AltGov2 [www.altgov2.org]
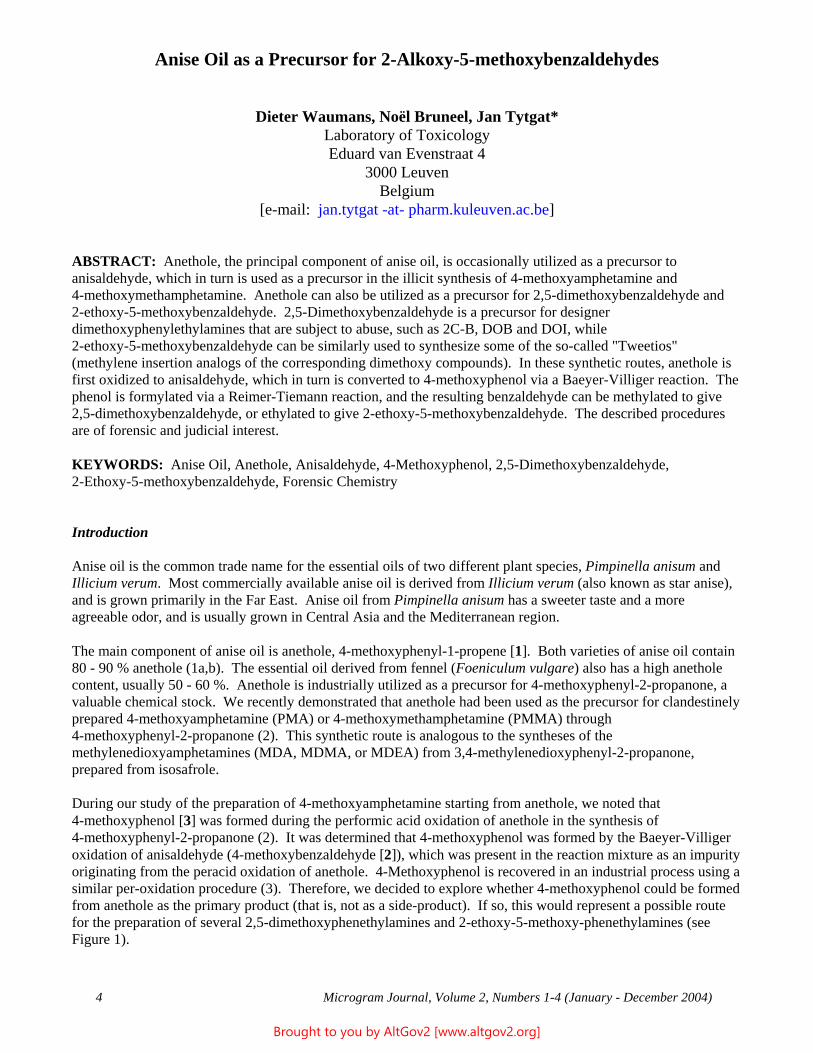
Anise Oil as a Precursor for 2-Alkoxy-5-methoxybenzaldehydes
Dieter Waumans, Noël Bruneel, Jan Tytgat* Laboratory of Toxicology Eduard van Evenstraat 4
3000 Leuven Belgium
[e-mail: jan.tytgat -at- pharm.kuleuven.ac.be]
ABSTRACT: Anethole, the principal component of anise oil, is occasionally utilized as a precursor to anisaldehyde, which in turn is used as a precursor in the illicit synthesis of 4-methoxyamphetamine and 4-methoxymethamphetamine. Anethole can also be utilized as a precursor for 2,5-dimethoxybenzaldehyde and 2-ethoxy-5-methoxybenzaldehyde. 2,5-Dimethoxybenzaldehyde is a precursor for designer dimethoxyphenylethylamines that are subject to abuse, such as 2C-B, DOB and DOI, while 2-ethoxy-5-methoxybenzaldehyde can be similarly used to synthesize some of the so-called "Tweetios" (methylene insertion analogs of the corresponding dimethoxy compounds). In these synthetic routes, anethole is first oxidized to anisaldehyde, which in turn is converted to 4-methoxyphenol via a Baeyer-Villiger reaction. The phenol is formylated via a Reimer-Tiemann reaction, and the resulting benzaldehyde can be methylated to give 2,5-dimethoxybenzaldehyde, or ethylated to give 2-ethoxy-5-methoxybenzaldehyde. The described procedures are of forensic and judicial interest.
KEYWORDS: Anise Oil, Anethole, Anisaldehyde, 4-Methoxyphenol, 2,5-Dimethoxybenzaldehyde, 2-Ethoxy-5-methoxybenzaldehyde, Forensic Chemistry
Introduction
Anise oil is the common trade name for the essential oils of two different plant species, Pimpinella anisum and Illicium verum. Most commercially available anise oil is derived from Illicium verum (also known as star anise), and is grown primarily in the Far East. Anise oil from Pimpinella anisum has a sweeter taste and a more agreeable odor, and is usually grown in Central Asia and the Mediterranean region.
The main component of anise oil is anethole, 4-methoxyphenyl-1-propene [1]. Both varieties of anise oil contain 80 - 90 % anethole (1a,b). The essential oil derived from fennel (Foeniculum vulgare) also has a high anethole content, usually 50 - 60 %. Anethole is industrially utilized as a precursor for 4-methoxyphenyl-2-propanone, a valuable chemical stock. We recently demonstrated that anethole had been used as the precursor for clandestinely prepared 4-methoxyamphetamine (PMA) or 4-methoxymethamphetamine (PMMA) through 4-methoxyphenyl-2-propanone (2). This synthetic route is analogous to the syntheses of the methylenedioxyamphetamines (MDA, MDMA, or MDEA) from 3,4-methylenedioxyphenyl-2-propanone, prepared from isosafrole.
During our study of the preparation of 4-methoxyamphetamine starting from anethole, we noted that 4-methoxyphenol [3] was formed during the performic acid oxidation of anethole in the synthesis of 4-methoxyphenyl-2-propanone (2). It was determined that 4-methoxyphenol was formed by the Baeyer-Villiger oxidation of anisaldehyde (4-methoxybenzaldehyde [2]), which was present in the reaction mixture as an impurity originating from the peracid oxidation of anethole. 4-Methoxyphenol is recovered in an industrial process using a similar per-oxidation procedure (3). Therefore, we decided to explore whether 4-methoxyphenol could be formed from anethole as the primary product (that is, not as a side-product). If so, this would represent a possible route for the preparation of several 2,5-dimethoxyphenethylamines and 2-ethoxy-5-methoxy-phenethylamines (see Figure 1).
Microgram Journal, Volume 2, Numbers 1-4 (January - December 2004) 4
Brought to you by AltGov2 [www.altgov2.org]
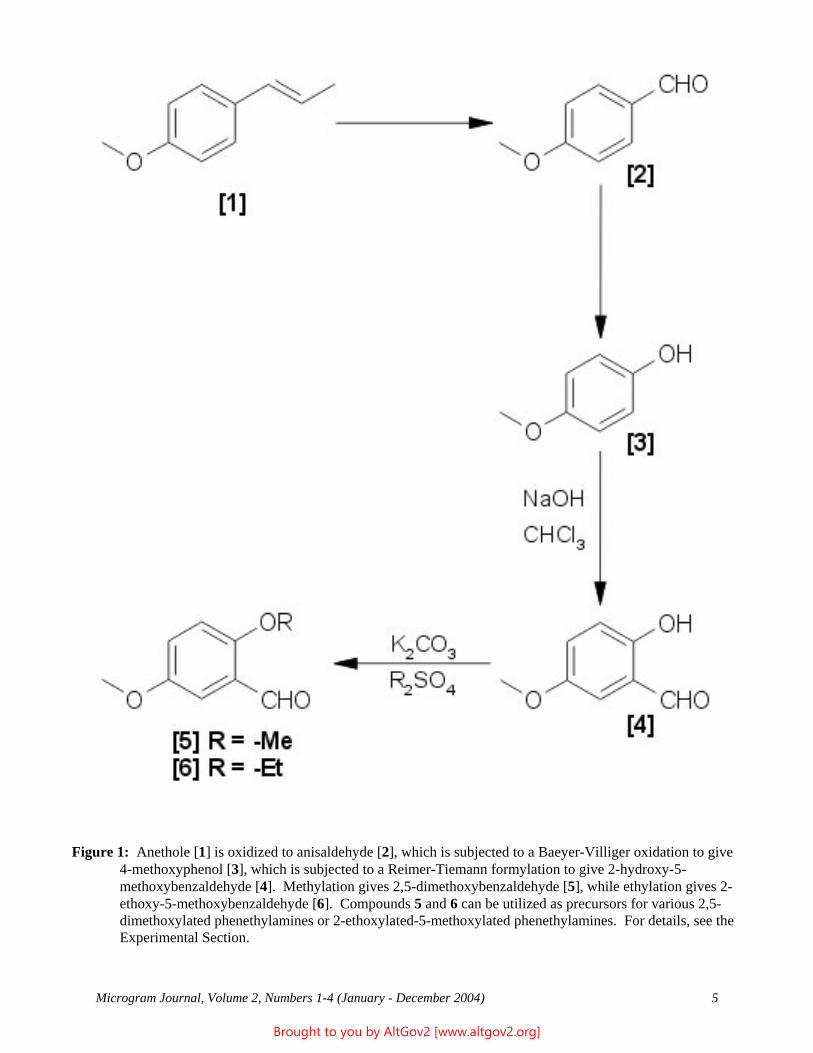
Figure 1: Anethole [1] is oxidized to anisaldehyde [2], which is subjected to a Baeyer-Villiger oxidation to give 4-methoxyphenol [3], which is subjected to a Reimer-Tiemann formylation to give 2-hydroxy-5-methoxybenzaldehyde [4]. Methylation gives 2,5-dimethoxybenzaldehyde [5], while ethylation gives 2-ethoxy-5-methoxybenzaldehyde [6]. Compounds 5 and 6 can be utilized as precursors for various 2,5-dimethoxylated phenethylamines or 2-ethoxylated-5-methoxylated phenethylamines. For details, see the Experimental Section.
Microgram Journal, Volume 2, Numbers 1-4 (January - December 2004) 5
Brought to you by AltGov2 [www.altgov2.org]
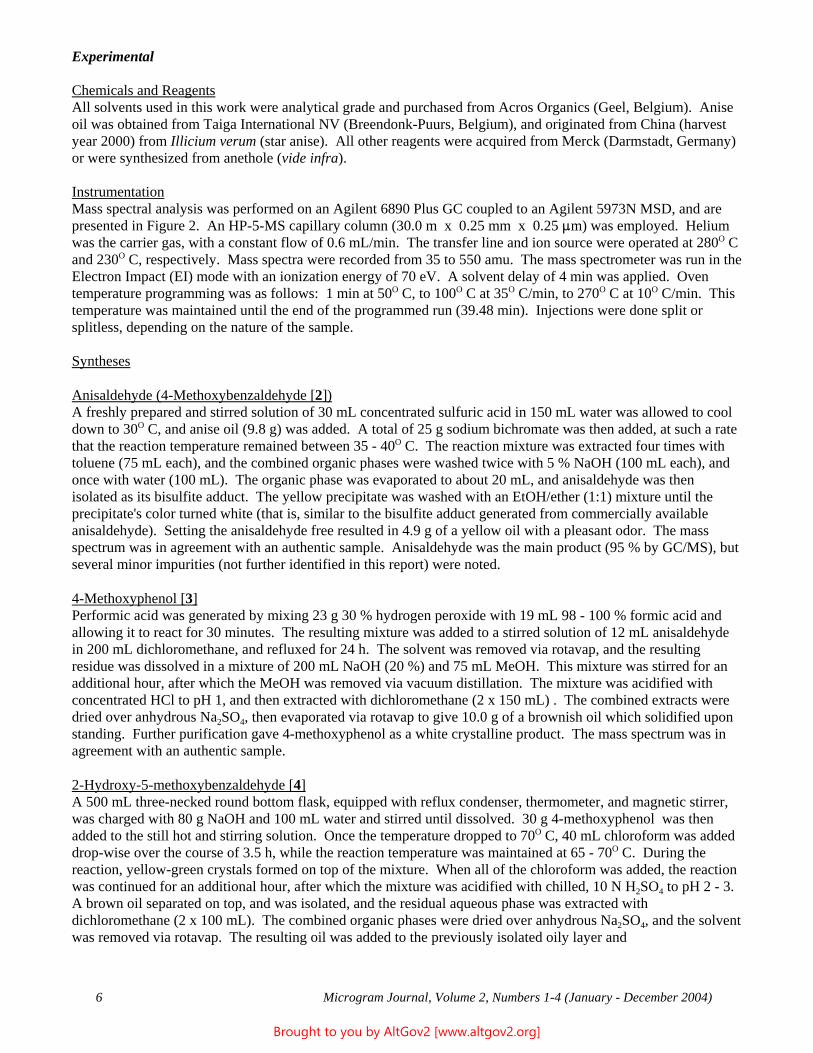
Experimental
Chemicals and Reagents All solvents used in this work were analytical grade and purchased from Acros Organics (Geel, Belgium). Anise oil was obtained from Taiga International NV (Breendonk-Puurs, Belgium), and originated from China (harvest year 2000) from Illicium verum (star anise). All other reagents were acquired from Merck (Darmstadt, Germany) or were synthesized from anethole (vide infra).
Instrumentation Mass spectral analysis was performed on an Agilent 6890 Plus GC coupled to an Agilent 5973N MSD, and are presented in Figure 2. An HP-5-MS capillary column (30.0 m x 0.25 mm x 0.25 :m) was employed. Helium was the carrier gas, with a constant flow of 0.6 mL/min. The transfer line and ion source were operated at 280O C and 230O C, respectively. Mass spectra were recorded from 35 to 550 amu. The mass spectrometer was run in the Electron Impact (EI) mode with an ionization energy of 70 eV. A solvent delay of 4 min was applied. Oven temperature programming was as follows: 1 min at 50O C, to 100O C at 35O C/min, to 270O C at 10O C/min. This temperature was maintained until the end of the programmed run (39.48 min). Injections were done split or splitless, depending on the nature of the sample.
Syntheses
Anisaldehyde (4-Methoxybenzaldehyde [2]) A freshly prepared and stirred solution of 30 mL concentrated sulfuric acid in 150 mL water was allowed to cool down to 30O C, and anise oil (9.8 g) was added. A total of 25 g sodium bichromate was then added, at such a rate that the reaction temperature remained between 35 - 40O C. The reaction mixture was extracted four times with toluene (75 mL each), and the combined organic phases were washed twice with 5 % NaOH (100 mL each), and once with water (100 mL). The organic phase was evaporated to about 20 mL, and anisaldehyde was then isolated as its bisulfite adduct. The yellow precipitate was washed with an EtOH/ether (1:1) mixture until the precipitate's color turned white (that is, similar to the bisulfite adduct generated from commercially available anisaldehyde). Setting the anisaldehyde free resulted in 4.9 g of a yellow oil with a pleasant odor. The mass spectrum was in agreement with an authentic sample. Anisaldehyde was the main product (95 % by GC/MS), but several minor impurities (not further identified in this report) were noted.
4-Methoxyphenol [3] Performic acid was generated by mixing 23 g 30 % hydrogen peroxide with 19 mL 98 - 100 % formic acid and allowing it to react for 30 minutes. The resulting mixture was added to a stirred solution of 12 mL anisaldehyde in 200 mL dichloromethane, and refluxed for 24 h. The solvent was removed via rotavap, and the resulting residue was dissolved in a mixture of 200 mL NaOH (20 %) and 75 mL MeOH. This mixture was stirred for an additional hour, after which the MeOH was removed via vacuum distillation. The mixture was acidified with concentrated HCl to pH 1, and then extracted with dichloromethane (2 x 150 mL) . The combined extracts were dried over anhydrous Na2SO4, then evaporated via rotavap to give 10.0 g of a brownish oil which solidified upon standing. Further purification gave 4-methoxyphenol as a white crystalline product. The mass spectrum was in agreement with an authentic sample.
2-Hydroxy-5-methoxybenzaldehyde [4] A 500 mL three-necked round bottom flask, equipped with reflux condenser, thermometer, and magnetic stirrer, was charged with 80 g NaOH and 100 mL water and stirred until dissolved. 30 g 4-methoxyphenol was then added to the still hot and stirring solution. Once the temperature dropped to 70O C, 40 mL chloroform was added drop-wise over the course of 3.5 h, while the reaction temperature was maintained at 65 - 70O C. During the reaction, yellow-green crystals formed on top of the mixture. When all of the chloroform was added, the reaction was continued for an additional hour, after which the mixture was acidified with chilled, 10 N H2SO4 to pH 2 - 3. A brown oil separated on top, and was isolated, and the residual aqueous phase was extracted with dichloromethane (2 x 100 mL). The combined organic phases were dried over anhydrous Na2SO4, and the solvent was removed via rotavap. The resulting oil was added to the previously isolated oily layer and
Microgram Journal, Volume 2, Numbers 1-4 (January - December 2004) 6
Brought to you by AltGov2 [www.altgov2.org]
steam-distilled. The distillate (2.5 L) was extracted with dichloromethane, and the organic layer isolated and washed with chilled water. The organic layer was dried over anhydrous Na2SO4, and the solvent was removed via rotavap. The residual yellow oil (2-hydroxy-5-methoxybenzaldehyde) weighed 23.8 g and was used in subsequent reactions without further purification.
2,5-Dimethoxybenzaldehyde [5] A 250 mL round-bottomed flask was equipped with a reflux condenser, thermometer, and magnetic stirrer, and was charged with 14 g anhydrous potassium carbonate, 10 g 2-hydroxy-5-methoxybenzaldehyde, and 100 mL acetone, and the mixture was brought to reflux. Once the mixture was boiling, 11 g of dimethyl sulfate was added, and the reaction was refluxed. After 3.5 h, the mixture was cooled, filtered, and the solvent was removed. The residue was taken up in 100 mL of cold water, and the precipitated crystals were collected and recrystallized from water/EtOH (1:1), giving (after drying in vacuo) 8.3 g 2,5-dimethoxybenzaldehyde as faintly yellow tinted needle-shaped crystals (GC purity: 98 %+). The mass spectrum was in agreement with an authentic sample. 1HNMR * 3.799 (s, 5-OMe), 3.893 (s, 2-OMe), 6.942 (d, J = 9.1 Hz, 1H), 7.135 (dd, J = 3.3 & 9.1 Hz, 1H), 7.326 (d, J = 3.3 Hz, 1H), 10.44 (s, 1H). 13C-NMR * 55.69, 56.06, 110.45, 113.33, 123.41, 124.98, 153.63, 156.76, 189.60 (CHO).
2-Ethoxy-5-methoxybenzaldehyde [6]A setup similar to the one described for 2,5-dimethoxybenzaldehyde was charged with 7 g anhydrous potassiumcarbonate, 7 g 2-hydroxy-5-methoxybenzaldehyde, and 100 mL acetone, and the mixture was brought to reflux. Once the mixture was boiling, 5 mL diethyl sulfate was added, and the reaction was refluxed. After 3 h, themixture was cooled, filtered, and the solvent was removed. The residue was taken up into 75 mL of cold water,and the precipitated crystals were collected and recrystallized from water/EtOH (1:1), yielding spectacularly long,needle-shaped crystals. Recrystallization from EtOH gave 5.9 g 2-ethoxy-5-methoxybenzaldehyde as faintlyyellow tinted, polymorphic crystals (GC purity: 98 %+). 1H-NMR * 1.447 (t, J = 7.1 Hz, 3H), 3.794 (s, 3H),4.106 (q, J = 7.0 Hz, 2H), 6.925 (d, J = 9.1 Hz, 1H), 7.111 (dd, J = 3.3 & 9.1Hz, 1H), 7.317 (d, J = 3.3 Hz, 1H),10.473 (s, 1H). 13C-NMR * 14.57, 55.63, 64.74, 110.08, 114.48, 123.47, 125.14, 153.54, 155.21, 189.72 (CHO).
Results and Discussion
The synthesis of anisaldehyde from anethole can be accomplished in several ways, for instance by reaction with ozone (4), VO5 (5), or HNO3 (6,7). We opted for the well-known sodium bichromate mediated oxidation. The applied procedure is a minor adaptation of a method used in the fragrance industry (6). The aldehyde was purified via its bisulfite adduct instead of distillation. Isolation as the bisulfite adduct is - in this case - a facile and low-priced alternative for purification via distillation. In fact, in the early 20th century, the bisulfite adduct of anisaldehyde was commonly traded as aubépine cristallisée for use in the perfume industry (aubépine translates from French as “hawthorn” (8)).
The synthesis of 4-methoxyphenol from anisaldehyde can be performed via the Baeyer-Villiger oxidation reaction with hydrogen peroxide or a peracid (9). We utilized performic acid in this study, but other peracids such as peracetic acid (10) or meta-chloroperbenzoic acid (11) work equally well. Other possibilities include sodium perborate in glacial acetic acid (12-14) or hydrogen peroxide with boric acid (15). Yields usually range between 70 % and quantitative, depending on which method was used.
The Reimer-Tiemann formylation reaction (16) is not widely utilized. Generally, low yields, several side-reactions, and easy formation of intractable tars are problematic. However, submission of 4-methoxyphenol to a Reimer-Tiemann formylation gives acceptable yields and reasonable workups. The scientific literature contains many references concerning adaptations for the Reimer-Tiemann formylation of 4-methoxyphenol, with yields usually varying between 40 - 70 %. In our study, we opted for a previously reported procedure by Wynberg and Meijer (17). Generally, this method has several advantages over the Vilsmeier-Haack formylation
Microgram Journal, Volume 2, Numbers 1-4 (January - December 2004) 7
Brought to you by AltGov2 [www.altgov2.org]
(another widely used formylation technique, but which gives poor yields in this case). Even an improved version of the Vilsmeier-Haack reaction still gave only 40 % 2,5-dimethoxybenzaldehyde after 48 h of refluxing (18).
The methylation of phenols to methoxybenzenes using dimethylsulfate is well-known. The use of dimethylsulfate requires care due to its toxicity, but it may be substituted for by less toxic and easier accessible chemicals, such as dimethyl carbonate (19).
The synthesized benzaldehydes can be used for the preparation of several “designer” phenylethylamines; 2,5-dimethoxybenzaldehyde can be applied in the synthesis of, e.g.: 2C-B (20a), 2C-I (20b), DOB (20c), DOC (20d), DOI (20e), and 2,5-DMA (20f). Other phenylethylamines can be synthesized using 1,4-dimethoxybenzene, e.g.: 2C-P (20g). 2-Ethoxy-5-methoxybenzaldehyde is a precursor for the so-called "Tweetios" (20h). Tweetios are methylene insertion analogues of the 2,5-dimethoxyphenylethylamines, where one or both methoxy groups are replaced by ethoxy groups. These compounds generally display less potency and shorter duration time than the 2,5-dimethoxy analogues, and so do not have high potential for clandestine synthesis. In this case, only the 2-ethoxy-5-methoxyphenylethylamines can be obtained.
Anethole is currently used in large quantities in the alcoholic beverage industry (e.g., for Ouzo or Ricard), and in oral hygiene products (21). It is also a valuable component in aromatherapy products. Due to this economic significance, it is unlikely that anise oil or anethole will become monitored or scheduled substances, despite their use in the illicit production of PMA and PMMA, their link with several PMA- and PMMA-related fatalities over the past few years (2,22), and/or their potential use towards synthesis of various designer phenethylamines. We are currently unaware of any examples of anise oil or anethole being used to produce designer phenethylamines, but still feel it is necessary to point this possibility, since it might become a preferred precursor in the future as chemical substance controls are gradually increased. It is also important to understand that the presence of anise oil or anethole in a clandestine laboratory does not automatically imply that the operator intended to synthesize PMA and/or PMMA; it is also possible that synthesis of a designer phenethylamine was intended. This can only be ascertained by a total review of all chemicals and notes present at the laboratory, and/or by operator interviews.
Acknowledgements
We are grateful to Prof. Dr. Roger Busson (REGA Institute, K. U. Leuven) for recording of the NMR spectra reported in this study.
References
1. Guenther E. The essential oils. D. Van Nostrand Company, New York, 1950: [a] Vol IV pp. 563-570 and 634-645; [b] Vol V pp. 361-379; [c] Vol IV pp. 459-463 and 506-508.
2. Waumans D, Bruneel N, Tytgat J. Anise oil as para-methoxyamphetamine (PMA) precursor. Forensic Sci Int 2003;133;159-170.
3. Schmauder H-P, Groger D, Lohmann D, Gruner H, Foken H, Zschunke A. Ueber nebenprodukte einer technischen anetholoxidation. Pharmazie 1979;34:22-25.
4. Otto M, Verley A. Verfahren zur ueberfuhrung der C3H5-gruppe (CH=CH-CH3 oder CH2-CH=CH2) aromatischer kohlenstoffverbindungen in die aldehydgruppe middels ozons. German Patent DE97620 (1895).
5. Milas NA. Hydroxylation of unsaturated carboxylic acid compounds and the like. United States Patent US2402566 (1942).
Microgram Journal, Volume 2, Numbers 1-4 (January - December 2004) 8
Brought to you by AltGov2 [www.altgov2.org]
6. Sornet R. La technique industrielle des parfums synthetiques. Gauthier-Villars et Cie, Paris, 1923, p. 47.
7. Landolph F. Sur quelques derives nouveaux de l'anethol. Comptes Rendus Acad Sci 1875;81:97-99.
8. Jeancard P. Les parfums: Chimie et industrie. Librairie J-B Bailliere et Fils, Paris, 1927, p. 202.
9. Hassel CH. The Baeyer-Villiger oxidation of aldehydes and ketones. Organic Reactions, Vol 9. John Wiley & Sons, Inc., New York, 1957, pp. 73-106.
10. Okuna Y. Theoretical investigation of the mechanism of the Baeyer-Villiger reaction in nonpolar solvents. Chem Eur J 1997;3(2):212-218.
11. Godfrey IM, Sargent MV. Preparation of methoxyphenols by Baeyer-Villiger oxidation of methoxybenzaldehydes. J Chem Soc Perkin Trans 1 1974:1353-1354.
12. McKillop A, Kemp D. Further functional group oxidations using sodium perborate. Tetrahedron 1989;45(11):3299-3306.
13. McKillop A, Anderson WR. Sodium perborate and sodium percarbonate: Cheap, safe and versatile oxidising agents for organic synthesis. Tetrahedron 1995;51(22):6145-6166.
14. Muzart J. Sodium perborate and sodium percarbonate in organic synthesis. Synthesis 1995:1325-1347.
15. Roy A, Reddy KR, Mohanta PK, Ila H, Junjappa H. Hydrogen peroxide/boric acid: An efficient system for oxidation of aromatic aldehydes and ketones to phenols. Synthetic Commun 1999;29(21):3781-3791.
16. Reimer K, Tiemann F. Ueber die einwirkung von chloroform auf alkalische phenolate. Ber Deutsch Chem Ges 1876;9:824-828.
17. Wynberg H, Meijer EW. The Reimer-Tiemann Reaction (in) WG Dauben (Ed.). Organic Reactions, Vol 28. John Wiley & Sons, Inc., New York, 1982, pp. 1-36.
18. Downie IM, Earle MJ, Heaney H, Shuhaibar KF. Vilsmeier formylation and glyoxylation reactions of nucleophilic aromatic compounds using pyrophosphoryl chloride. Tetrahedron 1993;49(19):4015-4034.
19. Ouk S , Thiebaud S, Borredon E, Le Gars P. Dimethyl carbonate and phenols to alkyl aryl ethers via clean synthesis. Green Chemistry 2002:431-435.
20. Shulgin A, Shulgin A. PIHKAL: A chemical love story. Transform Press, Berkeley, 2000 (1st Edition, 5th Printing): [a] pp. 503-506; [b] pp. 539-542; [c] pp. 620-622; [d] pp. 626-628; [e] pp. 633-637; [f] pp. 601-604; [g] pp. 545-548; [h] pp. 514-515.
21. Bauer K, Garbe D, Surburg H. Common fragrance and flavor materials. Wiley-VCH, Weinheim, 2001 (4th Edition), p. 128.
22. Waumans D, Bruneel N, Tytgat J. 4-Methoxyamphetamine on the illicit Belgian drug market as a brown powder: Synthesis and correlation with findings in the deceased's body fluids. Annales Tox Anal 2002;14(3):194 [Abstracts of the TIAFT 2002 Conference, Paris].
[Note: Patents were retrieved via the Espacenet website http://gb.espacenet.com]
[Figure 2 Follows.]
Microgram Journal, Volume 2, Numbers 1-4 (January - December 2004) 9
Brought to you by AltGov2 [www.altgov2.org]
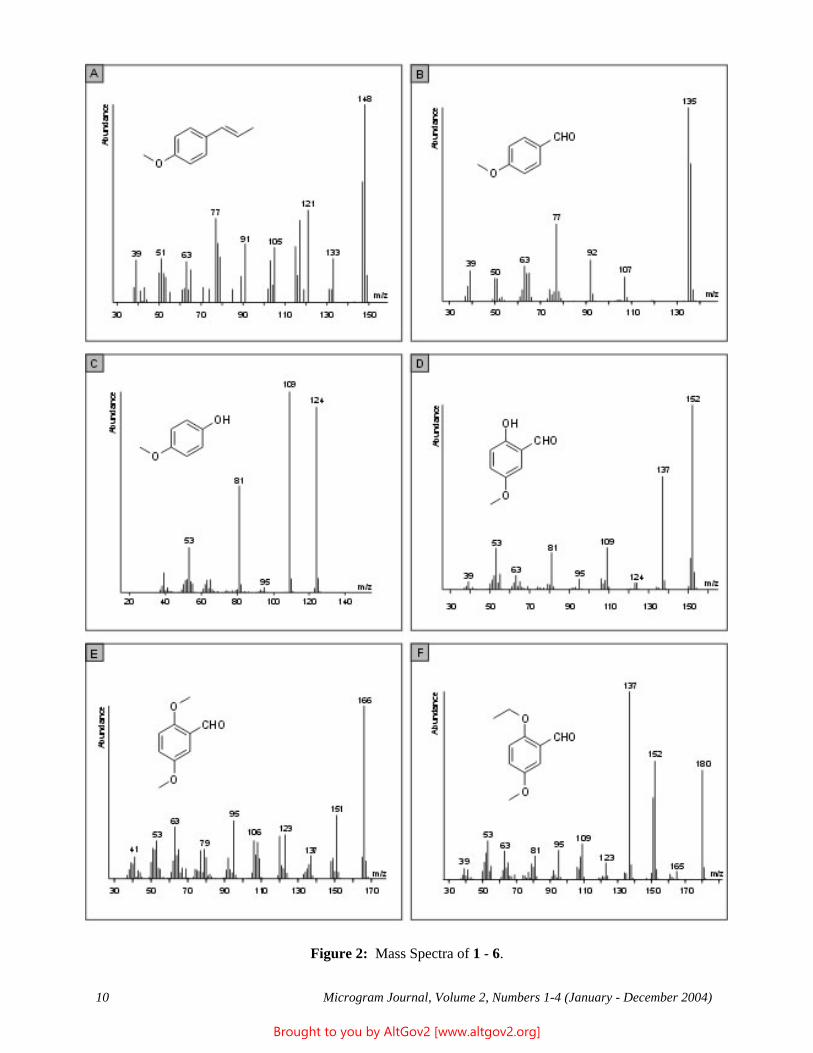
Figure 2: Mass Spectra of 1 - 6.
Microgram Journal, Volume 2, Numbers 1-4 (January - December 2004) 10
Brought to you by AltGov2 [www.altgov2.org]
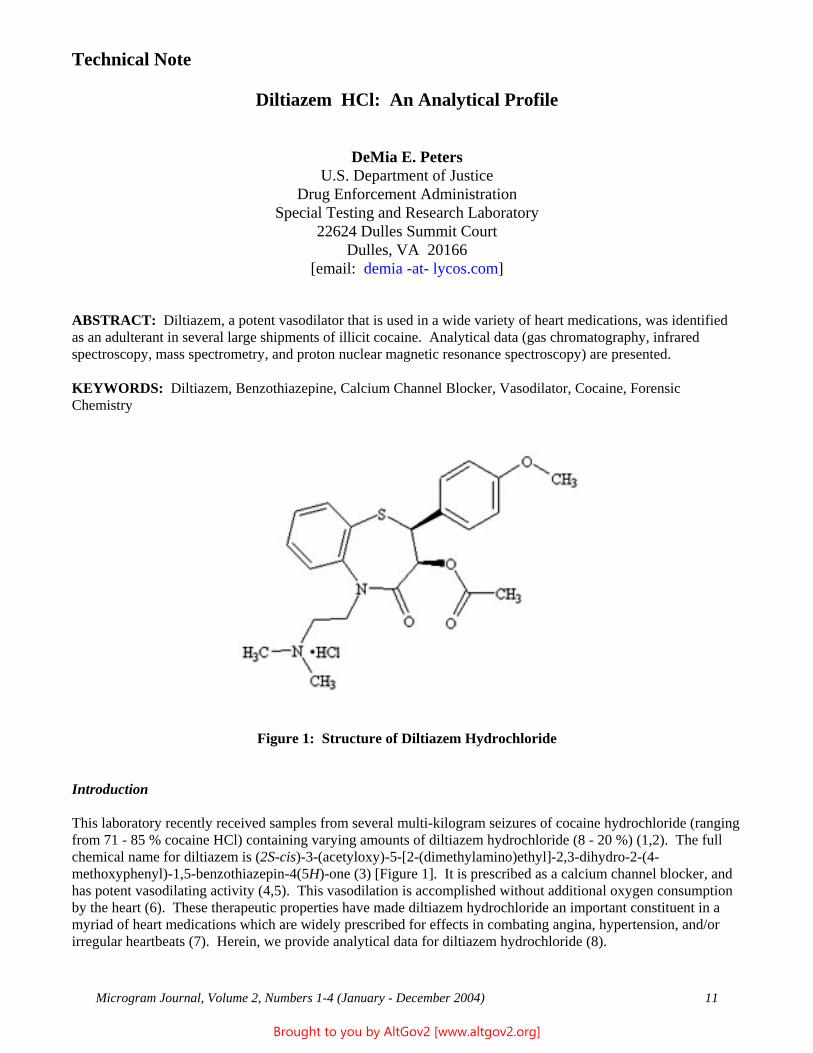
Technical Note
Diltiazem HCl: An Analytical Profile
DeMia E. Peters U.S. Department of Justice
Drug Enforcement Administration Special Testing and Research Laboratory
22624 Dulles Summit Court Dulles, VA 20166
[email: demia -at- lycos.com]
ABSTRACT: Diltiazem, a potent vasodilator that is used in a wide variety of heart medications, was identified as an adulterant in several large shipments of illicit cocaine. Analytical data (gas chromatography, infrared spectroscopy, mass spectrometry, and proton nuclear magnetic resonance spectroscopy) are presented.
KEYWORDS: Diltiazem, Benzothiazepine, Calcium Channel Blocker, Vasodilator, Cocaine, Forensic Chemistry
Figure 1: Structure of Diltiazem Hydrochloride
Introduction
This laboratory recently received samples from several multi-kilogram seizures of cocaine hydrochloride (ranging from 71 - 85 % cocaine HCl) containing varying amounts of diltiazem hydrochloride (8 - 20 %) (1,2). The full chemical name for diltiazem is (2S-cis)-3-(acetyloxy)-5-[2-(dimethylamino)ethyl]-2,3-dihydro-2-(4-methoxyphenyl)-1,5-benzothiazepin-4(5H)-one (3) [Figure 1]. It is prescribed as a calcium channel blocker, and has potent vasodilating activity (4,5). This vasodilation is accomplished without additional oxygen consumption by the heart (6). These therapeutic properties have made diltiazem hydrochloride an important constituent in a myriad of heart medications which are widely prescribed for effects in combating angina, hypertension, and/or irregular heartbeats (7). Herein, we provide analytical data for diltiazem hydrochloride (8).
Microgram Journal, Volume 2, Numbers 1-4 (January - December 2004) 11
Brought to you by AltGov2 [www.altgov2.org]
Experimental
Diltiazem: C22H26N2O4S 414.53 amu
Source of Diltiazem Sigma-Aldrich, Inc. (St. Louis, Missouri); Lot #123K0968, 99 %
Gas Chromatography Instrument Agilent 6890N with a flame ionization detector Column DB-1, 30 m x 0.25 mm x 0.25 :m film thickness Injector Temperature 280° C Oven Temperature 140° C for 1.5 min, 10° C/min to 280° C Carrier Gas Hydrogen at 1.1 mL/min, split ratio = 25:1
Utilizing the above experimental parameters, the retention time for diltiazem HCl is 17.64 minutes. The retention time relative to cocaine is 1.52. A screening run utilizing the above parameters will detect the presence of diltiazem and allow for correct quantitation parameters to be selected.
Infrared Spectroscopy Instrument Number of Scans Resolution Wavenumber Range
Thermo-Nicolet Nexus 670 32 4.000 4000 cm-1 to 400 cm-1
Data was obtained by the use of an attenuated total reflectance (ATR) attachment on FTIR. The data was not ATR corrected [Figure 2]. In addition, spectral data was obtained with a KBr dispersion technique on FTIR [Figure 3]. The principal peaks are at 1680 cm-1 and 1250 cm-1.
Mass Spectrometry Instrument Agilent 5973 Column DB-1, 30 m x 0.25 mm x 0.25 :m film thickness Injector Temperature 280° C Oven Temperature 90° C for 2 min, 14° C/min to 300° C Carrier Gas Helium with split ratio = 25:1 Scan Range 34 - 550 amu
Electron impact mass spectrometry data shows a molecular ion at 414 amu and a base ion of 58 amu [Figure 4A]. When the ion abundance of this spectrum is enhanced 10x, the ions are more easily viewed [Figure 4B].
Nuclear Magnetic Resonance Spectroscopy Analyses were performed on a Varian Mercury 400 MHz NMR. The sample was prepared at 22.4 mg/mL in deuterium oxide (D2O) containing TSP (3-(trimethylsilyl)propionic-2,2,3,3-d4 acid, sodium salt) as the reference at 0 ppm and maleic acid as the internal standard. The maleic acid forms a singlet at 6.4 ppm. The proton spectrum of the standard was obtained with 8 scans using a 45 second delay, 90o pulse, 5 second acquisition time, and oversampling of 4 [Figure 5].
Microgram Journal, Volume 2, Numbers 1-4 (January - December 2004) 12
Brought to you by AltGov2 [www.altgov2.org]
Results and Discussion
The referenced exhibits appear to be the first identified to contain diltiazem. Based on cocaine signature analysis, it appears that the diltiazem was added to the cocaine during one of the final processing stages; either: A) the base was added to cocaine base and the two were co-precipitated as hydrochloride salts; or B) the hydrochloride was added to cocaine hydrochloride and physically mixed prior to pressing into kilogram bricks.
The purpose for adulterating illicit cocaine with such an unusual (and relatively expensive) compound is unclear. A (brief) review of several websites dedicated to drug abuse does not suggest any synergistic/desirable or pseudo-therapeutic effects to co-administration of diltiazem with cocaine. Therefore, it is most likely that it was used merely as a “cut of convenience”.
Acknowledgements
The author wishes to thank Senior Research Chemist John F. Casale and Senior Forensic Chemist Pamela R. Smith (this laboratory) for their assistance. The author would also like to acknowledge Senior Research Chemist Patrick A. Hays (this laboratory) for his time and expertise in interpreting the NMR spectrum of diltiazem hydrochloride.
References
1. Anonymous. Diltiazem, hydroxyzine, and methylephedrine identified in separate shipments of cocaine. Microgram Bulletin 2004;37(8):137.
2. See also: Anonymous. Cocaine containing diltiazem on the west coast. Microgram Bulletin 2005;38(1):2.
3. Clarke’s Analysis of Drugs and Poisons (electronic version); London, The Pharmaceutical Press: 2004.
4. Gil-Agusti M, Carda-Broch S, Garcia-Alvarez-Coque MC, Esteve-Romero J. Use of micellar mobile phases for the chromatographic determination of clorazepate, diazepam and diltiazem in pharmaceuticals. Journal of Chromatographic Science 2000;38:521-527.
5. http://www.nlm.nih.gov/medlineplus/druginfo/medmaster/a684027.html
6. Nagao T, Sato M, Nakajima H, Kiyomoto A. Studies on a new 1,5-benzothiazepine derivative (CRD401). IV. Coronary vasodilating effect and structure–activity relationship. Chemical and Pharmaceutical Bulletin 1973;21(1):92-97.
7. Merck Index. 13th Edition; Whitehouse Station, Merck Research Laboratories: 1996, p. 563.
8. See also: Terry Mills III and J. Conrad Roberson, Instrumental Data for Drug Analysis, 2nd Ed., Vol. 1, pp.708 - 709; Elsevier, New York: 1987 (includes UV, MS, NMR, and FTIR data).
[Figures 2 through 5 follow on the next three pages.]
* * * * *
Microgram Journal, Volume 2, Numbers 1-4 (January - December 2004) 13
Brought to you by AltGov2 [www.altgov2.org]
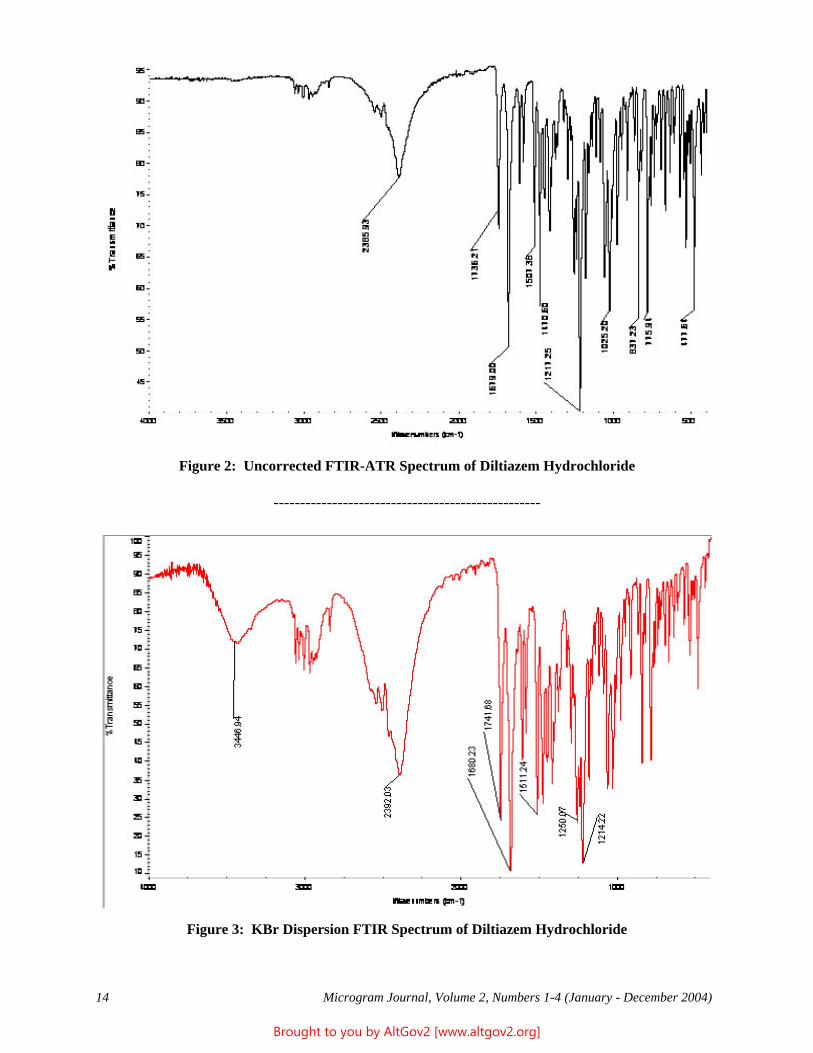
--------------------------------------------------
Figure 2: Uncorrected FTIR-ATR Spectrum of Diltiazem Hydrochloride
Figure 3: KBr Dispersion FTIR Spectrum of Diltiazem Hydrochloride
Microgram Journal, Volume 2, Numbers 1-4 (January - December 2004) 14
Brought to you by AltGov2 [www.altgov2.org]
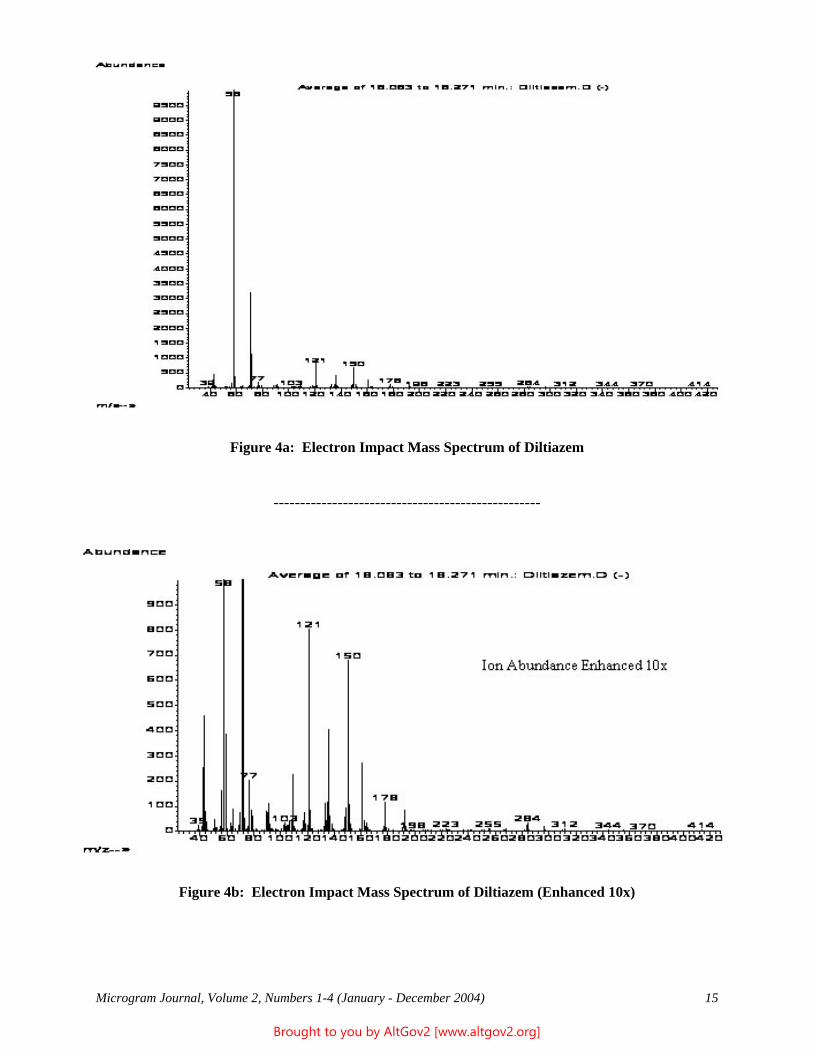
--------------------------------------------------
Figure 4a: Electron Impact Mass Spectrum of Diltiazem
Figure 4b: Electron Impact Mass Spectrum of Diltiazem (Enhanced 10x)
Microgram Journal, Volume 2, Numbers 1-4 (January - December 2004) 15
Brought to you by AltGov2 [www.altgov2.org]
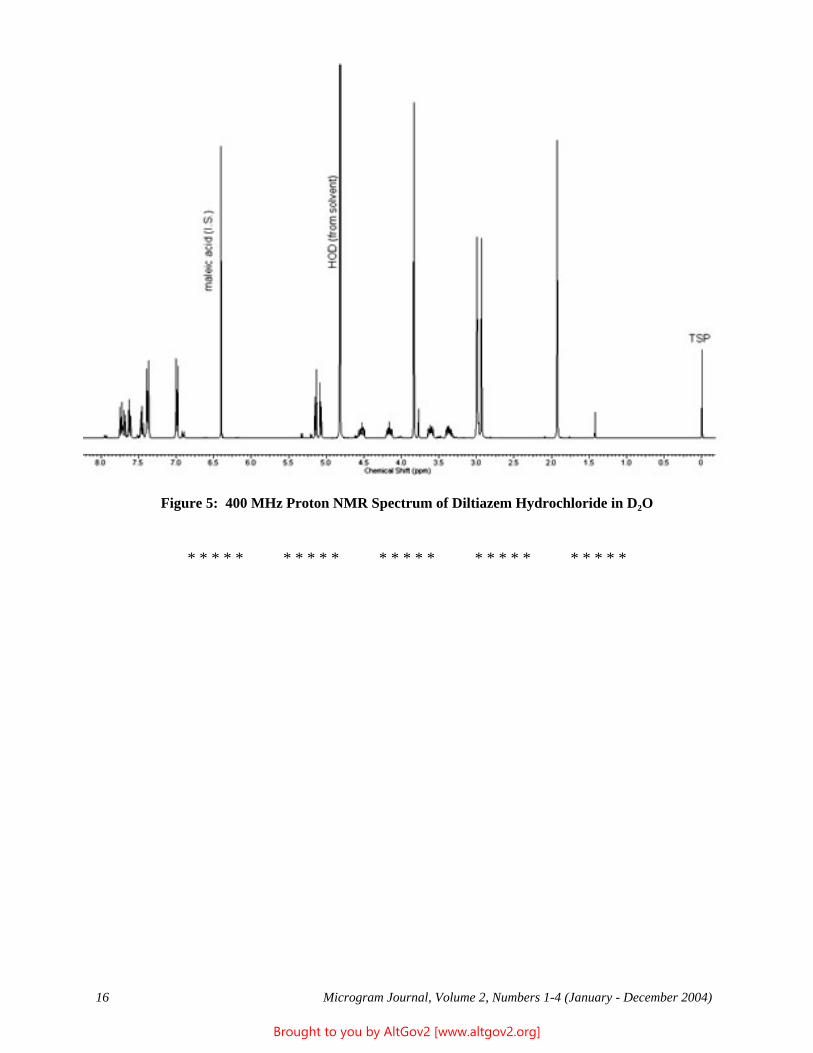
Figure 5: 400 MHz Proton NMR Spectrum of Diltiazem Hydrochloride in D2O
* * * * * * * * * * * * * * * * * * * * * * * * *
Microgram Journal, Volume 2, Numbers 1-4 (January - December 2004) 16
Brought to you by AltGov2 [www.altgov2.org]
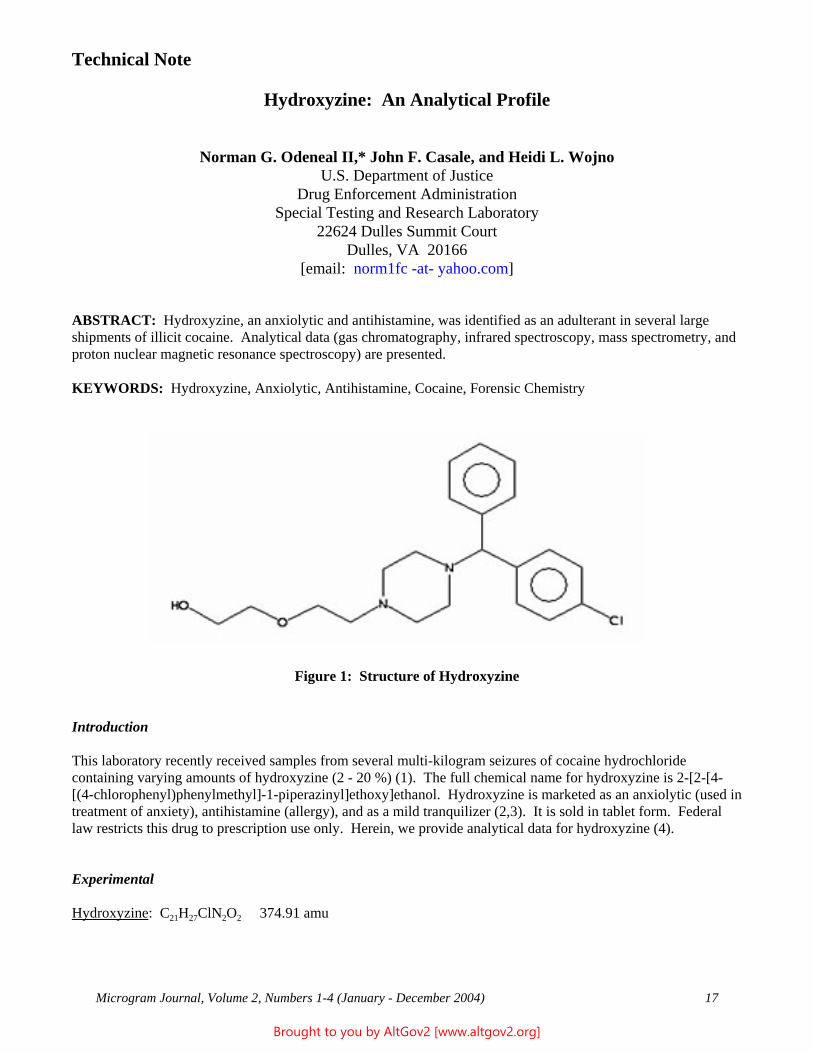
Technical Note
Hydroxyzine: An Analytical Profile
Norman G. Odeneal II,* John F. Casale, and Heidi L. Wojno U.S. Department of Justice
Drug Enforcement Administration Special Testing and Research Laboratory
22624 Dulles Summit Court Dulles, VA 20166
[email: norm1fc -at- yahoo.com]
ABSTRACT: Hydroxyzine, an anxiolytic and antihistamine, was identified as an adulterant in several large shipments of illicit cocaine. Analytical data (gas chromatography, infrared spectroscopy, mass spectrometry, and proton nuclear magnetic resonance spectroscopy) are presented.
KEYWORDS: Hydroxyzine, Anxiolytic, Antihistamine, Cocaine, Forensic Chemistry
Figure 1: Structure of Hydroxyzine
Introduction
This laboratory recently received samples from several multi-kilogram seizures of cocaine hydrochloride containing varying amounts of hydroxyzine (2 - 20 %) (1). The full chemical name for hydroxyzine is 2-[2-[4-[(4-chlorophenyl)phenylmethyl]-1-piperazinyl]ethoxy]ethanol. Hydroxyzine is marketed as an anxiolytic (used in treatment of anxiety), antihistamine (allergy), and as a mild tranquilizer (2,3). It is sold in tablet form. Federal law restricts this drug to prescription use only. Herein, we provide analytical data for hydroxyzine (4).
Experimental
Hydroxyzine: C21H27ClN2O2 374.91 amu
Microgram Journal, Volume 2, Numbers 1-4 (January - December 2004) 17
Brought to you by AltGov2 [www.altgov2.org]
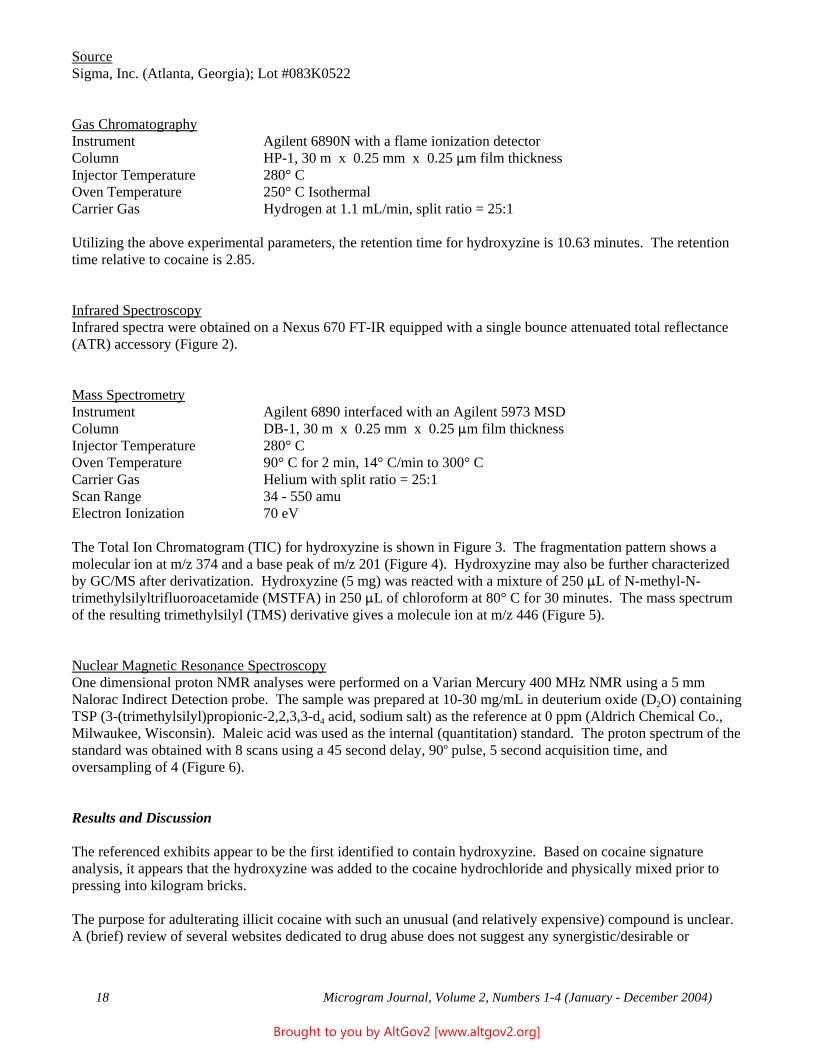
Source Sigma, Inc. (Atlanta, Georgia); Lot #083K0522
Gas Chromatography Instrument Agilent 6890N with a flame ionization detector Column HP-1, 30 m x 0.25 mm x 0.25 :m film thickness Injector Temperature 280° C Oven Temperature 250° C Isothermal Carrier Gas Hydrogen at 1.1 mL/min, split ratio = 25:1
Utilizing the above experimental parameters, the retention time for hydroxyzine is 10.63 minutes. The retention time relative to cocaine is 2.85.
Infrared Spectroscopy Infrared spectra were obtained on a Nexus 670 FT-IR equipped with a single bounce attenuated total reflectance (ATR) accessory (Figure 2).
Mass Spectrometry Instrument Agilent 6890 interfaced with an Agilent 5973 MSD Column DB-1, 30 m x 0.25 mm x 0.25 :m film thickness Injector Temperature 280° C Oven Temperature 90° C for 2 min, 14° C/min to 300° C Carrier Gas Helium with split ratio = 25:1 Scan Range 34 - 550 amu Electron Ionization 70 eV
The Total Ion Chromatogram (TIC) for hydroxyzine is shown in Figure 3. The fragmentation pattern shows a molecular ion at m/z 374 and a base peak of m/z 201 (Figure 4). Hydroxyzine may also be further characterized by GC/MS after derivatization. Hydroxyzine (5 mg) was reacted with a mixture of 250 :L of N-methyl-N-trimethylsilyltrifluoroacetamide (MSTFA) in 250 :L of chloroform at 80° C for 30 minutes. The mass spectrum of the resulting trimethylsilyl (TMS) derivative gives a molecule ion at m/z 446 (Figure 5).
Nuclear Magnetic Resonance Spectroscopy One dimensional proton NMR analyses were performed on a Varian Mercury 400 MHz NMR using a 5 mm Nalorac Indirect Detection probe. The sample was prepared at 10-30 mg/mL in deuterium oxide (D2O) containing TSP (3-(trimethylsilyl)propionic-2,2,3,3-d4 acid, sodium salt) as the reference at 0 ppm (Aldrich Chemical Co., Milwaukee, Wisconsin). Maleic acid was used as the internal (quantitation) standard. The proton spectrum of the standard was obtained with 8 scans using a 45 second delay, 90o pulse, 5 second acquisition time, and oversampling of 4 (Figure 6).
Results and Discussion
The referenced exhibits appear to be the first identified to contain hydroxyzine. Based on cocaine signature analysis, it appears that the hydroxyzine was added to the cocaine hydrochloride and physically mixed prior to pressing into kilogram bricks.
The purpose for adulterating illicit cocaine with such an unusual (and relatively expensive) compound is unclear. A (brief) review of several websites dedicated to drug abuse does not suggest any synergistic/desirable or
Microgram Journal, Volume 2, Numbers 1-4 (January - December 2004) 18
Brought to you by AltGov2 [www.altgov2.org]
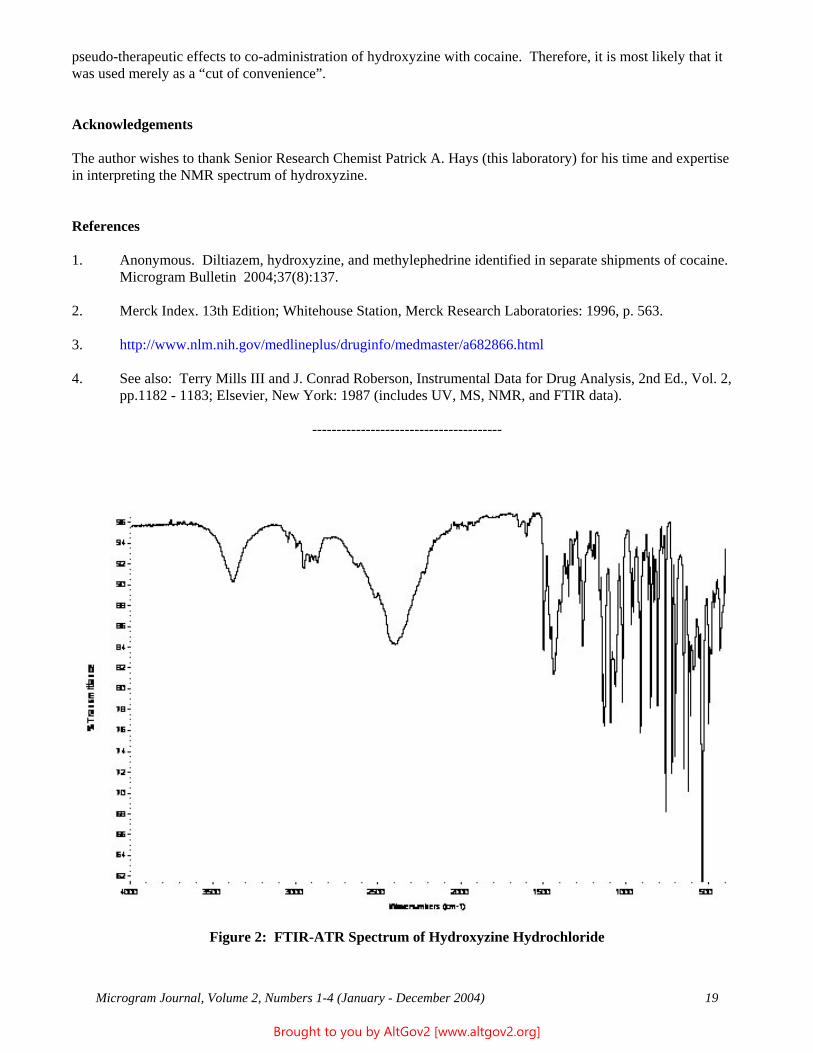
---------------------------------------
pseudo-therapeutic effects to co-administration of hydroxyzine with cocaine. Therefore, it is most likely that it was used merely as a “cut of convenience”.
Acknowledgements
The author wishes to thank Senior Research Chemist Patrick A. Hays (this laboratory) for his time and expertise in interpreting the NMR spectrum of hydroxyzine.
References
1. Anonymous. Diltiazem, hydroxyzine, and methylephedrine identified in separate shipments of cocaine. Microgram Bulletin 2004;37(8):137.
2. Merck Index. 13th Edition; Whitehouse Station, Merck Research Laboratories: 1996, p. 563.
3. http://www.nlm.nih.gov/medlineplus/druginfo/medmaster/a682866.html
4. See also: Terry Mills III and J. Conrad Roberson, Instrumental Data for Drug Analysis, 2nd Ed., Vol. 2, pp.1182 - 1183; Elsevier, New York: 1987 (includes UV, MS, NMR, and FTIR data).
Figure 2: FTIR-ATR Spectrum of Hydroxyzine Hydrochloride
Microgram Journal, Volume 2, Numbers 1-4 (January - December 2004) 19
Brought to you by AltGov2 [www.altgov2.org]
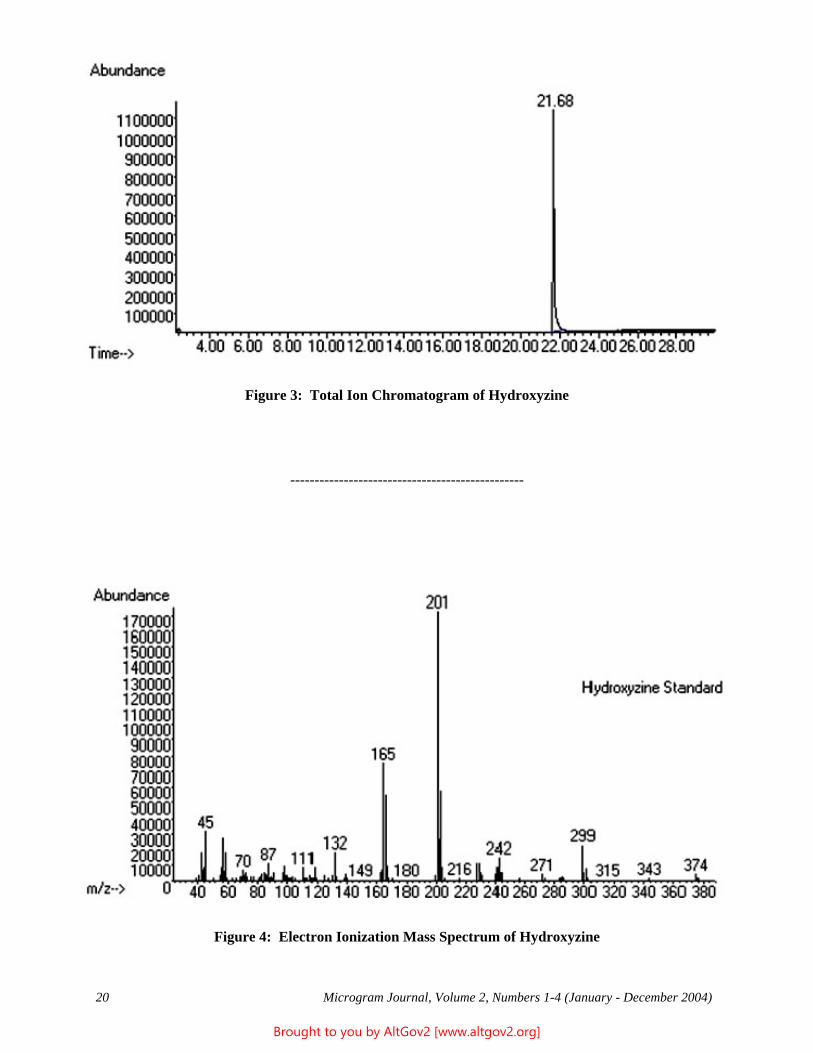
------------------------------------------------
Figure 3: Total Ion Chromatogram of Hydroxyzine
Figure 4: Electron Ionization Mass Spectrum of Hydroxyzine
Microgram Journal, Volume 2, Numbers 1-4 (January - December 2004) 20
Brought to you by AltGov2 [www.altgov2.org]
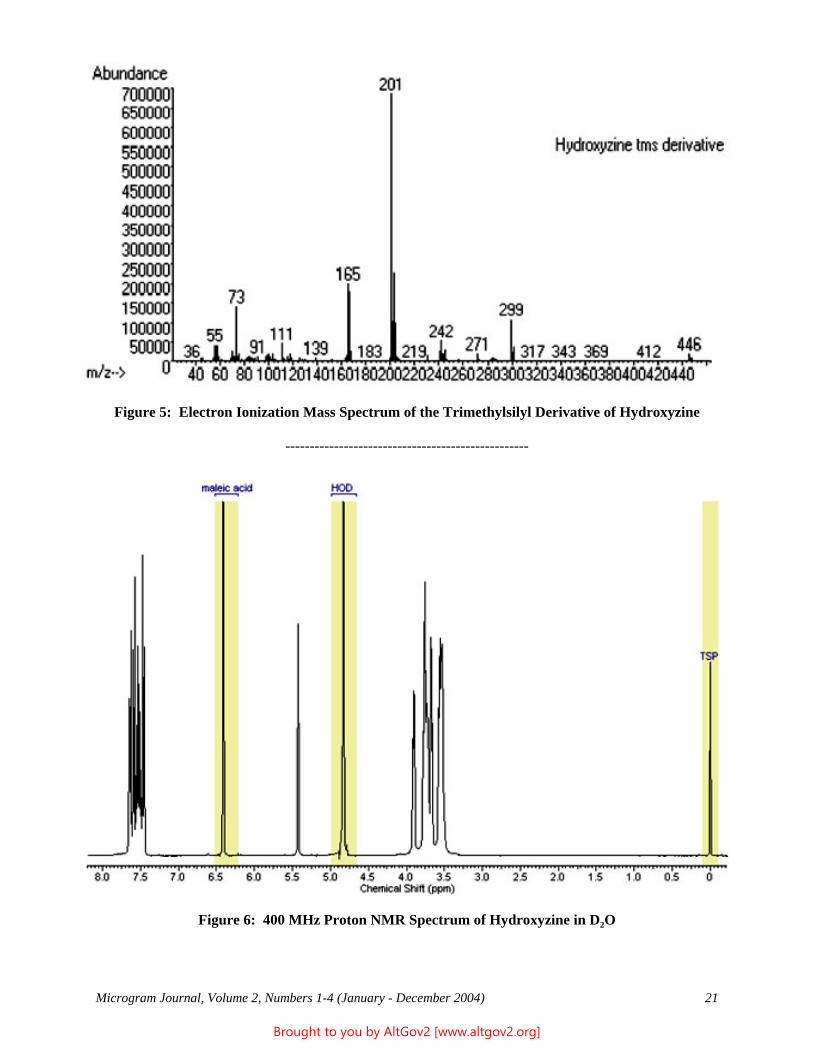
--------------------------------------------------
Figure 5: Electron Ionization Mass Spectrum of the Trimethylsilyl Derivative of Hydroxyzine
Figure 6: 400 MHz Proton NMR Spectrum of Hydroxyzine in D2O
Microgram Journal, Volume 2, Numbers 1-4 (January - December 2004) 21
Brought to you by AltGov2 [www.altgov2.org]
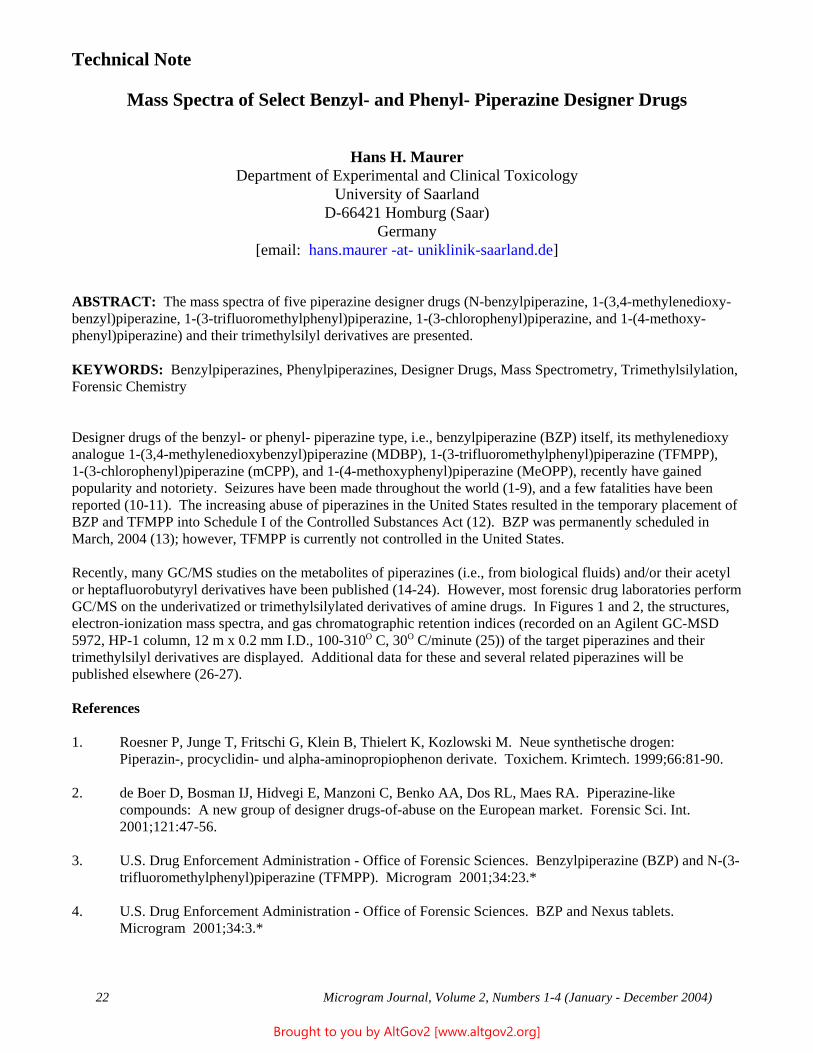
Technical Note
Mass Spectra of Select Benzyl- and Phenyl- Piperazine Designer Drugs
Hans H. Maurer Department of Experimental and Clinical Toxicology
University of Saarland D-66421 Homburg (Saar)
Germany [email: hans.maurer -at- uniklinik-saarland.de]
ABSTRACT: The mass spectra of five piperazine designer drugs (N-benzylpiperazine, 1-(3,4-methylenedioxy-benzyl)piperazine, 1-(3-trifluoromethylphenyl)piperazine, 1-(3-chlorophenyl)piperazine, and 1-(4-methoxy-phenyl)piperazine) and their trimethylsilyl derivatives are presented.
KEYWORDS: Benzylpiperazines, Phenylpiperazines, Designer Drugs, Mass Spectrometry, Trimethylsilylation, Forensic Chemistry
Designer drugs of the benzyl- or phenyl- piperazine type, i.e., benzylpiperazine (BZP) itself, its methylenedioxy analogue 1-(3,4-methylenedioxybenzyl)piperazine (MDBP), 1-(3-trifluoromethylphenyl)piperazine (TFMPP), 1-(3-chlorophenyl)piperazine (mCPP), and 1-(4-methoxyphenyl)piperazine (MeOPP), recently have gained popularity and notoriety. Seizures have been made throughout the world (1-9), and a few fatalities have been reported (10-11). The increasing abuse of piperazines in the United States resulted in the temporary placement of BZP and TFMPP into Schedule I of the Controlled Substances Act (12). BZP was permanently scheduled in March, 2004 (13); however, TFMPP is currently not controlled in the United States.
Recently, many GC/MS studies on the metabolites of piperazines (i.e., from biological fluids) and/or their acetyl or heptafluorobutyryl derivatives have been published (14-24). However, most forensic drug laboratories perform GC/MS on the underivatized or trimethylsilylated derivatives of amine drugs. In Figures 1 and 2, the structures, electron-ionization mass spectra, and gas chromatographic retention indices (recorded on an Agilent GC-MSD 5972, HP-1 column, 12 m x 0.2 mm I.D., 100-310O C, 30O C/minute (25)) of the target piperazines and their trimethylsilyl derivatives are displayed. Additional data for these and several related piperazines will be published elsewhere (26-27).
References
1. Roesner P, Junge T, Fritschi G, Klein B, Thielert K, Kozlowski M. Neue synthetische drogen: Piperazin-, procyclidin- und alpha-aminopropiophenon derivate. Toxichem. Krimtech. 1999;66:81-90.
2. de Boer D, Bosman IJ, Hidvegi E, Manzoni C, Benko AA, Dos RL, Maes RA. Piperazine-like compounds: A new group of designer drugs-of-abuse on the European market. Forensic Sci. Int. 2001;121:47-56.
3. U.S. Drug Enforcement Administration - Office of Forensic Sciences. Benzylpiperazine (BZP) and N-(3-trifluoromethylphenyl)piperazine (TFMPP). Microgram 2001;34:23.*
4. U.S. Drug Enforcement Administration - Office of Forensic Sciences. BZP and Nexus tablets. Microgram 2001;34:3.*
Microgram Journal, Volume 2, Numbers 1-4 (January - December 2004) 22
Brought to you by AltGov2 [www.altgov2.org]
5. U.S. Drug Enforcement Administration - Office of Forensic Sciences. Piperazines in Roanoke, Virginia. Microgram 2001;34:43.*
6. U.S. Drug Enforcement Administration - Office of Forensic Sciences. Benzylpiperazine and Peyote. Microgram 2001;34:65.*
7. U.S. Drug Enforcement Administration - Office of Forensic Sciences. Seven unusual tablet submissions in Largo, Florida. Microgram 2001;34:157.*
8. U.S. Drug Enforcement Administration - Office of Forensic Sciences. 1-Benzylpiperazine (BZP) and N-(3-trifluoromethylphenyl)piperazine (TFMPP). Microgram 2001;34:225.*
9. U.S. Drug Enforcement Administration - Office of Forensic Sciences. Benzylpiperazine (BZP) and N-(3-trifluoromethylphenyl)piperazine (TFMPP). Microgram 2001;34:196.*
10. Balmelli C, Kupferschmidt H, Rentsch K, Schneemann M. [Fatal brain edema after ingestion of ecstasy and benzylpiperazine]. Dtsch. Med. Wochenschr. 2001;126:809-811.
11. Wikstrom M, Holmgren P, Ahlner J. A2 (N-benzylpiperazine), a new drug of abuse in Sweden. J. Anal. Toxicol. 2004;28:67-70.
12. U.S. Drug Enforcement Administration - Department of Justice. Schedules of controlled substances: Temporary placement of benzylpiperazine and trifluoromethylphenylpiperazine into Schedule I. Fed. Register 2002;67:59161-59162.
13. U.S. Drug Enforcement Administration - Department of Justice. Schedules of controlled substances. Placement of 2,5-dimethoxy-4-(n)-propylthiophenethylamine and N-benzylpiperazine into Schedule I of the Controlled Substances Act. Fed. Register 2004;69:12794-12797.
14. Maurer HH, Kraemer T, Springer D, Staack RF. Chemistry, pharmacology, toxicology, and hepatic metabolism of designer drugs of the amphetamine (Ecstasy), piperazine, and pyrrolidinophenone types; a Synopsis. Ther. Drug Monit. 2004;26:127-131.
15. Staack RF, Maurer HH. New designer drug 1-(3,4-methylenedioxybenzyl) piperazine (MDBP): Studies on its metabolism and toxicological detection in rat urine using gas chromatography/mass spectrometry. J. Mass Spectrom. 2004;39:255-261.
16. Staack RF, Paul LD, Springer D, Kraemer T, Maurer HH. Cytochrome P450 dependent metabolism of the new designer drug 1-(3-trifluoromethylphenyl)piperazine (TFMPP). In vivo studies in Wistar and Dark Agouti rats as well as in vitro studies in human liver microsomes. Biochem. Pharmacol. 2004;67:235-244.
17. Staack RF, Theobald DS, Paul LD, Springer D, Kraemer T, Maurer HH. In vivo metabolism of the new designer drug 1-(4-methoxyphenyl)piperazine (MeOPP) in rat and identification of the human cytochrome P450 enzymes responsible for the major metabolic step. Xenobiotica 2004;34:179-192.
18. Staack RF, Fritschi G, Maurer HH. New designer drug 1-(3-trifluoromethylphenyl)piperazine (TFMPP): Gas chromatography/mass spectrometry and liquid chromatography/mass spectrometry studies on its phase I and II metabolism, and on its toxicological detection in rat urine. J. Mass Spectrom. 2003;38:971-981.
19. Staack RF, Maurer HH. Piperazine-derived designer drug 1-(3-chlorophenyl)piperazine (mCPP): GCMS studies on its metabolism and its toxicological detection in urine, including analytical differentiation from its precursor drugs trazodone and nefazodone. J. Anal. Toxicol. 2003;27:560-568.
Microgram Journal, Volume 2, Numbers 1-4 (January - December 2004) 23
Brought to you by AltGov2 [www.altgov2.org]
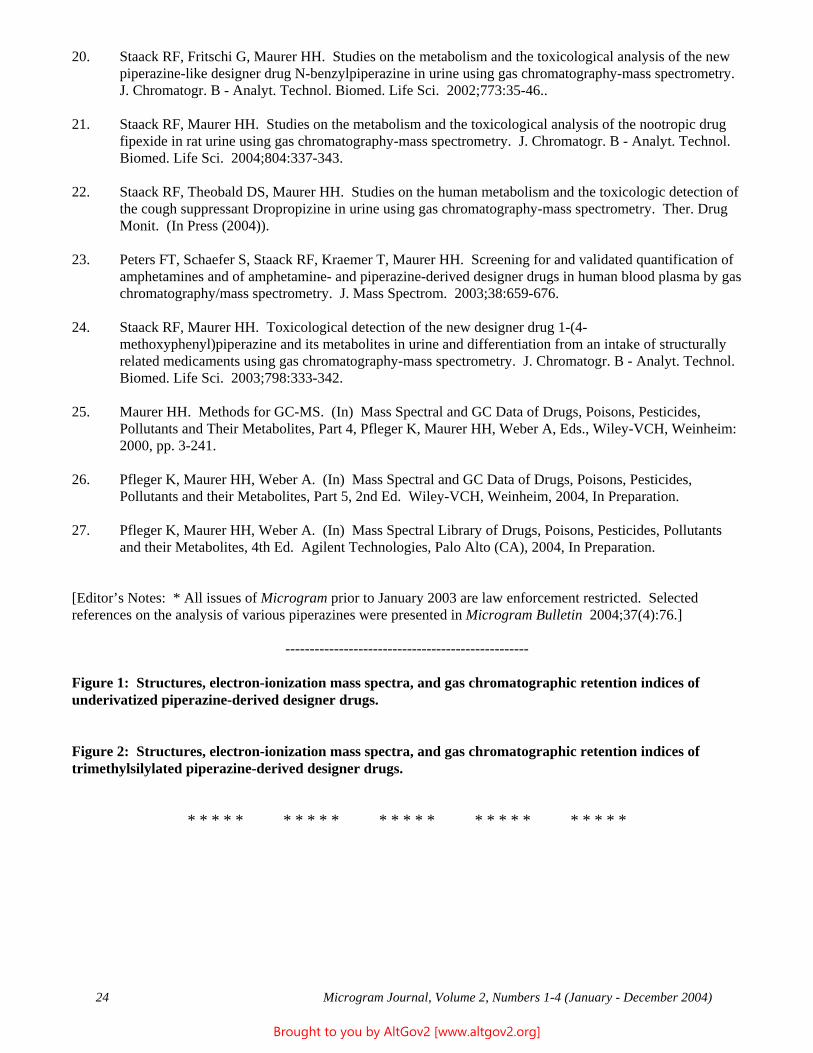
--------------------------------------------------
20. Staack RF, Fritschi G, Maurer HH. Studies on the metabolism and the toxicological analysis of the new piperazine-like designer drug N-benzylpiperazine in urine using gas chromatography-mass spectrometry. J. Chromatogr. B - Analyt. Technol. Biomed. Life Sci. 2002;773:35-46..
21. Staack RF, Maurer HH. Studies on the metabolism and the toxicological analysis of the nootropic drug fipexide in rat urine using gas chromatography-mass spectrometry. J. Chromatogr. B - Analyt. Technol. Biomed. Life Sci. 2004;804:337-343.
22. Staack RF, Theobald DS, Maurer HH. Studies on the human metabolism and the toxicologic detection of the cough suppressant Dropropizine in urine using gas chromatography-mass spectrometry. Ther. Drug Monit. (In Press (2004)).
23. Peters FT, Schaefer S, Staack RF, Kraemer T, Maurer HH. Screening for and validated quantification of amphetamines and of amphetamine- and piperazine-derived designer drugs in human blood plasma by gas chromatography/mass spectrometry. J. Mass Spectrom. 2003;38:659-676.
24. Staack RF, Maurer HH. Toxicological detection of the new designer drug 1-(4-methoxyphenyl)piperazine and its metabolites in urine and differentiation from an intake of structurally related medicaments using gas chromatography-mass spectrometry. J. Chromatogr. B - Analyt. Technol. Biomed. Life Sci. 2003;798:333-342.
25. Maurer HH. Methods for GC-MS. (In) Mass Spectral and GC Data of Drugs, Poisons, Pesticides, Pollutants and Their Metabolites, Part 4, Pfleger K, Maurer HH, Weber A, Eds., Wiley-VCH, Weinheim: 2000, pp. 3-241.
26. Pfleger K, Maurer HH, Weber A. (In) Mass Spectral and GC Data of Drugs, Poisons, Pesticides, Pollutants and their Metabolites, Part 5, 2nd Ed. Wiley-VCH, Weinheim, 2004, In Preparation.
27. Pfleger K, Maurer HH, Weber A. (In) Mass Spectral Library of Drugs, Poisons, Pesticides, Pollutants and their Metabolites, 4th Ed. Agilent Technologies, Palo Alto (CA), 2004, In Preparation.
[Editor’s Notes: * All issues of Microgram prior to January 2003 are law enforcement restricted. Selected references on the analysis of various piperazines were presented in Microgram Bulletin 2004;37(4):76.]
Figure 1: Structures, electron-ionization mass spectra, and gas chromatographic retention indices of underivatized piperazine-derived designer drugs.
Figure 2: Structures, electron-ionization mass spectra, and gas chromatographic retention indices of trimethylsilylated piperazine-derived designer drugs.
* * * * * * * * * * * * * * * * * * * * * * * * *
Microgram Journal, Volume 2, Numbers 1-4 (January - December 2004) 24
Brought to you by AltGov2 [www.altgov2.org]
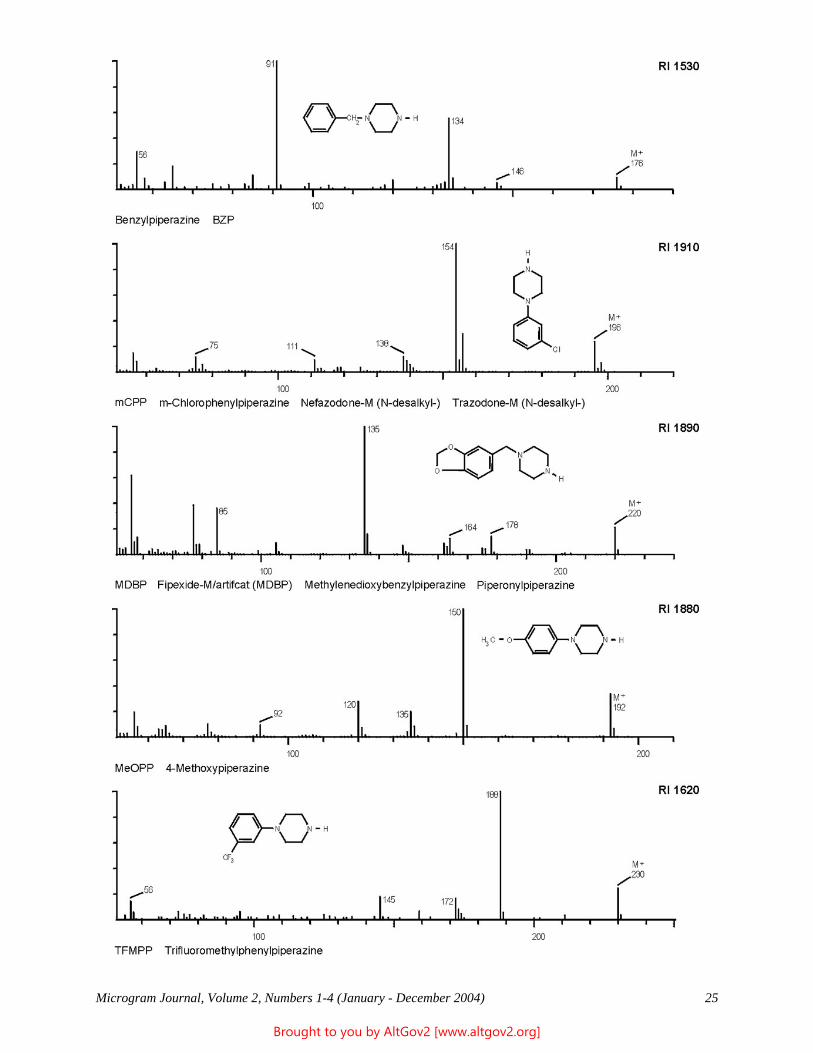
Microgram Journal, Volume 2, Numbers 1-4 (January - December 2004) 25
Brought to you by AltGov2 [www.altgov2.org]
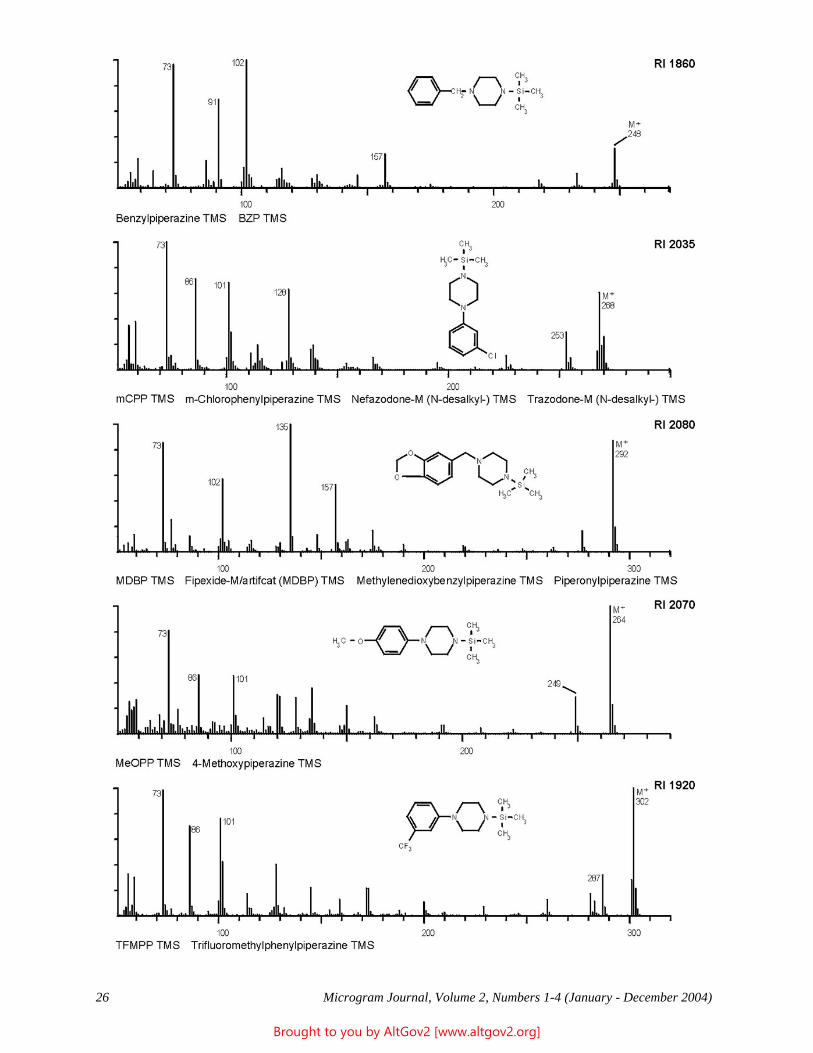
Microgram Journal, Volume 2, Numbers 1-4 (January - December 2004) 26
Brought to you by AltGov2 [www.altgov2.org]
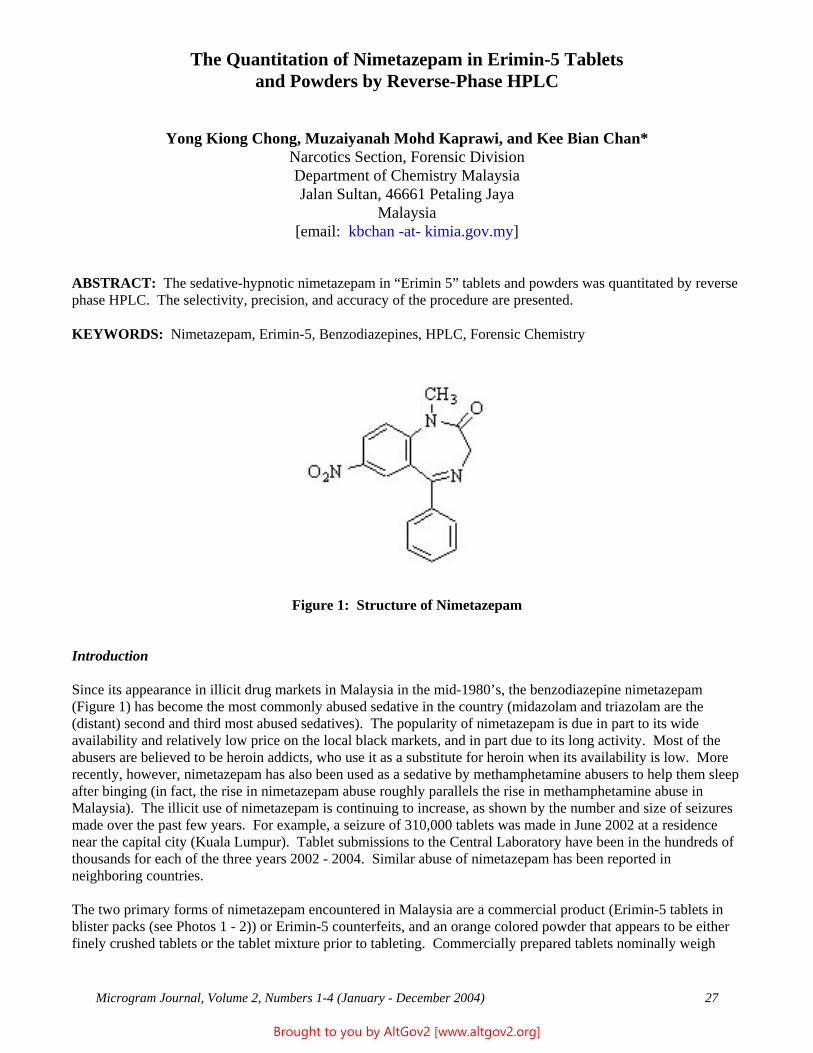
The Quantitation of Nimetazepam in Erimin-5 Tablets and Powders by Reverse-Phase HPLC
Yong Kiong Chong, Muzaiyanah Mohd Kaprawi, and Kee Bian Chan* Narcotics Section, Forensic Division Department of Chemistry Malaysia Jalan Sultan, 46661 Petaling Jaya
Malaysia [email: kbchan -at- kimia.gov.my]
ABSTRACT: The sedative-hypnotic nimetazepam in “Erimin 5” tablets and powders was quantitated by reverse phase HPLC. The selectivity, precision, and accuracy of the procedure are presented.
KEYWORDS: Nimetazepam, Erimin-5, Benzodiazepines, HPLC, Forensic Chemistry
Figure 1: Structure of Nimetazepam
Introduction
Since its appearance in illicit drug markets in Malaysia in the mid-1980’s, the benzodiazepine nimetazepam (Figure 1) has become the most commonly abused sedative in the country (midazolam and triazolam are the (distant) second and third most abused sedatives). The popularity of nimetazepam is due in part to its wide availability and relatively low price on the local black markets, and in part due to its long activity. Most of the abusers are believed to be heroin addicts, who use it as a substitute for heroin when its availability is low. More recently, however, nimetazepam has also been used as a sedative by methamphetamine abusers to help them sleep after binging (in fact, the rise in nimetazepam abuse roughly parallels the rise in methamphetamine abuse in Malaysia). The illicit use of nimetazepam is continuing to increase, as shown by the number and size of seizures made over the past few years. For example, a seizure of 310,000 tablets was made in June 2002 at a residence near the capital city (Kuala Lumpur). Tablet submissions to the Central Laboratory have been in the hundreds of thousands for each of the three years 2002 - 2004. Similar abuse of nimetazepam has been reported in neighboring countries.
The two primary forms of nimetazepam encountered in Malaysia are a commercial product (Erimin-5 tablets in blister packs (see Photos 1 - 2)) or Erimin-5 counterfeits, and an orange colored powder that appears to be either finely crushed tablets or the tablet mixture prior to tableting. Commercially prepared tablets nominally weigh
Microgram Journal, Volume 2, Numbers 1-4 (January - December 2004) 27
Brought to you by AltGov2 [www.altgov2.org]
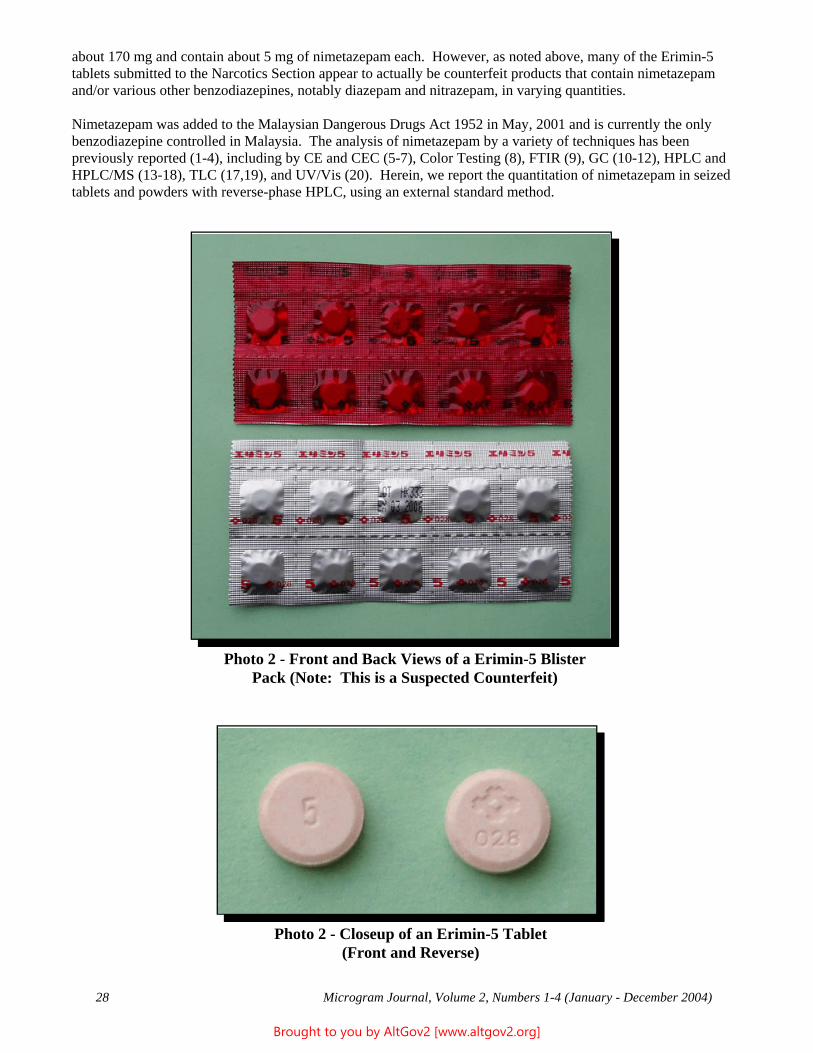
about 170 mg and contain about 5 mg of nimetazepam each. However, as noted above, many of the Erimin-5 tablets submitted to the Narcotics Section appear to actually be counterfeit products that contain nimetazepam and/or various other benzodiazepines, notably diazepam and nitrazepam, in varying quantities.
Nimetazepam was added to the Malaysian Dangerous Drugs Act 1952 in May, 2001 and is currently the only benzodiazepine controlled in Malaysia. The analysis of nimetazepam by a variety of techniques has been previously reported (1-4), including by CE and CEC (5-7), Color Testing (8), FTIR (9), GC (10-12), HPLC and HPLC/MS (13-18), TLC (17,19), and UV/Vis (20). Herein, we report the quantitation of nimetazepam in seized tablets and powders with reverse-phase HPLC, using an external standard method.
Photo 2 - Front and Back Views of a Erimin-5 Blister Pack (Note: This is a Suspected Counterfeit)
Photo 2 - Closeup of an Erimin-5 Tablet (Front and Reverse)
Microgram Journal, Volume 2, Numbers 1-4 (January - December 2004) 28
Brought to you by AltGov2 [www.altgov2.org]
Experimental
ChemicalsHPLC grade methanol and chloroform were purchased from Merck, while AR grade orthophosphoric acid (84 %)was purchased from Ajax (Australia). Nimetazepam (free-base) standard of 100 % purity was kindly providedfree of charge by Sumitomo Chemical Company (Tokyo, Japan). The following benzodiazepines (as free bases)were obtained from the United Nations Drug Control Programme (UNDCP) in Vienna (Austria): Nitrazepam,bromazepam, tetrazepam, flunitrazepam, oxazepam, lorazepam, clorazepate dipotassium (salt), diazepam,flurazepam, and medazepam. Unfortunately, midazolam and triazolam standards were unavailable, and so werenot run.
Instrumentation A Hewlett Packard Series 1050 HPLC was used with the following parameters:
Column : C-18, 5 :m particle size, 15 cm x 4.6 mm i.d. (from Alltech).Detector : UV at 265 nm.Mobile phase: Methanol:Water (50:65). The pH was adjusted to 4.0 with orthophosphoric acid (to a
mixture of 500 mL of methanol and 650 mL of water was added one drop of orthophosphoric acid) (21).
Column temperature: 25º C (ambient temperature). Flow rate : 1.5 mL/minute. Average Pressure: 155 bar. Injection: 20 :L by Rheodyne loop injector. Attenuation: 4 (Integrator).
Standard Solutions for Linearity Study and Calibration Standard solutions containing 0.020, 0.040, 0.080, 0.120, 0.160, 0.200 and 0.240 mg/mL of nimetazepam were prepared in a mixture of methanol/chloroform (5:1) (note that the chloroform was added to better solubulize the tablet materials, and had no adverse effects on the chromatography).
Quantitative Analysis of Samples About 70 – 100 mg of homogenized tablet material was accurately weighed into a 25 mL volumetric flask and made up to volume with a mixture of methanol/chloroform (5:1). The sample solution was ultrasonicated for 5 minutes and filtered through a 0.45 :m filter before injected onto the column. Quantitation was by external standard and with reference to the peak area of the 0.120 mg/mL nimetazepam standard.
Procedure for Standard Addition Method (i) 350.80 mg of tablet material was weighed into a 100 mL volumetric flask, made up to volume with methanol/chloroform (5:1), and ultrasonicated for 5 minutes. (ii) 10 mL of the solution in (i) (i.e., equivalent to 35.08 mg of tablet material) was pipetted into each of five 25 mL volumetric flasks. (iii) The following aliquots of nimetazepam standard stock solution (1.00 mg/mL) were pipetted into the solutions in (ii): 0, 1, 2, 3, and 4 mL. (iv) The solutions were made up to volume (i.e., 25 mL) with methanol/chloroform (5:1). (v) The solutions were filtered through a 0.45 :m filter and injected into the HPLC. (vi) A graph of area versus concentration of nimetazepam (mg/mL) was plotted using Excel and the native nimetazepam content calculated.
Results and Discussion
Selectivity Identification of benzodiazepines is accomplished in this laboratory by GC/MS. However, GC and GC/MS are problematic for quantitation of nimetazepam and some related benzodiazepines due to thermal degradation at injector port temperatures, and so HPLC was selected for quantitation. Because of the wide diversity of chemical structures and solubility characteristics among the benzodiazepines, no single HPLC method will separate all of
Microgram Journal, Volume 2, Numbers 1-4 (January - December 2004) 29
Brought to you by AltGov2 [www.altgov2.org]
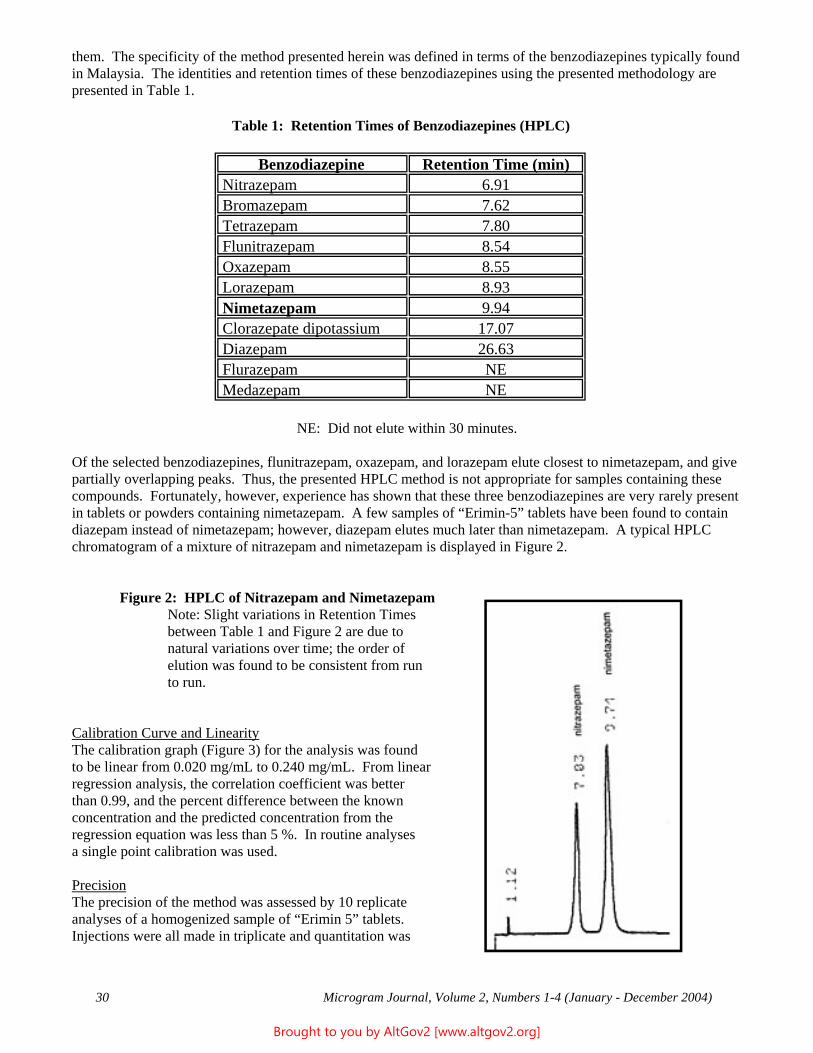
them. The specificity of the method presented herein was defined in terms of the benzodiazepines typically found in Malaysia. The identities and retention times of these benzodiazepines using the presented methodology are presented in Table 1.
Table 1: Retention Times of Benzodiazepines (HPLC)
Benzodiazepine Retention Time (min) Nitrazepam 6.91 Bromazepam 7.62 Tetrazepam 7.80 Flunitrazepam 8.54 Oxazepam 8.55 Lorazepam 8.93 Nimetazepam 9.94 Clorazepate dipotassium 17.07 Diazepam 26.63 Flurazepam NE Medazepam NE
NE: Did not elute within 30 minutes.
Of the selected benzodiazepines, flunitrazepam, oxazepam, and lorazepam elute closest to nimetazepam, and give partially overlapping peaks. Thus, the presented HPLC method is not appropriate for samples containing these compounds. Fortunately, however, experience has shown that these three benzodiazepines are very rarely present in tablets or powders containing nimetazepam. A few samples of “Erimin-5” tablets have been found to contain diazepam instead of nimetazepam; however, diazepam elutes much later than nimetazepam. A typical HPLC chromatogram of a mixture of nitrazepam and nimetazepam is displayed in Figure 2.
Figure 2: HPLC of Nitrazepam and Nimetazepam Note: Slight variations in Retention Times between Table 1 and Figure 2 are due to natural variations over time; the order of elution was found to be consistent from run to run.
Calibration Curve and Linearity The calibration graph (Figure 3) for the analysis was found to be linear from 0.020 mg/mL to 0.240 mg/mL. From linear regression analysis, the correlation coefficient was better than 0.99, and the percent difference between the known concentration and the predicted concentration from the regression equation was less than 5 %. In routine analyses a single point calibration was used.
Precision The precision of the method was assessed by 10 replicate analyses of a homogenized sample of “Erimin 5” tablets. Injections were all made in triplicate and quantitation was
Microgram Journal, Volume 2, Numbers 1-4 (January - December 2004) 30
Brought to you by AltGov2 [www.altgov2.org]

against the 0.120 mg/mL standard. The mean content of nimetazepam was found to be 3.1 % with a relative standard deviation of 4.4 %.
Figure 3: Calibration Curve of Nimetazepam
Accuracy The accuracy of the method was assessed by analyzing two laboratory prepared mixtures, and re-analysis of the sample which was used for the precision study by the method of standard addition.
Analysis of Laboratory Prepared MixturesOwing to the limited supply of pure nimetazepam reference standards, only two synthetic mixtures were prepared,simulating 5 mg/tablet and 3 mg/tablet. Both the samples were prepared in lactose and contained 3.5 % and 1.7 %of nimetazepam, respectively. Replicate analyses (n = 7) of these two mixtures were made and the resultsassessed using the Student t-statistic:
t = |⎯x - µ | n s
where ⎯x = sample mean (experimental value) : = true value (theoretical value) n = no. replicate (weighings) s = standard deviation
For both samples it was found that the t value did not exceed the critical value derived by statistical analysis, showing that there was no proven evidence of difference between the experimental value and the theoretical value at 95 % confidence level.
Microgram Journal, Volume 2, Numbers 1-4 (January - December 2004) 31
Brought to you by AltGov2 [www.altgov2.org]
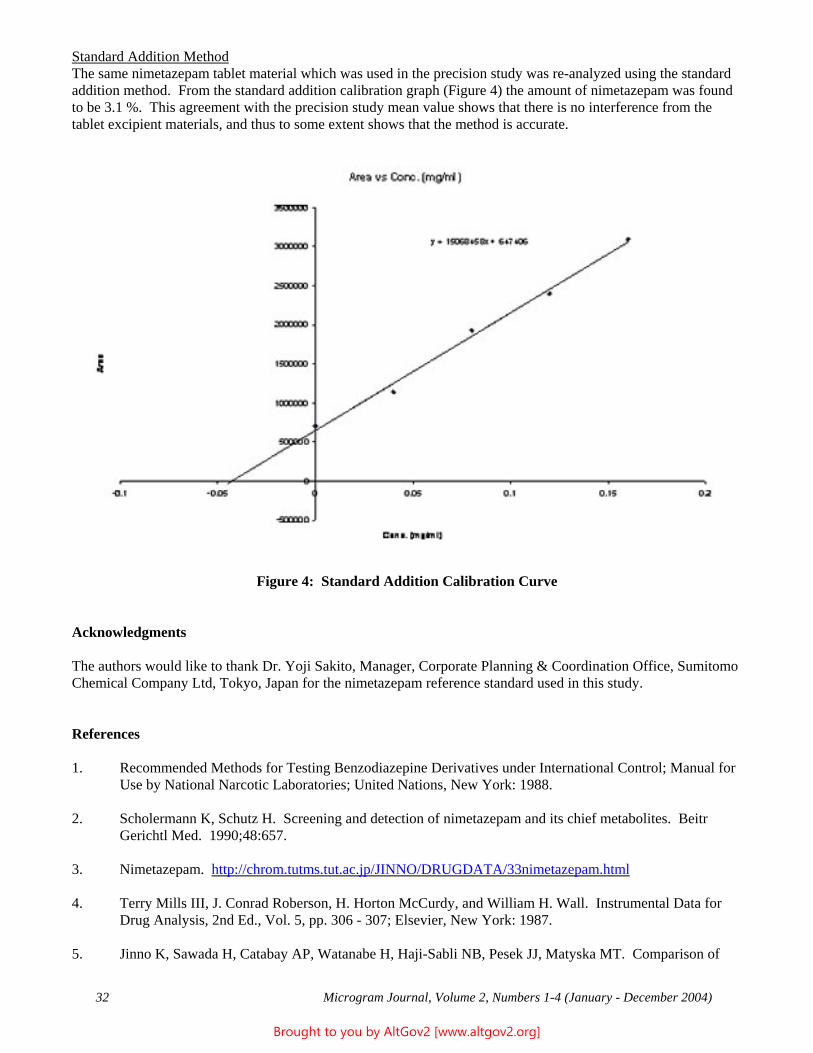
Standard Addition Method The same nimetazepam tablet material which was used in the precision study was re-analyzed using the standard addition method. From the standard addition calibration graph (Figure 4) the amount of nimetazepam was found to be 3.1 %. This agreement with the precision study mean value shows that there is no interference from the tablet excipient materials, and thus to some extent shows that the method is accurate.
Figure 4: Standard Addition Calibration Curve
Acknowledgments
The authors would like to thank Dr. Yoji Sakito, Manager, Corporate Planning & Coordination Office, Sumitomo Chemical Company Ltd, Tokyo, Japan for the nimetazepam reference standard used in this study.
References
1. Recommended Methods for Testing Benzodiazepine Derivatives under International Control; Manual for Use by National Narcotic Laboratories; United Nations, New York: 1988.
2. Scholermann K, Schutz H. Screening and detection of nimetazepam and its chief metabolites. Beitr Gerichtl Med. 1990;48:657.
3. Nimetazepam. http://chrom.tutms.tut.ac.jp/JINNO/DRUGDATA/33nimetazepam.html
4. Terry Mills III, J. Conrad Roberson, H. Horton McCurdy, and William H. Wall. Instrumental Data for Drug Analysis, 2nd Ed., Vol. 5, pp. 306 - 307; Elsevier, New York: 1987.
5. Jinno K, Sawada H, Catabay AP, Watanabe H, Haji-Sabli NB, Pesek JJ, Matyska MT. Comparison of
Microgram Journal, Volume 2, Numbers 1-4 (January - December 2004) 32
Brought to you by AltGov2 [www.altgov2.org]
separation behavior of benzodiazepines in packed capillary chromatography and open-tubular capillary electrochromatography. J. Chrom. A 2000;887(1-2):479-487.
6. Jinno K, Han Y, Sawada H, Taniguchi M. Capillary electrophoretic separation of toxic drugs using a polyacrylamide-coated capillary. Chromatographia 1997;46(5/6):309-314.
7. Jinno K, Han Y, Nakamura M. Analysis of anxiolytic drugs by capillary electrophoresis with bare and coated capillaries. J. Capillary Electrophor. 1996;3(3):139-145.
8. Koga S, Fuchi K, Irikado T. Color testing of benzodiazepine type psychotropic drugs using Zimmermann’s reagent. Kanzei Chuo Bunsekishoho 2000;40:67-71.
9. Hida M, Mitsui T. Rapid searching method of tablet samples by micro-FTIR. J. Health Sci. 1999;45(4):226-231.
10. Hida M, Mitsui T, Ohtani H, Tsuge S. Determination of benzodiazepines in tablets by thermal desorption gas chromatography. J. Pharm. Biomed. Anal. 1999;20(3):419-426.
11. Shimano M, Inoue Y, Yoko M, Matsuzaki R, Inde S, Yagasaki K. Qualitative analysis of psychotropic drugs by capillary gas chromatography using NPD. Kanzei Chuo Bunsekishoho 1995;34:87-92.
12. Kurazono K, Matuzaki R, Nagai M, Inde S, Yagasaki K. Analysis of psychotropic drugs by gas chromatography. Kanzei Chuo Bunsekishoho 1994;33:49-53.
13. Lim WJL, Lee TK, Mangudi M, Selvi TS. A study of “Erimin 5" tablets seized in Singapore. ANZFSS 17th International Symposium on the Forensic Sciences 2004 (Abstract of Presentation).
14. Sato K, Mizuno Y, Kobayashi K, Sano T, Taguchi T, Shimizu T, Lee X-P, Katsumata Y. Capillary high-performance liquid chromatography/fast-atom bombardment-mass spectrometry of 26 benzodiazepines. Jpn. J. Forensic Toxicol. 2000;18(1):32-38.
15. Catabay A, Taniguchi M, Jinno K, Pesek JJ, Williamsen E. Separation of 1,4-benzodiazepines and analogs using cholesteryl-10-undecenoate bonded phase in microcolumn liquid chromatography. J. Chromatogr. Sci. 1998;36(3):111-118.
16. Akieda T, Inoma S. The analysis of psychotropic substances by high performance liquid chromatography (HPLC) and high performance liquid chromatography-mass spectrometry (HPLC-MS). II. Kanzei Chuo Bunsekishoho 1995;34:65-86.
17. Fujimura T, Akieda T, Inoma S. Analysis of psychotropic drugs by high performance liquid chromatography and thin layer chromatography. Kanzei Chuo Bunsekishoho 1994;33:65-74.
18. Shimamine M, Masunari T, Nakahara Y. Identification of drugs of abuse by diode array detection. I. Screening test and identification of benzodiazepines by HPLC-DAD with ICOS software. Eisei Shikensho Hokoku 1993;111:47-56.
19. Schutz H, Rumpf E. TLC screening of 1,4-benzodiazepines. Adli Tip Dergisi (Turkey) 1990;6(1-2):3-8.
20. Singh V, Shukla SK, Mahanwal JS. Detection and determination of benzodiazepines by derivative UV spectroscopy. Part II. Indian J. Forensic Sci. 1990;4(2):89-102.
21. Kozu T. HPLC determination of nitrazepam and its metabolites in human urine. J. Chromatogr. 1984;310:213-218.
Microgram Journal, Volume 2, Numbers 1-4 (January - December 2004) 33
Brought to you by AltGov2 [www.altgov2.org]
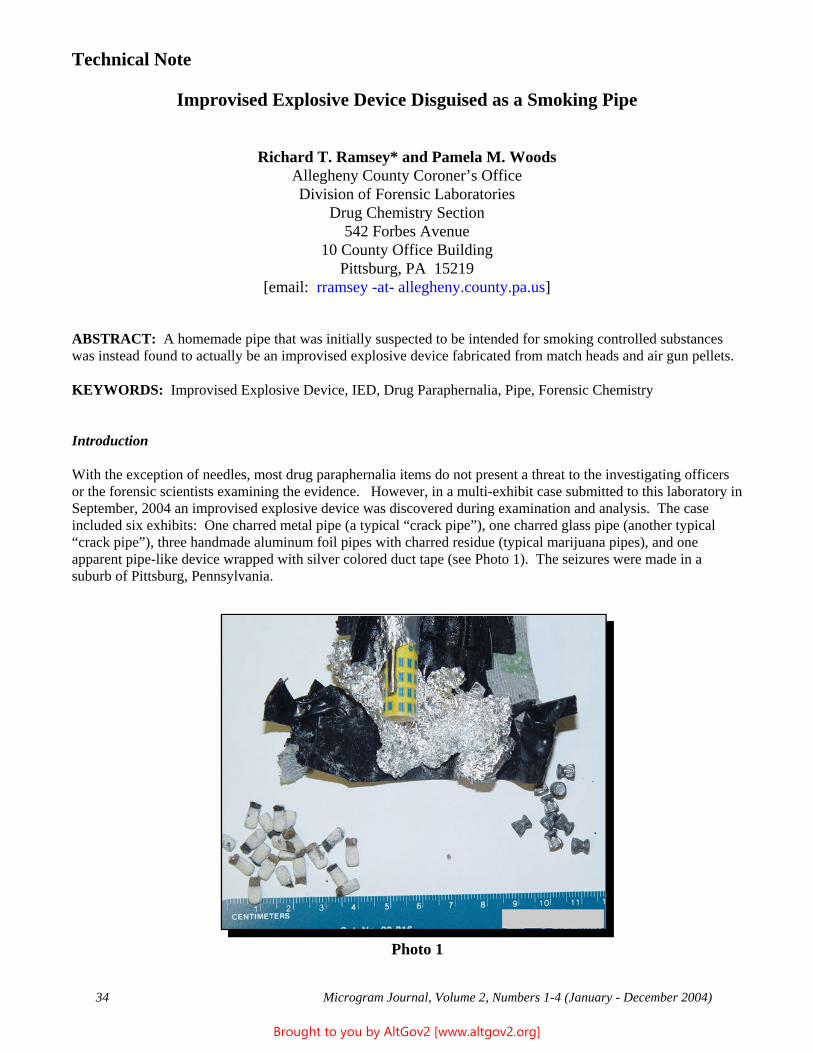
Technical Note
Improvised Explosive Device Disguised as a Smoking Pipe
Richard T. Ramsey* and Pamela M. Woods Allegheny County Coroner’s Office Division of Forensic Laboratories
Drug Chemistry Section 542 Forbes Avenue
10 County Office Building Pittsburg, PA 15219
[email: rramsey -at- allegheny.county.pa.us]
ABSTRACT: A homemade pipe that was initially suspected to be intended for smoking controlled substances was instead found to actually be an improvised explosive device fabricated from match heads and air gun pellets.
KEYWORDS: Improvised Explosive Device, IED, Drug Paraphernalia, Pipe, Forensic Chemistry
Introduction
With the exception of needles, most drug paraphernalia items do not present a threat to the investigating officers or the forensic scientists examining the evidence. However, in a multi-exhibit case submitted to this laboratory in September, 2004 an improvised explosive device was discovered during examination and analysis. The case included six exhibits: One charred metal pipe (a typical “crack pipe”), one charred glass pipe (another typical “crack pipe”), three handmade aluminum foil pipes with charred residue (typical marijuana pipes), and one apparent pipe-like device wrapped with silver colored duct tape (see Photo 1). The seizures were made in a suburb of Pittsburg, Pennsylvania.
Photo 1
Microgram Journal, Volume 2, Numbers 1-4 (January - December 2004) 34
Brought to you by AltGov2 [www.altgov2.org]
--------------------------------------------------
Experimental
The two presumed “crack pipes” (the metal and glass pipes) were each rinsed with chloroform, and the resulting solutions screened by thin layer chromatography (TLC), using “Analtech” Silica Gel plates 250 :m thickness. A reference standard of cocaine base was also spotted on the plate. The remainder of each chloroform rinse solution was evaporated to dryness, and the resulting residue was analyzed using Fourier Transform Infrared Spectrometry (FTIR), using a Perkin Elmer Spectrum One with an ATR attachment.
The three presumed marijuana pipes (the handmade aluminum foil pipes) were unrolled and found to contain charred residues. This material was subjected to a morphological examination under a stereoscope with a 10x magnification. The Duquenois-Levine test was also performed. Finally, the pipes were each rinsed with chloroform, and the resulting solutions screened by TLC against a known reference standard of marijuana.
The last pipe was first examined visually and stereoscopically (see Photo 1). It measured 8 cm in length and 1.5 cm in diameter, and was wrappeded with silver colored duct tape . As the layers of duct tape were unwrapped, an inner layer of black electrical tape was observed, and then a layer of aluminum foil. Inside of the foil, ten metal pellets were observed surrounding a plastic pen cap. The total net weight of the ten pellets was 76.9 grains. The pen cap was plastic, with a blue checked pattern on a yellow background. A standard metal shirt clip was observed on the exterior side of the pen cap. Twenty apparent match heads were found inside the pen cap. It appeared that the base of each match had been torn off, so that only the ignitable tip remained. The suspected match heads were examined using FTIR and diffuse reflectance.
Results and Discussion
The metal and glass pipes both tested positive for cocaine base. However, all three of the aluminum foil pipes tested negative for controlled substances. The final pipe was determined to actually be an IED. Upon close examination of the metal pellets, they were consistent in appearance with lead air gun pellets. The metal pellets had an hourglass shape with one end open characterized by rib marks around the outside; this is referred to as a “gereffelt” type skirt. The other end was filled and flat; this is referred to as a “wad cutter” type head design. The white material on the suspected match heads was consistent with potassium chlorate, one of the reactive ingredients used in the heads of commercially prepared matches. Although the exact function of this device is not known, detonation upon handling, disassembly, or analysis by law enforcement personnel seems unlikely. For this device to activate, an external force or an open flame would have to be introduced to ignite the match heads. The release of energy caused by the burning match heads would presumably cause an explosive effect, fragmenting the pen cap and ejecting the pellets contained within the tape. Speculating, it appears that the intended target would be an unsuspecting user.
[Editor’s Notes: Based on a brief review, references dedicated to IED’s do not include any devices of this exact description. However, there are a variety of similar, match head type IED’s, most of which would be considered to be “booby-trap” devices designed to detonate upon handling. Specific references are withheld in accordance with Journal policy.]
* * * * * * * * * * * * * * * * * * * * * * * * *
Microgram Journal, Volume 2, Numbers 1-4 (January - December 2004) 35
Brought to you by AltGov2 [www.altgov2.org]
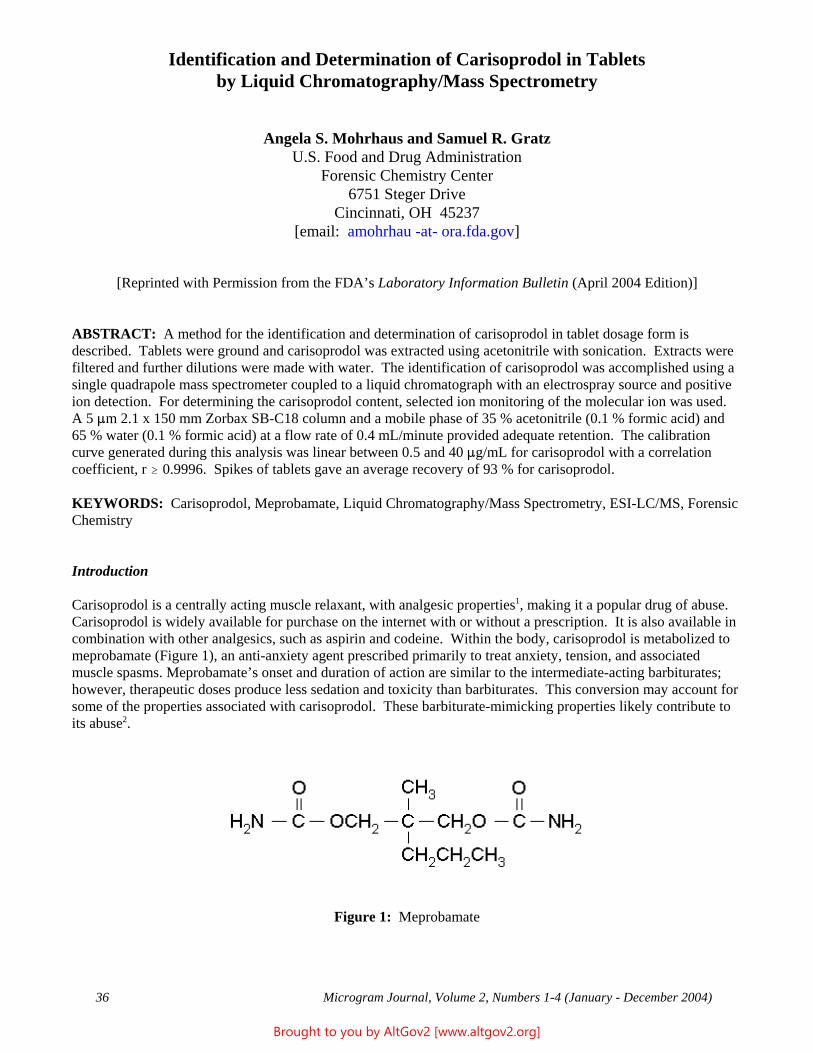
Identification and Determination of Carisoprodol in Tablets by Liquid Chromatography/Mass Spectrometry
Angela S. Mohrhaus and Samuel R. Gratz U.S. Food and Drug Administration
Forensic Chemistry Center 6751 Steger Drive
Cincinnati, OH 45237 [email: amohrhau -at- ora.fda.gov]
[Reprinted with Permission from the FDA’s Laboratory Information Bulletin (April 2004 Edition)]
ABSTRACT: A method for the identification and determination of carisoprodol in tablet dosage form is described. Tablets were ground and carisoprodol was extracted using acetonitrile with sonication. Extracts were filtered and further dilutions were made with water. The identification of carisoprodol was accomplished using a single quadrapole mass spectrometer coupled to a liquid chromatograph with an electrospray source and positive ion detection. For determining the carisoprodol content, selected ion monitoring of the molecular ion was used. A 5 :m 2.1 x 150 mm Zorbax SB-C18 column and a mobile phase of 35 % acetonitrile (0.1 % formic acid) and 65 % water (0.1 % formic acid) at a flow rate of 0.4 mL/minute provided adequate retention. The calibration curve generated during this analysis was linear between 0.5 and 40 :g/mL for carisoprodol with a correlation coefficient, r $ 0.9996. Spikes of tablets gave an average recovery of 93 % for carisoprodol.
KEYWORDS: Carisoprodol, Meprobamate, Liquid Chromatography/Mass Spectrometry, ESI-LC/MS, Forensic Chemistry
Introduction
Carisoprodol is a centrally acting muscle relaxant, with analgesic properties1, making it a popular drug of abuse. Carisoprodol is widely available for purchase on the internet with or without a prescription. It is also available in combination with other analgesics, such as aspirin and codeine. Within the body, carisoprodol is metabolized to meprobamate (Figure 1), an anti-anxiety agent prescribed primarily to treat anxiety, tension, and associated muscle spasms. Meprobamate’s onset and duration of action are similar to the intermediate-acting barbiturates; however, therapeutic doses produce less sedation and toxicity than barbiturates. This conversion may account for some of the properties associated with carisoprodol. These barbiturate-mimicking properties likely contribute to its abuse2.
Figure 1: Meprobamate
Microgram Journal, Volume 2, Numbers 1-4 (January - December 2004) 36
Brought to you by AltGov2 [www.altgov2.org]
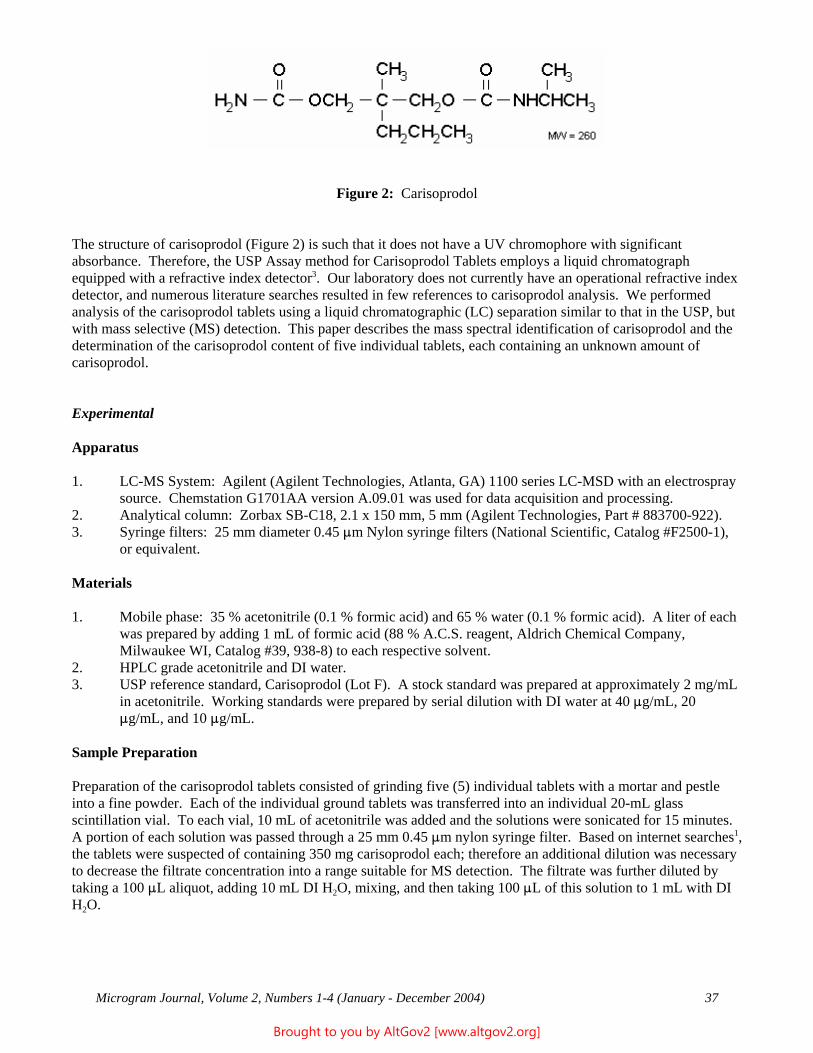
Figure 2: Carisoprodol
The structure of carisoprodol (Figure 2) is such that it does not have a UV chromophore with significant absorbance. Therefore, the USP Assay method for Carisoprodol Tablets employs a liquid chromatograph equipped with a refractive index detector3. Our laboratory does not currently have an operational refractive index detector, and numerous literature searches resulted in few references to carisoprodol analysis. We performed analysis of the carisoprodol tablets using a liquid chromatographic (LC) separation similar to that in the USP, but with mass selective (MS) detection. This paper describes the mass spectral identification of carisoprodol and the determination of the carisoprodol content of five individual tablets, each containing an unknown amount of carisoprodol.
Experimental
Apparatus
1. LC-MS System: Agilent (Agilent Technologies, Atlanta, GA) 1100 series LC-MSD with an electrospray source. Chemstation G1701AA version A.09.01 was used for data acquisition and processing.
2. Analytical column: Zorbax SB-C18, 2.1 x 150 mm, 5 mm (Agilent Technologies, Part # 883700-922). 3. Syringe filters: 25 mm diameter 0.45 :m Nylon syringe filters (National Scientific, Catalog #F2500-1),
or equivalent.
Materials
1. Mobile phase: 35 % acetonitrile (0.1 % formic acid) and 65 % water (0.1 % formic acid). A liter of each was prepared by adding 1 mL of formic acid (88 % A.C.S. reagent, Aldrich Chemical Company, Milwaukee WI, Catalog #39, 938-8) to each respective solvent.
2. HPLC grade acetonitrile and DI water. 3. USP reference standard, Carisoprodol (Lot F). A stock standard was prepared at approximately 2 mg/mL
in acetonitrile. Working standards were prepared by serial dilution with DI water at 40 :g/mL, 20 :g/mL, and 10 :g/mL.
Sample Preparation
Preparation of the carisoprodol tablets consisted of grinding five (5) individual tablets with a mortar and pestle into a fine powder. Each of the individual ground tablets was transferred into an individual 20-mL glass scintillation vial. To each vial, 10 mL of acetonitrile was added and the solutions were sonicated for 15 minutes. A portion of each solution was passed through a 25 mm 0.45 :m nylon syringe filter. Based on internet searches1, the tablets were suspected of containing 350 mg carisoprodol each; therefore an additional dilution was necessary to decrease the filtrate concentration into a range suitable for MS detection. The filtrate was further diluted by taking a 100 :L aliquot, adding 10 mL DI H2O, mixing, and then taking 100 :L of this solution to 1 mL with DI H2O.
Microgram Journal, Volume 2, Numbers 1-4 (January - December 2004) 37
Brought to you by AltGov2 [www.altgov2.org]
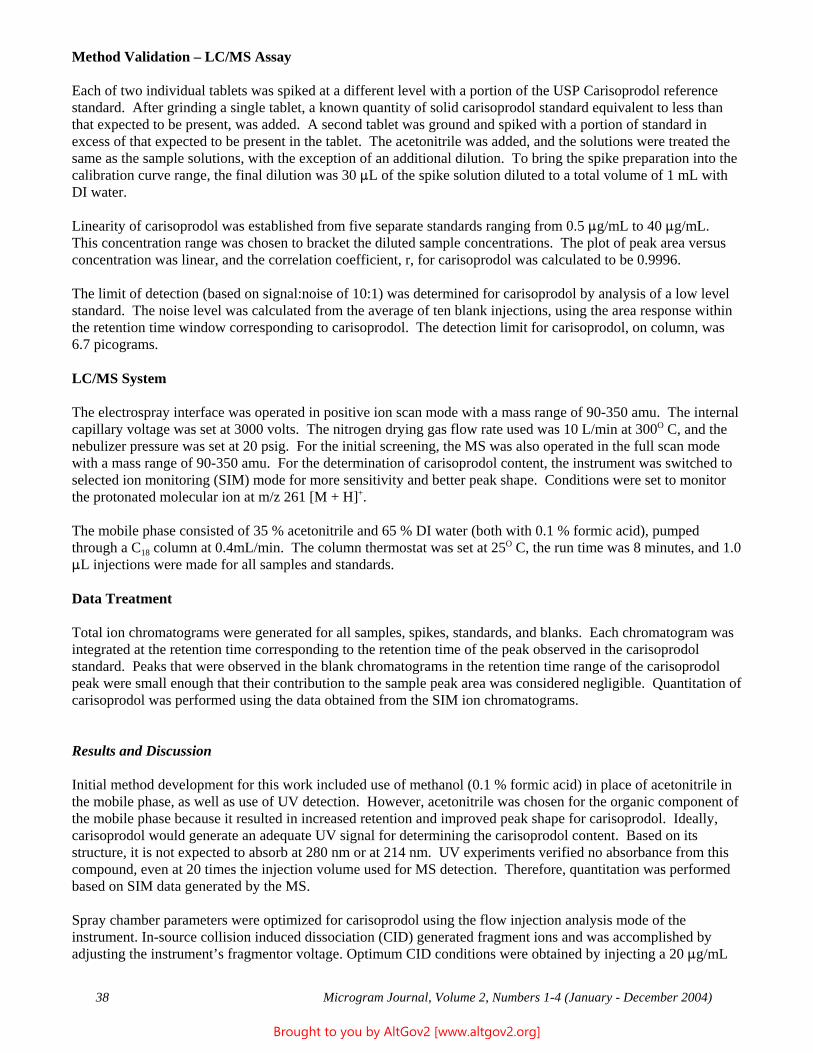
Method Validation – LC/MS Assay
Each of two individual tablets was spiked at a different level with a portion of the USP Carisoprodol reference standard. After grinding a single tablet, a known quantity of solid carisoprodol standard equivalent to less than that expected to be present, was added. A second tablet was ground and spiked with a portion of standard in excess of that expected to be present in the tablet. The acetonitrile was added, and the solutions were treated the same as the sample solutions, with the exception of an additional dilution. To bring the spike preparation into the calibration curve range, the final dilution was 30 :L of the spike solution diluted to a total volume of 1 mL with DI water.
Linearity of carisoprodol was established from five separate standards ranging from 0.5 :g/mL to 40 :g/mL. This concentration range was chosen to bracket the diluted sample concentrations. The plot of peak area versus concentration was linear, and the correlation coefficient, r, for carisoprodol was calculated to be 0.9996.
The limit of detection (based on signal:noise of 10:1) was determined for carisoprodol by analysis of a low level standard. The noise level was calculated from the average of ten blank injections, using the area response within the retention time window corresponding to carisoprodol. The detection limit for carisoprodol, on column, was 6.7 picograms.
LC/MS System
The electrospray interface was operated in positive ion scan mode with a mass range of 90-350 amu. The internal capillary voltage was set at 3000 volts. The nitrogen drying gas flow rate used was 10 L/min at 300O C, and the nebulizer pressure was set at 20 psig. For the initial screening, the MS was also operated in the full scan mode with a mass range of 90-350 amu. For the determination of carisoprodol content, the instrument was switched to selected ion monitoring (SIM) mode for more sensitivity and better peak shape. Conditions were set to monitor the protonated molecular ion at m/z 261 [M + H]+.
The mobile phase consisted of 35 % acetonitrile and 65 % DI water (both with 0.1 % formic acid), pumped through a C18 column at 0.4mL/min. The column thermostat was set at 25O C, the run time was 8 minutes, and 1.0 :L injections were made for all samples and standards.
Data Treatment
Total ion chromatograms were generated for all samples, spikes, standards, and blanks. Each chromatogram was integrated at the retention time corresponding to the retention time of the peak observed in the carisoprodol standard. Peaks that were observed in the blank chromatograms in the retention time range of the carisoprodol peak were small enough that their contribution to the sample peak area was considered negligible. Quantitation of carisoprodol was performed using the data obtained from the SIM ion chromatograms.
Results and Discussion
Initial method development for this work included use of methanol (0.1 % formic acid) in place of acetonitrile in the mobile phase, as well as use of UV detection. However, acetonitrile was chosen for the organic component of the mobile phase because it resulted in increased retention and improved peak shape for carisoprodol. Ideally, carisoprodol would generate an adequate UV signal for determining the carisoprodol content. Based on its structure, it is not expected to absorb at 280 nm or at 214 nm. UV experiments verified no absorbance from this compound, even at 20 times the injection volume used for MS detection. Therefore, quantitation was performed based on SIM data generated by the MS.
Spray chamber parameters were optimized for carisoprodol using the flow injection analysis mode of the instrument. In-source collision induced dissociation (CID) generated fragment ions and was accomplished by adjusting the instrument’s fragmentor voltage. Optimum CID conditions were obtained by injecting a 20 :g/mL
Microgram Journal, Volume 2, Numbers 1-4 (January - December 2004) 38
Brought to you by AltGov2 [www.altgov2.org]
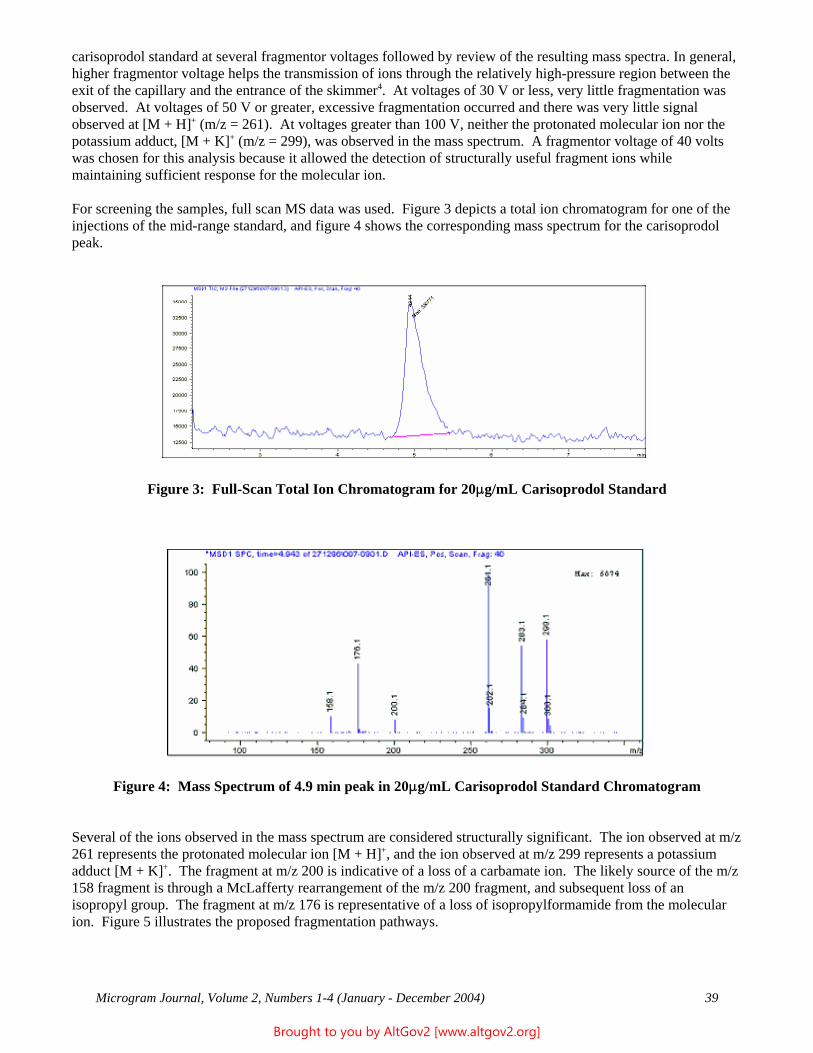
carisoprodol standard at several fragmentor voltages followed by review of the resulting mass spectra. In general, higher fragmentor voltage helps the transmission of ions through the relatively high-pressure region between the exit of the capillary and the entrance of the skimmer4. At voltages of 30 V or less, very little fragmentation was observed. At voltages of 50 V or greater, excessive fragmentation occurred and there was very little signal observed at [M + H]+ (m/z = 261). At voltages greater than 100 V, neither the protonated molecular ion nor the potassium adduct, [M + K]+ (m/z = 299), was observed in the mass spectrum. A fragmentor voltage of 40 volts was chosen for this analysis because it allowed the detection of structurally useful fragment ions while maintaining sufficient response for the molecular ion.
For screening the samples, full scan MS data was used. Figure 3 depicts a total ion chromatogram for one of the injections of the mid-range standard, and figure 4 shows the corresponding mass spectrum for the carisoprodol peak.
Figure 3: Full-Scan Total Ion Chromatogram for 20:g/mL Carisoprodol Standard
Figure 4: Mass Spectrum of 4.9 min peak in 20:g/mL Carisoprodol Standard Chromatogram
Several of the ions observed in the mass spectrum are considered structurally significant. The ion observed at m/z 261 represents the protonated molecular ion [M + H]+, and the ion observed at m/z 299 represents a potassium adduct [M + K]+. The fragment at m/z 200 is indicative of a loss of a carbamate ion. The likely source of the m/z 158 fragment is through a McLafferty rearrangement of the m/z 200 fragment, and subsequent loss of an isopropyl group. The fragment at m/z 176 is representative of a loss of isopropylformamide from the molecular ion. Figure 5 illustrates the proposed fragmentation pathways.
Microgram Journal, Volume 2, Numbers 1-4 (January - December 2004) 39
Brought to you by AltGov2 [www.altgov2.org]
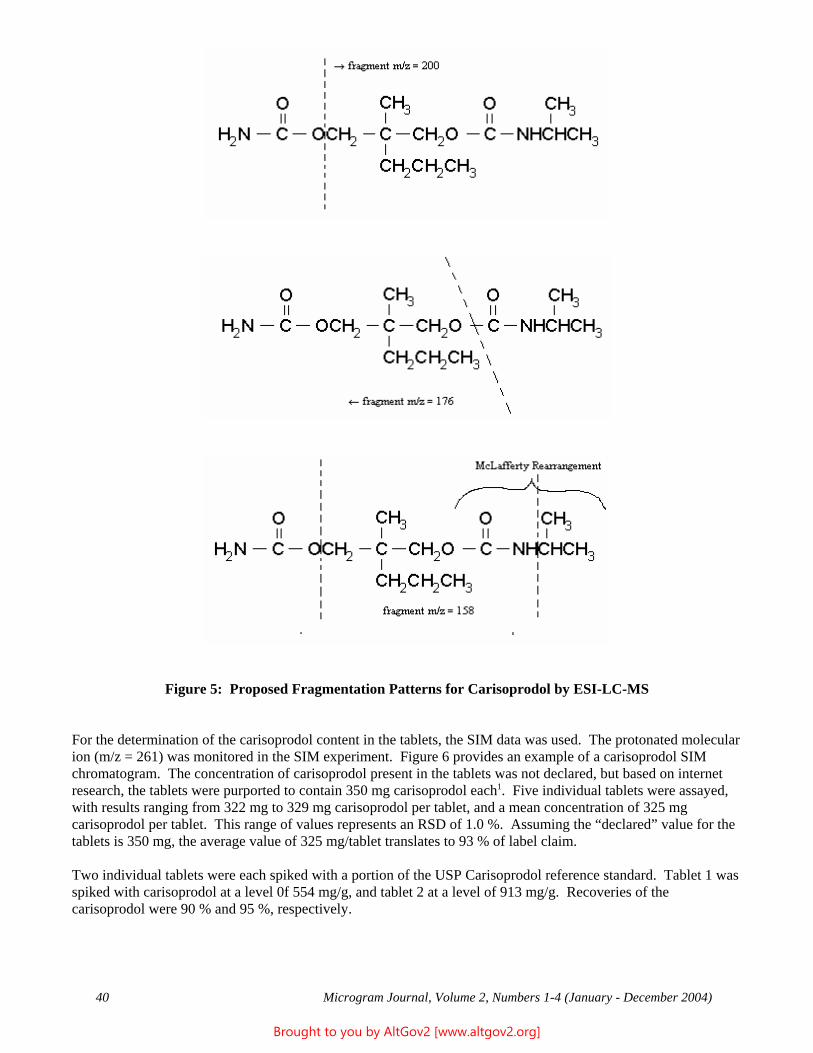
Figure 5: Proposed Fragmentation Patterns for Carisoprodol by ESI-LC-MS
For the determination of the carisoprodol content in the tablets, the SIM data was used. The protonated molecular ion (m/z = 261) was monitored in the SIM experiment. Figure 6 provides an example of a carisoprodol SIM chromatogram. The concentration of carisoprodol present in the tablets was not declared, but based on internet research, the tablets were purported to contain 350 mg carisoprodol each1. Five individual tablets were assayed, with results ranging from 322 mg to 329 mg carisoprodol per tablet, and a mean concentration of 325 mg carisoprodol per tablet. This range of values represents an RSD of 1.0 %. Assuming the “declared” value for the tablets is 350 mg, the average value of 325 mg/tablet translates to 93 % of label claim.
Two individual tablets were each spiked with a portion of the USP Carisoprodol reference standard. Tablet 1 was spiked with carisoprodol at a level 0f 554 mg/g, and tablet 2 at a level of 913 mg/g. Recoveries of the carisoprodol were 90 % and 95 %, respectively.
Microgram Journal, Volume 2, Numbers 1-4 (January - December 2004) 40
Brought to you by AltGov2 [www.altgov2.org]
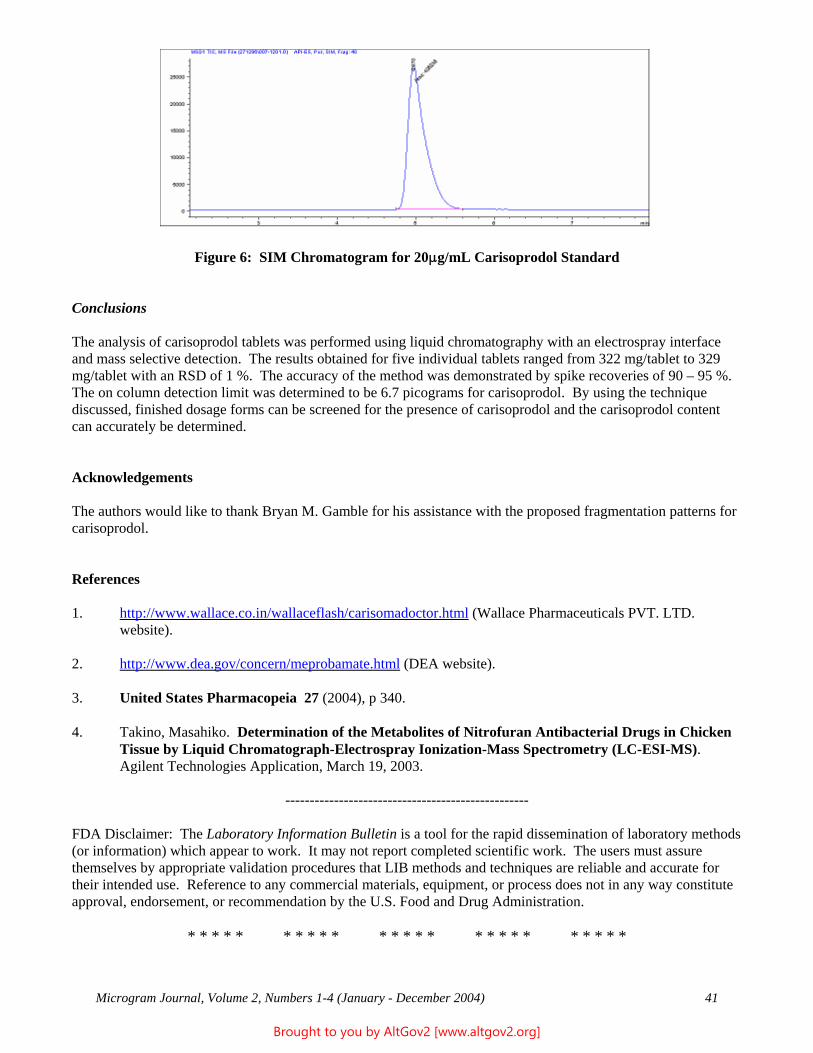
--------------------------------------------------
Figure 6: SIM Chromatogram for 20:g/mL Carisoprodol Standard
Conclusions
The analysis of carisoprodol tablets was performed using liquid chromatography with an electrospray interface and mass selective detection. The results obtained for five individual tablets ranged from 322 mg/tablet to 329 mg/tablet with an RSD of 1 %. The accuracy of the method was demonstrated by spike recoveries of 90 – 95 %. The on column detection limit was determined to be 6.7 picograms for carisoprodol. By using the technique discussed, finished dosage forms can be screened for the presence of carisoprodol and the carisoprodol content can accurately be determined.
Acknowledgements
The authors would like to thank Bryan M. Gamble for his assistance with the proposed fragmentation patterns for carisoprodol.
References
1. http://www.wallace.co.in/wallaceflash/carisomadoctor.html (Wallace Pharmaceuticals PVT. LTD. website).
2. http://www.dea.gov/concern/meprobamate.html (DEA website).
3. United States Pharmacopeia 27 (2004), p 340.
4. Takino, Masahiko. Determination of the Metabolites of Nitrofuran Antibacterial Drugs in Chicken Tissue by Liquid Chromatograph-Electrospray Ionization-Mass Spectrometry (LC-ESI-MS). Agilent Technologies Application, March 19, 2003.
FDA Disclaimer: The Laboratory Information Bulletin is a tool for the rapid dissemination of laboratory methods (or information) which appear to work. It may not report completed scientific work. The users must assure themselves by appropriate validation procedures that LIB methods and techniques are reliable and accurate for their intended use. Reference to any commercial materials, equipment, or process does not in any way constitute approval, endorsement, or recommendation by the U.S. Food and Drug Administration.
* * * * * * * * * * * * * * * * * * * * * * * * *
Microgram Journal, Volume 2, Numbers 1-4 (January - December 2004) 41
Brought to you by AltGov2 [www.altgov2.org]
INSTRUCTIONS FOR AUTHORS
General Information Microgram Journal is a scientific periodical that is published by the U.S. Drug Enforcement Administration’s Office of Forensic Sciences, and presents peer reviewed, full length Scientific Research Articles and Technical Notes on the detection and analyses of suspected controlled substances for forensic/law enforcement purposes.
Subscriptions to Microgram Journal Microgram Journal is unclassified, and is published on the DEA public access website (www.dea.gov). Private citizens should use the website to access Microgram Journal. Professional scientific and law enforcement personnel may either use the website or request a subscription. Subscriptions are available electronically and in hard copy. Electronic subscriptions require Internet access. The publications themselves will not be sent electronically to any subscriber; rather, an email notification of the pertinent URL will be sent to the subscriber when the respective issue is posted on the website (see additional information on email notifications, below). Requests for hard copies are strongly discouraged, and should be limited to those offices that do not have access to the Internet, require hard copies for their libraries, or have some other valid reason (Note: “For my personal collection” is not considered to be a valid reason). Requests for hard copies should indicate the number of copies required (maximum of two allowed per office), and should also include formal justification. Note that due to publication delays beyond the control of the Office of Forensic Sciences, hard copies will arrive from 30 to 180 days after electronic posting.
Requests to be added to the subscription list should be submitted via email to the Microgram Editor at: [email protected] If email submission is not possible, requests should be mailed to: Microgram Editor, Drug Enforcement Administration, Office of Forensic Sciences, 2401 Jefferson Davis Highway, Alexandria, VA 22301. All requests to be added to the Microgram mailing list should include the following Standard Contact Information:
* The Full Name and Mailing Address of Submitting Laboratory or Office;
* The Full Name, Title (Laboratory Director, Assistant Special Agent in Charge, Librarian, etc.), Phone Number, FAX Number, and Preferred email Address of the Submitting Individual (Note that subscriptions are mailed to titles, not names, in order to avoid subscription problems arising from future personnel changes);
* If available, the generic email address for the Submitting Laboratory or Office;
* If a generic email address is not available, one private email address for an individual who is likely to be a long-term employee, who has a stable email address, and who will be responsible for forwarding Microgram information to all of the other employees in the requestor’s Office (Note that only one email address per Office will be honored);
* If requesting hard copy mailings, the number of copies requested (two max), and justification.
Requests to be removed from the Microgram subscription list, or to change an existing subscription, should also be sent to the Microgram Editor. Such requests should included all of the pertinent standard contact information detailed above, and also should provide the email and/or hard mail address currently being utilized for the requestor’s subscription.
Note that, due to mailing delays and/or publication timeframes, subscription requests/changes may take as long as 90 days to implement.
Microgram Journal, Volume 2, Numbers 1-4 (January - December 2004) 42
Brought to you by AltGov2 [www.altgov2.org]
Email Notifications (Additional Comments) As noted above, electronic subscriptions are email based. The email provides a notification of the Microgram URL when a new issue is posted, and additional information as appropriate. Note that Microgram notices will NEVER include any attachments, or any hyperlink other than the Microgram URL. This is important, because the [email protected] address is routinely hijacked and used to send spam, very commonly including malicious attachments. For this reason, all subscribers are urged to have current Anti-Viral, Anti-Spyware, and Firewall programs in operation.
Costs Subscriptions to Microgram are free.
Submissions to Microgram Journal Manuscripts are accepted both from within and outside of DEA, and reviewers for the Journal are both internal (from within DEA) and external.
All submissions must be in English. All submissions should, whenever possible, be submitted electronically, as straight email or as an IBM® PC-compatible Corel WordPerfect® or Microsoft Word® attachment, to: [email protected] Current versions of Corel WordPerfect® or Microsoft Word® (defined as having release dates less than 5 years old) should be utilized. If electronic (email) submission is not possible, submissions may be mailed to: Microgram Editor, Drug Enforcement Administration, Office of Forensic Sciences, 2401 Jefferson Davis Highway, Alexandria, VA 22301. Hard-copy manuscripts should be submitted in triplicate, and should also be accompanied by an electronic version (written in either Corel WordPerfect® or Microsoft Word®) on a 3 ½ inch IBM® PC-compatible diskette, 100 or 250 MB Iomega® zip diskette, or an IBM® PC-compatible CD. Note that diskettes should be mailed in an irradiation-proof protective sleeve, and the mailing envelope should be marked: “Warning - Contains Electronic Media - Do Not Irradiate”. Hard-copy manuscripts should be printed in black ink using a laser or ink jet printer, double-spaced, on one side of 8 1/2" x 11" or A4 high quality white bond paper. A Times New Roman/12-point font is preferred for all submissions (electronic or hard copy). Each page, including illustrations, should have a one-inch (25 mm) margin on all sides. The pages should be numbered, but not stapled together.
Note that mailed submissions may be subject to lengthy handling delays beyond the control of the Office of Forensic Sciences, and electronic media sent through the mail may be destroyed en route by sanitizing procedures, despite protective measures and written warnings. All submissions should include the following Contact Information: The Full Name and Address of Submitting Laboratory or Office, and the Full Name, Phone Number, FAX Number, and Preferred email Address of the Submitting Individual.
Scientific Research Articles are formal, full length reports detailing original research in the detection and analysis of suspected controlled substances for forensic/law enforcement purposes, excluding in post-ingestion human/animal biological matrices (blood, urine, meconium, sweat, hair, etc.) Technical Notes are shorter communications concentrating on a specific drug (or drug class), unusual case, novel or unusual procedure or method, or minor original research. Each article/note should be a “stand-alone” work; serial publications will not be considered. Similarly, articles/notes which essentially duplicate existing literature will not be considered unless the presented data reflect significant advances in instrumentation made since the original publication(s) (however, see: Dual Publications, below). All submissions will be subjected to full peer review, and authors will be notified of the results of the review(s) within three months after the manuscript is received by the Office of Forensic Sciences.
The following guidelines should be used for all Articles (Technical Notes may follow an abbreviated version as appropriate):
Microgram Journal, Volume 2, Numbers 1-4 (January - December 2004) 43
Brought to you by AltGov2 [www.altgov2.org]
Cover Letter - Provide the standard contact information and pertinent correspondence (if any) for the Editor.
Title - Should be specific and amenable to indexing; they should not include acronyms or abbreviations except for very common instrumental technique acronyms (e.g., GC/MS or HPLC) and/or very common drug acronyms (e.g., MDMA or PCP). Titles should be sufficiently informative that the readership should not have to read the Abstract or the Introduction to understand the focus of the article. If the manuscript reflects work previously presented at a scientific meeting, a statement detailing that presentation should be included as a footnote to the Title.
Author(s)/Affiliation(s) - The author's full name (including middle initial(s)) and title, and the full name and address of the laboratory or office should immediately follow the title. The author’s degree level may be included if desired, but is not required (however, multiple authors should all include or all exclude this information). If there are several authors from two or more laboratories or offices, each set of authors should be listed separately, followed by their corresponding laboratory name and address (that is, Authors I, Laboratory I, Authors II, Laboratory II, etc.) Excessive authorship should be avoided. If there is more than one author, the primary author should be indicated with a superscripted asterisk. The name, phone numbers (Voice and FAX), preferred email address, and (if different from the laboratory or office address) the full mailing address of the contact person should be included on the title page.
Abstract - State the purpose, procedures, and principal findings of the paper, in 120 words or less. Avoid the use of abbreviations, and use only common acronyms as defined under “Titles”. Note that the abstract will be provided to Chemical Abstracts.
Keyword List - A minimum of five (maximum ten) abstracting keywords should be included.
Introduction - Briefly state the issue or problem. Detail existing practice in the topic area, and explain the shortcomings (if any) in what has been previously reported and/or what is being currently done in the field; that is, compare and contrast the selected methodology with previous and/or existing methods. Provide theoretical and practical background for novel or rarely utilized experimental or instrumental methods. Include pertinent references (avoid “Personal Communications”).
Experimental (Chemicals, Instrumentation, Procedures) - Detail the chemicals, instruments, and procedures utilized (including experimental parameters). However, USE CAUTION IN DETAILING SYNTHESES OF CONTROLLED OR ABUSED SUBSTANCES, especially novel syntheses to known controlled substances, or syntheses of novel substances that may be subject to abuse, that are not yet well known in the scientific and/or underground literature. [In such cases, a simple statement should be included to the effect that: “Experimental details on this synthesis are not provided, in accordance with Journal policy.”]
Results and Discussion - Present findings in a logical, easily followed sequence. Describe what was done, and where appropriate what conclusions can be drawn. Compare and contrast the findings with previous studies and/or current practice. Discuss any problems and/or unresolved issues.
Conclusions - Optional - Summarized results should be included only for complex articles. Conclusions should not merely duplicate the Abstract or a summary paragraph in the Results and Discussion section.
Acknowledgments - Should be brief, and include the full name, affiliation, and specific contribution made by each cited individual.
References - Articles and notes should have all textual citations collected in an endnotes list. Within the text, references should be consecutively numbered with superscripted Arabic numerals, or with Arabic numerals in parentheses, in accordance with their first appearance. Within the endnotes list, references should be consecutively numbered with Arabic numerals, as follows: Number, Period, Indent, Citation.
Microgram Journal, Volume 2, Numbers 1-4 (January - December 2004) 44
Brought to you by AltGov2 [www.altgov2.org]
Reference format should adhere to the Uniform Requirements for Manuscripts Submitted to Biomedical Journals (Note: This is the same reference format utilized in the Selected Reference Citations in Microgram Bulletin, and also (among many others) by the Journal of Forensic Sciences). Due to their inherently transitory nature, use of website URL’s as references are discouraged but permitted. As previously noted, Personal Communications should not be utilized; however, if unavoidable, utilize the following format: Full Name, Title, Affiliation (Laboratory or Office), Location (City and State, plus Nation if not the United States), Personal Communication, Year.
Table and Figures - All Tables and Figures should be appended onto the end of the article (not embedded in the text). Tables and Figures should be consecutively numbered with Arabic numerals, in accordance with their first citation in the text. Each Table and Figure should be “stand-alone”; that is, include sufficient descriptive information such that the reader will not have to refer back to the text to understand the Table or Figure. The Header should include the Table or Figure number and a concise title. Explanatory material, definitions of acronyms and/or abbreviations, and/or references within the Table or Figure should be designated by superscripted, lower case letters in alphabetical order, and included in dedicated footnotes at the bottom of the respective Table or Figure. Unless color is needed to enhance differentiation of the depicted material, all Tables and Figures should be in black and white (that is, avoid frivolous use of color for “artistic” purposes). Figures of spectra, chromatograms, charts, graphs, etc., should have clear and legibly labeled axes, but should not include instrument generated printoffs of experimental parameter lists.
Manuscripts submitted to Microgram Journal are required to be finished, professional quality efforts. Authors should ensure clarity, brevity, and pertinence of all information. Attention to detail in formatting, syntax, grammar, and spelling are as important as the accuracy of the facts presented. Authors are specially cautioned to conduct careful literature reviews prior to submission. At the Editor’s discretion, clearly substandard and/or inappropriate manuscripts will be returned to the authors without review.
Manuscripts will not be retyped, but “final” versions are subject to minor to moderate Editorial rewrite to improve presentation clarity or to reformat to current Microgram Journal style.
Dual publication - Re-publication of articles or notes of particular interest to the Microgram Journal readership will be considered if the article was originally published in a journal that is not easily accessed and the primary author has obtained explicit, written copyright exclusion from the original publisher and consent from all coauthors. Examples include exact English translations of articles or notes originally published in a non-English language journal, non-sensitive articles or notes originally published in a restricted journal or on a password protected website, or articles or notes originally published in limited distribution newsletters or proceedings. In general, any article or note that was published in English in a mainstream journal is not a candidate for republication in Microgram Journal. Authors interested in re-publishing previously published articles or notes in Microgram Journal should discuss the issue with the Microgram Editor before submitting.
Note that (in accordance with standard ethical guidelines) re-published articles should not be included as “new” articles in the respective author(s)’ Curriculum Vitae.
Costs - There are no costs (to the contributor) associated with publication in Microgram Journal.
Reprints - Microgram Journal does not provide reprints to authors. Microgram Journal may be photocopied as needed.
Questions may be directed to the Microgram Editor.
Microgram Journal, Volume 2, Numbers 1-4 (January - December 2004) 45
Brought to you by AltGov2 [www.altgov2.org]
U.S. Department of JusticeDrug Enforcement Administration
www.dea.gov
Microgram Journal
To Assist and Serve Scientists Concerned with the Detection and Analysis of Controlled Substances and Other Abused Substances for Forensic / Law Enforcement Purposes.
Published by: The Drug Enforcement Administration Office of Forensic Sciences Washington, DC 20537
The U.S. Attorney General has determined that the publication of this periodical is necessary in the transaction of the public business required by the Department of Justice. Information, instructions, and disclaimers are published in the first issue of each year.
Volume 3 Numbers 1-2 Posted On-Line At: January - June 2005 www.dea.gov/programs/forensicsci/microgram/index.html
Brought to you by AltGov2 [www.altgov2.org]
Contents
Characterization of the “Indanylamphetamines” 3 John F. Casale, Timothy D. McKibben, Joseph S. Bozenko, and Patrick A. Hays
Laboratory Analysis of the Conversion of Pseudoephedrine to Methamphetamine 11 from Over-the-Counter Products Robert P. Bianchi, Manoj N. Shah, David H. Rogers, and Thomas J. Mrazik
Spectral Characterization of 2,4-Dimethoxy-3-methylphenethylamine and Comparison 16 to 2,5-Dimethoxy-4-methylphenethylamine (“2C-D”) Russell A. Allred
Analytical Profile of Modafinil 27 Jeremiah A. Morris
Quantitation and Enantiomeric Determination of Propoxyphene Using Capillary 31 Zone Electrophoresis Clay P. Phelan
Identification and Quantitation of Hydromorphone Hydrochloride in Palladone® 39 (Extended Time-Release) Capsules Pamela R. Smith, Amanda K. Frohwein, Patrick A. Hays, and Ira S. Lurie
gamma-Hydroxybutyrate, Silver Salt (AgGHB): Identification of gamma-Hydroxy- 46 butyrate (GHB) via Conversion to the Silver Salt James V. DeFrancesco
Analytical Profiles for Five “Designer” Tryptamines 54 Trinette K. Spratley, Patrick A. Hays, Lois C. Geer, Sam D. Cooper,
and Timothy D. McKibben
Desloratadine: The Reaction Byproduct of the Reduction of Cold Tablets 69 Containing Loratadine with Hydriodic Acid/Red Phosphorus Shannon C. DiPari, Jason A. Bordelon, and Harry F. Skinner
Identification of Phenethylamines and Methylenedioxyamphetamines Using Liquid 78 Chromatography Atmospheric Pressure Electrospray Ionization Mass Spectrometry Adrian S. Krawczeniuk
Instructions for Authors
Note: In order to prevent automated theft of email addresses off the Internet postings of Microgram Journal, all email addresses reported in the Journal have had the “@” character replaced by “ -at- ”.
Cover Art: “Ball and Stick” Model of Ketamine (Courtesy of Patrick A. Hays, DEA Special Testing and Research Laboratory, Dulles, VA).
Microgram Journal, Volume 3, Numbers 1-2 (January - June 2005) 2
101
Brought to you by AltGov2 [www.altgov2.org]
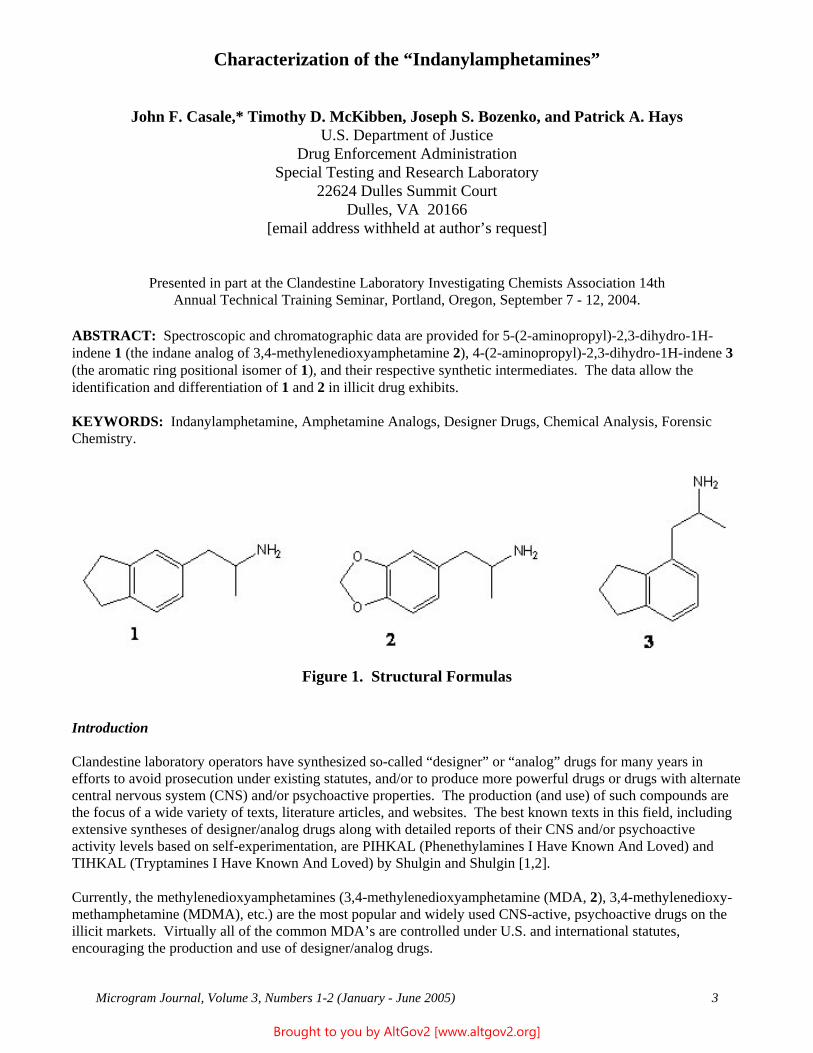
Characterization of the “Indanylamphetamines”
John F. Casale,* Timothy D. McKibben, Joseph S. Bozenko, and Patrick A. Hays U.S. Department of Justice
Drug Enforcement Administration Special Testing and Research Laboratory
22624 Dulles Summit Court Dulles, VA 20166
[email address withheld at author’s request]
Presented in part at the Clandestine Laboratory Investigating Chemists Association 14th Annual Technical Training Seminar, Portland, Oregon, September 7 - 12, 2004.
ABSTRACT: Spectroscopic and chromatographic data are provided for 5-(2-aminopropyl)-2,3-dihydro-1H-indene 1 (the indane analog of 3,4-methylenedioxyamphetamine 2), 4-(2-aminopropyl)-2,3-dihydro-1H-indene 3 (the aromatic ring positional isomer of 1), and their respective synthetic intermediates. The data allow the identification and differentiation of 1 and 2 in illicit drug exhibits.
KEYWORDS: Indanylamphetamine, Amphetamine Analogs, Designer Drugs, Chemical Analysis, Forensic Chemistry.
Figure 1. Structural Formulas
Introduction
Clandestine laboratory operators have synthesized so-called “designer” or “analog” drugs for many years in efforts to avoid prosecution under existing statutes, and/or to produce more powerful drugs or drugs with alternate central nervous system (CNS) and/or psychoactive properties. The production (and use) of such compounds are the focus of a wide variety of texts, literature articles, and websites. The best known texts in this field, including extensive syntheses of designer/analog drugs along with detailed reports of their CNS and/or psychoactive activity levels based on self-experimentation, are PIHKAL (Phenethylamines I Have Known And Loved) and TIHKAL (Tryptamines I Have Known And Loved) by Shulgin and Shulgin [1,2].
Currently, the methylenedioxyamphetamines (3,4-methylenedioxyamphetamine (MDA, 2), 3,4-methylenedioxy-methamphetamine (MDMA), etc.) are the most popular and widely used CNS-active, psychoactive drugs on the illicit markets. Virtually all of the common MDA’s are controlled under U.S. and international statutes, encouraging the production and use of designer/analog drugs.
Microgram Journal, Volume 3, Numbers 1-2 (January - June 2005) 3
Brought to you by AltGov2 [www.altgov2.org]
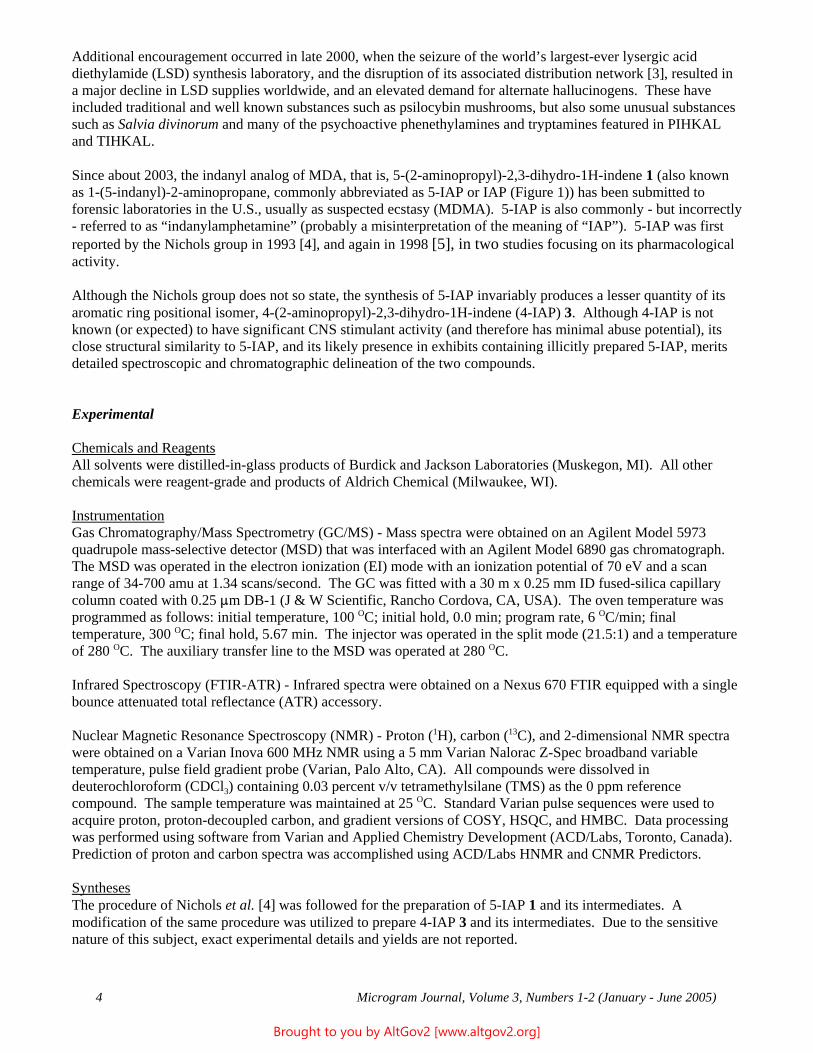
Additional encouragement occurred in late 2000, when the seizure of the world’s largest-ever lysergic acid diethylamide (LSD) synthesis laboratory, and the disruption of its associated distribution network [3], resulted in a major decline in LSD supplies worldwide, and an elevated demand for alternate hallucinogens. These have included traditional and well known substances such as psilocybin mushrooms, but also some unusual substances such as Salvia divinorum and many of the psychoactive phenethylamines and tryptamines featured in PIHKAL and TIHKAL.
Since about 2003, the indanyl analog of MDA, that is, 5-(2-aminopropyl)-2,3-dihydro-1H-indene 1 (also known as 1-(5-indanyl)-2-aminopropane, commonly abbreviated as 5-IAP or IAP (Figure 1)) has been submitted to forensic laboratories in the U.S., usually as suspected ecstasy (MDMA). 5-IAP is also commonly - but incorrectly - referred to as “indanylamphetamine” (probably a misinterpretation of the meaning of “IAP”). 5-IAP was first reported by the Nichols group in 1993 [4], and again in 1998 [5], in two studies focusing on its pharmacological activity.
Although the Nichols group does not so state, the synthesis of 5-IAP invariably produces a lesser quantity of its aromatic ring positional isomer, 4-(2-aminopropyl)-2,3-dihydro-1H-indene (4-IAP) 3. Although 4-IAP is not known (or expected) to have significant CNS stimulant activity (and therefore has minimal abuse potential), its close structural similarity to 5-IAP, and its likely presence in exhibits containing illicitly prepared 5-IAP, merits detailed spectroscopic and chromatographic delineation of the two compounds.
Experimental
Chemicals and Reagents All solvents were distilled-in-glass products of Burdick and Jackson Laboratories (Muskegon, MI). All other chemicals were reagent-grade and products of Aldrich Chemical (Milwaukee, WI).
Instrumentation Gas Chromatography/Mass Spectrometry (GC/MS) - Mass spectra were obtained on an Agilent Model 5973 quadrupole mass-selective detector (MSD) that was interfaced with an Agilent Model 6890 gas chromatograph. The MSD was operated in the electron ionization (EI) mode with an ionization potential of 70 eV and a scan range of 34-700 amu at 1.34 scans/second. The GC was fitted with a 30 m x 0.25 mm ID fused-silica capillary column coated with 0.25 :m DB-1 (J & W Scientific, Rancho Cordova, CA, USA). The oven temperature was programmed as follows: initial temperature, 100 OC; initial hold, 0.0 min; program rate, 6 OC/min; final temperature, 300 OC; final hold, 5.67 min. The injector was operated in the split mode (21.5:1) and a temperature of 280 OC. The auxiliary transfer line to the MSD was operated at 280 OC.
Infrared Spectroscopy (FTIR-ATR) - Infrared spectra were obtained on a Nexus 670 FTIR equipped with a single bounce attenuated total reflectance (ATR) accessory.
Nuclear Magnetic Resonance Spectroscopy (NMR) - Proton (1H), carbon (13C), and 2-dimensional NMR spectra were obtained on a Varian Inova 600 MHz NMR using a 5 mm Varian Nalorac Z-Spec broadband variable temperature, pulse field gradient probe (Varian, Palo Alto, CA). All compounds were dissolved in deuterochloroform (CDCl3) containing 0.03 percent v/v tetramethylsilane (TMS) as the 0 ppm reference compound. The sample temperature was maintained at 25 OC. Standard Varian pulse sequences were used to acquire proton, proton-decoupled carbon, and gradient versions of COSY, HSQC, and HMBC. Data processing was performed using software from Varian and Applied Chemistry Development (ACD/Labs, Toronto, Canada). Prediction of proton and carbon spectra was accomplished using ACD/Labs HNMR and CNMR Predictors.
Syntheses The procedure of Nichols et al. [4] was followed for the preparation of 5-IAP 1 and its intermediates. A modification of the same procedure was utilized to prepare 4-IAP 3 and its intermediates. Due to the sensitive nature of this subject, exact experimental details and yields are not reported.
Microgram Journal, Volume 3, Numbers 1-2 (January - June 2005) 4
Brought to you by AltGov2 [www.altgov2.org]
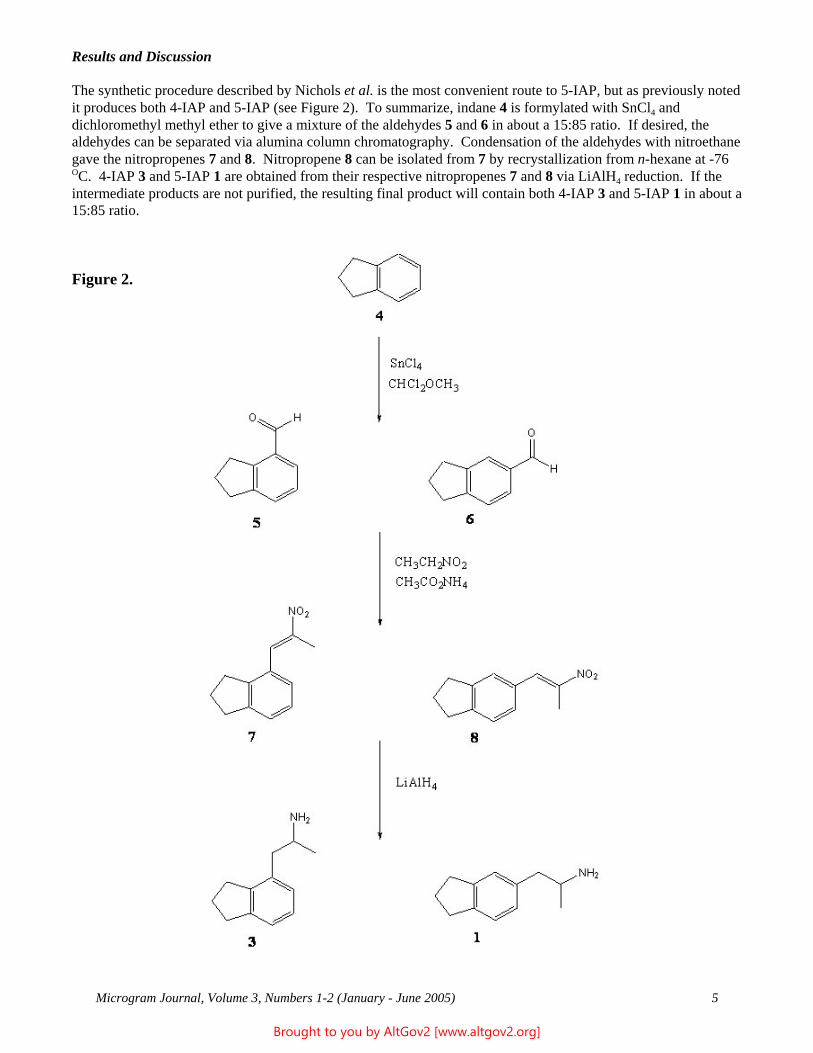
Results and Discussion
The synthetic procedure described by Nichols et al. is the most convenient route to 5-IAP, but as previously noted it produces both 4-IAP and 5-IAP (see Figure 2). To summarize, indane 4 is formylated with SnCl4 and dichloromethyl methyl ether to give a mixture of the aldehydes 5 and 6 in about a 15:85 ratio. If desired, the aldehydes can be separated via alumina column chromatography. Condensation of the aldehydes with nitroethane gave the nitropropenes 7 and 8. Nitropropene 8 can be isolated from 7 by recrystallization from n-hexane at -76 OC. 4-IAP 3 and 5-IAP 1 are obtained from their respective nitropropenes 7 and 8 via LiAlH4 reduction. If the intermediate products are not purified, the resulting final product will contain both 4-IAP 3 and 5-IAP 1 in about a 15:85 ratio.
Figure 2.
Microgram Journal, Volume 3, Numbers 1-2 (January - June 2005) 5
Brought to you by AltGov2 [www.altgov2.org]
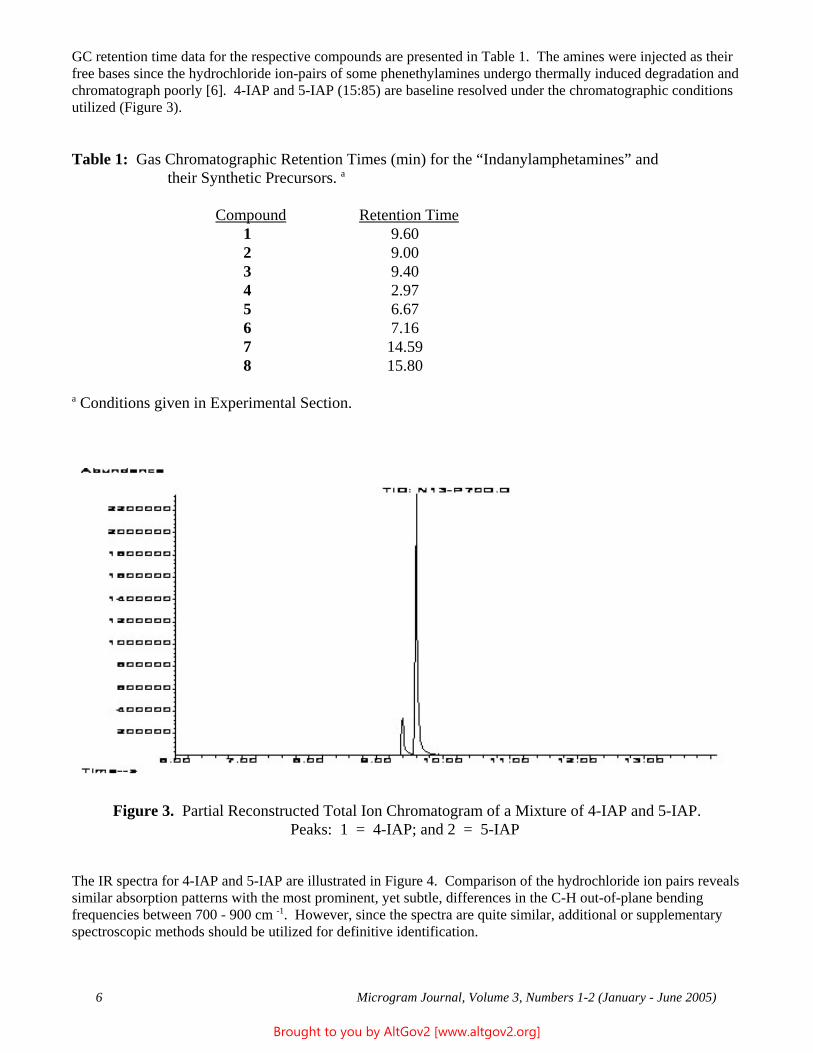
GC retention time data for the respective compounds are presented in Table 1. The amines were injected as their free bases since the hydrochloride ion-pairs of some phenethylamines undergo thermally induced degradation and chromatograph poorly [6]. 4-IAP and 5-IAP (15:85) are baseline resolved under the chromatographic conditions utilized (Figure 3).
Table 1: Gas Chromatographic Retention Times (min) for the “Indanylamphetamines” and their Synthetic Precursors. a
Compound Retention Time 1 9.60 2 9.00 3 9.40 4 2.97 5 6.67 6 7.16 7 14.59 8 15.80
a Conditions given in Experimental Section.
Figure 3. Partial Reconstructed Total Ion Chromatogram of a Mixture of 4-IAP and 5-IAP. Peaks: 1 = 4-IAP; and 2 = 5-IAP
The IR spectra for 4-IAP and 5-IAP are illustrated in Figure 4. Comparison of the hydrochloride ion pairs reveals similar absorption patterns with the most prominent, yet subtle, differences in the C-H out-of-plane bending frequencies between 700 - 900 cm -1. However, since the spectra are quite similar, additional or supplementary spectroscopic methods should be utilized for definitive identification.
Microgram Journal, Volume 3, Numbers 1-2 (January - June 2005) 6
Brought to you by AltGov2 [www.altgov2.org]
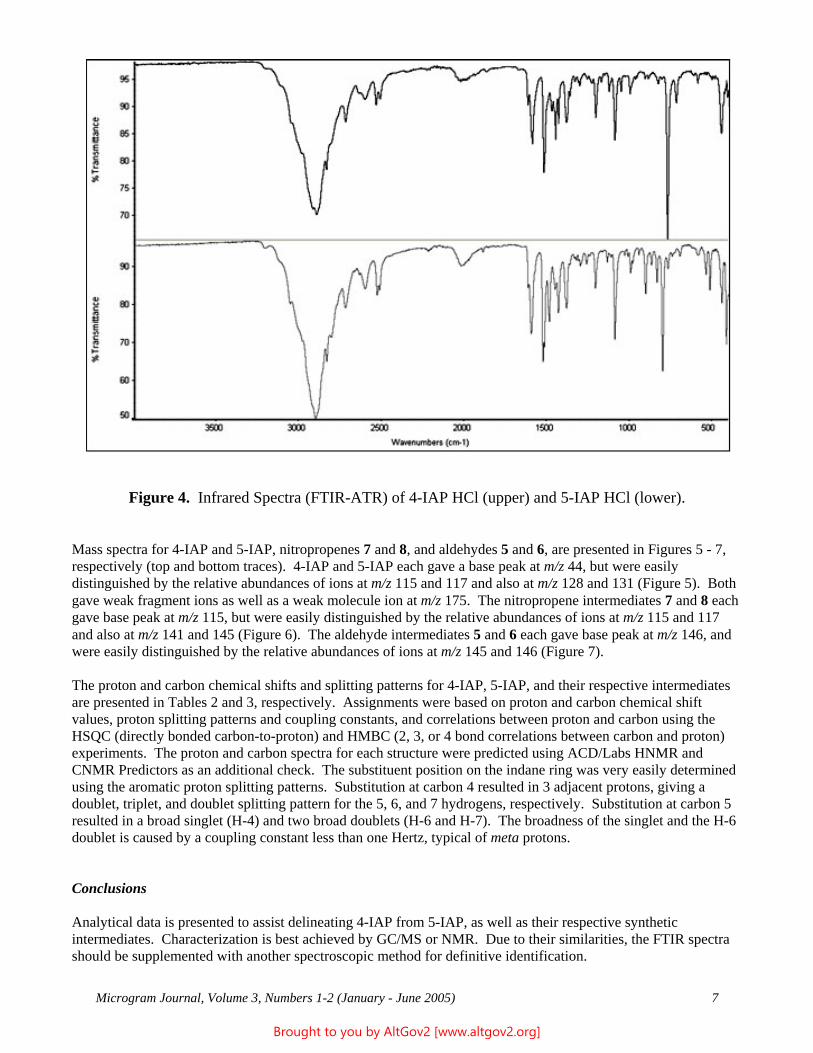
Figure 4. Infrared Spectra (FTIR-ATR) of 4-IAP HCl (upper) and 5-IAP HCl (lower).
Mass spectra for 4-IAP and 5-IAP, nitropropenes 7 and 8, and aldehydes 5 and 6, are presented in Figures 5 - 7, respectively (top and bottom traces). 4-IAP and 5-IAP each gave a base peak at m/z 44, but were easily distinguished by the relative abundances of ions at m/z 115 and 117 and also at m/z 128 and 131 (Figure 5). Both gave weak fragment ions as well as a weak molecule ion at m/z 175. The nitropropene intermediates 7 and 8 each gave base peak at m/z 115, but were easily distinguished by the relative abundances of ions at m/z 115 and 117 and also at m/z 141 and 145 (Figure 6). The aldehyde intermediates 5 and 6 each gave base peak at m/z 146, and were easily distinguished by the relative abundances of ions at m/z 145 and 146 (Figure 7).
The proton and carbon chemical shifts and splitting patterns for 4-IAP, 5-IAP, and their respective intermediates are presented in Tables 2 and 3, respectively. Assignments were based on proton and carbon chemical shift values, proton splitting patterns and coupling constants, and correlations between proton and carbon using the HSQC (directly bonded carbon-to-proton) and HMBC (2, 3, or 4 bond correlations between carbon and proton) experiments. The proton and carbon spectra for each structure were predicted using ACD/Labs HNMR and CNMR Predictors as an additional check. The substituent position on the indane ring was very easily determined using the aromatic proton splitting patterns. Substitution at carbon 4 resulted in 3 adjacent protons, giving a doublet, triplet, and doublet splitting pattern for the 5, 6, and 7 hydrogens, respectively. Substitution at carbon 5 resulted in a broad singlet (H-4) and two broad doublets (H-6 and H-7). The broadness of the singlet and the H-6 doublet is caused by a coupling constant less than one Hertz, typical of meta protons.
Conclusions
Analytical data is presented to assist delineating 4-IAP from 5-IAP, as well as their respective synthetic intermediates. Characterization is best achieved by GC/MS or NMR. Due to their similarities, the FTIR spectra should be supplemented with another spectroscopic method for definitive identification.
Microgram Journal, Volume 3, Numbers 1-2 (January - June 2005) 7
Brought to you by AltGov2 [www.altgov2.org]
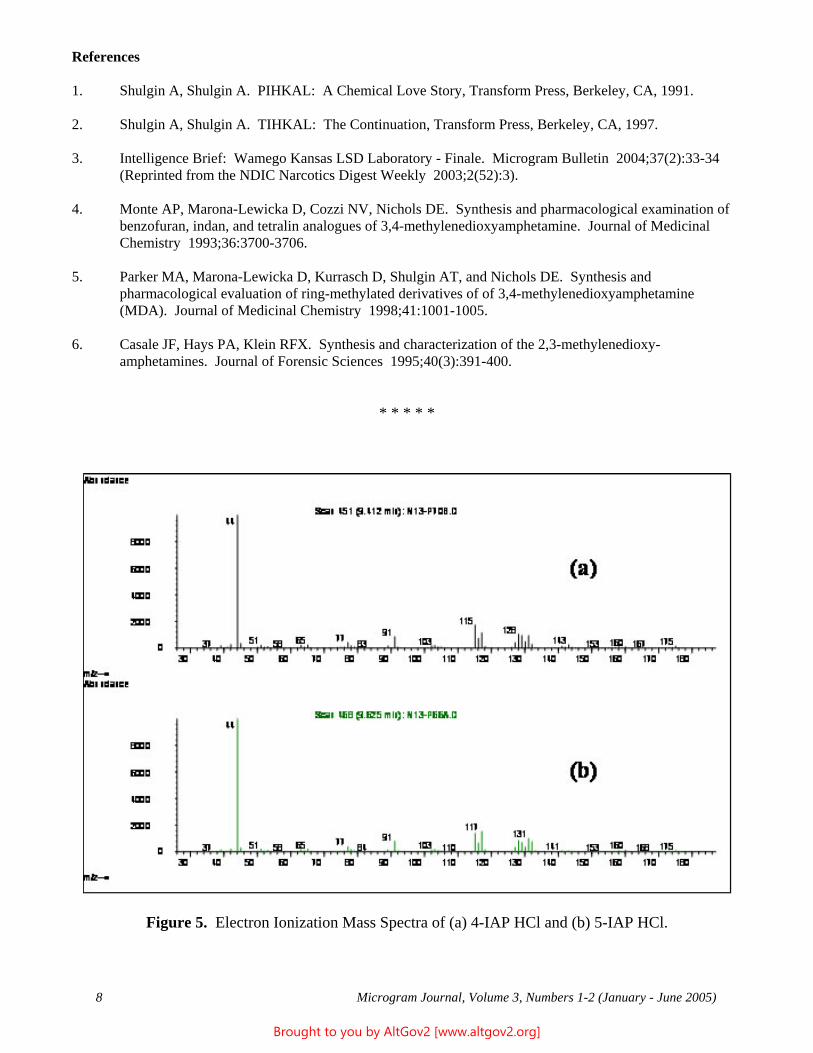
References
1. Shulgin A, Shulgin A. PIHKAL: A Chemical Love Story, Transform Press, Berkeley, CA, 1991.
2. Shulgin A, Shulgin A. TIHKAL: The Continuation, Transform Press, Berkeley, CA, 1997.
3. Intelligence Brief: Wamego Kansas LSD Laboratory - Finale. Microgram Bulletin 2004;37(2):33-34 (Reprinted from the NDIC Narcotics Digest Weekly 2003;2(52):3).
4. Monte AP, Marona-Lewicka D, Cozzi NV, Nichols DE. Synthesis and pharmacological examination of benzofuran, indan, and tetralin analogues of 3,4-methylenedioxyamphetamine. Journal of Medicinal Chemistry 1993;36:3700-3706.
5. Parker MA, Marona-Lewicka D, Kurrasch D, Shulgin AT, and Nichols DE. Synthesis and pharmacological evaluation of ring-methylated derivatives of of 3,4-methylenedioxyamphetamine (MDA). Journal of Medicinal Chemistry 1998;41:1001-1005.
6. Casale JF, Hays PA, Klein RFX. Synthesis and characterization of the 2,3-methylenedioxy-amphetamines. Journal of Forensic Sciences 1995;40(3):391-400.
* * * * *
Figure 5. Electron Ionization Mass Spectra of (a) 4-IAP HCl and (b) 5-IAP HCl.
Microgram Journal, Volume 3, Numbers 1-2 (January - June 2005) 8
Brought to you by AltGov2 [www.altgov2.org]
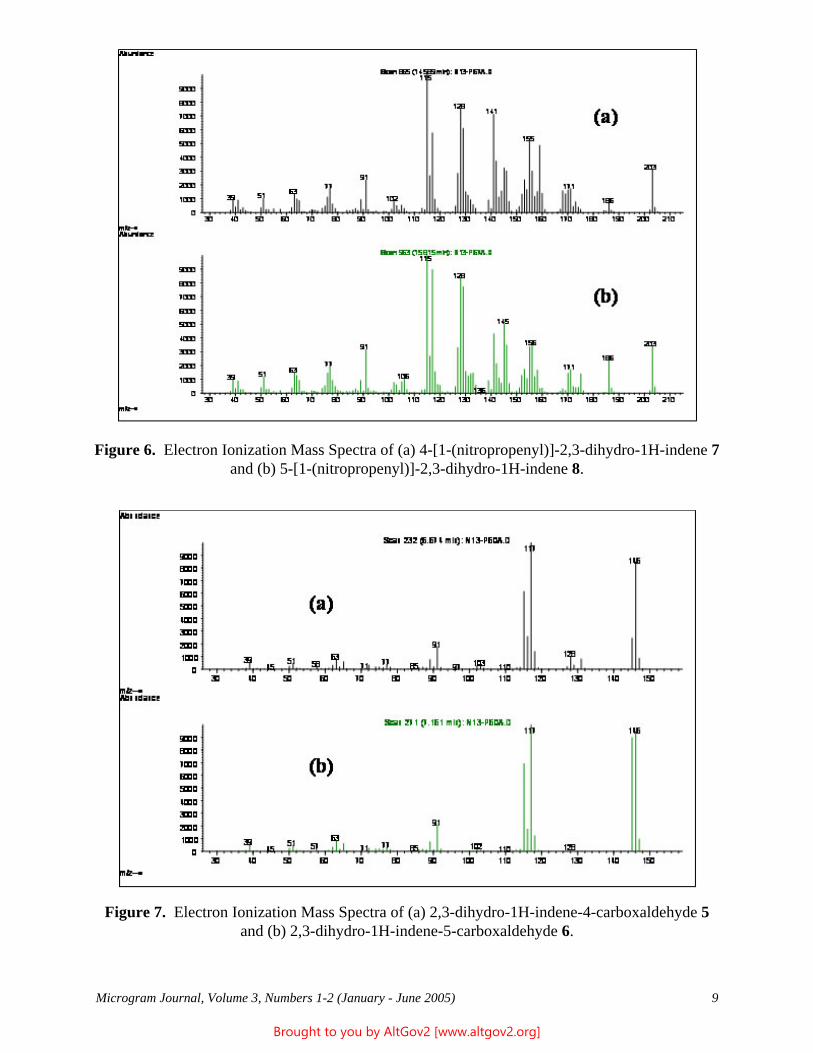
Figure 6. Electron Ionization Mass Spectra of (a) 4-[1-(nitropropenyl)]-2,3-dihydro-1H-indene 7 and (b) 5-[1-(nitropropenyl)]-2,3-dihydro-1H-indene 8.
Figure 7. Electron Ionization Mass Spectra of (a) 2,3-dihydro-1H-indene-4-carboxaldehyde 5 and (b) 2,3-dihydro-1H-indene-5-carboxaldehyde 6.
Microgram Journal, Volume 3, Numbers 1-2 (January - June 2005) 9
Brought to you by AltGov2 [www.altgov2.org]
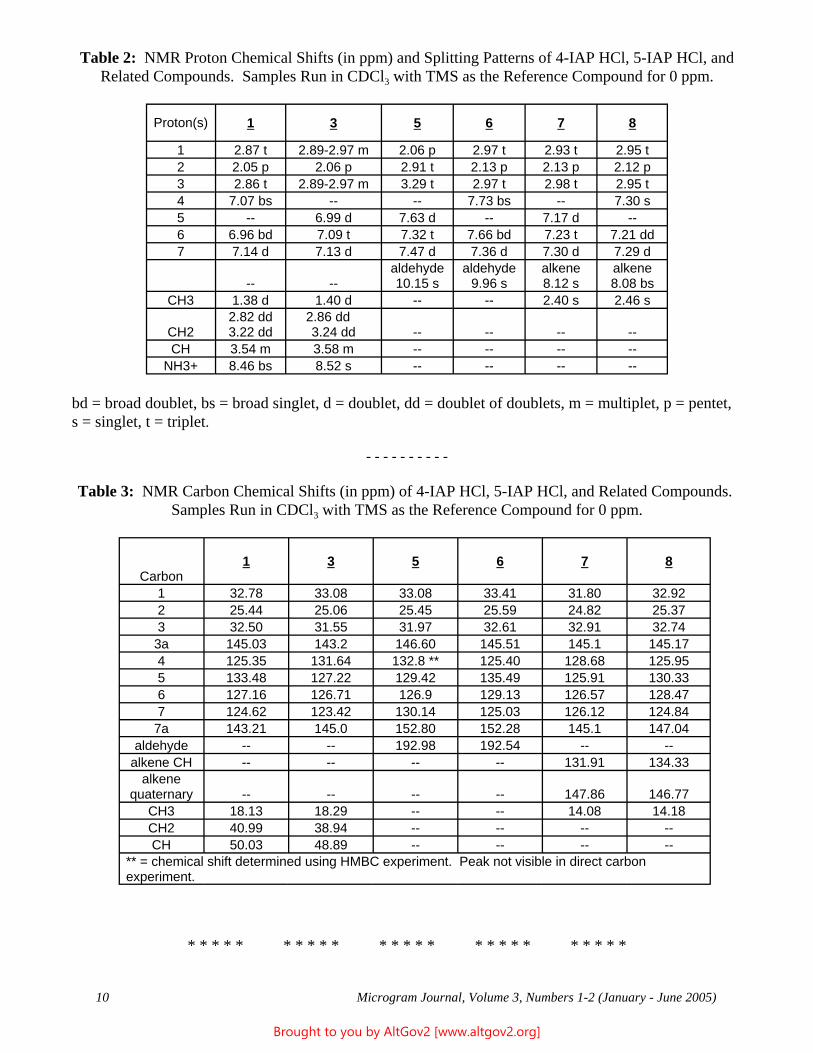
-- -- --
-- --
-- -- -- --
- - - - - - - - - -
-- -- -- ---- -- -- --
-- ---- -- -- ---- -- -- --
-- -- --
-- --
-- -- -- ---- -- -- --
-- -- -- --
Table 2: NMR Proton Chemical Shifts (in ppm) and Splitting Patterns of 4-IAP HCl, 5-IAP HCl, and Related Compounds. Samples Run in CDCl3 with TMS as the Reference Compound for 0 ppm.
Proton(s) 1 3 5 6 7 8
1 2.87 t 2.89-2.97 m 2.06 p 2.97 t 2.93 t 2.95 t 2 2.05 p 2.06 p 2.91 t 2.13 p 2.13 p 2.12 p 3 2.86 t 2.89-2.97 m 3.29 t 2.97 t 2.98 t 2.95 t 4 7.07 bs 7.73 bs 7.30 s 5 6.99 d 7.63 d 7.17 d 6 6.96 bd 7.09 t 7.32 t 7.66 bd 7.23 t 7.21 dd 7 7.14 d 7.13 d 7.47 d 7.36 d 7.30 d 7.29 d
aldehyde 10.15 s
aldehyde 9.96 s
alkene 8.12 s
alkene 8.08 bs
CH3 1.38 d 1.40 d 2.40 s 2.46 s
CH2 2.82 dd 3.22 dd
2.86 dd 3.24 dd
CH 3.54 m 3.58 m NH3+ 8.46 bs 8.52 s
bd = broad doublet, bs = broad singlet, d = doublet, dd = doublet of doublets, m = multiplet, p = pentet, s = singlet, t = triplet.
Table 3: NMR Carbon Chemical Shifts (in ppm) of 4-IAP HCl, 5-IAP HCl, and Related Compounds. Samples Run in CDCl3 with TMS as the Reference Compound for 0 ppm.
Carbon 1 3 5 6 7 8
1 32.78 33.08 33.08 33.41 31.80 32.92 2 25.44 25.06 25.45 25.59 24.82 25.37 3 32.50 31.55 31.97 32.61 32.91 32.74 3a 145.03 143.2 146.60 145.51 145.1 145.17 4 125.35 131.64 132.8 ** 125.40 128.68 125.95 5 133.48 127.22 129.42 135.49 125.91 130.33 6 127.16 126.71 126.9 129.13 126.57 128.47 7 124.62 123.42 130.14 125.03 126.12 124.84
7a 143.21 145.0 152.80 152.28 145.1 147.04 aldehyde 192.98 192.54
alkene CH 131.91 134.33 alkene
quaternary 147.86 146.77 CH3 18.13 18.29 14.08 14.18 CH2 40.99 38.94 CH 50.03 48.89
** = chemical shift determined using HMBC experiment. Peak not visible in direct carbon experiment.
* * * * * * * * * * * * * * * * * * * * * * * * *
Microgram Journal, Volume 3, Numbers 1-2 (January - June 2005) 10
Brought to you by AltGov2 [www.altgov2.org]
Laboratory Analysis of the Conversion of Pseudoephedrine to Methamphetamine From Over-the-Counter Products
Robert P. Bianchi, BS* Prescription Drug Research Center
Mason Enterprise Center 4031 University Drive, Suite 200
Fairfax, VA 22030 [email: RBconsulting700 -at- aol.com]
Manoj N. Shah, PhD, David H. Rogers, PhD, and Thomas J. Mrazik, PharmD Medical Information & Communications
McNeil Consumer & Specialty Pharmaceuticals 7050 Camp Hill Road
Fort Washington, Pennsylvania 19034
Presented in part at the American Pharmacists Association Annual Meeting, Orlando, Florida, April 1-5, 2005.
ABSTRACT: Two approaches to convert pseudoephedrine (PSE) to methamphetamine from over-the-counter (OTC) PSE products were examined. The first approach was two-step, and involved PSE extraction followed by conversion using the Birch method. Multiple-active products containing PSE and 2 - 4 actives were tested, including caplet, tablet, liquid, and liquid-filled softgel forms. The extent of conversion to methamphetamine varied among the extracts, and was up to 30.7 percent of the PSE present in the starting product. PSE extract conversion to methamphetamine was realized regardless of dosage form (i.e., whether solids, liquids, or liquid-filled softgels were used). The second approach involved direct conversion of PSE to methamphetamine using the Birch method. Materials tested included pure PSE powder, and also a combination of PSE plus an analgesic as either a powder mixture or as an OTC caplet. The extent of conversion to methamphetamine ranged from 54.1 to 67.7 percent of the PSE present in the starting material. These results provide scientific proof that PSE from solid and liquid OTC products can be converted to methamphetamine using either extraction or direct approaches (both employed by small clandestine laboratory operators). The ease and extent of PSE conversion from extracts appears to be independent of the PSE starting quantity, dosage forms, and presence of other actives.
KEYWORDS: Acetaminophen, Birch Method, Dextromethorphan, Extraction, Guaifenesin, Methamphetamine, Nazi Method, OTC PSE Products, Pseudoephedrine, Forensic Chemistry
Introduction
Methamphetamine abuse has reached widespread proportions in the United States, causing serious social, economic, and environmental problems for communities, and draining scarce law enforcement resources (1-4). Currently, thousands of small toxic laboratories (STLs) are seized annually throughout the country, especially in the Midwest and western states. With very few exceptions, these laboratories are not operated by professional chemists, but rather by “cooks” who have learned from other “cooks”, the Internet (5), or from underground publications (6). Production scales are typically one ounce or less, and are intended for personal use and/or limited distribution. It is estimated that approximately 35 percent of the methamphetamine used in the United States comes from small-scale laboratories (7).
At present, the most popular precursor used for the clandestine manufacture of methamphetamine is pseudoephedrine (PSE) contained in over-the-counter (OTC) sinus and cold preparations (8). The preferred
Microgram Journal, Volume 3, Numbers 1-2 (January - June 2005) 11
Brought to you by AltGov2 [www.altgov2.org]
starting material has been single-ingredient tablets (i.e., containing no other active ingredients). The PSE in these products are extracted with alcohol, filtered, and converted to methamphetamine via the Birch reduction method (Nazi method) or one of the red phosphorus methods (9,10). The first step in this study was therefore to determine the efficiency of extracting PSE from a variety of dosage forms, with subsequent conversion to methamphetamine using the Birch reduction method, which is currently the most popular among STL “cooks.” The second approach was to directly convert PSE or PSE-containing OTC products to methamphetamine, without the preliminary extraction step, again using the Birch reduction method.
Experimental
The described experiments were conducted by National Medical Services, Willow Grove, Pennsylvania, an independent forensic laboratory accredited by the American Society of Crime Laboratory Directors – Laboratory Accreditation Board (ASCLD-LAB).
Pseudoephedrine Extraction Followed by Birch Method Conversion A simple extraction process was performed on three multiple-active ingredient OTC products, each of which contained PSE, the pain reliever acetaminophen, and up to two other active ingredients (Table 1). The process involved grinding the tablets or caplets (modified for liquid-filled softgels), dissolving the resulting powder or liquid in denatured ethanol, filtering to isolate the solution, evaporating it to a small volume, adding acetone to precipitate the PSE, and collecting the precipitate by filtration. The procedure was conducted on a large scale (equivalent to 7.5 grams of PSE (i.e., 250 tablets/caplets or 100 liquid-filled softgels)) to simulate a typical small-scale illicit methamphetamine synthesis. The recovered PSE was directly submitted to the Birch reduction method. The method involves dissolution of the PSE in anhydrous ammonia, and then adding lithium metal (9). Quantitative analysis of the recovered PSE (and other active ingredients) from the first step, and of the methamphetamine and unreacted PSE from the second step, were performed using liquid chromatography/tandem mass spectrometry (LC/MS/MS).
Because illicit laboratories are known to employ additional extraction techniques (in addition to the method described above), five multiple-active OTC products, each of which contained PSE, acetaminophen, and up to 2 additional active ingredients (Table 1), were submitted to a more complex extraction process. This latter procedure involved dissolution of the sample in dilute hydrochloric acid, washing with a naphtha-based organic solvent to remove polymers, waxes, and other inert ingredients, alkalinization to form PSE base, two extractions with toluene to isolate the PSE base, and then conversion of the PSE base back to the HCl salt. The complex extraction was also conducted on a 7.5 gram PSE scale (250 caplets, 100 softgels, or 600 mL of liquid). quantitative analysis of the extracts and synthesized methamphetamine was again conducted by LC/MS/MS.
Direct Birch Method Conversion Pure PSE powder, a mixture of PSE and acetaminophen powder, and ground caplets containing PSE and acetaminophen were directly subjected to the Birch reduction method, and the resulting products were subjected to quantitative analysis by LC/MS/MS. The quantity of PSE in each of the starting materials was 0.2 grams, 0.2 grams, and 0.18 grams, respectively.
Results and Discussion
Pseudoephedrine Extraction Followed by Birch Method Reduction The results demonstrated PSE conversion to methamphetamine from all of the PSE precipitates subjected to the Birch method reduction (Table 2). The percentage of PSE in the starting OTC product that was converted to methamphetamine ranged from 0.3 to 30.7 percent. The conversion efficiency was comparable for PSE solid forms (ranging from 3.0 to 100 percent of the PSE in the extract being converted to methamphetamine) and PSE liquid forms (ranging from 37.5 to 100 percent of PSE in the extract being converted to methamphetamine). The starting quantity of PSE and the presence of other ingredients did not appear to affect the extent of conversion.
Microgram Journal, Volume 3, Numbers 1-2 (January - June 2005) 12
Brought to you by AltGov2 [www.altgov2.org]
Direct Birch Method Conversion Direct conversion of pure PSE powder was performed as a baseline reference. A second, powdered mixture of PSE (0.2 g) and acetaminophen (1.0 g) was used to assess the potential for interference from acetaminophen in the conversion process (since many of the OTC medications contain a high proportion of acetaminophen). A third experiment using an OTC tablet product containing PSE and acetaminophen was used to further verify the potential of direct conversion (6 tablets containing 0.18 g PSE and 3.0 g acetaminophen were ground using a mortar and pestle). The results confirmed PSE conversion to methamphetamine from all PSE forms, with 54.1 to 67.7 percent conversion of PSE to methamphetamine (Table 2). The results for PSE plus acetaminophen (i.e., powder and caplet) were comparable to those of PSE powder alone. Based on the results from the PSE extraction, it would be expected that direct conversion would also succeed for liquid and soft-gel forms.
Conclusions
The results of this study demonstrated that OTC sinus and cold preparations containing PSE can be converted to methamphetamine either directly or following a PSE extraction procedure, from both single- and multiple-active ingredient formulations. This study provides scientific proof that virtually any OTC product containing PSE can be used to manufacture methamphetamine (11,12). That is, the potential for methamphetamine production from PSE-containing OTC products is independent of dosage form (solid, liquid, or liquid-filled softgel), presence of actives, and formulation variations.
Acknowledgements
The authors thank Dr. Kevin Ballard, MD, PhD, and David Easterling, MS, National Medical Services, Willow Grove, Pennsylvania, for performing the extractions, methamphetamine synthesis, and chemical analyses for these experiments.
[Funding support: This study was funded by McNeil Consumer & Specialty Pharmaceuticals.]
References
1. U.S. Drug Enforcement Administration (DEA). DEA briefs and background. Drug trafficking in the United States. At http://www.dea.gov/concern/drug_trafficking.html. Accessed July 22, 2005.
2. U.S. Department of Justice, Office of Community Oriented Policing Services. Problem-oriented guides for police series guide No. 16. Clandestine drug labs. March 2002. At http://www.cops.usdoj.gov/mime/open.pdf?Item=274. Accessed July 22, 2005.
3. Methamphetamine – National Drug Threat Assessment. February 2005. National Drug Intelligence Center. At http://www.usdoj.gov/ndic/pubs11/13745/meth.htm. Accessed July 22, 2005.
4. Centers for Disease Control and Prevention. Acute public health consequences of methamphetamine laboratories - 16 states, January 2000 - June 2004. Morbidity and Mortality Weekly Report 2005;54(14):356-359.
5. Wax PM. Just a click away: Recreational drug websites on the Internet. Pediatrics 2002;109(6):e96.
6. Uncle Fester. Secrets of Methamphetamine Manufacture, 6th Edition. Loompanics Unlimited. Port Townsend, WA. 2002.
7. Interim report from the Interagency Working Group on Synthetic Drugs to the Director of National Drug Control Policy, Attorney General, Secretary for Health and Human Services. May 23, 2005. At
Microgram Journal, Volume 3, Numbers 1-2 (January - June 2005) 13
Brought to you by AltGov2 [www.altgov2.org]
http://www.whitehousedrugpolicy.gov/publications/pdf/interim_rpt.pdf#search='methamphetamine%20pr ecursor%20chemical%20control%20may%2023,%202005'. Accessed July 22, 2005.
8. U.S. Drug Enforcement Administration (DEA). DEA resources for law enforcement, intelligence briefs. January 2002. Chemical diversion and synthetic drug manufacture. At http://www.dea.gov/pubs/intel/intel010621.html. Accessed July 22, 2005.
9. Schucker D. Nazi labs. AONE Journal At http://www.okienarc.org/nazilab.htm. Accessed July 22, 2005.
10. Short K. Red phosphorus methamphetamine labs. AONE Journal At www.okienarc.org/RedPlabs.htm. Accessed July 22, 2005.
11. Bremer N, Woolery RJ. The yield of methamphetamine, unreacted precursor and Birch by-product with the lithium-ammonia reduction method as employed in clandestine laboratories. Newsletter of Midwestern Association of Forensic Scientists 1999; Fall:8-16.
12. Northrop DM, Knops LA and Person EC. Methamphetamine manufacture from cold and allergy medications containing pseudoephedrine in multi-ingredient liquid and softgel preparations. Journal of the Clandestine Laboratory Investigating Chemists Association 2005;15(2):11-19.
* * * * *
Table 1. Active Ingredients Per Dosage Unit Included in Tested OTC PSE Products.
Product Dosage Decongestant Analgesic Antihistamine Antitussive Expectorant Identifier Form (mg) (mg) (mg) (mg) (mg)
PSE Simple Extraction Followed by Birch Method Conversion 1 Caplet PSE APAP - -
(30) (500) 2 Tablet PSE APAP - - GUA
(30) (325) 3 Liquid PSE APAP
Filled (30) (250) Softgel
(200)- DXM GUA
(10) (100)
PSE Complex Extraction Followed by Birch Method Conversion 1 Caplet PSE APAP - -
(30) (500) 4 Caplet PSE APAP CLR -
(30) (500) (2) 5 Caplet PSE APAP - DXM GUA
(30) (325) 3 Liquid PSE APAP
Filled (30) (250) Softgel
6 Liquid PSE APAP
(15) (200)- DXM GUA
(10) (100)
DOX DXM (30) (500) (6.25) (15)
APAP - Acetaminophen; CLR - Chlorpheniramine; DOX - Doxylamine; DXM - Dextromethorphan; GUA - Guaifenesin; OTC - Over-the-Counter; PSE - Pseudoephedrine.
Microgram Journal, Volume 3, Numbers 1-2 (January - June 2005) 14
Brought to you by AltGov2 [www.altgov2.org]
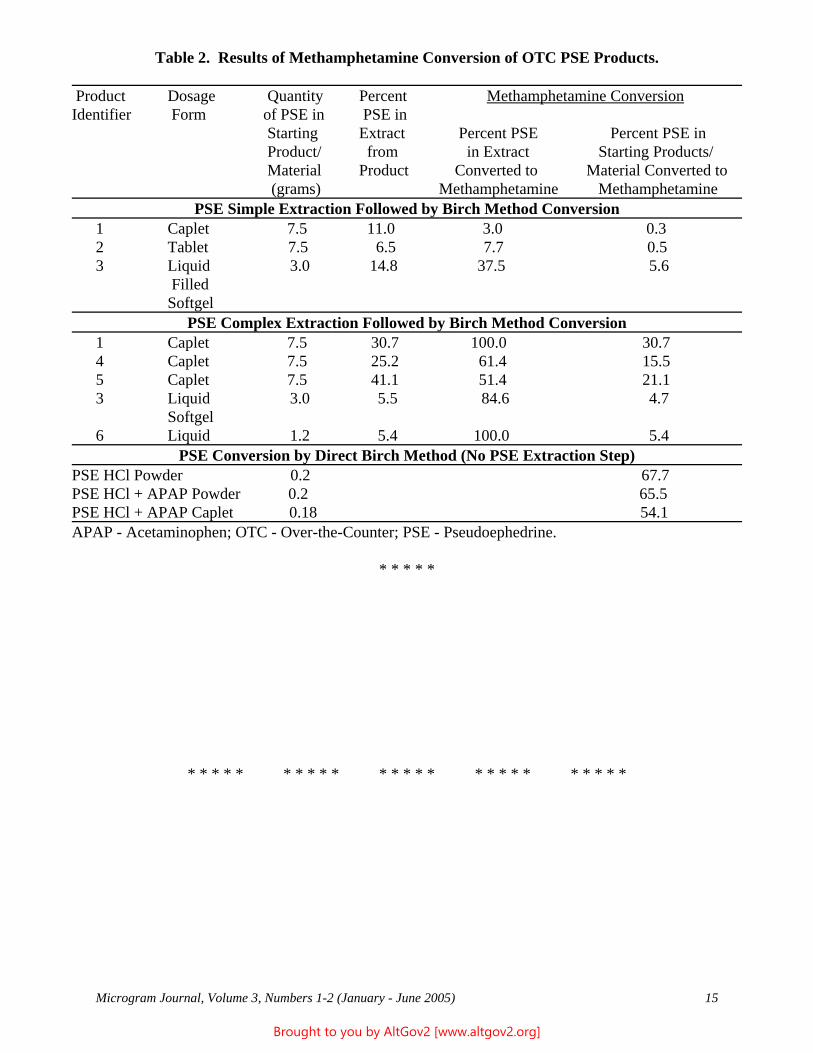
Table 2. Results of Methamphetamine Conversion of OTC PSE Products.
Product Dosage Quantity Percent Methamphetamine Conversion Identifier Form of PSE in PSE in
Starting Extract Percent PSE Percent PSE in Product/ from in Extract Starting Products/ Material Product Converted to Material Converted to
(grams) Methamphetamine Methamphetamine PSE Simple Extraction Followed by Birch Method Conversion
1 Caplet 7.5 11.0 3.0 0.3 2 Tablet 7.5 6.5 7.7 0.5 3 Liquid 3.0 14.8 37.5 5.6
Filled Softgel
PSE Complex Extraction Followed by Birch Method Conversion 1 Caplet 7.5 4 Caplet 7.5 5 Caplet 7.5 3 Liquid 3.0
Softgel 6 Liquid 1.2
30.7 100.0 30.725.2 61.4 15.541.1 51.4 21.15.5 84.6 4.7
5.4 100.0 5.4 PSE Conversion by Direct Birch Method (No PSE Extraction Step)
PSE HCl Powder 0.2 67.7 PSE HCl + APAP Powder 0.2 65.5 PSE HCl + APAP Caplet 0.18 54.1 APAP - Acetaminophen; OTC - Over-the-Counter; PSE - Pseudoephedrine.
* * * * *
* * * * * * * * * * * * * * * * * * * * * * * * *
Microgram Journal, Volume 3, Numbers 1-2 (January - June 2005) 15
Brought to you by AltGov2 [www.altgov2.org]
Spectral Characterization of 2,4-Dimethoxy-3-methylphenethylamine, and Comparison to 2,5-Dimethoxy-4-methylphenethylamine (“2C-D”)
Russell A. Allred, Ph.D. U.S. Department of Justice
Southeast Laboratory 5205 N.W. 84th Ave.
Miami, FL 33166 [email: russell.a.allred -at- usdoj.gov]
ABSTRACT: Synthesis and analytical data for 2,4-dimethoxy-3-methylphenethylamine (2) and its hydrochloride salt (3) are described. 2 was synthesized from 2,4-dimethoxy-3-methylbenzaldehyde via trans-2,4-dimethoxy-3-methyl-$-nitrostyrene (1). The compounds were characterized by 1H NMR, 13C NMR, GC/MS, and FTIR. The data was compared to 2,5-dimethoxy-4-methylphenethylamine (2C-D).
KEYWORDS: Designer Drugs, Dimethoxyphenethylamines, Synthesis, Isomescaline, 2C-D, Desoxy, TIM, Forensic Chemistry
Introduction
A large number of phenethylamines derivatives are known, many of which have been reported to have CNS-stimulant and/or psychoactive properties.1 As a result, many phenethylamines compounds are listed as controlled substances. Notably, for each of these controlled substances are various possible isomers differing only in the positioning of the phenyl substituents. These positional isomers and analogues are (with few exceptions) not formally controlled; however, they may be prosecuted under the Analogue Statute of the Controlled Substances Act.
Examples of positional isomers that have circulated in the chemical underground are 2,5-dimethoxy-4-methylphenethylamine HCl (also known as “2C-D”) and 3,5-dimethoxy-4-methylphenethylamine HCl (also known as “DESOXY”).1 Recently, an exhibit containing 2C-D was received at this laboratory. Interestingly, the 1H NMR spectrum of 2C-D displays two singlets in the aromatic region that could potentially be confused for a doublet, albeit with a suspiciously large vicinal coupling constant (10 Hz). Trisubstituted phenethylamines may only form vicinally-derived doublets in the aromatic region if the phenyl substituents are arranged such that the two aromatic protons are alpha to each other.
An example of an isomer of 2C-D having adjacent phenyl protons is 2,4-dimethoxy-3-methylphenethylamine HCl (3).2 While NMR spectral differences between 3 and 2C-D can be predicted, it was preferable to demonstrate these differences from actual data.
The synthesis of 2,4-dimethoxy-3-methyl-$-nitrostyrene (1), 2,4-dimethoxy-3-methylphenethylamine (2), and 3 was originally reported by Merchant, et al.2 and is provided herein along with new spectroscopic data (Scheme 1). In addition, the analytical results are compared to those of the recently received 2C-D exhibit.
Experimental
Reagents: All reagents and solvents were obtained from commercial sources and unless otherwise noted were used as received. Tetrahydrofuran was dried with Na/benzophenone and distilled under nitrogen prior to use.
Microgram Journal, Volume 3, Numbers 1-2 (January - June 2005) 16
Brought to you by AltGov2 [www.altgov2.org]
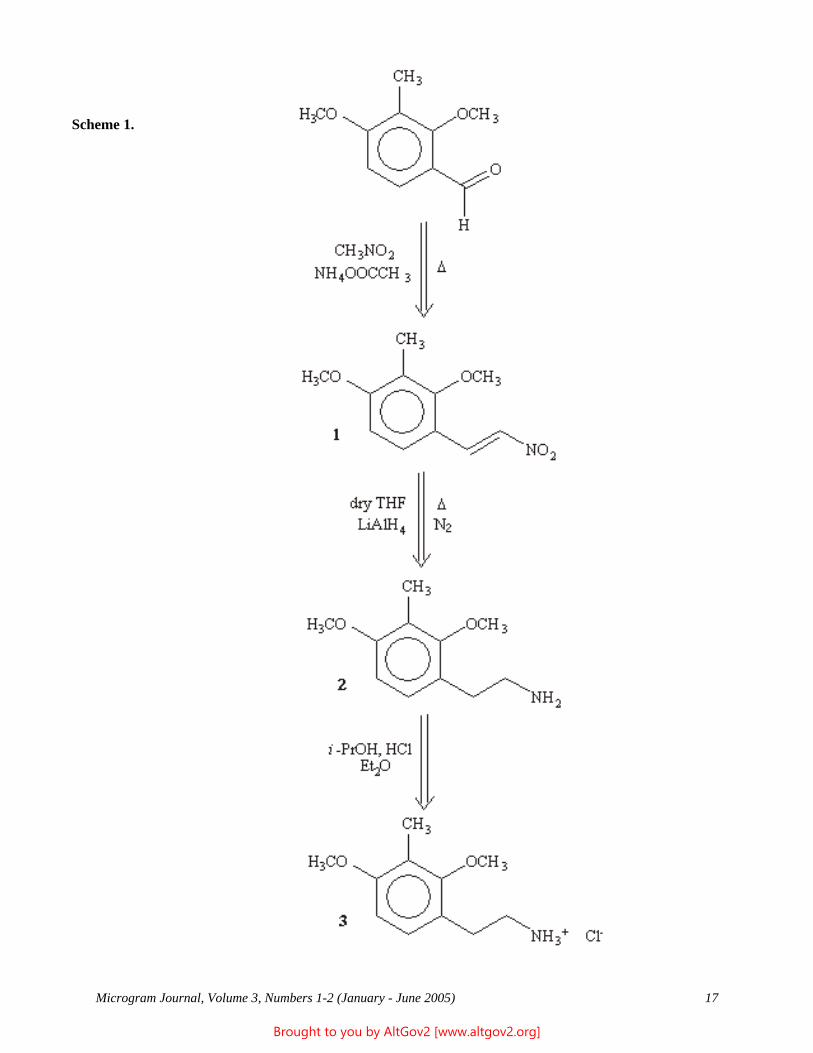
Scheme 1.
Microgram Journal, Volume 3, Numbers 1-2 (January - June 2005) 17
Brought to you by AltGov2 [www.altgov2.org]
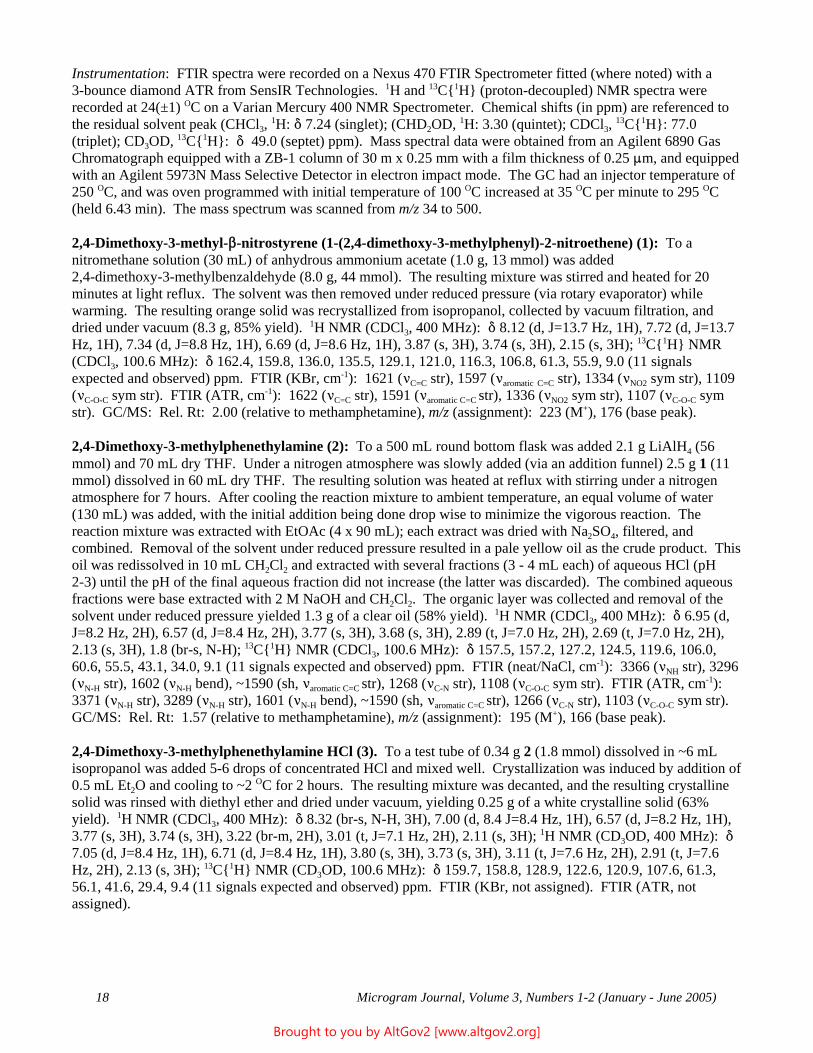
Instrumentation: FTIR spectra were recorded on a Nexus 470 FTIR Spectrometer fitted (where noted) with a 3-bounce diamond ATR from SensIR Technologies. 1H and 13C{1H} (proton-decoupled) NMR spectra were recorded at 24(±1) OC on a Varian Mercury 400 NMR Spectrometer. Chemical shifts (in ppm) are referenced to the residual solvent peak (CHCl3, 1H: * 7.24 (singlet); (CHD2OD, 1H: 3.30 (quintet); CDCl3, 13C{1H}: 77.0 (triplet); CD3OD, 13C{1H}: * 49.0 (septet) ppm). Mass spectral data were obtained from an Agilent 6890 Gas Chromatograph equipped with a ZB-1 column of 30 m x 0.25 mm with a film thickness of 0.25 :m, and equipped with an Agilent 5973N Mass Selective Detector in electron impact mode. The GC had an injector temperature of 250 OC, and was oven programmed with initial temperature of 100 OC increased at 35 OC per minute to 295 OC (held 6.43 min). The mass spectrum was scanned from m/z 34 to 500.
2,4-Dimethoxy-3-methyl-$-nitrostyrene (1-(2,4-dimethoxy-3-methylphenyl)-2-nitroethene) (1): To a nitromethane solution (30 mL) of anhydrous ammonium acetate (1.0 g, 13 mmol) was added 2,4-dimethoxy-3-methylbenzaldehyde (8.0 g, 44 mmol). The resulting mixture was stirred and heated for 20 minutes at light reflux. The solvent was then removed under reduced pressure (via rotary evaporator) while warming. The resulting orange solid was recrystallized from isopropanol, collected by vacuum filtration, and dried under vacuum (8.3 g, 85% yield). 1H NMR (CDCl3, 400 MHz): * 8.12 (d, J=13.7 Hz, 1H), 7.72 (d, J=13.7 Hz, 1H), 7.34 (d, J=8.8 Hz, 1H), 6.69 (d, J=8.6 Hz, 1H), 3.87 (s, 3H), 3.74 (s, 3H), 2.15 (s, 3H); 13C{1H} NMR (CDCl3, 100.6 MHz): * 162.4, 159.8, 136.0, 135.5, 129.1, 121.0, 116.3, 106.8, 61.3, 55.9, 9.0 (11 signals expected and observed) ppm. FTIR (KBr, cm-1): 1621 (<C=C str), 1597 (<aromatic C=C str), 1334 (<NO2 sym str), 1109 (<C-O-C sym str). FTIR (ATR, cm-1): 1622 (<C=C str), 1591 (<aromatic C=C str), 1336 (<NO2 sym str), 1107 (<C-O-C sym str). GC/MS: Rel. Rt: 2.00 (relative to methamphetamine), m/z (assignment): 223 (M+), 176 (base peak).
2,4-Dimethoxy-3-methylphenethylamine (2): To a 500 mL round bottom flask was added 2.1 g LiAlH4 (56 mmol) and 70 mL dry THF. Under a nitrogen atmosphere was slowly added (via an addition funnel) 2.5 g 1 (11 mmol) dissolved in 60 mL dry THF. The resulting solution was heated at reflux with stirring under a nitrogen atmosphere for 7 hours. After cooling the reaction mixture to ambient temperature, an equal volume of water (130 mL) was added, with the initial addition being done drop wise to minimize the vigorous reaction. The reaction mixture was extracted with EtOAc (4 x 90 mL); each extract was dried with Na2SO4, filtered, and combined. Removal of the solvent under reduced pressure resulted in a pale yellow oil as the crude product. This oil was redissolved in 10 mL CH2Cl2 and extracted with several fractions (3 - 4 mL each) of aqueous HCl (pH 2-3) until the pH of the final aqueous fraction did not increase (the latter was discarded). The combined aqueous fractions were base extracted with 2 M NaOH and CH2Cl2. The organic layer was collected and removal of the solvent under reduced pressure yielded 1.3 g of a clear oil (58% yield). 1H NMR (CDCl3, 400 MHz): * 6.95 (d, J=8.2 Hz, 2H), 6.57 (d, J=8.4 Hz, 2H), 3.77 (s, 3H), 3.68 (s, 3H), 2.89 (t, J=7.0 Hz, 2H), 2.69 (t, J=7.0 Hz, 2H), 2.13 (s, 3H), 1.8 (br-s, N-H); 13C{1H} NMR (CDCl3, 100.6 MHz): * 157.5, 157.2, 127.2, 124.5, 119.6, 106.0, 60.6, 55.5, 43.1, 34.0, 9.1 (11 signals expected and observed) ppm. FTIR (neat/NaCl, cm-1): 3366 (<NH str), 3296 (<N-H str), 1602 (<N-H bend), ~1590 (sh, <aromatic C=C str), 1268 (<C-N str), 1108 (<C-O-C sym str). FTIR (ATR, cm-1): 3371 (<N-H str), 3289 (<N-H str), 1601 (<N-H bend), ~1590 (sh, <aromatic C=C str), 1266 (<C-N str), 1103 (<C-O-C sym str). GC/MS: Rel. Rt: 1.57 (relative to methamphetamine), m/z (assignment): 195 (M+), 166 (base peak).
2,4-Dimethoxy-3-methylphenethylamine HCl (3). To a test tube of 0.34 g 2 (1.8 mmol) dissolved in ~6 mL isopropanol was added 5-6 drops of concentrated HCl and mixed well. Crystallization was induced by addition of 0.5 mL Et2O and cooling to ~2 OC for 2 hours. The resulting mixture was decanted, and the resulting crystalline solid was rinsed with diethyl ether and dried under vacuum, yielding 0.25 g of a white crystalline solid (63% yield). 1H NMR (CDCl3, 400 MHz): * 8.32 (br-s, N-H, 3H), 7.00 (d, 8.4 J=8.4 Hz, 1H), 6.57 (d, J=8.2 Hz, 1H), 3.77 (s, 3H), 3.74 (s, 3H), 3.22 (br-m, 2H), 3.01 (t, J=7.1 Hz, 2H), 2.11 (s, 3H); 1H NMR (CD3OD, 400 MHz): * 7.05 (d, J=8.4 Hz, 1H), 6.71 (d, J=8.4 Hz, 1H), 3.80 (s, 3H), 3.73 (s, 3H), 3.11 (t, J=7.6 Hz, 2H), 2.91 (t, J=7.6 Hz, 2H), 2.13 (s, 3H); 13C{1H} NMR (CD3OD, 100.6 MHz): * 159.7, 158.8, 128.9, 122.6, 120.9, 107.6, 61.3, 56.1, 41.6, 29.4, 9.4 (11 signals expected and observed) ppm. FTIR (KBr, not assigned). FTIR (ATR, not assigned).
Microgram Journal, Volume 3, Numbers 1-2 (January - June 2005) 18
Brought to you by AltGov2 [www.altgov2.org]
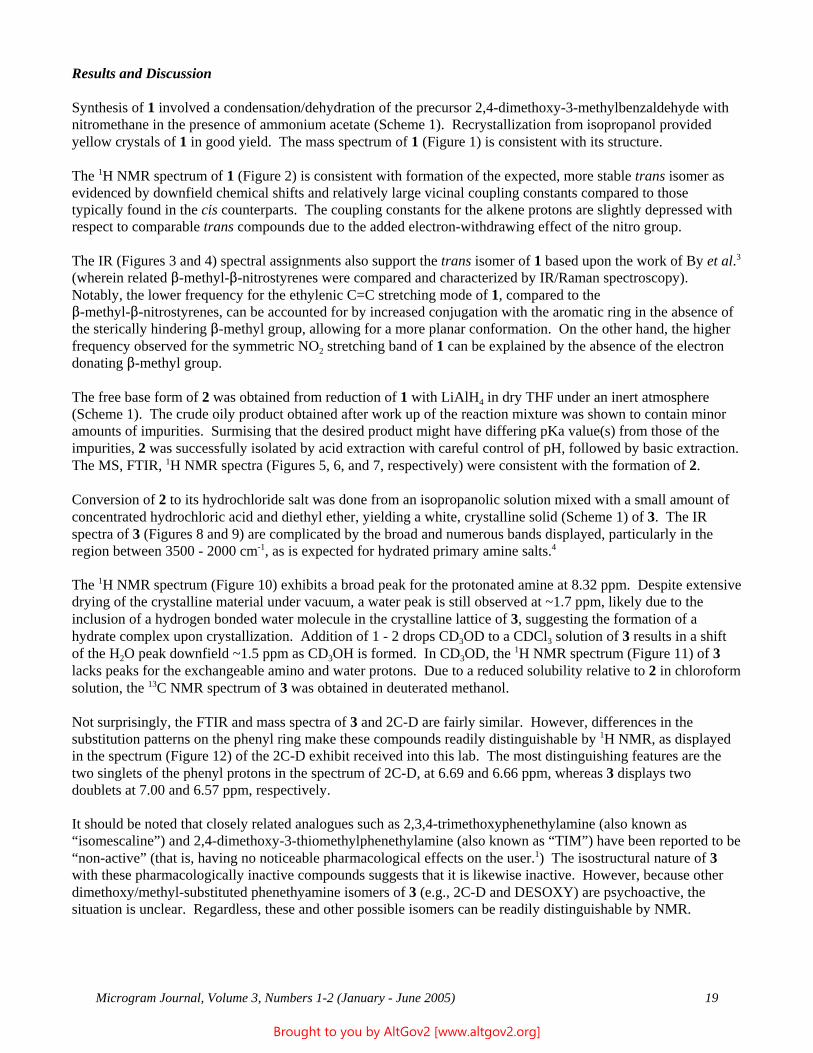
3
Results and Discussion
Synthesis of 1 involved a condensation/dehydration of the precursor 2,4-dimethoxy-3-methylbenzaldehyde with nitromethane in the presence of ammonium acetate (Scheme 1). Recrystallization from isopropanol provided yellow crystals of 1 in good yield. The mass spectrum of 1 (Figure 1) is consistent with its structure.
The 1H NMR spectrum of 1 (Figure 2) is consistent with formation of the expected, more stable trans isomer as evidenced by downfield chemical shifts and relatively large vicinal coupling constants compared to those typically found in the cis counterparts. The coupling constants for the alkene protons are slightly depressed with respect to comparable trans compounds due to the added electron-withdrawing effect of the nitro group.
The IR (Figures 3 and 4) spectral assignments also support the trans isomer of 1 based upon the work of By et al. (wherein related $-methyl-$-nitrostyrenes were compared and characterized by IR/Raman spectroscopy). Notably, the lower frequency for the ethylenic C=C stretching mode of 1, compared to the $-methyl-$-nitrostyrenes, can be accounted for by increased conjugation with the aromatic ring in the absence of the sterically hindering $-methyl group, allowing for a more planar conformation. On the other hand, the higher frequency observed for the symmetric NO2 stretching band of 1 can be explained by the absence of the electron donating $-methyl group.
The free base form of 2 was obtained from reduction of 1 with LiAlH4 in dry THF under an inert atmosphere (Scheme 1). The crude oily product obtained after work up of the reaction mixture was shown to contain minor amounts of impurities. Surmising that the desired product might have differing pKa value(s) from those of the impurities, 2 was successfully isolated by acid extraction with careful control of pH, followed by basic extraction. The MS, FTIR, 1H NMR spectra (Figures 5, 6, and 7, respectively) were consistent with the formation of 2.
Conversion of 2 to its hydrochloride salt was done from an isopropanolic solution mixed with a small amount of concentrated hydrochloric acid and diethyl ether, yielding a white, crystalline solid (Scheme 1) of 3. The IR spectra of 3 (Figures 8 and 9) are complicated by the broad and numerous bands displayed, particularly in the region between 3500 - 2000 cm-1, as is expected for hydrated primary amine salts.4
The 1H NMR spectrum (Figure 10) exhibits a broad peak for the protonated amine at 8.32 ppm. Despite extensive drying of the crystalline material under vacuum, a water peak is still observed at ~1.7 ppm, likely due to the inclusion of a hydrogen bonded water molecule in the crystalline lattice of 3, suggesting the formation of a hydrate complex upon crystallization. Addition of 1 - 2 drops CD3OD to a CDCl3 solution of 3 results in a shift of the H2O peak downfield ~1.5 ppm as CD3OH is formed. In CD3OD, the 1H NMR spectrum (Figure 11) of 3 lacks peaks for the exchangeable amino and water protons. Due to a reduced solubility relative to 2 in chloroform solution, the 13C NMR spectrum of 3 was obtained in deuterated methanol.
Not surprisingly, the FTIR and mass spectra of 3 and 2C-D are fairly similar. However, differences in the substitution patterns on the phenyl ring make these compounds readily distinguishable by 1H NMR, as displayed in the spectrum (Figure 12) of the 2C-D exhibit received into this lab. The most distinguishing features are the two singlets of the phenyl protons in the spectrum of 2C-D, at 6.69 and 6.66 ppm, whereas 3 displays two doublets at 7.00 and 6.57 ppm, respectively.
It should be noted that closely related analogues such as 2,3,4-trimethoxyphenethylamine (also known as “isomescaline”) and 2,4-dimethoxy-3-thiomethylphenethylamine (also known as “TIM”) have been reported to be “non-active” (that is, having no noticeable pharmacological effects on the user.1) The isostructural nature of 3 with these pharmacologically inactive compounds suggests that it is likewise inactive. However, because other dimethoxy/methyl-substituted phenethyamine isomers of 3 (e.g., 2C-D and DESOXY) are psychoactive, the situation is unclear. Regardless, these and other possible isomers can be readily distinguishable by NMR.
Microgram Journal, Volume 3, Numbers 1-2 (January - June 2005) 19
Brought to you by AltGov2 [www.altgov2.org]
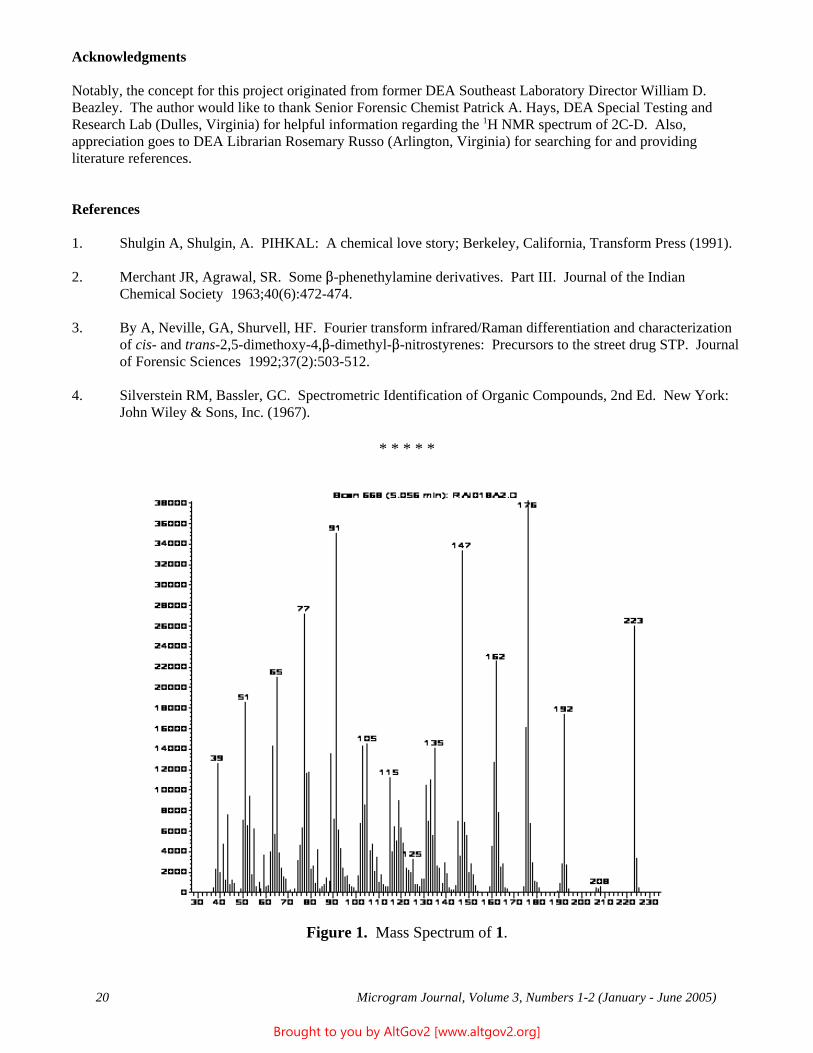
Acknowledgments
Notably, the concept for this project originated from former DEA Southeast Laboratory Director William D. Beazley. The author would like to thank Senior Forensic Chemist Patrick A. Hays, DEA Special Testing and Research Lab (Dulles, Virginia) for helpful information regarding the 1H NMR spectrum of 2C-D. Also, appreciation goes to DEA Librarian Rosemary Russo (Arlington, Virginia) for searching for and providing literature references.
References
1. Shulgin A, Shulgin, A. PIHKAL: A chemical love story; Berkeley, California, Transform Press (1991).
2. Merchant JR, Agrawal, SR. Some $-phenethylamine derivatives. Part III. Journal of the Indian Chemical Society 1963;40(6):472-474.
3. By A, Neville, GA, Shurvell, HF. Fourier transform infrared/Raman differentiation and characterization of cis- and trans-2,5-dimethoxy-4,$-dimethyl-$-nitrostyrenes: Precursors to the street drug STP. Journal of Forensic Sciences 1992;37(2):503-512.
4. Silverstein RM, Bassler, GC. Spectrometric Identification of Organic Compounds, 2nd Ed. New York: John Wiley & Sons, Inc. (1967).
* * * * *
Figure 1. Mass Spectrum of 1.
Microgram Journal, Volume 3, Numbers 1-2 (January - June 2005) 20
Brought to you by AltGov2 [www.altgov2.org]
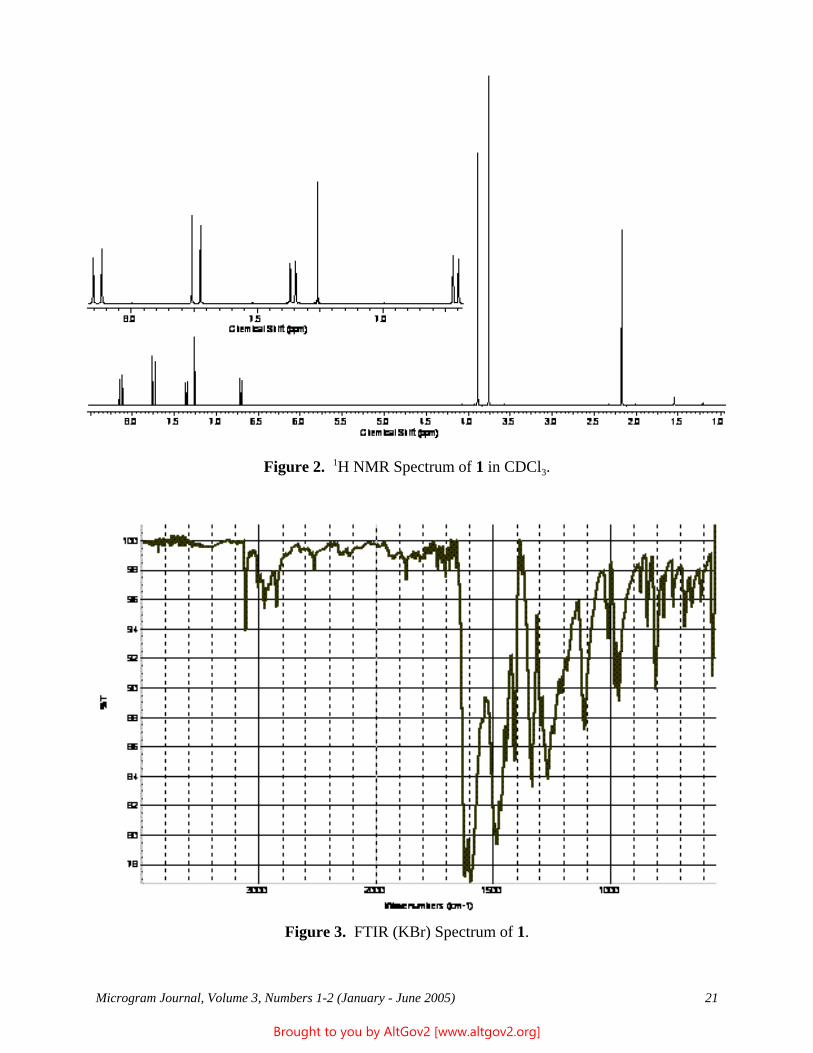
Figure 2. 1H NMR Spectrum of 1 in CDCl3.
Figure 3. FTIR (KBr) Spectrum of 1.
Microgram Journal, Volume 3, Numbers 1-2 (January - June 2005) 21
Brought to you by AltGov2 [www.altgov2.org]
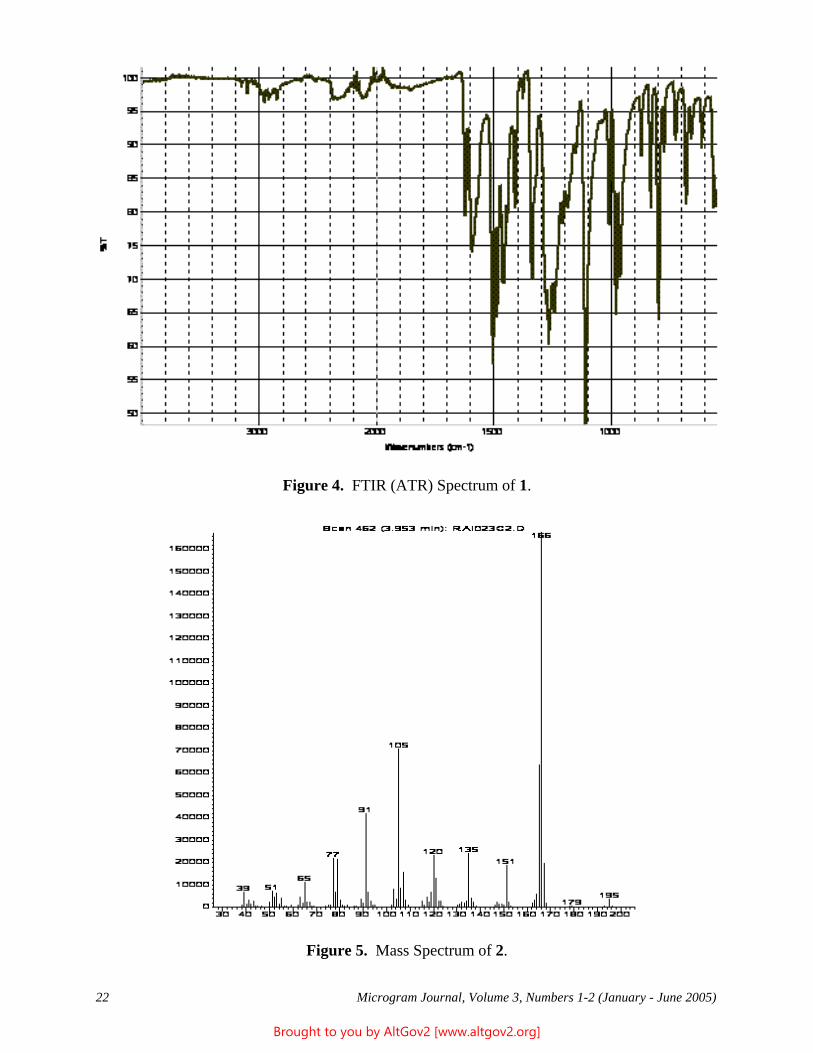
Figure 4. FTIR (ATR) Spectrum of 1.
Figure 5. Mass Spectrum of 2.
Microgram Journal, Volume 3, Numbers 1-2 (January - June 2005) 22
Brought to you by AltGov2 [www.altgov2.org]
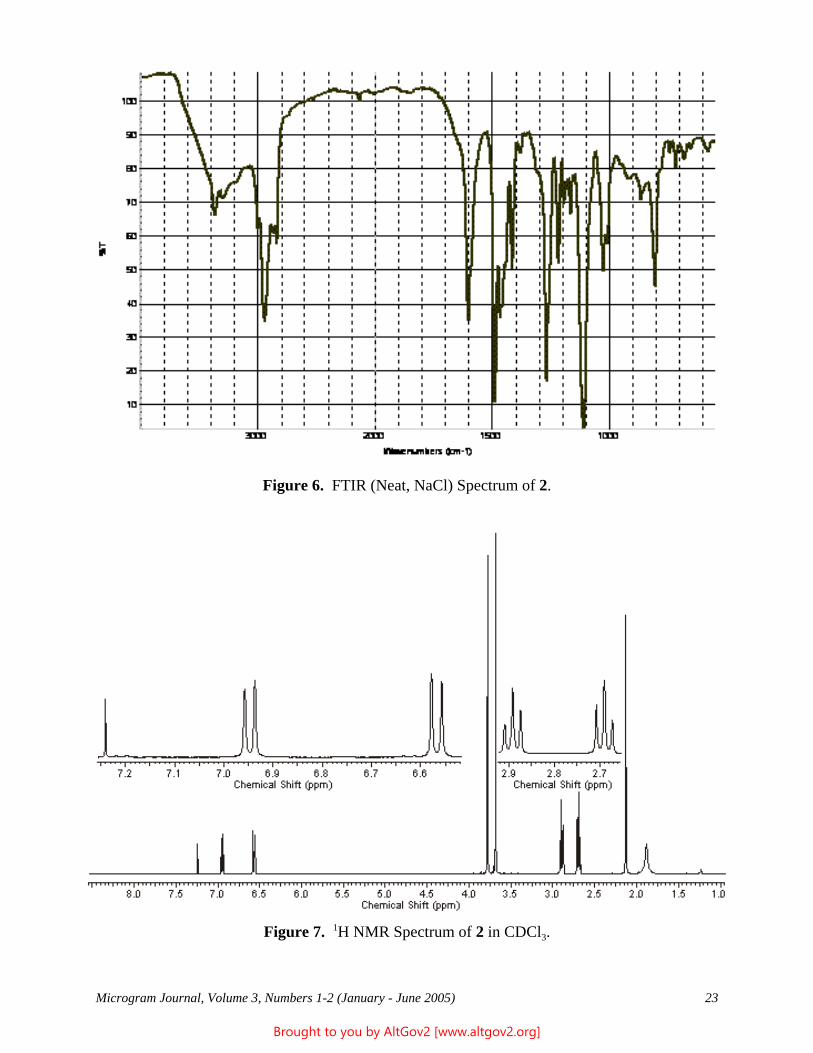
Figure 6. FTIR (Neat, NaCl) Spectrum of 2.
Figure 7. 1H NMR Spectrum of 2 in CDCl3.
Microgram Journal, Volume 3, Numbers 1-2 (January - June 2005) 23
Brought to you by AltGov2 [www.altgov2.org]
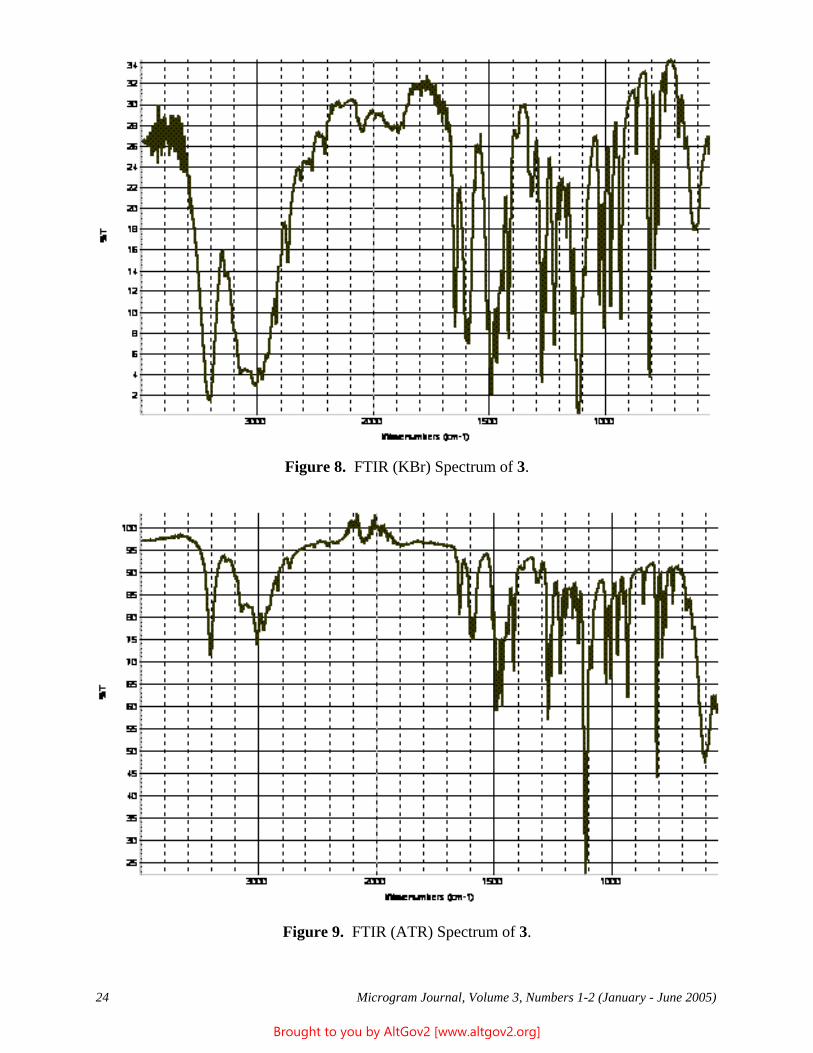
Figure 8. FTIR (KBr) Spectrum of 3.
Figure 9. FTIR (ATR) Spectrum of 3.
Microgram Journal, Volume 3, Numbers 1-2 (January - June 2005) 24
Brought to you by AltGov2 [www.altgov2.org]
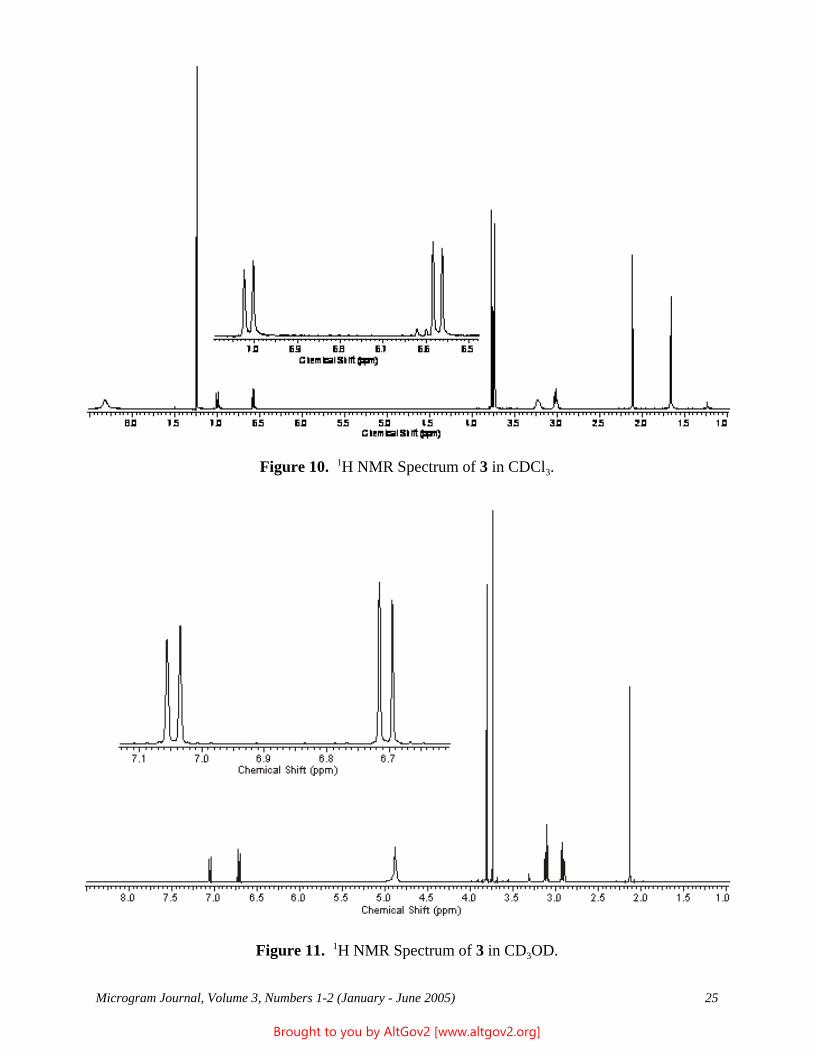
Figure 10. 1H NMR Spectrum of 3 in CDCl3.
Figure 11. 1H NMR Spectrum of 3 in CD3OD.
Microgram Journal, Volume 3, Numbers 1-2 (January - June 2005) 25
Brought to you by AltGov2 [www.altgov2.org]
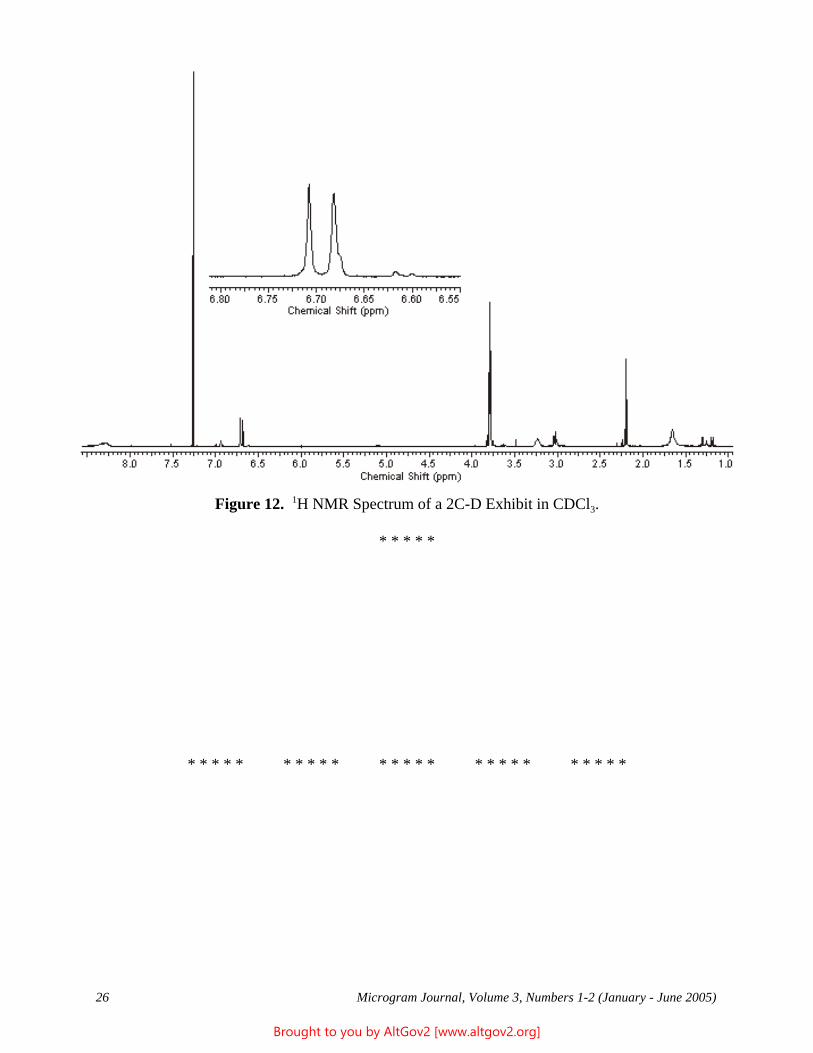
Figure 12. 1H NMR Spectrum of a 2C-D Exhibit in CDCl3.
* * * * *
* * * * * * * * * * * * * * * * * * * * * * * * *
Microgram Journal, Volume 3, Numbers 1-2 (January - June 2005) 26
Brought to you by AltGov2 [www.altgov2.org]
Technical Note
Analytical Profile of Modafinil
Jeremiah A. Morris Johnson County Sheriff’s Office
Criminalistics Laboratory 6000 Lamar
Mission, KS 66202 [email: Jeremiah.Morris -at- jocogov.org]
ABSTRACT: Analytical data (color tests, GC/MS, and FTIR) are reported for modafinil.
KEYWORDS: Modafinil, Provigil, Color Testing, GC/MS, FTIR, Forensic Chemistry.
Figure 1
Modafinil: 2-[(Diphenylmethyl)sulfinyl]acetamide; C15H15NO2S; mw = 273.36
Introduction
Modafinil (Figure 1), the active constituent of Provigil® tablets, became a Schedule IV controlled substance in January 1999. According to the manufacturer, modafinil is a CNS stimulant which possesses, “wake-promoting actions like sympathomimetic agents including amphetamine and methylphenidate, although the pharmacologic profile is not identical to that of sympathomimetic amines” [1].
Presumptive testing and instrumental data were collected to assist in the identification of submissions of modafinil tablets.
Experimental
Standard and Reagents A reference standard of modafinil (Lot# 084K4633) was obtained from Sigma. Potassium bromide (IR grade, lot# 035261) and methylene chloride (ACS grade, lot# 040933) were obtained from Fisher. The derivatizing agent BSTFA+TMCS (99:1, lot# LA90822) was obtained from Supelco.
Methods and Instrumentation Presumptive Color Tests: Portions of modafinil were placed in reagent wells followed by the addition of various presumptive color test reagents.
Tablet Extraction: A Provigil tablet extraction procedure was obtained from Cephalon [2]. A single tablet was ground and placed in a separatory funnel followed by the addition of 50-mL de-ionized water and 50-mL methylene chloride. The mixture was shook for approximately one minute with venting. A portion of the lower layer was drained, filtered, and evaporated to dryness, leaving a white powder residue.
Microgram Journal, Volume 3, Numbers 1-2 (January - June 2005) 27
Brought to you by AltGov2 [www.altgov2.org]
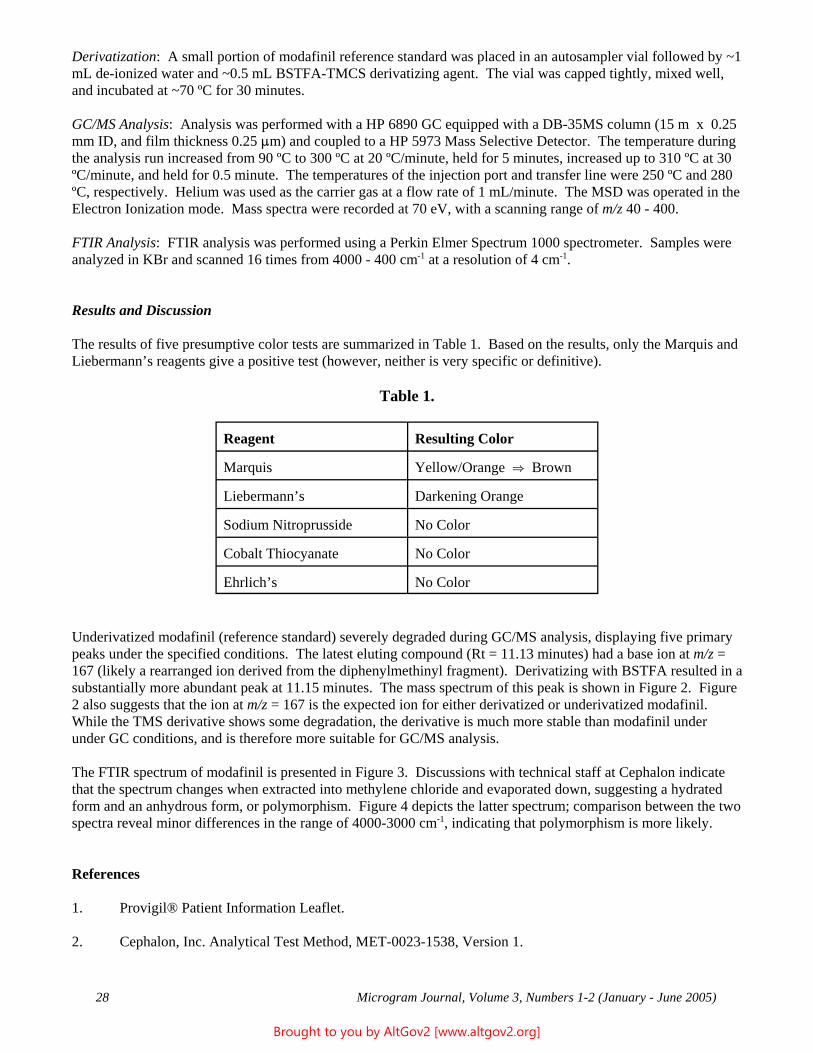
Derivatization: A small portion of modafinil reference standard was placed in an autosampler vial followed by ~1 mL de-ionized water and ~0.5 mL BSTFA-TMCS derivatizing agent. The vial was capped tightly, mixed well, and incubated at ~70 ºC for 30 minutes.
GC/MS Analysis: Analysis was performed with a HP 6890 GC equipped with a DB-35MS column (15 m x 0.25 mm ID, and film thickness 0.25 :m) and coupled to a HP 5973 Mass Selective Detector. The temperature during the analysis run increased from 90 ºC to 300 ºC at 20 ºC/minute, held for 5 minutes, increased up to 310 ºC at 30 ºC/minute, and held for 0.5 minute. The temperatures of the injection port and transfer line were 250 ºC and 280 ºC, respectively. Helium was used as the carrier gas at a flow rate of 1 mL/minute. The MSD was operated in the Electron Ionization mode. Mass spectra were recorded at 70 eV, with a scanning range of m/z 40 - 400.
FTIR Analysis: FTIR analysis was performed using a Perkin Elmer Spectrum 1000 spectrometer. Samples were analyzed in KBr and scanned 16 times from 4000 - 400 cm-1 at a resolution of 4 cm-1.
Results and Discussion
The results of five presumptive color tests are summarized in Table 1. Based on the results, only the Marquis and Liebermann’s reagents give a positive test (however, neither is very specific or definitive).
Table 1.
Reagent Resulting Color
Marquis Yellow/Orange | Brown
Liebermann’s Darkening Orange
Sodium Nitroprusside No Color
Cobalt Thiocyanate No Color
Ehrlich’s No Color
Underivatized modafinil (reference standard) severely degraded during GC/MS analysis, displaying five primary peaks under the specified conditions. The latest eluting compound (Rt = 11.13 minutes) had a base ion at m/z = 167 (likely a rearranged ion derived from the diphenylmethinyl fragment). Derivatizing with BSTFA resulted in a substantially more abundant peak at 11.15 minutes. The mass spectrum of this peak is shown in Figure 2. Figure 2 also suggests that the ion at m/z = 167 is the expected ion for either derivatized or underivatized modafinil. While the TMS derivative shows some degradation, the derivative is much more stable than modafinil under under GC conditions, and is therefore more suitable for GC/MS analysis.
The FTIR spectrum of modafinil is presented in Figure 3. Discussions with technical staff at Cephalon indicate that the spectrum changes when extracted into methylene chloride and evaporated down, suggesting a hydrated form and an anhydrous form, or polymorphism. Figure 4 depicts the latter spectrum; comparison between the two spectra reveal minor differences in the range of 4000-3000 cm-1, indicating that polymorphism is more likely.
References
1. Provigil® Patient Information Leaflet.
2. Cephalon, Inc. Analytical Test Method, MET-0023-1538, Version 1.
Microgram Journal, Volume 3, Numbers 1-2 (January - June 2005) 28
Brought to you by AltGov2 [www.altgov2.org]
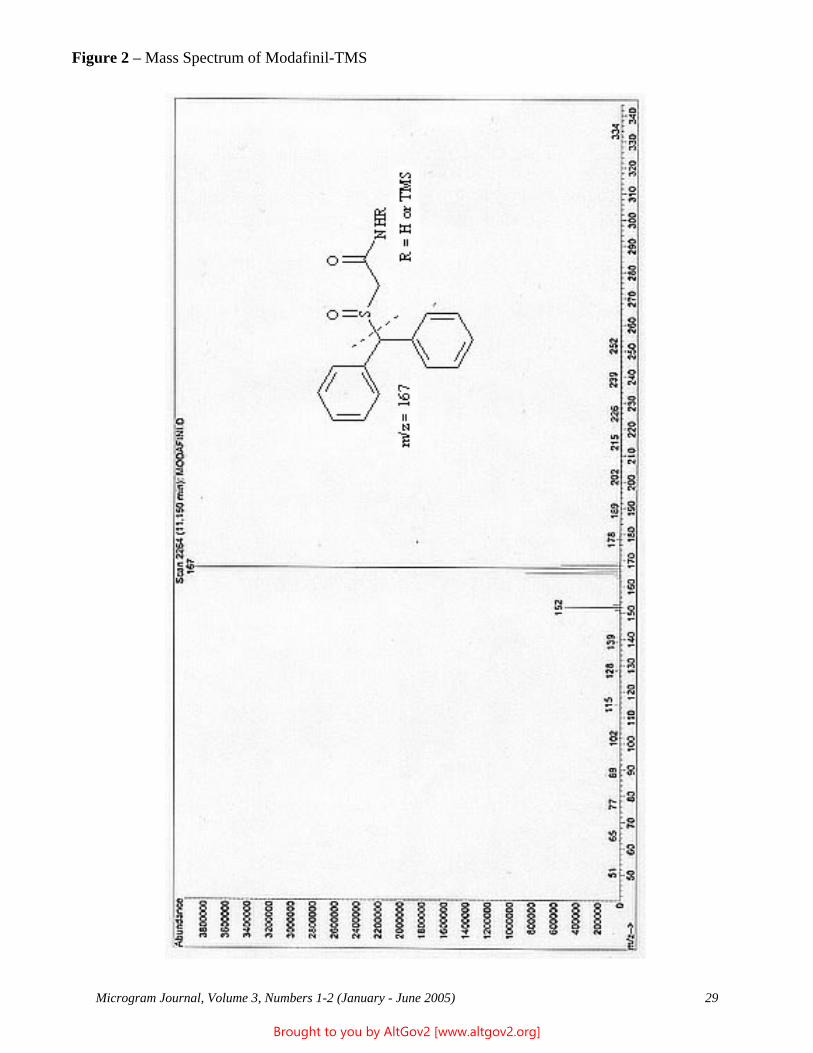
Figure 2 – Mass Spectrum of Modafinil-TMS
Microgram Journal, Volume 3, Numbers 1-2 (January - June 2005) 29
Brought to you by AltGov2 [www.altgov2.org]
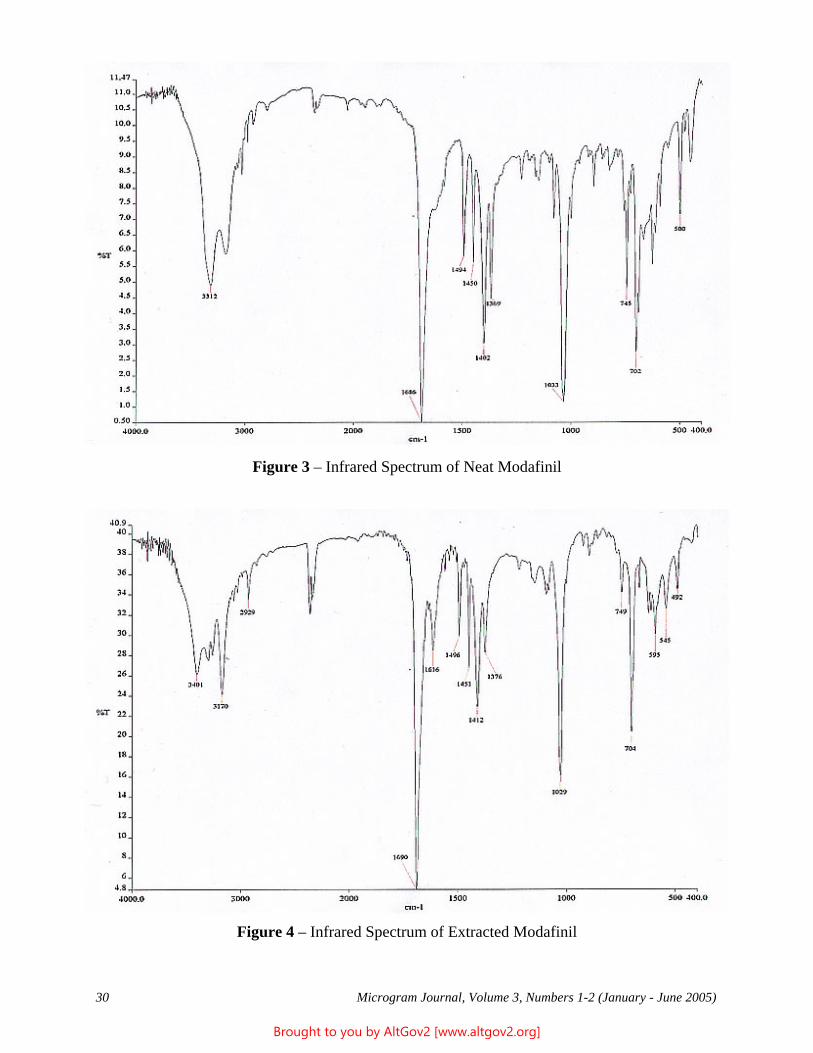
Figure 3 – Infrared Spectrum of Neat Modafinil
Figure 4 – Infrared Spectrum of Extracted Modafinil
Microgram Journal, Volume 3, Numbers 1-2 (January - June 2005) 30
Brought to you by AltGov2 [www.altgov2.org]
Quantitation and Enantiomeric Determination of Propoxyphene Using Capillary Zone Electrophoresis
Clay P. Phelan U.S. Department of Justice
Drug Enforcement Administration Southwest Laboratory
2815 Scott Street Vista, CA 92081
[Email Address: Clay.P.Phelan -at- usdoj.gov]
ABSTRACT: Validated Methods for the quantitation of d-propoxyphene HCl and d-propoxyphene napsylate were developed using capillary zone electrophoresis, using an uncoated capillary, a lithium phosphate buffer, and using thiamine HCl as the internal standard. The addition of a small amount of acetonitrile to the injection solvent facilitated the solubilization of d-propoxyphene napsylate. The analytes’ responses were reproducible, provided accurate recovery values, and were linear within the experimental concentration range. A chiral analysis was also conducted, using the same capillary but with 2-hydroxypropyl-$-cyclodextrin added to the run buffer. The methods were specifically developed for the analysis of pharmaceutical tablets containing d-propoxyphene HCl or d-propoxyphene napsylate, which typically are adulterated only with caffeine, aspirin, and/or acetaminophen; however, the method is applicable to analysis of a wide variety of other drugs.
KEYWORDS: Capillary Zone Electrophoresis, CZE, d-Propoxyphene HCl, d-Propoxyphene Napsylate, Chiral Analysis, Forensic Chemistry
Introduction
d-Propoxyphene is a mild narcotic analgesic found in various pharmaceutical preparations, usually as the hydrochloride or napsylate salt. These preparations typically also contain large amounts of acetaminophen, aspirin, or caffeine. This drug is prescribed for pain relief; however, it is also abused for its euphoric side effects [1], and it is therefore commonly diverted into the illicit drug trade. Currently, d-propoxyphene is a Schedule IV controlled substance in the United States; however l-propoxyphene is not controlled. This requires enantiomeric determination for all samples containing propoxyphene.
Propoxyphene is thermally labile, and will break down on a gas chromatograph. Therefore, most of the literature procedures for its analysis are based on liquid chromatographic techniques, more recently including capillary electrophoretic methods [1,2]. The analysis of controlled substances with CE, especially using specialized capillary coatings and/or run buffers, have been shown to produce highly accurate and reproducible results [3-5]. However, some of these techniques are relatively costly and complicated. The described methodologies are simple, inexpensive, and can also be utilized for a wide variety of other drugs, including the phenethylamines [6].
The first CE method for quantitation and enantiomeric determination of propoxyphene was reported in 1994 [7]. However, the methodology required the use of fairly long capillaries, resulting in long analysis times. In addition, because d-propoxyphene napsylate has a solubility limit of approximately 1.0 mg/mL in 0.01 N HCl, the quantitation samples were prepared at concentrations less than 0.6 mg/mL, and had to be sonicated for several hours prior to analysis.
Solubility problems in CE can be addressed by the use of an organic modifier in the injection solvent and/or run buffer. For d-propoxyphene napsylate, acetonitrile was determined to be an appropriate modifier. Thiamine HCl
Microgram Journal, Volume 3, Numbers 1-2 (January - June 2005) 31
Brought to you by AltGov2 [www.altgov2.org]
was selected as the method internal standard, as it is commercially available, inexpensive, and not found in typical pharmaceutical preparations or in most illicit drug samples.
Experimental
Preparation of Internal Standard Stock Solution Thiamine HCl (Sigma, St. Louis, MO) was dissolved in 0.01 N HCl, for a concentration of 1 mg/mL. The deionized water used to produce the 0.01 N HCl was obtained from a Milli Q® Gradient 10A purification system (Millipore, Bedford, MA).
Preparation of the Achiral Buffer A 100 mM solution of phosphoric acid was prepared using deionized water and $85% reagent grade phosphoric acid (J.T. Baker, Phillipsburg, NJ). The solution was then titrated to a pH of 2.30 ±0.02 with solid lithium hydroxide (Sigma, St. Louis, MO). (Precise pH control is very important in CE, as it affects both migration times and selectivity.) The buffer was filtered prior to use through a 0.45 :m filter, using an Agilent (Wilmington, DE) Solvent Filter/Degasser. Because this buffer contains no preservatives, it was stored at 7 ºC, and was replaced every 6 to 8 weeks.
Preparation of the Chiral Buffer 2-Hydroxypropyl-$-cyclodextrin (Sigma, St. Louis, MO) was added to the achiral buffer such that its concentration was 20 mM. The buffer was filtered prior to use through a 0.45 :m filter.
Preparation of Capillaries The capillary was prepared in-house, using a 50 :m ± 3 :m ID with a 363 :m ± 10 :m OD flexible polyamide-coated fused silica capillary tubing (Polymicro Technologies, Phoenix, AZ). The capillary was manually cut to a nominal length of 34 cm ± 0.5 cm using a CE column cutter equipped with a diamond blade. Both ends of the capillary were inspected under a microscope to ensure that the glass edge was straight and perpendicular to the length of the capillary tubing, and also was free of debris and defects. The detector window was produced by removing the polyamide coating using a standard window maker equipped with a 7 mm heating module (MICROSOLV® , Long Branch, NJ). The coating on each end of the capillary was removed using a 2 mm heating module. The new capillary was initially conditioned at 40 ºC by flushing it with 1.0 N NaOH (5 minutes), 0.1 N NaOH (10 minutes), deionized water (5 minutes), and 100 mM lithium phosphate buffer (10 minutes). Subsequently, capillaries were conditioned once every 24 hours at 15 ºC by flushing them with 1.0 N NaOH (1 minutes), 0.1 N NaOH (2 minutes), deionized water (1 minutes), and 100 mM lithium phosphate buffer (2 minutes).
Sample and Standard Preparation for d-Propoxyphene Hydrochloride d-Propoxyphene HCl standard (Sigma, St. Louis, MO) or a d-propoxyphene HCl-containing sample was accurately weighed and placed in a volumetric flask with an appropriate aliquot of thiamine HCl stock solution (1:5), and the solution was diluted to final volume with 0.01 N HCl. The concentration of the standard or sample in each solution varied between 0.2 - 0.5 mg/mL. Each solution was filtered prior to injection through a syringe equipped with a 0.45 :m filter (Acrodisc®). For the linearity studies, eight solutions of the d-propoxyphene HCl were prepared at concentrations ranging from 0.05 to 1.3 mg/mL, with the internal standard concentration constant at 0.2 mg/mL. The standard and sample solutions were diluted with 0.01 N HCl to approximately 0.05 to 0.10 mg/mL for the chiral analyses. Enantiomers were determined using the chiral buffer.
Sample and Standard Preparation for d-Propoxyphene Napsylate d-Propoxyphene napsylate standard or a d-propoxyphene napsylate-containing sample was accurately weighed and placed in a 100 mL volumetric flask with 4 mL acetonitrile and sonicated of approximately 5.0 minutes. An appropriate aliquot of thiamine HCl stock solution (1:5) was added, and the solution was diluted to final volume with 0.01 N HCl. The concentration of the standard or sample in each solution varied between 0.2 - 0.5 mg/mL (the amount of acetonitrile in the final solutions was approximately 4%). Each solution was filtered prior to
Microgram Journal, Volume 3, Numbers 1-2 (January - June 2005) 32
Brought to you by AltGov2 [www.altgov2.org]
injection through a syringe equipped with a 0.45 :m filter (Acrodisc®). For the linearity studies, eight solutions of the d-propoxyphene napsylate were prepared at concentrations from 0.05 to 1.2 mg/mL, containing varying amounts of acetonitrile (0.2% to 4.8%). Additional solutions containing d-propoxyphene napsylate were also prepared from 0.569 to 0.737 mg/mL, containing acetonitrile ranging from 6% to 14%. The appropriate aliquot of thiamine HCl stock solution (1:5) was added, and the solution were diluted to final volume with 0.01 N HCl. The standard and the sample solutions were diluted to approximately 0.05 to 0.10 mg/mL with 0.01 N HCl for the chiral analyses. Enantiomers were determined using the chiral (20 mM 2-hydroxypropyl-$-cyclodextrin) buffer.
Capillary Electrophoresis Experiments were performed using a Hewlett Packard 3DCE capillary electrophoresis system (Agilent Technologies, Wilmington, DE), equipped with a diode array detector set at a wavelength of 207 nm with a bandwidth of 7 nm. For quantitations, the capillary was flushed with buffer for 2.5 minutes between injections for the HCl, and for 1.0 minutes with 0.1 N NaOH and 2.0 minutes with the achiral buffer for the napsylate. The buffer was replenished after six injections to prevent depletion of electrolytes and charge. The capillary temperature was maintained at 15 ºC. The hydrodynamic injection time was 2.5 seconds at 50 mBar. The applied voltage was 14.5 kV, which was determined empirically to maintain current below 60 :A, thereby limiting Joule heating while also optimizing analysis time.
For the enantiomer determination, the capillary was flushed with buffer for 2.5 minutes between injections for both the HCl and the napsylate salts. The standard and the sample solutions were diluted to approximately 0.2 mg/mL with 0.01 N HCl. The enantiomers were determined using the chiral buffer, using the same applied voltage (14.5 kV). The d,l-propoxyphene standard and sample injection was set at 50 mBar of pressure for 1.5 seconds, followed by a second co-injection of 0.01 N HCl at 20 mBar for 1.0 second. The samples and standards of d-propoxyphene and l-propoxyphene were injected at 50 mBar of pressure for 1.5 seconds, followed by a second co-injection of the d,l-propoxyphene standard at 20 mBar for 1.0 second. The buffer was not replenished after six injections, but rather was utilized until depleted.
Results and Discussion
The objective of the study was to accurately and rapidly quantitate d-propoxyphene HCl and d-propoxyphene napsylate by CZE without interferences from adulterants or diluents. CZE permits direct analysis without requiring extractions. The use of a simple aqueous buffer for the HCl salt reduces analysis cost and allows for simple disposal; the use of acetonitrile as an organic modifier for the napsylate salt is nearly as convenient. Because neutral compounds migrate at the rate comparable to the electroosmotic flow (EOF), while negatively charged (acidic) compounds migrate at a rate slower than the EOF, these species are not detected using the presented method. Therefore, pharmaceutical tablets that contain adulterants such as caffeine, aspirin, or acetaminophen do not interfere. For example, the analysis of a 50 mg d-propoxyphene napsylate tablet containing 325 mg of acetaminophen displays no peak(s) for the acetaminophen (Figure 1).
These methods were specifically developed for pharmaceutical tablets containing d-propoxyphene HCl or d-propoxyphene napsylate, which typically are adulterated only with caffeine, aspirin, and/or acetaminophen. As noted above, these adulterants do not interfere with achiral quantitation; therefore, a selectivity study was not conducted (or required for this application). In the unlikely event that counterfeit pharmaceuticals containing additional adulterants were encountered, the alternative adulterants would have to be identified by spectroscopic means, after which the sample would have to be evaluated to ensure that the selectivity requirements were met, before proceeding with CZE analysis.
The linearity study demonstrated that the calculated errors were less than five percent, and the correlation coefficients were greater than 0.998, within the specified linear range (see Table I). The linearity studies were conducted both with the method using a 1.0 minute flush with the 0.1 N NaOH followed by a 2.0 minute flush of the achiral buffer, and with the method using a 2.5 minute flush with the achiral buffer. It was determined that the use of a 0.1 N NaOH flush resulted in a higher correlation coefficient.
Microgram Journal, Volume 3, Numbers 1-2 (January - June 2005) 33
Brought to you by AltGov2 [www.altgov2.org]
The precision was determined by injecting two concentrations of analyte at the lower and upper ends of the established linear range. The %RSDs for the two concentrations did not exceed 3% for the HCl or the napsylate. Furthermore, an additional five solutions ranging from 0.569 to 0.737 mg/mL of d-propoxyphene napsylate containing varying amounts of acetonitrile (6, 8, 10, 12, or 14%) gave equivalent %RSD values. The precision was determined both with the 1.0 minute flush with the 0.1 N NaOH followed by a 2.0 minute flush of the achiral buffer, and with the 2.5 minute flush with the achiral buffer. Again, it was determined that the use of a 0.1 N NaOH flush resulted in a lower, more consistent %RSDs (Tables II and III).
The accuracy (recovery) was determined by preparing three different concentrations of the analyte with each of the following adulterants: Acetaminophen, aspirin, and caffeine. The concentrations of the analytes represented the lower, middle, and upper linear ranges (i.e., 10%, 50%, and 80%), and contained the appropriate amount of the internal standard. The samples were prepared by sonicating for 5 minutes, and were also compared to non-sonicated samples. The CZE results were compared to the actual values, and did not exceed a 5.0% difference (Table IV). However, samples that were sonicated gave lower errors.
Conclusions
CZE is an effective technique for the quantitation of pharmaceutical preparations containing d-propoxyphene HCl or d-propoxyphene napsylate. Quantitative results were shown to be accurate, reproducible, and precise, and allowed analyses to be accomplished in less than 6 minutes. The use of thiamine HCl as the internal standard was convenient, did not interfere with any known controlled adulterant, and is commercially available at low cost. Chiral separations are conveniently accomplished on the same system with the use of 2-hydroxypropyl-$-cyclodextrin in the run buffer. The described system offers an approach for routine analysis that is simple, robust, practical, and inexpensive. The methodology has been applied to a broader range of illicit drugs, including synthetic opiates and phenethylamines, under the same/similar operating conditions with equal success, and has been used to analyze a large number seized exhibits over the past two years.
Acknowledgments
The author expresses appreciation to the following staff employed at the DEA Southwest Laboratory: Senior Forensic Chemist Harry F. Skinner, and Forensic Chemists Alan Randa, Dean A. Kirby, Nathan Salazar, and Nicole C. Payne-King, for their technical contributions. The author would also like to thank Librarian Rose Mary Russo of the DEA Library (Arlington, Virginia) for her assistance in acquiring references.
References
1. Magoon T, Ota K, Jakubowski J, Nerozzi M, Werner TC. The use of neutral cyclodextrins as additives in capillary electrophoresis for the separation and identification of propoxyphene enantiomers. Analytical and Bioanalytical Chemistry 2002;373:628.
2. Weinberger R. Practical Capillary Electrophoresis, 2nd Edition, Academic Press (2000).
3. Lurie IS, Bethea MJ, McKibben TD, Hays PA, Pellegrini P, Sahai R, Garcia AD, Weinberger R. Use of dynamically coated capillaries for the routine analysis of methamphetamine, amphetamine, MDA, MDMA, MDEA, and cocaine using capillary electrophoresis. Journal of Forensic Sciences 2001;46(5):1025.
4. Lurie IS, Hays PA, Parker K. Capillary electrophoresis analysis of a wide variety of seized drugs using the same capillary with dynamic coatings. Electrophoresis 2004;25(10-11):1580.
Microgram Journal, Volume 3, Numbers 1-2 (January - June 2005) 34
Brought to you by AltGov2 [www.altgov2.org]
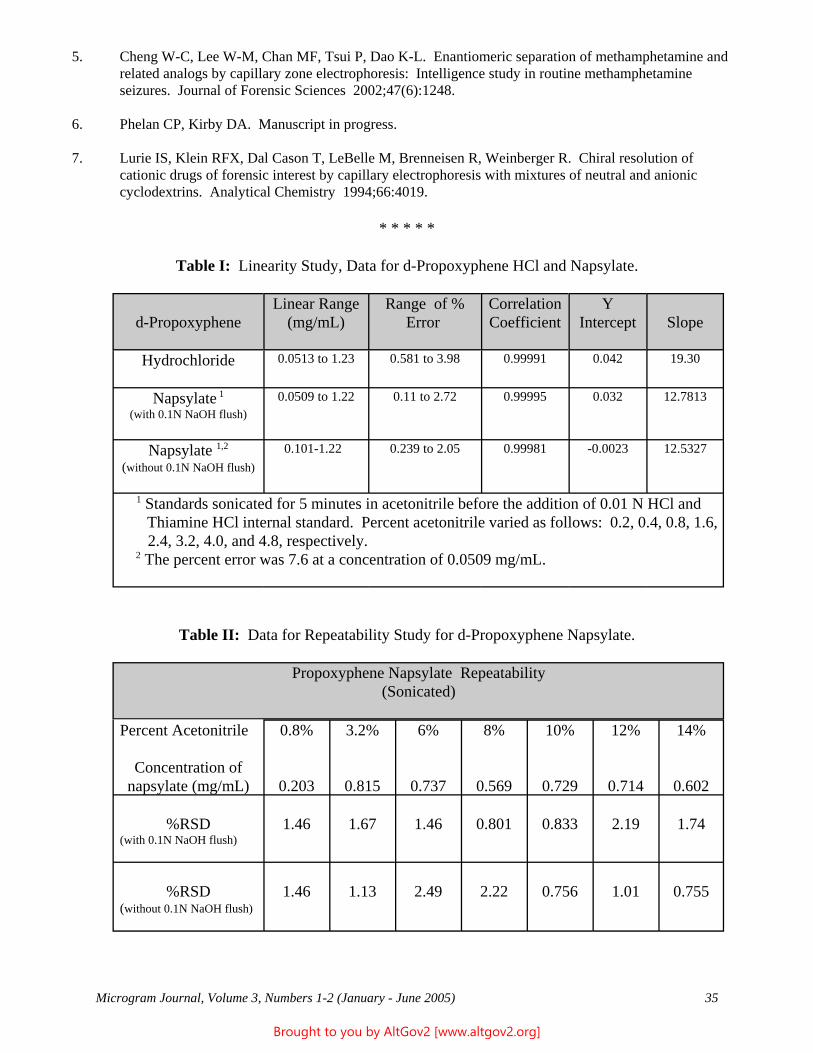
5. Cheng W-C, Lee W-M, Chan MF, Tsui P, Dao K-L. Enantiomeric separation of methamphetamine and related analogs by capillary zone electrophoresis: Intelligence study in routine methamphetamine seizures. Journal of Forensic Sciences 2002;47(6):1248.
6. Phelan CP, Kirby DA. Manuscript in progress.
7. Lurie IS, Klein RFX, Dal Cason T, LeBelle M, Brenneisen R, Weinberger R. Chiral resolution of cationic drugs of forensic interest by capillary electrophoresis with mixtures of neutral and anionic cyclodextrins. Analytical Chemistry 1994;66:4019.
* * * * *
Table I: Linearity Study, Data for d-Propoxyphene HCl and Napsylate.
d-Propoxyphene Linear Range
(mg/mL) Range of %
Error Correlation Coefficient
Y Intercept Slope
Hydrochloride 0.0513 to 1.23 0.581 to 3.98 0.99991 0.042 19.30
Napsylate 1
(with 0.1N NaOH flush) 0.0509 to 1.22 0.11 to 2.72 0.99995 0.032 12.7813
Napsylate 1,2
(without 0.1N NaOH flush) 0.101-1.22 0.239 to 2.05 0.99981 -0.0023 12.5327
1 Standards sonicated for 5 minutes in acetonitrile before the addition of 0.01 N HCl and Thiamine HCl internal standard. Percent acetonitrile varied as follows: 0.2, 0.4, 0.8, 1.6,
2.4, 3.2, 4.0, and 4.8, respectively. 2 The percent error was 7.6 at a concentration of 0.0509 mg/mL.
Table II: Data for Repeatability Study for d-Propoxyphene Napsylate.
Propoxyphene Napsylate Repeatability (Sonicated)
Percent Acetonitrile 0.8% 3.2% 6% 8% 10% 12% 14%
Concentration of napsylate (mg/mL) 0.203 0.815 0.737 0.569 0.729 0.714 0.602
%RSD 1.46 1.67 1.46 0.801 0.833 2.19 1.74 (with 0.1N NaOH flush)
%RSD (without 0.1N NaOH flush)
1.46 1.13 2.49 2.22 0.756 1.01 0.755
Microgram Journal, Volume 3, Numbers 1-2 (January - June 2005) 35
Brought to you by AltGov2 [www.altgov2.org]
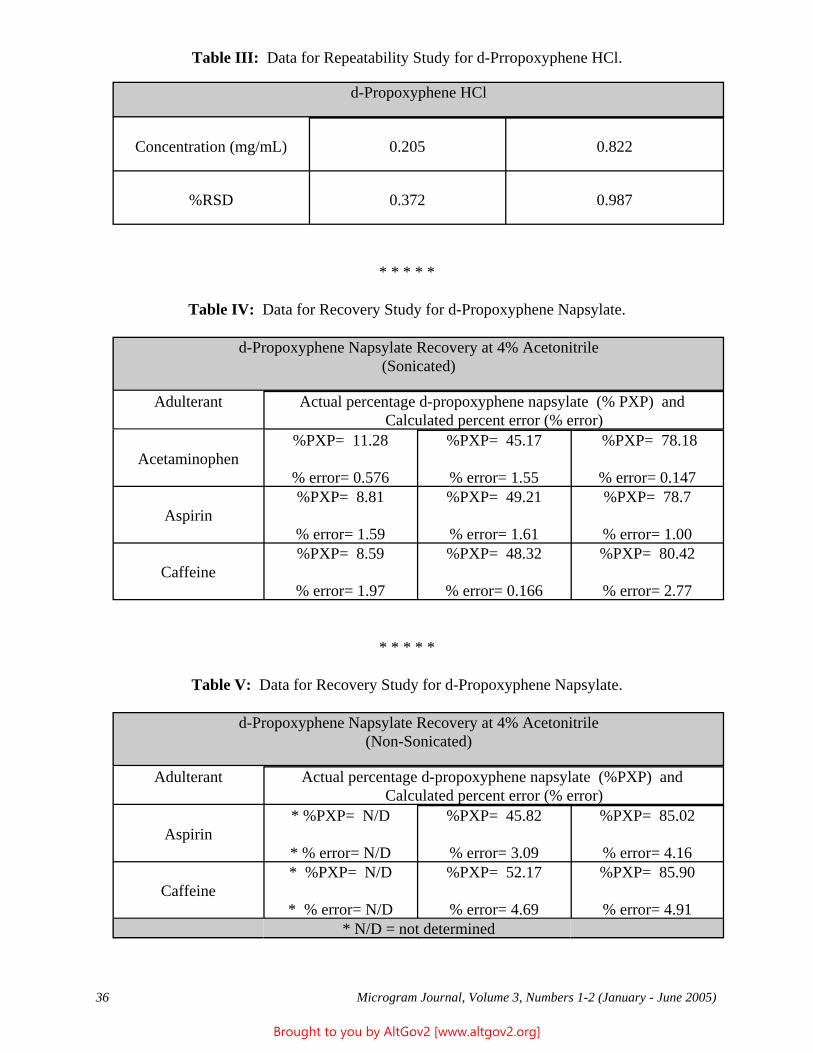
Table III: Data for Repeatability Study for d-Prropoxyphene HCl.
d-Propoxyphene HCl
Concentration (mg/mL) 0.205 0.822
%RSD 0.372 0.987
* * * * *
Table IV: Data for Recovery Study for d-Propoxyphene Napsylate.
d-Propoxyphene Napsylate Recovery at 4% Acetonitrile (Sonicated)
Adulterant Actual percentage d-propoxyphene napsylate (% PXP) and Calculated percent error (% error)
Acetaminophen %PXP= 11.28
% error= 0.576
%PXP= 45.17
% error= 1.55
%PXP= 78.18
% error= 0.147
Aspirin %PXP= 8.81
% error= 1.59
%PXP= 49.21
% error= 1.61
%PXP= 78.7
% error= 1.00
Caffeine %PXP= 8.59
% error= 1.97
%PXP= 48.32
% error= 0.166
%PXP= 80.42
% error= 2.77
* * * * *
Table V: Data for Recovery Study for d-Propoxyphene Napsylate.
d-Propoxyphene Napsylate Recovery at 4% Acetonitrile (Non-Sonicated)
Adulterant Actual percentage d-propoxyphene napsylate (%PXP) and Calculated percent error (% error)
Aspirin * %PXP= N/D
* % error= N/D
%PXP= 45.82
% error= 3.09
%PXP= 85.02
% error= 4.16
Caffeine * %PXP= N/D
* % error= N/D
%PXP= 52.17
% error= 4.69
%PXP= 85.90
% error= 4.91 * N/D = not determined
Microgram Journal, Volume 3, Numbers 1-2 (January - June 2005) 36
Brought to you by AltGov2 [www.altgov2.org]
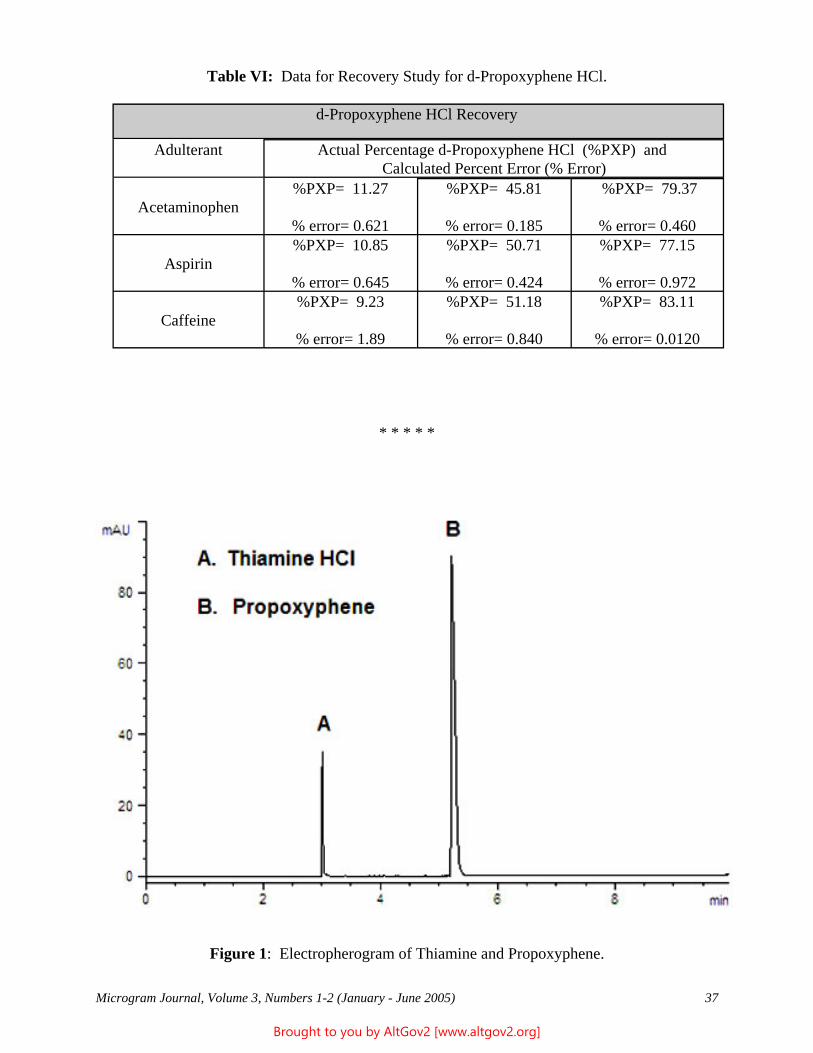
Table VI: Data for Recovery Study for d-Propoxyphene HCl.
d-Propoxyphene HCl Recovery
Adulterant Actual Percentage d-Propoxyphene HCl (%PXP) and Calculated Percent Error (% Error)
Acetaminophen %PXP= 11.27
% error= 0.621
%PXP= 45.81
% error= 0.185
%PXP= 79.37
% error= 0.460
Aspirin %PXP= 10.85
% error= 0.645
%PXP= 50.71
% error= 0.424
%PXP= 77.15
% error= 0.972
Caffeine %PXP= 9.23
% error= 1.89
%PXP= 51.18
% error= 0.840
%PXP= 83.11
% error= 0.0120
* * * * *
Figure 1: Electropherogram of Thiamine and Propoxyphene.
Microgram Journal, Volume 3, Numbers 1-2 (January - June 2005) 37
Brought to you by AltGov2 [www.altgov2.org]
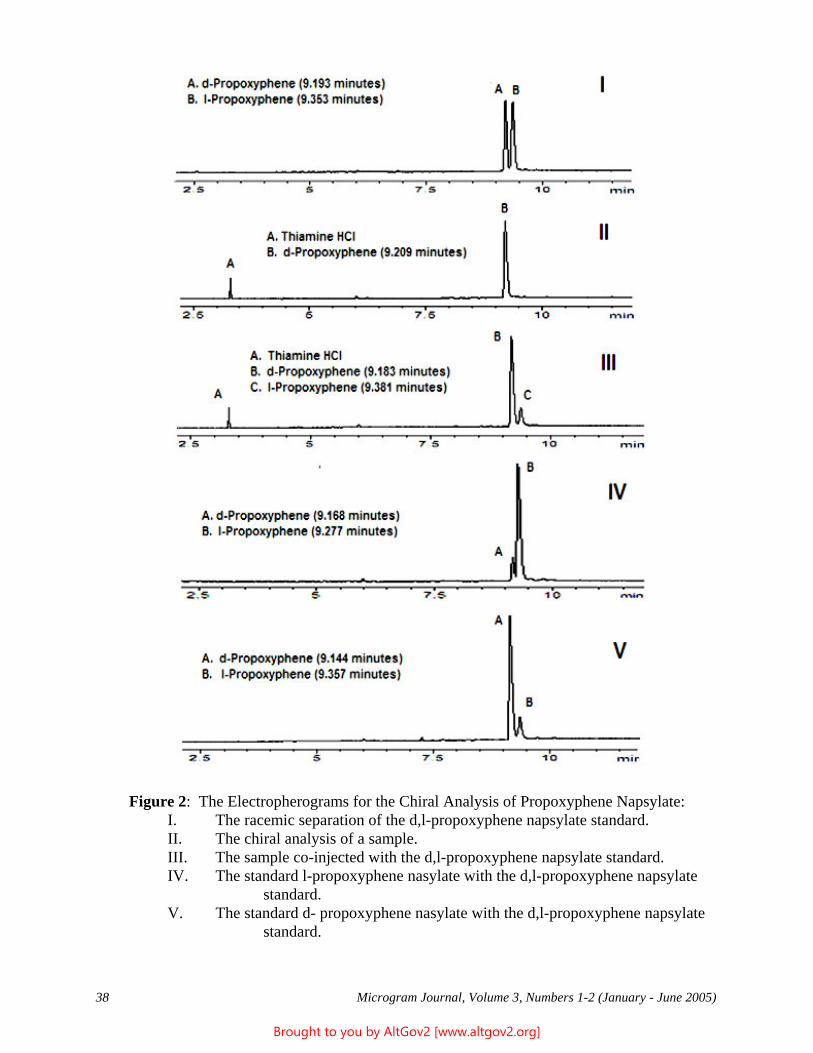
Figure 2: The Electropherograms for the Chiral Analysis of Propoxyphene Napsylate: I. The racemic separation of the d,l-propoxyphene napsylate standard. II. The chiral analysis of a sample. III. The sample co-injected with the d,l-propoxyphene napsylate standard. IV. The standard l-propoxyphene nasylate with the d,l-propoxyphene napsylate
standard. V. The standard d- propoxyphene nasylate with the d,l-propoxyphene napsylate
standard.
Microgram Journal, Volume 3, Numbers 1-2 (January - June 2005) 38
Brought to you by AltGov2 [www.altgov2.org]
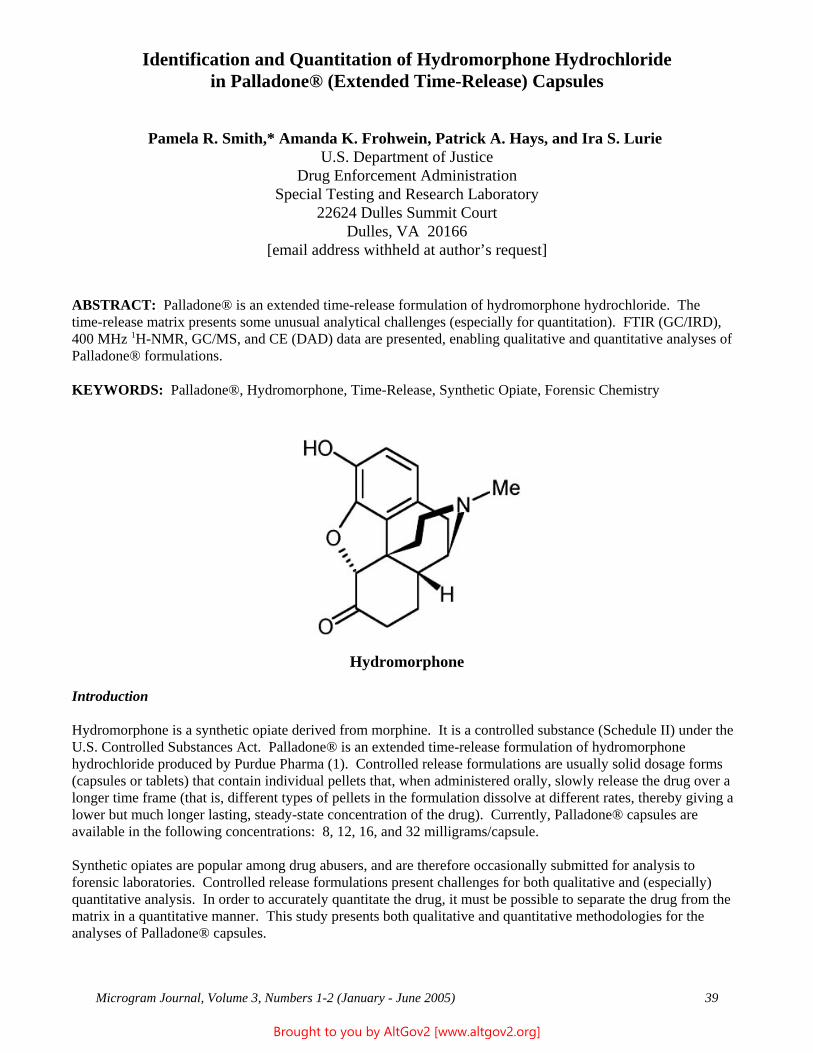
Identification and Quantitation of Hydromorphone Hydrochloride in Palladone® (Extended Time-Release) Capsules
Pamela R. Smith,* Amanda K. Frohwein, Patrick A. Hays, and Ira S. Lurie U.S. Department of Justice
Drug Enforcement Administration Special Testing and Research Laboratory
22624 Dulles Summit Court Dulles, VA 20166
[email address withheld at author’s request]
ABSTRACT: Palladone® is an extended time-release formulation of hydromorphone hydrochloride. The time-release matrix presents some unusual analytical challenges (especially for quantitation). FTIR (GC/IRD), 400 MHz 1H-NMR, GC/MS, and CE (DAD) data are presented, enabling qualitative and quantitative analyses of Palladone® formulations.
KEYWORDS: Palladone®, Hydromorphone, Time-Release, Synthetic Opiate, Forensic Chemistry
Hydromorphone
Introduction
Hydromorphone is a synthetic opiate derived from morphine. It is a controlled substance (Schedule II) under the U.S. Controlled Substances Act. Palladone® is an extended time-release formulation of hydromorphone hydrochloride produced by Purdue Pharma (1). Controlled release formulations are usually solid dosage forms (capsules or tablets) that contain individual pellets that, when administered orally, slowly release the drug over a longer time frame (that is, different types of pellets in the formulation dissolve at different rates, thereby giving a lower but much longer lasting, steady-state concentration of the drug). Currently, Palladone® capsules are available in the following concentrations: 8, 12, 16, and 32 milligrams/capsule.
Synthetic opiates are popular among drug abusers, and are therefore occasionally submitted for analysis to forensic laboratories. Controlled release formulations present challenges for both qualitative and (especially) quantitative analysis. In order to accurately quantitate the drug, it must be possible to separate the drug from the matrix in a quantitative manner. This study presents both qualitative and quantitative methodologies for the analyses of Palladone® capsules.
Microgram Journal, Volume 3, Numbers 1-2 (January - June 2005) 39
Brought to you by AltGov2 [www.altgov2.org]
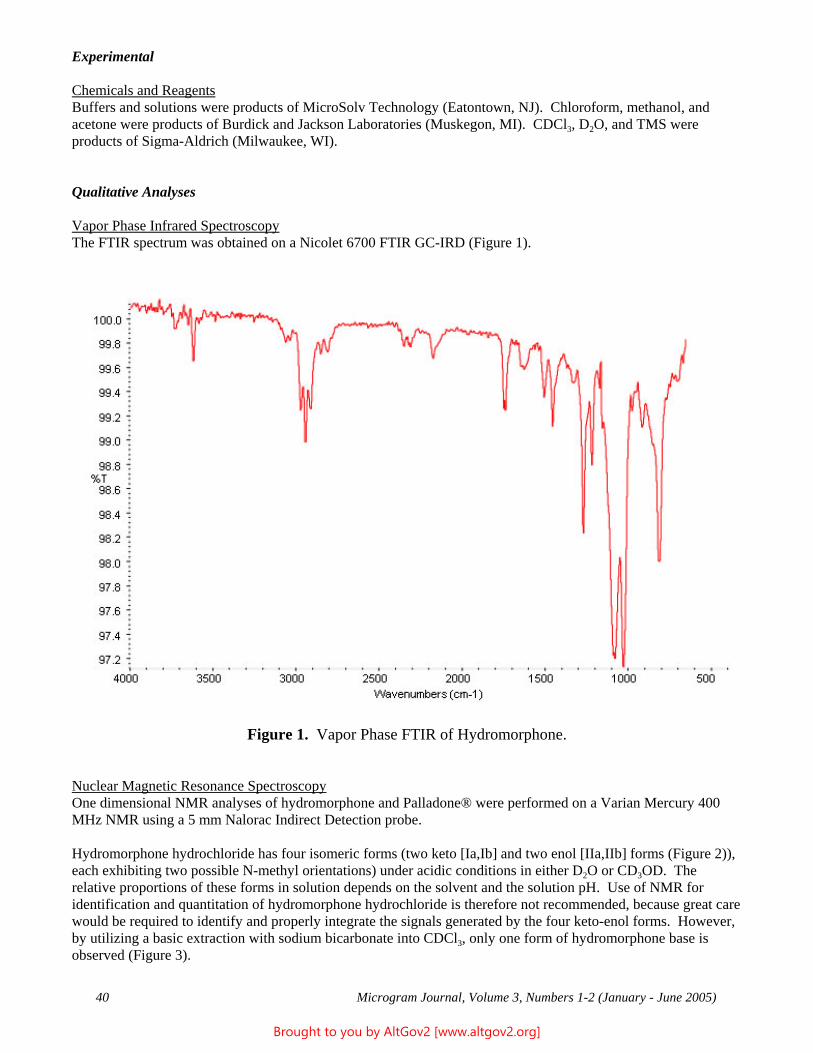
Experimental
Chemicals and Reagents Buffers and solutions were products of MicroSolv Technology (Eatontown, NJ). Chloroform, methanol, and acetone were products of Burdick and Jackson Laboratories (Muskegon, MI). CDCl3, D2O, and TMS were products of Sigma-Aldrich (Milwaukee, WI).
Qualitative Analyses
Vapor Phase Infrared Spectroscopy The FTIR spectrum was obtained on a Nicolet 6700 FTIR GC-IRD (Figure 1).
Figure 1. Vapor Phase FTIR of Hydromorphone.
Nuclear Magnetic Resonance Spectroscopy One dimensional NMR analyses of hydromorphone and Palladone® were performed on a Varian Mercury 400 MHz NMR using a 5 mm Nalorac Indirect Detection probe.
Hydromorphone hydrochloride has four isomeric forms (two keto [Ia,Ib] and two enol [IIa,IIb] forms (Figure 2)), each exhibiting two possible N-methyl orientations) under acidic conditions in either D2O or CD3OD. The relative proportions of these forms in solution depends on the solvent and the solution pH. Use of NMR for identification and quantitation of hydromorphone hydrochloride is therefore not recommended, because great care would be required to identify and properly integrate the signals generated by the four keto-enol forms. However, by utilizing a basic extraction with sodium bicarbonate into CDCl3, only one form of hydromorphone base is observed (Figure 3).
Microgram Journal, Volume 3, Numbers 1-2 (January - June 2005) 40
Brought to you by AltGov2 [www.altgov2.org]
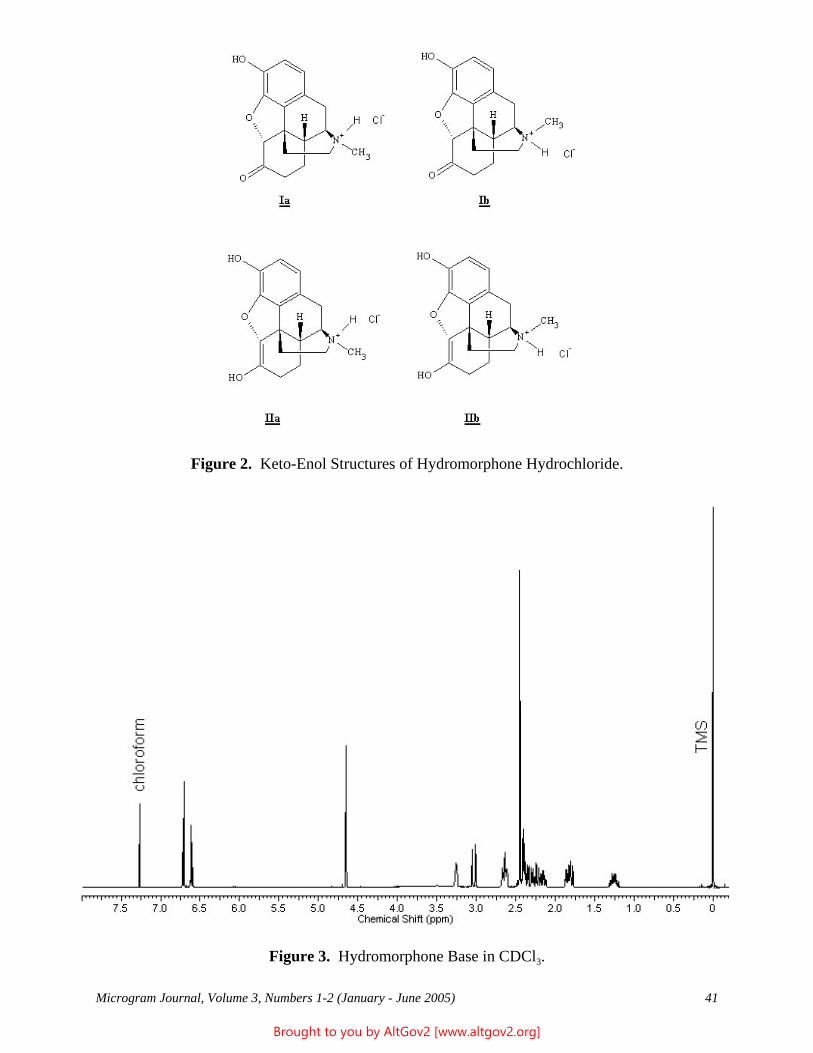
Figure 2. Keto-Enol Structures of Hydromorphone Hydrochloride.
Figure 3. Hydromorphone Base in CDCl3.
Microgram Journal, Volume 3, Numbers 1-2 (January - June 2005) 41
Brought to you by AltGov2 [www.altgov2.org]
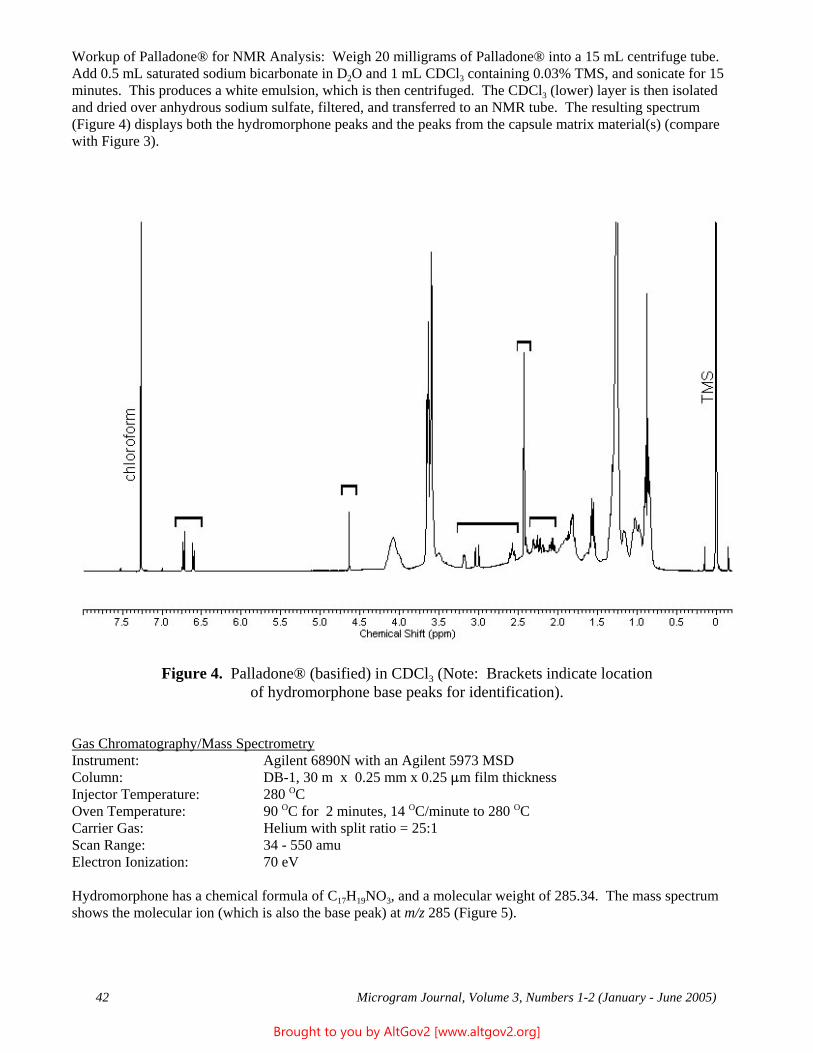
Workup of Palladone® for NMR Analysis: Weigh 20 milligrams of Palladone® into a 15 mL centrifuge tube. Add 0.5 mL saturated sodium bicarbonate in D2O and 1 mL CDCl3 containing 0.03% TMS, and sonicate for 15 minutes. This produces a white emulsion, which is then centrifuged. The CDCl3 (lower) layer is then isolated and dried over anhydrous sodium sulfate, filtered, and transferred to an NMR tube. The resulting spectrum (Figure 4) displays both the hydromorphone peaks and the peaks from the capsule matrix material(s) (compare with Figure 3).
Figure 4. Palladone® (basified) in CDCl3 (Note: Brackets indicate location of hydromorphone base peaks for identification).
Gas Chromatography/Mass Spectrometry Instrument: Agilent 6890N with an Agilent 5973 MSD Column: DB-1, 30 m x 0.25 mm x 0.25 :m film thickness Injector Temperature: 280 OC Oven Temperature: 90 OC for 2 minutes, 14 OC/minute to 280 OC Carrier Gas: Helium with split ratio = 25:1 Scan Range: 34 - 550 amu Electron Ionization: 70 eV
Hydromorphone has a chemical formula of C17H19NO3, and a molecular weight of 285.34. The mass spectrum shows the molecular ion (which is also the base peak) at m/z 285 (Figure 5).
Microgram Journal, Volume 3, Numbers 1-2 (January - June 2005) 42
Brought to you by AltGov2 [www.altgov2.org]
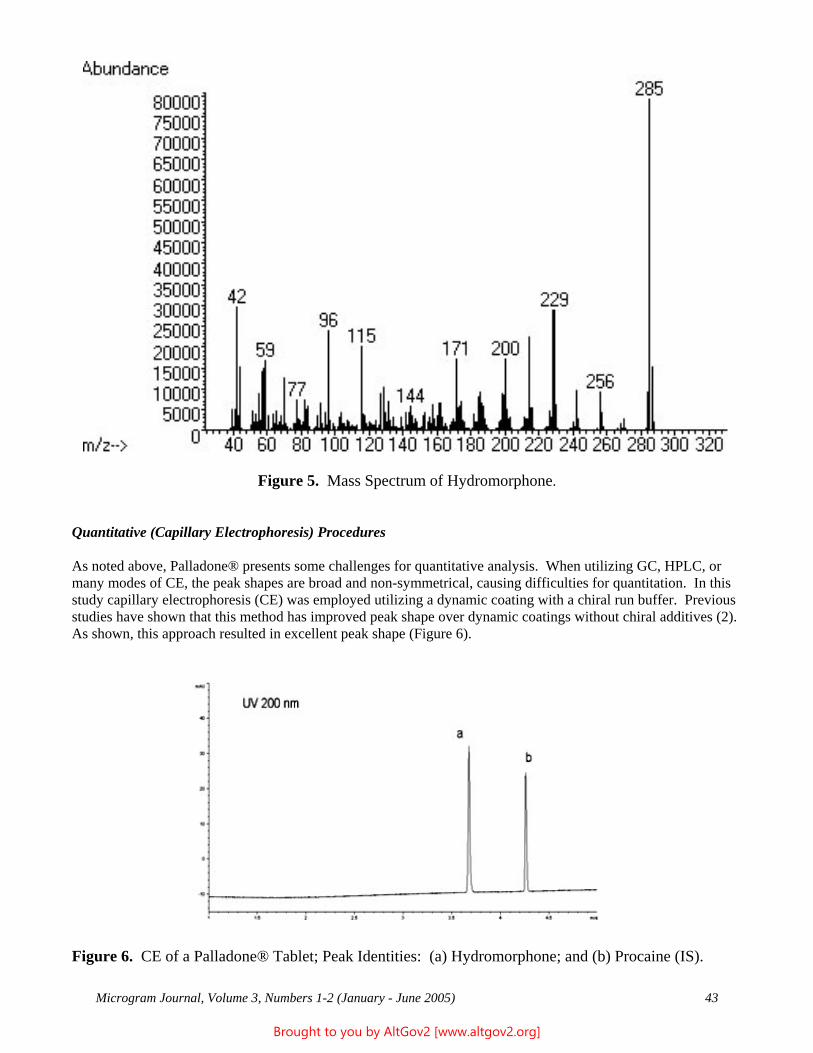
Figure 5. Mass Spectrum of Hydromorphone.
Quantitative (Capillary Electrophoresis) Procedures
As noted above, Palladone® presents some challenges for quantitative analysis. When utilizing GC, HPLC, or many modes of CE, the peak shapes are broad and non-symmetrical, causing difficulties for quantitation. In this study capillary electrophoresis (CE) was employed utilizing a dynamic coating with a chiral run buffer. Previous studies have shown that this method has improved peak shape over dynamic coatings without chiral additives (2). As shown, this approach resulted in excellent peak shape (Figure 6).
Figure 6. CE of a Palladone® Tablet; Peak Identities: (a) Hydromorphone; and (b) Procaine (IS).
Microgram Journal, Volume 3, Numbers 1-2 (January - June 2005) 43
Brought to you by AltGov2 [www.altgov2.org]
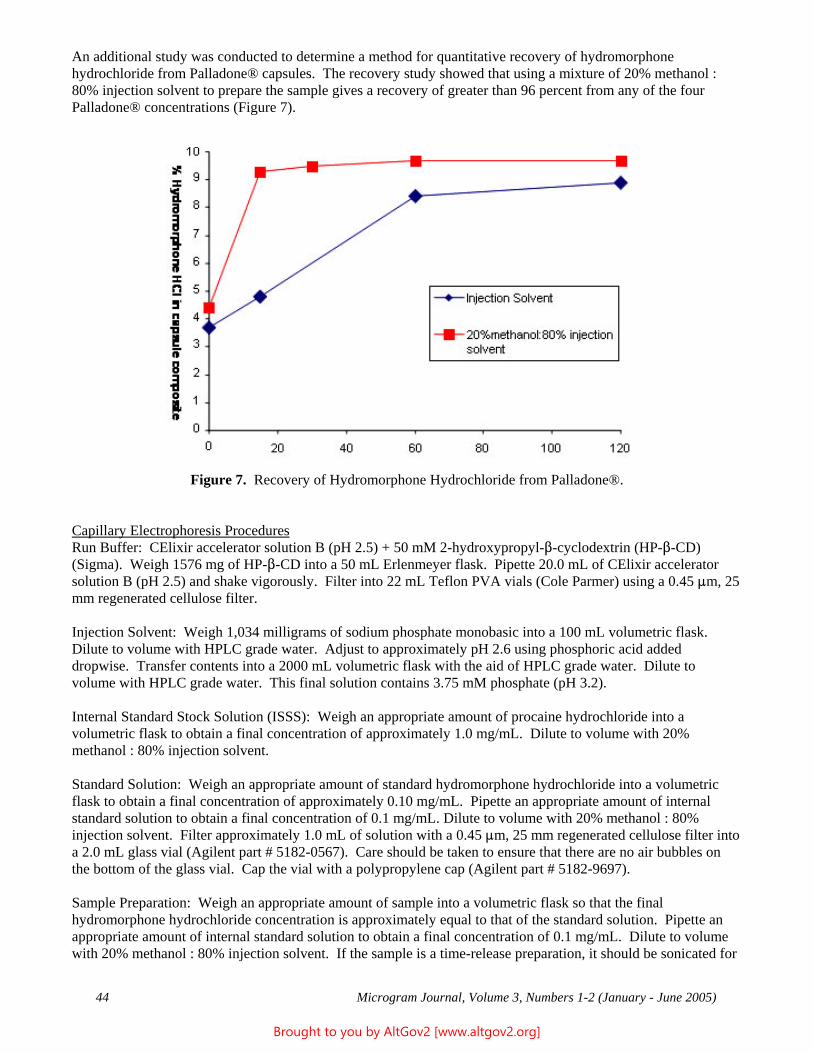
An additional study was conducted to determine a method for quantitative recovery of hydromorphone hydrochloride from Palladone® capsules. The recovery study showed that using a mixture of 20% methanol : 80% injection solvent to prepare the sample gives a recovery of greater than 96 percent from any of the four Palladone® concentrations (Figure 7).
Figure 7. Recovery of Hydromorphone Hydrochloride from Palladone®.
Capillary Electrophoresis Procedures Run Buffer: CElixir accelerator solution B (pH 2.5) + 50 mM 2-hydroxypropyl-$-cyclodextrin (HP-$-CD) (Sigma). Weigh 1576 mg of HP-$-CD into a 50 mL Erlenmeyer flask. Pipette 20.0 mL of CElixir accelerator solution B (pH 2.5) and shake vigorously. Filter into 22 mL Teflon PVA vials (Cole Parmer) using a 0.45 :m, 25 mm regenerated cellulose filter.
Injection Solvent: Weigh 1,034 milligrams of sodium phosphate monobasic into a 100 mL volumetric flask. Dilute to volume with HPLC grade water. Adjust to approximately pH 2.6 using phosphoric acid added dropwise. Transfer contents into a 2000 mL volumetric flask with the aid of HPLC grade water. Dilute to volume with HPLC grade water. This final solution contains 3.75 mM phosphate (pH 3.2).
Internal Standard Stock Solution (ISSS): Weigh an appropriate amount of procaine hydrochloride into a volumetric flask to obtain a final concentration of approximately 1.0 mg/mL. Dilute to volume with 20% methanol : 80% injection solvent.
Standard Solution: Weigh an appropriate amount of standard hydromorphone hydrochloride into a volumetric flask to obtain a final concentration of approximately 0.10 mg/mL. Pipette an appropriate amount of internal standard solution to obtain a final concentration of 0.1 mg/mL. Dilute to volume with 20% methanol : 80% injection solvent. Filter approximately 1.0 mL of solution with a 0.45 :m, 25 mm regenerated cellulose filter into a 2.0 mL glass vial (Agilent part # 5182-0567). Care should be taken to ensure that there are no air bubbles on the bottom of the glass vial. Cap the vial with a polypropylene cap (Agilent part # 5182-9697).
Sample Preparation: Weigh an appropriate amount of sample into a volumetric flask so that the final hydromorphone hydrochloride concentration is approximately equal to that of the standard solution. Pipette an appropriate amount of internal standard solution to obtain a final concentration of 0.1 mg/mL. Dilute to volume with 20% methanol : 80% injection solvent. If the sample is a time-release preparation, it should be sonicated for
Microgram Journal, Volume 3, Numbers 1-2 (January - June 2005) 44
Brought to you by AltGov2 [www.altgov2.org]
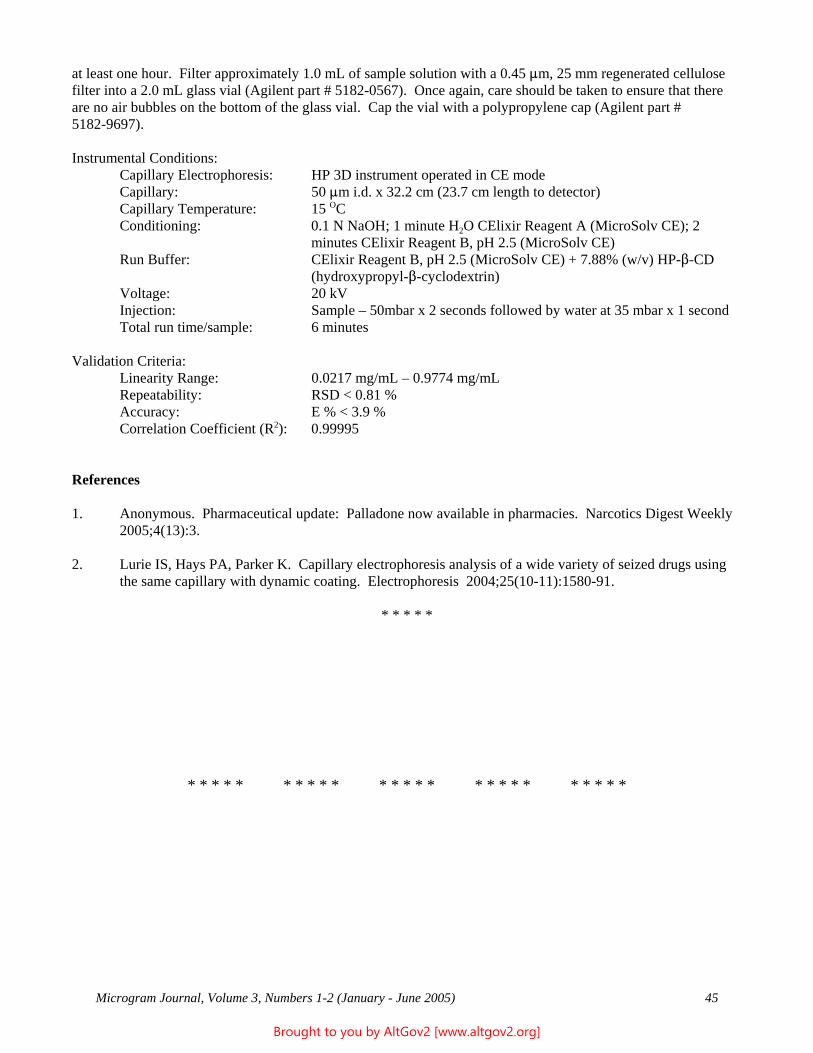
at least one hour. Filter approximately 1.0 mL of sample solution with a 0.45 :m, 25 mm regenerated cellulose filter into a 2.0 mL glass vial (Agilent part # 5182-0567). Once again, care should be taken to ensure that there are no air bubbles on the bottom of the glass vial. Cap the vial with a polypropylene cap (Agilent part # 5182-9697).
Instrumental Conditions: Capillary Electrophoresis: HP 3D instrument operated in CE mode Capillary: 50 :m i.d. x 32.2 cm (23.7 cm length to detector) Capillary Temperature: 15 OC Conditioning: 0.1 N NaOH; 1 minute H2O CElixir Reagent A (MicroSolv CE); 2
minutes CElixir Reagent B, pH 2.5 (MicroSolv CE) Run Buffer: CElixir Reagent B, pH 2.5 (MicroSolv CE) + 7.88% (w/v) HP-$-CD
(hydroxypropyl-$-cyclodextrin) Voltage: 20 kV Injection: Sample – 50mbar x 2 seconds followed by water at 35 mbar x 1 second Total run time/sample: 6 minutes
Validation Criteria: Linearity Range: 0.0217 mg/mL – 0.9774 mg/mL Repeatability: RSD < 0.81 % Accuracy: E % < 3.9 % Correlation Coefficient (R2): 0.99995
References
1. Anonymous. Pharmaceutical update: Palladone now available in pharmacies. Narcotics Digest Weekly 2005;4(13):3.
2. Lurie IS, Hays PA, Parker K. Capillary electrophoresis analysis of a wide variety of seized drugs using the same capillary with dynamic coating. Electrophoresis 2004;25(10-11):1580-91.
* * * * *
* * * * * * * * * * * * * * * * * * * * * * * * *
Microgram Journal, Volume 3, Numbers 1-2 (January - June 2005) 45
Brought to you by AltGov2 [www.altgov2.org]
gamma-Hydroxybutyrate, Silver Salt (AgGHB): Identification of gamma-Hydroxybutyrate (GHB) via Conversion to the Silver Salt
James V. DeFrancesco U.S. Department of Justice
Drug Enforcement Administration North Central Laboratory 536 S. Clark St., Suite 800
Chicago, IL 60605 [email: james.v.defrancesco -at- usdoj.gov]
ABSTRACT: A practical method for the identification of gamma-hydroxybutyrate (GHB) via infrared analysis of the corresponding silver salt is presented. The method is facile and robust, and complements the GC/MS analysis of GHB derivatives.
KEYWORDS: gamma-Hydroxybutyrate, gamma-Hydroxybutyric Acid, GHB, Sodium Oxybate, Infrared Spectrophotometry, IR, Silver Nitrate, Precipitation, Derivatization, GC/MS, Forensic Chemistry
Introduction
The continuing abuse of gamma-hydroxybutyric acid (GHB) and gamma-hydroxybutyrate (also commonly abbreviated as “GHB”) has prompted the forensic community to develop an array of analytical methodologies to identify it in its various forms (1). As new salt forms of GHB have been encountered, forensic chemists have relied primarily on infrared spectrophotometry (IR) for identification (2-5). In conjunction with IR, derivatization of GHB (usually via silylation) with subsequent analysis by Gas Chromatography/Mass Spectrometry (GC/MS) has served as a complementary means of identification of the organic ligand (2).
The silver nitrate test has been a staple in the analytical laboratory for many years; however, its use is typically limited to the presumptive identification of simple halides and commonly encountered polyatomic ions by precipitation, often followed by a solubility test for the precipitate. This study was initiated to investigate the use the silver nitrate test as a fast and easy method to presumptively identify GHB in the field. However, the resulting silver salt precipitate (i.e., AgGHB) has proven to be quite valuable for more rigorous laboratory identification.
There are several advantages to converting GHB from a group I or II metal salt (e.g., LiGHB, NaGHB, KGHB, or Ca(GHB)2) into AgGHB. The most immediate and practical advantage is increased stability with respect to water absorption. The silver salt is far less hygroscopic than any of its group I or II metal counterparts. This property gives the analyst a much longer time frame in which to conduct further analyses. Thus, the preparation and direct characterization of the AgGHB salt directly by IR, or by subsequent derivatization followed by GC/MS analysis, increases the specificity and accuracy of the analysis.
Experimental
Intrumentation The IR spectra were collected by two instruments: A Nicolet 6700 FT-IR equipped with a single-bounce diamond ATR accessory, and (for KBr windows) with an ATI Mattson Genesis Series FT-IR. The GC/MS data were obtained using a Agilent 6890 GC equipped with a 5873 MSD (EI, 70 eV) and HP-5MS column (30 m long x 0.32 mm ID x 0.25 :m thickness) heated from 90 OC to 280 OC at 10 OC/minute.
Microgram Journal, Volume 3, Numbers 1-2 (January - June 2005) 46
Brought to you by AltGov2 [www.altgov2.org]
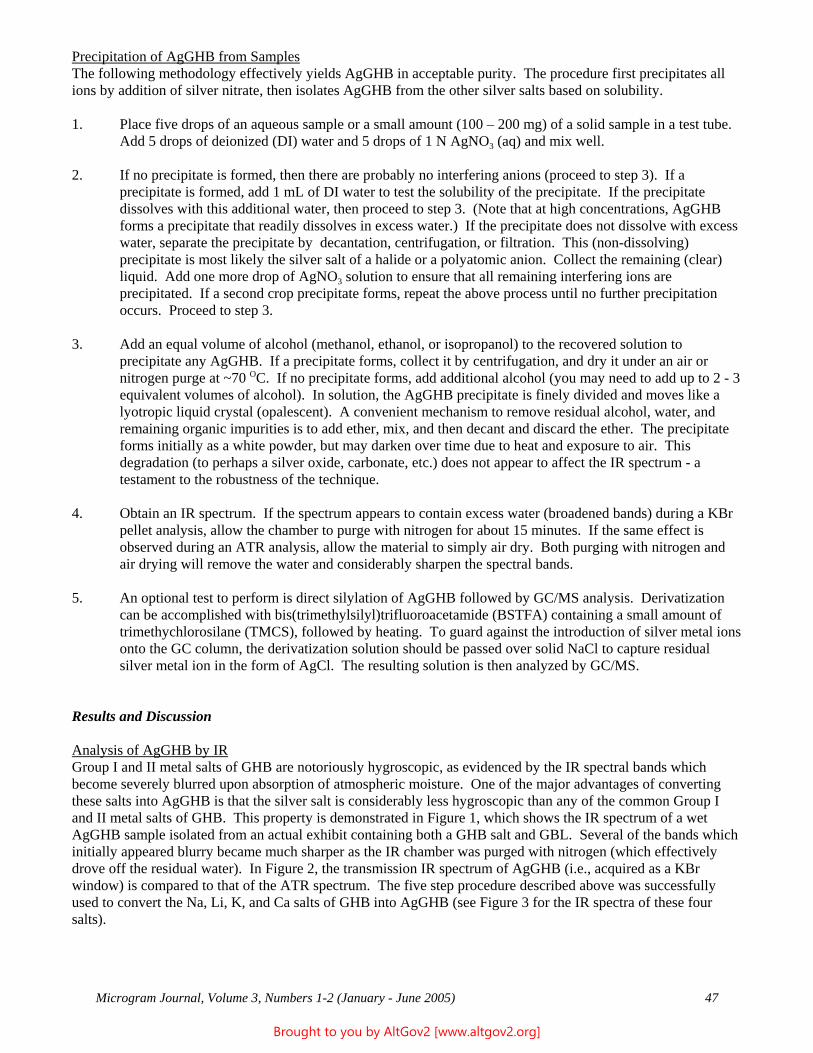
Precipitation of AgGHB from Samples The following methodology effectively yields AgGHB in acceptable purity. The procedure first precipitates all ions by addition of silver nitrate, then isolates AgGHB from the other silver salts based on solubility.
1. Place five drops of an aqueous sample or a small amount (100 – 200 mg) of a solid sample in a test tube. Add 5 drops of deionized (DI) water and 5 drops of 1 N AgNO3 (aq) and mix well.
2. If no precipitate is formed, then there are probably no interfering anions (proceed to step 3). If a precipitate is formed, add 1 mL of DI water to test the solubility of the precipitate. If the precipitate dissolves with this additional water, then proceed to step 3. (Note that at high concentrations, AgGHB forms a precipitate that readily dissolves in excess water.) If the precipitate does not dissolve with excess water, separate the precipitate by decantation, centrifugation, or filtration. This (non-dissolving) precipitate is most likely the silver salt of a halide or a polyatomic anion. Collect the remaining (clear) liquid. Add one more drop of AgNO3 solution to ensure that all remaining interfering ions are precipitated. If a second crop precipitate forms, repeat the above process until no further precipitation occurs. Proceed to step 3.
3. Add an equal volume of alcohol (methanol, ethanol, or isopropanol) to the recovered solution to precipitate any AgGHB. If a precipitate forms, collect it by centrifugation, and dry it under an air or nitrogen purge at ~70 OC. If no precipitate forms, add additional alcohol (you may need to add up to 2 - 3 equivalent volumes of alcohol). In solution, the AgGHB precipitate is finely divided and moves like a lyotropic liquid crystal (opalescent). A convenient mechanism to remove residual alcohol, water, and remaining organic impurities is to add ether, mix, and then decant and discard the ether. The precipitate forms initially as a white powder, but may darken over time due to heat and exposure to air. This degradation (to perhaps a silver oxide, carbonate, etc.) does not appear to affect the IR spectrum - a testament to the robustness of the technique.
4. Obtain an IR spectrum. If the spectrum appears to contain excess water (broadened bands) during a KBr pellet analysis, allow the chamber to purge with nitrogen for about 15 minutes. If the same effect is observed during an ATR analysis, allow the material to simply air dry. Both purging with nitrogen and air drying will remove the water and considerably sharpen the spectral bands.
5. An optional test to perform is direct silylation of AgGHB followed by GC/MS analysis. Derivatization can be accomplished with bis(trimethylsilyl)trifluoroacetamide (BSTFA) containing a small amount of trimethychlorosilane (TMCS), followed by heating. To guard against the introduction of silver metal ions onto the GC column, the derivatization solution should be passed over solid NaCl to capture residual silver metal ion in the form of AgCl. The resulting solution is then analyzed by GC/MS.
Results and Discussion
Analysis of AgGHB by IR Group I and II metal salts of GHB are notoriously hygroscopic, as evidenced by the IR spectral bands which become severely blurred upon absorption of atmospheric moisture. One of the major advantages of converting these salts into AgGHB is that the silver salt is considerably less hygroscopic than any of the common Group I and II metal salts of GHB. This property is demonstrated in Figure 1, which shows the IR spectrum of a wet AgGHB sample isolated from an actual exhibit containing both a GHB salt and GBL. Several of the bands which initially appeared blurry became much sharper as the IR chamber was purged with nitrogen (which effectively drove off the residual water). In Figure 2, the transmission IR spectrum of AgGHB (i.e., acquired as a KBr window) is compared to that of the ATR spectrum. The five step procedure described above was successfully used to convert the Na, Li, K, and Ca salts of GHB into AgGHB (see Figure 3 for the IR spectra of these four salts).
Microgram Journal, Volume 3, Numbers 1-2 (January - June 2005) 47
Brought to you by AltGov2 [www.altgov2.org]
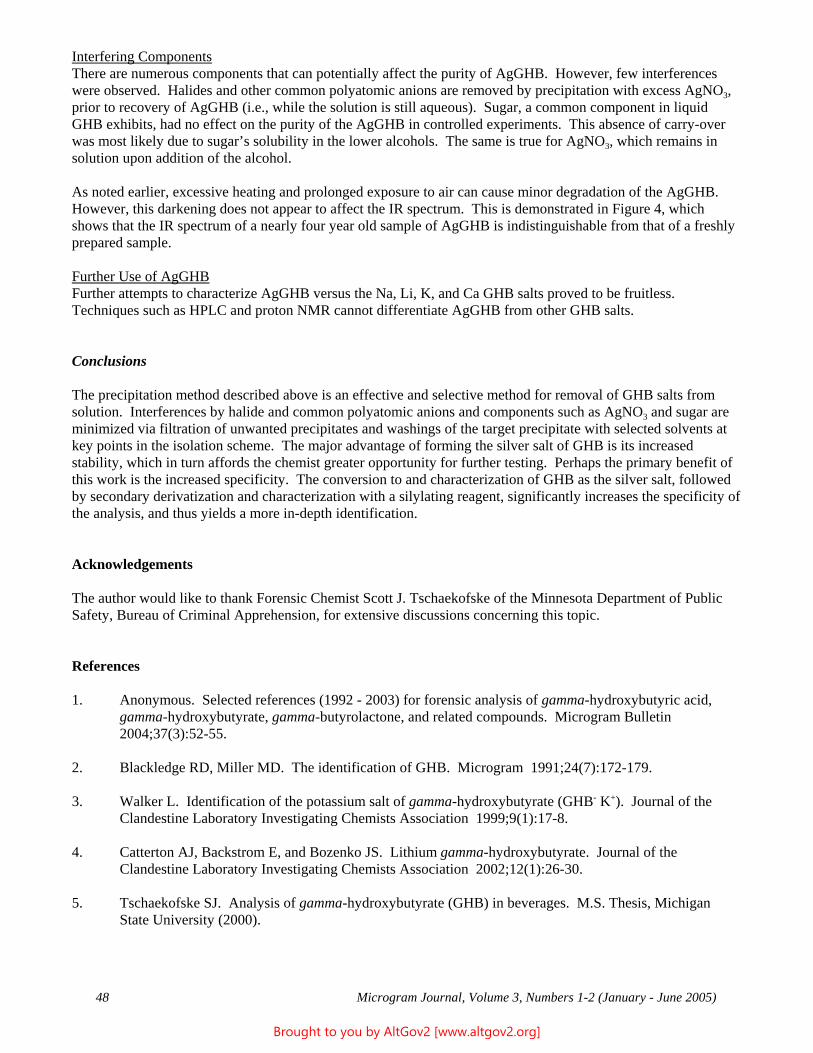
Interfering Components There are numerous components that can potentially affect the purity of AgGHB. However, few interferences were observed. Halides and other common polyatomic anions are removed by precipitation with excess AgNO3, prior to recovery of AgGHB (i.e., while the solution is still aqueous). Sugar, a common component in liquid GHB exhibits, had no effect on the purity of the AgGHB in controlled experiments. This absence of carry-over was most likely due to sugar’s solubility in the lower alcohols. The same is true for AgNO3, which remains in solution upon addition of the alcohol.
As noted earlier, excessive heating and prolonged exposure to air can cause minor degradation of the AgGHB. However, this darkening does not appear to affect the IR spectrum. This is demonstrated in Figure 4, whichshows that the IR spectrum of a nearly four year old sample of AgGHB is indistinguishable from that of a freshlyprepared sample.
Further Use of AgGHBFurther attempts to characterize AgGHB versus the Na, Li, K, and Ca GHB salts proved to be fruitless. Techniques such as HPLC and proton NMR cannot differentiate AgGHB from other GHB salts.
Conclusions
The precipitation method described above is an effective and selective method for removal of GHB salts from solution. Interferences by halide and common polyatomic anions and components such as AgNO3 and sugar are minimized via filtration of unwanted precipitates and washings of the target precipitate with selected solvents at key points in the isolation scheme. The major advantage of forming the silver salt of GHB is its increased stability, which in turn affords the chemist greater opportunity for further testing. Perhaps the primary benefit of this work is the increased specificity. The conversion to and characterization of GHB as the silver salt, followed by secondary derivatization and characterization with a silylating reagent, significantly increases the specificity of the analysis, and thus yields a more in-depth identification.
Acknowledgements
The author would like to thank Forensic Chemist Scott J. Tschaekofske of the Minnesota Department of Public Safety, Bureau of Criminal Apprehension, for extensive discussions concerning this topic.
References
1. Anonymous. Selected references (1992 - 2003) for forensic analysis of gamma-hydroxybutyric acid, gamma-hydroxybutyrate, gamma-butyrolactone, and related compounds. Microgram Bulletin 2004;37(3):52-55.
2. Blackledge RD, Miller MD. The identification of GHB. Microgram 1991;24(7):172-179.
3. Walker L. Identification of the potassium salt of gamma-hydroxybutyrate (GHB- K+). Journal of the Clandestine Laboratory Investigating Chemists Association 1999;9(1):17-8.
4. Catterton AJ, Backstrom E, and Bozenko JS. Lithium gamma-hydroxybutyrate. Journal of the Clandestine Laboratory Investigating Chemists Association 2002;12(1):26-30.
5. Tschaekofske SJ. Analysis of gamma-hydroxybutyrate (GHB) in beverages. M.S. Thesis, Michigan State University (2000).
Microgram Journal, Volume 3, Numbers 1-2 (January - June 2005) 48
Brought to you by AltGov2 [www.altgov2.org]
Figure 1: Effect of Moisture on IR Spectrum of AgGHB (Transmission).
* * * * *
Microgram Journal, Volume 3, Numbers 1-2 (January - June 2005) 49
Brought to you by AltGov2 [www.altgov2.org]
Figure 2: Transmission and Reflectance IR Spectra of AgGHB.
* * * * *
Microgram Journal, Volume 3, Numbers 1-2 (January - June 2005) 50
Brought to you by AltGov2 [www.altgov2.org]
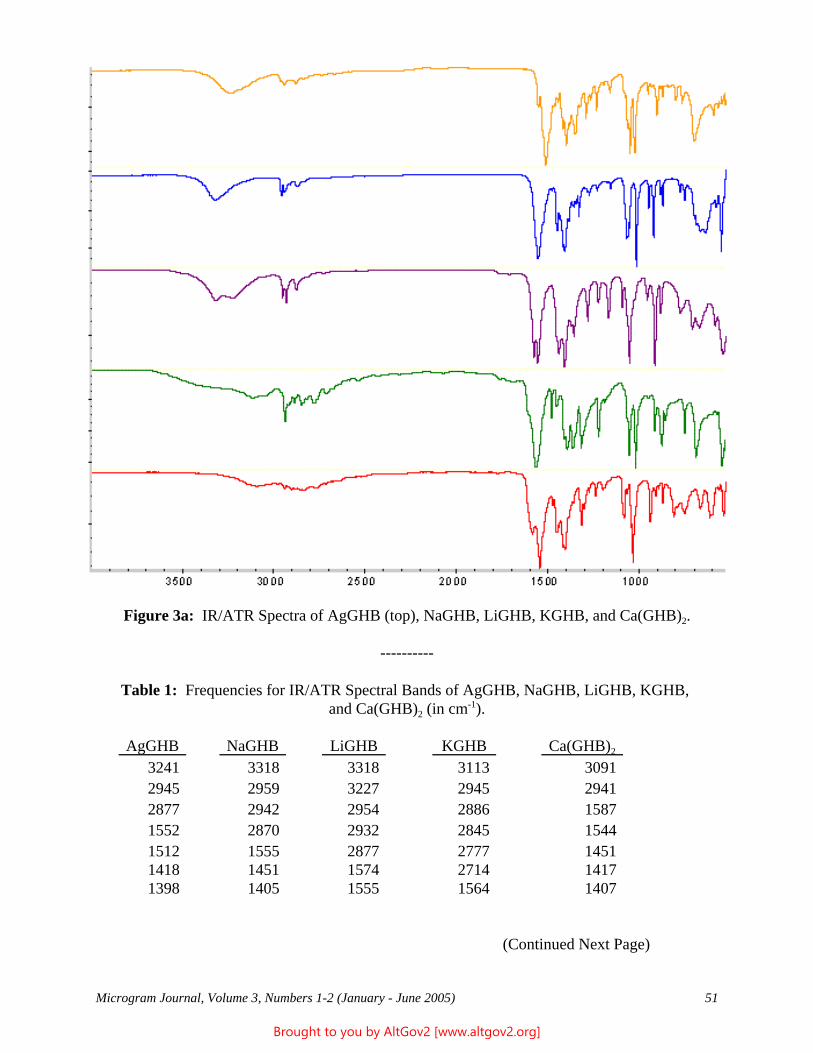
----------
Figure 3a: IR/ATR Spectra of AgGHB (top), NaGHB, LiGHB, KGHB, and Ca(GHB)2.
Table 1: Frequencies for IR/ATR Spectral Bands of AgGHB, NaGHB, LiGHB, KGHB, and Ca(GHB)2 (in cm-1).
AgGHB NaGHB LiGHB KGHB Ca(GHB)2
3241 3318 3318 3113 3091 2945 2959 3227 2945 2941 2877 2942 2954 2886 1587 1552 2870 2932 2845 1544 1512 1555 2877 2777 1451 1418 1451 1574 2714 1417 1398 1405 1555 1564 1407
(Continued Next Page)
Microgram Journal, Volume 3, Numbers 1-2 (January - June 2005) 51
Brought to you by AltGov2 [www.altgov2.org]
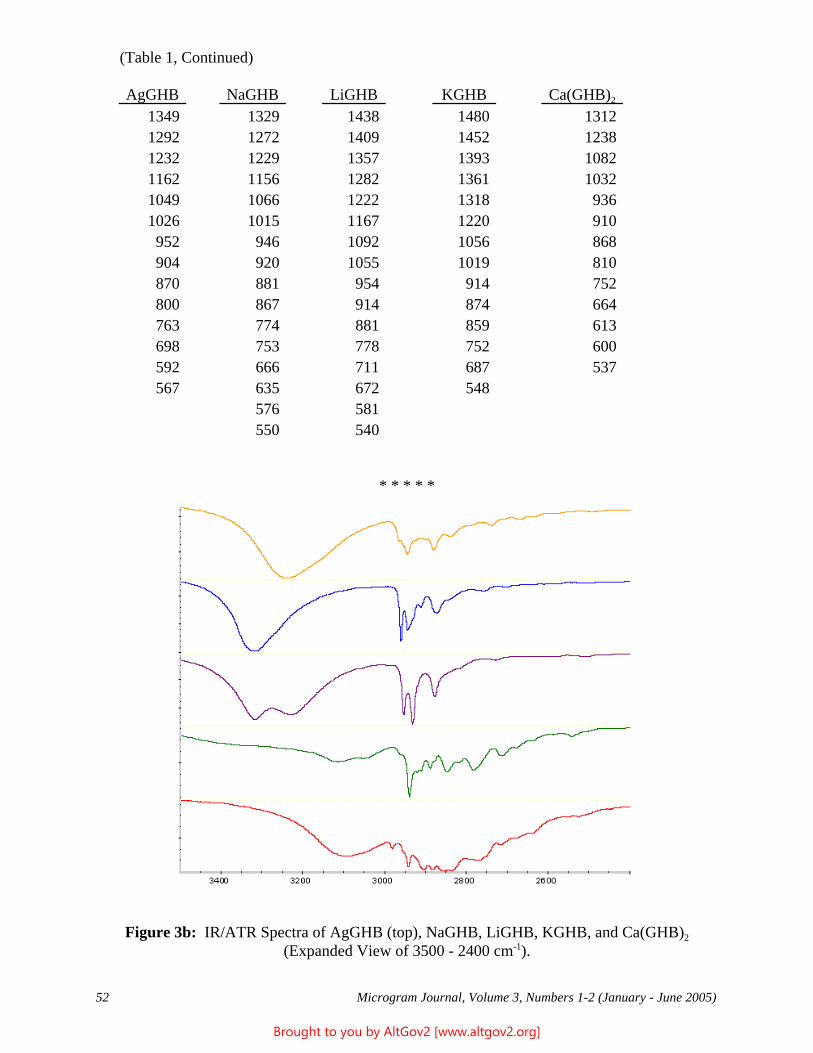
(Table 1, Continued)
AgGHB NaGHB LiGHB KGHB Ca(GHB)2
1349 1329 1438 1480 1312 1292 1272 1409 1452 1238 1232 1229 1357 1393 1082 1162 1156 1282 1361 1032 1049 1066 1222 1318 936 1026 1015 1167 1220 910 952 946 1092 1056 868 904 920 1055 1019 810 870 881 954 914 752 800 867 914 874 664 763 774 881 859 613 698 753 778 752 600 592 666 711 687 537 567 635 672 548
576 581 550 540
* * * * *
Figure 3b: IR/ATR Spectra of AgGHB (top), NaGHB, LiGHB, KGHB, and Ca(GHB)2 (Expanded View of 3500 - 2400 cm-1).
Microgram Journal, Volume 3, Numbers 1-2 (January - June 2005) 52
Brought to you by AltGov2 [www.altgov2.org]
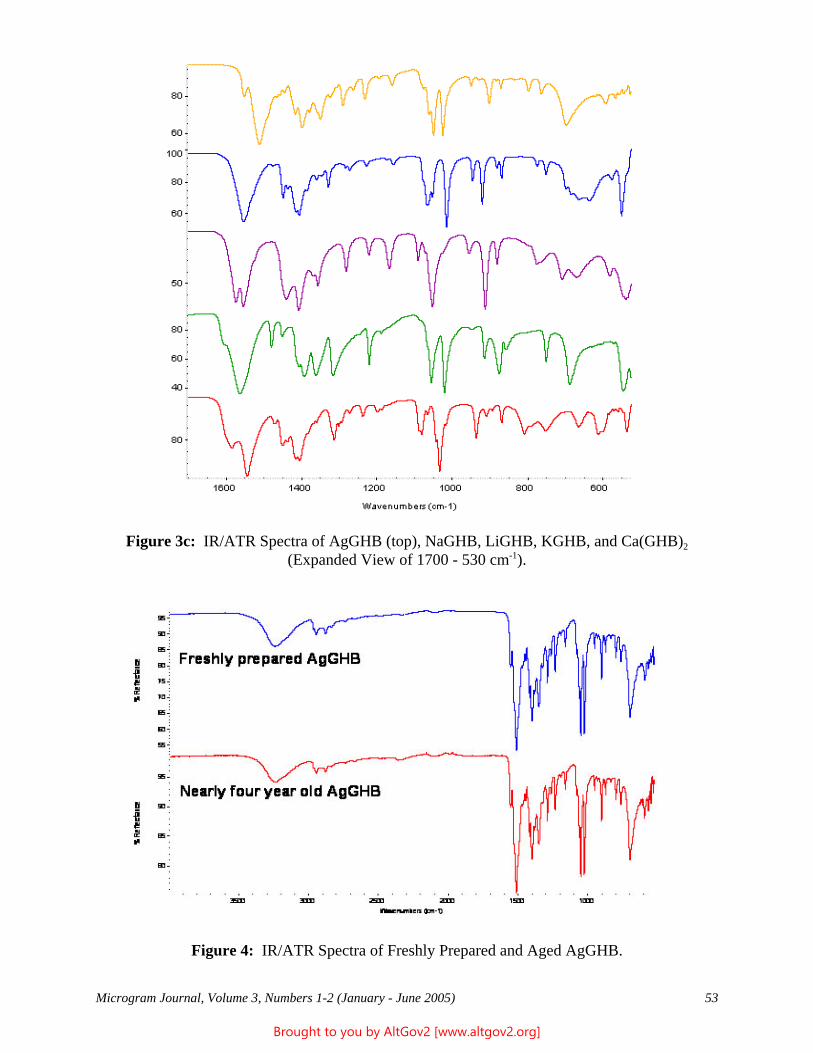
Figure 3c: IR/ATR Spectra of AgGHB (top), NaGHB, LiGHB, KGHB, and Ca(GHB)2 (Expanded View of 1700 - 530 cm-1).
Figure 4: IR/ATR Spectra of Freshly Prepared and Aged AgGHB.
Microgram Journal, Volume 3, Numbers 1-2 (January - June 2005) 53
Brought to you by AltGov2 [www.altgov2.org]
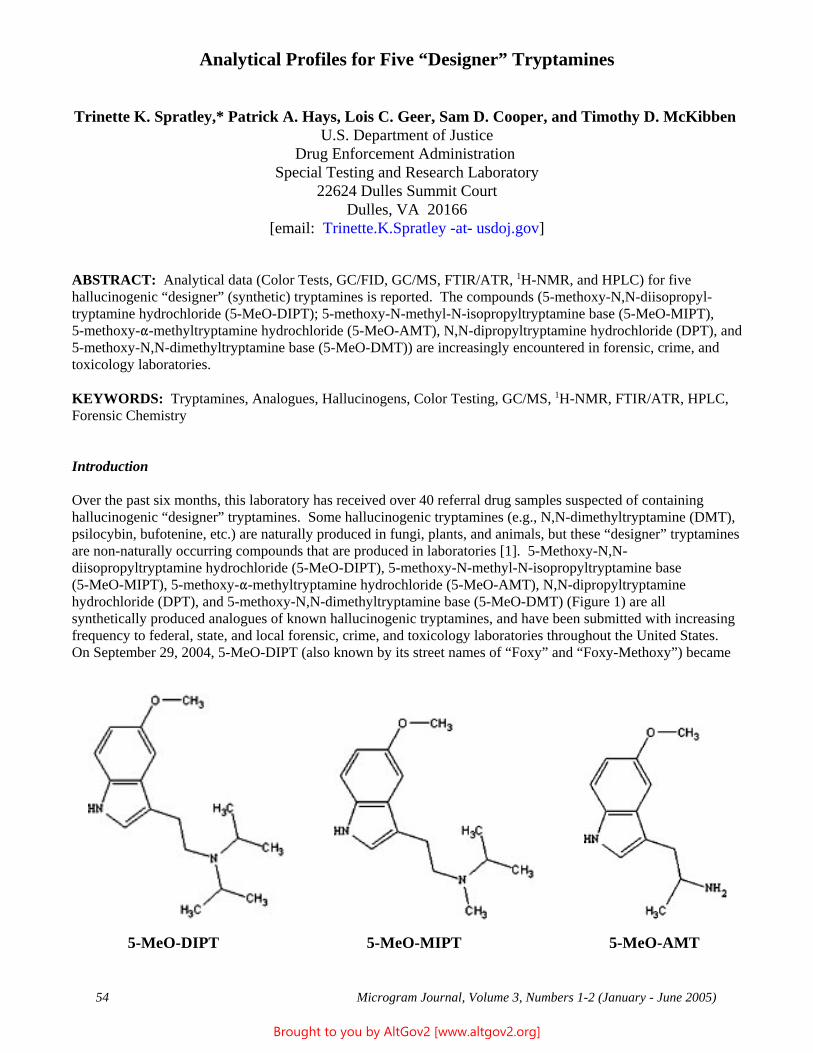
Analytical Profiles for Five “Designer” Tryptamines
Trinette K. Spratley,* Patrick A. Hays, Lois C. Geer, Sam D. Cooper, and Timothy D. McKibben U.S. Department of Justice
Drug Enforcement Administration Special Testing and Research Laboratory
22624 Dulles Summit Court Dulles, VA 20166
[email: Trinette.K.Spratley -at- usdoj.gov]
ABSTRACT: Analytical data (Color Tests, GC/FID, GC/MS, FTIR/ATR, 1H-NMR, and HPLC) for five hallucinogenic “designer” (synthetic) tryptamines is reported. The compounds (5-methoxy-N,N-diisopropyl-tryptamine hydrochloride (5-MeO-DIPT); 5-methoxy-N-methyl-N-isopropyltryptamine base (5-MeO-MIPT), 5-methoxy-"-methyltryptamine hydrochloride (5-MeO-AMT), N,N-dipropyltryptamine hydrochloride (DPT), and 5-methoxy-N,N-dimethyltryptamine base (5-MeO-DMT)) are increasingly encountered in forensic, crime, and toxicology laboratories.
KEYWORDS: Tryptamines, Analogues, Hallucinogens, Color Testing, GC/MS, 1H-NMR, FTIR/ATR, HPLC, Forensic Chemistry
Introduction
Over the past six months, this laboratory has received over 40 referral drug samples suspected of containing hallucinogenic “designer” tryptamines. Some hallucinogenic tryptamines (e.g., N,N-dimethyltryptamine (DMT), psilocybin, bufotenine, etc.) are naturally produced in fungi, plants, and animals, but these “designer” tryptamines are non-naturally occurring compounds that are produced in laboratories [1]. 5-Methoxy-N,N-diisopropyltryptamine hydrochloride (5-MeO-DIPT), 5-methoxy-N-methyl-N-isopropyltryptamine base (5-MeO-MIPT), 5-methoxy-"-methyltryptamine hydrochloride (5-MeO-AMT), N,N-dipropyltryptamine hydrochloride (DPT), and 5-methoxy-N,N-dimethyltryptamine base (5-MeO-DMT) (Figure 1) are all synthetically produced analogues of known hallucinogenic tryptamines, and have been submitted with increasing frequency to federal, state, and local forensic, crime, and toxicology laboratories throughout the United States. On September 29, 2004, 5-MeO-DIPT (also known by its street names of “Foxy” and “Foxy-Methoxy”) became
5-MeO-DIPT 5-MeO-MIPT 5-MeO-AMT
Microgram Journal, Volume 3, Numbers 1-2 (January - June 2005) 54
Brought to you by AltGov2 [www.altgov2.org]
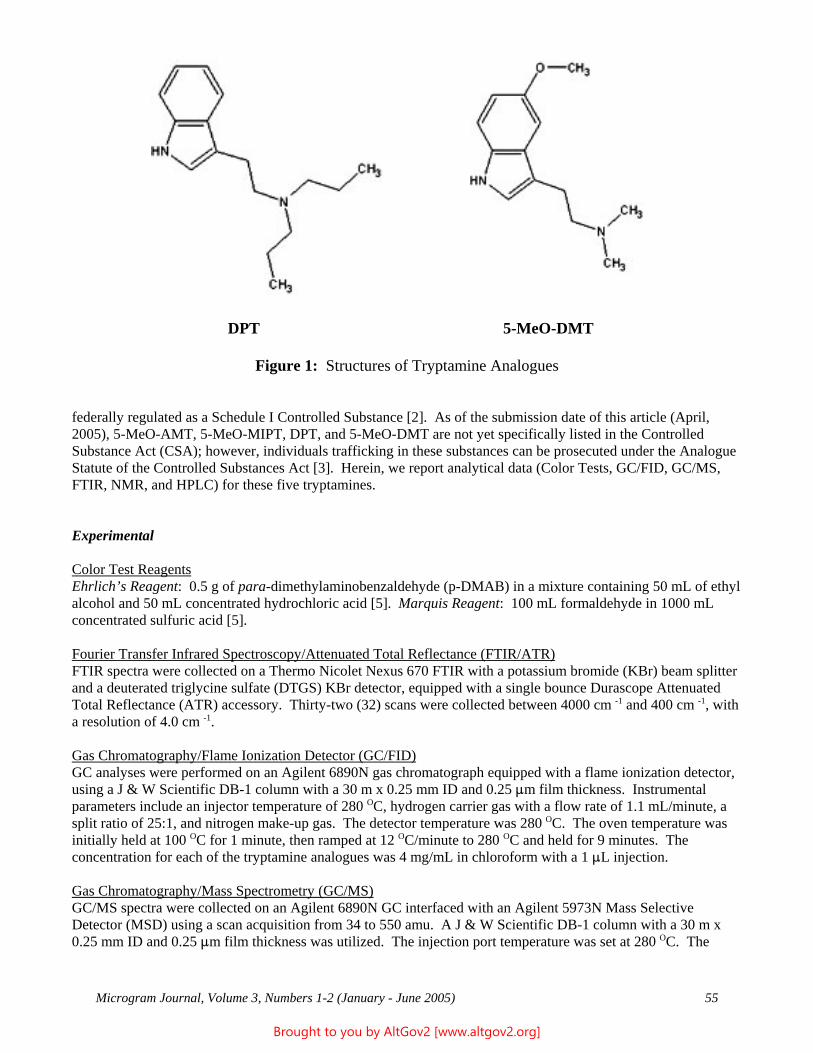
DPT 5-MeO-DMT
Figure 1: Structures of Tryptamine Analogues
federally regulated as a Schedule I Controlled Substance [2]. As of the submission date of this article (April, 2005), 5-MeO-AMT, 5-MeO-MIPT, DPT, and 5-MeO-DMT are not yet specifically listed in the Controlled Substance Act (CSA); however, individuals trafficking in these substances can be prosecuted under the Analogue Statute of the Controlled Substances Act [3]. Herein, we report analytical data (Color Tests, GC/FID, GC/MS, FTIR, NMR, and HPLC) for these five tryptamines.
Experimental
Color Test Reagents Ehrlich’s Reagent: 0.5 g of para-dimethylaminobenzaldehyde (p-DMAB) in a mixture containing 50 mL of ethyl alcohol and 50 mL concentrated hydrochloric acid [5]. Marquis Reagent: 100 mL formaldehyde in 1000 mL concentrated sulfuric acid [5].
Fourier Transfer Infrared Spectroscopy/Attenuated Total Reflectance (FTIR/ATR) FTIR spectra were collected on a Thermo Nicolet Nexus 670 FTIR with a potassium bromide (KBr) beam splitter and a deuterated triglycine sulfate (DTGS) KBr detector, equipped with a single bounce Durascope Attenuated Total Reflectance (ATR) accessory. Thirty-two (32) scans were collected between 4000 cm -1 and 400 cm -1, with a resolution of 4.0 cm -1.
Gas Chromatography/Flame Ionization Detector (GC/FID) GC analyses were performed on an Agilent 6890N gas chromatograph equipped with a flame ionization detector, using a J & W Scientific DB-1 column with a 30 m x 0.25 mm ID and 0.25 :m film thickness. Instrumental parameters include an injector temperature of 280 OC, hydrogen carrier gas with a flow rate of 1.1 mL/minute, a split ratio of 25:1, and nitrogen make-up gas. The detector temperature was 280 OC. The oven temperature was initially held at 100 OC for 1 minute, then ramped at 12 OC/minute to 280 OC and held for 9 minutes. The concentration for each of the tryptamine analogues was 4 mg/mL in chloroform with a 1 :L injection.
Gas Chromatography/Mass Spectrometry (GC/MS)GC/MS spectra were collected on an Agilent 6890N GC interfaced with an Agilent 5973N Mass SelectiveDetector (MSD) using a scan acquisition from 34 to 550 amu. A J & W Scientific DB-1 column with a 30 m x0.25 mm ID and 0.25 :m film thickness was utilized. The injection port temperature was set at 280 OC. The
Microgram Journal, Volume 3, Numbers 1-2 (January - June 2005) 55
Brought to you by AltGov2 [www.altgov2.org]
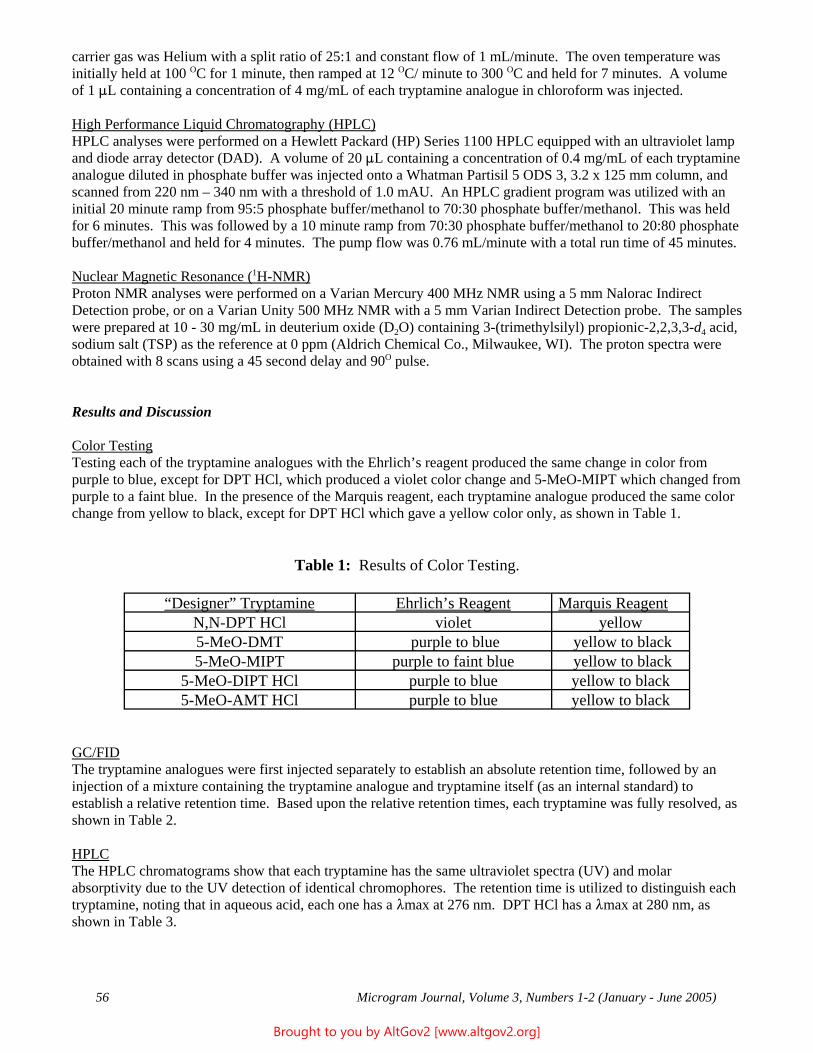
carrier gas was Helium with a split ratio of 25:1 and constant flow of 1 mL/minute. The oven temperature was initially held at 100 OC for 1 minute, then ramped at 12 OC/ minute to 300 OC and held for 7 minutes. A volume of 1 :L containing a concentration of 4 mg/mL of each tryptamine analogue in chloroform was injected.
High Performance Liquid Chromatography (HPLC) HPLC analyses were performed on a Hewlett Packard (HP) Series 1100 HPLC equipped with an ultraviolet lamp and diode array detector (DAD). A volume of 20 :L containing a concentration of 0.4 mg/mL of each tryptamine analogue diluted in phosphate buffer was injected onto a Whatman Partisil 5 ODS 3, 3.2 x 125 mm column, and scanned from 220 nm – 340 nm with a threshold of 1.0 mAU. An HPLC gradient program was utilized with an initial 20 minute ramp from 95:5 phosphate buffer/methanol to 70:30 phosphate buffer/methanol. This was held for 6 minutes. This was followed by a 10 minute ramp from 70:30 phosphate buffer/methanol to 20:80 phosphate buffer/methanol and held for 4 minutes. The pump flow was 0.76 mL/minute with a total run time of 45 minutes.
Nuclear Magnetic Resonance (1H-NMR) Proton NMR analyses were performed on a Varian Mercury 400 MHz NMR using a 5 mm Nalorac Indirect Detection probe, or on a Varian Unity 500 MHz NMR with a 5 mm Varian Indirect Detection probe. The samples were prepared at 10 - 30 mg/mL in deuterium oxide (D2O) containing 3-(trimethylsilyl) propionic-2,2,3,3-d4 acid, sodium salt (TSP) as the reference at 0 ppm (Aldrich Chemical Co., Milwaukee, WI). The proton spectra were obtained with 8 scans using a 45 second delay and 90O pulse.
Results and Discussion
Color Testing Testing each of the tryptamine analogues with the Ehrlich’s reagent produced the same change in color from purple to blue, except for DPT HCl, which produced a violet color change and 5-MeO-MIPT which changed from purple to a faint blue. In the presence of the Marquis reagent, each tryptamine analogue produced the same color change from yellow to black, except for DPT HCl which gave a yellow color only, as shown in Table 1.
Table 1: Results of Color Testing.
“Designer” Tryptamine Ehrlich’s Reagent Marquis Reagent N,N-DPT HCl violet yellow 5-MeO-DMT purple to blue yellow to black 5-MeO-MIPT purple to faint blue yellow to black
5-MeO-DIPT HCl purple to blue yellow to black 5-MeO-AMT HCl purple to blue yellow to black
GC/FID The tryptamine analogues were first injected separately to establish an absolute retention time, followed by an injection of a mixture containing the tryptamine analogue and tryptamine itself (as an internal standard) to establish a relative retention time. Based upon the relative retention times, each tryptamine was fully resolved, as shown in Table 2.
HPLC The HPLC chromatograms show that each tryptamine has the same ultraviolet spectra (UV) and molar absorptivity due to the UV detection of identical chromophores. The retention time is utilized to distinguish each tryptamine, noting that in aqueous acid, each one has a 8max at 276 nm. DPT HCl has a 8max at 280 nm, as shown in Table 3.
Microgram Journal, Volume 3, Numbers 1-2 (January - June 2005) 56
Brought to you by AltGov2 [www.altgov2.org]
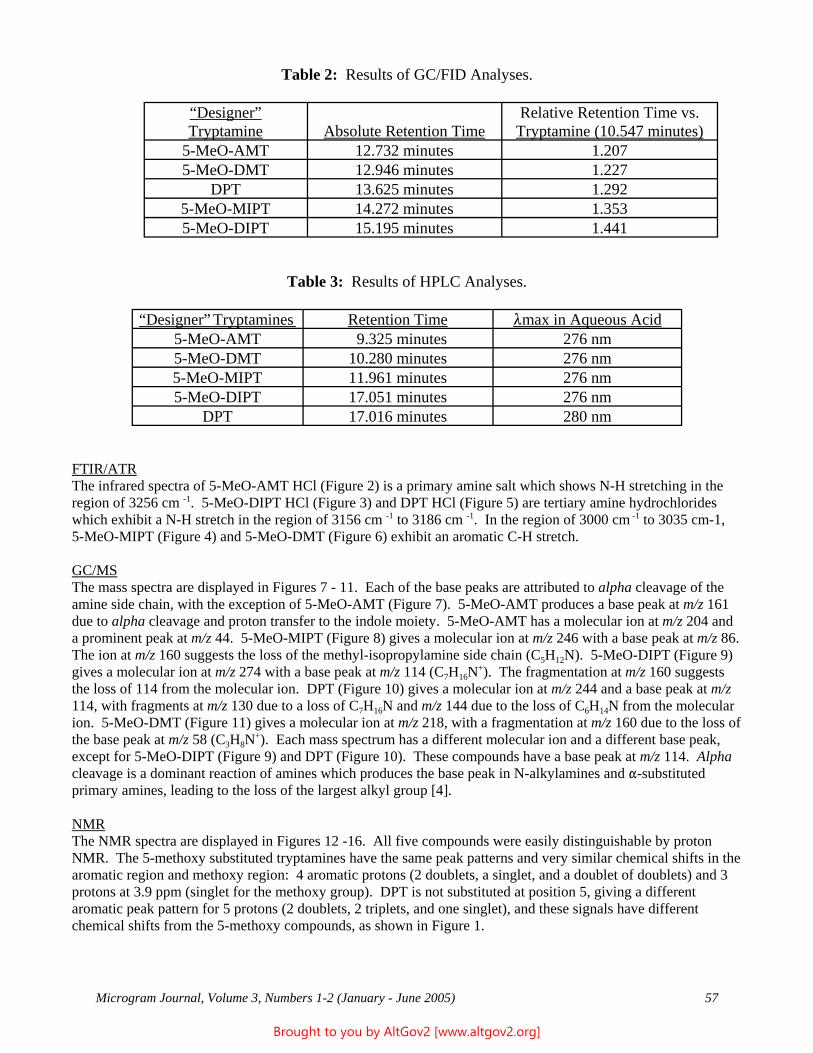
Table 2: Results of GC/FID Analyses.
“Designer” Tryptamine Absolute Retention Time
Relative Retention Time vs. Tryptamine (10.547 minutes)
5-MeO-AMT 12.732 minutes 1.207 5-MeO-DMT 12.946 minutes 1.227
DPT 13.625 minutes 1.292 5-MeO-MIPT 14.272 minutes 1.353 5-MeO-DIPT 15.195 minutes 1.441
Table 3: Results of HPLC Analyses.
“Designer” Tryptamines Retention Time 8max in Aqueous Acid 5-MeO-AMT 9.325 minutes 276 nm 5-MeO-DMT 10.280 minutes 276 nm 5-MeO-MIPT 11.961 minutes 276 nm 5-MeO-DIPT 17.051 minutes 276 nm
DPT 17.016 minutes 280 nm
FTIR/ATR The infrared spectra of 5-MeO-AMT HCl (Figure 2) is a primary amine salt which shows N-H stretching in the region of 3256 cm -1. 5-MeO-DIPT HCl (Figure 3) and DPT HCl (Figure 5) are tertiary amine hydrochlorides which exhibit a N-H stretch in the region of 3156 cm -1 to 3186 cm -1. In the region of 3000 cm -1 to 3035 cm-1, 5-MeO-MIPT (Figure 4) and 5-MeO-DMT (Figure 6) exhibit an aromatic C-H stretch.
GC/MS The mass spectra are displayed in Figures 7 - 11. Each of the base peaks are attributed to alpha cleavage of the amine side chain, with the exception of 5-MeO-AMT (Figure 7). 5-MeO-AMT produces a base peak at m/z 161 due to alpha cleavage and proton transfer to the indole moiety. 5-MeO-AMT has a molecular ion at m/z 204 and a prominent peak at m/z 44. 5-MeO-MIPT (Figure 8) gives a molecular ion at m/z 246 with a base peak at m/z 86. The ion at m/z 160 suggests the loss of the methyl-isopropylamine side chain (C5H12N). 5-MeO-DIPT (Figure 9) gives a molecular ion at m/z 274 with a base peak at m/z 114 (C7H16N+). The fragmentation at m/z 160 suggests the loss of 114 from the molecular ion. DPT (Figure 10) gives a molecular ion at m/z 244 and a base peak at m/z 114, with fragments at m/z 130 due to a loss of C7H16N and m/z 144 due to the loss of C6H14N from the molecular ion. 5-MeO-DMT (Figure 11) gives a molecular ion at m/z 218, with a fragmentation at m/z 160 due to the loss of the base peak at m/z 58 (C3H8N+). Each mass spectrum has a different molecular ion and a different base peak, except for 5-MeO-DIPT (Figure 9) and DPT (Figure 10). These compounds have a base peak at m/z 114. Alpha cleavage is a dominant reaction of amines which produces the base peak in N-alkylamines and "-substituted primary amines, leading to the loss of the largest alkyl group [4].
NMR The NMR spectra are displayed in Figures 12 -16. All five compounds were easily distinguishable by proton NMR. The 5-methoxy substituted tryptamines have the same peak patterns and very similar chemical shifts in the aromatic region and methoxy region: 4 aromatic protons (2 doublets, a singlet, and a doublet of doublets) and 3 protons at 3.9 ppm (singlet for the methoxy group). DPT is not substituted at position 5, giving a different aromatic peak pattern for 5 protons (2 doublets, 2 triplets, and one singlet), and these signals have different chemical shifts from the 5-methoxy compounds, as shown in Figure 1.
Microgram Journal, Volume 3, Numbers 1-2 (January - June 2005) 57
Brought to you by AltGov2 [www.altgov2.org]
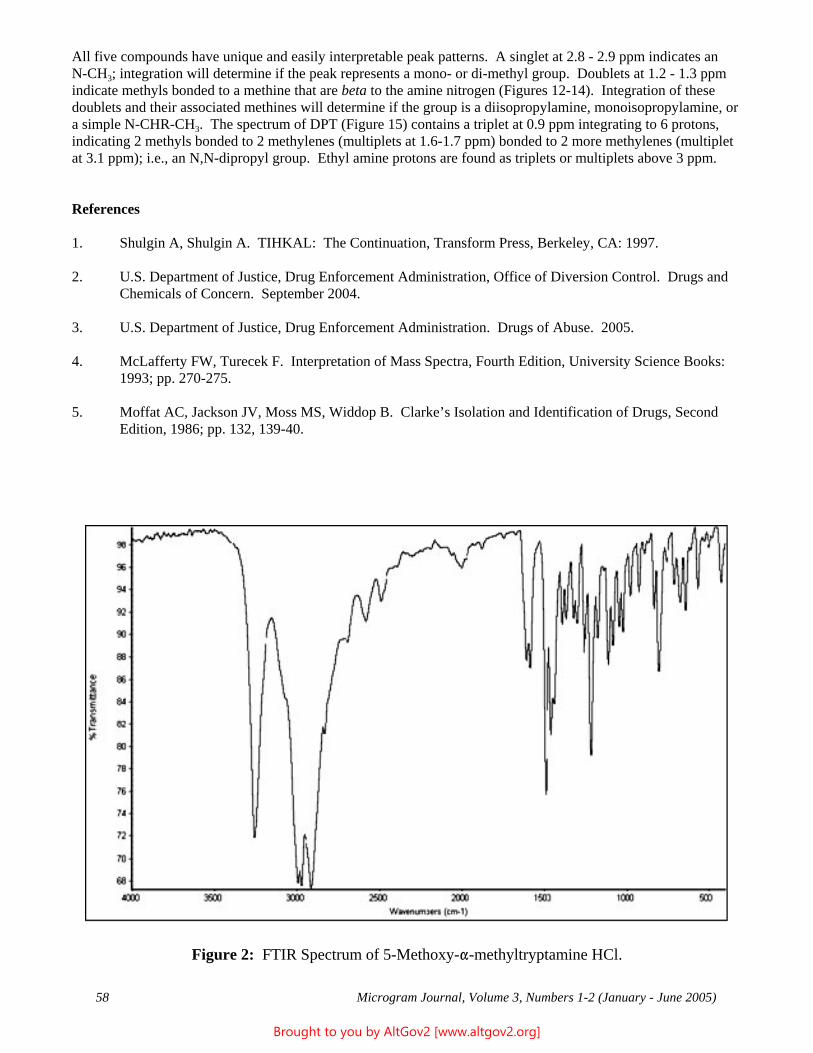
All five compounds have unique and easily interpretable peak patterns. A singlet at 2.8 - 2.9 ppm indicates an N-CH3; integration will determine if the peak represents a mono- or di-methyl group. Doublets at 1.2 - 1.3 ppm indicate methyls bonded to a methine that are beta to the amine nitrogen (Figures 12-14). Integration of these doublets and their associated methines will determine if the group is a diisopropylamine, monoisopropylamine, or a simple N-CHR-CH3. The spectrum of DPT (Figure 15) contains a triplet at 0.9 ppm integrating to 6 protons, indicating 2 methyls bonded to 2 methylenes (multiplets at 1.6-1.7 ppm) bonded to 2 more methylenes (multiplet at 3.1 ppm); i.e., an N,N-dipropyl group. Ethyl amine protons are found as triplets or multiplets above 3 ppm.
References
1. Shulgin A, Shulgin A. TIHKAL: The Continuation, Transform Press, Berkeley, CA: 1997.
2. U.S. Department of Justice, Drug Enforcement Administration, Office of Diversion Control. Drugs and Chemicals of Concern. September 2004.
3. U.S. Department of Justice, Drug Enforcement Administration. Drugs of Abuse. 2005.
4. McLafferty FW, Turecek F. Interpretation of Mass Spectra, Fourth Edition, University Science Books: 1993; pp. 270-275.
5. Moffat AC, Jackson JV, Moss MS, Widdop B. Clarke’s Isolation and Identification of Drugs, Second Edition, 1986; pp. 132, 139-40.
Figure 2: FTIR Spectrum of 5-Methoxy-"-methyltryptamine HCl.
Microgram Journal, Volume 3, Numbers 1-2 (January - June 2005) 58
Brought to you by AltGov2 [www.altgov2.org]
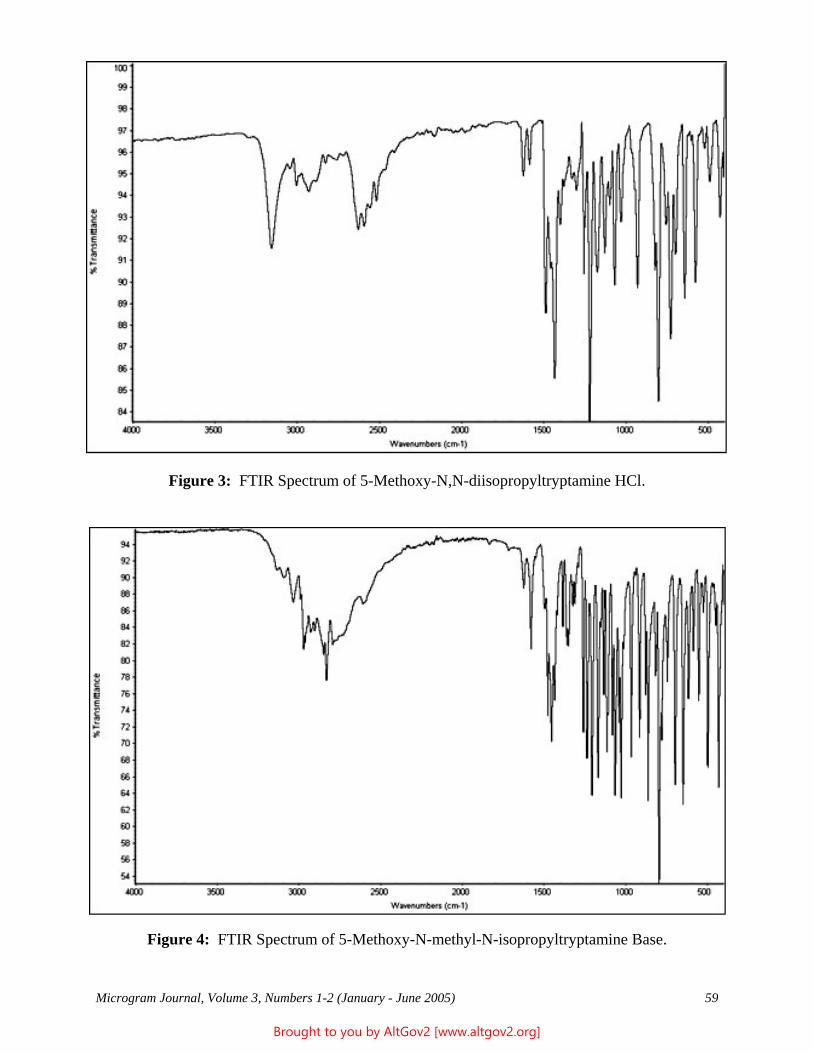
Figure 3: FTIR Spectrum of 5-Methoxy-N,N-diisopropyltryptamine HCl.
Figure 4: FTIR Spectrum of 5-Methoxy-N-methyl-N-isopropyltryptamine Base.
Microgram Journal, Volume 3, Numbers 1-2 (January - June 2005) 59
Brought to you by AltGov2 [www.altgov2.org]
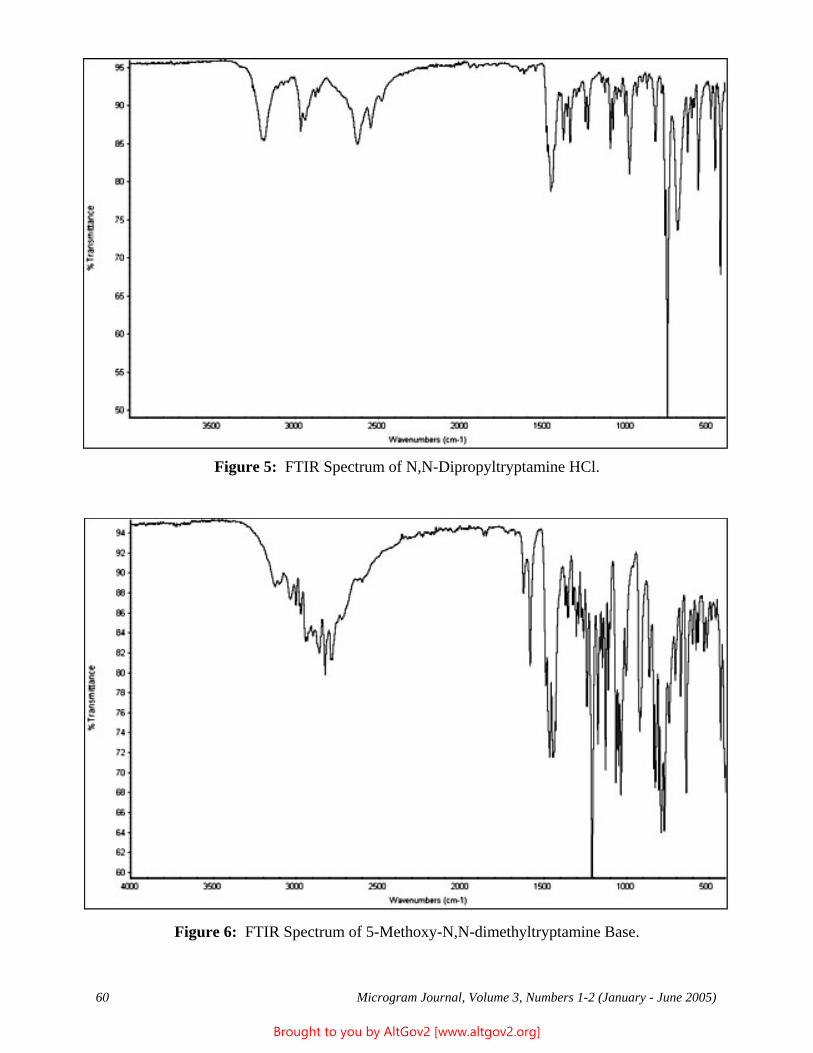
Figure 5: FTIR Spectrum of N,N-Dipropyltryptamine HCl.
Figure 6: FTIR Spectrum of 5-Methoxy-N,N-dimethyltryptamine Base.
Microgram Journal, Volume 3, Numbers 1-2 (January - June 2005) 60
Brought to you by AltGov2 [www.altgov2.org]
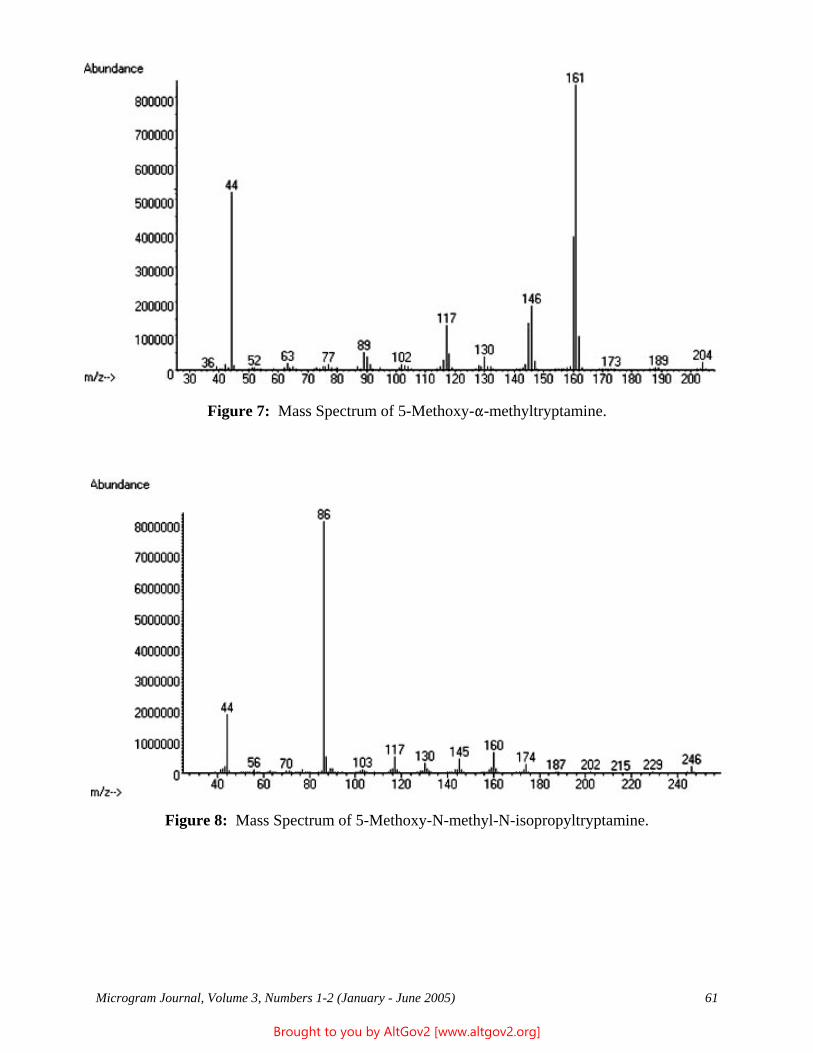
Figure 7: Mass Spectrum of 5-Methoxy-"-methyltryptamine.
Figure 8: Mass Spectrum of 5-Methoxy-N-methyl-N-isopropyltryptamine.
Microgram Journal, Volume 3, Numbers 1-2 (January - June 2005) 61
Brought to you by AltGov2 [www.altgov2.org]
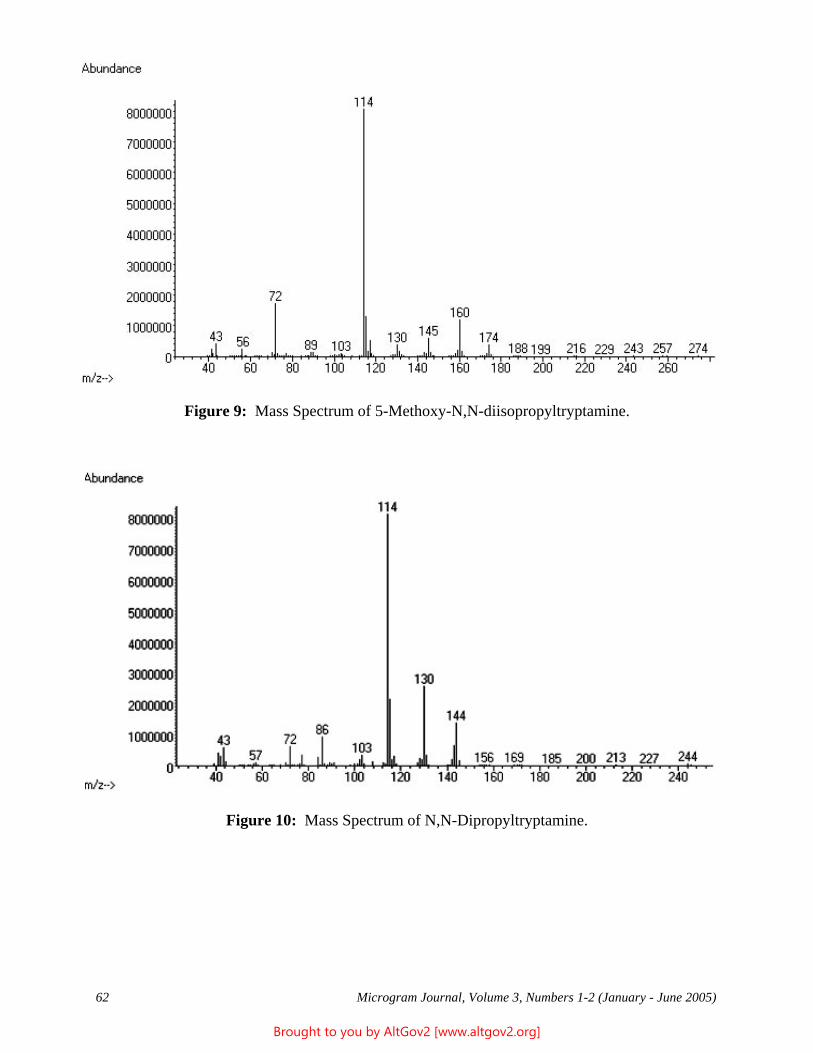
Figure 9: Mass Spectrum of 5-Methoxy-N,N-diisopropyltryptamine.
Figure 10: Mass Spectrum of N,N-Dipropyltryptamine.
Microgram Journal, Volume 3, Numbers 1-2 (January - June 2005) 62
Brought to you by AltGov2 [www.altgov2.org]
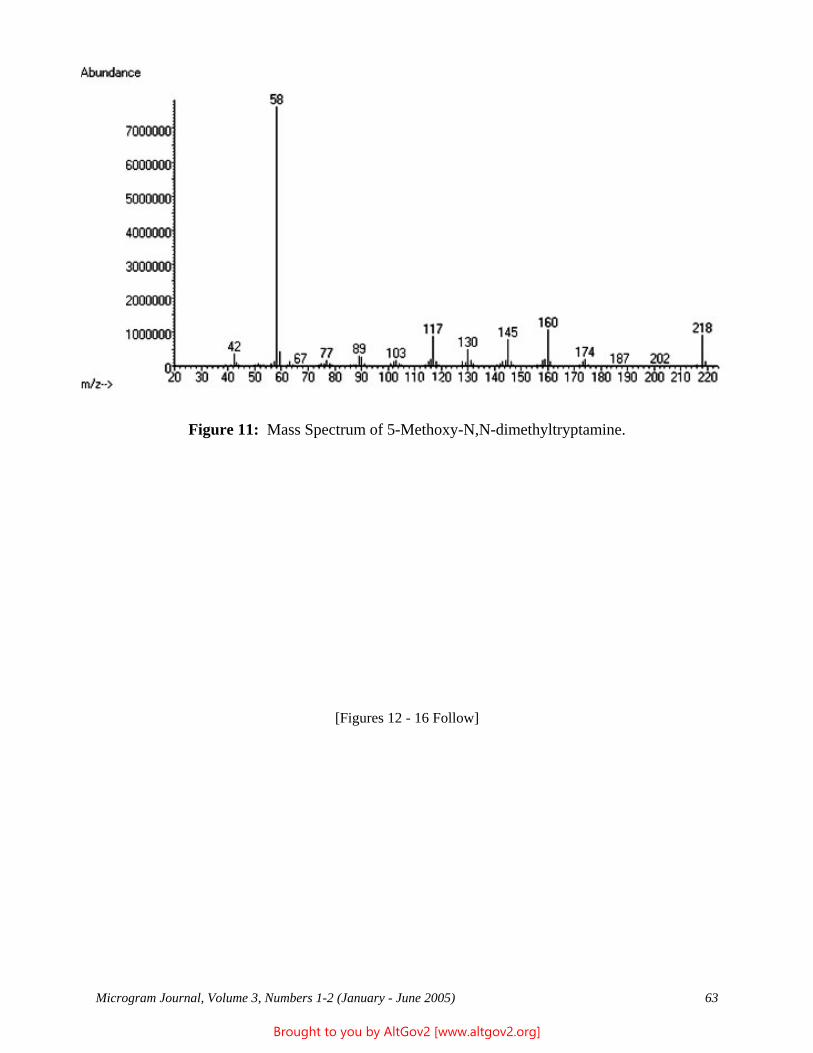
Figure 11: Mass Spectrum of 5-Methoxy-N,N-dimethyltryptamine.
[Figures 12 - 16 Follow]
Microgram Journal, Volume 3, Numbers 1-2 (January - June 2005) 63
Brought to you by AltGov2 [www.altgov2.org]
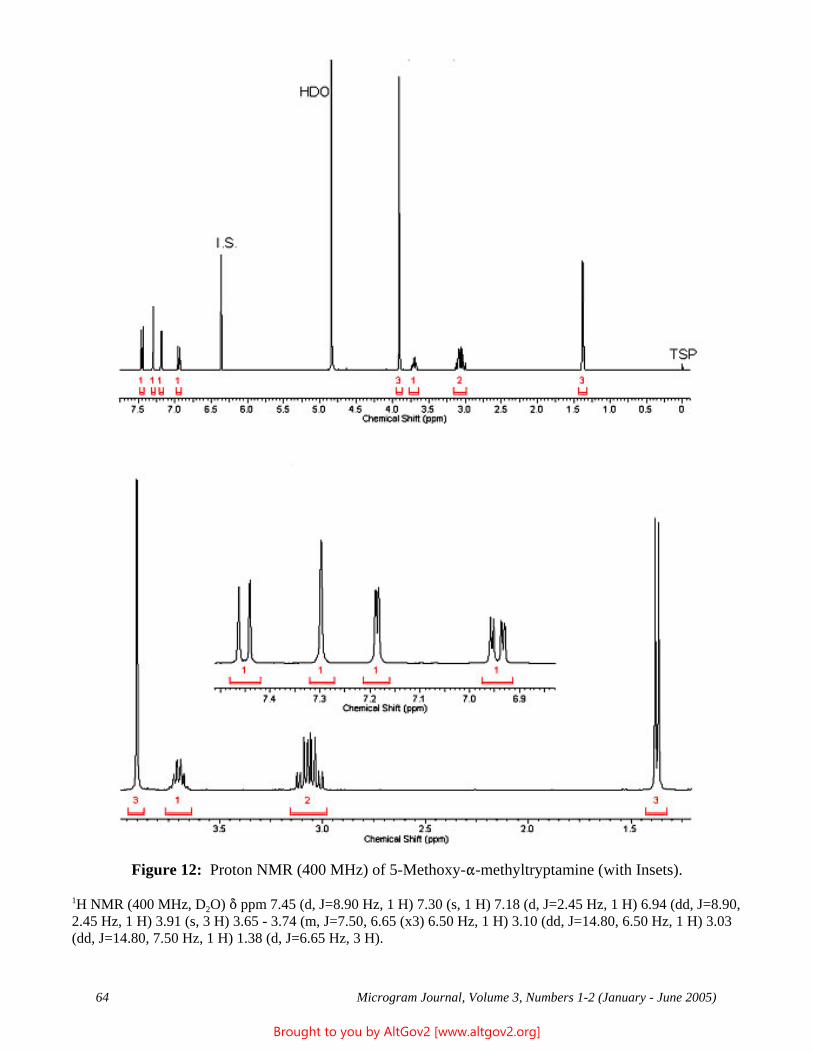
Figure 12: Proton NMR (400 MHz) of 5-Methoxy-"-methyltryptamine (with Insets).
1H NMR (400 MHz, D2O) * ppm 7.45 (d, J=8.90 Hz, 1 H) 7.30 (s, 1 H) 7.18 (d, J=2.45 Hz, 1 H) 6.94 (dd, J=8.90, 2.45 Hz, 1 H) 3.91 (s, 3 H) 3.65 - 3.74 (m, J=7.50, 6.65 (x3) 6.50 Hz, 1 H) 3.10 (dd, J=14.80, 6.50 Hz, 1 H) 3.03 (dd, J=14.80, 7.50 Hz, 1 H) 1.38 (d, J=6.65 Hz, 3 H).
Microgram Journal, Volume 3, Numbers 1-2 (January - June 2005) 64
Brought to you by AltGov2 [www.altgov2.org]
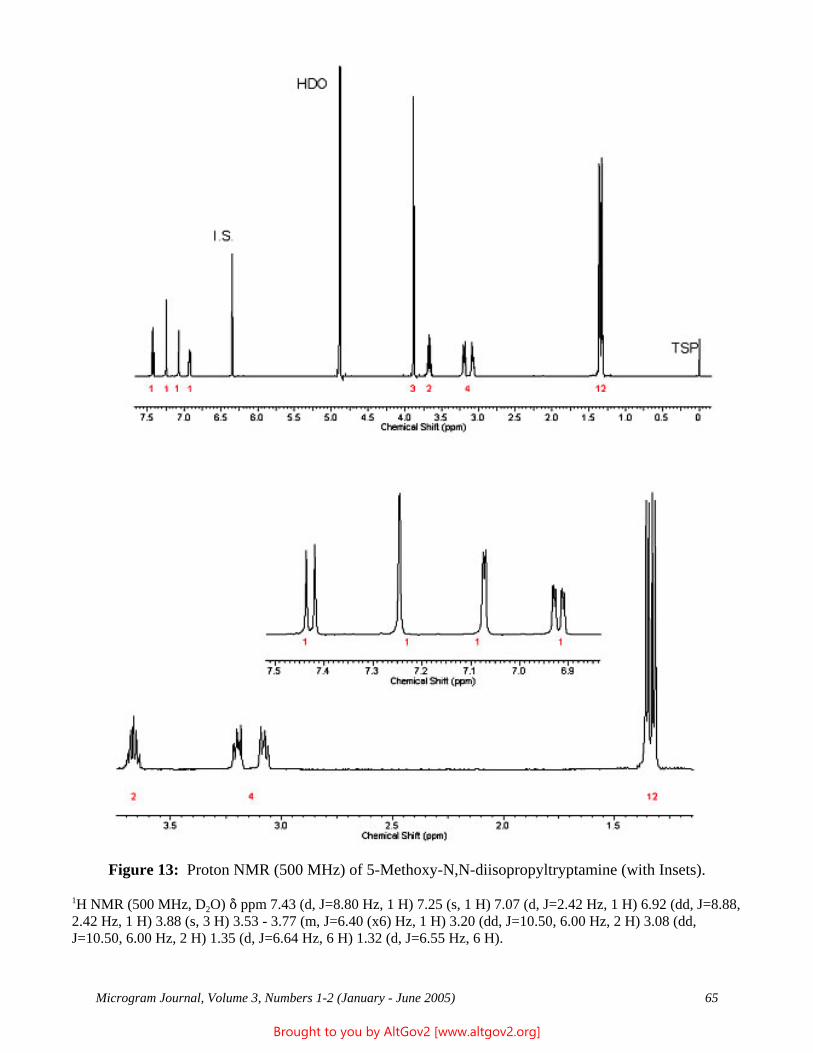
Figure 13: Proton NMR (500 MHz) of 5-Methoxy-N,N-diisopropyltryptamine (with Insets).
1H NMR (500 MHz, D2O) * ppm 7.43 (d, J=8.80 Hz, 1 H) 7.25 (s, 1 H) 7.07 (d, J=2.42 Hz, 1 H) 6.92 (dd, J=8.88, 2.42 Hz, 1 H) 3.88 (s, 3 H) 3.53 - 3.77 (m, J=6.40 (x6) Hz, 1 H) 3.20 (dd, J=10.50, 6.00 Hz, 2 H) 3.08 (dd, J=10.50, 6.00 Hz, 2 H) 1.35 (d, J=6.64 Hz, 6 H) 1.32 (d, J=6.55 Hz, 6 H).
Microgram Journal, Volume 3, Numbers 1-2 (January - June 2005) 65
Brought to you by AltGov2 [www.altgov2.org]
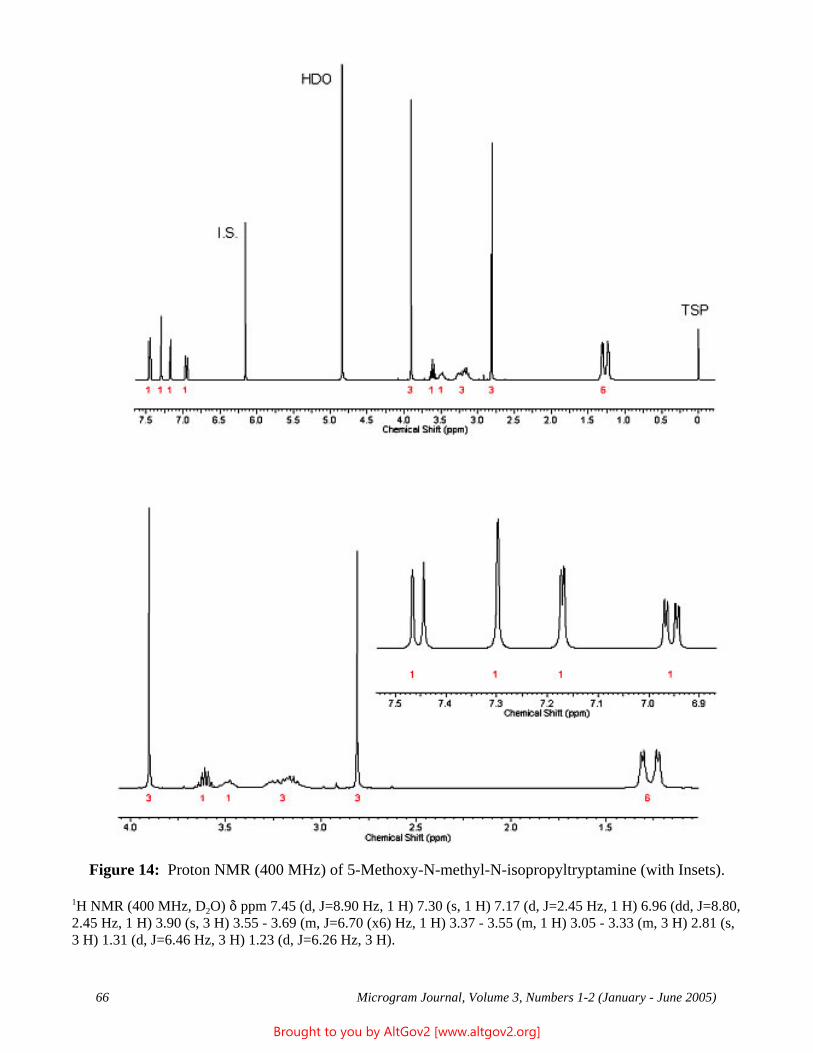
Figure 14: Proton NMR (400 MHz) of 5-Methoxy-N-methyl-N-isopropyltryptamine (with Insets).
1H NMR (400 MHz, D2O) * ppm 7.45 (d, J=8.90 Hz, 1 H) 7.30 (s, 1 H) 7.17 (d, J=2.45 Hz, 1 H) 6.96 (dd, J=8.80, 2.45 Hz, 1 H) 3.90 (s, 3 H) 3.55 - 3.69 (m, J=6.70 (x6) Hz, 1 H) 3.37 - 3.55 (m, 1 H) 3.05 - 3.33 (m, 3 H) 2.81 (s, 3 H) 1.31 (d, J=6.46 Hz, 3 H) 1.23 (d, J=6.26 Hz, 3 H).
Microgram Journal, Volume 3, Numbers 1-2 (January - June 2005) 66
Brought to you by AltGov2 [www.altgov2.org]
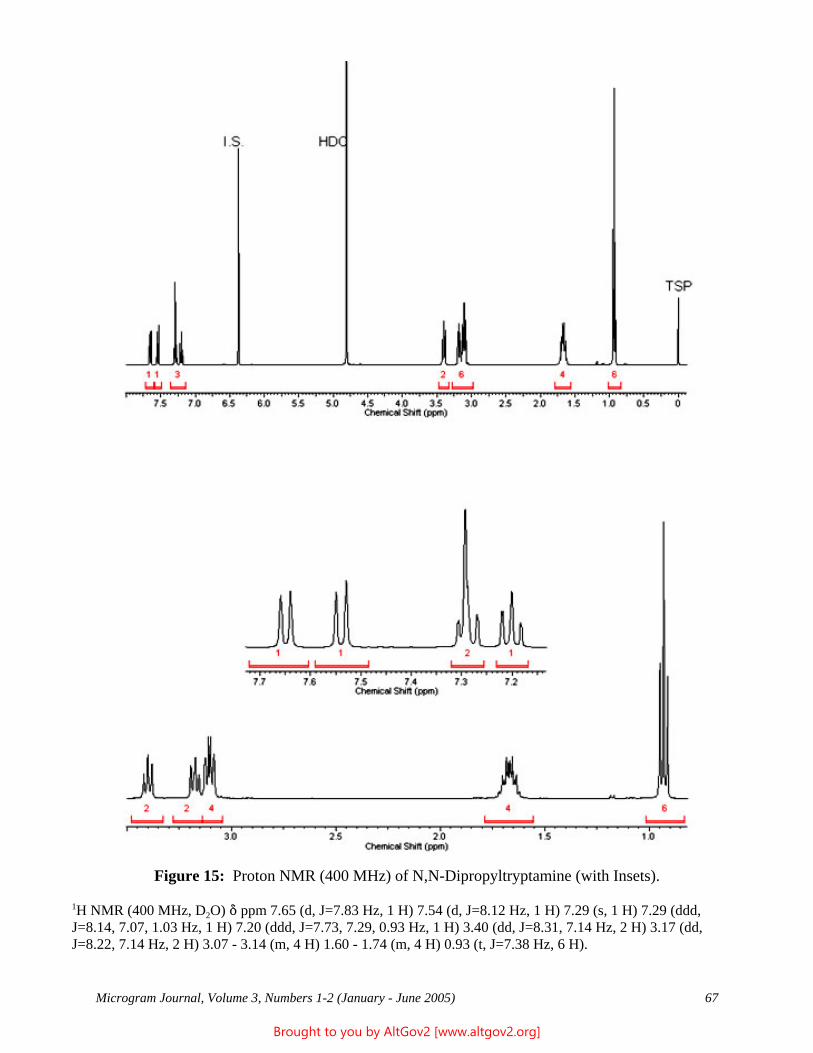
Figure 15: Proton NMR (400 MHz) of N,N-Dipropyltryptamine (with Insets).
1H NMR (400 MHz, D2O) * ppm 7.65 (d, J=7.83 Hz, 1 H) 7.54 (d, J=8.12 Hz, 1 H) 7.29 (s, 1 H) 7.29 (ddd, J=8.14, 7.07, 1.03 Hz, 1 H) 7.20 (ddd, J=7.73, 7.29, 0.93 Hz, 1 H) 3.40 (dd, J=8.31, 7.14 Hz, 2 H) 3.17 (dd, J=8.22, 7.14 Hz, 2 H) 3.07 - 3.14 (m, 4 H) 1.60 - 1.74 (m, 4 H) 0.93 (t, J=7.38 Hz, 6 H).
Microgram Journal, Volume 3, Numbers 1-2 (January - June 2005) 67
Brought to you by AltGov2 [www.altgov2.org]
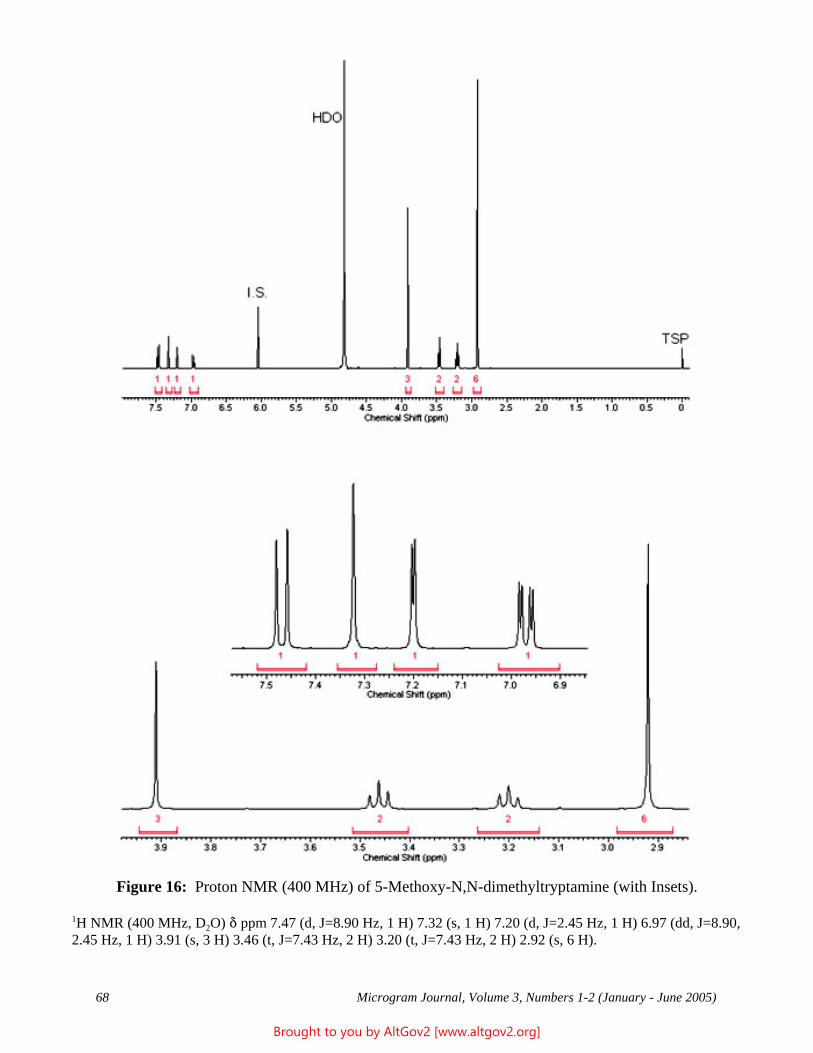
Figure 16: Proton NMR (400 MHz) of 5-Methoxy-N,N-dimethyltryptamine (with Insets).
1H NMR (400 MHz, D2O) * ppm 7.47 (d, J=8.90 Hz, 1 H) 7.32 (s, 1 H) 7.20 (d, J=2.45 Hz, 1 H) 6.97 (dd, J=8.90, 2.45 Hz, 1 H) 3.91 (s, 3 H) 3.46 (t, J=7.43 Hz, 2 H) 3.20 (t, J=7.43 Hz, 2 H) 2.92 (s, 6 H).
Microgram Journal, Volume 3, Numbers 1-2 (January - June 2005) 68
Brought to you by AltGov2 [www.altgov2.org]
Desloratadine: The Reaction Byproduct of the Reduction of Cold Tablets Containing Loratadine with Hydriodic Acid/Red Phosphorus
Shannon C. DiPari,* Jason A. Bordelon, and Harry F. Skinner U.S. Department of Justice
Drug Enforcement Administration Southwest Laboratory
2815 Scott Street Vista, CA 92081
[email: Shannon.C.DiPari -at- usdoj.gov]
[Reprinted with Permission from the Journal of the Clandestine Laboratory Investigating Chemists Association 2005;15(1):4-11. Note that the original article did not contain an Abstract or Keyword list,
and those provided below are by the Editor. Note also that this version has been reformated to Microgram Journal standards, and additionally has had minor errors corrected.]
ABSTRACT: Production of methamphetamine via hydriodic acid/red phosphorus reduction of over-the-counter pseudoephedrine products that contain other active co-ingredients will generate products that are contaminated with those co-ingredients and/or their reduction byproducts. In the case of pseudoephedrine products containing loratadine, the final product will contain desloratadine. Identification of desloratadine in methamphetamine therefore provides an indication of the commercial product used as the precursor in the synthesis.
KEYWORDS: Desloratadine, Loratadine, Pseudoephedrine, Methamphetamine, Hydriodic Acid, Red Phosphorus, Reduction, Trace Analysis, Impurity Profiling, Forensic Chemistry
Introduction
Clandestine methamphetamine laboratories are prevalent in the United States. One of the primary synthetic methods encountered is the reduction of ephedrine or pseudoephedrine with hydriodic acid/red phosphorus.1
When first encountered and for many years thereafter, commercial hydriodic acid and red phosphorus were used in the reduction. In recent years, however, hydriodic acid and red phosphorus purchases have been restricted by law, forcing the clandestine laboratory operators to search for alternative sources. Red phosphorus is commonly obtained by the use of matchbooks and flares whereas hydriodic acid needs to be synthesized by the clandestine laboratory operator. The synthetic methods to generate hydriodic acid use iodine and either red phosphorus or other reactive phosphorous compounds such as hypophosphorous acid or phosphorous acid.2
Due to the increased restrictions on obtaining pure precursor ephedrine or pseudoephedrine, most clandestine laboratory operators are utilizing common cold tablet preparations.3,4 These cold tablet preparations contain either ephedrine or pseudoephedrine, and often other ingredients such as cough suppressants, analgesics, expectorants, or antihistamines. Common co-ingredients include acetaminophen, brompheniramine, chlorpheniramine, dextromethorphan, diphenhydramine, doxylamine, guaifenesin, and triprolidine. When these compounds are present in the ephedrine/pseudoephedrine reduction mixtures, they will be carried through the reaction sequence unchanged, or will produce characteristic byproducts that are identifiable by GC/MS.5,6
The identification of these compounds or their byproducts in clandestinely produced methamphetamine can assist the analyst in determining which cold tablet preparation was used as the precursor source. The ratios of these byproducts relative to methamphetamine are usually very low in the final product. However, they can be easily extracted and identified.7 As new cold products become available on the market, clandestine laboratory operators will use them to obtain pseudoephedrine and manufacture methamphetamine. Any new co-products contained in
Microgram Journal, Volume 3, Numbers 1-2 (January - June 2005) 69
Brought to you by AltGov2 [www.altgov2.org]
these cold tablets have the potential to produce impurities not previously encountered by the forensic analyst. A recent example is tablets containing loratadine, which are already being used in methamphetamine production. Loratadine is the active ingredient in Claritin®, which recently changed from a prescription to an over-the-counter medication.
Experimental
Reactions Loratadine, red phosphorus and 30 mL of 57 % hydriodic acid were refluxed (boiling point = 120 OC) in a round bottom flask fitted with a condenser. The reactions were monitored by removal of aliquots with subsequent analysis. The aliquots were sampled initially, once the mixture began to reflux, and then at every hour. The progress of each reaction was monitored as a decrease of the precursor and the formation of desloratadine. The progress was also monitored by detection of intermediates and byproducts.
Gas Chromatography These analyses were performed using an Agilent Technologies 6890N Gas Chromatograph equipped with electronic pneumatic control and a flame ionization detector. A 10.0 m x 0.32 mm i.d. fused-silica capillary column coated with 0.52 :m DB-5 (Agilent Technologies) was employed. Hydrogen was the carrier gas, with an average linear velocity of 40 cm/sec (constant flow). The injection port and detector were maintained at 280 OC. The samples were extracted into ether, and one :L of each sample was injected in split mode (25:1). The oven temperature was programmed as follows: Initial temperature 130 OC, hold for 1.0 minute, then increase temperature 25 OC per minute to 280 OC, hold for 1.0 minute (total run time = 10.0 minutes).
Gas Chromatography/Mass Spectrometry The electron impact (EI) mass spectra were obtained using an Agilent Technologies Mass Spectrometer. The spectrometer was equipped with a 5973 mass selective detector and 6890N gas chromatograph. A 30.0 m x 0.25 mm i.d. fused-silica capillary column coated with 0.25 :m HP5-MS (Agilent Technologies) was employed. Helium was the carrier gas with an average linear velocity of 40 cm/sec (constant flow). The injection port and ion sources were set at 240 OC and 180 OC, respectively. One :L from each of the samples was injected in split mode (30:1). The oven temperature was programmed as follows: Initial temperature 100 OC for 1.0 minute, then increase temperature 20 OC per minute to 280 OC, hold for 10.0 minutes (total run time = 20 minutes). The mass spectrometer was scanned over an m/z range of 40 - 500. The transfer lines were maintained at 280 OC.
Infrared Spectrophotometry The infrared spectra were obtained in potassium bromide on a Nicolet Magna 560 Fourier Transform Infrared (FTIR) Spectrophotometer. The infrared spectra were also obtained by attenuated total reflectance (ATR) on an Avatar 370 FTIR Spectrophotometer.
Results and Discussion
The intermediates and byproducts in the synthesis of methamphetamine utilizing ephedrine/pseudoephedrine via HI/red P are well documented.1, 7-11 For example, if chlorpheniramine or 1-(4-methylphenyl)-1-(2-pyridyl)-3-pyrolidinopropane (commonly referred to as “reduced triprolidine”) are present in a methamphetamine sample, then the precursor source of the pseudoephedrine also certainly contained chlorpheniramine or triprolidine, respectively.5 Whenever a new compound shows up in the finished product, this indicates that a new, previously unused cold tablet preparation has probably been used as the precursor source.
Recently, a methamphetamine sample was analyzed in this laboratory and was found to contain a new compound not seen in previous exhibits. The compound was in very low concentration in comparison to the methamphetamine, indicating it was probably not added as a cutting agent. The gas chromatogram is shown in Figure 1. The compound eluted on the gas chromatograph in the same general area of other “byproduct amines”
Microgram Journal, Volume 3, Numbers 1-2 (January - June 2005) 70
Brought to you by AltGov2 [www.altgov2.org]
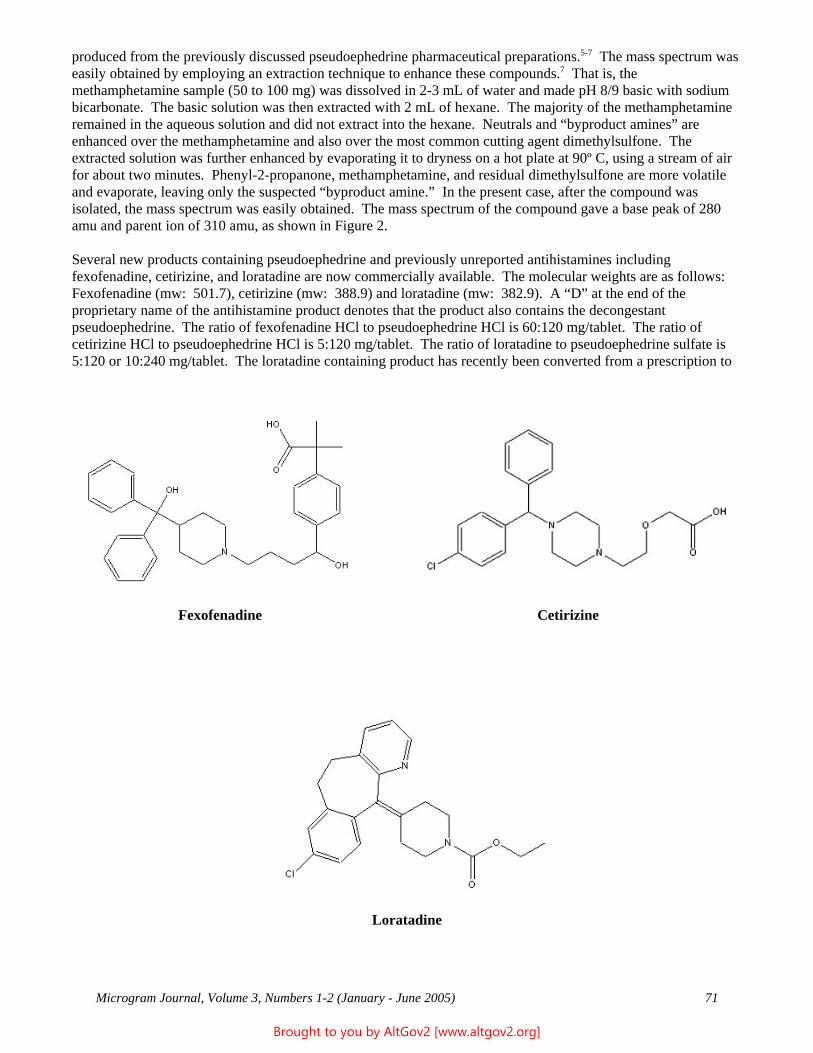
produced from the previously discussed pseudoephedrine pharmaceutical preparations.5-7 The mass spectrum was easily obtained by employing an extraction technique to enhance these compounds.7 That is, the methamphetamine sample (50 to 100 mg) was dissolved in 2-3 mL of water and made pH 8/9 basic with sodium bicarbonate. The basic solution was then extracted with 2 mL of hexane. The majority of the methamphetamine remained in the aqueous solution and did not extract into the hexane. Neutrals and “byproduct amines” are enhanced over the methamphetamine and also over the most common cutting agent dimethylsulfone. The extracted solution was further enhanced by evaporating it to dryness on a hot plate at 90º C, using a stream of air for about two minutes. Phenyl-2-propanone, methamphetamine, and residual dimethylsulfone are more volatile and evaporate, leaving only the suspected “byproduct amine.” In the present case, after the compound was isolated, the mass spectrum was easily obtained. The mass spectrum of the compound gave a base peak of 280 amu and parent ion of 310 amu, as shown in Figure 2.
Several new products containing pseudoephedrine and previously unreported antihistamines including fexofenadine, cetirizine, and loratadine are now commercially available. The molecular weights are as follows: Fexofenadine (mw: 501.7), cetirizine (mw: 388.9) and loratadine (mw: 382.9). A “D” at the end of the proprietary name of the antihistamine product denotes that the product also contains the decongestant pseudoephedrine. The ratio of fexofenadine HCl to pseudoephedrine HCl is 60:120 mg/tablet. The ratio of cetirizine HCl to pseudoephedrine HCl is 5:120 mg/tablet. The ratio of loratadine to pseudoephedrine sulfate is 5:120 or 10:240 mg/tablet. The loratadine containing product has recently been converted from a prescription to
Fexofenadine Cetirizine
Loratadine
Microgram Journal, Volume 3, Numbers 1-2 (January - June 2005) 71
Brought to you by AltGov2 [www.altgov2.org]
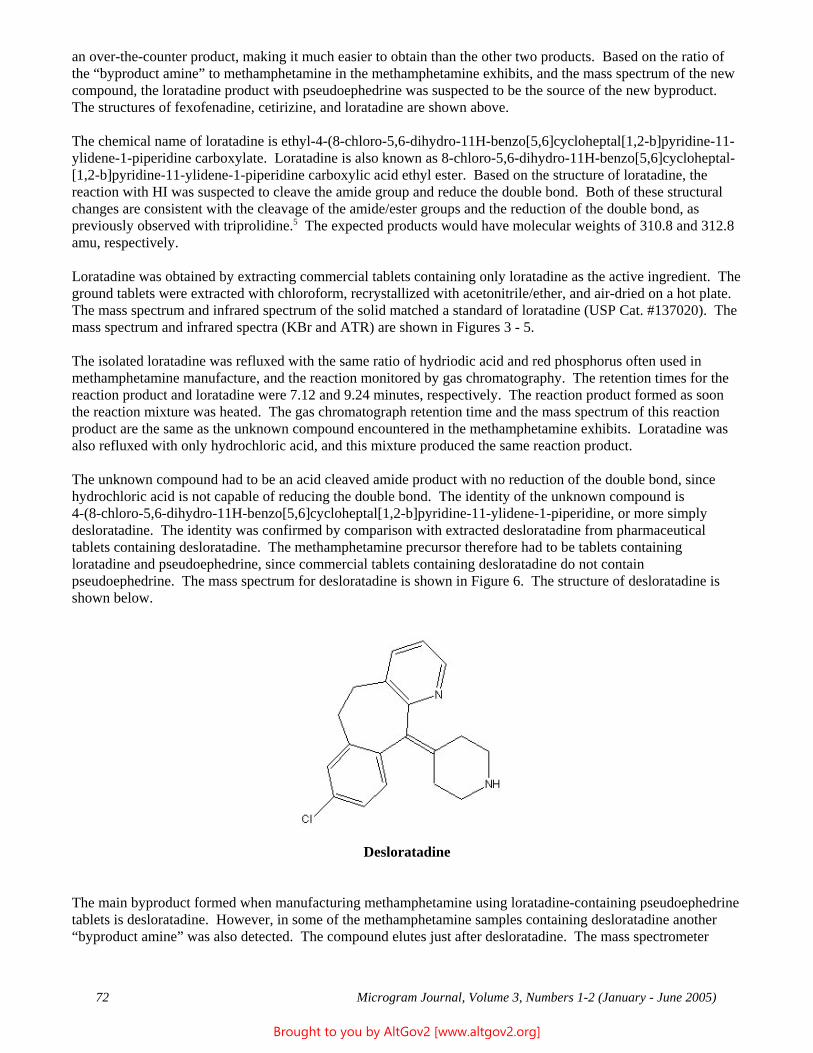
an over-the-counter product, making it much easier to obtain than the other two products. Based on the ratio of the “byproduct amine” to methamphetamine in the methamphetamine exhibits, and the mass spectrum of the new compound, the loratadine product with pseudoephedrine was suspected to be the source of the new byproduct. The structures of fexofenadine, cetirizine, and loratadine are shown above.
The chemical name of loratadine is ethyl-4-(8-chloro-5,6-dihydro-11H-benzo[5,6]cycloheptal[1,2-b]pyridine-11-ylidene-1-piperidine carboxylate. Loratadine is also known as 8-chloro-5,6-dihydro-11H-benzo[5,6]cycloheptal-[1,2-b]pyridine-11-ylidene-1-piperidine carboxylic acid ethyl ester. Based on the structure of loratadine, the reaction with HI was suspected to cleave the amide group and reduce the double bond. Both of these structural changes are consistent with the cleavage of the amide/ester groups and the reduction of the double bond, as previously observed with triprolidine.5 The expected products would have molecular weights of 310.8 and 312.8 amu, respectively.
Loratadine was obtained by extracting commercial tablets containing only loratadine as the active ingredient. The ground tablets were extracted with chloroform, recrystallized with acetonitrile/ether, and air-dried on a hot plate. The mass spectrum and infrared spectrum of the solid matched a standard of loratadine (USP Cat. #137020). The mass spectrum and infrared spectra (KBr and ATR) are shown in Figures 3 - 5.
The isolated loratadine was refluxed with the same ratio of hydriodic acid and red phosphorus often used in methamphetamine manufacture, and the reaction monitored by gas chromatography. The retention times for the reaction product and loratadine were 7.12 and 9.24 minutes, respectively. The reaction product formed as soon the reaction mixture was heated. The gas chromatograph retention time and the mass spectrum of this reaction product are the same as the unknown compound encountered in the methamphetamine exhibits. Loratadine was also refluxed with only hydrochloric acid, and this mixture produced the same reaction product.
The unknown compound had to be an acid cleaved amide product with no reduction of the double bond, since hydrochloric acid is not capable of reducing the double bond. The identity of the unknown compound is 4-(8-chloro-5,6-dihydro-11H-benzo[5,6]cycloheptal[1,2-b]pyridine-11-ylidene-1-piperidine, or more simply desloratadine. The identity was confirmed by comparison with extracted desloratadine from pharmaceutical tablets containing desloratadine. The methamphetamine precursor therefore had to be tablets containing loratadine and pseudoephedrine, since commercial tablets containing desloratadine do not contain pseudoephedrine. The mass spectrum for desloratadine is shown in Figure 6. The structure of desloratadine is shown below.
Desloratadine
The main byproduct formed when manufacturing methamphetamine using loratadine-containing pseudoephedrine tablets is desloratadine. However, in some of the methamphetamine samples containing desloratadine another “byproduct amine” was also detected. The compound elutes just after desloratadine. The mass spectrometer
Microgram Journal, Volume 3, Numbers 1-2 (January - June 2005) 72
Brought to you by AltGov2 [www.altgov2.org]
total ion chromatogram is shown in Figure 7. This compound has a base peak of 82 amu with an ion at 267 amu and a suspected parent peak of 310 amu. The mass spectrum is shown in Figure 8. This compound has not yet been identified, and will be addressed in future studies.
Conclusions
Use of cold tablet preparations as the source of pseudoephedrine has presented challenges in the identification of the trace amounts of the “byproduct amines” in methamphetamine samples. These challenges will continue as new pharmaceutical combinations with pseudoephedrine are made available. The identification of these byproducts in clandestinely produced methamphetamine can help analysts in determining which cold tablet preparations were used as the precursor source, and to link specific exhibits and cases, or both.
References
1. Skinner HF. Methamphetamine synthesis via hydriodic acid/red phosphorus reduction of ephedrine. Forensic Science International 1990;48:123.
2. Skinner HF. Identification and quantitation of hydriodic acid manufactured from iodine, red phosphorus, and water. Microgram 1995;28(11):349.
3. The Chemical Diversion and Trafficking Act of 1988. Anti-Drug Abuse Amendments Act of 1988, Subtitle A.
4. Drug Enforcement Administration, Statistical Reports, 1996.
5. Oulton SR, Skinner HF. Reaction byproducts of common cold tablet ingredients via hydriodic acid/red phosphorus. Journal of the Clandestine Laboratory Investigating Chemists Association 1999;9(4):21.
6. Melgoza L. Impurities in methamphetamine manufactured from over-the-counter pseudoephedrine tablet preparations. Journal of the Clandestine Laboratory Investigating Chemists Association 1999;9(2-3):21.
7. Martinez FS, Jacobs J L, Skinner HF. Extraction of reaction by-products of common cold tablet ingredients via hydriodic acid reduction. Journal of the Clandestine Laboratory Investigating Chemists Association 2003;13(1):13.
8. Lekskulchai V, Carter K, Poklis A, Soine W. GC/MS analysis of methamphetamine impurities: Reactivity of (+)- or (-)-chloroephedrine and cis and trans-1,2-dimethyl-3-phenylaziridine. Journal of Analytical Toxicology 2000;24:602.
9. Lurie IS, Bailey CG, Anex DS, Bethea MJ, McKibben TD, Casale JF. Profiling of impurities in illicit methamphetamine by high-performance liquid chromatography and capillary electrochromatography. Journal of Chromatography 2000;870:53.
10. Noggle FT, Clark CR, DeRuiter J. Characterization of methamphetamine and synthetic byproducts in clandestine samples: A case report. Microgram 1994;27:253.
11. Windahl KL, McTigue MJ, Pearson JR, Pratt SJ, Rowe JE, Sear EM. Investigation of the impurities found in methamphetamine synthesized from pseudoephedrine by reduction with hydriodic acid and red phosphorus. Forensic Science International 1995;76(2):97.
[Figures 1 - 8 Follow.]
Microgram Journal, Volume 3, Numbers 1-2 (January - June 2005) 73
Brought to you by AltGov2 [www.altgov2.org]
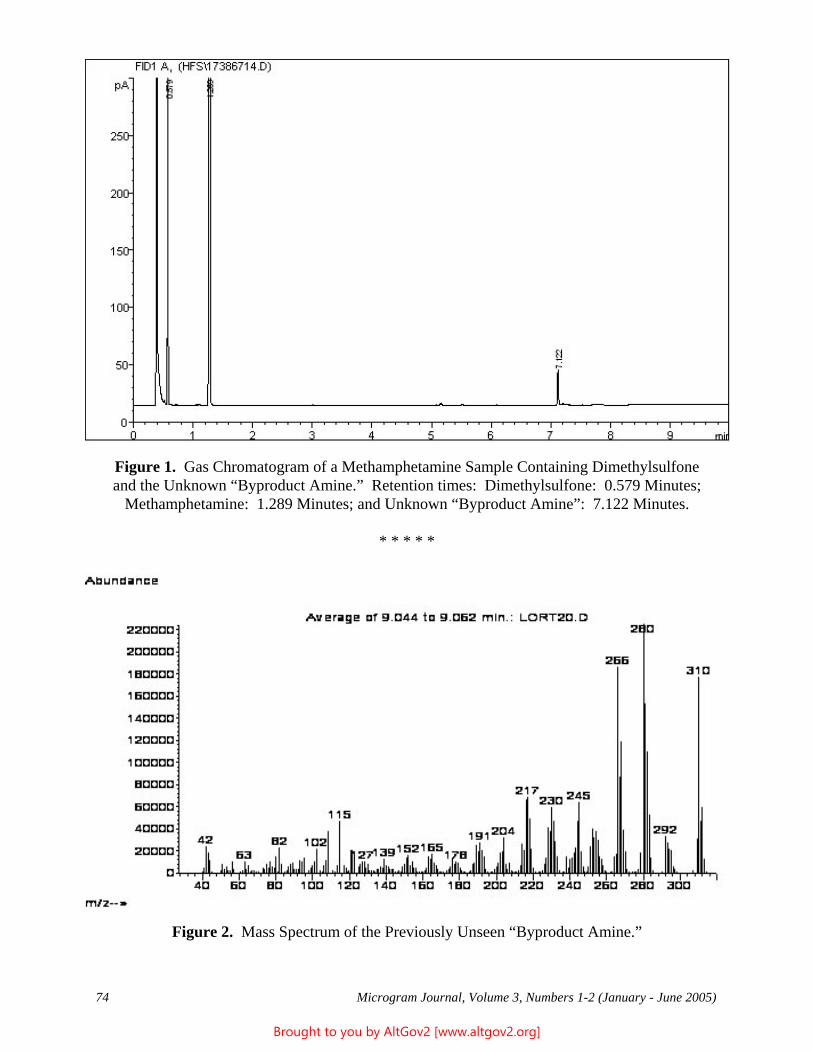
Figure 1. Gas Chromatogram of a Methamphetamine Sample Containing Dimethylsulfone and the Unknown “Byproduct Amine.” Retention times: Dimethylsulfone: 0.579 Minutes;
Methamphetamine: 1.289 Minutes; and Unknown “Byproduct Amine”: 7.122 Minutes.
* * * * *
Figure 2. Mass Spectrum of the Previously Unseen “Byproduct Amine.”
Microgram Journal, Volume 3, Numbers 1-2 (January - June 2005) 74
Brought to you by AltGov2 [www.altgov2.org]
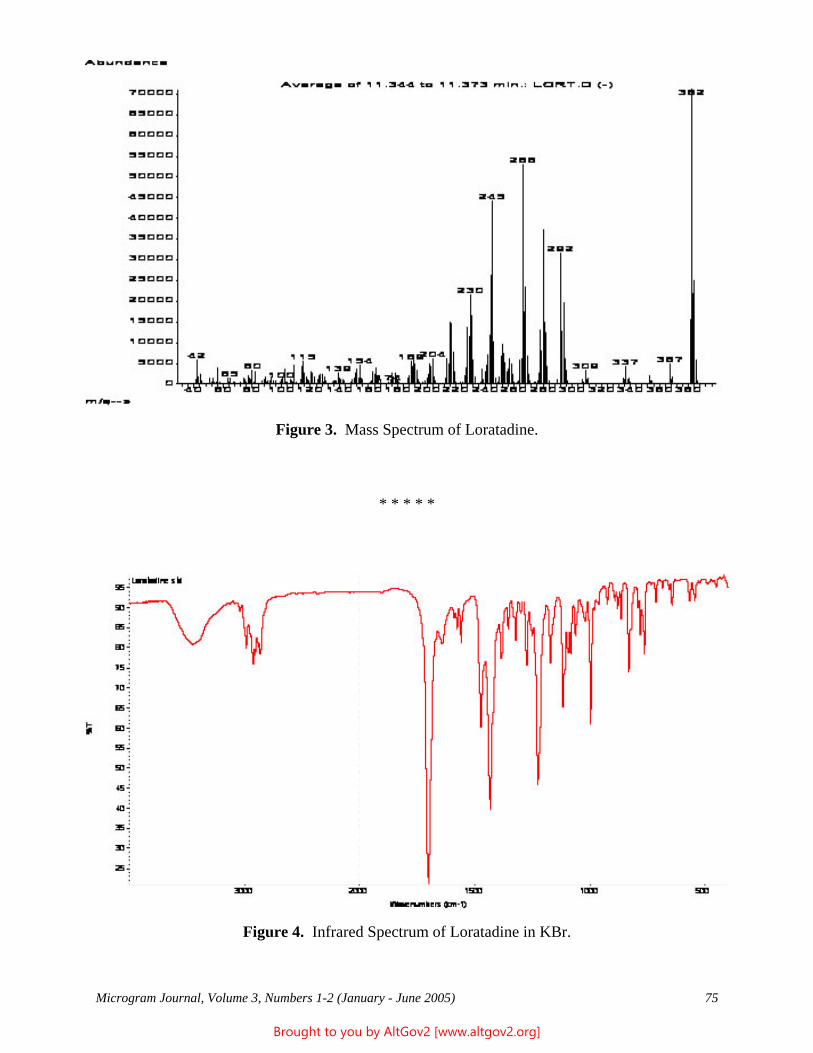
Figure 3. Mass Spectrum of Loratadine.
* * * * *
Figure 4. Infrared Spectrum of Loratadine in KBr.
Microgram Journal, Volume 3, Numbers 1-2 (January - June 2005) 75
Brought to you by AltGov2 [www.altgov2.org]
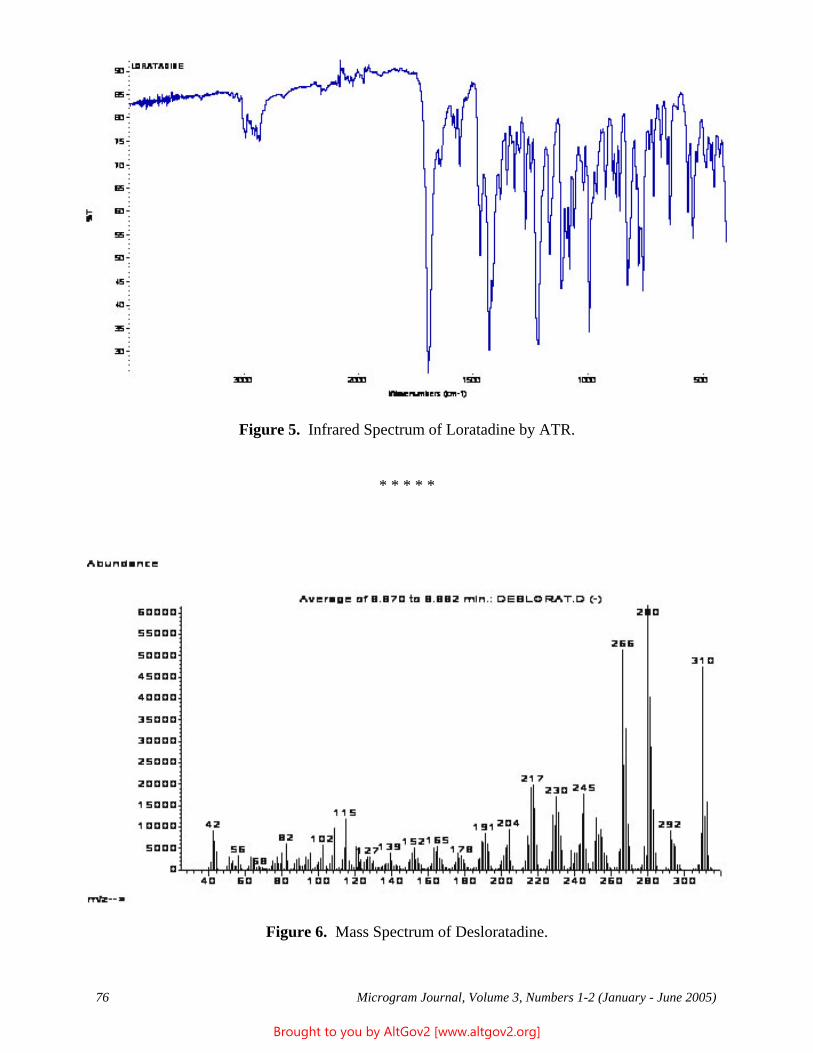
Figure 5. Infrared Spectrum of Loratadine by ATR.
* * * * *
Figure 6. Mass Spectrum of Desloratadine.
Microgram Journal, Volume 3, Numbers 1-2 (January - June 2005) 76
Brought to you by AltGov2 [www.altgov2.org]
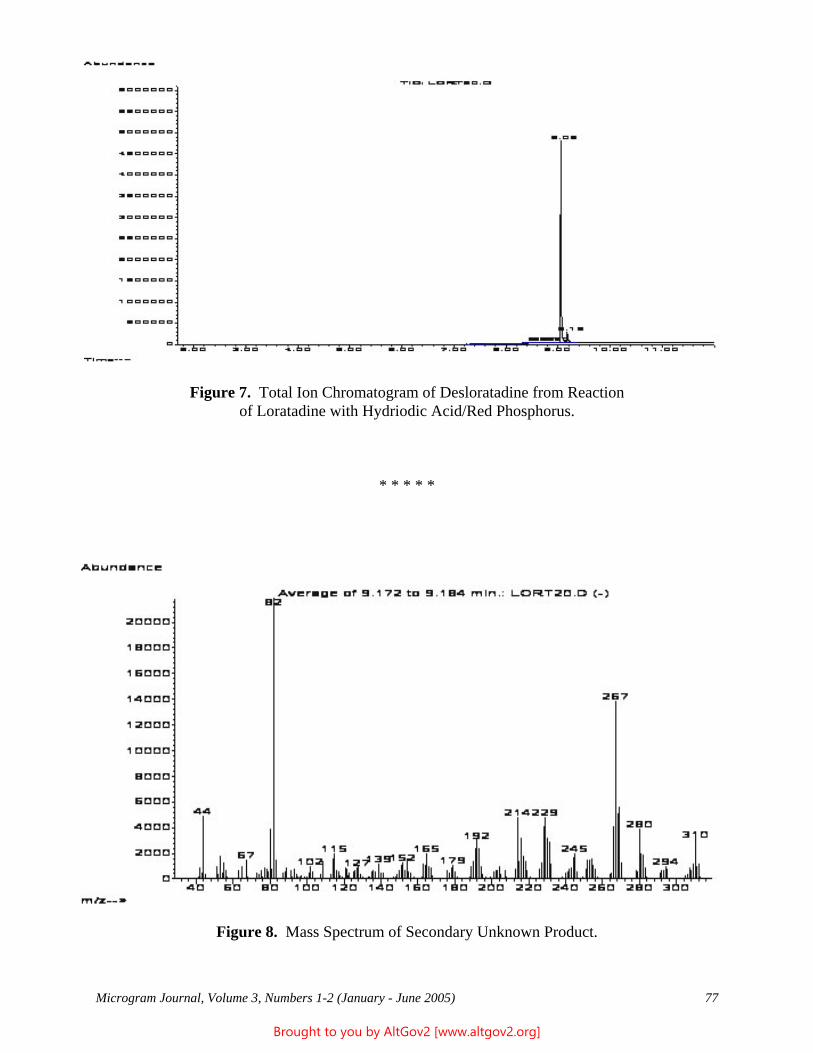
Figure 7. Total Ion Chromatogram of Desloratadine from Reaction of Loratadine with Hydriodic Acid/Red Phosphorus.
* * * * *
Figure 8. Mass Spectrum of Secondary Unknown Product.
Microgram Journal, Volume 3, Numbers 1-2 (January - June 2005) 77
Brought to you by AltGov2 [www.altgov2.org]
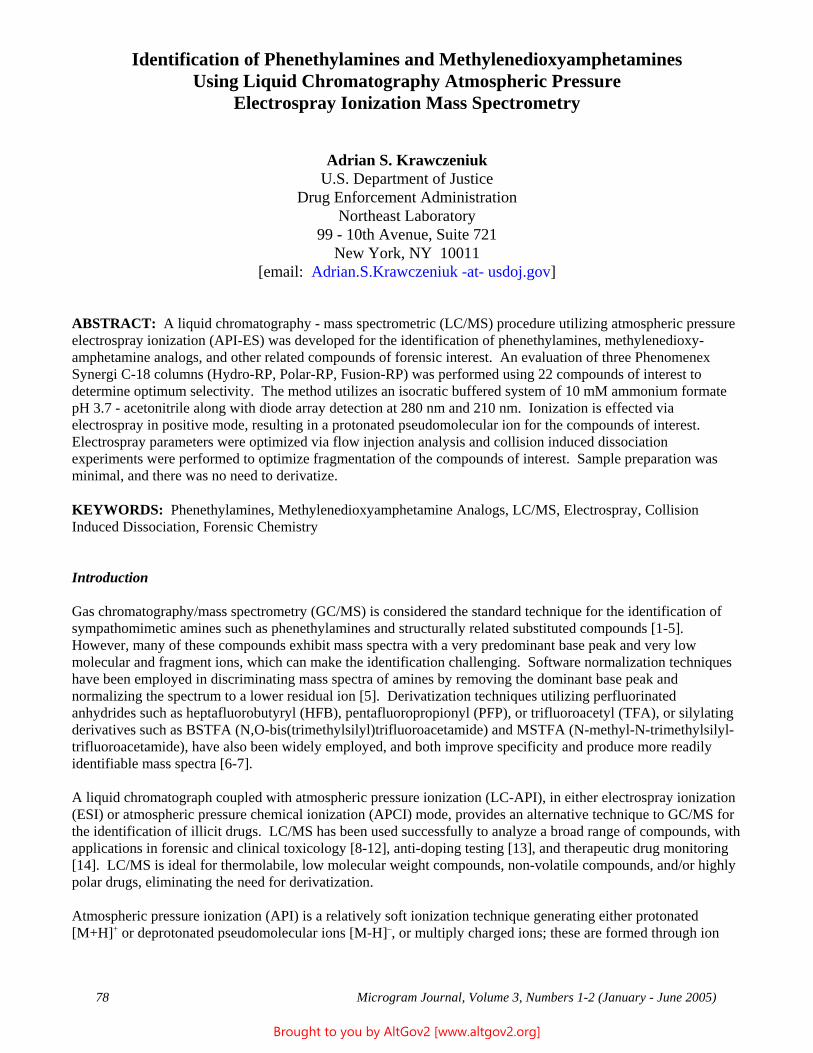
Identification of Phenethylamines and Methylenedioxyamphetamines Using Liquid Chromatography Atmospheric Pressure
Electrospray Ionization Mass Spectrometry
Adrian S. Krawczeniuk U.S. Department of Justice
Drug Enforcement Administration Northeast Laboratory
99 - 10th Avenue, Suite 721 New York, NY 10011
[email: Adrian.S.Krawczeniuk -at- usdoj.gov]
ABSTRACT: A liquid chromatography - mass spectrometric (LC/MS) procedure utilizing atmospheric pressure electrospray ionization (API-ES) was developed for the identification of phenethylamines, methylenedioxyamphetamine analogs, and other related compounds of forensic interest. An evaluation of three Phenomenex Synergi C-18 columns (Hydro-RP, Polar-RP, Fusion-RP) was performed using 22 compounds of interest to determine optimum selectivity. The method utilizes an isocratic buffered system of 10 mM ammonium formate pH 3.7 - acetonitrile along with diode array detection at 280 nm and 210 nm. Ionization is effected via electrospray in positive mode, resulting in a protonated pseudomolecular ion for the compounds of interest. Electrospray parameters were optimized via flow injection analysis and collision induced dissociation experiments were performed to optimize fragmentation of the compounds of interest. Sample preparation was minimal, and there was no need to derivatize.
KEYWORDS: Phenethylamines, Methylenedioxyamphetamine Analogs, LC/MS, Electrospray, Collision Induced Dissociation, Forensic Chemistry
Introduction
Gas chromatography/mass spectrometry (GC/MS) is considered the standard technique for the identification of sympathomimetic amines such as phenethylamines and structurally related substituted compounds [1-5]. However, many of these compounds exhibit mass spectra with a very predominant base peak and very low molecular and fragment ions, which can make the identification challenging. Software normalization techniques have been employed in discriminating mass spectra of amines by removing the dominant base peak and normalizing the spectrum to a lower residual ion [5]. Derivatization techniques utilizing perfluorinated anhydrides such as heptafluorobutyryl (HFB), pentafluoropropionyl (PFP), or trifluoroacetyl (TFA), or silylating derivatives such as BSTFA (N,O-bis(trimethylsilyl)trifluoroacetamide) and MSTFA (N-methyl-N-trimethylsilyl-trifluoroacetamide), have also been widely employed, and both improve specificity and produce more readily identifiable mass spectra [6-7].
A liquid chromatograph coupled with atmospheric pressure ionization (LC-API), in either electrospray ionization (ESI) or atmospheric pressure chemical ionization (APCI) mode, provides an alternative technique to GC/MS for the identification of illicit drugs. LC/MS has been used successfully to analyze a broad range of compounds, with applications in forensic and clinical toxicology [8-12], anti-doping testing [13], and therapeutic drug monitoring [14]. LC/MS is ideal for thermolabile, low molecular weight compounds, non-volatile compounds, and/or highly polar drugs, eliminating the need for derivatization.
Atmospheric pressure ionization (API) is a relatively soft ionization technique generating either protonated [M+H]+ or deprotonated pseudomolecular ions [M-H]–, or multiply charged ions; these are formed through ion
Microgram Journal, Volume 3, Numbers 1-2 (January - June 2005) 78
Brought to you by AltGov2 [www.altgov2.org]
evaporation in ESI, and through gas-phase chemical ionization in APCI. API sources yield low fragmentation, which would normally preclude the use of single quadrupole instruments. However, in-source collision dissociation (CID) can take place in the ion source, allowing for fragmentation of analyte ions via collisions with neutral molecules from residual solvent and gas molecules. This results in bond cleavages and rearrangements that are representative of the molecular structure of the molecule.
This study presents an LC/MS method using electrospray ionization (ESI) for the separation and confirmation of phenethylamines (PEAs), methylenedioxyamphetamines (MDAs), and other compounds routinely encountered in illicit drug seizures. HPLC separations were optimized using three different C-18 stationary phases, and CID experiments were performed in order to obtain mass spectra with fragmentations characteristic for each compound examined.
Experimental
LC/MS Methodology Analyses were performed using an Agilent Technologies 1100 series high pressure liquid chromatograph (HPLC), including a quarternary pump, vacuum degasser, autosampler, thermostatted column compartment, diode array detector, and coupled to an Agilent Technologies 1100 series Model SL single quadrupole mass spectrometer equipped with an electrospray ionization interface. Nitrogen drying gas was generated using a nitrogen generator (Agilent Technologies 5183-2003) coupled to a Jun Air air compressor.
Chromatographic separations were evaluated using three different Phenomenex Synergi columns (15 cm x 3.0 mm, 4 : 80 A) - Hydro-RP, Polar-RP and Fusion-RP. A mobile phase of 10 mM ammonium formate pH 3.7: Acetonitrile (88:12) delivered at a flow rate of 0.5 mL/minute was used to elute the compounds of interest. The column temperature was thermostatically controlled at 40 OC. An injection volume of 2 :L was used.
Mass analyses were performed in scan mode from a mass range m/z 50 - 350 measuring positive pseudomolecular ions. The fragmentor was set at 150 V for all compounds except phenethylamine which was run at 70 V in order to observe the pseudomolecular ion. Spray chamber parameters were as follows: 12.0 L/minute drying gas, 350 OC drying gas temperature, 40 psig nebulizer, 4000 V capillary voltage.
All illicit samples examined were dissolved in the mobile phase and filtered thru a 0.45 : nylon membrane filter prior to analysis. Flow injection analysis was performed on all compounds examined by varying the fragmentor voltage from 100 - 240 V in increments of 20 V. Nebulizer pressure, capillary voltage, and drying gas flow were operated as per manufacturer’s specifications. Complete system control and data evaluation was carried out using the Agilent Chemstation for LC/MS.
Reagents All drug standards were obtained from the reference collection of the DEA Northeast Laboratory. Standards were prepared at a concentration of 0.05 mg/mL diluted in 10 mM ammonium formate pH 3.7. Ammonium formate (99.995+ %), formic acid (95 - 97 %), and acetonitrile (LC/MS Chromasolv grade) were obtained from Sigma Aldrich, St. Louis, MO. Ultrapure water from a Millipore Gradient 10-Elix 3 system (Billerica, MA) was used to prepare all buffers in the study.
Results and Discussion
Optimization of the HPLC conditions was performed using an ammonium formate buffer at pH 3.7 and acetonitrile as the organic modifier. Acetonitrile was chosen as opposed to methanol because it gave more symmetrically shaped peaks and efficiently resolved the compounds of interest. PEAs and MDAs are ideal candidates for positive ion ESI because low pH buffers completely ionize basic compounds (i.e., resulting in protonated species). A total of 22 compounds including structurally similar sympathomimetic amines, MDAs,
Microgram Journal, Volume 3, Numbers 1-2 (January - June 2005) 79
Brought to you by AltGov2 [www.altgov2.org]
and adulterants routinely encountered in illicit seizures were evaluated on three Phenomenex Synergi C-18 columns (Hydro-RP, Polar-RP and Fusion-RP).
Selectivity data for each of the three columns evaluated are listed in Tables 1 - 3. All three columns gave similar selectivities for the 12 most commonly encountered substrates (phenylpropanolamine, phenethylamine, ephedrine, pseudoephedrine, methylephedrine, amphetamine, dimethylamphetamine, methamphetamine, phentermine, 3,4-MDA, 3,4-MDMA, 3,4-MDEA, and MBDB) (see Tables 1 - 3 and Figures 1 - 3). The Polar-RP column (an ether linked phenyl phase with hydrophilic endcapping) exhibited slightly more retentiveness for the N-substituted MDA analogs MDEA, MBDB, and N,N-dimethyl-MDA, along with dimethylamphetamine and ketamine. The adulterant caffeine, commonly encountered in MDMA seizures submitted to our laboratory, was retained on the Polar-RP column, but co-eluted with MDMA on the Hydro-RP and Fusion-RP columns (Tables 1 - 3). Case submissions containing both illicit tablets and powders were analyzed using the established LC/MS procedure (see Figures 13 - 14). Results were verified using a GC/MS method. Both the Hydro-RP and Polar-RP columns have been used interchangeably for routine case submissions, with good success.
Figures 4 - 10 show the mass spectra of 17 PEAs and MDAs examined under the ESI conditions specified. All compounds examined (except phenethylamine) exhibited a protonated pseudomolecular ion using a fragmentor of 150 V. Decreasing the voltage to 70 V revealed the protonated pseudomolecular ion for phenethylamine.
Methamphetamine and phentermine exhibit similar GC/MS fragmentation patterns, but are readily differentiated under ESI conditions. Both compounds are easily resolved on the Hydro-RP and Fusion-RP columns (see Figure 3). These isomers are more closely resolved on the Polar-RP column with a resolution of 1.55 (HPLC) and 1.22 (MS) using the half-width method calculation. Methamphetamine and phentermine both exhibit a pseudomolecular ion of m/z 150, but are easily differentiated by their characteristic fragment ions, with methamphetamine exhibiting a m/z 119 product ion and phentermine exhibiting a m/z 133 product ion (see Figure 4). The ability to resolve these isomeric pairs chromatographically and differentiate them by their mass spectral fragmentation patterns allows for facile identification of these two compounds. Phentermine and 4-methoxymethamphetamine are unresolved on the three columns tested - but this combination has never been encountered at our laboratory (see Figure 3).
The MDAs were resolved on all three columns (see Figure 1). N-hydroxy-3,4-MDA was strongly retained on the Hydro-RP, and eluted in 44 minutes. However, the Polar-RP and Fusion-RP columns offered a more efficient elution, with retention times less than eleven minutes. N-methyl-1-(3,4-methylenedioxyphenyl)-2-butanamine (MBDB) is readily resolved from its regioisomeric MDA derivatives (i.e., 3,4-MDEA, and N,N-dimethyl-3,4-MDA) on all three columns. All three compounds exhibit a protonated pseudomolecular ion at m/z 208. 3,4-MDEA and N,N-dimethyl-3,4-MDA exhibit indistinguishable ESI mass spectra (Figures 7). 3,4-MDEA and MBDB are readily differentiated by their product ions, with MBDB exhibiting product ions at m/z 177 and 135 while MDEA exhibits product ions at m/z 163 and 133 (see Figure 7).
3,4-MDA exhibits a pseudomolecular ion at m/z 180, with product ions at m/z 163, 133, and 105, while 3,4-MDMA exhibits a pseudomolecular ion and base peak at m/z 194, with similar product ions (see Figure 5). All the substituted MDA analogs examined (except 3,4-MDEA and N,N-dimethyl-3,4-MDA) are readily distinguishable by their pseudomolecular ions. In addition, all of the MDAs are resolved on all three columns, thereby allowing for differentiation even of 3,4-MDEA and N,N-dimethyl-3,4-MDA via retention time matching.
In the present study, a fragmentor voltage of 150 V was chosen in order to observe a protonated pseudomolecular ion and sufficient fragmentation product ions that would allow for conclusive identification of each compound examined. Table 4 provides a summary of the relative abundances of the five major ions for each compound examined. The protonated molecular ion was the base peak for 12 of the 22 compounds examined.
Flow injection analysis allows for direct sample injection into the mass spectrometer and was used in order to optimize API-MS parameters. This allowed for rapid method development. CID experiments via flow injection analysis were performed on all compounds by varying the fragmentor voltages from 100 - 240 V.
Microgram Journal, Volume 3, Numbers 1-2 (January - June 2005) 80
Brought to you by AltGov2 [www.altgov2.org]
Varying the fragmentor voltages had the greatest impact on the rate of fragmentation as observed during the CID of 3,4-MDMA (Figure 12). The protonated pseudomolecular ion m/z 194 is most abundant at 100 V and gradually decreases as the fragmentor voltage is ramped to 240 V. At 100 V, the pseudomolecular ion is the base peak, and there are minimal fragment product ions. As the fragmentor voltage is increased, characteristic product ions are observed, and increase in intensity (Figure 11).
Fragmentor voltages were optimized for each respective compound (see Table 5). The sensitivity of higher mass ions was higher at lower fragmentor voltages, while the sensitivity of lower mass ions increased at higher fragmentor voltages. Area response sensitivity gradually decreased for compounds examined as a function of increasing fragmentor voltage (see Figure 15).
In-source CID has been shown to produce similar fragmentations as conventional CID in the collision cell of a tandem mass spectrometer (MS-MS) - but not necessarily of the same intensities. A requirement for in-source CID is a complete separation of the compounds being studied, as opposed to conventional CID using a tandem MS, where a precursor ion is specifically selected, followed by fragmentation [15,17,18]. A disadvantage of in-source CID is that since all ions are fragmented there is no mechanism to elucidate which product ions originated from which precursor ion [18]. In addition, no commercial in-source CID mass spectral libraries exist at present, requiring the user to create an in-house CID mass spectral library for the compounds of interest [16].
In conclusion, in-source fragmentation using a single quadrupole mass spectrometer allows for the positive identification of PEAs and MDAs. The instrumentation is user friendly, provides the ability to perform rapid method development using in-source CID, and offers extracted ion monitoring to deconvolute complex chromatograms. The LC/MS method has been implemented at our laboratory, and has been instrumental in confirming the presence of PEAs, MDAs, and common adulterants found in complex illicit mixtures. This provides a complementary and/or alternative means of identification of PEAs and MDAs.
Acknowledgments
Special thanks to Forensic Chemist Ramona S. Montreuil and Supervisory Chemist Ed J. Manning (both at this laboratory) for their editorial suggestions in reviewing this manuscript.
References
1. Noggle FT, Clark CR, DeRuiter J. Comparative analytical profiles for regioisomeric phenethylamines related to methamphetamine. Microgram 1991;24(4):76-91.
2. Noggle FT, Clark CR, Bouhadir KH, DeRuiter J. Methods for the differentiation of methamphetamine from regioisomeric phenethylamines. Journal of Chromatographic Science 1991;29:31-36.
3. Noggle FT, Clark CR, DeRuiter J. Liquid chromatographic and mass spectral analysis of methoxyamphetamine and methoxymethamphetamine. Journal of Chromatographic Science 1989;27:602-606.
4. DalCason TA. The characterization of some 3,4-methylenedioxyphenylisopropylamines (MDA analogs). Journal of Forensic Sciences 1989;34(4):928-961.
5. Steeves JB, Gagne HM, Buel E. Normalization of residual ions after removal of the base peak in electron impact mass spectrometry. Journal of Forensic Sciences 2000;45(4):882-885.
6. Kaufmann MS, Hatzis AC. Electron impact mass spectrometry of N-substituted amphetamines. Microgram 1996;29(7):179-189.
Microgram Journal, Volume 3, Numbers 1-2 (January - June 2005) 81
Brought to you by AltGov2 [www.altgov2.org]
7. Knapp DR, Editor. Handbook of Analytical Derivatization Reactions. John Wiley and Sons, New York, NY (1979).
8. Maurer HH. Liquid chromatography-mass spectrometry in forensic and clinical toxicology. Journal of Chromatography B: Biomedical Sciences and Applications 1998;713:3-25.
9. Bogusz MJ. Liquid chromatography-mass spectrometry as a routine method in forensic sciences: A proof of maturity. Journal of Chromatography B: Biomedical Sciences and Applications 2000;748:3-19.
10. Bogusz MJ, Kruger KD, Maier RD. Analysis of underivatized amphetamines and related phenethylamines with high performance liquid chromatography-atmospheric pressure chemical ionization mass spectrometry. Journal of Analytical Toxicology 2000;24:77-84.
11. Nordgren HK, Bech O. Direct screening of urine for MDMA and MDA by liquid chromatography-tandem mass spectrometry. Journal of Analytical Toxicology 2003;27:15-19.
12. Rohrich J, Kauert G. Determination of amphetamine and methylenedioxyamphetamine derivative in hair. Forensic Science International 1997;84:179-188.
13. Politi L, Groppi A, Polettini A. Applications of liquid chromatography-mass spectrometry in doping control. Journal of Analytical Toxicology 2005;29:1-14.
14. Day J, Slawson M, Lugo RA, Wilkins D. Analysis of fentanyl and norfentanyl in human plasma by liquid chromatography-tandem MS using electrospray ionization. Journal Analytical Toxicology 2003;27:513-516.
15. Venisse N, Marquet P, Duchoslav E, Dupuy JL, Lachatre G. A general unknown screening procedure for drugs and toxic compounds in serum using liquid chromatography electrospray-single quadrupole mass spectrometry. Journal of Analytical Toxicology 2003;27:7-14.
16. Marquet P, Venisse N, Lacassie E, Lachatre G. In-source CID mass spectral libraries for the general unknown screening of drugs and toxicants. Analysis 2000;28:925-934.
17. Niessen WMA. Advances in instrumentation in liquid chromatography-mass spectrometry and related liquid introduction techniques. Journal of Chromatography A 1998;794:407-435.
18. Basics of LC/MS Primer, Agilent Technologies (2001).
* * * * *
[Table 1 - 5 and Figures 1 - 15 Follow.]
Microgram Journal, Volume 3, Numbers 1-2 (January - June 2005) 82
Brought to you by AltGov2 [www.altgov2.org]
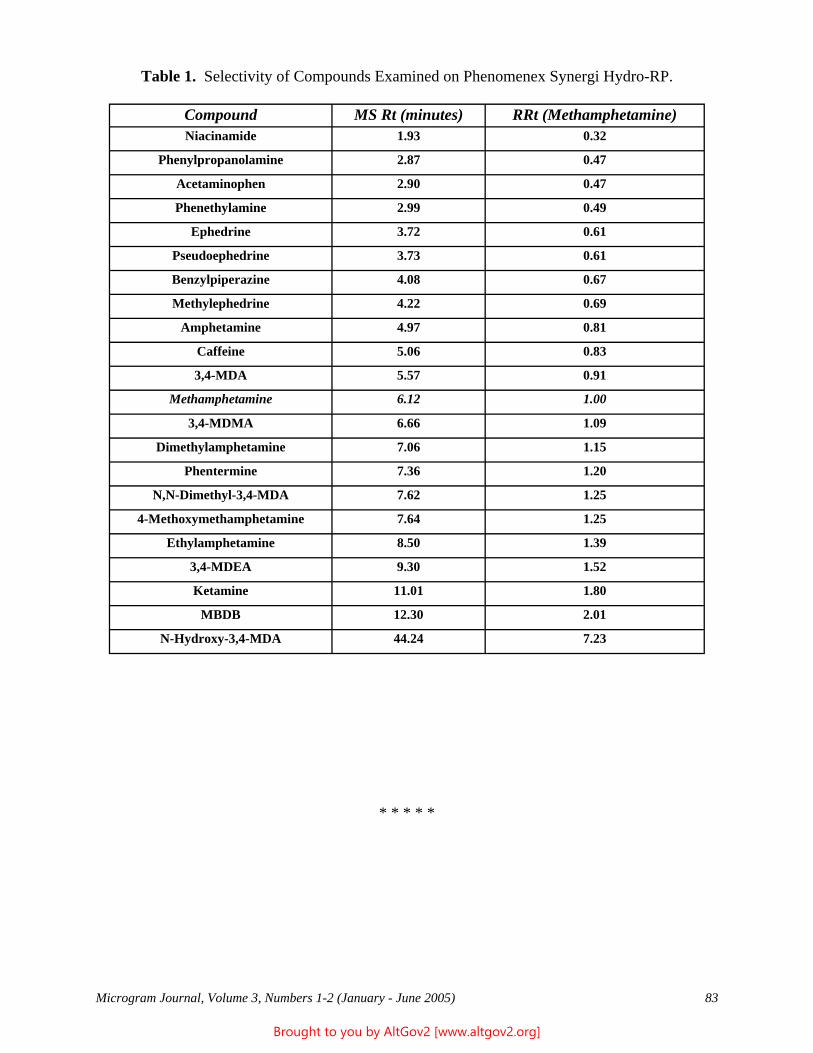
Table 1. Selectivity of Compounds Examined on Phenomenex Synergi Hydro-RP.
Compound MS Rt (minutes) RRt (Methamphetamine) Niacinamide 1.93 0.32
Phenylpropanolamine 2.87 0.47
Acetaminophen 2.90 0.47
Phenethylamine 2.99 0.49
Ephedrine 3.72 0.61
Pseudoephedrine 3.73 0.61
Benzylpiperazine 4.08 0.67
Methylephedrine 4.22 0.69
Amphetamine 4.97 0.81
Caffeine 5.06 0.83
3,4-MDA 5.57 0.91
Methamphetamine 6.12 1.00
3,4-MDMA 6.66 1.09
Dimethylamphetamine 7.06 1.15
Phentermine 7.36 1.20
N,N-Dimethyl-3,4-MDA 7.62 1.25
4-Methoxymethamphetamine 7.64 1.25
Ethylamphetamine 8.50 1.39
3,4-MDEA 9.30 1.52
Ketamine 11.01 1.80
MBDB 12.30 2.01
N-Hydroxy-3,4-MDA 44.24 7.23
* * * * *
Microgram Journal, Volume 3, Numbers 1-2 (January - June 2005) 83
Brought to you by AltGov2 [www.altgov2.org]
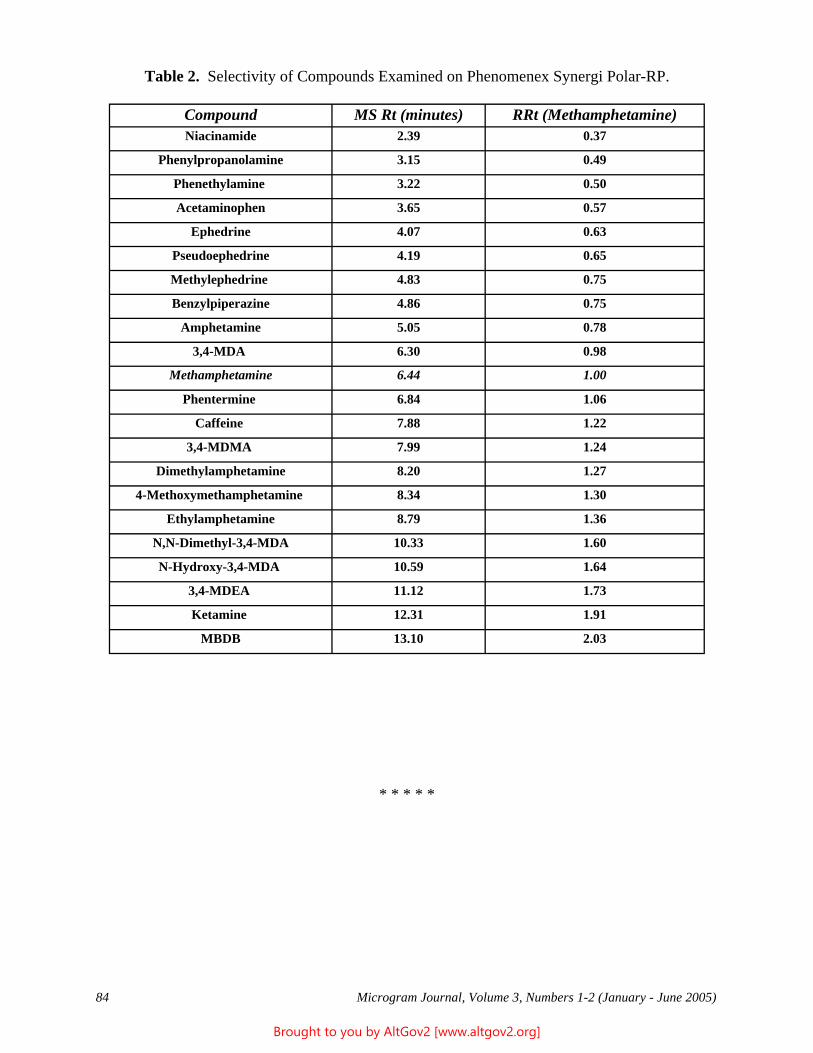
Table 2. Selectivity of Compounds Examined on Phenomenex Synergi Polar-RP.
Compound MS Rt (minutes) RRt (Methamphetamine) Niacinamide 2.39 0.37
Phenylpropanolamine 3.15 0.49
Phenethylamine 3.22 0.50
Acetaminophen 3.65 0.57
Ephedrine 4.07 0.63
Pseudoephedrine 4.19 0.65
Methylephedrine 4.83 0.75
Benzylpiperazine 4.86 0.75
Amphetamine 5.05 0.78
3,4-MDA 6.30 0.98
Methamphetamine 6.44 1.00
Phentermine 6.84 1.06
Caffeine 7.88 1.22
3,4-MDMA 7.99 1.24
Dimethylamphetamine 8.20 1.27
4-Methoxymethamphetamine 8.34 1.30
Ethylamphetamine 8.79 1.36
N,N-Dimethyl-3,4-MDA 10.33 1.60
N-Hydroxy-3,4-MDA 10.59 1.64
3,4-MDEA 11.12 1.73
Ketamine 12.31 1.91
MBDB 13.10 2.03
* * * * *
Microgram Journal, Volume 3, Numbers 1-2 (January - June 2005) 84
Brought to you by AltGov2 [www.altgov2.org]
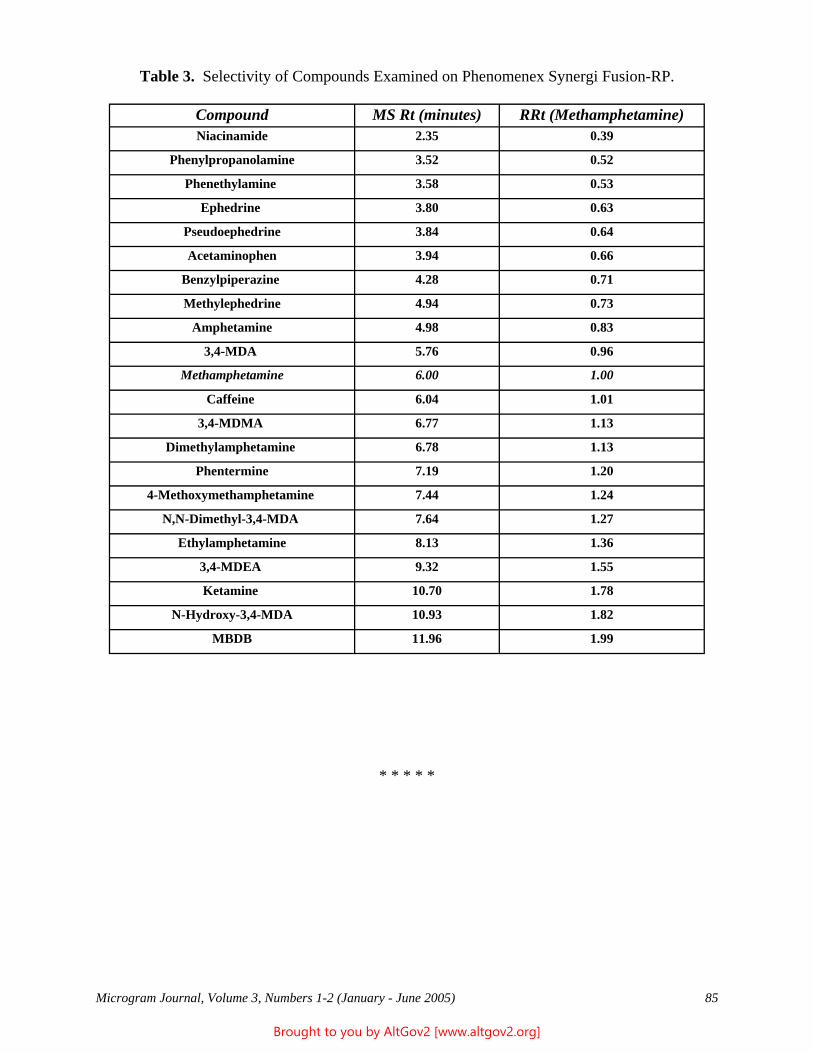
Table 3. Selectivity of Compounds Examined on Phenomenex Synergi Fusion-RP.
Compound MS Rt (minutes) RRt (Methamphetamine) Niacinamide 2.35 0.39
Phenylpropanolamine 3.52 0.52
Phenethylamine 3.58 0.53
Ephedrine 3.80 0.63
Pseudoephedrine 3.84 0.64
Acetaminophen 3.94 0.66
Benzylpiperazine 4.28 0.71
Methylephedrine 4.94 0.73
Amphetamine 4.98 0.83
3,4-MDA 5.76 0.96
Methamphetamine 6.00 1.00
Caffeine 6.04 1.01
3,4-MDMA 6.77 1.13
Dimethylamphetamine 6.78 1.13
Phentermine 7.19 1.20
4-Methoxymethamphetamine 7.44 1.24
N,N-Dimethyl-3,4-MDA 7.64 1.27
Ethylamphetamine 8.13 1.36
3,4-MDEA 9.32 1.55
Ketamine 10.70 1.78
N-Hydroxy-3,4-MDA 10.93 1.82
MBDB 11.96 1.99
* * * * *
Microgram Journal, Volume 3, Numbers 1-2 (January - June 2005) 85
Brought to you by AltGov2 [www.altgov2.org]
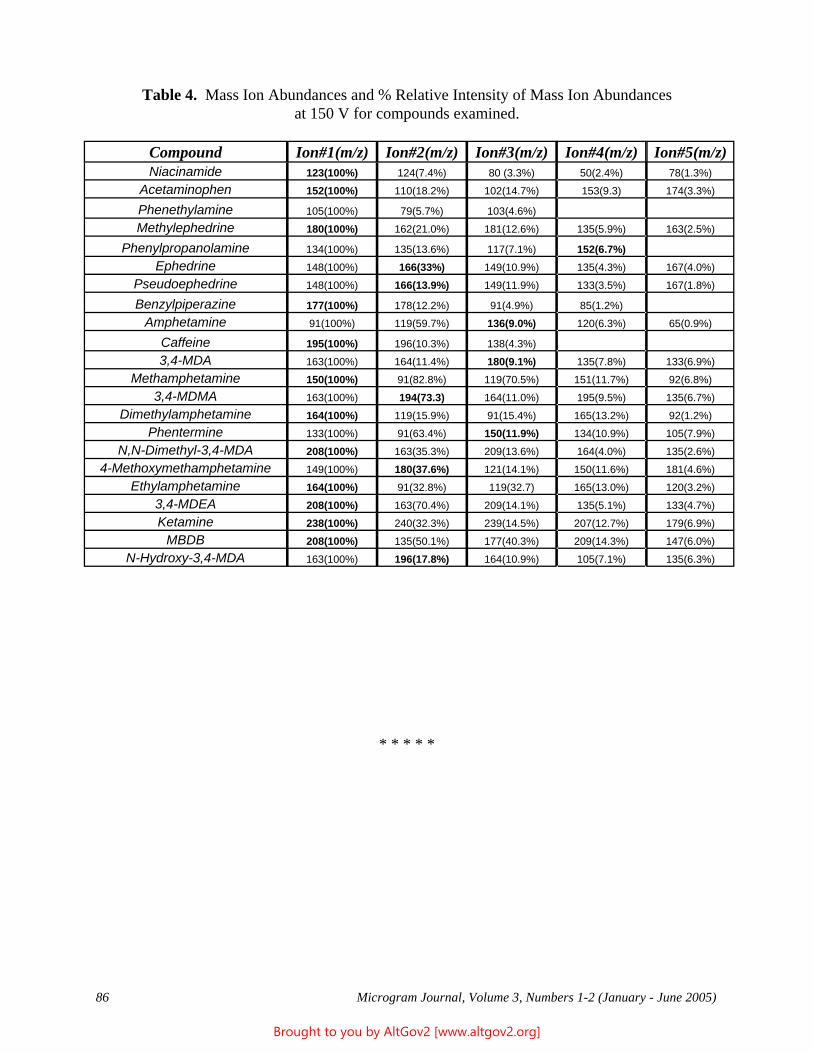
Table 4. Mass Ion Abundances and % Relative Intensity of Mass Ion Abundances at 150 V for compounds examined.
Compound Ion#1(m/z) Ion#2(m/z) Ion#3(m/z) Ion#4(m/z) Ion#5(m/z) Niacinamide 123(100%) 124(7.4%) 80 (3.3%) 50(2.4%) 78(1.3%)
Acetaminophen 152(100%) 110(18.2%) 102(14.7%) 153(9.3) 174(3.3%)
Phenethylamine 105(100%) 79(5.7%) 103(4.6%) Methylephedrine 180(100%) 162(21.0%) 181(12.6%) 135(5.9%) 163(2.5%)
Phenylpropanolamine 134(100%) 135(13.6%) 117(7.1%) 152(6.7%) Ephedrine 148(100%) 166(33%) 149(10.9%) 135(4.3%) 167(4.0%)
Pseudoephedrine 148(100%) 166(13.9%) 149(11.9%) 133(3.5%) 167(1.8%)
Benzylpiperazine 177(100%) 178(12.2%) 91(4.9%) 85(1.2%) Amphetamine 91(100%) 119(59.7%) 136(9.0%) 120(6.3%) 65(0.9%)
Caffeine 195(100%) 196(10.3%) 138(4.3%) 3,4-MDA 163(100%) 164(11.4%) 180(9.1%) 135(7.8%) 133(6.9%)
Methamphetamine 150(100%) 91(82.8%) 119(70.5%) 151(11.7%) 92(6.8%) 3,4-MDMA 163(100%) 194(73.3) 164(11.0%) 195(9.5%) 135(6.7%)
Dimethylamphetamine 164(100%) 119(15.9%) 91(15.4%) 165(13.2%) 92(1.2%) Phentermine 133(100%) 91(63.4%) 150(11.9%) 134(10.9%) 105(7.9%)
N,N-Dimethyl-3,4-MDA 208(100%) 163(35.3%) 209(13.6%) 164(4.0%) 135(2.6%) 4-Methoxymethamphetamine 149(100%) 180(37.6%) 121(14.1%) 150(11.6%) 181(4.6%)
Ethylamphetamine 164(100%) 91(32.8%) 119(32.7) 165(13.0%) 120(3.2%) 3,4-MDEA 208(100%) 163(70.4%) 209(14.1%) 135(5.1%) 133(4.7%) Ketamine 238(100%) 240(32.3%) 239(14.5%) 207(12.7%) 179(6.9%)
MBDB 208(100%) 135(50.1%) 177(40.3%) 209(14.3%) 147(6.0%) N-Hydroxy-3,4-MDA 163(100%) 196(17.8%) 164(10.9%) 105(7.1%) 135(6.3%)
* * * * *
Microgram Journal, Volume 3, Numbers 1-2 (January - June 2005) 86
Brought to you by AltGov2 [www.altgov2.org]
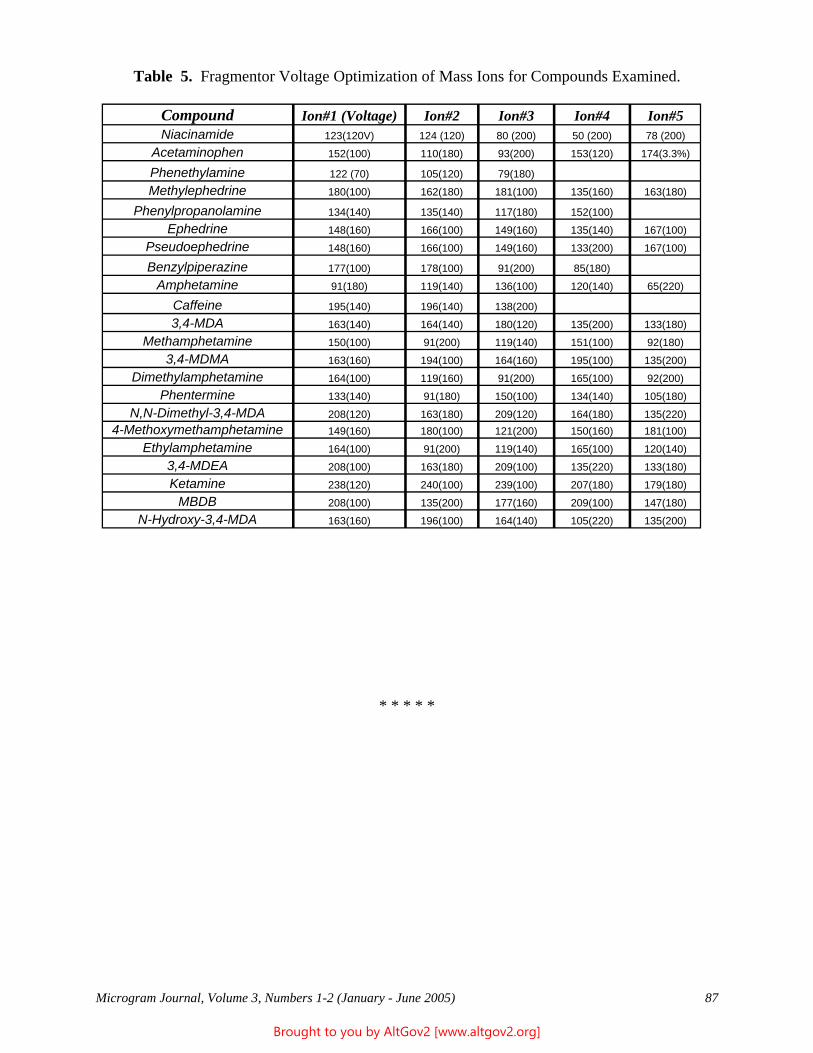
Table 5. Fragmentor Voltage Optimization of Mass Ions for Compounds Examined.
Compound Ion#1 (Voltage) Ion#2 Ion#3 Ion#4 Ion#5 Niacinamide 123(120V) 124 (120) 80 (200) 50 (200) 78 (200)
Acetaminophen 152(100) 110(180) 93(200) 153(120) 174(3.3%)
Phenethylamine 122 (70) 105(120) 79(180) Methylephedrine 180(100) 162(180) 181(100) 135(160) 163(180)
Phenylpropanolamine 134(140) 135(140) 117(180) 152(100) Ephedrine 148(160) 166(100) 149(160) 135(140) 167(100)
Pseudoephedrine 148(160) 166(100) 149(160) 133(200) 167(100)
Benzylpiperazine 177(100) 178(100) 91(200) 85(180) Amphetamine 91(180) 119(140) 136(100) 120(140) 65(220)
Caffeine 195(140) 196(140) 138(200) 3,4-MDA 163(140) 164(140) 180(120) 135(200) 133(180)
Methamphetamine 150(100) 91(200) 119(140) 151(100) 92(180) 3,4-MDMA 163(160) 194(100) 164(160) 195(100) 135(200)
Dimethylamphetamine 164(100) 119(160) 91(200) 165(100) 92(200) Phentermine 133(140) 91(180) 150(100) 134(140) 105(180)
N,N-Dimethyl-3,4-MDA 208(120) 163(180) 209(120) 164(180) 135(220) 4-Methoxymethamphetamine 149(160) 180(100) 121(200) 150(160) 181(100)
Ethylamphetamine 164(100) 91(200) 119(140) 165(100) 120(140) 3,4-MDEA 208(100) 163(180) 209(100) 135(220) 133(180) Ketamine 238(120) 240(100) 239(100) 207(180) 179(180)
MBDB 208(100) 135(200) 177(160) 209(100) 147(180) N-Hydroxy-3,4-MDA 163(160) 196(100) 164(140) 105(220) 135(200)
* * * * *
Microgram Journal, Volume 3, Numbers 1-2 (January - June 2005) 87
Brought to you by AltGov2 [www.altgov2.org]
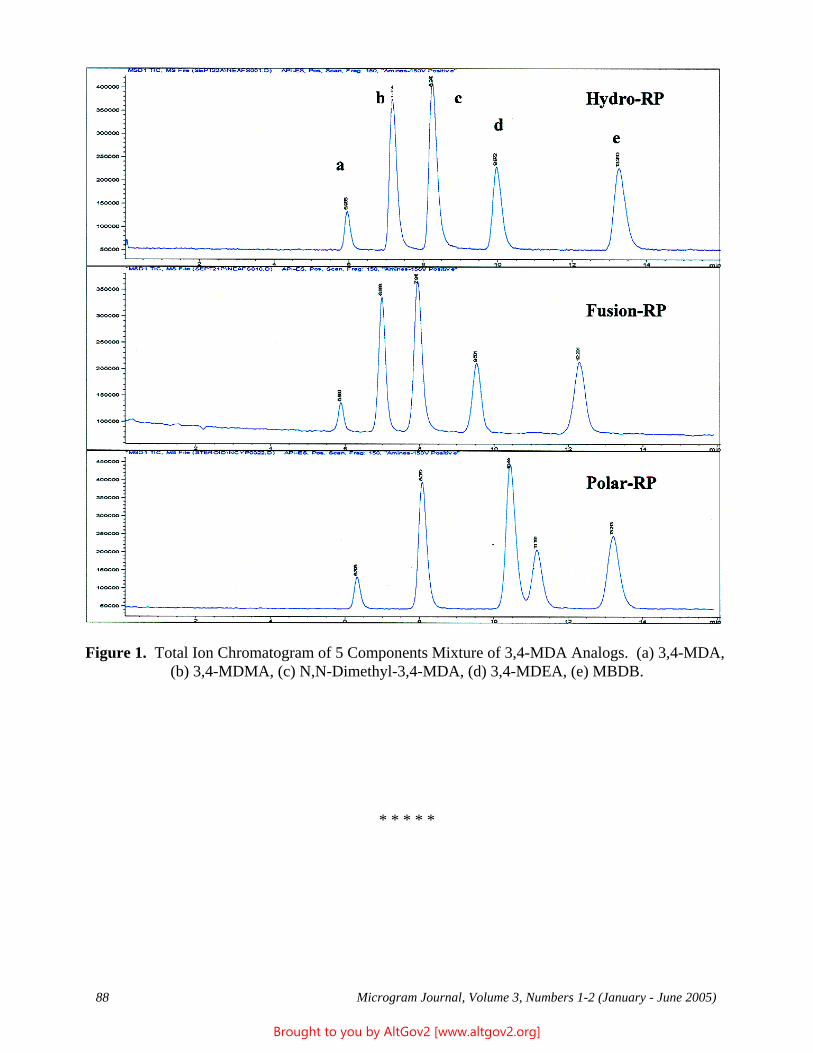
Figure 1. Total Ion Chromatogram of 5 Components Mixture of 3,4-MDA Analogs. (a) 3,4-MDA, (b) 3,4-MDMA, (c) N,N-Dimethyl-3,4-MDA, (d) 3,4-MDEA, (e) MBDB.
* * * * *
Microgram Journal, Volume 3, Numbers 1-2 (January - June 2005) 88
Brought to you by AltGov2 [www.altgov2.org]
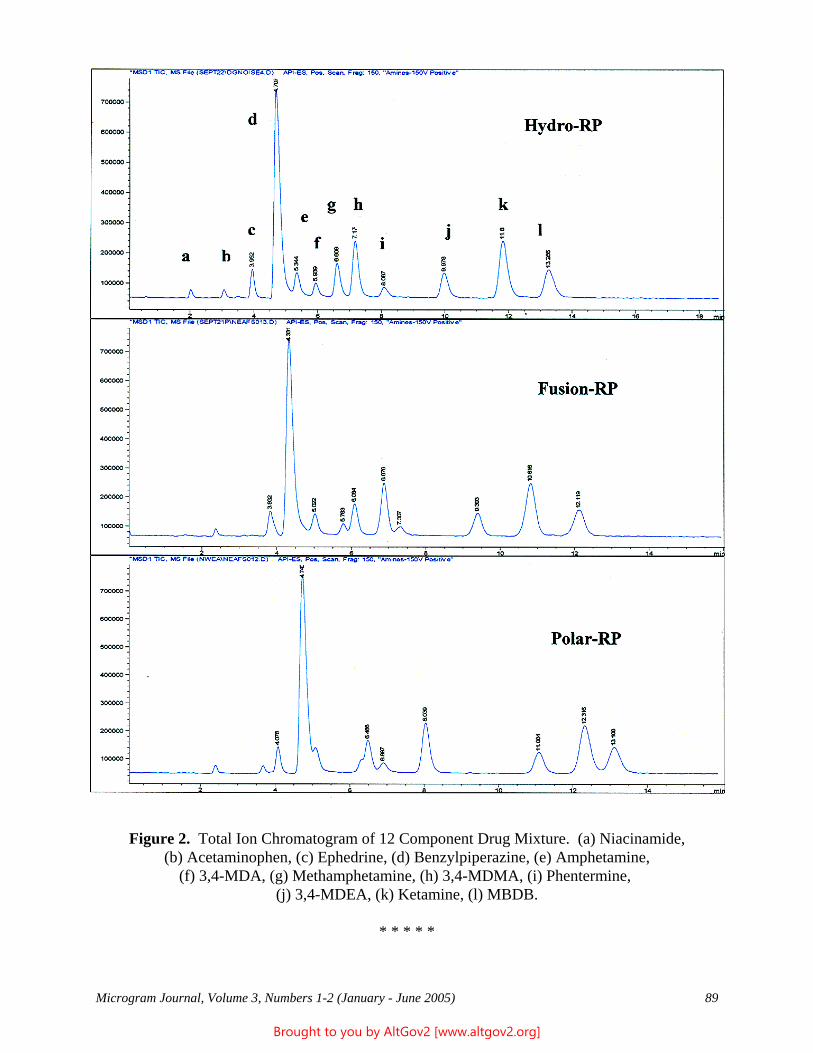
Figure 2. Total Ion Chromatogram of 12 Component Drug Mixture. (a) Niacinamide, (b) Acetaminophen, (c) Ephedrine, (d) Benzylpiperazine, (e) Amphetamine,
(f) 3,4-MDA, (g) Methamphetamine, (h) 3,4-MDMA, (i) Phentermine, (j) 3,4-MDEA, (k) Ketamine, (l) MBDB.
* * * * *
Microgram Journal, Volume 3, Numbers 1-2 (January - June 2005) 89
Brought to you by AltGov2 [www.altgov2.org]
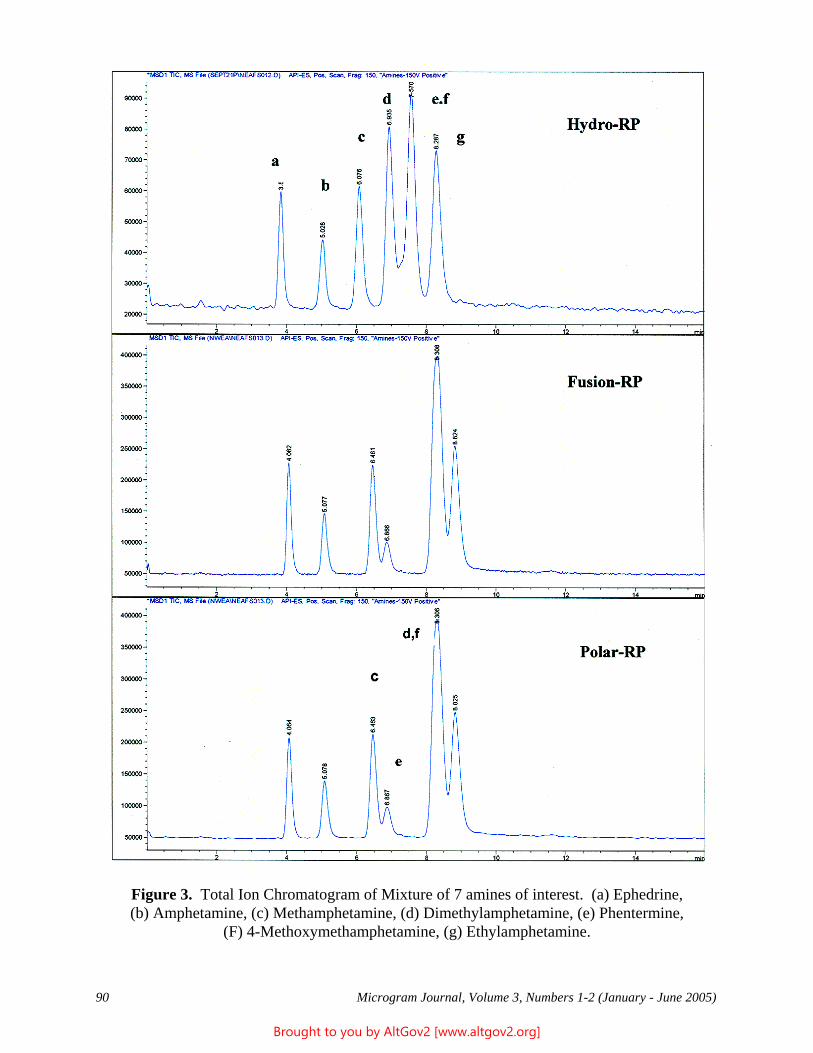
Figure 3. Total Ion Chromatogram of Mixture of 7 amines of interest. (a) Ephedrine, (b) Amphetamine, (c) Methamphetamine, (d) Dimethylamphetamine, (e) Phentermine,
(F) 4-Methoxymethamphetamine, (g) Ethylamphetamine.
Microgram Journal, Volume 3, Numbers 1-2 (January - June 2005) 90
Brought to you by AltGov2 [www.altgov2.org]
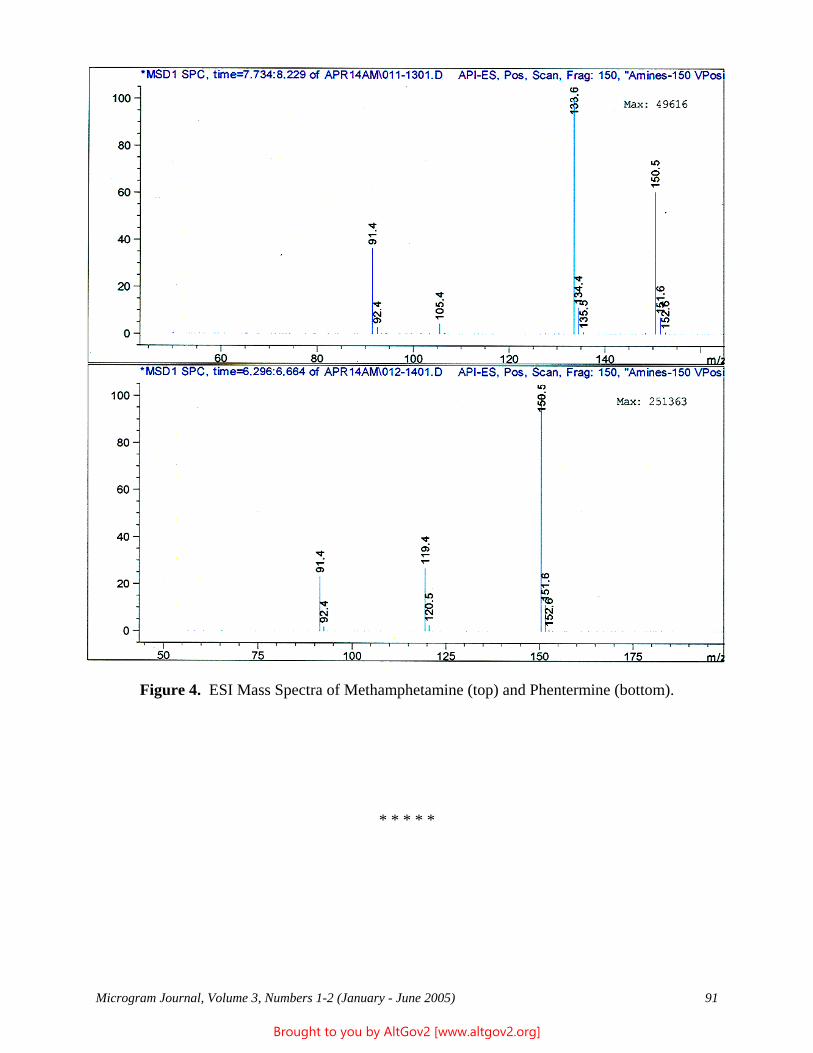
Figure 4. ESI Mass Spectra of Methamphetamine (top) and Phentermine (bottom).
* * * * *
Microgram Journal, Volume 3, Numbers 1-2 (January - June 2005) 91
Brought to you by AltGov2 [www.altgov2.org]
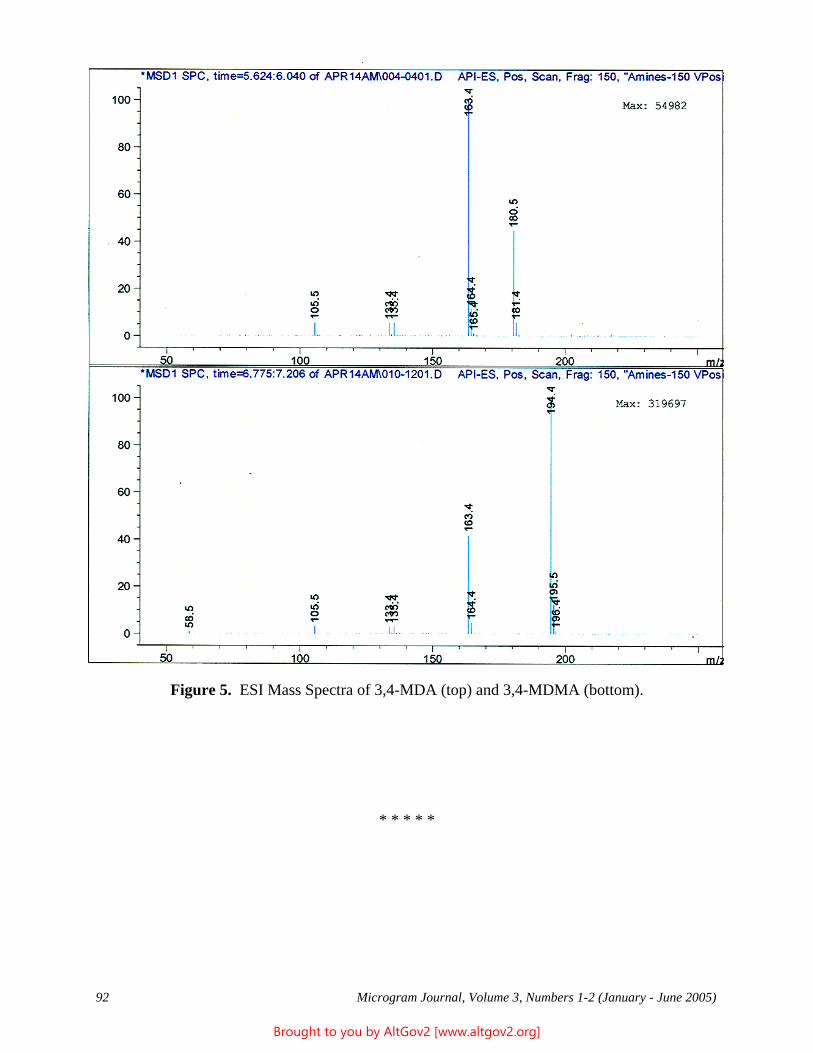
Figure 5. ESI Mass Spectra of 3,4-MDA (top) and 3,4-MDMA (bottom).
* * * * *
Microgram Journal, Volume 3, Numbers 1-2 (January - June 2005) 92
Brought to you by AltGov2 [www.altgov2.org]
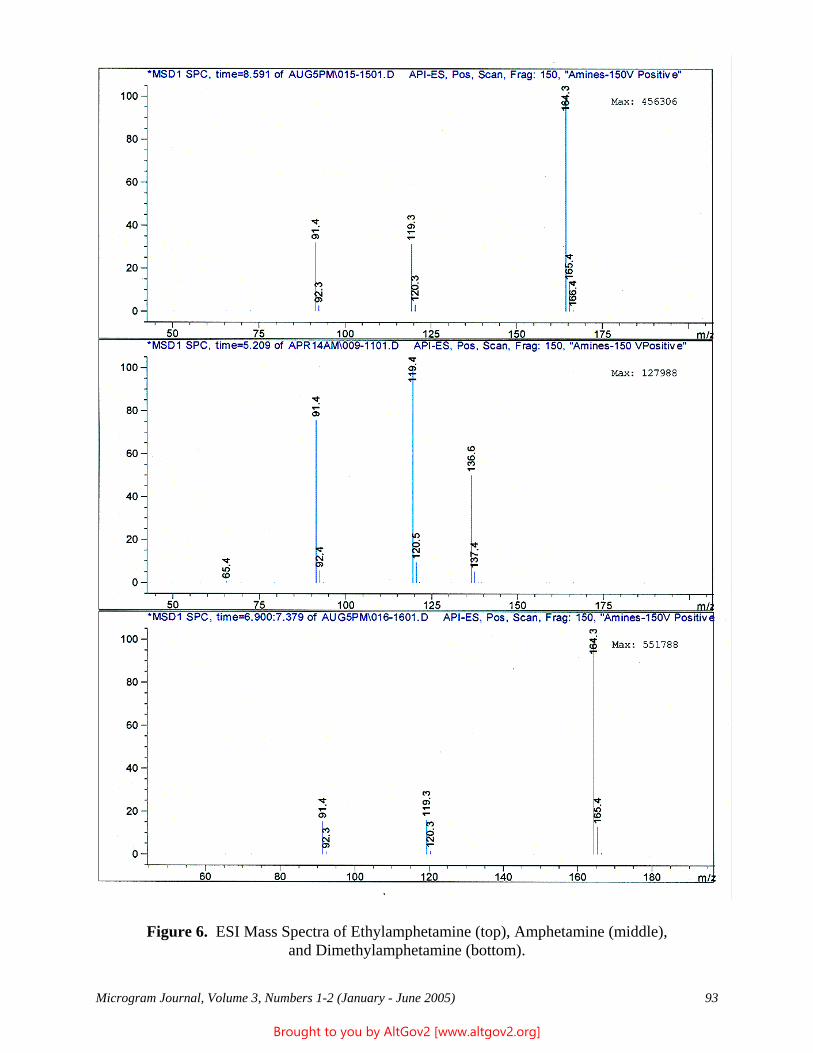
Figure 6. ESI Mass Spectra of Ethylamphetamine (top), Amphetamine (middle), and Dimethylamphetamine (bottom).
Microgram Journal, Volume 3, Numbers 1-2 (January - June 2005) 93
Brought to you by AltGov2 [www.altgov2.org]
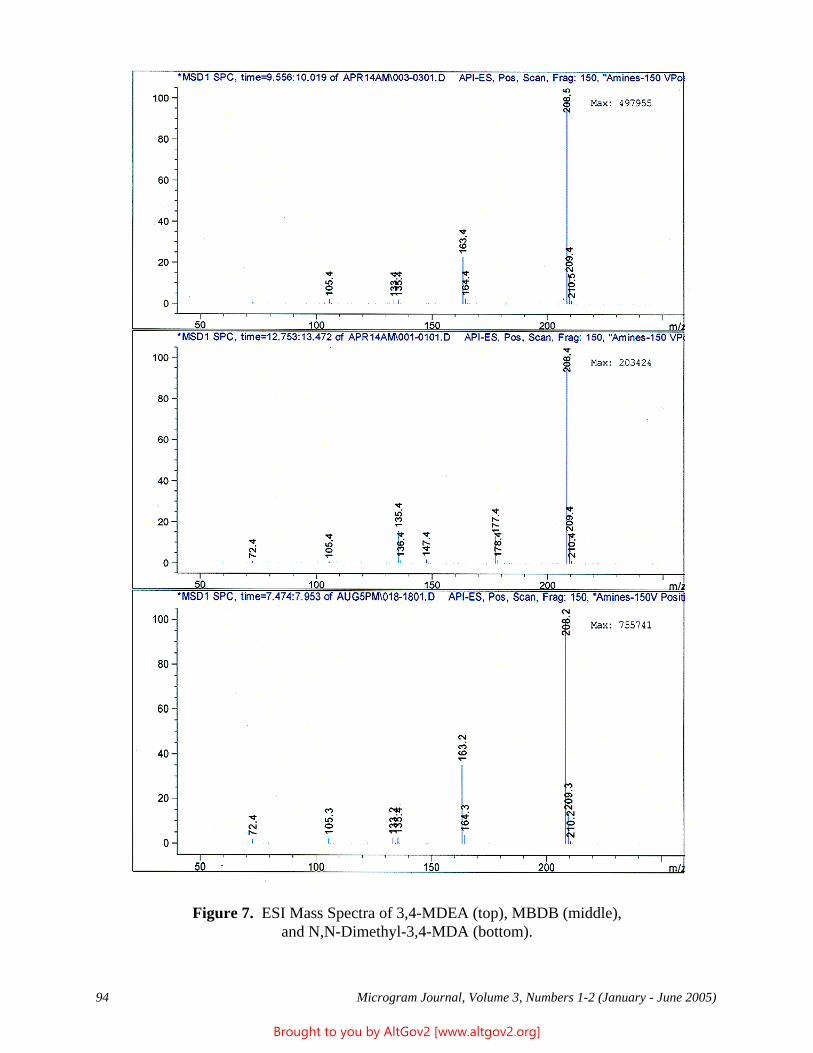
Figure 7. ESI Mass Spectra of 3,4-MDEA (top), MBDB (middle), and N,N-Dimethyl-3,4-MDA (bottom).
Microgram Journal, Volume 3, Numbers 1-2 (January - June 2005) 94
Brought to you by AltGov2 [www.altgov2.org]
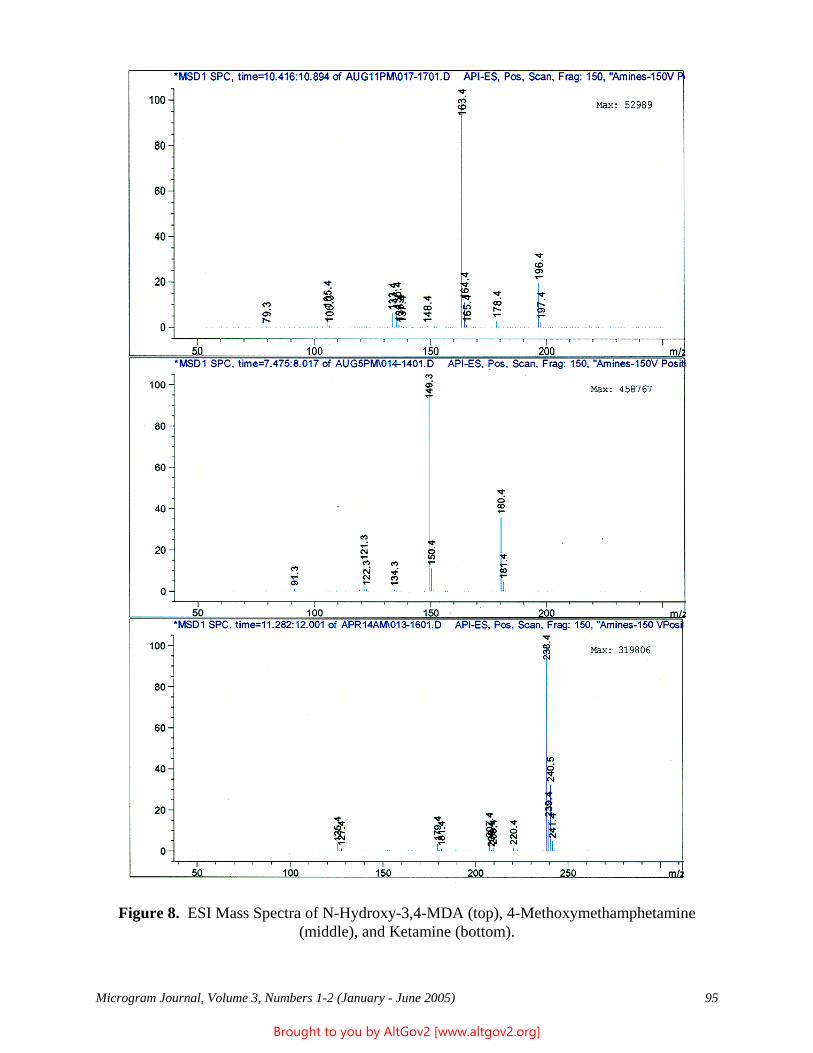
Figure 8. ESI Mass Spectra of N-Hydroxy-3,4-MDA (top), 4-Methoxymethamphetamine (middle), and Ketamine (bottom).
Microgram Journal, Volume 3, Numbers 1-2 (January - June 2005) 95
Brought to you by AltGov2 [www.altgov2.org]
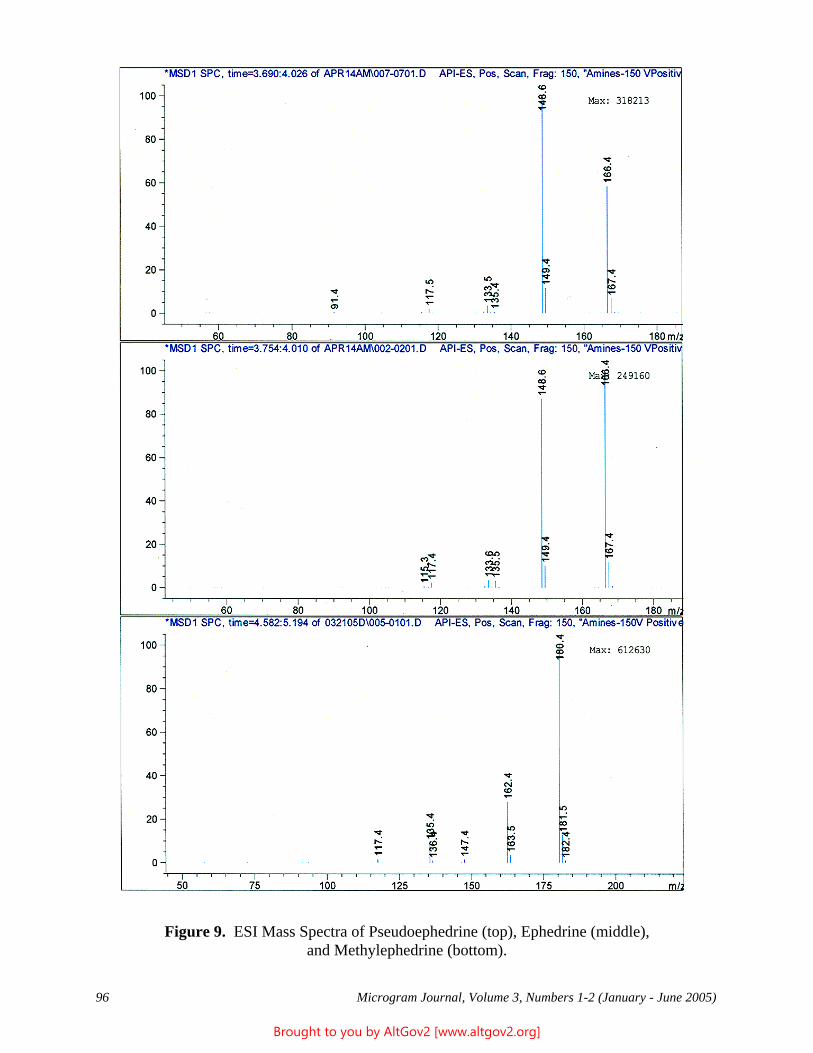
Figure 9. ESI Mass Spectra of Pseudoephedrine (top), Ephedrine (middle), and Methylephedrine (bottom).
Microgram Journal, Volume 3, Numbers 1-2 (January - June 2005) 96
Brought to you by AltGov2 [www.altgov2.org]
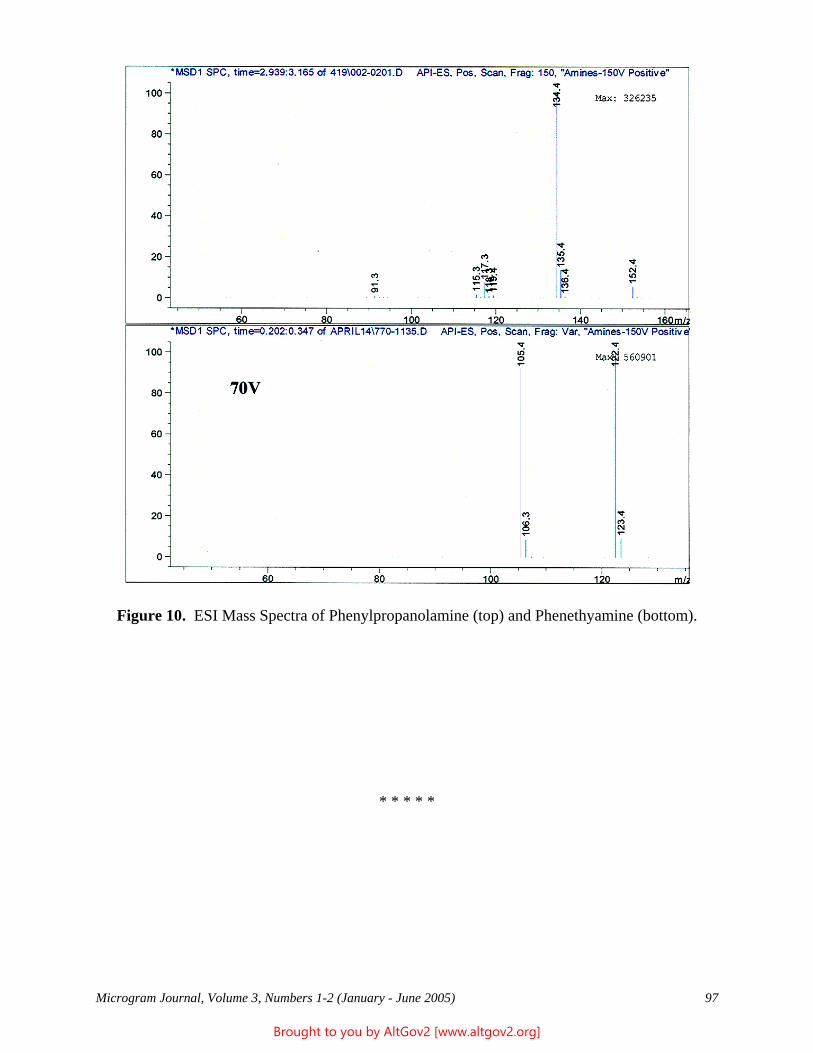
Figure 10. ESI Mass Spectra of Phenylpropanolamine (top) and Phenethyamine (bottom).
* * * * *
Microgram Journal, Volume 3, Numbers 1-2 (January - June 2005) 97
Brought to you by AltGov2 [www.altgov2.org]
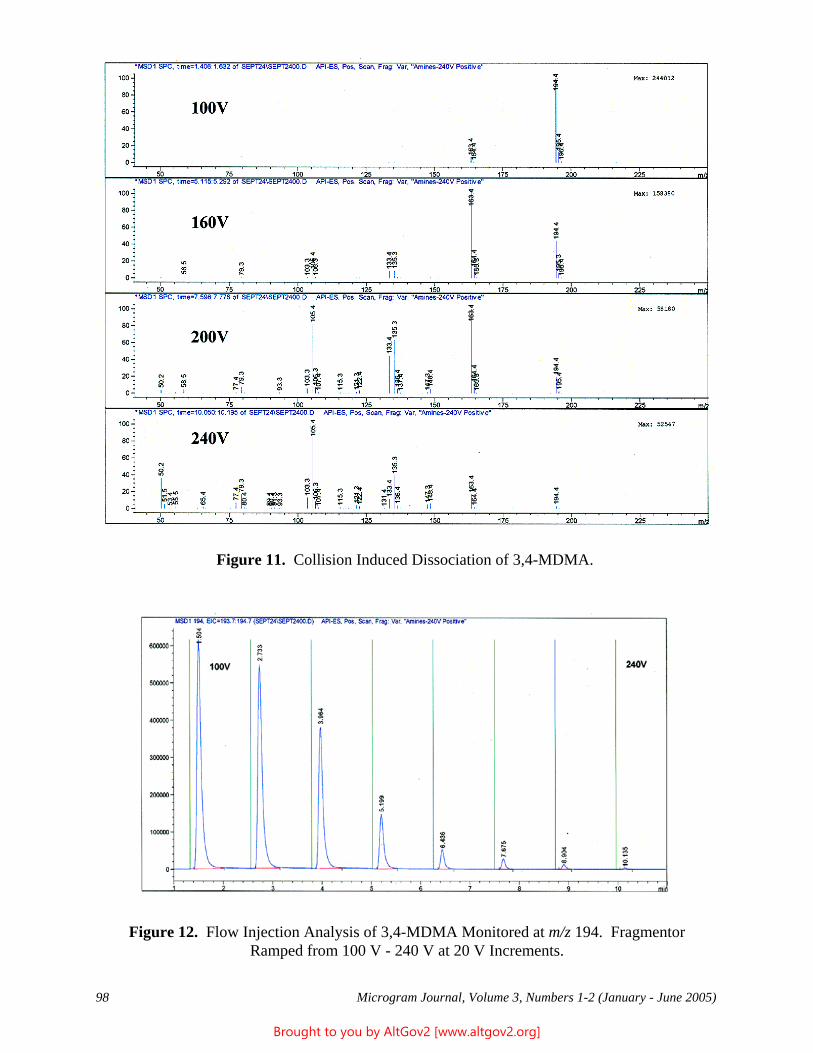
Figure 11. Collision Induced Dissociation of 3,4-MDMA.
Figure 12. Flow Injection Analysis of 3,4-MDMA Monitored at m/z 194. Fragmentor Ramped from 100 V - 240 V at 20 V Increments.
Microgram Journal, Volume 3, Numbers 1-2 (January - June 2005) 98
Brought to you by AltGov2 [www.altgov2.org]
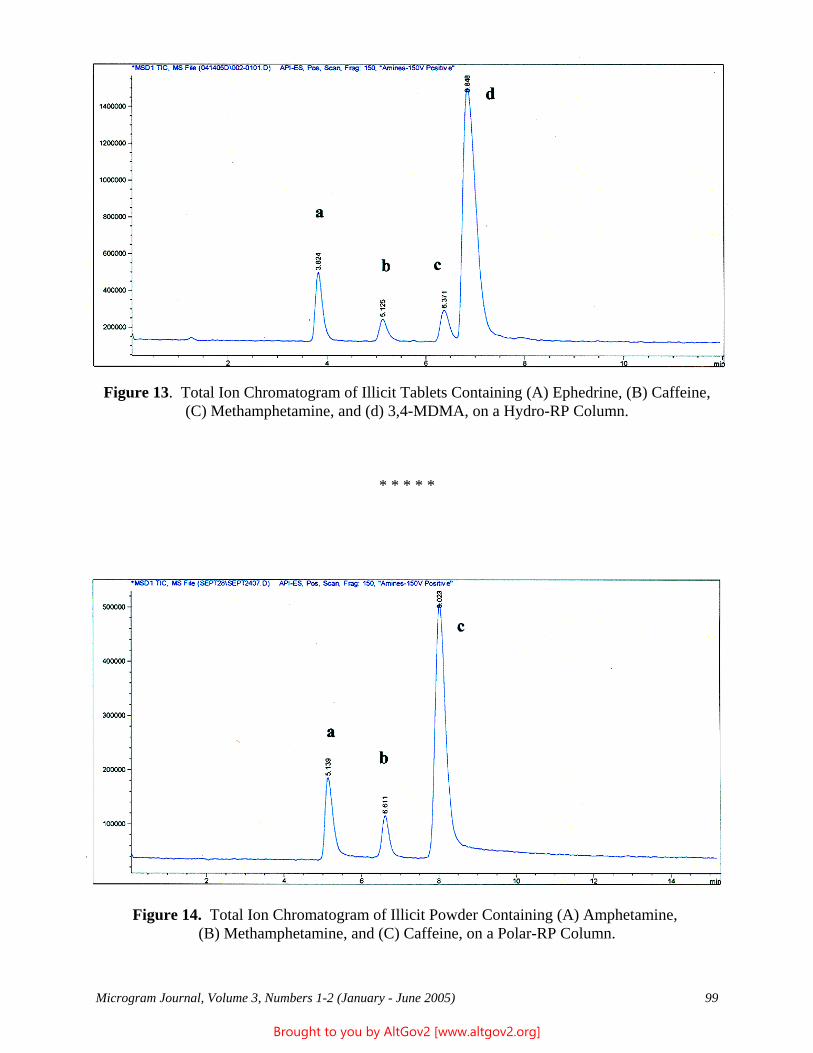
Figure 13. Total Ion Chromatogram of Illicit Tablets Containing (A) Ephedrine, (B) Caffeine, (C) Methamphetamine, and (d) 3,4-MDMA, on a Hydro-RP Column.
* * * * *
Figure 14. Total Ion Chromatogram of Illicit Powder Containing (A) Amphetamine, (B) Methamphetamine, and (C) Caffeine, on a Polar-RP Column.
Microgram Journal, Volume 3, Numbers 1-2 (January - June 2005) 99
Brought to you by AltGov2 [www.altgov2.org]
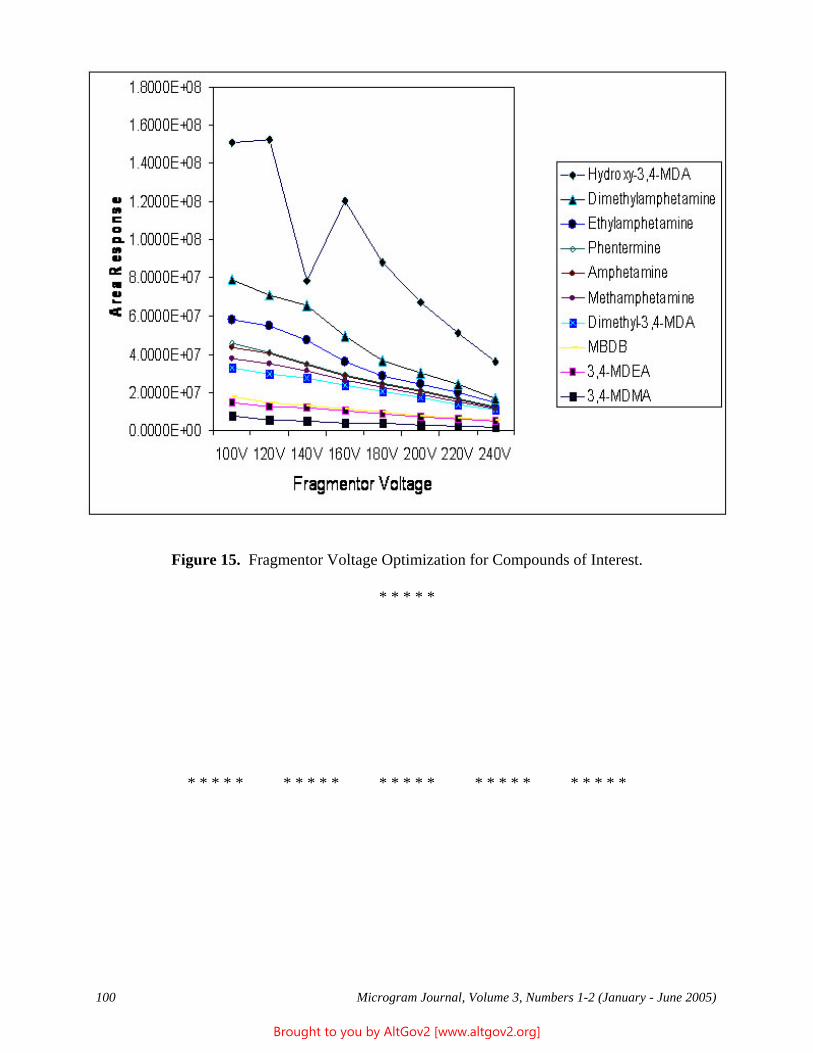
Figure 15. Fragmentor Voltage Optimization for Compounds of Interest.
* * * * *
* * * * * * * * * * * * * * * * * * * * * * * * *
Microgram Journal, Volume 3, Numbers 1-2 (January - June 2005) 100
Brought to you by AltGov2 [www.altgov2.org]
INSTRUCTIONS FOR AUTHORS
General Information Microgram Journal is a scientific periodical that is published by the U.S. Drug Enforcement Administration’s Office of Forensic Sciences, and presents peer reviewed, full length Scientific Research Articles and Technical Notes on the detection and analyses of suspected controlled substances for forensic/law enforcement purposes.
Subscriptions to Microgram Journal Microgram Journal is unclassified, and is published on the DEA public access website (www.dea.gov). Private citizens should use the website to access Microgram Journal. Professional scientific and law enforcement personnel may either use the website or request a subscription. Subscriptions are available electronically and in hard copy. Electronic subscriptions require Internet access. The publications themselves will not be sent electronically to any subscriber; rather, an email notification of the pertinent URL will be sent to the subscriber when the respective issue is posted on the website (see additional information on email notifications, below). Requests for hard copies are strongly discouraged, and should be limited to those offices that do not have access to the Internet, require hard copies for their libraries, or have some other valid reason (Note: “For my personal collection” is not considered to be a valid reason). Requests for hard copies should indicate the number of copies required (maximum of two allowed per office), and should also include formal justification. Note that due to publication delays beyond the control of the Office of Forensic Sciences, hard copies will arrive from 30 to 180 days after electronic posting.
Requests to be added to the subscription list should be submitted via email to the Microgram Editor at: [email protected] If email submission is not possible, requests should be mailed to: Microgram Editor, Drug Enforcement Administration, Office of Forensic Sciences, 2401 Jefferson Davis Highway, Alexandria, VA 22301. All requests to be added to the Microgram mailing list should include the following Standard Contact Information:
* The Full Name and Mailing Address of Submitting Laboratory or Office;
* The Full Name, Title (Laboratory Director, Assistant Special Agent in Charge, Librarian, etc.), Phone Number, FAX Number, and Preferred email Address of the Submitting Individual (Note that subscriptions are mailed to titles, not names, in order to avoid subscription problems arising from future personnel changes);
* If available, the generic email address for the Submitting Laboratory or Office;
* If a generic email address is not available, one private email address for an individual who is likely to be a long-term employee, who has a stable email address, and who will be responsible for forwarding Microgram information to all of the other employees in the requestor’s Office (Note that only one email address per Office will be honored);
* If requesting hard copy mailings, the number of copies requested (two max), and justification.
Requests to be removed from the Microgram subscription list, or to change an existing subscription, should also be sent to the Microgram Editor. Such requests should included all of the pertinent standard contact information detailed above, and also should provide the email and/or hard mail address currently being utilized for the requestor’s subscription.
Note that, due to mailing delays and/or publication timeframes, subscription requests/changes may take as long as 90 days to implement.
Microgram Journal, Volume 3, Numbers 1-2 (January - June 2005) 101
Brought to you by AltGov2 [www.altgov2.org]
Email Notifications (Additional Comments) As noted above, electronic subscriptions are email based. The email provides a notification of the Microgram URL when a new issue is posted, and additional information as appropriate. Note that Microgram notices will NEVER include any attachments, or any hyperlink other than the Microgram URL. This is important, because the [email protected] address is routinely hijacked and used to send spam, very commonly including malicious attachments. For this reason, all subscribers are urged to have current Anti-Viral, Anti-Spyware, and Firewall programs in operation.
Costs Subscriptions to Microgram are free.
Submissions to Microgram Journal Manuscripts are accepted both from within and outside of DEA, and reviewers for the Journal are both internal (from within DEA) and external.
All submissions must be in English. All submissions should, whenever possible, be submitted electronically, as straight email or as an IBM® PC-compatible Corel WordPerfect® or Microsoft Word® attachment, to: [email protected] Current versions of Corel WordPerfect® or Microsoft Word® (defined as having release dates less than 5 years old) should be utilized. If electronic (email) submission is not possible, submissions may be mailed to: Microgram Editor, Drug Enforcement Administration, Office of Forensic Sciences, 2401 Jefferson Davis Highway, Alexandria, VA 22301. Hard-copy manuscripts should be submitted in triplicate, and should also be accompanied by an electronic version (written in either Corel WordPerfect® or Microsoft Word®) on a 3 ½ inch IBM® PC-compatible diskette, 100 or 250 MB Iomega® zip diskette, or an IBM® PC-compatible CD. Note that diskettes should be mailed in an irradiation-proof protective sleeve, and the mailing envelope should be marked: “Warning - Contains Electronic Media - Do Not Irradiate”. Hard-copy manuscripts should be printed in black ink using a laser or ink jet printer, double-spaced, on one side of 8 1/2" x 11" or A4 high quality white bond paper. A Times New Roman/12-point font is preferred for all submissions (electronic or hard copy). Each page, including illustrations, should have a one-inch (25 mm) margin on all sides. The pages should be numbered, but not stapled together.
Note that mailed submissions may be subject to lengthy handling delays beyond the control of the Office of Forensic Sciences, and electronic media sent through the mail may be destroyed en route by sanitizing procedures, despite protective measures and written warnings. All submissions should include the following Contact Information: The Full Name and Address of Submitting Laboratory or Office, and the Full Name, Phone Number, FAX Number, and Preferred email Address of the Submitting Individual.
Scientific Research Articles are formal, full length reports detailing original research in the detection and analysis of suspected controlled substances for forensic/law enforcement purposes, excluding in post-ingestion human/animal biological matrices (blood, urine, meconium, sweat, hair, etc.) Technical Notes are shorter communications concentrating on a specific drug (or drug class), unusual case, novel or unusual procedure or method, or minor original research. Each article/note should be a “stand-alone” work; serial publications will not be considered. Similarly, articles/notes which essentially duplicate existing literature will not be considered unless the presented data reflect significant advances in instrumentation made since the original publication(s) (however, see: Dual Publications, below). All submissions will be subjected to full peer review, and authors will be notified of the results of the review(s) within three months after the manuscript is received by the Office of Forensic Sciences.
The following guidelines should be used for all Articles (Technical Notes may follow an abbreviated version as appropriate):
Microgram Journal, Volume 3, Numbers 1-2 (January - June 2005) 102
Brought to you by AltGov2 [www.altgov2.org]
Cover Letter - Provide the standard contact information and pertinent correspondence (if any) for the Editor.
Title - Should be specific and amenable to indexing; they should not include acronyms or abbreviations except for very common instrumental technique acronyms (e.g., GC/MS or HPLC) and/or very common drug acronyms (e.g., MDMA or PCP). Titles should be sufficiently informative that the readership should not have to read the Abstract or the Introduction to understand the focus of the article. If the manuscript reflects work previously presented at a scientific meeting, a statement detailing that presentation should be included as a footnote to the Title.
Author(s)/Affiliation(s) - The author's full name (including middle initial(s)) and title, and the full name and address of the laboratory or office should immediately follow the title. The author’s degree level may be included if desired, but is not required (however, multiple authors should all include or all exclude this information). If there are several authors from two or more laboratories or offices, each set of authors should be listed separately, followed by their corresponding laboratory name and address (that is, Authors I, Laboratory I, Authors II, Laboratory II, etc.) Excessive authorship should be avoided. If there is more than one author, the primary author should be indicated with a superscripted asterisk. The name, phone numbers (Voice and FAX), preferred email address, and (if different from the laboratory or office address) the full mailing address of the contact person should be included on the title page.
Abstract - State the purpose, procedures, and principal findings of the paper, in 120 words or less. Avoid the use of abbreviations, and use only common acronyms as defined under “Titles”. Note that the abstract will be provided to Chemical Abstracts.
Keyword List - A minimum of five (maximum ten) abstracting keywords should be included.
Introduction - Briefly state the issue or problem. Detail existing practice in the topic area, and explain the shortcomings (if any) in what has been previously reported and/or what is being currently done in the field; that is, compare and contrast the selected methodology with previous and/or existing methods. Provide theoretical and practical background for novel or rarely utilized experimental or instrumental methods. Include pertinent references (avoid “Personal Communications”).
Experimental (Chemicals, Instrumentation, Procedures) - Detail the chemicals, instruments, and procedures utilized (including experimental parameters). However, USE CAUTION IN DETAILING SYNTHESES OF CONTROLLED OR ABUSED SUBSTANCES, especially novel syntheses to known controlled substances, or syntheses of novel substances that may be subject to abuse, that are not yet well known in the scientific and/or underground literature. [In such cases, a simple statement should be included to the effect that: “Experimental details on this synthesis are not provided, in accordance with Journal policy.”]
Results and Discussion - Present findings in a logical, easily followed sequence. Describe what was done, and where appropriate what conclusions can be drawn. Compare and contrast the findings with previous studies and/or current practice. Discuss any problems and/or unresolved issues.
Conclusions - Optional - Summarized results should be included only for complex articles. Conclusions should not merely duplicate the Abstract or a summary paragraph in the Results and Discussion section.
Acknowledgments - Should be brief, and include the full name, affiliation, and specific contribution made by each cited individual.
References - Articles and notes should have all textual citations collected in an endnotes list. Within the text, references should be consecutively numbered with superscripted Arabic numerals, or with Arabic numerals in parentheses, in accordance with their first appearance. Within the endnotes list, references
Microgram Journal, Volume 3, Numbers 1-2 (January - June 2005) 103
Brought to you by AltGov2 [www.altgov2.org]
should be consecutively numbered with Arabic numerals, as follows: Number, Period, Indent, Citation. Reference format should adhere to the Uniform Requirements for Manuscripts Submitted to Biomedical Journals (Note: This is the same reference format utilized in the Selected Reference Citations in Microgram Bulletin, and also (among many others) by the Journal of Forensic Sciences). Due to their inherently transitory nature, use of website URL’s as references are discouraged but permitted. As previously noted, Personal Communications should not be utilized; however, if unavoidable, utilize the following format: Full Name, Title, Affiliation (Laboratory or Office), Location (City and State, plus Nation if not the United States), Personal Communication, Year.
Table and Figures - All Tables and Figures should be appended onto the end of the article (not embedded in the text). Tables and Figures should be consecutively numbered with Arabic numerals, in accordance with their first citation in the text. Each Table and Figure should be “stand-alone”; that is, include sufficient descriptive information such that the reader will not have to refer back to the text to understand the Table or Figure. The Header should include the Table or Figure number and a concise title. Explanatory material, definitions of acronyms and/or abbreviations, and/or references within the Table or Figure should be designated by superscripted, lower case letters in alphabetical order, and included in dedicated footnotes at the bottom of the respective Table or Figure. Unless color is needed to enhance differentiation of the depicted material, all Tables and Figures should be in black and white (that is, avoid frivolous use of color for “artistic” purposes). Figures of spectra, chromatograms, charts, graphs, etc., should have clear and legibly labeled axes, but should not include instrument generated printoffs of experimental parameter lists.
Manuscripts submitted to Microgram Journal are required to be finished, professional quality efforts. Authors should ensure clarity, brevity, and pertinence of all information. Attention to detail in formatting, syntax, grammar, and spelling are as important as the accuracy of the facts presented. Authors are specially cautioned to conduct careful literature reviews prior to submission. At the Editor’s discretion, clearly substandard and/or inappropriate manuscripts will be returned to the authors without review.
Manuscripts will not be retyped, but “final” versions are subject to minor to moderate Editorial rewrite to improve presentation clarity or to reformat to current Microgram Journal style.
Dual publication - Re-publication of articles or notes of particular interest to the Microgram Journal readership will be considered if the article was originally published in a journal that is not easily accessed and the primary author has obtained explicit, written copyright exclusion from the original publisher and consent from all coauthors. Examples include exact English translations of articles or notes originally published in a non-English language journal, non-sensitive articles or notes originally published in a restricted journal or on a password protected website, or articles or notes originally published in limited distribution newsletters or proceedings. In general, any article or note that was published in English in a mainstream journal is not a candidate for republication in Microgram Journal. Authors interested in re-publishing previously published articles or notes in Microgram Journal should discuss the issue with the Microgram Editor before submitting.
Note that (in accordance with standard ethical guidelines) re-published articles should not be included as “new” articles in the respective author(s)’ Curriculum Vitae.
Costs - There are no costs (to the contributor) associated with publication in Microgram Journal.
Reprints - Microgram Journal does not provide reprints to authors. Microgram Journal may be photocopied as needed.
Questions may be directed to the Microgram Editor.
Microgram Journal, Volume 3, Numbers 1-2 (January - June 2005) 104
Brought to you by AltGov2 [www.altgov2.org]
U.S. Department of Justice
Drug Enforcement Administration
www.dea.gov
Microgram
Journal
To Assist and Serve Scientists Concerned with the Detection and Analysis of Controlled Substances and Other Abused Substances for Forensic / Law Enforcement Purposes.
Published by:
The Drug Enforcement Administration
Office of Forensic Sciences
Washington, DC 20537
The U.S. Attorney General has determined that the publication of this
periodical is necessary in the transaction of the public business
required by the Department of Justice. Information, instructions, and
disclaimers are published in the first issue of each year.
Volume 3 Numbers 3-4 Posted On-Line At: July - December 2005 www.dea.gov/programs/forensicsci/microgram/index.html
Brought to you by AltGov2 [www.altgov2.org]
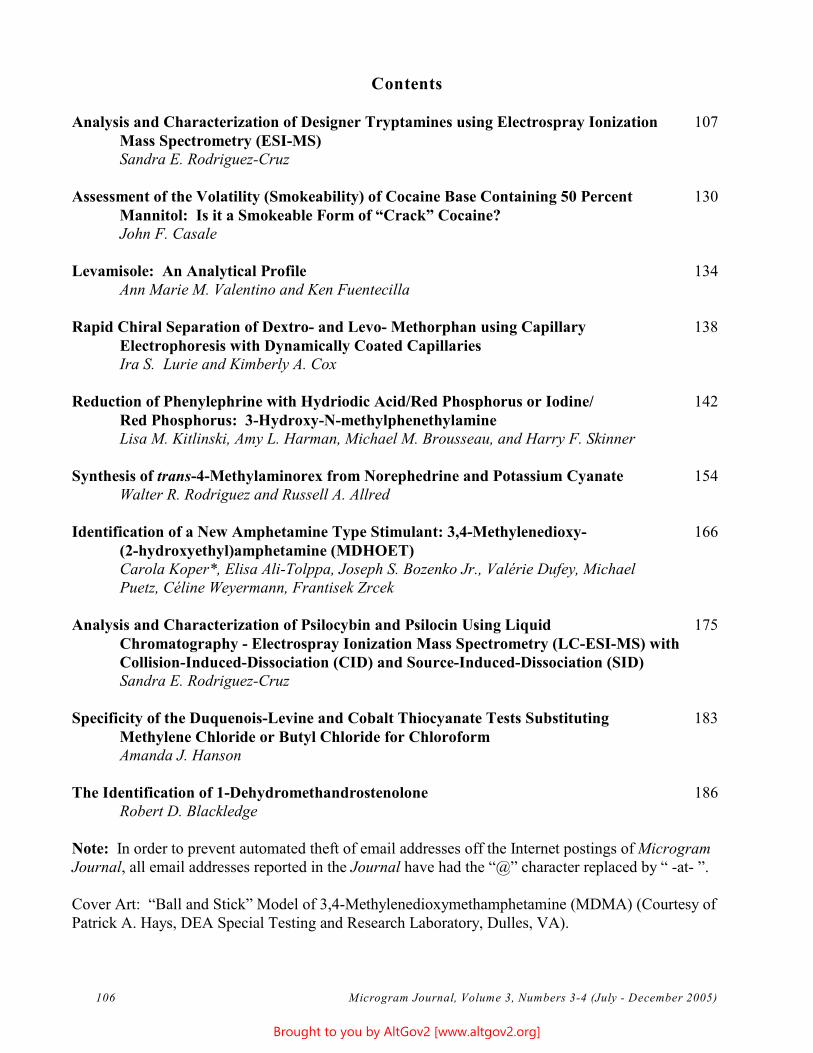
Contents
Analysis and Characterization of Designer Tryptamines using Electrospray Ionization 107 Mass Spectrometry (ESI-MS) Sandra E. Rodriguez-Cruz
Assessment of the Volatility (Smokeability) of Cocaine Base Containing 50 Percent 130 Mannitol: Is it a Smokeable Form of “Crack” Cocaine? John F. Casale
Levamisole: An Analytical Profile 134 Ann Marie M. Valentino and Ken Fuentecilla
Rapid Chiral Separation of Dextro- and Levo- Methorphan using Capillary 138 Electrophoresis with Dynamically Coated Capillaries Ira S. Lurie and Kimberly A. Cox
Reduction of Phenylephrine with Hydriodic Acid/Red Phosphorus or Iodine/ 142 Red Phosphorus: 3-Hydroxy-N-methylphenethylamine Lisa M. Kitlinski, Amy L. Harman, Michael M. Brousseau, and Harry F. Skinner
Synthesis of trans-4-Methylaminorex from Norephedrine and Potassium Cyanate 154 Walter R. Rodriguez and Russell A. Allred
Identification of a New Amphetamine Type Stimulant: 3,4-Methylenedioxy- 166 (2-hydroxyethyl)amphetamine (MDHOET) Carola Koper*, Elisa Ali-Tolppa, Joseph S. Bozenko Jr., Valérie Dufey, Michael Puetz, Céline Weyermann, Frantisek Zrcek
Analysis and Characterization of Psilocybin and Psilocin Using Liquid 175 Chromatography - Electrospray Ionization Mass Spectrometry (LC-ESI-MS) with Collision-Induced-Dissociation (CID) and Source-Induced-Dissociation (SID) Sandra E. Rodriguez-Cruz
Specificity of the Duquenois-Levine and Cobalt Thiocyanate Tests Substituting 183 Methylene Chloride or Butyl Chloride for Chloroform Amanda J. Hanson
The Identification of 1-Dehydromethandrostenolone 186 Robert D. Blackledge
Note: In order to prevent automated theft of email addresses off the Internet postings of Microgram Journal, all email addresses reported in the Journal have had the “@” character replaced by “ -at- ”.
Cover Art: “Ball and Stick” Model of 3,4-Methylenedioxymethamphetamine (MDMA) (Courtesy of Patrick A. Hays, DEA Special Testing and Research Laboratory, Dulles, VA).
106 Microgram Journal, Volume 3, Numbers 3-4 (July - December 2005)
Brought to you by AltGov2 [www.altgov2.org]
Analysis and Characterization of Designer Tryptamines using
Electrospray Ionization Mass Spectrometry (ESI-MS)
Sandra E. Rodriguez-Cruz, Ph.D. U.S. Department of Justice
Drug Enforcement Administration Southwest Laboratory
2815 Scott Street Vista, CA 92081
[email: sandra.e.rodriguez-cruz -at- usdoj.gov]
[Presented in Part at the ASMS 17th Sanibel Conference on Mass Spectrometry - Mass Spectrometry
in Forensic Science and Counterterrorism, Clearwater Beach, FL (January 28 - February 1, 2005).]
ABSTRACT: The analysis and characterization of 12 “designer” tryptamines by electrospray ionization mass
spectrometry (ESI-MS) are presented. Molecular weights were confirmed based on the experimental observation
of protonated and deprotonated pseudo-molecular ions in the positive and negative ion modes, respectively.
Standard tandem mass spectrometry (MS2) experiments were also performed, and the results provided for the
characterization of various fragmentation signatures, useful for the future analysis of currently unknown, similar
compounds. The fragmentation spectra obtained from collision-induced dissociation (CID) experiments (35 eV)
were also compiled as part of an in-house mass spectral library. Results from selected MS3 experiments are
presented and their use in structural elucidation is discussed. For comparison, the gas chromatography/mass
spectrometry (GC/MS) data for the tryptamines are also included and discussed.
KEYWORDS: Tryptamines, Analogues, Designer Drugs, Electrospray Ionization-Mass Spectrometry, ESI-MS,
Pseudo-molecular Ion, Fragmentation, Tandem Mass Spectrometry, Collision-Induced Dissociation, GC/MS,
Forensic Chemistry.
Introduction
“Designer drugs” are compounds with structures that are very similar to controlled substances, but that are not
specifically controlled. Also known as “analogues,” most of these compounds have never been previously
encountered or characterized, and so are not present in commercial spectral libraries; therefore, they can represent
unusual challenges for forensic laboratories. Definitive identification of such drugs usually requires in-depth
analysis using multiple and complementary techniques, including infrared spectroscopy (IR), gas
chromatography/mass spectrometry (GC/MS), and nuclear magnetic resonance (NMR).
For decades, the use of electron ionization (EI) mass spectrometry as a detector for gas chromatography (GC)
instruments has been a main step in the structure elucidation process used by analytical and synthetic chemists [1].
Electron ionization mass spectra of many thousands of compounds, normally collected under 70 eV of energy, are
readily available from reference databases [2] and instrument manufacturers [3]. The capabilities of mass
spectrometry, however, have greatly expanded with the more recent development of specialized ionization
techniques like electrospray ionization (ESI) [4] and atmospheric pressure chemical ionization (APCI) [5],
making possible the analysis of many polar and thermally labile compounds that were not amenable to GC/MS
analyses. Through the ESI process, ions in solution are transported into the gas phase by a series of solvent
evaporation and Coulomb explosion steps, preserving the original intact ions and introducing them into the
Microgram Journal, Volume 3, Numbers 3-4 (July - December 2005) 107
Brought to you by AltGov2 [www.altgov2.org]
vacuum-housed mass analyzer without significant fragmentation. As a result, this process produces singly and/or
multiply charged ions which, upon mass spectrometric analysis, provide direct molecular weight information - a
critical step in identification.
In addition, the interface of an ESI source to an ion-trap mass spectrometer provides for not only molecular nweight determinations, but also for tandem and MS fragmentation analysis of intact gas-phase ions via
collision-induced dissociation (CID) experiments using a target gas [5]. By performing these experiments under
controlled conditions, further structural elucidation can be accomplished, and the additional spectra generated can
be collected and stored as part of a laboratory-generated library.
Certain synthetic tryptamines produce hallucinogenic effects in humans [6,7]. These properties can be expected
based on the structural similarities between these tryptamines and some naturally occurring hallucinogenic
tryptamines such as psilocybin, psilocin, dimethyltryptamine, bufotenine, and ibogaine. By slightly modifying
the structures of these latter substances, synthetic chemists have developed novel “designer” tryptamines with
very similar, new, modified, unusual, and/or otherwise desirable psychedelic properties. Synthetic details for the
preparation of some designer tryptamines have been available to the public for many years [8]. However, the
scientific literature provides only very limited information regarding their analysis and characterization [9-13].
Most of the available literature focuses on the extraction of the naturally available tryptamines from their source
[14], or the analysis and detection of their metabolites in animal biological fluids [15-18].
This paper presents the analysis of various designer tryptamines using ESI-MS. Figure 1 illustrates the core
structure of a tryptamine-type molecule, while Table 1 lists the 12 compounds investigated in this work, along
with details of their structure. Some of these compounds were recently acquired during a law enforcement
investigation targeting their open sale on the internet. Initially, these compounds were identified at this laboratory
using IR and NMR spectroscopy, GC, and GC/MS techniques. Analysis by ESI-MS provides complementary
information that is valuable for the full characterization of these compounds. For most of the compounds, the
generation of pseudo-molecular ions via ESI provides molecular weight information that is not available via nGC/MS analysis. MS fragmentation experiments further complement the structural information obtained from
GC/MS, and allow the additional characterization of thermally labile compounds.
Experimental
Solutions for each of the analogues were prepared by dissolving the appropriate amount in methanol to obtain a
final concentration of approximately 10 :g/mL. Solutions were introduced into the mass spectrometer using a
ThermoFinnigan Surveyor autosampler. Sample injections (10 :L) were loaded into a methanol constant flow
(200 :L/min) provided by a ThermoFinnigan Surveyor solvent pump.
Mass spectra were collected using a ThermoFinnigan LCQ Advantage MAX ion-trap mass spectrometer equipped
with an ESI source and operated using the Xcalibur software (Version 1.4) provided by the manufacturer. The
ESI voltage needle was kept at 5.0 kV, generating a spray current of approximately 0.3 :A. The sheath and
auxiliary sweep gas flows (nitrogen) were operated at 40 and 10 units, respectively. Conditions inside the source
were as follows: Capillary temperature 300 OC; capillary voltage ±30 V; and tube lens voltage ±15 V. Negative
and positive mass spectra were collected in the centroid mode for the m/z range of 50 to 550. Each scan collected
was composed of three microscans using a maximum ion injection time of 50 milliseconds. During ion storage, 7the trap was operated with the automatic gain control (AGC) set point at 5 x 10 ions and Helium (99.999%
purity) was used as the trapping gas. After sequential ejection from the trap, ions were detected using a
conversion dynode (±14.7 kV) and electron multiplier (-750 V) assembly. The pressure within the mass analyzer nregion was kept at 6.7 x 10⁻⁶ Torr by using a turbomolecular pump. MS experiments were performed by isolating
the desired precursor ions using an isolation window of 3.0 m/z units. The isolated ions were then subjected to
normalized collision energies between 25 and 35 eV (%) in order to generate characteristic fragmentation.
Microgram Journal, Volume 3, Numbers 3-4 (July - December 2005) 108
Brought to you by AltGov2 [www.altgov2.org]
Helium (99.999% purity) was used as the collision gas, and ions were activated during 30 milliseconds using an
activation q value of 0.25.
Experimental data were analyzed using the qualitative analysis program provided within the Xcalibur software 2suite. In addition, all MS fragmentation data were incorporated into an in-house spectral library.
For the GC/MS data (displayed in the Appendices), solutions of the 12 analogues were prepared in methanol at a
concentration of 1 mg/mL. Samples were introduced into the gas chromatograph using 1.0 :L injections. The OGC oven program used was: initial temperature: 90 OC (1 minute hold), ramp to 300 C (20 OC/minute); final
temperature: 300 OC (5 minute hold). Helium was used as the carrier gas at a constant flow of 1 mL/minute.
Mass spectra were obtained using a ThermoFinnigan PolarisQ ion-trap mass spectrometer controlled by the
Xcalibur software.
Results and Discussion
ESI-MS Experiments
Figures 2a and 2b present the positive and negative ion mode full-scan electrospray mass spectra obtained for
4-acetoxy-N,N-diisopropyltryptamine (9). The singly protonated and singly deprotonated pseudo-molecular ions
are clearly represented at m/z 303 and 301, respectively, indicating a molecular weight of 302 for this compound.
Similar spectra were obtained for the other 11 analogues. The molecular weights determined from all of these
experiments are included in Table 1. Under the experimental conditions utilized, the signal intensity for the
negative ion spectra was observed to be somewhat dependent on the structure of the compounds, specifically the
presence of methoxy, acetoxy, or hydroxy groups. Molecules containing such functionalities were observed to
produce more intense deprotonated pseudo-molecular ions.
Full-scan electrospray analysis was especially useful for the identification and differentiation of 4-hydroxy-N,N-
diisopropyltryptamine (7) and 4-acetoxy-N,N-diisopropyltryptamine (9). The latter compound is thermally
unstable, and standard GC/MS analyses gave highly similar spectra (see Appendices). However, ESI-MS
provided accurate molecular weight information, allowing a easy identification.
2ESI-MS Experiments
In addition to collecting full-scan ESI spectra for these molecules, ESI-MS/MS (ESI-MS2) fragmentation
experiments were also performed in order to obtain structural information that would complement the information
previously obtained via GC/MS experiments. ESI-MS2 fragmentation experiments were performed in the positive
ion mode at various normalized collision energies. The spectra generated at 35 eV were considered to be the most
useful, and so were exported and compiled into an in-house library for future use in the identification of
unknowns.
The Appendices contain the ESI-MS2 spectra obtained for each of the tryptamines investigated using a normalized
collision energy of 35 eV (top panels) . After isolation of the singly protonated pseudo-molecular or parent
species, the ions were subjected to collisions with the target gas Helium, producing fragments that partially
characterize the original molecule. For all the tryptamines investigated, major fragments observed correspond to
two types of dissociations, both due to cleavages on the aliphatic side chain of the molecule. The first cleavage is
between the nitrogen and the alpha carbon, with the second cleavage occurring between the alpha and beta
carbons (see Figure 1). The former process results in the production of ammonia or a neutral primary or
secondary amine (depending on the amine substituents), with the charge being transferred to the indole-containing
fragment. The latter fragmentation process produces a charged amine, along with a neutral indole-containing
fragment. Both of these fragmentation processes are illustrated in Figure 3 for the case of
5-methoxy-N,N-methylisopropyltryptamine (11).
Microgram Journal, Volume 3, Numbers 3-4 (July - December 2005) 109
Brought to you by AltGov2 [www.altgov2.org]
For compounds with the same molecular weights, the fragmentation patterns obtained from the ESI-MS2
experiments were useful for elucidating structures. For example, 4-acetoxy-N,N-methylisopropyltryptamine (8)
and 5-methoxy-N,N-diisopropyltryptamine (10) have the same molecular weight of 274. In both cases, the
protonated and deprotonated pseudo-molecular ions are observed at m/z 275 and 273, respectively, not allowing
for their distinction. However, ESI-MS2 analysis produced different fragmentation patterns for these compounds
(see Appendices 8 and 10). For 4-acetoxy-N,N-methylisopropyltryptamine (8), the major fragment is observed at
m/z 202, with additional fragments at m/z 160 and 86. Whereas for 5-methoxy-N,N-diisopropyl-tryptamine (10),
the major fragment is observed at m/z 114, with additional fragments at m/z 102 and 174.
2The usefulness of ESI-MS analyses can also be illustrated by again comparing 4-hydroxy-N,N-diisopropyl-
tryptamine (7) and 4-acetoxy-N,N-diisopropyltryptamine (9). As mentioned before, these compounds are
virtually undistinguishable by GC/MS analysis, due to the thermal instability of the 4-acetoxy group. In addition 2to providing direct molecular weight information, ESI-MS analysis produces distinctive fragments that allow
their specific characterization. For 4-acetoxy-N,N-diisopropyltryptamine (9), fragments are produced at m/z 202,
160, 114, and 102. Whereas for 4-hydroxy-N,N-diisopropyltryptamine (7), fragments are produced at m/z 160,
114, and 102. While the fragment at m/z 202 is the predominant fragment produced from the former compound, it
is absent from the latter, providing a marker ion for differentiation.
GC/MS Experiments
The Appendices also include the standard EI spectra obtained using a GC/MS system (bottom panels). Not
surprisingly, most of the spectra are characterized by the presence of one major peak (base peak) corresponding to
fragmentation of the sigma bond between the alpha and beta carbons. For 10 of the compounds (tryptamines 2
11), alpha cleavage [19] results in retention of the charge by the amine group. For alpha-methyltryptamine (1)
and 5-methoxy-alpha-methyltryptamine (12), the most favorable fragmentation, inductive cleavage [19], results in
charge migration to the indole-containing fragment, producing peaks at m/z 130 and 160, respectively. An
additional hydrogen rearrangement process is also involved, resulting in major peaks at m/z 131 and 161,
respectively. GC/MS experiments also produce characteristic signatures for the different amine substituents. For
example, m/z 86 is characteristic of the N,N-methylisopropyl and N,N-diethyl groups, while m/z 114 is
characteristic of the N,N-dipropyl or N,N-diisopropyl functionalities. For these two latter isomeric species, the
additional presence of ions at m/z 72 and 86, respectively, provides a useful distinguishing factor.
Additional bond cleavages in the tryptamine molecule result in the generation of specific fragmentation
signatures. These can be of great use when interpreting data generated by either GC/MS or ESI-MS2 techniques.
For example, the presence of an ion at m/z 144 is indicative of a non-substituted indole moiety, after cleavage of
the sigma bond between the amine nitrogen and the alpha carbon. The same type of cleavage leads to the
generation of peaks at m/z 174 and 202 for compounds where the indole contains a methoxy or acetoxy
functionality, respectively. As previously mentioned, cleavage between the alpha and beta carbons produces a
high-intensity peak at m/z 86, due to the generation of the C H +N=CH2 fragment, which can be produced from 4 10
the diethylamine or methylisopropylamine group. Through the same process, the generation of m/z 114 is +indicative of the C H14 N=CH2 fragment, consistent with either dipropylamine or diisopropylamine. For 6
dimethyltrypamine compounds, the analogous peak will appear at m/z 58 due to C H +N=CH . As observed for 2 6 2
alpha-methyltryptamine (1) and 5-methoxy-alpha-methyltryptamine (12), cleavage between the alpha and beta
carbons also produces signature ions at m/z 130 and 160, characteristic of an unsubstituted and a
methoxy-substituted indole, respectively.
nESI-MS Experiments
The use of ESI combined with a quadrupole ion trap as the mass analyzer provides the enhanced capabilities of n 3MS experiments. To illustrate the usefulness of this type of analysis, ESI-MS experiments were performed on
N,N-dipropyltryptamine (5) and N,N-diisopropyltryptamine (6). As illustrated in the Appendices, the fragments
Microgram Journal, Volume 3, Numbers 3-4 (July - December 2005) 110
Brought to you by AltGov2 [www.altgov2.org]
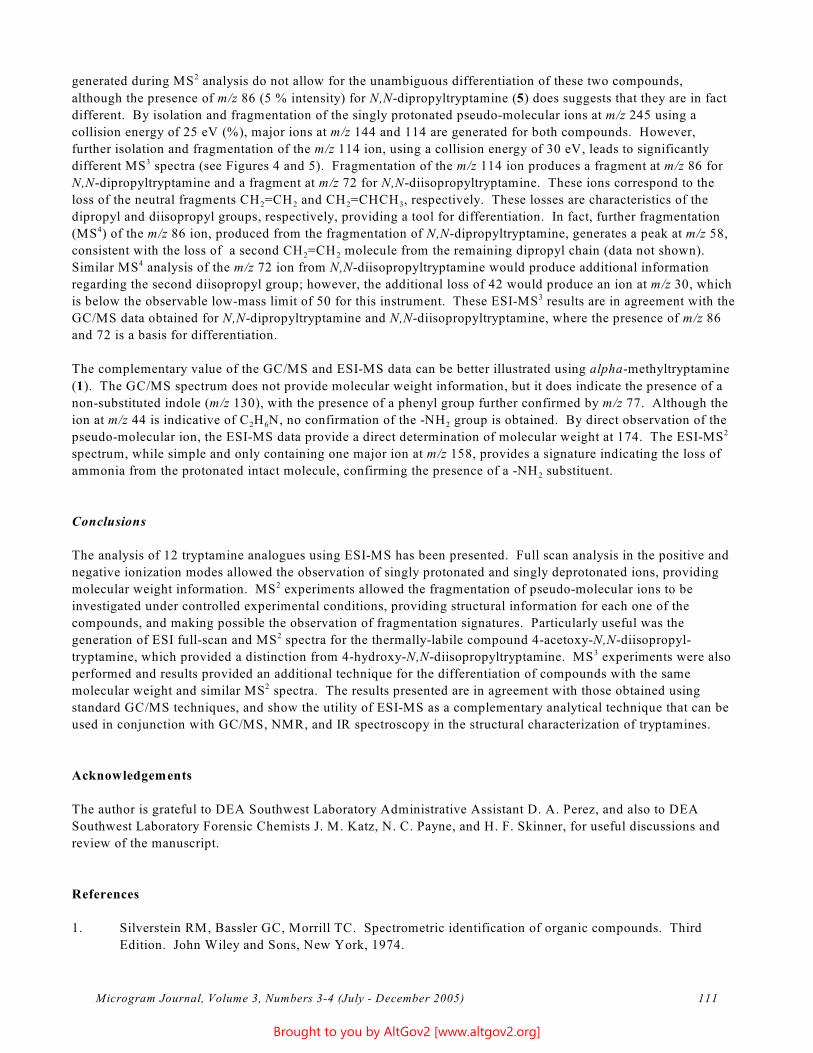
generated during MS2 analysis do not allow for the unambiguous differentiation of these two compounds,
although the presence of m/z 86 (5 % intensity) for N,N-dipropyltryptamine (5) does suggests that they are in fact
different. By isolation and fragmentation of the singly protonated pseudo-molecular ions at m/z 245 using a
collision energy of 25 eV (%), major ions at m/z 144 and 114 are generated for both compounds. However,
further isolation and fragmentation of the m/z 114 ion, using a collision energy of 30 eV, leads to significantly 3different MS spectra (see Figures 4 and 5). Fragmentation of the m/z 114 ion produces a fragment at m/z 86 for
N,N-dipropyltryptamine and a fragment at m/z 72 for N,N-diisopropyltryptamine. These ions correspond to the
loss of the neutral fragments CH =CH and CH =CHCH , respectively. These losses are characteristics of the 2 2 2 3
dipropyl and diisopropyl groups, respectively, providing a tool for differentiation. In fact, further fragmentation 4(MS ) of the m/z 86 ion, produced from the fragmentation of N,N-dipropyltryptamine, generates a peak at m/z 58,
consistent with the loss of a second CH2=CH molecule from the remaining dipropyl chain (data not shown). 2 4Similar MS analysis of the m/z 72 ion from N,N-diisopropyltryptamine would produce additional information
regarding the second diisopropyl group; however, the additional loss of 42 would produce an ion at m/z 30, which
is below the observable low-mass limit of 50 for this instrument. These ESI-MS3 results are in agreement with the
GC/MS data obtained for N,N-dipropyltryptamine and N,N-diisopropyltryptamine, where the presence of m/z 86
and 72 is a basis for differentiation.
The complementary value of the GC/MS and ESI-MS data can be better illustrated using alpha-methyltryptamine
(1). The GC/MS spectrum does not provide molecular weight information, but it does indicate the presence of a
non-substituted indole (m/z 130), with the presence of a phenyl group further confirmed by m/z 77. Although the
ion at m/z 44 is indicative of C H N, no confirmation of the -NH group is obtained. By direct observation of the 2 6 2
pseudo-molecular ion, the ESI-MS data provide a direct determination of molecular weight at 174. The ESI-MS2
spectrum, while simple and only containing one major ion at m/z 158, provides a signature indicating the loss of
ammonia from the protonated intact molecule, confirming the presence of a -NH2 substituent.
Conclusions
The analysis of 12 tryptamine analogues using ESI-MS has been presented. Full scan analysis in the positive and
negative ionization modes allowed the observation of singly protonated and singly deprotonated ions, providing
molecular weight information. MS2 experiments allowed the fragmentation of pseudo-molecular ions to be
investigated under controlled experimental conditions, providing structural information for each one of the
compounds, and making possible the observation of fragmentation signatures. Particularly useful was the 2generation of ESI full-scan and MS spectra for the thermally-labile compound 4-acetoxy-N,N-diisopropyl-
tryptamine, which provided a distinction from 4-hydroxy-N,N-diisopropyltryptamine. MS3 experiments were also
performed and results provided an additional technique for the differentiation of compounds with the same
molecular weight and similar MS2 spectra. The results presented are in agreement with those obtained using
standard GC/MS techniques, and show the utility of ESI-MS as a complementary analytical technique that can be
used in conjunction with GC/MS, NMR, and IR spectroscopy in the structural characterization of tryptamines.
Acknowledgements
The author is grateful to DEA Southwest Laboratory Administrative Assistant D. A. Perez, and also to DEA
Southwest Laboratory Forensic Chemists J. M. Katz, N. C. Payne, and H. F. Skinner, for useful discussions and
review of the manuscript.
References
1. Silverstein RM, Bassler GC, Morrill TC. Spectrometric identification of organic compounds. Third
Edition. John Wiley and Sons, New York, 1974.
Microgram Journal, Volume 3, Numbers 3-4 (July - December 2005) 111
Brought to you by AltGov2 [www.altgov2.org]
2. Pfleger K, Maurer HH, Weber A. Mass spectral and GC data of drugs, poisons, pesticides, pollutants and
their metabolites. Second Edition. Wiley-VCH, Weinheim, 1992.
3. Stein S, Mirokhin Y, Tchekhovskoi D, Mallard G. The NIST/EPA/NIH mass spectral library. Version
2.0a, July 2002.
4. Cole RB. Electrospray ionization mass spectrometry: Fundamentals, instrumentation and applications.
John Wiley and Sons, New York, 1997.
5. Johnstone RAW, Rose ME. Mass spectrometry for chemists and biochemists. Second Edition.
Cambridge University Press, Cambridge, 1996.
6. Gahlinger P. Illegal drugs: A complete guide to their history, chemistry, use, and abuse. Plume, New
York, 2004.
7. Perrine DM. The chemistry of mind-altering drugs: History, pharmacology and cultural context; pp.
278-288. American Chemical Society, Washington, D.C., 1996.
8. Shulgin A, Shulgin A. TIHKAL: The continuation. Transform Press, Berkeley, 1997.
9. Clark A. 5-Methoxy-N,N-dimethyltryptamine. Microgram 1974;7(4):42.*
10. Chamakura R. Bufotenine. Microgram 1993;16(8):185.*
11. Vohlken B. Bufotenine and Psilocin: Mass Spectral Distinctions. Microgram 1993;16(10):233.*
12. Roesner P. Mass spectra of designer drugs. John Wiley and Sons, Inc., New York, 2003.
13. Brandt SD, Freeman S, Fleet IA, McGagh P, Alder JF. Analytical chemistry of synthetic routes to
psychoactive tryptamines. Part I. Characterisation of the Speeter and Anthony synthetic route to
5-methoxy-N,N-diisopropyltryptamine using ESI-MS-MS and ESI-TOF-MS. Analyst 2004;129:1047.
14. Casale, JF. An aqueous-organic extraction method for the isolation and identification of psilocin from
hallucinogenic mushrooms. Journal of Forensic Sciences 1985;30:247.
15. Katagi M, Tsutsumi H, Miki A, Nakajima K, Tsuchihashi H. Analyses of clandestine tablets of
amphetamines and their designer drugs encountered in recent Japan. Japanese Journal of Forensic
Toxicology 2002;20:303.
16. McClean S, Robinson RC, Shaw C, Smyth WF. Characterisation and determination of indole alkaloids in
frog-skin secretions by electrospray ionisation ion trap mass spectrometry. Rapid Communications in
Mass Spectrometry 2002;16:346.
17. Meatherall R, Sharma P. Foxy, a designer tryptamine hallucinogen. Journal of Analytical Toxicology
2003;27:313.
18. Vorce SP, Sklerov JH. A general screening and confirmation approach to the analysis of designer
tryptamine and phenethylamine in blood and urine using GC-EI-MS and HPLC-electrospray-MS. Journal
of Analytical Toxicology 2004;28:410.
Microgram Journal, Volume 3, Numbers 3-4 (July - December 2005) 112
Brought to you by AltGov2 [www.altgov2.org]
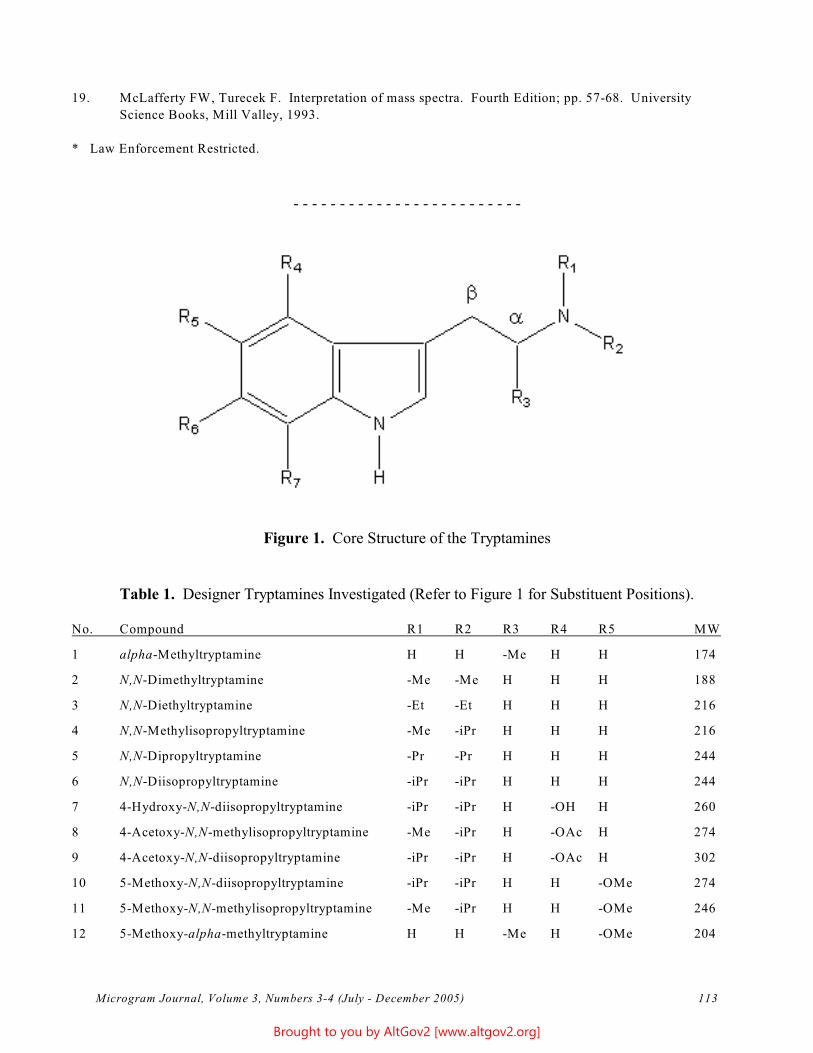
- - - - - - - - - - - - - - - - - - - - - - - - -
19. McLafferty FW, Turecek F. Interpretation of mass spectra. Fourth Edition; pp. 57-68. University
Science Books, Mill Valley, 1993.
* Law Enforcement Restricted.
Figure 1. Core Structure of the Tryptamines
Table 1. Designer Tryptamines Investigated (Refer to Figure 1 for Substituent Positions).
No. Compound R1 R2 R3 R4 R5 MW
1 alpha-Methyltryptamine H H -Me H H 174
2 N,N-Dimethyltryptamine -Me -Me H H H 188
3 N,N-Diethyltryptamine -Et -Et H H H 216
4 N,N-Methylisopropyltryptamine -Me -iPr H H H 216
5 N,N-Dipropyltryptamine -Pr -Pr H H H 244
6 N,N-Diisopropyltryptamine -iPr -iPr H H H 244
7 4-Hydroxy-N,N-diisopropyltryptamine -iPr -iPr H -OH H 260
8 4-Acetoxy-N,N-methylisopropyltryptamine -Me -iPr H -OAc H 274
9 4-Acetoxy-N,N-diisopropyltryptamine -iPr -iPr H -OAc H 302
10 5-Methoxy-N,N-diisopropyltryptamine -iPr -iPr H H -OMe 274
11 5-Methoxy-N,N-methylisopropyltryptamine -Me -iPr H H -OMe 246
12 5-Methoxy-alpha-methyltryptamine H H -Me H -OMe 204
Microgram Journal, Volume 3, Numbers 3-4 (July - December 2005) 113
Brought to you by AltGov2 [www.altgov2.org]
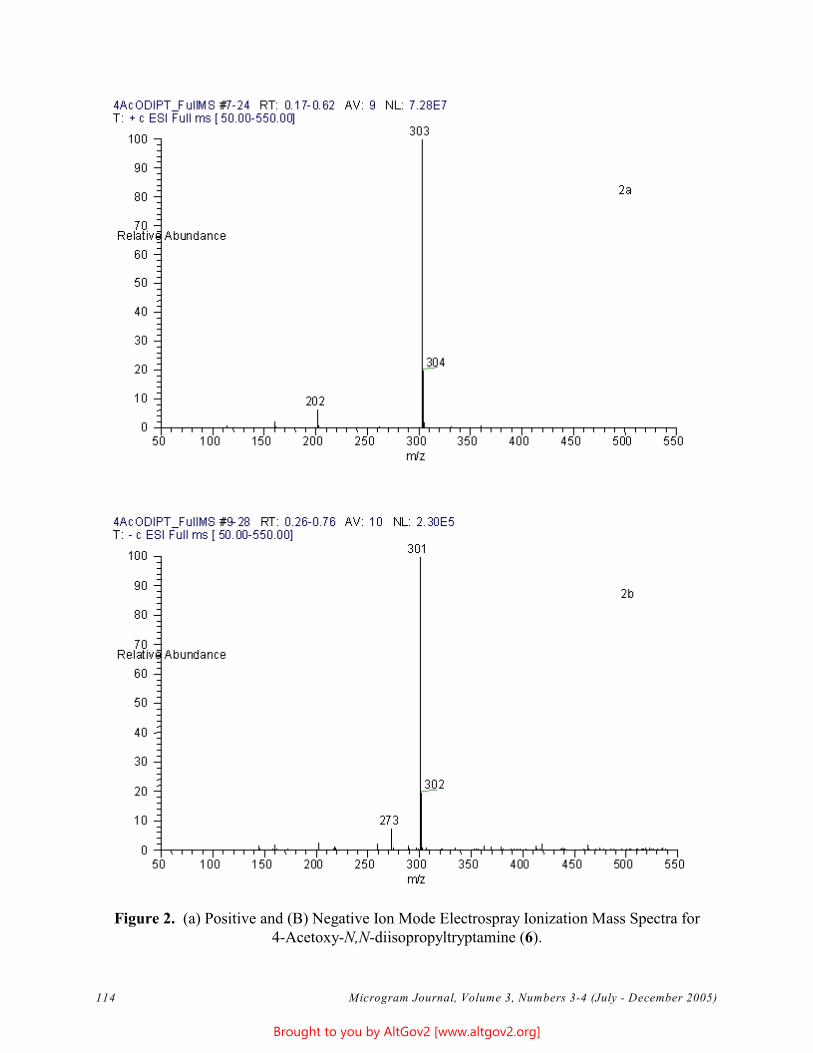
Figure 2. (a) Positive and (B) Negative Ion Mode Electrospray Ionization Mass Spectra for 4-Acetoxy-N,N-diisopropyltryptamine (6).
Microgram Journal, Volume 3, Numbers 3-4 (July - December 2005) 114
Brought to you by AltGov2 [www.altgov2.org]
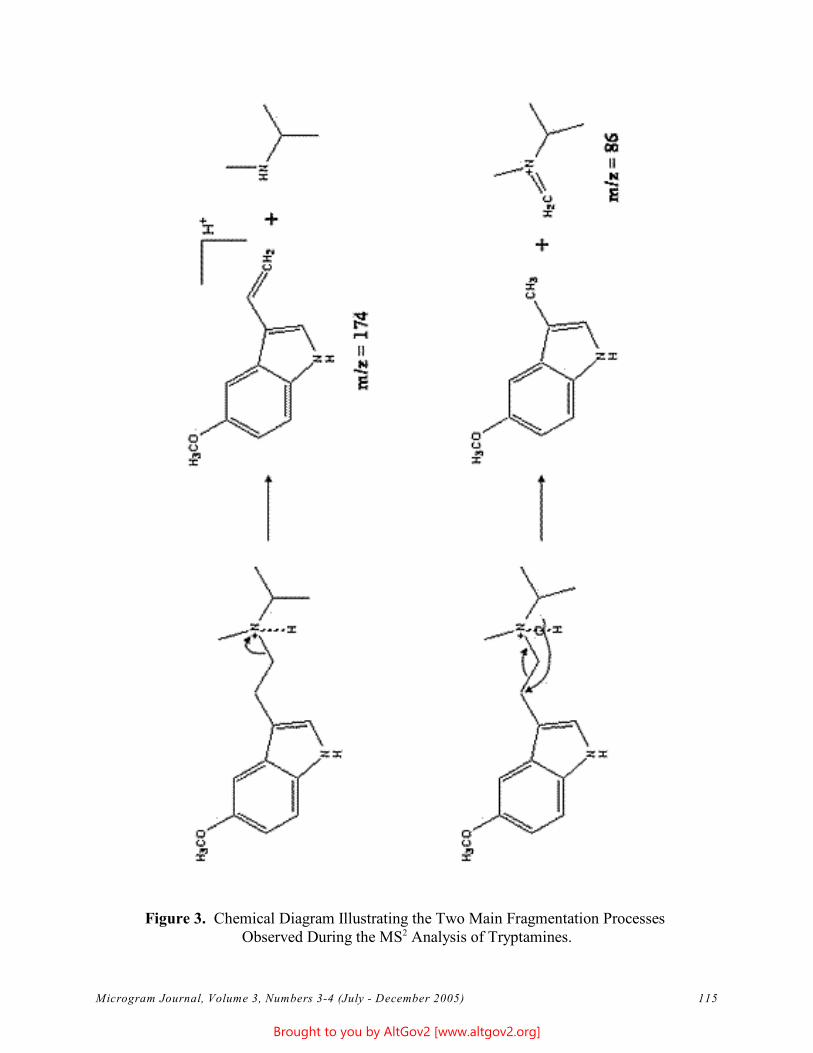
Figure 3. Chemical Diagram Illustrating the Two Main Fragmentation Processes 2Observed During the MS Analysis of Tryptamines.
Microgram Journal, Volume 3, Numbers 3-4 (July - December 2005) 115
Brought to you by AltGov2 [www.altgov2.org]
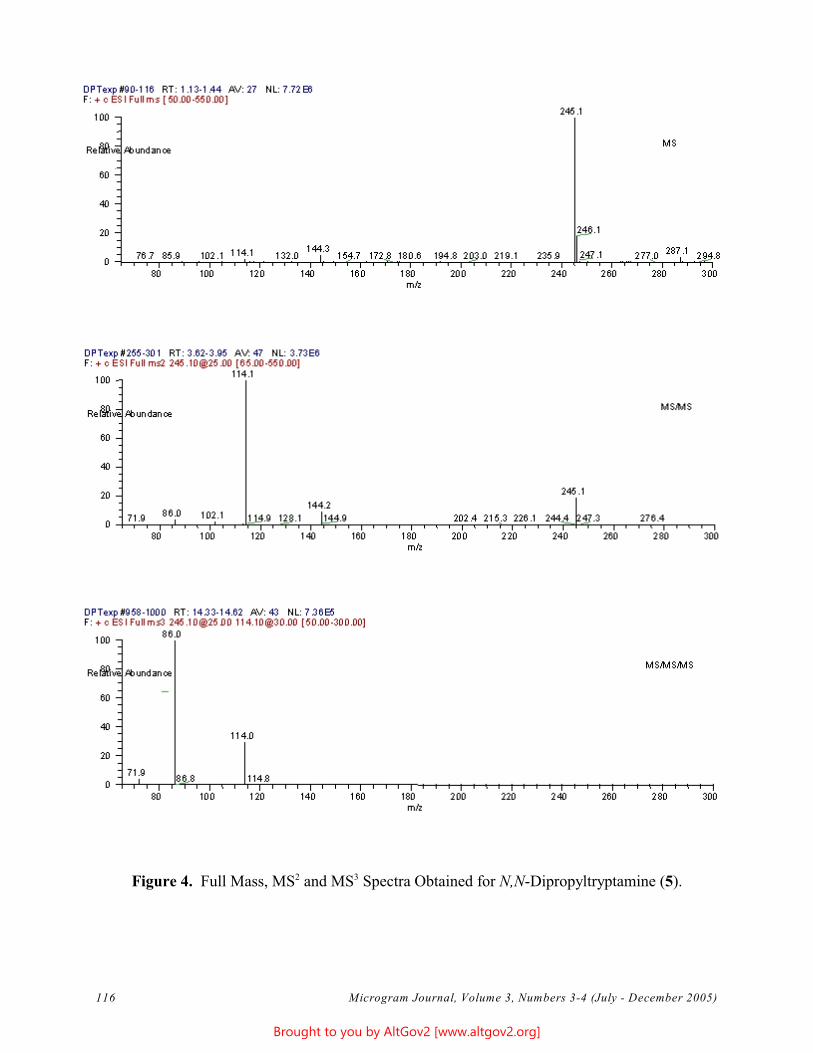
2 3Figure 4. Full Mass, MS and MS Spectra Obtained for N,N-Dipropyltryptamine (5).
Microgram Journal, Volume 3, Numbers 3-4 (July - December 2005) 116
Brought to you by AltGov2 [www.altgov2.org]
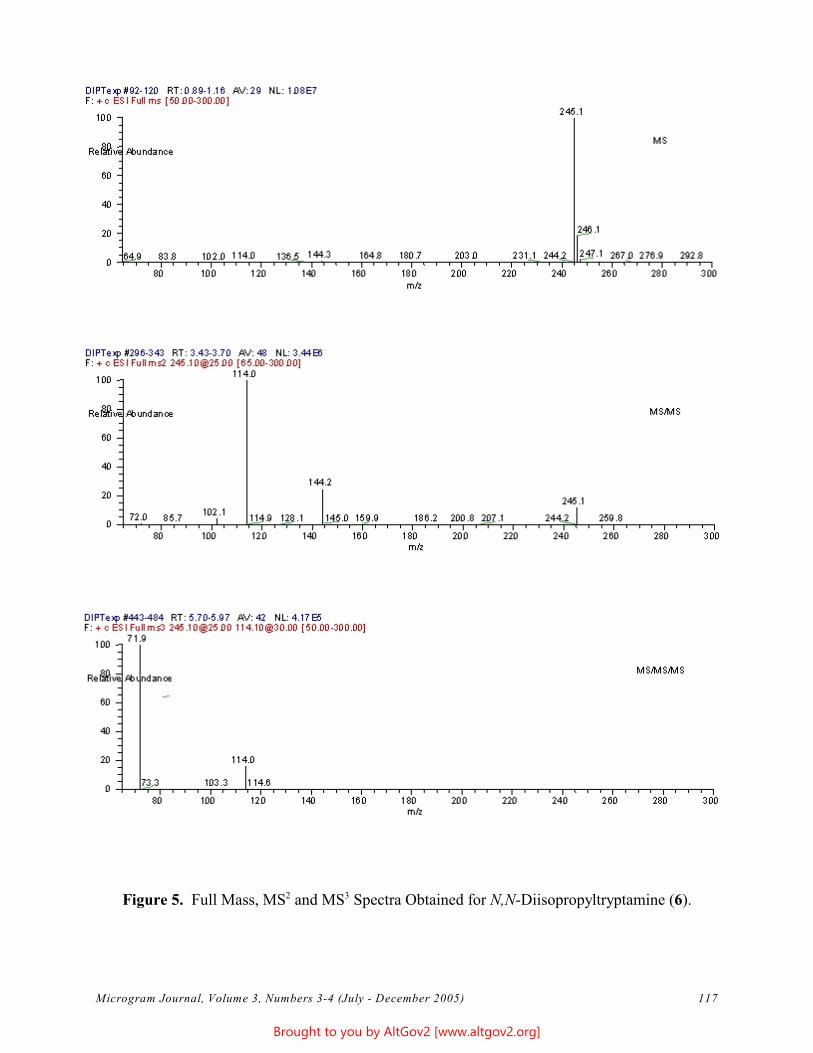
2 3Figure 5. Full Mass, MS and MS Spectra Obtained for N,N-Diisopropyltryptamine (6).
Microgram Journal, Volume 3, Numbers 3-4 (July - December 2005) 117
Brought to you by AltGov2 [www.altgov2.org]
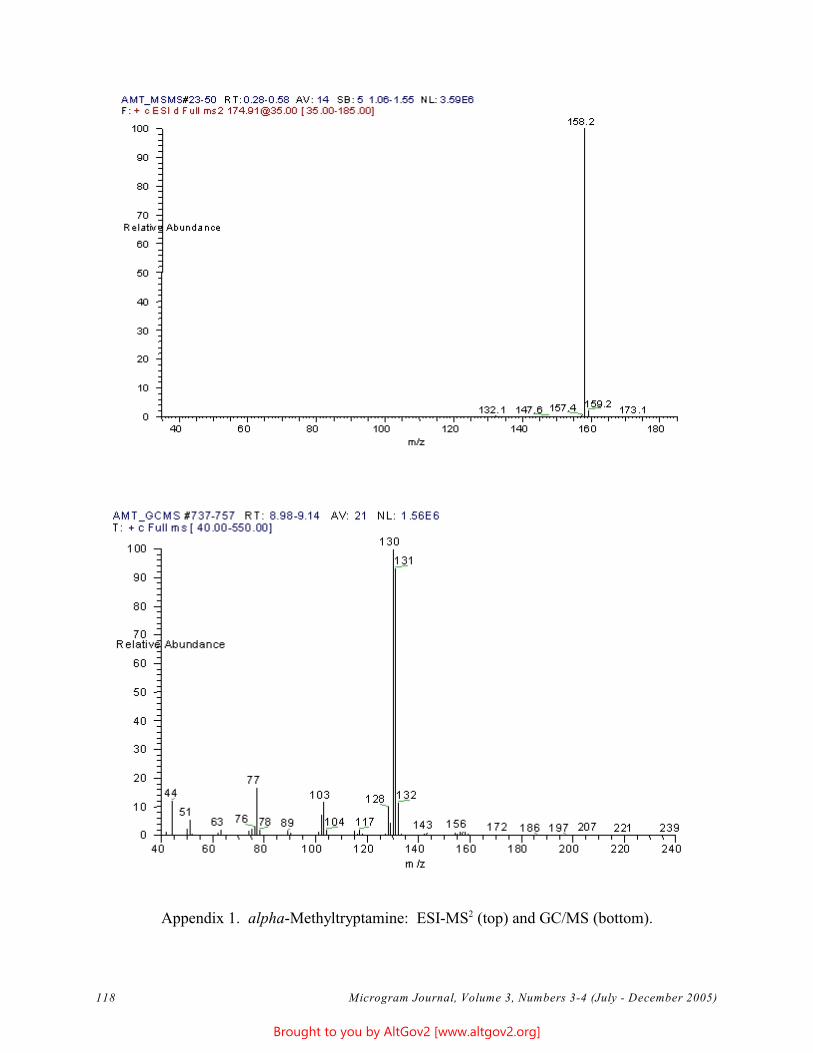
2Appendix 1. alpha-Methyltryptamine: ESI-MS (top) and GC/MS (bottom).
Microgram Journal, Volume 3, Numbers 3-4 (July - December 2005) 118
Brought to you by AltGov2 [www.altgov2.org]
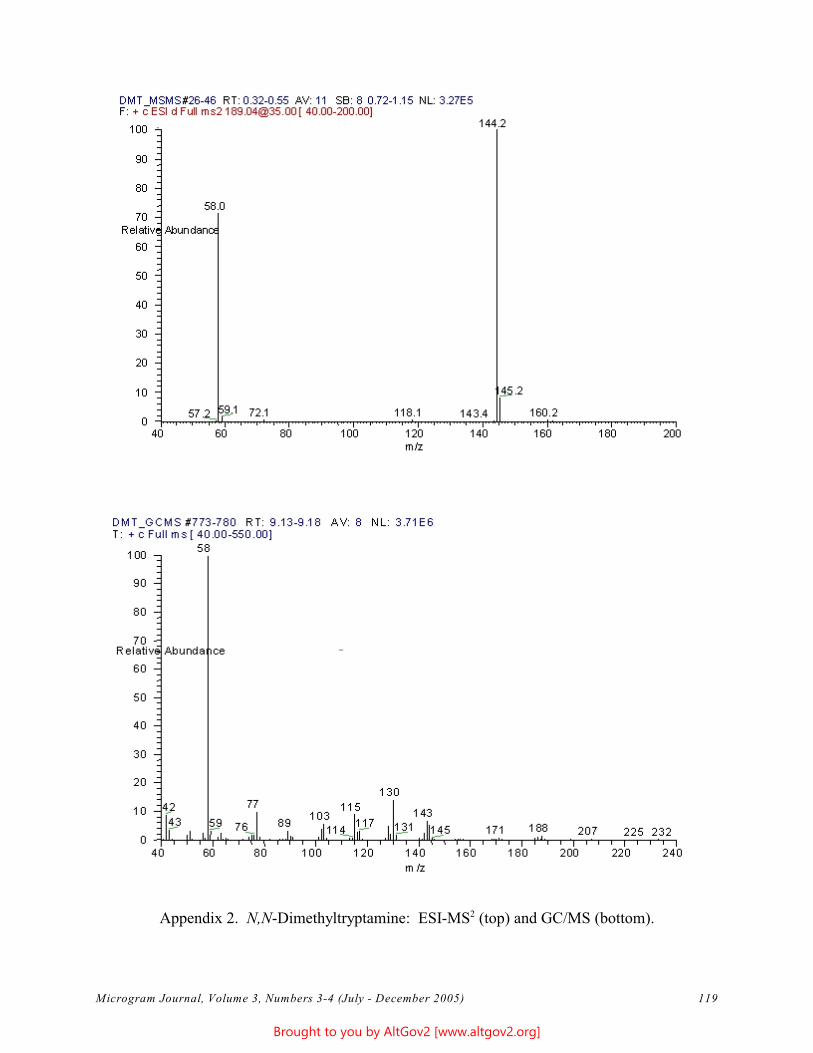
2Appendix 2. N,N-Dimethyltryptamine: ESI-MS (top) and GC/MS (bottom).
Microgram Journal, Volume 3, Numbers 3-4 (July - December 2005) 119
Brought to you by AltGov2 [www.altgov2.org]
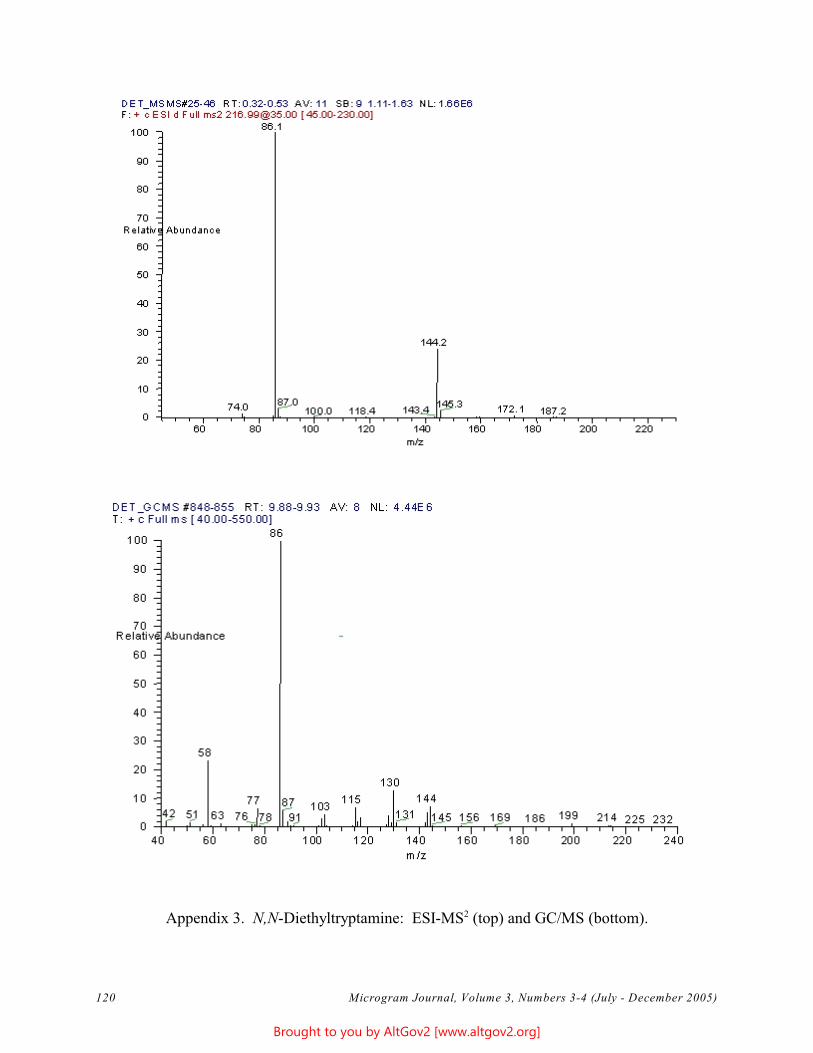
2Appendix 3. N,N-Diethyltryptamine: ESI-MS (top) and GC/MS (bottom).
Microgram Journal, Volume 3, Numbers 3-4 (July - December 2005) 120
Brought to you by AltGov2 [www.altgov2.org]
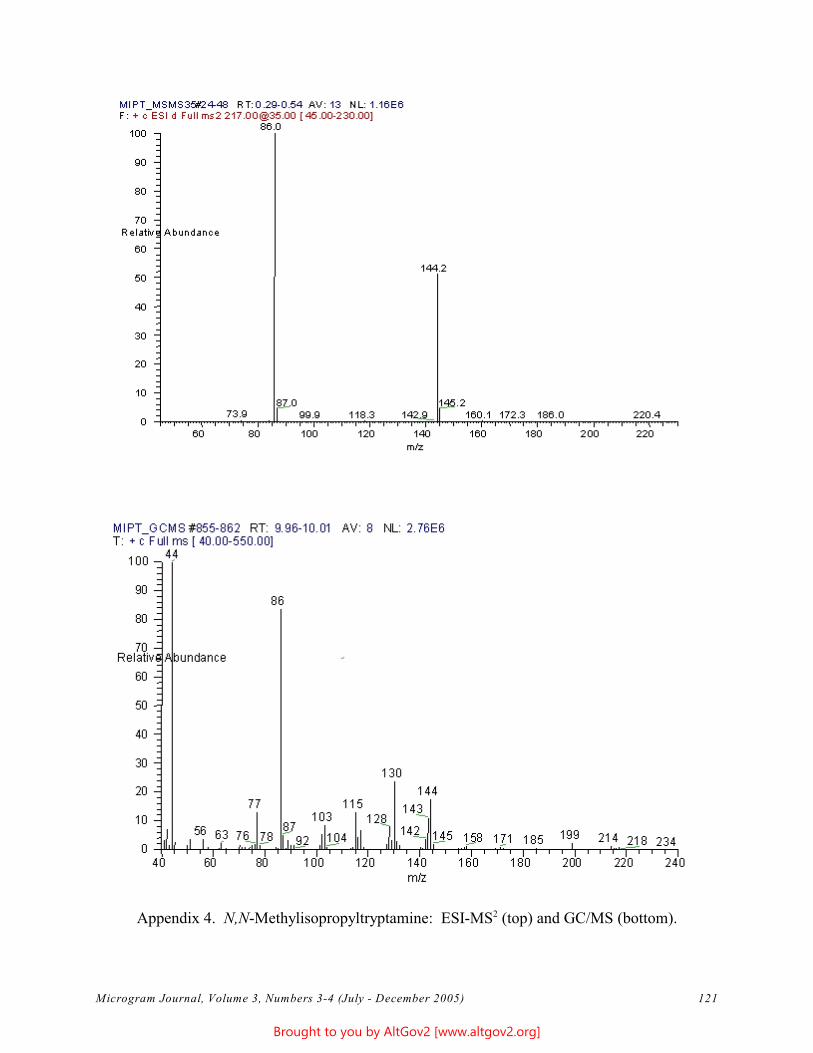
2Appendix 4. N,N-Methylisopropyltryptamine: ESI-MS (top) and GC/MS (bottom).
Microgram Journal, Volume 3, Numbers 3-4 (July - December 2005) 121
Brought to you by AltGov2 [www.altgov2.org]
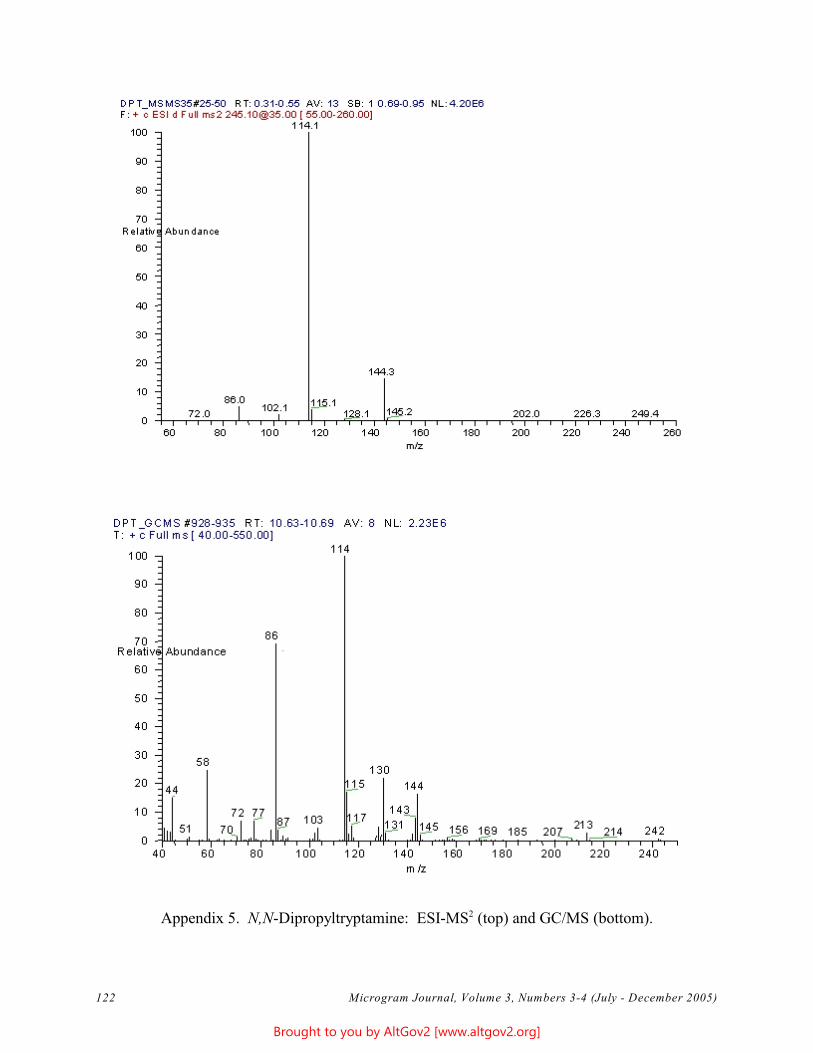
2Appendix 5. N,N-Dipropyltryptamine: ESI-MS (top) and GC/MS (bottom).
Microgram Journal, Volume 3, Numbers 3-4 (July - December 2005) 122
Brought to you by AltGov2 [www.altgov2.org]
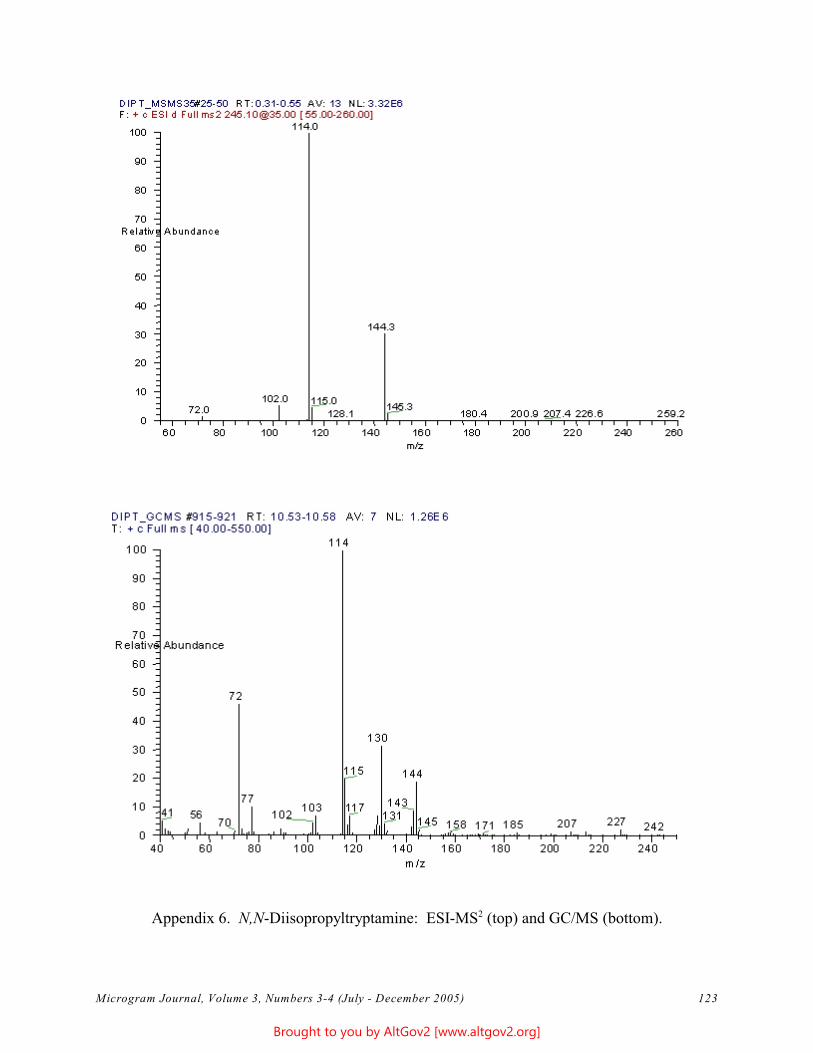
2Appendix 6. N,N-Diisopropyltryptamine: ESI-MS (top) and GC/MS (bottom).
Microgram Journal, Volume 3, Numbers 3-4 (July - December 2005) 123
Brought to you by AltGov2 [www.altgov2.org]
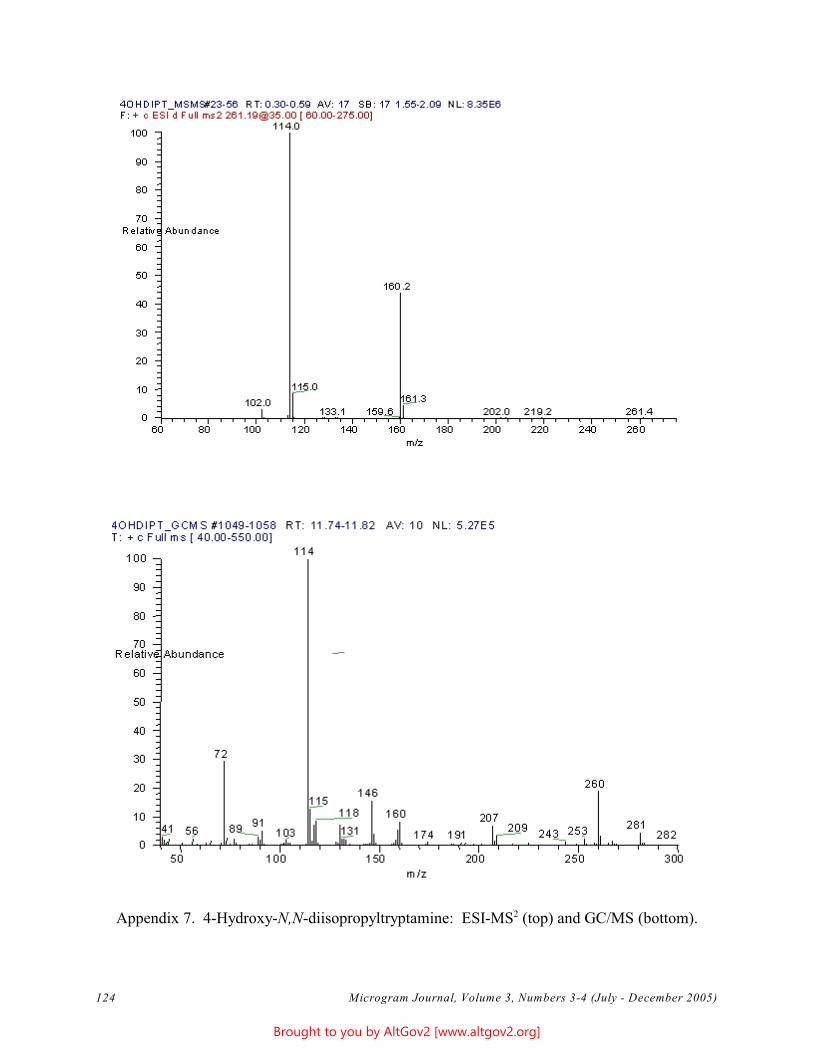
2Appendix 7. 4-Hydroxy-N,N-diisopropyltryptamine: ESI-MS (top) and GC/MS (bottom).
Microgram Journal, Volume 3, Numbers 3-4 (July - December 2005) 124
Brought to you by AltGov2 [www.altgov2.org]
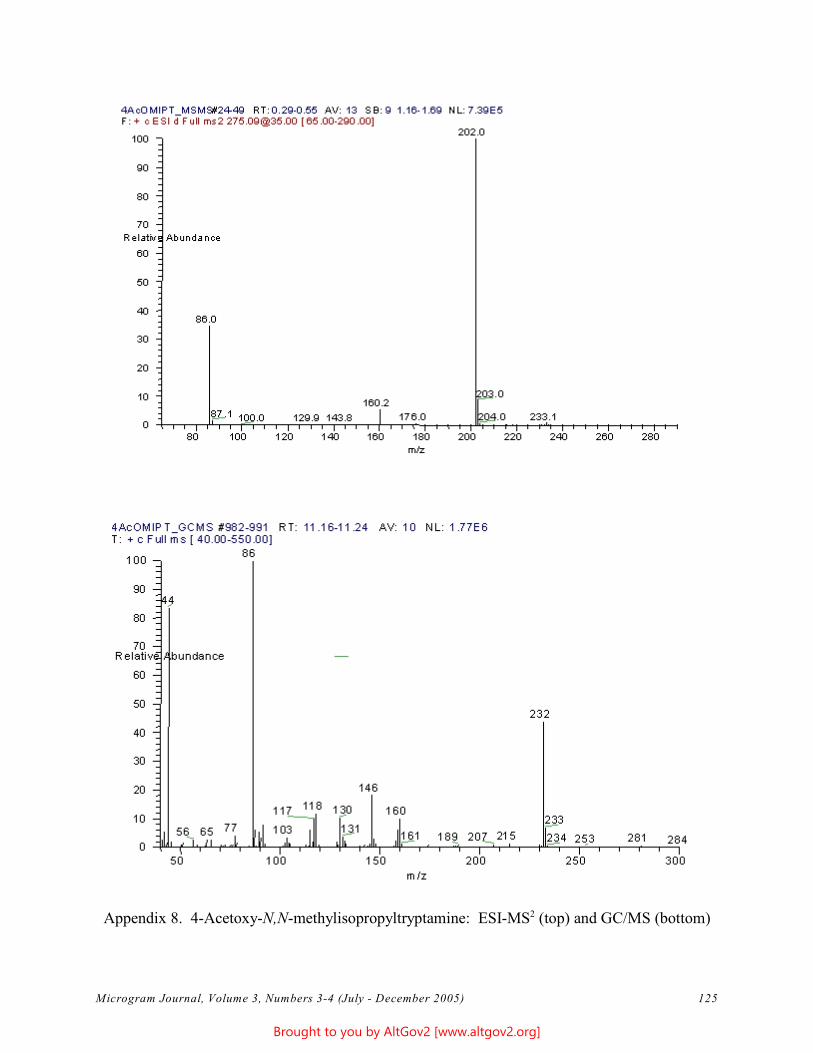
2Appendix 8. 4-Acetoxy-N,N-methylisopropyltryptamine: ESI-MS (top) and GC/MS (bottom)
Microgram Journal, Volume 3, Numbers 3-4 (July - December 2005) 125
Brought to you by AltGov2 [www.altgov2.org]
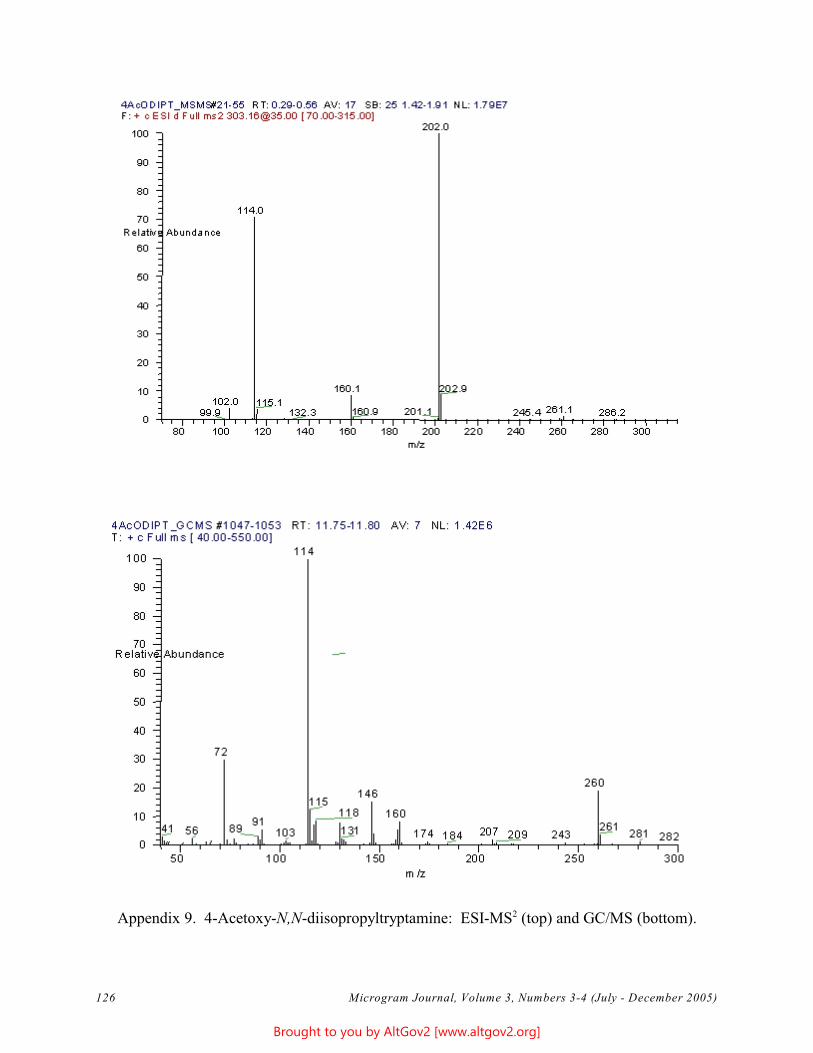
2Appendix 9. 4-Acetoxy-N,N-diisopropyltryptamine: ESI-MS (top) and GC/MS (bottom).
Microgram Journal, Volume 3, Numbers 3-4 (July - December 2005) 126
Brought to you by AltGov2 [www.altgov2.org]
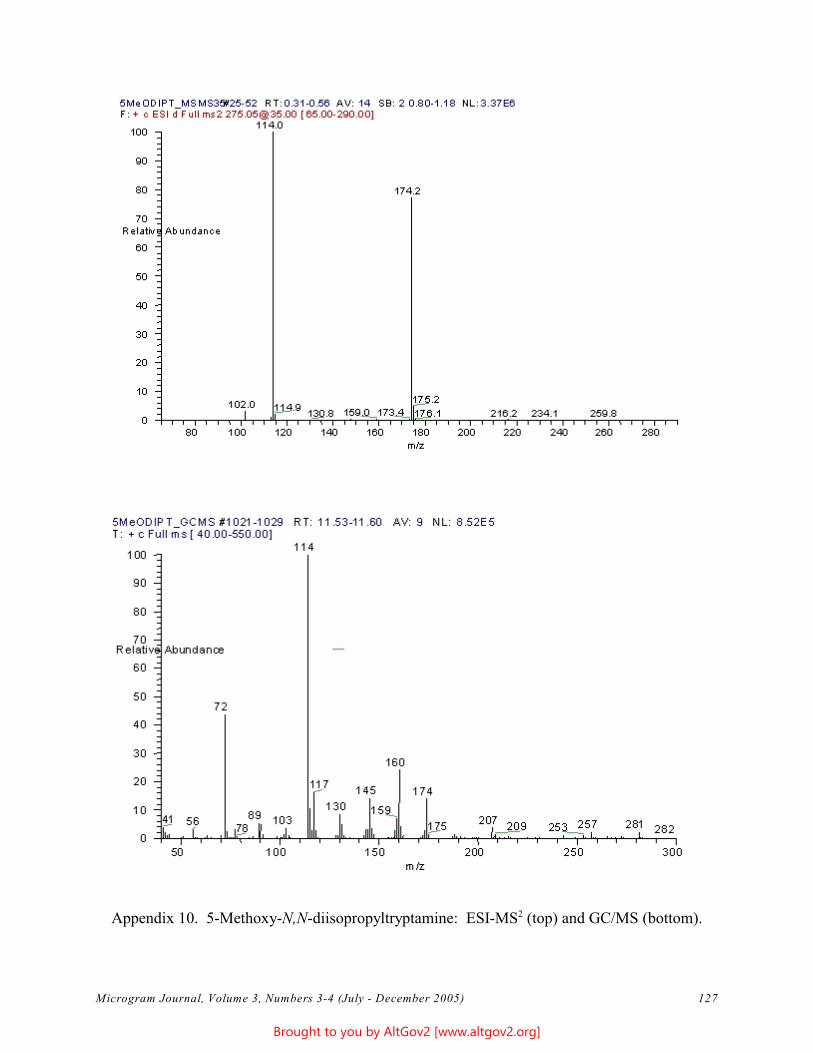
2Appendix 10. 5-Methoxy-N,N-diisopropyltryptamine: ESI-MS (top) and GC/MS (bottom).
Microgram Journal, Volume 3, Numbers 3-4 (July - December 2005) 127
Brought to you by AltGov2 [www.altgov2.org]
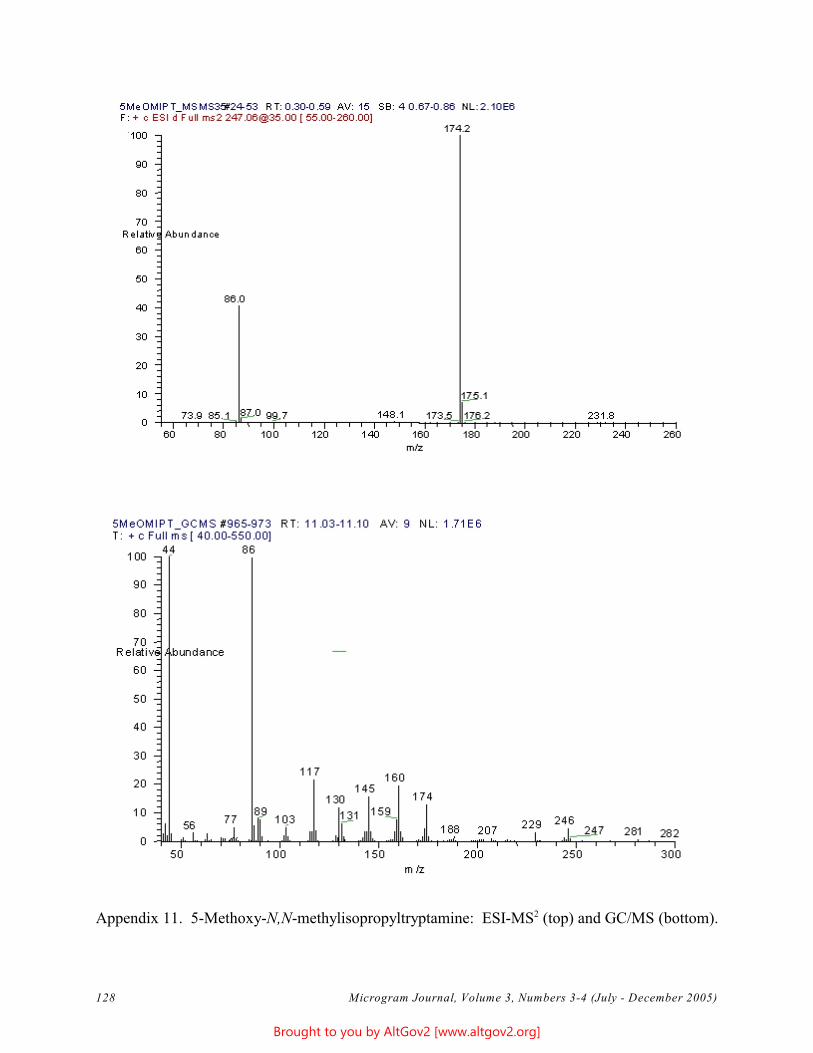
2Appendix 11. 5-Methoxy-N,N-methylisopropyltryptamine: ESI-MS (top) and GC/MS (bottom).
Microgram Journal, Volume 3, Numbers 3-4 (July - December 2005) 128
Brought to you by AltGov2 [www.altgov2.org]
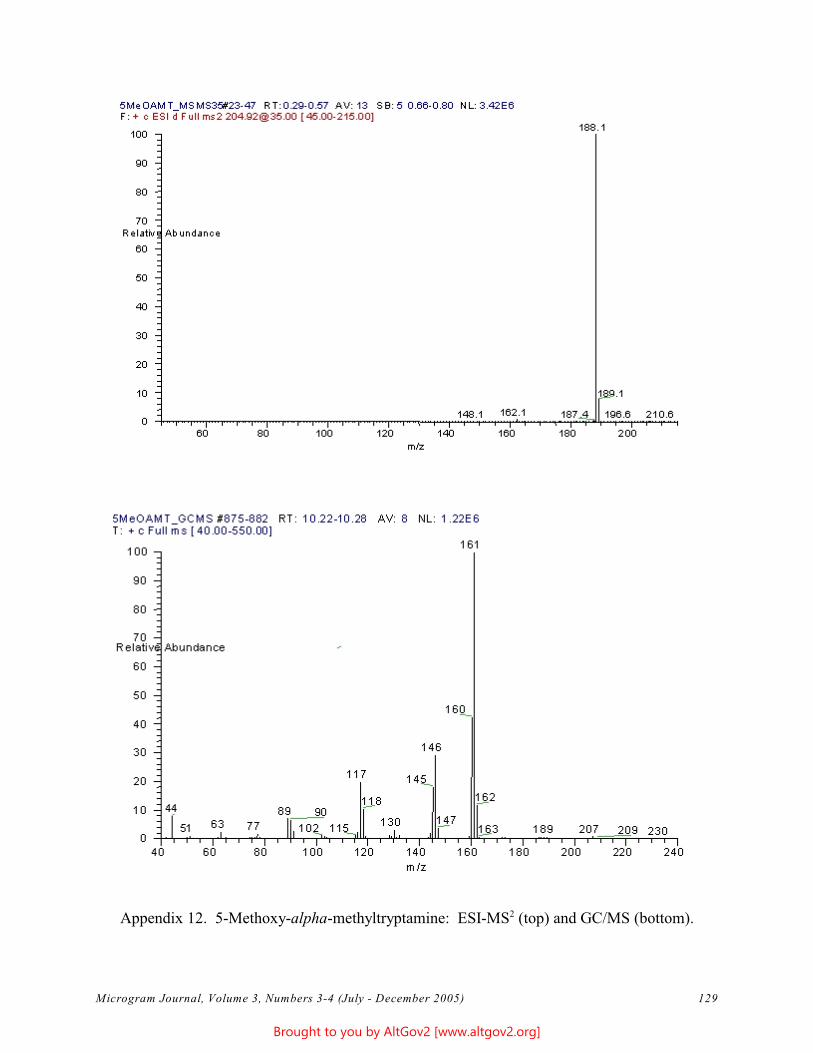
2Appendix 12. 5-Methoxy-alpha-methyltryptamine: ESI-MS (top) and GC/MS (bottom).
Microgram Journal, Volume 3, Numbers 3-4 (July - December 2005) 129
Brought to you by AltGov2 [www.altgov2.org]
Technical Note
Assessment of the Volatility (Smokeability) of Cocaine Base Containing
50 Percent Mannitol: Is it a Smokeable Form of “Crack” Cocaine?
John F. Casale U.S. Department of Justice
Drug Enforcement Administration Special Testing and Research Laboratory
22624 Dulles Summit Court Dulles, VA 20166
[email address withheld at author’s request]
ABSTRACT: A defendant convicted of possession and use of “crack” cocaine claimed on appeal that cocaine
base containing 44 percent mannitol was not a “smokeable form,” and therefore that Federal Sentencing
Guidelines for “crack” cocaine were not applicable in his sentencing To investigate this claim, a sample of
“crack” cocaine was made by mixing molten illicit cocaine base with an equal weight of mannitol, then cooled to
form a solid “rock” that was visually consistent with typical exhibits of “crack” cocaine. A sample of this
formulation was heated in a device similar to a crack pipe, and the resulting vapors were collected by dissolution
into chloroform. Analysis of the resulting solution by GC/MS identified cocaine, thereby confirming that “crack”
formulated from equal parts cocaine base and mannitol is smokeable.
KEYWORDS: Cocaine, Mannitol, Crack, Gas Chromatography/Mass Spectrometry, Forensic Chemistry.
Introduction
“Crack” cocaine has been a major drug of abuse since the early 1980’s. The term “crack” is the most common
street name used for cocaine base that is smoked. It can be in a rock-like, powder, or oil-like form, and can also
be adulterated or diluted (“cut”) with a virtually unlimited number of substances; some of the most common
include benzocaine, procaine, mannitol, acetaminophen, aspirin, and phenacetin. “Crack” is not a scientific term;
however, for sentencing purposes, “crack” has been defined as cocaine base.
Because of the violence associated with trafficking and sale of “crack” cocaine, and its unusually high potential
for addiction, the U.S. Congress mandated more punitive sentences for cocaine base versus cocaine
hydrochloride. Some recent judicial rulings have decreed that cocaine base exhibits must be in a “smokeable
form” in order to impose Federal Sentencing Guidelines for “crack” cocaine [1]. Recently, a defendant who had
been convicted for possession and use of “crack” cocaine claimed on judicial appeal that cocaine base containing
44 percent mannitol (that is, the sample he had) was not a “smokeable form” of cocaine base. Herein, we report
the results of experiments designed to determine if a “crack” cocaine sample containing 50 percent mannitol is a
“smokeable form” of cocaine base.
Experimental
Materials
Illicitly prepared cocaine base (m.p. 84 - 88 OC) was obtained from the reference collection of this laboratory.
Pharmaceutical cocaine base and mannitol were obtained from Merck Chemical (Rahway, NJ) and
Microgram Journal, Volume 3, Numbers 3-4 (July - December 2005) 130
Brought to you by AltGov2 [www.altgov2.org]
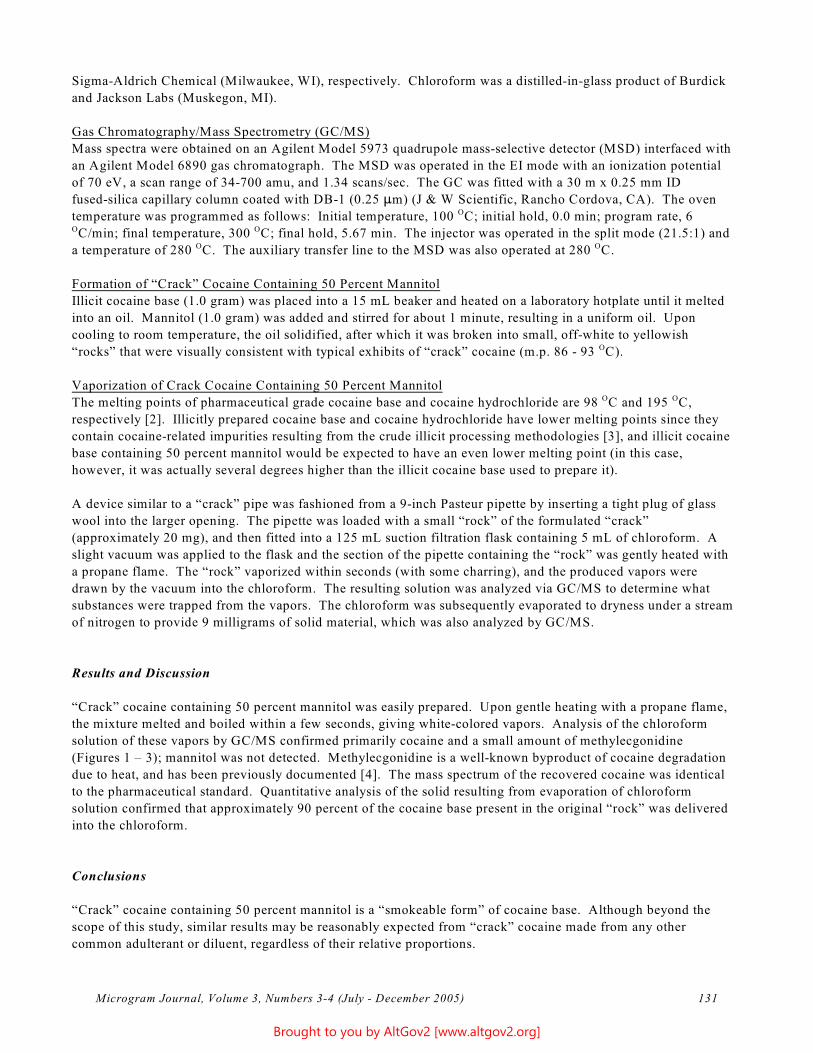
Sigma-Aldrich Chemical (Milwaukee, WI), respectively. Chloroform was a distilled-in-glass product of Burdick
and Jackson Labs (Muskegon, MI).
Gas Chromatography/Mass Spectrometry (GC/MS)
Mass spectra were obtained on an Agilent Model 5973 quadrupole mass-selective detector (MSD) interfaced with
an Agilent Model 6890 gas chromatograph. The MSD was operated in the EI mode with an ionization potential
of 70 eV, a scan range of 34-700 amu, and 1.34 scans/sec. The GC was fitted with a 30 m x 0.25 mm ID
fused-silica capillary column coated with DB-1 (0.25 :m) (J & W Scientific, Rancho Cordova, CA). The oven
temperature was programmed as follows: Initial temperature, 100 OC; initial hold, 0.0 min; program rate, 6 OC/min; final temperature, 300 OC; final hold, 5.67 min. The injector was operated in the split mode (21.5:1) and
Oa temperature of 280 OC. The auxiliary transfer line to the MSD was also operated at 280 C.
Formation of “Crack” Cocaine Containing 50 Percent Mannitol
Illicit cocaine base (1.0 gram) was placed into a 15 mL beaker and heated on a laboratory hotplate until it melted
into an oil. Mannitol (1.0 gram) was added and stirred for about 1 minute, resulting in a uniform oil. Upon
cooling to room temperature, the oil solidified, after which it was broken into small, off-white to yellowish
“rocks” that were visually consistent with typical exhibits of “crack” cocaine (m.p. 86 - 93 OC).
Vaporization of Crack Cocaine Containing 50 Percent Mannitol OThe melting points of pharmaceutical grade cocaine base and cocaine hydrochloride are 98 OC and 195 C,
respectively [2]. Illicitly prepared cocaine base and cocaine hydrochloride have lower melting points since they
contain cocaine-related impurities resulting from the crude illicit processing methodologies [3], and illicit cocaine
base containing 50 percent mannitol would be expected to have an even lower melting point (in this case,
however, it was actually several degrees higher than the illicit cocaine base used to prepare it).
A device similar to a “crack” pipe was fashioned from a 9-inch Pasteur pipette by inserting a tight plug of glass
wool into the larger opening. The pipette was loaded with a small “rock” of the formulated “crack”
(approximately 20 mg), and then fitted into a 125 mL suction filtration flask containing 5 mL of chloroform. A
slight vacuum was applied to the flask and the section of the pipette containing the “rock” was gently heated with
a propane flame. The “rock” vaporized within seconds (with some charring), and the produced vapors were
drawn by the vacuum into the chloroform. The resulting solution was analyzed via GC/MS to determine what
substances were trapped from the vapors. The chloroform was subsequently evaporated to dryness under a stream
of nitrogen to provide 9 milligrams of solid material, which was also analyzed by GC/MS.
Results and Discussion
“Crack” cocaine containing 50 percent mannitol was easily prepared. Upon gentle heating with a propane flame,
the mixture melted and boiled within a few seconds, giving white-colored vapors. Analysis of the chloroform
solution of these vapors by GC/MS confirmed primarily cocaine and a small amount of methylecgonidine
(Figures 1 – 3); mannitol was not detected. Methylecgonidine is a well-known byproduct of cocaine degradation
due to heat, and has been previously documented [4]. The mass spectrum of the recovered cocaine was identical
to the pharmaceutical standard. Quantitative analysis of the solid resulting from evaporation of chloroform
solution confirmed that approximately 90 percent of the cocaine base present in the original “rock” was delivered
into the chloroform.
Conclusions
“Crack” cocaine containing 50 percent mannitol is a “smokeable form” of cocaine base. Although beyond the
scope of this study, similar results may be reasonably expected from “crack” cocaine made from any other
common adulterant or diluent, regardless of their relative proportions.
Microgram Journal, Volume 3, Numbers 3-4 (July - December 2005) 131
Brought to you by AltGov2 [www.altgov2.org]
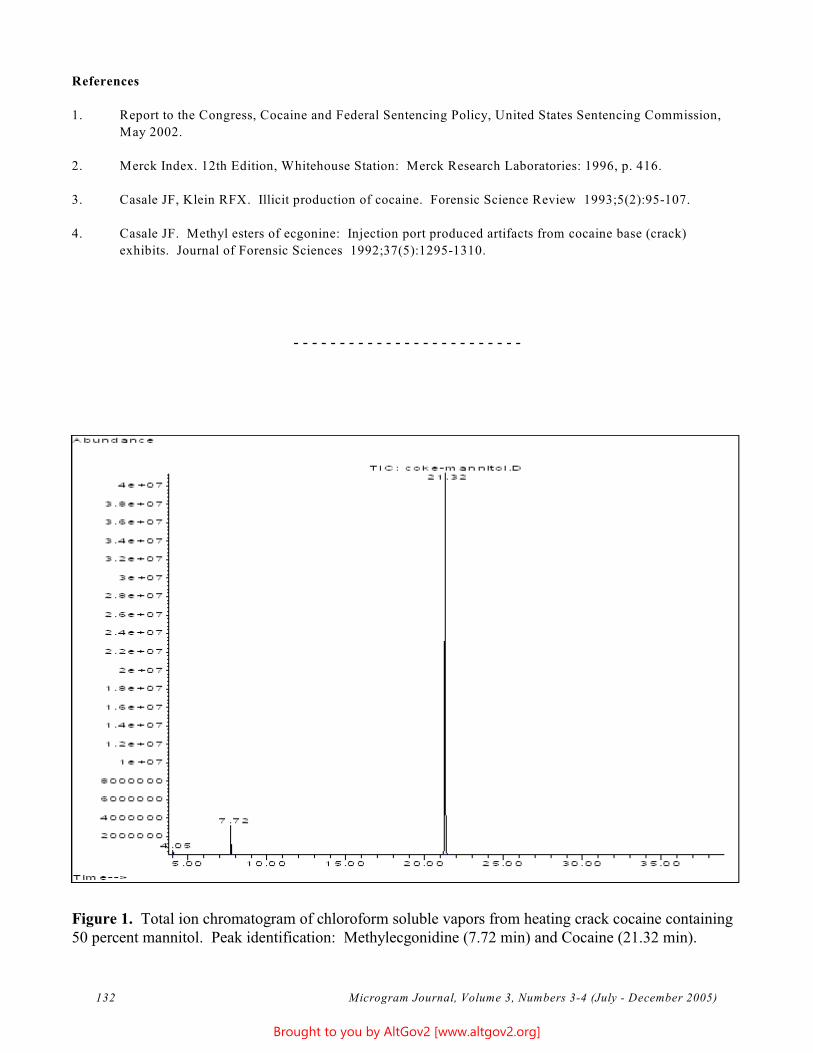
- - - - - - - - - - - - - - - - - - - - - - - - -
References
1. Report to the Congress, Cocaine and Federal Sentencing Policy, United States Sentencing Commission,
May 2002.
2. Merck Index. 12th Edition, Whitehouse Station: Merck Research Laboratories: 1996, p. 416.
3. Casale JF, Klein RFX. Illicit production of cocaine. Forensic Science Review 1993;5(2):95-107.
4. Casale JF. Methyl esters of ecgonine: Injection port produced artifacts from cocaine base (crack)
exhibits. Journal of Forensic Sciences 1992;37(5):1295-1310.
Figure 1. Total ion chromatogram of chloroform soluble vapors from heating crack cocaine containing 50 percent mannitol. Peak identification: Methylecgonidine (7.72 min) and Cocaine (21.32 min).
Microgram Journal, Volume 3, Numbers 3-4 (July - December 2005) 132
Brought to you by AltGov2 [www.altgov2.org]
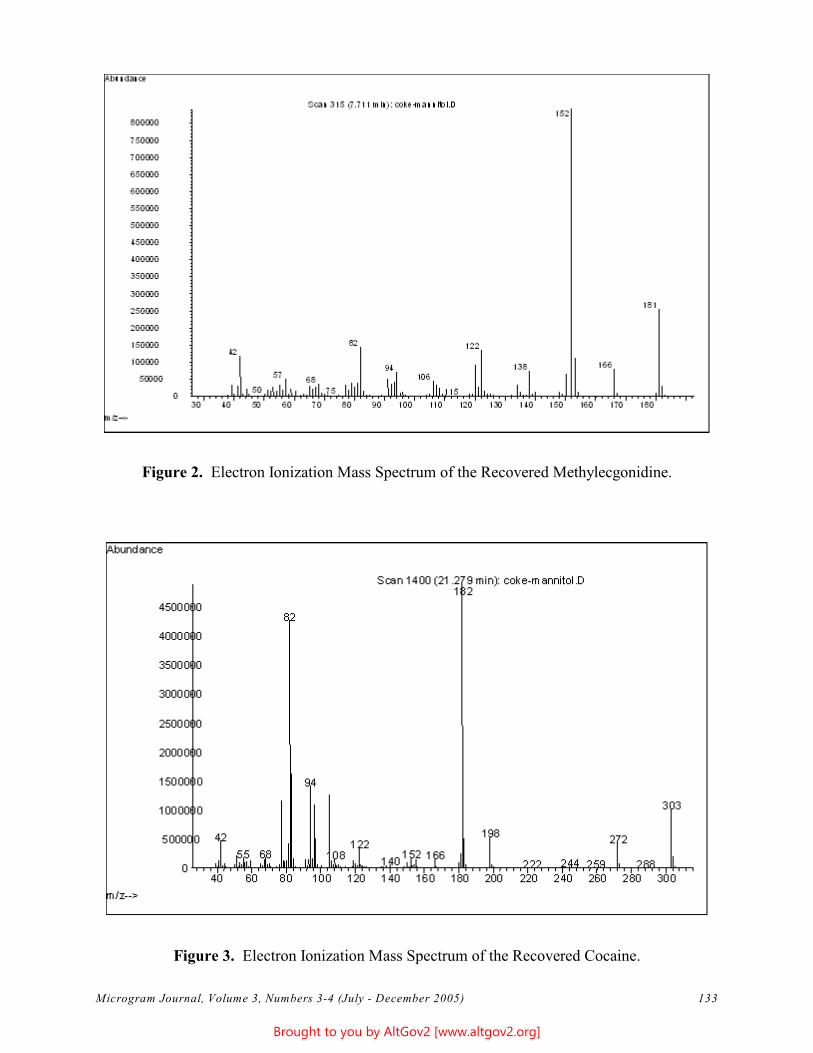
Figure 2. Electron Ionization Mass Spectrum of the Recovered Methylecgonidine.
Figure 3. Electron Ionization Mass Spectrum of the Recovered Cocaine.
Microgram Journal, Volume 3, Numbers 3-4 (July - December 2005) 133
Brought to you by AltGov2 [www.altgov2.org]
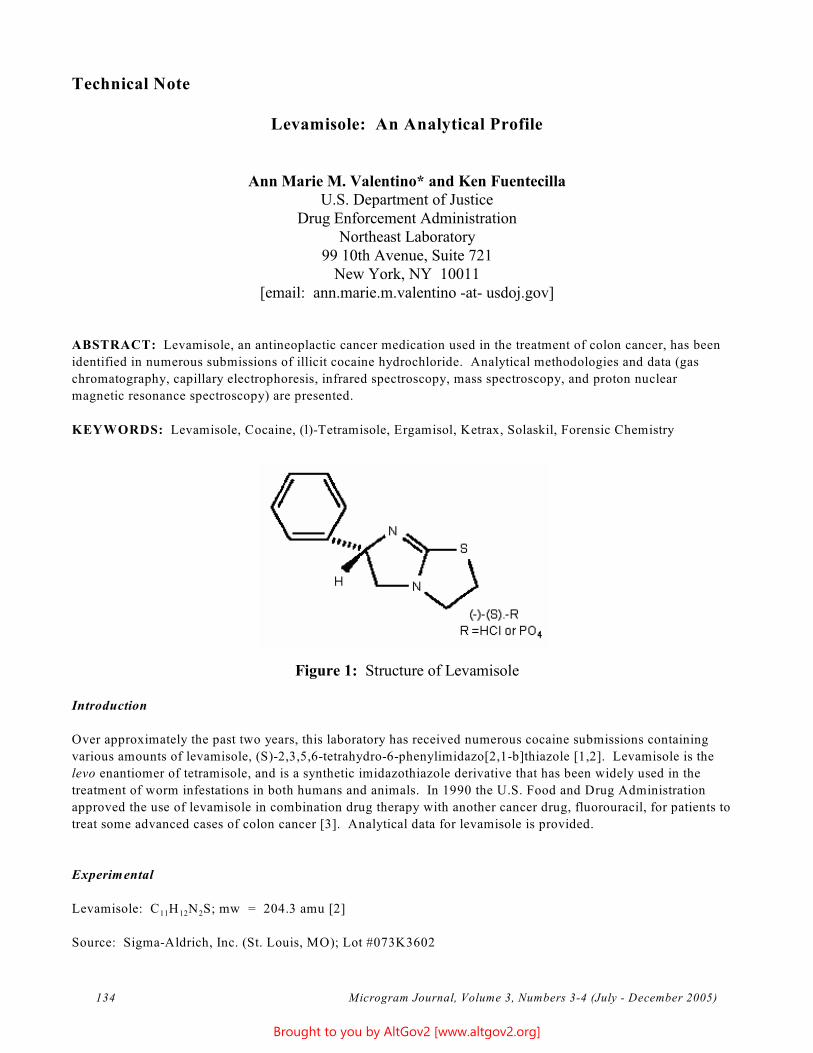
Technical Note
Levamisole: An Analytical Profile
Ann Marie M. Valentino* and Ken Fuentecilla U.S. Department of Justice
Drug Enforcement Administration Northeast Laboratory
99 10th Avenue, Suite 721 New York, NY 10011
[email: ann.marie.m.valentino -at- usdoj.gov]
ABSTRACT: Levamisole, an antineoplactic cancer medication used in the treatment of colon cancer, has been
identified in numerous submissions of illicit cocaine hydrochloride. Analytical methodologies and data (gas
chromatography, capillary electrophoresis, infrared spectroscopy, mass spectroscopy, and proton nuclear
magnetic resonance spectroscopy) are presented.
KEYWORDS: Levamisole, Cocaine, (l)-Tetramisole, Ergamisol, Ketrax, Solaskil, Forensic Chemistry
Figure 1: Structure of Levamisole
Introduction
Over approximately the past two years, this laboratory has received numerous cocaine submissions containing
various amounts of levamisole, (S)-2,3,5,6-tetrahydro-6-phenylimidazo[2,1-b]thiazole [1,2]. Levamisole is the
levo enantiomer of tetramisole, and is a synthetic imidazothiazole derivative that has been widely used in the
treatment of worm infestations in both humans and animals. In 1990 the U.S. Food and Drug Administration
approved the use of levamisole in combination drug therapy with another cancer drug, fluorouracil, for patients to
treat some advanced cases of colon cancer [3]. Analytical data for levamisole is provided.
Experimental
Levamisole: C11H N S; mw = 204.3 amu [2] 12 2
Source: Sigma-Aldrich, Inc. (St. Louis, MO); Lot #073K3602
Microgram Journal, Volume 3, Numbers 3-4 (July - December 2005) 134
Brought to you by AltGov2 [www.altgov2.org]
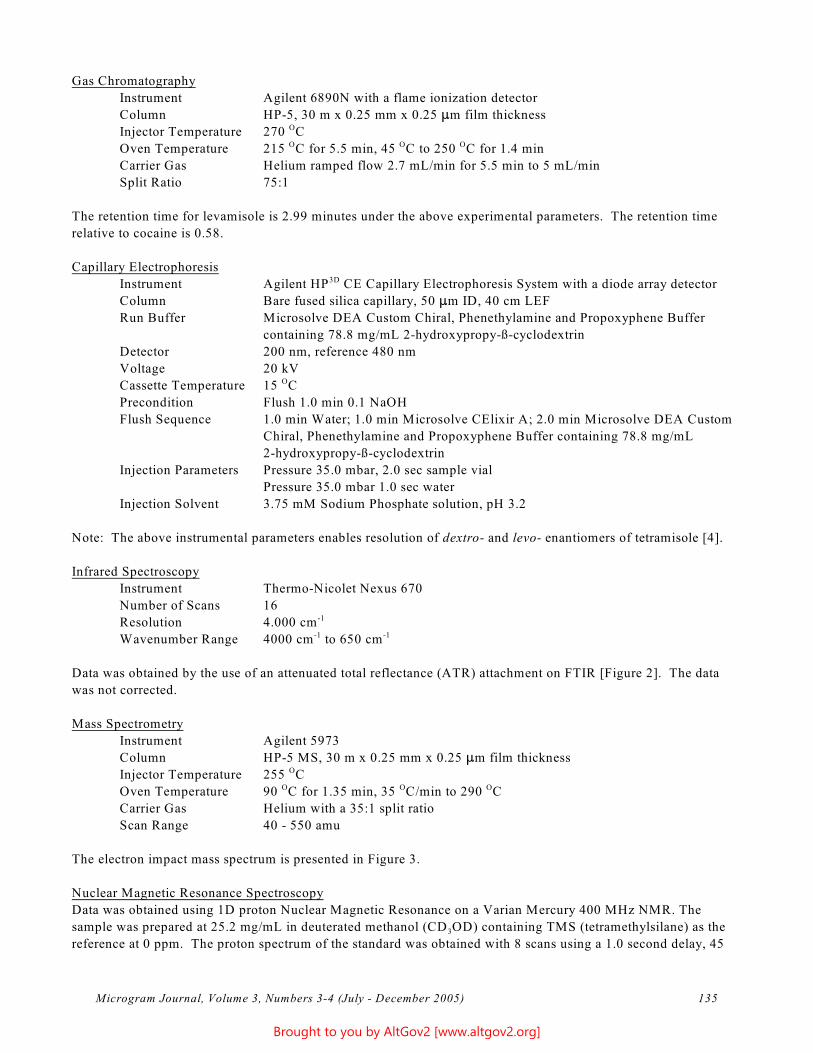
Gas Chromatography
Instrument
Column
Injector Temperature
Oven Temperature
Carrier Gas
Split Ratio
Agilent 6890N with a flame ionization detector
HP-5, 30 m x 0.25 mm x 0.25 :m film thickness
270 OC
215 OC for 5.5 min, 45 OC to 250 OC for 1.4 min
Helium ramped flow 2.7 mL/min for 5.5 min to 5 mL/min
75:1
The retention time for levamisole is 2.99 minutes under the above experimental parameters. The retention time
relative to cocaine is 0.58.
Capillary Electrophoresis
Instrument
Column
Run Buffer
Detector
Voltage
Cassette Temperature
Precondition
Flush Sequence
Injection Parameters
Injection Solvent
Agilent HP3D CE Capillary Electrophoresis System with a diode array detector
Bare fused silica capillary, 50 :m ID, 40 cm LEF
Microsolve DEA Custom Chiral, Phenethylamine and Propoxyphene Buffer
containing 78.8 mg/mL 2-hydroxypropy-ß-cyclodextrin
200 nm, reference 480 nm
20 kV
15 OC
Flush 1.0 min 0.1 NaOH
1.0 min Water; 1.0 min Microsolve CElixir A; 2.0 min Microsolve DEA Custom
Chiral, Phenethylamine and Propoxyphene Buffer containing 78.8 mg/mL
2-hydroxypropy-ß-cyclodextrin
Pressure 35.0 mbar, 2.0 sec sample vial
Pressure 35.0 mbar 1.0 sec water
3.75 mM Sodium Phosphate solution, pH 3.2
Note: The above instrumental parameters enables resolution of dextro- and levo- enantiomers of tetramisole [4].
Infrared Spectroscopy
Instrument Thermo-Nicolet Nexus 670
Number of Scans 16
Resolution 4.000 cm-1
Wavenumber Range 4000 cm-1 to 650 cm -1
Data was obtained by the use of an attenuated total reflectance (ATR) attachment on FTIR [Figure 2]. The data
was not corrected.
Mass Spectrometry
Instrument
Column
Injector Temperature
Oven Temperature
Carrier Gas
Scan Range
Agilent 5973
HP-5 MS, 30 m x 0.25 mm x 0.25 :m film thickness
255 OC O90 OC for 1.35 min, 35 C/min to 290 OC
Helium with a 35:1 split ratio
40 - 550 amu
The electron impact mass spectrum is presented in Figure 3.
Nuclear Magnetic Resonance Spectroscopy
Data was obtained using 1D proton Nuclear Magnetic Resonance on a Varian Mercury 400 MHz NMR. The
sample was prepared at 25.2 mg/mL in deuterated methanol (CD OD) containing TMS (tetramethylsilane) as the 3
reference at 0 ppm. The proton spectrum of the standard was obtained with 8 scans using a 1.0 second delay, 45
Microgram Journal, Volume 3, Numbers 3-4 (July - December 2005) 135
Brought to you by AltGov2 [www.altgov2.org]
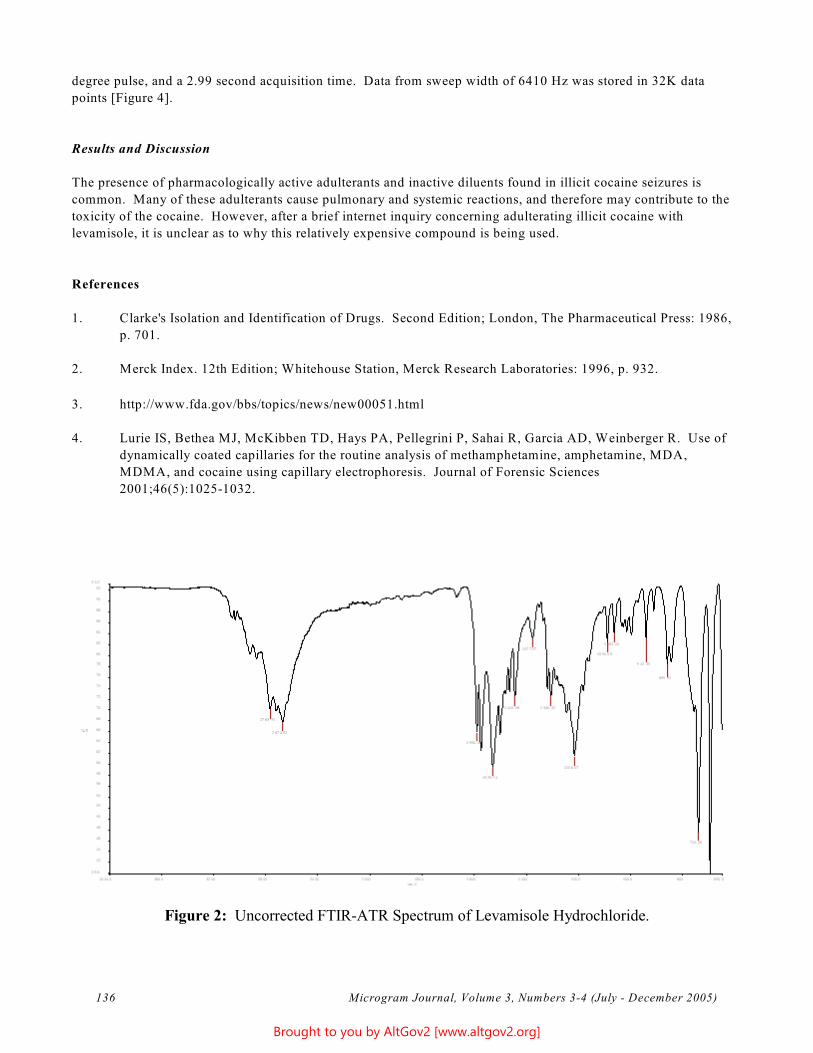
degree pulse, and a 2.99 second acquisition time. Data from sweep width of 6410 Hz was stored in 32K data
points [Figure 4].
Results and Discussion
The presence of pharmacologically active adulterants and inactive diluents found in illicit cocaine seizures is
common. Many of these adulterants cause pulmonary and systemic reactions, and therefore may contribute to the
toxicity of the cocaine. However, after a brief internet inquiry concerning adulterating illicit cocaine with
levamisole, it is unclear as to why this relatively expensive compound is being used.
References
1. Clarke's Isolation and Identification of Drugs. Second Edition; London, The Pharmaceutical Press: 1986,
p. 701.
2. Merck Index. 12th Edition; Whitehouse Station, Merck Research Laboratories: 1996, p. 932.
3. http://www.fda.gov/bbs/topics/news/new00051.html
4. Lurie IS, Bethea MJ, McKibben TD, Hays PA, Pellegrini P, Sahai R, Garcia AD, Weinberger R. Use of
dynamically coated capillaries for the routine analysis of methamphetamine, amphetamine, MDA,
MDMA, and cocaine using capillary electrophoresis. Journal of Forensic Sciences
2001;46(5):1025-1032.
Figure 2: Uncorrected FTIR-ATR Spectrum of Levamisole Hydrochloride.
Microgram Journal, Volume 3, Numbers 3-4 (July - December 2005) 136
Brought to you by AltGov2 [www.altgov2.org]
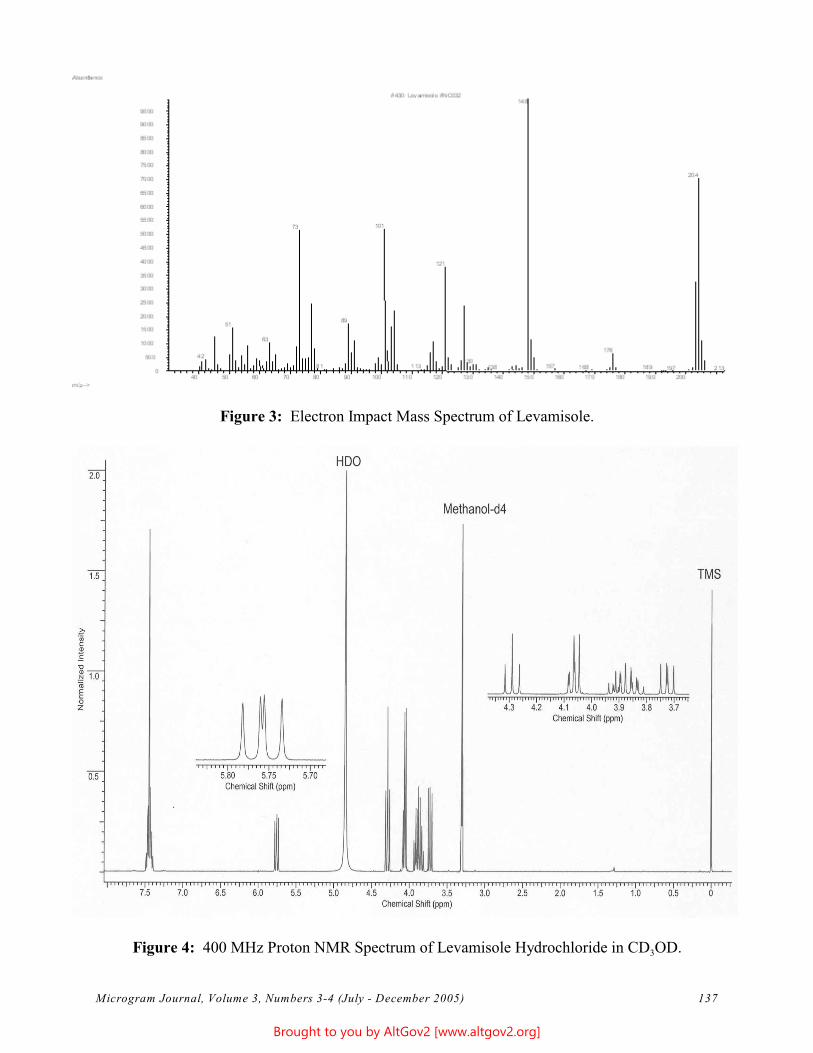
Figure 3: Electron Impact Mass Spectrum of Levamisole.
Figure 4: 400 MHz Proton NMR Spectrum of Levamisole Hydrochloride in CD OD. 3
Microgram Journal, Volume 3, Numbers 3-4 (July - December 2005) 137
Brought to you by AltGov2 [www.altgov2.org]
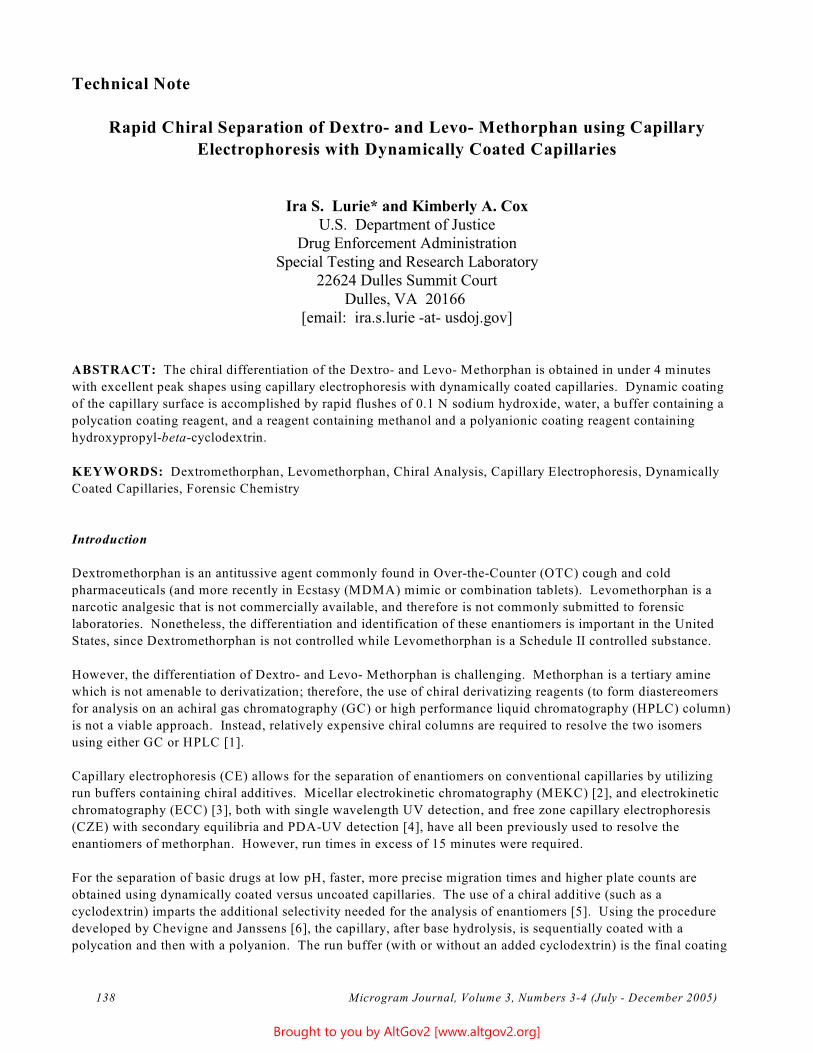
Technical Note
Rapid Chiral Separation of Dextro- and Levo- Methorphan using Capillary
Electrophoresis with Dynamically Coated Capillaries
Ira S. Lurie* and Kimberly A. Cox U.S. Department of Justice
Drug Enforcement Administration Special Testing and Research Laboratory
22624 Dulles Summit Court Dulles, VA 20166
[email: ira.s.lurie -at- usdoj.gov]
ABSTRACT: The chiral differentiation of the Dextro- and Levo- Methorphan is obtained in under 4 minutes
with excellent peak shapes using capillary electrophoresis with dynamically coated capillaries. Dynamic coating
of the capillary surface is accomplished by rapid flushes of 0.1 N sodium hydroxide, water, a buffer containing a
polycation coating reagent, and a reagent containing methanol and a polyanionic coating reagent containing
hydroxypropyl-beta-cyclodextrin.
KEYWORDS: Dextromethorphan, Levomethorphan, Chiral Analysis, Capillary Electrophoresis, Dynamically
Coated Capillaries, Forensic Chemistry
Introduction
Dextromethorphan is an antitussive agent commonly found in Over-the-Counter (OTC) cough and cold
pharmaceuticals (and more recently in Ecstasy (MDMA) mimic or combination tablets). Levomethorphan is a
narcotic analgesic that is not commercially available, and therefore is not commonly submitted to forensic
laboratories. Nonetheless, the differentiation and identification of these enantiomers is important in the United
States, since Dextromethorphan is not controlled while Levomethorphan is a Schedule II controlled substance.
However, the differentiation of Dextro- and Levo- Methorphan is challenging. Methorphan is a tertiary amine
which is not amenable to derivatization; therefore, the use of chiral derivatizing reagents (to form diastereomers
for analysis on an achiral gas chromatography (GC) or high performance liquid chromatography (HPLC) column)
is not a viable approach. Instead, relatively expensive chiral columns are required to resolve the two isomers
using either GC or HPLC [1].
Capillary electrophoresis (CE) allows for the separation of enantiomers on conventional capillaries by utilizing
run buffers containing chiral additives. Micellar electrokinetic chromatography (MEKC) [2], and electrokinetic
chromatography (ECC) [3], both with single wavelength UV detection, and free zone capillary electrophoresis
(CZE) with secondary equilibria and PDA-UV detection [4], have all been previously used to resolve the
enantiomers of methorphan. However, run times in excess of 15 minutes were required.
For the separation of basic drugs at low pH, faster, more precise migration times and higher plate counts are
obtained using dynamically coated versus uncoated capillaries. The use of a chiral additive (such as a
cyclodextrin) imparts the additional selectivity needed for the analysis of enantiomers [5]. Using the procedure
developed by Chevigne and Janssens [6], the capillary, after base hydrolysis, is sequentially coated with a
polycation and then with a polyanion. The run buffer (with or without an added cyclodextrin) is the final coating
Microgram Journal, Volume 3, Numbers 3-4 (July - December 2005) 138
Brought to you by AltGov2 [www.altgov2.org]
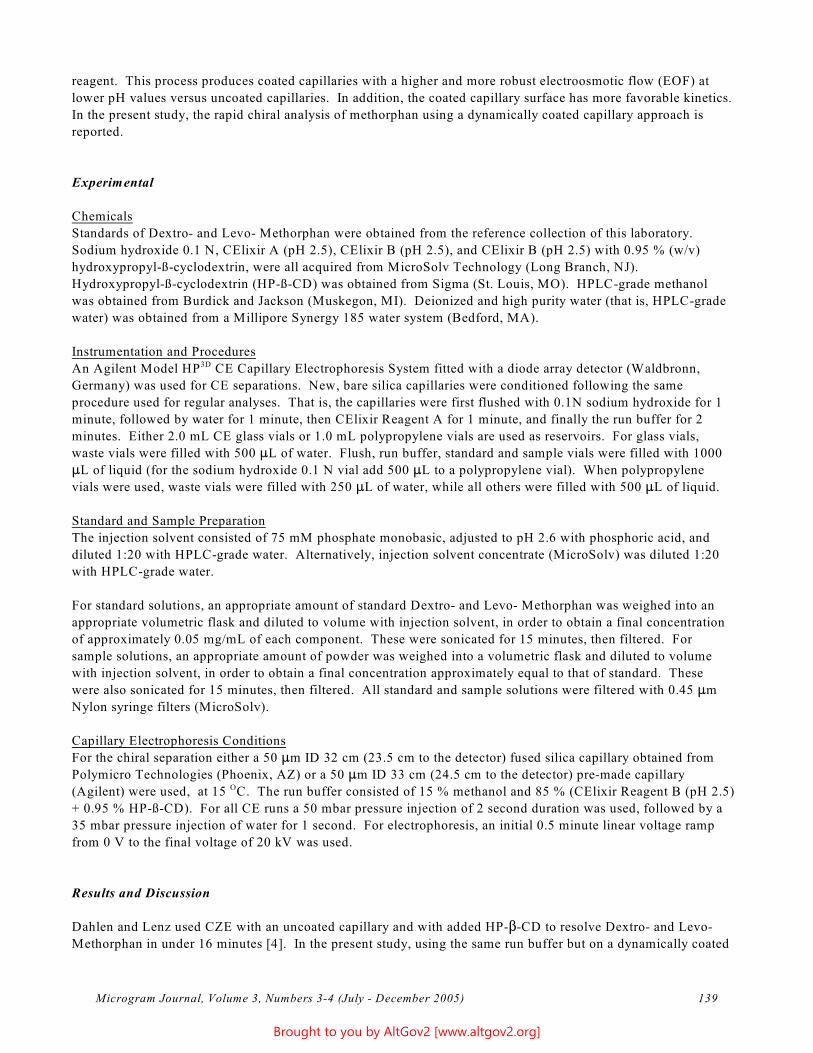
reagent. This process produces coated capillaries with a higher and more robust electroosmotic flow (EOF) at
lower pH values versus uncoated capillaries. In addition, the coated capillary surface has more favorable kinetics.
In the present study, the rapid chiral analysis of methorphan using a dynamically coated capillary approach is
reported.
Experimental
Chemicals
Standards of Dextro- and Levo- Methorphan were obtained from the reference collection of this laboratory.
Sodium hydroxide 0.1 N, CElixir A (pH 2.5), CElixir B (pH 2.5), and CElixir B (pH 2.5) with 0.95 % (w/v)
hydroxypropyl-ß-cyclodextrin, were all acquired from MicroSolv Technology (Long Branch, NJ).
Hydroxypropyl-ß-cyclodextrin (HP-ß-CD) was obtained from Sigma (St. Louis, MO). HPLC-grade methanol
was obtained from Burdick and Jackson (Muskegon, MI). Deionized and high purity water (that is, HPLC-grade
water) was obtained from a Millipore Synergy 185 water system (Bedford, MA).
Instrumentation and Procedures
An Agilent Model HP3D CE Capillary Electrophoresis System fitted with a diode array detector (Waldbronn,
Germany) was used for CE separations. New, bare silica capillaries were conditioned following the same
procedure used for regular analyses. That is, the capillaries were first flushed with 0.1N sodium hydroxide for 1
minute, followed by water for 1 minute, then CElixir Reagent A for 1 minute, and finally the run buffer for 2
minutes. Either 2.0 mL CE glass vials or 1.0 mL polypropylene vials are used as reservoirs. For glass vials,
waste vials were filled with 500 :L of water. Flush, run buffer, standard and sample vials were filled with 1000
:L of liquid (for the sodium hydroxide 0.1 N vial add 500 :L to a polypropylene vial). When polypropylene
vials were used, waste vials were filled with 250 :L of water, while all others were filled with 500 :L of liquid.
Standard and Sample Preparation
The injection solvent consisted of 75 mM phosphate monobasic, adjusted to pH 2.6 with phosphoric acid, and
diluted 1:20 with HPLC-grade water. Alternatively, injection solvent concentrate (MicroSolv) was diluted 1:20
with HPLC-grade water.
For standard solutions, an appropriate amount of standard Dextro- and Levo- Methorphan was weighed into an
appropriate volumetric flask and diluted to volume with injection solvent, in order to obtain a final concentration
of approximately 0.05 mg/mL of each component. These were sonicated for 15 minutes, then filtered. For
sample solutions, an appropriate amount of powder was weighed into a volumetric flask and diluted to volume
with injection solvent, in order to obtain a final concentration approximately equal to that of standard. These
were also sonicated for 15 minutes, then filtered. All standard and sample solutions were filtered with 0.45 :m
Nylon syringe filters (MicroSolv).
Capillary Electrophoresis Conditions
For the chiral separation either a 50 :m ID 32 cm (23.5 cm to the detector) fused silica capillary obtained from
Polymicro Technologies (Phoenix, AZ) or a 50 :m ID 33 cm (24.5 cm to the detector) pre-made capillary
(Agilent) were used, at 15 OC. The run buffer consisted of 15 % methanol and 85 % (CElixir Reagent B (pH 2.5)
+ 0.95 % HP-ß-CD). For all CE runs a 50 mbar pressure injection of 2 second duration was used, followed by a
35 mbar pressure injection of water for 1 second. For electrophoresis, an initial 0.5 minute linear voltage ramp
from 0 V to the final voltage of 20 kV was used.
Results and Discussion
Dahlen and Lenz used CZE with an uncoated capillary and with added HP-$-CD to resolve Dextro- and Levo-
Methorphan in under 16 minutes [4]. In the present study, using the same run buffer but on a dynamically coated
Microgram Journal, Volume 3, Numbers 3-4 (July - December 2005) 139
Brought to you by AltGov2 [www.altgov2.org]
capillary, identical results were obtained in under 4 minutes (see Figure 1). Highly precise separations were
obtained, as demonstrated by excellent run-to-run migration time precision (% RSD = 0.1, n = 7). Because the
peaks are so narrow, identification can be difficult based on migration time alone; however, co-injection of
sample and either standard eliminates any ambiguities. Relative migration time data (relative to
Dextromethorphan) of solutes commonly found with Dextromethorphan is given in Table 1. The non-controlled
substances are included because they and Dextromethorphan are commonly combined in various OTC
pharmaceuticals. The controlled substances are included since they and Dextromethorphan are occasionally
identified in Ecstasy (MDMA) mimic and combination tablets.
If needed, n-butylamphetamine can be used as an internal standard in this method for the quantitation of
Methorphan.
The present procedure is compatible with previously reported methodology for the CE analysis of a wide variety
of seized drugs using the same capillary with dynamic coatings [5]. Classes of compounds that can be analyzed
using this methodology (using higher CD concentrations than used in this study) include the phenethylamines and
the methylenedioxyphenethylamines. Specific compounds that can be analyzed using this methodology include
propoxyphene, cocaine, oxycodone, heroin, lysergic acid diethylamide (LSD), opium, psilocybe mushrooms,
gamma-hydroxybutyrate (GHB), and gamma-butyrolactone (GBL).
References
1. Pihlainen K, Kostiainen R. Effect of the eluent on enanatiomer separation of controlled drugs by liquid
chromatography - ultraviolet absorbance detection - electrospray ionization tandem mass spectrometry
using vancomycin and native beta-cyclodextrin chiral stationary phases. Journal of Chromatography A
2004;1033:91-99.
2. Aumatell A, Wells RJ. Chiral differentiation of the optical isomers of racemethorphan and racemorphan
in urine by capillary zone electrophoresis. Journal of Chromatographic Science 1993;31:502-508.
3. Lurie IS. Application of capillary electrophoresis to the analysis of seized drugs. American Laboratory
1996;28(2):26-34.
4. Dahlen J, Lenz M. Chiral analysis of substances of forensic interest using cyclodextrin-modified
capillary electrophoresis. Presented at ENSFI working group, Riva del Garda, Italy, May 2004
5. Lurie IS, Hays PA, Parker K. Capillary electrophoresis analysis of a wide variety of seized drugs using
the same capillary with dynamic coatings. Electrophoresis 2004;25:1580-1591. [Note: Substrates
analyzed in the study include the enantiomers of norpseudoephedrine, pseudoephedrine, ephedrine,
amphetamine, methamphetamine, 3,4-methylenedioxyamphetamine (MDA), 3,4-methylenedioxy-
methamphetamine (MDMA), 3,4-methylenedioxyethylamphetamine (MDEA), and propoxyphene].
6. Chevigne R, Janssens J. US Patent #5,611,903, 3/18/97.
[Table 1 and Figure 1 Follow.]
Microgram Journal, Volume 3, Numbers 3-4 (July - December 2005) 140
Brought to you by AltGov2 [www.altgov2.org]
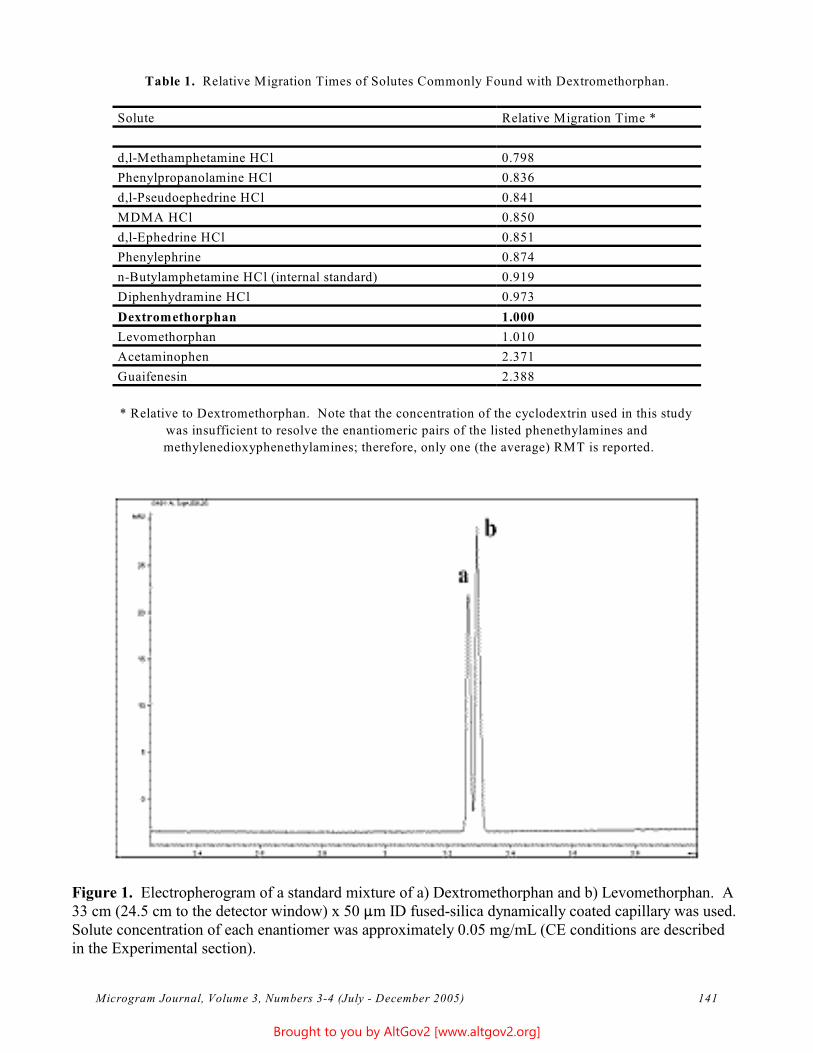
Table 1. Relative Migration Times of Solutes Commonly Found with Dextromethorphan.
Solute Relative Migration Time *
d,l-Methamphetamine HCl 0.798
Phenylpropanolamine HCl 0.836
d,l-Pseudoephedrine HCl 0.841
MDMA HCl 0.850
d,l-Ephedrine HCl 0.851
Phenylephrine 0.874
n-Butylamphetamine HCl (internal standard) 0.919
Diphenhydramine HCl 0.973
Dextromethorphan 1.000
Levomethorphan 1.010
Acetaminophen 2.371
Guaifenesin 2.388
* Relative to Dextromethorphan. Note that the concentration of the cyclodextrin used in this study
was insufficient to resolve the enantiomeric pairs of the listed phenethylamines and
methylenedioxyphenethylamines; therefore, only one (the average) RMT is reported.
Figure 1. Electropherogram of a standard mixture of a) Dextromethorphan and b) Levomethorphan. A 33 cm (24.5 cm to the detector window) x 50 :m ID fused-silica dynamically coated capillary was used. Solute concentration of each enantiomer was approximately 0.05 mg/mL (CE conditions are described in the Experimental section).
Microgram Journal, Volume 3, Numbers 3-4 (July - December 2005) 141
Brought to you by AltGov2 [www.altgov2.org]
Reduction of Phenylephrine with Hydriodic Acid/Red Phosphorus
or Iodine/Red Phosphorus: 3-Hydroxy-N-methylphenethylamine
Lisa M. Kitlinski, Amy L. Harman, Michael M. Brousseau, and Harry F. Skinner* U. S. Department of Justice
Drug Enforcement Administration Southwest Laboratory
2815 Scott Street Vista, CA 92081
[email: harry.f.skinner -at- usdoj.gov]
ABSTRACT: In an effort to decrease illicit methamphetamine production within the United States, many
pharmaceutical companies are now substituting phenylephrine for pseudoephedrine in many of their
Over-the-Counter consumer products intended for treatment of the symptoms of the common cold, allergies, and
related maladies. Because these products are the favored source of pseudoephedrine for illicit production of
methamphetamine, and also because many clandestine laboratory operators are chemically naïve, it is expected
that phenylephrine-containing products will occasionally be utilized in erroneous efforts to produce
methamphetamine. Submission of phenylephrine to reduction conditions typically utilized in clandestine
methamphetamine laboratories (hydriodic acid/red phosphorus or iodine/red phosphorus) produced
3-hydroxy-N-methylphenethylamine, commonly referred to as “Reduced Phenylephrine” or “Reduced PE.”
Standard analytical data for “Reduced PE” are presented.
KEYWORDS: 3-Hydroxy-N-methylphenethylamine, Phenylephrine, Reduction, Methamphetamine,
Pseudoephedrine, Reduced Phenylephrine, Reduced PE, Hydriodic Acid, Red Phosphorus, Iodine, Clandestine
Laboratories, Forensic Chemistry
Introduction
Clandestine methamphetamine laboratories are epidemic in many areas of the United States. One of the primary
synthetic methods that has been used for production of methamphetamine over the past 25 years is the reduction
of ephedrine or pseudoephedrine with hydriodic acid/red phosphorus (HI/red P) [1]. In past efforts to combat
illicit methamphetamine production, federal and state authorities restricted the sale of bulk ephedrine and
pseudoephedrine, and closely monitored the sale and use of hydriodic acid and red phosphorus [2]. In response,
clandestine laboratory operators began utilizing Over-the-Counter (OTC) consumer products containing
ephedrine or pseudoephedrine, began generating hydriodic acid in situ with iodine and red phosphorus (I /red P)2
[3], and also turned to alternate syntheses, notably the lithium/ammonia reduction [4]. A number of states
countered these initiatives with a variety of additional restrictions on the sale of ephedrine- and pseudoephedrine-
containing OTC products, including purchase limits, access restrictions, and identification/signature requirements,
and also further restricted sales of I2 and red P. In turn, clandestine laboratory operators in those states resorted to
so-called “road trips” to purchase ephedrine- and pseudoephedrine-containing OTC products, either traveling to
states that had no restrictions, or purchasing the maximum allowable amounts at dozens or even hundreds of
stores within states that had restrictions in place. In addition, as acquisition of I and red P became increasingly 2
problematic, clandestine laboratory operators turned to a variety of I - and red P-containing consumer products, 2
and also began using other phosphorus compounds as substitutes for red P.
Most recently, the Combat Methamphetamine Epidemic Act (enacted in March 2006) placed federal restrictions
on the sale of ephedrine-, pseudoephedrine-, and phenylpropanolamine-containing OTC products (again,
Microgram Journal, Volume 3, Numbers 3-4 (July - December 2005) 142
Brought to you by AltGov2 [www.altgov2.org]
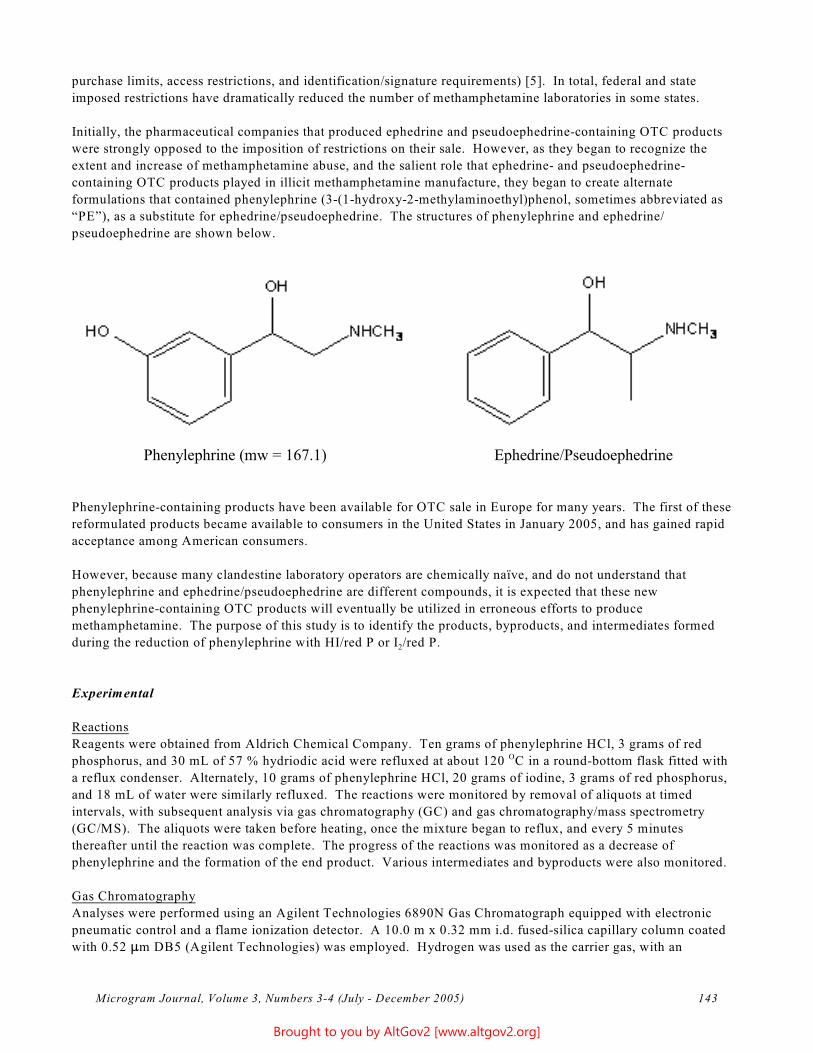
purchase limits, access restrictions, and identification/signature requirements) [5]. In total, federal and state
imposed restrictions have dramatically reduced the number of methamphetamine laboratories in some states.
Initially, the pharmaceutical companies that produced ephedrine and pseudoephedrine-containing OTC products
were strongly opposed to the imposition of restrictions on their sale. However, as they began to recognize the
extent and increase of methamphetamine abuse, and the salient role that ephedrine- and pseudoephedrine-
containing OTC products played in illicit methamphetamine manufacture, they began to create alternate
formulations that contained phenylephrine (3-(1-hydroxy-2-methylaminoethyl)phenol, sometimes abbreviated as
“PE”), as a substitute for ephedrine/pseudoephedrine. The structures of phenylephrine and ephedrine/
pseudoephedrine are shown below.
Phenylephrine (mw = 167.1) Ephedrine/Pseudoephedrine
Phenylephrine-containing products have been available for OTC sale in Europe for many years. The first of these
reformulated products became available to consumers in the United States in January 2005, and has gained rapid
acceptance among American consumers.
However, because many clandestine laboratory operators are chemically naïve, and do not understand that
phenylephrine and ephedrine/pseudoephedrine are different compounds, it is expected that these new
phenylephrine-containing OTC products will eventually be utilized in erroneous efforts to produce
methamphetamine. The purpose of this study is to identify the products, byproducts, and intermediates formed
during the reduction of phenylephrine with HI/red P or I /red P. 2
Experimental
Reactions
Reagents were obtained from Aldrich Chemical Company. Ten grams of phenylephrine HCl, 3 grams of red
phosphorus, and 30 mL of 57 % hydriodic acid were refluxed at about 120 OC in a round-bottom flask fitted with
a reflux condenser. Alternately, 10 grams of phenylephrine HCl, 20 grams of iodine, 3 grams of red phosphorus,
and 18 mL of water were similarly refluxed. The reactions were monitored by removal of aliquots at timed
intervals, with subsequent analysis via gas chromatography (GC) and gas chromatography/mass spectrometry
(GC/MS). The aliquots were taken before heating, once the mixture began to reflux, and every 5 minutes
thereafter until the reaction was complete. The progress of the reactions was monitored as a decrease of
phenylephrine and the formation of the end product. Various intermediates and byproducts were also monitored.
Gas Chromatography
Analyses were performed using an Agilent Technologies 6890N Gas Chromatograph equipped with electronic
pneumatic control and a flame ionization detector. A 10.0 m x 0.32 mm i.d. fused-silica capillary column coated
with 0.52 :m DB5 (Agilent Technologies) was employed. Hydrogen was used as the carrier gas, with an
Microgram Journal, Volume 3, Numbers 3-4 (July - December 2005) 143
Brought to you by AltGov2 [www.altgov2.org]
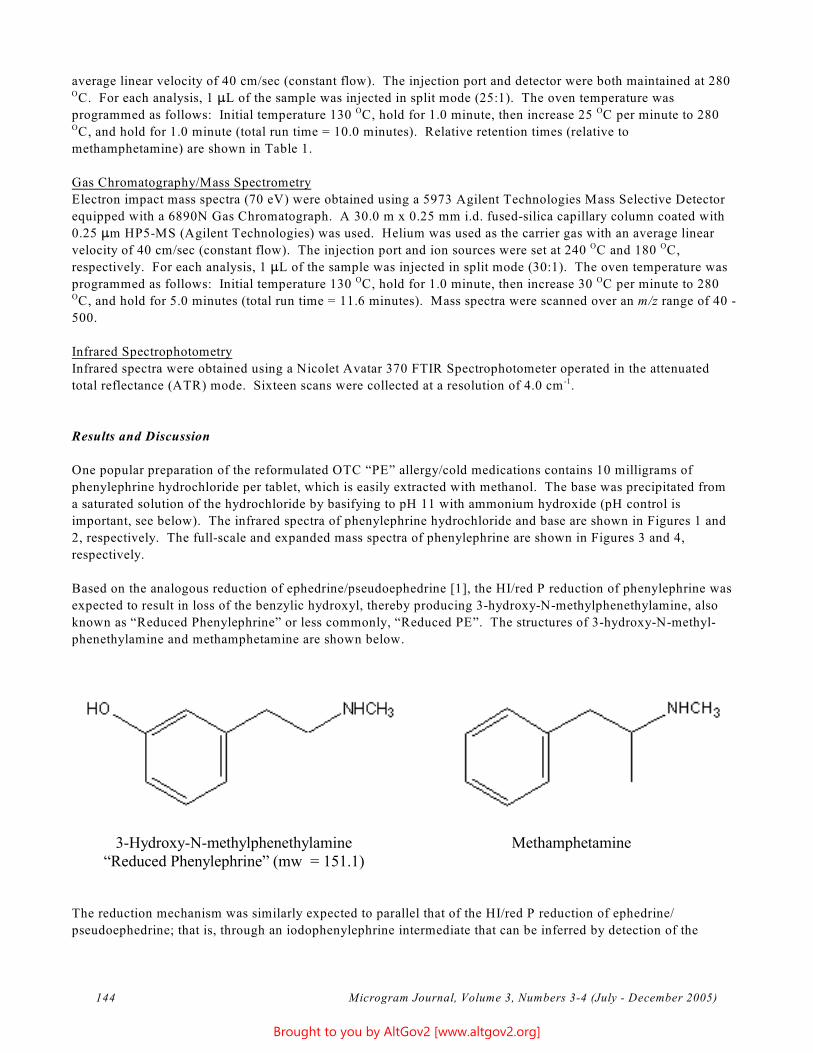
average linear velocity of 40 cm/sec (constant flow). The injection port and detector were both maintained at 280 OC. For each analysis, 1 :L of the sample was injected in split mode (25:1). The oven temperature was
Oprogrammed as follows: Initial temperature 130 OC, hold for 1.0 minute, then increase 25 C per minute to 280 OC, and hold for 1.0 minute (total run time = 10.0 minutes). Relative retention times (relative to
methamphetamine) are shown in Table 1.
Gas Chromatography/Mass Spectrometry
Electron impact mass spectra (70 eV) were obtained using a 5973 Agilent Technologies Mass Selective Detector
equipped with a 6890N Gas Chromatograph. A 30.0 m x 0.25 mm i.d. fused-silica capillary column coated with
0.25 :m HP5-MS (Agilent Technologies) was used. Helium was used as the carrier gas with an average linear Ovelocity of 40 cm/sec (constant flow). The injection port and ion sources were set at 240 OC and 180 C,
respectively. For each analysis, 1 :L of the sample was injected in split mode (30:1). The oven temperature was Oprogrammed as follows: Initial temperature 130 OC, hold for 1.0 minute, then increase 30 C per minute to 280
OC, and hold for 5.0 minutes (total run time = 11.6 minutes). Mass spectra were scanned over an m/z range of 40
500.
Infrared Spectrophotometry
Infrared spectra were obtained using a Nicolet Avatar 370 FTIR Spectrophotometer operated in the attenuated
total reflectance (ATR) mode. Sixteen scans were collected at a resolution of 4.0 cm-1.
Results and Discussion
One popular preparation of the reformulated OTC “PE” allergy/cold medications contains 10 milligrams of
phenylephrine hydrochloride per tablet, which is easily extracted with methanol. The base was precipitated from
a saturated solution of the hydrochloride by basifying to pH 11 with ammonium hydroxide (pH control is
important, see below). The infrared spectra of phenylephrine hydrochloride and base are shown in Figures 1 and
2, respectively. The full-scale and expanded mass spectra of phenylephrine are shown in Figures 3 and 4,
respectively.
Based on the analogous reduction of ephedrine/pseudoephedrine [1], the HI/red P reduction of phenylephrine was
expected to result in loss of the benzylic hydroxyl, thereby producing 3-hydroxy-N-methylphenethylamine, also
known as “Reduced Phenylephrine” or less commonly, “Reduced PE”. The structures of 3-hydroxy-N-methyl-
phenethylamine and methamphetamine are shown below.
3-Hydroxy-N-methylphenethylamine Methamphetamine “Reduced Phenylephrine” (mw = 151.1)
The reduction mechanism was similarly expected to parallel that of the HI/red P reduction of ephedrine/
pseudoephedrine; that is, through an iodophenylephrine intermediate that can be inferred by detection of the
Microgram Journal, Volume 3, Numbers 3-4 (July - December 2005) 144
Brought to you by AltGov2 [www.altgov2.org]
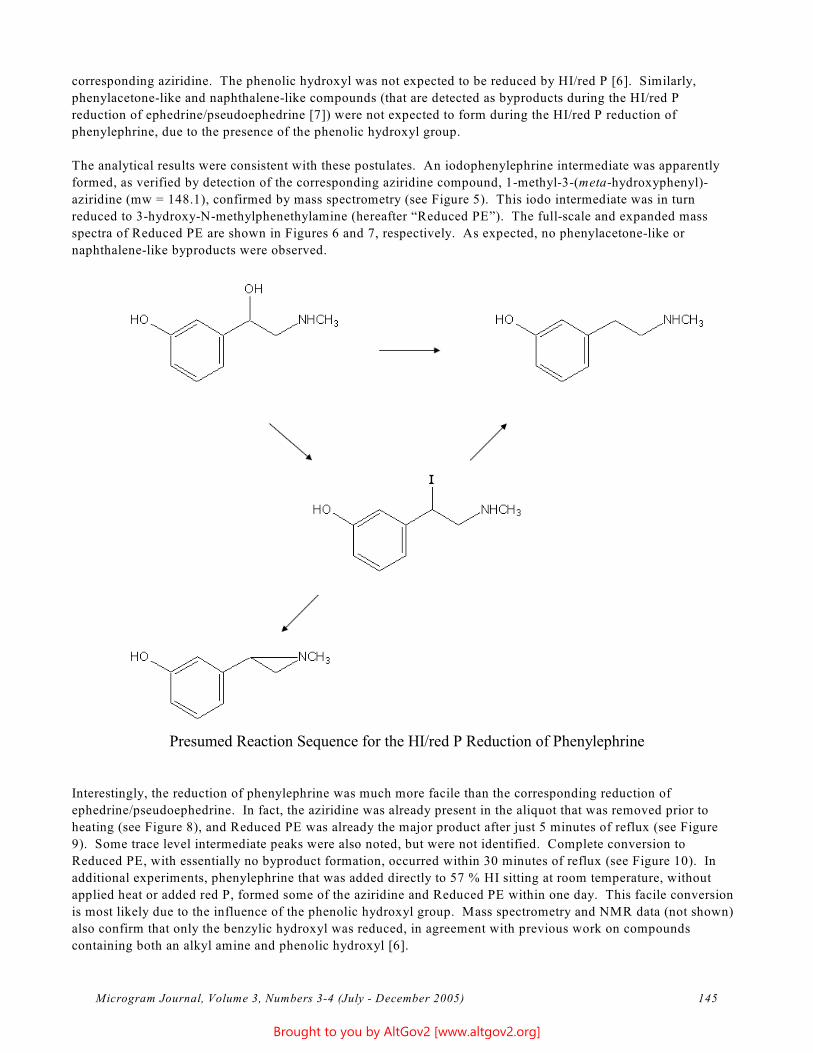
corresponding aziridine. The phenolic hydroxyl was not expected to be reduced by HI/red P [6]. Similarly,
phenylacetone-like and naphthalene-like compounds (that are detected as byproducts during the HI/red P
reduction of ephedrine/pseudoephedrine [7]) were not expected to form during the HI/red P reduction of
phenylephrine, due to the presence of the phenolic hydroxyl group.
The analytical results were consistent with these postulates. An iodophenylephrine intermediate was apparently
formed, as verified by detection of the corresponding aziridine compound, 1-methyl-3-(meta-hydroxyphenyl)-
aziridine (mw = 148.1), confirmed by mass spectrometry (see Figure 5). This iodo intermediate was in turn
reduced to 3-hydroxy-N-methylphenethylamine (hereafter “Reduced PE”). The full-scale and expanded mass
spectra of Reduced PE are shown in Figures 6 and 7, respectively. As expected, no phenylacetone-like or
naphthalene-like byproducts were observed.
Presumed Reaction Sequence for the HI/red P Reduction of Phenylephrine
Interestingly, the reduction of phenylephrine was much more facile than the corresponding reduction of
ephedrine/pseudoephedrine. In fact, the aziridine was already present in the aliquot that was removed prior to
heating (see Figure 8), and Reduced PE was already the major product after just 5 minutes of reflux (see Figure
9). Some trace level intermediate peaks were also noted, but were not identified. Complete conversion to
Reduced PE, with essentially no byproduct formation, occurred within 30 minutes of reflux (see Figure 10). In
additional experiments, phenylephrine that was added directly to 57 % HI sitting at room temperature, without
applied heat or added red P, formed some of the aziridine and Reduced PE within one day. This facile conversion
is most likely due to the influence of the phenolic hydroxyl group. Mass spectrometry and NMR data (not shown)
also confirm that only the benzylic hydroxyl was reduced, in agreement with previous work on compounds
containing both an alkyl amine and phenolic hydroxyl [6].
Microgram Journal, Volume 3, Numbers 3-4 (July - December 2005) 145
Brought to you by AltGov2 [www.altgov2.org]
The extraction process for Reduced PE was more challenging than the corresponding extraction of
methamphetamine. Because Reduced PE can form a phenolate salt, the extraction can only be accomplished in a
narrow pH range (expected to be between the pKa’s of methamphetamine hydrochloride and phenol; that is,
corresponding to about pH 11). To determine the optimal extraction pH, a series of test solutions were made,
each using a set amount of reaction mixture adjusted to different pH values via dropwise addition of ammonium
hydroxide. The resulting solutions were then extracted with a chloroform/isopropanol (2:1) mixture, and the
extracts analyzed by GC. As expected, as the pH in the respective test tubes approached pH 11 (as measured by
multi-range pH paper), the amount of Reduced PE in the extracts increased, but as the pH increased past pH 11,
the amount of Reduced PE in the extracts decreased.
The solvent system used for the above extractions was unusual. Reduced PE does not readily extract from a pH
11 solution into ether, hexane, or camping type fuel (extraction solvents that are typically used at clandestine
methamphetamine laboratories). It is thought that a zwitterion is formed between the phenolic hydroxyl and the
free amine. Since a zwitterion has salt-like characteristics, its solubility in water and polar solvents is enhanced.
The chloroform/isopropanol (2:1) mixture improves the partition coefficient of Reduced PE, allowing its
extraction from the aqueous solution. This solvent mixture has previously proven effective in extracting similar
zwitterionic substances form aqueous solutions, including morphine, psilocybin, and lysergic acid.
The infrared spectrum of Reduced PE base (as obtained by evaporation of the above chloroform/isoproanol (2:1)
extracts) is shown in Figure 11.
Conclusions
As the availability of ephedrine/pseudoephedrine-containing OTC products decrease, it is expected that some
chemically naïve clandestine laboratory operators will attempt to produce methamphetamine from substitute
phenylephrine-containing OTC products, thereby producing Reduced PE. It is in fact quite likely that such
substitutions have already been attempted; however, it is also quite likely that these syntheses failed due to the
loss of Reduced PE during the extraction procedures typically utilized in illicit methamphetamine production.
Similarly, some clandestine laboratory operators will attempt to produce methamphetamine from mixtures of
pseudoephedrine- and phenylephrine-containing OTC products, but these efforts will only result in lower apparent
yields of methamphetamine, again due to the loss of Reduced PE during extractions.
Furthermore, the reduction of phenylephrine-containing OTC products using the lithium/ammonia process (Birch
reduction) will likely be attempted, and will probably yield Reduced PE - though some other unknown product is
also possible (this will be addressed in future research). Regardless of the reduction technique, however, the use
of phenylephrine as a substitute for ephedrine/ pseudoephedrine in illicit methamphetamine production will
probably be short-lived, since Reduced PE is believed to have no significant CNS stimulant effects [8], and
clandestine laboratory operators will quickly become educated about phenylephrine through drug abuse websites,
bulletin boards, and chat-rooms on the Internet, consumer complaints, and discussions with fellow laboratory
operators. Nonetheless, it is necessary for forensic analysts to be able to identify these products, and understand
their sources.
References
1. Skinner HF. Methamphetamine synthesis via hydriodic acid/red phosphorus reduction of ephedrine.
Forensic Science International 1990;48:123.
2. The Chemical Diversion and Trafficking Act of 1988. Anti-Drug Abuse Amendments Act of 1988,
Subtitle A.
Microgram Journal, Volume 3, Numbers 3-4 (July - December 2005) 146
Brought to you by AltGov2 [www.altgov2.org]
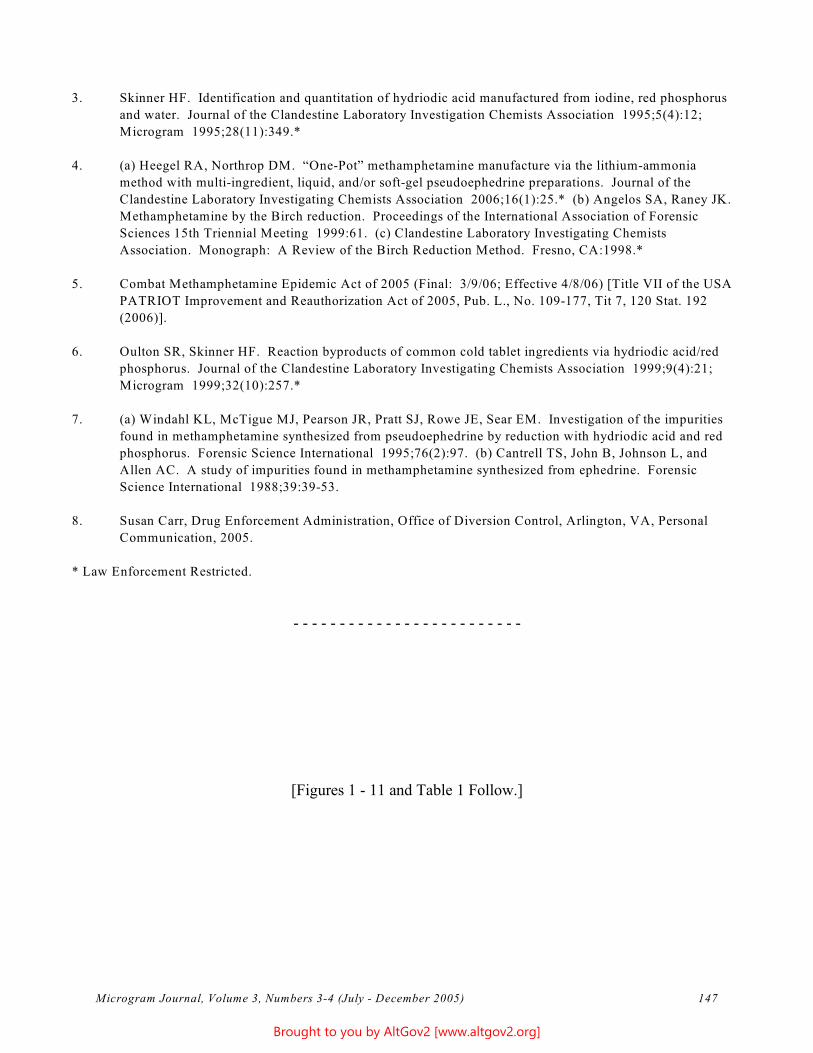
- - - - - - - - - - - - - - - - - - - - - - - - -
3. Skinner HF. Identification and quantitation of hydriodic acid manufactured from iodine, red phosphorus
and water. Journal of the Clandestine Laboratory Investigation Chemists Association 1995;5(4):12;
Microgram 1995;28(11):349.*
4. (a) Heegel RA, Northrop DM. “One-Pot” methamphetamine manufacture via the lithium-ammonia
method with multi-ingredient, liquid, and/or soft-gel pseudoephedrine preparations. Journal of the
Clandestine Laboratory Investigating Chemists Association 2006;16(1):25.* (b) Angelos SA, Raney JK.
Methamphetamine by the Birch reduction. Proceedings of the International Association of Forensic
Sciences 15th Triennial Meeting 1999:61. (c) Clandestine Laboratory Investigating Chemists
Association. Monograph: A Review of the Birch Reduction Method. Fresno, CA:1998.*
5. Combat Methamphetamine Epidemic Act of 2005 (Final: 3/9/06; Effective 4/8/06) [Title VII of the USA
PATRIOT Improvement and Reauthorization Act of 2005, Pub. L., No. 109-177, Tit 7, 120 Stat. 192
(2006)].
6. Oulton SR, Skinner HF. Reaction byproducts of common cold tablet ingredients via hydriodic acid/red
phosphorus. Journal of the Clandestine Laboratory Investigating Chemists Association 1999;9(4):21;
Microgram 1999;32(10):257.*
7. (a) Windahl KL, McTigue MJ, Pearson JR, Pratt SJ, Rowe JE, Sear EM. Investigation of the impurities
found in methamphetamine synthesized from pseudoephedrine by reduction with hydriodic acid and red
phosphorus. Forensic Science International 1995;76(2):97. (b) Cantrell TS, John B, Johnson L, and
Allen AC. A study of impurities found in methamphetamine synthesized from ephedrine. Forensic
Science International 1988;39:39-53.
8. Susan Carr, Drug Enforcement Administration, Office of Diversion Control, Arlington, VA, Personal
Communication, 2005.
* Law Enforcement Restricted.
[Figures 1 - 11 and Table 1 Follow.]
Microgram Journal, Volume 3, Numbers 3-4 (July - December 2005) 147
Brought to you by AltGov2 [www.altgov2.org]
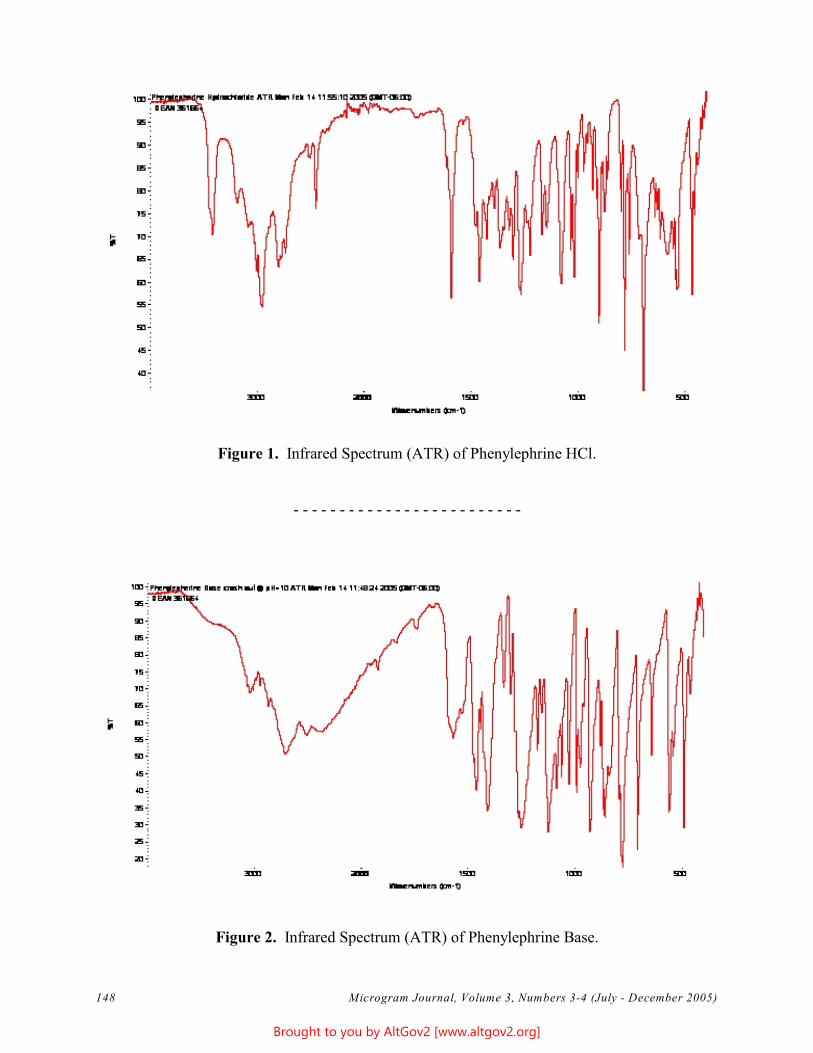
- - - - - - - - - - - - - - - - - - - - - - - - -
Figure 1. Infrared Spectrum (ATR) of Phenylephrine HCl.
Figure 2. Infrared Spectrum (ATR) of Phenylephrine Base.
Microgram Journal, Volume 3, Numbers 3-4 (July - December 2005) 148
Brought to you by AltGov2 [www.altgov2.org]
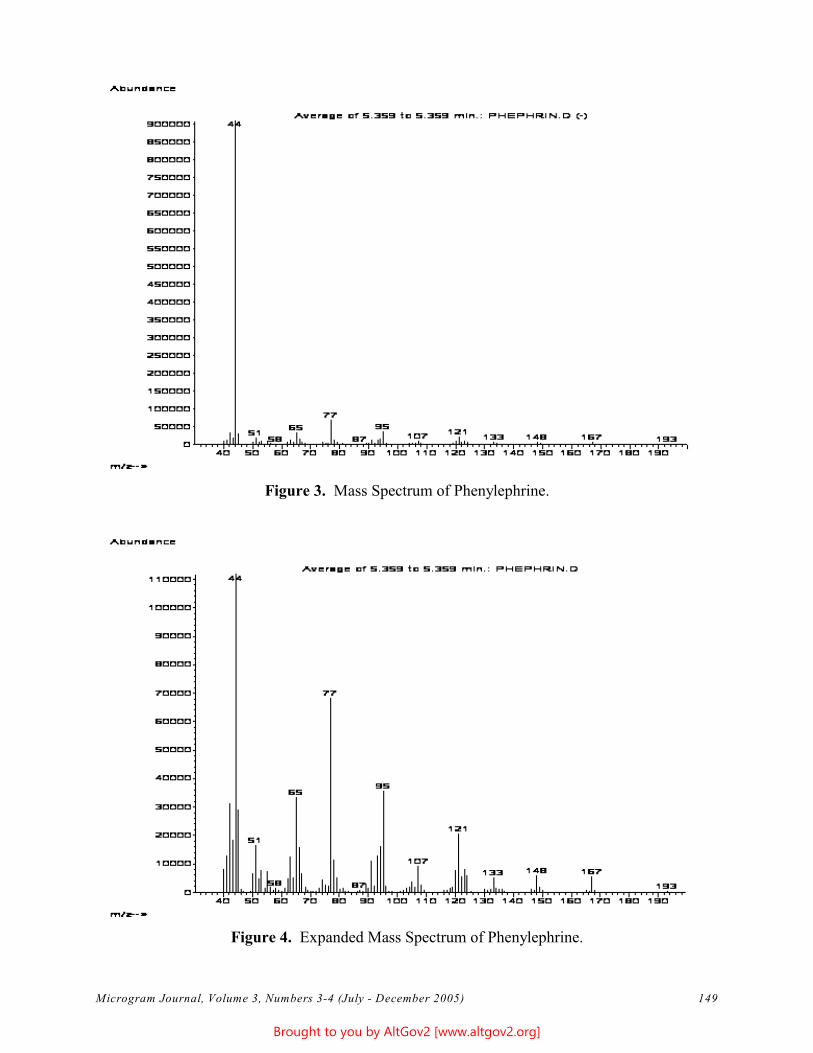
Figure 3. Mass Spectrum of Phenylephrine.
Figure 4. Expanded Mass Spectrum of Phenylephrine.
Microgram Journal, Volume 3, Numbers 3-4 (July - December 2005) 149
Brought to you by AltGov2 [www.altgov2.org]
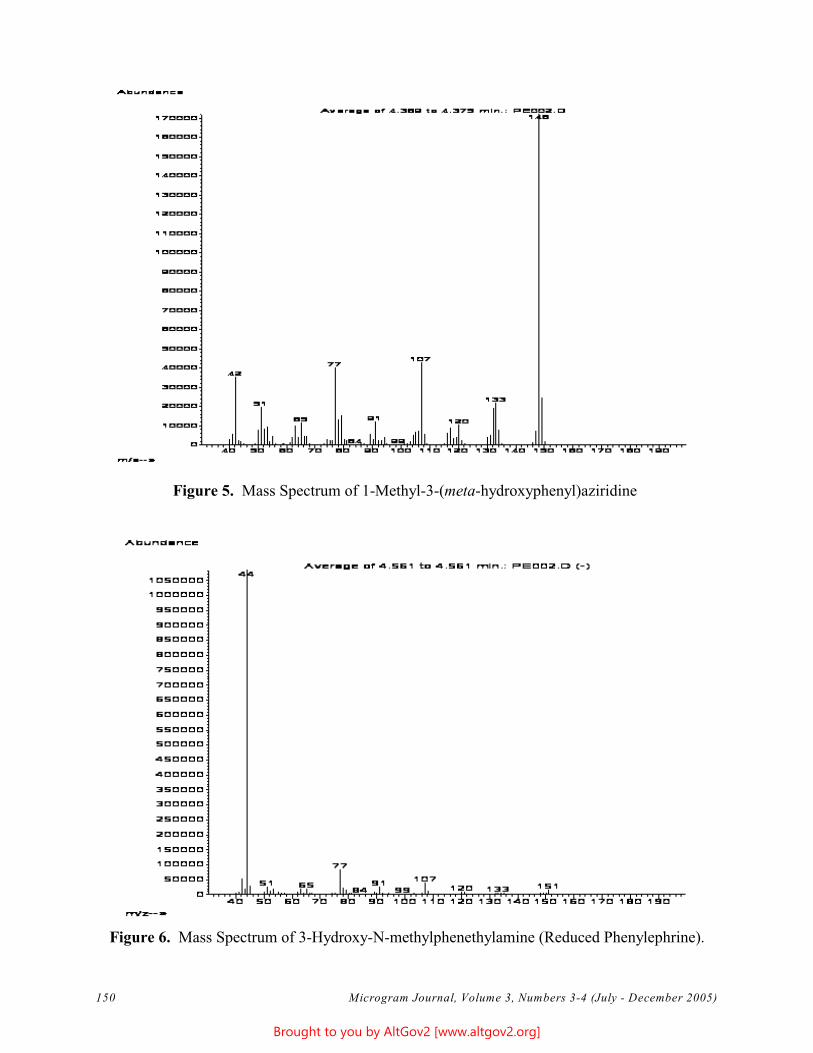
Figure 5. Mass Spectrum of 1-Methyl-3-(meta-hydroxyphenyl)aziridine
Figure 6. Mass Spectrum of 3-Hydroxy-N-methylphenethylamine (Reduced Phenylephrine).
Microgram Journal, Volume 3, Numbers 3-4 (July - December 2005) 150
Brought to you by AltGov2 [www.altgov2.org]
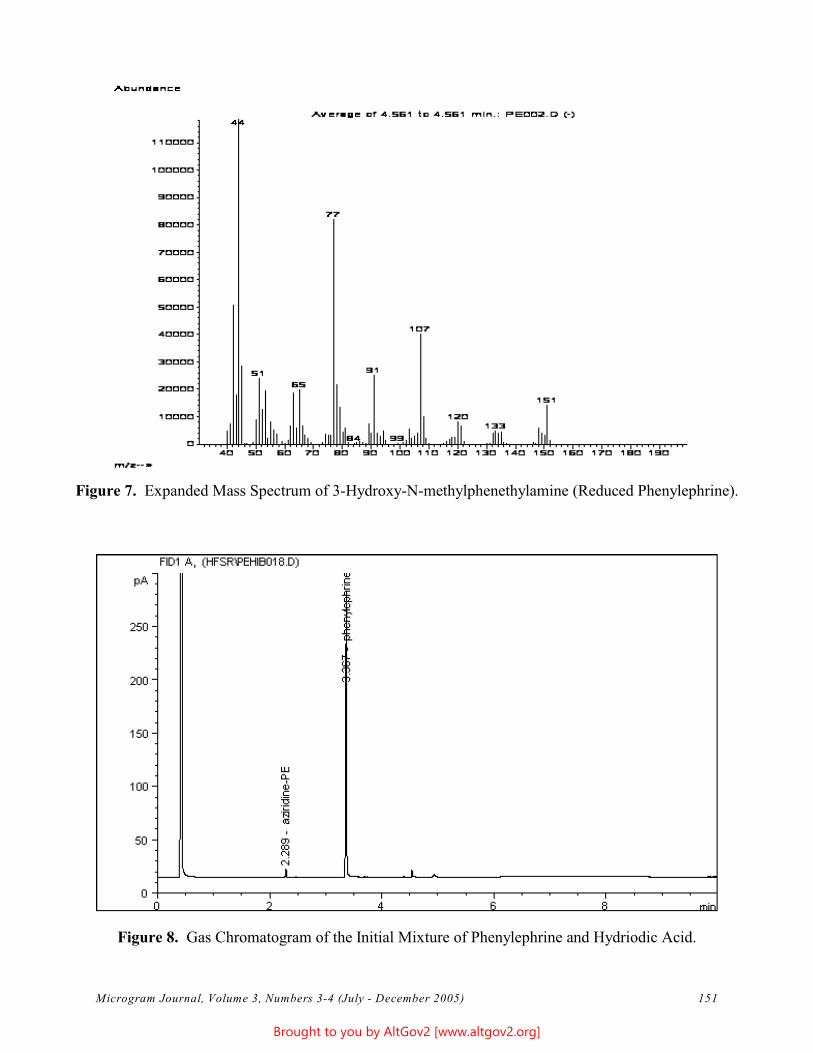
Figure 7. Expanded Mass Spectrum of 3-Hydroxy-N-methylphenethylamine (Reduced Phenylephrine).
Figure 8. Gas Chromatogram of the Initial Mixture of Phenylephrine and Hydriodic Acid.
Microgram Journal, Volume 3, Numbers 3-4 (July - December 2005) 151
Brought to you by AltGov2 [www.altgov2.org]
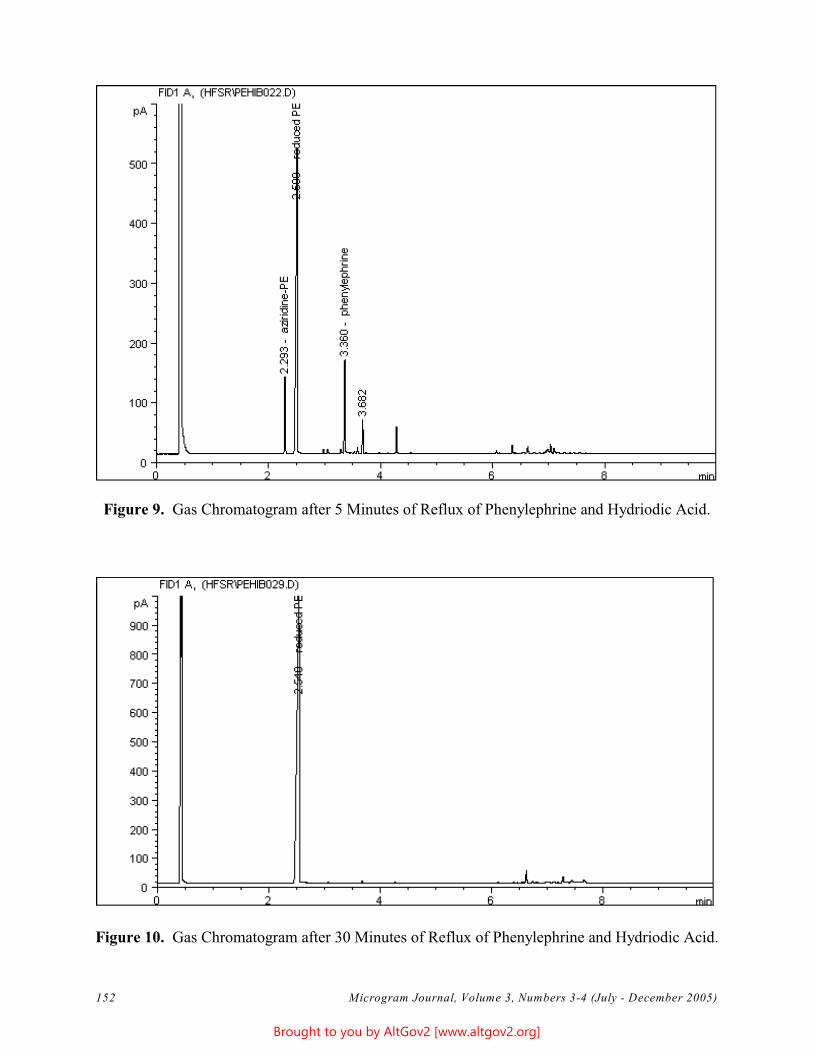
Figure 9. Gas Chromatogram after 5 Minutes of Reflux of Phenylephrine and Hydriodic Acid.
Figure 10. Gas Chromatogram after 30 Minutes of Reflux of Phenylephrine and Hydriodic Acid.
Microgram Journal, Volume 3, Numbers 3-4 (July - December 2005) 152
Brought to you by AltGov2 [www.altgov2.org]
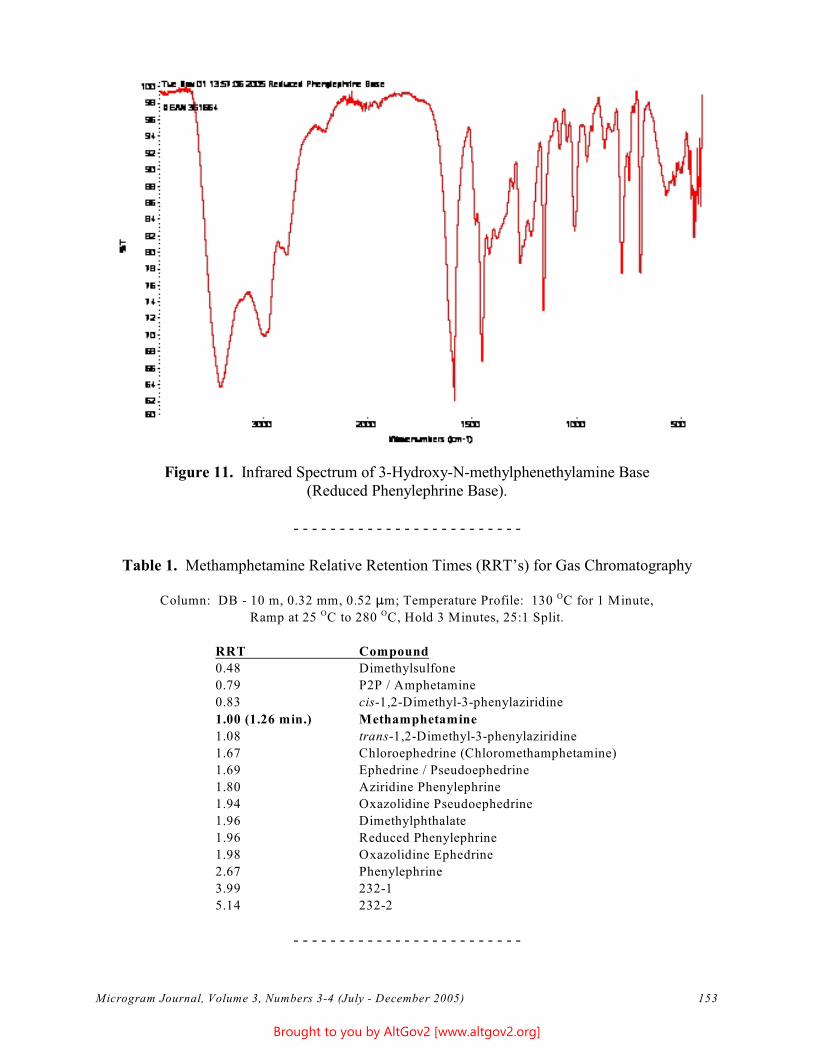
- - - - - - - - - - - - - - - - - - - - - - - - -
- - - - - - - - - - - - - - - - - - - - - - - - -
Figure 11. Infrared Spectrum of 3-Hydroxy-N-methylphenethylamine Base (Reduced Phenylephrine Base).
Table 1. Methamphetamine Relative Retention Times (RRT’s) for Gas Chromatography
Column: DB - 10 m, 0.32 mm, 0.52 :m; Temperature Profile: 130 OC for 1 Minute, ORamp at 25 OC to 280 C, Hold 3 Minutes, 25:1 Split.
RRT Compound
0.48 Dimethylsulfone
0.79 P2P / Amphetamine
0.83 cis-1,2-Dimethyl-3-phenylaziridine
1.00 (1.26 min.) Methamphetamine
1.08 trans-1,2-Dimethyl-3-phenylaziridine
1.67 Chloroephedrine (Chloromethamphetamine)
1.69 Ephedrine / Pseudoephedrine
1.80 Aziridine Phenylephrine
1.94 Oxazolidine Pseudoephedrine
1.96 Dimethylphthalate
1.96 Reduced Phenylephrine
1.98 Oxazolidine Ephedrine
2.67 Phenylephrine
3.99 232-1
5.14 232-2
Microgram Journal, Volume 3, Numbers 3-4 (July - December 2005) 153
Brought to you by AltGov2 [www.altgov2.org]
Synthesis of trans-4-Methylaminorex from
Norephedrine and Potassium Cyanate
Walter R. Rodriguez,* M.S. and Russell A. Allred, Ph.D. U.S. Department of Justice
Drug Enforcement Administration Southeast Laboratory
5205 NW 84th Avenue Miami, FL 33166
[email: walter.r.rodriguez -at- usdoj.gov]
ABSTRACT: An unusual and previously undocumented synthesis for trans-4-methylaminorex was determined
to be in use at a clandestine laboratory. Conventional references unanimously describe the use of norephedrine
(phenylpropanolamine, 2-amino-1-phenylpropan-1-ol) and cyanogen bromide to synthesize cis-4-methyl-
aminorex. In this case, use of norephedrine and potassium cyanate gave predominantly trans-4-methylaminorex.
This new synthesis is explored, and its intermediates and byproducts are characterized.
KEYWORDS: 4-Methylaminorex, Oxazoline, Norephedrine, Phenylpropanolamine, Potassium Cyanate,
Diastereomers, Clandestine Laboratory, Controlled Substance Analogue, Isomer, Forensic Chemistry
Introduction
In December 2004, a clandestine laboratory raid was conducted at a private residence in Ft. Lauderdale, Florida.
The operator was an educated chemist (degree in Chemical Engineering). In his post-Miranda statements, he
indicated that he had been synthesizing “Euphoria” (4-Methylaminorex, also known as: U4Euh, Ice*, 4-MAR,
Intellex) in his home since June 2004, and stated that he was capable of producing batches as large as 1 kilogram.
He also admitted to manufacturing lesser quantities of amphetamine, methamphetamine, and 3,4-methylene-
dioxymethamphetamine. The chemicals and materials seized at the site supported his claims.
Of particular interest was 20 kilograms of a white powder alleged to be potassium cyanate (later confirmed to be a
cyanate salt (cation not identified)). This compound had never been previously reported as a primary reagent at a
clandestine laboratory. By the cook’s account, he followed an internet recipe for synthesis of trans-4-methyl-
aminorex from norephedrine and potassium cyanate.
This statement was surprising in that exhaustive literature searches indicated that the only reported syntheses
starting with norephedrine used cyanogen bromide (not potassium cyanate) and produced cis (not trans)
4-methylaminorex [1]. The internet recipe (which had been posted on a website dedicated to drug abuse) was
derived from the work of Fodor and Koczka [2], who investigated the stereochemistry of the conversion of
2-ureidoalcohols to oxazolidines. Included were the conversions of ephedrine and pseudoephedrine to the
corresponding 2-ureidoalcohols, followed by their cyclization to their corresponding oxazolidines. Extrapolating
from these results, the internet author theorized that the same reaction sequence could be applied to norephedrine,
resulting in trans-4-methylaminorex [3] (Figure 1).
Klein et al. reported that the cyanogen bromide method is stereoselective and proceeds with retention of
configuration at the benzylic carbon (C-1) of norephedrine [4]. Thus, norephedrine produces cis-4-methyl-
[* In the late 1980's and early 1990's, “Ice” was a street name for 4-methylaminorex. Since then, however, it has
shifted to a street name for high purity methamphetamine hydrochloride in large crystal form.]
Microgram Journal, Volume 3, Numbers 3-4 (July - December 2005) 154
Brought to you by AltGov2 [www.altgov2.org]
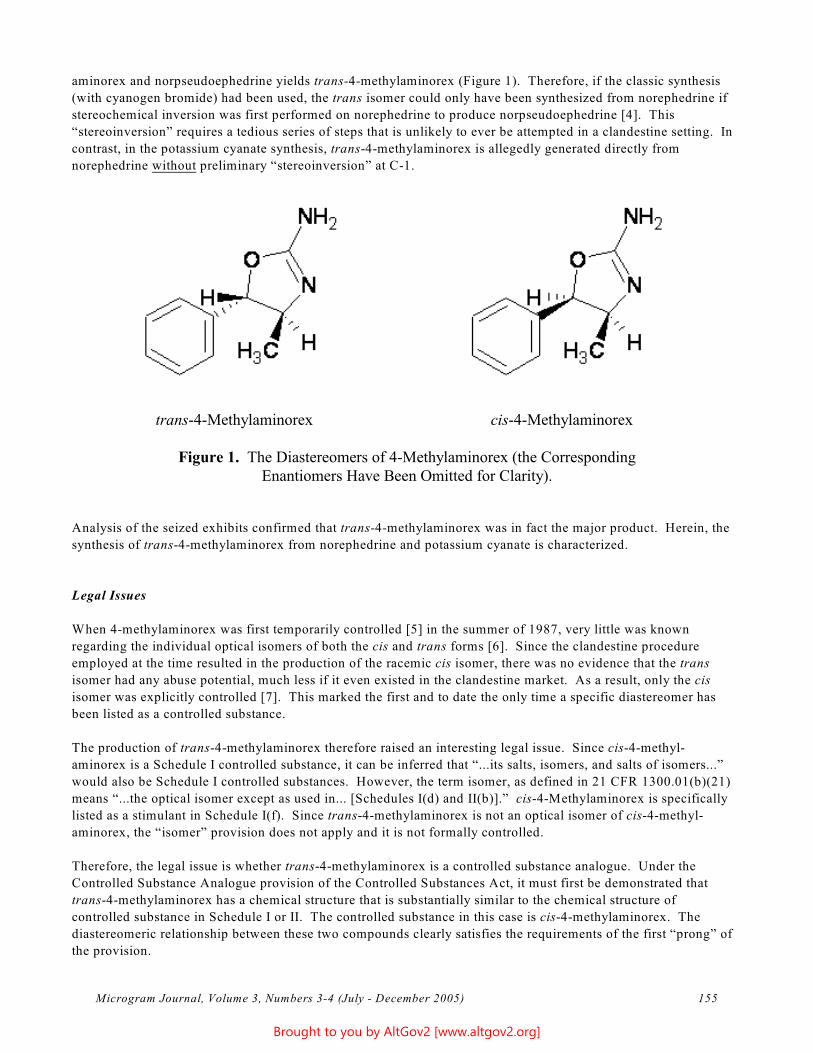
aminorex and norpseudoephedrine yields trans-4-methylaminorex (Figure 1). Therefore, if the classic synthesis
(with cyanogen bromide) had been used, the trans isomer could only have been synthesized from norephedrine if
stereochemical inversion was first performed on norephedrine to produce norpseudoephedrine [4]. This
“stereoinversion” requires a tedious series of steps that is unlikely to ever be attempted in a clandestine setting. In
contrast, in the potassium cyanate synthesis, trans-4-methylaminorex is allegedly generated directly from
norephedrine without preliminary “stereoinversion” at C-1.
trans-4-Methylaminorex cis-4-Methylaminorex
Figure 1. The Diastereomers of 4-Methylaminorex (the Corresponding Enantiomers Have Been Omitted for Clarity).
Analysis of the seized exhibits confirmed that trans-4-methylaminorex was in fact the major product. Herein, the
synthesis of trans-4-methylaminorex from norephedrine and potassium cyanate is characterized.
Legal Issues
When 4-methylaminorex was first temporarily controlled [5] in the summer of 1987, very little was known
regarding the individual optical isomers of both the cis and trans forms [6]. Since the clandestine procedure
employed at the time resulted in the production of the racemic cis isomer, there was no evidence that the trans
isomer had any abuse potential, much less if it even existed in the clandestine market. As a result, only the cis
isomer was explicitly controlled [7]. This marked the first and to date the only time a specific diastereomer has
been listed as a controlled substance.
The production of trans-4-methylaminorex therefore raised an interesting legal issue. Since cis-4-methyl-
aminorex is a Schedule I controlled substance, it can be inferred that “...its salts, isomers, and salts of isomers...”
would also be Schedule I controlled substances. However, the term isomer, as defined in 21 CFR 1300.01(b)(21)
means “...the optical isomer except as used in... [Schedules I(d) and II(b)].” cis-4-Methylaminorex is specifically
listed as a stimulant in Schedule I(f). Since trans-4-methylaminorex is not an optical isomer of cis-4-methyl-
aminorex, the “isomer” provision does not apply and it is not formally controlled.
Therefore, the legal issue is whether trans-4-methylaminorex is a controlled substance analogue. Under the
Controlled Substance Analogue provision of the Controlled Substances Act, it must first be demonstrated that
trans-4-methylaminorex has a chemical structure that is substantially similar to the chemical structure of
controlled substance in Schedule I or II. The controlled substance in this case is cis-4-methylaminorex. The
diastereomeric relationship between these two compounds clearly satisfies the requirements of the first “prong” of
the provision.
Microgram Journal, Volume 3, Numbers 3-4 (July - December 2005) 155
Brought to you by AltGov2 [www.altgov2.org]
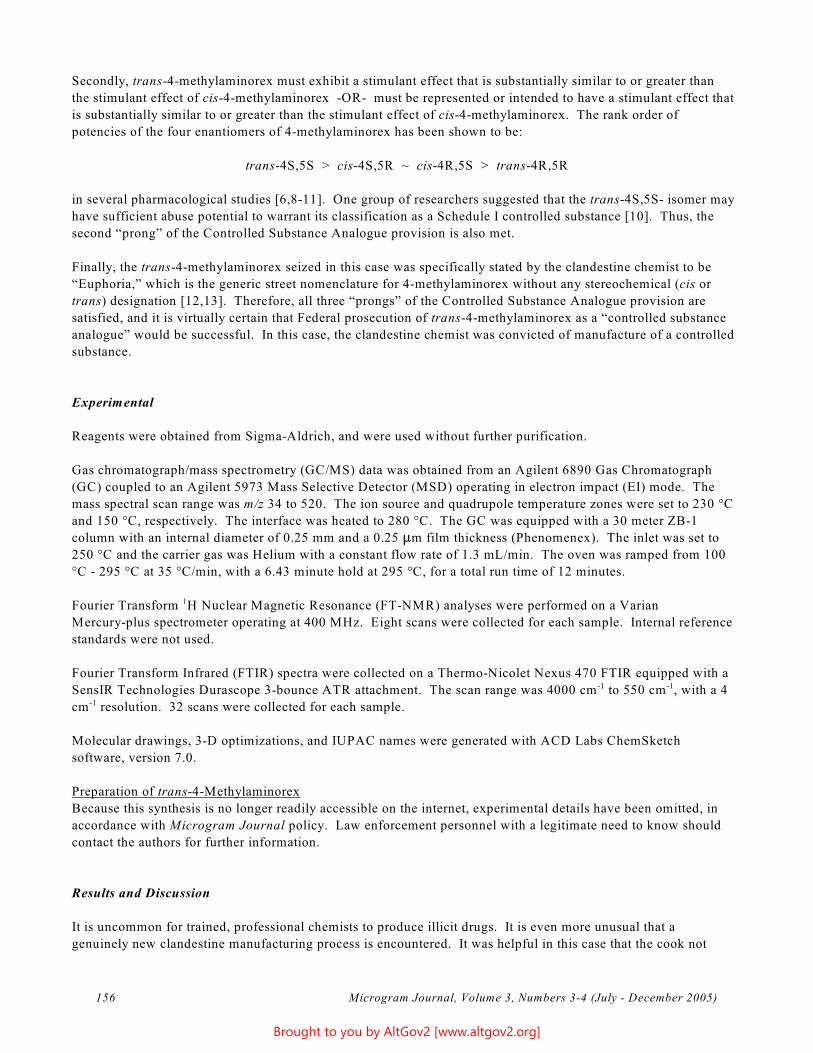
-1
Secondly, trans-4-methylaminorex must exhibit a stimulant effect that is substantially similar to or greater than
the stimulant effect of cis-4-methylaminorex -OR- must be represented or intended to have a stimulant effect that
is substantially similar to or greater than the stimulant effect of cis-4-methylaminorex. The rank order of
potencies of the four enantiomers of 4-methylaminorex has been shown to be:
trans-4S,5S > cis-4S,5R ~ cis-4R,5S > trans-4R,5R
in several pharmacological studies [6,8-11]. One group of researchers suggested that the trans-4S,5S- isomer may
have sufficient abuse potential to warrant its classification as a Schedule I controlled substance [10]. Thus, the
second “prong” of the Controlled Substance Analogue provision is also met.
Finally, the trans-4-methylaminorex seized in this case was specifically stated by the clandestine chemist to be
“Euphoria,” which is the generic street nomenclature for 4-methylaminorex without any stereochemical (cis or
trans) designation [12,13]. Therefore, all three “prongs” of the Controlled Substance Analogue provision are
satisfied, and it is virtually certain that Federal prosecution of trans-4-methylaminorex as a “controlled substance
analogue” would be successful. In this case, the clandestine chemist was convicted of manufacture of a controlled
substance.
Experimental
Reagents were obtained from Sigma-Aldrich, and were used without further purification.
Gas chromatograph/mass spectrometry (GC/MS) data was obtained from an Agilent 6890 Gas Chromatograph
(GC) coupled to an Agilent 5973 Mass Selective Detector (MSD) operating in electron impact (EI) mode. The
mass spectral scan range was m/z 34 to 520. The ion source and quadrupole temperature zones were set to 230 °C
and 150 °C, respectively. The interface was heated to 280 °C. The GC was equipped with a 30 meter ZB-1
column with an internal diameter of 0.25 mm and a 0.25 :m film thickness (Phenomenex). The inlet was set to
250 °C and the carrier gas was Helium with a constant flow rate of 1.3 mL/min. The oven was ramped from 100
°C - 295 °C at 35 °C/min, with a 6.43 minute hold at 295 °C, for a total run time of 12 minutes.
Fourier Transform 1H Nuclear Magnetic Resonance (FT-NMR) analyses were performed on a Varian
Mercury-plus spectrometer operating at 400 MHz. Eight scans were collected for each sample. Internal reference
standards were not used.
Fourier Transform Infrared (FTIR) spectra were collected on a Thermo-Nicolet Nexus 470 FTIR equipped with a -1SensIR Technologies Durascope 3-bounce ATR attachment. The scan range was 4000 cm-1 to 550 cm , with a 4
cm resolution. 32 scans were collected for each sample.
Molecular drawings, 3-D optimizations, and IUPAC names were generated with ACD Labs ChemSketch
software, version 7.0.
Preparation of trans-4-Methylaminorex
Because this synthesis is no longer readily accessible on the internet, experimental details have been omitted, in
accordance with Microgram Journal policy. Law enforcement personnel with a legitimate need to know should
contact the authors for further information.
Results and Discussion
It is uncommon for trained, professional chemists to produce illicit drugs. It is even more unusual that a
genuinely new clandestine manufacturing process is encountered. It was helpful in this case that the cook not
Microgram Journal, Volume 3, Numbers 3-4 (July - December 2005) 156
Brought to you by AltGov2 [www.altgov2.org]
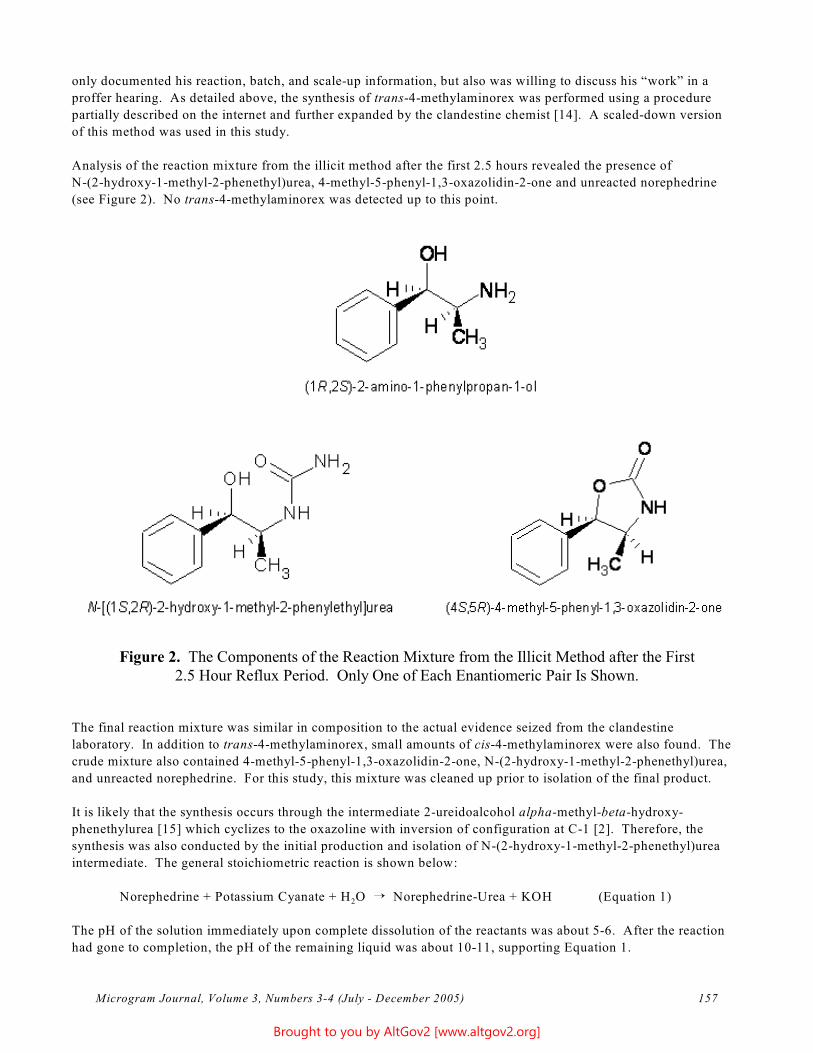
only documented his reaction, batch, and scale-up information, but also was willing to discuss his “work” in a
proffer hearing. As detailed above, the synthesis of trans-4-methylaminorex was performed using a procedure
partially described on the internet and further expanded by the clandestine chemist [14]. A scaled-down version
of this method was used in this study.
Analysis of the reaction mixture from the illicit method after the first 2.5 hours revealed the presence of
N-(2-hydroxy-1-methyl-2-phenethyl)urea, 4-methyl-5-phenyl-1,3-oxazolidin-2-one and unreacted norephedrine
(see Figure 2). No trans-4-methylaminorex was detected up to this point.
Figure 2. The Components of the Reaction Mixture from the Illicit Method after the First 2.5 Hour Reflux Period. Only One of Each Enantiomeric Pair Is Shown.
The final reaction mixture was similar in composition to the actual evidence seized from the clandestine
laboratory. In addition to trans-4-methylaminorex, small amounts of cis-4-methylaminorex were also found. The
crude mixture also contained 4-methyl-5-phenyl-1,3-oxazolidin-2-one, N-(2-hydroxy-1-methyl-2-phenethyl)urea,
and unreacted norephedrine. For this study, this mixture was cleaned up prior to isolation of the final product.
It is likely that the synthesis occurs through the intermediate 2-ureidoalcohol alpha-methyl-beta-hydroxy-
phenethylurea [15] which cyclizes to the oxazoline with inversion of configuration at C-1 [2]. Therefore, the
synthesis was also conducted by the initial production and isolation of N-(2-hydroxy-1-methyl-2-phenethyl)urea
intermediate. The general stoichiometric reaction is shown below:
Norephedrine + Potassium Cyanate + H O ÷ Norephedrine-Urea + KOH (Equation 1) 2
The pH of the solution immediately upon complete dissolution of the reactants was about 5-6. After the reaction
had gone to completion, the pH of the remaining liquid was about 10-11, supporting Equation 1.
Microgram Journal, Volume 3, Numbers 3-4 (July - December 2005) 157
Brought to you by AltGov2 [www.altgov2.org]
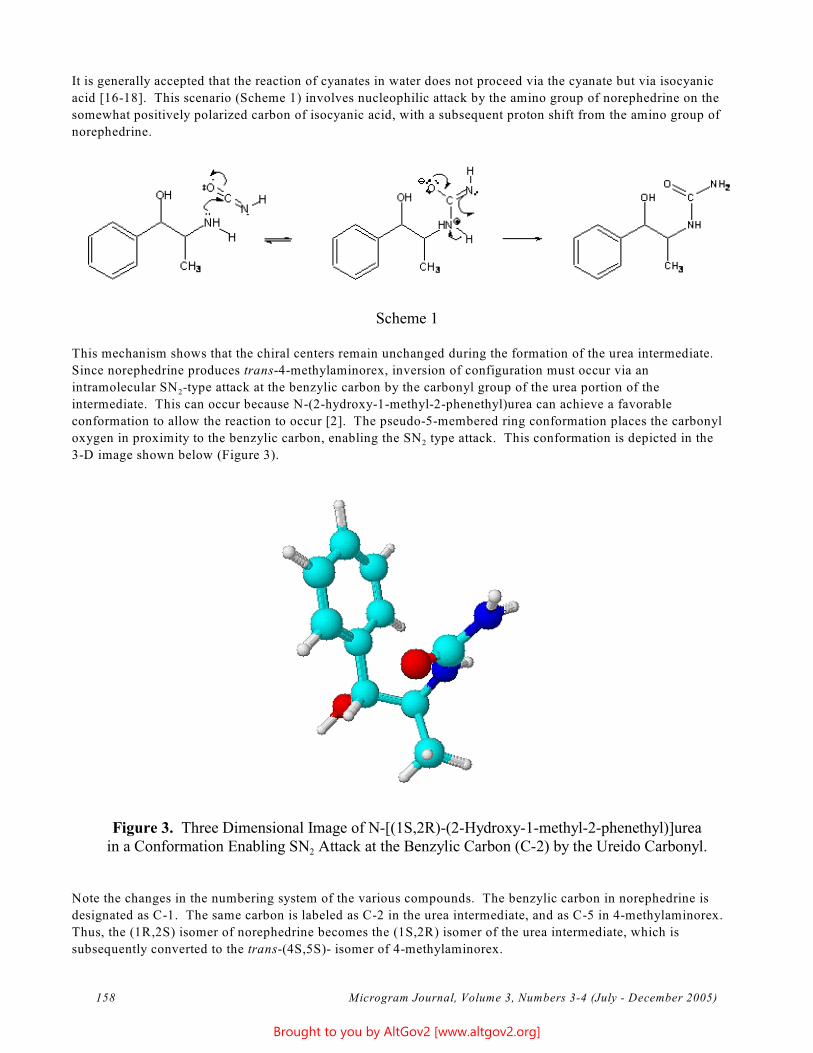
It is generally accepted that the reaction of cyanates in water does not proceed via the cyanate but via isocyanic
acid [16-18]. This scenario (Scheme 1) involves nucleophilic attack by the amino group of norephedrine on the
somewhat positively polarized carbon of isocyanic acid, with a subsequent proton shift from the amino group of
norephedrine.
Scheme 1
This mechanism shows that the chiral centers remain unchanged during the formation of the urea intermediate.
Since norephedrine produces trans-4-methylaminorex, inversion of configuration must occur via an
intramolecular SN2-type attack at the benzylic carbon by the carbonyl group of the urea portion of the
intermediate. This can occur because N-(2-hydroxy-1-methyl-2-phenethyl)urea can achieve a favorable
conformation to allow the reaction to occur [2]. The pseudo-5-membered ring conformation places the carbonyl
oxygen in proximity to the benzylic carbon, enabling the SN2 type attack. This conformation is depicted in the
3-D image shown below (Figure 3).
Figure 3. Three Dimensional Image of N-[(1S,2R)-(2-Hydroxy-1-methyl-2-phenethyl)]urea in a Conformation Enabling SN Attack at the Benzylic Carbon (C-2) by the Ureido Carbonyl. 2
Note the changes in the numbering system of the various compounds. The benzylic carbon in norephedrine is
designated as C-1. The same carbon is labeled as C-2 in the urea intermediate, and as C-5 in 4-methylaminorex.
Thus, the (1R,2S) isomer of norephedrine becomes the (1S,2R) isomer of the urea intermediate, which is
subsequently converted to the trans-(4S,5S)- isomer of 4-methylaminorex.
158 Microgram Journal, Volume 3, Numbers 3-4 (July - December 2005)
Brought to you by AltGov2 [www.altgov2.org]
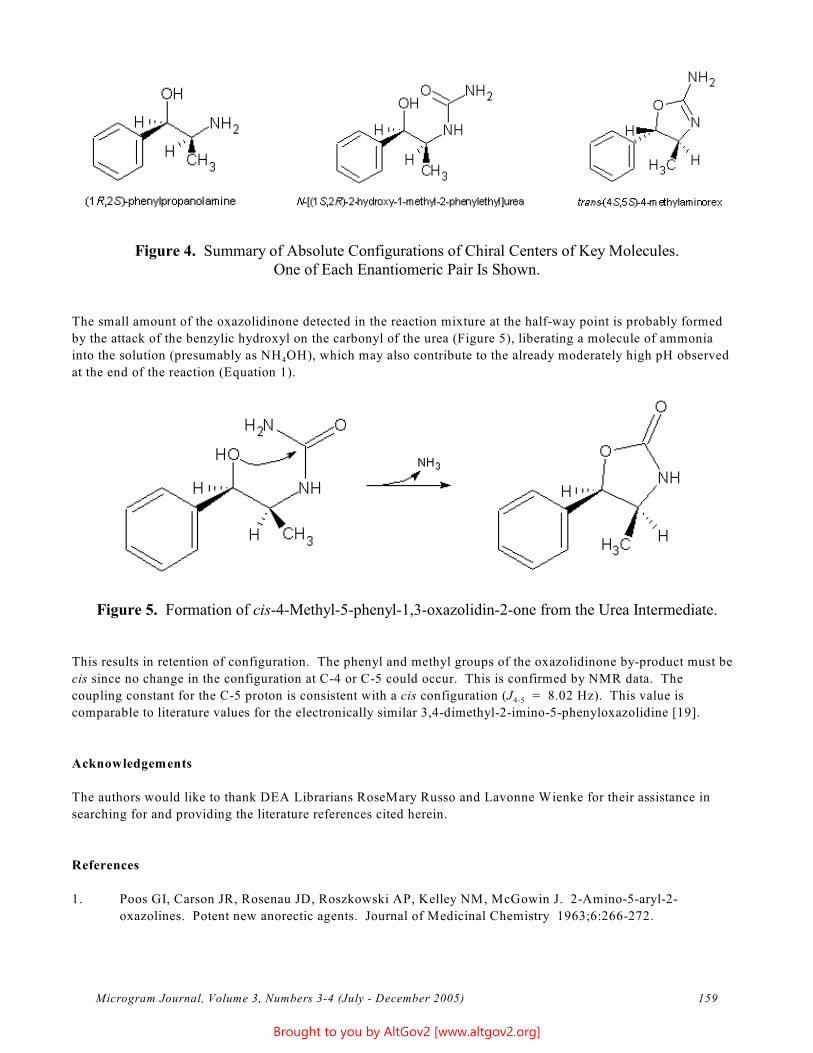
Figure 4. Summary of Absolute Configurations of Chiral Centers of Key Molecules. One of Each Enantiomeric Pair Is Shown.
The small amount of the oxazolidinone detected in the reaction mixture at the half-way point is probably formed
by the attack of the benzylic hydroxyl on the carbonyl of the urea (Figure 5), liberating a molecule of ammonia
into the solution (presumably as NH OH), which may also contribute to the already moderately high pH observed 4
at the end of the reaction (Equation 1).
Figure 5. Formation of cis-4-Methyl-5-phenyl-1,3-oxazolidin-2-one from the Urea Intermediate.
This results in retention of configuration. The phenyl and methyl groups of the oxazolidinone by-product must be
cis since no change in the configuration at C-4 or C-5 could occur. This is confirmed by NMR data. The
coupling constant for the C-5 proton is consistent with a cis configuration (J = 8.02 Hz). This value is 4-5
comparable to literature values for the electronically similar 3,4-dimethyl-2-imino-5-phenyloxazolidine [19].
Acknowledgements
The authors would like to thank DEA Librarians RoseMary Russo and Lavonne Wienke for their assistance in
searching for and providing the literature references cited herein.
References
1. Poos GI, Carson JR, Rosenau JD, Roszkowski AP, Kelley NM, McGowin J. 2-Amino-5-aryl-2-
oxazolines. Potent new anorectic agents. Journal of Medicinal Chemistry 1963;6:266-272.
Microgram Journal, Volume 3, Numbers 3-4 (July - December 2005) 159
Brought to you by AltGov2 [www.altgov2.org]
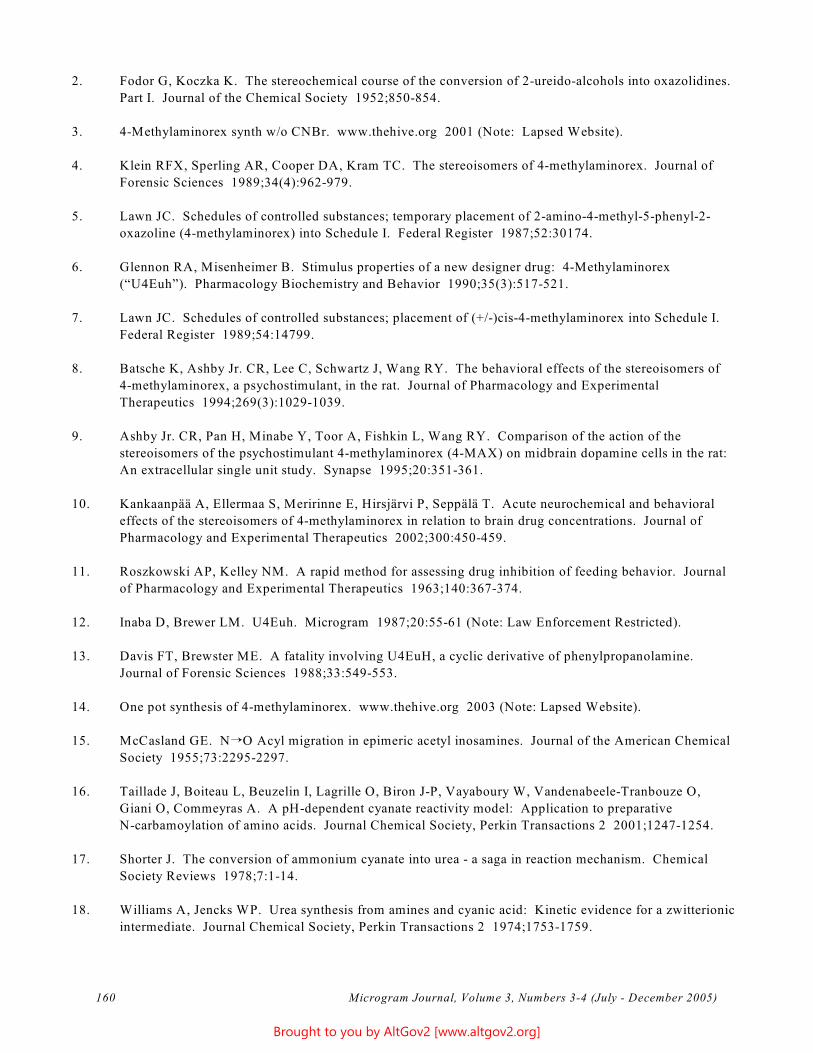
2. Fodor G, Koczka K. The stereochemical course of the conversion of 2-ureido-alcohols into oxazolidines.
Part I. Journal of the Chemical Society 1952;850-854.
3. 4-Methylaminorex synth w/o CNBr. www.thehive.org 2001 (Note: Lapsed Website).
4. Klein RFX, Sperling AR, Cooper DA, Kram TC. The stereoisomers of 4-methylaminorex. Journal of
Forensic Sciences 1989;34(4):962-979.
5. Lawn JC. Schedules of controlled substances; temporary placement of 2-amino-4-methyl-5-phenyl-2-
oxazoline (4-methylaminorex) into Schedule I. Federal Register 1987;52:30174.
6. Glennon RA, Misenheimer B. Stimulus properties of a new designer drug: 4-Methylaminorex
(“U4Euh”). Pharmacology Biochemistry and Behavior 1990;35(3):517-521.
7. Lawn JC. Schedules of controlled substances; placement of (+/-)cis-4-methylaminorex into Schedule I.
Federal Register 1989;54:14799.
8. Batsche K, Ashby Jr. CR, Lee C, Schwartz J, Wang RY. The behavioral effects of the stereoisomers of
4-methylaminorex, a psychostimulant, in the rat. Journal of Pharmacology and Experimental
Therapeutics 1994;269(3):1029-1039.
9. Ashby Jr. CR, Pan H, Minabe Y, Toor A, Fishkin L, Wang RY. Comparison of the action of the
stereoisomers of the psychostimulant 4-methylaminorex (4-MAX) on midbrain dopamine cells in the rat:
An extracellular single unit study. Synapse 1995;20:351-361.
10. Kankaanpää A, Ellermaa S, Meririnne E, Hirsjärvi P, Seppälä T. Acute neurochemical and behavioral
effects of the stereoisomers of 4-methylaminorex in relation to brain drug concentrations. Journal of
Pharmacology and Experimental Therapeutics 2002;300:450-459.
11. Roszkowski AP, Kelley NM. A rapid method for assessing drug inhibition of feeding behavior. Journal
of Pharmacology and Experimental Therapeutics 1963;140:367-374.
12. Inaba D, Brewer LM. U4Euh. Microgram 1987;20:55-61 (Note: Law Enforcement Restricted).
13. Davis FT, Brewster ME. A fatality involving U4EuH, a cyclic derivative of phenylpropanolamine.
Journal of Forensic Sciences 1988;33:549-553.
14. One pot synthesis of 4-methylaminorex. www.thehive.org 2003 (Note: Lapsed Website).
15. McCasland GE. N÷O Acyl migration in epimeric acetyl inosamines. Journal of the American Chemical
Society 1955;73:2295-2297.
16. Taillade J, Boiteau L, Beuzelin I, Lagrille O, Biron J-P, Vayaboury W, Vandenabeele-Tranbouze O,
Giani O, Commeyras A. A pH-dependent cyanate reactivity model: Application to preparative
N-carbamoylation of amino acids. Journal Chemical Society, Perkin Transactions 2 2001;1247-1254.
17. Shorter J. The conversion of ammonium cyanate into urea - a saga in reaction mechanism. Chemical
Society Reviews 1978;7:1-14.
18. Williams A, Jencks WP. Urea synthesis from amines and cyanic acid: Kinetic evidence for a zwitterionic
intermediate. Journal Chemical Society, Perkin Transactions 2 1974;1753-1759.
Microgram Journal, Volume 3, Numbers 3-4 (July - December 2005) 160
Brought to you by AltGov2 [www.altgov2.org]
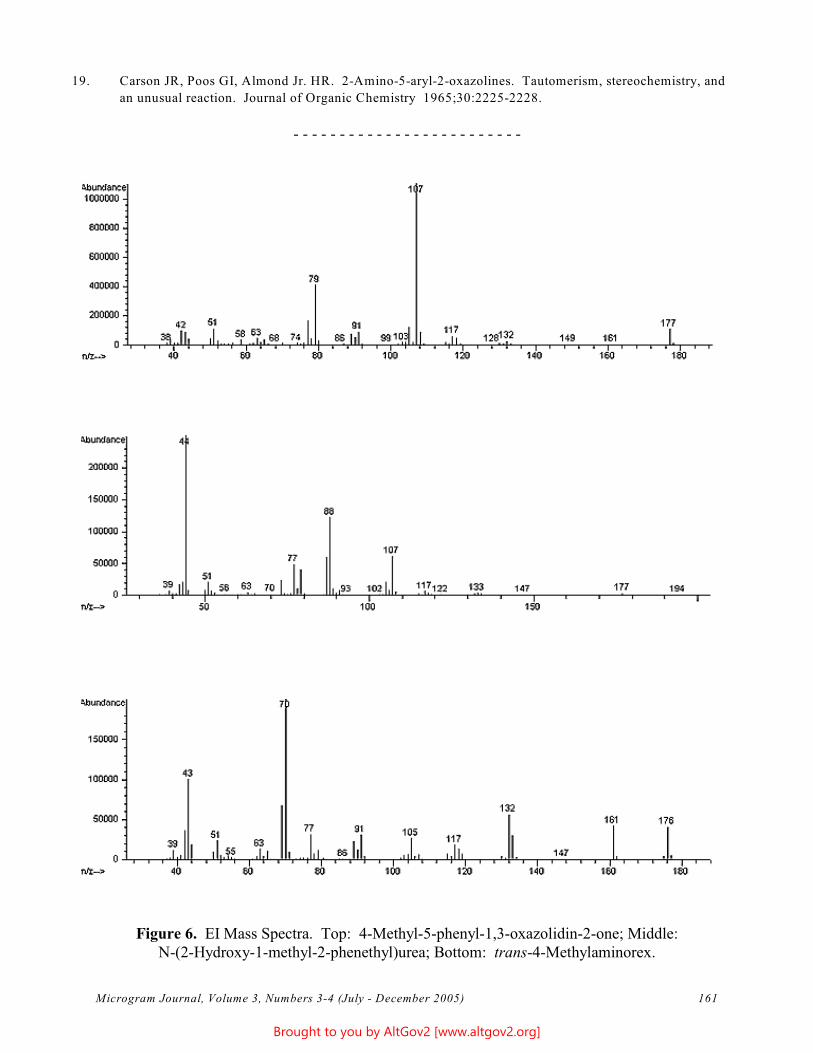
- - - - - - - - - - - - - - - - - - - - - - - - -
19. Carson JR, Poos GI, Almond Jr. HR. 2-Amino-5-aryl-2-oxazolines. Tautomerism, stereochemistry, and
an unusual reaction. Journal of Organic Chemistry 1965;30:2225-2228.
Figure 6. EI Mass Spectra. Top: 4-Methyl-5-phenyl-1,3-oxazolidin-2-one; Middle: N-(2-Hydroxy-1-methyl-2-phenethyl)urea; Bottom: trans-4-Methylaminorex.
Microgram Journal, Volume 3, Numbers 3-4 (July - December 2005) 161
Brought to you by AltGov2 [www.altgov2.org]
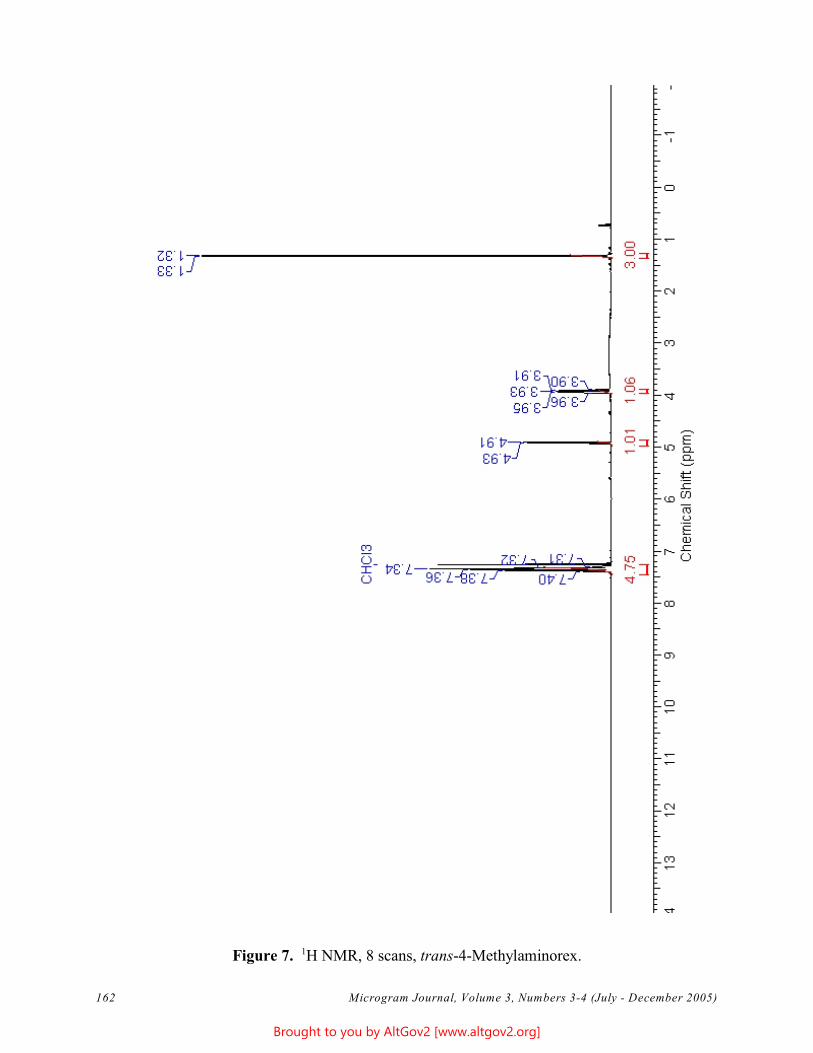
1Figure 7. H NMR, 8 scans, trans-4-Methylaminorex.
Microgram Journal, Volume 3, Numbers 3-4 (July - December 2005) 162
Brought to you by AltGov2 [www.altgov2.org]
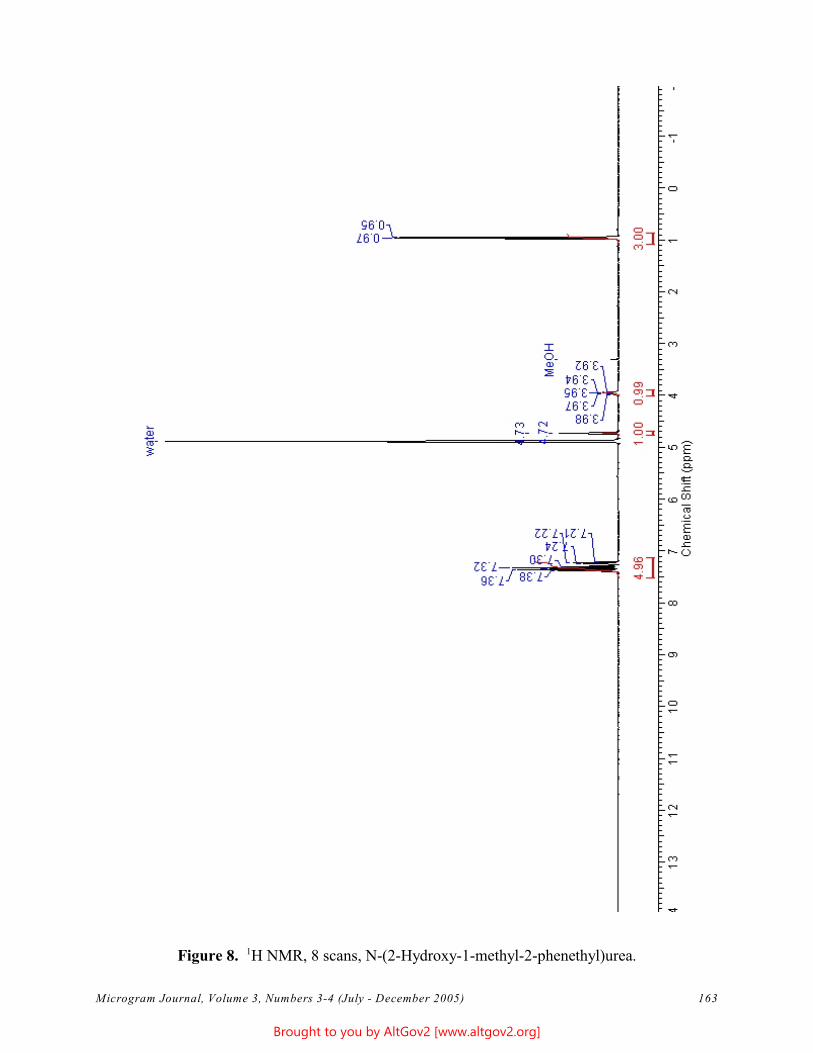
Figure 8. 1H NMR, 8 scans, N-(2-Hydroxy-1-methyl-2-phenethyl)urea.
Microgram Journal, Volume 3, Numbers 3-4 (July - December 2005) 163
Brought to you by AltGov2 [www.altgov2.org]
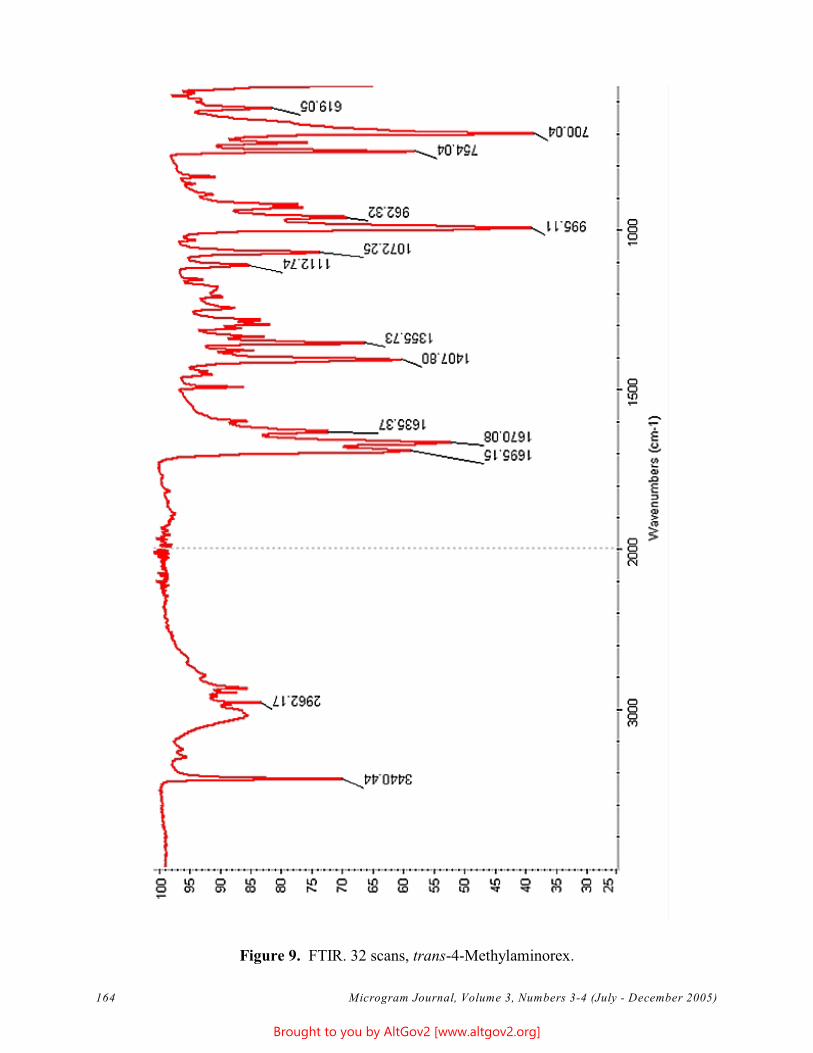
Figure 9. FTIR. 32 scans, trans-4-Methylaminorex.
Microgram Journal, Volume 3, Numbers 3-4 (July - December 2005) 164
Brought to you by AltGov2 [www.altgov2.org]
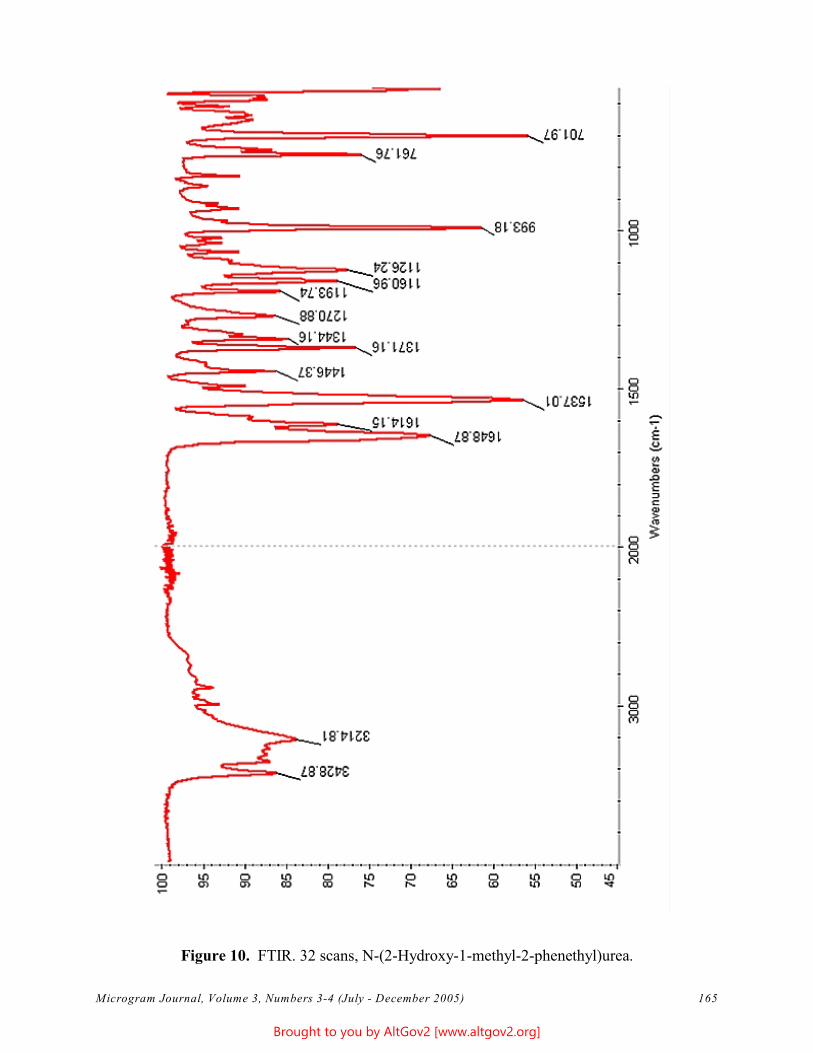
Figure 10. FTIR. 32 scans, N-(2-Hydroxy-1-methyl-2-phenethyl)urea.
Microgram Journal, Volume 3, Numbers 3-4 (July - December 2005) 165
Brought to you by AltGov2 [www.altgov2.org]
Identification of a New Amphetamine Type Stimulant: 3,4-Methylenedioxy-
N-(2-hydroxyethyl)amphetamine (MDHOET)
Carola Koper* Netherlands Forensic Institute
P. O. Box 24044 2490 AA The Hague, The Netherlands
[email: c.koper -at- nfi.minjus.nl]
Elisa Ali-Tolppa National Bureau of Investigation
P.O. Box 285 FIN- 01301 Vantaa, Finland
Joseph S. Bozenko Jr. U.S. Department of Justice
Drug Enforcement Administration Special Testing and Research Laboratory
22624 Dulles Summit Court Dulles, Virginia 20166, USA
Valérie Dufey Laboratoire Police Scientifique de Lyon
31 Avenue Franklin Roosevelt 69134 Ecully, France
Michael Puetz Bundeskriminalamt
Thaerstrasse 11 65193 Wiesbaden, Germany
Céline Weyermann Institute de Police Scientifique
University of Lausanne, Batiment de Chimie CH 1015 Lausanne-Dorigny, Switzerland
Frantisek Zrcek Police of Czech Republic
Institute of Criminalistics Prague P.O. Box 62/KUP/Strojnicka 27 17089 Prague, Czech Republic
ABSTRACT: 3,4-Methylenedioxy-N-(2-hydroxyethyl)amphetamine (M DHOET), an M DA derivative, was
identified in Ecstasy-type tablets seized in France, and subsequently in exhibits seized in Austria, The
Netherlands, Switzerland, and the United Kingdom. This unusual amphetamine type stimulant (ATS) was
submitted as an unknown to seven European laboratories participating in a sponsored ATS profiling program. Six
Microgram Journal, Volume 3, Numbers 3-4 (July - December 2005) 166
Brought to you by AltGov2 [www.altgov2.org]
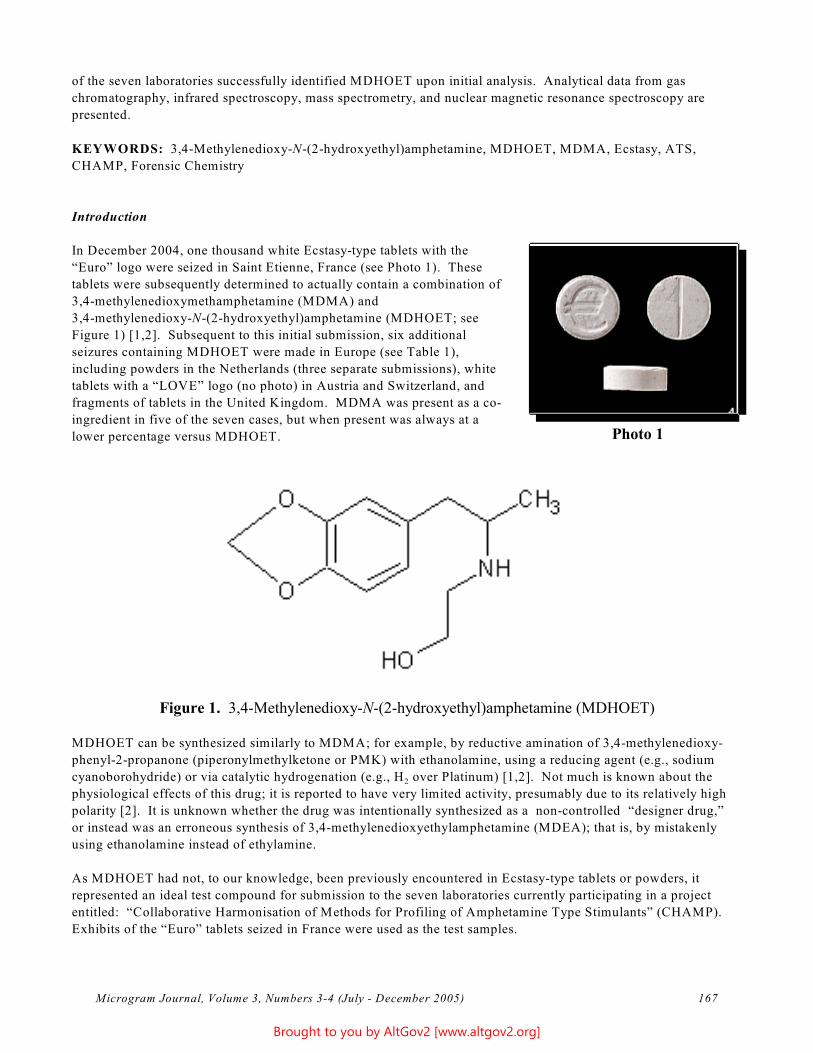
of the seven laboratories successfully identified MDHOET upon initial analysis. Analytical data from gas
chromatography, infrared spectroscopy, mass spectrometry, and nuclear magnetic resonance spectroscopy are
presented.
KEYW ORDS: 3,4-Methylenedioxy-N-(2-hydroxyethyl)amphetamine, MDHOET, MDMA, Ecstasy, ATS,
CHAMP, Forensic Chemistry
Introduction
In December 2004, one thousand white Ecstasy-type tablets with the
“Euro” logo were seized in Saint Etienne, France (see Photo 1). These
tablets were subsequently determined to actually contain a combination of
3,4-methylenedioxymethamphetamine (MDMA) and
3,4-methylenedioxy-N-(2-hydroxyethyl)amphetamine (MDHOET; see
Figure 1) [1,2]. Subsequent to this initial submission, six additional
seizures containing MDHOET were made in Europe (see Table 1),
including powders in the Netherlands (three separate submissions), white
tablets with a “LOVE” logo (no photo) in Austria and Switzerland, and
fragments of tablets in the United Kingdom. MDMA was present as a co-
ingredient in five of the seven cases, but when present was always at a
lower percentage versus MDHOET. Photo 1
Figure 1. 3,4-Methylenedioxy-N-(2-hydroxyethyl)amphetamine (MDHOET)
MDHOET can be synthesized similarly to MDMA; for example, by reductive amination of 3,4-methylenedioxy-
phenyl-2-propanone (piperonylmethylketone or PMK) with ethanolamine, using a reducing agent (e.g., sodium
cyanoborohydride) or via catalytic hydrogenation (e.g., H over Platinum) [1,2]. Not much is known about the 2
physiological effects of this drug; it is reported to have very limited activity, presumably due to its relatively high
polarity [2]. It is unknown whether the drug was intentionally synthesized as a non-controlled “designer drug,”
or instead was an erroneous synthesis of 3,4-methylenedioxyethylamphetamine (MDEA); that is, by mistakenly
using ethanolamine instead of ethylamine.
As MDHOET had not, to our knowledge, been previously encountered in Ecstasy-type tablets or powders, it
represented an ideal test compound for submission to the seven laboratories currently participating in a project
entitled: “Collaborative Harmonisation of Methods for Profiling of Amphetamine Type Stimulants” (CHAMP).
Exhibits of the “Euro” tablets seized in France were used as the test samples.
Microgram Journal, Volume 3, Numbers 3-4 (July - December 2005) 167
Brought to you by AltGov2 [www.altgov2.org]
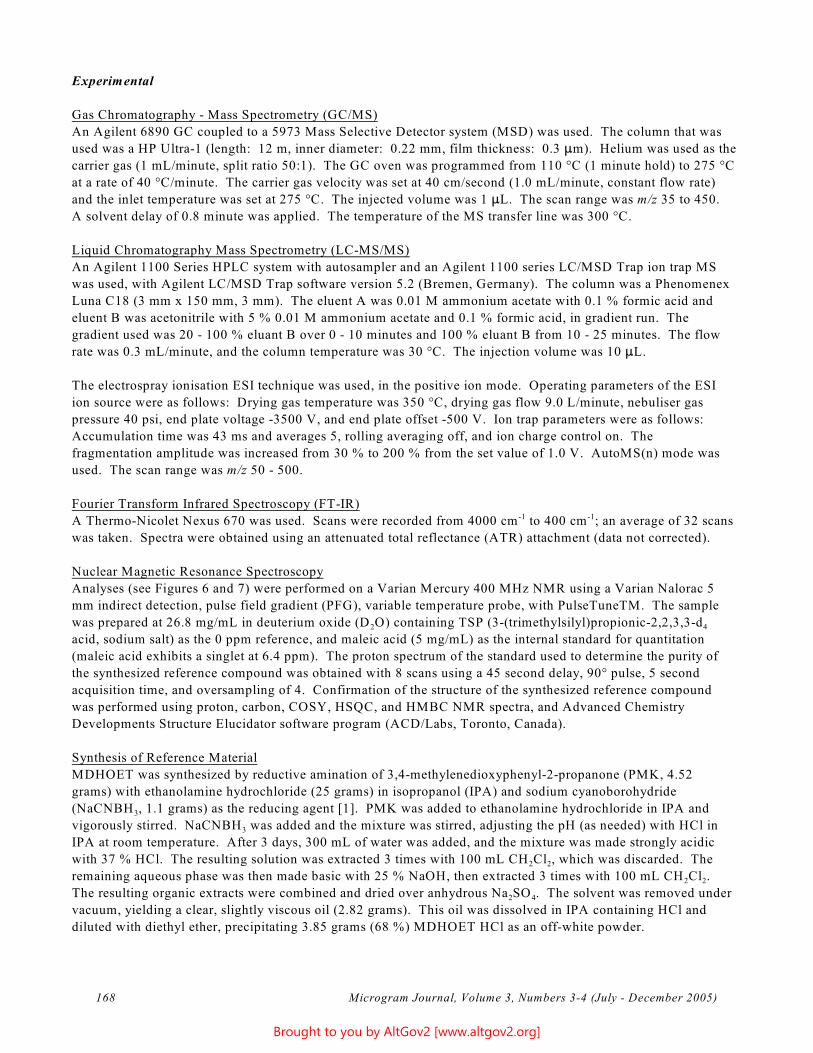
Experimental
Gas Chromatography - Mass Spectrometry (GC/MS)
An Agilent 6890 GC coupled to a 5973 Mass Selective Detector system (MSD) was used. The column that was
used was a HP Ultra-1 (length: 12 m, inner diameter: 0.22 mm, film thickness: 0.3 :m). Helium was used as the
carrier gas (1 mL/minute, split ratio 50:1). The GC oven was programmed from 110 °C (1 minute hold) to 275 °C
at a rate of 40 °C/minute. The carrier gas velocity was set at 40 cm/second (1.0 mL/minute, constant flow rate)
and the inlet temperature was set at 275 °C. The injected volume was 1 :L. The scan range was m/z 35 to 450.
A solvent delay of 0.8 minute was applied. The temperature of the MS transfer line was 300 °C.
Liquid Chromatography Mass Spectrometry (LC-MS/MS)
An Agilent 1100 Series HPLC system with autosampler and an Agilent 1100 series LC/MSD Trap ion trap MS
was used, with Agilent LC/MSD Trap software version 5.2 (Bremen, Germany). The column was a Phenomenex
Luna C18 (3 mm x 150 mm, 3 mm). The eluent A was 0.01 M ammonium acetate with 0.1 % formic acid and
eluent B was acetonitrile with 5 % 0.01 M ammonium acetate and 0.1 % formic acid, in gradient run. The
gradient used was 20 - 100 % eluant B over 0 - 10 minutes and 100 % eluant B from 10 - 25 minutes. The flow
rate was 0.3 mL/minute, and the column temperature was 30 °C. The injection volume was 10 :L.
The electrospray ionisation ESI technique was used, in the positive ion mode. Operating parameters of the ESI
ion source were as follows: Drying gas temperature was 350 °C, drying gas flow 9.0 L/minute, nebuliser gas
pressure 40 psi, end plate voltage -3500 V, and end plate offset -500 V. Ion trap parameters were as follows:
Accumulation time was 43 ms and averages 5, rolling averaging off, and ion charge control on. The
fragmentation amplitude was increased from 30 % to 200 % from the set value of 1.0 V. AutoMS(n) mode was
used. The scan range was m/z 50 - 500.
Fourier Transform Infrared Spectroscopy (FT-IR) -1A Thermo-Nicolet Nexus 670 was used. Scans were recorded from 4000 cm-1 to 400 cm ; an average of 32 scans
was taken. Spectra were obtained using an attenuated total reflectance (ATR) attachment (data not corrected).
Nuclear Magnetic Resonance Spectroscopy
Analyses (see Figures 6 and 7) were performed on a Varian Mercury 400 MHz NMR using a Varian Nalorac 5
mm indirect detection, pulse field gradient (PFG), variable temperature probe, with PulseTuneTM. The sample
was prepared at 26.8 mg/mL in deuterium oxide (D O) containing TSP (3-(trimethylsilyl)propionic-2,2,3,3-d 2 4
acid, sodium salt) as the 0 ppm reference, and maleic acid (5 mg/mL) as the internal standard for quantitation
(maleic acid exhibits a singlet at 6.4 ppm). The proton spectrum of the standard used to determine the purity of
the synthesized reference compound was obtained with 8 scans using a 45 second delay, 90° pulse, 5 second
acquisition time, and oversampling of 4. Confirmation of the structure of the synthesized reference compound
was performed using proton, carbon, COSY, HSQC, and HMBC NMR spectra, and Advanced Chemistry
Developments Structure Elucidator software program (ACD/Labs, Toronto, Canada).
Synthesis of Reference Material
MDHOET was synthesized by reductive amination of 3,4-methylenedioxyphenyl-2-propanone (PMK, 4.52
grams) with ethanolamine hydrochloride (25 grams) in isopropanol (IPA) and sodium cyanoborohydride
(NaCNBH , 1.1 grams) as the reducing agent [1]. PMK was added to ethanolamine hydrochloride in IPA and 3
vigorously stirred. NaCNBH was added and the mixture was stirred, adjusting the pH (as needed) with HCl in 3
IPA at room temperature. After 3 days, 300 mL of water was added, and the mixture was made strongly acidic
with 37 % HCl. The resulting solution was extracted 3 times with 100 mL CH Cl , which was discarded. The2 2
remaining aqueous phase was then made basic with 25 % NaOH, then extracted 3 times with 100 mL CH Cl . 2 2
The resulting organic extracts were combined and dried over anhydrous Na SO . The solvent was removed under 2 4
vacuum, yielding a clear, slightly viscous oil (2.82 grams). This oil was dissolved in IPA containing HCl and
diluted with diethyl ether, precipitating 3.85 grams (68 %) MDHOET HCl as an off-white powder.
Microgram Journal, Volume 3, Numbers 3-4 (July - December 2005) 168
Brought to you by AltGov2 [www.altgov2.org]
Results and Discussion
Laboratory Results
Subexhibits of the “Euro” tablets seized in Saint Etienne, France were distributed to the participating laboratories
as “blind” samples (that is, with no indication that they were a test, and no instructions on recommended methods
for analysis). This resulted in the use of a variety of techniques, of which GC/FID, GC/MS, FT-IR were the most
frequently employed (see Table 2). The composition of the tablets (approximately 2 % MDMA (as base),
caffeine, and approximately 7 % MDHOET (as base)) was an unusual complicating factor. Six of the seven
partners properly identified MDHOET; the lone exception missed its presence during initial screening due to its
co-elution with caffeine during the GC/FID analysis used in their laboratory. To confirm the identification, one 13 laboratory synthesized a reference standard, a second laboratory used NMR spectroscopy (1H, C-, COSY and
HETCOR), and a third laboratory did both. In addition to MDMA and MDHOET, caffeine, sorbitol and cellulose
were identified by some of the laboratories (using GC, 1H-NMR, and/or FT-IR).
Mass Spectrometry
All laboratories taking part in the round robin used mass spectrometry for the elucidation of the structure of the
unknown analyte. Apart from GC/MS, both liquid chromatography - mass spectrometry (LC/MS) and capillary
electrophoresis - mass spectrometry (CE/MS) were used. When LC/MS, CE/MS or ion-trap GC/MS was used,
the M+H ion was present at m/z 224 (Figure 2). However, if quadrupole GC/MS was used, derivatization (for
example, silylation or acetylation) was necessary to determine the molecular ion.
Upon GC/MS analysis of a non-derivatized sample, both MDMA (Retention index (RI) 1515) and MDHOET (RI
1865) were detected [3]. The mass spectrum of MDHOET is displayed in Figure 3. No molecular ion could be
identified. Besides the base peak at m/z 88 (CH CH=+NHCH CH OH ),other characteristic fragment ions are 3 2 2 +visible at m/z 44, m/z 70 (-18 (H 0) from m/z 88), m/z 135 (-88 (CH CH= NHCH CH OH)) and m/z 163 (-60 2 3 2 2
(H NCH CH OH)). The two fragments at m/z 70 and m/z 88 both suggest the presence of an -OH functionality 2 2 2
(that is, loss of H O). 2
Acetylation of MDHOET gave two derivatives, in agreement with the presence of two active hydrogens (NH and
OH). The major compound was the di-acetylated derivative (Figure 4, molecular ion at m/z 307), while the minor
compound was the mono-acetylated compound (molecular ion at m/z 281; spectrum not shown). Comparison of
the mass spectrum of MDHOET with that of its amphetamine analogue, N-(2-hydroxyethyl)amphetamine as
described by Cry et al. and Carpenter et al. [4,5], further corroborates this interpretation.
Fourier Transform Infrared Spectrometry
The FTIR-ATR spectrum of the synthesized MDHOET HCl is shown in Figure 5. The principal wavebands are at -11031 and 1249 cm-1, with additional characteristic bands at 3369, 2949 and 1578 cm .
NMR Spectroscopy 13 The 1H- and C-NMR spectra of the synthesized MDHOET in D O are shown in Figures 6 and 7. The two active 2
hydrogens are not visible due to deuterium exchange with the solvent (when dissolved in CDCl , both resonances 3
are visible as broad singlets between 9.2 - 9.3 ppm). The 1H-NMR spectrum of the original sample dissolved in
D O is shown in Figure 8. In addition to MDHOET, MDMA, sorbitol, and caffeine are observed. The2 1assignment of both the H- and 13C- resonances of MDHOET are given in Table 3.
Conclusions
Although MDHOET is quite unlikely to ever become a significant drug of abuse, future encounters are probable,
both in Europe and elsewhere. The analytical data presented in this article should enable facile analyses of this
unusual “designer drug,” in accordance with SWGDRUG protocols [6].
Microgram Journal, Volume 3, Numbers 3-4 (July - December 2005) 169
Brought to you by AltGov2 [www.altgov2.org]
Acknowledgements
The Sixth Framework Program of the European Commission is gratefully acknowledged for funding this project.
The authors would like to thank the following persons for their contributions: Laura Aalberg (Vantaa, Finland),
Fabrice Besacier (Ecully, France), Jiri Bolehovsky (Prague, Czech Republic), Rainer Dahlenburg (Wiesbaden,
Germany), Susanne Dieckmann (Wiesbaden, Germany), Laurence Dujourdy (Ecully, France), Pierre Esseiva
(Lausanne-Dorigny, Switzerland), Céline Delaporte (Lausanne-Dorigny, Switzerland), Henk Huizer (The Hague,
The Netherlands), Libuse Kawulokova (Prague, Czech Republic), Eric Lock (The Hague, The Netherlands),
Anneke Poortman (The Hague, The Netherlands), Milan Prazak (Prague, Czech Republic), Erkki Sippola (Vantaa,
Finland), and Pavel Tomicek (Prague, Czech Republic) [See address header for respective addresses.]
References
1. Braun U, Shulgin AT, Braun G. Research on the central activity and analgesia of N-substituted analogs
of the amphetamine derivative 3,4-methylenedioxyphenylisopropylamine. Arzneimittelforschung
1980;30(5):825-30.
2. Shulgin A, Shulgin A. PIHKAL. Transform Press, Berkeley, California, 1991, p. 731.
3. Kovats E. Gas-chromatographische charakterisierung organischer Verbindungen Teil 1:
Retentionsindices aliphatischer halogenide, alkohole, aldehyde, und ketone. Helvetica Chimica Acta
1958;41:1915-1932.
4. Cry TD, Dawson BA, By AW, Neville GA, Shurvell HF. Structural elucidation of unusual police
exhibits. II. Identification and spectral characterization of N-(2-hydroxyethyl)amphetamine
hydrochloride. Journal of Forensic Sciences 1996;41(4):608-611.
5. Carpenter J, Hugerl J, Weaver K. The identification of N-(2-hydroxyethyl)amphetamine. Journal of the
Canadian Society of Forensic Science 1993;26(4):143-146.
6. Scientific Working Group for the Analysis of Seized Drugs (SWGDRUG) Recommendations.
www.swgdrug.org/approved.htm
Table 1. Seizures of MDHOET in Europe During the Time Frame December 2004 - March 2006.
Country Date Logo Wt., Diam., Width Contents Amount
France 12/04 Euro 282 mg, 9.1 mm, 3.6 mm MDHOET, MDMA, caffeine 1000 tablets
Netherlands 02/05 - - MDHOET, MDMA 10 g powder
06/05 - - MDHOET, MDMA 20 g powder
03/06 - - MDHOET, MDMA 1.8 g powder
Austria 05/05 Love 190 mg, 6.7 mm, 4.1 mm MDHOET 50 tablets
Switzerland 05/05 Love 278 mg, 7.1 mm, 4.5 mm MDHOET, MDMA Not Reported
U.K. 04/05 Prob. - MDHOET Tablet
Unmarked Fragments
Microgram Journal, Volume 3, Numbers 3-4 (July - December 2005) 170
Brought to you by AltGov2 [www.altgov2.org]
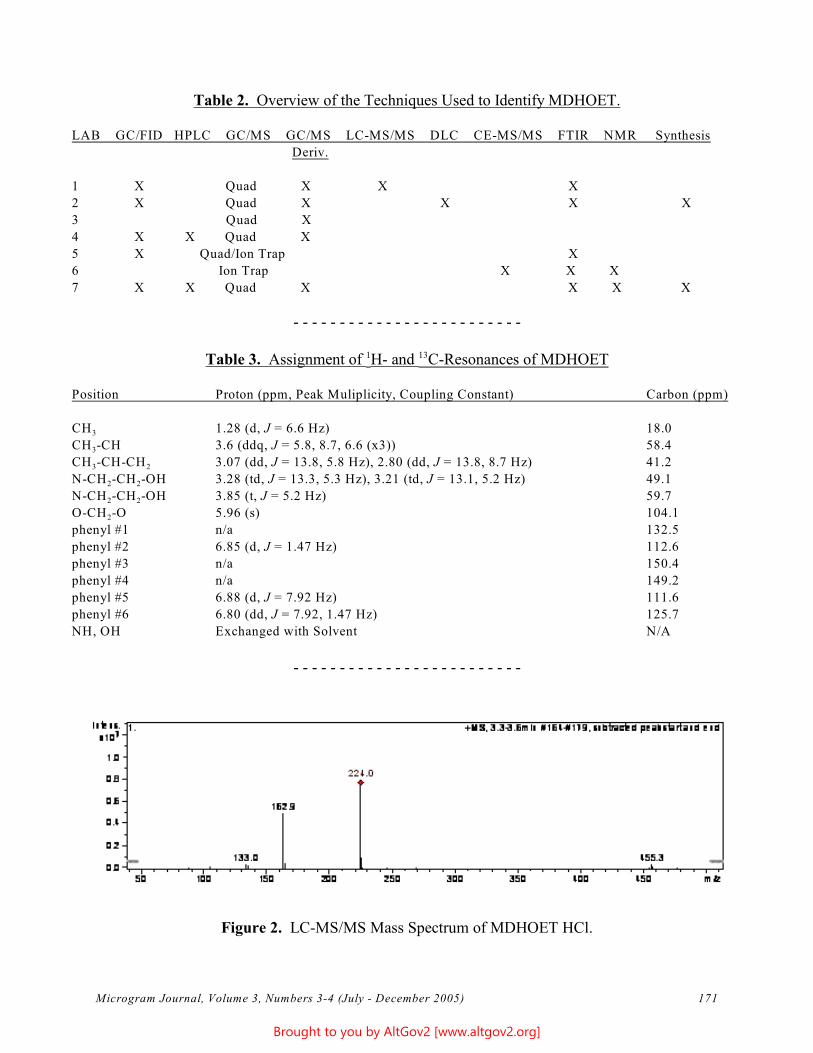
- - - - - - - - - - - - - - - - - - - - - - - - -
- - - - - - - - - - - - - - - - - - - - - - - - -
Table 2. Overview of the Techniques Used to Identify MDHOET.
LAB GC/FID HPLC GC/MS GC/MS LC-MS/MS DLC CE-MS/MS FTIR NMR Synthesis
Deriv.
1 X Quad
2 X Quad
3 Quad
4 X X Quad
5 X Quad/Ion Trap
6 Ion Trap
7 X X Quad
X X X
X X X X
X
X
X
X X X
X X X X
1Table 3. Assignment of H- and 13C-Resonances of MDHOET
Position Proton (ppm, Peak Muliplicity, Coupling Constant) Carbon (ppm)
CH3 1.28 (d, J = 6.6 Hz) 18.0
CH3-CH 3.6 (ddq, J = 5.8, 8.7, 6.6 (x3)) 58.4
CH3-CH-CH 3.07 (dd, J = 13.8, 5.8 Hz), 2.80 (dd, J = 13.8, 8.7 Hz) 41.2 2
N-CH2-CH -OH 3.28 (td, J = 13.3, 5.3 Hz), 3.21 (td, J = 13.1, 5.2 Hz) 49.1 2
N-CH2-CH -OH 3.85 (t, J = 5.2 Hz) 59.7 2
O-CH2-O 5.96 (s) 104.1
phenyl #1 n/a 132.5
phenyl #2 6.85 (d, J = 1.47 Hz) 112.6
phenyl #3 n/a 150.4
phenyl #4 n/a 149.2
phenyl #5 6.88 (d, J = 7.92 Hz) 111.6
phenyl #6 6.80 (dd, J = 7.92, 1.47 Hz) 125.7
NH, OH Exchanged with Solvent N/A
Figure 2. LC-MS/MS Mass Spectrum of MDHOET HCl.
Microgram Journal, Volume 3, Numbers 3-4 (July - December 2005) 171
Brought to you by AltGov2 [www.altgov2.org]
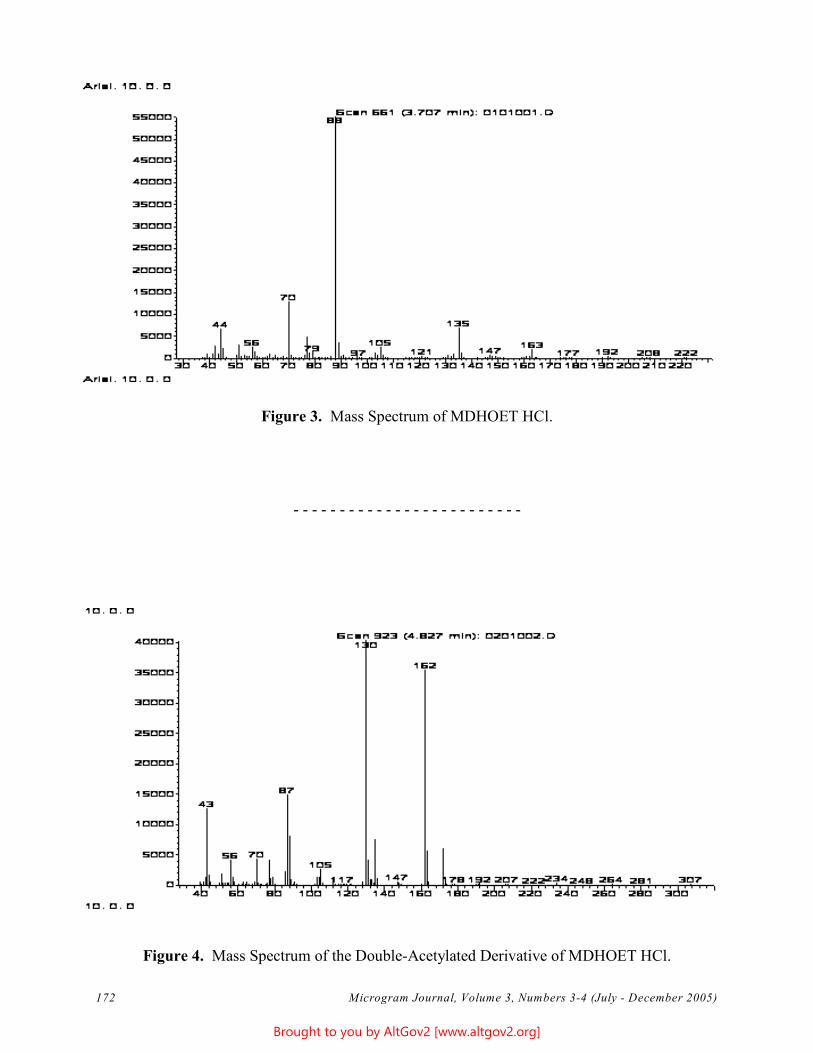
- - - - - - - - - - - - - - - - - - - - - - - - -
Figure 3. Mass Spectrum of MDHOET HCl.
Figure 4. Mass Spectrum of the Double-Acetylated Derivative of MDHOET HCl.
Microgram Journal, Volume 3, Numbers 3-4 (July - December 2005) 172
Brought to you by AltGov2 [www.altgov2.org]
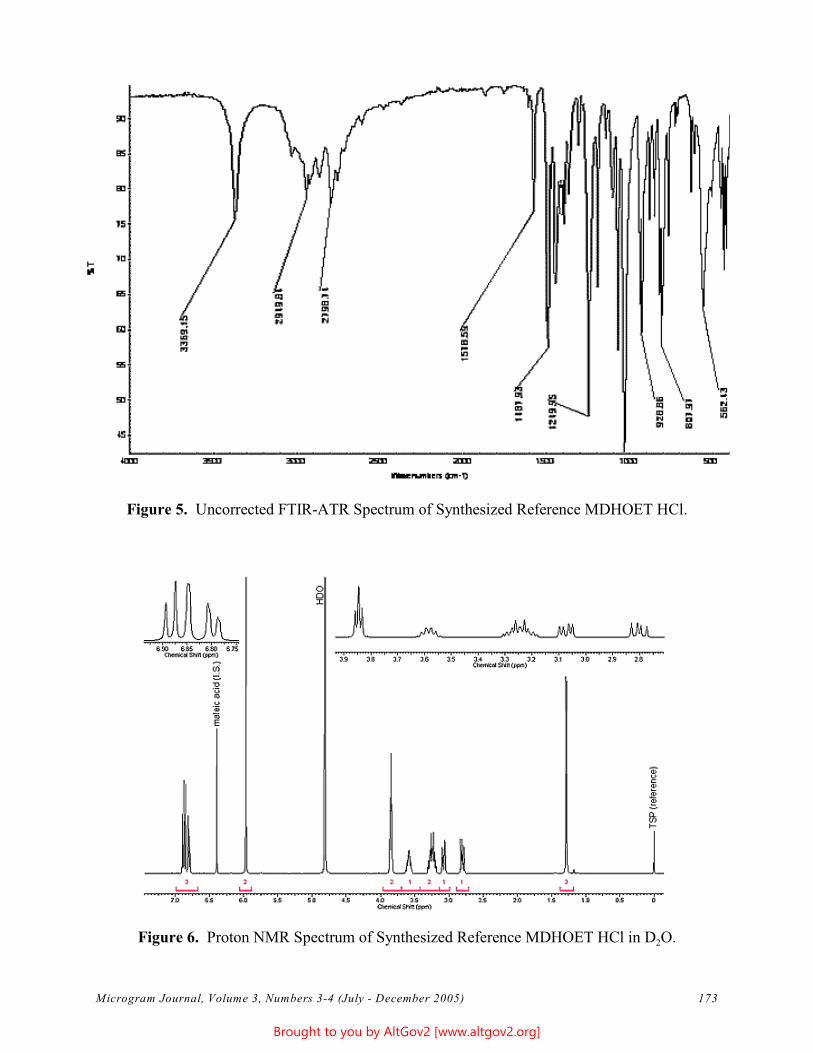
Figure 5. Uncorrected FTIR-ATR Spectrum of Synthesized Reference MDHOET HCl.
Figure 6. Proton NMR Spectrum of Synthesized Reference MDHOET HCl in D O. 2
Microgram Journal, Volume 3, Numbers 3-4 (July - December 2005) 173
Brought to you by AltGov2 [www.altgov2.org]
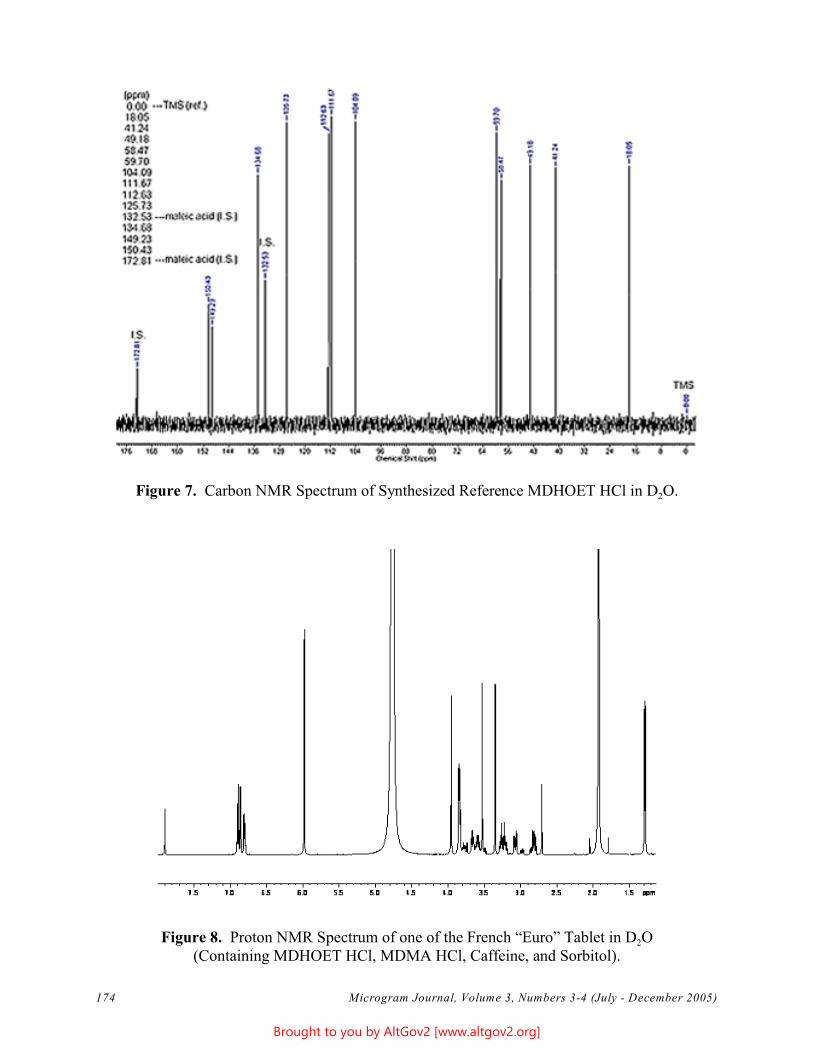
Figure 7. Carbon NMR Spectrum of Synthesized Reference MDHOET HCl in D O. 2
Figure 8. Proton NMR Spectrum of one of the French “Euro” Tablet in D O 2
(Containing MDHOET HCl, MDMA HCl, Caffeine, and Sorbitol).
Microgram Journal, Volume 3, Numbers 3-4 (July - December 2005) 174
Brought to you by AltGov2 [www.altgov2.org]
Technical Note
Analysis and Characterization of Psilocybin and Psilocin Using Liquid
Chromatography - Electrospray Ionization Mass Spectrometry (LC-ESI-MS) with
Collision-Induced-Dissociation (CID) and Source-Induced-Dissociation (SID)
Sandra E. Rodriguez-Cruz, Ph.D. U.S. Department of Justice
Drug Enforcement Administration Southwest Laboratory
2815 Scott Street Vista, CA 92081
[email: sandra.e.rodriguez-cruz -at- usdoj.gov]
ABSTRACT: The rapid analysis of psilocybin and psilocin using liquid chromatography electrospray ionization
mass spectrometry (LC-ESI-MS) is presented. Full-scan MS experiments provide molecular weight information,
but little fragmentation. Similarly, collision-induced-dissociation (CID) experiments generate only a limited
number of fragments. However, source-induced-dissociation (SID) experiments result in more extensive
fragmentation. The combined results from these complementary techniques allows for the more complete
characterization of psilocin and the thermally-labile psilocybin.
KEYWORDS: Psilocybin, Psilocin, Thermally-Labile, Liquid Chromatography-Mass Spectrometry (LC/MS),
Tandem Mass Spectrometry, Collision-Induced-Dissociation, Source-Induced-Dissociation.
Introduction
Direct analysis of thermally-labile compounds using gas chromatography - mass spectrometry (GC/MS) is limited
or impossible due to degradation caused by the high injector and column temperatures. Although derivatization is
useful in many cases, direct analysis of the compounds of interest is always preferable. The development of the
electrospray ionization (ESI) technique has enabled the transfer of thermally-labile compounds from solution into
the gas phase without significant degradation [1]. The use of ESI in combination with liquid chromatography
mass spectrometry (LC/MS) techniques therefore provides a powerful analytical tool for the analysis of heat
sensitive compounds.
A “classic” example of such a thermally labile compound is psilocybin, a powerful hallucinogen found in over
100 species of mushrooms, including Psilocybe azurescens, Strophoria cubensis, and Psilocybe mexicana [2-4].
Psilocybin is the phosphorylated ester of psilocin (Figure 1). The phosphate ester in psilocybin is delicate, and
analysis of psilocybin-containing substrates by standard analytical techniques is therefore problematic. Because
both psilocybin and psilocin are classified under Schedule I of the United States Controlled Substances Act, their
analyses are important for forensic/law enforcement purposes.
Previous reports on the analysis of hallucinogenic mushrooms include descriptions of various extractions of the
material, followed by instrumental analysis using liquid chromatography, gas chromatography, and mass
spectrometry techniques [5-11]. In actuality, most of these analyses allow the detection of psilocin only, since the
psilocybin did not survive the extraction and/or analysis. In addition, both psilocin and psilocybin have been
indirectly analyzed following derivatization [12], and more recently, directly analyzed with the use of LC/MS
Microgram Journal, Volume 3, Numbers 3-4 (July - December 2005) 175
Brought to you by AltGov2 [www.altgov2.org]
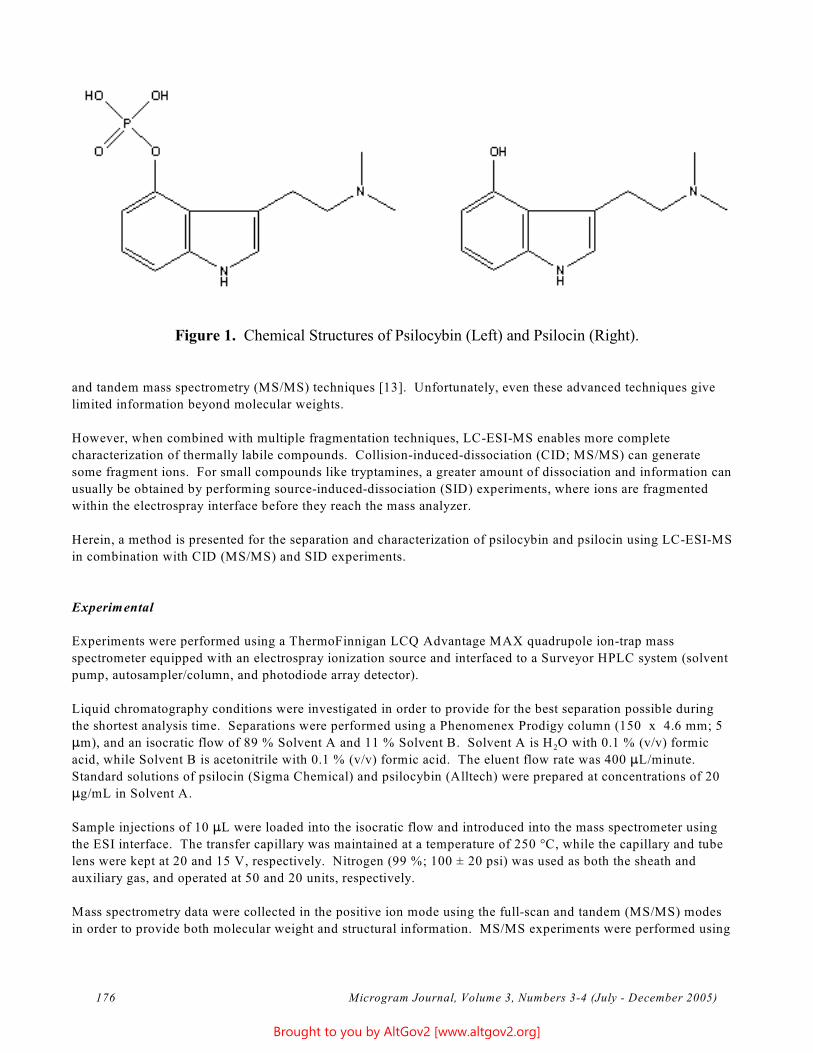
Figure 1. Chemical Structures of Psilocybin (Left) and Psilocin (Right).
and tandem mass spectrometry (MS/MS) techniques [13]. Unfortunately, even these advanced techniques give
limited information beyond molecular weights.
However, when combined with multiple fragmentation techniques, LC-ESI-MS enables more complete
characterization of thermally labile compounds. Collision-induced-dissociation (CID; MS/MS) can generate
some fragment ions. For small compounds like tryptamines, a greater amount of dissociation and information can
usually be obtained by performing source-induced-dissociation (SID) experiments, where ions are fragmented
within the electrospray interface before they reach the mass analyzer.
Herein, a method is presented for the separation and characterization of psilocybin and psilocin using LC-ESI-MS
in combination with CID (MS/MS) and SID experiments.
Experimental
Experiments were performed using a ThermoFinnigan LCQ Advantage MAX quadrupole ion-trap mass
spectrometer equipped with an electrospray ionization source and interfaced to a Surveyor HPLC system (solvent
pump, autosampler/column, and photodiode array detector).
Liquid chromatography conditions were investigated in order to provide for the best separation possible during
the shortest analysis time. Separations were performed using a Phenomenex Prodigy column (150 x 4.6 mm; 5
:m), and an isocratic flow of 89 % Solvent A and 11 % Solvent B. Solvent A is H O with 0.1 % (v/v) formic 2
acid, while Solvent B is acetonitrile with 0.1 % (v/v) formic acid. The eluent flow rate was 400 :L/minute.
Standard solutions of psilocin (Sigma Chemical) and psilocybin (Alltech) were prepared at concentrations of 20
:g/mL in Solvent A.
Sample injections of 10 :L were loaded into the isocratic flow and introduced into the mass spectrometer using
the ESI interface. The transfer capillary was maintained at a temperature of 250 °C, while the capillary and tube
lens were kept at 20 and 15 V, respectively. Nitrogen (99 %; 100 ± 20 psi) was used as both the sheath and
auxiliary gas, and operated at 50 and 20 units, respectively.
Mass spectrometry data were collected in the positive ion mode using the full-scan and tandem (MS/MS) modes
in order to provide both molecular weight and structural information. MS/MS experiments were performed using
Microgram Journal, Volume 3, Numbers 3-4 (July - December 2005) 176
Brought to you by AltGov2 [www.altgov2.org]
a standard collision energy of 35 eV. Source-induced-dissociation (SID) experiments were performed using
variable energies between 25 and 40 eV. Helium (99.999 %; 40 ± 10 psi) was used as both the trapping and
collision gas.
Instrument control, data collection and analysis were performed using the Xcalibur software (version 1.4)
provided by the instrument manufacturer.
Results and Discussion
Figure 2 shows the total ion chromatogram (TIC), UV-based chromatogram, and full-scan ESI mass spectral data
obtained during a 10 minute isocratic separation (11 % Solvent B). Psilocybin elutes at 5.5 minutes, while
psilocin elutes at 7.4 minutes. Clear separation is obtained and the full-scan spectra show the pseudo-molecular + +(M+H ) ions for psilocybin and psilocin at m/z 285 and 205, respectively. The full-scan ESI spectrum for
+ +psilocybin also shows a peak at m/z 307, corresponding to the (M+Na ) ion. The ESI data for psilocin also
shows a small fragment ion at m/z 160. This experiment allows for the separation, detection, and determination of
the molecular weights for these two compounds.
Figure 3 shows the tandem (MS/MS) fragmentation data obtained during the chromatographic separation of
psilocybin and psilocin. During standard collision-induced dissociation (CID) experiments at 35 eV, psilocybin
dissociates into two main fragments. The fragment observed at m/z 205 corresponds to loss of a neutral phosphate
3 )moiety (HPO ; 80 Da), while the fragment at m/z 240 results from the loss of neutral dimethylamine (HN(CH3 2;
45 Da). Dissociation of psilocin is dominated by the loss of dimethylamine, producing a fragment at m/z 160.
The dissociation patterns observed for psilocybin and psilocin are typical of tryptamine-type fragmentations
previously reported [14,15], and are also in agreement with recent tandem MS experiments using a
triple-quadrupole mass analyzer [13].
Source-induced-dissociation (SID) experiments provide an alternative fragmentation technique for compounds
that show a limited number of fragments under MS/MS conditions. During SID, electrospray-generated ions are
subjected to high-energy collisions with the background gas within the relatively high-pressure capillary-skimmer
region of the ionization interface. As a result, characteristic fragments are generated and mass analysis provides
additional structural information. Figures 4 and 5 show SID data obtained for psilocybin and psilocin,
respectively, using dissociation energies of 25, 30, 35, and 40 eV.
For psilocybin, SID experiments result in the formation of multiple fragments. In addition to the fragments at m/z
240 and 205 observed with CID, other characteristic fragments are observed at m/z 222, 160, 142, and 115. The
former three fragments correspond to loss of H O, HPO , and H PO4 from the m/z 240 species, while the peak at 2 3 3
m/z 115 is characteristic of the indole moiety. The fragment at m/z 160 can also be generated from the loss of
HN(CH ) from m/z 205. As observed in the SID spectra, the sodiated psilocybin ion at m/z 307 does not undergo 3 2
significant dissociation under these conditions. This is probably reflective of the greater stability of this species,
due to the higher affinity of the phosphate group for sodium.
Increased fragmentation is also observed from SID experiments on psilocin. After production of m/z 160,
subsequent dissociation reactions result in the appearance of fragments at m/z 142 and 132, due to loss of H O and 2
CH =CH , respectively. The fragments observed at m/z 115 and 117 are again characteristics of the indole group, 2 2
with and without the loss of H . 2
Conclusions
The presented LC-ESI-MS techniques allow for the direct, facile separation and identification of psilocybin and
psilocin. The LC conditions used separated the two compounds in less than 8 minutes. Mass spectrometry
Microgram Journal, Volume 3, Numbers 3-4 (July - December 2005) 177
Brought to you by AltGov2 [www.altgov2.org]
experiments in the full-scan and MS/MS mode provided molecular weight and partial structural information.
Source-induced-dissociation experiments provided complementary fragment information, allowing for a much
more complete structural characterization of the two species. The presented techniques illustrate the utility of
LC-ESI-MS, CID, and SID experiments for the analysis and characterization of thermally-labile compounds.
References
1. Cole RB. Electrospray ionization mass spectrometry: Fundamentals, instrumentation and applications.
John Wiley and Sons, New York, 1997.
2. Drug identification bible. Amera-Chem, Inc., Grand Junction, Colorado, 2002.
3. Gahlinger P. Illegal drugs: A complete guide to their history, chemistry, use, and abuse. Plume, New
York, 2004.
4. Perrine DM. The chemistry of mind-altering drugs: History, pharmacology and cultural context.
American Chemical Society, Washington, D.C., 1996.
5. Thomson BM. Analysis of psilocybin and psilocin in mushroom extracts by reverse phase HPLC.
Journal of Forensic Sciences 1980;25:779.
6. Casale J. An aqueous-organic extraction method for the isolation and identification of psilocin from
hallucinogenic mushrooms. Journal of Forensic Sciences 1985;30:247.
7. Lee RE. Techniques for the rapid isolation and identification of psilocin from psilocybin containing
mushrooms. Journal of Forensic Sciences 1985;30:931.
8. Phelan CP. Identification of psilocin and bufotenine via GC/IRD. Microgram 1999;32:83 (Note: Law
Enforcement Restricted).
9. Gross TS. Detecting psychoactive drugs in the developmental stages of mushrooms. Journal of Forensic
Sciences 2000;45:527.
10. Gross TS. Psychotropic drugs in developmental mushrooms: A case study review. Journal of Forensic
Sciences 2002;47:1298.
11. Saito K, Toyo’oka T, Fukushima T, Kato M, Shirota O, Goda Y. Determination of psilocin in magic
mushrooms and rat plasma by liquid chromatography with fluorimetry and electrospray ionization mass
spectrometry. Analytica Chimica Acta 2004;527:149.
12. Timmons JE. The identification of psilocin and psilocybin using gas chromatography - mass
spectrometry. Microgram 1984;17:28 (Note: Law Enforcement Restricted).
13. Kamata T, Nishikawa M, Katagi M, Tsuchihashi H. Liquid chromatography - mass spectrometric and
liquid chromatography - tandem mass spectrometric determination of hallucinogenic indoles psilocin and
psilocybin in “magic mushrooms” samples. Journal of Forensic Sciences 2005;50:336.
14. Roesner P. Mass spectra of designer drugs. John Wiley and Sons, Inc., New York, 2003.
15. Rodriguez-Cruz SE. Analysis and characterization of designer tryptamines using electrospray ionization
mass spectrometry (ESI-MS). Microgram Journal, this issue, page 107.
Microgram Journal, Volume 3, Numbers 3-4 (July - December 2005) 178
Brought to you by AltGov2 [www.altgov2.org]
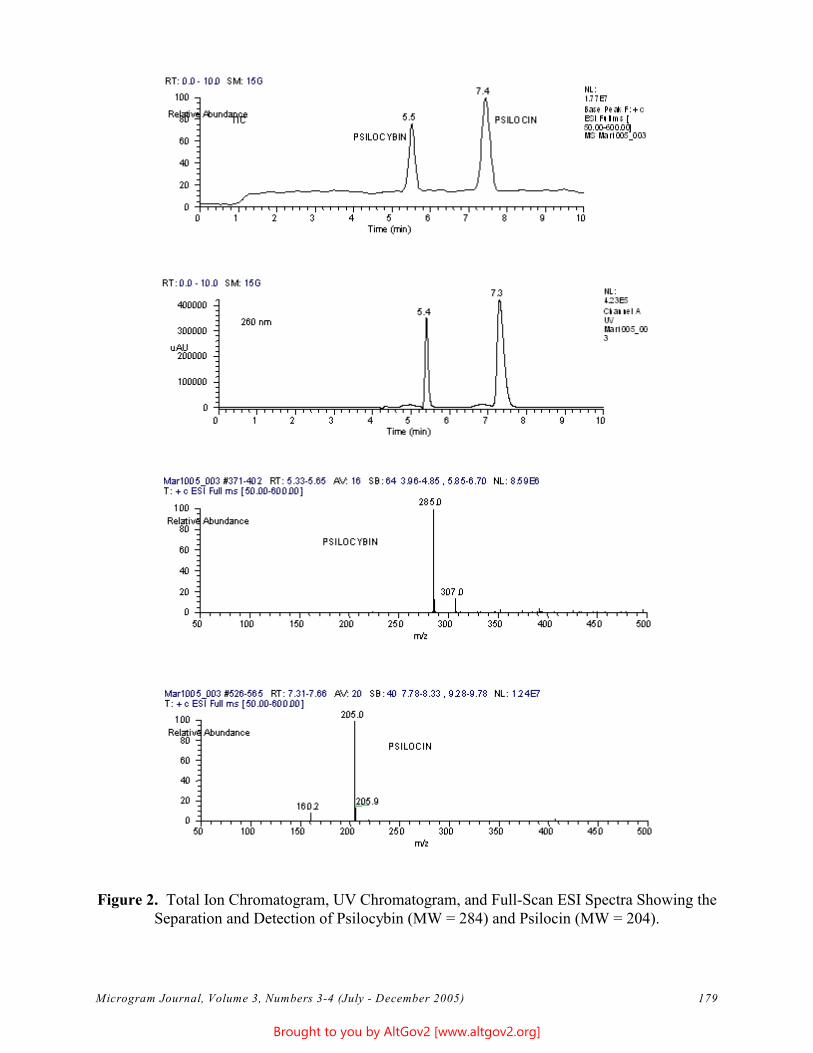
Figure 2. Total Ion Chromatogram, UV Chromatogram, and Full-Scan ESI Spectra Showing the Separation and Detection of Psilocybin (MW = 284) and Psilocin (MW = 204).
Microgram Journal, Volume 3, Numbers 3-4 (July - December 2005) 179
Brought to you by AltGov2 [www.altgov2.org]
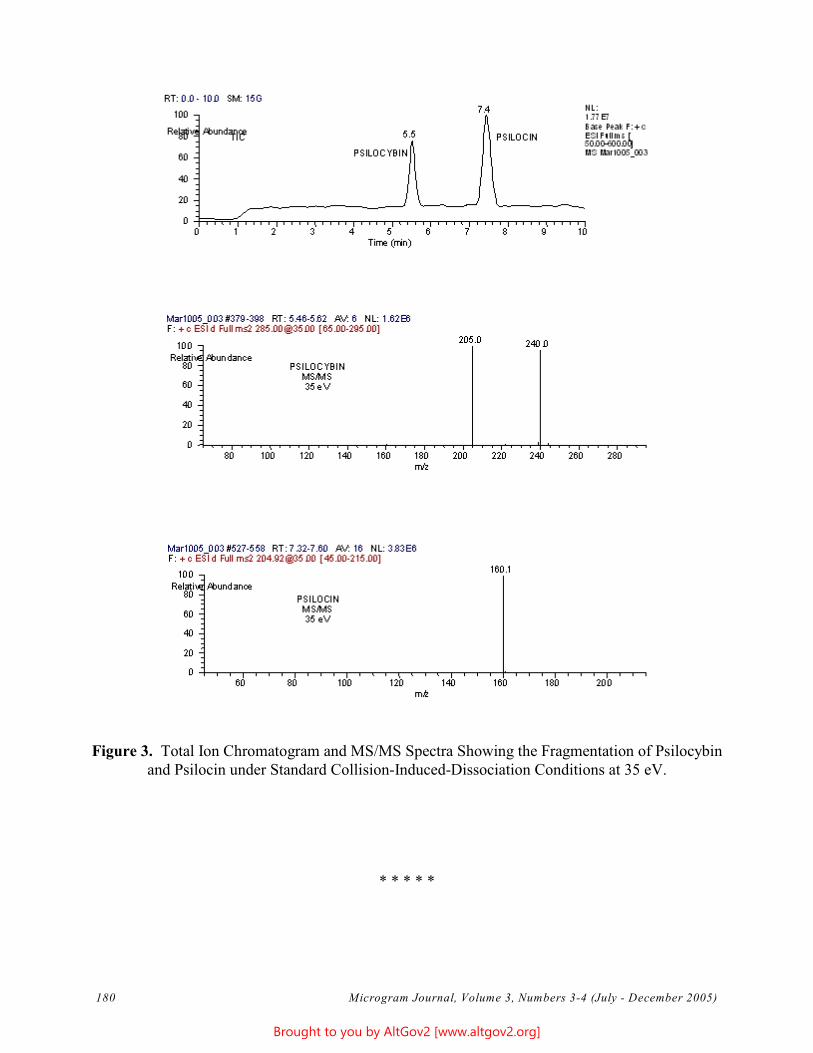
Figure 3. Total Ion Chromatogram and MS/MS Spectra Showing the Fragmentation of Psilocybin and Psilocin under Standard Collision-Induced-Dissociation Conditions at 35 eV.
* * * * *
Microgram Journal, Volume 3, Numbers 3-4 (July - December 2005) 180
Brought to you by AltGov2 [www.altgov2.org]
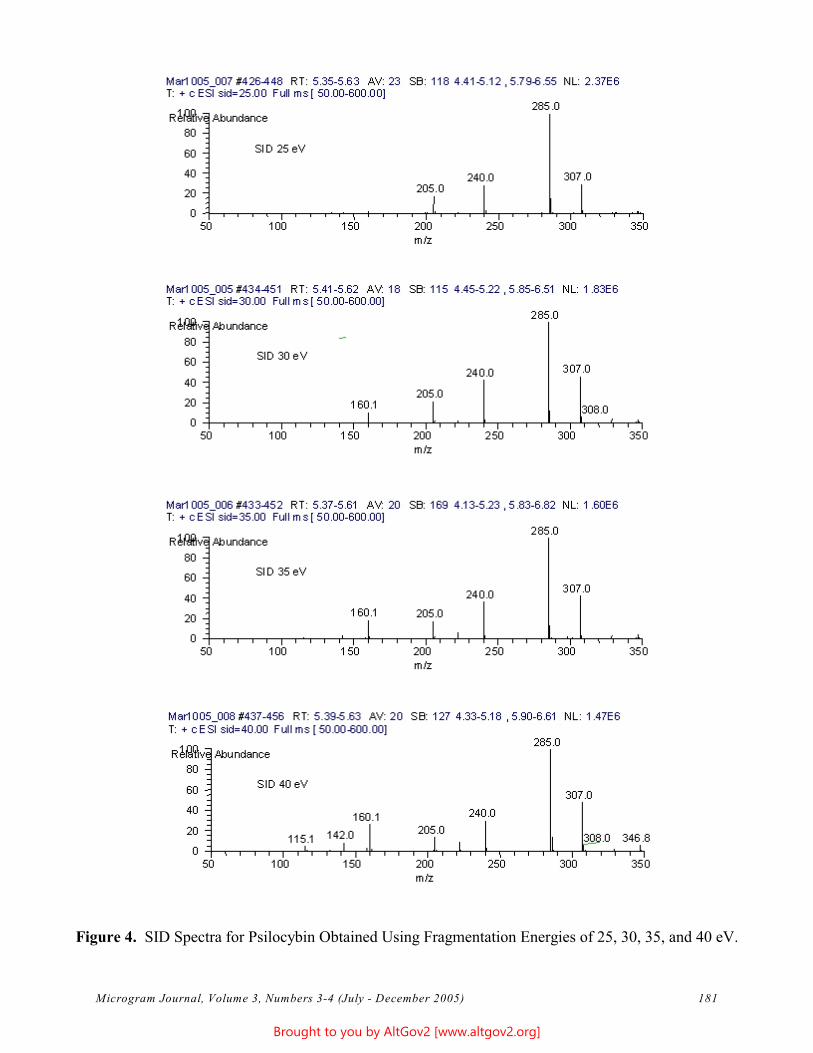
Figure 4. SID Spectra for Psilocybin Obtained Using Fragmentation Energies of 25, 30, 35, and 40 eV.
Microgram Journal, Volume 3, Numbers 3-4 (July - December 2005) 181
Brought to you by AltGov2 [www.altgov2.org]
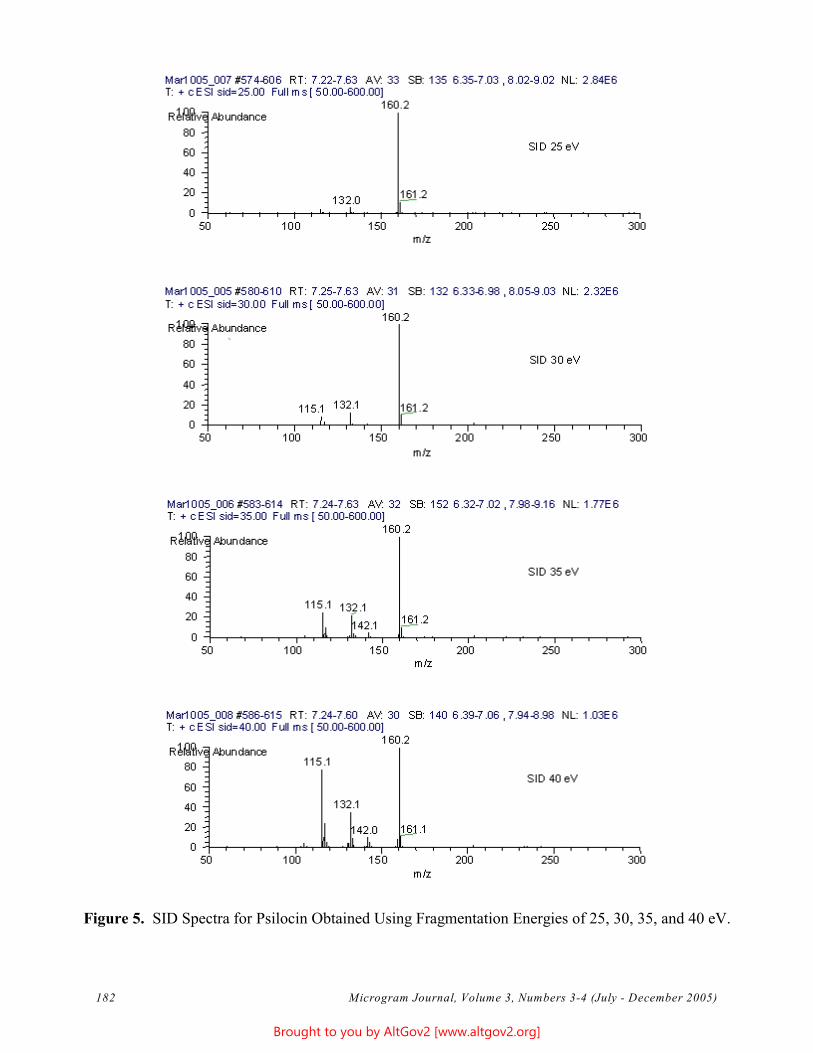
Figure 5. SID Spectra for Psilocin Obtained Using Fragmentation Energies of 25, 30, 35, and 40 eV.
Microgram Journal, Volume 3, Numbers 3-4 (July - December 2005) 182
Brought to you by AltGov2 [www.altgov2.org]
Technical Note
Specificity of the Duquenois-Levine and Cobalt Thiocyanate Tests
Substituting Methylene Chloride or Butyl Chloride for Chloroform
Amanda J. Hanson Wisconsin State Crime Laboratory - Madison
4626 University Avenue Madison, WI 53705-2156
[e-mail: hansonaj -at- doj.state.wi.us]
ABSTRACT: The use of alternative solvents in the Duquenois-Levine and Cobalt Thiocyanate tests were
explored due to substandard results with recently purchased lots of chloroform. Methylene chloride provided
satisfactory results when substituted for chloroform in both tests. Butyl chloride provided satisfactory results in
the Duquenois-Levine test.
KEYWORDS: Duquenois-Levine, Cobalt Thiocyanate, Marijuana, Cocaine, Chloroform, Methylene Chloride,
n-Butyl Chloride
Introduction
The Rapid Modified Duquenois-Levine test and Cobalt Thiocyanate test (Scott test) are proven screening tests for
the presence of marijuana and cocaine, respectively. The organic solvent traditionally used in these tests is
chloroform. However, chloroform recently purchased by this laboratory produced little or no color change when
performing the Duquenois-Levine and Cobalt Thiocyanate tests. Shortly after opening, this chloroform became
yellow to green in color, at which point it was unsuitable to perform these tests. According to the manufacturer,
this unusual decomposition of the chloroform was due to insufficient amounts of preservatives. This experience
led to the investigation of using alternative organic solvents, specifically methylene chloride and n-butyl chloride,
in the Duquenois-Levine and Cobalt Thiocyanate tests.
Experimental
Reagents and Solvents
Hydrochloric acid, methylene chloride, and n-butyl chloride were obtained from Fisher Scientific. Acceptable
quality chloroform was obtained from OmniSolv. The Duquenois reagent was prepared by adding 10 grams of
vanillin and 5 milliliters of acetaldehyde to 500 milliliters of ethanol. The vanillin, acetaldehyde, and ethanol
were obtained from Kodak, EM Science, and Fisher Scientific, respectively. The cobalt thiocyanate reagent was
prepared by dissolving ten grams of cobalt (II) thiocyanate in a mixture of 490 milliliters of distilled water and
500 milliliters of glycerin. The cobalt (II) thiocyanate and glycerin were obtained from Aldrich Chemical and
Fisher Scientific, respectively.
Procedures
The Duquenois-Levine test was performed on 17 different substances using chloroform, methylene chloride, and
butyl chloride as the organic solvent. The test was performed by placing approximately 10 to 20 milligrams of a
target substance in a glass test tube, then 10 drops of the Duquenois reagent. After shaking, 10 drops of
concentrated hydrochloric acid were added, and the tube was again shaken. Any color that resulted after the
Microgram Journal, Volume 3, Numbers 3-4 (July - December 2005) 183
Brought to you by AltGov2 [www.altgov2.org]
hydrochloric acid step was recorded. Twenty drops of chloroform were then added, and the tube was vortexed,
then allowed to settle and separate into two layers. Any color that transferred into the organic layer was recorded
(Table 1). This procedure was repeated for each target substance by substituting methylene chloride or butyl
chloride for chloroform.
The cobalt thiocyanate test was performed on 14 different substances using chloroform, methylene chloride, and
butyl chloride. The test was performed by placing approximately 2 to 4 milligrams of a target substance in a glass
test tube, then 5 drops of cobalt thiocyanate reagent. After shaking,1 or 2 drops of concentrated hydrochloric acid
were added, and the tube was again shaken. Ten drops of chloroform were then added, and the tube was
vortexed, then allowed to settle and separate into two layers. The final color of the chloroform (organic) layer
was recorded (Table 2). This procedure was repeated for each target substance by substituting methylene chloride
or butyl chloride for chloroform.
Results and Discussion
The results for the Duquenois-Levine test using either methylene chloride and butyl chloride were consistent with
results obtained using chloroform. The marijuana became purple with the addition of the Duquenois reagent and
hydrochloric acid. Upon addition of the organic solvent, the purple color transferred to the organic layer,
indicating a positive test for cannabinoids. The color was consistent in all tests involving marijuana, regardless of
the solvent used. None of the remaining 16 substances tested gave the characteristic purple color in the organic
solvent layer.
Similarly, the results of the Cobalt Thiocyanate test were equivalent whether chloroform or methylene chloride
was used. However, the results for the butyl chloride were mixed. Addition of the cobalt thiocyanate reagent to
cocaine hydrochloride resulted in the surface of the particles turning a bright blue (faint blue for cocaine base).
The solution changed back to pink upon adding one or two drops of hydrochloric acid and mixing. Addition of
10 drops of chloroform, vortexing, and allowing the solution to settle resulted in a blue organic layer for both
cocaine hydrochloride and cocaine base. The test had similar results when methylene chloride was substituted for
chloroform. In the case of butyl chloride, however, the organic layer stayed clear, giving an inconclusive test.
Diphenhydramine and lidocaine also gave blue organic layers with either chloroform and methylene chloride.
These compounds are known false positives for cocaine. However, in the case of butyl chloride, the organic
layers were clear for diphenhydramine and white for lidocaine. The other ten materials had consistent negative
test results for all three organic solvents.
Conclusions
Methylene chloride may be substituted for chloroform in both the Rapid Modified Duquenois-Levine test and
Cobalt Thiocyanate test. Similarly, butyl chloride may be substituted for chloroform in the Duquenois-Levine
test. However, butyl chloride was not a reliable substitute solvent for use in the Cobalt Thiocyanate test.
Methylene chloride also works well as an extraction solvent in place of chloroform.
[Tables 1 and 2 Follow.]
Microgram Journal, Volume 3, Numbers 3-4 (July - December 2005) 184
Brought to you by AltGov2 [www.altgov2.org]
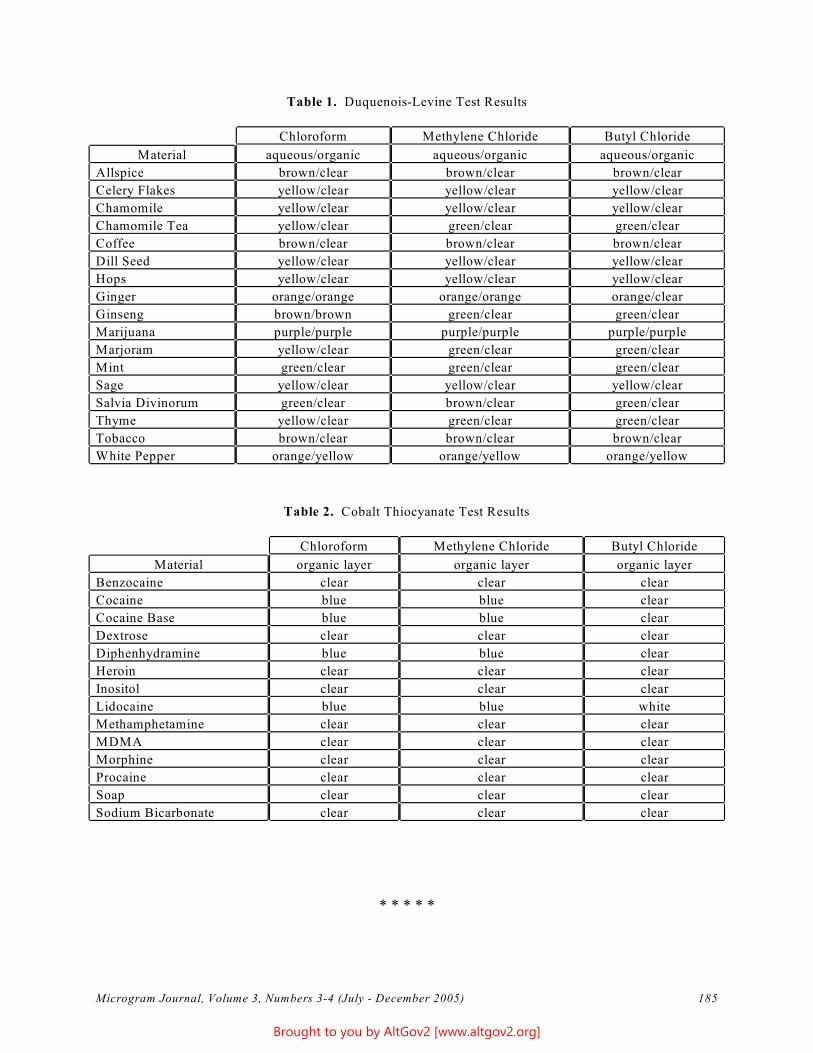
Table 1. Duquenois-Levine Test Results
Chloroform Methylene Chloride Butyl Chloride
Material aqueous/organic aqueous/organic aqueous/organic
Allspice brown/clear brown/clear brown/clear
Celery Flakes yellow/clear yellow/clear yellow/clear
Chamomile yellow/clear yellow/clear yellow/clear
Chamomile Tea yellow/clear green/clear green/clear
Coffee brown/clear brown/clear brown/clear
Dill Seed yellow/clear yellow/clear yellow/clear
Hops yellow/clear yellow/clear yellow/clear
Ginger orange/orange orange/orange orange/clear
Ginseng brown/brown green/clear green/clear
Marijuana purple/purple purple/purple purple/purple
Marjoram yellow/clear green/clear green/clear
Mint green/clear green/clear green/clear
Sage yellow/clear yellow/clear yellow/clear
Salvia Divinorum green/clear brown/clear green/clear
Thyme yellow/clear green/clear green/clear
Tobacco brown/clear brown/clear brown/clear
White Pepper orange/yellow orange/yellow orange/yellow
Table 2. Cobalt Thiocyanate Test Results
Chloroform Methylene Chloride Butyl Chloride
Material organic layer organic layer organic layer
Benzocaine clear clear clear
Cocaine blue blue clear
Cocaine Base blue blue clear
Dextrose clear clear clear
Diphenhydramine blue blue clear
Heroin clear clear clear
Inositol clear clear clear
Lidocaine blue blue white
Methamphetamine clear clear clear
MDMA clear clear clear
Morphine clear clear clear
Procaine clear clear clear
Soap clear clear clear
Sodium Bicarbonate clear clear clear
* * * * *
Microgram Journal, Volume 3, Numbers 3-4 (July - December 2005) 185
Brought to you by AltGov2 [www.altgov2.org]
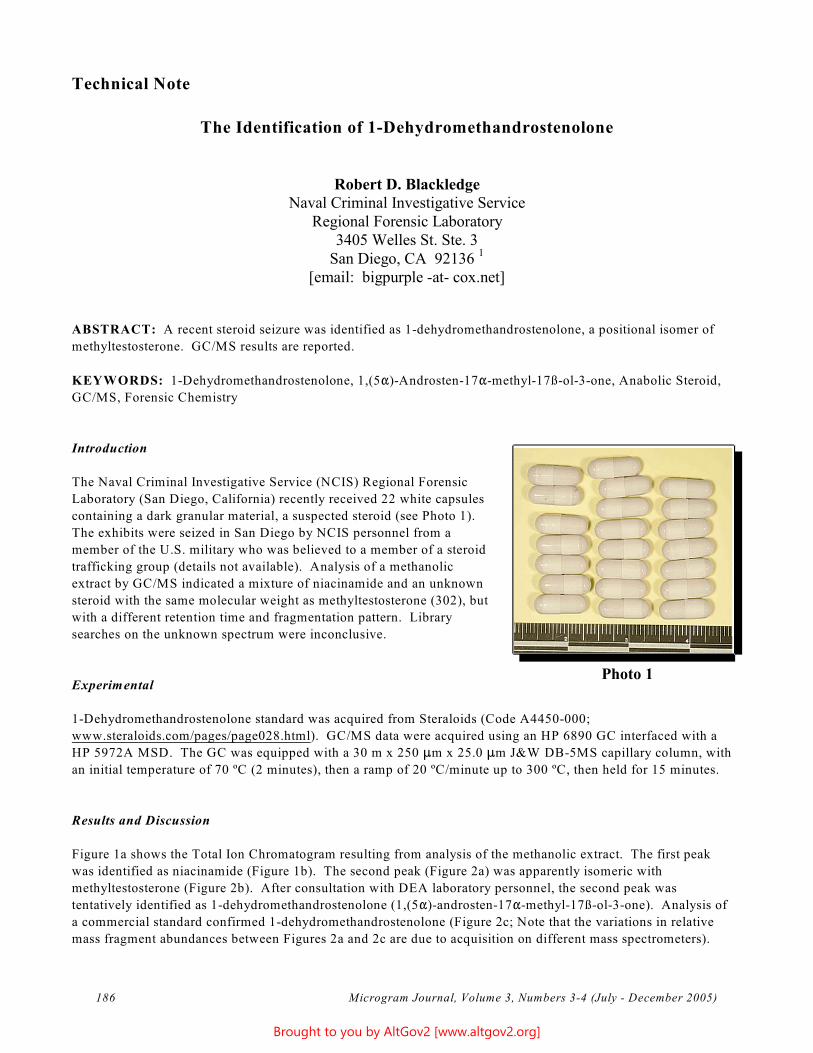
Technical Note
The Identification of 1-Dehydromethandrostenolone
Robert D. Blackledge Naval Criminal Investigative Service
Regional Forensic Laboratory 3405 Welles St. Ste. 3
San Diego, CA 92136 1
[email: bigpurple -at- cox.net]
ABSTRACT: A recent steroid seizure was identified as 1-dehydromethandrostenolone, a positional isomer of
methyltestosterone. GC/MS results are reported.
KEYWORDS: 1-Dehydromethandrostenolone, 1,(5")-Androsten-17"-methyl-17ß-ol-3-one, Anabolic Steroid,
GC/MS, Forensic Chemistry
Introduction
The Naval Criminal Investigative Service (NCIS) Regional Forensic
Laboratory (San Diego, California) recently received 22 white capsules
containing a dark granular material, a suspected steroid (see Photo 1).
The exhibits were seized in San Diego by NCIS personnel from a
member of the U.S. military who was believed to a member of a steroid
trafficking group (details not available). Analysis of a methanolic
extract by GC/MS indicated a mixture of niacinamide and an unknown
steroid with the same molecular weight as methyltestosterone (302), but
with a different retention time and fragmentation pattern. Library
searches on the unknown spectrum were inconclusive.
Photo 1 Experimental
1-Dehydromethandrostenolone standard was acquired from Steraloids (Code A4450-000;
www.steraloids.com/pages/page028.html). GC/MS data were acquired using an HP 6890 GC interfaced with a
HP 5972A MSD. The GC was equipped with a 30 m x 250 :m x 25.0 :m J&W DB-5MS capillary column, with
an initial temperature of 70 ºC (2 minutes), then a ramp of 20 ºC/minute up to 300 ºC, then held for 15 minutes.
Results and Discussion
Figure 1a shows the Total Ion Chromatogram resulting from analysis of the methanolic extract. The first peak
was identified as niacinamide (Figure 1b). The second peak (Figure 2a) was apparently isomeric with
methyltestosterone (Figure 2b). After consultation with DEA laboratory personnel, the second peak was
tentatively identified as 1-dehydromethandrostenolone (1,(5")-androsten-17"-methyl-17ß-ol-3-one). Analysis of
a commercial standard confirmed 1-dehydromethandrostenolone (Figure 2c; Note that the variations in relative
mass fragment abundances between Figures 2a and 2c are due to acquisition on different mass spectrometers).
Microgram Journal, Volume 3, Numbers 3-4 (July - December 2005) 186
Brought to you by AltGov2 [www.altgov2.org]
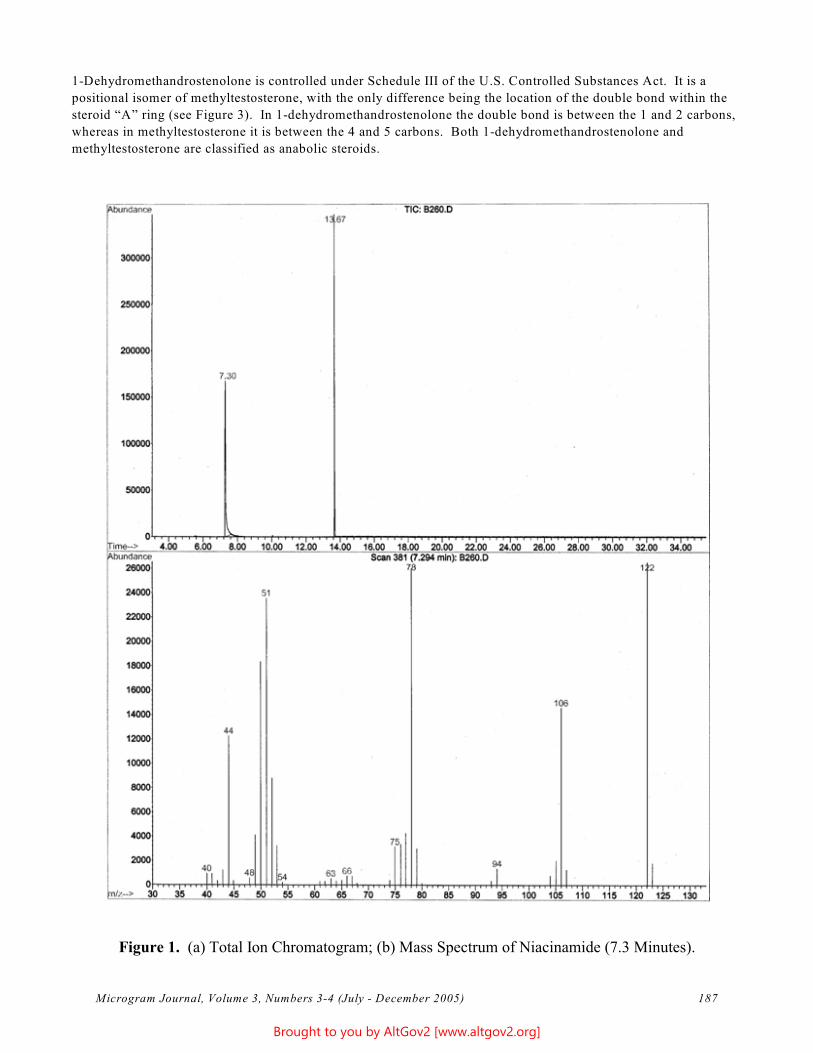
1-Dehydromethandrostenolone is controlled under Schedule III of the U.S. Controlled Substances Act. It is a
positional isomer of methyltestosterone, with the only difference being the location of the double bond within the
steroid “A” ring (see Figure 3). In 1-dehydromethandrostenolone the double bond is between the 1 and 2 carbons,
whereas in methyltestosterone it is between the 4 and 5 carbons. Both 1-dehydromethandrostenolone and
methyltestosterone are classified as anabolic steroids.
Figure 1. (a) Total Ion Chromatogram; (b) Mass Spectrum of Niacinamide (7.3 Minutes).
Microgram Journal, Volume 3, Numbers 3-4 (July - December 2005) 187
Brought to you by AltGov2 [www.altgov2.org]
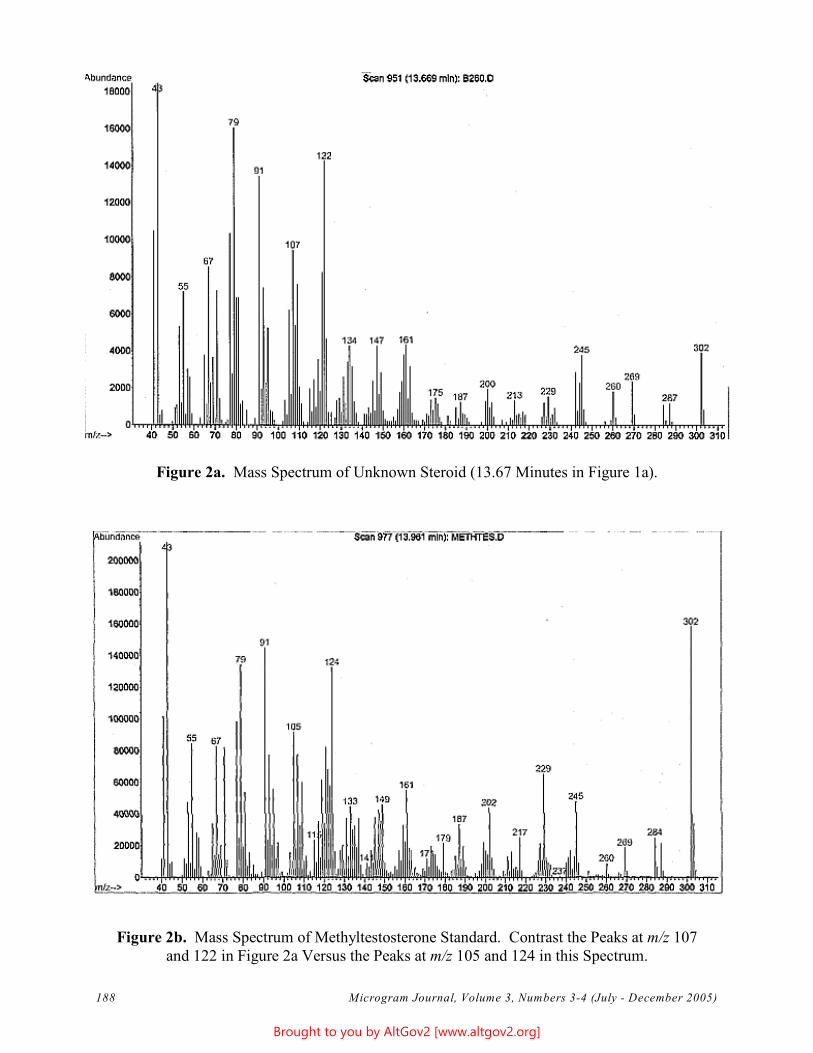
Figure 2a. Mass Spectrum of Unknown Steroid (13.67 Minutes in Figure 1a).
Figure 2b. Mass Spectrum of Methyltestosterone Standard. Contrast the Peaks at m/z 107and 122 in Figure 2a Versus the Peaks at m/z 105 and 124 in this Spectrum.
Microgram Journal, Volume 3, Numbers 3-4 (July - December 2005) 188
Brought to you by AltGov2 [www.altgov2.org]
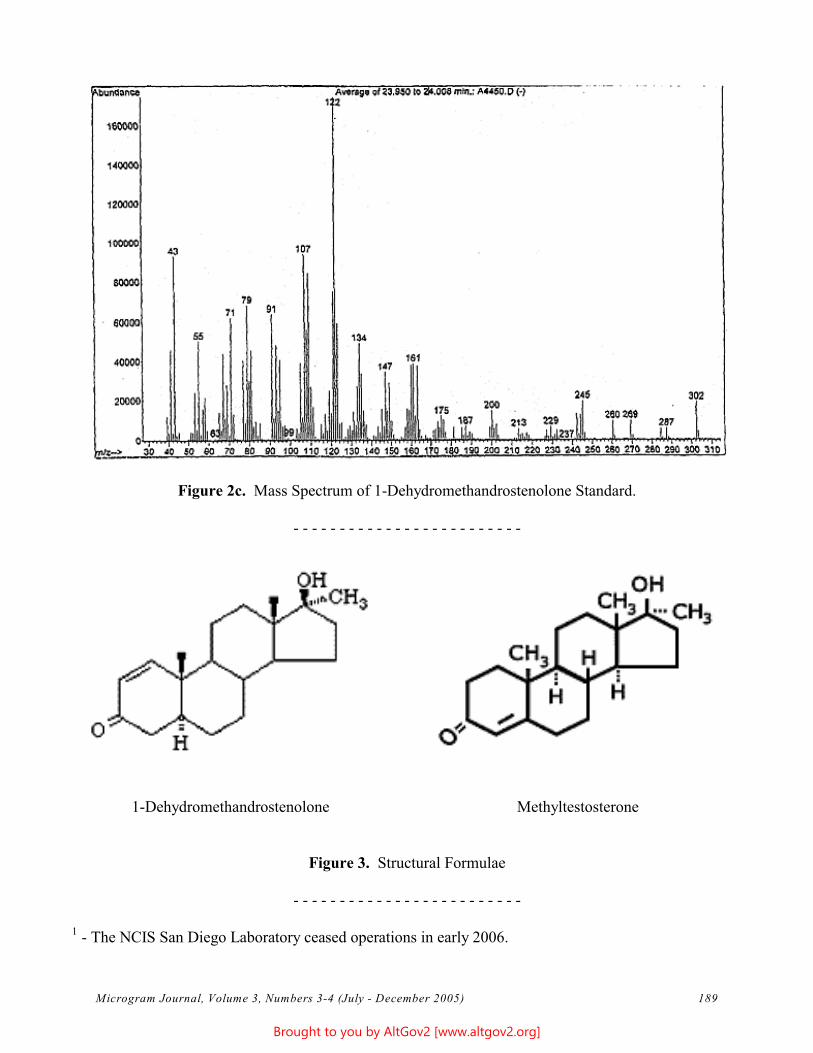
- - - - - - - - - - - - - - - - - - - - - - - - -
- - - - - - - - - - - - - - - - - - - - - - - - -
Figure 2c. Mass Spectrum of 1-Dehydromethandrostenolone Standard.
1-Dehydromethandrostenolone Methyltestosterone
Figure 3. Structural Formulae
1 - The NCIS San Diego Laboratory ceased operations in early 2006.
Microgram Journal, Volume 3, Numbers 3-4 (July - December 2005) 189
Brought to you by AltGov2 [www.altgov2.org]
U.S. Department of JusticeDrug Enforcement Administration
www.dea.gov
MicrogramJournal
To Assist and Serve Scientists Concerned with the Detection and Analysis of ControlledSubstances and Other Abused Substances for Forensic / Law Enforcement Purposes.
Published by: The U.S. Attorney General has determined that the publication of thisThe Drug Enforcement Administration periodical is necessary in the transaction of the public business Office of Forensic Sciences required by the Department of Justice. Information, instructions, and Washington, DC 20537 disclaimers are published in the first issue of each year.
Volume 4Numbers 1-4 Posted On-Line At:January - December 2006 www.dea.gov/programs/forensicsci/microgram/index.html
Brought to you by AltGov2 [www.altgov2.org]
2 Microgram Journal, Volume 4, Numbers 1-4 (January - December 2006)
Contents
Identification of Bufotenine in Yopo Seeds via GC/IRD 3Robert D. Blackledge and Clay P. Phelan
Analytical Profiles for 3,4,5-, 2,4,5-, and 2,4,6-Trimethoxyamphetamine 12Kenji Tsujikawa, Tatsuyuki Kanamori, Kenji Kuwayama, Hajime Miyaguchi,Yuko Iwata, and Hiroyuki Inoue
A New, Highly Specific Color Test for Ketamine 24Mohammad Sarwar
Eszopiclone (Lunesta™): An Analytical Profile 29Roxanne E. Franckowski and Robert A. Thompson
Isolation of cis-Cinnamoylcocaine from Crude Illicit Cocaine via Alumina 37Column ChromatographyJohn F. Casale, Enrique L. Piñero, and Elizabeth M. Corbeil
The Characterization of 4-Methoxy-N-ethylamphetamine Hydrochloride 42John F. Casale, Patrick A. Hays, Trinette K. Spratley, and Pamela R. Smith
Quantitation of Cocaine by Gas Chromatography-Flame Ionization Detection Utilizing 47Isopropylcocaine as a Structurally Related Internal StandardEnrique L. Piñero and John F. Casale
Dehydrochlormethyltestosterone: An Analytical Profile 54Eric S. Wisniewski and Patrick A. Hays
Qualitative and Quantitative Analysis of Ionamin 30 Capsules (Containing 66a Time-Release Formulation of Phentermine)Nicole R. Edwards
Information and Instructions for Authors 70
- - - - - - - - - -
Note: In order to prevent automated theft of email addresses off the Internet postings of MicrogramJournal, all email addresses reported in the Journal have had the “@” character replaced by “ -at- ”.
Cover Art: “Ball and Stick” Model of )9-Tetrahydrocannabinol (Courtesy of Patrick A. Hays, DEASpecial Testing and Research Laboratory, Dulles, VA).
Brought to you by AltGov2 [www.altgov2.org]
Microgram Journal, Volume 4, Numbers 1-4 (January - December 2006) 3
Technical Note
Identification of Bufotenine in Yopo Seeds via GC/IRD
Robert D. Blackledge*U.S. Naval Criminal Investigative ServiceRegional Forensic Laboratory - San Diego
3405 Welles St., Suite 3San Diego, CA 92136 1
[email: bigpurple -at- cox.net]
Clay P. PhelanU.S. Department of Justice
Drug Enforcement AdministrationSouth Central Laboratory
10150 E. Technology Blvd.Dallas, TX 75220
[email: clay.p.phelan -at- usdoj.gov]
ABSTRACT: The analysis of seeds from yopo (Anadenanthera peregrina) by GC/IRD and GC/MS is presented. The GC/IRD technique is easily able to discriminate between bufotenine (present in yopo seeds) and its positionalisomer psilocin.
KEYWORDS: Yopo, Anadenanthera Peregrina, Bufonenine, Psilocin, Tryptamines, GC/IRD, GC/MS,Forensic Chemistry
Introduction
Yopo (Anadenanthera peregrina) is a tree that is native to the open plains of South America (1,2). Its leaves,bark, and seeds (sometime called “beans”) reportedly contain bufotenine (5-hydroxydimethyltryptamine),dimethyltryptamine (DMT), and 5-methoxydimethyltryptamine (5-MeO-DMT) (1-6). The seeds are ground witha mortar and pestle into a snuff-like powder that is used by indigenous peoples in various religious rituals. Because the various tryptamines that are present in yopo are hallucinogenic, the seeds are also subject to abuse,and so are irregularly encountered in forensic laboratories (3).
Recently, this laboratory (NCIS - RFL - San Diego) received a zip-lock plastic bag that contained approximately20 suspected yopo seeds (see Photo 1, next page). The exhibit had been confiscated from a U.S. Navy member inJapan (no further details).
Analysis of any substrate containing bufotenine by GC/MS is complicated by the similarity of its mass spectrumwith that of its positional isomer psilocin (4-hydroxydimethyltryptamine). Bufotenine and psilocin are bothcontrolled under Schedule I of the U.S. Controlled Substances Act, but bufotenine-containing substrates are
- - - - - - - - - - - - - - - - - - - - - - - - -
1 The NCIS San Diego Laboratory ceased operations in early 2006.
Brought to you by AltGov2 [www.altgov2.org]
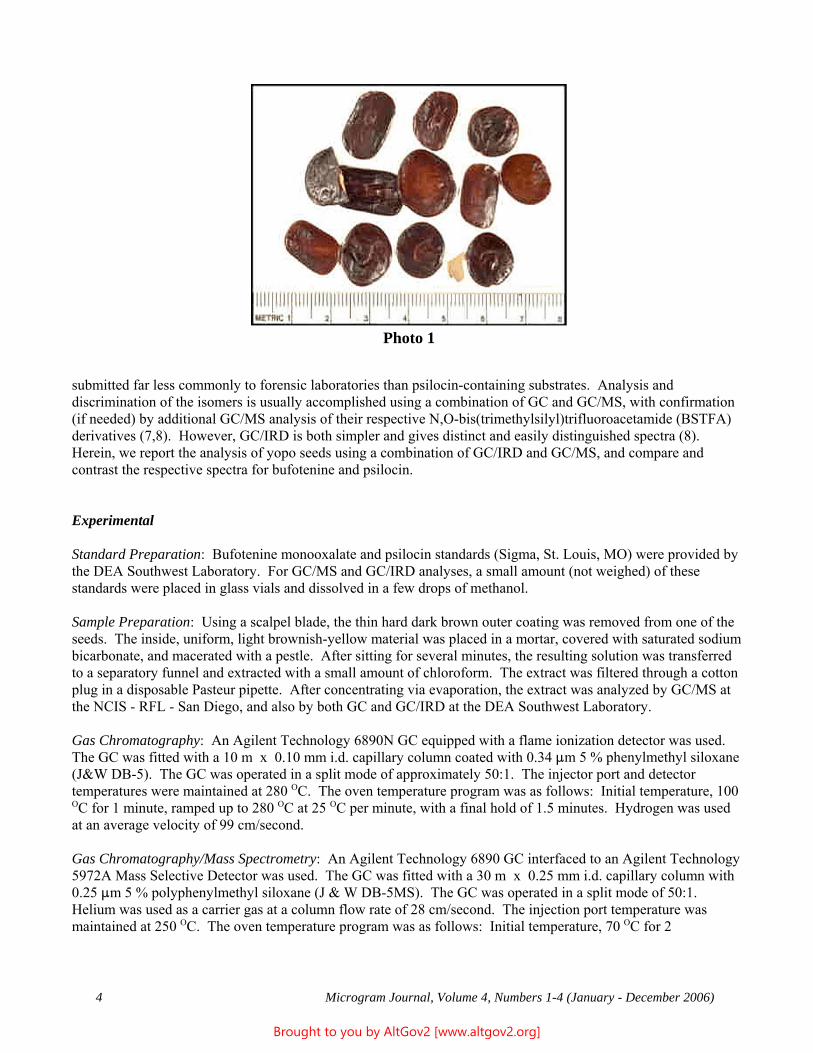
4 Microgram Journal, Volume 4, Numbers 1-4 (January - December 2006)
submitted far less commonly to forensic laboratories than psilocin-containing substrates. Analysis anddiscrimination of the isomers is usually accomplished using a combination of GC and GC/MS, with confirmation(if needed) by additional GC/MS analysis of their respective N,O-bis(trimethylsilyl)trifluoroacetamide (BSTFA)derivatives (7,8). However, GC/IRD is both simpler and gives distinct and easily distinguished spectra (8). Herein, we report the analysis of yopo seeds using a combination of GC/IRD and GC/MS, and compare andcontrast the respective spectra for bufotenine and psilocin.
Experimental
Standard Preparation: Bufotenine monooxalate and psilocin standards (Sigma, St. Louis, MO) were provided bythe DEA Southwest Laboratory. For GC/MS and GC/IRD analyses, a small amount (not weighed) of thesestandards were placed in glass vials and dissolved in a few drops of methanol.
Sample Preparation: Using a scalpel blade, the thin hard dark brown outer coating was removed from one of theseeds. The inside, uniform, light brownish-yellow material was placed in a mortar, covered with saturated sodiumbicarbonate, and macerated with a pestle. After sitting for several minutes, the resulting solution was transferredto a separatory funnel and extracted with a small amount of chloroform. The extract was filtered through a cottonplug in a disposable Pasteur pipette. After concentrating via evaporation, the extract was analyzed by GC/MS atthe NCIS - RFL - San Diego, and also by both GC and GC/IRD at the DEA Southwest Laboratory.
Gas Chromatography: An Agilent Technology 6890N GC equipped with a flame ionization detector was used. The GC was fitted with a 10 m x 0.10 mm i.d. capillary column coated with 0.34 :m 5 % phenylmethyl siloxane(J&W DB-5). The GC was operated in a split mode of approximately 50:1. The injector port and detectortemperatures were maintained at 280 OC. The oven temperature program was as follows: Initial temperature, 100OC for 1 minute, ramped up to 280 OC at 25 OC per minute, with a final hold of 1.5 minutes. Hydrogen was usedat an average velocity of 99 cm/second.
Gas Chromatography/Mass Spectrometry: An Agilent Technology 6890 GC interfaced to an Agilent Technology5972A Mass Selective Detector was used. The GC was fitted with a 30 m x 0.25 mm i.d. capillary column with0.25 :m 5 % polyphenylmethyl siloxane (J & W DB-5MS). The GC was operated in a split mode of 50:1. Helium was used as a carrier gas at a column flow rate of 28 cm/second. The injection port temperature wasmaintained at 250 OC. The oven temperature program was as follows: Initial temperature, 70 OC for 2
Photo 1
Brought to you by AltGov2 [www.altgov2.org]
Microgram Journal, Volume 4, Numbers 1-4 (January - December 2006) 5
minutes, ramped up to 300 OC at 20 OC per minute, with a final hold of 15 minutes. The MSD transfer line wasmaintained at 280 OC. The MSD was operated at 70 eV.
Gas Chromatography/Infrared Spectroscopy: A Varian/Digilab GC/IRD was used. The GC was fitted with a 25m x 0.32 mm i.d. capillary column with 0.52 :m 5 % phenylmethyl siloxane (HP-5). The GC was operated in asplitless mode, with a purge delay time of 0.50 minute. Helium was used as the carrier gas at a column flow rateof 36 cm/second. The injector port temperature was maintained at 275 OC. The oven temperature program was asfollows: Initial temperature, 70 OC for 1 minute; ramped up to 300 OC at 25 OC per minute, with a final hold of 3minutes. The flow cell and transfer line temperatures were maintained at 250 OC.
Results and Discussion
The workup procedure gave a chloroform extract that was surprisingly clean, and that contained a significantamount of bufotenine based on the intensities of the GC, GC/MS, and GC/IRD signals. Clearly, even less thanone seed would have provided sufficient sample for analysis and identification. The psilocin eluted prior to thebufotenine on all three instrument systems, and the elution time for the yopo seed extract matched the bufoteninestandard (the seed extract’s greater concentration caused some peak broadening). Figures 1 through 6 show,respectively, the GC, GC/MS, and GC/IRD instrumental results for the seed extract, the psilocin standard, and thebufotenine standard.
Although others have reported that the seeds (or beans) contain DMT and 5-MeO-DMT in addition to bufotenine(1-6), in fact only bufotenine was found in the seeds in this case. A portion of these seeds were sent to James S.Miller, Ph.D., Curator and Director at the William L. Brown Center for Plant Genetic Resources, MissouriBotanical Garden [P.O. Box 299, St. Louis, MO 63166-0299]; Dr. Miller confirmed that the seeds were fromAnadenanthera peregrina, “Yopo.”
References
1. Anonymous. Cebil and yopo (Anadenanthera spp.). http://www.a1b2c3.com/drugs/var003.htm
2. Torres CM, Repke DB. Anadenanthera. Visionary plant of ancient South America. Haworth HerbalPress, Inc., New York:2006. http://www.routledge.com/books/details/9780789026422/
3. Anonymous. Yopo seeds in Crete Township, Illinois. Microgram Bulletin 2004;37(4):69.
4. Shultes RE. Hallucinogenic plants. Golden Press, New York:1976. www.zauberpilz.com/golden/g81-90.htm
5. Von Reis AS. Anadenanthera: Source of the classic tryptamine-containing snuffs of the new world. Psychopharmacology Bulletin 1976;12(4):10-12.
6. De Budowski J. On the alkaloidal composition of the snuff drug yopo from upper Orinoco (Venezuela). Farmaco 1974;29(8):574-578.
7. Burke AA, Lipak AD, Oberdorf CA. BSTFA derivatization of bufotenine. American Academy ofForensic Sciences, New York, NY:1997; Abstract B47.
8. Phelan CP. Identification of psilocin and bufotenine via GC/IRD. Microgram 1999;32(2):83-89. [Note: All issues of Microgram and Microgram Bulletin prior to January 2003 are Law Enforcement Restricted.]
Brought to you by AltGov2 [www.altgov2.org]
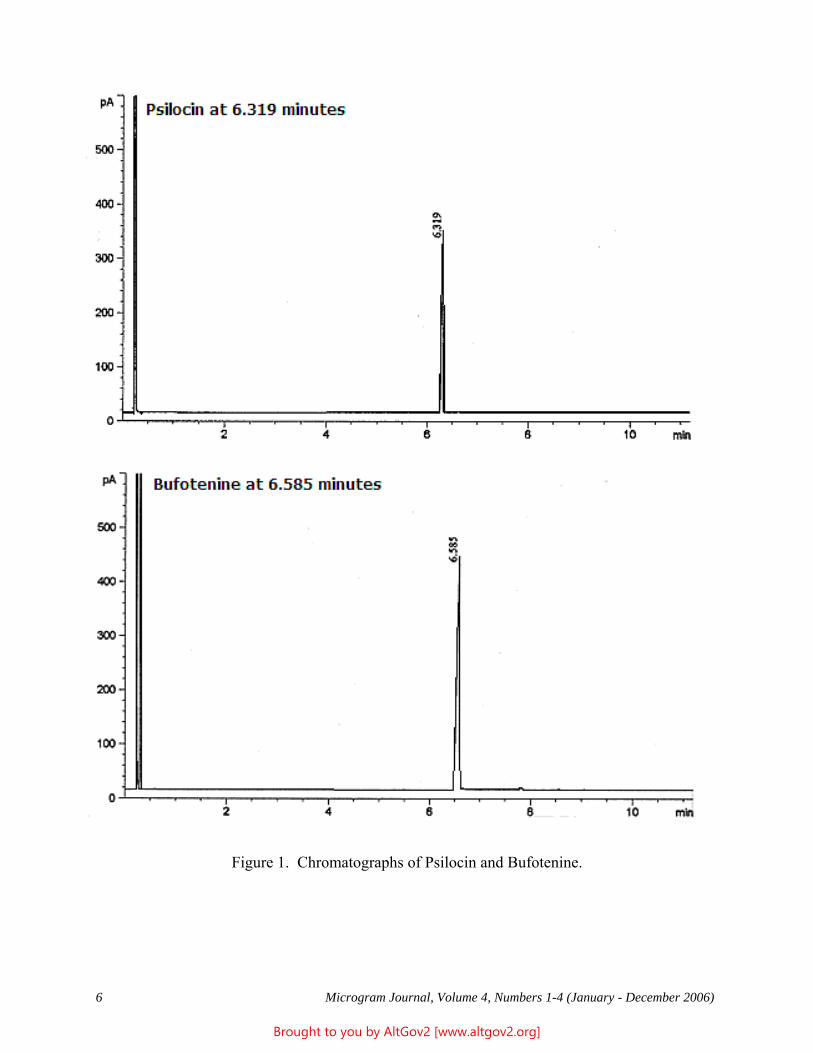
6 Microgram Journal, Volume 4, Numbers 1-4 (January - December 2006)
Figure 1. Chromatographs of Psilocin and Bufotenine.
Brought to you by AltGov2 [www.altgov2.org]
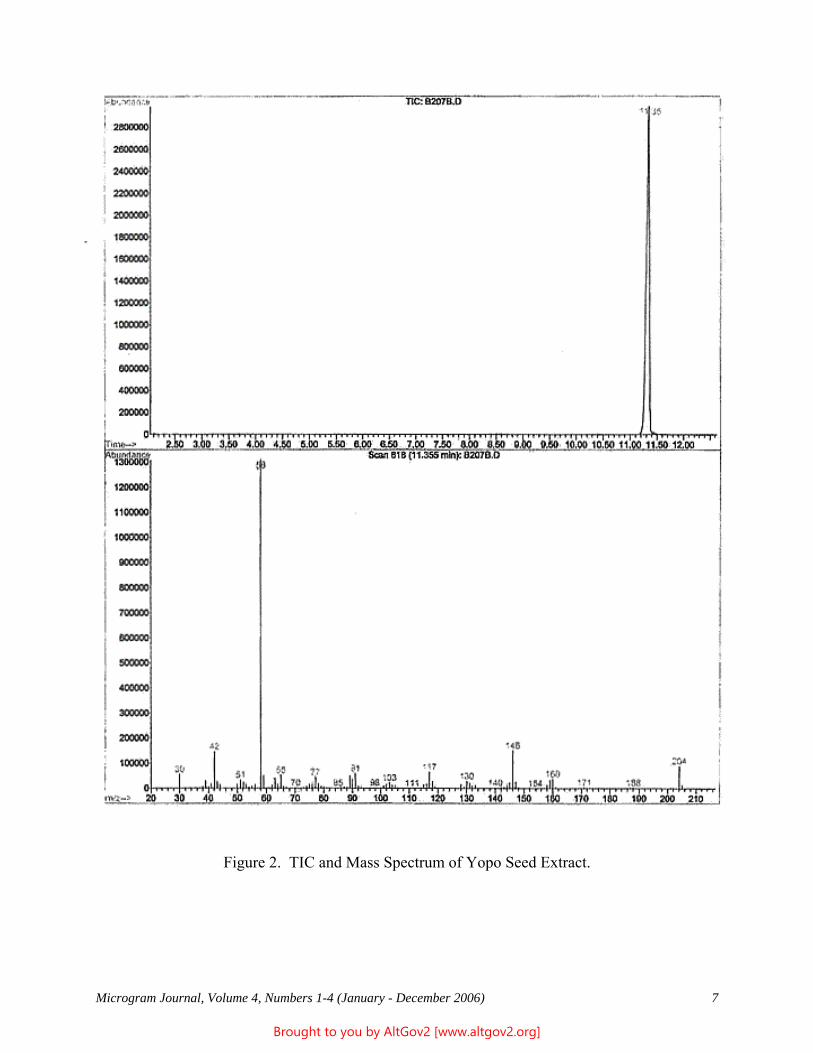
Microgram Journal, Volume 4, Numbers 1-4 (January - December 2006) 7
Figure 2. TIC and Mass Spectrum of Yopo Seed Extract.
Brought to you by AltGov2 [www.altgov2.org]
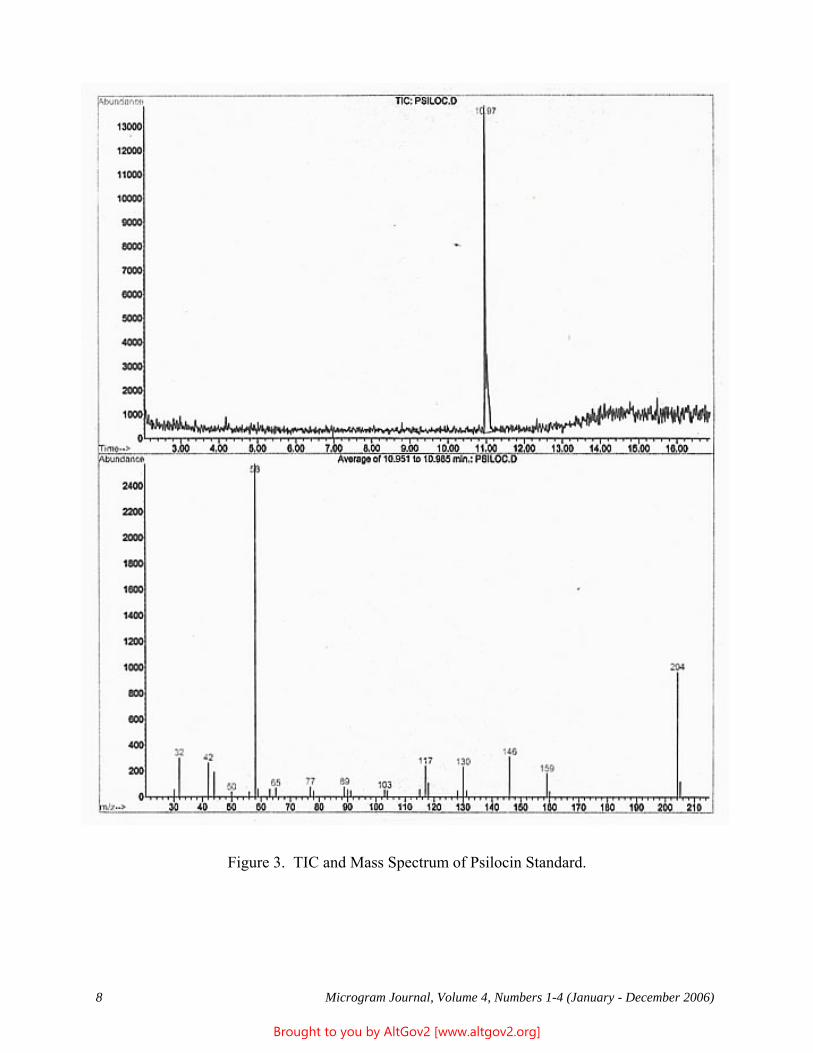
8 Microgram Journal, Volume 4, Numbers 1-4 (January - December 2006)
Figure 3. TIC and Mass Spectrum of Psilocin Standard.
Brought to you by AltGov2 [www.altgov2.org]
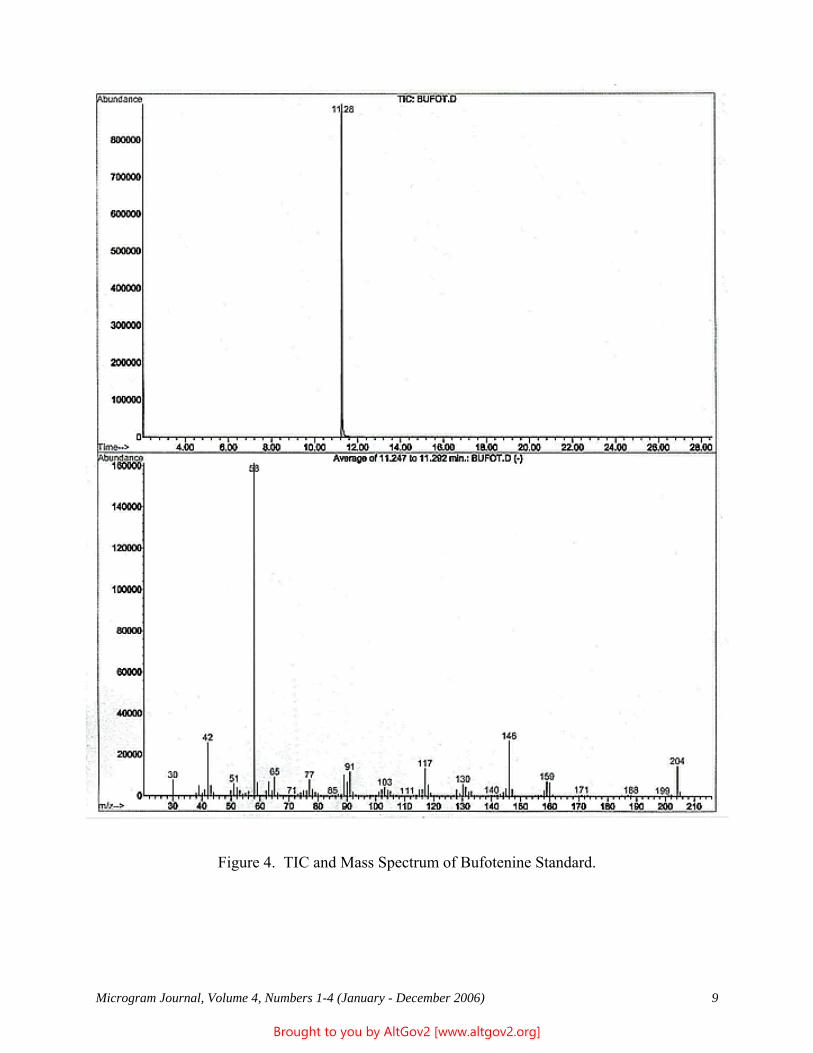
Microgram Journal, Volume 4, Numbers 1-4 (January - December 2006) 9
Figure 4. TIC and Mass Spectrum of Bufotenine Standard.
Brought to you by AltGov2 [www.altgov2.org]
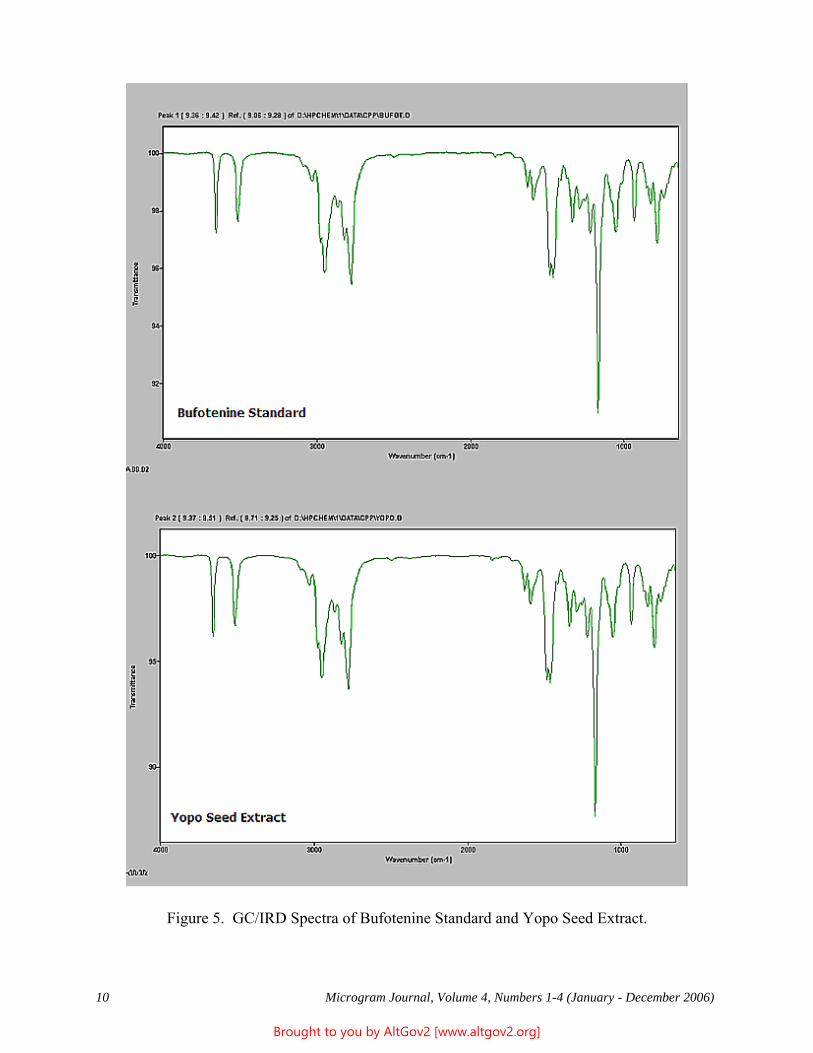
10 Microgram Journal, Volume 4, Numbers 1-4 (January - December 2006)
Figure 5. GC/IRD Spectra of Bufotenine Standard and Yopo Seed Extract.
Brought to you by AltGov2 [www.altgov2.org]
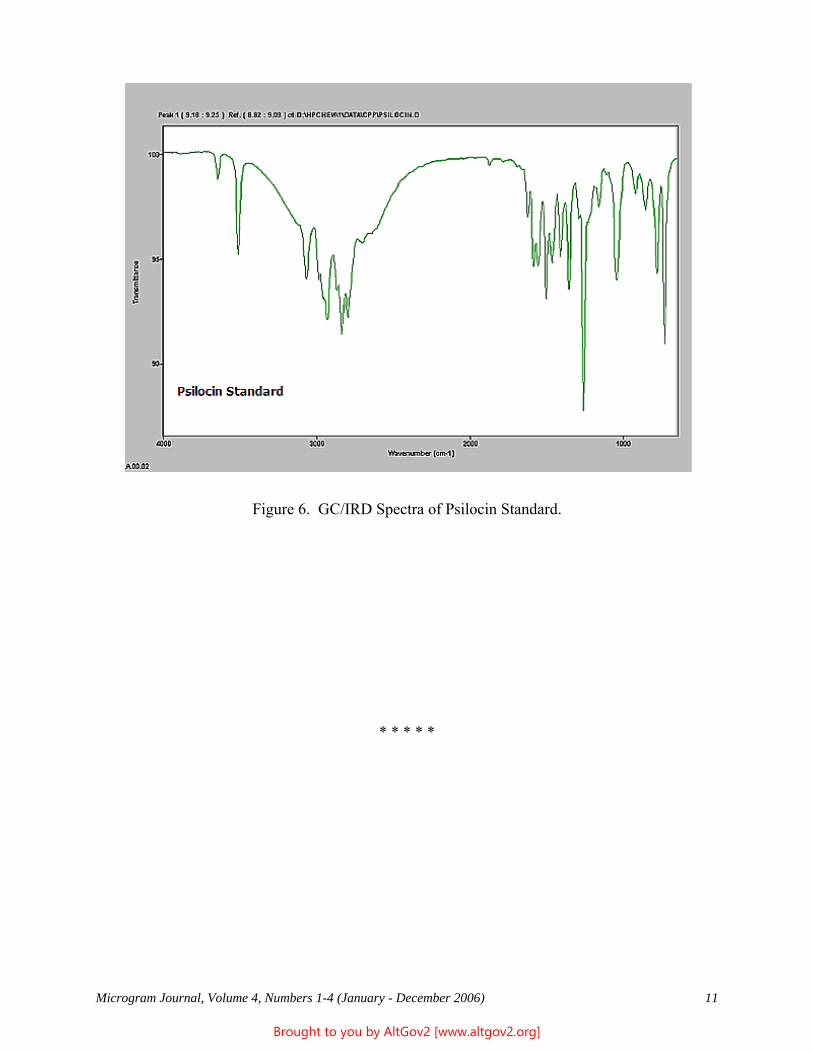
Microgram Journal, Volume 4, Numbers 1-4 (January - December 2006) 11
Figure 6. GC/IRD Spectra of Psilocin Standard.
* * * * *
Brought to you by AltGov2 [www.altgov2.org]
12 Microgram Journal, Volume 4, Numbers 1-4 (January - December 2006)
Analytical Profiles for 3,4,5-, 2,4,5-, and 2,4,6-Trimethoxyamphetamine
Kenji Tsujikawa,* Tatsuyuki Kanamori, Kenji Kuwayama, Hajime Miyaguchi, Yuko Iwata, and Hiroyuki Inoue
National Research Institute of Police Science6-3-1, Kashiwanoha, Kashiwa
Chiba 277-0882, Japan[email: tujikawa -at- nrips.go.jp]
ABSTRACT: Analytical profiles (Marquis color testing, infrared spectroscopy, nuclear magnetic resonance, thinlayer chromatography, high-performance liquid chromatography, and gas chromatography/mass spectrometry) arepresented for 3,4,5-trimethoxyamphetamine, 2,4,5-trimethoxyamphetamine, and 2,4,6-trimethoxyamphetamine. The data allows identification and differentiation of these positional isomers.
KEYWORDS: 3,4,5-Trimethoxyamphetamine, 2,4,5-Trimethoxyamphetamine, 2,4,6-Trimethoxyamphetamine,TMA, Positional Isomers, Marquis, IR, NMR, TLC, HPLC, GC/MS, Forensic Chemistry
Introduction
Most of the trimethoxyamphetamines (TMAs) are hallucinogens (1). There are six different positional isomers,that differ only in the respective positions of the three methoxy groups on the benzene ring (see Figure 1, nextpage). Of the six isomers, 3,4,5-trimethoxyamphetamine (TMA-1), 2,4,5-trimethoxyamphetamine (TMA-2), and2,4,6-trimethoxyamphetamine (TMA-6) are more important than other three isomers, both from the perspective oftheir legal status and their circulation in Japanese drug markets. Unlike in the United States, positional isomers ofhallucinogenic phenethylamines are not automatically controlled under Japanese statutes. Thus, TMA-1 iscontrolled by the Narcotics and Psychotropics Control Law in Japan, while TMA-2 is currently uncontrolled (butis anticipated to be scheduled in the near future), and TMA-6 is currently uncontrolled. In Japan, TMA-1 isusually sold as a solid, while TMA-2 and TMA-6 are more commonly sold in liquid forms, usually mixed withpigments, flavors, and sometimes other psychoactive compounds. Currently, abuse of 2,3,4-trimethoxy-amphetamine (TMA-3), 2,3,5-trimethoxyamphetamine (TMA-4), and 2,3,6-trimethoxyamphetamine (TMA-5)have not been reported in Japan.
Because the legal status of the TMAs vary by structure in Japan, it is important to be able to identify anddifferentiate between (at least) TMA-1, TMA-2, and TMA-6. To our knowledge, no methods have been reportedfor such differentiation. Herein, we present analytical data (color testing, infrared spectroscopy (IR), nuclearmagnetic resonance (NMR), thin layer chromatography (TLC), high-performance liquid chromatography (HPLC),and gas chromatography/mass spectrometry (GC/MS)) for TMA-1, TMA-2, and TMA-6.
Experimental
Syntheses: Authentic standards of hydrochloride salts of TMA-1, TMA-2, and TMA-6 were synthesized in ourlaboratory using previously reported procedures (1). All other chemicals used were of analytical grade.
Color Testing: Marquis reagent was prepared by adding one drop of formaldehyde to 1 mL of concentratedsulfuric acid (2). The sample was placed in a depression of spot plates, and 3 drops of the reagent were added. [The TLC spray reagents are reported below.]
Brought to you by AltGov2 [www.altgov2.org]
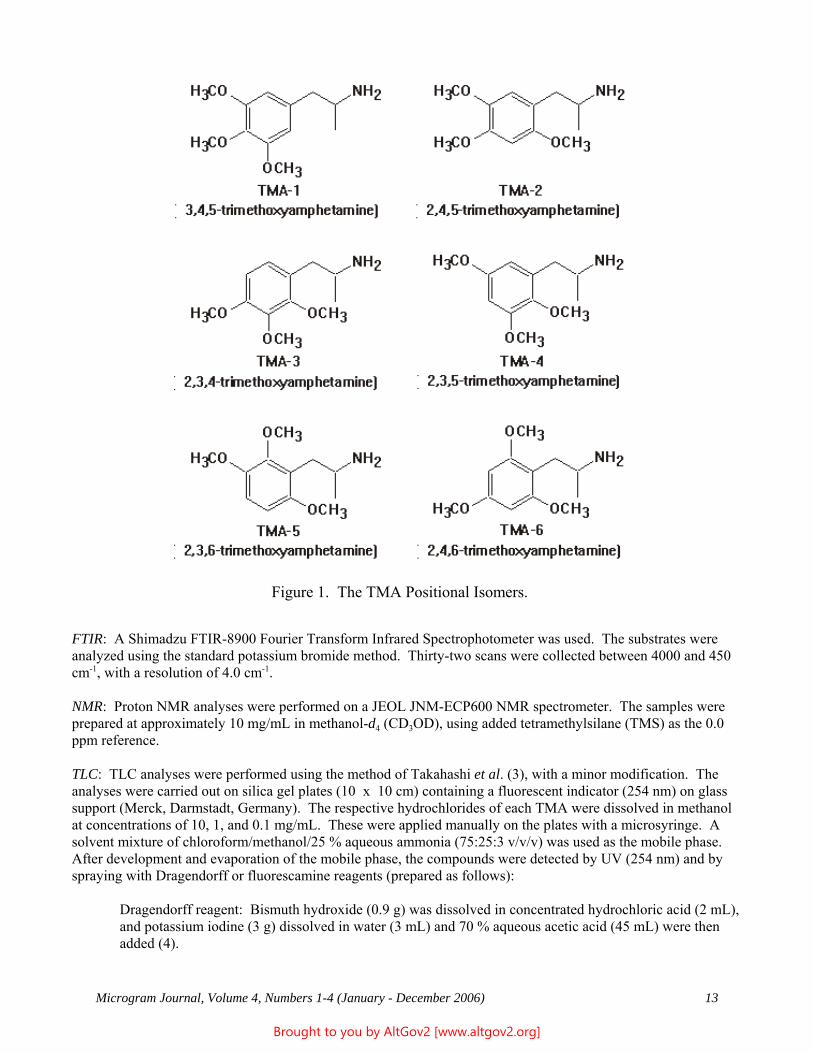
Microgram Journal, Volume 4, Numbers 1-4 (January - December 2006) 13
FTIR: A Shimadzu FTIR-8900 Fourier Transform Infrared Spectrophotometer was used. The substrates wereanalyzed using the standard potassium bromide method. Thirty-two scans were collected between 4000 and 450cm-1, with a resolution of 4.0 cm-1.
NMR: Proton NMR analyses were performed on a JEOL JNM-ECP600 NMR spectrometer. The samples wereprepared at approximately 10 mg/mL in methanol-d4 (CD3OD), using added tetramethylsilane (TMS) as the 0.0ppm reference.
TLC: TLC analyses were performed using the method of Takahashi et al. (3), with a minor modification. Theanalyses were carried out on silica gel plates (10 x 10 cm) containing a fluorescent indicator (254 nm) on glasssupport (Merck, Darmstadt, Germany). The respective hydrochlorides of each TMA were dissolved in methanolat concentrations of 10, 1, and 0.1 mg/mL. These were applied manually on the plates with a microsyringe. Asolvent mixture of chloroform/methanol/25 % aqueous ammonia (75:25:3 v/v/v) was used as the mobile phase. After development and evaporation of the mobile phase, the compounds were detected by UV (254 nm) and byspraying with Dragendorff or fluorescamine reagents (prepared as follows):
Dragendorff reagent: Bismuth hydroxide (0.9 g) was dissolved in concentrated hydrochloric acid (2 mL),and potassium iodine (3 g) dissolved in water (3 mL) and 70 % aqueous acetic acid (45 mL) were thenadded (4).
Figure 1. The TMA Positional Isomers.
Brought to you by AltGov2 [www.altgov2.org]
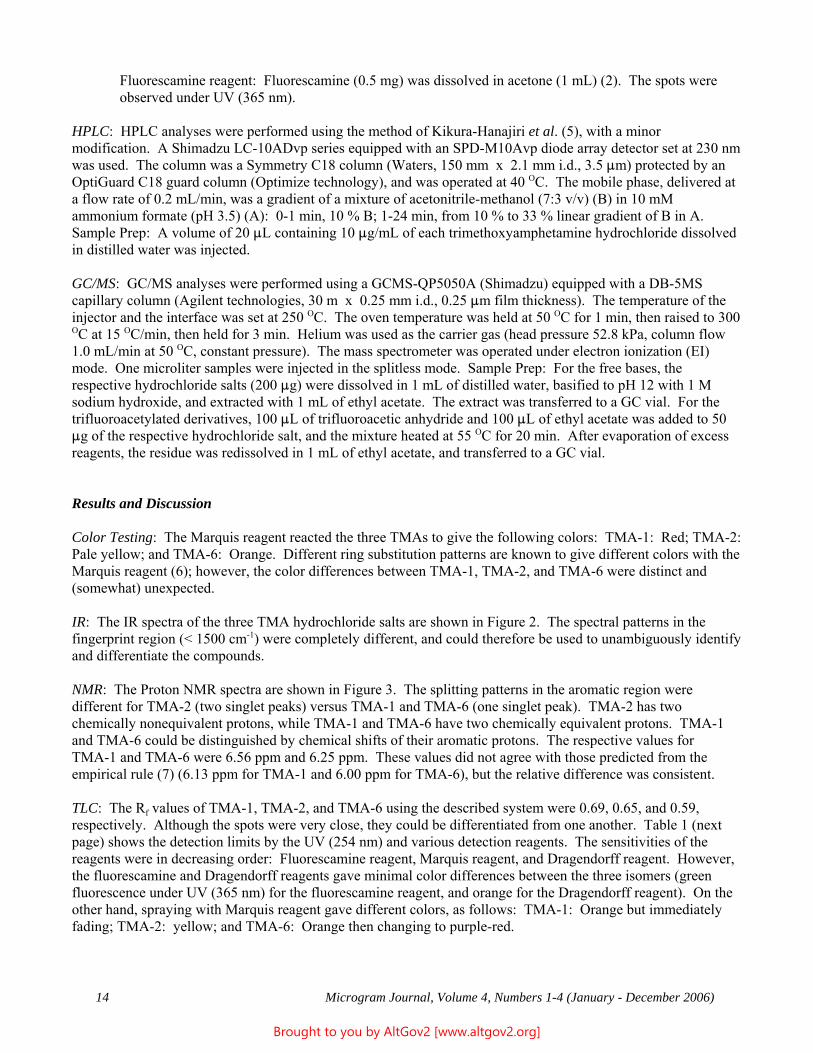
14 Microgram Journal, Volume 4, Numbers 1-4 (January - December 2006)
Fluorescamine reagent: Fluorescamine (0.5 mg) was dissolved in acetone (1 mL) (2). The spots wereobserved under UV (365 nm).
HPLC: HPLC analyses were performed using the method of Kikura-Hanajiri et al. (5), with a minormodification. A Shimadzu LC-10ADvp series equipped with an SPD-M10Avp diode array detector set at 230 nmwas used. The column was a Symmetry C18 column (Waters, 150 mm x 2.1 mm i.d., 3.5 :m) protected by anOptiGuard C18 guard column (Optimize technology), and was operated at 40 OC. The mobile phase, delivered ata flow rate of 0.2 mL/min, was a gradient of a mixture of acetonitrile-methanol (7:3 v/v) (B) in 10 mMammonium formate (pH 3.5) (A): 0-1 min, 10 % B; 1-24 min, from 10 % to 33 % linear gradient of B in A. Sample Prep: A volume of 20 :L containing 10 :g/mL of each trimethoxyamphetamine hydrochloride dissolvedin distilled water was injected.
GC/MS: GC/MS analyses were performed using a GCMS-QP5050A (Shimadzu) equipped with a DB-5MScapillary column (Agilent technologies, 30 m x 0.25 mm i.d., 0.25 :m film thickness). The temperature of theinjector and the interface was set at 250 OC. The oven temperature was held at 50 OC for 1 min, then raised to 300OC at 15 OC/min, then held for 3 min. Helium was used as the carrier gas (head pressure 52.8 kPa, column flow1.0 mL/min at 50 OC, constant pressure). The mass spectrometer was operated under electron ionization (EI)mode. One microliter samples were injected in the splitless mode. Sample Prep: For the free bases, therespective hydrochloride salts (200 :g) were dissolved in 1 mL of distilled water, basified to pH 12 with 1 Msodium hydroxide, and extracted with 1 mL of ethyl acetate. The extract was transferred to a GC vial. For thetrifluoroacetylated derivatives, 100 :L of trifluoroacetic anhydride and 100 :L of ethyl acetate was added to 50:g of the respective hydrochloride salt, and the mixture heated at 55 OC for 20 min. After evaporation of excessreagents, the residue was redissolved in 1 mL of ethyl acetate, and transferred to a GC vial.
Results and Discussion
Color Testing: The Marquis reagent reacted the three TMAs to give the following colors: TMA-1: Red; TMA-2: Pale yellow; and TMA-6: Orange. Different ring substitution patterns are known to give different colors with theMarquis reagent (6); however, the color differences between TMA-1, TMA-2, and TMA-6 were distinct and(somewhat) unexpected.
IR: The IR spectra of the three TMA hydrochloride salts are shown in Figure 2. The spectral patterns in thefingerprint region (< 1500 cm-1) were completely different, and could therefore be used to unambiguously identifyand differentiate the compounds.
NMR: The Proton NMR spectra are shown in Figure 3. The splitting patterns in the aromatic region weredifferent for TMA-2 (two singlet peaks) versus TMA-1 and TMA-6 (one singlet peak). TMA-2 has twochemically nonequivalent protons, while TMA-1 and TMA-6 have two chemically equivalent protons. TMA-1and TMA-6 could be distinguished by chemical shifts of their aromatic protons. The respective values forTMA-1 and TMA-6 were 6.56 ppm and 6.25 ppm. These values did not agree with those predicted from theempirical rule (7) (6.13 ppm for TMA-1 and 6.00 ppm for TMA-6), but the relative difference was consistent.
TLC: The Rf values of TMA-1, TMA-2, and TMA-6 using the described system were 0.69, 0.65, and 0.59,respectively. Although the spots were very close, they could be differentiated from one another. Table 1 (nextpage) shows the detection limits by the UV (254 nm) and various detection reagents. The sensitivities of thereagents were in decreasing order: Fluorescamine reagent, Marquis reagent, and Dragendorff reagent. However,the fluorescamine and Dragendorff reagents gave minimal color differences between the three isomers (greenfluorescence under UV (365 nm) for the fluorescamine reagent, and orange for the Dragendorff reagent). On theother hand, spraying with Marquis reagent gave different colors, as follows: TMA-1: Orange but immediatelyfading; TMA-2: yellow; and TMA-6: Orange then changing to purple-red.
Brought to you by AltGov2 [www.altgov2.org]
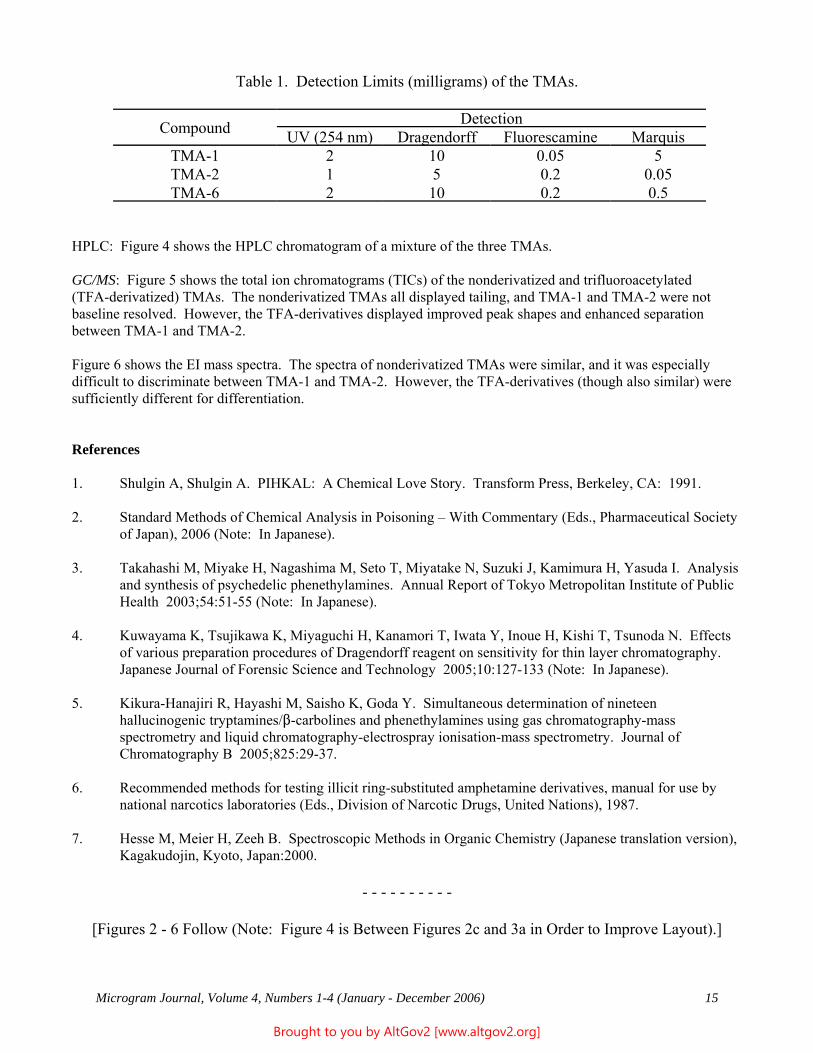
Microgram Journal, Volume 4, Numbers 1-4 (January - December 2006) 15
Table 1. Detection Limits (milligrams) of the TMAs.
Compound DetectionUV (254 nm) Dragendorff Fluorescamine Marquis
TMA-1 2 10 0.05 5TMA-2 1 5 0.2 0.05TMA-6 2 10 0.2 0.5
HPLC: Figure 4 shows the HPLC chromatogram of a mixture of the three TMAs.
GC/MS: Figure 5 shows the total ion chromatograms (TICs) of the nonderivatized and trifluoroacetylated(TFA-derivatized) TMAs. The nonderivatized TMAs all displayed tailing, and TMA-1 and TMA-2 were notbaseline resolved. However, the TFA-derivatives displayed improved peak shapes and enhanced separationbetween TMA-1 and TMA-2.
Figure 6 shows the EI mass spectra. The spectra of nonderivatized TMAs were similar, and it was especiallydifficult to discriminate between TMA-1 and TMA-2. However, the TFA-derivatives (though also similar) weresufficiently different for differentiation.
References
1. Shulgin A, Shulgin A. PIHKAL: A Chemical Love Story. Transform Press, Berkeley, CA: 1991.
2. Standard Methods of Chemical Analysis in Poisoning – With Commentary (Eds., Pharmaceutical Societyof Japan), 2006 (Note: In Japanese).
3. Takahashi M, Miyake H, Nagashima M, Seto T, Miyatake N, Suzuki J, Kamimura H, Yasuda I. Analysisand synthesis of psychedelic phenethylamines. Annual Report of Tokyo Metropolitan Institute of PublicHealth 2003;54:51-55 (Note: In Japanese).
4. Kuwayama K, Tsujikawa K, Miyaguchi H, Kanamori T, Iwata Y, Inoue H, Kishi T, Tsunoda N. Effectsof various preparation procedures of Dragendorff reagent on sensitivity for thin layer chromatography. Japanese Journal of Forensic Science and Technology 2005;10:127-133 (Note: In Japanese).
5. Kikura-Hanajiri R, Hayashi M, Saisho K, Goda Y. Simultaneous determination of nineteenhallucinogenic tryptamines/$-carbolines and phenethylamines using gas chromatography-massspectrometry and liquid chromatography-electrospray ionisation-mass spectrometry. Journal ofChromatography B 2005;825:29-37.
6. Recommended methods for testing illicit ring-substituted amphetamine derivatives, manual for use bynational narcotics laboratories (Eds., Division of Narcotic Drugs, United Nations), 1987.
7. Hesse M, Meier H, Zeeh B. Spectroscopic Methods in Organic Chemistry (Japanese translation version),Kagakudojin, Kyoto, Japan:2000.
- - - - - - - - - -
[Figures 2 - 6 Follow (Note: Figure 4 is Between Figures 2c and 3a in Order to Improve Layout).]
Brought to you by AltGov2 [www.altgov2.org]
16 Microgram Journal, Volume 4, Numbers 1-4 (January - December 2006)
Figures 2a-b. IR Spectra of the Hydrochloride Salts of TMA-1 and TMA-2.
Brought to you by AltGov2 [www.altgov2.org]
Microgram Journal, Volume 4, Numbers 1-4 (January - December 2006) 17
Figure 2c. IR Spectra of the Hydrochloride Salt of TMA-6.
Figure 4. HPLC Chromatogram of a Mixture of the Three TMAs (Detection: UV 230 nm).Retention times (Minutes): TMA-1 - 10.7, TMA-2 - 11.9, and TMA-6 - 18.7.
Brought to you by AltGov2 [www.altgov2.org]
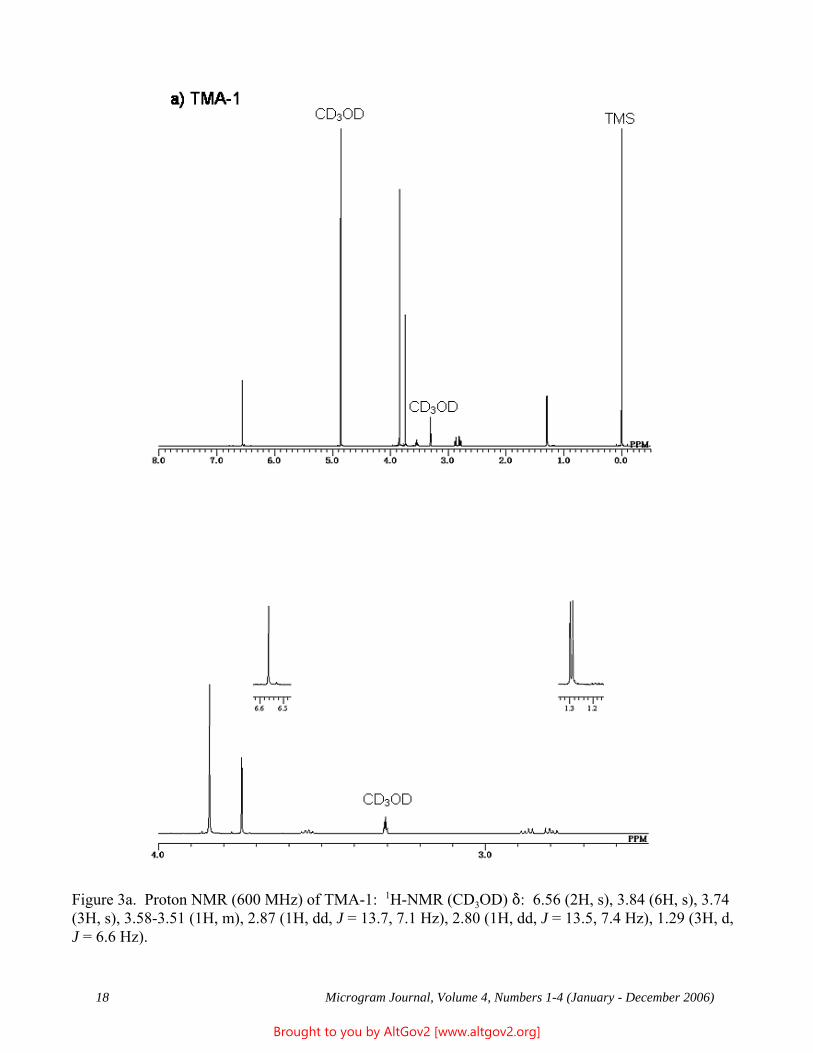
18 Microgram Journal, Volume 4, Numbers 1-4 (January - December 2006)
Figure 3a. Proton NMR (600 MHz) of TMA-1: 1H-NMR (CD3OD) *: 6.56 (2H, s), 3.84 (6H, s), 3.74(3H, s), 3.58-3.51 (1H, m), 2.87 (1H, dd, J = 13.7, 7.1 Hz), 2.80 (1H, dd, J = 13.5, 7.4 Hz), 1.29 (3H, d,J = 6.6 Hz).
Brought to you by AltGov2 [www.altgov2.org]
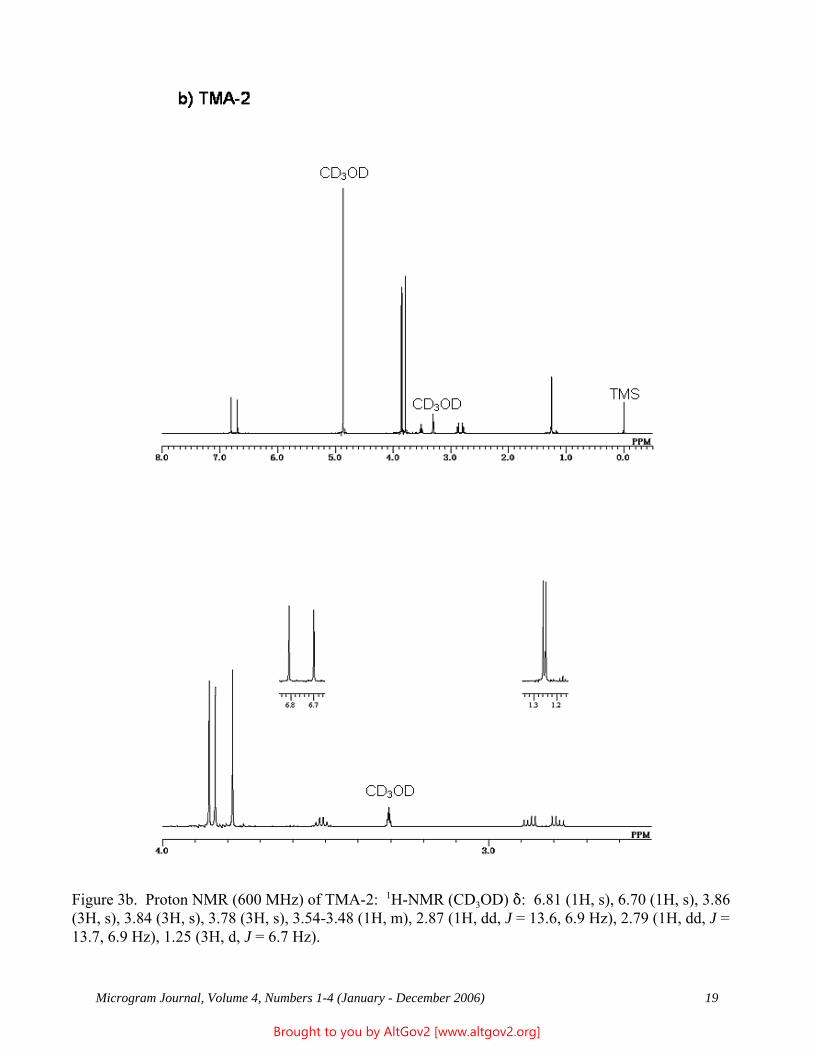
Microgram Journal, Volume 4, Numbers 1-4 (January - December 2006) 19
Figure 3b. Proton NMR (600 MHz) of TMA-2: 1H-NMR (CD3OD) *: 6.81 (1H, s), 6.70 (1H, s), 3.86(3H, s), 3.84 (3H, s), 3.78 (3H, s), 3.54-3.48 (1H, m), 2.87 (1H, dd, J = 13.6, 6.9 Hz), 2.79 (1H, dd, J =13.7, 6.9 Hz), 1.25 (3H, d, J = 6.7 Hz).
Brought to you by AltGov2 [www.altgov2.org]
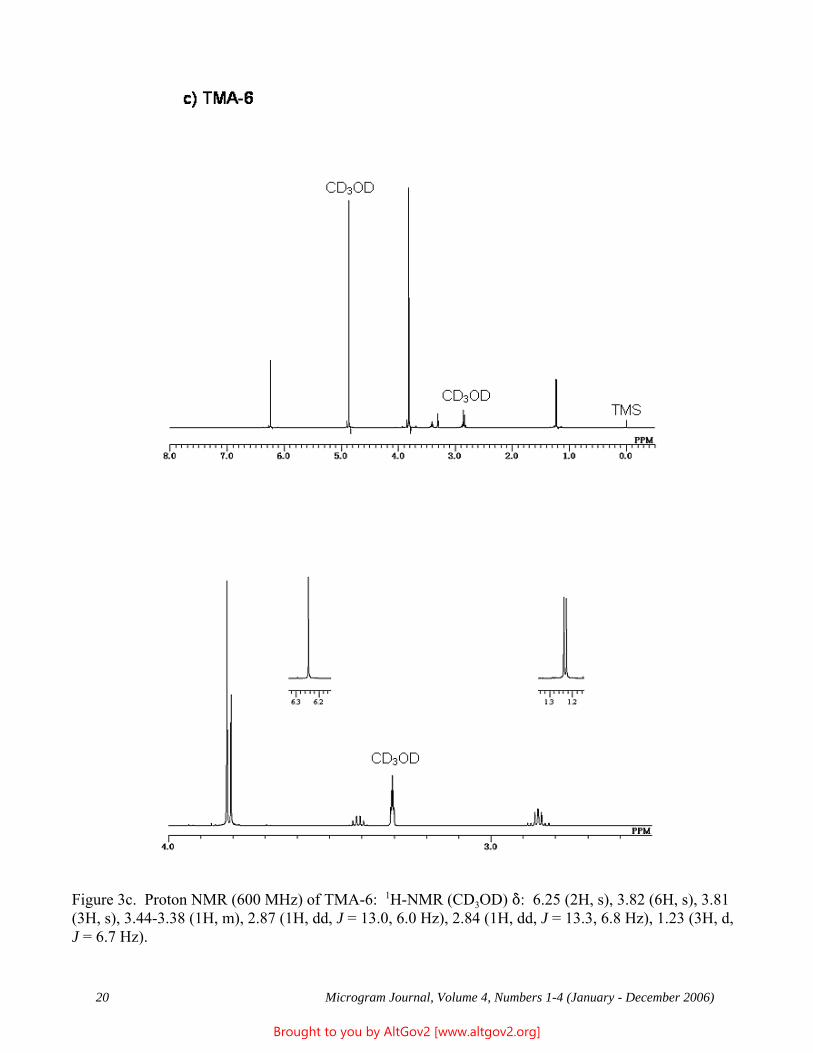
20 Microgram Journal, Volume 4, Numbers 1-4 (January - December 2006)
Figure 3c. Proton NMR (600 MHz) of TMA-6: 1H-NMR (CD3OD) *: 6.25 (2H, s), 3.82 (6H, s), 3.81(3H, s), 3.44-3.38 (1H, m), 2.87 (1H, dd, J = 13.0, 6.0 Hz), 2.84 (1H, dd, J = 13.3, 6.8 Hz), 1.23 (3H, d,J = 6.7 Hz).
Brought to you by AltGov2 [www.altgov2.org]
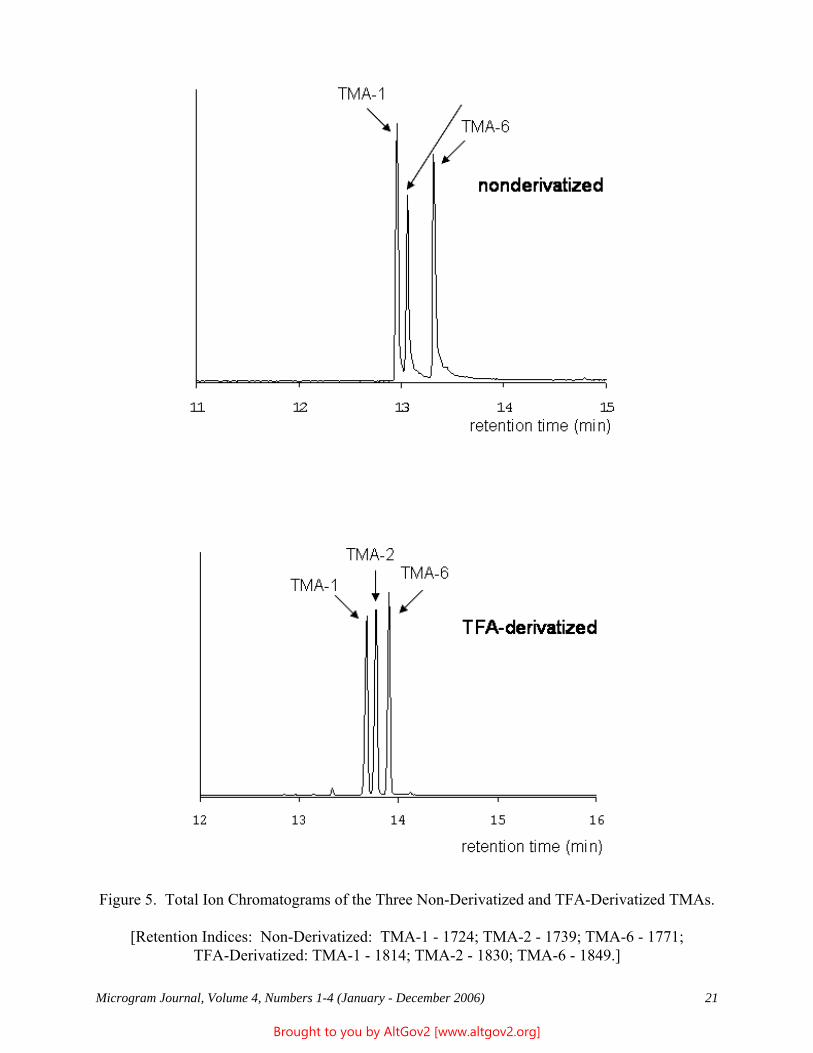
Microgram Journal, Volume 4, Numbers 1-4 (January - December 2006) 21
Figure 5. Total Ion Chromatograms of the Three Non-Derivatized and TFA-Derivatized TMAs.
[Retention Indices: Non-Derivatized: TMA-1 - 1724; TMA-2 - 1739; TMA-6 - 1771;TFA-Derivatized: TMA-1 - 1814; TMA-2 - 1830; TMA-6 - 1849.]
Brought to you by AltGov2 [www.altgov2.org]
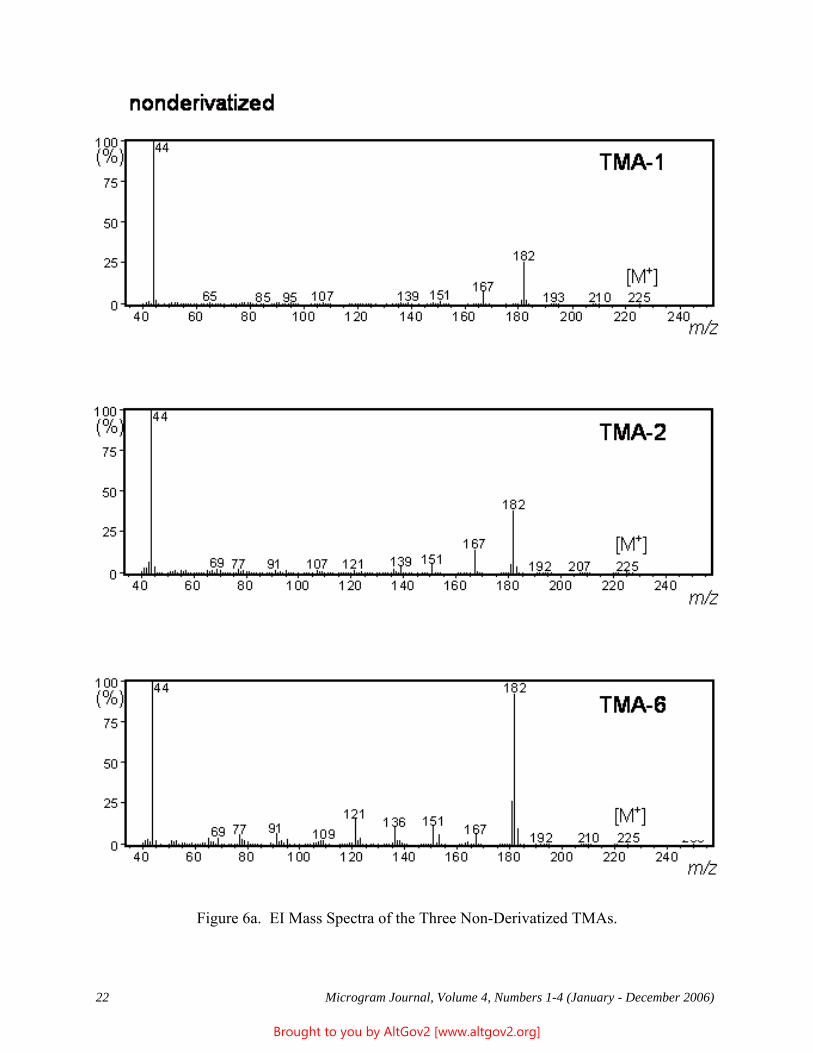
22 Microgram Journal, Volume 4, Numbers 1-4 (January - December 2006)
Figure 6a. EI Mass Spectra of the Three Non-Derivatized TMAs.
Brought to you by AltGov2 [www.altgov2.org]
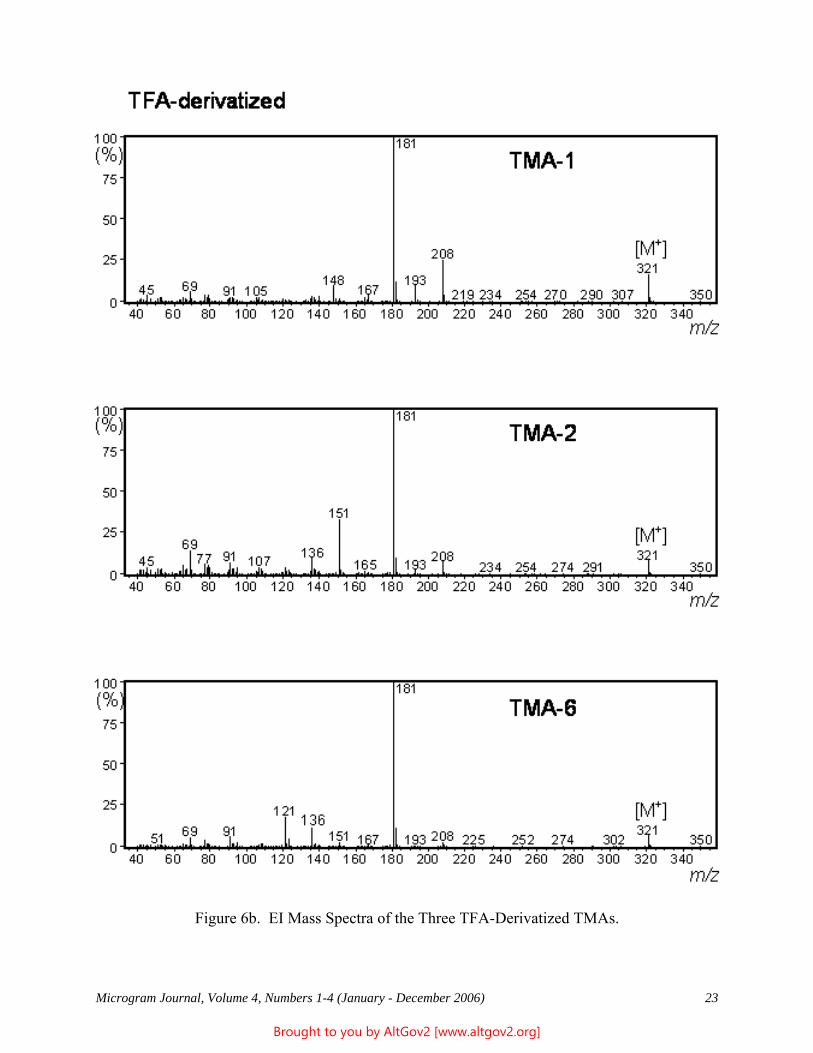
Microgram Journal, Volume 4, Numbers 1-4 (January - December 2006) 23
Figure 6b. EI Mass Spectra of the Three TFA-Derivatized TMAs.
Brought to you by AltGov2 [www.altgov2.org]
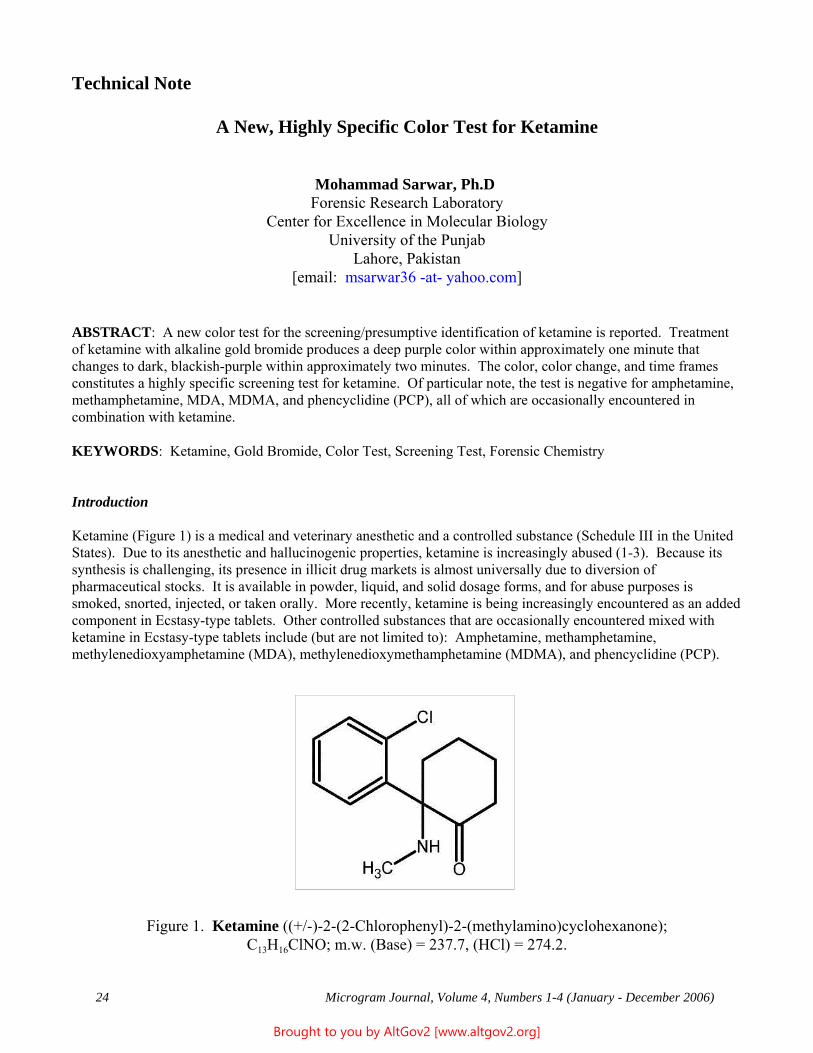
24 Microgram Journal, Volume 4, Numbers 1-4 (January - December 2006)
Technical Note
A New, Highly Specific Color Test for Ketamine
Mohammad Sarwar, Ph.D Forensic Research Laboratory
Center for Excellence in Molecular BiologyUniversity of the Punjab
Lahore, Pakistan[email: msarwar36 -at- yahoo.com]
ABSTRACT: A new color test for the screening/presumptive identification of ketamine is reported. Treatmentof ketamine with alkaline gold bromide produces a deep purple color within approximately one minute thatchanges to dark, blackish-purple within approximately two minutes. The color, color change, and time framesconstitutes a highly specific screening test for ketamine. Of particular note, the test is negative for amphetamine,methamphetamine, MDA, MDMA, and phencyclidine (PCP), all of which are occasionally encountered incombination with ketamine. KEYWORDS: Ketamine, Gold Bromide, Color Test, Screening Test, Forensic Chemistry
Introduction
Ketamine (Figure 1) is a medical and veterinary anesthetic and a controlled substance (Schedule III in the UnitedStates). Due to its anesthetic and hallucinogenic properties, ketamine is increasingly abused (1-3). Because itssynthesis is challenging, its presence in illicit drug markets is almost universally due to diversion ofpharmaceutical stocks. It is available in powder, liquid, and solid dosage forms, and for abuse purposes issmoked, snorted, injected, or taken orally. More recently, ketamine is being increasingly encountered as an addedcomponent in Ecstasy-type tablets. Other controlled substances that are occasionally encountered mixed withketamine in Ecstasy-type tablets include (but are not limited to): Amphetamine, methamphetamine,methylenedioxyamphetamine (MDA), methylenedioxymethamphetamine (MDMA), and phencyclidine (PCP).
Figure 1. Ketamine ((+/-)-2-(2-Chlorophenyl)-2-(methylamino)cyclohexanone);C13H16ClNO; m.w. (Base) = 237.7, (HCl) = 274.2.
Brought to you by AltGov2 [www.altgov2.org]
Microgram Journal, Volume 4, Numbers 1-4 (January - December 2006) 25
There are numerous analytical methods for the identification of ketamine in forensic and toxicologicallaboratories (4-13); however, until recently only one color test (the Janovsky reagent (11,14)) was available forscreening purposes. Unfortunately, although moderately specific the Janovsky reagent (alkaline meta-dinitrobenzene) is rather insensitive (detection limit about 1.25 milligrams) and is therefore infrequently used forscreening of mixed samples or solutions. In early 2007, Morris reported a modified cobalt thiocyanate color testfor ketamine that is highly specific (15); however, it is also rather insensitive (detection limit also about 1.25milligrams). Herein, a new presumptive color test for the preliminary screening of ketamine is reported. The testis simple, easy to perform, nearly twice as sensitive as the Janovsky and Morris tests, and highly specific.
Experimental
Materials: All standards used were from Sigma, Alltech, and Matheson. Gold bromide and sodium hydroxidewere both analytical grade.
Reagents: A 0.5 % solution of gold bromide was prepared in deionized water, resulting in a brownish yellowcolored solution. A 0.2 M solution of NaOH was also prepared in deionized water.
Method: One drop of 0.5 % gold bromide solution and one drop of the 0.2 M NaOH solution were combined in aspot plate well. A small amount of the substrate was added to the spot well and mixed, and the color monitoredover approximately the next 2 minutes.
Results and Discussion
A literature search indicates that gold bromide has not been previously reported for color testing; however,acidified gold bromide has been used in a rather obscure microcrystal test for caffeine (16-18).
As noted in the Experimental section, the alkaline gold bromide test reagent is brownish-yellow in color. Upontreatment with the test reagent, ketamine gives a deep purple color within approximately one minute, that turns toa dark, blackish-purple color within approximately two minutes. A blank does not produce any color changes. Forty-seven other compounds (illicit drugs, adulterants, and diluents) which are frequently encountered inforensic laboratories were also tested (see Table 1, next page). A few of these compounds produced the samepurple color as ketamine, but in all such cases there was a major time difference for the development of the color. A few compounds having hydroxyl or phenolic groups (acetaminophen, ascorbic acid, lactose, mannitol,morphine, and sucrose) gives the purple color almost instantaneously. Similarly, heroin (both standard and street-level) also gives the purple color almost instantaneously (the observation that heroin standard gives a positive testconfirms that the positive test for street-level heroin was not just due to the presence of morphine or sugars). However, none of the tested compounds gave the color and color change like ketamine over the two minute timeframe. In addition, none of the other amine drugs tested gave a positive test, including those most commonlyencountered in combination with ketamine in illicit samples. Ketamine is not commonly encountered incombination with heroin, morphine, or the other tested diluents that do give an instantaneous color development -nonetheless, if a nearly instantaneous color change is observed, the test cannot be used for presumptiveidentification of ketamine.
As noted in the Introduction, the Janovsky and Morris tests have limits of detection of approximately 1.25milligrams, in both cases requiring additional efforts to maximize sensitivity. The limit of detection for thepresented test, with no special efforts to maximize sensitivity, was 0.8 milligrams - nearly twice as sensitive.
The initial purple color may be due to the formation of a complex between the gold and the ketamine. The causefor the change of color from purple to dark blackish-purple is unknown; however, it may be due to a redoxreaction that produces a small amount of colloidal gold.
Brought to you by AltGov2 [www.altgov2.org]
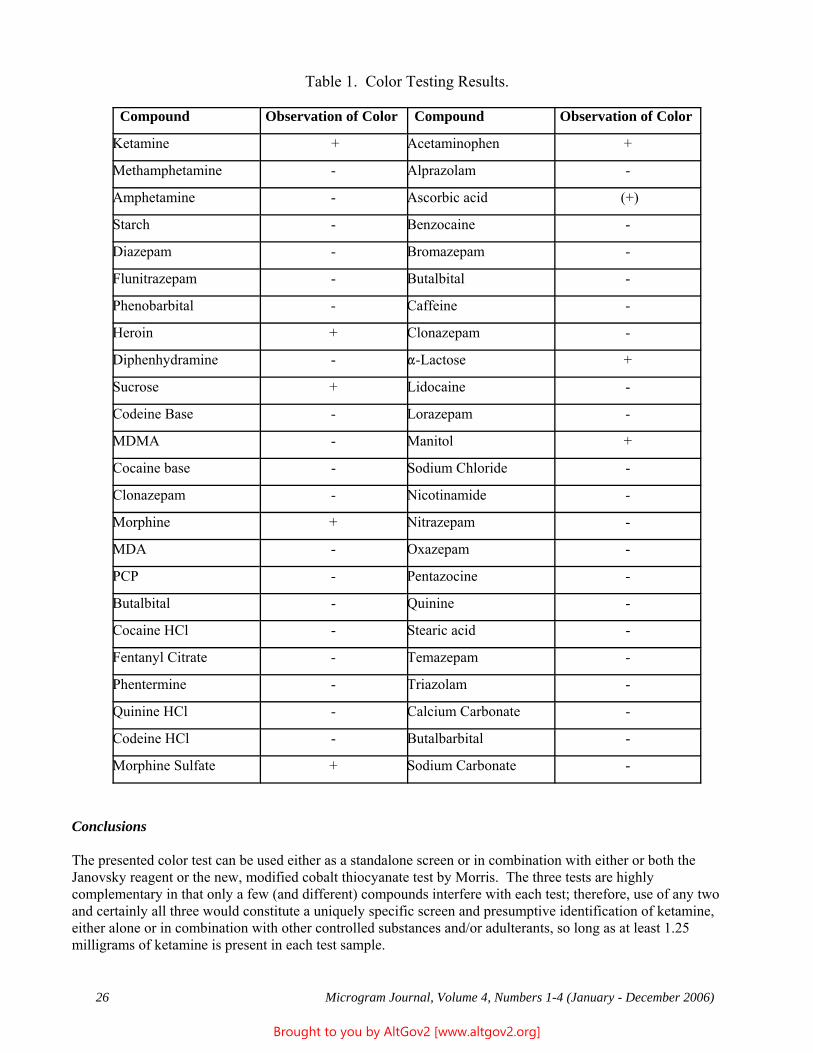
26 Microgram Journal, Volume 4, Numbers 1-4 (January - December 2006)
Table 1. Color Testing Results.
Compound Observation of Color Compound Observation of Color
Ketamine + Acetaminophen +
Methamphetamine - Alprazolam -
Amphetamine - Ascorbic acid (+)
Starch - Benzocaine -
Diazepam - Bromazepam -
Flunitrazepam - Butalbital -
Phenobarbital - Caffeine -
Heroin + Clonazepam -
Diphenhydramine - "-Lactose +
Sucrose + Lidocaine -
Codeine Base - Lorazepam -
MDMA - Manitol +
Cocaine base - Sodium Chloride -
Clonazepam - Nicotinamide -
Morphine + Nitrazepam -
MDA - Oxazepam -
PCP - Pentazocine -
Butalbital - Quinine -
Cocaine HCl - Stearic acid -
Fentanyl Citrate - Temazepam -
Phentermine - Triazolam -
Quinine HCl - Calcium Carbonate -
Codeine HCl - Butalbarbital -
Morphine Sulfate + Sodium Carbonate -
Conclusions
The presented color test can be used either as a standalone screen or in combination with either or both theJanovsky reagent or the new, modified cobalt thiocyanate test by Morris. The three tests are highlycomplementary in that only a few (and different) compounds interfere with each test; therefore, use of any twoand certainly all three would constitute a uniquely specific screen and presumptive identification of ketamine,either alone or in combination with other controlled substances and/or adulterants, so long as at least 1.25milligrams of ketamine is present in each test sample.
Brought to you by AltGov2 [www.altgov2.org]
Microgram Journal, Volume 4, Numbers 1-4 (January - December 2006) 27
Acknowledgements
I am greatly indebted to the Forensic Science Center at Chicago, Illinois (USA) for providing access to thefacilities and necessary materials to conduct this research. The assistance of Art Weathers (Forensic Scientist III,Forensic Science Center at Chicago) in conducting this work is highly appreciated. The assistance of ImranMajeed (Assistant Research Officer, Center of Excellence in Molecular Biology, University of the Punjab,Lahore, Pakistan) in preparing this manuscript is also highly appreciated.
References
1. Anonymous. Poppers, ketamine, and GHB. Drugscope Drug Notes 2002(9):1.
2. Dal Cason TA, Franzosa ES. Occurrences and forms of the hallucinogens. Hallucinogens 2003:37.
3. Tanaka E, Honda K, Yasuhara H. Ketamine: Its pharmacology and toxicology. Japanese Journal ofForensic Toxicology 2005;23(3):187.
4. Alizadeh N , Mehdipour R. Drug-selective electrode for ketamine determination in pharmaceuticalpreparations and electrochemical study of drug with BSA. Journal of Pharmaceutical and BiomedicalAnalysis 2002;30(3):725.
5. Apollonio LG, Pianca DJ, Whittall IR, Kyd JM, Maher WA. A comparison of atmospheric pressurechemical ionization and electrospray ionization in testing of amphetamine-type substances and ketamine using ultra-performance liquid chromatography/mass spectrometry. Rapid Communications in MassSpectrometry 2006;20(18):2777.
6. Apollonio LG, Pianca DJ, Whittall IR, Maher WA, Kyd JM. A demonstration of the use of ultra-performance liquid chromatography - mass spectrometry (UPLC/MS) in the determination ofamphetamine-type substances and ketamine and toxicological analysis. Journal of Chromatography, B. Analytical Technologies in the Biomedical and Life Sciences 2006;836(1-2):111.
7. Apollonio LG, Whittall IR, Pianca DJ, Kyd JM, Maher WA. Product ion mass spectra of amphetamine-type substances, designer analogues, and ketamine using ultra-performance liquid chromatography/tandem mass spectrometry. Rapid Communications in Mass Spectrometry 2006;20(15):2259.
8. Cherkaoui S, Veuthey JL. Use of negatively charged cyclodextrins for the simultaneousenantioseparation of selected anesthetic drugs by capillary electrophoresis-mass spectrometry. Journal ofPharmaceutical and Biomedical Analysis 2002;27(3-4):615.
9. Geraghty E, Wu C, McGann W. Effective screening for “Club Drugs” with dual mode ion trap mobilityspectrometry. International Journal for Ion Mobility Spectrometry 2002;5(3):41.
10. Licata M, Pierini G, Popoli G. A fatal ketamine poisoning. Journal of Forensic Sciences 1994;39(5):1314.
11. Rees DK, Wasem SE. The identification and quantitation of ketamine hydrochloride. Microgram 2000;33(7):163. [Note: Law Enforcement Restricted Issue.]
12. Rofael HZ, AbdelRahman MS. Development and validation of a high-performance liquidchromatography method for the determination of cocaine, its metabolites and ketamine. Journal ofApplied Toxicology 2002;22(2):123.
Brought to you by AltGov2 [www.altgov2.org]
28 Microgram Journal, Volume 4, Numbers 1-4 (January - December 2006)
13. Moffat AC, Osselton MD, Widdop B, Galichet LY, eds. Clarke’s Analysis of Drugs and Poisons, 3rd ed.,Pharmaceutical Press, London:2004, pp. 1152-1153.
14. Shadan A, Rahin R. Presumptive test for ketamine by the Janovsky reagent. Buletin Kualiti danTeknikal Bil B, Keluaran 2005;(3):5.
15. Morris JA. Modified cobalt thiocyanate presumptive color test for ketamine hydrochloride. Journal ofForensic Sciences 2007;52(1):84.
16. Whitmore WF, Wood CA. Chemical microscopy of some toxicologically important alkaloids. Microchimica Acta 1939;27(4):249-334.
17. Anonymous. The analysis of heroin. Bulletin on Narcotics 1953;5(2):27-34.
18. McConnell-Davis TW, Farmilio CG, Genest K. Analysis of an impure heroin seizure. Bulletin onNarcotics 1962;14(3):47-57.
* * * * *
* * * * *
Brought to you by AltGov2 [www.altgov2.org]
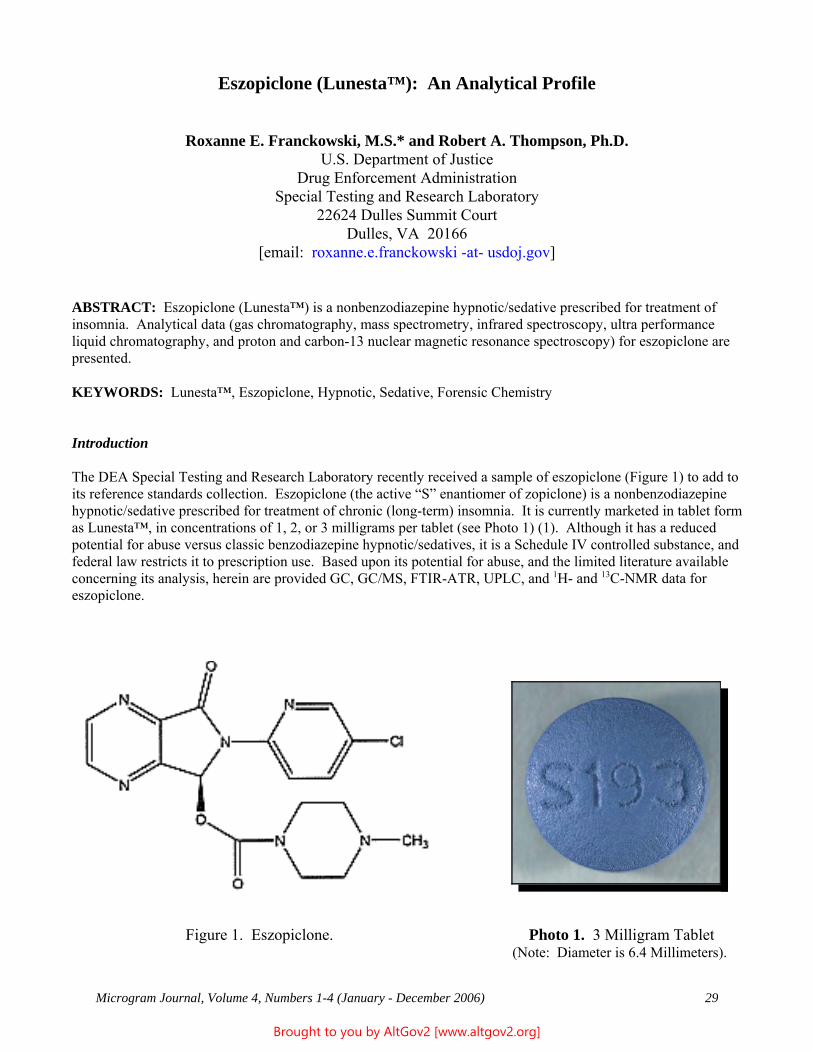
Microgram Journal, Volume 4, Numbers 1-4 (January - December 2006) 29
Eszopiclone (Lunesta™): An Analytical Profile
Roxanne E. Franckowski, M.S.* and Robert A. Thompson, Ph.D.U.S. Department of Justice
Drug Enforcement AdministrationSpecial Testing and Research Laboratory
22624 Dulles Summit CourtDulles, VA 20166
[email: roxanne.e.franckowski -at- usdoj.gov]
ABSTRACT: Eszopiclone (Lunesta™) is a nonbenzodiazepine hypnotic/sedative prescribed for treatment ofinsomnia. Analytical data (gas chromatography, mass spectrometry, infrared spectroscopy, ultra performanceliquid chromatography, and proton and carbon-13 nuclear magnetic resonance spectroscopy) for eszopiclone arepresented.
KEYWORDS: Lunesta™, Eszopiclone, Hypnotic, Sedative, Forensic Chemistry
Introduction
The DEA Special Testing and Research Laboratory recently received a sample of eszopiclone (Figure 1) to add toits reference standards collection. Eszopiclone (the active “S” enantiomer of zopiclone) is a nonbenzodiazepinehypnotic/sedative prescribed for treatment of chronic (long-term) insomnia. It is currently marketed in tablet formas Lunesta™, in concentrations of 1, 2, or 3 milligrams per tablet (see Photo 1) (1). Although it has a reducedpotential for abuse versus classic benzodiazepine hypnotic/sedatives, it is a Schedule IV controlled substance, andfederal law restricts it to prescription use. Based upon its potential for abuse, and the limited literature availableconcerning its analysis, herein are provided GC, GC/MS, FTIR-ATR, UPLC, and 1H- and 13C-NMR data foreszopiclone.
Figure 1. Eszopiclone. Photo 1. 3 Milligram Tablet (Note: Diameter is 6.4 Millimeters).
Brought to you by AltGov2 [www.altgov2.org]
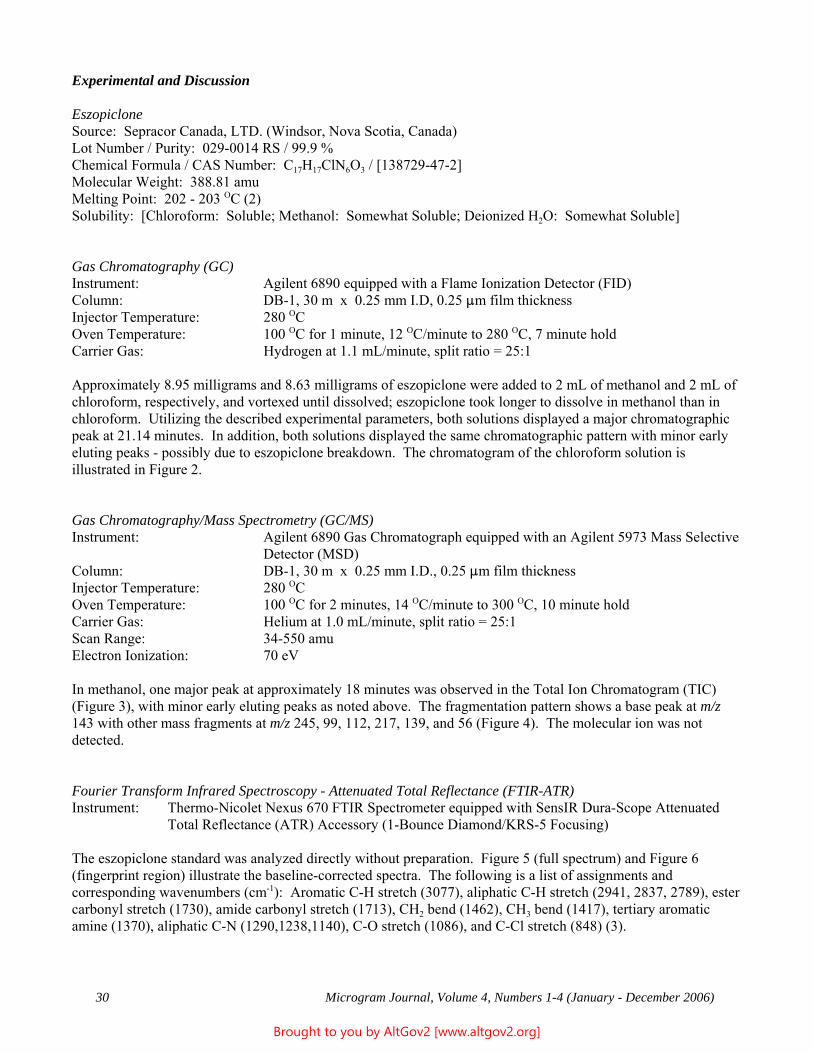
30 Microgram Journal, Volume 4, Numbers 1-4 (January - December 2006)
Experimental and Discussion
EszopicloneSource: Sepracor Canada, LTD. (Windsor, Nova Scotia, Canada)Lot Number / Purity: 029-0014 RS / 99.9 %Chemical Formula / CAS Number: C17H17ClN6O3 / [138729-47-2]Molecular Weight: 388.81 amuMelting Point: 202 - 203 OC (2)Solubility: [Chloroform: Soluble; Methanol: Somewhat Soluble; Deionized H2O: Somewhat Soluble]
Gas Chromatography (GC)Instrument: Agilent 6890 equipped with a Flame Ionization Detector (FID)Column: DB-1, 30 m x 0.25 mm I.D, 0.25 :m film thicknessInjector Temperature: 280 OCOven Temperature: 100 OC for 1 minute, 12 OC/minute to 280 OC, 7 minute holdCarrier Gas: Hydrogen at 1.1 mL/minute, split ratio = 25:1
Approximately 8.95 milligrams and 8.63 milligrams of eszopiclone were added to 2 mL of methanol and 2 mL ofchloroform, respectively, and vortexed until dissolved; eszopiclone took longer to dissolve in methanol than inchloroform. Utilizing the described experimental parameters, both solutions displayed a major chromatographicpeak at 21.14 minutes. In addition, both solutions displayed the same chromatographic pattern with minor earlyeluting peaks - possibly due to eszopiclone breakdown. The chromatogram of the chloroform solution isillustrated in Figure 2.
Gas Chromatography/Mass Spectrometry (GC/MS)Instrument: Agilent 6890 Gas Chromatograph equipped with an Agilent 5973 Mass Selective
Detector (MSD)Column: DB-1, 30 m x 0.25 mm I.D., 0.25 :m film thicknessInjector Temperature: 280 OCOven Temperature: 100 OC for 2 minutes, 14 OC/minute to 300 OC, 10 minute holdCarrier Gas: Helium at 1.0 mL/minute, split ratio = 25:1Scan Range: 34-550 amuElectron Ionization: 70 eV
In methanol, one major peak at approximately 18 minutes was observed in the Total Ion Chromatogram (TIC)(Figure 3), with minor early eluting peaks as noted above. The fragmentation pattern shows a base peak at m/z143 with other mass fragments at m/z 245, 99, 112, 217, 139, and 56 (Figure 4). The molecular ion was notdetected.
Fourier Transform Infrared Spectroscopy - Attenuated Total Reflectance (FTIR-ATR)Instrument: Thermo-Nicolet Nexus 670 FTIR Spectrometer equipped with SensIR Dura-Scope Attenuated
Total Reflectance (ATR) Accessory (1-Bounce Diamond/KRS-5 Focusing)
The eszopiclone standard was analyzed directly without preparation. Figure 5 (full spectrum) and Figure 6(fingerprint region) illustrate the baseline-corrected spectra. The following is a list of assignments andcorresponding wavenumbers (cm-1): Aromatic C-H stretch (3077), aliphatic C-H stretch (2941, 2837, 2789), estercarbonyl stretch (1730), amide carbonyl stretch (1713), CH2 bend (1462), CH3 bend (1417), tertiary aromaticamine (1370), aliphatic C-N (1290,1238,1140), C-O stretch (1086), and C-Cl stretch (848) (3).
Brought to you by AltGov2 [www.altgov2.org]
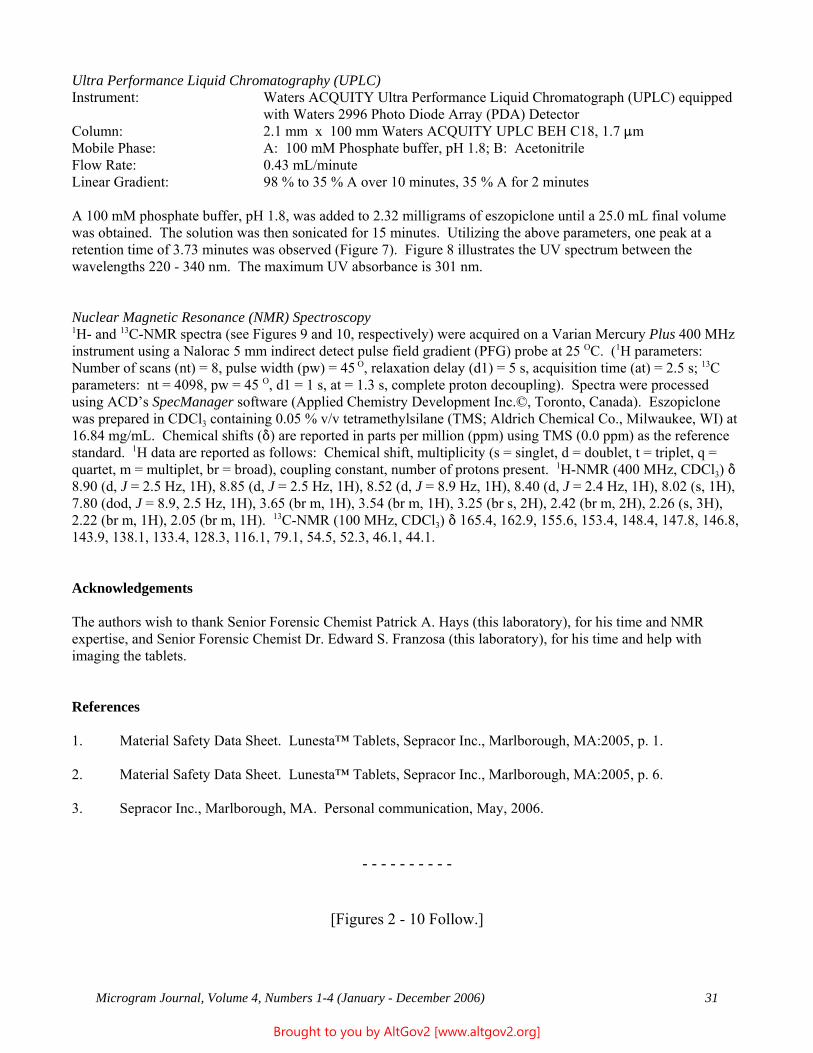
Microgram Journal, Volume 4, Numbers 1-4 (January - December 2006) 31
Ultra Performance Liquid Chromatography (UPLC)Instrument: Waters ACQUITY Ultra Performance Liquid Chromatograph (UPLC) equipped
with Waters 2996 Photo Diode Array (PDA) DetectorColumn: 2.1 mm x 100 mm Waters ACQUITY UPLC BEH C18, 1.7 :mMobile Phase: A: 100 mM Phosphate buffer, pH 1.8; B: AcetonitrileFlow Rate: 0.43 mL/minuteLinear Gradient: 98 % to 35 % A over 10 minutes, 35 % A for 2 minutes
A 100 mM phosphate buffer, pH 1.8, was added to 2.32 milligrams of eszopiclone until a 25.0 mL final volumewas obtained. The solution was then sonicated for 15 minutes. Utilizing the above parameters, one peak at aretention time of 3.73 minutes was observed (Figure 7). Figure 8 illustrates the UV spectrum between thewavelengths 220 - 340 nm. The maximum UV absorbance is 301 nm.
Nuclear Magnetic Resonance (NMR) Spectroscopy1H- and 13C-NMR spectra (see Figures 9 and 10, respectively) were acquired on a Varian Mercury Plus 400 MHzinstrument using a Nalorac 5 mm indirect detect pulse field gradient (PFG) probe at 25 OC. (1H parameters: Number of scans (nt) = 8, pulse width (pw) = 45 O, relaxation delay (d1) = 5 s, acquisition time (at) = 2.5 s; 13Cparameters: nt = 4098, pw = 45 O, d1 = 1 s, at = 1.3 s, complete proton decoupling). Spectra were processedusing ACD’s SpecManager software (Applied Chemistry Development Inc.©, Toronto, Canada). Eszopiclonewas prepared in CDCl3 containing 0.05 % v/v tetramethylsilane (TMS; Aldrich Chemical Co., Milwaukee, WI) at16.84 mg/mL. Chemical shifts (*) are reported in parts per million (ppm) using TMS (0.0 ppm) as the referencestandard. 1H data are reported as follows: Chemical shift, multiplicity (s = singlet, d = doublet, t = triplet, q =quartet, m = multiplet, br = broad), coupling constant, number of protons present. 1H-NMR (400 MHz, CDCl3) *8.90 (d, J = 2.5 Hz, 1H), 8.85 (d, J = 2.5 Hz, 1H), 8.52 (d, J = 8.9 Hz, 1H), 8.40 (d, J = 2.4 Hz, 1H), 8.02 (s, 1H),7.80 (dod, J = 8.9, 2.5 Hz, 1H), 3.65 (br m, 1H), 3.54 (br m, 1H), 3.25 (br s, 2H), 2.42 (br m, 2H), 2.26 (s, 3H),2.22 (br m, 1H), 2.05 (br m, 1H). 13C-NMR (100 MHz, CDCl3) * 165.4, 162.9, 155.6, 153.4, 148.4, 147.8, 146.8,143.9, 138.1, 133.4, 128.3, 116.1, 79.1, 54.5, 52.3, 46.1, 44.1.
Acknowledgements
The authors wish to thank Senior Forensic Chemist Patrick A. Hays (this laboratory), for his time and NMRexpertise, and Senior Forensic Chemist Dr. Edward S. Franzosa (this laboratory), for his time and help withimaging the tablets.
References
1. Material Safety Data Sheet. Lunesta™ Tablets, Sepracor Inc., Marlborough, MA:2005, p. 1.
2. Material Safety Data Sheet. Lunesta™ Tablets, Sepracor Inc., Marlborough, MA:2005, p. 6.
3. Sepracor Inc., Marlborough, MA. Personal communication, May, 2006.
- - - - - - - - - -
[Figures 2 - 10 Follow.]
Brought to you by AltGov2 [www.altgov2.org]
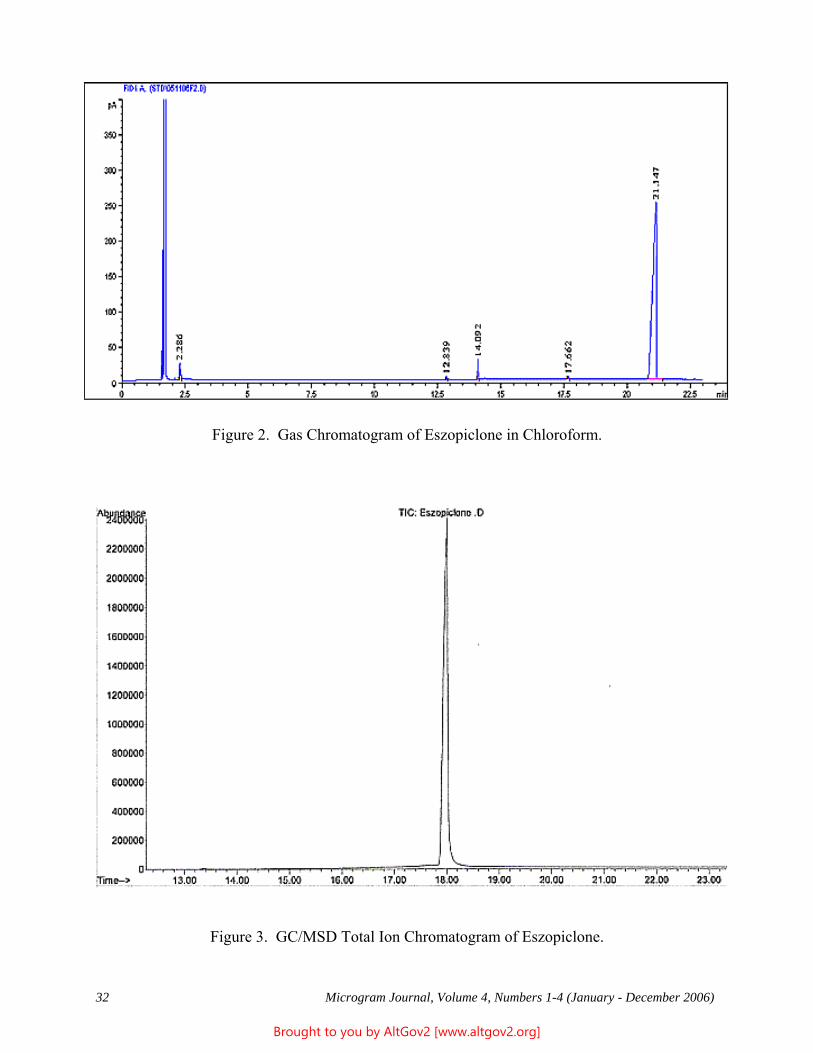
32 Microgram Journal, Volume 4, Numbers 1-4 (January - December 2006)
Figure 2. Gas Chromatogram of Eszopiclone in Chloroform.
Figure 3. GC/MSD Total Ion Chromatogram of Eszopiclone.
Brought to you by AltGov2 [www.altgov2.org]
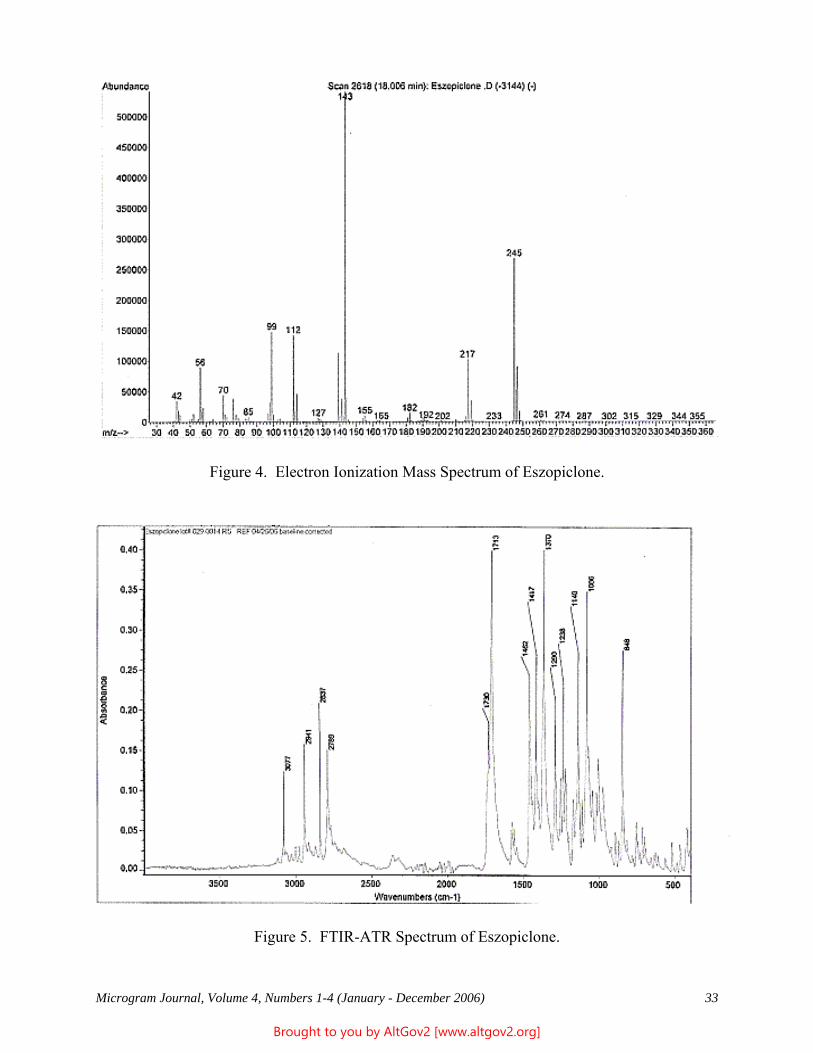
Microgram Journal, Volume 4, Numbers 1-4 (January - December 2006) 33
Figure 4. Electron Ionization Mass Spectrum of Eszopiclone.
Figure 5. FTIR-ATR Spectrum of Eszopiclone.
Brought to you by AltGov2 [www.altgov2.org]
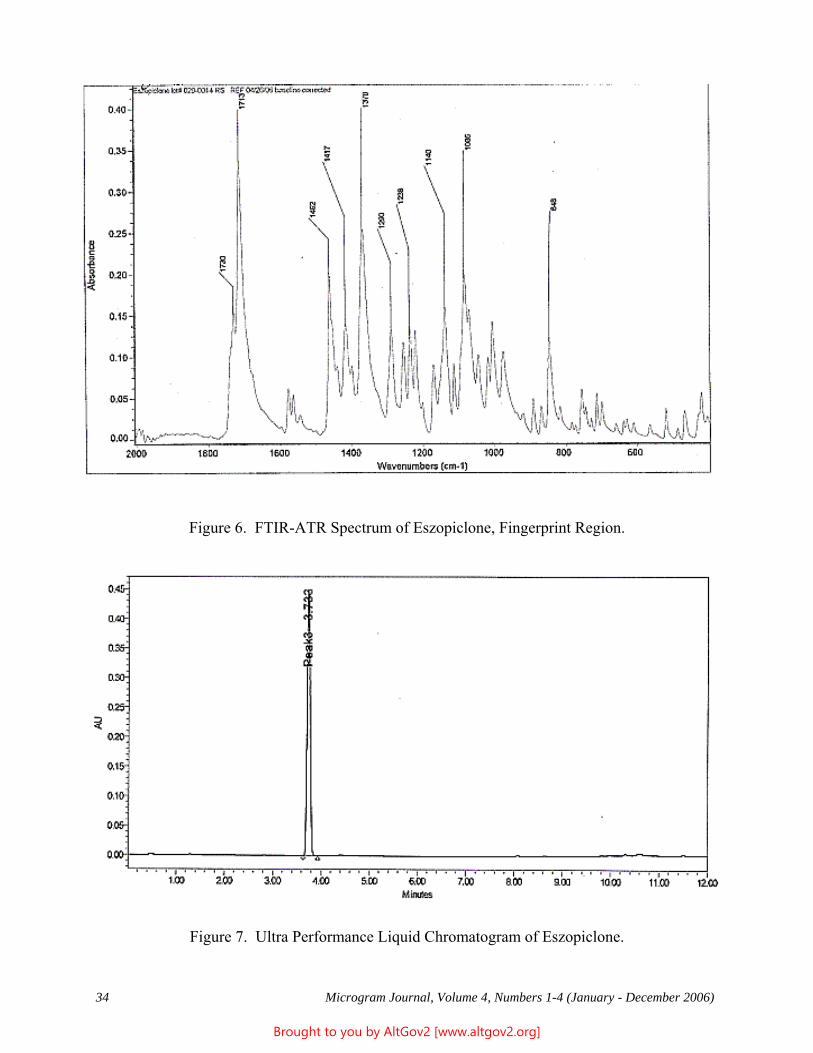
34 Microgram Journal, Volume 4, Numbers 1-4 (January - December 2006)
Figure 6. FTIR-ATR Spectrum of Eszopiclone, Fingerprint Region.
Figure 7. Ultra Performance Liquid Chromatogram of Eszopiclone.
Brought to you by AltGov2 [www.altgov2.org]
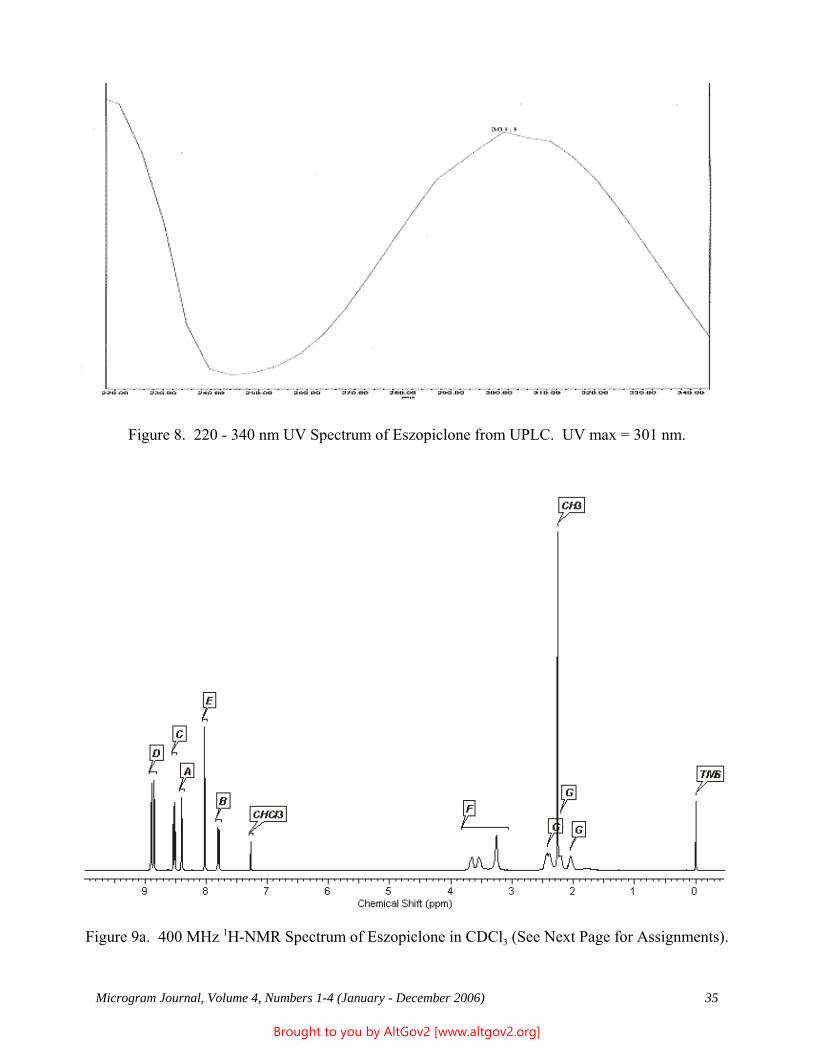
Microgram Journal, Volume 4, Numbers 1-4 (January - December 2006) 35
Figure 8. 220 - 340 nm UV Spectrum of Eszopiclone from UPLC. UV max = 301 nm.
Figure 9a. 400 MHz 1H-NMR Spectrum of Eszopiclone in CDCl3 (See Next Page for Assignments).
Brought to you by AltGov2 [www.altgov2.org]
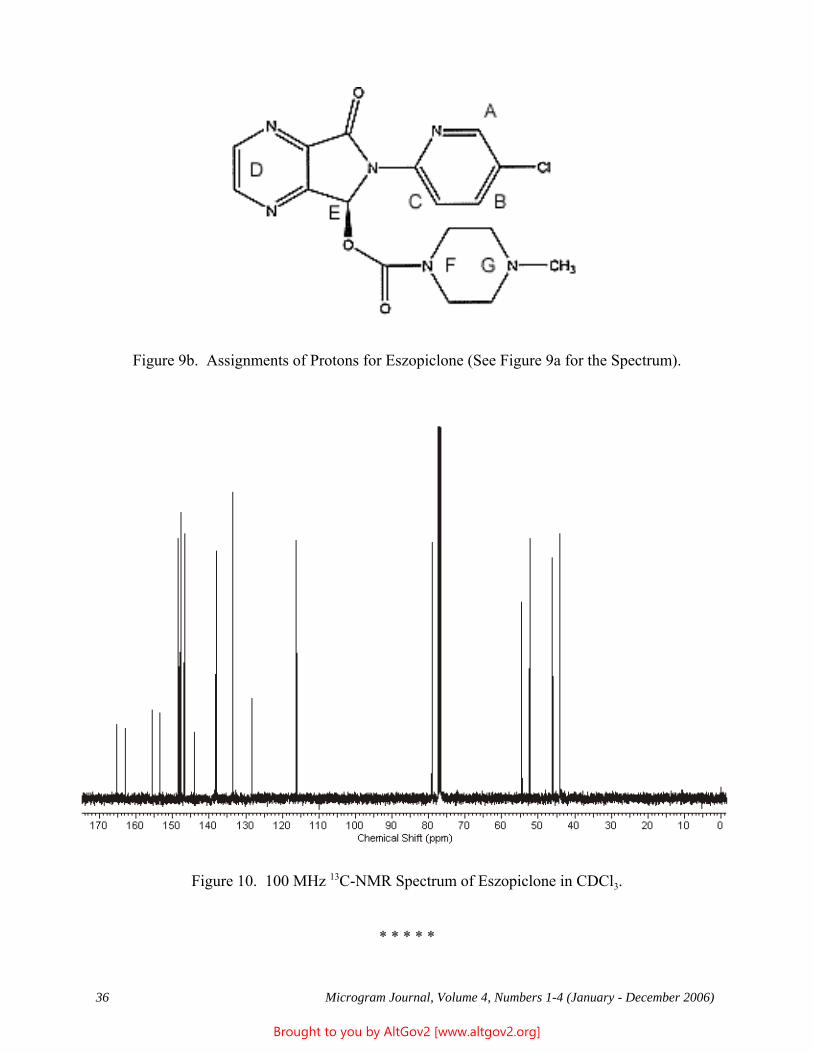
36 Microgram Journal, Volume 4, Numbers 1-4 (January - December 2006)
Figure 9b. Assignments of Protons for Eszopiclone (See Figure 9a for the Spectrum).
Figure 10. 100 MHz 13C-NMR Spectrum of Eszopiclone in CDCl3.
* * * * *
Brought to you by AltGov2 [www.altgov2.org]
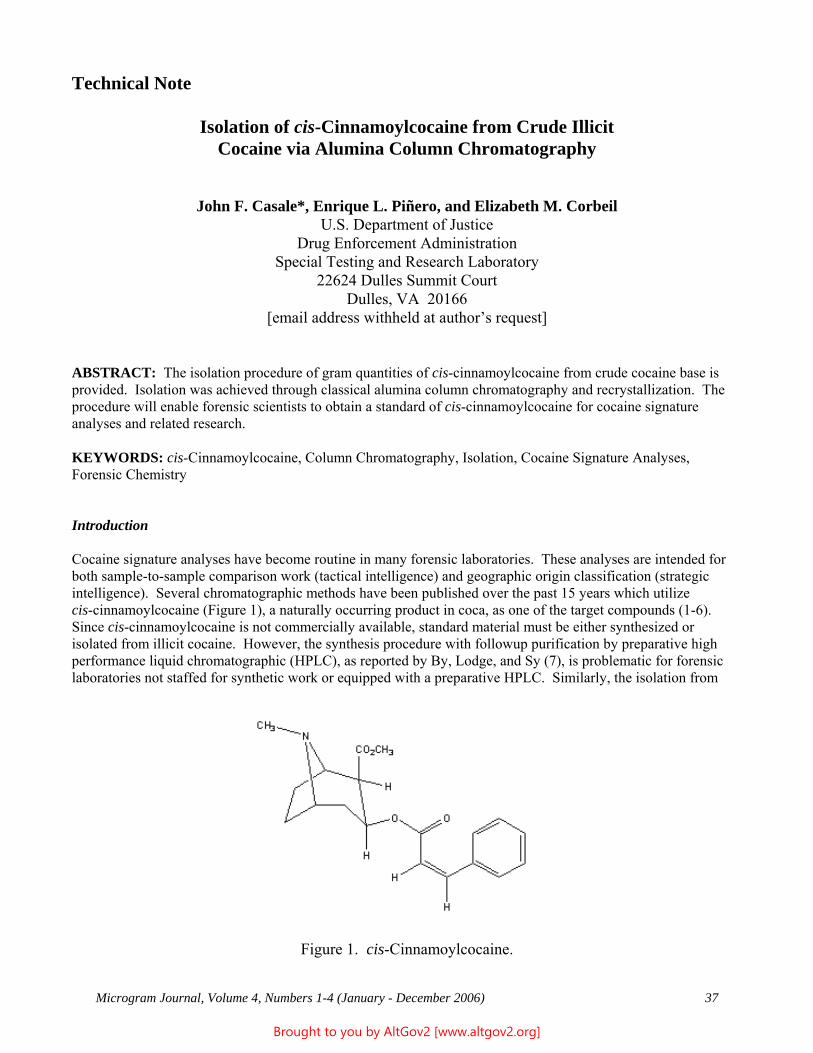
Microgram Journal, Volume 4, Numbers 1-4 (January - December 2006) 37
Technical Note
Isolation of cis-Cinnamoylcocaine from Crude IllicitCocaine via Alumina Column Chromatography
John F. Casale*, Enrique L. Piñero, and Elizabeth M. CorbeilU.S. Department of Justice
Drug Enforcement AdministrationSpecial Testing and Research Laboratory
22624 Dulles Summit CourtDulles, VA 20166
[email address withheld at author’s request]
ABSTRACT: The isolation procedure of gram quantities of cis-cinnamoylcocaine from crude cocaine base isprovided. Isolation was achieved through classical alumina column chromatography and recrystallization. Theprocedure will enable forensic scientists to obtain a standard of cis-cinnamoylcocaine for cocaine signatureanalyses and related research.
KEYWORDS: cis-Cinnamoylcocaine, Column Chromatography, Isolation, Cocaine Signature Analyses,Forensic Chemistry
Introduction
Cocaine signature analyses have become routine in many forensic laboratories. These analyses are intended forboth sample-to-sample comparison work (tactical intelligence) and geographic origin classification (strategicintelligence). Several chromatographic methods have been published over the past 15 years which utilizecis-cinnamoylcocaine (Figure 1), a naturally occurring product in coca, as one of the target compounds (1-6). Since cis-cinnamoylcocaine is not commercially available, standard material must be either synthesized orisolated from illicit cocaine. However, the synthesis procedure with followup purification by preparative highperformance liquid chromatographic (HPLC), as reported by By, Lodge, and Sy (7), is problematic for forensiclaboratories not staffed for synthetic work or equipped with a preparative HPLC. Similarly, the isolation from
Figure 1. cis-Cinnamoylcocaine.
Brought to you by AltGov2 [www.altgov2.org]
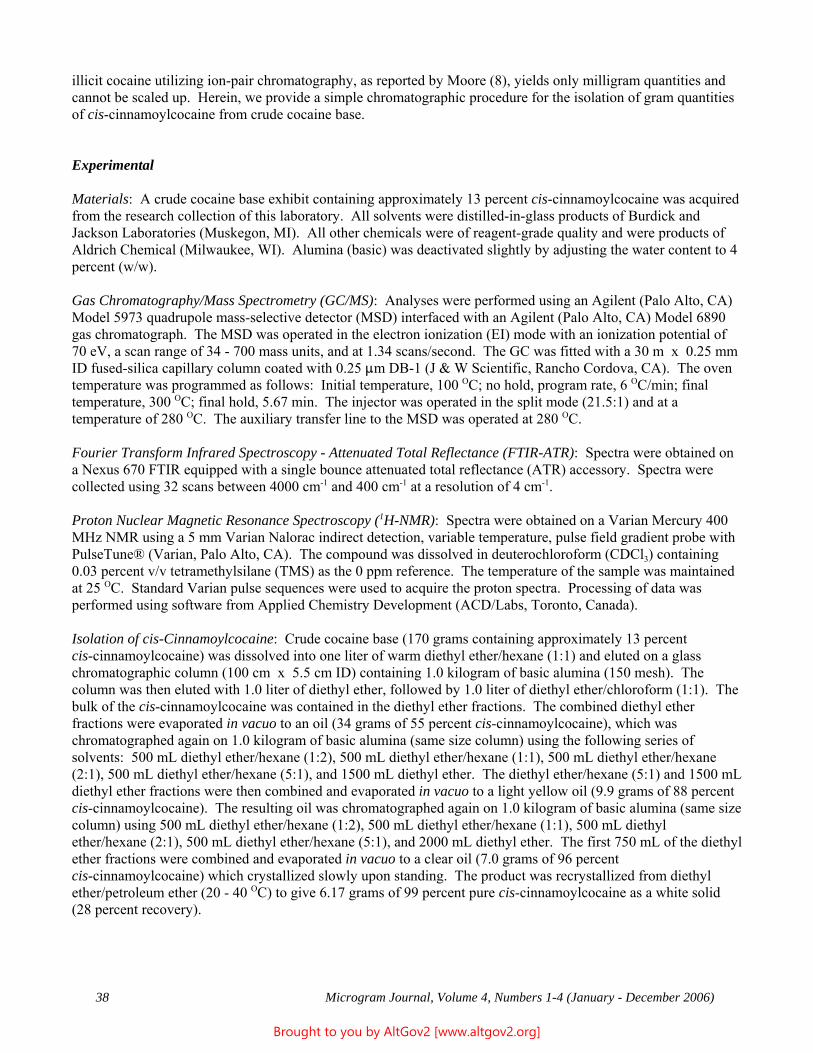
38 Microgram Journal, Volume 4, Numbers 1-4 (January - December 2006)
illicit cocaine utilizing ion-pair chromatography, as reported by Moore (8), yields only milligram quantities andcannot be scaled up. Herein, we provide a simple chromatographic procedure for the isolation of gram quantitiesof cis-cinnamoylcocaine from crude cocaine base.
Experimental
Materials: A crude cocaine base exhibit containing approximately 13 percent cis-cinnamoylcocaine was acquiredfrom the research collection of this laboratory. All solvents were distilled-in-glass products of Burdick andJackson Laboratories (Muskegon, MI). All other chemicals were of reagent-grade quality and were products ofAldrich Chemical (Milwaukee, WI). Alumina (basic) was deactivated slightly by adjusting the water content to 4percent (w/w).
Gas Chromatography/Mass Spectrometry (GC/MS): Analyses were performed using an Agilent (Palo Alto, CA)Model 5973 quadrupole mass-selective detector (MSD) interfaced with an Agilent (Palo Alto, CA) Model 6890gas chromatograph. The MSD was operated in the electron ionization (EI) mode with an ionization potential of70 eV, a scan range of 34 - 700 mass units, and at 1.34 scans/second. The GC was fitted with a 30 m x 0.25 mmID fused-silica capillary column coated with 0.25 :m DB-1 (J & W Scientific, Rancho Cordova, CA). The oventemperature was programmed as follows: Initial temperature, 100 OC; no hold, program rate, 6 OC/min; finaltemperature, 300 OC; final hold, 5.67 min. The injector was operated in the split mode (21.5:1) and at atemperature of 280 OC. The auxiliary transfer line to the MSD was operated at 280 OC.
Fourier Transform Infrared Spectroscopy - Attenuated Total Reflectance (FTIR-ATR): Spectra were obtained ona Nexus 670 FTIR equipped with a single bounce attenuated total reflectance (ATR) accessory. Spectra werecollected using 32 scans between 4000 cm-1 and 400 cm-1 at a resolution of 4 cm-1.
Proton Nuclear Magnetic Resonance Spectroscopy (1H-NMR): Spectra were obtained on a Varian Mercury 400MHz NMR using a 5 mm Varian Nalorac indirect detection, variable temperature, pulse field gradient probe withPulseTune® (Varian, Palo Alto, CA). The compound was dissolved in deuterochloroform (CDCl3) containing0.03 percent v/v tetramethylsilane (TMS) as the 0 ppm reference. The temperature of the sample was maintainedat 25 OC. Standard Varian pulse sequences were used to acquire the proton spectra. Processing of data wasperformed using software from Applied Chemistry Development (ACD/Labs, Toronto, Canada).
Isolation of cis-Cinnamoylcocaine: Crude cocaine base (170 grams containing approximately 13 percentcis-cinnamoylcocaine) was dissolved into one liter of warm diethyl ether/hexane (1:1) and eluted on a glasschromatographic column (100 cm x 5.5 cm ID) containing 1.0 kilogram of basic alumina (150 mesh). Thecolumn was then eluted with 1.0 liter of diethyl ether, followed by 1.0 liter of diethyl ether/chloroform (1:1). Thebulk of the cis-cinnamoylcocaine was contained in the diethyl ether fractions. The combined diethyl etherfractions were evaporated in vacuo to an oil (34 grams of 55 percent cis-cinnamoylcocaine), which waschromatographed again on 1.0 kilogram of basic alumina (same size column) using the following series ofsolvents: 500 mL diethyl ether/hexane (1:2), 500 mL diethyl ether/hexane (1:1), 500 mL diethyl ether/hexane(2:1), 500 mL diethyl ether/hexane (5:1), and 1500 mL diethyl ether. The diethyl ether/hexane (5:1) and 1500 mLdiethyl ether fractions were then combined and evaporated in vacuo to a light yellow oil (9.9 grams of 88 percentcis-cinnamoylcocaine). The resulting oil was chromatographed again on 1.0 kilogram of basic alumina (same sizecolumn) using 500 mL diethyl ether/hexane (1:2), 500 mL diethyl ether/hexane (1:1), 500 mL diethylether/hexane (2:1), 500 mL diethyl ether/hexane (5:1), and 2000 mL diethyl ether. The first 750 mL of the diethylether fractions were combined and evaporated in vacuo to a clear oil (7.0 grams of 96 percentcis-cinnamoylcocaine) which crystallized slowly upon standing. The product was recrystallized from diethylether/petroleum ether (20 - 40 OC) to give 6.17 grams of 99 percent pure cis-cinnamoylcocaine as a white solid(28 percent recovery).
Brought to you by AltGov2 [www.altgov2.org]
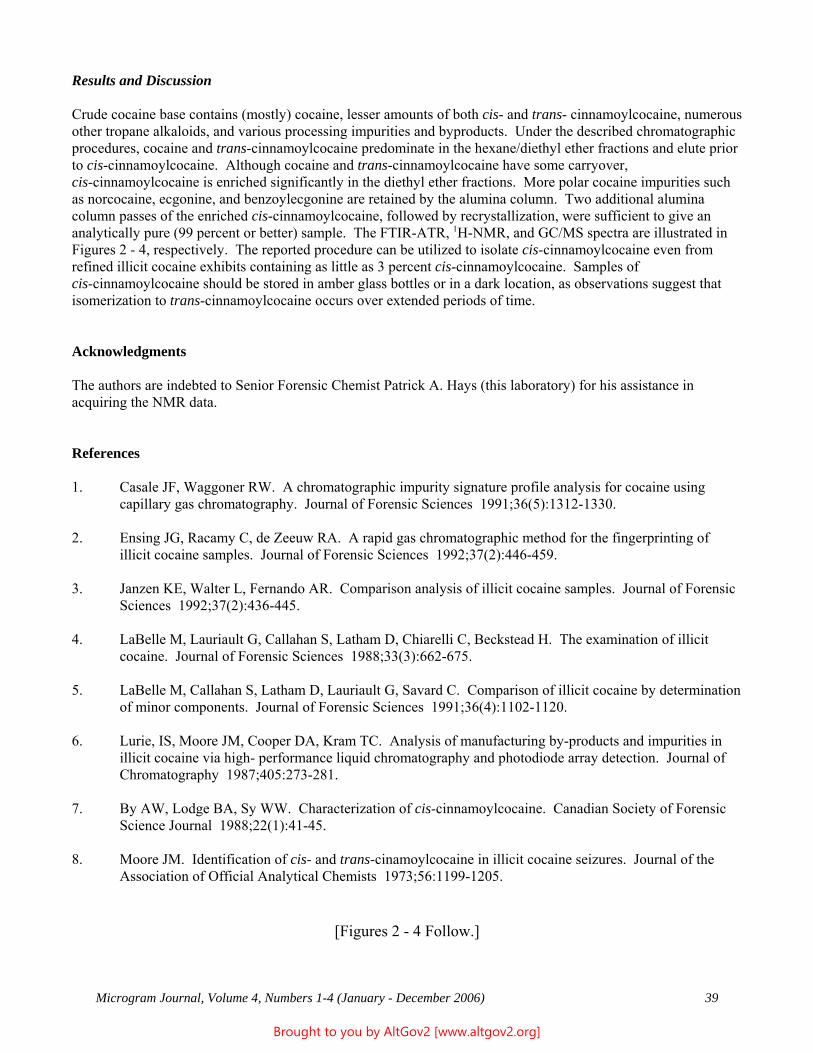
Microgram Journal, Volume 4, Numbers 1-4 (January - December 2006) 39
Results and Discussion
Crude cocaine base contains (mostly) cocaine, lesser amounts of both cis- and trans- cinnamoylcocaine, numerousother tropane alkaloids, and various processing impurities and byproducts. Under the described chromatographicprocedures, cocaine and trans-cinnamoylcocaine predominate in the hexane/diethyl ether fractions and elute priorto cis-cinnamoylcocaine. Although cocaine and trans-cinnamoylcocaine have some carryover,cis-cinnamoylcocaine is enriched significantly in the diethyl ether fractions. More polar cocaine impurities suchas norcocaine, ecgonine, and benzoylecgonine are retained by the alumina column. Two additional aluminacolumn passes of the enriched cis-cinnamoylcocaine, followed by recrystallization, were sufficient to give ananalytically pure (99 percent or better) sample. The FTIR-ATR, 1H-NMR, and GC/MS spectra are illustrated inFigures 2 - 4, respectively. The reported procedure can be utilized to isolate cis-cinnamoylcocaine even fromrefined illicit cocaine exhibits containing as little as 3 percent cis-cinnamoylcocaine. Samples ofcis-cinnamoylcocaine should be stored in amber glass bottles or in a dark location, as observations suggest thatisomerization to trans-cinnamoylcocaine occurs over extended periods of time.
Acknowledgments
The authors are indebted to Senior Forensic Chemist Patrick A. Hays (this laboratory) for his assistance inacquiring the NMR data.
References
1. Casale JF, Waggoner RW. A chromatographic impurity signature profile analysis for cocaine usingcapillary gas chromatography. Journal of Forensic Sciences 1991;36(5):1312-1330.
2. Ensing JG, Racamy C, de Zeeuw RA. A rapid gas chromatographic method for the fingerprinting ofillicit cocaine samples. Journal of Forensic Sciences 1992;37(2):446-459.
3. Janzen KE, Walter L, Fernando AR. Comparison analysis of illicit cocaine samples. Journal of ForensicSciences 1992;37(2):436-445.
4. LaBelle M, Lauriault G, Callahan S, Latham D, Chiarelli C, Beckstead H. The examination of illicitcocaine. Journal of Forensic Sciences 1988;33(3):662-675.
5. LaBelle M, Callahan S, Latham D, Lauriault G, Savard C. Comparison of illicit cocaine by determinationof minor components. Journal of Forensic Sciences 1991;36(4):1102-1120.
6. Lurie, IS, Moore JM, Cooper DA, Kram TC. Analysis of manufacturing by-products and impurities inillicit cocaine via high- performance liquid chromatography and photodiode array detection. Journal ofChromatography 1987;405:273-281.
7. By AW, Lodge BA, Sy WW. Characterization of cis-cinnamoylcocaine. Canadian Society of ForensicScience Journal 1988;22(1):41-45.
8. Moore JM. Identification of cis- and trans-cinamoylcocaine in illicit cocaine seizures. Journal of theAssociation of Official Analytical Chemists 1973;56:1199-1205.
[Figures 2 - 4 Follow.]
Brought to you by AltGov2 [www.altgov2.org]
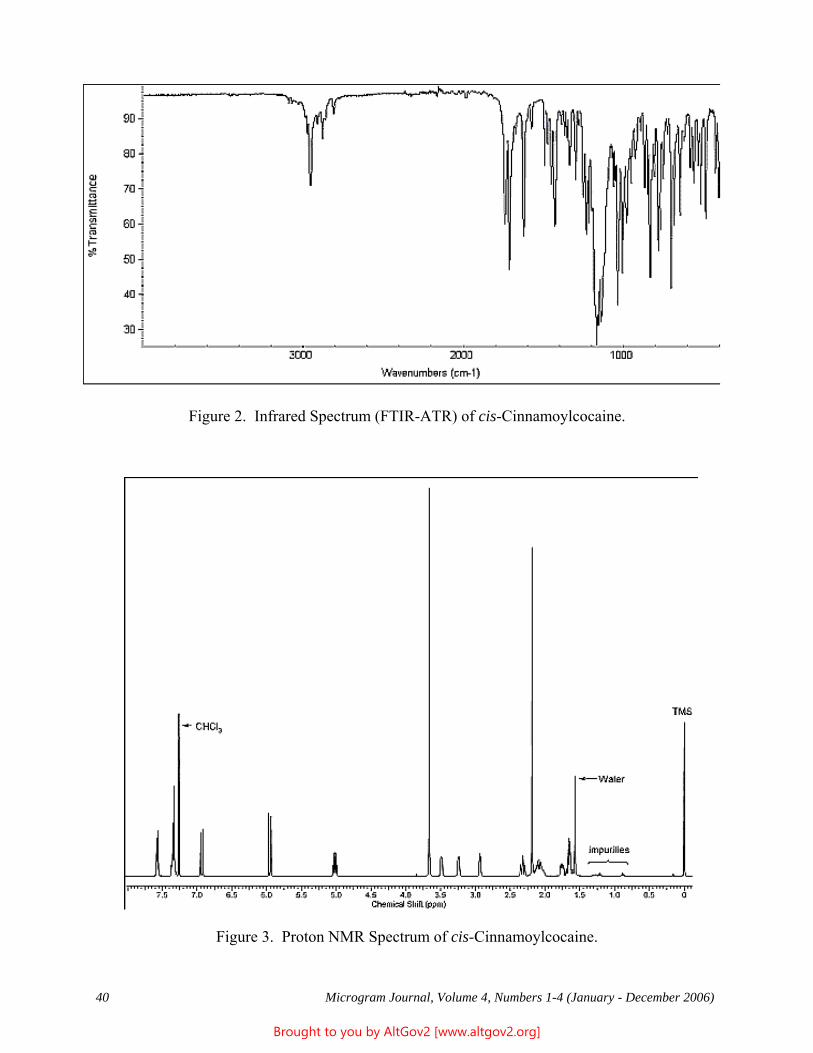
40 Microgram Journal, Volume 4, Numbers 1-4 (January - December 2006)
Figure 2. Infrared Spectrum (FTIR-ATR) of cis-Cinnamoylcocaine.
Figure 3. Proton NMR Spectrum of cis-Cinnamoylcocaine.
Brought to you by AltGov2 [www.altgov2.org]
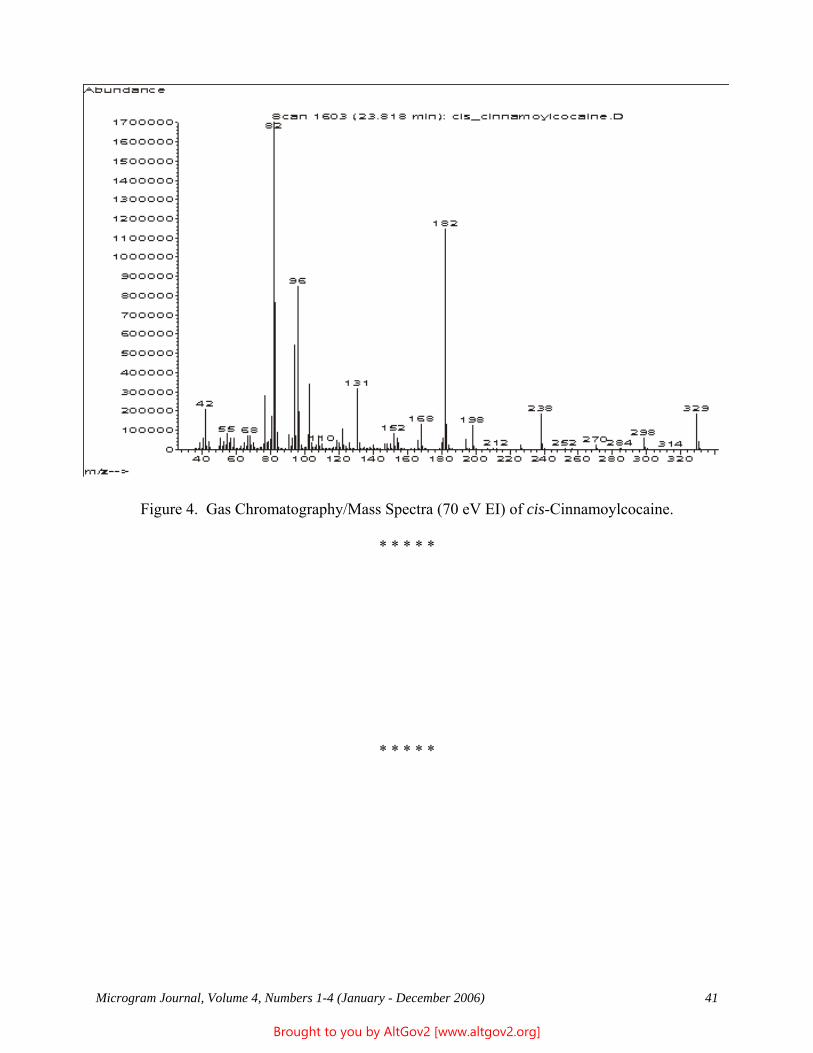
Microgram Journal, Volume 4, Numbers 1-4 (January - December 2006) 41
Figure 4. Gas Chromatography/Mass Spectra (70 eV EI) of cis-Cinnamoylcocaine.
* * * * *
* * * * *
Brought to you by AltGov2 [www.altgov2.org]
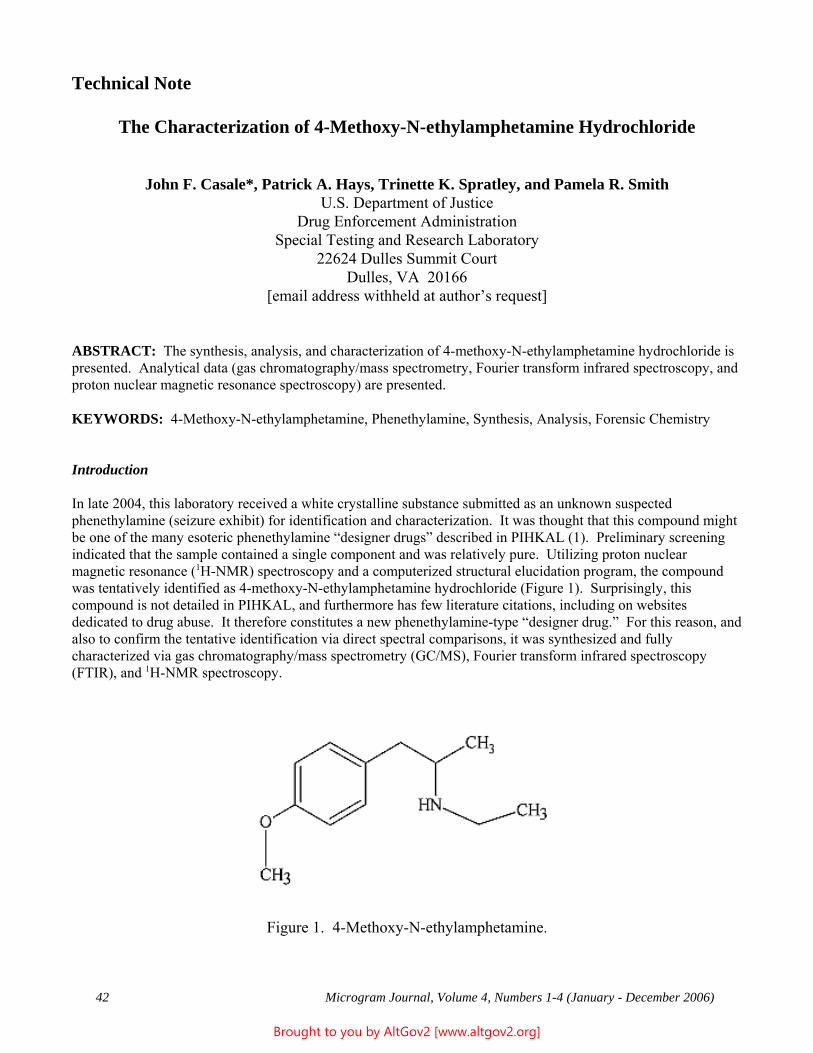
42 Microgram Journal, Volume 4, Numbers 1-4 (January - December 2006)
Technical Note
The Characterization of 4-Methoxy-N-ethylamphetamine Hydrochloride
John F. Casale*, Patrick A. Hays, Trinette K. Spratley, and Pamela R. SmithU.S. Department of Justice
Drug Enforcement AdministrationSpecial Testing and Research Laboratory
22624 Dulles Summit CourtDulles, VA 20166
[email address withheld at author’s request]
ABSTRACT: The synthesis, analysis, and characterization of 4-methoxy-N-ethylamphetamine hydrochloride ispresented. Analytical data (gas chromatography/mass spectrometry, Fourier transform infrared spectroscopy, andproton nuclear magnetic resonance spectroscopy) are presented.
KEYWORDS: 4-Methoxy-N-ethylamphetamine, Phenethylamine, Synthesis, Analysis, Forensic Chemistry
Introduction
In late 2004, this laboratory received a white crystalline substance submitted as an unknown suspectedphenethylamine (seizure exhibit) for identification and characterization. It was thought that this compound mightbe one of the many esoteric phenethylamine “designer drugs” described in PIHKAL (1). Preliminary screeningindicated that the sample contained a single component and was relatively pure. Utilizing proton nuclearmagnetic resonance (1H-NMR) spectroscopy and a computerized structural elucidation program, the compoundwas tentatively identified as 4-methoxy-N-ethylamphetamine hydrochloride (Figure 1). Surprisingly, thiscompound is not detailed in PIHKAL, and furthermore has few literature citations, including on websitesdedicated to drug abuse. It therefore constitutes a new phenethylamine-type “designer drug.” For this reason, andalso to confirm the tentative identification via direct spectral comparisons, it was synthesized and fullycharacterized via gas chromatography/mass spectrometry (GC/MS), Fourier transform infrared spectroscopy(FTIR), and 1H-NMR spectroscopy.
Figure 1. 4-Methoxy-N-ethylamphetamine.
Brought to you by AltGov2 [www.altgov2.org]
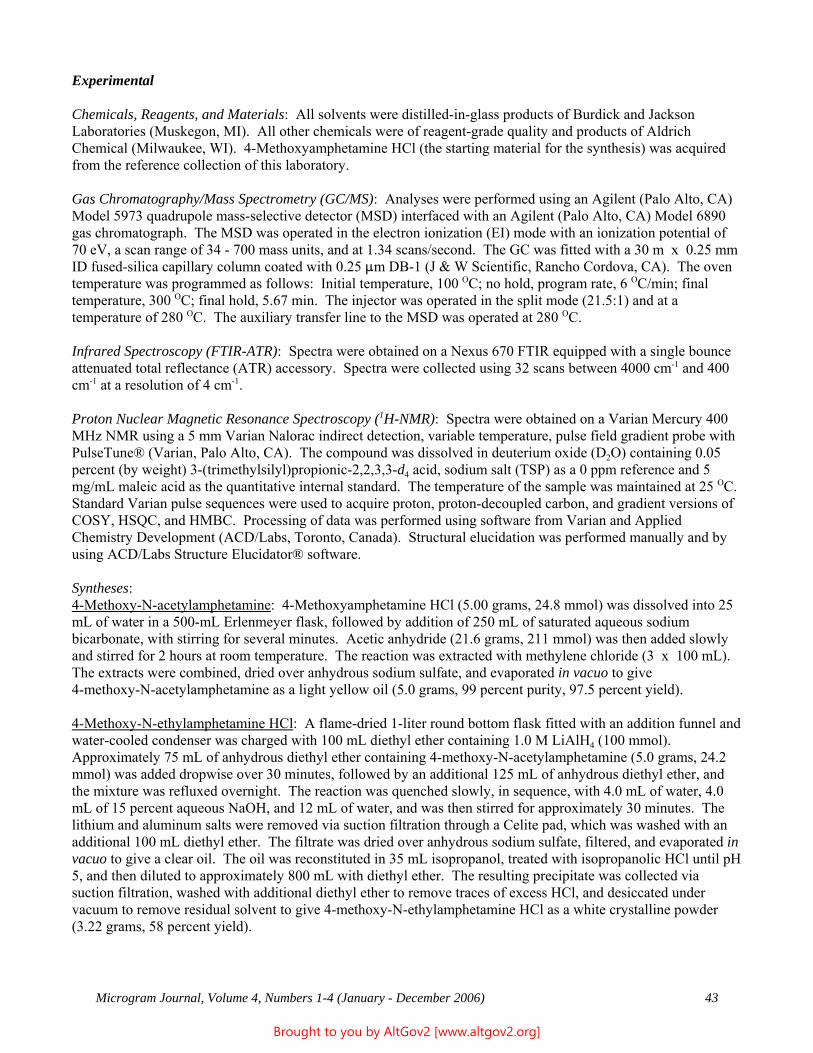
Microgram Journal, Volume 4, Numbers 1-4 (January - December 2006) 43
Experimental
Chemicals, Reagents, and Materials: All solvents were distilled-in-glass products of Burdick and JacksonLaboratories (Muskegon, MI). All other chemicals were of reagent-grade quality and products of AldrichChemical (Milwaukee, WI). 4-Methoxyamphetamine HCl (the starting material for the synthesis) was acquiredfrom the reference collection of this laboratory.
Gas Chromatography/Mass Spectrometry (GC/MS): Analyses were performed using an Agilent (Palo Alto, CA)Model 5973 quadrupole mass-selective detector (MSD) interfaced with an Agilent (Palo Alto, CA) Model 6890gas chromatograph. The MSD was operated in the electron ionization (EI) mode with an ionization potential of70 eV, a scan range of 34 - 700 mass units, and at 1.34 scans/second. The GC was fitted with a 30 m x 0.25 mmID fused-silica capillary column coated with 0.25 :m DB-1 (J & W Scientific, Rancho Cordova, CA). The oventemperature was programmed as follows: Initial temperature, 100 OC; no hold, program rate, 6 OC/min; finaltemperature, 300 OC; final hold, 5.67 min. The injector was operated in the split mode (21.5:1) and at atemperature of 280 OC. The auxiliary transfer line to the MSD was operated at 280 OC.
Infrared Spectroscopy (FTIR-ATR): Spectra were obtained on a Nexus 670 FTIR equipped with a single bounceattenuated total reflectance (ATR) accessory. Spectra were collected using 32 scans between 4000 cm-1 and 400cm-1 at a resolution of 4 cm-1.
Proton Nuclear Magnetic Resonance Spectroscopy (1H-NMR): Spectra were obtained on a Varian Mercury 400MHz NMR using a 5 mm Varian Nalorac indirect detection, variable temperature, pulse field gradient probe withPulseTune® (Varian, Palo Alto, CA). The compound was dissolved in deuterium oxide (D2O) containing 0.05percent (by weight) 3-(trimethylsilyl)propionic-2,2,3,3-d4 acid, sodium salt (TSP) as a 0 ppm reference and 5mg/mL maleic acid as the quantitative internal standard. The temperature of the sample was maintained at 25 OC. Standard Varian pulse sequences were used to acquire proton, proton-decoupled carbon, and gradient versions ofCOSY, HSQC, and HMBC. Processing of data was performed using software from Varian and AppliedChemistry Development (ACD/Labs, Toronto, Canada). Structural elucidation was performed manually and byusing ACD/Labs Structure Elucidator® software.
Syntheses:4-Methoxy-N-acetylamphetamine: 4-Methoxyamphetamine HCl (5.00 grams, 24.8 mmol) was dissolved into 25mL of water in a 500-mL Erlenmeyer flask, followed by addition of 250 mL of saturated aqueous sodiumbicarbonate, with stirring for several minutes. Acetic anhydride (21.6 grams, 211 mmol) was then added slowlyand stirred for 2 hours at room temperature. The reaction was extracted with methylene chloride (3 x 100 mL).The extracts were combined, dried over anhydrous sodium sulfate, and evaporated in vacuo to give4-methoxy-N-acetylamphetamine as a light yellow oil (5.0 grams, 99 percent purity, 97.5 percent yield).
4-Methoxy-N-ethylamphetamine HCl: A flame-dried 1-liter round bottom flask fitted with an addition funnel andwater-cooled condenser was charged with 100 mL diethyl ether containing 1.0 M LiAlH4 (100 mmol). Approximately 75 mL of anhydrous diethyl ether containing 4-methoxy-N-acetylamphetamine (5.0 grams, 24.2mmol) was added dropwise over 30 minutes, followed by an additional 125 mL of anhydrous diethyl ether, andthe mixture was refluxed overnight. The reaction was quenched slowly, in sequence, with 4.0 mL of water, 4.0mL of 15 percent aqueous NaOH, and 12 mL of water, and was then stirred for approximately 30 minutes. Thelithium and aluminum salts were removed via suction filtration through a Celite pad, which was washed with anadditional 100 mL diethyl ether. The filtrate was dried over anhydrous sodium sulfate, filtered, and evaporated invacuo to give a clear oil. The oil was reconstituted in 35 mL isopropanol, treated with isopropanolic HCl until pH5, and then diluted to approximately 800 mL with diethyl ether. The resulting precipitate was collected viasuction filtration, washed with additional diethyl ether to remove traces of excess HCl, and desiccated undervacuum to remove residual solvent to give 4-methoxy-N-ethylamphetamine HCl as a white crystalline powder(3.22 grams, 58 percent yield).
Brought to you by AltGov2 [www.altgov2.org]
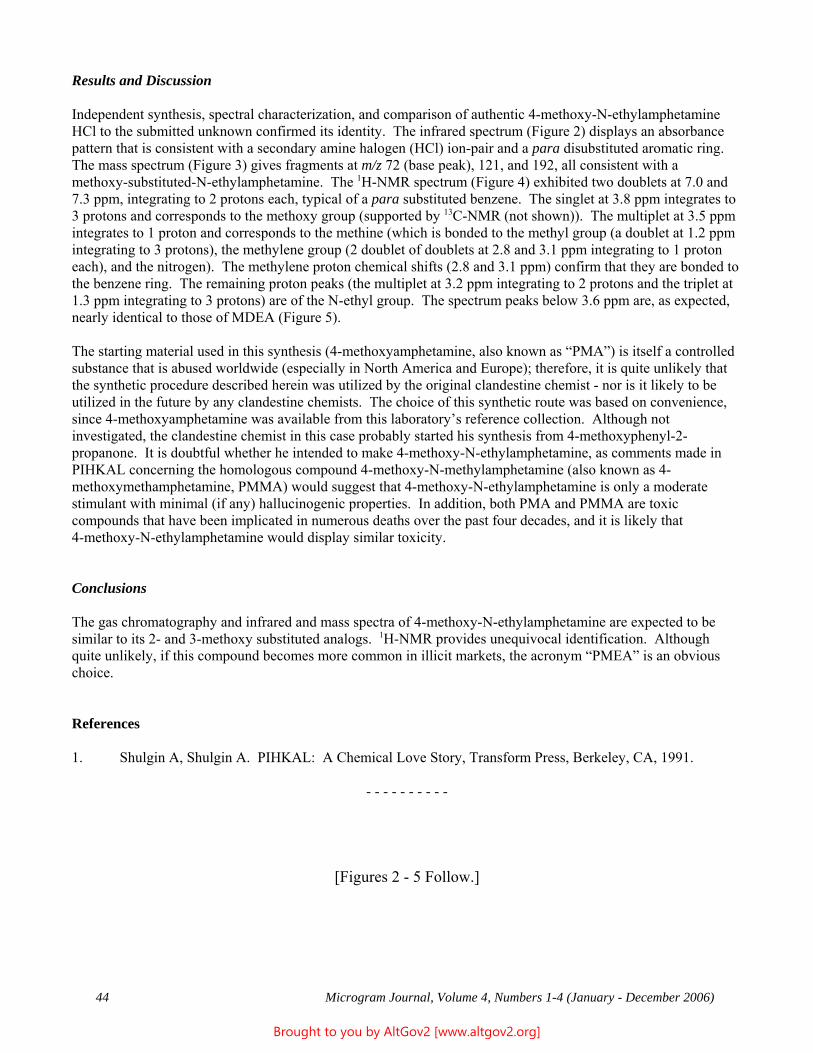
44 Microgram Journal, Volume 4, Numbers 1-4 (January - December 2006)
Results and Discussion
Independent synthesis, spectral characterization, and comparison of authentic 4-methoxy-N-ethylamphetamineHCl to the submitted unknown confirmed its identity. The infrared spectrum (Figure 2) displays an absorbancepattern that is consistent with a secondary amine halogen (HCl) ion-pair and a para disubstituted aromatic ring. The mass spectrum (Figure 3) gives fragments at m/z 72 (base peak), 121, and 192, all consistent with amethoxy-substituted-N-ethylamphetamine. The 1H-NMR spectrum (Figure 4) exhibited two doublets at 7.0 and7.3 ppm, integrating to 2 protons each, typical of a para substituted benzene. The singlet at 3.8 ppm integrates to3 protons and corresponds to the methoxy group (supported by 13C-NMR (not shown)). The multiplet at 3.5 ppmintegrates to 1 proton and corresponds to the methine (which is bonded to the methyl group (a doublet at 1.2 ppmintegrating to 3 protons), the methylene group (2 doublet of doublets at 2.8 and 3.1 ppm integrating to 1 protoneach), and the nitrogen). The methylene proton chemical shifts (2.8 and 3.1 ppm) confirm that they are bonded tothe benzene ring. The remaining proton peaks (the multiplet at 3.2 ppm integrating to 2 protons and the triplet at1.3 ppm integrating to 3 protons) are of the N-ethyl group. The spectrum peaks below 3.6 ppm are, as expected,nearly identical to those of MDEA (Figure 5).
The starting material used in this synthesis (4-methoxyamphetamine, also known as “PMA”) is itself a controlledsubstance that is abused worldwide (especially in North America and Europe); therefore, it is quite unlikely thatthe synthetic procedure described herein was utilized by the original clandestine chemist - nor is it likely to beutilized in the future by any clandestine chemists. The choice of this synthetic route was based on convenience,since 4-methoxyamphetamine was available from this laboratory’s reference collection. Although notinvestigated, the clandestine chemist in this case probably started his synthesis from 4-methoxyphenyl-2-propanone. It is doubtful whether he intended to make 4-methoxy-N-ethylamphetamine, as comments made inPIHKAL concerning the homologous compound 4-methoxy-N-methylamphetamine (also known as 4-methoxymethamphetamine, PMMA) would suggest that 4-methoxy-N-ethylamphetamine is only a moderatestimulant with minimal (if any) hallucinogenic properties. In addition, both PMA and PMMA are toxiccompounds that have been implicated in numerous deaths over the past four decades, and it is likely that4-methoxy-N-ethylamphetamine would display similar toxicity.
Conclusions
The gas chromatography and infrared and mass spectra of 4-methoxy-N-ethylamphetamine are expected to besimilar to its 2- and 3-methoxy substituted analogs. 1H-NMR provides unequivocal identification. Althoughquite unlikely, if this compound becomes more common in illicit markets, the acronym “PMEA” is an obviouschoice.
References
1. Shulgin A, Shulgin A. PIHKAL: A Chemical Love Story, Transform Press, Berkeley, CA, 1991.
- - - - - - - - - -
[Figures 2 - 5 Follow.]
Brought to you by AltGov2 [www.altgov2.org]
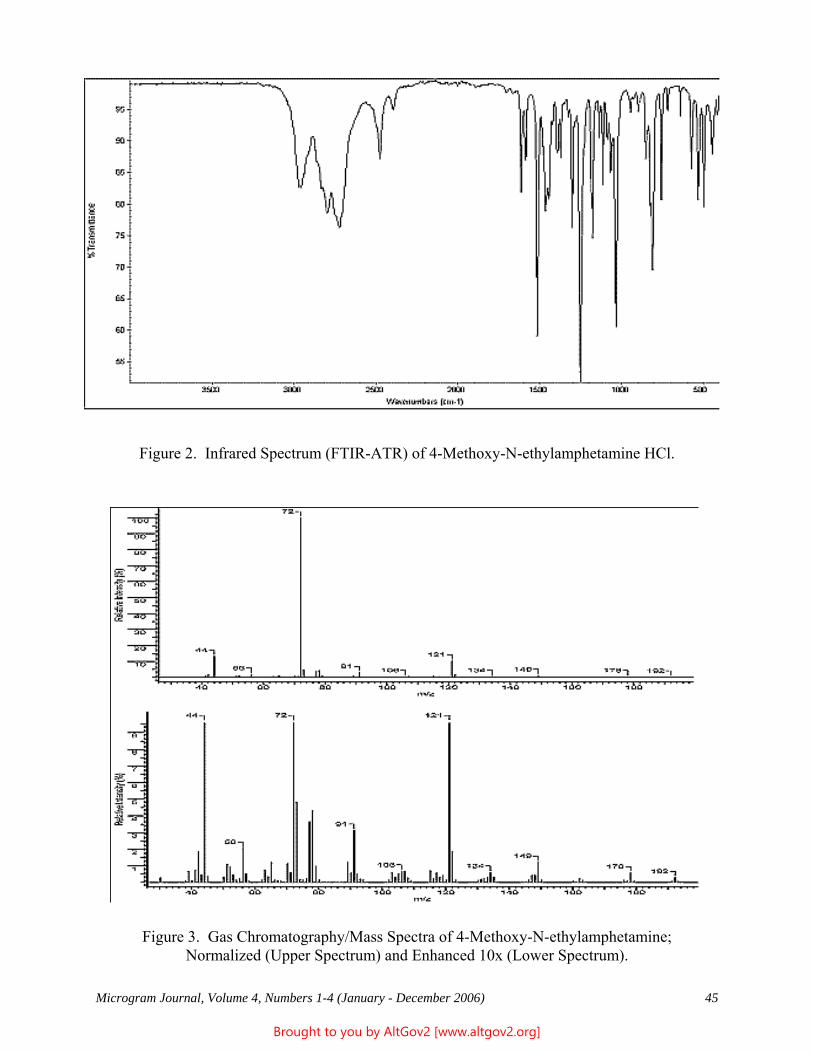
Microgram Journal, Volume 4, Numbers 1-4 (January - December 2006) 45
Figure 2. Infrared Spectrum (FTIR-ATR) of 4-Methoxy-N-ethylamphetamine HCl.
Figure 3. Gas Chromatography/Mass Spectra of 4-Methoxy-N-ethylamphetamine;Normalized (Upper Spectrum) and Enhanced 10x (Lower Spectrum).
Brought to you by AltGov2 [www.altgov2.org]
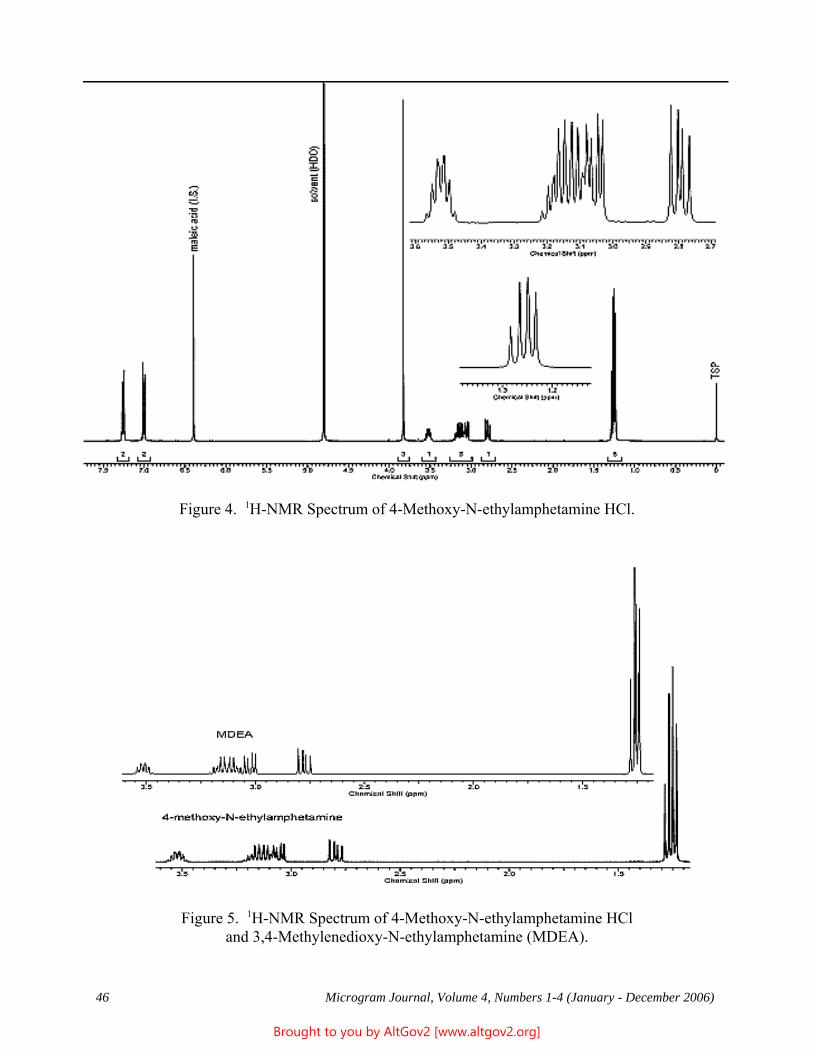
46 Microgram Journal, Volume 4, Numbers 1-4 (January - December 2006)
Figure 4. 1H-NMR Spectrum of 4-Methoxy-N-ethylamphetamine HCl.
Figure 5. 1H-NMR Spectrum of 4-Methoxy-N-ethylamphetamine HCland 3,4-Methylenedioxy-N-ethylamphetamine (MDEA).
Brought to you by AltGov2 [www.altgov2.org]
Microgram Journal, Volume 4, Numbers 1-4 (January - December 2006) 47
Quantitation of Cocaine by Gas Chromatography-Flame Ionization DetectionUtilizing Isopropylcocaine as a Structurally Related Internal Standard
Enrique L. Piñero* and John F. CasaleU.S. Department of Justice
Drug Enforcement AdministrationSpecial Testing and Research Laboratory
22624 Dulles Summit CourtDulles, VA 20166
[email address withheld at author’s request]
ABSTRACT: The quantitation of cocaine by gas chromatography-flame ionization detection usingisopropylcocaine as a structurally related internal standard is presented. The selectivity, precision, and accuracyof the method are detailed. The facile, multi-gram synthesis of isopropylcocaine standard from cocaine (via twodifferent routes) is described.
KEYWORDS: Isopropylcocaine, Synthesis, Gas Chromatography, Flame Ionization Detection, CocaineQuantitation, Internal Standard, Forensic Chemistry
Introduction
The analysis of cocaine exhibits has been a major task in forensic, crime, and toxicological laboratories over thepast 20 - 25 years. Federal Sentencing Guidelines (1), as well as some state criminal statutes, require quantitativeanalysis of cocaine exhibits. In addition, the accurate assay of cocaine is also a critical element for laboratoriesthat are conducting cocaine signature analyses (2-3). In the DEA's Cocaine Signature Program (CSP), targetalkaloids are quantitated relative to the amount of cocaine present, not to the total sample weight. Therefore, evensamples that are cut, either with an adulterant or a diluent, can still be analyzed for signature purposes as thoughthey were uncut. However, this technique requires highly accurate quantitations of all of the target alkaloids.
Several gas chromatographic methods have been developed and validated for cocaine quantitation (4-8). Thesemethods utilize an internal standard (ISTD) to improve the precision of the quantitative analysis; however, theISTDs utilized in these studies (tetraphenylethylene, morphine HCl, cyclobenzapine HCl, methylpalmitate, oreicosane) are not structurally related to cocaine, and in fact in most instances have dissimilar chemical andphysical properties. Thus, the presence of impurities, possible acid hydrolysis of cocaine (9), dirty injection ports,and the formation of artifacts (10), can decrease the accuracy of the assay (11). The use of a structurally relatedinternal standard (SR-ISTD) minimize the factors that affect the resulting analyte signal (in this case cocaine),since the SR-ISTD will have virtually the same response to the detector (3). The gas chromatographic methodpresented herein employs isopropyl cocaine as the SR-ISTD. Isopropylcocaine is not commercially available;however, also as described herein it can be synthesized from cocaine and commercially available reagents (seeFigure 1, next page).
Experimental
Materials: Pharmaceutical cocaine base and hydrochloride were obtained from Merck Chemical (Rahway, NJ). Chloroform was a distilled-in-glass product of Burdick and Jackson Laboratories (Muskegon, MI). All other
Brought to you by AltGov2 [www.altgov2.org]
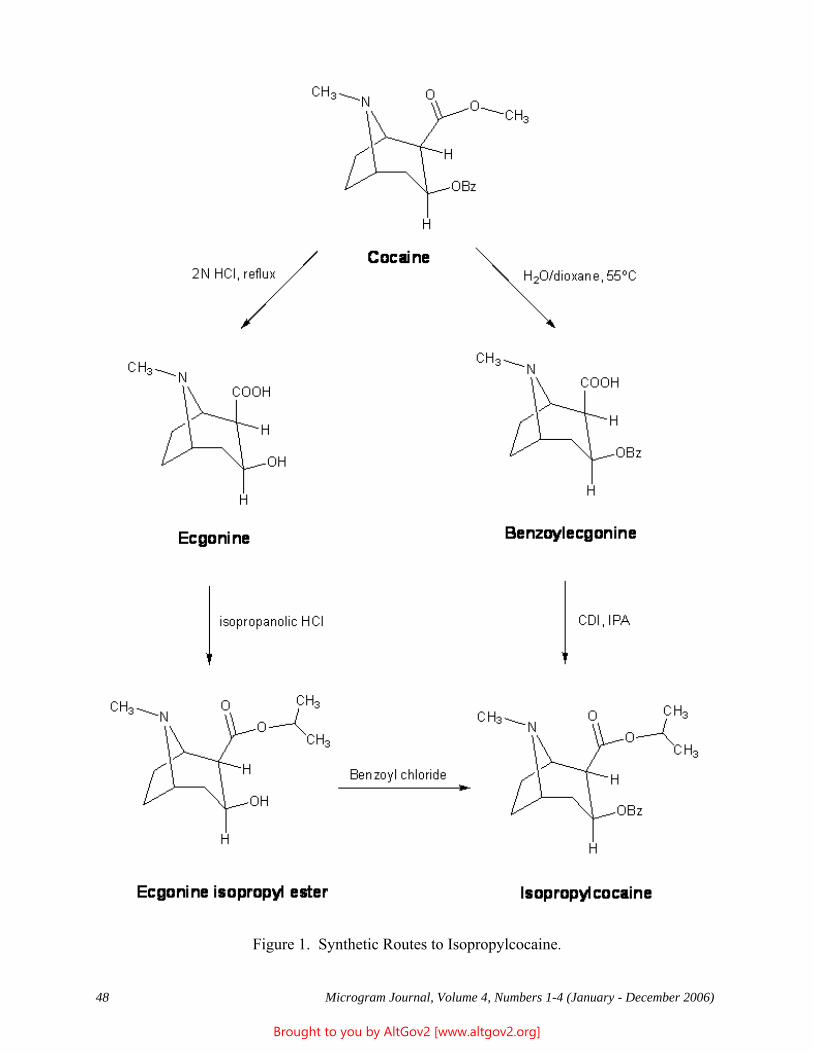
48 Microgram Journal, Volume 4, Numbers 1-4 (January - December 2006)
Figure 1. Synthetic Routes to Isopropylcocaine.
Brought to you by AltGov2 [www.altgov2.org]
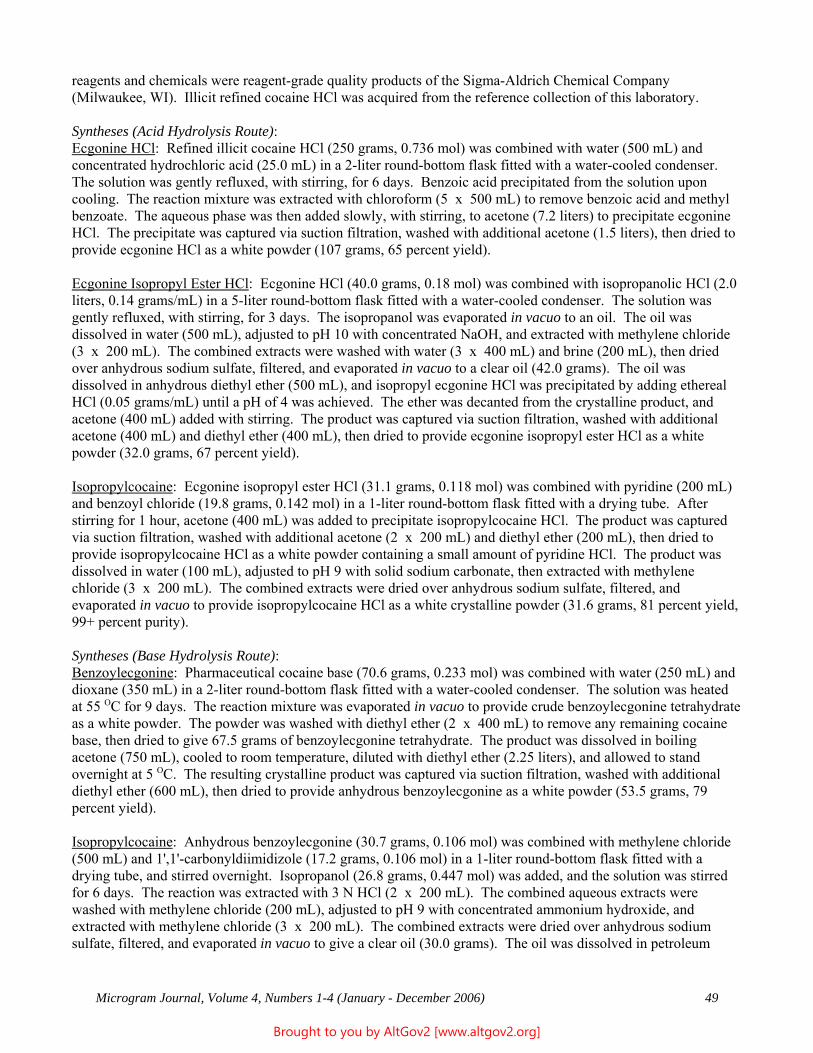
Microgram Journal, Volume 4, Numbers 1-4 (January - December 2006) 49
reagents and chemicals were reagent-grade quality products of the Sigma-Aldrich Chemical Company(Milwaukee, WI). Illicit refined cocaine HCl was acquired from the reference collection of this laboratory.
Syntheses (Acid Hydrolysis Route):Ecgonine HCl: Refined illicit cocaine HCl (250 grams, 0.736 mol) was combined with water (500 mL) andconcentrated hydrochloric acid (25.0 mL) in a 2-liter round-bottom flask fitted with a water-cooled condenser. The solution was gently refluxed, with stirring, for 6 days. Benzoic acid precipitated from the solution uponcooling. The reaction mixture was extracted with chloroform (5 x 500 mL) to remove benzoic acid and methylbenzoate. The aqueous phase was then added slowly, with stirring, to acetone (7.2 liters) to precipitate ecgonineHCl. The precipitate was captured via suction filtration, washed with additional acetone (1.5 liters), then dried toprovide ecgonine HCl as a white powder (107 grams, 65 percent yield).
Ecgonine Isopropyl Ester HCl: Ecgonine HCl (40.0 grams, 0.18 mol) was combined with isopropanolic HCl (2.0liters, 0.14 grams/mL) in a 5-liter round-bottom flask fitted with a water-cooled condenser. The solution wasgently refluxed, with stirring, for 3 days. The isopropanol was evaporated in vacuo to an oil. The oil wasdissolved in water (500 mL), adjusted to pH 10 with concentrated NaOH, and extracted with methylene chloride(3 x 200 mL). The combined extracts were washed with water (3 x 400 mL) and brine (200 mL), then driedover anhydrous sodium sulfate, filtered, and evaporated in vacuo to a clear oil (42.0 grams). The oil wasdissolved in anhydrous diethyl ether (500 mL), and isopropyl ecgonine HCl was precipitated by adding etherealHCl (0.05 grams/mL) until a pH of 4 was achieved. The ether was decanted from the crystalline product, andacetone (400 mL) added with stirring. The product was captured via suction filtration, washed with additionalacetone (400 mL) and diethyl ether (400 mL), then dried to provide ecgonine isopropyl ester HCl as a whitepowder (32.0 grams, 67 percent yield).
Isopropylcocaine: Ecgonine isopropyl ester HCl (31.1 grams, 0.118 mol) was combined with pyridine (200 mL)and benzoyl chloride (19.8 grams, 0.142 mol) in a 1-liter round-bottom flask fitted with a drying tube. Afterstirring for 1 hour, acetone (400 mL) was added to precipitate isopropylcocaine HCl. The product was capturedvia suction filtration, washed with additional acetone (2 x 200 mL) and diethyl ether (200 mL), then dried toprovide isopropylcocaine HCl as a white powder containing a small amount of pyridine HCl. The product wasdissolved in water (100 mL), adjusted to pH 9 with solid sodium carbonate, then extracted with methylenechloride (3 x 200 mL). The combined extracts were dried over anhydrous sodium sulfate, filtered, andevaporated in vacuo to provide isopropylcocaine HCl as a white crystalline powder (31.6 grams, 81 percent yield,99+ percent purity).
Syntheses (Base Hydrolysis Route):Benzoylecgonine: Pharmaceutical cocaine base (70.6 grams, 0.233 mol) was combined with water (250 mL) anddioxane (350 mL) in a 2-liter round-bottom flask fitted with a water-cooled condenser. The solution was heatedat 55 OC for 9 days. The reaction mixture was evaporated in vacuo to provide crude benzoylecgonine tetrahydrateas a white powder. The powder was washed with diethyl ether (2 x 400 mL) to remove any remaining cocainebase, then dried to give 67.5 grams of benzoylecgonine tetrahydrate. The product was dissolved in boilingacetone (750 mL), cooled to room temperature, diluted with diethyl ether (2.25 liters), and allowed to standovernight at 5 OC. The resulting crystalline product was captured via suction filtration, washed with additionaldiethyl ether (600 mL), then dried to provide anhydrous benzoylecgonine as a white powder (53.5 grams, 79percent yield).
Isopropylcocaine: Anhydrous benzoylecgonine (30.7 grams, 0.106 mol) was combined with methylene chloride(500 mL) and 1',1'-carbonyldiimidizole (17.2 grams, 0.106 mol) in a 1-liter round-bottom flask fitted with adrying tube, and stirred overnight. Isopropanol (26.8 grams, 0.447 mol) was added, and the solution was stirredfor 6 days. The reaction was extracted with 3 N HCl (2 x 200 mL). The combined aqueous extracts werewashed with methylene chloride (200 mL), adjusted to pH 9 with concentrated ammonium hydroxide, andextracted with methylene chloride (3 x 200 mL). The combined extracts were dried over anhydrous sodiumsulfate, filtered, and evaporated in vacuo to give a clear oil (30.0 grams). The oil was dissolved in petroleum
Brought to you by AltGov2 [www.altgov2.org]
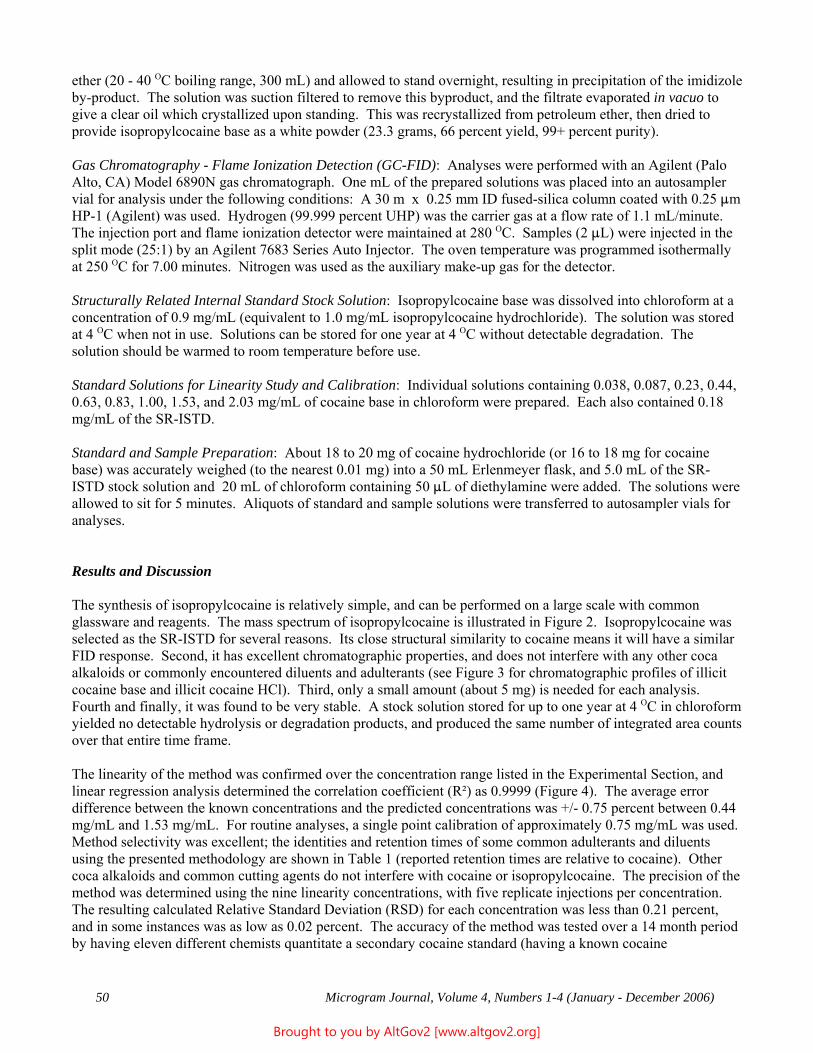
50 Microgram Journal, Volume 4, Numbers 1-4 (January - December 2006)
ether (20 - 40 OC boiling range, 300 mL) and allowed to stand overnight, resulting in precipitation of the imidizoleby-product. The solution was suction filtered to remove this byproduct, and the filtrate evaporated in vacuo togive a clear oil which crystallized upon standing. This was recrystallized from petroleum ether, then dried toprovide isopropylcocaine base as a white powder (23.3 grams, 66 percent yield, 99+ percent purity).
Gas Chromatography - Flame Ionization Detection (GC-FID): Analyses were performed with an Agilent (PaloAlto, CA) Model 6890N gas chromatograph. One mL of the prepared solutions was placed into an autosamplervial for analysis under the following conditions: A 30 m x 0.25 mm ID fused-silica column coated with 0.25 :mHP-1 (Agilent) was used. Hydrogen (99.999 percent UHP) was the carrier gas at a flow rate of 1.1 mL/minute. The injection port and flame ionization detector were maintained at 280 OC. Samples (2 :L) were injected in thesplit mode (25:1) by an Agilent 7683 Series Auto Injector. The oven temperature was programmed isothermallyat 250 OC for 7.00 minutes. Nitrogen was used as the auxiliary make-up gas for the detector.
Structurally Related Internal Standard Stock Solution: Isopropylcocaine base was dissolved into chloroform at aconcentration of 0.9 mg/mL (equivalent to 1.0 mg/mL isopropylcocaine hydrochloride). The solution was storedat 4 OC when not in use. Solutions can be stored for one year at 4 OC without detectable degradation. Thesolution should be warmed to room temperature before use.
Standard Solutions for Linearity Study and Calibration: Individual solutions containing 0.038, 0.087, 0.23, 0.44,0.63, 0.83, 1.00, 1.53, and 2.03 mg/mL of cocaine base in chloroform were prepared. Each also contained 0.18mg/mL of the SR-ISTD.
Standard and Sample Preparation: About 18 to 20 mg of cocaine hydrochloride (or 16 to 18 mg for cocainebase) was accurately weighed (to the nearest 0.01 mg) into a 50 mL Erlenmeyer flask, and 5.0 mL of the SR-ISTD stock solution and 20 mL of chloroform containing 50 :L of diethylamine were added. The solutions wereallowed to sit for 5 minutes. Aliquots of standard and sample solutions were transferred to autosampler vials foranalyses.
Results and Discussion
The synthesis of isopropylcocaine is relatively simple, and can be performed on a large scale with commonglassware and reagents. The mass spectrum of isopropylcocaine is illustrated in Figure 2. Isopropylcocaine wasselected as the SR-ISTD for several reasons. Its close structural similarity to cocaine means it will have a similarFID response. Second, it has excellent chromatographic properties, and does not interfere with any other cocaalkaloids or commonly encountered diluents and adulterants (see Figure 3 for chromatographic profiles of illicitcocaine base and illicit cocaine HCl). Third, only a small amount (about 5 mg) is needed for each analysis. Fourth and finally, it was found to be very stable. A stock solution stored for up to one year at 4 OC in chloroformyielded no detectable hydrolysis or degradation products, and produced the same number of integrated area countsover that entire time frame.
The linearity of the method was confirmed over the concentration range listed in the Experimental Section, andlinear regression analysis determined the correlation coefficient (R²) as 0.9999 (Figure 4). The average errordifference between the known concentrations and the predicted concentrations was +/- 0.75 percent between 0.44mg/mL and 1.53 mg/mL. For routine analyses, a single point calibration of approximately 0.75 mg/mL was used. Method selectivity was excellent; the identities and retention times of some common adulterants and diluentsusing the presented methodology are shown in Table 1 (reported retention times are relative to cocaine). Othercoca alkaloids and common cutting agents do not interfere with cocaine or isopropylcocaine. The precision of themethod was determined using the nine linearity concentrations, with five replicate injections per concentration. The resulting calculated Relative Standard Deviation (RSD) for each concentration was less than 0.21 percent,and in some instances was as low as 0.02 percent. The accuracy of the method was tested over a 14 month periodby having eleven different chemists quantitate a secondary cocaine standard (having a known cocaine
Brought to you by AltGov2 [www.altgov2.org]
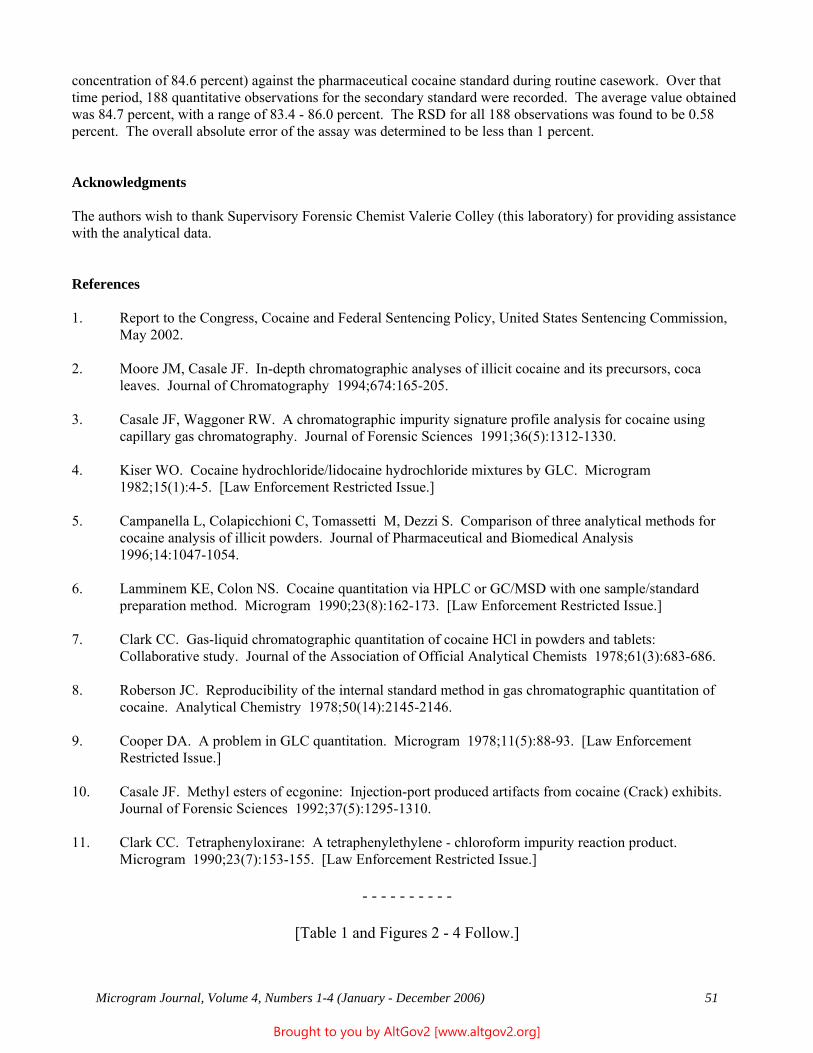
Microgram Journal, Volume 4, Numbers 1-4 (January - December 2006) 51
concentration of 84.6 percent) against the pharmaceutical cocaine standard during routine casework. Over thattime period, 188 quantitative observations for the secondary standard were recorded. The average value obtainedwas 84.7 percent, with a range of 83.4 - 86.0 percent. The RSD for all 188 observations was found to be 0.58percent. The overall absolute error of the assay was determined to be less than 1 percent.
Acknowledgments
The authors wish to thank Supervisory Forensic Chemist Valerie Colley (this laboratory) for providing assistancewith the analytical data.
References
1. Report to the Congress, Cocaine and Federal Sentencing Policy, United States Sentencing Commission,May 2002.
2. Moore JM, Casale JF. In-depth chromatographic analyses of illicit cocaine and its precursors, cocaleaves. Journal of Chromatography 1994;674:165-205.
3. Casale JF, Waggoner RW. A chromatographic impurity signature profile analysis for cocaine usingcapillary gas chromatography. Journal of Forensic Sciences 1991;36(5):1312-1330.
4. Kiser WO. Cocaine hydrochloride/lidocaine hydrochloride mixtures by GLC. Microgram 1982;15(1):4-5. [Law Enforcement Restricted Issue.]
5. Campanella L, Colapicchioni C, Tomassetti M, Dezzi S. Comparison of three analytical methods forcocaine analysis of illicit powders. Journal of Pharmaceutical and Biomedical Analysis 1996;14:1047-1054.
6. Lamminem KE, Colon NS. Cocaine quantitation via HPLC or GC/MSD with one sample/standardpreparation method. Microgram 1990;23(8):162-173. [Law Enforcement Restricted Issue.]
7. Clark CC. Gas-liquid chromatographic quantitation of cocaine HCl in powders and tablets: Collaborative study. Journal of the Association of Official Analytical Chemists 1978;61(3):683-686.
8. Roberson JC. Reproducibility of the internal standard method in gas chromatographic quantitation ofcocaine. Analytical Chemistry 1978;50(14):2145-2146.
9. Cooper DA. A problem in GLC quantitation. Microgram 1978;11(5):88-93. [Law EnforcementRestricted Issue.]
10. Casale JF. Methyl esters of ecgonine: Injection-port produced artifacts from cocaine (Crack) exhibits. Journal of Forensic Sciences 1992;37(5):1295-1310.
11. Clark CC. Tetraphenyloxirane: A tetraphenylethylene - chloroform impurity reaction product. Microgram 1990;23(7):153-155. [Law Enforcement Restricted Issue.]
- - - - - - - - - -
[Table 1 and Figures 2 - 4 Follow.]
Brought to you by AltGov2 [www.altgov2.org]
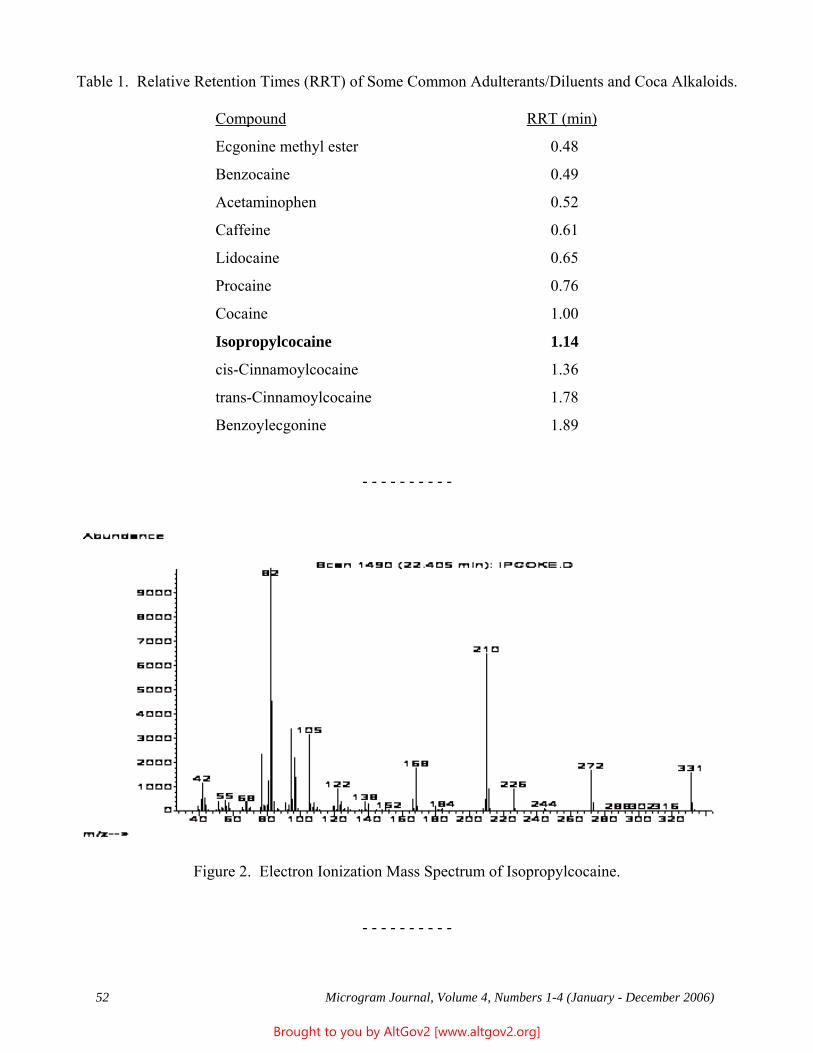
52 Microgram Journal, Volume 4, Numbers 1-4 (January - December 2006)
Table 1. Relative Retention Times (RRT) of Some Common Adulterants/Diluents and Coca Alkaloids.
Compound RRT (min)
Ecgonine methyl ester 0.48
Benzocaine 0.49
Acetaminophen 0.52
Caffeine 0.61
Lidocaine 0.65
Procaine 0.76
Cocaine 1.00
Isopropylcocaine 1.14
cis-Cinnamoylcocaine 1.36
trans-Cinnamoylcocaine 1.78
Benzoylecgonine 1.89
- - - - - - - - - -
Figure 2. Electron Ionization Mass Spectrum of Isopropylcocaine.
- - - - - - - - - -
Brought to you by AltGov2 [www.altgov2.org]
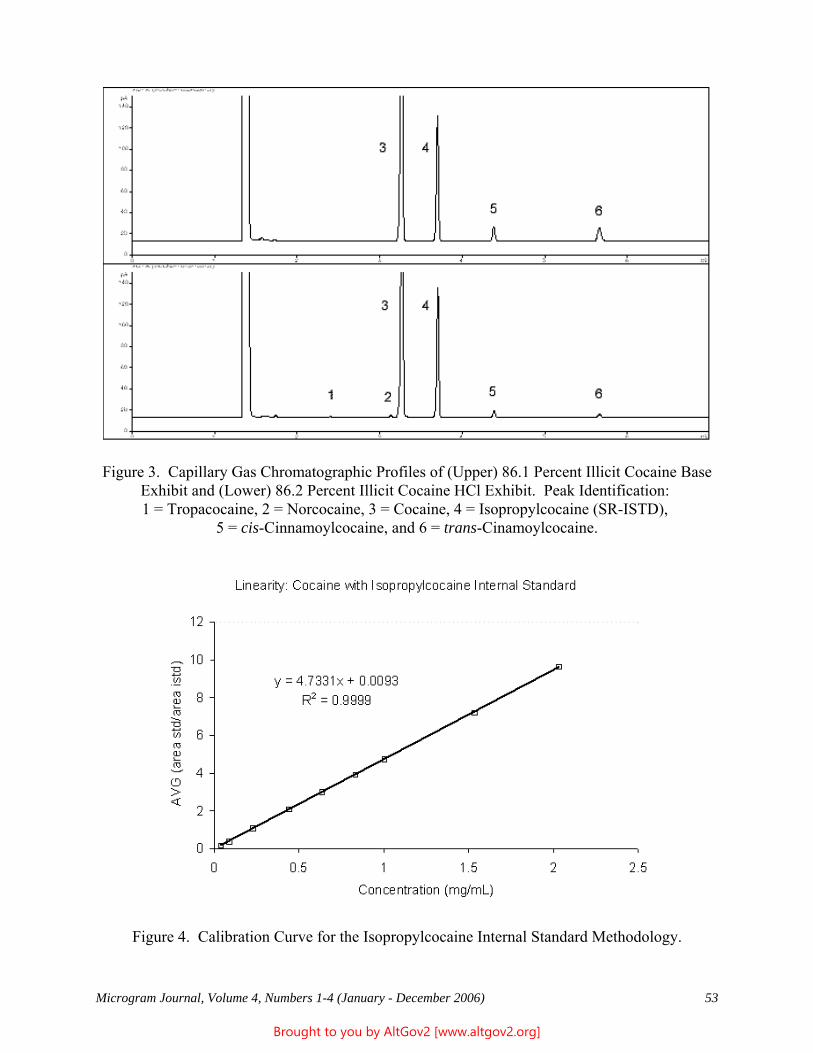
Microgram Journal, Volume 4, Numbers 1-4 (January - December 2006) 53
Figure 3. Capillary Gas Chromatographic Profiles of (Upper) 86.1 Percent Illicit Cocaine BaseExhibit and (Lower) 86.2 Percent Illicit Cocaine HCl Exhibit. Peak Identification: 1 = Tropacocaine, 2 = Norcocaine, 3 = Cocaine, 4 = Isopropylcocaine (SR-ISTD),
5 = cis-Cinnamoylcocaine, and 6 = trans-Cinamoylcocaine.
Figure 4. Calibration Curve for the Isopropylcocaine Internal Standard Methodology.
Brought to you by AltGov2 [www.altgov2.org]
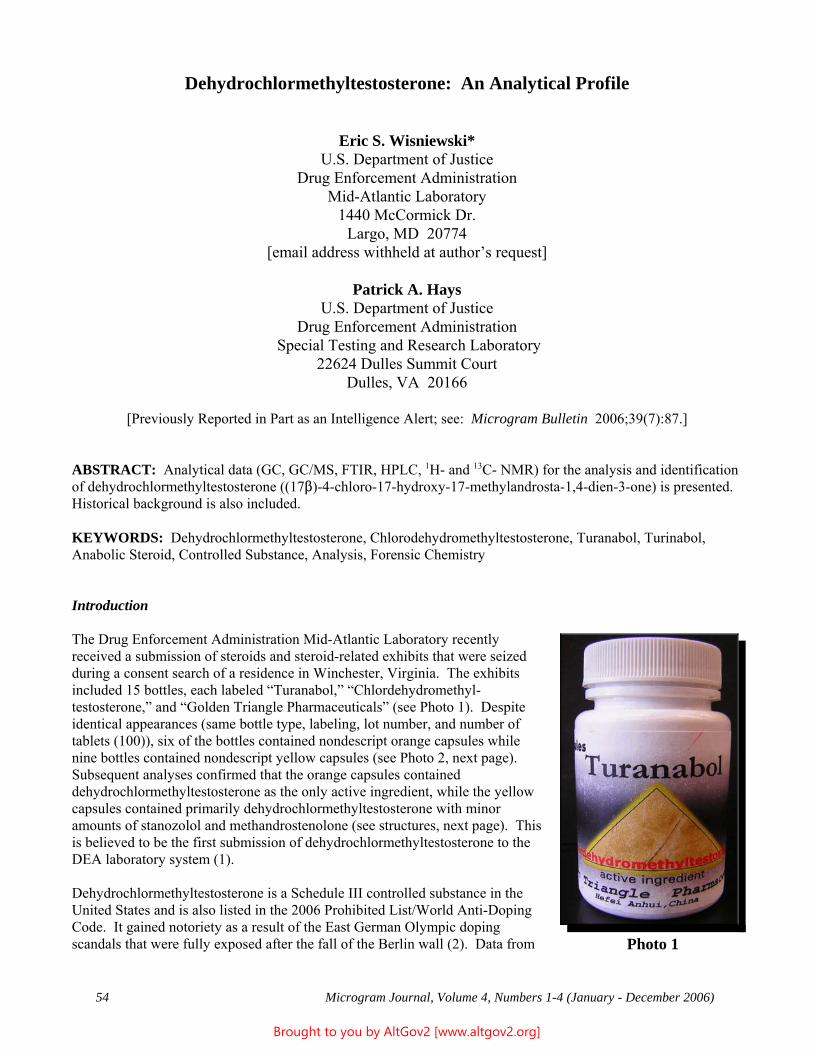
54 Microgram Journal, Volume 4, Numbers 1-4 (January - December 2006)
Dehydrochlormethyltestosterone: An Analytical Profile
Eric S. Wisniewski*U.S. Department of Justice
Drug Enforcement AdministrationMid-Atlantic Laboratory
1440 McCormick Dr.Largo, MD 20774
[email address withheld at author’s request]
Patrick A. HaysU.S. Department of Justice
Drug Enforcement Administration Special Testing and Research Laboratory
22624 Dulles Summit CourtDulles, VA 20166
[Previously Reported in Part as an Intelligence Alert; see: Microgram Bulletin 2006;39(7):87.]
ABSTRACT: Analytical data (GC, GC/MS, FTIR, HPLC, 1H- and 13C- NMR) for the analysis and identificationof dehydrochlormethyltestosterone ((17$)-4-chloro-17-hydroxy-17-methylandrosta-1,4-dien-3-one) is presented. Historical background is also included.
KEYWORDS: Dehydrochlormethyltestosterone, Chlorodehydromethyltestosterone, Turanabol, Turinabol,Anabolic Steroid, Controlled Substance, Analysis, Forensic Chemistry
Introduction
The Drug Enforcement Administration Mid-Atlantic Laboratory recentlyreceived a submission of steroids and steroid-related exhibits that were seizedduring a consent search of a residence in Winchester, Virginia. The exhibitsincluded 15 bottles, each labeled “Turanabol,” “Chlordehydromethyl-testosterone,” and “Golden Triangle Pharmaceuticals” (see Photo 1). Despiteidentical appearances (same bottle type, labeling, lot number, and number oftablets (100)), six of the bottles contained nondescript orange capsules whilenine bottles contained nondescript yellow capsules (see Photo 2, next page). Subsequent analyses confirmed that the orange capsules containeddehydrochlormethyltestosterone as the only active ingredient, while the yellowcapsules contained primarily dehydrochlormethyltestosterone with minoramounts of stanozolol and methandrostenolone (see structures, next page). Thisis believed to be the first submission of dehydrochlormethyltestosterone to theDEA laboratory system (1).
Dehydrochlormethyltestosterone is a Schedule III controlled substance in theUnited States and is also listed in the 2006 Prohibited List/World Anti-DopingCode. It gained notoriety as a result of the East German Olympic dopingscandals that were fully exposed after the fall of the Berlin wall (2). Data from Photo 1
Brought to you by AltGov2 [www.altgov2.org]
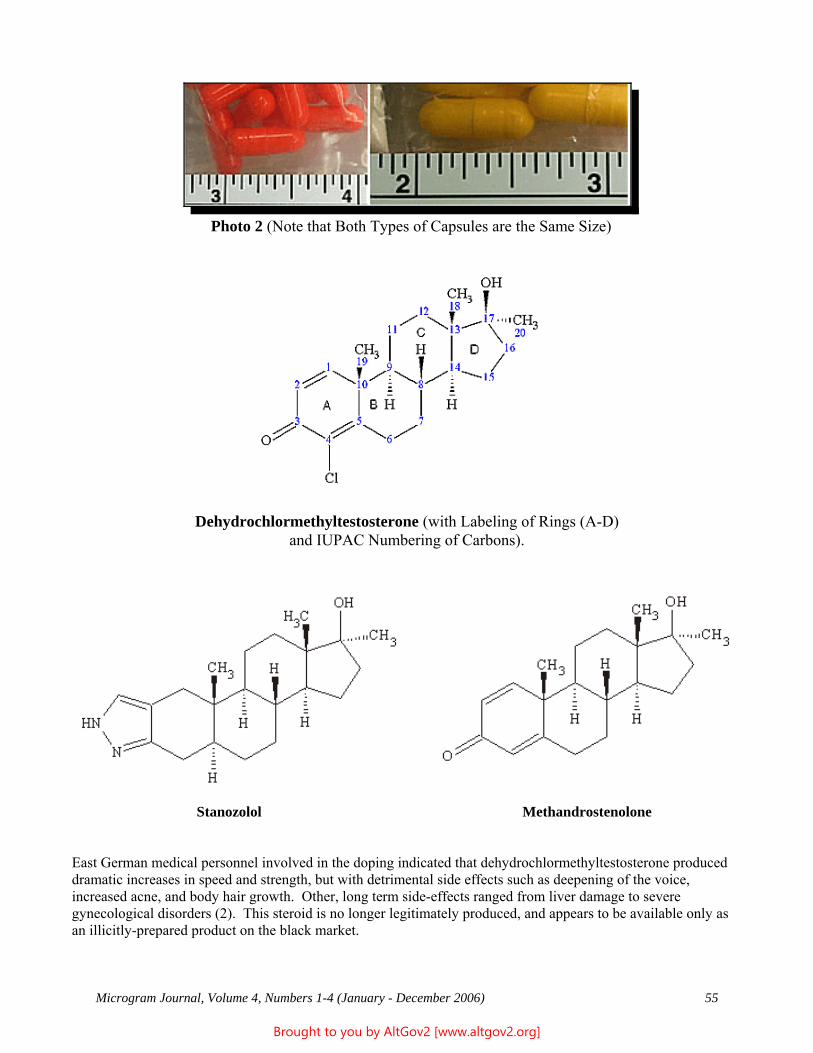
Microgram Journal, Volume 4, Numbers 1-4 (January - December 2006) 55
Dehydrochlormethyltestosterone (with Labeling of Rings (A-D)and IUPAC Numbering of Carbons).
Stanozolol Methandrostenolone
East German medical personnel involved in the doping indicated that dehydrochlormethyltestosterone produceddramatic increases in speed and strength, but with detrimental side effects such as deepening of the voice,increased acne, and body hair growth. Other, long term side-effects ranged from liver damage to severegynecological disorders (2). This steroid is no longer legitimately produced, and appears to be available only asan illicitly-prepared product on the black market.
Photo 2 (Note that Both Types of Capsules are the Same Size)
Brought to you by AltGov2 [www.altgov2.org]
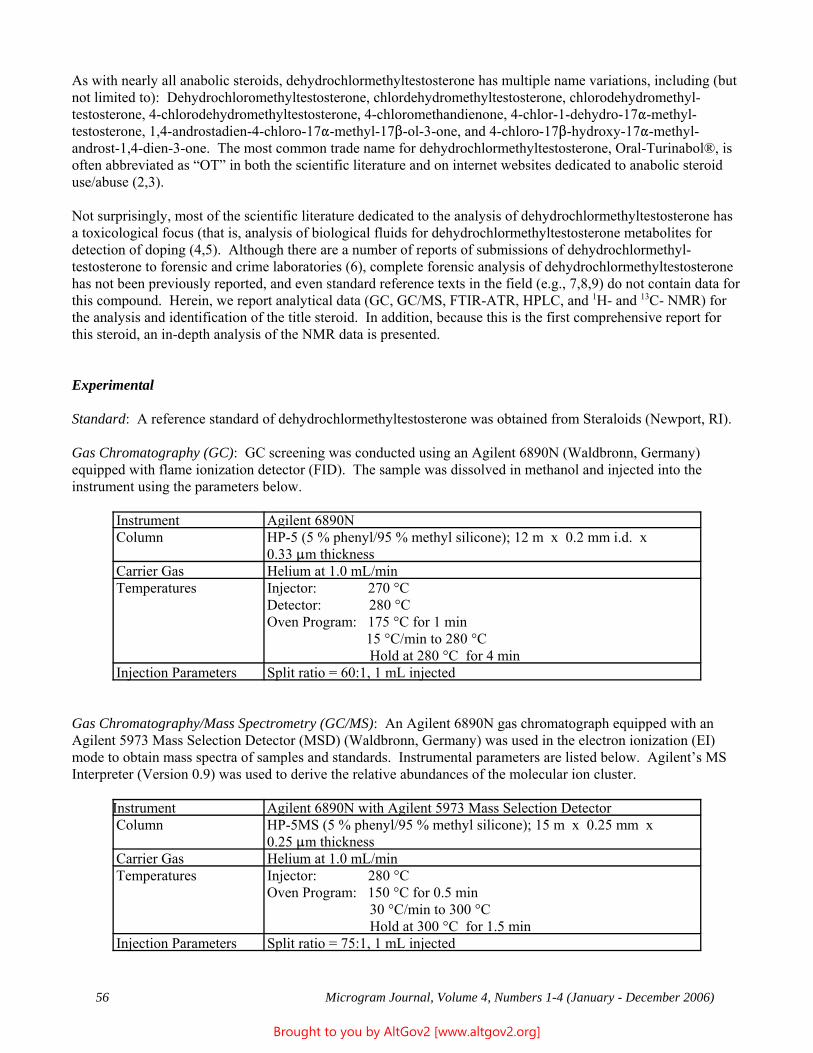
56 Microgram Journal, Volume 4, Numbers 1-4 (January - December 2006)
As with nearly all anabolic steroids, dehydrochlormethyltestosterone has multiple name variations, including (butnot limited to): Dehydrochloromethyltestosterone, chlordehydromethyltestosterone, chlorodehydromethyl-testosterone, 4-chlorodehydromethyltestosterone, 4-chloromethandienone, 4-chlor-1-dehydro-17"-methyl-testosterone, 1,4-androstadien-4-chloro-17"-methyl-17$-ol-3-one, and 4-chloro-17$-hydroxy-17"-methyl-androst-1,4-dien-3-one. The most common trade name for dehydrochlormethyltestosterone, Oral-Turinabol®, isoften abbreviated as “OT” in both the scientific literature and on internet websites dedicated to anabolic steroiduse/abuse (2,3).
Not surprisingly, most of the scientific literature dedicated to the analysis of dehydrochlormethyltestosterone hasa toxicological focus (that is, analysis of biological fluids for dehydrochlormethyltestosterone metabolites fordetection of doping (4,5). Although there are a number of reports of submissions of dehydrochlormethyl-testosterone to forensic and crime laboratories (6), complete forensic analysis of dehydrochlormethyltestosteronehas not been previously reported, and even standard reference texts in the field (e.g., 7,8,9) do not contain data forthis compound. Herein, we report analytical data (GC, GC/MS, FTIR-ATR, HPLC, and 1H- and 13C- NMR) forthe analysis and identification of the title steroid. In addition, because this is the first comprehensive report forthis steroid, an in-depth analysis of the NMR data is presented.
Experimental
Standard: A reference standard of dehydrochlormethyltestosterone was obtained from Steraloids (Newport, RI).
Gas Chromatography (GC): GC screening was conducted using an Agilent 6890N (Waldbronn, Germany)equipped with flame ionization detector (FID). The sample was dissolved in methanol and injected into theinstrument using the parameters below.
Instrument Agilent 6890N Column HP-5 (5 % phenyl/95 % methyl silicone); 12 m x 0.2 mm i.d. x
0.33 :m thickness Carrier Gas Helium at 1.0 mL/min Temperatures Injector: 270 °C
Detector: 280 °C Oven Program: 175 °C for 1 min 15 °C/min to 280 °C Hold at 280 °C for 4 min
Injection Parameters Split ratio = 60:1, 1 mL injected
Gas Chromatography/Mass Spectrometry (GC/MS): An Agilent 6890N gas chromatograph equipped with anAgilent 5973 Mass Selection Detector (MSD) (Waldbronn, Germany) was used in the electron ionization (EI)mode to obtain mass spectra of samples and standards. Instrumental parameters are listed below. Agilent’s MSInterpreter (Version 0.9) was used to derive the relative abundances of the molecular ion cluster.
Instrument Agilent 6890N with Agilent 5973 Mass Selection Detector Column HP-5MS (5 % phenyl/95 % methyl silicone); 15 m x 0.25 mm x
0.25 :m thickness Carrier Gas Helium at 1.0 mL/min Temperatures Injector: 280 °C
Oven Program: 150 °C for 0.5 min 30 °C/min to 300 °C Hold at 300 °C for 1.5 min
Injection Parameters Split ratio = 75:1, 1 mL injected
Brought to you by AltGov2 [www.altgov2.org]
Microgram Journal, Volume 4, Numbers 1-4 (January - December 2006) 57
Detector Quadrupole Mass Detector Temperatures Transfer Line: 280 °C
MS Quad: 150 °C MS Source: 230 °C
Acquisition Mode Scan Solvent Delay Time 0.5 minutes Scan Parameters Mass Range: 40 - 450 amu
Sample #: 3 (2n = 8 samples taken at each mass) Resulting Scan Rate = 1.84 scans/sec
Fourier Transform Infrared Spectrometer - Attenuated Total Reflectance (FTIR-ATR): Infrared spectroscopy wasperformed using a Thermo Nicolet Nexus 670 Fourier Transform Infrared Spectrometer (FTIR) (Madison, WI)equipped with a Golden Gate Attenuated Total Reflectance (ATR) detector. The sample was prepared byextraction of the capsule matrix with methanol followed by evaporation. The IR spectrum was collected byaveraging 24 scans with a resolution of 4.0 wavenumbers (cm-1).
High Performance Liquid Chromatography (HPLC): HPLC was conducted using an Agilent 1100 Seriesinstrument (Waldbronn, Germany) using ultraviolet (UV) detection. The sample was dissolved in methanol andinjected into the instrument using the parameters below (10).
Instrument Agilent 1100 Series Column Waters Xterra RP18 (4.6 x 150 mm, 3.5 mm) Mobile Phase 80 % Water (W): 20 % Acetonitrile (A) hold for 3 min
Ramp to 55 % W: 45 % A for 2 min and hold for 8 min Ramp to 35 % W: 65 % A for 3 min and hold for 10 min Ramp to 10 % W: 90 % A for 5 min and hold for 9 min
Temperature 45 °C Detection Wavelength 225 nm Injection Volume 5 mL Injection Solvent Methanol
Nuclear Magnetic Resonance (NMR) Spectroscopy: One and two dimensional (1D and 2D) NMR experimentswere performed on a Varian Mercury 400 MHz NMR using a 5 mm Varian Nalorac pulse field gradient (PFG)indirection detection probe (Varian Inc., Palo Alto, CA). Standard Varian pulse sequences were employed. Thesample and standard were prepared in deuterated methanol (CD3OD) with tetramethylsilane (TMS) added(approximately 0.05 % v/v) as the reference at 0 ppm (Aldrich Chemical Co., Milwaukee, WI). The 1H-NMRspectrum of the standard was obtained with 8 scans using a 45 second delay, 90 O pulse, 2 second acquisitiontime, and oversampling of 6. The 13C-NMR spectrum of the standard was obtained with proton decoupling; 2,000scans were acquired, using a 1 second delay, 45 O pulse, 1.2 second acquisition time, and oversampling of 3. Samples were maintained at 25 OC. Standard Varian gradient versions of 2D NMR experiments were performedto help make assignments, including homonuclear COSY (2 - 4 bond proton-proton through bond correlations),NOESY (proton - proton spatial nearness correlations for protons < 4 angstroms apart), heteronuclear HSQC(proton to directly bonded carbon correlations), and HMBC (2, 3, or 4 bond proton to carbon correlations). Structural elucidation was performed utilizing Applied Chemistry Developments (ACD/Labs, Toronto, Canada)software (HNMR Predictor, CNMR predictor, and Structure Elucidator).
- - - - - - - - - -
Brought to you by AltGov2 [www.altgov2.org]
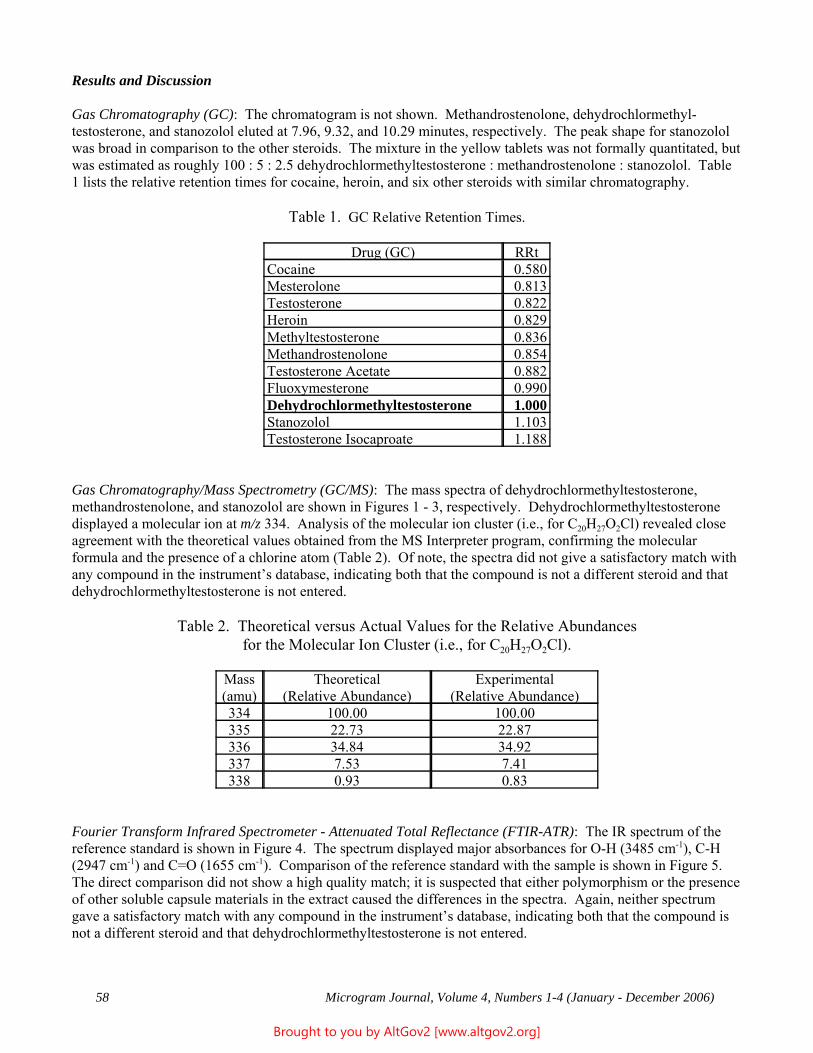
58 Microgram Journal, Volume 4, Numbers 1-4 (January - December 2006)
Results and Discussion
Gas Chromatography (GC): The chromatogram is not shown. Methandrostenolone, dehydrochlormethyl-testosterone, and stanozolol eluted at 7.96, 9.32, and 10.29 minutes, respectively. The peak shape for stanozololwas broad in comparison to the other steroids. The mixture in the yellow tablets was not formally quantitated, butwas estimated as roughly 100 : 5 : 2.5 dehydrochlormethyltestosterone : methandrostenolone : stanozolol. Table1 lists the relative retention times for cocaine, heroin, and six other steroids with similar chromatography.
Table 1. GC Relative Retention Times.
Drug (GC) RRt Cocaine 0.580 Mesterolone 0.813 Testosterone 0.822 Heroin 0.829 Methyltestosterone 0.836 Methandrostenolone 0.854 Testosterone Acetate 0.882 Fluoxymesterone 0.990 Dehydrochlormethyltestosterone 1.000 Stanozolol 1.103 Testosterone Isocaproate 1.188
Gas Chromatography/Mass Spectrometry (GC/MS): The mass spectra of dehydrochlormethyltestosterone,methandrostenolone, and stanozolol are shown in Figures 1 - 3, respectively. Dehydrochlormethyltestosteronedisplayed a molecular ion at m/z 334. Analysis of the molecular ion cluster (i.e., for C20H27O2Cl) revealed closeagreement with the theoretical values obtained from the MS Interpreter program, confirming the molecularformula and the presence of a chlorine atom (Table 2). Of note, the spectra did not give a satisfactory match withany compound in the instrument’s database, indicating both that the compound is not a different steroid and thatdehydrochlormethyltestosterone is not entered.
Table 2. Theoretical versus Actual Values for the Relative Abundancesfor the Molecular Ion Cluster (i.e., for C20H27O2Cl).
Mass(amu)
Theoretical(Relative Abundance)
Experimental(Relative Abundance)
334 100.00 100.00335 22.73 22.87336 34.84 34.92337 7.53 7.41338 0.93 0.83
Fourier Transform Infrared Spectrometer - Attenuated Total Reflectance (FTIR-ATR): The IR spectrum of thereference standard is shown in Figure 4. The spectrum displayed major absorbances for O-H (3485 cm-1), C-H(2947 cm-1) and C=O (1655 cm-1). Comparison of the reference standard with the sample is shown in Figure 5. The direct comparison did not show a high quality match; it is suspected that either polymorphism or the presenceof other soluble capsule materials in the extract caused the differences in the spectra. Again, neither spectrumgave a satisfactory match with any compound in the instrument’s database, indicating both that the compound isnot a different steroid and that dehydrochlormethyltestosterone is not entered.
Brought to you by AltGov2 [www.altgov2.org]
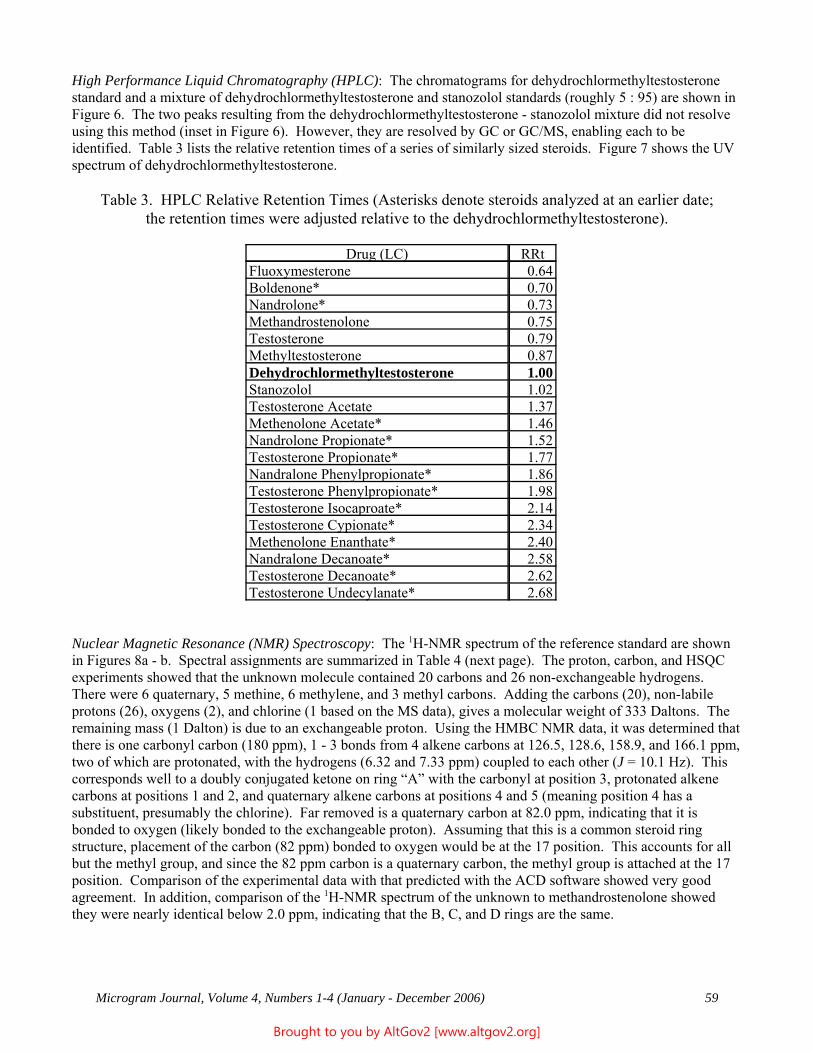
Microgram Journal, Volume 4, Numbers 1-4 (January - December 2006) 59
High Performance Liquid Chromatography (HPLC): The chromatograms for dehydrochlormethyltestosteronestandard and a mixture of dehydrochlormethyltestosterone and stanozolol standards (roughly 5 : 95) are shown inFigure 6. The two peaks resulting from the dehydrochlormethyltestosterone - stanozolol mixture did not resolveusing this method (inset in Figure 6). However, they are resolved by GC or GC/MS, enabling each to beidentified. Table 3 lists the relative retention times of a series of similarly sized steroids. Figure 7 shows the UVspectrum of dehydrochlormethyltestosterone.
Table 3. HPLC Relative Retention Times (Asterisks denote steroids analyzed at an earlier date;the retention times were adjusted relative to the dehydrochlormethyltestosterone).
Drug (LC) RRt Fluoxymesterone 0.64 Boldenone* 0.70 Nandrolone* 0.73 Methandrostenolone 0.75 Testosterone 0.79 Methyltestosterone 0.87 Dehydrochlormethyltestosterone 1.00 Stanozolol 1.02 Testosterone Acetate 1.37 Methenolone Acetate* 1.46 Nandrolone Propionate* 1.52 Testosterone Propionate* 1.77 Nandralone Phenylpropionate* 1.86 Testosterone Phenylpropionate* 1.98 Testosterone Isocaproate* 2.14 Testosterone Cypionate* 2.34 Methenolone Enanthate* 2.40 Nandralone Decanoate* 2.58 Testosterone Decanoate* 2.62 Testosterone Undecylanate* 2.68
Nuclear Magnetic Resonance (NMR) Spectroscopy: The 1H-NMR spectrum of the reference standard are shownin Figures 8a - b. Spectral assignments are summarized in Table 4 (next page). The proton, carbon, and HSQCexperiments showed that the unknown molecule contained 20 carbons and 26 non-exchangeable hydrogens. There were 6 quaternary, 5 methine, 6 methylene, and 3 methyl carbons. Adding the carbons (20), non-labileprotons (26), oxygens (2), and chlorine (1 based on the MS data), gives a molecular weight of 333 Daltons. Theremaining mass (1 Dalton) is due to an exchangeable proton. Using the HMBC NMR data, it was determined thatthere is one carbonyl carbon (180 ppm), 1 - 3 bonds from 4 alkene carbons at 126.5, 128.6, 158.9, and 166.1 ppm,two of which are protonated, with the hydrogens (6.32 and 7.33 ppm) coupled to each other (J = 10.1 Hz). Thiscorresponds well to a doubly conjugated ketone on ring “A” with the carbonyl at position 3, protonated alkenecarbons at positions 1 and 2, and quaternary alkene carbons at positions 4 and 5 (meaning position 4 has asubstituent, presumably the chlorine). Far removed is a quaternary carbon at 82.0 ppm, indicating that it isbonded to oxygen (likely bonded to the exchangeable proton). Assuming that this is a common steroid ringstructure, placement of the carbon (82 ppm) bonded to oxygen would be at the 17 position. This accounts for allbut the methyl group, and since the 82 ppm carbon is a quaternary carbon, the methyl group is attached at the 17position. Comparison of the experimental data with that predicted with the ACD software showed very goodagreement. In addition, comparison of the 1H-NMR spectrum of the unknown to methandrostenolone showedthey were nearly identical below 2.0 ppm, indicating that the B, C, and D rings are the same.
Brought to you by AltGov2 [www.altgov2.org]
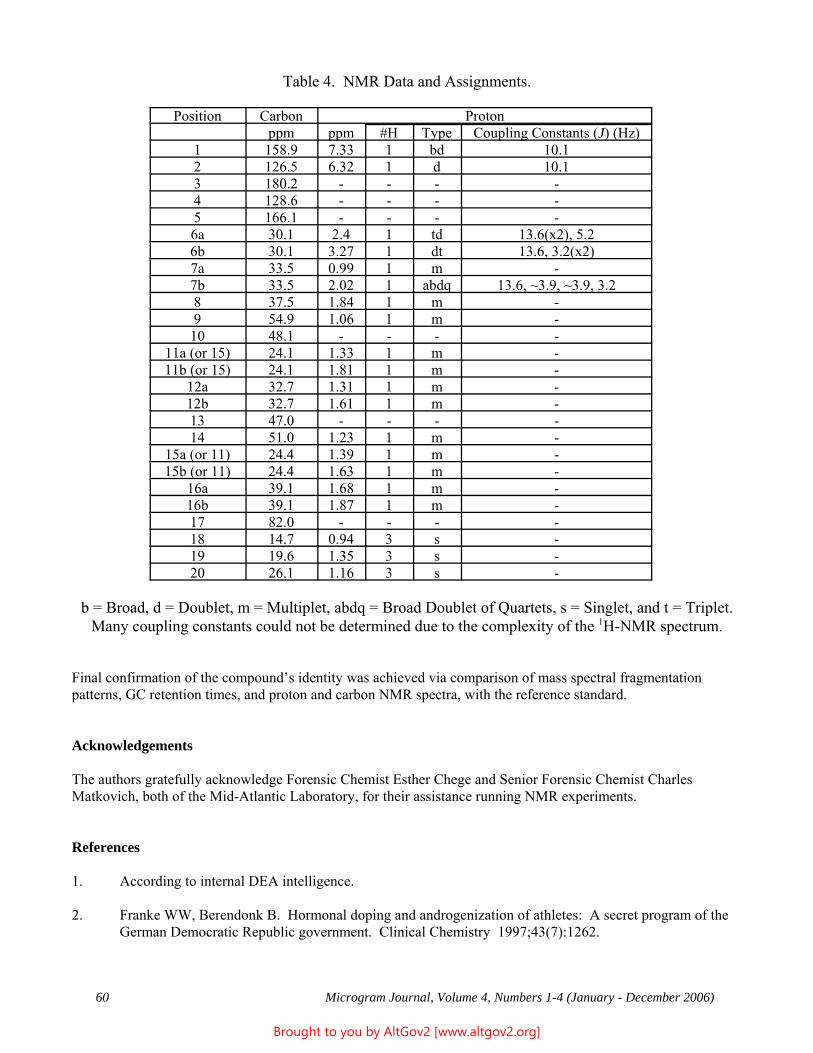
60 Microgram Journal, Volume 4, Numbers 1-4 (January - December 2006)
Table 4. NMR Data and Assignments.
Position Carbon Protonppm ppm #H Type Coupling Constants (J) (Hz)
1 158.9 7.33 1 bd 10.12 126.5 6.32 1 d 10.13 180.2 - - - -4 128.6 - - - -5 166.1 - - - -6a 30.1 2.4 1 td 13.6(x2), 5.26b 30.1 3.27 1 dt 13.6, 3.2(x2)7a 33.5 0.99 1 m -7b 33.5 2.02 1 abdq 13.6, ~3.9, ~3.9, 3.28 37.5 1.84 1 m -9 54.9 1.06 1 m -
10 48.1 - - - -11a (or 15) 24.1 1.33 1 m -11b (or 15) 24.1 1.81 1 m -
12a 32.7 1.31 1 m -12b 32.7 1.61 1 m -13 47.0 - - - -14 51.0 1.23 1 m -
15a (or 11) 24.4 1.39 1 m -15b (or 11) 24.4 1.63 1 m -
16a 39.1 1.68 1 m -16b 39.1 1.87 1 m -17 82.0 - - - -18 14.7 0.94 3 s -19 19.6 1.35 3 s -20 26.1 1.16 3 s -
b = Broad, d = Doublet, m = Multiplet, abdq = Broad Doublet of Quartets, s = Singlet, and t = Triplet.Many coupling constants could not be determined due to the complexity of the 1H-NMR spectrum.
Final confirmation of the compound’s identity was achieved via comparison of mass spectral fragmentationpatterns, GC retention times, and proton and carbon NMR spectra, with the reference standard.
Acknowledgements
The authors gratefully acknowledge Forensic Chemist Esther Chege and Senior Forensic Chemist CharlesMatkovich, both of the Mid-Atlantic Laboratory, for their assistance running NMR experiments.
References
1. According to internal DEA intelligence.
2. Franke WW, Berendonk B. Hormonal doping and androgenization of athletes: A secret program of theGerman Democratic Republic government. Clinical Chemistry 1997;43(7):1262.
Brought to you by AltGov2 [www.altgov2.org]
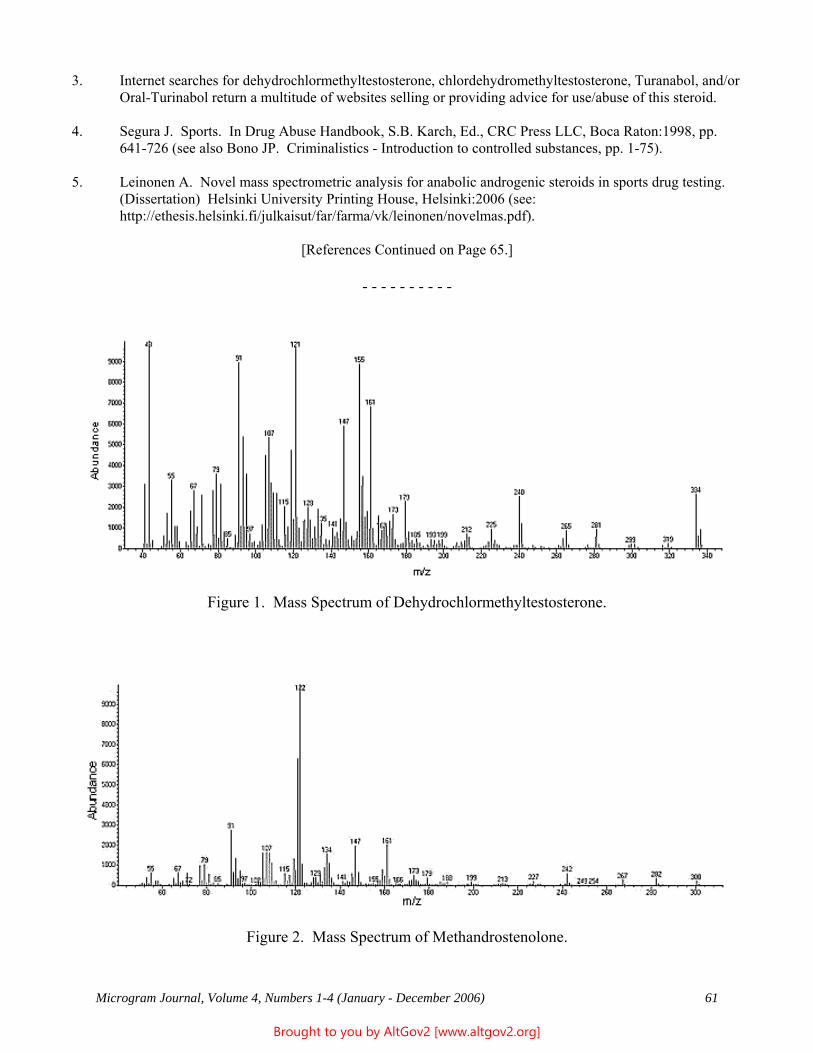
Microgram Journal, Volume 4, Numbers 1-4 (January - December 2006) 61
3. Internet searches for dehydrochlormethyltestosterone, chlordehydromethyltestosterone, Turanabol, and/orOral-Turinabol return a multitude of websites selling or providing advice for use/abuse of this steroid.
4. Segura J. Sports. In Drug Abuse Handbook, S.B. Karch, Ed., CRC Press LLC, Boca Raton:1998, pp.641-726 (see also Bono JP. Criminalistics - Introduction to controlled substances, pp. 1-75).
5. Leinonen A. Novel mass spectrometric analysis for anabolic androgenic steroids in sports drug testing. (Dissertation) Helsinki University Printing House, Helsinki:2006 (see: http://ethesis.helsinki.fi/julkaisut/far/farma/vk/leinonen/novelmas.pdf).
[References Continued on Page 65.]
- - - - - - - - - -
Figure 1. Mass Spectrum of Dehydrochlormethyltestosterone.
Figure 2. Mass Spectrum of Methandrostenolone.
Brought to you by AltGov2 [www.altgov2.org]
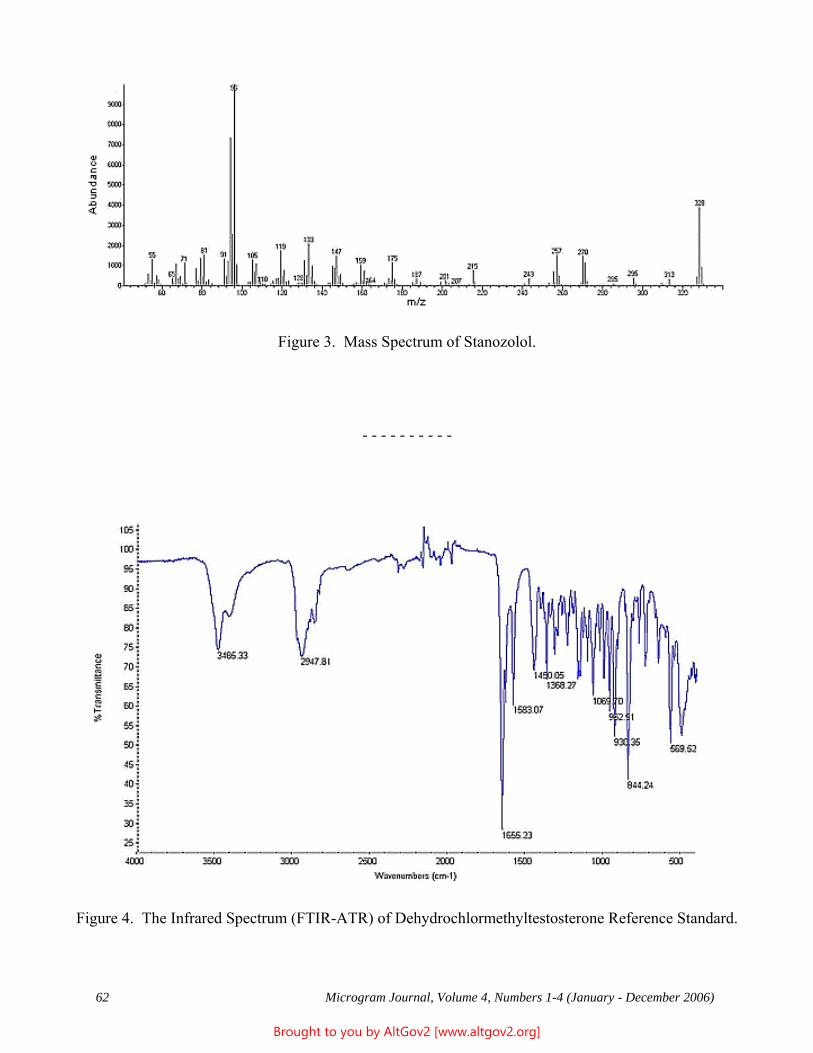
62 Microgram Journal, Volume 4, Numbers 1-4 (January - December 2006)
Figure 3. Mass Spectrum of Stanozolol.
- - - - - - - - - -
Figure 4. The Infrared Spectrum (FTIR-ATR) of Dehydrochlormethyltestosterone Reference Standard.
Brought to you by AltGov2 [www.altgov2.org]
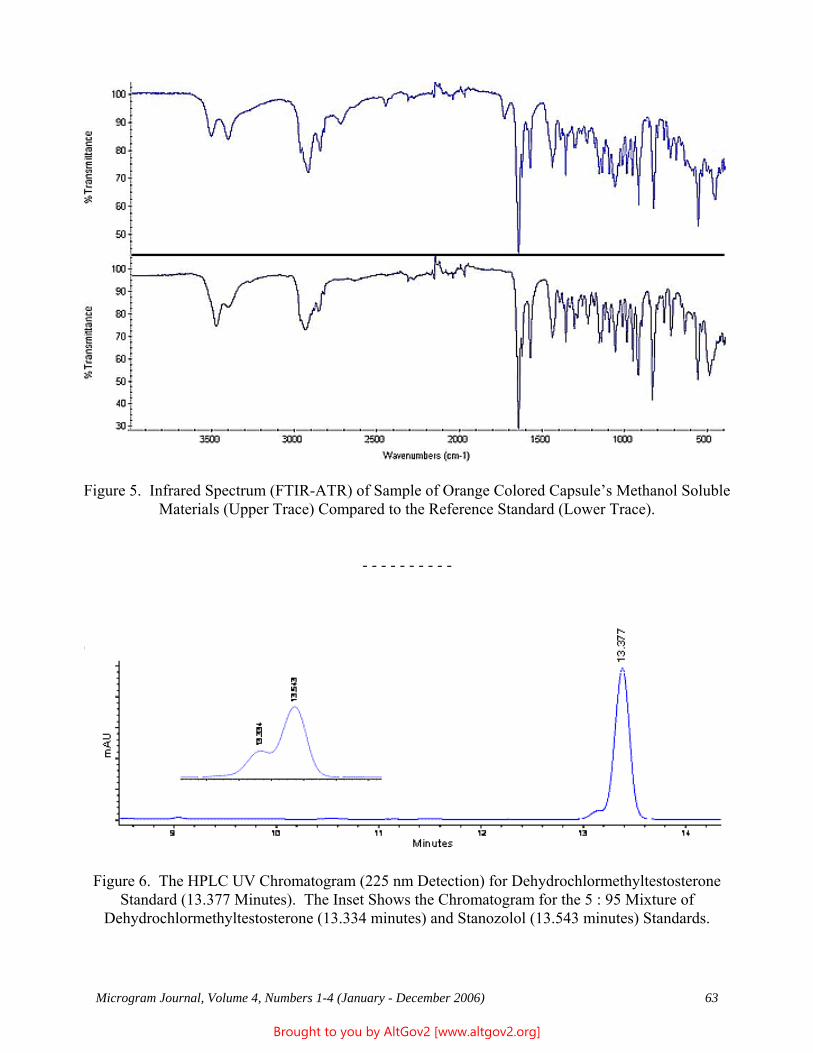
Microgram Journal, Volume 4, Numbers 1-4 (January - December 2006) 63
Figure 5. Infrared Spectrum (FTIR-ATR) of Sample of Orange Colored Capsule’s Methanol SolubleMaterials (Upper Trace) Compared to the Reference Standard (Lower Trace).
- - - - - - - - - -
Figure 6. The HPLC UV Chromatogram (225 nm Detection) for DehydrochlormethyltestosteroneStandard (13.377 Minutes). The Inset Shows the Chromatogram for the 5 : 95 Mixture of
Dehydrochlormethyltestosterone (13.334 minutes) and Stanozolol (13.543 minutes) Standards.
Brought to you by AltGov2 [www.altgov2.org]
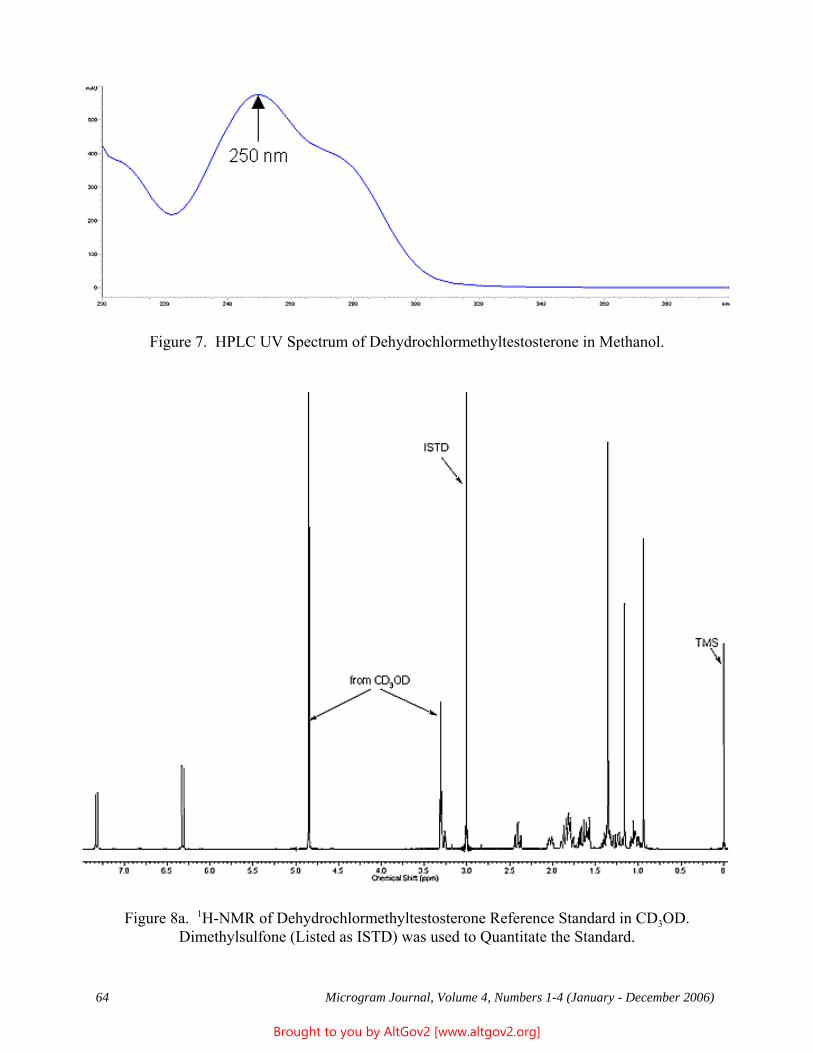
64 Microgram Journal, Volume 4, Numbers 1-4 (January - December 2006)
Figure 7. HPLC UV Spectrum of Dehydrochlormethyltestosterone in Methanol.
Figure 8a. 1H-NMR of Dehydrochlormethyltestosterone Reference Standard in CD3OD.Dimethylsulfone (Listed as ISTD) was used to Quantitate the Standard.
Brought to you by AltGov2 [www.altgov2.org]
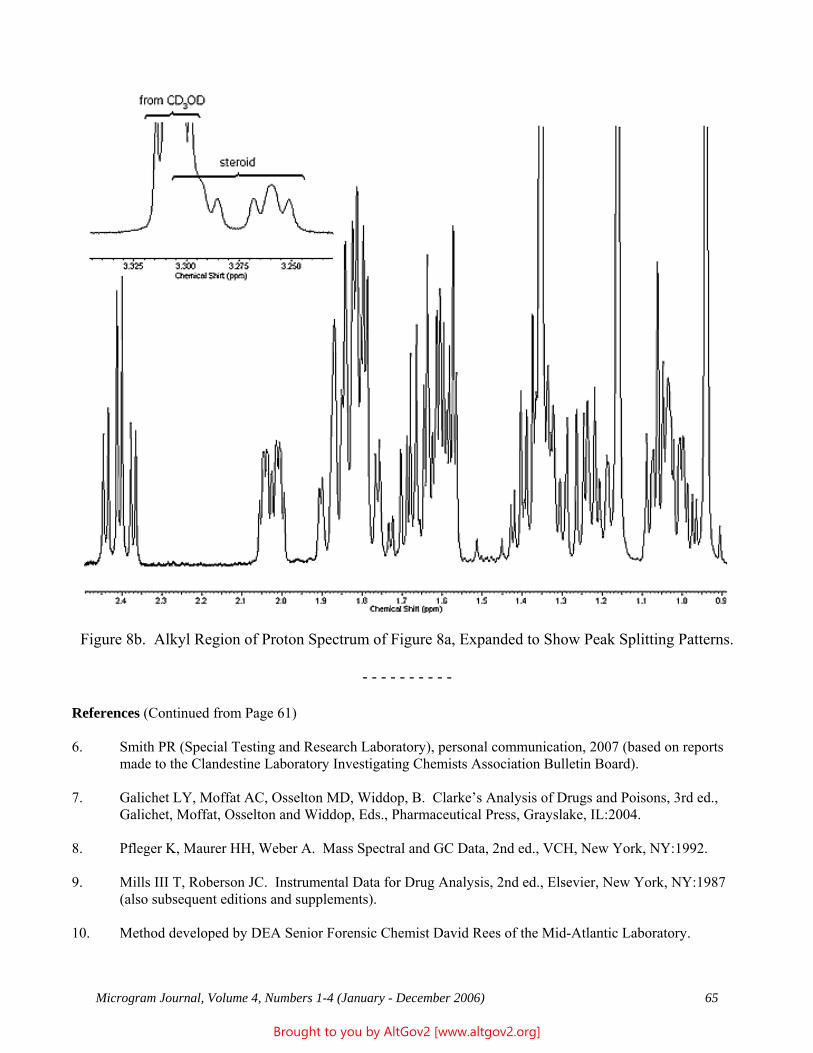
Microgram Journal, Volume 4, Numbers 1-4 (January - December 2006) 65
Figure 8b. Alkyl Region of Proton Spectrum of Figure 8a, Expanded to Show Peak Splitting Patterns.
- - - - - - - - - -
References (Continued from Page 61)
6. Smith PR (Special Testing and Research Laboratory), personal communication, 2007 (based on reportsmade to the Clandestine Laboratory Investigating Chemists Association Bulletin Board).
7. Galichet LY, Moffat AC, Osselton MD, Widdop, B. Clarke’s Analysis of Drugs and Poisons, 3rd ed.,Galichet, Moffat, Osselton and Widdop, Eds., Pharmaceutical Press, Grayslake, IL:2004.
8. Pfleger K, Maurer HH, Weber A. Mass Spectral and GC Data, 2nd ed., VCH, New York, NY:1992.
9. Mills III T, Roberson JC. Instrumental Data for Drug Analysis, 2nd ed., Elsevier, New York, NY:1987(also subsequent editions and supplements).
10. Method developed by DEA Senior Forensic Chemist David Rees of the Mid-Atlantic Laboratory.
Brought to you by AltGov2 [www.altgov2.org]
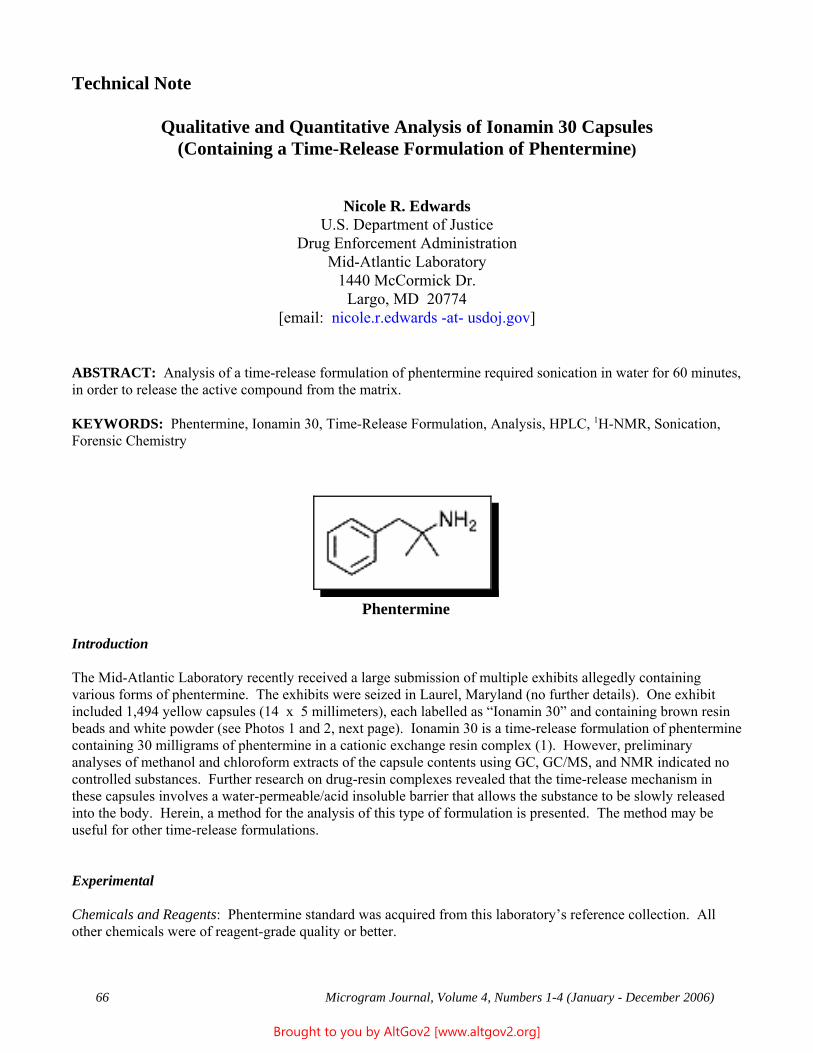
66 Microgram Journal, Volume 4, Numbers 1-4 (January - December 2006)
Technical Note
Qualitative and Quantitative Analysis of Ionamin 30 Capsules(Containing a Time-Release Formulation of Phentermine)
Nicole R. EdwardsU.S. Department of Justice
Drug Enforcement AdministrationMid-Atlantic Laboratory
1440 McCormick Dr.Largo, MD 20774
[email: nicole.r.edwards -at- usdoj.gov]
ABSTRACT: Analysis of a time-release formulation of phentermine required sonication in water for 60 minutes,in order to release the active compound from the matrix.
KEYWORDS: Phentermine, Ionamin 30, Time-Release Formulation, Analysis, HPLC, 1H-NMR, Sonication,Forensic Chemistry
Introduction
The Mid-Atlantic Laboratory recently received a large submission of multiple exhibits allegedly containingvarious forms of phentermine. The exhibits were seized in Laurel, Maryland (no further details). One exhibitincluded 1,494 yellow capsules (14 x 5 millimeters), each labelled as “Ionamin 30” and containing brown resinbeads and white powder (see Photos 1 and 2, next page). Ionamin 30 is a time-release formulation of phenterminecontaining 30 milligrams of phentermine in a cationic exchange resin complex (1). However, preliminaryanalyses of methanol and chloroform extracts of the capsule contents using GC, GC/MS, and NMR indicated nocontrolled substances. Further research on drug-resin complexes revealed that the time-release mechanism inthese capsules involves a water-permeable/acid insoluble barrier that allows the substance to be slowly releasedinto the body. Herein, a method for the analysis of this type of formulation is presented. The method may beuseful for other time-release formulations.
Experimental
Chemicals and Reagents: Phentermine standard was acquired from this laboratory’s reference collection. Allother chemicals were of reagent-grade quality or better.
Phentermine
Brought to you by AltGov2 [www.altgov2.org]
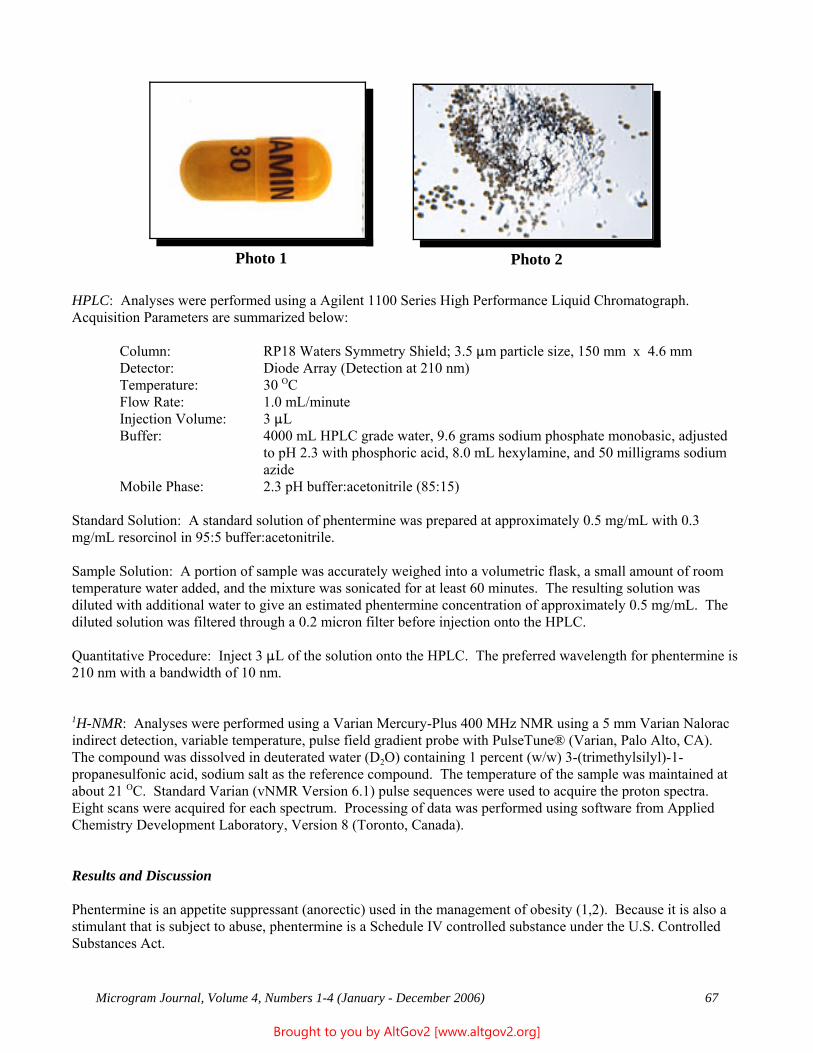
Microgram Journal, Volume 4, Numbers 1-4 (January - December 2006) 67
HPLC: Analyses were performed using a Agilent 1100 Series High Performance Liquid Chromatograph. Acquisition Parameters are summarized below:
Column: RP18 Waters Symmetry Shield; 3.5 :m particle size, 150 mm x 4.6 mmDetector: Diode Array (Detection at 210 nm)Temperature: 30 OCFlow Rate: 1.0 mL/minuteInjection Volume: 3 :LBuffer: 4000 mL HPLC grade water, 9.6 grams sodium phosphate monobasic, adjusted
to pH 2.3 with phosphoric acid, 8.0 mL hexylamine, and 50 milligrams sodiumazide
Mobile Phase: 2.3 pH buffer:acetonitrile (85:15)
Standard Solution: A standard solution of phentermine was prepared at approximately 0.5 mg/mL with 0.3mg/mL resorcinol in 95:5 buffer:acetonitrile.
Sample Solution: A portion of sample was accurately weighed into a volumetric flask, a small amount of roomtemperature water added, and the mixture was sonicated for at least 60 minutes. The resulting solution wasdiluted with additional water to give an estimated phentermine concentration of approximately 0.5 mg/mL. Thediluted solution was filtered through a 0.2 micron filter before injection onto the HPLC.
Quantitative Procedure: Inject 3 :L of the solution onto the HPLC. The preferred wavelength for phentermine is210 nm with a bandwidth of 10 nm.
1H-NMR: Analyses were performed using a Varian Mercury-Plus 400 MHz NMR using a 5 mm Varian Naloracindirect detection, variable temperature, pulse field gradient probe with PulseTune® (Varian, Palo Alto, CA). The compound was dissolved in deuterated water (D2O) containing 1 percent (w/w) 3-(trimethylsilyl)-1-propanesulfonic acid, sodium salt as the reference compound. The temperature of the sample was maintained atabout 21 OC. Standard Varian (vNMR Version 6.1) pulse sequences were used to acquire the proton spectra. Eight scans were acquired for each spectrum. Processing of data was performed using software from AppliedChemistry Development Laboratory, Version 8 (Toronto, Canada).
Results and Discussion
Phentermine is an appetite suppressant (anorectic) used in the management of obesity (1,2). Because it is also astimulant that is subject to abuse, phentermine is a Schedule IV controlled substance under the U.S. ControlledSubstances Act.
Photo 1 Photo 2
Brought to you by AltGov2 [www.altgov2.org]
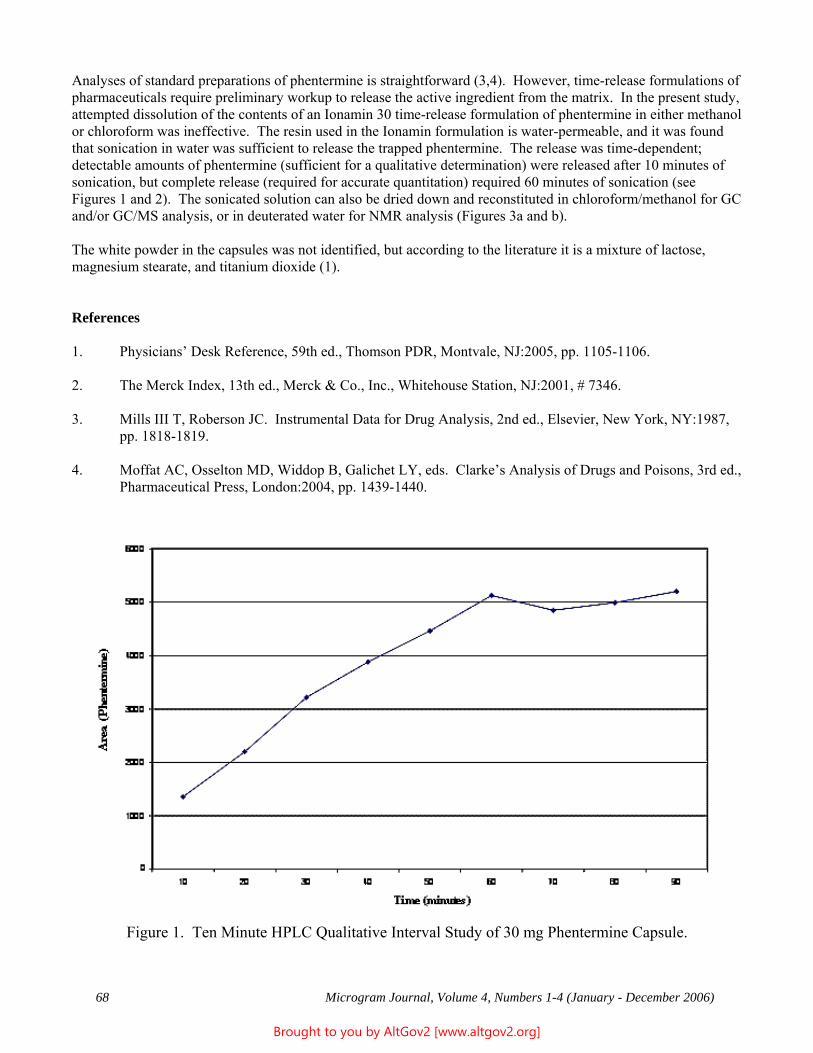
68 Microgram Journal, Volume 4, Numbers 1-4 (January - December 2006)
Analyses of standard preparations of phentermine is straightforward (3,4). However, time-release formulations ofpharmaceuticals require preliminary workup to release the active ingredient from the matrix. In the present study,attempted dissolution of the contents of an Ionamin 30 time-release formulation of phentermine in either methanolor chloroform was ineffective. The resin used in the Ionamin formulation is water-permeable, and it was foundthat sonication in water was sufficient to release the trapped phentermine. The release was time-dependent;detectable amounts of phentermine (sufficient for a qualitative determination) were released after 10 minutes ofsonication, but complete release (required for accurate quantitation) required 60 minutes of sonication (seeFigures 1 and 2). The sonicated solution can also be dried down and reconstituted in chloroform/methanol for GCand/or GC/MS analysis, or in deuterated water for NMR analysis (Figures 3a and b).
The white powder in the capsules was not identified, but according to the literature it is a mixture of lactose,magnesium stearate, and titanium dioxide (1).
References
1. Physicians’ Desk Reference, 59th ed., Thomson PDR, Montvale, NJ:2005, pp. 1105-1106.
2. The Merck Index, 13th ed., Merck & Co., Inc., Whitehouse Station, NJ:2001, # 7346.
3. Mills III T, Roberson JC. Instrumental Data for Drug Analysis, 2nd ed., Elsevier, New York, NY:1987,pp. 1818-1819.
4. Moffat AC, Osselton MD, Widdop B, Galichet LY, eds. Clarke’s Analysis of Drugs and Poisons, 3rd ed.,Pharmaceutical Press, London:2004, pp. 1439-1440.
Figure 1. Ten Minute HPLC Qualitative Interval Study of 30 mg Phentermine Capsule.
Brought to you by AltGov2 [www.altgov2.org]
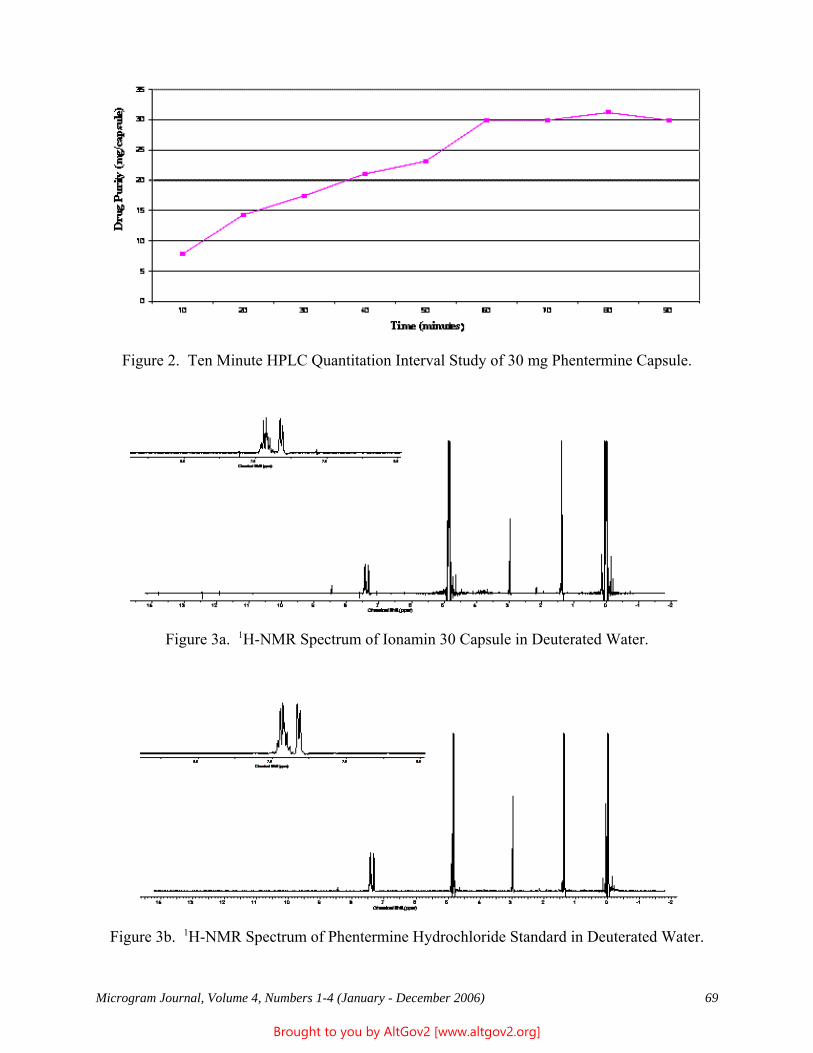
Microgram Journal, Volume 4, Numbers 1-4 (January - December 2006) 69
Figure 2. Ten Minute HPLC Quantitation Interval Study of 30 mg Phentermine Capsule.
Figure 3a. 1H-NMR Spectrum of Ionamin 30 Capsule in Deuterated Water.
Figure 3b. 1H-NMR Spectrum of Phentermine Hydrochloride Standard in Deuterated Water.
Brought to you by AltGov2 [www.altgov2.org]
70 Microgram Journal, Volume 4, Numbers 1-4 (January - December 2006)
Information and Instructions for Authors for Microgram Journal
General InformationMicrogram Journal is a scientific periodical published by the U.S. Drug Enforcement Administration’s Office ofForensic Sciences, that presents peer reviewed, full length Scientific Research Articles and Technical Notes onthe detection and analyses of suspected controlled substances for forensic/law enforcement purposes.
Access to Microgram JournalMicrogram Journal is unclassified, and is published on the DEA public access website (at: www.dea.gov/programs/forensicsci/microgram/index.html). At this time, Microgram Journal is available onlyelectronically, and requires Internet access. Professional scientific and law enforcement personnel may requestemail notifications when new issues are posted (such notifications are not available to private citizens). Thepublications themselves are never sent electronically (that is, as attachments).
Requests to be added to the email notification list should preferably be submitted via email to the MicrogramEditor at: microgram-2007 -at- mailsnare.net Requests can also be mailed to: Microgram Editor, DrugEnforcement Administration, Office of Forensic Sciences, 2401 Jefferson Davis Highway, Alexandria, VA 22301. All requests to be added to the Microgram email notification list should include the following StandardContact Information:
* The Full Name and Mailing Address of Submitting Laboratory or Office;
* The Full Name, Title (Laboratory Director, Assistant Special Agent in Charge, Librarian, etc.), PhoneNumber, FAX Number, and Preferred email Address of the Submitting Individual (Note that emailnotifications are mailed to titles, not names, in order to avoid problems arising from future personnelchanges);
* If available, the generic email address for the Submitting Laboratory or Office;
* If a generic email address is not available, one private email address for an individual who is likely to bea long-term employee, who has a stable email address, and who will be responsible for forwardingMicrogram information to all of the other employees in the requestor’s Office (Note that only one emailaddress per Office will be honored).
Requests to be removed from the Microgram email notification list, or to change an existing email address, shouldalso be sent to the Microgram Editor. Such requests should include all of the pertinent Standard ContactInformation detailed above, and also should provide both the previous and the new email addresses.
Email notification requests/changes are usually implemented within six weeks.
Email Notifications (Additional Comments)As noted above, the email notification indicates which issue has been posted, provides the Microgram URL, andadditional information as appropriate. Note that Microgram e-notices will NEVER include any attachments, orany hyperlink other than the Microgram URL. This is important, because the Microgram email address isroutinely hijacked and used to send spam, very commonly including malicious attachments. For this reason,all subscribers are urged to have current anti-viral, anti-spyware, and firewall programs in operation. However, inorder to ensure that the email notifications are not filtered as spam, the microgram-2007 -at- mailsnare emailaddress must be “whitelisted” by the Office’s ISP.
Brought to you by AltGov2 [www.altgov2.org]
Microgram Journal, Volume 4, Numbers 1-4 (January - December 2006) 71
CostsAccess to Microgram Journal is free.
Submissions to Microgram JournalManuscripts are accepted both from within and outside of DEA, and reviewers are both internal (from withinDEA) and external.
All submissions must be in English. All submissions should, whenever possible, be submitted electronically, asstraight email or as an IBM® PC-compatible Corel WordPerfect® or Microsoft Word® attachment, to: [email protected] Current versions of Corel WordPerfect® or Microsoft Word® (defined ashaving release dates less than 5 years old) should be utilized. If electronic (email) submission is not possible,submissions may be mailed to: Microgram Editor, Drug Enforcement Administration, Office of ForensicSciences, 2401 Jefferson Davis Highway, Alexandria, VA 22301. Hard-copy manuscripts should be submitted intriplicate, and should also be accompanied by an electronic version (written in either Corel WordPerfect® orMicrosoft Word®) on a 3 ½ inch IBM® PC-compatible diskette, 100 or 250 MB Iomega® zip diskette, or anIBM® PC-compatible CD. Note that diskettes should be mailed in an irradiation-proof protective sleeve,and the mailing envelope should be marked: “Warning - Contains Electronic Media - Do Not Irradiate”. Hard-copy manuscripts should be printed in black ink using a laser or ink jet printer, double-spaced, on one sideof 8 1/2" x 11" or A4 high quality white bond paper. A Times New Roman/12-point font is preferred for allsubmissions (electronic or hard copy). Each page, including illustrations, should have a one-inch (25 mm) marginon all sides. All photos and figures should also be submitted as stand-alone attachments, not only embedded inthe manuscript. The pages should be numbered, but not stapled together.
Note that mailed submissions may be subject to lengthy handling delays beyond the control of the Office ofForensic Sciences, and electronic media sent through the mail may be destroyed en route by sanitizingprocedures, despite protective measures and written warnings. All submissions should include the followingContact Information: The Full Name and Address of Submitting Laboratory or Office, and the Full Name,Phone Number, FAX Number, and Preferred email Address of the Submitting Individual.
Scientific Research Articles are formal, full length reports detailing original research in the detection andanalysis of suspected controlled substances for forensic/law enforcement purposes, excluding in post-ingestionhuman/animal biological matrices (blood, urine, meconium, sweat, hair, etc.) Technical Notes are shortercommunications concentrating on a specific drug (or drug class), unusual case, novel or unusual procedure ormethod, or minor original research. Each article/note should be a “stand-alone” work; serial publications will notbe considered. Similarly, articles/notes which essentially duplicate existing literature will not be consideredunless the presented data reflect significant advances in instrumentation made since the original publication(s)(however, see: Dual Publications, below). All submissions will be subjected to peer review, and authors will benotified of the results of the review(s) within three months after the manuscript is received by the Office ofForensic Sciences.
The following guidelines should be used for all Articles (Technical Notes may follow an abbreviated version asappropriate):
Cover Letter - Provide the standard contact information and pertinent correspondence (if any) for theEditor.
Title - Should be specific and amenable to indexing; they should not include acronyms or abbreviationsexcept for very common instrumental technique acronyms (e.g., GC/MS or HPLC) and/or very commondrug acronyms (e.g., MDMA or PCP). Titles should be sufficiently informative that the readershipshould not have to read the Abstract or the Introduction to understand the focus of the article. If the
Brought to you by AltGov2 [www.altgov2.org]
72 Microgram Journal, Volume 4, Numbers 1-4 (January - December 2006)
manuscript reflects work previously presented at a scientific meeting, a statement detailing thatpresentation should be included as a footnote to the Title.
Author(s)/Affiliation(s) - The author's full name (including middle initial(s)) and title, and the full nameand address of the laboratory or office should immediately follow the title. The author’s degree level maybe included if desired, but is not required (however, multiple authors should all include or all exclude thisinformation). If there are several authors from two or more laboratories or offices, each set of authorsshould be listed separately, followed by their corresponding laboratory name and address (that is,Authors I, Laboratory I, Authors II, Laboratory II, etc.) Excessive authorship should be avoided. If thereis more than one author, the primary author should be indicated with a superscripted asterisk. The name,phone numbers (Voice and FAX), preferred email address, and (if different from the laboratory or officeaddress) the full mailing address of the contact person should be included on the title page.
Abstract - State the purpose, procedures, and principal findings of the paper, in 120 words or less. Avoidthe use of abbreviations, and use only common acronyms as defined under “Titles”. Note that the abstractwill be provided to Chemical Abstracts.
Keyword List - A minimum of five (maximum ten) abstracting keywords should be included. Unlessinappropriate, the last keyword pair should always be “Forensic Chemistry.”
Introduction - Briefly state the issue or problem. Detail existing practice in the topic area, and explainthe shortcomings (if any) in what has been previously reported and/or what is being currently done in thefield; that is, compare and contrast the selected methodology with previous and/or existing methods. Provide theoretical and practical background for novel or rarely utilized experimental or instrumentalmethods. Include pertinent references (avoid “Personal Communications”).
Experimental (Chemicals, Instrumentation, Procedures) - Detail the chemicals, instruments, andprocedures utilized (including experimental parameters). However, USE CAUTION IN DETAILINGSYNTHESES OF CONTROLLED OR ABUSED SUBSTANCES, especially novel syntheses toknown controlled substances, or syntheses of novel substances that may be subject to abuse, that are notyet well known in the scientific and/or underground literature. [In such cases, a simple statement shouldbe included to the effect that: “Experimental details on this synthesis are not provided, in accordancewith Journal policy.”]
Results and Discussion - Present findings in a logical, easily followed sequence. Describe what wasdone, and where appropriate what conclusions can be drawn. Compare and contrast the findings withprevious studies and/or current practice. Discuss any problems and/or unresolved issues.
Conclusions - Optional - Summarized results should be included only for complex articles. Conclusionsshould not merely duplicate the Abstract or the summary paragraph in the Results and Discussion section.
Acknowledgments - Optional - Should be brief, and include the full name, affiliation, and specificcontribution made by each cited individual.
References - Articles and notes should have all textual citations collected in an endnotes list. Within thetext, references should be consecutively numbered with superscripted Arabic numerals, or with Arabicnumerals in parentheses, in accordance with their first appearance. Within the endnotes list, referencesshould be consecutively numbered with Arabic numerals, as follows: Number, Period, Indent, Citation. Reference format should adhere to the Uniform Requirements for Manuscripts Submitted to BiomedicalJournals (Note: This is the same reference format utilized in the Selected Reference Citations inMicrogram Bulletin, and also (among many others) by the Journal of Forensic Sciences). Due to theirinherently transitory nature, use of website URL’s as references are discouraged but are permitted. As
Brought to you by AltGov2 [www.altgov2.org]
Microgram Journal, Volume 4, Numbers 1-4 (January - December 2006) 73
previously noted, Personal Communications should not be utilized; however, if unavoidable, utilize thefollowing format: Full Name, Title, Affiliation (Laboratory or Office), Location (City and State, plusNation if not the United States), Personal Communication, Year.
Table and Figures - All Tables and Figures should be appended onto the end of the article (notembedded in the text). Tables and Figures should be consecutively numbered with Arabic numerals, inaccordance with their first citation in the text. Each Table and Figure should be “stand-alone”; that is,include sufficient descriptive information such that the reader will not have to refer back to the text tounderstand the Table or Figure. The Header should include the Table or Figure number and a concisetitle. Explanatory material, definitions of acronyms and/or abbreviations, and/or references within theTable or Figure should be designated by superscripted, lower case letters in alphabetical order, andincluded in dedicated footnotes at the bottom of the respective Table or Figure. Unless color is needed toenhance differentiation of the depicted material, all Tables and Figures should be in black and white (thatis, avoid frivolous use of color for “artistic” purposes). Figures of spectra, chromatograms, charts,graphs, etc., should have clear and legibly labeled axes, but should not include instrument generatedprintoffs of experimental parameter lists.
Manuscripts submitted to Microgram Journal are required to be finished, professional quality efforts. Authorsshould ensure clarity, brevity, and pertinence of all information. Attention to detail in formatting, syntax,grammar, and spelling are as important as the accuracy of the facts presented. Authors are specially cautioned toconduct careful literature reviews prior to submission. At the Editor’s discretion, clearly substandard and/orinappropriate manuscripts will be returned to the authors without review.
Manuscripts will not be retyped, but “final” versions are subject to minor to moderate Editorial rewrite toimprove presentation clarity or to reformat to current Microgram Journal style.
Dual publication - Re-publication of articles or notes of particular interest to the Microgram Journal readershipwill be considered if the article was originally published in a journal that is not easily accessed and the primaryauthor has obtained explicit, written copyright exclusion from the original publisher and consent from all co-authors. Examples include exact English translations of articles or notes originally published in a non-Englishlanguage journal, non-sensitive articles or notes originally published in a restricted journal or on a passwordprotected website, or articles or notes originally published in limited distribution newsletters or proceedings. Ingeneral, any article or note that was published in English in a mainstream journal is not a candidate for re-publication in Microgram Journal. Authors interested in re-publishing previously published articles or notes inMicrogram Journal should discuss the issue with the Microgram Editor before submitting.
Note that (in accordance with standard ethical guidelines) re-published articles should not be included as “new”articles in the respective author(s)’ Curriculum Vitae.
Costs - There are no costs (to the contributor) associated with publication in Microgram Journal.
Reprints - Microgram Journal does not provide reprints to authors. Microgram Journal may be photocopied (orprinted off the website) as needed.
Questions may be directed to the Microgram Editor.
* * * * *
Brought to you by AltGov2 [www.altgov2.org]
74 Microgram Journal, Volume 4, Numbers 1-4 (January - December 2006)
DISCLAIMERS
1) All material published in Microgram Journal is reviewed prior to publication. However, the reliability andaccuracy of all published information are the responsibility of the respective contributors, and publicationin Microgram Journal implies no endorsement by the United States Department of Justice or the DrugEnforcement Administration.
2) Due to the ease of scanning, copying, electronic manipulation, and/or reprinting, only the posted copies ofMicrogram Journal (on www.dea.gov) are absolutely valid. All other copies, whether electronic or hard, arenecessarily suspect unless verified against the posted versions.
3) WARNING!: Due to the often lengthy time delays between the actual dates of seizures and their subsequentreporting in Microgram Journal, and also because of the often wide variety of seizure types with superficiallysimilar physical attributes, published material cannot be utilized to visually identify controlled substancescurrently circulating in clandestine markets. The United States Department of Justice and the DrugEnforcement Administration assume no liability for the use or misuse of the information published inMicrogram Journal.
* * * * * * * * * * * * * * * * * * * * * * * * *
Brought to you by AltGov2 [www.altgov2.org]
U.S. Department of JusticeDrug Enforcement Administration
www.dea.gov
MicrogramJournal
To Assist and Serve Scientists Concerned with the Detection and Analysis of ControlledSubstances and Other Abused Substances for Forensic / Law Enforcement Purposes.
Published by: The U.S. Attorney General has determined that the publication of thisThe Drug Enforcement Administration periodical is necessary in the transaction of the public business Office of Forensic Sciences required by the Department of Justice. Information, instructions, and Washington, DC 20537 disclaimers are published in the first issue of each year.
Volume 5Numbers 1-4 Posted On-Line At:January - December 2007 www.dea.gov/programs/forensicsci/microgram/index.html
Brought to you by AltGov2 [www.altgov2.org]
2 Microgram Journal, Volume 5, Numbers 1-4 (January - December 2007)
Contents
Synthesis and Identification of N,N-Dimethylcathinone Hydrochloride 3Terry A. Dal Cason
Quantitation of the Major Alkaloids in Opium from Papaver Setigerum DC 13Sini Panicker, Heidi L. Wojno, and Lewis H. Ziska
Analysis of Fatty Acids in Marijuana (Cannabis Sativa Leaf) 20Nadia Fucci
The Characterization of Three FLY Compounds (2C-B-FLY, 3C-B-FLY, and 26Bromo-DragonFLY)Erin C. Reed and Gregory S. Kiddon
Comparison of the Novel Direct Analysis in Real Time Time-of-Flight Mass 34Spectrometry (AccuTOF-DART™) and Signature Analysis for theIdentification of Constituents of Refined Illicit CocaineJeri D. Ropero-Miller, Peter R. Stout, Nichole D. Bynum, and John F. Casale
The Isolation, Identification, and Quantitation of Dimethyltryptamine (DMT) 41in Mimosa HostilisJack A. Fasanello and Andrea D. Placke
Five Year Indices 53
Information and Instructions for Authors 61
- - - - - - - - - -
Note: In order to prevent automated theft of email addresses off the Internet postings of MicrogramJournal, all email addresses reported in the Journal have had the “@” character replaced by “ -at- ”.
Cover Art: “Ball and Stick” Model of Testosterone (Courtesy of Patrick A. Hays, DEA Special Testingand Research Laboratory, Dulles, VA).
Brought to you by AltGov2 [www.altgov2.org]
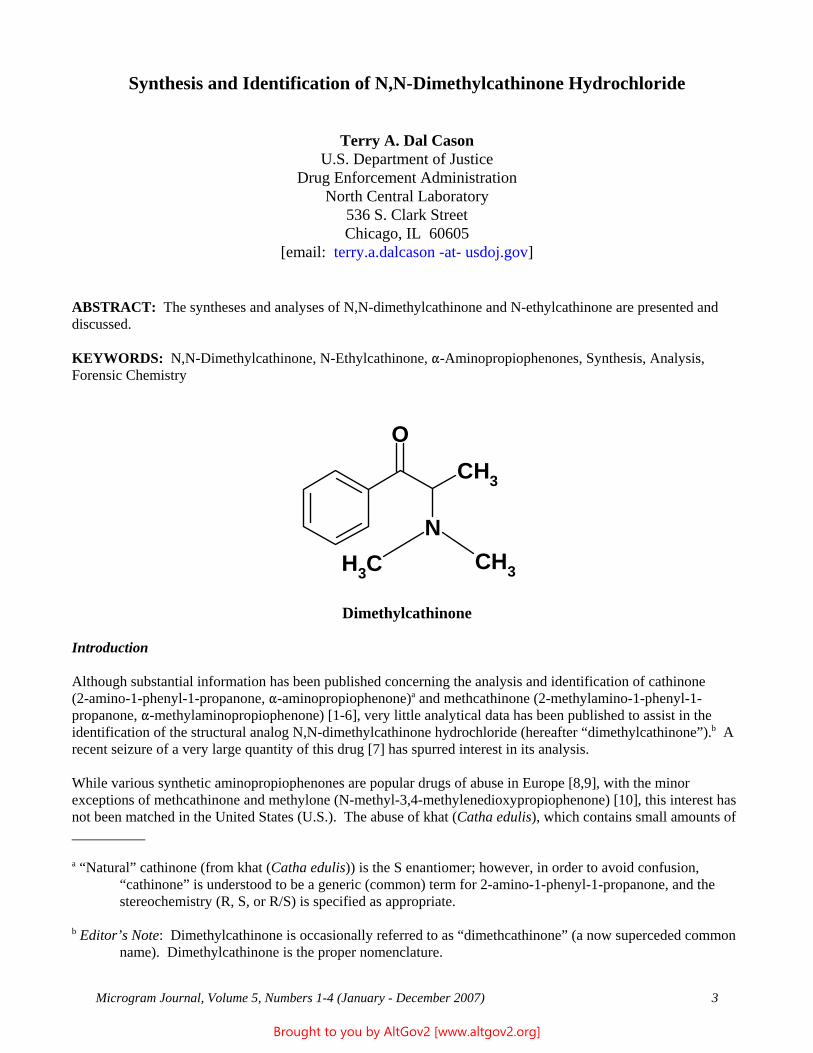
Microgram Journal, Volume 5, Numbers 1-4 (January - December 2007) 3
Synthesis and Identification of N,N-Dimethylcathinone Hydrochloride
Terry A. Dal CasonU.S. Department of Justice
Drug Enforcement AdministrationNorth Central Laboratory
536 S. Clark StreetChicago, IL 60605
[email: terry.a.dalcason -at- usdoj.gov]
ABSTRACT: The syntheses and analyses of N,N-dimethylcathinone and N-ethylcathinone are presented anddiscussed.
KEYWORDS: N,N-Dimethylcathinone, N-Ethylcathinone, "-Aminopropiophenones, Synthesis, Analysis,Forensic Chemistry
Dimethylcathinone
Introduction
Although substantial information has been published concerning the analysis and identification of cathinone (2-amino-1-phenyl-1-propanone, "-aminopropiophenone)a and methcathinone (2-methylamino-1-phenyl-1-propanone, "-methylaminopropiophenone) [1-6], very little analytical data has been published to assist in theidentification of the structural analog N,N-dimethylcathinone hydrochloride (hereafter “dimethylcathinone”).b Arecent seizure of a very large quantity of this drug [7] has spurred interest in its analysis.
While various synthetic aminopropiophenones are popular drugs of abuse in Europe [8,9], with the minorexceptions of methcathinone and methylone (N-methyl-3,4-methylenedioxypropiophenone) [10], this interest hasnot been matched in the United States (U.S.). The abuse of khat (Catha edulis), which contains small amounts of__________
a “Natural” cathinone (from khat (Catha edulis)) is the S enantiomer; however, in order to avoid confusion,“cathinone” is understood to be a generic (common) term for 2-amino-1-phenyl-1-propanone, and thestereochemistry (R, S, or R/S) is specified as appropriate.
b Editor’s Note: Dimethylcathinone is occasionally referred to as “dimethcathinone” (a now superceded commonname). Dimethylcathinone is the proper nomenclature.
CH3
NCH3
CH3
O
Brought to you by AltGov2 [www.altgov2.org]
4 Microgram Journal, Volume 5, Numbers 1-4 (January - December 2007)
(2S)-(-)-cathinone [4,11-16], has been endemic in the east African communities within the U.S., but cathinone isvirtually never encountered as a clandestinely synthesized or extracted drug, possibly because of its instability infree base form. Under U.S. law, cathinone, khat, and methcathinone are all Schedule I Controlled Substances. Currently (early 2008), dimethylcathinone is not scheduled; however, prosecution of this compound (as aSchedule I drug) would be conducted under the tenets of the Controlled Substances Analogue Enforcement Act.
Quite surprisingly, racemic dimethylcathinone is approximately equipotent with both racemic cathinone andracemic amphetamine, while the (2S)-(-)-enantiomer is nearly equipotent with both (2S)-(-)-cathinone and(2S)-(+)-amphetamine [17,18]. This is in direct contrast with (2S)-(+)-dimethylamphetamine, which has beenfound in drug discrimination studies to be only approximately one tenth as potent an analeptic agent (CNSstimulant) as (2S)-(+)-amphetamine [17]. This unexpected potency likely explains the recent appearances ofdimethylcathinone in clandestine markets.
(2S)-(-)-Dimethylcathinone can be synthesized from (1R,2S)-(-)-N-methylephedrine by oxidation with potassiumpermanganate [5,19,20] or any of a variety of chromium compounds, most often sodium or potassium dichromate[21-27]. Alternatively, racemic dimethylcathinone can be prepared from 2-bromopropiophenone by reacting withdimethylamine [17,28-32]. Herein, the synthesis and analysis of dimethylcathinone are presented and discussed. For comparative purposes, analytical data for N-ethylcathinone (hereafter “ethylcathinone”), an isomericstructural analog of dimethylcathinone, are also presented.
Experimental
Instrumentation: Solid state Fourier Transform infrared (FTIR) spectra were acquired as a potassium bromidematrix, with a Thermo Nicolet Model 6700 Fourier Transform Infrared Spectrophotometer. Gas phase infrared(IRD) spectra were obtained using a Bio-Rad (now ASAP) IRD II infrared detector interfaced to an Agilent 6890Gas Chromatograph (GC) with an HP-5 30 m x 0.32 mm x 0.25 m column in splitless mode from 800C (2.0min) at 150C/min to 2700C (2.0 min). Mass spectra were acquired using an Agilent 5973 Mass Selective Detector(MSD) attached to an Agilent 6890 GC. This GC had the same type column as above but used a program from800C (2.0 min) at 200C/min to 2400C (0.5 min) in split mode (100:1). Nuclear magnetic resonance (NMR) spectrawere acquired at 400 MHz using a Varian Mercury 400 NMR. The compounds were analyzed as thehydrochloride salts in deuterium oxide (D2O). Melting points were determined with a Thomas-Hoover “Unimelt”apparatus. Polarimetry on the (2S)-(-)-dimethylcathinone HCl was performed using a Perkin-Elmer Model 241Polarimeter with a 10 cm (1 decimeter) sample cell. All data were acquired at the DEA North Central Laboratorywith the exception of the NMR spectra, which were provided by the DEA Special Testing and ResearchLaboratory (Dulles, VA).
Syntheses and Melting Points: Racemic dimethylcathinone and racemic ethylcathinone were prepared by reacting2-bromopropiophenone (Aldrich Chemical Co., Milwaukee, WI) with dimethylamine or ethylamine, respectively,as aqueous free bases at -80C (ice-salt bath). (2S)-(-)-Dimethylcathinone HCl was prepared by oxidizing(1R,2S)-(-)-N-methylephedrine HCl (Aldrich) with a sodium dichromate/sulfuric acid solution at -50C (ice-saltbath). The hydrochloride salts of all compounds were prepared by the addition of a 5% isopropanol/HCl solutionto a chloroform solution of the respective free base.
Racemic dimethylcathinone HCl, mp = 206-206.50CRacemic ethylcathinone HCl, mp = 186-1880C(2S)-(-)-Dimethylcathinone HCl, mp = 197.5-2000C, ["] = -52.5O (H2O, 1%), T = 210C
Gas Chromatography - Mass Spectrometry (GC/MS): The mass spectra of dimethylcathinone and ethylcathinonewere acquired as the free bases in chloroform, prepared by dissolving the HCl salts in water, adding saturatedsodium carbonate, and extracting into chloroform. The resulting extracts were then passed through a disposablepipette containing a pledget of glass wool and into a glass vial, then introduced into the GC/MS. The mass
Brought to you by AltGov2 [www.altgov2.org]
Microgram Journal, Volume 5, Numbers 1-4 (January - December 2007) 5
spectra of N-acetylethylcathinone was acquired by adding acetic anhydride to a solution of ethylcathinone inchloroform, and immediately injecting the mixture into the GC/MS (the acetylation occurs in the injection port).
Infrared Spectroscopy (FTIR): The two compounds were analyzed as the hydrochloride salts in a compressedpotassium bromide matrix.
Infrared Spectroscopy (IRD): The two compounds were introduced to the IRD as free bases in chloroformthrough an Agilent 6890 GC.
NMR Spectrometry: The 400 MHz proton NMR spectra were acquired by the DEA Special Testing and ResearchLaboratory (Dulles, VA). Maleic acid was used as an internal standard (peak at 6.40 ppm). Hydrogen exchangewith the D2O solvent is responsible for the HOD resonance at 4.80 ppm. The 0.00 ppm reference peak is from3-(trimethylsilyl)propionic-2,2,3,3-d4 acid, sodium salt, present in the D2O solvent (Aldrich).
Color Tests: Although ethylcathinone HCl is a secondary amine, its response to the secondary amine test isalmost imperceptible, with only a slight bluish ring forming in a porcelain spot plate after a short period of time. Both of the cathinone analogs give a dull orange with Chen’s reagent. Ethylcathinone starts to respond to thereagent in about 90 seconds, while dimethylcathinone starts to respond in about 180 seconds. Full dissipation ofthe initial “Robin’s Egg Blue” color of the reagent mixture requires 10 minutes or more, giving an orange-browncolor. Preparation of the reagents is given in Reference 1.
Results and Discussion
The GC retention times of dimethylcathinone and ethylcathinone are very close using the column and parametersspecified in the Instrumentation section (dimethylcathinone 7.07 min; ethylcathinone 7.19 min). The resultingmass spectra are typical of simple phenethylamines (Figures 1a-b). The molecular ions are nearly imperceptible,and a large base peak is observed at m/z = 72, indicative of the respective immonium ions. However,ethylcathinone also has a significant ion at m/z = 44, from loss of ethylene from the m/z = 72 ion [33]. Thisallows easy differentiation of the two compounds, a distinction that is further enhanced by conversion ofethylcathinone to N-acetylethylcathinone with acetic anhydride. N-Acetylethylcathinone gives a mass spectrumhaving a very large ion at m/z = 114 (72 + 42) and a small molecular ion at m/z = 219 (177 +42) (Figure 1c). Dimethylcathinone (a tertiary amine) does not react with acetic anhydride. A detailed elucidation of thefragmentation patterns for methamphetamine and related compounds has recently been published [34].
Although GC/MS is the method of choice for identification of many compounds, infrared spectrophotometry maybe preferable for dimethylcathinone. The solid state FTIR of a purified sample gives a distinctive spectrum thatalso allows identification of the salt form (Figures 2a-b). When available, IRD offers the convenience of GC/MSwithout the sample preparation often required for FTIR. IRD spectra, although lacking the fine structure seen insolid state FTIR spectra, are nonetheless distinct and avoid potential difficulties which may occur with somecompounds due to polymorphism (Figures 3a-b).
Proton NMR also gives distinct spectra for dimethylcathinone and ethylcathinone. The spectra are easilydistinguished by the resonances for the dimethylamino versus ethylamino groups, between 1.30 and 3.30 ppm(Figures 4a-b).
Color tests (presumptive tests, field tests) are often useful in determining the initial direction of an analysis. In thecase of cathinone-based compounds, however, the beta-keto group appears to have an adverse effect on severalcommonly used reagents (e.g., Marquis and secondary amine), by slowing or preventing the color responsestypically observed for simple secondary phenethylamines. One test that is somewhat useful is the Chen’s Test. When a blank is prepared from the three components comprising the reagent, a “Robin’s Egg Blue” precipitateresults. This is the initial response of this reagent to the cathinone compounds tested to date. However, when
Brought to you by AltGov2 [www.altgov2.org]
6 Microgram Journal, Volume 5, Numbers 1-4 (January - December 2007)
allowed to sit undisturbed for periods of up to 10 minutes, the blue precipitate dissipates, leaving a clear orange toorange-brown solution. In contrast, the corresponding aminoalcohols typically give an immediate purple response[10].
Melting points are useful in determining if a pure enantiomer or the racemate of dimethylcathinone is present. Enantiomers can be more rigorously identified with polarimetry. However, caution is needed when performingpolarimetry on any of the "-aminopropiophenones. Cathinone free base is known to racemize quickly inhydrolytic solvents (methanol, ethanol, etc.), but less rapidly in chloroform or methylene chloride. Thepropensity for enantiomeric dimethylcathinone to racemize is unknown. The oxalate and hydrochloride salt formsof dimethylcathinone are stable as dry powders.
Acknowledgements
The authors wish to thank Senior Forensic Chemists Patrick A. Hays and Trinette K. Spratley (both of the DEASpecial Testing and Research Laboratory, Dulles, VA) for acquiring and providing the NMR spectra.
References
1. Dal Cason TA. The identification of cathinone and methcathinone. Microgram 1992;25(12):313-329.*
2. Noggle FT, DeRuiter J, Valaer A, Clark CR. GC-MS analysis of methcathinone and its majordecomposition product. Microgram 1994;27(4):106-118.*
3. Noggle FT, DeRuiter J, Hayes L, Clark CR. Stereochemical analysis of methcathinone prepared byoxidation of ephedrines and pseudoephedrines. Microgram 1994;27(4):119-125.*
4. Lee MM. The identification of cathinone in khat (Catha edulis): A Time Study. Journal of ForensicSciences 1995;40(1):116-121.
5. Savenko VG, Semkin EP, Sorokin VI, Kazankov SP. Expert Examination of Narcotic SubstancesObtained from Ephedrine; Recommended Methods; L.V. Razina, Ed.; U.S.S.R. Ministry of the Interior. All Union Scientific Research Institute of Polygraphy (Publisher), Moscow, 1989, pp. 1-20.
6. Lurie IS, Klein RFX, Dal Cason TA, LeBelle MJ, Brenneisen R, Weinberger RE. Chiral resolution ofcationic drugs of forensic interest by capillary electrophoresis with mixtures of neural and anioniccyclodextrins. Analytical Chemistry 1994;66(22):4019-4026.
7. (a) Anonymous. Very large seizure of dimethcathinone in Tampa, Florida. Microgram Bulletin 2007;40(8):81. (b) Even more recently, 4-methylmethcathinone (another positional isomer ofdimethcathinone) was identified in Australia (Karen Blakey, Queensland Health Scientific Services,personal communication, February 19, 2008).
8. Peter Roesner (Altenholz, Germany), personal communication, November 9, 2007. [Dr. Roesnerestimates that perhaps 20 illicit cathinone analogs have been encountered. His mass spectra library,Designer Drugs 2008, contains a large number of cathinone analogs, including many legitimatelyprepared as research chemicals.]
9. Westphal F, Junge T, Roesner P, Fritschi G, Klein B, Girreser U. Mass spectral and NMR spectral dataof two new designer drugs with an "-aminophenone structure: 4'-Methyl-"-pyrrolidinohexanophenoneand 4'-methyl-"-pyrrolidinobutyrophenone. Forensic Science International 2007;169(1):32-42.
Brought to you by AltGov2 [www.altgov2.org]
Microgram Journal, Volume 5, Numbers 1-4 (January - December 2007) 7
10. Dal Cason TA. The characterization of some 3,4-methylenedioxycathinone (MDCATH) homologs. Forensic Science International 1997;87(1):9-53.
11. Nordal A, Laane MM. Identification of khat. Meddelelser fra Norsk Farmaceutisk Selskap 1978;40:1-18.
12. Morselli O, Bovolenta A, Ripani L, Garofano L. Gas-chromatography/mass spectrometry determinationof the active principles of “Catha edulis” African vegetable. Microgram 1992;25(11):290-294.*
13. Mathys K, Brenneisen R. HPLC and TLC profiles of phenylalkylamines of khat (Catha edulis Forsk.)confiscated in Switzerland. Pharmaceutica Acta Helvetiae 1993;68(2):121-128.
14. Szendrei K. The chemistry of khat. Bulletin on Narcotics 1980;32(3):5-35.
15. Leete E. Biogenesis of d-norpseudoephedrine in Catha edulis. Chemistry and Industry 1958:1088-1089.
16. Brenneisen R, Geisshusler S, Schorno X. Metabolism of cathinone to (-)-norephedrine and(-)-norpseudoephedrine. Journal of Pharmacy and Pharmacology 1986;38:298-300.
17. Dal Cason TA, Young R, Glennon RA. Cathinone: An investigation of several N-alkyl and
methylenedioxy-substituted analogs. Pharmacology Biochemistry and Behavior 1997;58(4):1109-1116.
18. Glennon RA, Young R, Hauck AE, McKenney JD. Structure-activity studies on amphetamine analogsusing drug discrimination methodology. Pharmacology Biochemistry and Behavior 1984;21:895-901.
19. Zhingel KY, Dovensky W, Crossman A, Allen A. Ephedrone: 2-Methylamino-1-phenylpropan-1-one(Jeff). Journal of Forensic Sciences 1991;36(3):915-920.
20. Semkin EP, Sorokin VI, Savenko VG. Examination of ephedrone. Microgram 1993;26(1):8-13.*
21. L’Italien YJ, Park H, Rebstock MC. Methylaminopropiophenone compounds and methods for producingthe same. U.S. Patent 2,802,865, 1957, Parke, Davis, and Co.
22. Parke, Davis, and Co. Amino ketone compounds and methods for producing the same. British Patent768,772, Feb. 20, 1957.
23. E. Merck, Chemische Fabrik in Darmstadt. Verfahren zur uberfuhrung vonpseudo-1-phenyl-2-methylaminopropan-1-ol in N-1-phenyl-2-methylaminopropan-1-ol. German Patent495,534, April 8, 1930.
24. Berrang BD, Lewin AH, Carroll FI. Enantiomeric "-aminopropiophenones (cathinone): Preparation andinvestigation. Journal of Organic Chemistry 1982;47(13):2643-2647.
25. Ratchliffe R, Rodehorst R. Improved procedure for oxidations with the chromium trioxide-pyridinecomplex. Journal of Organic Chemistry 1970;35(11):4000-4002.
26. Corey EJ, Schmidt G. Useful procedures for the oxidation of alcohols involving pyridinium dichromatein aprotic media. Tetrahedron Letters 1979;5:399-402.
27. Angelos G. Examination of a commercial pickling agent for the synthesis of methcathinone. Journal ofthe Clandestine Laboratory Investigating Chemists Association 1993;3(4):16.*
28. Kamlet J. Preparation of alpha-alkylaminoacylophenones. U.S. Patent 2,155,194, April 18, 1939.
Brought to you by AltGov2 [www.altgov2.org]
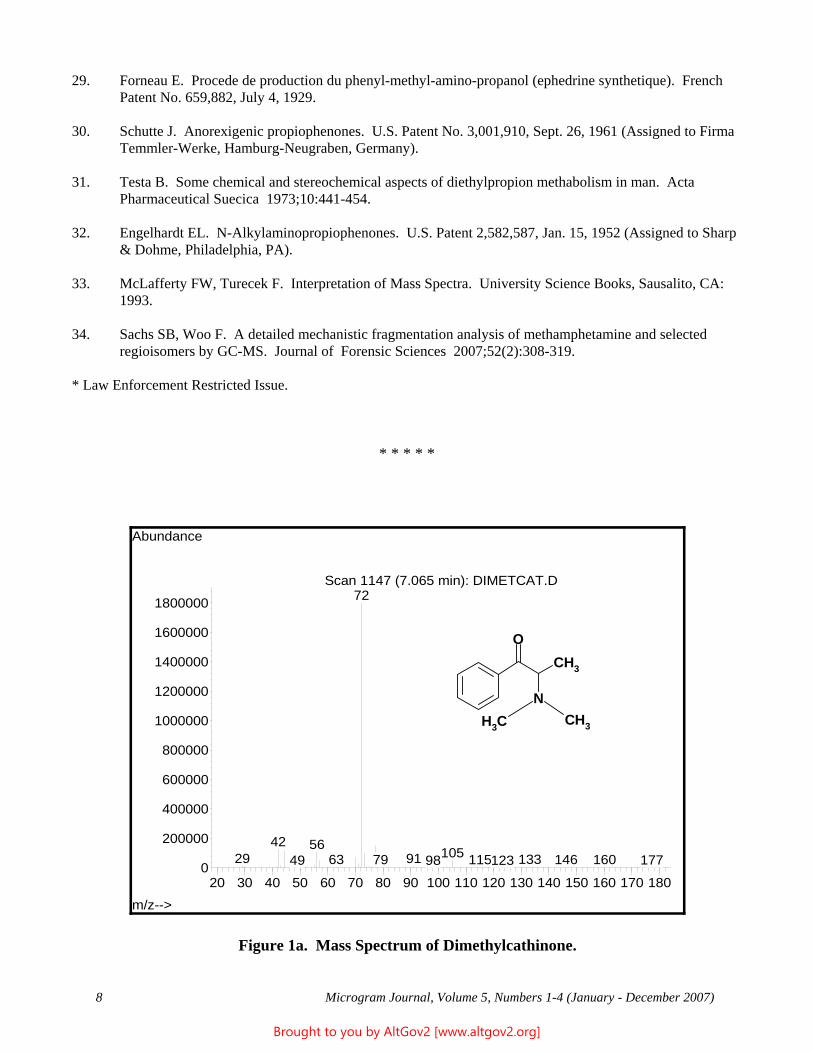
8 Microgram Journal, Volume 5, Numbers 1-4 (January - December 2007)
29. Forneau E. Procede de production du phenyl-methyl-amino-propanol (ephedrine synthetique). FrenchPatent No. 659,882, July 4, 1929.
30. Schutte J. Anorexigenic propiophenones. U.S. Patent No. 3,001,910, Sept. 26, 1961 (Assigned to FirmaTemmler-Werke, Hamburg-Neugraben, Germany).
31. Testa B. Some chemical and stereochemical aspects of diethylpropion methabolism in man. ActaPharmaceutical Suecica 1973;10:441-454.
32. Engelhardt EL. N-Alkylaminopropiophenones. U.S. Patent 2,582,587, Jan. 15, 1952 (Assigned to Sharp& Dohme, Philadelphia, PA).
33. McLafferty FW, Turecek F. Interpretation of Mass Spectra. University Science Books, Sausalito, CA:1993.
34. Sachs SB, Woo F. A detailed mechanistic fragmentation analysis of methamphetamine and selectedregioisomers by GC-MS. Journal of Forensic Sciences 2007;52(2):308-319.
* Law Enforcement Restricted Issue.
* * * * *
20 30 40 50 60 70 80 90 100 110 120 130 140 150 160 170 1800
200000
400000
600000
800000
1000000
1200000
1400000
1600000
1800000
m/z-->
Abundance
Scan 1147 (7.065 min): DIMETCAT.D72
42 56 10529 91 13363 146 16079 115 17749 98 123
CH3
NCH3
CH3
O
Figure 1a. Mass Spectrum of Dimethylcathinone.
Brought to you by AltGov2 [www.altgov2.org]
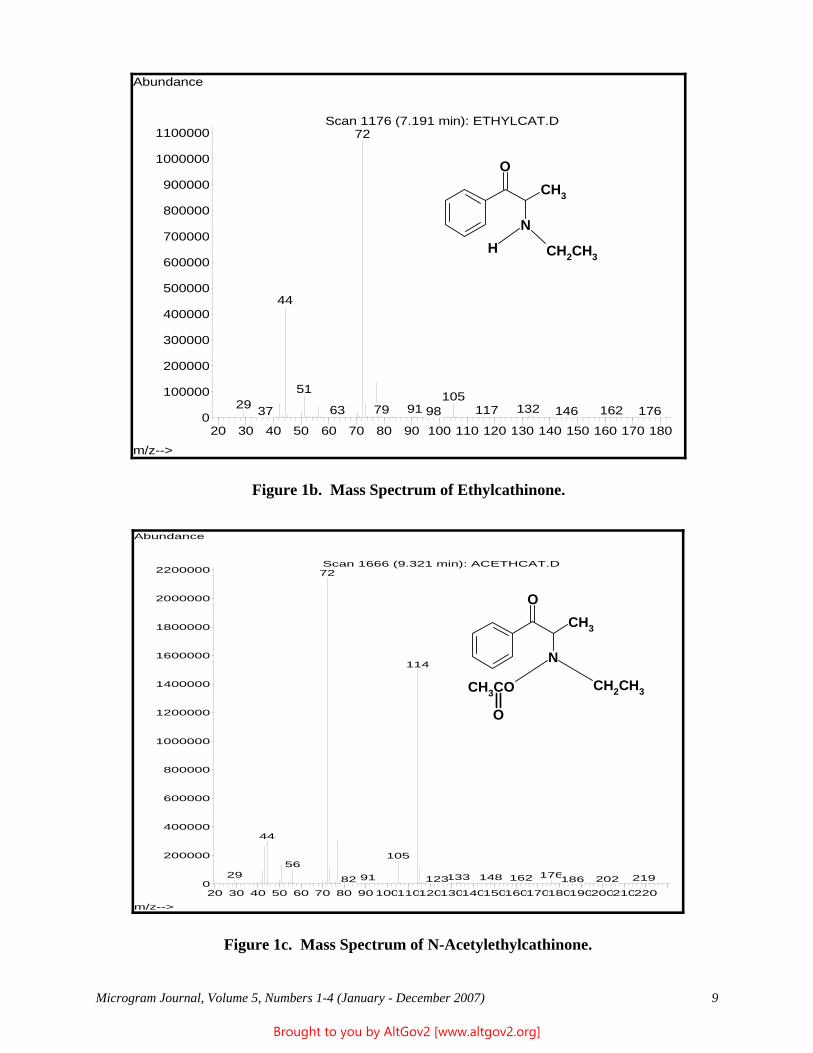
Microgram Journal, Volume 5, Numbers 1-4 (January - December 2007) 9
20 30 40 50 60 70 80 90 100 110 120 130 140 150 160 170 1800
100000
200000
300000
400000
500000
600000
700000
800000
900000
1000000
1100000
m/z-->
Abundance
Scan 1176 (7.191 min): ETHYLCAT.D72
44
51 10529 91 1327963 117 162 17614637 98
HN
CH2CH3
CH3
O
Figure 1b. Mass Spectrum of Ethylcathinone.
20 30 40 50 60 70 80 90 1001101201301401501601701801902002102200
200000
400000
600000
800000
1000000
1200000
1400000
1600000
1800000
2000000
2200000
m/z-->
Abundance
Scan 1666 (9.321 min): ACETHCAT.D72
114
44
10556
29 176133 14891 162 219123 20282 186
CH3CO
N
CH2CH3
CH3
O
O
Figure 1c. Mass Spectrum of N-Acetylethylcathinone.
Brought to you by AltGov2 [www.altgov2.org]
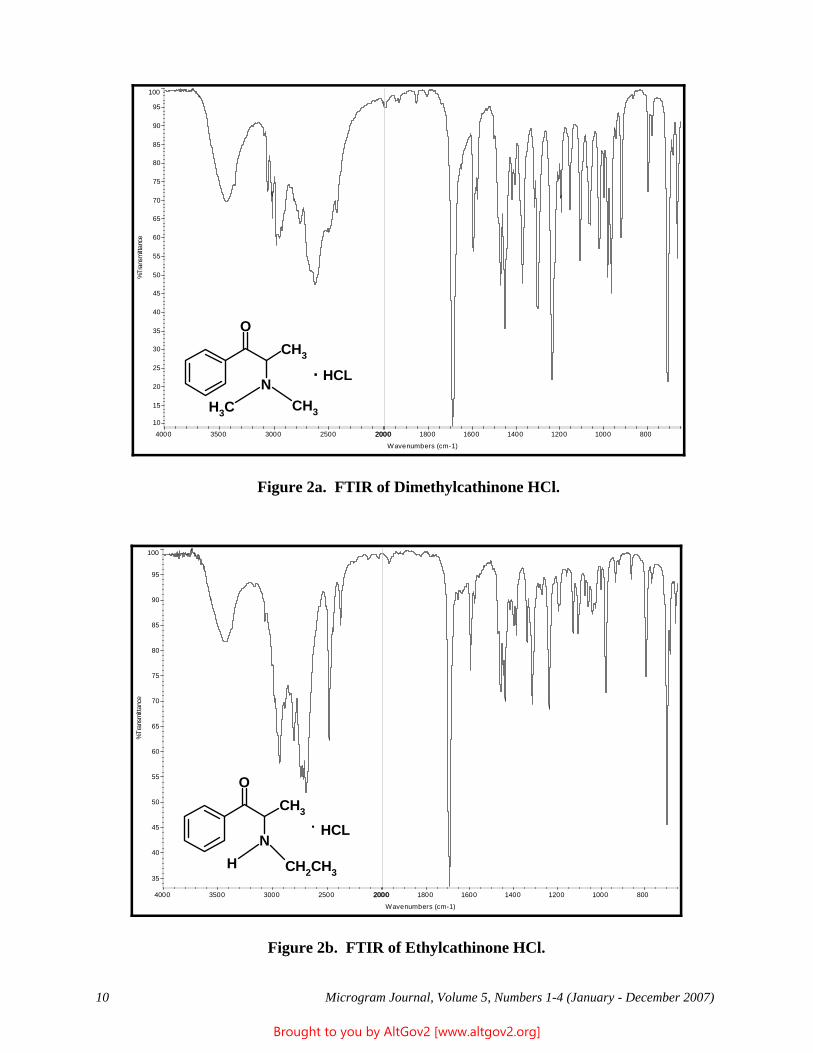
10 Microgram Journal, Volume 5, Numbers 1-4 (January - December 2007)
10
15
20
25
30
35
40
45
50
55
60
65
70
75
80
85
90
95
100
%Tr
ansm
ittan
ce
800 1000 1200 1400 1600 1800 2000 2000 2500 3000 3500 4000
Wavenumbers (cm-1)
CH3
NCH3
CH3
O
. HCL
Figure 2a. FTIR of Dimethylcathinone HCl.
35
40
45
50
55
60
65
70
75
80
85
90
95
100
%Tr
ansm
ittan
ce
800 1000 1200 1400 1600 1800 2000 2000 2500 3000 3500 4000
Wavenumbers (cm-1)
HN
CH2CH3
CH3
O
. HCL
Figure 2b. FTIR of Ethylcathinone HCl.
Brought to you by AltGov2 [www.altgov2.org]
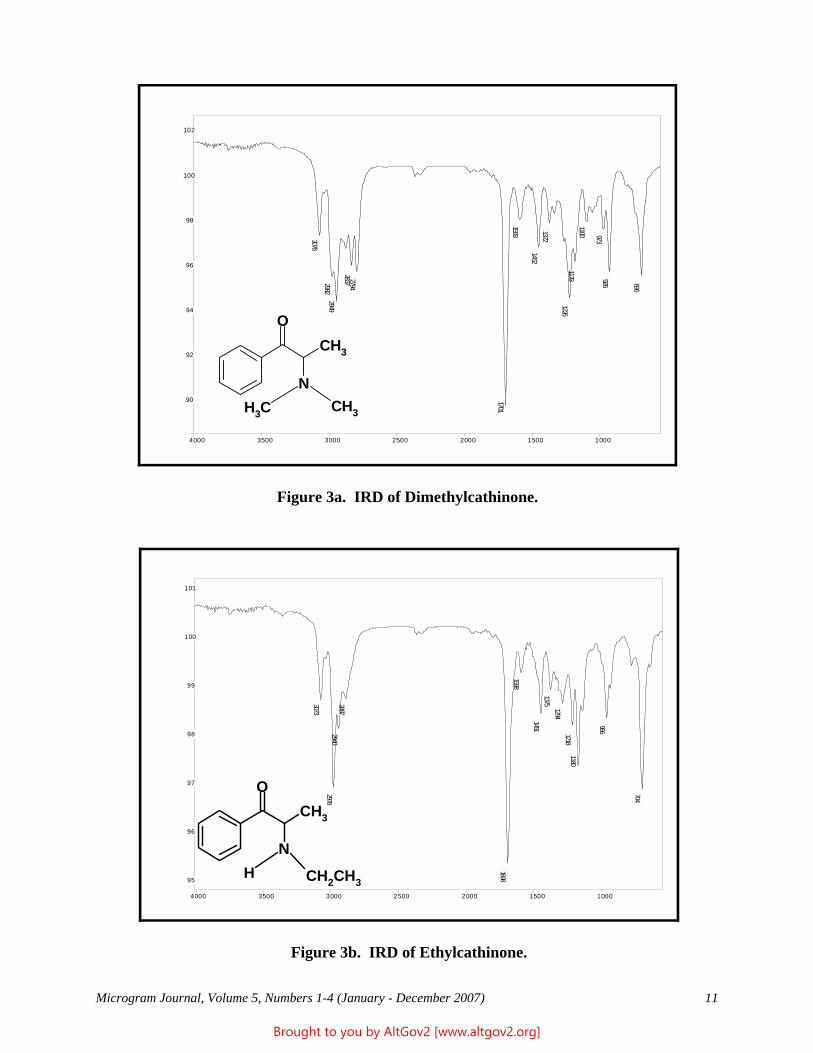
Microgram Journal, Volume 5, Numbers 1-4 (January - December 2007) 11
3076
29822949
2837 2794
1701
1593
14521372
12261179
1100 973926 696
90
92
94
96
98
100
102
4000 3500 3000 2500 2000 1500 1000
CH3
NCH3
CH3
O
Figure 3a. IRD of Dimethylcathinone.3073
29782940
2887
1698
1598
14511375
12941218
1180
966
704
95
96
97
98
99
100
101
4000 3500 3000 2500 2000 1500 1000
Figure 3b. IRD of Ethylcathinone.
HN
CH2CH3
CH3
O
Brought to you by AltGov2 [www.altgov2.org]
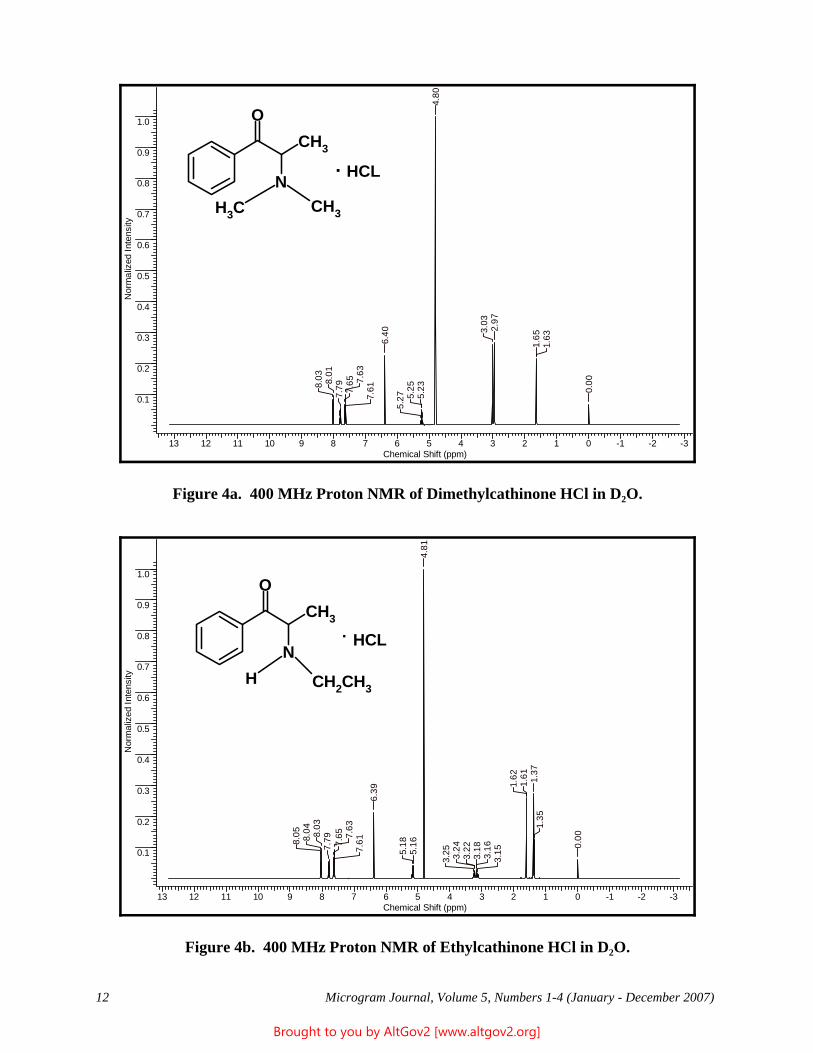
12 Microgram Journal, Volume 5, Numbers 1-4 (January - December 2007)
13 12 11 10 9 8 7 6 5 4 3 2 1 0 -1 -2 -3Chemical Shift (ppm)
0.1
0.2
0.3
0.4
0.5
0.6
0.7
0.8
0.9
1.0N
orm
aliz
ed In
tens
ity
0.00
1.63
1.65
2.97
3.03
4.80
5.23
5.25
5.27
6.40
7.61
7.63
7.65
7.79
8.01
8.03
Figure 4a. 400 MHz Proton NMR of Dimethylcathinone HCl in D2O.
CH3
NCH3
CH3
O
. HCL
13 12 11 10 9 8 7 6 5 4 3 2 1 0 -1 -2 -3Chemical Shift (ppm)
0.1
0.2
0.3
0.4
0.5
0.6
0.7
0.8
0.9
1.0
Nor
mal
ized
Inte
nsity
0.00
1.35
1.37
1.61
1.62
3.153.16
3.18
3.22
3.24
3.25
4.81
5.16
5.18
6.39
7.61
7.63
7.65
7.798.
038.
048.
05
Figure 4b. 400 MHz Proton NMR of Ethylcathinone HCl in D2O.
HN
CH2CH3
CH3
O
. HCL
Brought to you by AltGov2 [www.altgov2.org]
Microgram Journal, Volume 5, Numbers 1-4 (January - December 2007) 13
Quantitation of the Major Alkaloids in Opium from Papaver Setigerum DC
Sini Panicker* and Heidi L. Wojnoa
U.S. Department of JusticeDrug Enforcement Administration
Special Testing and Research Laboratory22624 Dulles Summit Court
Dulles, VA 20166[email: sini.x.panicker -at- usdoj.gov]
Lewis H. ZiskaCrop Systems and Global Change Laboratory
U.S. Department of AgricultureAgricultural Research Service
10300 Baltimore AvenueBeltsville, MD 20705
[email: lewis.ziska -at- ars.usda.gov]
ABSTRACT: Quantitation of morphine and other major alkaloids in opium gum from specially cultivatedPapaver setigerum DC (“Wild Poppy”) is presented. Papaver setigerum plants (n = 14) were grown in anatmosphere containing a slightly elevated level of carbon dioxide (390 ppm). Opium gum collected from thecapsules of the mature plants was analyzed for morphine, codeine, thebaine, noscapine, and papaverine, usingcapillary electrophoresis (CE). Morphine was confirmed at an average of 2 percent by weight. Codeine,noscapine, and papaverine were also detected; however, thebaine was below the limits of quantitation by theemployed CE method, and could only be detected by gas chromatography/mass spectrometry.
KEYWORDS: Papaver setigerum, Papaver somniferum, Opium Poppy, Wild Poppy, Opium, Opium Alkaloids,Quantitation, Forensic Chemistry
Introduction
There are more than one hundred species under the genus Papaver that produce alkaloids in the specialized cellscalled laticifers. However, only two naturally occurring species, Papaver somniferum L (Photo 1, next page) andPapaver setigerum DC (Photo 2, next page) produce morphine in significant quantities [1]. Papaver somniferumis commonly known as opium poppy, and is cultivated around the world for both licit and illicit purposes. Papaver setigerum, also known as “wild poppy,” is native to the Mediterranean region and Canary Islands. Although several previous reports indicate that Papaver setigerum opium contains morphine (vide infra), to dateit has never been reported to have been used for licit or illicit morphine production.
Scientific publications on Papaver setigerum reveal varying opinions amongst scientists in labeling it as aseparate species or as the subspecies of Papaver somniferum. One of the earliest publications on opium poppiesfrom Fulton [2] suggested a close relationship between Papaver somniferum and Papaver setigerum. Farmilo etal. [3] was the first to report the presence of morphine in the pods, buds, and leaves of Papaver setigerum.__________
a Current Address: Lancaster Laboratories, Inc., 2425 New Holland Pike, Lancaster, PA 17601.
Brought to you by AltGov2 [www.altgov2.org]
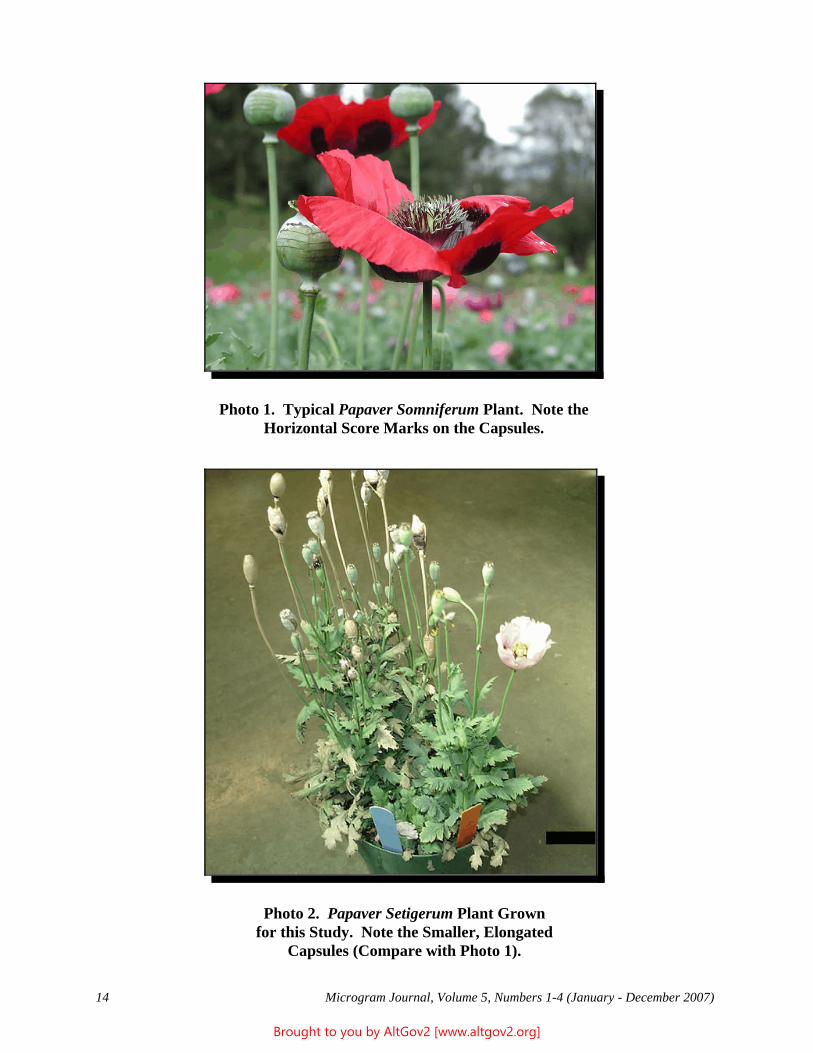
14 Microgram Journal, Volume 5, Numbers 1-4 (January - December 2007)
Photo 1. Typical Papaver Somniferum Plant. Note theHorizontal Score Marks on the Capsules.
Photo 2. Papaver Setigerum Plant Grownfor this Study. Note the Smaller, Elongated
Capsules (Compare with Photo 1).
Brought to you by AltGov2 [www.altgov2.org]
Microgram Journal, Volume 5, Numbers 1-4 (January - December 2007) 15
Farmilo et al. also indicated that the Papaver setigerum chromosome count is a tetraploid (n = 22), whereasPapaver somniferum is a diploid (n = 11), which suggests that Papaver somniferum could not have evolved fromPapaver setigerum as many scientists had previously suggested. Farmilo’s article also compared and contrastedsketches of Papaver somniferum and Papaver setigerum plants, including drawings of their pods (which differsignificantly in appearance). The information supported earlier work by Sugiura [4], who disagreed with theconcept of Papaver setigerum as a direct ancestor to Papaver somniferum, and instead regarded them as separatespecies, with the possibility of a common ancestor.
One of the earliest (1956) studies on the quantitation of morphine in Papaver setigerum opium came fromAsahina et al., who reported a morphine content of 5.1% [5]. A detailed publication from the same group in 1957[6] described two sets of experiments with Papaver setigerum plants, reporting morphine values of 5.1% and7.3% (surprisingly high). The other alkaloids were reported at: Codeine (0.9 and 0.8%); thebaine (2.1 and 1.6%);papaverine (1.9 and 2.6%); and narcotine (also known as noscapine, 0.1 and 0.1%). The paper also reported therelative differences in the alkaloids present in opium from Papaver somniferum cultivations in Iran, India, andTurkey versus those present in Papaver setigerum opium. A later study from La Valva et al. [7] found nomorphine, codeine, and thebaine in the Papaver setigerum populations from Mediterranean France and southernItaly; however, this latter finding is atypical. Subsequently, Garnock-Jones et al. [8] confirmed alkaloids in theair-dried capsules of New Zealand cultivations of Papaver setigerum (morphine 0.4%; codeine 0.5%; papaverine1.6%; narcotine 1.3%; thebaine not reported), but also noted that the alkaloid concentrations were “much lower”in wild plants. Garnock-Jones et al. also declared Papaver setigerum to be a subspecies of Papaver somniferum. Aside from the negative alkaloid values reported by La Valva et al., these reports collectively established Papaversetigerum as a separate species (or possibly a rather distantly related subspecies), under the genus Papaver, withthe potential of producing minor to significant amounts of morphine.
In the era of numerous internet vendors for seeds of both Papaver somniferum and Papaver setigerum, theforensic science community has a salient interest in the actual alkaloid composition of Papaver setigerum, and inthe potential use of its opium for illicit purposes. As detailed above, the literature is inconsistent and in somecases is contradictory. The U.S. Controlled Substances Act does not differentiate between species (or subspecies)of Papaver. Thus, Papaver setigerum is not formally controlled (by name) in the United States; however, opiumand related products (such as poppy straw) from Papaver setigerum are controlled (Schedule II) if they containmorphine, codeine, and/or thebaine. Of note, opium cultivation laws in many other countries specifically prohibitcultivation of Papaver setigerum.
The opium analyzed in this study came from an environmental research project conducted by the U.S. Departmentof Agriculture, where the primary goal was to study the effects of a slight increase in atmospheric carbon dioxide(CO2) on Papaver setigerum plant growth and alkaloid production [9]. The Mauna Loa Observatory (Hawaii)reports the average ambient atmospheric CO2 level to be 385 ppm [10]. However, the actual ambient atmosphericCO2 level is thought to be slightly higher, as was reported by Ziska et al. [11]. Therefore, the study wasconducted at a 390 ppm CO2 level, which is believed to provide more valid data on actual alkaloid production inthe wild. Fourteen Papaver setigerum plants were cultivated in controlled environment grow chambers in anatmosphere containing 390 ppm CO2. Opium gum was obtained by lancing the mature pods from the plants, inthe same manner that opium from Papaver somniferum plants is obtained, and was analyzed using a capillaryelectrophoresis methodology [12].
Experimental
Seeds: Seeds of Papaver setigerum DC were obtained from the Institut fur Pflanzengenetik undKulturpflanzenforschung in Gatersleben, Germany.
Cultivation and Harvesting: The study was conducted using controlled environment chambers (EGCCorporation, Chagrin Falls, OH), with the chamber set at 390 ppm CO2 for 24 h day-1. The actual average 24 hCO2 values were 389 +/- 12.1 ppm. The seeds were sown by hand in 2.6 L pots filled with a 4:1:1 mixture of
Brought to you by AltGov2 [www.altgov2.org]
16 Microgram Journal, Volume 5, Numbers 1-4 (January - December 2007)
sphagnum, perlite, and vermiculite. Floral initiation occurred at about 70 days after sowing. There wereapproximately 8-10 capsules per plant. The scoring of the mature capsules began about two weeks after the lossof the floral petals. Scoring was done using a razor blade, making 2 to 3 one-millimeter deep incisions on thecapsule surface. For each capsule, opium gum was collected over a 24 h period on aluminum foil, allowed to airdry for 72 hours, and then weighed. The timing and harvesting techniques match those typically used for Papaversomniferum.
Capillary Electrophoresis (CE): Opium alkaloid standards were obtained from the reference collection of theDEA Special Testing and Research Laboratory (Dulles, VA). All CE-grade reagents and run buffer solutionswere obtained from MicrosolvTM Technology (Eatontown, NJ). High Performance Liquid Chromatography grademethanol was obtained from Burdick and Jackson (Muskegon, MI). High purity, deionized water was obtainedfrom a Millipore Milli-Q-Gradient A10 water system (Bedford, MA). An internal standard stock solution oftetracaine hydrochloride was prepared by weighing 25 mg into a 100 mL volumetric flask and diluted to volumewith a 1:11 mixture of methanol and 3.75 mM phosphate buffer (pH 3.2). To obtain the tetracaine internalstandard working solution, 6 mL of the tetracaine HCl internal standard stock solution was diluted to volume with3.75 mM phosphate buffer (pH 3.2) in a 50 mL volumetric flask. Appropriate amounts of morphine, codeine,thebaine, noscapine, and papaverine base standards were weighed into a 100 mL volumetric flask in order toobtain an approximate final concentration of 0.025 mg mL-1 for each compound. Ten mL of the internal standardstock solution was pipetted into the above mentioned volumetric flask and diluted to volume with a 1:11 mixtureof methanol and 3.75 mM phosphate buffer. Approximately 500 :L of the solution was filtered using 0.45 :mregenerated cellulose Titan filter and transferred to a 1.0 mL polypropylene CE injection vial.
Appropriate amounts of the opium gum samples were weighed into a volumetric flask in order to obtain aconcentration of morphine similar to that of the standard. The flask was filled to half volume with methanol andsonicated for 30 minutes at 550C to completely extract the alkaloids. The flask was then cooled, and diluted tovolume with 3.75 mM phosphate buffer (pH 3.2). 400 :L of the above solution was added to 2.0 mL of theinternal standard working solution. Approximately 500 :L of the above solution was filtered using a 0.45 :mregenerated cellulose Titan filter and transferred to a 1.0 mL polypropylene CE injection vial. An Agilent ModelHP3DCE capillary electrophoresis system equipped with a diode array detector (Waldbronn, Germany) was usedfor alkaloid analysis and quantitation, as described by Lurie et al. [12]. All experiments were carried out withfused silica 32 cm (23.5 cm to detector window) x 50 :m I.D. pre-made capillaries obtained from AgilentTechnologies (Part No: G1600-63211).
Gas Chromatography/Mass Spectrometry (GC/MS): Analyses were conducted using an Agilent (Palo Alto, CA)Model 5973 Quadrupole Mass Selective Detector (MSD) interfaced with an Agilent Model 6890 GasChromatograph (GC). The GC contained a J&W Scientific (Rancho Cordova, CA) 30 m x 0.25 mm I.D. fusedsilica capillary column coated with a film thickness of 0.25 :m DB-1. The injection port was maintained at2800C. The oven was programmed with an initial temperature of 900C, holding for 2 minutes, then 140C perminute increase until 3000C, holding for another 10 minutes. One mL portions of the methanol extracts of theopium samples were placed into autosampler vials for analysis.
Results and Discussion
Morphine, codeine, noscapine, and papaverine were all detected and quantitated using the CE method describedin the Experimental section. Thebaine was detected in the opium using the GC/MS method described in theExperimental section; however, CE quantitation of thebaine was not possible because of its low levels (the TICindicated thebaine between 0.01 and 0.3%). The low thebaine content was unexpected in view of the valuepreviously reported by Asahina et al. [6]. The quantitation results for morphine, codeine, noscapine, andpapaverine for the opium samples collected from all 14 plants are presented in Table 1. The amounts of opiumobtained from each plant are also presented in Table 1. The average levels were 2% morphine, 3% codeine, 10%noscapine, and 5% papaverine, all by weight of opium. The noscapine quant was stunningly high (5x) relative to
Brought to you by AltGov2 [www.altgov2.org]
Microgram Journal, Volume 5, Numbers 1-4 (January - December 2007) 17
the morphine content, and interestingly, is very similar (on a weight percent basis) to the noscapine content ofopium from Papaver somniferum cultivations in South and Central America [12].
Studies at the Special Testing and Research Laboratory have shown that the morphine content in Papaversomniferum opium varies among growing regions. However, on average, Papaver somniferum opium containsabout 10 - 13% morphine [13]. These latter results do not derive from controlled cultivations; however, as notedabove, it is assumed that these plants were grown at an average ground level CO2 level of 390 ppm. Theelectropherograms of typical Papaver setigerum and Papaver somniferum opiums are shown in Figure 1.
Based on the results of this study, although Papaver setigerum opium contains some morphine, it is not a viablesource of opium for illicit poppy cultivators. Cultivation and the manual harvesting of opium poppy capsules bylancing and subsequent hand-collection are very time-consuming and labor-intensive processes. Papaversetigerum plants are much smaller in size compared to Papaver somniferum plants; furthermore, the capsules inPapaver setigerum are also very small and elongated in shape (between 10 - 16 millimeters in length and between4 - 7 millimeters in diameter). In contrast, Papaver somniferum capsules are more or less globular in shape andmuch larger in size (typically between 20 and 40 millimeters in diameter). For these reasons, the total amount ofopium that can be obtained from a field of Papaver setigerum poppies is much lower than from an equal sizedfield of Papaver somniferum poppies. The much lower morphine content, much lower total opium yield, and theincreased time and labor needed to harvest the opium from the small, elongated pods, all explain why Papaversetigerum has never received much attention in the areas of either licit or illicit cultivation and morphineproduction. Based on this study, it would appear that this disinterest is justified.
Acknowledgements
The authors would like to thank Thomas M. Duncan and Elizabeth R. Pascual, Supervisory Chemists, DEASpecial Testing and Research Laboratory (Dulles, VA), for their support and encouragement.
References
1. Kapoor LD. Opium Poppy: Botany, Chemistry, and Pharmacology. The Haworth Press Inc., 1995.
2. Fulton CC. The Opium Poppy and other Poppies. U.S. Treasury Department, Bureau of Narcotics, 1944,pp. 37-38.
3. Farmilo CG, Rhodes HLJ, Hart HRL, Taylor H. Detection of morphine in Papaver setigerum DC. Bulletin on Narcotics 1953;5(1):26-31.
4. Suguira T. Chromosome studies in Papaveraceae with special reference to the phylogeny. Cytologia 1940;10:558-576.
5. Asahina H, Ono M. Quantitative determination of morphine in opium by paper chromatography andspectrophotometry. UNODC Bulletin, 1956.
6. Asahina H, Kawatani T, Ono M, Fujita S. Studies of poppies and opium. UNODC Bulletin, 1957.
7. La Valva V, Sabato S, Giglicano G. Morphology and alkaloid chemistry of Papaver setigerum DC(Papaveraceae). TAXON 1985;34(2):191-196.
8. Garnock-Jones PJ, Scholes P. Alkaloid content of Papaver somniferum subsp. setigerum from NewZealand. New Zealand Journal of Botany 1990;28:367-369.
Brought to you by AltGov2 [www.altgov2.org]
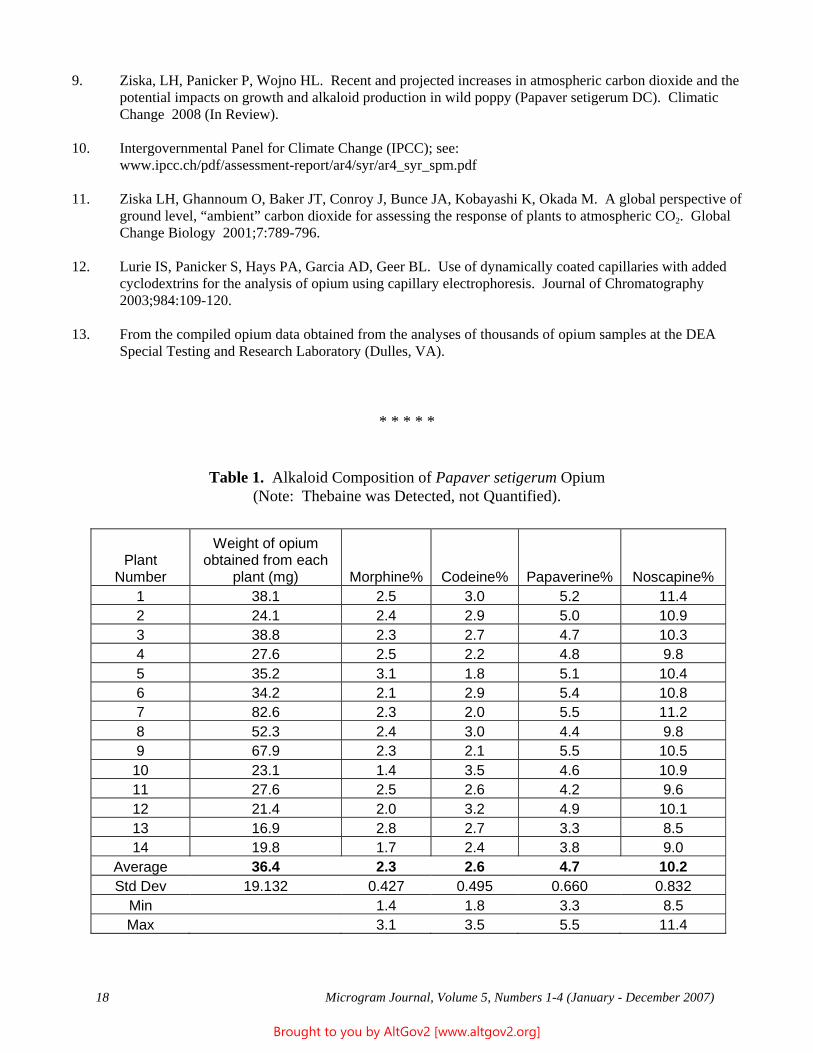
18 Microgram Journal, Volume 5, Numbers 1-4 (January - December 2007)
9. Ziska, LH, Panicker P, Wojno HL. Recent and projected increases in atmospheric carbon dioxide and thepotential impacts on growth and alkaloid production in wild poppy (Papaver setigerum DC). ClimaticChange 2008 (In Review).
10. Intergovernmental Panel for Climate Change (IPCC); see: www.ipcc.ch/pdf/assessment-report/ar4/syr/ar4_syr_spm.pdf
11. Ziska LH, Ghannoum O, Baker JT, Conroy J, Bunce JA, Kobayashi K, Okada M. A global perspective ofground level, “ambient” carbon dioxide for assessing the response of plants to atmospheric CO2. GlobalChange Biology 2001;7:789-796.
12. Lurie IS, Panicker S, Hays PA, Garcia AD, Geer BL. Use of dynamically coated capillaries with addedcyclodextrins for the analysis of opium using capillary electrophoresis. Journal of Chromatography 2003;984:109-120.
13. From the compiled opium data obtained from the analyses of thousands of opium samples at the DEASpecial Testing and Research Laboratory (Dulles, VA).
* * * * *
Table 1. Alkaloid Composition of Papaver setigerum Opium(Note: Thebaine was Detected, not Quantified).
Plant Number
Weight of opium obtained from each
plant (mg) Morphine% Codeine% Papaverine% Noscapine% 1 38.1 2.5 3.0 5.2 11.4 2 24.1 2.4 2.9 5.0 10.9 3 38.8 2.3 2.7 4.7 10.3 4 27.6 2.5 2.2 4.8 9.8 5 35.2 3.1 1.8 5.1 10.4 6 34.2 2.1 2.9 5.4 10.8 7 82.6 2.3 2.0 5.5 11.2 8 52.3 2.4 3.0 4.4 9.8 9 67.9 2.3 2.1 5.5 10.5 10 23.1 1.4 3.5 4.6 10.9 11 27.6 2.5 2.6 4.2 9.6 12 21.4 2.0 3.2 4.9 10.1 13 16.9 2.8 2.7 3.3 8.5 14 19.8 1.7 2.4 3.8 9.0
Average 36.4 2.3 2.6 4.7 10.2 Std Dev 19.132 0.427 0.495 0.660 0.832
Min 1.4 1.8 3.3 8.5 Max 3.1 3.5 5.5 11.4
Brought to you by AltGov2 [www.altgov2.org]
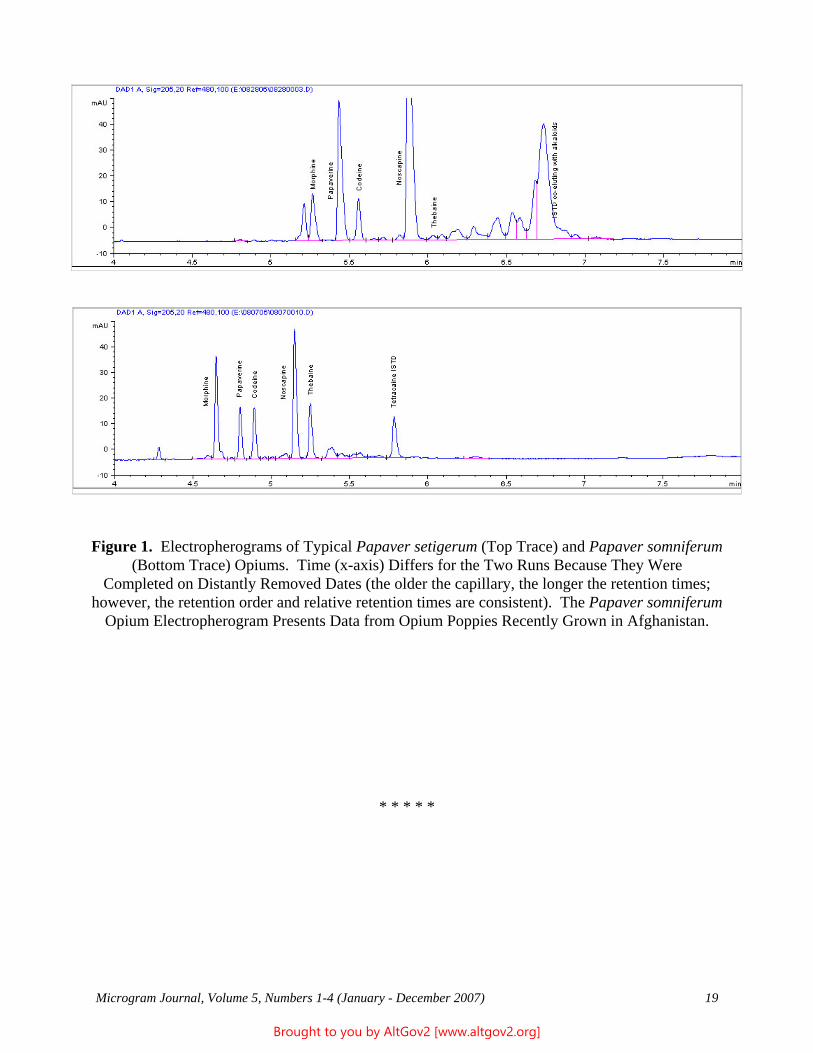
Microgram Journal, Volume 5, Numbers 1-4 (January - December 2007) 19
Figure 1. Electropherograms of Typical Papaver setigerum (Top Trace) and Papaver somniferum(Bottom Trace) Opiums. Time (x-axis) Differs for the Two Runs Because They Were
Completed on Distantly Removed Dates (the older the capillary, the longer the retention times;however, the retention order and relative retention times are consistent). The Papaver somniferum
Opium Electropherogram Presents Data from Opium Poppies Recently Grown in Afghanistan.
* * * * *
Brought to you by AltGov2 [www.altgov2.org]
20 Microgram Journal, Volume 5, Numbers 1-4 (January - December 2007)
Technical Note
Analysis of Fatty Acids in Marijuana (Cannabis Sativa Leaf)
Nadia Fucci, Ph.D.Catholic University of the Sacred Heart
Institute of Legal MedicineLargo Francesco Vito1- 00168 Rome, Italy
[email: nadiafucci -at- rm.unicatt.it]
ABSTRACT: Various fatty acids (palmitic, myristic, oleic, and stearic acids) were identified in 20 marijuana(cannabis leaf) samples recently seized on the illicit market in Rome, Italy. Samples were analyzed by gaschromatography/mass spectrometry to determine delta-9-tetrahydrocannabinol, other minor cannabinoidcongeners, and fatty acids. Although cannabis seeds and the oil derived from those seeds are known to be rich infatty acids, this is believed to be the first study demonstrating the presence of fatty acids in marijuana. Thepotential value of the results in source determination and comparative analyses is discussed.
KEYWORDS: Marijuana, Fatty Acids, Myristic Acid, Palmitic Acid, Oleic Acid, Stearic Acid, Analysis,GC/MS, Forensic Chemistry
Introduction
Cannabis preparations, especially marijuana (cannabis leaf), are the most widely abused illicit drugs in the world. Because of the significant economic and social impact associated with abuse of marijuana and related products,extensive effort is expended to monitor their production, trafficking, and use. These efforts include sourcedetermination (i.e., geographic origin) [e.g., 1-4] and comparative analysis (i.e., sample - sample comparisons)[e.g., 5-8]. Approaches have included classic impurity profiling (including cannabinoid quants and ratios),various DNA-based analyses, and isotope ratio analyses (primarily based on *13C and *15N) [e.g., 9].
Because hemp fiber, seeds, and seed oils all have potential economic value, analysis of Cannabis sativa has notbeen limited to leaf or leaf-derived products. One sub-topic of interest is the presence of fatty acids in the seedsand fruits of cannabis [10-13]. The seeds and seed oils of cannabis contain a wide variety of fatty acids ineconomically viable amounts. Samir et al. [12] reported the concentration of fatty acids and the relativepercentage of unsaturated and saturated fatty acids in a number of different samples of cannabis seeds, and notedthat climate and growing conditions seemed to influence the composition of these compounds in the differentsamples. Furthermore, Bagci et al. [13] showed that high amounts of individual fatty acids, along with variousminor components (tocopherol and tocotrienols) was useful in assessing chemotaxonomic relationships amongdifferent varieties of cannabis. Collectively, these results suggest that fatty acids may be of value in sourcedetermination and/or comparative analysis of cannabis seeds or seed oils.
However, there do not appear to be any studies reporting the presence of fatty acids in marijuana itself (i.e.,cannabis leaf). In this study, a simple gas chromatography/mass spectrometry (GC/MS) method was developedfor the determination of fatty acids in marijuana, and was successfully demonstrated on 20 samples seized inRome, Italy. The technique is sensitive and accurate. The potential value of the results in source determinationand comparative analyses is discussed.
Brought to you by AltGov2 [www.altgov2.org]
Microgram Journal, Volume 5, Numbers 1-4 (January - December 2007) 21
Experimental
Materials and Methods: All chemical and reagents employed were of analytical grade. Fatty acid standards werepurchased from Sigma-Aldrich. A mixture of the standards, each at a concentration of 0.1 mg/mL, was used formethod development. Twenty marijuana samples from the illicit Roman market were analyzed. The sampleswere stored in the dark in a dry-box prior to analysis. Individual samples (100 milligrams) were extracted with0.5 mL of chloroform solution at room temperature, and an aliquot injected into the GC/MS.
Instrumentation: GC/MS analyses were performed on a Model Focus-HP Gas Chromatograph fitted with asplit-splitless injector (270OC) equipped with a HP-1 capillary column (12 m x 0.2 mm I.D.) coated with 0.3 :mthickness of methylsilicone. The temperature program ramped from 70OC to 280OC at 10OC/min, with a 5 minfinal hold. Helium was employed as the carrier gas, at a column head pressure of 10 psi. The GC was connectedto an HP 5971A Mass Analyzer operating at 70 eV EI over 40-500 a.m.u. in selected ion monitoring (SIM) mode.
Results and Discussion
Cannabis seeds and seed oils have been shown to contain up to 20 fatty acids [10-13]. Analysis of the 20marijuana samples selected for this study confirmed the (varying) presence of myristic, palmitic, oleic, and/orstearic acids (see Tables 1-3 and Figures 1-4). Table 1 presents the IUPAC names and formulas for the respectiveacids. Table 2 presents the respective retention times and the ions selected for SIM analysis. Table 3 presents theresults by sample (ratio’d against the combined cannabidiol (CBD) and cannabinol (CBN) content). Figures 1-4display typical SIM chromatograms of the respective acids.
The acids varied dramatically by sample. All four acids were present in only 10 of the 20 samples(1,2,4,5,10,11,13,15,16, and 17). Three acids (myristic, palmitic, and stearic) were present in samples 3 and 18;two acids (myristic and palmitic) were present in samples 6,7,12, and 19; only one acid (oleic) was present insamples 9,14 and 20; and finally, no fatty acids were detected in sample 8. The geographic origin for samples 6and 7 was alleged to be the Netherlands, and in fact those samples had similar delta-9-tetrahydrocannabinolcontents (about 1%) and similar impurity profiles, and were also similar in their fatty acid profile (but with onlytwo acids present and with actual origin unknown, the results are interesting but of only curiosity value). Nonetheless, these results suggest that the fatty acid profile of marijuana may be useful for comparative analyses(sample - sample comparisons). The analysis is easy, quick, and sufficiently sensitive for small sample amounts. Although unlikely [12], the method may also be useful for source determination; however, such an advance wouldrequire a much larger database of authentics (samples of known origin).
Additional research is planned for more sensitive determination of fatty acids in marijuana by derivatizing theacids prior to analysis. The results will be the subject of a future report.
References
1. Datwyler SL, Weiblen GD. Genetic variation in hemp and marijuana (Cannabis sativa L.) according toamplified fragment length polymorphism. Journal of Forensic Science 2006;51(2):371-75.
2. Stefanidou M, Athaneselis S, Alevisopoulos G, Koutselinis A. )9-Tetrahydrocannabinol content incannabis plants of Greek origin. Chemical Pharmaceutical Bulletin 2000;48:743-45.
3. United Nations. Special Issue on Cannabis. Bulletin on Narcotics 1985;37(4):1-94.
4. Toonen M, Ribot S, Thissen J. Yield of illicit indoor cannabis in the Netherlands. Journal of ForensicScience 2006;51(5):1050-4.
Brought to you by AltGov2 [www.altgov2.org]
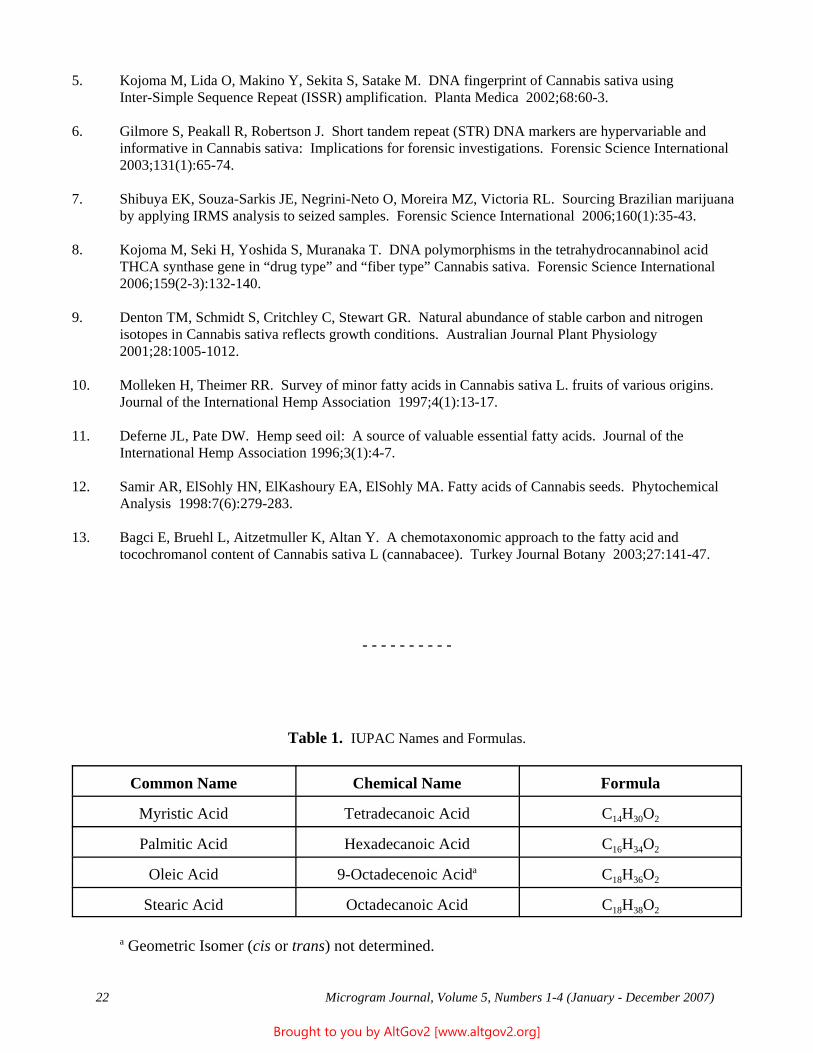
22 Microgram Journal, Volume 5, Numbers 1-4 (January - December 2007)
5. Kojoma M, Lida O, Makino Y, Sekita S, Satake M. DNA fingerprint of Cannabis sativa usingInter-Simple Sequence Repeat (ISSR) amplification. Planta Medica 2002;68:60-3.
6. Gilmore S, Peakall R, Robertson J. Short tandem repeat (STR) DNA markers are hypervariable andinformative in Cannabis sativa: Implications for forensic investigations. Forensic Science International 2003;131(1):65-74.
7. Shibuya EK, Souza-Sarkis JE, Negrini-Neto O, Moreira MZ, Victoria RL. Sourcing Brazilian marijuanaby applying IRMS analysis to seized samples. Forensic Science International 2006;160(1):35-43.
8. Kojoma M, Seki H, Yoshida S, Muranaka T. DNA polymorphisms in the tetrahydrocannabinol acidTHCA synthase gene in “drug type” and “fiber type” Cannabis sativa. Forensic Science International 2006;159(2-3):132-140.
9. Denton TM, Schmidt S, Critchley C, Stewart GR. Natural abundance of stable carbon and nitrogenisotopes in Cannabis sativa reflects growth conditions. Australian Journal Plant Physiology 2001;28:1005-1012.
10. Molleken H, Theimer RR. Survey of minor fatty acids in Cannabis sativa L. fruits of various origins. Journal of the International Hemp Association 1997;4(1):13-17.
11. Deferne JL, Pate DW. Hemp seed oil: A source of valuable essential fatty acids. Journal of theInternational Hemp Association 1996;3(1):4-7.
12. Samir AR, ElSohly HN, ElKashoury EA, ElSohly MA. Fatty acids of Cannabis seeds. PhytochemicalAnalysis 1998:7(6):279-283.
13. Bagci E, Bruehl L, Aitzetmuller K, Altan Y. A chemotaxonomic approach to the fatty acid andtocochromanol content of Cannabis sativa L (cannabacee). Turkey Journal Botany 2003;27:141-47.
- - - - - - - - - -
Table 1. IUPAC Names and Formulas.
Common Name Chemical Name Formula
Myristic Acid Tetradecanoic Acid C14H30O2
Palmitic Acid Hexadecanoic Acid C16H34O2
Oleic Acid 9-Octadecenoic Acida C18H36O2
Stearic Acid Octadecanoic Acid C18H38O2
a Geometric Isomer (cis or trans) not determined.
Brought to you by AltGov2 [www.altgov2.org]
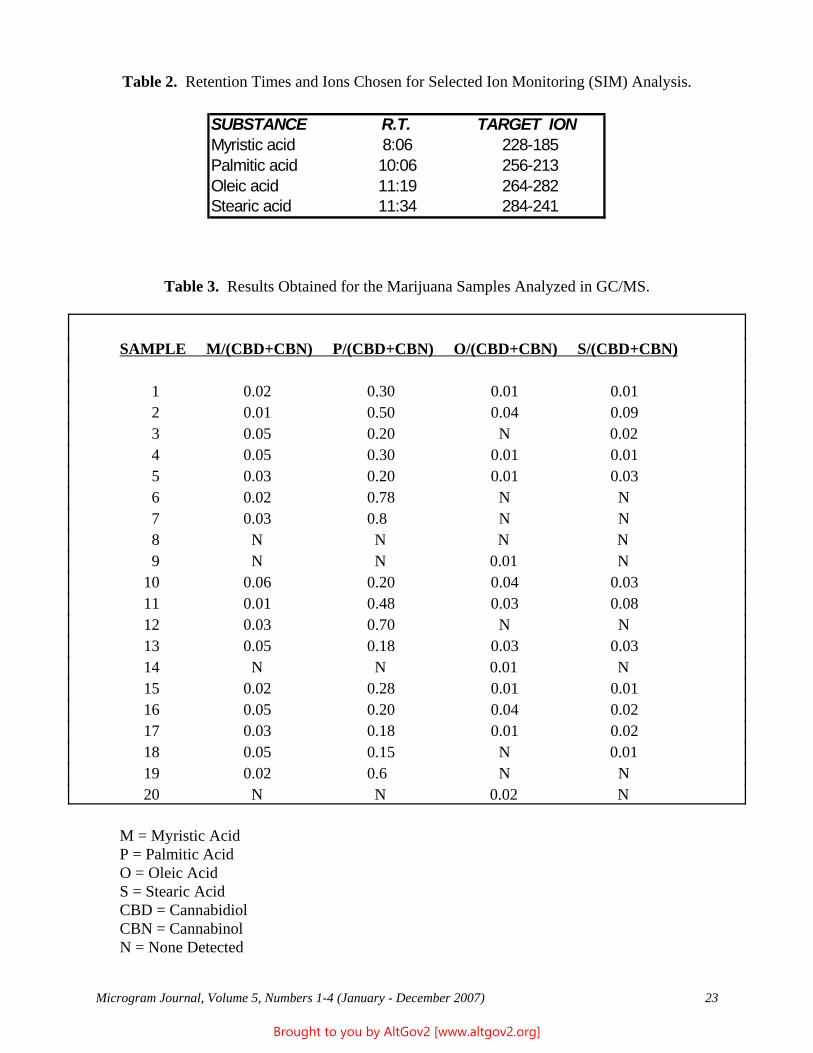
Microgram Journal, Volume 5, Numbers 1-4 (January - December 2007) 23
Table 2. Retention Times and Ions Chosen for Selected Ion Monitoring (SIM) Analysis.
Table 3. Results Obtained for the Marijuana Samples Analyzed in GC/MS.
SAMPLE M/(CBD+CBN) P/(CBD+CBN) O/(CBD+CBN) S/(CBD+CBN)
1 0.02 0.30 0.01 0.01 2 0.01 0.50 0.04 0.09 3 0.05 0.20 N 0.02 4 0.05 0.30 0.01 0.01 5 0.03 0.20 0.01 0.03 6 0.02 0.78 N N 7 0.03 0.8 N N 8 N N N N 9 N N 0.01 N 10 0.06 0.20 0.04 0.03 11 0.01 0.48 0.03 0.08 12 0.03 0.70 N N 13 0.05 0.18 0.03 0.03 14 N N 0.01 N 15 0.02 0.28 0.01 0.01 16 0.05 0.20 0.04 0.02 17 0.03 0.18 0.01 0.02 18 0.05 0.15 N 0.01 19 0.02 0.6 N N 20 N N 0.02 N
M = Myristic AcidP = Palmitic AcidO = Oleic AcidS = Stearic AcidCBD = CannabidiolCBN = CannabinolN = None Detected
SUBSTANCE R.T. TARGET ION Myristic acid 8:06 228-185Palmitic acid 10:06 256-213Oleic acid 11:19 264-282Stearic acid 11:34 284-241
Brought to you by AltGov2 [www.altgov2.org]
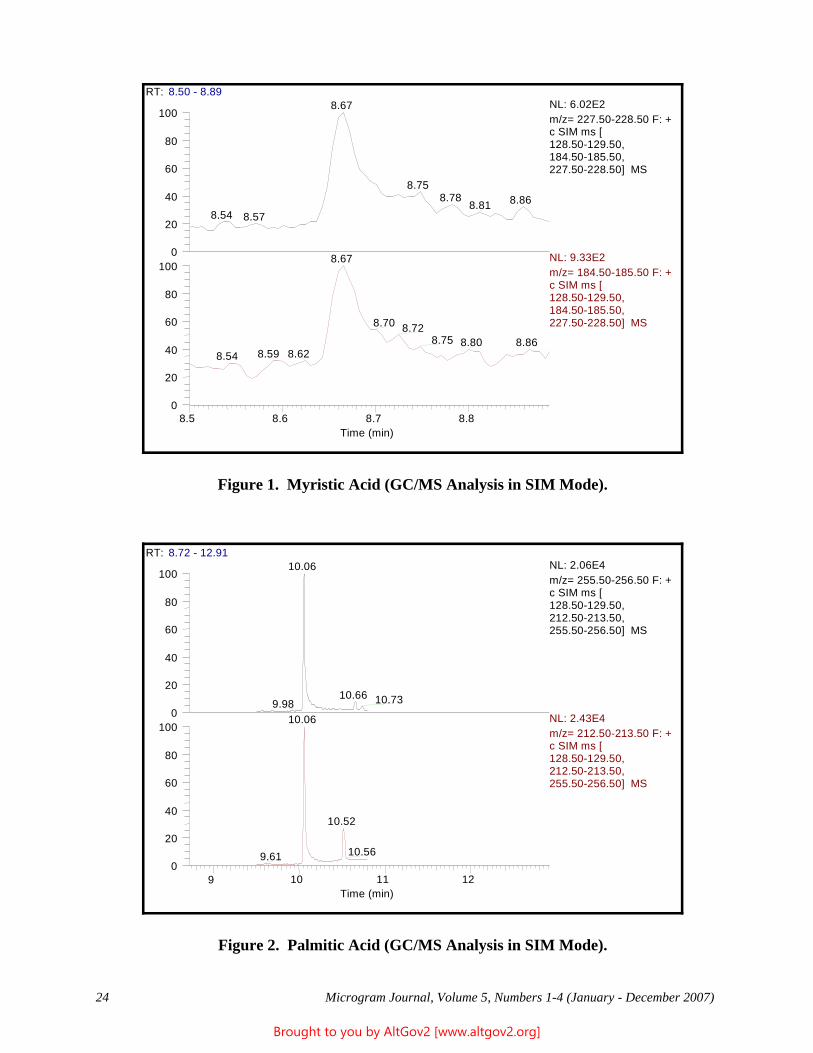
24 Microgram Journal, Volume 5, Numbers 1-4 (January - December 2007)
RT: 8.50 - 8.89
8.5 8.6 8.7 8.8Time (min)
0
20
40
60
80
100 0
20
40
60
80
100
8.67
8.758.78 8.868.81
8.54 8.57
8.67
8.70 8.728.75 8.868.80
8.62 8.59 8.54
NL: 6.02E2 m/z= 227.50-228.50 F: + c SIM ms [ 128.50-129.50, 184.50-185.50, 227.50-228.50] MS
NL: 9.33E2 m/z= 184.50-185.50 F: + c SIM ms [ 128.50-129.50, 184.50-185.50, 227.50-228.50] MS
Figure 1. Myristic Acid (GC/MS Analysis in SIM Mode).
RT: 8.72 - 12.91
9 10 11 12Time (min)
0
20
40
60
80
100 0
20
40
60
80
100 10.06
10.66 10.739.98 10.06
10.52
10.569.61
NL: 2.06E4 m/z= 255.50-256.50 F: + c SIM ms [ 128.50-129.50, 212.50-213.50, 255.50-256.50] MS
NL: 2.43E4 m/z= 212.50-213.50 F: + c SIM ms [ 128.50-129.50, 212.50-213.50, 255.50-256.50] MS
Figure 2. Palmitic Acid (GC/MS Analysis in SIM Mode).
Brought to you by AltGov2 [www.altgov2.org]
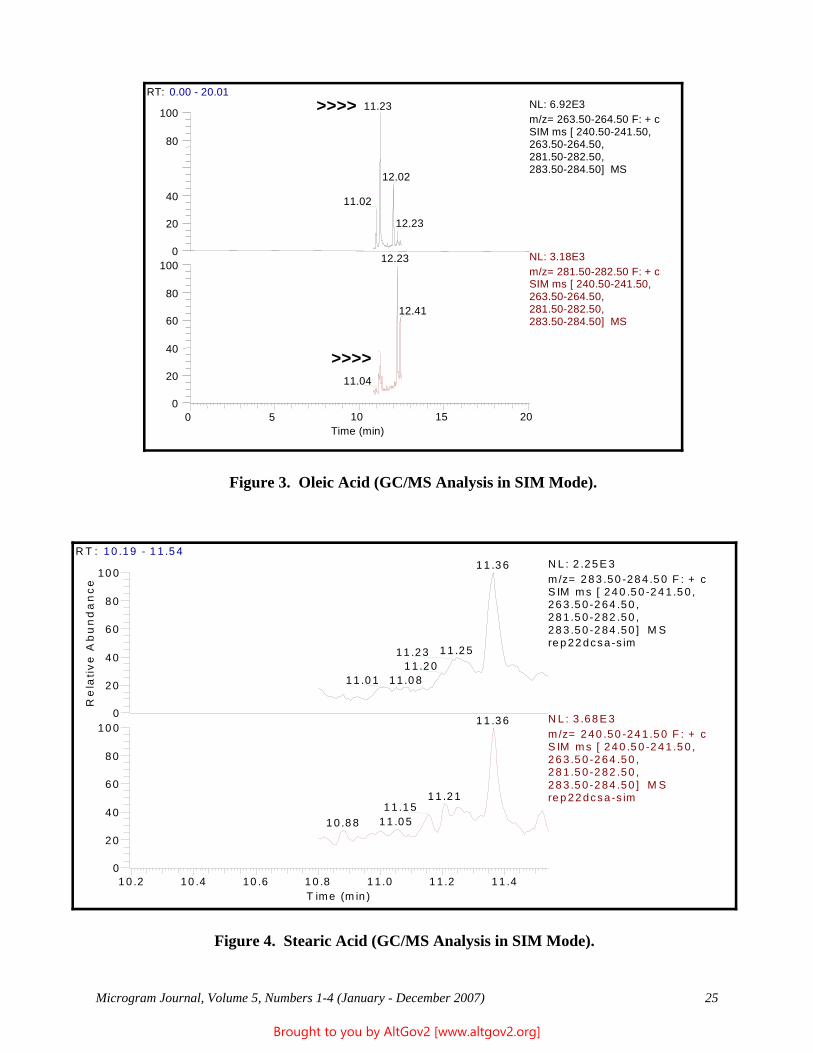
Microgram Journal, Volume 5, Numbers 1-4 (January - December 2007) 25
RT: 0.00 - 20.01
0 5 10 15 20Time (min)
0
20
40
60
80
100 0
20
40
>>>>
80
100
11.23
12.02
11.02
12.23
12.23
12.41
11.04
NL: 6.92E3 m/z= 263.50-264.50 F: + c SIM ms [ 240.50-241.50, 263.50-264.50, 281.50-282.50, 283.50-284.50] MS
NL: 3.18E3 m/z= 281.50-282.50 F: + c SIM ms [ 240.50-241.50, 263.50-264.50, 281.50-282.50, 283.50-284.50] MS
>>>>
Figure 3. Oleic Acid (GC/MS Analysis in SIM Mode).
R T : 1 0 .19 - 1 1 .5 4
1 0 .2 10 .4 10 .6 1 0 .8 1 1 .0 1 1 .2 11 .4T ime (m in )
0
20
40
60
80
10 00
20
40
60
80
10 0
Re
lati
ve A
bu
nd
an
ce
1 1 .3 6
1 1 .2 511 .231 1 .2 0
1 1 .0 81 1 .0 1
1 1 .3 6
1 1 .2 11 1 .1 5
1 1 .0 51 0 .8 8
N L : 2 .25 E 3m/z= 2 83 .50 -28 4 .5 0 F : + c S IM m s [ 24 0 .5 0 -2 4 1 .5 0 , 26 3 .5 0 -2 64 .50 , 28 1 .5 0 -2 82 .50 , 28 3 .5 0 -2 84 .50 ] M S re p 22 dcsa -s im
N L : 3 .68 E 3m/z= 2 40 .50 -24 1 .5 0 F : + c S IM m s [ 24 0 .5 0 -2 4 1 .5 0 , 26 3 .5 0 -2 64 .50 , 28 1 .5 0 -2 82 .50 , 28 3 .5 0 -2 84 .50 ] M S re p 22 dcsa -s im
Figure 4. Stearic Acid (GC/MS Analysis in SIM Mode).
Brought to you by AltGov2 [www.altgov2.org]
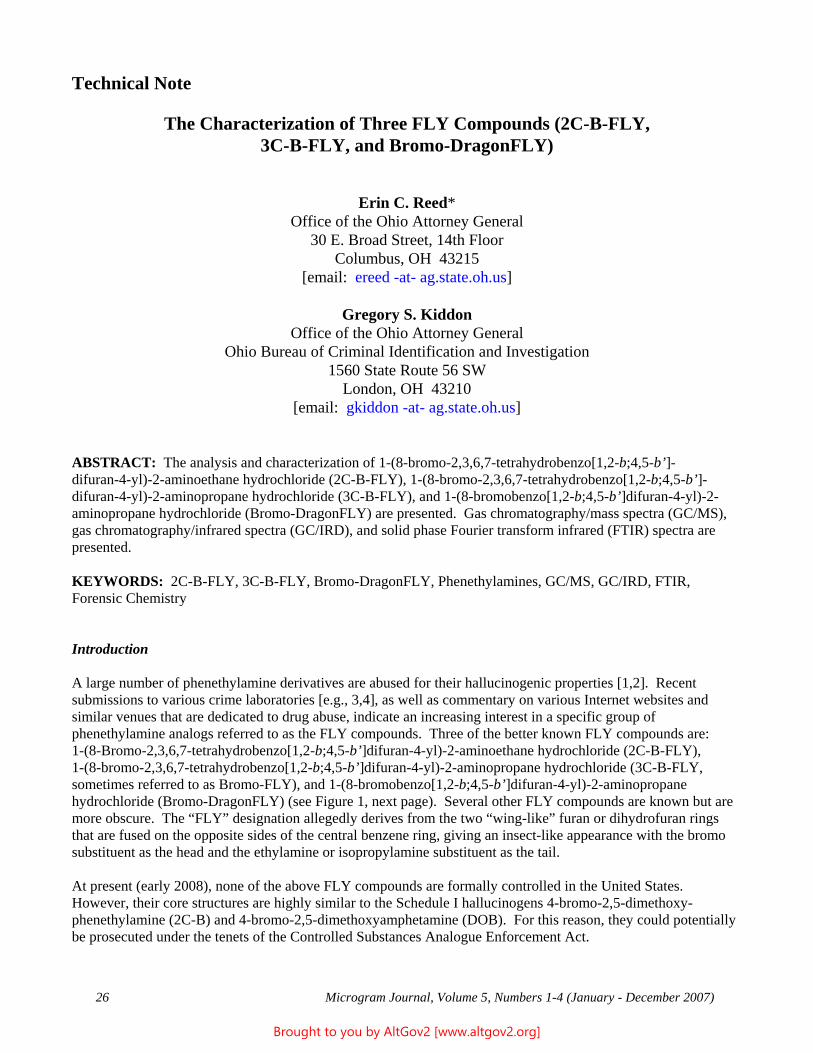
26 Microgram Journal, Volume 5, Numbers 1-4 (January - December 2007)
Technical Note
The Characterization of Three FLY Compounds (2C-B-FLY,3C-B-FLY, and Bromo-DragonFLY)
Erin C. Reed*Office of the Ohio Attorney General
30 E. Broad Street, 14th FloorColumbus, OH 43215
[email: ereed -at- ag.state.oh.us]
Gregory S. KiddonOffice of the Ohio Attorney General
Ohio Bureau of Criminal Identification and Investigation1560 State Route 56 SW
London, OH 43210[email: gkiddon -at- ag.state.oh.us]
ABSTRACT: The analysis and characterization of 1-(8-bromo-2,3,6,7-tetrahydrobenzo[1,2-b;4,5-b’]-difuran-4-yl)-2-aminoethane hydrochloride (2C-B-FLY), 1-(8-bromo-2,3,6,7-tetrahydrobenzo[1,2-b;4,5-b’]-difuran-4-yl)-2-aminopropane hydrochloride (3C-B-FLY), and 1-(8-bromobenzo[1,2-b;4,5-b’]difuran-4-yl)-2-aminopropane hydrochloride (Bromo-DragonFLY) are presented. Gas chromatography/mass spectra (GC/MS),gas chromatography/infrared spectra (GC/IRD), and solid phase Fourier transform infrared (FTIR) spectra arepresented.
KEYWORDS: 2C-B-FLY, 3C-B-FLY, Bromo-DragonFLY, Phenethylamines, GC/MS, GC/IRD, FTIR,Forensic Chemistry
Introduction
A large number of phenethylamine derivatives are abused for their hallucinogenic properties [1,2]. Recentsubmissions to various crime laboratories [e.g., 3,4], as well as commentary on various Internet websites andsimilar venues that are dedicated to drug abuse, indicate an increasing interest in a specific group ofphenethylamine analogs referred to as the FLY compounds. Three of the better known FLY compounds are: 1-(8-Bromo-2,3,6,7-tetrahydrobenzo[1,2-b;4,5-b’]difuran-4-yl)-2-aminoethane hydrochloride (2C-B-FLY),1-(8-bromo-2,3,6,7-tetrahydrobenzo[1,2-b;4,5-b’]difuran-4-yl)-2-aminopropane hydrochloride (3C-B-FLY,sometimes referred to as Bromo-FLY), and 1-(8-bromobenzo[1,2-b;4,5-b’]difuran-4-yl)-2-aminopropanehydrochloride (Bromo-DragonFLY) (see Figure 1, next page). Several other FLY compounds are known but aremore obscure. The “FLY” designation allegedly derives from the two “wing-like” furan or dihydrofuran ringsthat are fused on the opposite sides of the central benzene ring, giving an insect-like appearance with the bromosubstituent as the head and the ethylamine or isopropylamine substituent as the tail.
At present (early 2008), none of the above FLY compounds are formally controlled in the United States. However, their core structures are highly similar to the Schedule I hallucinogens 4-bromo-2,5-dimethoxy-phenethylamine (2C-B) and 4-bromo-2,5-dimethoxyamphetamine (DOB). For this reason, they could potentiallybe prosecuted under the tenets of the Controlled Substances Analogue Enforcement Act.
Brought to you by AltGov2 [www.altgov2.org]
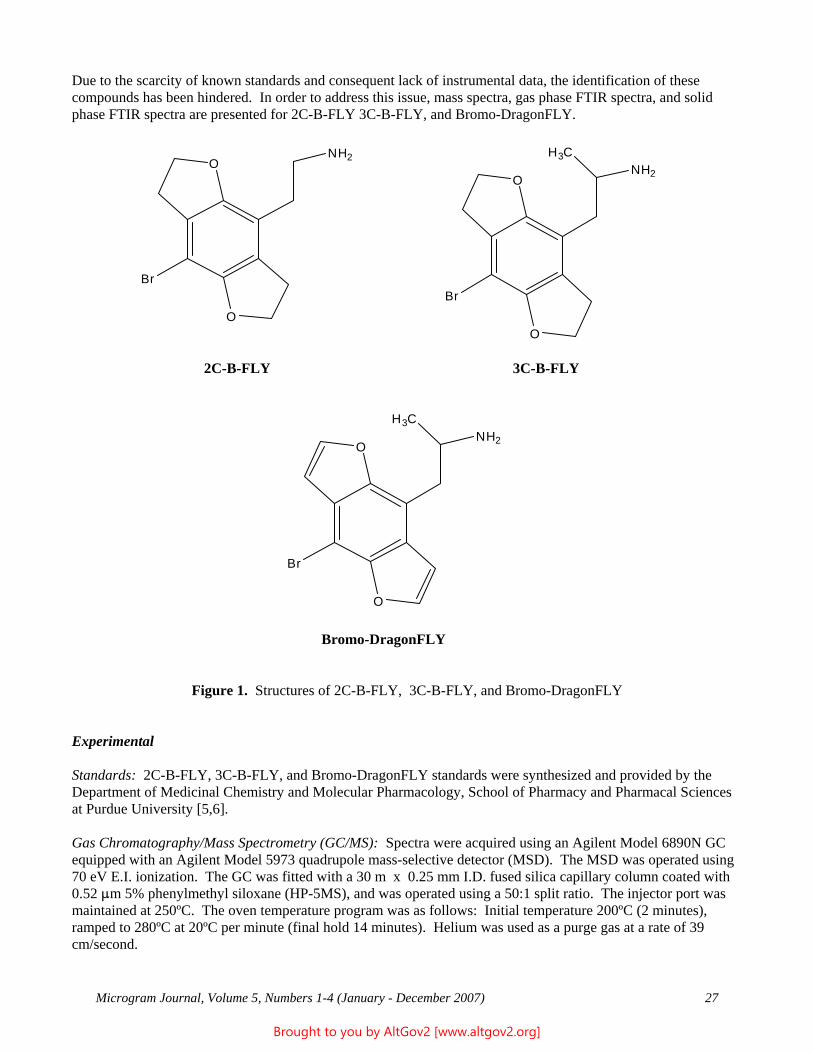
Microgram Journal, Volume 5, Numbers 1-4 (January - December 2007) 27
Due to the scarcity of known standards and consequent lack of instrumental data, the identification of thesecompounds has been hindered. In order to address this issue, mass spectra, gas phase FTIR spectra, and solidphase FTIR spectra are presented for 2C-B-FLY 3C-B-FLY, and Bromo-DragonFLY.
2C-B-FLY 3C-B-FLY
Bromo-DragonFLY
Figure 1. Structures of 2C-B-FLY, 3C-B-FLY, and Bromo-DragonFLY
Experimental
Standards: 2C-B-FLY, 3C-B-FLY, and Bromo-DragonFLY standards were synthesized and provided by theDepartment of Medicinal Chemistry and Molecular Pharmacology, School of Pharmacy and Pharmacal Sciencesat Purdue University [5,6]. Gas Chromatography/Mass Spectrometry (GC/MS): Spectra were acquired using an Agilent Model 6890N GCequipped with an Agilent Model 5973 quadrupole mass-selective detector (MSD). The MSD was operated using70 eV E.I. ionization. The GC was fitted with a 30 m x 0.25 mm I.D. fused silica capillary column coated with0.52 :m 5% phenylmethyl siloxane (HP-5MS), and was operated using a 50:1 split ratio. The injector port wasmaintained at 250ºC. The oven temperature program was as follows: Initial temperature 200ºC (2 minutes),ramped to 280ºC at 20ºC per minute (final hold 14 minutes). Helium was used as a purge gas at a rate of 39cm/second.
O
O
Br
NH2 O
O
Br
NH2
H3C
O
O
Br
NH2
H3C
Brought to you by AltGov2 [www.altgov2.org]
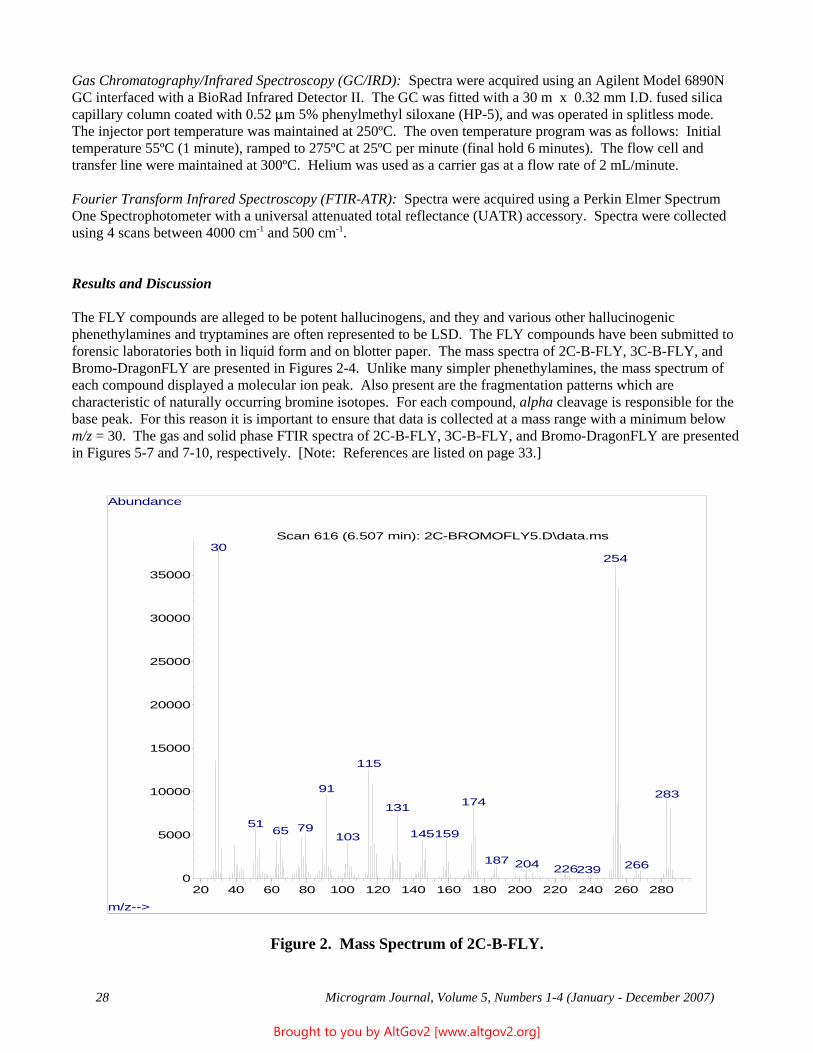
28 Microgram Journal, Volume 5, Numbers 1-4 (January - December 2007)
Gas Chromatography/Infrared Spectroscopy (GC/IRD): Spectra were acquired using an Agilent Model 6890NGC interfaced with a BioRad Infrared Detector II. The GC was fitted with a 30 m x 0.32 mm I.D. fused silicacapillary column coated with 0.52 :m 5% phenylmethyl siloxane (HP-5), and was operated in splitless mode. The injector port temperature was maintained at 250ºC. The oven temperature program was as follows: Initialtemperature 55ºC (1 minute), ramped to 275ºC at 25ºC per minute (final hold 6 minutes). The flow cell andtransfer line were maintained at 300ºC. Helium was used as a carrier gas at a flow rate of 2 mL/minute.
Fourier Transform Infrared Spectroscopy (FTIR-ATR): Spectra were acquired using a Perkin Elmer SpectrumOne Spectrophotometer with a universal attenuated total reflectance (UATR) accessory. Spectra were collectedusing 4 scans between 4000 cm-1 and 500 cm-1.
Results and Discussion
The FLY compounds are alleged to be potent hallucinogens, and they and various other hallucinogenicphenethylamines and tryptamines are often represented to be LSD. The FLY compounds have been submitted toforensic laboratories both in liquid form and on blotter paper. The mass spectra of 2C-B-FLY, 3C-B-FLY, andBromo-DragonFLY are presented in Figures 2-4. Unlike many simpler phenethylamines, the mass spectrum ofeach compound displayed a molecular ion peak. Also present are the fragmentation patterns which arecharacteristic of naturally occurring bromine isotopes. For each compound, alpha cleavage is responsible for thebase peak. For this reason it is important to ensure that data is collected at a mass range with a minimum belowm/z = 30. The gas and solid phase FTIR spectra of 2C-B-FLY, 3C-B-FLY, and Bromo-DragonFLY are presentedin Figures 5-7 and 7-10, respectively. [Note: References are listed on page 33.]
20 40 60 80 100 120 140 160 180 200 220 240 260 2800
5000
10000
15000
20000
25000
30000
35000
m/z-->
Abundance
Scan 616 (6.507 min): 2C-BROMOFLY5.D\data.ms30
254
115
91 283174131
51 7965 145159103
187 204 266226239
Figure 2. Mass Spectrum of 2C-B-FLY.
Brought to you by AltGov2 [www.altgov2.org]
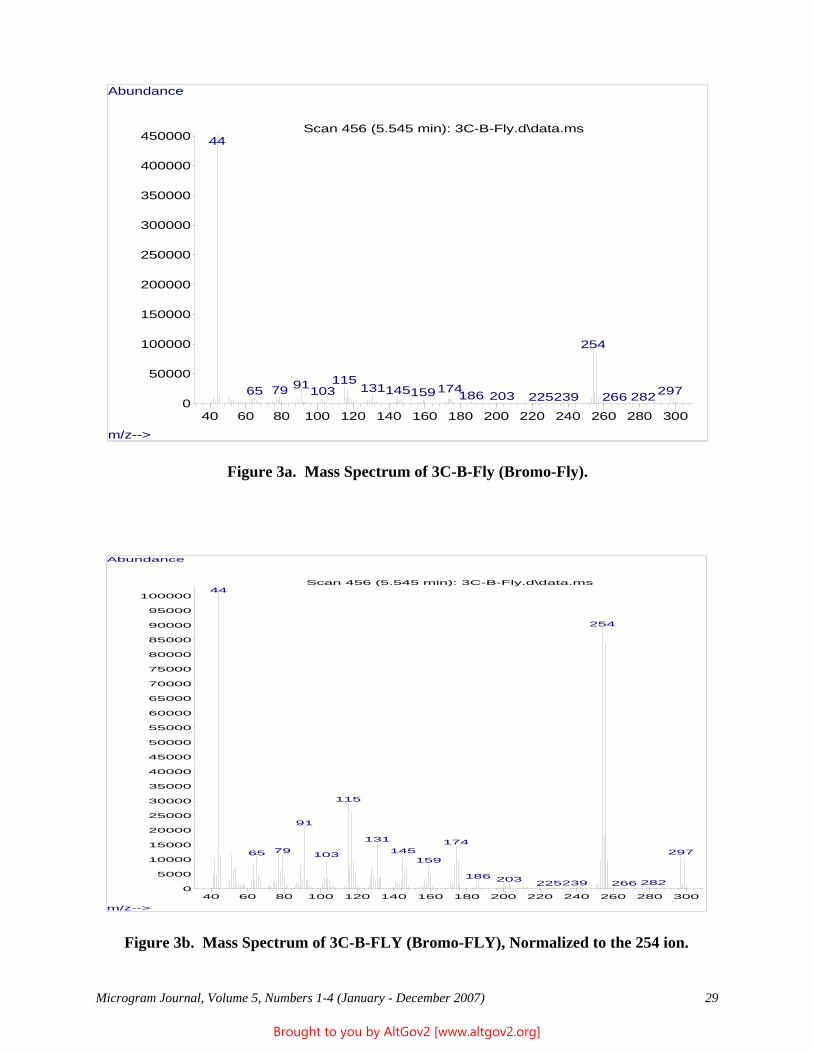
Microgram Journal, Volume 5, Numbers 1-4 (January - December 2007) 29
40 60 80 100 120 140 160 180 200 220 240 260 280 3000
50000
100000
150000
200000
250000
300000
350000
400000
450000
m/z-->
Abundance
Scan 456 (5.545 min): 3C-B-Fly.d\data.ms44
254
11591 131 17479 145 29765 103 159 186 203 282239225 266
Figure 3a. Mass Spectrum of 3C-B-Fly (Bromo-Fly).
40 60 80 100 120 140 160 180 200 220 240 260 280 3000
5000
10000
15000
20000
25000
30000
35000
40000
45000
50000
55000
60000
65000
70000
75000
80000
85000
90000
95000
100000
m/z-->
Abundance
Scan 456 (5.545 min): 3C-B-Fly.d\data.ms44
254
115
91
131 17479 145 29765 103
159
186 203 282239225 266
Figure 3b. Mass Spectrum of 3C-B-FLY (Bromo-FLY), Normalized to the 254 ion.
Brought to you by AltGov2 [www.altgov2.org]
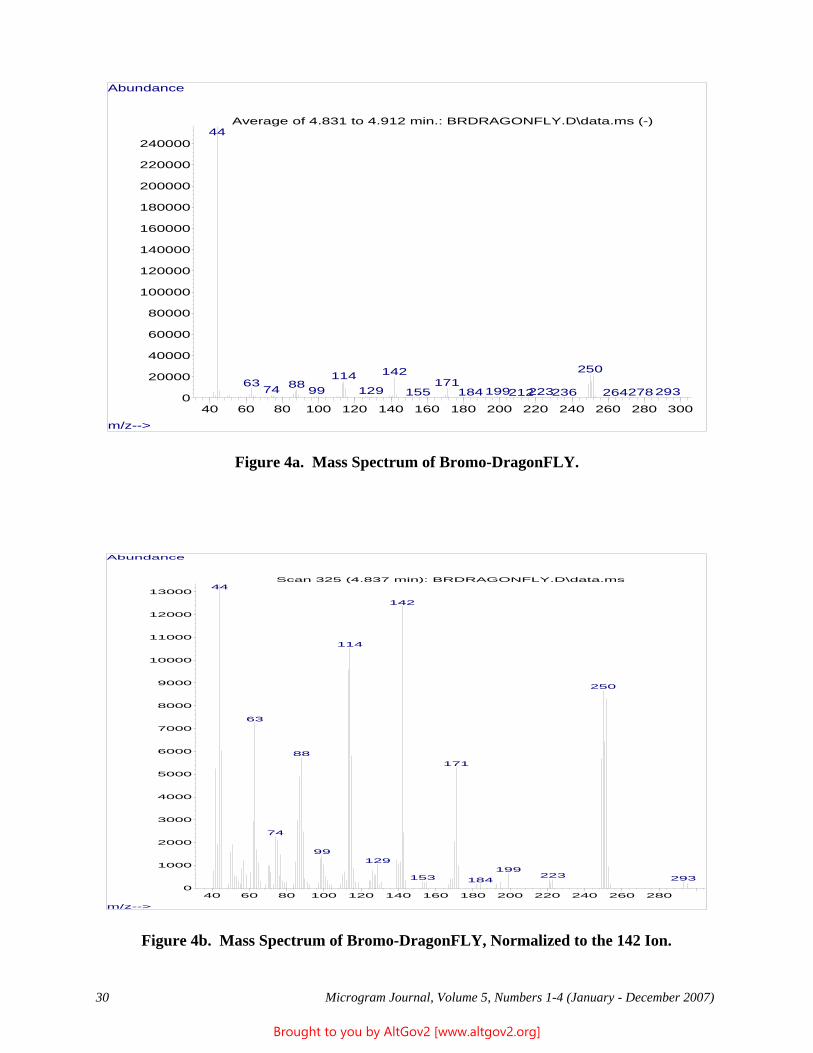
30 Microgram Journal, Volume 5, Numbers 1-4 (January - December 2007)
40 60 80 100 120 140 160 180 200 220 240 260 280 3000
20000
40000
60000
80000
100000
120000
140000
160000
180000
200000
220000
240000
m/z-->
Abundance
Average of 4.831 to 4.912 min.: BRDRAGONFLY.D\data.ms (-)44
25014211417163 8874 99 129 199 223 293155 278184 236 264212
Figure 4a. Mass Spectrum of Bromo-DragonFLY.
40 60 80 100 120 140 160 180 200 220 240 260 2800
1000
2000
3000
4000
5000
6000
7000
8000
9000
10000
11000
12000
13000
m/z-->
Abundance
Scan 325 (4.837 min): BRDRAGONFLY.D\data.ms44
142
114
250
63
88171
74
99129
199223153 293184
Figure 4b. Mass Spectrum of Bromo-DragonFLY, Normalized to the 142 Ion.
Brought to you by AltGov2 [www.altgov2.org]
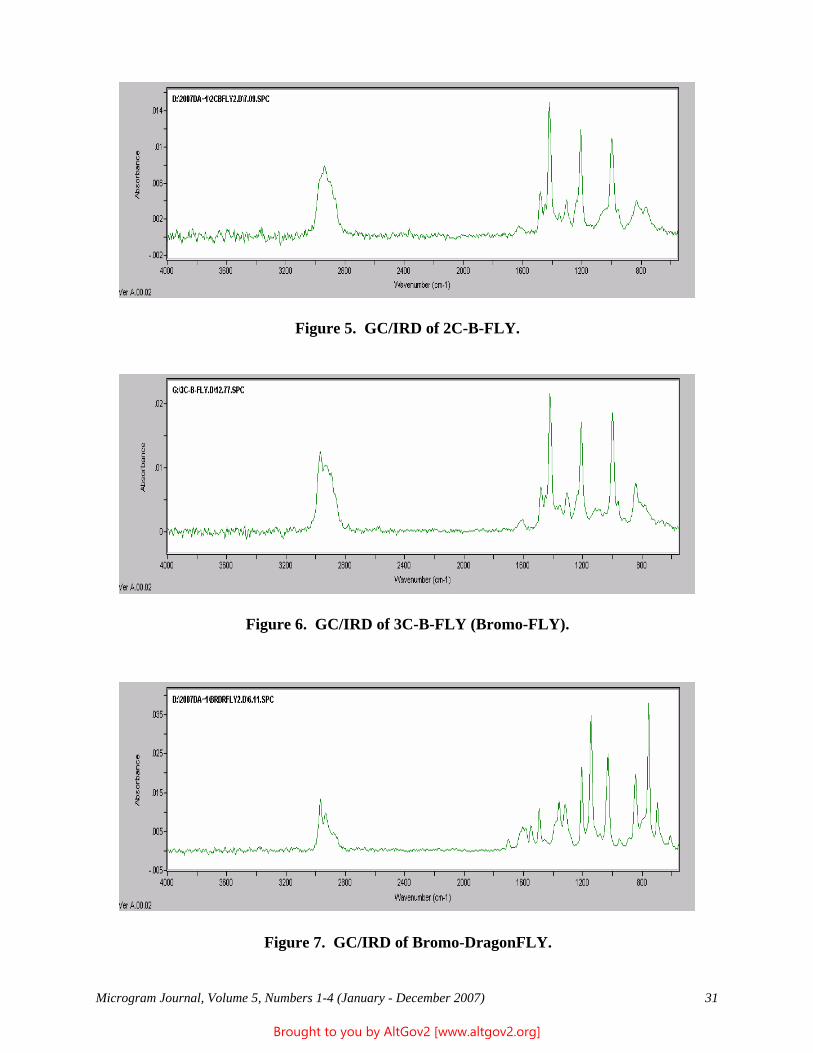
Microgram Journal, Volume 5, Numbers 1-4 (January - December 2007) 31
Figure 5. GC/IRD of 2C-B-FLY.
Figure 7. GC/IRD of Bromo-DragonFLY.
Figure 6. GC/IRD of 3C-B-FLY (Bromo-FLY).
Brought to you by AltGov2 [www.altgov2.org]
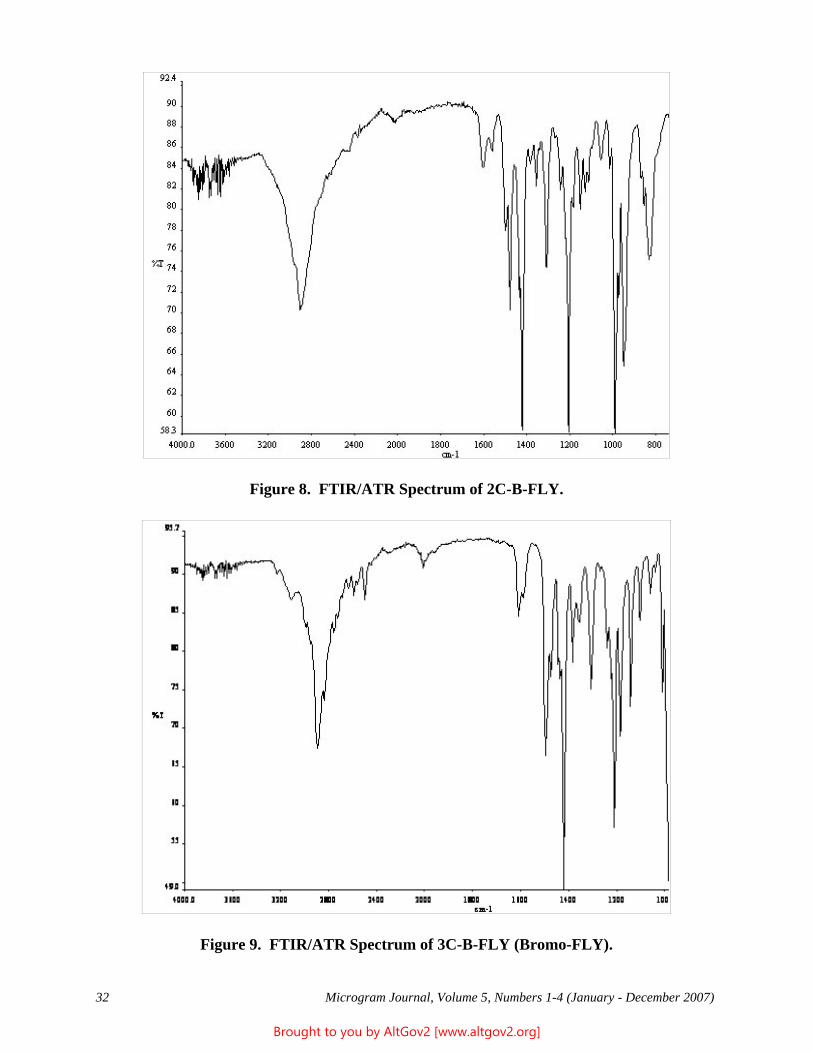
32 Microgram Journal, Volume 5, Numbers 1-4 (January - December 2007)
Figure 8. FTIR/ATR Spectrum of 2C-B-FLY.
Figure 9. FTIR/ATR Spectrum of 3C-B-FLY (Bromo-FLY).
Brought to you by AltGov2 [www.altgov2.org]
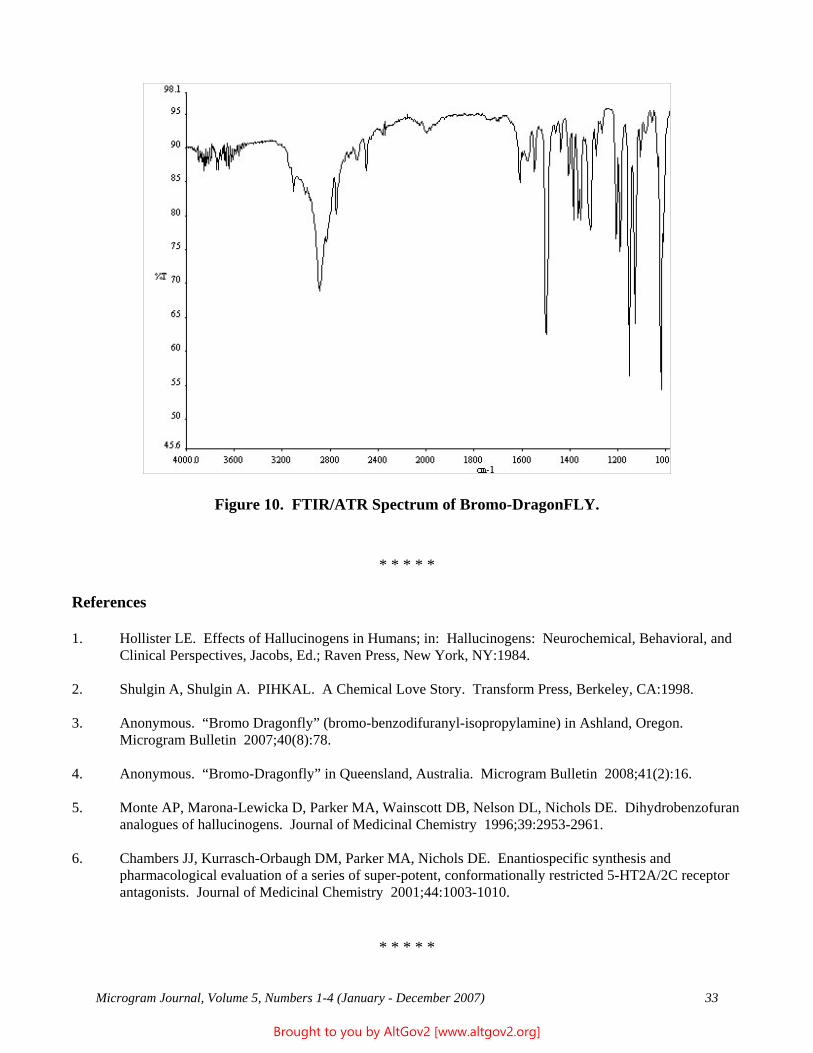
Microgram Journal, Volume 5, Numbers 1-4 (January - December 2007) 33
* * * * *
References
1. Hollister LE. Effects of Hallucinogens in Humans; in: Hallucinogens: Neurochemical, Behavioral, andClinical Perspectives, Jacobs, Ed.; Raven Press, New York, NY:1984.
2. Shulgin A, Shulgin A. PIHKAL. A Chemical Love Story. Transform Press, Berkeley, CA:1998.
3. Anonymous. “Bromo Dragonfly” (bromo-benzodifuranyl-isopropylamine) in Ashland, Oregon. Microgram Bulletin 2007;40(8):78.
4. Anonymous. “Bromo-Dragonfly” in Queensland, Australia. Microgram Bulletin 2008;41(2):16.
5. Monte AP, Marona-Lewicka D, Parker MA, Wainscott DB, Nelson DL, Nichols DE. Dihydrobenzofurananalogues of hallucinogens. Journal of Medicinal Chemistry 1996;39:2953-2961.
6. Chambers JJ, Kurrasch-Orbaugh DM, Parker MA, Nichols DE. Enantiospecific synthesis andpharmacological evaluation of a series of super-potent, conformationally restricted 5-HT2A/2C receptorantagonists. Journal of Medicinal Chemistry 2001;44:1003-1010.
* * * * *
Figure 10. FTIR/ATR Spectrum of Bromo-DragonFLY.
Brought to you by AltGov2 [www.altgov2.org]
34 Microgram Journal, Volume 5, Numbers 1-4 (January - December 2007)
TECHNICAL NOTE
Comparison of the Novel Direct Analysis in Real Time Time-of-Flight Mass Spectrometry (AccuTOF-DART™) and Signature Analysis for the
Identification of Constituents of Refined Illicit Cocaine
Jeri D. Ropero-Miller, Ph.D.*, Peter R. Stout, Ph.D., and Nichole D. Bynum, M.S.RTI International
Center for Forensic Sciences3040 Cornwallis Road
Research Triangle Park, NC 27709[email: jerimiller -at- rti.org]
John F. Casale, B.S.U.S. Department of Justice
Drug Enforcement AdministrationSpecial Testing and Research Laboratory
22624 Dulles Summit CourtDulles, VA 20166
ABSTRACT: The characterization of 25 illicit cocaine samples by a novel application of direct analysis in realtime (DART) sample introduction coupled with time-of-flight mass spectrometry (TOF-MS) and cocainesignature analyses is provided. The AccuTOF-DARTTM analysis of the cocaine samples resulted in the detectionof most analytes, although some compounds were not detected. This new technique is easy, rapid, requires verylittle sample, and can be used to screen even complex mixtures. Potential applications, including use for signatureanalyses of controlled substances, are discussed.
KEYWORDS: Cocaine Signature Analyses, DART, TOF-MS, Screening Test, Forensic Chemistry
Introduction
Time-of-flight mass spectrometry (TOF-MS) using exact mass determination has the potential to greatly improvedrug screening in forensic laboratories [1-4]. A TOF-DART instrument, which couples a TOF mass spectrometerwith a direct analysis in real time (DART) ion source, has been recently introduced. The instrument easily andrapidly screens samples for a wide range of compounds, and requires only minute amounts of sample and littlesample preparation. Both sample preparation and sample screening for multiple drug analytes can be completedin minutes with the TOF-DART, whereas conventional cocaine signature analyses or controlled substancesscreening may take 8 hours or longer. Figure 1 compares the analysis of controlled substances by traditionalGC/MS to the novel screening by TOF-DART. The instrument provides sufficient selectivity and accurateelemental composition assignment through exact mass determination, resulting in analytical identification for awide variety of small molecules, such as drugs and unknown substances (e.g., adulterants, manufacturingsolvents, and byproducts), with minimal sample preparation. TOF-DART detects a variety of controlledsubstances in solid samples or solution preparations [5-6].
In addition to routine sample analysis, AccuTOF-DARTTM may have potential as an adjunct technique forsignature analyses. While such analyses have become routine in many forensic laboratories, these programs couldstill benefit from a rapid screening method to identify controlled substances [7]. A procedure with minimal to no
Brought to you by AltGov2 [www.altgov2.org]
Microgram Journal, Volume 5, Numbers 1-4 (January - December 2007) 35
sample preparation would complement existing methods. Determination of complex mixtures of drugs,adulterants, and diluents can help law enforcement track high-level dealers of illicit substances and identify newlocal or national illicit manufacturing trends. Herein, we provide a direct comparison of cocaine signature andAccuTOF-DARTTM analyses of 25 refined illicit cocaine samples.
Experimental
Materials: Twenty-five DEA confiscated cocaine hydrochloride samples were obtained from the NationalInstitute of Drug Abuse's drug supply repository for research (Bethesda, MD). Polyethylene glycol (used as thecalibrating reagent) was of reagent-grade quality, and was obtained from Sigma Aldrich Chemical (St. Louis,MO). Cocaine analyte standards were purchased from Cerilliant (Austin, TX) as hydrochloride salt solutions inmethanol (cocaine, anhydroecgonine methyl ester, cocaethylene, norcocaine) or acetonitrile (benzoylecgonine),all at 1 mg/mL.
AccuTOF-DARTTM Analyses: Analyses were performed at the RTI International’s Center for Forensic Sciencesusing a JEOL USA, Inc. (Peabody, MA) AccuTOF-DARTTM. The analyses were conducted using positive modesof the DART ion source. The source was operated with a ring lens voltage of 5 V, an orifice 1 voltage of 20 V,and an orifice 2 voltage of 5 V. Electrodes 1 and 2 of the DART source were set to 150 V and 350 V,respectively, while the DART temperature was set to 3000C. The detector was optimized at 2,200 V. TheAccuTOF-DARTTM was calibrated with polyethylene glycol prior to each sample run. The samples wereintroduced into the ion source by dipping a glass probe into the sample and passing this through the stream. When available, the mono-isotopic M+H values of the cocaine analytes were verified using certified drugstandard solutions.
Cocaine Signature Analyses by Gas Chromatography/Mass Spectrometry (GC/MS): Cocaine signature analyseswere conducted by gas chromatography/mass spectrometry, as reported by Casale et al. and briefly describedherein [7-11]. Analyses were performed using an Agilent (Palo Alto, CA) Model 5973 quadrupole mass-selectivedetector (MSD) interfaced with an Agilent Model 6890 gas chromatograph (GC). The MSD was operated in theelectron ionization (EI) mode with an ionization potential of 70 eV, a scan range of 34 - 700 mass units, and at1.34 scans/second. The GC was fitted with a 30 m x 0.25 mm I.D. fused-silica capillary column coated with0.25 :m DB-1 (J & W Scientific, Rancho Cordova, CA). The oven temperature was programmed as follows: Initial temperature, 1000C; no hold, program rate, 60C/min; final temperature, 3000C; final hold, 5.67 min. Theinjector was operated in the split mode (21.5:1) and at a temperature of 2800C. The auxiliary transfer line to theMSD was operated at 2800C.
Results and Discussion
Table 1 contains the theoretical M+H values of the target analytes that were detected in the cocaine exhibits bycocaine signature analyses. All values are reported to 0.001 mmu with the exception of petroleum ether (whichhas a very low mass and thus a larger expected mass error).
The results of the AccuTOF-DARTTM analysis of the 25 cocaine samples in comparison to the multi-techniquesignature analyses are in Table 2. Anhydroecgonine methyl ester (AEME) and cinnamoylcocaine were easilydetected in 23 out of the 25 samples, as shown in the AccuTOF-DARTTM spectra depicted in Figures 1A - B. Inall samples, there was an ion present at m/z = 290.139, which is the M+H value of C16H19NO4. This is themolecular formula of the isomeric pair benzoylecgonine (BE) and norcocaine, which have identical (and thereforeindistinguishable) masses. Figure 2 shows the presence of the ion at 290.169 in an analyzed sample. Thetheoretical value of BE and norcocaine is 290.139. Although the difference of 0.030 mmu is not optimal, it maybe due to an interferent present at a similar mass, resulting in a skewed m/z value. This is a problem that isfrequently encountered during TOF-DART analysis. For example, known analytes may be analyzed sequentiallyand subjected to the same calibration, but while one peak will generate an M+H value 1 or 2 mmu from its
Brought to you by AltGov2 [www.altgov2.org]
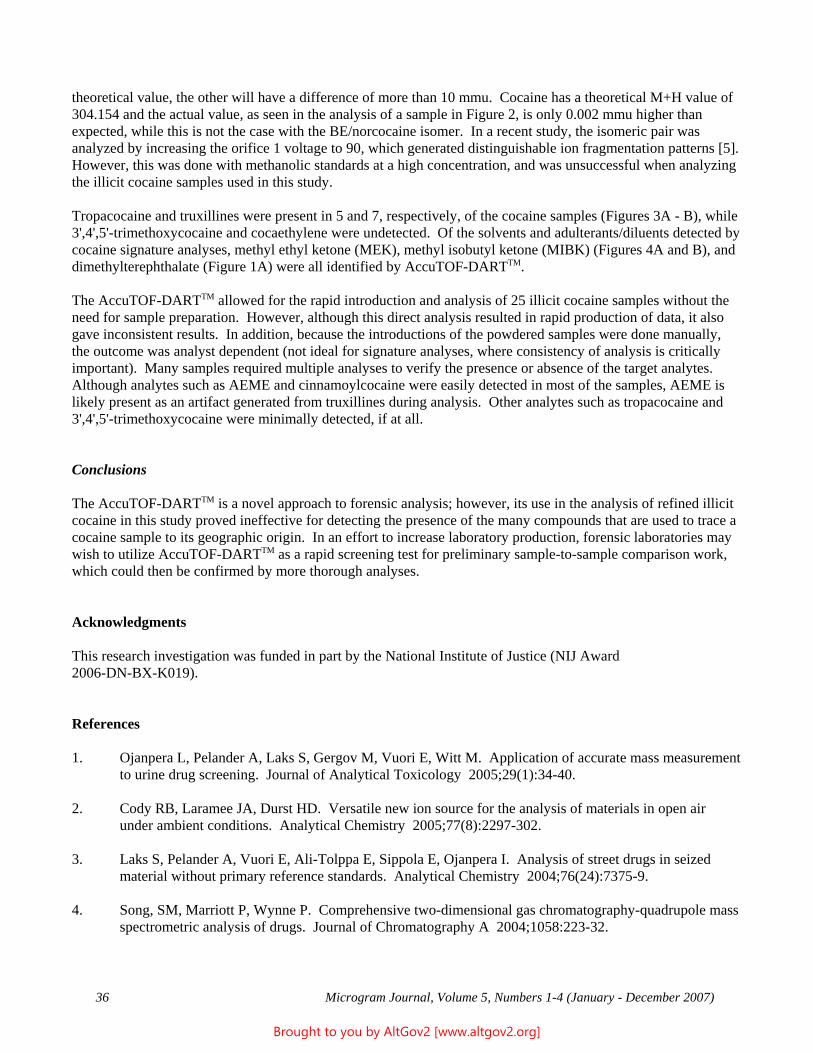
36 Microgram Journal, Volume 5, Numbers 1-4 (January - December 2007)
theoretical value, the other will have a difference of more than 10 mmu. Cocaine has a theoretical M+H value of304.154 and the actual value, as seen in the analysis of a sample in Figure 2, is only 0.002 mmu higher thanexpected, while this is not the case with the BE/norcocaine isomer. In a recent study, the isomeric pair wasanalyzed by increasing the orifice 1 voltage to 90, which generated distinguishable ion fragmentation patterns [5]. However, this was done with methanolic standards at a high concentration, and was unsuccessful when analyzingthe illicit cocaine samples used in this study.
Tropacocaine and truxillines were present in 5 and 7, respectively, of the cocaine samples (Figures 3A - B), while3',4',5'-trimethoxycocaine and cocaethylene were undetected. Of the solvents and adulterants/diluents detected bycocaine signature analyses, methyl ethyl ketone (MEK), methyl isobutyl ketone (MIBK) (Figures 4A and B), anddimethylterephthalate (Figure 1A) were all identified by AccuTOF-DARTTM.
The AccuTOF-DARTTM allowed for the rapid introduction and analysis of 25 illicit cocaine samples without theneed for sample preparation. However, although this direct analysis resulted in rapid production of data, it alsogave inconsistent results. In addition, because the introductions of the powdered samples were done manually,the outcome was analyst dependent (not ideal for signature analyses, where consistency of analysis is criticallyimportant). Many samples required multiple analyses to verify the presence or absence of the target analytes. Although analytes such as AEME and cinnamoylcocaine were easily detected in most of the samples, AEME islikely present as an artifact generated from truxillines during analysis. Other analytes such as tropacocaine and3',4',5'-trimethoxycocaine were minimally detected, if at all.
Conclusions
The AccuTOF-DARTTM is a novel approach to forensic analysis; however, its use in the analysis of refined illicitcocaine in this study proved ineffective for detecting the presence of the many compounds that are used to trace acocaine sample to its geographic origin. In an effort to increase laboratory production, forensic laboratories maywish to utilize AccuTOF-DARTTM as a rapid screening test for preliminary sample-to-sample comparison work,which could then be confirmed by more thorough analyses.
Acknowledgments
This research investigation was funded in part by the National Institute of Justice (NIJ Award2006-DN-BX-K019).
References
1. Ojanpera L, Pelander A, Laks S, Gergov M, Vuori E, Witt M. Application of accurate mass measurementto urine drug screening. Journal of Analytical Toxicology 2005;29(1):34-40.
2. Cody RB, Laramee JA, Durst HD. Versatile new ion source for the analysis of materials in open airunder ambient conditions. Analytical Chemistry 2005;77(8):2297-302.
3. Laks S, Pelander A, Vuori E, Ali-Tolppa E, Sippola E, Ojanpera I. Analysis of street drugs in seizedmaterial without primary reference standards. Analytical Chemistry 2004;76(24):7375-9.
4. Song, SM, Marriott P, Wynne P. Comprehensive two-dimensional gas chromatography-quadrupole massspectrometric analysis of drugs. Journal of Chromatography A 2004;1058:223-32.
Brought to you by AltGov2 [www.altgov2.org]
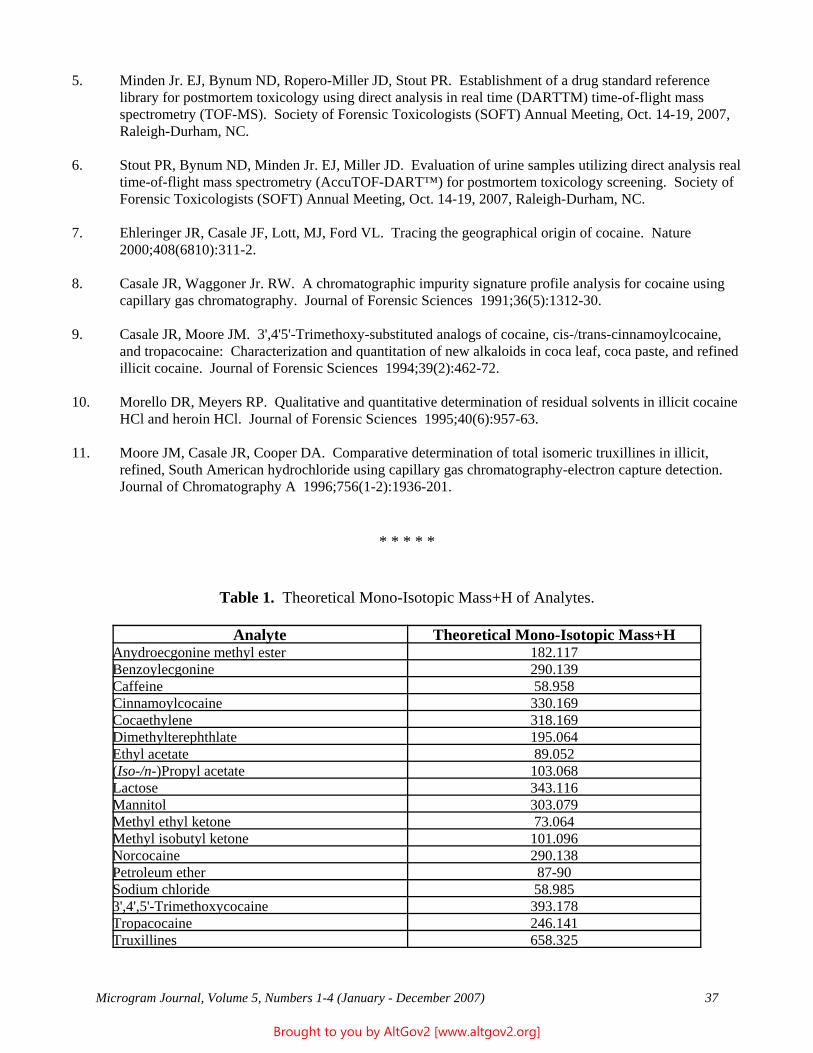
Microgram Journal, Volume 5, Numbers 1-4 (January - December 2007) 37
5. Minden Jr. EJ, Bynum ND, Ropero-Miller JD, Stout PR. Establishment of a drug standard referencelibrary for postmortem toxicology using direct analysis in real time (DARTTM) time-of-flight massspectrometry (TOF-MS). Society of Forensic Toxicologists (SOFT) Annual Meeting, Oct. 14-19, 2007,Raleigh-Durham, NC.
6. Stout PR, Bynum ND, Minden Jr. EJ, Miller JD. Evaluation of urine samples utilizing direct analysis realtime-of-flight mass spectrometry (AccuTOF-DART™) for postmortem toxicology screening. Society ofForensic Toxicologists (SOFT) Annual Meeting, Oct. 14-19, 2007, Raleigh-Durham, NC.
7. Ehleringer JR, Casale JF, Lott, MJ, Ford VL. Tracing the geographical origin of cocaine. Nature 2000;408(6810):311-2.
8. Casale JR, Waggoner Jr. RW. A chromatographic impurity signature profile analysis for cocaine using
capillary gas chromatography. Journal of Forensic Sciences 1991;36(5):1312-30.
9. Casale JR, Moore JM. 3',4'5'-Trimethoxy-substituted analogs of cocaine, cis-/trans-cinnamoylcocaine,and tropacocaine: Characterization and quantitation of new alkaloids in coca leaf, coca paste, and refinedillicit cocaine. Journal of Forensic Sciences 1994;39(2):462-72.
10. Morello DR, Meyers RP. Qualitative and quantitative determination of residual solvents in illicit cocaineHCl and heroin HCl. Journal of Forensic Sciences 1995;40(6):957-63.
11. Moore JM, Casale JR, Cooper DA. Comparative determination of total isomeric truxillines in illicit,refined, South American hydrochloride using capillary gas chromatography-electron capture detection. Journal of Chromatography A 1996;756(1-2):1936-201.
* * * * *
Table 1. Theoretical Mono-Isotopic Mass+H of Analytes.
Analyte Theoretical Mono-Isotopic Mass+HAnydroecgonine methyl ester 182.117Benzoylecgonine 290.139Caffeine 58.958Cinnamoylcocaine 330.169Cocaethylene 318.169Dimethylterephthlate 195.064Ethyl acetate 89.052(Iso-/n-)Propyl acetate 103.068Lactose 343.116Mannitol 303.079Methyl ethyl ketone 73.064Methyl isobutyl ketone 101.096Norcocaine 290.138Petroleum ether 87-90Sodium chloride 58.9853',4',5'-Trimethoxycocaine 393.178Tropacocaine 246.141Truxillines 658.325
Brought to you by AltGov2 [www.altgov2.org]
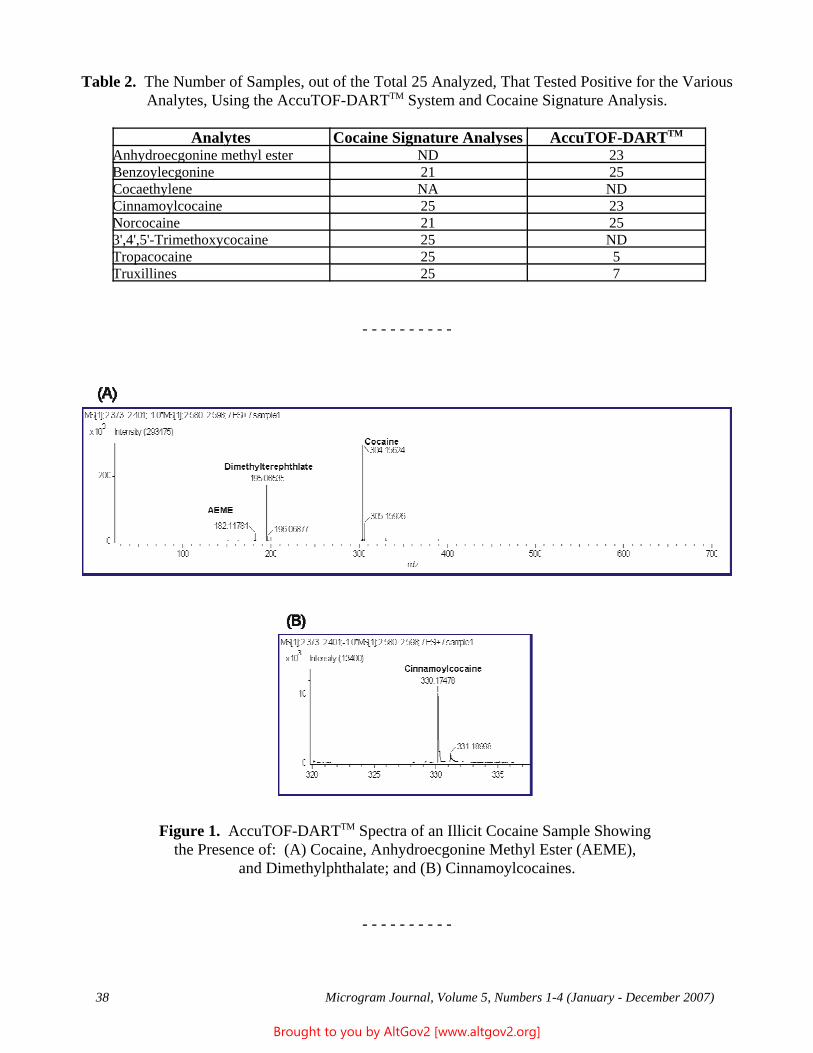
38 Microgram Journal, Volume 5, Numbers 1-4 (January - December 2007)
Table 2. The Number of Samples, out of the Total 25 Analyzed, That Tested Positive for the VariousAnalytes, Using the AccuTOF-DARTTM System and Cocaine Signature Analysis.
Analytes Cocaine Signature Analyses AccuTOF-DARTTM
Anhydroecgonine methyl ester ND 23Benzoylecgonine 21 25Cocaethylene NA NDCinnamoylcocaine 25 23Norcocaine 21 253',4',5'-Trimethoxycocaine 25 NDTropacocaine 25 5Truxillines 25 7
- - - - - - - - - -
Figure 1. AccuTOF-DARTTM Spectra of an Illicit Cocaine Sample Showing the Presence of: (A) Cocaine, Anhydroecgonine Methyl Ester (AEME),
and Dimethylphthalate; and (B) Cinnamoylcocaines.
- - - - - - - - - -
Brought to you by AltGov2 [www.altgov2.org]
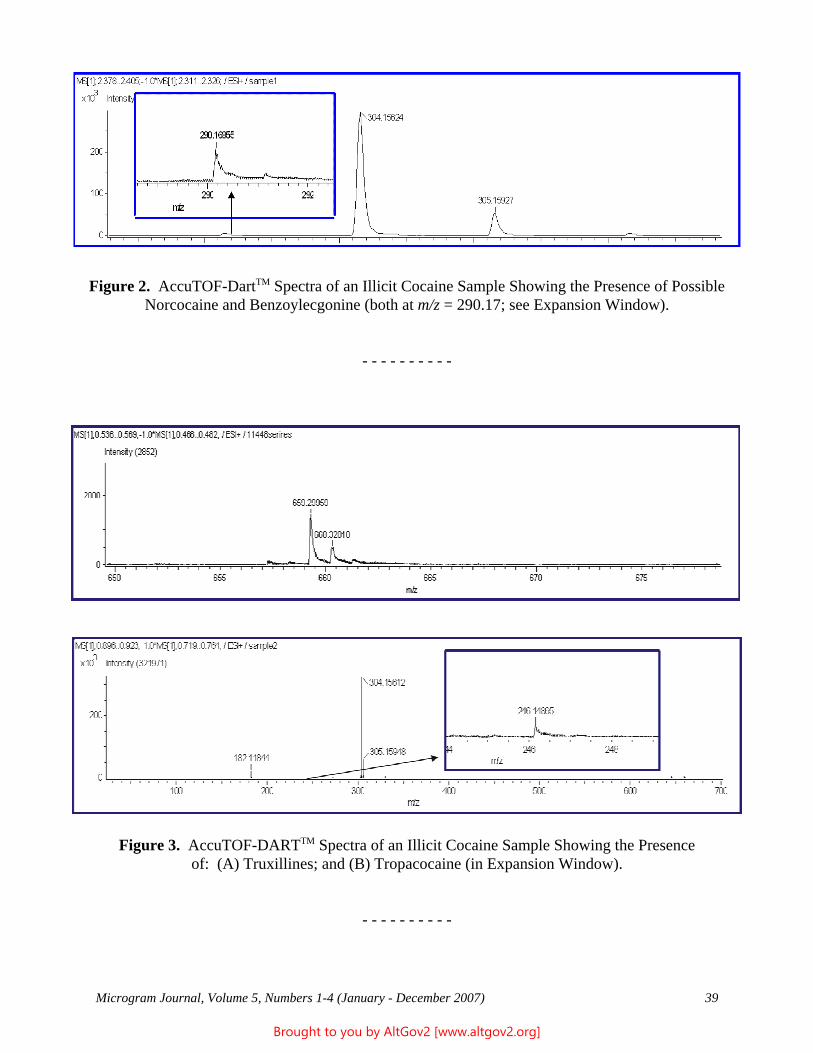
Microgram Journal, Volume 5, Numbers 1-4 (January - December 2007) 39
Figure 2. AccuTOF-DartTM Spectra of an Illicit Cocaine Sample Showing the Presence of PossibleNorcocaine and Benzoylecgonine (both at m/z = 290.17; see Expansion Window).
- - - - - - - - - -
Figure 3. AccuTOF-DARTTM Spectra of an Illicit Cocaine Sample Showing the Presenceof: (A) Truxillines; and (B) Tropacocaine (in Expansion Window).
- - - - - - - - - -
Brought to you by AltGov2 [www.altgov2.org]
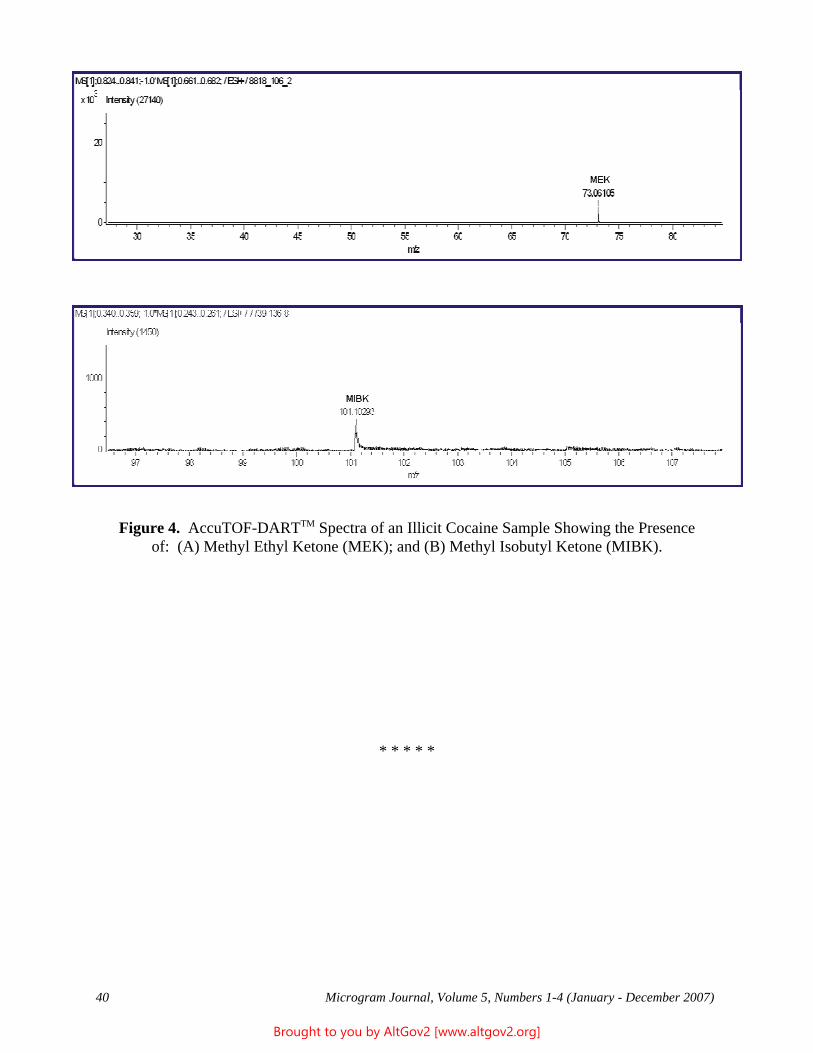
40 Microgram Journal, Volume 5, Numbers 1-4 (January - December 2007)
Figure 4. AccuTOF-DARTTM Spectra of an Illicit Cocaine Sample Showing the Presenceof: (A) Methyl Ethyl Ketone (MEK); and (B) Methyl Isobutyl Ketone (MIBK).
* * * * *
Brought to you by AltGov2 [www.altgov2.org]
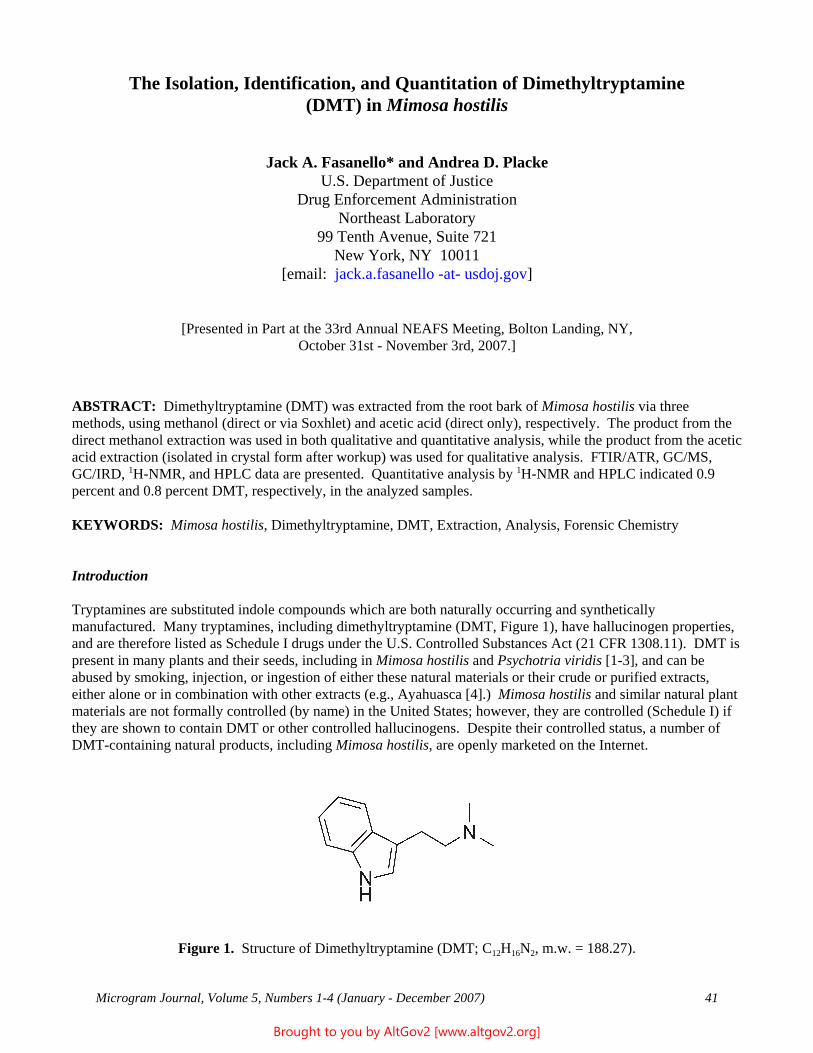
Microgram Journal, Volume 5, Numbers 1-4 (January - December 2007) 41
The Isolation, Identification, and Quantitation of Dimethyltryptamine(DMT) in Mimosa hostilis
Jack A. Fasanello* and Andrea D. PlackeU.S. Department of Justice
Drug Enforcement AdministrationNortheast Laboratory
99 Tenth Avenue, Suite 721New York, NY 10011
[email: jack.a.fasanello -at- usdoj.gov]
[Presented in Part at the 33rd Annual NEAFS Meeting, Bolton Landing, NY,October 31st - November 3rd, 2007.]
ABSTRACT: Dimethyltryptamine (DMT) was extracted from the root bark of Mimosa hostilis via threemethods, using methanol (direct or via Soxhlet) and acetic acid (direct only), respectively. The product from thedirect methanol extraction was used in both qualitative and quantitative analysis, while the product from the aceticacid extraction (isolated in crystal form after workup) was used for qualitative analysis. FTIR/ATR, GC/MS,GC/IRD, 1H-NMR, and HPLC data are presented. Quantitative analysis by 1H-NMR and HPLC indicated 0.9percent and 0.8 percent DMT, respectively, in the analyzed samples.
KEYWORDS: Mimosa hostilis, Dimethyltryptamine, DMT, Extraction, Analysis, Forensic Chemistry
Introduction
Tryptamines are substituted indole compounds which are both naturally occurring and syntheticallymanufactured. Many tryptamines, including dimethyltryptamine (DMT, Figure 1), have hallucinogen properties,and are therefore listed as Schedule I drugs under the U.S. Controlled Substances Act (21 CFR 1308.11). DMT ispresent in many plants and their seeds, including in Mimosa hostilis and Psychotria viridis [1-3], and can beabused by smoking, injection, or ingestion of either these natural materials or their crude or purified extracts,either alone or in combination with other extracts (e.g., Ayahuasca [4].) Mimosa hostilis and similar natural plantmaterials are not formally controlled (by name) in the United States; however, they are controlled (Schedule I) ifthey are shown to contain DMT or other controlled hallucinogens. Despite their controlled status, a number ofDMT-containing natural products, including Mimosa hostilis, are openly marketed on the Internet.
Figure 1. Structure of Dimethyltryptamine (DMT; C12H16N2, m.w. = 188.27).
Brought to you by AltGov2 [www.altgov2.org]
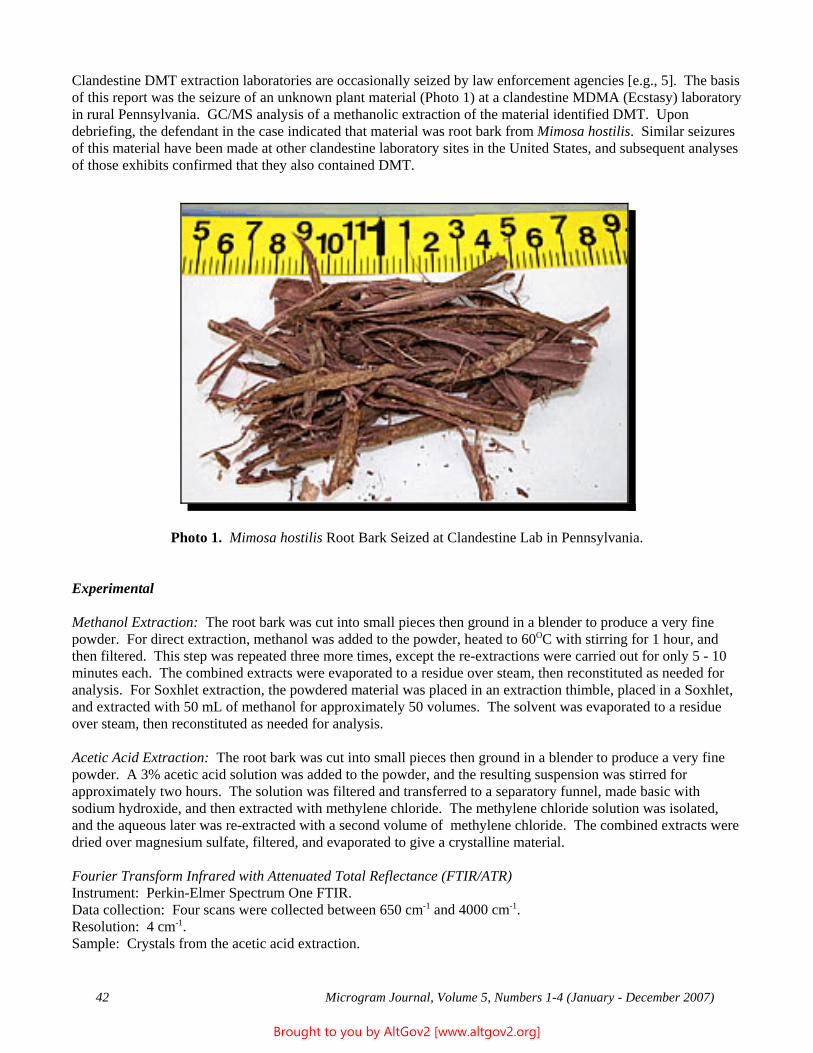
42 Microgram Journal, Volume 5, Numbers 1-4 (January - December 2007)
Clandestine DMT extraction laboratories are occasionally seized by law enforcement agencies [e.g., 5]. The basisof this report was the seizure of an unknown plant material (Photo 1) at a clandestine MDMA (Ecstasy) laboratoryin rural Pennsylvania. GC/MS analysis of a methanolic extraction of the material identified DMT. Upondebriefing, the defendant in the case indicated that material was root bark from Mimosa hostilis. Similar seizuresof this material have been made at other clandestine laboratory sites in the United States, and subsequent analysesof those exhibits confirmed that they also contained DMT.
Photo 1. Mimosa hostilis Root Bark Seized at Clandestine Lab in Pennsylvania.
Experimental
Methanol Extraction: The root bark was cut into small pieces then ground in a blender to produce a very finepowder. For direct extraction, methanol was added to the powder, heated to 60OC with stirring for 1 hour, andthen filtered. This step was repeated three more times, except the re-extractions were carried out for only 5 - 10minutes each. The combined extracts were evaporated to a residue over steam, then reconstituted as needed foranalysis. For Soxhlet extraction, the powdered material was placed in an extraction thimble, placed in a Soxhlet,and extracted with 50 mL of methanol for approximately 50 volumes. The solvent was evaporated to a residueover steam, then reconstituted as needed for analysis.
Acetic Acid Extraction: The root bark was cut into small pieces then ground in a blender to produce a very finepowder. A 3% acetic acid solution was added to the powder, and the resulting suspension was stirred forapproximately two hours. The solution was filtered and transferred to a separatory funnel, made basic withsodium hydroxide, and then extracted with methylene chloride. The methylene chloride solution was isolated,and the aqueous later was re-extracted with a second volume of methylene chloride. The combined extracts weredried over magnesium sulfate, filtered, and evaporated to give a crystalline material.
Fourier Transform Infrared with Attenuated Total Reflectance (FTIR/ATR)Instrument: Perkin-Elmer Spectrum One FTIR.Data collection: Four scans were collected between 650 cm-1 and 4000 cm-1.Resolution: 4 cm-1.Sample: Crystals from the acetic acid extraction.
Brought to you by AltGov2 [www.altgov2.org]
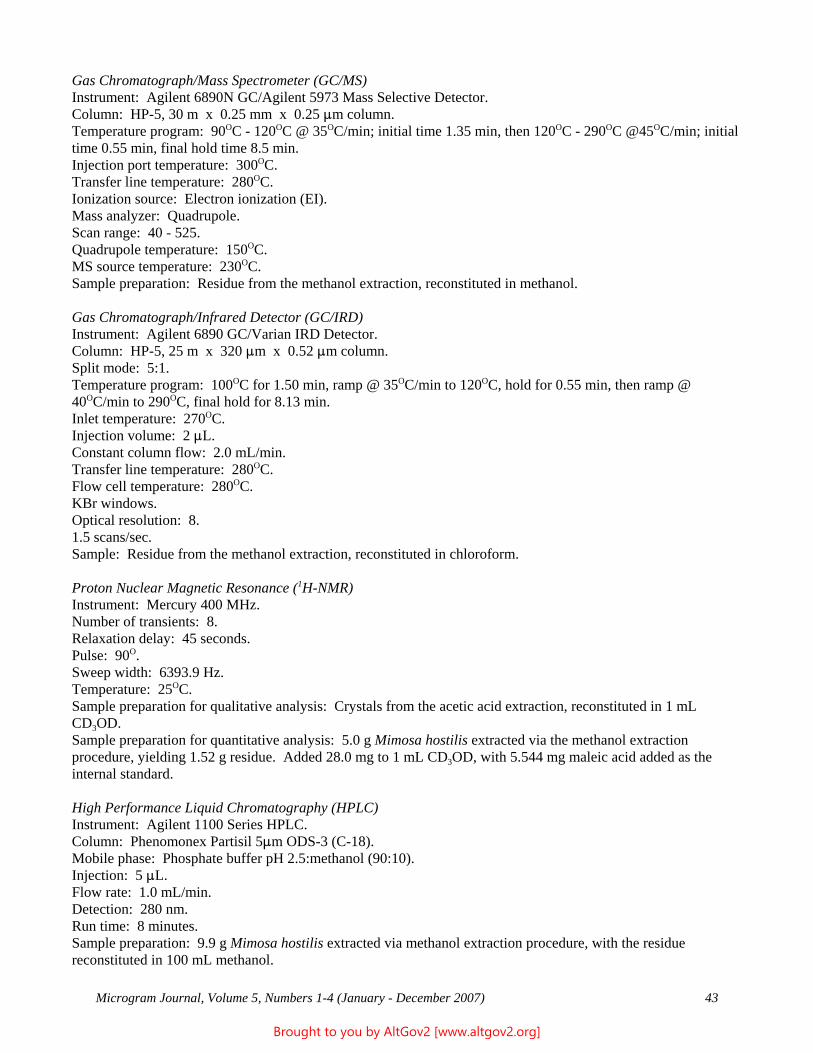
Microgram Journal, Volume 5, Numbers 1-4 (January - December 2007) 43
Gas Chromatograph/Mass Spectrometer (GC/MS)Instrument: Agilent 6890N GC/Agilent 5973 Mass Selective Detector.Column: HP-5, 30 m x 0.25 mm x 0.25 :m column.Temperature program: 90OC - 120OC @ 35OC/min; initial time 1.35 min, then 120OC - 290OC @45OC/min; initialtime 0.55 min, final hold time 8.5 min.Injection port temperature: 300OC.Transfer line temperature: 280OC.Ionization source: Electron ionization (EI).Mass analyzer: Quadrupole.Scan range: 40 - 525.Quadrupole temperature: 150OC.MS source temperature: 230OC.Sample preparation: Residue from the methanol extraction, reconstituted in methanol.
Gas Chromatograph/Infrared Detector (GC/IRD)Instrument: Agilent 6890 GC/Varian IRD Detector.Column: HP-5, 25 m x 320 :m x 0.52 :m column.Split mode: 5:1.Temperature program: 100OC for 1.50 min, ramp @ 35OC/min to 120OC, hold for 0.55 min, then ramp @40OC/min to 290OC, final hold for 8.13 min.Inlet temperature: 270OC.Injection volume: 2 :L.Constant column flow: 2.0 mL/min.Transfer line temperature: 280OC.Flow cell temperature: 280OC.KBr windows.Optical resolution: 8.1.5 scans/sec.Sample: Residue from the methanol extraction, reconstituted in chloroform.
Proton Nuclear Magnetic Resonance (1H-NMR)Instrument: Mercury 400 MHz.Number of transients: 8.Relaxation delay: 45 seconds.Pulse: 90O.Sweep width: 6393.9 Hz.Temperature: 25OC.Sample preparation for qualitative analysis: Crystals from the acetic acid extraction, reconstituted in 1 mLCD3OD.Sample preparation for quantitative analysis: 5.0 g Mimosa hostilis extracted via the methanol extractionprocedure, yielding 1.52 g residue. Added 28.0 mg to 1 mL CD3OD, with 5.544 mg maleic acid added as theinternal standard.
High Performance Liquid Chromatography (HPLC)Instrument: Agilent 1100 Series HPLC.Column: Phenomonex Partisil 5:m ODS-3 (C-18).Mobile phase: Phosphate buffer pH 2.5:methanol (90:10).Injection: 5 :L.Flow rate: 1.0 mL/min.Detection: 280 nm.Run time: 8 minutes.Sample preparation: 9.9 g Mimosa hostilis extracted via methanol extraction procedure, with the residuereconstituted in 100 mL methanol.
Brought to you by AltGov2 [www.altgov2.org]
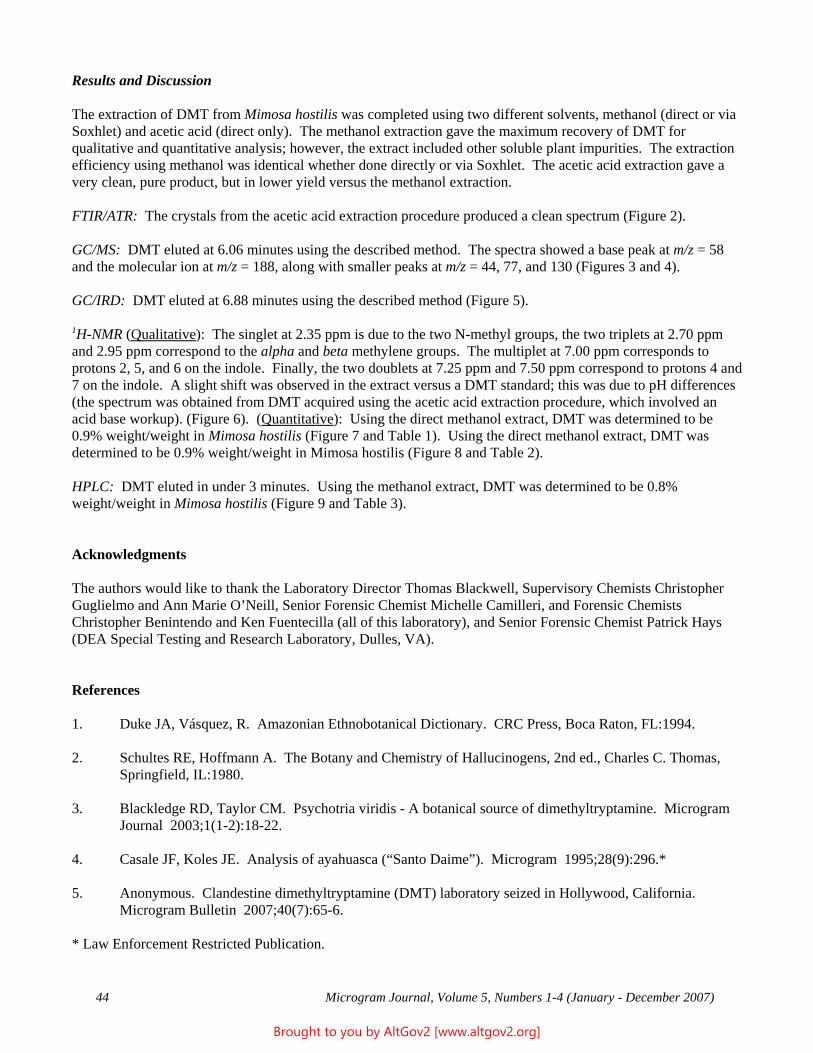
44 Microgram Journal, Volume 5, Numbers 1-4 (January - December 2007)
Results and Discussion
The extraction of DMT from Mimosa hostilis was completed using two different solvents, methanol (direct or viaSoxhlet) and acetic acid (direct only). The methanol extraction gave the maximum recovery of DMT forqualitative and quantitative analysis; however, the extract included other soluble plant impurities. The extractionefficiency using methanol was identical whether done directly or via Soxhlet. The acetic acid extraction gave avery clean, pure product, but in lower yield versus the methanol extraction.
FTIR/ATR: The crystals from the acetic acid extraction procedure produced a clean spectrum (Figure 2).
GC/MS: DMT eluted at 6.06 minutes using the described method. The spectra showed a base peak at m/z = 58and the molecular ion at m/z = 188, along with smaller peaks at m/z = 44, 77, and 130 (Figures 3 and 4).
GC/IRD: DMT eluted at 6.88 minutes using the described method (Figure 5).
1H-NMR (Qualitative): The singlet at 2.35 ppm is due to the two N-methyl groups, the two triplets at 2.70 ppmand 2.95 ppm correspond to the alpha and beta methylene groups. The multiplet at 7.00 ppm corresponds toprotons 2, 5, and 6 on the indole. Finally, the two doublets at 7.25 ppm and 7.50 ppm correspond to protons 4 and7 on the indole. A slight shift was observed in the extract versus a DMT standard; this was due to pH differences(the spectrum was obtained from DMT acquired using the acetic acid extraction procedure, which involved anacid base workup). (Figure 6). (Quantitative): Using the direct methanol extract, DMT was determined to be0.9% weight/weight in Mimosa hostilis (Figure 7 and Table 1). Using the direct methanol extract, DMT wasdetermined to be 0.9% weight/weight in Mimosa hostilis (Figure 8 and Table 2).
HPLC: DMT eluted in under 3 minutes. Using the methanol extract, DMT was determined to be 0.8%weight/weight in Mimosa hostilis (Figure 9 and Table 3).
Acknowledgments
The authors would like to thank the Laboratory Director Thomas Blackwell, Supervisory Chemists ChristopherGuglielmo and Ann Marie O’Neill, Senior Forensic Chemist Michelle Camilleri, and Forensic ChemistsChristopher Benintendo and Ken Fuentecilla (all of this laboratory), and Senior Forensic Chemist Patrick Hays(DEA Special Testing and Research Laboratory, Dulles, VA).
References
1. Duke JA, Vásquez, R. Amazonian Ethnobotanical Dictionary. CRC Press, Boca Raton, FL:1994.
2. Schultes RE, Hoffmann A. The Botany and Chemistry of Hallucinogens, 2nd ed., Charles C. Thomas,Springfield, IL:1980.
3. Blackledge RD, Taylor CM. Psychotria viridis - A botanical source of dimethyltryptamine. MicrogramJournal 2003;1(1-2):18-22.
4. Casale JF, Koles JE. Analysis of ayahuasca (“Santo Daime”). Microgram 1995;28(9):296.*
5. Anonymous. Clandestine dimethyltryptamine (DMT) laboratory seized in Hollywood, California. Microgram Bulletin 2007;40(7):65-6.
* Law Enforcement Restricted Publication.
Brought to you by AltGov2 [www.altgov2.org]
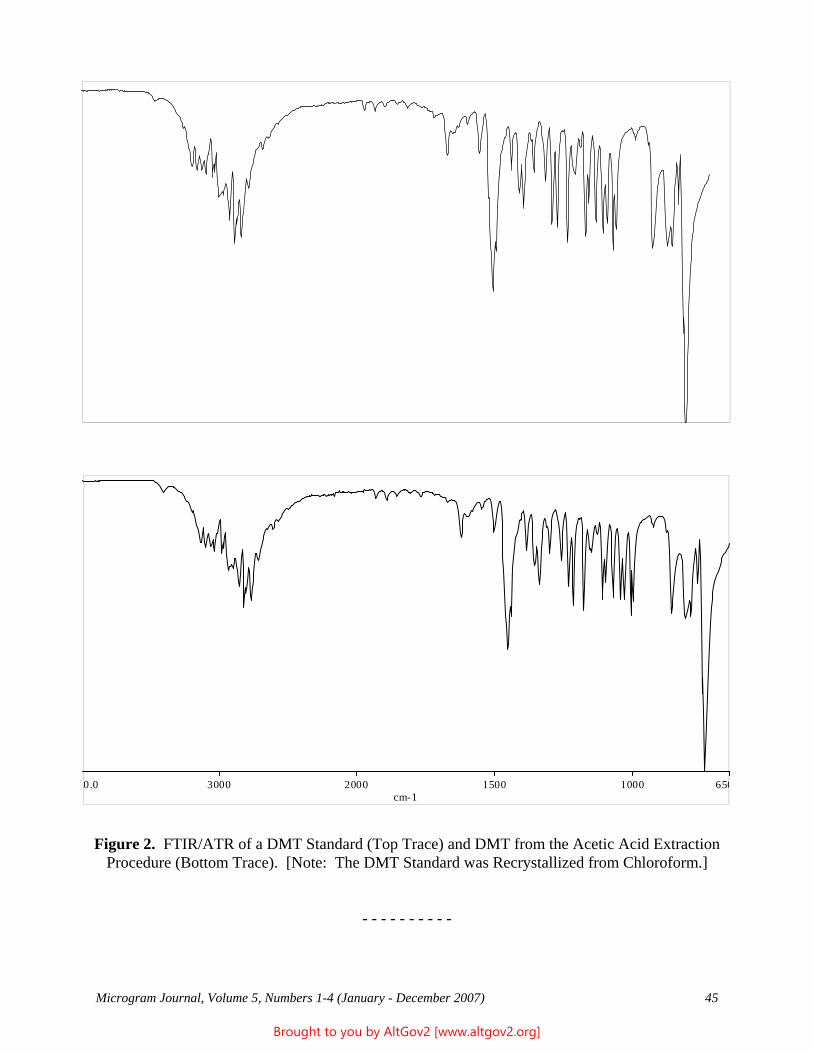
Microgram Journal, Volume 5, Numbers 1-4 (January - December 2007) 45
Figure 2. FTIR/ATR of a DMT Standard (Top Trace) and DMT from the Acetic Acid ExtractionProcedure (Bottom Trace). [Note: The DMT Standard was Recrystallized from Chloroform.]
- - - - - - - - - -
0.0 3000 2000 1500 1000 650cm-1
Brought to you by AltGov2 [www.altgov2.org]
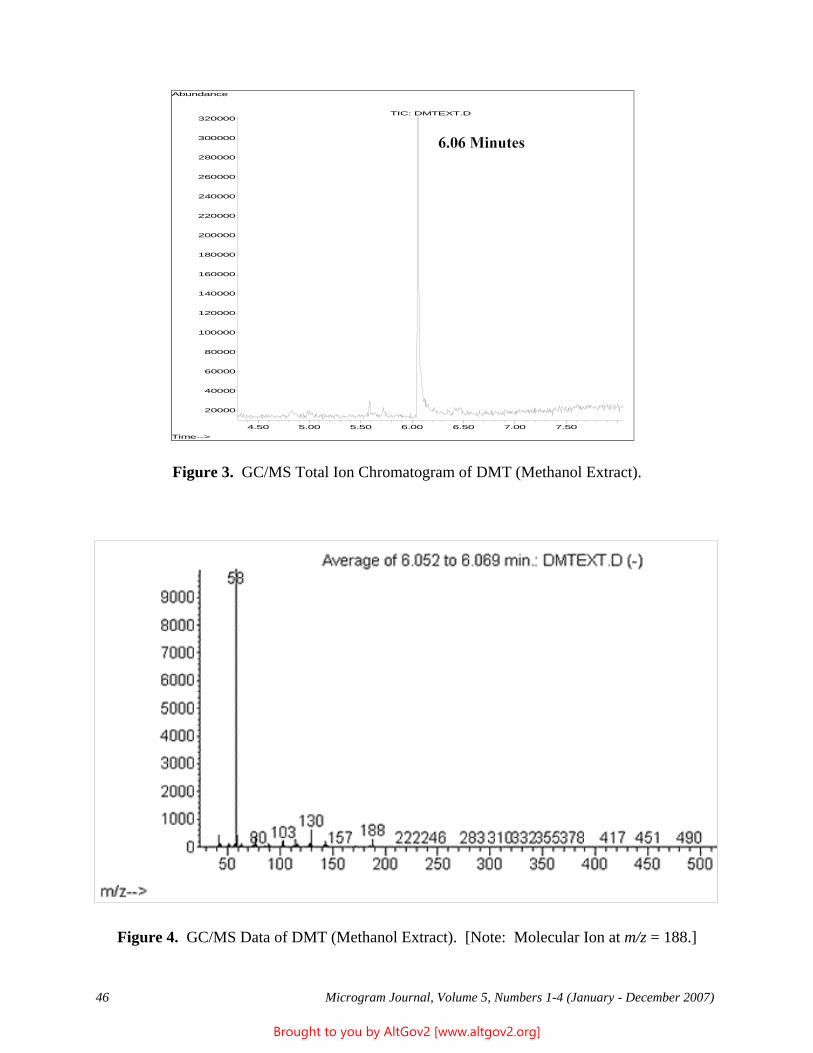
46 Microgram Journal, Volume 5, Numbers 1-4 (January - December 2007)
Figure 3. GC/MS Total Ion Chromatogram of DMT (Methanol Extract).
Figure 4. GC/MS Data of DMT (Methanol Extract). [Note: Molecular Ion at m/z = 188.]
4.50 5.00 5.50 6.00 6.50 7.00 7.50
20000
40000
60000
80000
100000
120000
140000
160000
180000
200000
220000
240000
260000
280000
300000
320000
Time-->
Abundance
TIC: DMTEXT.D
Brought to you by AltGov2 [www.altgov2.org]
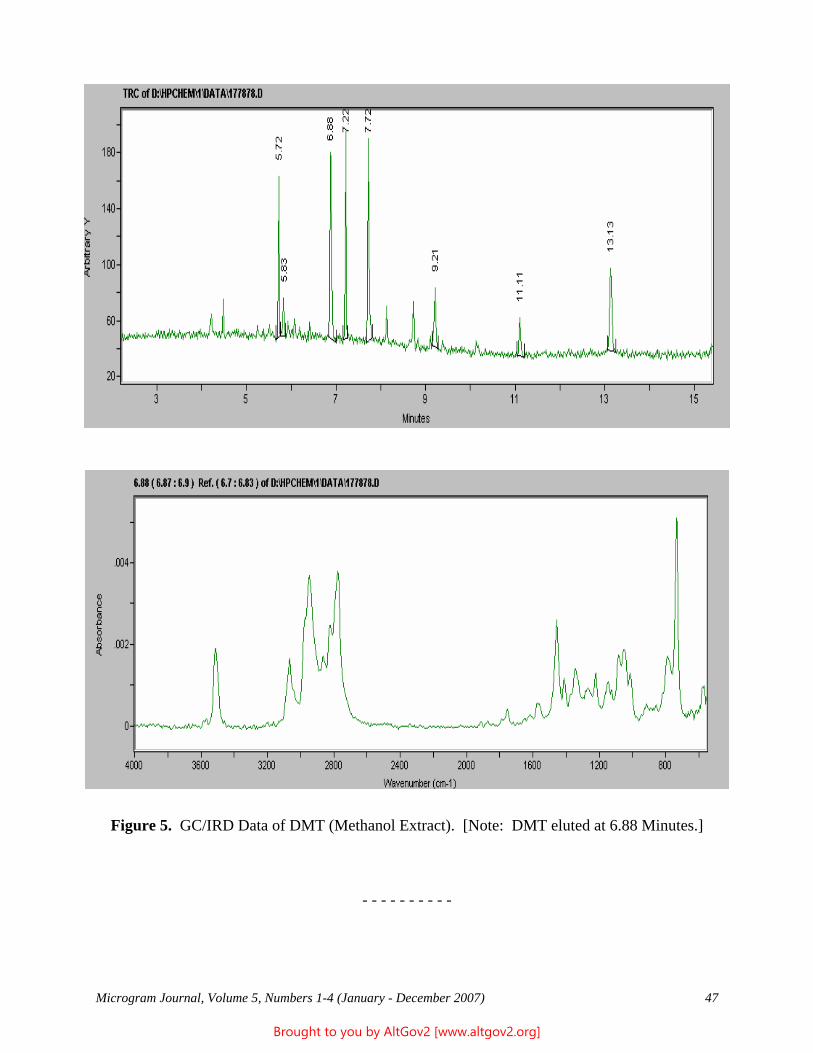
Microgram Journal, Volume 5, Numbers 1-4 (January - December 2007) 47
Figure 5. GC/IRD Data of DMT (Methanol Extract). [Note: DMT eluted at 6.88 Minutes.]
- - - - - - - - - -
Brought to you by AltGov2 [www.altgov2.org]
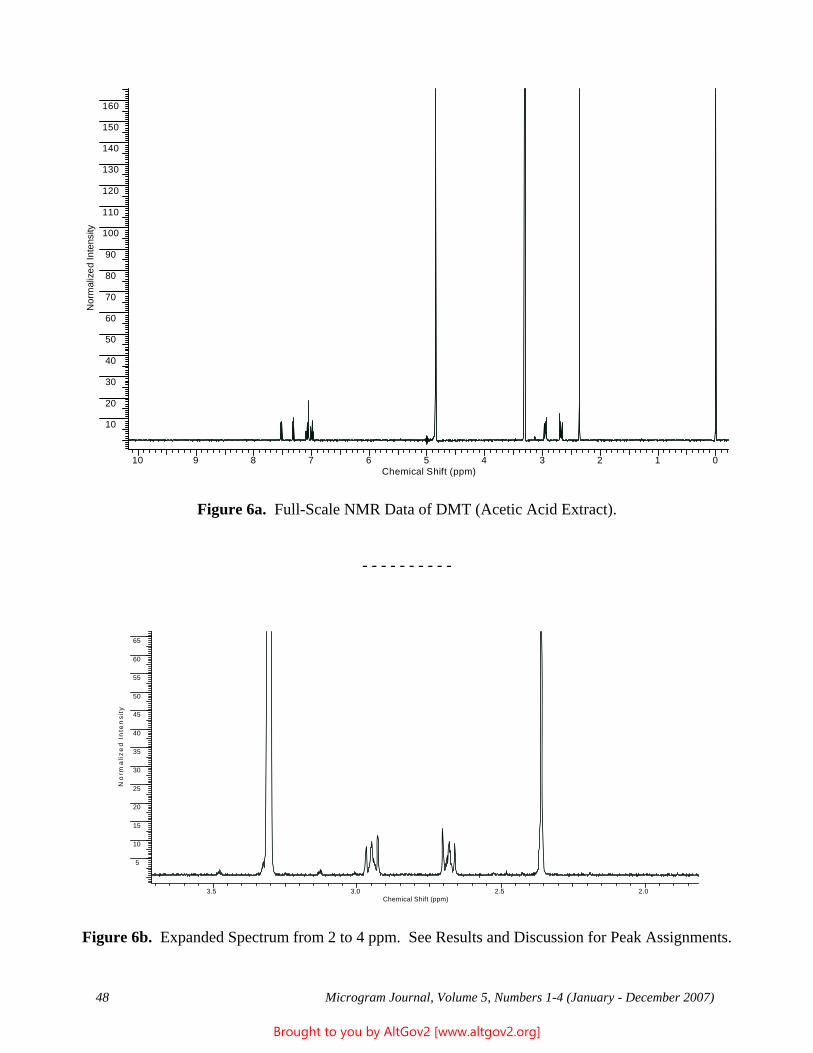
48 Microgram Journal, Volume 5, Numbers 1-4 (January - December 2007)
Figure 6a. Full-Scale NMR Data of DMT (Acetic Acid Extract).
- - - - - - - - - -
Figure 6b. Expanded Spectrum from 2 to 4 ppm. See Results and Discussion for Peak Assignments.
10 9 8 7 6 5 4 3 2 1 0Chemical Shift (ppm)
10
20
30
40
50
60
70
80
90
100
110
120
130
140
150
160
Nor
mal
ized
Inte
nsity
3.5 3.0 2.5 2.0Chemical Shift (ppm)
5
10
15
20
25
30
35
40
45
50
55
60
65
No
rma
lize
d I
nte
nsi
ty
Brought to you by AltGov2 [www.altgov2.org]
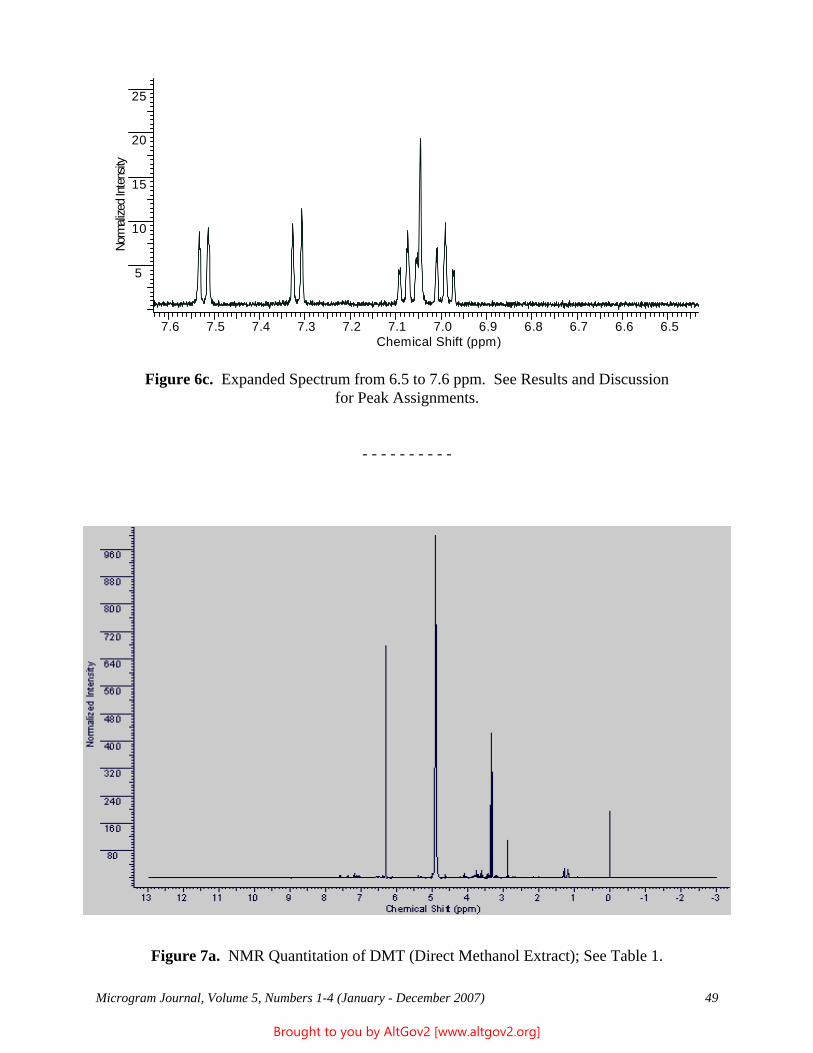
Microgram Journal, Volume 5, Numbers 1-4 (January - December 2007) 49
Figure 6c. Expanded Spectrum from 6.5 to 7.6 ppm. See Results and Discussionfor Peak Assignments.
- - - - - - - - - -
Figure 7a. NMR Quantitation of DMT (Direct Methanol Extract); See Table 1.
7.6 7.5 7.4 7.3 7.2 7.1 7.0 6.9 6.8 6.7 6.6 6.5Chemical Shift (ppm)
5
10
15
20
25
Norm
alize
d Int
ensit
y
Brought to you by AltGov2 [www.altgov2.org]
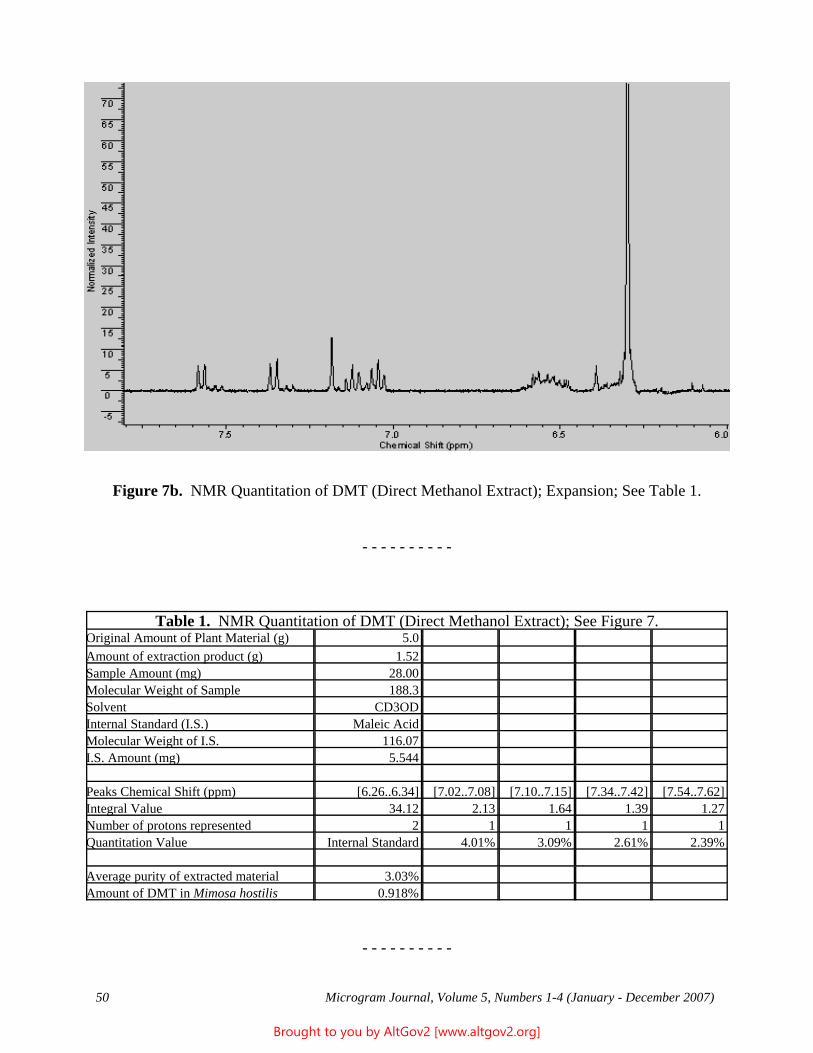
50 Microgram Journal, Volume 5, Numbers 1-4 (January - December 2007)
Figure 7b. NMR Quantitation of DMT (Direct Methanol Extract); Expansion; See Table 1.
- - - - - - - - - -
Table 1. NMR Quantitation of DMT (Direct Methanol Extract); See Figure 7.Original Amount of Plant Material (g) 5.0 Amount of extraction product (g) 1.52 Sample Amount (mg) 28.00 Molecular Weight of Sample 188.3 Solvent CD3OD Internal Standard (I.S.) Maleic Acid Molecular Weight of I.S. 116.07 I.S. Amount (mg) 5.544 Peaks Chemical Shift (ppm) [6.26..6.34] [7.02..7.08] [7.10..7.15] [7.34..7.42] [7.54..7.62] Integral Value 34.12 2.13 1.64 1.39 1.27 Number of protons represented 2 1 1 1 1 Quantitation Value Internal Standard 4.01% 3.09% 2.61% 2.39% Average purity of extracted material 3.03% Amount of DMT in Mimosa hostilis 0.918%
- - - - - - - - - -
Brought to you by AltGov2 [www.altgov2.org]
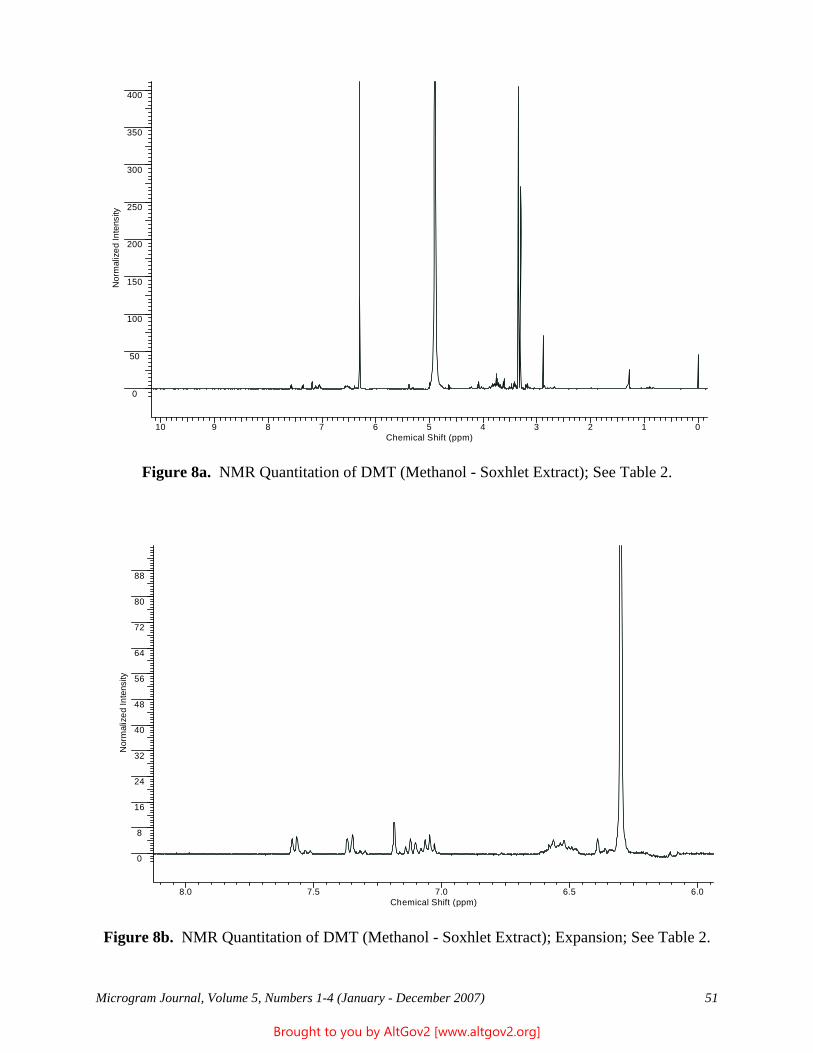
Microgram Journal, Volume 5, Numbers 1-4 (January - December 2007) 51
Figure 8a. NMR Quantitation of DMT (Methanol - Soxhlet Extract); See Table 2.
Figure 8b. NMR Quantitation of DMT (Methanol - Soxhlet Extract); Expansion; See Table 2.
10 9 8 7 6 5 4 3 2 1 0Chemical Shift (ppm)
0
50
100
150
200
250
300
350
400
Nor
mal
ized
Inte
nsity
8.0 7.5 7.0 6.5 6.0Chemical Shift (ppm)
0
8
16
24
32
40
48
56
64
72
80
88
Nor
mal
ized
Inte
nsity
Brought to you by AltGov2 [www.altgov2.org]
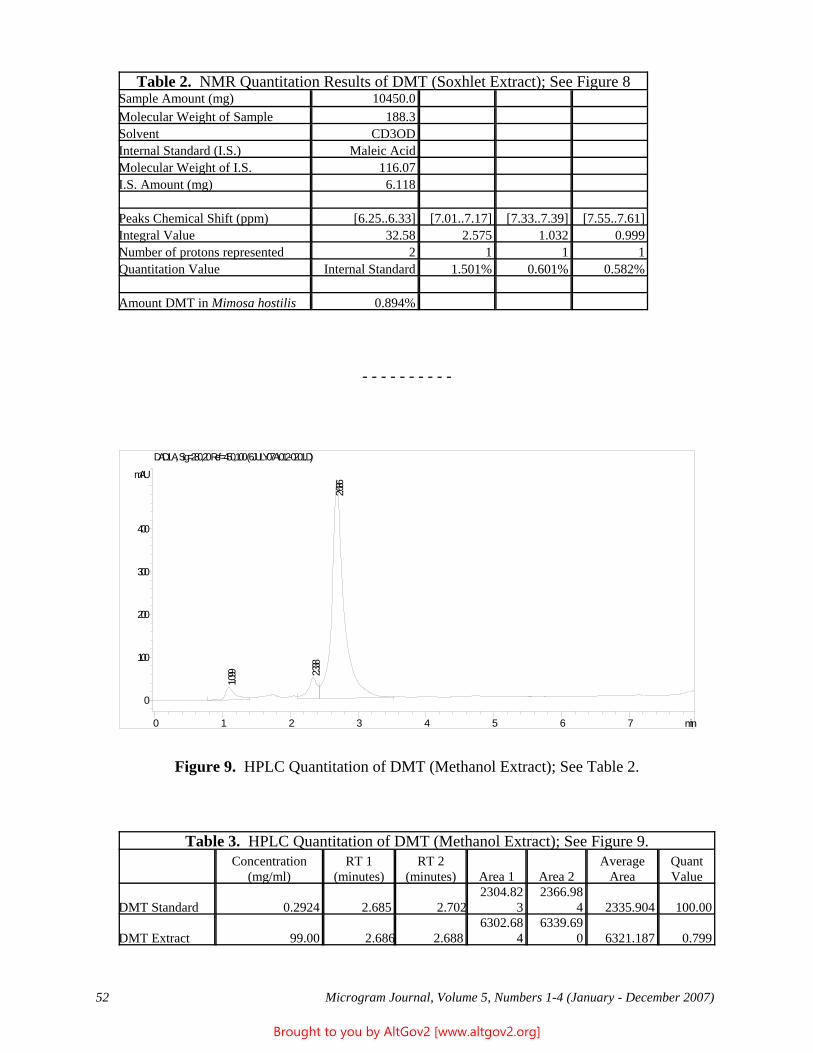
52 Microgram Journal, Volume 5, Numbers 1-4 (January - December 2007)
Table 2. NMR Quantitation Results of DMT (Soxhlet Extract); See Figure 8Sample Amount (mg) 10450.0 Molecular Weight of Sample 188.3 Solvent CD3OD Internal Standard (I.S.) Maleic Acid Molecular Weight of I.S. 116.07 I.S. Amount (mg) 6.118 Peaks Chemical Shift (ppm) [6.25..6.33] [7.01..7.17] [7.33..7.39] [7.55..7.61] Integral Value 32.58 2.575 1.032 0.999 Number of protons represented 2 1 1 1 Quantitation Value Internal Standard 1.501% 0.601% 0.582% Amount DMT in Mimosa hostilis 0.894%
- - - - - - - - - -
Figure 9. HPLC Quantitation of DMT (Methanol Extract); See Table 2.
Table 3. HPLC Quantitation of DMT (Methanol Extract); See Figure 9.
Concentration
(mg/ml)RT 1
(minutes)RT 2
(minutes) Area 1 Area 2Average
AreaQuantValue
DMT Standard 0.2924 2.685 2.7022304.82
3 2366.98
4 2335.904 100.00
DMT Extract 99.00 2.686 2.688 6302.68
4 6339.69
0 6321.187 0.799
min0 1 2 3 4 5 6 7
mAU
0
100
200
300
400
DAD1 A, Sig=280,20 Ref=450,100 (6JULY07A\012-0201.D)
1.099 2.3
38
2.686
Brought to you by AltGov2 [www.altgov2.org]
Microgram Journal, Volume 5, Numbers 1-4 (January - December 2007) 53
Five Year Index (by Author)
Allred RA. Spectral characterization of 2,4-dimethoxy-3-methylphenethylamine and comparison to 2,5-dimethoxy-4-methylphenethylamine (“2C-D”). Microgram Journal 2005;3(1-2):16-26.
Azoury M, Zelkowicz A, Goren Z, Almog J. Evaluation of ninhydrin analogues and other electron-deficientcompounds as spray reagents for drugs on thin layer chromatograms. Microgram Journal 2003;1(1-2):23-31.
Bianchi RP, Shah MN, Rogers DH, Mrazik TJ. Laboratory analysis of the conversion of pseudoephedrine tomethamphetamine from over-the-counter products. Microgram Journal 2005;3(1-2):11-5.
Blackledge RD. The identification of 1-dehydromethandrostenolone. Microgram Journal 2005;3(3-4):186-9.
Blackledge RD, Phelan CP. Identification of bufotenine in yopo seeds via GC/IRD. Microgram Journal 2006;4(1-4):3-11.
Blackledge RD, Taylor CM. Psychotria viridis – A botanical source of dimethyltryptamine (DMT). MicrogramJournal 2003;1(1-2):18-22.
Bono JP. Report of the Scientific Working Group for the Analysis of Seized Drugs (SWGDRUG) Conference(Montreal). Microgram Journal 2003;1(3-4):208-36.
Casale JF. Assessment of the volatility (smokeability) of cocaine base containing 50 percent mannitol: Is it asmokeable form of “crack” cocaine? Microgram Journal 2005;3(3-4):130-3.
Casale JF, Hays PA, Spratley TK, Smith PR. The characterization of 4-methoxy-N-ethylamphetaminehydrochloride. Microgram Journal 2006;4(1-4):42-5.
Casale JF, McKibben TD, Bozenko JS, Hays PA. Characterization of the “Indanylamphetamines.” MicrogramJournal 2005;3(1-2):3-10.
Casale JF, Piñero EL, Corbeil EM. Isolation of cis-cinnamoylcocaine from crude illicit cocaine via aluminacolumn chromatography. Microgram Journal 2006;4(1-4):37-41.
Chan KB, Chong YK, Nazarudin M. The identification of N,N-dimethylamphetamine (DMA) in an exhibit inMalaysia. Microgram Journal 2003;1(3-4):163-8.
Chong YK, Kaprawi MM, Chan KB. The quantitation of nimetazepam in Erimin-5 tablets and powders byreverse-phase HPLC. Microgram Journal 2004;2(1-4):27-33.
Coyle HM, Palmbach T, Juliano N, Ladd C, Lee HC. An overview of DNA methods for the identification andindividualization of marijuana. Microgram Journal 2003;1(3-4):196-207.
Dal Cason TA. Synthesis and identification of N,N-dimethylcathinone hydrochloride. Microgram Journal 2007;5(1-4):3-12.
Deakin AL. A study of acids used for the acidified cobalt thiocyanate test for cocaine base. Microgram Journal 2003;1(1-2):40-3.
DeFrancesco JV. gamma-Hydroxybutyrate, silver salt (AgGHB): Identification of gamma-hydroxybutyrate(GHB) via conversion to the silver salt. Microgram Journal 2005;3(1-2):46-53.
Brought to you by AltGov2 [www.altgov2.org]
54 Microgram Journal, Volume 5, Numbers 1-4 (January - December 2007)
DiPari SC, Bordelon JA, Skinner HF. Desloratadine: The reaction byproduct of the reduction of cold tabletscontaining Loratadine with hydriodic acid/red phosphorus. Microgram Journal 2005;3(1-2):69-77.
Edwards NR. Qualitative and quantitative analysis of Ionamin 30 capsules (containing a time-release formulationof phentermine). Microgram Journal 2006;4(1-4):66-9.
Fasanello JA, Placke AD. The isolation, identification, and quantitation of dimethyltryptamine (DMT) in Mimosahostilis. Microgram Journal 2007;5(1-4):41-50.
Franckowski RE, Thompson RA. Eszopiclone (Lunesta™): An analytical profile. Microgram Journal 2006;4(1-4):29-36.
Fucci N. Analysis of fatty acids in marijuana (Cannabis sativa leaf). Microgram Journal 2007;5(1-4):20-6.
Garcia AD, Catterton AJ. 1,4-Butanediol (BD) - Forensic profile. Microgram Journal 2003;1(1-2):44-54.
Geer LC, Hays PA. Letrozole (FemaraTM). Microgram Journal 2003;1(3-4):190-5.
Hanson AJ. Specificity of the Duquenois-Levine and cobalt thiocyanate tests substituting methylene chloride orbutyl chloride for chloroform. Microgram Journal 2005;3(3-4):183-5.
Kitlinski LM, Harman AL, Brousseau MM, Skinner HF. Reduction of phenylephrine with hydriodic acid/redphosphorus or iodine/red phosphorus: 3-Hydroxy-N-methylphenethylamine. Microgram Journal 2005;3(3-4):142-53.
Klein RFX, Hays PA. Detection and analysis of drugs of forensic interest, 1992 - 2001; A literature review. Microgram Journal 2003;1(1-2):55-153.
Koper C, Ali-Tolppa E, Bozenko Jr. JS, Dufey V, Puetz M, Weyermann C, Zrcek F. Identification of a newamphetamine type stimulant: 3,4-Methylenedioxy-(2-hydroxyethyl)amphetamine (MDHOET). MicrogramJournal 2005;3(3-4):166-74.
Krawczeniuk AS. Identification of phenethylamines and methylenedioxyamphetamines using liquidchromatography atmospheric pressure electrospray ionization mass spectrometry. Microgram Journal 2005;3(1-2):78-100.
Lurie IS, Cox KA. Rapid chiral separation of dextro- and levo- methorphan using capillary electrophoresis withdynamically coated capillaries. Microgram Journal 2005;3(3-4):138-41.
Makino Y, Kurobane S, Miyasaka K, Nagano K. Profiling of ecstasy tablets seized in Japan. Microgram Journal 2003;1(3-4):169-76.
Maurer HH. Mass spectra of select benzyl- and phenyl- piperazine designer drugs. Microgram Journal 2004;2(1-4):22-6.
Mohrhaus AS, Gratz SR. Identification and determination of carisoprodol in tablets by liquid chromatography/mass spectrometry. Microgram Journal 2004;2(1-4):36-41.
Morris JA. Analytical profile of Modafinil. Microgram Journal 2005;3(1-2):27-31.
Newell CJ. Potency of cannabis seized in central Florida during June 2002. Microgram Journal 2003;1(1-2):37-9.
Brought to you by AltGov2 [www.altgov2.org]

Microgram Journal, Volume 5, Numbers 1-4 (January - December 2007) 55
Odeneal II NG, Casale JF, Wojno HL. Hydroxyzine: An analytical profile. Microgram Journal 2004;2(1-4):17-22.
Panicker S, Wojno HL, Ziska LH. Quantitation of the major alkaloids in opium from Papaver setigerum DC. Microgram Journal 2007;5(1-4):13-9.
Peters DE. Diltiazem HCl: An analytical profile. Microgram Journal 2004;2(1-4):11-6.
Phelan CP. Quantitation and enantiomeric determination of propoxyphene using capillary zone electrophoresis. Microgram Journal 2005;3(1-2):31-8.
Piñero EL, Casale JF. Quantitation of cocaine by gas chromatography-flame ionization detection utilizingisopropylcocaine as a structurally related internal standard. Microgram Journal 2006;4(1-4):47-53.
Ramsey RT, Woods P. Improvised explosive device disguised as a smoking pipe. Microgram Journal 2004;2(1-4):34-5.
Reed EC, Kiddon GS. The characterization of three FLY compounds. Microgram Journal 2007;5(1-4):26-33.
Rodriguez WR, Allred RA. Synthesis of trans-4-methylaminorex from norephedrine and potassium cyanate. Microgram Journal 2005;3(3-4):154-65.
Rodriguez-Cruz SE. Analysis and characterization of designer tryptamines using electrospray ionization massspectrometry (ESI-MS). Microgram Journal 2005;3(3-4):107-29.
Rodriguez-Cruz SE. Analysis and characterization of psilocybin and psilocin using liquid chromatography -electrospray ionization mass spectrometry (LC-ESI-MS) with collision-induced-dissociation (CID) andsource-induced-dissociation (SID). Microgram Journal 2005;3(3-4):175-82.
Ropero-Miller JD, Stout PR, Bynum ND, Casale JF. Comparison of the novel direct analysis in real timetime-of-flight mass spectrometry (AccuTOF-DART™) and signature analysis for the identification of constituentsof refined illicit cocaine. Microgram Journal 2007;5(1-4):34-40.
Sarwar M. A new, highly specific color test for ketamine. Microgram Journal 2006;4(1-4):24-8.
Sarwar M, McDonald JL. A rapid extraction and GC/MS methodology for the identification of psilocyn inmushroom/chocolate concoctions. Microgram Journal 2003;1(3-4):177-83.
Smith PR, Frohwein AK, Hays PA, Lurie IS. Identification and quantitation of hydromorphone hydrochloride inPalladone® (extended time-release) capsules. Microgram Journal 2005;3(1-2):39-45.
Spratley TK, Hays PA, Geer LC, Cooper SD, McKibben TD. Analytical profiles for five “designer” tryptamines. Microgram Journal 2005;3(1-2):54-68.
Tsujikawa K, Kanamori T, Kuwayama K, Miyaguchi H, Iwata Y, Inoue H. Analytical profiles for 3,4,5-, 2,4,5-,and 2,4,6-trimethoxyamphetamine. Microgram Journal 2006;4(1-4):12-23.
Valentino AMM, Fuentecilla K. Levamisole: An analytical profile. Microgram Journal 2005;3(3-4):134-7.
Vohlken BA, Layton SM. Instrumental separation of 3,4-methylenedioxyamphetamine (MDA) from 1-(3,4-methylenedioxyphenyl)-2-propanol, a co-eluting compound. Microgram Journal 2003;1(1-2):32-6.
Brought to you by AltGov2 [www.altgov2.org]
56 Microgram Journal, Volume 5, Numbers 1-4 (January - December 2007)
Waumans D, Bruneel N, Hermans B, Tytgat J. A rapid and simple GC/MS screening method for 4-methoxy-phenol in illicitly prepared 4-methoxyamphetamine (PMA). Microgram Journal 2003;1(3-4):184-9.
Waumans D, Bruneel N, Tytgat J. Anise oil as a precursor for 2-alkoxy-5-methoxybenzaldehydes. MicrogramJournal 2004;2(1-4):4-10.
Wesley JF. Osmolality - A novel and sensitive tool for detection of tampering of beverages adulterated withethanol, gamma-butyrolactone, and 1,4-butanediol, and for detection of dilution-tampered Demerol syringes. Microgram Journal 2003;1(1-2):8-17.
Wisniewski ES, Hays PA. Dehydrochlormethyltestosterone: An analytical profile. Microgram Journal 2006;4(1-4):54-65.
Zimmerman MM. The identification of 5-methoxy-alpha-methyltryptamine (5-MeO-AMT). Microgram Journal 2003;1(3-4):158-62.
* * * * *
Five Year Index (by Compound or Topic)
Anise oil (as a precursor): Waumans D, Bruneel N, Tytgat J. Anise oil as a precursor for 2-alkoxy-5-methoxy-benzaldehydes. Microgram Journal 2004;2(1-4):4-10.
Bufotenine (in yopo seeds): Blackledge RD, Phelan CP. Identification of bufotenine in yopo seeds via GC/IRD. Microgram Journal 2006;4(1-4):3-11.
1,4-Butanediol: Garcia AD, Catterton AJ. 1,4-Butanediol (BD) - Forensic profile. Microgram Journal 2003;1(1-2):44-54.
Carisoprodol: Mohrhaus AS, Gratz SR. Identification and determination of carisoprodol in tablets by liquidchromatography/mass spectrometry. Microgram Journal 2004;2(1-4):36-41.
cis-Cinnamoylcocaine (isolation of): Casale JF, Piñero EL, Corbeil EM. Isolation of cis-cinnamoylcocainefrom crude illicit cocaine via alumina column chromatography. Microgram Journal 2006;4(1-4):37-41.
Cobalt thiocyanate test (modified conditions): Deakin AL. A study of acids used for the acidified cobaltthiocyanate test for cocaine base. Microgram Journal 2003;1(1-2):40-3.
Cocaine (analysis by AccuTOF-DART™): Ropero-Miller JD, Stout PR, Bynum ND, Casale JF. Comparisonof the novel direct analysis in real time time-of-flight mass spectrometry (AccuTOF-DART™) and signatureanalysis for the identification of constituents of refined illicit cocaine. Microgram Journal 2007;5(1-4):34-40.
Cocaine base (containing mannitol): Casale JF. Assessment of the volatility (smokeability) of cocaine basecontaining 50 percent mannitol: Is it a smokeable form of “crack” cocaine? Microgram Journal 2005;3(3-4):130-3.
Dehydrochlormethyltestosterone: Wisniewski ES, Hays PA. Dehydrochlormethyltestosterone: An analyticalprofile. Microgram Journal 2006;4(1-4):54-65.
1-Dehydromethandrostenolone: Blackledge RD. The identification of 1-dehydromethandrostenolone. Microgram Journal 2005;3(3-4):186-9.
Brought to you by AltGov2 [www.altgov2.org]
Microgram Journal, Volume 5, Numbers 1-4 (January - December 2007) 57
Desloratadine: DiPari SC, Bordelon JA, Skinner HF. Desloratadine: The reaction byproduct of the reduction ofcold tablets containing Loratadine with hydriodic acid/red phosphorus. Microgram Journal 2005;3(1-2):69-77.
Diltiazem: Peters DE. Diltiazem HCl: An analytical profile. Microgram Journal 2004;2(1-4):11-6.
Dimethoxymethylphenethylamines: Allred RA. Spectral characterization of 2,4-dimethoxy-3-methyl-phenethylamine and comparison to 2,5-dimethoxy-4-methylphenethylamine (“2C-D”). Microgram Journal 2005;3(1-2):16-26.
Dimethylamphetamine: Chan KB, Chong YK, Nazarudin M. The identification of N,N-dimethylamphetamine(DMA) in an exhibit in Malaysia. Microgram Journal 2003;1(3-4):163-8.
Dimethylcathinone: Dal Cason TA. Synthesis and identification of N,N-dimethylcathinone hydrochloride. Microgram Journal 2007;5(1-4):3-12.
Duquenois-Levine and cobalt thiocyanate tests (alternate solvents): Hanson AJ. Specificity of theDuquenois-Levine and cobalt thiocyanate tests substituting methylene chloride or butyl chloride for chloroform. Microgram Journal 2005;3(3-4):183-5.
Eszopiclone (Lunesta™): Franckowski RE, Thompson RA. Eszopiclone (Lunesta™): An analytical profile. Microgram Journal 2006;4(1-4):29-36.
Explosive device (disguised as a drug smoking pipe): Ramsey RT, Woods P. Improvised explosive devicedisguised as a smoking pipe. Microgram Journal 2004;2(1-4):34-5.
FLY Compounds: Reed EC, Kiddon GS. The characterization of three FLY compounds. Microgram Journal 2007;5(1-4):26-33.
gamma-Hydroxybutyrate, silver salt: DeFrancesco JV. gamma-Hydroxybutyrate, silver salt (AgGHB): Identification of gamma-hydroxybutyrate (GHB) via conversion to the silver salt. Microgram Journal 2005;3(1-2):46-53.
3-Hydroxy-N-methylphenethylamine (from reduction of phenylephrine): Kitlinski LM, Harman AL,Brousseau MM, Skinner HF. Reduction of phenylephrine with hydriodic acid/red phosphorus or iodine/redphosphorus: 3-Hydroxy-N-methylphenethylamine. Microgram Journal 2005;3(3-4):142-53.
Hydroxyzine: Odeneal II NG, Casale JF, Wojno HL. Hydroxyzine: An analytical profile. Microgram Journal 2004;2(1-4):17-22.
Indanylamphetamines: Casale JF, McKibben TD, Bozenko JS, Hays PA. Characterization of the“Indanylamphetamines.” Microgram Journal 2005;3(1-2):3-10.
Isopropylcocaine (standard for quantitation of cocaine): Piñero EL, Casale JF. Quantitation of cocaine bygas chromatography-flame ionization detection utilizing isopropylcocaine as a structurally related internalstandard. Microgram Journal 2006;4(1-4):47-53.
Ketamine (color test): Sarwar M. A new, highly specific color test for ketamine. Microgram Journal 2006;4(1-4):24-8.
Letrozole (FemaraTM): Geer LC, Hays PA. Letrozole (Femara®). Microgram Journal 2003;1(3-4):190-5.
Brought to you by AltGov2 [www.altgov2.org]
58 Microgram Journal, Volume 5, Numbers 1-4 (January - December 2007)
Levamisole: Valentino AMM, Fuentecilla K. Levamisole: An analytical profile. Microgram Journal 2005;3(3-4):134-7.
Literature Review: Klein RFX, Hays PA. Detection and analysis of drugs of forensic interest, 1992 - 2001; Aliterature review. Microgram Journal 2003;1(1-2):55-153.
Marijuana (analysis for fatty acids in): Fucci N. Analysis of fatty acids in marijuana (Cannabis sativa leaf). Microgram Journal 2007;5(1-4):20-6.
Marijuana (overview of DNA methods for analysis of): Coyle HM, Palmbach T, Juliano N, Ladd C, Lee HC. An overview of DNA methods for the identification and individualization of marijuana. Microgram Journal 2003;1(3-4):196-207.
Marijuana (local survey of potency): Newell CJ. Potency of cannabis seized in central Florida during June2002. Microgram Journal 2003;1(1-2):37-9.
Methamphetamine (preparation from over-the-counter PSE-containing products): Bianchi RP, Shah MN,Rogers DH, Mrazik TJ. Laboratory analysis of the conversion of pseudoephedrine to methamphetamine fromover-the-counter products. Microgram Journal 2005;3(1-2):11-5.
Methorphan: Lurie IS, Cox KA. Rapid chiral separation of dextro- and levo- methorphan using capillaryelectrophoresis with dynamically coated capillaries. Microgram Journal 2005;3(3-4):138-41.
4-Methoxy-N-ethylamphetamine: Casale JF, Hays PA, Spratley TK, Smith PR. The characterization of4-methoxy-N-ethylamphetamine hydrochloride. Microgram Journal 2006;4(1-4):42-5.
5-Methoxy-alpha-methyltryptamine: Zimmerman MM. The identification of 5-methoxy-alpha-methyl-tryptamine (5-MeO-AMT). Microgram Journal 2003;1(3-4):158-62.
4-Methoxyphenol (in PMA): Waumans D, Bruneel N, Hermans B, Tytgat J. A rapid and simple GC/MSscreening method for 4-methoxyphenol in illicitly prepared 4-methoxyamphetamine (PMA). Microgram Journal 2003;1(3-4):184-9.
trans-4-Methylaminorex: Rodriguez WR, Allred RA. Synthesis of trans-4-methylaminorex from norephedrineand potassium cyanate. Microgram Journal 2005;3(3-4):154-65.
3,4-Methylenedioxy-(2-hydroxyethyl)amphetamine: Koper C, Ali-Tolppa E, Bozenko Jr. JS, Dufey V, PuetzM, Weyermann C, Zrcek F. Identification of a new amphetamine type stimulant: 3,4-Methylenedioxy-(2-hydroxyethyl)amphetamine (MDHOET). Microgram Journal 2005;3(3-4):166-74.
3,4-Methylenedioxymethamphetamine (profiling): Makino Y, Kurobane S, Miyasaka K, Nagano K. Profilingof ecstasy tablets seized in Japan. Microgram Journal 2003;1(3-4):169-76.
1-(3,4-Methylenedioxyphenyl)-2-propanol (in MDA): Vohlken BA, Layton SM. Instrumental separation of3,4-methylenedioxyamphetamine (MDA) from 1-(3,4-methylenedioxyphenyl)-2-propanol, a co-elutingcompound. Microgram Journal 2003;1(1-2):32-6.
Mimosa hostilis: Fasanello JA, Placke AD. The isolation, identification, and quantitation of dimethyltryptamine(DMT) in Mimosa hostilis. Microgram Journal 2007;5(1-4):41-50.
Modafinil: Morris JA. Analytical profile of Modafinil. Microgram Journal 2005;3(1-2):27-31.
Brought to you by AltGov2 [www.altgov2.org]
Microgram Journal, Volume 5, Numbers 1-4 (January - December 2007) 59
Nimetazepam (in Erimin-5 tablets): Chong YK, Kaprawi MM, Chan KB. The quantitation of nimetazepam inErimin-5 tablets and powders by reverse-phase HPLC. Microgram Journal 2004;2(1-4):27-33.
Ninhydrin analogues (as spray reagents for TLC): Azoury M, Zelkowicz A, Goren Z, Almog J. Evaluation ofninhydrin analogues and other electron-deficient compounds as spray reagents for drugs on thin layerchromatograms. Microgram Journal 2003;1(1-2):23-31.
Osmolality: Wesley JF. Osmolality - A novel and sensitive tool for detection of tampering of beveragesadulterated with ethanol, gamma-butyrolactone, and 1,4-butanediol, and for detection of dilution-tamperedDemerol syringes. Microgram Journal 2003;1(1-2):8-17.
Palladone (hydromorphone hydrochloride): Smith PR, Frohwein AK, Hays PA, Lurie IS. Identification andquantitation of hydromorphone hydrochloride in Palladone® (extended time-release) capsules. MicrogramJournal 2005;3(1-2):39-45.
Papaver setigerum (analysis of): Panicker S, Wojno HL, Ziska LH. Quantitation of the major alkaloids inopium from Papaver setigerum DC. Microgram Journal 2007;5(1-4):13-9.
Phenethylamines and methylenedioxyamphetamines (analysis by LC-AP-EIMS): Krawczeniuk AS. Identification of phenethylamines and methylenedioxyamphetamines using liquid chromatography atmosphericpressure electrospray ionization mass spectrometry. Microgram Journal 2005;3(1-2):78-100.
Phentermine (in Ionamin 30 capsules): Edwards NR. Qualitative and quantitative analysis of Ionamin 30capsules (containing a time-release formulation of phentermine). Microgram Journal 2006;4(1-4):66-9.
Piperazines: Maurer HH. Mass spectra of select benzyl- and phenyl- piperazine designer drugs. MicrogramJournal 2004;2(1-4):22-6.
Propoxyphene: Phelan CP. Quantitation and enantiomeric determination of propoxyphene using capillary zoneelectrophoresis. Microgram Journal 2005;3(1-2):31-8.
Psilocybe mushroom/chocolate concoctions: Sarwar M, McDonald JL. A rapid extraction and GC/MSmethodology for the identification of psilocyn in mushroom/chocolate concoctions. Microgram Journal 2003;1(3-4):177-83.
Psilocybin and psilocin (analysis by LC-ESI-MS): Rodriguez-Cruz SE. Analysis and characterization ofpsilocybin and psilocin using liquid chromatography - electrospray ionization mass spectrometry (LC-ESI-MS)with collision-induced-dissociation (CID) and source-induced-dissociation (SID). Microgram Journal 2005;3(3-4):175-82.
Psychotria viridis: Blackledge RD, Taylor CM. Psychotria viridis – A botanical source of dimethyltryptamine(DMT). Microgram Journal 2003;1(1-2):18-22.
SWGDRUG: Bono JP. Report of the Scientific Working Group for the Analysis of Seized Drugs (SWGDRUG)Conference (Montreal). Microgram Journal 2003;1(3-4):208-36.
3,4,5-, 2,4,5-, and 2,4,6-Trimethoxyamphetamine: Tsujikawa K, Kanamori T, Kuwayama K, Miyaguchi H,Iwata Y, Inoue H. Analytical profiles for 3,4,5-, 2,4,5-, and 2,4,6-trimethoxyamphetamine. Microgram Journal 2006;4(1-4):12-23.
Tryptamines: Spratley TK, Hays PA, Geer LC, Cooper SD, McKibben TD. Analytical profiles for five“designer” tryptamines. Microgram Journal 2005;3(1-2):54-68.
Brought to you by AltGov2 [www.altgov2.org]
60 Microgram Journal, Volume 5, Numbers 1-4 (January - December 2007)
Tryptamines (analysis by ESI-MS): Rodriguez-Cruz SE. Analysis and characterization of designer tryptaminesusing electrospray ionization mass spectrometry (ESI-MS). Microgram Journal 2005;3(3-4):107-29.
* * * * * * * * * * * * * * * * * * * * * * * * *
* * * * *
* * * * * * * * * * * * * * * * * * * * * * * * *
DISCLAIMERS
1) All material published in Microgram Journal is reviewed prior to publication. However, the reliability andaccuracy of all published information are the responsibility of the respective contributors, and publicationin Microgram Journal implies no endorsement by the United States Department of Justice or the DrugEnforcement Administration.
2) Due to the ease of scanning, copying, electronic manipulation, and/or reprinting, only the posted copies ofMicrogram Journal (on www.dea.gov) are absolutely valid. All other copies, whether electronic or hard, arenecessarily suspect unless verified against the posted versions.
3) WARNING!: Due to the often lengthy time delays between the actual dates of seizures and their subsequentreporting in Microgram Journal, and also because of the often wide variety of seizure types with superficiallysimilar physical attributes, published material cannot be utilized to visually identify controlled substancescurrently circulating in clandestine markets. The United States Department of Justice and the DrugEnforcement Administration assume no liability for the use or misuse of the information published inMicrogram Journal.
* * * * * * * * * * * * * * * * * * * * * * * * *
Brought to you by AltGov2 [www.altgov2.org]
Microgram Journal, Volume 5, Numbers 1-4 (January - December 2007) 61
Information and Instructions for Authors for Microgram Journal
General InformationMicrogram Journal is a scientific periodical published by the U.S. Drug Enforcement Administration’s Office ofForensic Sciences, that presents peer reviewed, full length Scientific Research Articles and Technical Notes onthe detection and analyses of suspected controlled substances for forensic/law enforcement purposes.
Access to Microgram JournalMicrogram Journal is unclassified, and is published on the DEA public access website (at: www.dea.gov/programs/forensicsci/microgram/index.html). At this time, Microgram Journal is available onlyelectronically, and requires Internet access. Professional scientific and law enforcement personnel may requestemail notifications when new issues are posted (such notifications are not available to private citizens). Thepublications themselves are never sent electronically (that is, as attachments).
Requests to be added to the email notification list should preferably be submitted via email to the MicrogramEditor at: DEA-Microgram-2008 -at- mailsnare.net Requests can also be mailed to: Microgram Editor, DrugEnforcement Administration, Office of Forensic Sciences, 8701 Morrissette Drive, Springfield, VA 22152. Allrequests to be added to the Microgram email notification list should include the following Standard ContactInformation:
* The Full Name and Mailing Address of Submitting Laboratory or Office;
* The Full Name, Title (Laboratory Director, Assistant Special Agent in Charge, Librarian, etc.), PhoneNumber, FAX Number, and Preferred email Address of the Submitting Individual (Note that emailnotifications are mailed to titles, not names, in order to avoid problems arising from future personnelchanges);
* If available, the generic email address for the Submitting Laboratory or Office;
* If a generic email address is not available, one private email address for an individual who is likely to bea long-term employee, who has a stable email address, and who will be responsible for forwardingMicrogram information to all of the other employees in the requestor’s Office (Note that only one emailaddress per Office will be honored).
Requests to be removed from the Microgram email notification list, or to change an existing email address, shouldalso be sent to the Microgram Editor. Such requests should include all of the pertinent Standard ContactInformation detailed above, and also should provide both the previous and the new email addresses.
Email notification requests/changes are usually implemented within six weeks.
Email Notifications (Additional Comments)As noted above, the email notification indicates which issue has been posted, provides the Microgram URL, andadditional information as appropriate. Note that Microgram e-notices will NEVER include any attachments, orany hyperlink other than the Microgram URL. This is important, because the Microgram email address isroutinely hijacked and used to send spam, very commonly including malicious attachments. For this reason,all subscribers are urged to have current anti-viral, anti-spyware, and firewall programs in operation. However, inorder to ensure that the email notifications are not filtered as spam, the DEA-Microgram-2008 -at- mailsnareemail address must be “whitelisted” by the Office’s ISP.
Brought to you by AltGov2 [www.altgov2.org]
62 Microgram Journal, Volume 5, Numbers 1-4 (January - December 2007)
CostsAccess to Microgram Journal is free.
Submissions to Microgram JournalManuscripts are accepted both from within and outside of DEA, and reviewers are both internal (from withinDEA) and external.
All submissions must be in English. All submissions should, whenever possible, be submitted electronically, asstraight email or as an IBM® PC-compatible Corel WordPerfect® or Microsoft Word® attachment, to: [email protected] Current versions of Corel WordPerfect® or Microsoft Word® (defined ashaving release dates less than 5 years old) should be utilized. If electronic (email) submission is not possible,submissions may be mailed to: Microgram Editor, Drug Enforcement Administration, Office of ForensicSciences, 8701 Morrissette Drive, Springfield, VA 22152. Hard-copy manuscripts should be submitted intriplicate, and should also be accompanied by an electronic version (written in either Corel WordPerfect® orMicrosoft Word®) on a 3 ½ inch IBM® PC-compatible diskette, 100 or 250 MB Iomega® zip diskette, or anIBM® PC-compatible CD. Note that diskettes should be mailed in an irradiation-proof protective sleeve,and the mailing envelope should be marked: “Warning - Contains Electronic Media - Do Not Irradiate”. Hard-copy manuscripts should be printed in black ink using a laser or ink jet printer, double-spaced, on one sideof 8 1/2" x 11" or A4 high quality white bond paper. A Times New Roman/12-point font is preferred for allsubmissions (electronic or hard copy). Each page, including illustrations, should have a one-inch (25 mm) marginon all sides. All photos and figures should also be submitted as stand-alone attachments, not only embedded inthe manuscript. The pages should be numbered, but not stapled together.
Note that mailed submissions may be subject to lengthy handling delays beyond the control of the Office ofForensic Sciences, and electronic media sent through the mail may be destroyed en route by sanitizingprocedures, despite protective measures and written warnings. All submissions should include the followingContact Information: The Full Name and Address of Submitting Laboratory or Office, and the Full Name,Phone Number, FAX Number, and Preferred email Address of the Submitting Individual.
Scientific Research Articles are formal, full length reports detailing original research in the detection andanalysis of suspected controlled substances for forensic/law enforcement purposes, excluding in post-ingestionhuman/animal biological matrices (blood, urine, meconium, sweat, hair, etc.) Technical Notes are shortercommunications concentrating on a specific drug (or drug class), unusual case, novel or unusual procedure ormethod, or minor original research, again excluding in post-ingestion human/animal biological matrices. Eacharticle/note should be a “stand-alone” work; serial publications will not be considered. Similarly, articles/noteswhich essentially duplicate existing literature will not be considered unless the presented data reflect significantadvances in instrumentation made since the original publication(s) (however, see: Dual Publications, below). Allsubmissions will be subjected to peer review, and authors will be notified of the results of the review(s) withinthree months after the manuscript is received by the Office of Forensic Sciences.
The following guidelines should be used for all Articles (Technical Notes may follow an abbreviated version asappropriate):
Cover Letter - Provide the standard contact information and pertinent correspondence (if any) for theEditor.
Title - Should be specific and amenable to indexing; they should not include acronyms or abbreviationsexcept for very common instrumental technique acronyms (e.g., GC/MS or HPLC) and/or very commondrug acronyms (e.g., MDMA or PCP). Titles should be sufficiently informative that the readershipshould not have to read the Abstract or the Introduction to understand the focus of the article. If the
Brought to you by AltGov2 [www.altgov2.org]
Microgram Journal, Volume 5, Numbers 1-4 (January - December 2007) 63
manuscript reflects work previously presented at a scientific meeting, a statement detailing thatpresentation should be included as a footnote to the Title.
Author(s)/Affiliation(s) - The author's full name (including middle initial(s)) and title, and the full nameand address of the laboratory or office should immediately follow the title. The author’s degree level maybe included if desired, but is not required (however, multiple authors should all include or all exclude thisinformation). If there are several authors from two or more laboratories or offices, each set of authorsshould be listed separately, followed by their corresponding laboratory name and address (that is, AuthorsI, Laboratory I, Authors II, Laboratory II, etc.) Excessive authorship should be avoided. If there is morethan one author, the primary author should be indicated with a superscripted asterisk. The name, phonenumbers (Voice and FAX), preferred email address, and (if different from the laboratory or officeaddress) the full mailing address of the contact person should be included on the title page.
Abstract - State the purpose, procedures, and principal findings of the paper, in 120 words or less. Avoidthe use of abbreviations, and use only common acronyms as defined under “Titles”. Note that the abstractwill be provided to Chemical Abstracts.
Keyword List - A minimum of five (maximum ten) abstracting keywords should be included. Unlessinappropriate, the last keyword pair should always be “Forensic Chemistry.”
Introduction - Briefly state the issue or problem. Detail existing practice in the topic area, and explainthe shortcomings (if any) in what has been previously reported and/or what is being currently done in thefield; that is, compare and contrast the selected methodology with previous and/or existing methods. Provide theoretical and practical background for novel or rarely utilized experimental or instrumentalmethods. Include pertinent references (avoid “Personal Communications”).
Experimental (Chemicals, Instrumentation, Procedures) - Detail the chemicals, instruments, andprocedures utilized (including experimental parameters). However, USE CAUTION IN DETAILINGSYNTHESES OF CONTROLLED OR ABUSED SUBSTANCES, especially novel syntheses toknown controlled substances, or syntheses of novel substances that may be subject to abuse, that are notyet well known in the scientific and/or underground literature. [In such cases, a simple statement shouldbe included to the effect that: “Experimental details on this synthesis are not provided, in accordancewith Journal policy.”]
Results and Discussion - Present findings in a logical, easily followed sequence. Describe what wasdone, and where appropriate what conclusions can be drawn. Compare and contrast the findings withprevious studies and/or current practice. Discuss any problems and/or unresolved issues.
Conclusions - Optional - Summarized results should be included only for complex articles. Conclusionsshould not merely duplicate the Abstract or the summary paragraph in the Results and Discussion section.
Acknowledgments - Optional - Should be brief, and include the full name, affiliation, and specificcontribution made by each cited individual.
References - Articles and notes should have all textual citations collected in an endnotes list. Within thetext, references should be consecutively numbered with superscripted Arabic numerals, or with Arabicnumerals in brackets, in accordance with their first appearance. Within the endnotes list, referencesshould be consecutively numbered with Arabic numerals, as follows: Number, Period, Indent, Citation. Reference format should adhere to the Uniform Requirements for Manuscripts Submitted to BiomedicalJournals (Note: This is the same reference format utilized in the Selected Reference Citations inMicrogram Bulletin, and also (among many others) by the Journal of Forensic Sciences). Due to theirinherently transitory nature, use of website URL’s as references are discouraged but are permitted. As
Brought to you by AltGov2 [www.altgov2.org]

64 Microgram Journal, Volume 5, Numbers 1-4 (January - December 2007)
previously noted, Personal Communications should not be utilized; however, if unavoidable, utilize thefollowing format: Full Name, Title, Affiliation (Laboratory or Office), Location (City and State, plusNation if not the United States), Personal Communication, Year.
Table and Figures - All Tables and Figures should be appended onto the end of the article (notembedded in the text). Tables and Figures should be consecutively numbered with Arabic numerals, inaccordance with their first citation in the text. Each Table and Figure should be “stand-alone”; that is,include sufficient descriptive information such that the reader will not have to refer back to the text tounderstand the Table or Figure. The Header should include the Table or Figure number and a concisetitle. Explanatory material, definitions of acronyms and/or abbreviations, and/or references within theTable or Figure should be designated by superscripted, lower case letters in alphabetical order, andincluded in dedicated footnotes at the bottom of the respective Table or Figure. Unless color is needed toenhance differentiation of the depicted material, all Tables and Figures should be in black and white (thatis, avoid frivolous use of color for “artistic” purposes). Figures of spectra, chromatograms, charts,graphs, etc., should have clear and legibly labeled axes, but should not include instrument generatedprintoffs of experimental parameter lists.
Manuscripts submitted to Microgram Journal are required to be finished, professional quality efforts. Authorsshould ensure clarity, brevity, and pertinence of all information. Attention to detail in formatting, syntax,grammar, and spelling are as important as the accuracy of the facts presented. Authors are specially cautioned toconduct careful literature reviews prior to submission. At the Editor’s discretion, clearly substandard and/orinappropriate manuscripts will be returned to the authors without review.
Manuscripts will not be retyped, but “final” versions are subject to minor to moderate Editorial rewrite toimprove presentation clarity or to reformat to current Microgram Journal style.
Dual publication - Re-publication of articles or notes of particular interest to the Microgram Journal readershipwill be considered if the article was originally published in a journal that is not easily accessed and the primaryauthor has obtained explicit, written copyright exclusion from the original publisher and consent from all co-authors. Examples include exact English translations of articles or notes originally published in a non-Englishlanguage journal, non-sensitive articles or notes originally published in a restricted journal or on a passwordprotected website, or articles or notes originally published in limited distribution newsletters or proceedings. Ingeneral, any article or note that was published in English in a mainstream journal is not a candidate for re-publication in Microgram Journal. Authors interested in re-publishing previously published articles or notes inMicrogram Journal should discuss the issue with the Microgram Editor before submitting.
Note that (in accordance with standard ethical guidelines) re-published articles should not be included as “new”articles in the respective author(s)’ Curriculum Vitae.
Costs - There are no costs (to the contributor) associated with publication in Microgram Journal.
Reprints - Microgram Journal does not provide reprints to authors. Microgram Journal may be photocopied (orprinted off the website) as needed.
Questions may be directed to the Microgram Editor.
* * * * *
Brought to you by AltGov2 [www.altgov2.org]
U.S. Department of JusticeDrug Enforcement Administration
www.dea.gov
MicrogramJournal
To Assist and Serve Scientists Concerned with the Detection and Analysis of ControlledSubstances and Other Abused Substances for Forensic / Law Enforcement Purposes.
Published by: The U.S. Attorney General has determined that the publication of thisThe Drug Enforcement Administration periodical is necessary in the transaction of the public business Office of Forensic Sciences required by the Department of Justice. Information, instructions, and Washington, DC 20537 disclaimers are published in the first issue of each year.
Volume 6Numbers 1-2 Posted On-Line At:January - June 2008 www.dea.gov/programs/forensicsci/microgram/index.html
Brought to you by AltGov2 [www.altgov2.org]
2 Microgram Journal, Volume 6, Numbers 1-2 (January - June, 2008)
Contents
The Use of Dipropionylmorphine as a Structurally-Related Internal Standard 3for Gas Chromatographic Quantitation of HeroinSusan C. Kerr and John F. Casale
Rapid Screening of Seized Drug Exhibits Using Desorption Electrospray Ionization 10Mass Spectrometry (DESI-MS)Sandra E. Rodriguez-Cruz
Discovery of an Interesting Temperature Effect on the Sensitivity of the Cobalt 26Thiocyanate Test for CocaineJim W. McGill, Crystal A. Dixon, David Ritter, and Joanna D. Sides
Identification of N-Methylbenzylamine Hydrochloride, N-Ethylbenzylamine 36Hydrochloride, and N-Isopropylbenzylamine HydrochlorideRamona M. Sanderson
Isolation of Methamphetamine from 1-(1',4'-Cyclohexadienyl)-2-methylaminopropane 46(CMP) Using Potassium PermanganateFracia S. Martinez, Daniel M. Roesch, and James L. Jacobs
Information and Instructions for Authors 55
- - - - - - - - - -
Note: In order to prevent automated theft of email addresses off the Internet postings of MicrogramJournal, all email addresses reported in the Journal have had the “@” character replaced by “ -at- ”.
Cover Art: “Ball and Stick” Model of 3-Chlorophenylpiperazine (mCPP; Courtesy of Patrick A. Hays,DEA Special Testing and Research Laboratory, Dulles, VA).
Brought to you by AltGov2 [www.altgov2.org]
Microgram Journal, Volume 6, Numbers 1-2 (January - June, 2008) 3
The Use of Dipropionylmorphine as a Structurally-Related InternalStandard for Gas Chromatographic Quantitation of Heroin
Susan C. Kerr, B.S.* and John F. Casale, B.S.U.S. Department of Justice
Drug Enforcement AdministrationSpecial Testing and Research Laboratory
22624 Dulles Summit CourtDulles, VA 20166
[email address withheld at author’s request]
ABSTRACT: Dipropionylmorphine is utilized as a structurally similar internal standard for quantitation of illicitheroin via gas chromatography with flame ionization detection. The described method has excellent selectivity,precision, and accuracy, with a relative standard deviation of less than 0.2 percent and a correlation coefficient of0.99999. The quantitative results were in excellent agreement with other quantitative methods. The synthesis ofhigh-purity dipropionylmorphine from morphine is detailed.
KEYWORDS: Dipropionylmorphine, Synthesis, Gas Chromatography, Flame Ionization Detection, Heroin,Quantitation, Internal Standard, Forensic Chemistry.
Introduction
The quantitative determination of illicit heroin (Figure 1) and related opium alkaloids is important for forensic,toxicological, and judicial purposes. Many methods have been published for this purpose, including using, forexample, high pressure liquid chromatography (HPLC) [1], capillary electrophoresis (CE) [2], nuclear magneticresonance (NMR) [3], and gas chromatography (GC) [4-6].
Internal standards are routinely incorporated in quantitative methods. Structurally similar internal standards arepreferred because they improve method accuracy and precision. However, most analytical methods that employinternal standards use non-structurally related hydrocarbons such as n-tetracosane [4], n-octacosane [4], andn-triacontane [5] because of their wide availability, high purity, high stability, and relative ease in handling. Incontrast, methods using structurally related internal standards are uncommon.
Specifically looking at gas chromatography analysis with flame ionization detection (GC/FID), an ideal internalstandard should have similar chemical and physical properties as well as comparable FID responses to the analyteof interest. As such, the structurally related internal standard would maximize precision and accuracy [6] andminimize issues related to reactivity, absorption, solubility, and inlet/on-column degradation [4,7]. Diacetylnalorphine has been previously utilized as a structurally similar internal standard for heroin quantitation[8], and satisfies the above criteria. However, it is not an ideal compound for routine use because of the relativelyhigh cost of its precursor (nalorphine), and its moderate instability in solution (three months at 4OC).
To date, only diacetylnalorphine has been reported for use as a structurally similar internal standard for heroinquantitation. However, dipropionylmorphine (Figure 1) was previously utilized as a target compound forquantitation of morphine in toxicological samples [9] (in this study, propionic anhydride was utilized as aderivatization reagent). A priori, dipropionylmorphine would be an ideal internal standard for heroin quantitationby GC/FID, providing it is non-coincident with any other opium alkaloids or typical adulterants and diluents. Herein we report the facile synthesis and successful use of dipropionylmorphine as a structurally similar internalstandard for GC/FID analysis of heroin.
Brought to you by AltGov2 [www.altgov2.org]
4 Microgram Journal, Volume 6, Numbers 1-2 (January - June, 2008)
Experimental
Reagents: All solvents were obtained from Burdick and Jackson Laboratories (Muskegon, MI). Diethylamine,propionylchloride, ammonium hydroxide, alumina, and activated carbon were obtained from Sigma Aldrich Inc.(St. Louis, MO). Heroin hydrochloride and morphine hydrochloride standards were obtained from thislaboratory’s reference collection. Synthesis of Dipropionylmorphine: Morphine hydrochloride monohydrate (40.0 g, 0.124 mol) was combinedwith 800 mL of acetonitrile and propionyl chloride (51.1 g, 0.552 mol) in a 2-liter round-bottom flask fitted with awater-cooled condenser. The solution was refluxed gently, with stirring, for 22.5 hours. Upon cooling, thereaction mixture was split into four 200 mL aliquots. Each portion was added slowly with stirring to a mixture ofisooctane (1.0 liter) and diethyl ether (800 mL), causing crude dipropionylmorphine hydrochloride to precipitatefrom solution. The crystals were captured via suction filtration and washed with anhydrous diethyl ether (200mL). All four crops of crude material were then dissolved into 400 mL of water and filtered. The filtrate waswashed with isooctane (500 mL), then with anhydrous diethyl ether (400 mL). The solution was adjusted to pH 9with concentrated ammonium hydroxide and extracted with methylene chloride (2 x 300 mL). The extracts werecombined, dried over anhydrous sodium sulfate, filtered, and treated with activated carbon (2 g). The carbon wasremoved by filtering through a celite pad. The filtrate was evaporated in vacuo to provide approximately 40grams of 96 percent dipropionylmorphine base. The material was chromatographed on a basic alumina column(600 g containing 4 percent H2O) using methylene chloride. The first 800 mL of eluate was collected andevaporated in vacuo to a clear oil. The oil was dissolved into a minimal volume of anhydrous diethyl ether in aflask, and the flask was scratched to crystallize dipropionylmorphine base as a chromatographically pure (99+percent) white powder (34.2 g, 70 percent yield).
Gas Chromatography - Flame Ionization Detection (GC/FID): An Agilent 6890N GC with a DB-5 column (30 m x 0.25 mm I.D., 0.25 :m film thickness) was utilized. The oven temperature program began at 205OC (1 minutehold), ramped to 240OC at 12OC/minute (5 minute hold), ramped at 4OC/minute to 275OC (1 minute hold), andthen ramped at 15OC/minute to 285OC (2.33 minute hold). The carrier gas was hydrogen (99.999 percent UHP) ata flow rate of 0.9 mL/minute, with a split ratio of 25:1. The injector and detector temperatures were maintained at280OC.
Gas Chromatography - Mass Spectrometry (GC/MS): An Agilent 6890N GC/MSD with a DB-1 column (30 m x 0.25 mm I.D., 0.25 :m film thickness) was utilized. The oven temperature program began at 90OC (2 minutehold), ramped to 300OC at 14.0OC /minute (10.0 minute hold). The carrier gas was ultra high purity Helium at aflow of 1.0 mL/minute, with a split ratio of 25:1. The injector and detector temperatures were maintained at280OC. The mass spectrum of dipropionylmorphine is presented in Figure 2.
Internal Standard Stock Solution: A stock solution of dipropionylmorphine was prepared at 1 mg/mL inchloroform. The solution was used at room temperature and can be stored at 4OC for up to two years withoutdetectable degradation.
Standard and Sample Preparation: Approximately 18 - 20 mg of heroin hydrochloride standard was accuratelyweighed into a 50 mL Erlenmeyer flask. 5.00 mL of the internal standard stock solution and 20 mL of chloroform(containing 50 :L of diethylamine) were added to the Erlenmeyer flask and the solution was allowed to sit for 5minutes. Samples were prepared in the same manner with slight modifications in sample weight to maintainsample concentration within the linear range of the method (see below). Aliquots of both standard and samplewere transferred to separate autosampler vials for analysis.
Linearity and Precision: Nine individual concentrations of heroin hydrochloride were prepared (at 0.106, 0.207,0.418, 0.611, 0.757, 0.807, 1.011, 1.632, and 2.039 mg/mL) with the internal standard, as described above. Allnine concentrations were utilized to calculate the method linearity and precision.
Brought to you by AltGov2 [www.altgov2.org]
Microgram Journal, Volume 6, Numbers 1-2 (January - June, 2008) 5
Results and Discussion
High purity dipropionylmorphine is easily prepared from morphine hydrochloride. As expected, heroin anddipropionylmorphine give highly similar FID responses. The selectivity of dipropionylmorphine on a DB-5column was excellent, with no interferences with any of the opium alkaloids, adulterants, and diluents typicallypresent in illicit heroin (see Figure 3 and Table 1). The stock solution was stable for over 2 years at 4OC (nodetectable degradation or hydrolysis, and consistent FID peak area and height counts (see Figure 4)).
The method linearity was determined over the concentration range stated in the Experimental section. Thecalculated correlation coefficient (R2) was 0.99999 (see Figure 5). The method precision was determined usingall nine of the solutions listed in the Experimental section, with seven replicate injections per solution. TheRelative Standard Deviations (RSDs) ranged from 0.04 to 0.17 percent. The method accuracy was determined byquantitating 11 illicit samples that had previously been analyzed in this laboratory via proton nuclear magneticresonance (1H-NMR) and capillary electrophoresis (CE). The average difference for the three methods wasdetermined to be 2.6 percent absolute (see Table 2).
Finally, the GC/FIDs of four different types of heroin are presented in Figure 6. Highly refined samples, such asSoutheast Asian (SEA/4) and South American (SA) heroin, as well as crudely refined samples, such as SouthwestAsian (SWA/A) and Mexican black tar (MEX) heroin, can all be routinely quantitated utilizing this method.
References:
1. Lurie IS, McGuinness K. The quantitation of heroin and selected basic impurities via reversed phaseHPLC. The analysis of adulterated samples. Journal of Liquid Chromatography 1987;10(10):2189-2204.
2. Lurie IS, Hays PA, Garcia AE, Panicker S. Use of dynamically coated capillaries for the determination ofheroin, basic impurities and adulterants with capillary electrophoresis. Journal of Chromatography 2004;1034:227-235.
3. Hays PA. Proton nuclear magnetic resonance spectroscopy (NMR) methods for determining the purity ofreference drug standards and illicit forensic drug seizures. Journal of Forensic Sciences 2005;50(6):1342-1360.
4. Huizer H, Poortman AJ. Some aspects of the gas chromatographic (GC) analysis of heroin. UnitedNations Office on Drugs and Crime, February 1989, SCITEC/5.
5. Moore JM, Bena FE. Rapid gas chromatographic assay for heroin in illicit preparations. AnalyticalChemistry 1972;44(2):385-387.
6. Cooper DA. A problem with GLC quantitation. Microgram 1978;11(5):10-15.*
7. Cook CE, Brine DR. Pyrolysis products of heroin. Journal of Forensic Sciences 1985;30(1):251-261.
8. Demedts P, Van den Heede J, Heyndrickx A. Diacetylnalorphine as an appropriate internal standard forthe GC analysis of illicit heroin samples. Microgram 1982;15(10):6-11.*
9. Zezulak BA, Snyder JJ, Needleman SB. Simultaneous analysis of codeine, morphine, and heroin after$-Glucuronidase hydrolysis. Journal of Forensic Sciences 1993;38(6):1275-1285.
* Law Enforcement Restricted Publication.
Brought to you by AltGov2 [www.altgov2.org]
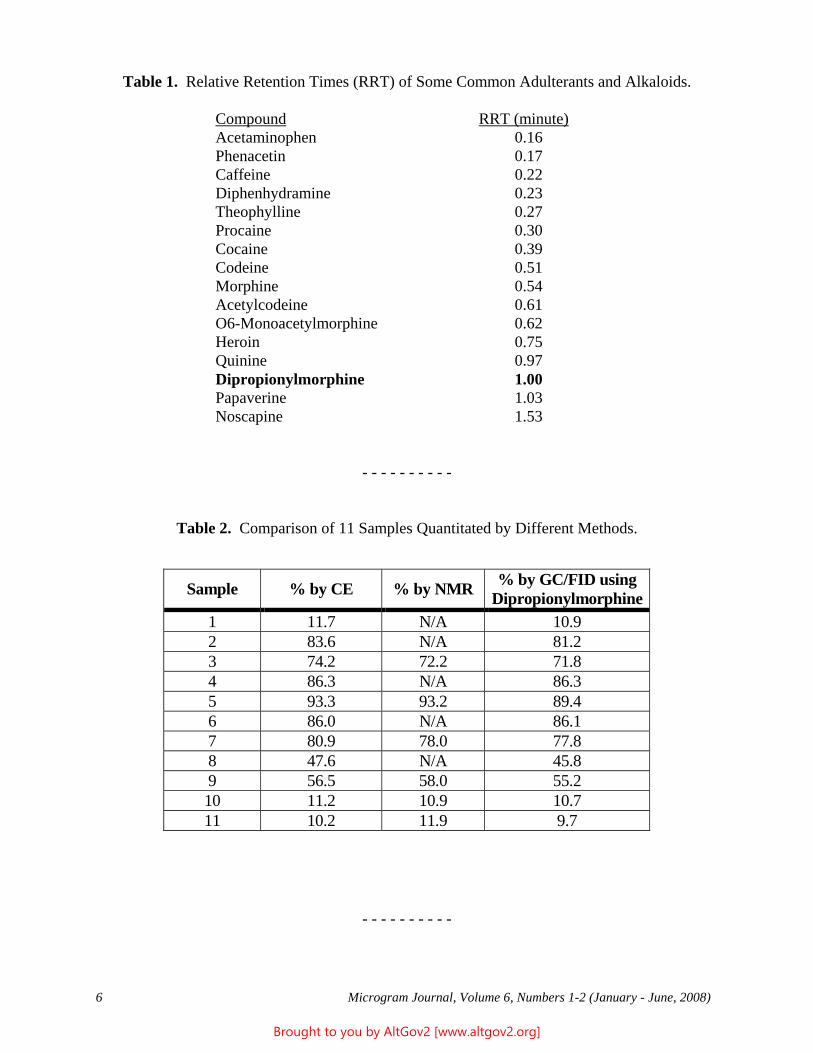
6 Microgram Journal, Volume 6, Numbers 1-2 (January - June, 2008)
Table 1. Relative Retention Times (RRT) of Some Common Adulterants and Alkaloids.
Compound RRT (minute)Acetaminophen 0.16Phenacetin 0.17Caffeine 0.22Diphenhydramine 0.23Theophylline 0.27Procaine 0.30Cocaine 0.39Codeine 0.51Morphine 0.54Acetylcodeine 0.61O6-Monoacetylmorphine 0.62Heroin 0.75Quinine 0.97Dipropionylmorphine 1.00Papaverine 1.03Noscapine 1.53
- - - - - - - - - -
Table 2. Comparison of 11 Samples Quantitated by Different Methods.
- - - - - - - - - -
Sample % by CE % by NMR % by GC/FID using Dipropionylmorphine
1 11.7 N/A 10.9 2 83.6 N/A 81.2 3 74.2 72.2 71.8 4 86.3 N/A 86.3 5 93.3 93.2 89.4 6 86.0 N/A 86.1 7 80.9 78.0 77.8 8 47.6 N/A 45.8 9 56.5 58.0 55.2 10 11.2 10.9 10.7 11 10.2 11.9 9.7
Brought to you by AltGov2 [www.altgov2.org]
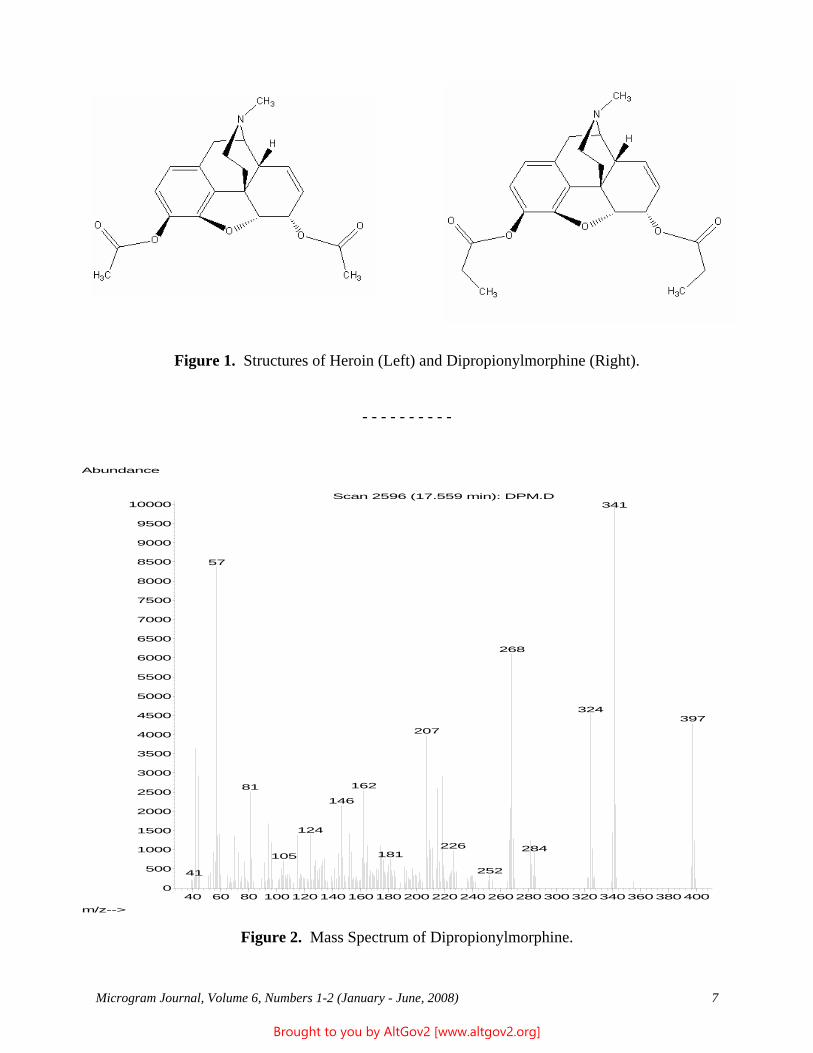
Microgram Journal, Volume 6, Numbers 1-2 (January - June, 2008) 7
Figure 1. Structures of Heroin (Left) and Dipropionylmorphine (Right).
- - - - - - - - - -
Figure 2. Mass Spectrum of Dipropionylmorphine.
40 60 80 1001201401601802002202402602803003203403603804000
500
1000
1500
2000
2500
3000
3500
4000
4500
5000
5500
6000
6500
7000
7500
8000
8500
9000
9500
10000
m/z-->
Abundance
Scan 2596 (17.559 min): DPM.D341
57
268
324397
207
16281
146
124
226 284181105
25241
Brought to you by AltGov2 [www.altgov2.org]
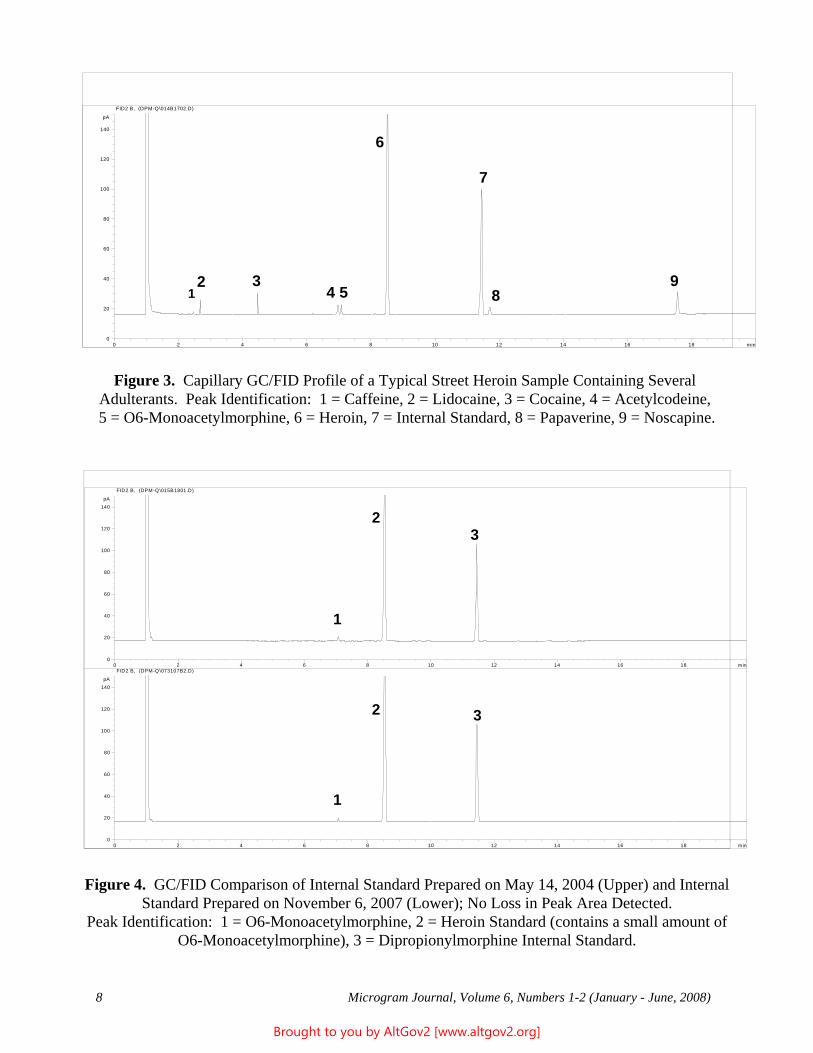
8 Microgram Journal, Volume 6, Numbers 1-2 (January - June, 2008)
Figure 3. Capillary GC/FID Profile of a Typical Street Heroin Sample Containing Several Adulterants. Peak Identification: 1 = Caffeine, 2 = Lidocaine, 3 = Cocaine, 4 = Acetylcodeine, 5 = O6-Monoacetylmorphine, 6 = Heroin, 7 = Internal Standard, 8 = Papaverine, 9 = Noscapine.
Figure 4. GC/FID Comparison of Internal Standard Prepared on May 14, 2004 (Upper) and InternalStandard Prepared on November 6, 2007 (Lower); No Loss in Peak Area Detected.
Peak Identification: 1 = O6-Monoacetylmorphine, 2 = Heroin Standard (contains a small amount ofO6-Monoacetylmorphine), 3 = Dipropionylmorphine Internal Standard.
min0 2 4 6 8 10 12 14 16 18
pA
0
20
40
60
80
100
120
140
FID2 B, (DPM-Q\014B1702.D)
1 2 3
4 5
6
7
8 9
min0 2 4 6 8 10 12 14 16 18
pA
0
20
40
60
80
100
120
140
FID2 B, (DPM-Q\015B1801.D)
min0 2 4 6 8 10 12 14 16 18
pA
0
20
40
60
80
100
120
140
FID2 B, (DPM-Q\073107B2.D)
1
1
2
2
3
3
Brought to you by AltGov2 [www.altgov2.org]
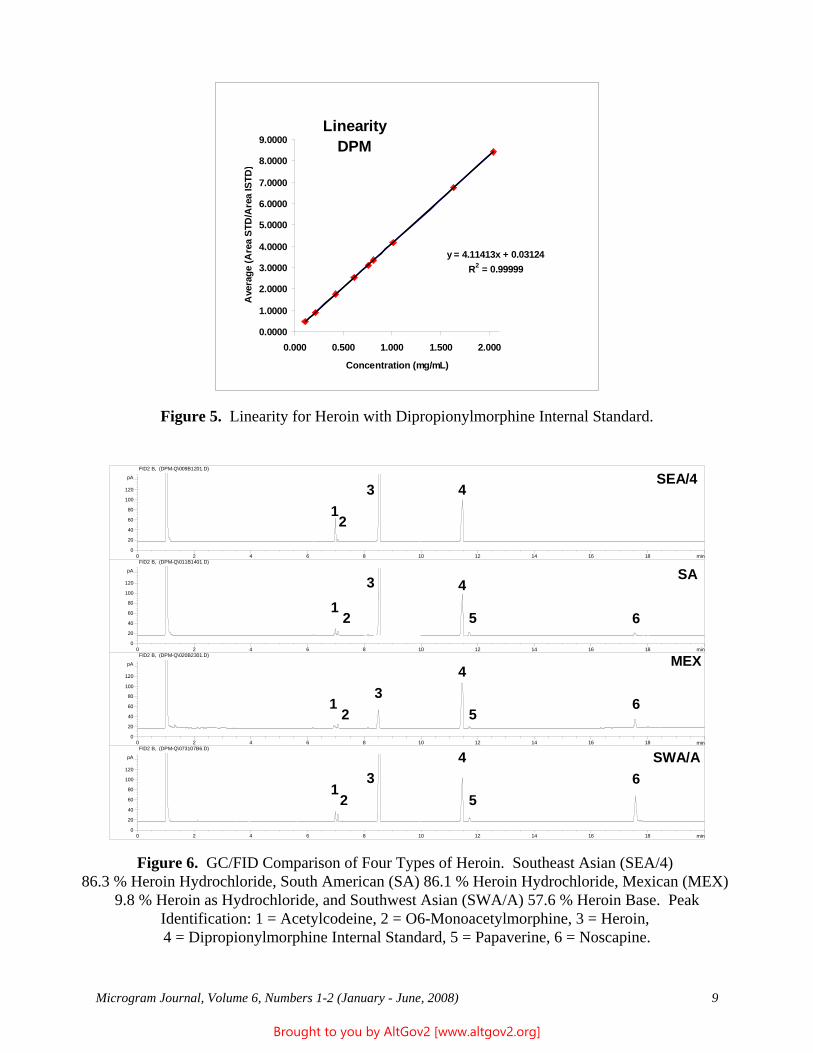
Microgram Journal, Volume 6, Numbers 1-2 (January - June, 2008) 9
Figure 5. Linearity for Heroin with Dipropionylmorphine Internal Standard.
Figure 6. GC/FID Comparison of Four Types of Heroin. Southeast Asian (SEA/4) 86.3 % Heroin Hydrochloride, South American (SA) 86.1 % Heroin Hydrochloride, Mexican (MEX)
9.8 % Heroin as Hydrochloride, and Southwest Asian (SWA/A) 57.6 % Heroin Base. PeakIdentification: 1 = Acetylcodeine, 2 = O6-Monoacetylmorphine, 3 = Heroin, 4 = Dipropionylmorphine Internal Standard, 5 = Papaverine, 6 = Noscapine.
LinearityDPM
y = 4.11413x + 0.03124R2 = 0.99999
0.0000
1.0000
2.0000
3.0000
4.0000
5.0000
6.0000
7.0000
8.0000
9.0000
0.000 0.500 1.000 1.500 2.000
Concentration (mg/mL)
Ave
rage
(Are
a ST
D/A
rea
ISTD
)
min0 2 4 6 8 10 12 14 16 18
pA
0
20
40
60
80
100
120
FID2 B, (DPM-Q\009B1201.D)
min0 2 4 6 8 10 12 14 16 18
pA
0
20
40
60
80
100
120
FID2 B, (DPM-Q\011B1401.D)
min0 2 4 6 8 10 12 14 16 18
pA
0
20
40
60
80
100
120
FID2 B, (DPM-Q\020B2301.D)
min0 2 4 6 8 10 12 14 16 18
pA
0
20
40
60
80
100
120
FID2 B, (DPM-Q\073107B6.D)
SEA/4
SA
MEX
SWA/A
1
1
1
1
2
2
2
2
3
3
3
3
4
4
4
4
5
5
5
6
6
6
Brought to you by AltGov2 [www.altgov2.org]
10 Microgram Journal, Volume 6, Numbers 1-2 (January - June, 2008)
Rapid Screening of Seized Drug Exhibits Using DesorptionElectrospray Ionization Mass Spectrometry (DESI-MS)
Sandra E. Rodriguez-Cruz, Ph.D.U.S. Department of Justice
Drug Enforcement AdministrationSouthwest Laboratory
2815 Scott StreetVista, CA 92081
[email: Sandra.E.Rodriguez-Cruz -at- usdoj.gov]
[Presented in Part at the 2007 American Society for Mass Spectrometry (ASMS) Fall Workshop - The Artof Open Air Ionization on Surfaces, Philadelphia, PA (November 9, 2007).]
ABSTRACT: Desorption electrospray ionization mass spectrometry (DESI-MS), an extension of theelectrospray ionization technique, is utilized for the rapid screening and/or pre-analysis of multi-unit exhibits. Multiple real-case analyses are presented, including hydrocodone tablets, Ecstasy tablets containingMDMA/methamphetamine mixtures, prednisone tablets, alprazolam tablets, marijuana, counterfeit sildenafilcitrate tablets containing sildenafil base, counterfeit oxycodone tablets containing fentanyl, breath mintscontaining )9-tetrahydrocannabinol, a chocolate-coated opium bar, and an unknown liquid containing a mixtureof gamma-butyrolactone and gamma-hydroxybutyric acid. Analyses were conducted directly on the samples, inmost cases with no sample preparation, and the results were obtained in less than 30 seconds per sample. Additionally, the use of DESI-MS/MS enabled identification of the controlled substances and adulterants in thesamples.
KEYWORDS: Desorption Electrospray Ionization Mass Spectrometry, DESI-MS, DESI-MS/MS, ControlledSubstances, Screening, Analysis, Forensic Chemistry.
Introduction
Forensic laboratories with large caseloads need high-throughput sampling and identification techniques in order toreduce turn-around times while fulfilling the requirements of the judicial system. For exhibits composed ofmultiple units, even if the units are visually indistinguishable, the standard analytical protocol requires apre-analysis (screening) on each individual or selected unit to determine composition, before either combinationof the units into a homogeneous composite, or separation of the units into several mutually exclusive subgroups,based on the results. For decades, screening was done with a combination of visual inspection, color tests,microcrystal tests, thin-layer chromatography, microscopy, and similar techniques. However, most suchtechniques are only presumptive, and evolving laboratory policy and procedures mandate the identification of allcontrolled substances in each individual unit prior to composition.
The capabilities of analytical instruments (including screening instruments) have been greatly extended with theaddition of powerful detectors, autosampling devices, data handling computers, and library searching abilities. However, increasing sophistication usually equates to longer analyses and the generation of very large amounts ofdata, increasing turnaround times. Furthermore, sample preparation, extractions, and chemical derivatizationsteps are still often necessary in order to conclusively identify active ingredient(s). Currently, gaschromatography - mass spectrometry (GC/MS) is the most commonly used technique for the screening andpreliminary identification of forensic exhibits. However, depending on instrument parameters, even short GC
Brought to you by AltGov2 [www.altgov2.org]
Microgram Journal, Volume 6, Numbers 1-2 (January - June, 2008) 11
analyses can take five minutes between injections. For a case with 25 samples, this already translates into morethan two hours of analysis, not including sample preparation time and data processing. Standard GC and GC/MSanalyses usually take considerably longer. Pre-analyses/screening of individual units can also be done withinfrared (FTIR) or Raman spectroscopy; however, these techniques are best suited to pure or uncut samples, andare usually not very fast. For these reasons, there is a continuing need for instrumental techniques that can veryrapidly analyze large numbers of samples, including samples with multiple components.
A rapid, confirmational screening technique for the analysis of benzodiazepines in drinks using direct electrosprayprobe / mass spectrometry has been reported [1]. However, although able to identify unknown samples duringrapid screening, an extraction procedure was required prior to analysis. Fast analysis of multiple drugs of abusein urine and hair using liquid chromatography - mass spectrometry techniques have been reported [2,3]. Morerecently, Cooks et al. [4] reported the development of a new, ambient sampling technique, desorption electrosprayionization (DESI). This technique allows for the rapid analyses of samples under ambient conditions and withoutany type of sample preparation, using mass spectrometry as the detector. Also recently, Cody et al. developedanother technique for rapid atmospheric sampling using mass spectrometry [5]. Direct analysis in real time(DART) interfaced with time-of-flight mass spectrometry also allows the analysis of samples without the need forsample preparation or extraction procedures. The introduction of these techniques represents a significant stepforward in the development of high-throughput analyses. Their application to the analysis of forensic samplescould have a great impact on the quantity and quality of data generated by forensic chemists, especially for therapid confirmatory screening of controlled substances.
During DESI, charged solvent droplets are directed towards the surface of a sample, resulting in the formation ofsingly and/or multiply charged species similar to those observed under normal electrospray conditions [6,7]. Thesamples can be analyzed either directly or after deposition onto a non-conducting surface. The interface of theDESI technique with a mass spectrometer (DESI-MS) or a tandem mass spectrometer (DESI-MS/MS) allows forthe formal identification of the charged species. It has been proposed that the ion formation process during DESIoccurs via at least three mechanisms [4]. The first involves a molecule-pick-up process resulting from the impactof charged solvent droplets onto the sample surface. This mechanism is believed to be responsible for theESI-like spectra generated during DESI. The second involves a charge and momentum transfer leading todesorption of the sample molecules as ions. Indirect evidence for this mechanism is obtained by the generation ofDESI spectra for carotenoid compounds, which otherwise are not ionized using ESI. The third involves thevolatilization or desorption of neutral species followed by gas-phase ionization via ion/molecule reactions.
Herein, multiple applications of DESI-MS and DESI-MS/MS for the screening and analysis of various controlledsubstances are presented. Our previous studies are also summarized here, as they further demonstrate theapplication of this recently developed technique for forensic analyses [8]. Samples of licit as well as illicit originwere investigated, and the rapid identification of the controlled active ingredient(s) was/were achieved. Analyseswere conducted directly on the samples, in most cases with no sample preparation, and were completed in lessthan 30 seconds per sample.
Experimental
Experiments were performed using a Thermo Fisher Scientific LCQ Advantage MAX quadrupole ion-trap massspectrometer equipped with an IonMAX atmospheric pressure ionization source and an ESI probe (San Jose, CA). This system was interfaced to a Thermo Fisher Scientific Surveyor HPLC system. For the DESI experiments, thedesorbing solvent was delivered by the built-in syringe pump on the mass spectrometer or by the solvent deliverypump of the HPLC system. These two options allowed for delivery of solvent at flow rates between 2 and 100 :Lper minute. Depending on experimental needs, the desorbing solvent was a mixture of methanol, deionized water(0.1 percent formic acid), and/or acetonitrile (0.1 percent formic acid). The solvent was directed to the ESIinterface without further modification.
Brought to you by AltGov2 [www.altgov2.org]
12 Microgram Journal, Volume 6, Numbers 1-2 (January - June, 2008)
The atmospheric pressure ionization chamber was kept opened to the laboratory atmosphere and the automatichigh voltage shut-off of the IonMAX chamber was disabled in order to allow sampling. Once constant ESIsolvent, voltage, and current were achieved, direct sampling was performed. As during routine electrosprayoperation, the droplet desolvation process was aided using Nitrogen (99 percent; 100 ± 20 psi) as both the sheathand auxiliary gas, operated at 50 and 20 units, respectively. The ESI source transfer capillary was maintained at atemperature of 250OC, while the capillary and tube lens were kept at 30 and 15 V, respectively.
Instrument control, data collection and analysis were performed using the Xcalibur software (version 1.4)provided by the instrument manufacturer. Mass spectrometry data were collected in the positive ion mode usingeither the real-time view provided by the Tune Plus program module or through the Sequence module provided bythe software. By setting up the mass analyzer to collect both full-scan and MSn data, molecular weight andstructural information was obtained. Collision-induced dissociation experiments were performed afteroptimization of the collision energy (typically 25-35 percent eV) for the analyte. Helium (99.999 percent; 40 ± 10psi) was used as both the trapping and collision gas. Under these conditions, the fragmentation data obtainedfrom DESI-generated ions can be directly compared to the laboratory-generated standard spectral librarypreviously developed using ESI-generated ions.
Samples were obtained from seized exhibits submitted to the laboratory for forensic analysis, and were analyzedas received (i.e., with no preparation or derivatization steps prior to the DESI-MS and/or DESI-MS/MS analyses). Sampling was performed by positioning a flat portion of the material in question, using non-conducting (Teflon®)tweezers, slightly below the entrance to the mass spectrometer, within the electrospray plume region (see Photo1). The samples were positioned to obtain a 45 degree angle (approximately) between the flat surface to beanalyzed and the electrospray emitter (optimal sample positioning has been addressed by Cooks et al. [4]). Samples were analyzed for 1 to 5 seconds, and sufficient solvent-only collection time (approximately 1 minute)was allowed between samples in order for the signal background to return to low levels.
Results and Discussion, I - Previous Studies
Previously, this laboratory used DESI-MS and DESI-MS/MS for the rapid analyses of various tablets andmarijuana [8]. The objectives and results of those studies (summarized below) demonstrated the use of thesetechniques for pre-analysis/screening purposes.
Objective 1: To demonstrate that the technique can detect the presence of one or more controlled substances inthe presence of other major matrix components. Analyses were conducted on authentic Vicodin® tablets and onillicit Ecstasy-type tablets suspected to contain 3,4-methylenedioxymethamphetamine (MDMA). Each Vicodin®tablet contained 5 mg of hydrocodone bitartrate, 500 mg of acetaminophen, and various tablet bindingcomponents [9]. Figure 1 shows the ambient sampling of five of these tablets. The total-ion-current (TIC)(upper) trace shows the real-time sampling of the tablets (completed in less than 6 minutes), with each peakrepresenting a different tablet. The bottom five panels display the full-scan mass spectra for each tablet. Themolecular ions at m/z 152 and 325 correspond to protonated acetaminophen (MW = 151 Da) and thesodium-bound dimer of acetaminophen (2M+Na+)+, respectively. The peak at m/z 300 is due to protonatedhydrocodone (MW = 299 Da). It is noteworthy that the presence of acetaminophen does not interfere with thedetection of hydrocodone, even though the concentration of the latter is 100 times lower. The observed relativeintensities of the two components vary from sample to sample due to the variable (non-reproducible) positioningof the tablets within the ESI plume.
Figure 2 shows the ambient sampling of five suspected Ecstasy tablets. The full-scan mass spectral data shows amajor component at m/z 194, consistent with MDMA (MW = 193 Da), and additional peaks at m/z 163 and 150. The peak at m/z 163 corresponds to a fragment commonly observed during analysis of themethylenedioxyphenethylamines. The peak at m/z 150 suggests the presence of methamphetamine (MW = 149
Brought to you by AltGov2 [www.altgov2.org]
Microgram Journal, Volume 6, Numbers 1-2 (January - June, 2008) 13
Da). Further chemical analysis confirmed the presence of MDMA hydrochloride and methamphetaminehydrochloride at concentrations of 57.0 and 9.5 milligrams/tablet, respectively.
Objective 2: To demonstrate that the methodology is free of interferences and/or cross-contamination (carry-over) from previously tested samples. Analyses were conducted on authentic prednisone and Vicodin® tablets. The first and third tablets were prednisone (MW = 358 Da), while the second and fourth tablets were Vicodin®(same as above). Figure 3 shows the results from the alternating sampling of the four tablets. The prednisonetablets (left panels) display a molecular ion at m/z 359. The Vicodin® tablets (right panels) again display themolecular ions for acetaminophen and hydrocodone. No interferences or cross-contamination (carry-over) areobserved in any of the spectra.
Objective 3: To demonstrate that the methodology can identify controlled substances. DESI-MS/MS analyseswere conducted on 23 authentic Xanax® tablets; each tablet contained 2 milligrams of alprazolam (MW = 308Da). Figure 4 shows the ambient sampling for four of these tablets. The fragmentation data contains the majorfragment ions generated upon dissociation of the m/z 309 ion; comparison with a previously generated librarystandard confirmed alprazolam. For a total tablet weight of 260 milligrams, this represents detection of the activeingredient at a concentration of 0.7 percent. Of note, the MS/MS data obtained using DESI can be directlycompared with the laboratory-generated ESI library using standard MS/MS conditions. Thus, the development ofa DESI-MS/MS specific library is not necessary.
Objective 4: To demonstrate that the methodology can analyze plant material. Cooks and co-workerspreviously performed DESI-MS analyses on various natural products, including tomatoes and hibiscus flowers[4]. Their experiments confirmed the ability of DESI-MS to detect some of the main components in thesesubstances, regardless of interferences generated by the complicated plant matrices. Figure 5 displays theDESI-MS data from the ambient sampling of three dried marijuana leaves. The spectrum included one majormolecular ion at m/z 315 and minor peaks at m/z 311, 327, 341, and 359. The peak at 311 corresponds toprotonated cannabinol (MW = 310 Da), while the peak at m/z 315 is due to delta-9-tetrahydrocannabinol (THC;MW = 314 Da). The peaks at m/z 341 and 359 are probably due to other minor cannabinoids, likely including thecarboxylic acid of THC (MW = 358 Da). The identification of THC was confirmed by performing MS/MSexperiments, which matched the previously generated library standard.
Results and Discussion, II - Recent Applications
Additional forensic applications of DESI-MS and DESI-MS/MS continue to be developed at this laboratory. Themost recent applications (summarized below) include analyses of counterfeit pharmaceuticals, “medical”marijuana exhibits, gamma-butyrolactone (GBL) and gamma-hydroxybutyrate (GHB), and disguised opiumformulations.
Counterfeit Pharmaceuticals - Counterfeit tablets and liquids are commonly submitted to this laboratory, usuallypursuant to diversion investigations targeting the commercial black market. For example, the laboratory hasrecently received multiple exhibits of white tablets suspected to be counterfeit Viagra® (see Figure 6). Thesetablets all bore the characteristic logos; however, legitimate tablets are blue and contain sildenafil citrate. Analysis by DESI-MS and DESI-MS/MS confirmed sildenafil (MW = 474 Da); however, citrate (MW = 190) wasnot present (see Figure 6, lower panel), confirming that the tablets were counterfeits.
In another recent case, the laboratory received 9,463 round, concave, green tablets bearing “OC” and “80”inscriptions, suspected to be counterfeit or mimic Oxycontin® (see Figure 7). Again, the tablets all bore thecorrect logos; however, the tablets were slightly smaller than the legitimate product, and also were greenthroughout (the legitimate product is a compressed white powder with a colored coating). Analysis of nearly tenthousand tablets would be a daunting task for any forensic laboratory; however, the DEA evidence sampling planallows for preliminary analysis of 29 randomly selected tablets, and if the results are consistent in all 29 tablets,formulation of a final composite for full characterization and purity determination [10]. Even screening of 29
Brought to you by AltGov2 [www.altgov2.org]
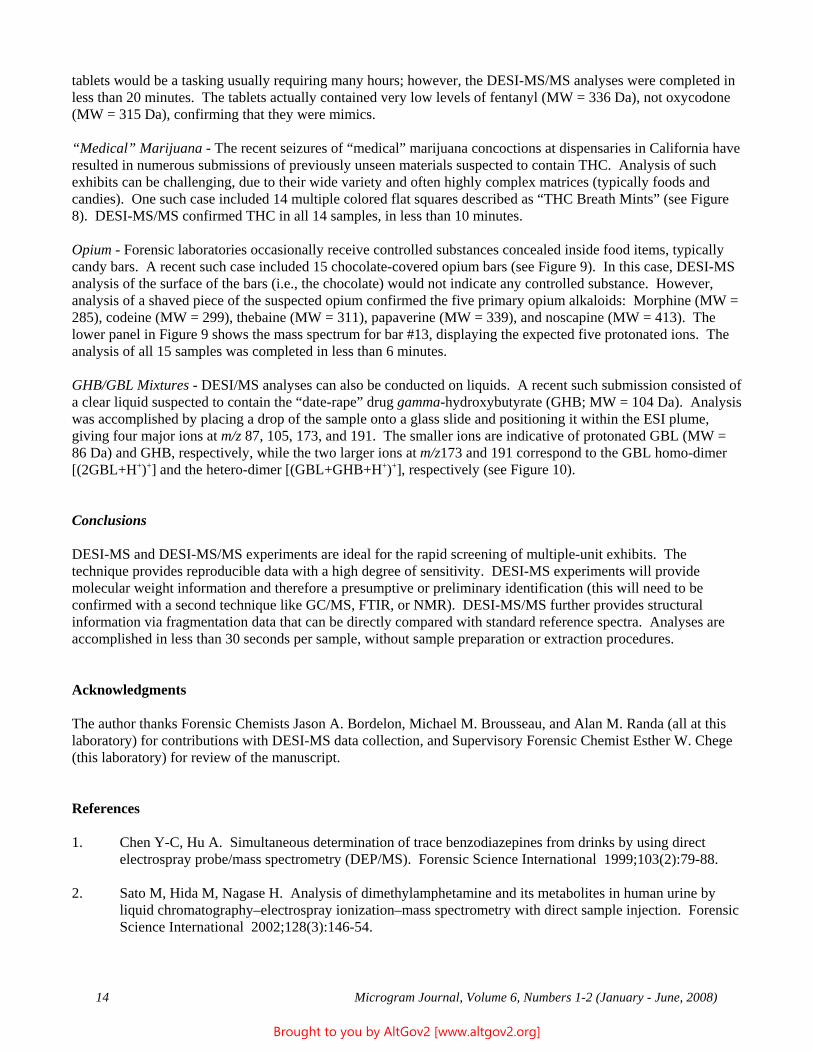
14 Microgram Journal, Volume 6, Numbers 1-2 (January - June, 2008)
tablets would be a tasking usually requiring many hours; however, the DESI-MS/MS analyses were completed inless than 20 minutes. The tablets actually contained very low levels of fentanyl (MW = 336 Da), not oxycodone(MW = 315 Da), confirming that they were mimics.
“Medical” Marijuana - The recent seizures of “medical” marijuana concoctions at dispensaries in California haveresulted in numerous submissions of previously unseen materials suspected to contain THC. Analysis of suchexhibits can be challenging, due to their wide variety and often highly complex matrices (typically foods andcandies). One such case included 14 multiple colored flat squares described as “THC Breath Mints” (see Figure8). DESI-MS/MS confirmed THC in all 14 samples, in less than 10 minutes.
Opium - Forensic laboratories occasionally receive controlled substances concealed inside food items, typicallycandy bars. A recent such case included 15 chocolate-covered opium bars (see Figure 9). In this case, DESI-MSanalysis of the surface of the bars (i.e., the chocolate) would not indicate any controlled substance. However,analysis of a shaved piece of the suspected opium confirmed the five primary opium alkaloids: Morphine (MW =285), codeine (MW = 299), thebaine (MW = 311), papaverine (MW = 339), and noscapine (MW = 413). Thelower panel in Figure 9 shows the mass spectrum for bar #13, displaying the expected five protonated ions. Theanalysis of all 15 samples was completed in less than 6 minutes.
GHB/GBL Mixtures - DESI/MS analyses can also be conducted on liquids. A recent such submission consisted ofa clear liquid suspected to contain the “date-rape” drug gamma-hydroxybutyrate (GHB; MW = 104 Da). Analysiswas accomplished by placing a drop of the sample onto a glass slide and positioning it within the ESI plume,giving four major ions at m/z 87, 105, 173, and 191. The smaller ions are indicative of protonated GBL (MW =86 Da) and GHB, respectively, while the two larger ions at m/z173 and 191 correspond to the GBL homo-dimer[(2GBL+H+)+] and the hetero-dimer [(GBL+GHB+H+)+], respectively (see Figure 10).
Conclusions
DESI-MS and DESI-MS/MS experiments are ideal for the rapid screening of multiple-unit exhibits. Thetechnique provides reproducible data with a high degree of sensitivity. DESI-MS experiments will providemolecular weight information and therefore a presumptive or preliminary identification (this will need to beconfirmed with a second technique like GC/MS, FTIR, or NMR). DESI-MS/MS further provides structuralinformation via fragmentation data that can be directly compared with standard reference spectra. Analyses areaccomplished in less than 30 seconds per sample, without sample preparation or extraction procedures.
Acknowledgments
The author thanks Forensic Chemists Jason A. Bordelon, Michael M. Brousseau, and Alan M. Randa (all at thislaboratory) for contributions with DESI-MS data collection, and Supervisory Forensic Chemist Esther W. Chege(this laboratory) for review of the manuscript.
References
1. Chen Y-C, Hu A. Simultaneous determination of trace benzodiazepines from drinks by using directelectrospray probe/mass spectrometry (DEP/MS). Forensic Science International 1999;103(2):79-88.
2. Sato M, Hida M, Nagase H. Analysis of dimethylamphetamine and its metabolites in human urine byliquid chromatography–electrospray ionization–mass spectrometry with direct sample injection. ForensicScience International 2002;128(3):146-54.
Brought to you by AltGov2 [www.altgov2.org]
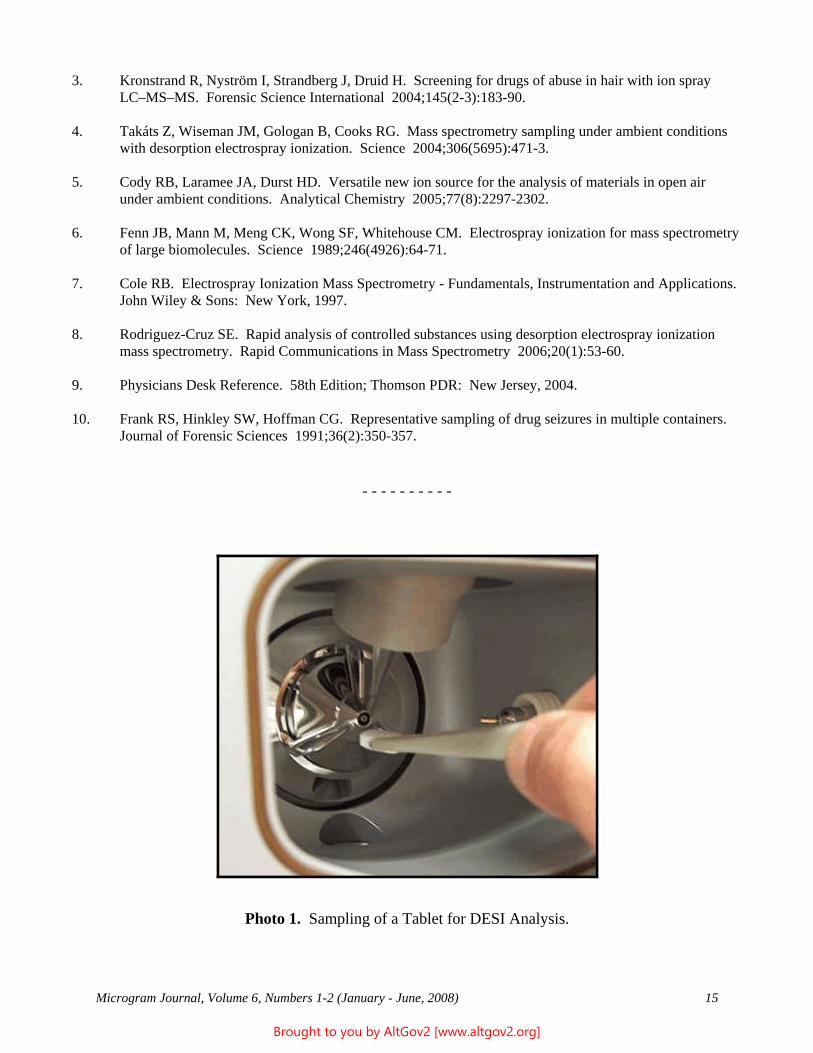
Microgram Journal, Volume 6, Numbers 1-2 (January - June, 2008) 15
3. Kronstrand R, Nyström I, Strandberg J, Druid H. Screening for drugs of abuse in hair with ion sprayLC–MS–MS. Forensic Science International 2004;145(2-3):183-90.
4. Takáts Z, Wiseman JM, Gologan B, Cooks RG. Mass spectrometry sampling under ambient conditionswith desorption electrospray ionization. Science 2004;306(5695):471-3.
5. Cody RB, Laramee JA, Durst HD. Versatile new ion source for the analysis of materials in open airunder ambient conditions. Analytical Chemistry 2005;77(8):2297-2302.
6. Fenn JB, Mann M, Meng CK, Wong SF, Whitehouse CM. Electrospray ionization for mass spectrometryof large biomolecules. Science 1989;246(4926):64-71.
7. Cole RB. Electrospray Ionization Mass Spectrometry - Fundamentals, Instrumentation and Applications. John Wiley & Sons: New York, 1997.
8. Rodriguez-Cruz SE. Rapid analysis of controlled substances using desorption electrospray ionizationmass spectrometry. Rapid Communications in Mass Spectrometry 2006;20(1):53-60.
9. Physicians Desk Reference. 58th Edition; Thomson PDR: New Jersey, 2004.
10. Frank RS, Hinkley SW, Hoffman CG. Representative sampling of drug seizures in multiple containers. Journal of Forensic Sciences 1991;36(2):350-357.
- - - - - - - - - -
Photo 1. Sampling of a Tablet for DESI Analysis.
Brought to you by AltGov2 [www.altgov2.org]
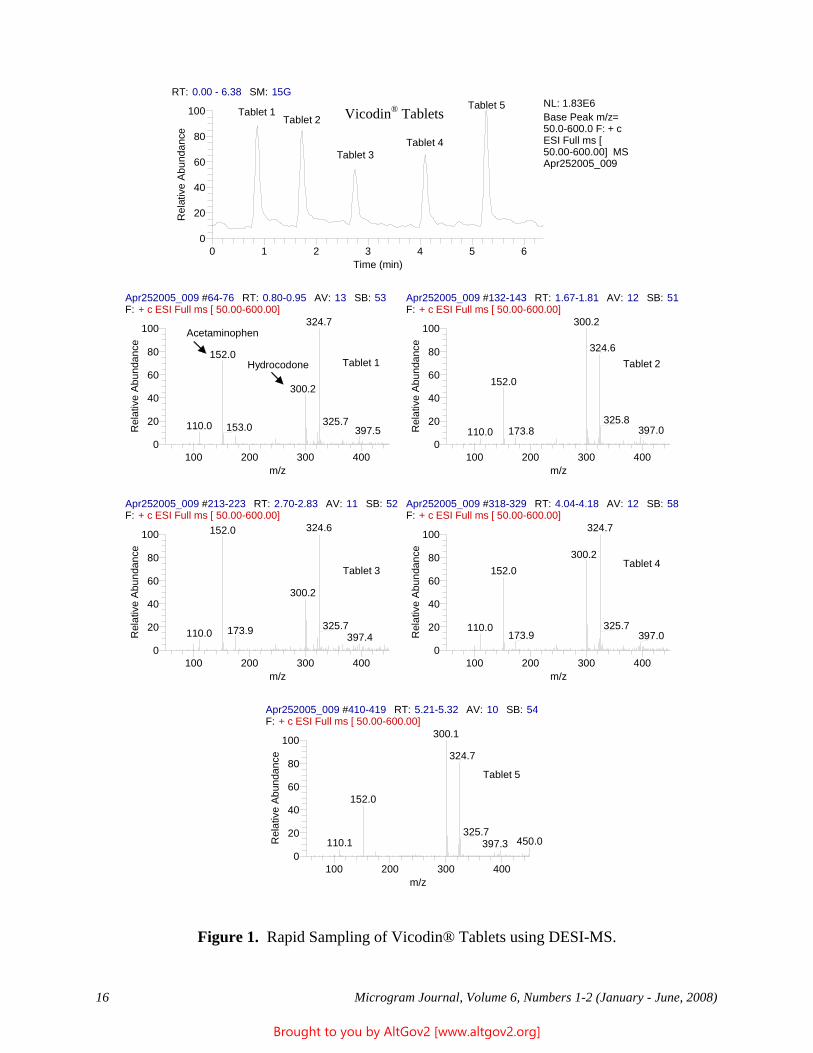
16 Microgram Journal, Volume 6, Numbers 1-2 (January - June, 2008)
Figure 1. Rapid Sampling of Vicodin® Tablets using DESI-MS.
RT: 0.00 - 6.38 SM: 15G
0 1 2 3 4 5 6Time (min)
0
20
40
60
80
100
Rel
ativ
e Ab
unda
nce
Tablet 5
Tablet 4Tablet 3
Tablet 2Tablet 1
NL: 1.83E6Base Peak m/z= 50.0-600.0 F: + c ESI Full ms [ 50.00-600.00] MS Apr252005_009
Apr252005_009 #64-76 RT: 0.80-0.95 AV: 13 SB: 53F: + c ESI Full ms [ 50.00-600.00]
100 200 300 400m/z
0
20
40
60
80
100
Rel
ativ
e Ab
unda
nce
Tablet 1Hydrocodone
Acetaminophen324.7
152.0
300.2
325.7110.0 153.0 397.5
Apr252005_009 #132-143 RT: 1.67-1.81 AV: 12 SB: 51F: + c ESI Full ms [ 50.00-600.00]
100 200 300 400m/z
0
20
40
60
80
100
Rel
ativ
e Ab
unda
nce
Tablet 2
300.2
324.6
152.0
325.8397.0173.8110.0
Apr252005_009 #213-223 RT: 2.70-2.83 AV: 11 SB: 52F: + c ESI Full ms [ 50.00-600.00]
100 200 300 400m/z
0
20
40
60
80
100
Rel
ativ
e A
bund
ance
Tablet 3
324.6152.0
300.2
325.7173.9110.0 397.4
Apr252005_009 #318-329 RT: 4.04-4.18 AV: 12 SB: 58F: + c ESI Full ms [ 50.00-600.00]
100 200 300 400m/z
0
20
40
60
80
100
Rel
ativ
e A
bund
ance
Tablet 4
324.7
300.2152.0
325.7110.0173.9 397.0
Apr252005_009 #410-419 RT: 5.21-5.32 AV: 10 SB: 54F: + c ESI Full ms [ 50.00-600.00]
100 200 300 400m/z
0
20
40
60
80
100
Rel
ativ
e Ab
unda
nce
Tablet 5
300.1
324.7
152.0
325.7450.0110.1 397.3
Vicodin® Tablets
Brought to you by AltGov2 [www.altgov2.org]
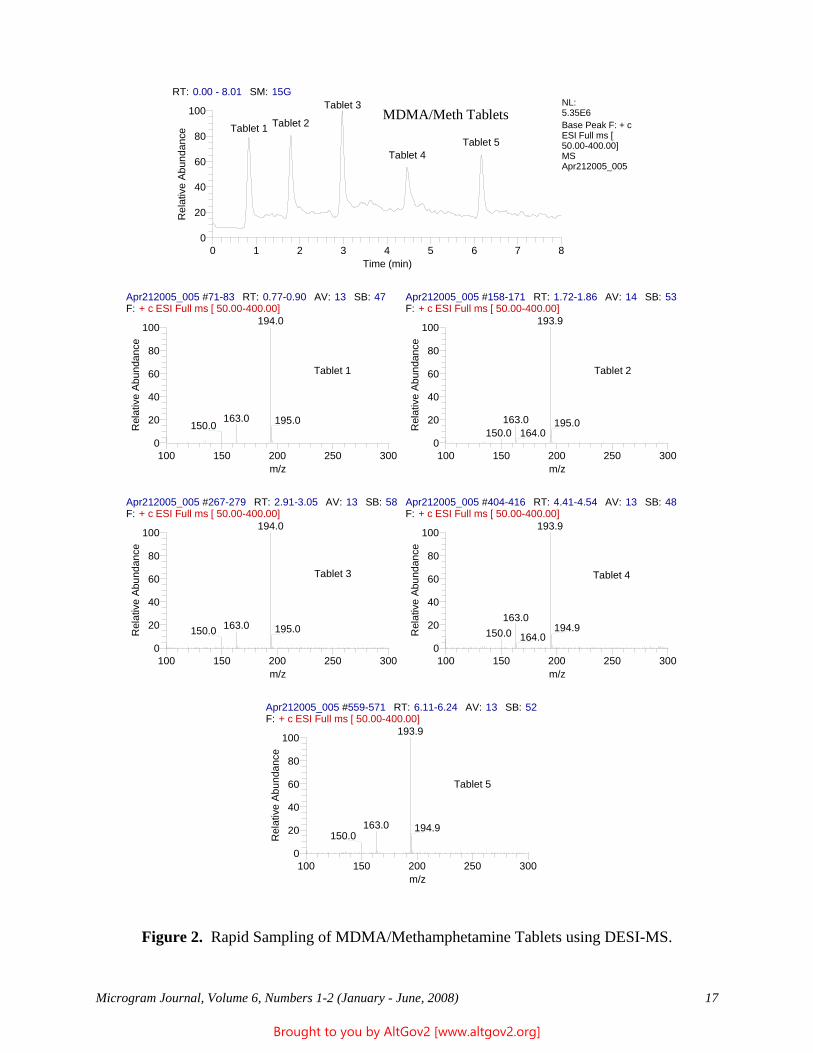
Microgram Journal, Volume 6, Numbers 1-2 (January - June, 2008) 17
Figure 2. Rapid Sampling of MDMA/Methamphetamine Tablets using DESI-MS.
RT: 0.00 - 8.01 SM: 15G
0 1 2 3 4 5 6 7 8Time (min)
0
20
40
60
80
100
Rel
ativ
e A
bund
ance
MDMA / Meth Tablets
Tablet 5Tablet 4
Tablet 3
Tablet 2Tablet 1
NL:5.35E6Base Peak F: + c ESI Full ms [ 50.00-400.00] MS Apr212005_005
Apr212005_005 #71-83 RT: 0.77-0.90 AV: 13 SB: 47F: + c ESI Full ms [ 50.00-400.00]
100 150 200 250 300m/z
0
20
40
60
80
100
Rel
ativ
e A
bund
ance
Tablet 1
194.0
163.0 195.0150.0
Apr212005_005 #158-171 RT: 1.72-1.86 AV: 14 SB: 53F: + c ESI Full ms [ 50.00-400.00]
100 150 200 250 300m/z
0
20
40
60
80
100
Rel
ativ
e A
bund
ance
Tablet 2
193.9
163.0 195.0164.0150.0
Apr212005_005 #267-279 RT: 2.91-3.05 AV: 13 SB: 58F: + c ESI Full ms [ 50.00-400.00]
100 150 200 250 300m/z
0
20
40
60
80
100
Rel
ativ
e A
bund
ance
Tablet 3
194.0
163.0 195.0150.0
Apr212005_005 #404-416 RT: 4.41-4.54 AV: 13 SB: 48F: + c ESI Full ms [ 50.00-400.00]
100 150 200 250 300m/z
0
20
40
60
80
100
Rel
ativ
e A
bund
ance
Tablet 4
193.9
163.0194.9150.0 164.0
Apr212005_005 #559-571 RT: 6.11-6.24 AV: 13 SB: 52F: + c ESI Full ms [ 50.00-400.00]
100 150 200 250 300m/z
0
20
40
60
80
100
Rel
ativ
e A
bund
ance
Tablet 5
193.9
163.0 194.9150.0
MDMA/Meth Tablets
Brought to you by AltGov2 [www.altgov2.org]
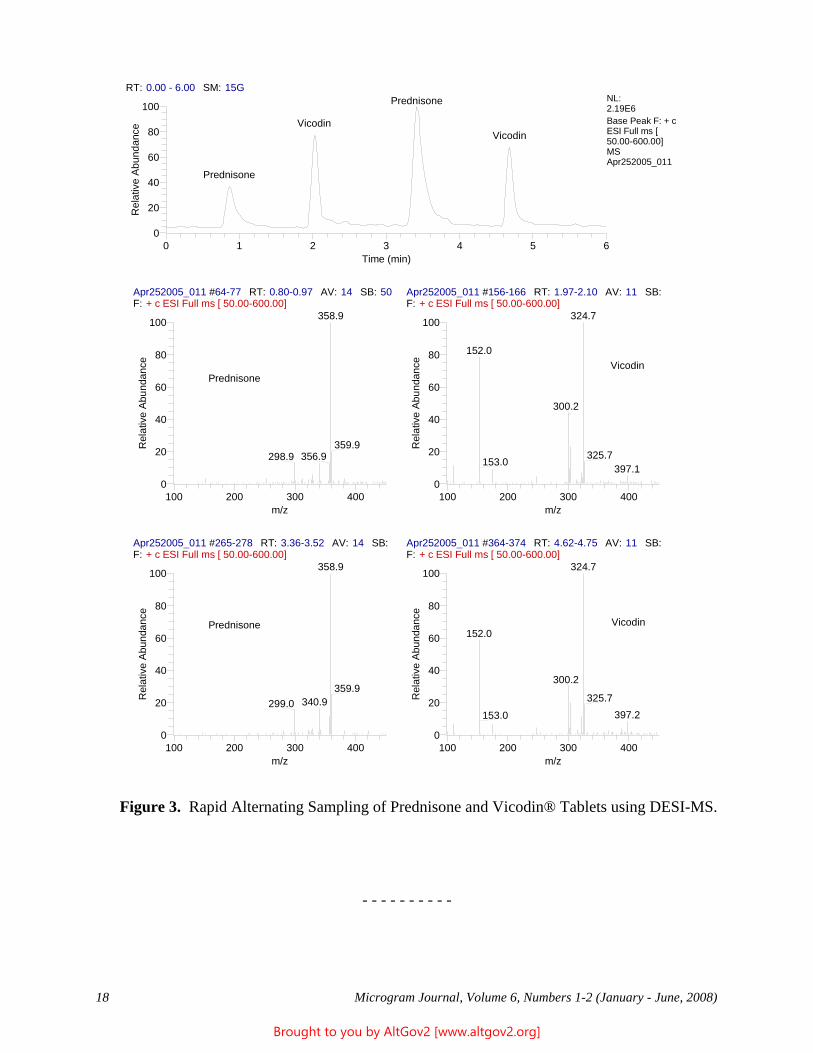
18 Microgram Journal, Volume 6, Numbers 1-2 (January - June, 2008)
Figure 3. Rapid Alternating Sampling of Prednisone and Vicodin® Tablets using DESI-MS.
- - - - - - - - - -
RT: 0.00 - 6.00 SM: 15G
0 1 2 3 4 5 6Time (min)
0
20
40
60
80
100
Rel
ativ
e A
bund
ance Vicodin
Vicodin
Prednisone
Prednisone
NL:2.19E6Base Peak F: + c ESI Full ms [ 50.00-600.00] MS Apr252005_011
Apr252005_011 #64-77 RT: 0.80-0.97 AV: 14 SB: 50F: + c ESI Full ms [ 50.00-600.00]
100 200 300 400m/z
0
20
40
60
80
100
Rel
ativ
e Ab
unda
nce
Prednisone
358.9
359.9356.9298.9
Apr252005_011 #156-166 RT: 1.97-2.10 AV: 11 SB:F: + c ESI Full ms [ 50.00-600.00]
100 200 300 400m/z
0
20
40
60
80
100
Rel
ativ
e Ab
unda
nce Vicodin
324.7
152.0
300.2
325.7153.0
397.1
Apr252005_011 #265-278 RT: 3.36-3.52 AV: 14 SB:F: + c ESI Full ms [ 50.00-600.00]
100 200 300 400m/z
0
20
40
60
80
100
Rel
ativ
e A
bund
ance
Prednisone
358.9
359.9340.9299.0
Apr252005_011 #364-374 RT: 4.62-4.75 AV: 11 SB:F: + c ESI Full ms [ 50.00-600.00]
100 200 300 400m/z
0
20
40
60
80
100
Rel
ativ
e A
bund
ance Vicodin
324.7
152.0
300.2
325.7397.2153.0
Brought to you by AltGov2 [www.altgov2.org]
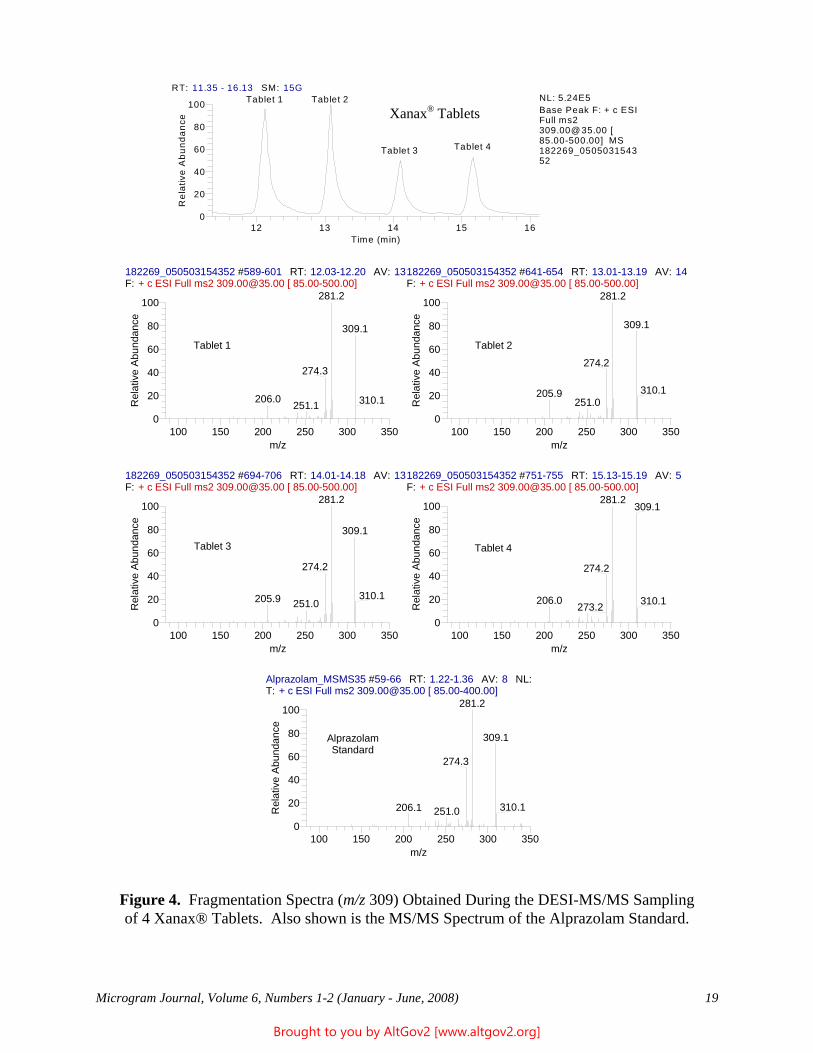
Microgram Journal, Volume 6, Numbers 1-2 (January - June, 2008) 19
Figure 4. Fragmentation Spectra (m/z 309) Obtained During the DESI-MS/MS Samplingof 4 Xanax® Tablets. Also shown is the MS/MS Spectrum of the Alprazolam Standard.
RT: 11.35 - 16.13 SM: 15G
12 13 14 15 16Time (min)
0
20
40
60
80
100
Rel
ativ
e A
bund
ance
Tablet 4Tablet 3
Tablet 2Tablet 1 NL: 5.24E5Base Peak F: + c ESI Full ms2 309.00@ 35.00 [ 85.00-500.00] MS 182269_050503154352
182269_050503154352 #589-601 RT: 12.03-12.20 AV: 13F: + c ESI Full ms2 [email protected] [ 85.00-500.00]
100 150 200 250 300 350m/z
0
20
40
60
80
100
Rel
ativ
e A
bund
ance
Tablet 1
281.2
309.1
274.3
206.0 310.1251.1
182269_050503154352 #641-654 RT: 13.01-13.19 AV: 14F: + c ESI Full ms2 [email protected] [ 85.00-500.00]
100 150 200 250 300 350m/z
0
20
40
60
80
100
Rel
ativ
e A
bund
ance
Tablet 2
281.2
309.1
274.2
310.1205.9251.0
182269_050503154352 #694-706 RT: 14.01-14.18 AV: 13F: + c ESI Full ms2 [email protected] [ 85.00-500.00]
100 150 200 250 300 350m/z
0
20
40
60
80
100
Rel
ativ
e A
bund
ance
Tablet 3
281.2
309.1
274.2
310.1205.9 251.0
182269_050503154352 #751-755 RT: 15.13-15.19 AV: 5F: + c ESI Full ms2 [email protected] [ 85.00-500.00]
100 150 200 250 300 350m/z
0
20
40
60
80
100
Rel
ativ
e A
bund
ance
Tablet 4
281.2309.1
274.2
206.0 310.1273.2
Alprazolam_MSMS35 #59-66 RT: 1.22-1.36 AV: 8 NL:T: + c ESI Full ms2 [email protected] [ 85.00-400.00]
100 150 200 250 300 350m/z
0
20
40
60
80
100
Rel
ativ
e A
bund
ance
AlprazolamStandard
281.2
309.1
274.3
310.1206.1 251.0
Xanax® Tablets
Brought to you by AltGov2 [www.altgov2.org]
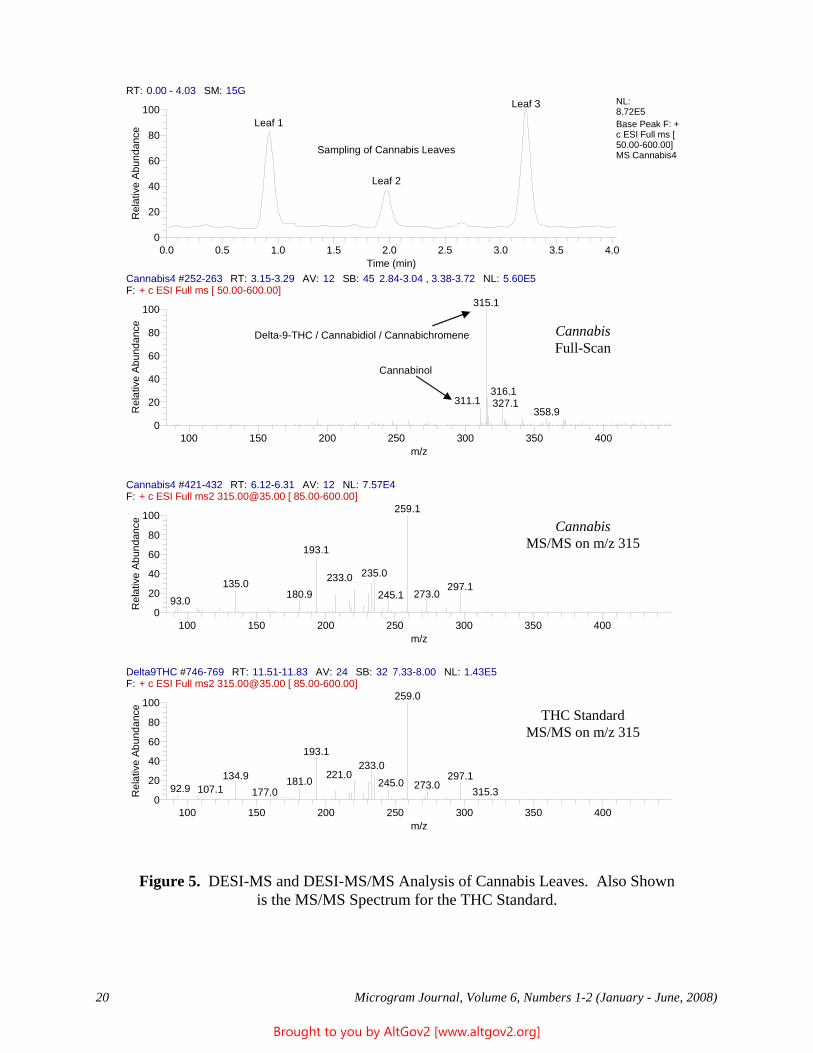
20 Microgram Journal, Volume 6, Numbers 1-2 (January - June, 2008)
Figure 5. DESI-MS and DESI-MS/MS Analysis of Cannabis Leaves. Also Shownis the MS/MS Spectrum for the THC Standard.
RT: 0.00 - 4.03 SM: 15G
0.0 0.5 1.0 1.5 2.0 2.5 3.0 3.5 4.0Time (min)
0
20
40
60
80
100
Rel
ativ
e A
bund
ance
Sampling of Cannabis Leaves
Leaf 3
Leaf 2
Leaf 1
NL:8.72E5Base Peak F: + c ESI Full ms [ 50.00-600.00] MS Cannabis4
Cannabis4 #252-263 RT: 3.15-3.29 AV: 12 SB: 45 2.84-3.04 , 3.38-3.72 NL: 5.60E5F: + c ESI Full ms [ 50.00-600.00]
100 150 200 250 300 350 400m/z
0
20
40
60
80
100
Rel
ativ
e Ab
unda
nce
Delta-9-THC / Cannabidiol / Cannabichromene
Cannabinol
CannabisFull-Scan
315.1
316.1311.1 327.1
358.9
Cannabis4 #421-432 RT: 6.12-6.31 AV: 12 NL: 7.57E4F: + c ESI Full ms2 [email protected] [ 85.00-600.00]
100 150 200 250 300 350 400m/z
0
20
40
60
80
100
Rel
ativ
e A
bund
ance
CannabisMS/MS on m/z 315
259.1
193.1
235.0233.0135.0 297.1273.0180.9 245.193.0
Delta9THC #746-769 RT: 11.51-11.83 AV: 24 SB: 32 7.33-8.00 NL: 1.43E5F: + c ESI Full ms2 [email protected] [ 85.00-600.00]
100 150 200 250 300 350 400m/z
0
20
40
60
80
100
Rel
ativ
e Ab
unda
nce
Delta-9-THC StandardMS/MS on m/z 315
259.0
193.1233.0
221.0134.9 297.1181.0 245.0 273.092.9 107.1 315.3177.0
Cannabis Full-Scan
Cannabis MS/MS on m/z 315
THC Standard MS/MS on m/z 315
Brought to you by AltGov2 [www.altgov2.org]
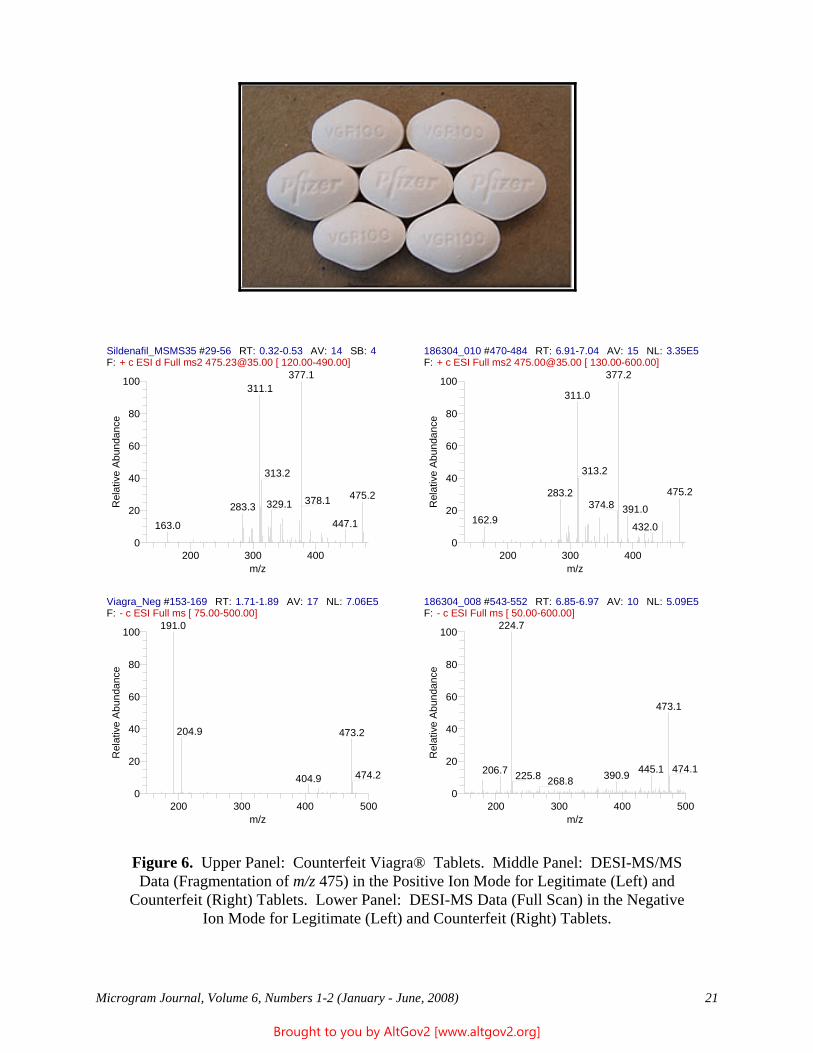
Microgram Journal, Volume 6, Numbers 1-2 (January - June, 2008) 21
Figure 6. Upper Panel: Counterfeit Viagra® Tablets. Middle Panel: DESI-MS/MSData (Fragmentation of m/z 475) in the Positive Ion Mode for Legitimate (Left) and
Counterfeit (Right) Tablets. Lower Panel: DESI-MS Data (Full Scan) in the NegativeIon Mode for Legitimate (Left) and Counterfeit (Right) Tablets.
Sildenafil_MSMS35 #29-56 RT: 0.32-0.53 AV: 14 SB: 4F: + c ESI d Full ms2 [email protected] [ 120.00-490.00]
200 300 400m/z
0
20
40
60
80
100
Rel
ativ
e A
bund
ance
377.1311.1
313.2
475.2378.1329.1283.3447.1163.0
186304_010 #470-484 RT: 6.91-7.04 AV: 15 NL: 3.35E5F: + c ESI Full ms2 [email protected] [ 130.00-600.00]
200 300 400m/z
0
20
40
60
80
100
Rel
ativ
e A
bund
ance
377.2
311.0
313.2
475.2283.2374.8 391.0
162.9432.0
Viagra_Neg #153-169 RT: 1.71-1.89 AV: 17 NL: 7.06E5F: - c ESI Full ms [ 75.00-500.00]
200 300 400 500m/z
0
20
40
60
80
100
Rel
ativ
e A
bund
ance
191.0
204.9 473.2
474.2404.9
186304_008 #543-552 RT: 6.85-6.97 AV: 10 NL: 5.09E5F: - c ESI Full ms [ 50.00-600.00]
200 300 400 500m/z
0
20
40
60
80
100
Rel
ativ
e A
bund
ance
224.7
473.1
474.1445.1206.7 390.9225.8 268.8
Brought to you by AltGov2 [www.altgov2.org]

22 Microgram Journal, Volume 6, Numbers 1-2 (January - June, 2008)
Figure 7. Upper Panel: Counterfeit Oxycontin® Tablets. Middle Panel: DESI-MSSampling of 29 Unknown Tablets. Lower Panel: DESI-MS/MS Data (Fragmentation
of m/z 337) for Unknown Tablet #3 (Left) and Fentanyl Standard (Right).
RT: 1.94 - 18.22 SM: 11G
2 4 6 8 10 12 14 16 18Time (min)
0
1000000
2000000
3000000
4000000
5000000
6000000
7000000
8000000
9000000
10000000
11000000
12000000
Inte
nsity
5.08 NL: 1.35E7Base Peak F: + c ESI Full ms2 [email protected] [ 100.00-500.00] MS 187698screens_051207153738
187698screens_051207153738 #212-223 RT: 3.94-4.06F: + c ESI Full ms2 [email protected] [ 100.00-500.00]
200 250 300 350m/z
0
20
40
60
80
100
Rel
ativ
e A
bund
ance
188.2
216.0281.1
FentanylCitrate_MSMS #28-52 RT: 0.34-0.57 AV: 12 NL:F: + c ESI d Full ms2 [email protected] [ 80.00-350.00]
150 200 250 300 350m/z
0
20
40
60
80
100
Rel
ativ
e A
bund
ance
188.2
189.2281.1216.1
3
1019
29
Brought to you by AltGov2 [www.altgov2.org]
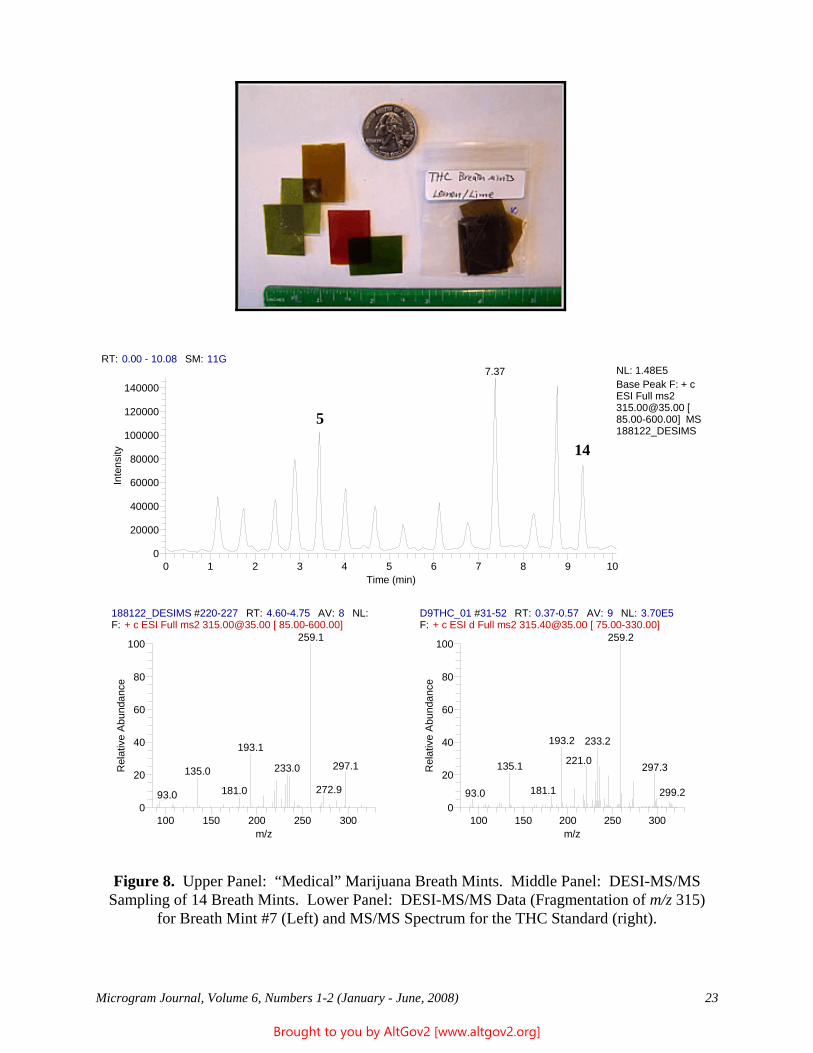
Microgram Journal, Volume 6, Numbers 1-2 (January - June, 2008) 23
Figure 8. Upper Panel: “Medical” Marijuana Breath Mints. Middle Panel: DESI-MS/MSSampling of 14 Breath Mints. Lower Panel: DESI-MS/MS Data (Fragmentation of m/z 315)
for Breath Mint #7 (Left) and MS/MS Spectrum for the THC Standard (right).
RT: 0.00 - 10.08 SM: 11G
0 1 2 3 4 5 6 7 8 9 10Time (min)
0
20000
40000
60000
80000
100000
120000
140000
Inte
nsity
7.37 NL: 1.48E5Base Peak F: + c ESI Full ms2 [email protected] [ 85.00-600.00] MS 188122_DESIMS
188122_DESIMS #220-227 RT: 4.60-4.75 AV: 8 NL:F: + c ESI Full ms2 [email protected] [ 85.00-600.00]
100 150 200 250 300m/z
0
20
40
60
80
100
Rel
ativ
e A
bund
ance
259.1
193.1
297.1233.0135.0
272.9181.093.0
D9THC_01 #31-52 RT: 0.37-0.57 AV: 9 NL: 3.70E5F: + c ESI d Full ms2 [email protected] [ 75.00-330.00]
100 150 200 250 300m/z
0
20
40
60
80
100
Rel
ativ
e A
bund
ance
259.2
193.2 233.2
221.0135.1 297.3
181.1 299.293.0
5
14
Brought to you by AltGov2 [www.altgov2.org]
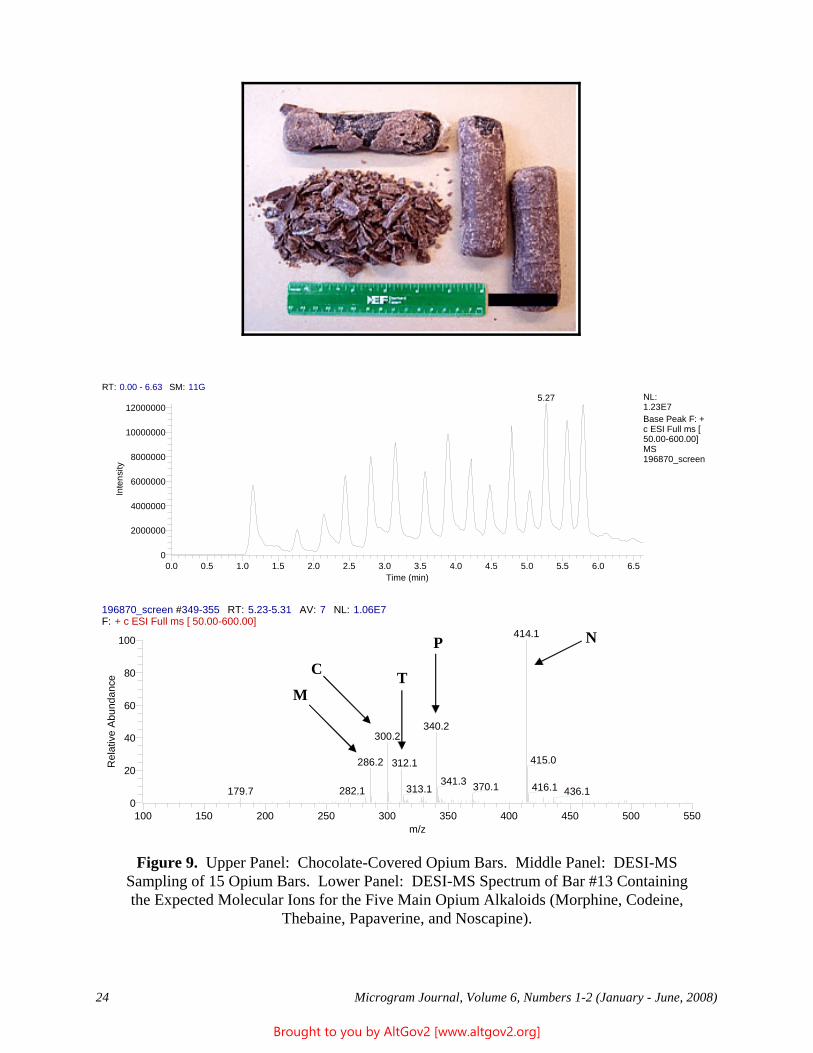
24 Microgram Journal, Volume 6, Numbers 1-2 (January - June, 2008)
Figure 9. Upper Panel: Chocolate-Covered Opium Bars. Middle Panel: DESI-MSSampling of 15 Opium Bars. Lower Panel: DESI-MS Spectrum of Bar #13 Containingthe Expected Molecular Ions for the Five Main Opium Alkaloids (Morphine, Codeine,
Thebaine, Papaverine, and Noscapine).
RT: 0.00 - 6.63 SM: 11G
0.0 0.5 1.0 1.5 2.0 2.5 3.0 3.5 4.0 4.5 5.0 5.5 6.0 6.5Time (min)
0
2000000
4000000
6000000
8000000
10000000
12000000
Inte
nsity
5.27 NL:1.23E7Base Peak F: + c ESI Full ms [ 50.00-600.00] MS 196870_screen
196870_screen #349-355 RT: 5.23-5.31 AV: 7 NL: 1.06E7F: + c ESI Full ms [ 50.00-600.00]
100 150 200 250 300 350 400 450 500 550m/z
0
20
40
60
80
100
Rel
ativ
e A
bund
ance
414.1
340.2300.2
415.0286.2 312.1
341.3 370.1 416.1313.1282.1179.7 436.1
M
C T
P N
Brought to you by AltGov2 [www.altgov2.org]
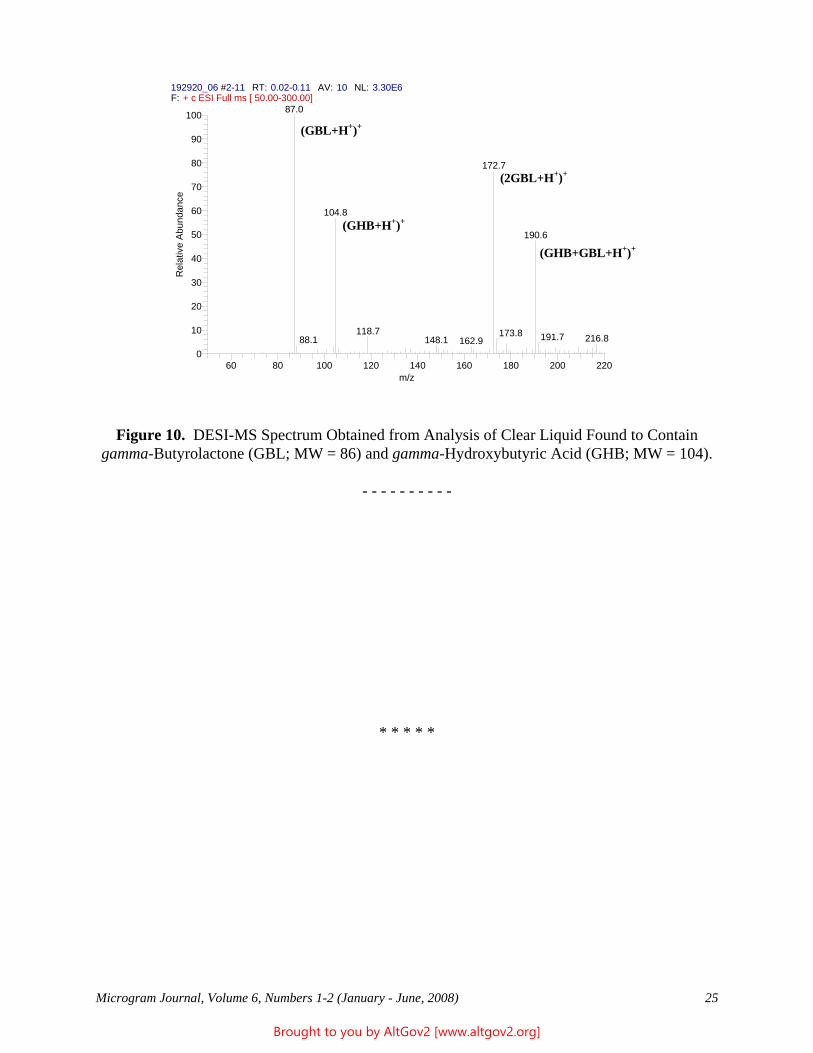
Microgram Journal, Volume 6, Numbers 1-2 (January - June, 2008) 25
Figure 10. DESI-MS Spectrum Obtained from Analysis of Clear Liquid Found to Containgamma-Butyrolactone (GBL; MW = 86) and gamma-Hydroxybutyric Acid (GHB; MW = 104).
- - - - - - - - - -
* * * * *
192920_06 #2-11 RT: 0.02-0.11 AV: 10 NL: 3.30E6F: + c ESI Full ms [ 50.00-300.00]
60 80 100 120 140 160 180 200 220m/z
0
10
20
30
40
50
60
70
80
90
100
Rel
ativ
e Ab
unda
nce
87.0
172.7
104.8
190.6
118.7 173.8 191.7 216.888.1 148.1 162.9
(GBL+H+)+
(GHB+H+)+
(GHB+GBL+H+)+
(2GBL+H+)+
Brought to you by AltGov2 [www.altgov2.org]
26 Microgram Journal, Volume 6, Numbers 1-2 (January - June, 2008)
Discovery of an Interesting Temperature Effect on the Sensitivityof the Cobalt Thiocyanate Test for Cocaine
Jim W. McGill, Ph.D.,* Crystal A. Dixon, B.A., B.S.,1 and David Ritter, Ph.D.Department of Chemistry
MS6400Southeast Missouri State University
One University PlazaCape Girardeau, MO 63701
[email: jmcgill -at- semo.edu]
Joanna D. Sides, B.S.Missouri State Highway Patrol
Troop E Laboratory122 South Ellis Street
Cape Girardeau, MO 63703
ABSTRACT: During investigation of the mechanism and specificity of the Scott’s (cobalt(II) thiocyanate) testfor cocaine, it was discovered that the ambient temperature affected the equilibrium between the pink (negative)and the blue (positive) test results. At 4OC (~39OF) the sensitivity of the test was doubled versus roomtemperature (22OC (~72OF)), while temperatures in excess of 40OC (~104OF) decreased the sensitivity of the testmore than twofold versus room temperature. These findings can impact the storage, use, and interpretation ofcommercially available cocaine test kits in typical field settings that are experiencing very cold or (especially)very hot ambient temperatures. A number of recommendations are offered to minimize the effects of hottemperatures on the test kits.
KEYWORDS: Cocaine, Scott’s Test, Cobalt Thiocyanate, Presumptive Test, Color Test, Sensitivity,Temperature, Forensic Chemistry.
Introduction
The use of presumptive color tests in forensic and analytical laboratories to screen drug submissions is common[1]. Because of their ease of use and interpretation, a number of presumptive color tests for commonly submitteddrugs have been incorporated into portable test kits for use by law enforcement personnel in field settings.2 Thesetest kits are mass-produced by a number of commercial manufacturers, and typically consist of one or more smallampoules of reagents in self-contained pouches that are reasonably priced, convenient, and safe to use. Theresults are easily interpreted, and the used kits are easily disposed of in accordance with hazardous waste statutes. Typically, a suspected controlled substance is placed into a tube or a pouch prior to breaking a glass ampoulecontaining a solution of a test reagent, agitating the mixture, and observing the results (usually an obvious colorchange). In more complex kits, a series of ampoules is broken in sequence, and the intermediate results at each
----------
1 Current Address: Custom Sensors and Technology, 531 Axminister Drive, Fenton, MO 63026.
2 Most such kits are based on chemical tests; more recently, a number of kits based on immunoassay testing have been produced (the latter are not further addressed in this study).
Brought to you by AltGov2 [www.altgov2.org]
Microgram Journal, Volume 6, Numbers 1-2 (January - June, 2008) 27
step dictate whether to continue to completion. Virtually all such kits come with instructions and color charts thatshow the expected color(s) for positive test results, and law enforcement personnel are well trained in their use.
A positive test result is considered to be a presumptive identification for the controlled substance that was beingtested for, and it would be submitted to the laboratory as such. In addition to being a preliminary identificationfor laboratory analysis, a positive field test is also valuable as probable cause for an arrest, a further searchincident to an arrest, and/or a search warrant. Furthermore, positive field tests ease the pressure on the judicialsystem, as defendants very commonly plead out during preliminary hearings when faced with presumptiveidentifications.
However, because of the wide variety of illicit drugs with similar appearances, virtually any suspect materialwould almost certainly be submitted (as an unknown/suspected controlled substance) even if the field test gave anegative or inconclusive result - especially if the appearance or packaging of the material, or the circumstances ofthe seizure, suggested that it was a controlled substance. However, a negative or inconclusive field test wouldlikely result in a rush analysis request to the laboratory (especially likely if suspects were being detained pendingthe results), which is disruptive to laboratory operations. In addition, negative/inconclusive tests can encourageguilty defendants (“guilty” in this context meaning they are fully aware of the actual identity of the suspectmaterial) to vigorously contest judicial proceedings until the results of analysis are returned from the laboratory. Thus, reliable and accurate tests are critical.
Cobalt Thiocyanate Test for Cocaine
The cobalt thiocyanate test for cocaine was first introduced by Young in 1931 [2]. The original test employed atwo percent aqueous solution of cobalt(II) thiocyanate and tin(II) chloride in an aqueous hydrochloric acidsolution. A positive test displays a blue color, while a negative test remains pink (i.e., the color of the testreagent). Even from its introduction, Young and others recognized that this test, while useful for rapidpresumptive testing of cocaine, was not specific [3]; i.e., various other compounds gave “positive” results whensubjected to this test. A number of variations of the test have subsequently been reported, virtually all focused onimproving its specificity and/or sensitivity. Accounts of the evolution of the various versions of this test, withtheir relative advantages and disadvantages, are well-documented in the literature [4].
The most commonly employed current incarnation of this test, known as the Scott’s test [4e], employs athree-stage sequence: 1) A 1:1 water/glycerine solution of cobalt thiocyanate is added to the suspect substance(resulting in a blue precipitate and a blue solution); 2) Concentrated hydrochloric acid is added (the blueprecipitate dissolves and the liquid turns pink); and 3) Chloroform is added (the upper (aqueous) layer remainspink, while the lower (chloroform) layer turns blue). A positive result at each stage is required in order to qualifyas a positive test for cocaine. This sequence is not only more specific for cocaine, but can also detect bothcocaine base and cocaine hydrochloride. However, despite its significantly improved specificity versus theoriginal (Young) test, the Scott’s test is still subject to false positive and false negative results, which haveinspired continuing modifications and alternative tests. Nonetheless, its convenience and utility as a presumptivetest in the hands of trained personnel have made it a mainstay in the arsenal of qualitative forensic reagents, and itis the basis for most (if not all) chemistry-based field test kits for cocaine.
Not surprisingly, the Scott’s test is one of the most frequently performed field tests. As noted above, cocaine testkits that are based on the Scott’s test are commercially produced by several different manufacturers; however, allare similar in their design and use. Typically, a qualitatively prescribed amount of the suspected cocaine is placedinside a thick transparent plastic pouch containing three secured ampoules, and the pouch is sealed. The firstampoule, containing the cobalt thiocyanate solution, is broken, the mixture is agitated, and the color andprecipitate (if any) are noted. The second ampoule, containing the hydrochloric acid solution, is broken, themixture is further agitated, and the color is again noted. Finally, the third ampoule, containing chloroform, isbroken, again with agitation and observation of the colors in the two layers [5]. A positive result at each of thethree stages is considered to be a presumptive identification of cocaine. Anything less than a positive result at anystage is considered to be inconclusive or negative.
Brought to you by AltGov2 [www.altgov2.org]
28 Microgram Journal, Volume 6, Numbers 1-2 (January - June, 2008)
However, a positive test does not confirm cocaine, and a negative test does not mean that cocaine is not present. As noted above, a number of other compounds give a “positive” test result (thus giving what is typically referredto as a “false positive”). Still other compounds can interfere with a positive result (giving a “false negative”). Inaddition, the test is sensitive to the quantity of test material used - both insufficient and excessive quantities ofcocaine are documented to produce false negatives [4e]. The potential for chemical interference(s), and thesensitivity of the test to the quantity of cocaine present, are especially important considering the fact that illicitcocaine is almost always cut with other substances at the retail and wholesale levels, and (increasingly) even atthe production level (currently (2008), it is common for cocaine kilogram bricks produced in South America to beadulterated with small to moderate percentages of diltiazem, hydroxyzine, or levamisole [6]). Adulterants anddiluents can not only interfere with the test, but also decrease the actual amount of cocaine placed in the test kit.
Mechanistic Studies of the Cobalt Thiocyanate Test
Efforts to better understand the cobalt thiocyanate test and its limitations have been aimed at two primary areas ofstudy: 1) Elucidation of the mechanism of the test [7]; and 2) Empirical documentation of compounds givingfalse positive or interfering tests. While an abundance of useful information exists in the forensic literature foreach of these two areas of study, a rigorous explanation of the mechanism of the test remains elusive.
As noted above, a positive test displays a blue color in Step 1, while a negative test retains the pink color of thetest reagent. Although various hypotheses have been published, the exact structures of the blue and pinkcomplexes are unknown. It is known that octahedral cobalt(II) complexes, such as [Co(H2O)6]2+, are typicallypink, whereas tetrahedral cobalt(II) complexes like [CoCl4]2- are typically an intense blue [8]. Ligand field theoryexplains these phenomena quite well. Critically, these changes in geometry are reversible and are oftenaccompanied by enthalpy changes. For example, the equilibrium of octahedral and tetrahedral cobalt complexions in the presence of chloride anion may be expressed as follows [9]:
(Eq. 1) [CoCl(H2O)5]+(aq) + Cl-(aq) –> CoCl2(H2O)2(aq) + 3 H2O(l) )H ~ 48 kJ/mole
Since the forward reaction is endothermic (i.e., it requires heat as a reactant), raising the temperature favors theformation of the blue tetrahedral complex, while lowering the temperature favors the formation of the pinkoctahedral complex. This phenomenon is an excellent demonstration of Le Chatelier’s principle [10].
A reasonable inference would be that a similar change in cobalt geometry occurs in the Scott’s test. The basicequation for this analogous equilibrium (i.e., substituting thiocyanate for chloride) can be expressed as follows:
(Eq. 2) [Co(SCN)(H2O)5]+(aq) + 3 SCN-(aq) –> [Co(SCN)4]2-(aq) + 5 H2O(l) )H ~ ? kJ/mole
However, in this case the exact structure of the pink octahedral and the blue tetrahedral species are unknown, andit is likely that gradual replacement of aqua with thiocyanato ligands gives a range of pink and blue coloredintermediate species.
In the absence of cocaine, the equilibrium would be expected to lie to the left in an aqueous solution (where theexcess water competes for the coordination sites on the cobalt). However, if cocaine is present, the substitution oftwo bulky, relatively hydrophobic protonated cocaine cations in the coordination sphere lends stability to thecomplex, rendering it more soluble in organic solvents (such as chloroform), favoring the right side of theequilibrium. That is, the cocaine serves to partly or fully exclude water from the coordination sphere, causing theequilibrium to shift to the right. Thus, the blue coordination compound responsible for a positive Scott’s testmight be (R3NH)2Co(SCN)4, where R3NH+ represents the protonated cocaine molecule [7], as follows:
(Eq. 3) [Co(SCN)(H2O)5]+(aq) + 3 SCN-(aq) + 2 R3NH+ –> (R3NH)2Co(SCN)4 + 5 H2O(l)
Brought to you by AltGov2 [www.altgov2.org]
Microgram Journal, Volume 6, Numbers 1-2 (January - June, 2008) 29
Surprisingly, no studies examining the effect(s) of temperature on this equilibrium have been reported in theforensic literature. Le Chatelier’s principle predicts that applying thermal stresses to the equilibrium system willaffect its position, favoring either the reactants or the products, and thereby altering the sensitivity of the test. Thus far, published studies of the sensitivity and specificity of the Scott’s test have focused on the presence ofinterfering analytes giving false positive or false negative results, on substituting different acids and organicsolvents in the test, or on the quantities of cocaine used in the test kits [4], but none have considered temperature.
Furthermore, the various manufacturers of the test kits do not specifically address this issue in their productliterature. One of the test kit manufacturers does state (in a newsletter) that “a cold test will simply show the colorreactions slower than a room temperature test” [11]. However, the same newsletter also states that “[f]ield testscan be stored without concern in any container (desks, briefcases, cabinets, glove compartments, or vehicletrunks).” In view of the thermodynamics of the cobalt complexes, these assertions appear dubious.
Test kits are typically stored in vehicles prior to use, where (depending on locale) temperatures can fall belowfreezing during winter months and can exceed 140OF (60OC) during summer months. Two critical questions are: 1) Do the temperatures commonly achieved inside the cabin or trunk of a vehicle during winter or summer monthssignificantly affect the sensitivity of the Scott’s test?; and 2) Can temperature-controlled storage be used toenhance the sensitivity of the Scott’s test?
Experimental
[Editor’s Notes: Because publication in Microgram Journal could be interpreted as an endorsement or acounter-endorsement by the U.S. Drug Enforcement Administration, the names of the test-kit manufacturers andthe names of their test kits have been redacted from this article. The results apply equally to virtually any Scott’stest-based test kit.]
Cobalt(II) thiocyanate was purchased from Sigma-Aldrich. Concentrated hydrochloric acid and chloroform werepurchased from Fisher Scientific. Reference standard cocaine was purchased from Sigma-Aldrich and was storedand used in the drug chemistry section of the Missouri State Highway Patrol Troop E Satellite Laboratory. Cocaine test kits used for this study were purchased from a well known manufacturer of narcotics field test kits,and were stated to be applicable for testing both cocaine salts and cocaine base. The provided instructions for usewere followed, including a printed qualitative sample size indicator. Reduced temperature studies were conductedusing a standard portable cooler with ice as the cooling agent. Elevated temperature studies were conducted usinga standard laboratory oven.
Stock Solution Studies
A preliminary test was done to confirm that the equilibrium reaction operating in the Scott’s test for cocaine couldin fact be manipulated by temperature. For economy, a stock solution of cobalt thiocyanate was prepared toclosely match the concentration of the solution contained in the test kit ampoules. A series of calibrationsolutions was prepared such that the concentration of the test kit solution was within the concentration range ofthe calibration set, as judged by visual inspection. The actual absorbances of the solutions - measuring 0.05, 0.10,and 0.15 M in concentration - were formally measured at 517 nanometers using a Beckman DB-G UV-Visspectrophotometer.
Using the resulting calibration curve and measuring the absorbance of the test kit solution from the ampoule, itwas determined that the test kit solution was approximately 0.11 M cobalt(II) thiocyanate. A stock solution at thisconcentration was prepared and used in preliminary tests with various quantities of cocaine and at room, reduced,and elevated temperatures.
Brought to you by AltGov2 [www.altgov2.org]
30 Microgram Journal, Volume 6, Numbers 1-2 (January - June, 2008)
Reduced-Temperature Studies (with Test Kits)
A number of test kits were cooled to approximately 4OC in a small insulated cooler. While these pouches werebeing cooled, a benchmark test was performed using a kit at room temperature, following the manufacturer’sinstructions printed on the product box. The quantity of cocaine prescribed by the circle printed on the box wasmeasured visually and then weighed using a laboratory balance (mass = 0.5 mg). This sample was then placedinto the control test kit, and the series of ampoules was broken in sequence with agitation and observation inaccord with the instructions. This test result was noted and was the basis of comparison for all subsequent tests.
The quantity of cocaine (0.5 mg) and the procedures used for the benchmark test were then duplicated for a testpouch cooled to 4OC (39OF). Following this test, a second reduced-temperature test was performed using aquantity of cocaine approximately one-half the size of the recommended amount used in the initial test (0.2 mg). The quantity of cocaine was cut in half again, to approximately one-fourth the size recommended by themanufacturer (0.1 mg), and the test procedure was repeated. Duplicate tests were run to confirm each result. Trials were also performed to compare the effect of pre-cooling the test kits prior to introduction of the cocainesamples versus attempting to cause a positive or negative result to be reversed by cooling the test kits after a resultwas obtained at room temperature for a given sample.
Elevated-Temperature Studies (with Test Kits)
A number of test kits were warmed to either 45OC (113OF) or 60OC (140OF) in a standard laboratory oven. Another benchmark test was performed at room temperature and was used as a reference in theelevated-temperature study. The quantity of cocaine (0.5 mg) and the procedures for the benchmark test werethen duplicated for test pouches warmed to 45OC and 60OC. Following each of these tests, a second set ofelevated-temperature tests was performed using a quantity of cocaine approximately double the size of therecommended amount used in the initial test (1 mg).
Results and Discussion
Stock Solution Studies
Initial investigations revealed that 1 milligram of cocaine, combined in a test tube with one drop of concentratedhydrochloric acid and two drops of 0.11 M cobalt thiocyanate stock solution, resulted in the formation of blueflakes and a blue solution - a positive test. Based on literature data for the aqua complexes of cobalt(II) chloride,it was expected that decreasing the temperature of this positive test solution would shift the equilibrium towardthe pink octahedral complex responsible for a negative test, while increasing the temperature would have theopposite effect. In actuality, however, cooling the blue solution to 4OC (39OF) had no significant impact on thecolor, while raising the temperature resulted in a change from blue to pink. At only 30OC (86OF), the solutionbegan changing from blue to pink with blue specks. Continued heating to 60OC (140OF) resulted in a pinksolution with no blue specks.
Next, the mass of cocaine was decreased to less than 0.5 milligram. This quantity was insufficient to produce ablue color in the test tube at room temperature. Raising the temperature of this solution gradually to 60OC(140OF) did not produce any significant changes in its appearance. However, cooling the solution to 4OC (39OF)resulted in a change in color from pink to blue - a positive test. Collectively, these results suggest that thereaction responsible for the change from pink to blue color in the Scott’s test for cocaine is exothermic with a )Hon the same order of magnitude (but of opposite sign) as that for the endothermic reaction involving cobalt(II)chloride (shown in Eq. 1). The results also indicate that the temperature of a field test kit for cocaine willsignificantly impact the sensitivity and accuracy of its response.
Brought to you by AltGov2 [www.altgov2.org]
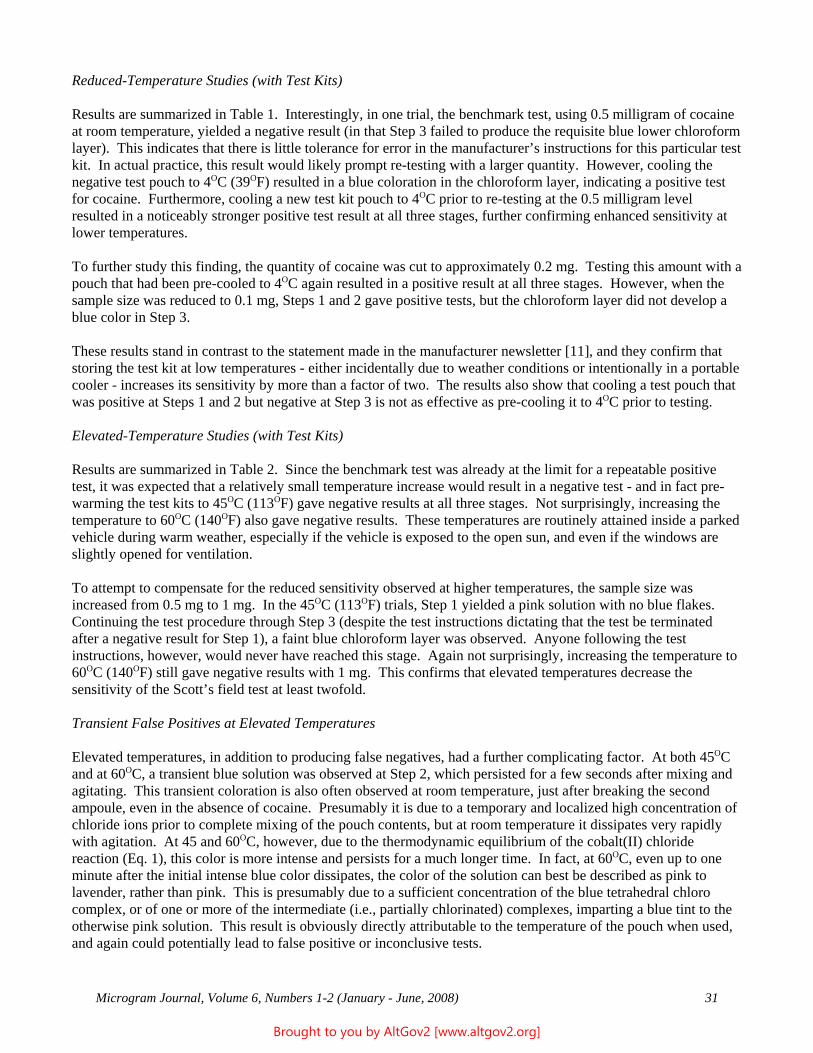
Microgram Journal, Volume 6, Numbers 1-2 (January - June, 2008) 31
Reduced-Temperature Studies (with Test Kits)
Results are summarized in Table 1. Interestingly, in one trial, the benchmark test, using 0.5 milligram of cocaineat room temperature, yielded a negative result (in that Step 3 failed to produce the requisite blue lower chloroformlayer). This indicates that there is little tolerance for error in the manufacturer’s instructions for this particular testkit. In actual practice, this result would likely prompt re-testing with a larger quantity. However, cooling thenegative test pouch to 4OC (39OF) resulted in a blue coloration in the chloroform layer, indicating a positive testfor cocaine. Furthermore, cooling a new test kit pouch to 4OC prior to re-testing at the 0.5 milligram levelresulted in a noticeably stronger positive test result at all three stages, further confirming enhanced sensitivity atlower temperatures.
To further study this finding, the quantity of cocaine was cut to approximately 0.2 mg. Testing this amount with apouch that had been pre-cooled to 4OC again resulted in a positive result at all three stages. However, when thesample size was reduced to 0.1 mg, Steps 1 and 2 gave positive tests, but the chloroform layer did not develop ablue color in Step 3.
These results stand in contrast to the statement made in the manufacturer newsletter [11], and they confirm thatstoring the test kit at low temperatures - either incidentally due to weather conditions or intentionally in a portablecooler - increases its sensitivity by more than a factor of two. The results also show that cooling a test pouch thatwas positive at Steps 1 and 2 but negative at Step 3 is not as effective as pre-cooling it to 4OC prior to testing.
Elevated-Temperature Studies (with Test Kits)
Results are summarized in Table 2. Since the benchmark test was already at the limit for a repeatable positivetest, it was expected that a relatively small temperature increase would result in a negative test - and in fact pre-warming the test kits to 45OC (113OF) gave negative results at all three stages. Not surprisingly, increasing thetemperature to 60OC (140OF) also gave negative results. These temperatures are routinely attained inside a parkedvehicle during warm weather, especially if the vehicle is exposed to the open sun, and even if the windows areslightly opened for ventilation.
To attempt to compensate for the reduced sensitivity observed at higher temperatures, the sample size wasincreased from 0.5 mg to 1 mg. In the 45OC (113OF) trials, Step 1 yielded a pink solution with no blue flakes. Continuing the test procedure through Step 3 (despite the test instructions dictating that the test be terminatedafter a negative result for Step 1), a faint blue chloroform layer was observed. Anyone following the testinstructions, however, would never have reached this stage. Again not surprisingly, increasing the temperature to60OC (140OF) still gave negative results with 1 mg. This confirms that elevated temperatures decrease thesensitivity of the Scott’s field test at least twofold.
Transient False Positives at Elevated Temperatures
Elevated temperatures, in addition to producing false negatives, had a further complicating factor. At both 45OCand at 60OC, a transient blue solution was observed at Step 2, which persisted for a few seconds after mixing andagitating. This transient coloration is also often observed at room temperature, just after breaking the secondampoule, even in the absence of cocaine. Presumably it is due to a temporary and localized high concentration ofchloride ions prior to complete mixing of the pouch contents, but at room temperature it dissipates very rapidlywith agitation. At 45 and 60OC, however, due to the thermodynamic equilibrium of the cobalt(II) chloridereaction (Eq. 1), this color is more intense and persists for a much longer time. In fact, at 60OC, even up to oneminute after the initial intense blue color dissipates, the color of the solution can best be described as pink tolavender, rather than pink. This is presumably due to a sufficient concentration of the blue tetrahedral chlorocomplex, or of one or more of the intermediate (i.e., partially chlorinated) complexes, imparting a blue tint to theotherwise pink solution. This result is obviously directly attributable to the temperature of the pouch when used,and again could potentially lead to false positive or inconclusive tests.
Brought to you by AltGov2 [www.altgov2.org]
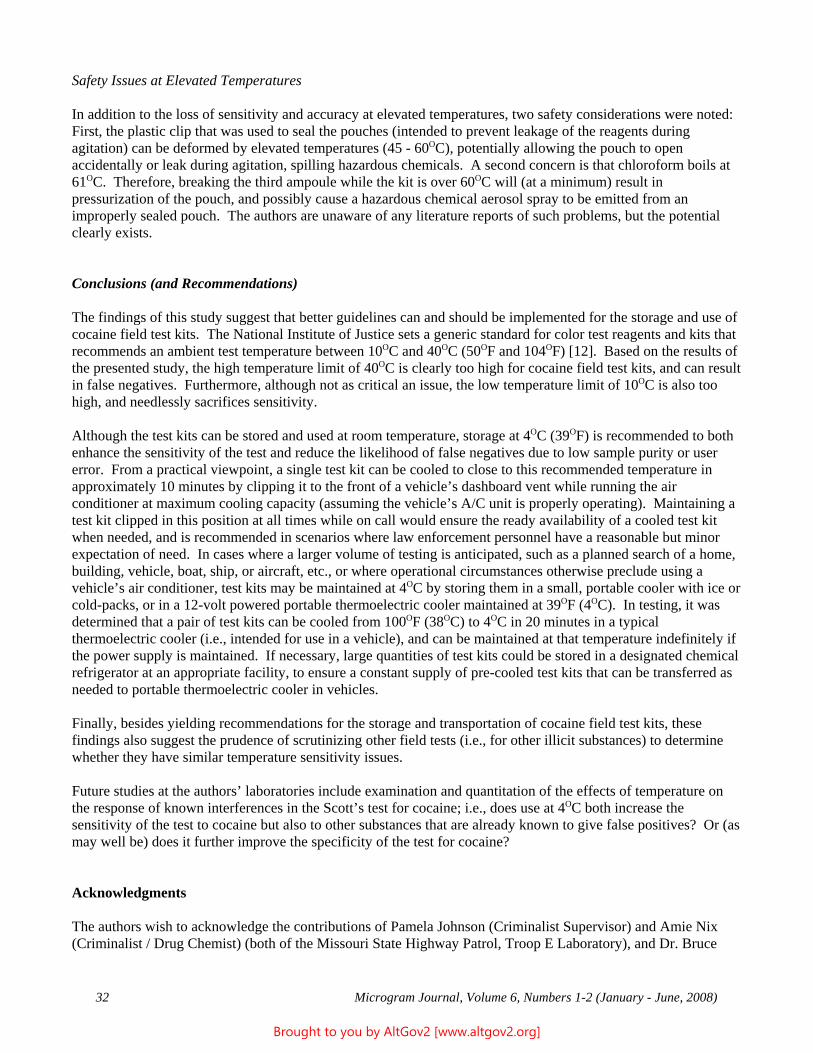
32 Microgram Journal, Volume 6, Numbers 1-2 (January - June, 2008)
Safety Issues at Elevated Temperatures
In addition to the loss of sensitivity and accuracy at elevated temperatures, two safety considerations were noted: First, the plastic clip that was used to seal the pouches (intended to prevent leakage of the reagents duringagitation) can be deformed by elevated temperatures (45 - 60OC), potentially allowing the pouch to openaccidentally or leak during agitation, spilling hazardous chemicals. A second concern is that chloroform boils at61OC. Therefore, breaking the third ampoule while the kit is over 60OC will (at a minimum) result inpressurization of the pouch, and possibly cause a hazardous chemical aerosol spray to be emitted from animproperly sealed pouch. The authors are unaware of any literature reports of such problems, but the potentialclearly exists.
Conclusions (and Recommendations)
The findings of this study suggest that better guidelines can and should be implemented for the storage and use ofcocaine field test kits. The National Institute of Justice sets a generic standard for color test reagents and kits thatrecommends an ambient test temperature between 10OC and 40OC (50OF and 104OF) [12]. Based on the results ofthe presented study, the high temperature limit of 40OC is clearly too high for cocaine field test kits, and can resultin false negatives. Furthermore, although not as critical an issue, the low temperature limit of 10OC is also toohigh, and needlessly sacrifices sensitivity.
Although the test kits can be stored and used at room temperature, storage at 4OC (39OF) is recommended to bothenhance the sensitivity of the test and reduce the likelihood of false negatives due to low sample purity or usererror. From a practical viewpoint, a single test kit can be cooled to close to this recommended temperature inapproximately 10 minutes by clipping it to the front of a vehicle’s dashboard vent while running the airconditioner at maximum cooling capacity (assuming the vehicle’s A/C unit is properly operating). Maintaining atest kit clipped in this position at all times while on call would ensure the ready availability of a cooled test kitwhen needed, and is recommended in scenarios where law enforcement personnel have a reasonable but minorexpectation of need. In cases where a larger volume of testing is anticipated, such as a planned search of a home,building, vehicle, boat, ship, or aircraft, etc., or where operational circumstances otherwise preclude using avehicle’s air conditioner, test kits may be maintained at 4OC by storing them in a small, portable cooler with ice orcold-packs, or in a 12-volt powered portable thermoelectric cooler maintained at 39OF (4OC). In testing, it wasdetermined that a pair of test kits can be cooled from 100OF (38OC) to 4OC in 20 minutes in a typicalthermoelectric cooler (i.e., intended for use in a vehicle), and can be maintained at that temperature indefinitely ifthe power supply is maintained. If necessary, large quantities of test kits could be stored in a designated chemicalrefrigerator at an appropriate facility, to ensure a constant supply of pre-cooled test kits that can be transferred asneeded to portable thermoelectric cooler in vehicles.
Finally, besides yielding recommendations for the storage and transportation of cocaine field test kits, thesefindings also suggest the prudence of scrutinizing other field tests (i.e., for other illicit substances) to determinewhether they have similar temperature sensitivity issues.
Future studies at the authors’ laboratories include examination and quantitation of the effects of temperature onthe response of known interferences in the Scott’s test for cocaine; i.e., does use at 4OC both increase thesensitivity of the test to cocaine but also to other substances that are already known to give false positives? Or (asmay well be) does it further improve the specificity of the test for cocaine?
Acknowledgments
The authors wish to acknowledge the contributions of Pamela Johnson (Criminalist Supervisor) and Amie Nix(Criminalist / Drug Chemist) (both of the Missouri State Highway Patrol, Troop E Laboratory), and Dr. Bruce
Brought to you by AltGov2 [www.altgov2.org]
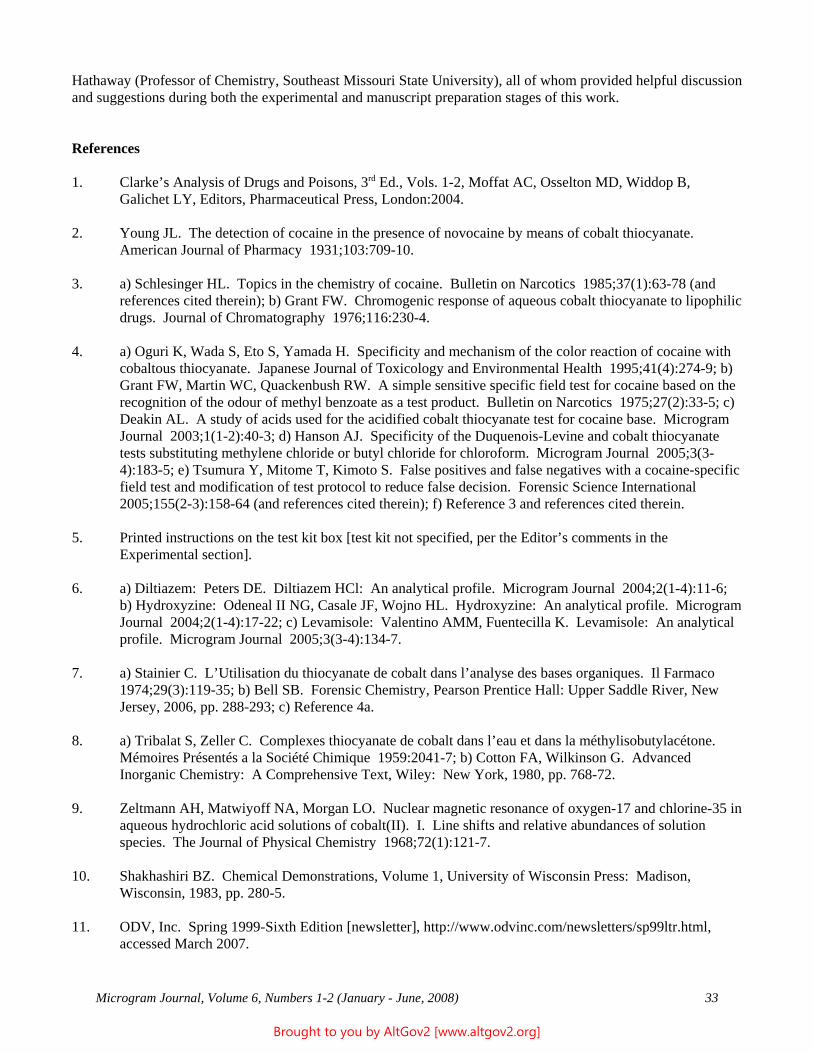
Microgram Journal, Volume 6, Numbers 1-2 (January - June, 2008) 33
Hathaway (Professor of Chemistry, Southeast Missouri State University), all of whom provided helpful discussionand suggestions during both the experimental and manuscript preparation stages of this work.
References
1. Clarke’s Analysis of Drugs and Poisons, 3rd Ed., Vols. 1-2, Moffat AC, Osselton MD, Widdop B,Galichet LY, Editors, Pharmaceutical Press, London:2004.
2. Young JL. The detection of cocaine in the presence of novocaine by means of cobalt thiocyanate. American Journal of Pharmacy 1931;103:709-10.
3. a) Schlesinger HL. Topics in the chemistry of cocaine. Bulletin on Narcotics 1985;37(1):63-78 (andreferences cited therein); b) Grant FW. Chromogenic response of aqueous cobalt thiocyanate to lipophilicdrugs. Journal of Chromatography 1976;116:230-4.
4. a) Oguri K, Wada S, Eto S, Yamada H. Specificity and mechanism of the color reaction of cocaine withcobaltous thiocyanate. Japanese Journal of Toxicology and Environmental Health 1995;41(4):274-9; b)Grant FW, Martin WC, Quackenbush RW. A simple sensitive specific field test for cocaine based on therecognition of the odour of methyl benzoate as a test product. Bulletin on Narcotics 1975;27(2):33-5; c)Deakin AL. A study of acids used for the acidified cobalt thiocyanate test for cocaine base. MicrogramJournal 2003;1(1-2):40-3; d) Hanson AJ. Specificity of the Duquenois-Levine and cobalt thiocyanatetests substituting methylene chloride or butyl chloride for chloroform. Microgram Journal 2005;3(3-4):183-5; e) Tsumura Y, Mitome T, Kimoto S. False positives and false negatives with a cocaine-specificfield test and modification of test protocol to reduce false decision. Forensic Science International 2005;155(2-3):158-64 (and references cited therein); f) Reference 3 and references cited therein.
5. Printed instructions on the test kit box [test kit not specified, per the Editor’s comments in theExperimental section].
6. a) Diltiazem: Peters DE. Diltiazem HCl: An analytical profile. Microgram Journal 2004;2(1-4):11-6;b) Hydroxyzine: Odeneal II NG, Casale JF, Wojno HL. Hydroxyzine: An analytical profile. MicrogramJournal 2004;2(1-4):17-22; c) Levamisole: Valentino AMM, Fuentecilla K. Levamisole: An analyticalprofile. Microgram Journal 2005;3(3-4):134-7.
7. a) Stainier C. L’Utilisation du thiocyanate de cobalt dans l’analyse des bases organiques. Il Farmaco 1974;29(3):119-35; b) Bell SB. Forensic Chemistry, Pearson Prentice Hall: Upper Saddle River, NewJersey, 2006, pp. 288-293; c) Reference 4a.
8. a) Tribalat S, Zeller C. Complexes thiocyanate de cobalt dans l’eau et dans la méthylisobutylacétone. Mémoires Présentés a la Société Chimique 1959:2041-7; b) Cotton FA, Wilkinson G. AdvancedInorganic Chemistry: A Comprehensive Text, Wiley: New York, 1980, pp. 768-72.
9. Zeltmann AH, Matwiyoff NA, Morgan LO. Nuclear magnetic resonance of oxygen-17 and chlorine-35 inaqueous hydrochloric acid solutions of cobalt(II). I. Line shifts and relative abundances of solutionspecies. The Journal of Physical Chemistry 1968;72(1):121-7.
10. Shakhashiri BZ. Chemical Demonstrations, Volume 1, University of Wisconsin Press: Madison,Wisconsin, 1983, pp. 280-5.
11. ODV, Inc. Spring 1999-Sixth Edition [newsletter], http://www.odvinc.com/newsletters/sp99ltr.html,accessed March 2007.
Brought to you by AltGov2 [www.altgov2.org]
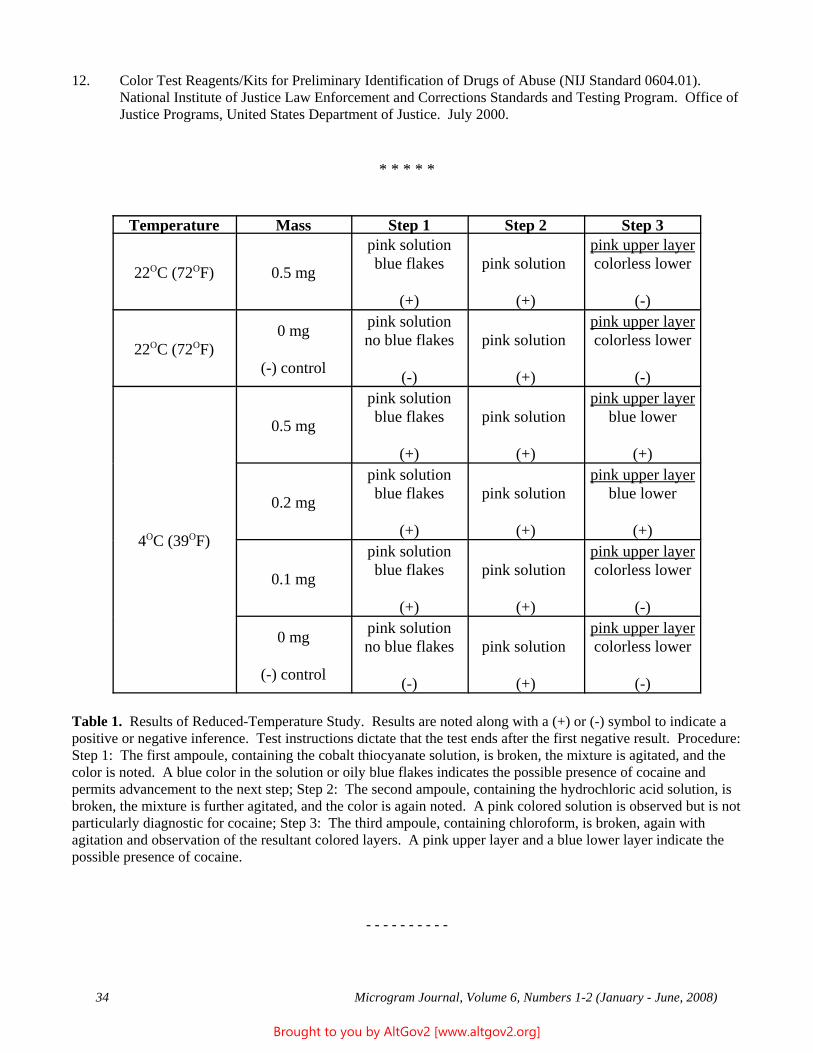
34 Microgram Journal, Volume 6, Numbers 1-2 (January - June, 2008)
12. Color Test Reagents/Kits for Preliminary Identification of Drugs of Abuse (NIJ Standard 0604.01). National Institute of Justice Law Enforcement and Corrections Standards and Testing Program. Office ofJustice Programs, United States Department of Justice. July 2000.
* * * * *
Temperature Mass Step 1 Step 2 Step 3
22OC (72OF) 0.5 mg
pink solutionblue flakes
(+)
pink solution
(+)
pink upper layercolorless lower
(-)
22OC (72OF)0 mg
(-) control
pink solutionno blue flakes
(-)
pink solution
(+)
pink upper layercolorless lower
(-)
4OC (39OF)
0.5 mg
pink solutionblue flakes
(+)
pink solution
(+)
pink upper layerblue lower
(+)
0.2 mg
pink solutionblue flakes
(+)
pink solution
(+)
pink upper layerblue lower
(+)
0.1 mg
pink solutionblue flakes
(+)
pink solution
(+)
pink upper layercolorless lower
(-)
0 mg
(-) control
pink solutionno blue flakes
(-)
pink solution
(+)
pink upper layercolorless lower
(-)
Table 1. Results of Reduced-Temperature Study. Results are noted along with a (+) or (-) symbol to indicate apositive or negative inference. Test instructions dictate that the test ends after the first negative result. Procedure: Step 1: The first ampoule, containing the cobalt thiocyanate solution, is broken, the mixture is agitated, and thecolor is noted. A blue color in the solution or oily blue flakes indicates the possible presence of cocaine andpermits advancement to the next step; Step 2: The second ampoule, containing the hydrochloric acid solution, isbroken, the mixture is further agitated, and the color is again noted. A pink colored solution is observed but is notparticularly diagnostic for cocaine; Step 3: The third ampoule, containing chloroform, is broken, again withagitation and observation of the resultant colored layers. A pink upper layer and a blue lower layer indicate thepossible presence of cocaine.
- - - - - - - - - -
Brought to you by AltGov2 [www.altgov2.org]
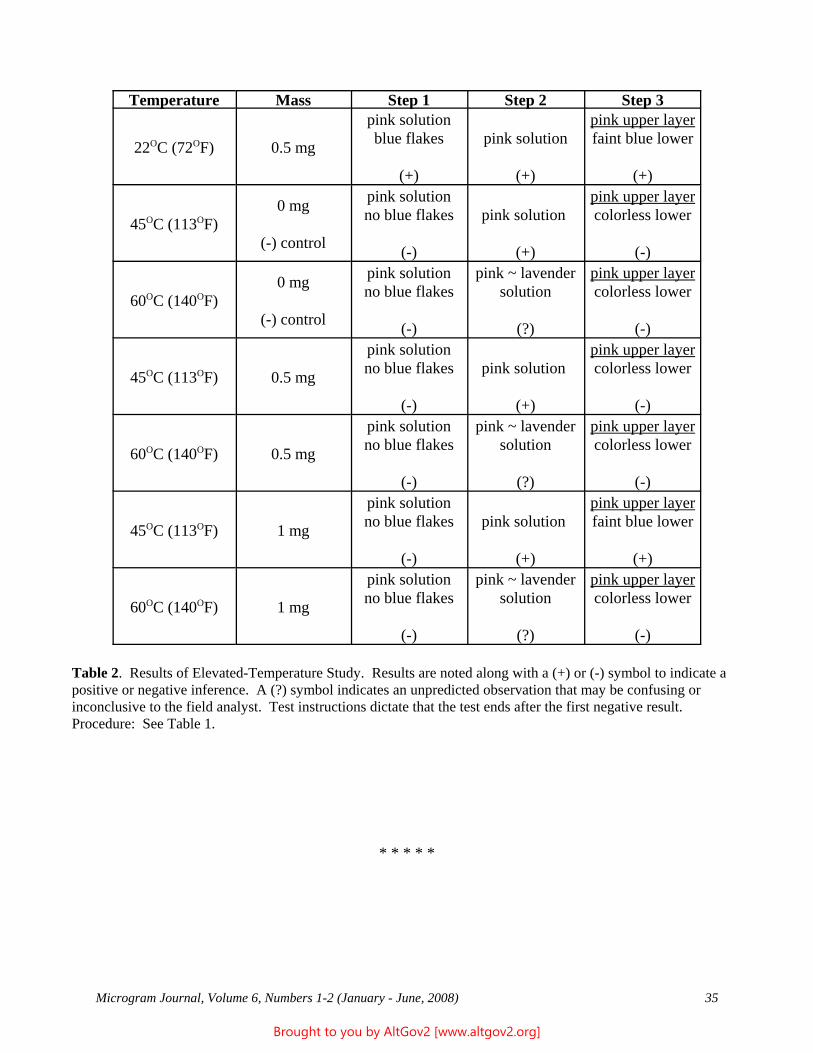
Microgram Journal, Volume 6, Numbers 1-2 (January - June, 2008) 35
Temperature Mass Step 1 Step 2 Step 3
22OC (72OF) 0.5 mg
pink solutionblue flakes
(+)
pink solution
(+)
pink upper layerfaint blue lower
(+)
45OC (113OF)0 mg
(-) control
pink solutionno blue flakes
(-)
pink solution
(+)
pink upper layercolorless lower
(-)
60OC (140OF)0 mg
(-) control
pink solutionno blue flakes
(-)
pink ~ lavendersolution
(?)
pink upper layercolorless lower
(-)
45OC (113OF) 0.5 mg
pink solutionno blue flakes
(-)
pink solution
(+)
pink upper layercolorless lower
(-)
60OC (140OF) 0.5 mg
pink solutionno blue flakes
(-)
pink ~ lavendersolution
(?)
pink upper layercolorless lower
(-)
45OC (113OF) 1 mg
pink solutionno blue flakes
(-)
pink solution
(+)
pink upper layerfaint blue lower
(+)
60OC (140OF) 1 mg
pink solutionno blue flakes
(-)
pink ~ lavendersolution
(?)
pink upper layercolorless lower
(-)
Table 2. Results of Elevated-Temperature Study. Results are noted along with a (+) or (-) symbol to indicate apositive or negative inference. A (?) symbol indicates an unpredicted observation that may be confusing orinconclusive to the field analyst. Test instructions dictate that the test ends after the first negative result. Procedure: See Table 1.
* * * * *
Brought to you by AltGov2 [www.altgov2.org]
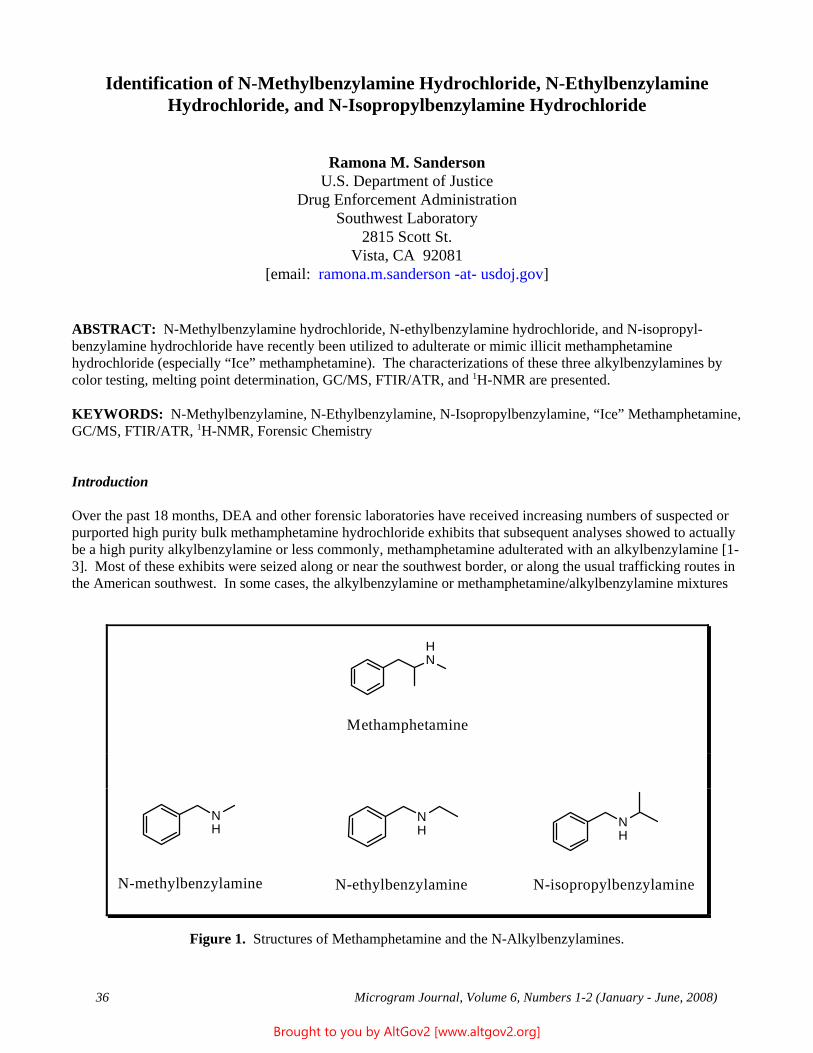
36 Microgram Journal, Volume 6, Numbers 1-2 (January - June, 2008)
Identification of N-Methylbenzylamine Hydrochloride, N-EthylbenzylamineHydrochloride, and N-Isopropylbenzylamine Hydrochloride
Ramona M. SandersonU.S. Department of Justice
Drug Enforcement AdministrationSouthwest Laboratory
2815 Scott St.Vista, CA 92081
[email: ramona.m.sanderson -at- usdoj.gov]
ABSTRACT: N-Methylbenzylamine hydrochloride, N-ethylbenzylamine hydrochloride, and N-isopropyl-benzylamine hydrochloride have recently been utilized to adulterate or mimic illicit methamphetaminehydrochloride (especially “Ice” methamphetamine). The characterizations of these three alkylbenzylamines bycolor testing, melting point determination, GC/MS, FTIR/ATR, and 1H-NMR are presented.
KEYWORDS: N-Methylbenzylamine, N-Ethylbenzylamine, N-Isopropylbenzylamine, “Ice” Methamphetamine,GC/MS, FTIR/ATR, 1H-NMR, Forensic Chemistry
Introduction
Over the past 18 months, DEA and other forensic laboratories have received increasing numbers of suspected orpurported high purity bulk methamphetamine hydrochloride exhibits that subsequent analyses showed to actuallybe a high purity alkylbenzylamine or less commonly, methamphetamine adulterated with an alkylbenzylamine [1-3]. Most of these exhibits were seized along or near the southwest border, or along the usual trafficking routes inthe American southwest. In some cases, the alkylbenzylamine or methamphetamine/alkylbenzylamine mixtures
Figure 1. Structures of Methamphetamine and the N-Alkylbenzylamines.
HN
Methamphetamine
NH
N-methylbenzylamine
NH
N-ethylbenzylamine
NH
N-isopropylbenzylamine
Brought to you by AltGov2 [www.altgov2.org]
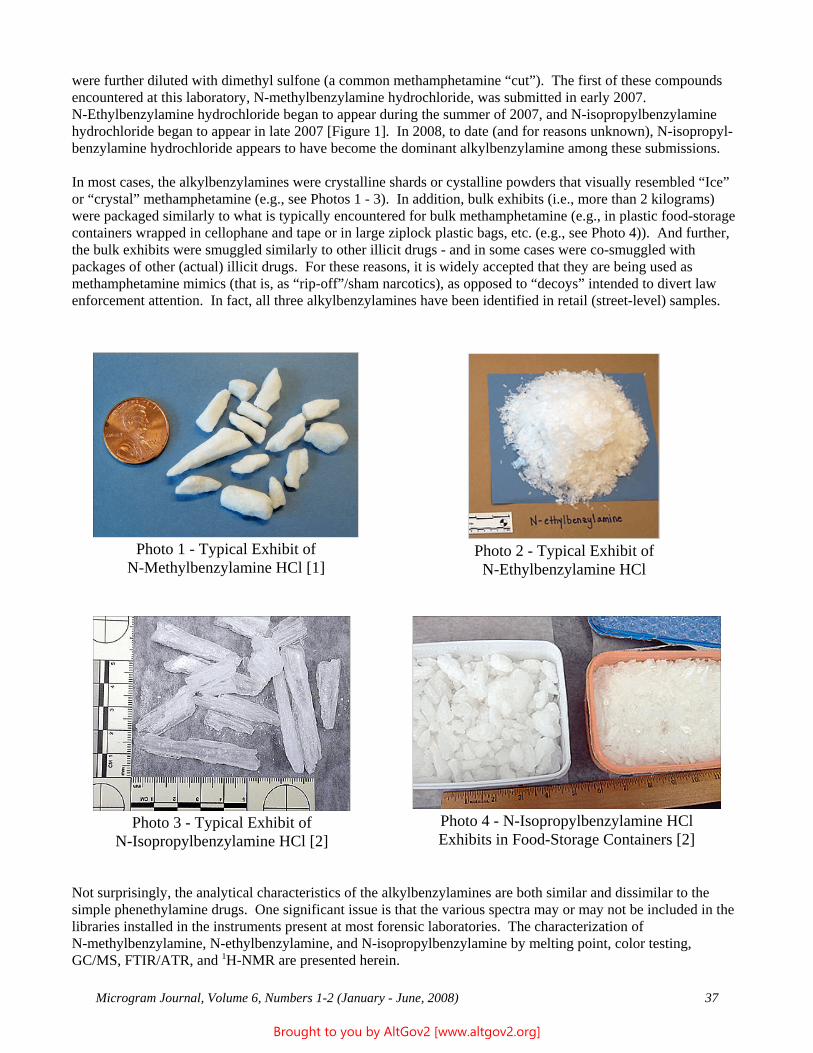
Microgram Journal, Volume 6, Numbers 1-2 (January - June, 2008) 37
were further diluted with dimethyl sulfone (a common methamphetamine “cut”). The first of these compoundsencountered at this laboratory, N-methylbenzylamine hydrochloride, was submitted in early 2007. N-Ethylbenzylamine hydrochloride began to appear during the summer of 2007, and N-isopropylbenzylaminehydrochloride began to appear in late 2007 [Figure 1]. In 2008, to date (and for reasons unknown), N-isopropyl-benzylamine hydrochloride appears to have become the dominant alkylbenzylamine among these submissions.
In most cases, the alkylbenzylamines were crystalline shards or cystalline powders that visually resembled “Ice”or “crystal” methamphetamine (e.g., see Photos 1 - 3). In addition, bulk exhibits (i.e., more than 2 kilograms)were packaged similarly to what is typically encountered for bulk methamphetamine (e.g., in plastic food-storagecontainers wrapped in cellophane and tape or in large ziplock plastic bags, etc. (e.g., see Photo 4)). And further,the bulk exhibits were smuggled similarly to other illicit drugs - and in some cases were co-smuggled withpackages of other (actual) illicit drugs. For these reasons, it is widely accepted that they are being used asmethamphetamine mimics (that is, as “rip-off”/sham narcotics), as opposed to “decoys” intended to divert lawenforcement attention. In fact, all three alkylbenzylamines have been identified in retail (street-level) samples.
Not surprisingly, the analytical characteristics of the alkylbenzylamines are both similar and dissimilar to thesimple phenethylamine drugs. One significant issue is that the various spectra may or may not be included in thelibraries installed in the instruments present at most forensic laboratories. The characterization ofN-methylbenzylamine, N-ethylbenzylamine, and N-isopropylbenzylamine by melting point, color testing,GC/MS, FTIR/ATR, and 1H-NMR are presented herein.
Photo 2 - Typical Exhibit ofN-Ethylbenzylamine HCl
Photo 1 - Typical Exhibit ofN-Methylbenzylamine HCl [1]
Photo 4 - N-Isopropylbenzylamine HClExhibits in Food-Storage Containers [2]
Photo 3 - Typical Exhibit ofN-Isopropylbenzylamine HCl [2]
Brought to you by AltGov2 [www.altgov2.org]
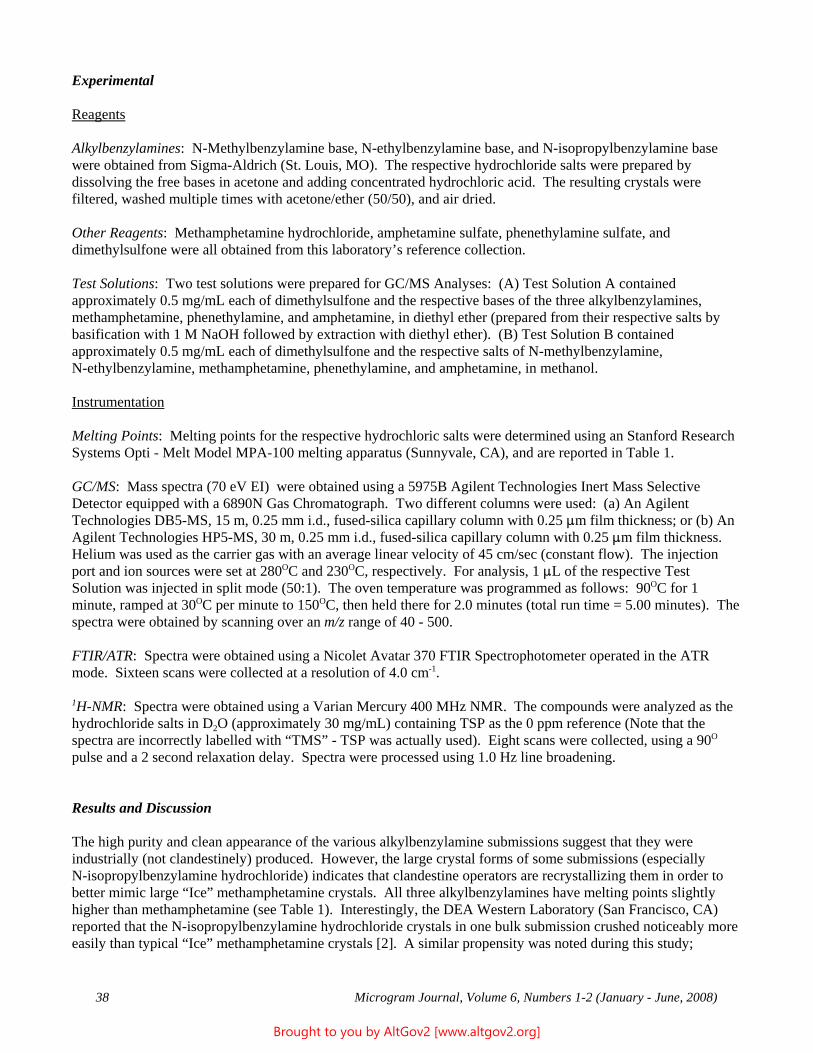
38 Microgram Journal, Volume 6, Numbers 1-2 (January - June, 2008)
Experimental
Reagents
Alkylbenzylamines: N-Methylbenzylamine base, N-ethylbenzylamine base, and N-isopropylbenzylamine basewere obtained from Sigma-Aldrich (St. Louis, MO). The respective hydrochloride salts were prepared bydissolving the free bases in acetone and adding concentrated hydrochloric acid. The resulting crystals werefiltered, washed multiple times with acetone/ether (50/50), and air dried.
Other Reagents: Methamphetamine hydrochloride, amphetamine sulfate, phenethylamine sulfate, anddimethylsulfone were all obtained from this laboratory’s reference collection.
Test Solutions: Two test solutions were prepared for GC/MS Analyses: (A) Test Solution A containedapproximately 0.5 mg/mL each of dimethylsulfone and the respective bases of the three alkylbenzylamines,methamphetamine, phenethylamine, and amphetamine, in diethyl ether (prepared from their respective salts bybasification with 1 M NaOH followed by extraction with diethyl ether). (B) Test Solution B containedapproximately 0.5 mg/mL each of dimethylsulfone and the respective salts of N-methylbenzylamine,N-ethylbenzylamine, methamphetamine, phenethylamine, and amphetamine, in methanol.
Instrumentation
Melting Points: Melting points for the respective hydrochloric salts were determined using an Stanford ResearchSystems Opti - Melt Model MPA-100 melting apparatus (Sunnyvale, CA), and are reported in Table 1.
GC/MS: Mass spectra (70 eV EI) were obtained using a 5975B Agilent Technologies Inert Mass SelectiveDetector equipped with a 6890N Gas Chromatograph. Two different columns were used: (a) An AgilentTechnologies DB5-MS, 15 m, 0.25 mm i.d., fused-silica capillary column with 0.25 :m film thickness; or (b) AnAgilent Technologies HP5-MS, 30 m, 0.25 mm i.d., fused-silica capillary column with 0.25 :m film thickness. Helium was used as the carrier gas with an average linear velocity of 45 cm/sec (constant flow). The injectionport and ion sources were set at 280OC and 230OC, respectively. For analysis, 1 :L of the respective TestSolution was injected in split mode (50:1). The oven temperature was programmed as follows: 90OC for 1minute, ramped at 30OC per minute to 150OC, then held there for 2.0 minutes (total run time = 5.00 minutes). Thespectra were obtained by scanning over an m/z range of 40 - 500.
FTIR/ATR: Spectra were obtained using a Nicolet Avatar 370 FTIR Spectrophotometer operated in the ATRmode. Sixteen scans were collected at a resolution of 4.0 cm-1.
1H-NMR: Spectra were obtained using a Varian Mercury 400 MHz NMR. The compounds were analyzed as thehydrochloride salts in D2O (approximately 30 mg/mL) containing TSP as the 0 ppm reference (Note that thespectra are incorrectly labelled with “TMS” - TSP was actually used). Eight scans were collected, using a 90O
pulse and a 2 second relaxation delay. Spectra were processed using 1.0 Hz line broadening.
Results and Discussion
The high purity and clean appearance of the various alkylbenzylamine submissions suggest that they wereindustrially (not clandestinely) produced. However, the large crystal forms of some submissions (especiallyN-isopropylbenzylamine hydrochloride) indicates that clandestine operators are recrystallizing them in order tobetter mimic large “Ice” methamphetamine crystals. All three alkylbenzylamines have melting points slightlyhigher than methamphetamine (see Table 1). Interestingly, the DEA Western Laboratory (San Francisco, CA)reported that the N-isopropylbenzylamine hydrochloride crystals in one bulk submission crushed noticeably moreeasily than typical “Ice” methamphetamine crystals [2]. A similar propensity was noted during this study;
Brought to you by AltGov2 [www.altgov2.org]
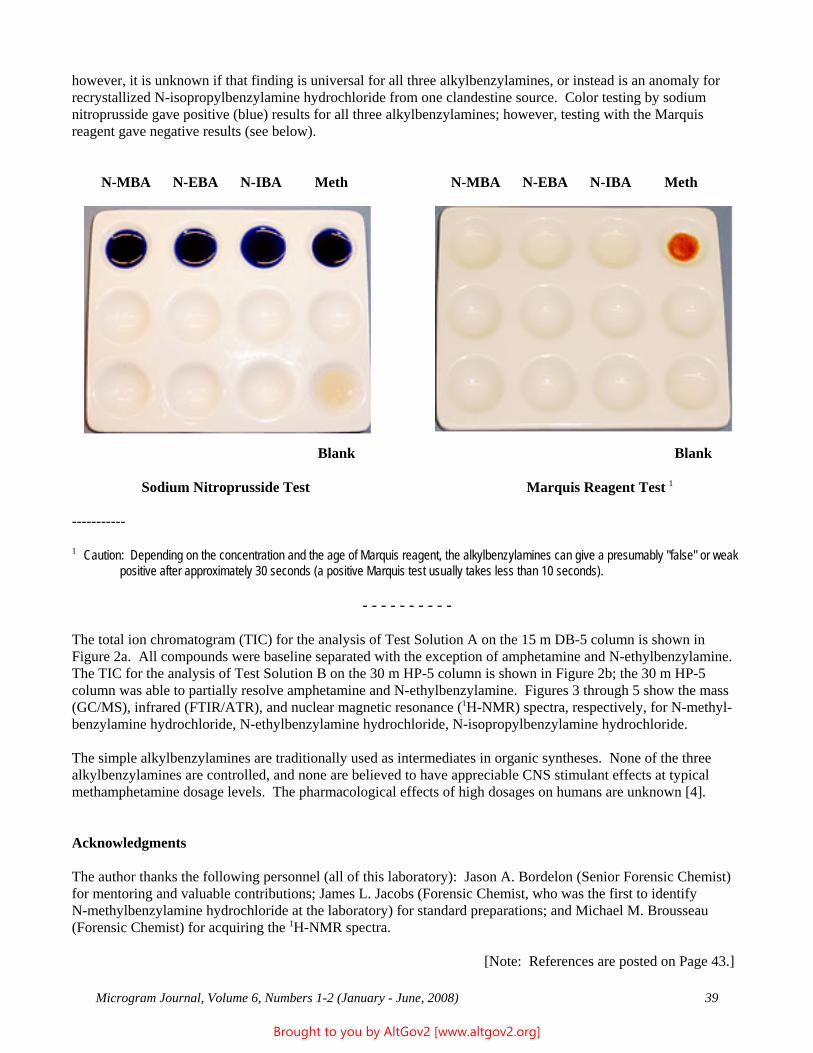
Microgram Journal, Volume 6, Numbers 1-2 (January - June, 2008) 39
however, it is unknown if that finding is universal for all three alkylbenzylamines, or instead is an anomaly forrecrystallized N-isopropylbenzylamine hydrochloride from one clandestine source. Color testing by sodiumnitroprusside gave positive (blue) results for all three alkylbenzylamines; however, testing with the Marquisreagent gave negative results (see below).
N-MBA N-EBA N-IBA Meth N-MBA N-EBA N-IBA Meth
Blank Blank
Sodium Nitroprusside Test Marquis Reagent Test 1
-----------
1 Caution: Depending on the concentration and the age of Marquis reagent, the alkylbenzylamines can give a presumably "false" or weakpositive after approximately 30 seconds (a positive Marquis test usually takes less than 10 seconds).
- - - - - - - - - -
The total ion chromatogram (TIC) for the analysis of Test Solution A on the 15 m DB-5 column is shown inFigure 2a. All compounds were baseline separated with the exception of amphetamine and N-ethylbenzylamine. The TIC for the analysis of Test Solution B on the 30 m HP-5 column is shown in Figure 2b; the 30 m HP-5column was able to partially resolve amphetamine and N-ethylbenzylamine. Figures 3 through 5 show the mass(GC/MS), infrared (FTIR/ATR), and nuclear magnetic resonance (1H-NMR) spectra, respectively, for N-methyl-benzylamine hydrochloride, N-ethylbenzylamine hydrochloride, N-isopropylbenzylamine hydrochloride.
The simple alkylbenzylamines are traditionally used as intermediates in organic syntheses. None of the threealkylbenzylamines are controlled, and none are believed to have appreciable CNS stimulant effects at typicalmethamphetamine dosage levels. The pharmacological effects of high dosages on humans are unknown [4].
Acknowledgments
The author thanks the following personnel (all of this laboratory): Jason A. Bordelon (Senior Forensic Chemist)for mentoring and valuable contributions; James L. Jacobs (Forensic Chemist, who was the first to identifyN-methylbenzylamine hydrochloride at the laboratory) for standard preparations; and Michael M. Brousseau(Forensic Chemist) for acquiring the 1H-NMR spectra.
[Note: References are posted on Page 43.]
Brought to you by AltGov2 [www.altgov2.org]
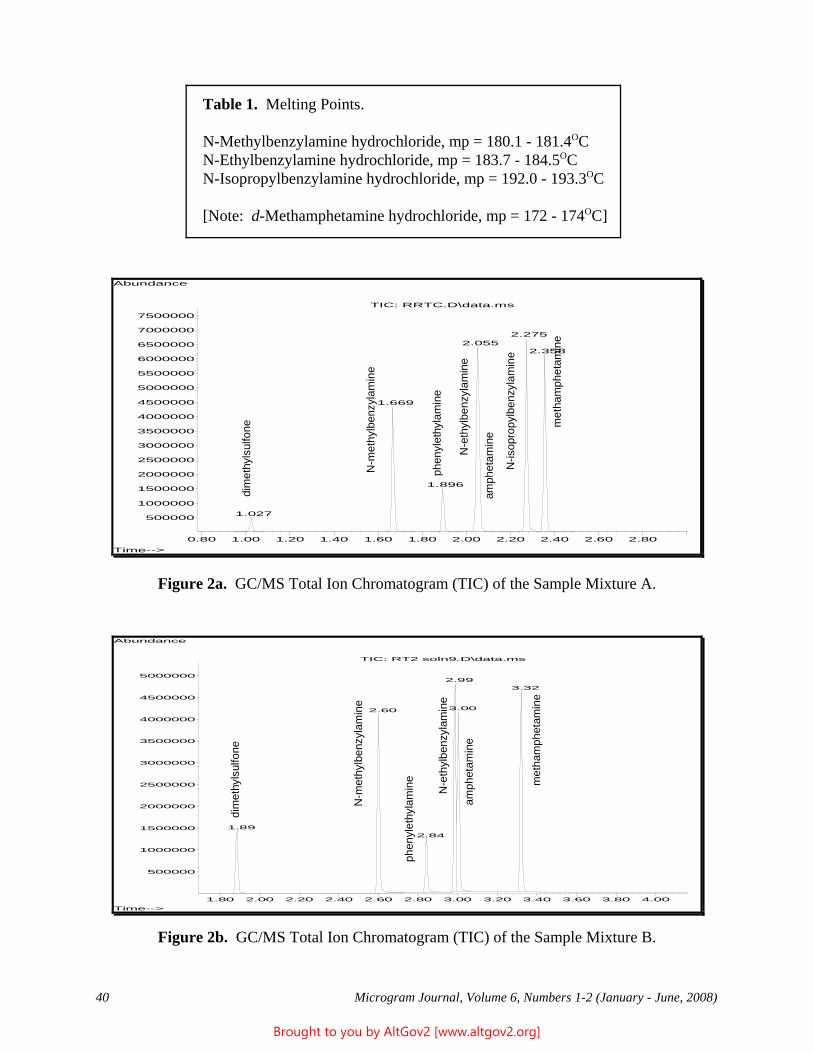
40 Microgram Journal, Volume 6, Numbers 1-2 (January - June, 2008)
Figure 2a. GC/MS Total Ion Chromatogram (TIC) of the Sample Mixture A.
Figure 2b. GC/MS Total Ion Chromatogram (TIC) of the Sample Mixture B.
Table 1. Melting Points.
N-Methylbenzylamine hydrochloride, mp = 180.1 - 181.4OC N-Ethylbenzylamine hydrochloride, mp = 183.7 - 184.5OC N-Isopropylbenzylamine hydrochloride, mp = 192.0 - 193.3OC
[Note: d-Methamphetamine hydrochloride, mp = 172 - 174OC]
0.80 1.00 1.20 1.40 1.60 1.80 2.00 2.20 2.40 2.60 2.80
500000
1000000
1500000
2000000
2500000
3000000
3500000
4000000
4500000
5000000
5500000
6000000
6500000
7000000
7500000
Time-->
Abundance
TIC: RRTC.D\data.ms
1.027
1.669
1.896
2.055 2.275
2.358
phen
ylet
hyla
min
e
dim
ethy
lsul
fone
N-m
ethy
lben
zyla
min
e
N-e
thyl
benz
ylam
ine
N-is
opro
pylb
enzy
lam
ine
met
ham
phet
amin
e
amph
etam
ine
1.80 2.00 2.20 2.40 2.60 2.80 3.00 3.20 3.40 3.60 3.80 4.00
500000
1000000
1500000
2000000
2500000
3000000
3500000
4000000
4500000
5000000
Time-->
Abundance
TIC: RT2 soln9.D\data.ms
1.89
2.60
2.84
2.99
3.00
3.32
dim
ethy
lsul
fone
N-m
ethy
lben
zyla
min
e
N-e
thyl
benz
ylam
ine
amph
etam
ine
met
ham
phet
amin
e
phen
ylet
hyla
min
e
Brought to you by AltGov2 [www.altgov2.org]
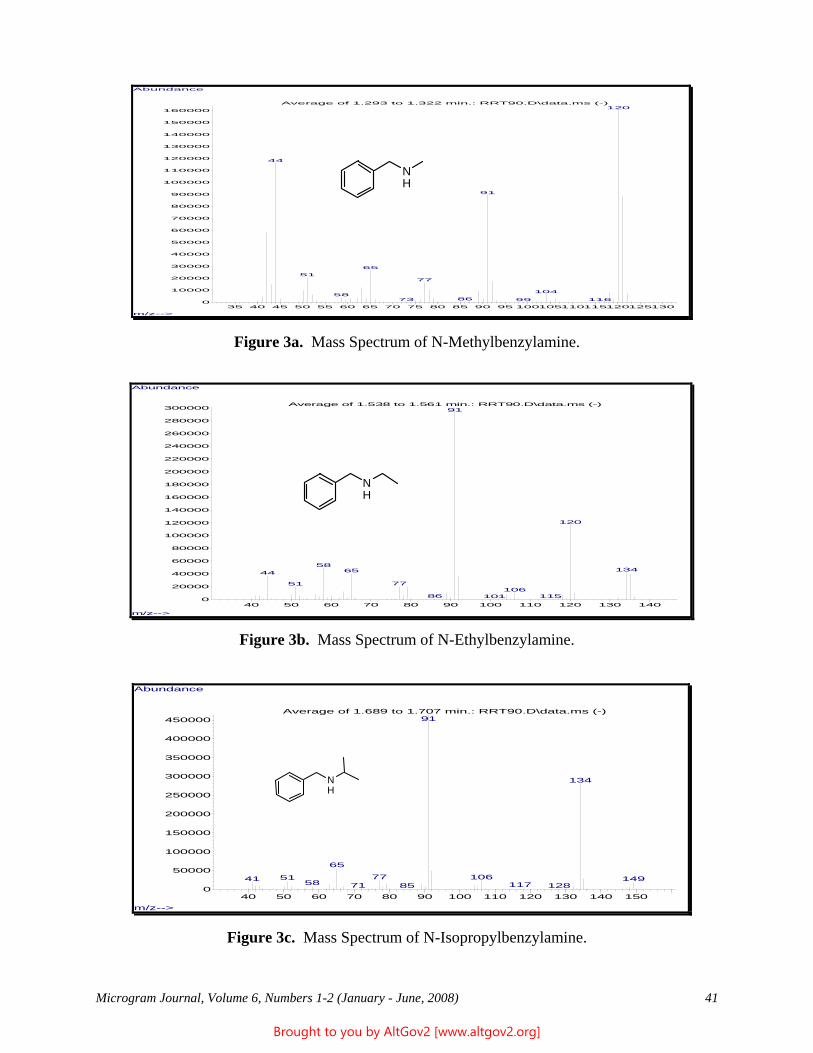
Microgram Journal, Volume 6, Numbers 1-2 (January - June, 2008) 41
Figure 3a. Mass Spectrum of N-Methylbenzylamine.
Figure 3b. Mass Spectrum of N-Ethylbenzylamine.
Figure 3c. Mass Spectrum of N-Isopropylbenzylamine.
35 40 45 50 55 60 65 70 75 80 85 90 95 1001051101151201251300
10000
20000
30000
40000
50000
60000
70000
80000
90000
100000
110000
120000
130000
140000
150000
160000
m/z-->
Abundance
Average of 1.293 to 1.322 min.: RRT90.D\data.ms (-)120
44
91
65
5177
10458
8673 11699
NH
40 50 60 70 80 90 100 110 120 130 1400
20000
40000
60000
80000
100000
120000
140000
160000
180000
200000
220000
240000
260000
280000
300000
m/z-->
Abundance
Average of 1.538 to 1.561 min.: RRT90.D\data.ms (-)91
120
581346544
7751106
86 115101
NH
40 50 60 70 80 90 100 110 120 130 140 1500
50000
100000
150000
200000
250000
300000
350000
400000
450000
m/z-->
Abundance
Average of 1.689 to 1.707 min.: RRT90.D\data.ms (-)91
134
65
77 1065141 14958 11771 12885
NH
Brought to you by AltGov2 [www.altgov2.org]
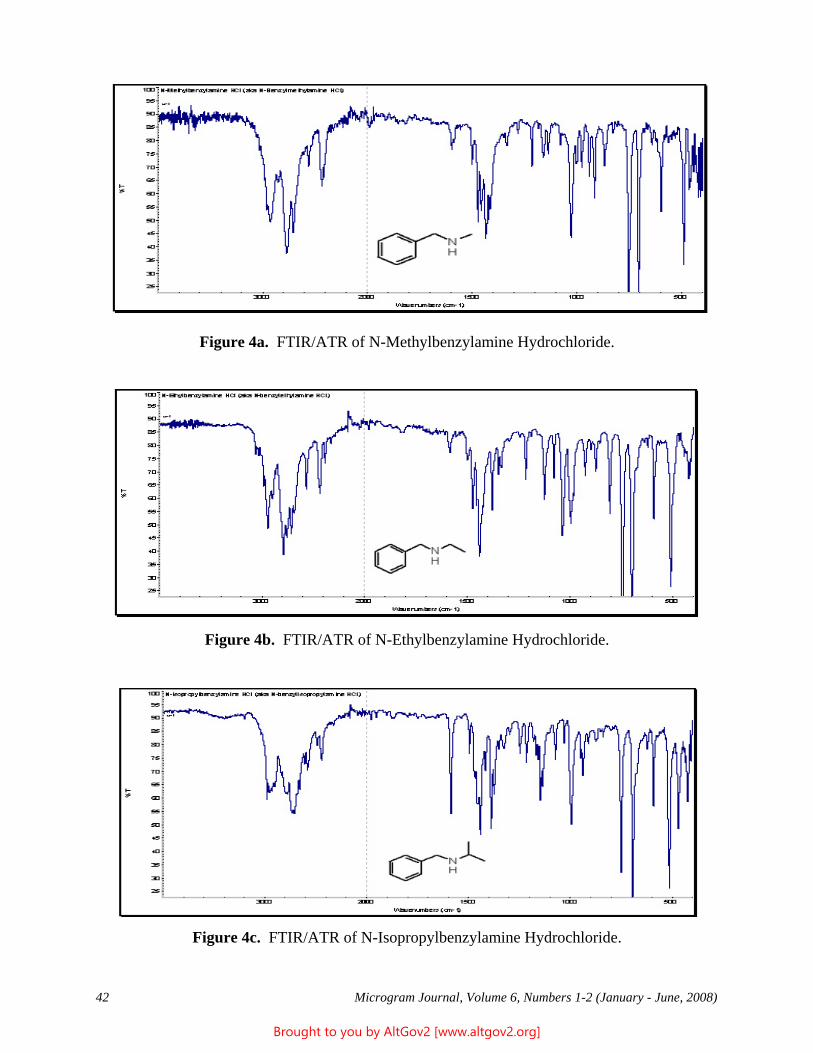
42 Microgram Journal, Volume 6, Numbers 1-2 (January - June, 2008)
Figure 4a. FTIR/ATR of N-Methylbenzylamine Hydrochloride.
Figure 4b. FTIR/ATR of N-Ethylbenzylamine Hydrochloride.
Figure 4c. FTIR/ATR of N-Isopropylbenzylamine Hydrochloride.
Brought to you by AltGov2 [www.altgov2.org]
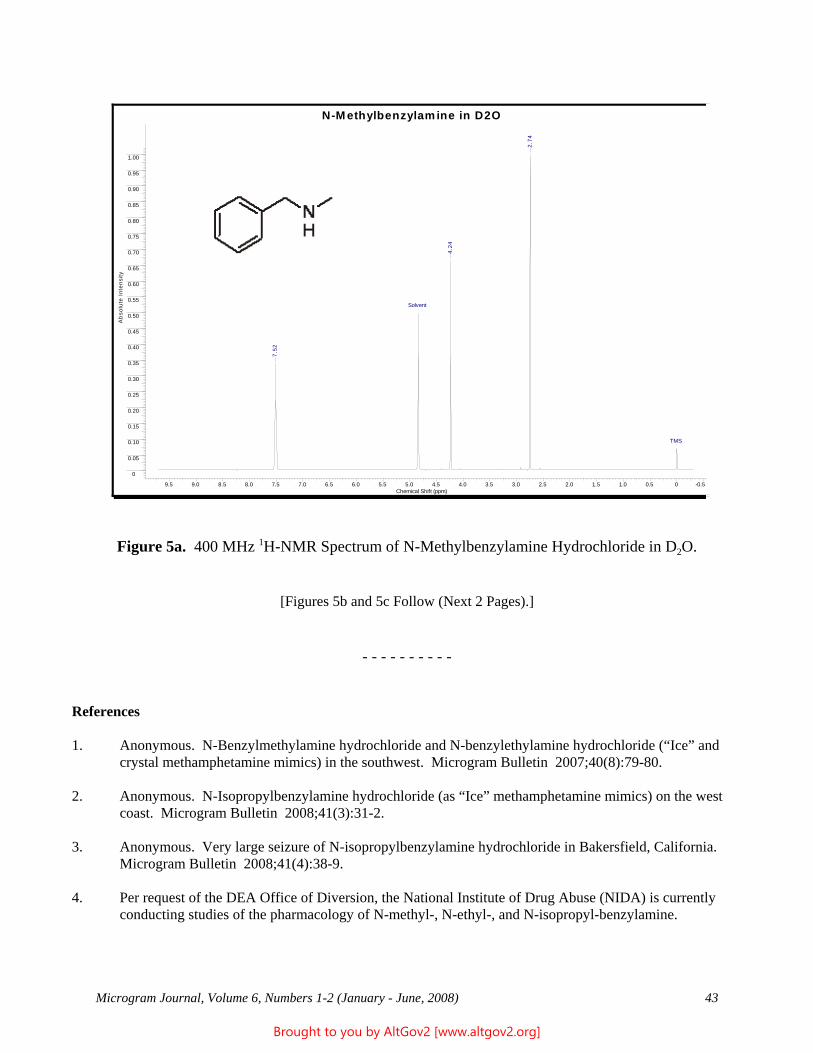
Microgram Journal, Volume 6, Numbers 1-2 (January - June, 2008) 43
Figure 5a. 400 MHz 1H-NMR Spectrum of N-Methylbenzylamine Hydrochloride in D2O.
[Figures 5b and 5c Follow (Next 2 Pages).]
- - - - - - - - - -
References
1. Anonymous. N-Benzylmethylamine hydrochloride and N-benzylethylamine hydrochloride (“Ice” andcrystal methamphetamine mimics) in the southwest. Microgram Bulletin 2007;40(8):79-80.
2. Anonymous. N-Isopropylbenzylamine hydrochloride (as “Ice” methamphetamine mimics) on the westcoast. Microgram Bulletin 2008;41(3):31-2.
3. Anonymous. Very large seizure of N-isopropylbenzylamine hydrochloride in Bakersfield, California. Microgram Bulletin 2008;41(4):38-9.
4. Per request of the DEA Office of Diversion, the National Institute of Drug Abuse (NIDA) is currentlyconducting studies of the pharmacology of N-methyl-, N-ethyl-, and N-isopropyl-benzylamine.
N-M ethylbenzylam ine in D2O
9.5 9.0 8.5 8.0 7.5 7.0 6.5 6.0 5.5 5.0 4.5 4.0 3.5 3.0 2.5 2.0 1.5 1.0 0.5 0 -0.5Chemical Shift (ppm)
0
0.05
0.10
0.15
0.20
0.25
0.30
0.35
0.40
0.45
0.50
0.55
0.60
0.65
0.70
0.75
0.80
0.85
0.90
0.95
1.00
Ab
solu
te I
nten
sity
TMS
Solvent
2.74
4.24
7.52
Brought to you by AltGov2 [www.altgov2.org]
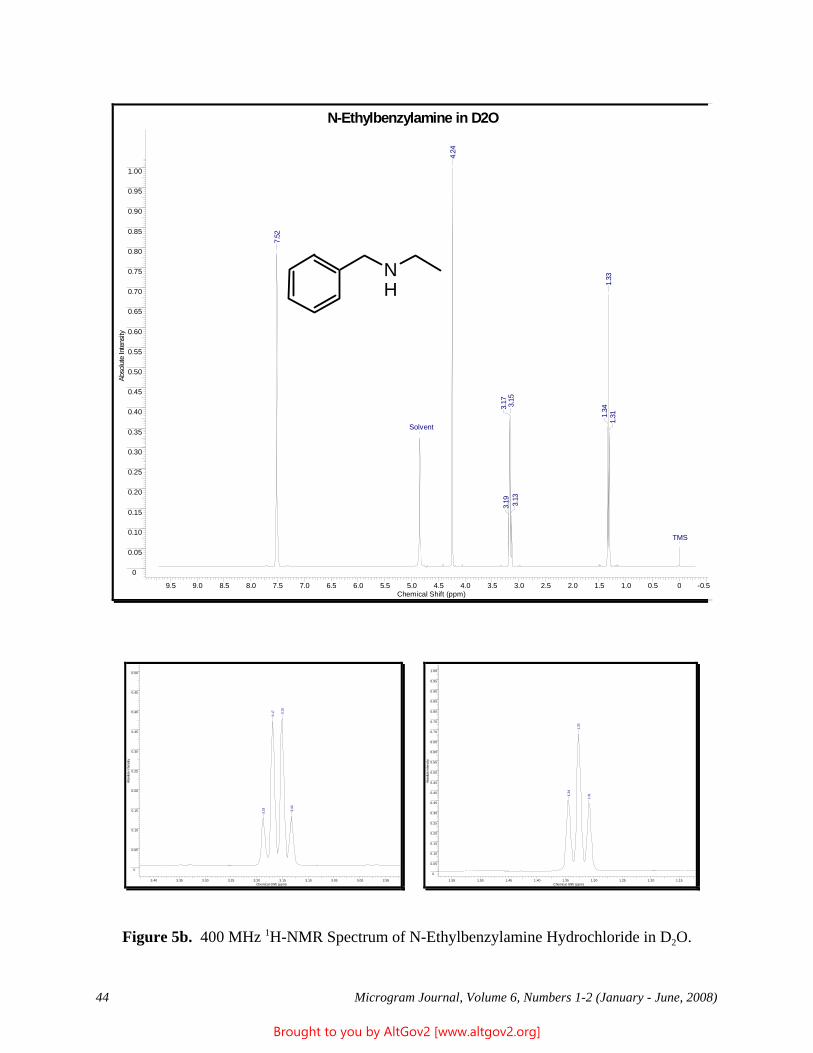
44 Microgram Journal, Volume 6, Numbers 1-2 (January - June, 2008)
Figure 5b. 400 MHz 1H-NMR Spectrum of N-Ethylbenzylamine Hydrochloride in D2O.
N-Ethylbenzylamine in D2O
9.5 9.0 8.5 8.0 7.5 7.0 6.5 6.0 5.5 5.0 4.5 4.0 3.5 3.0 2.5 2.0 1.5 1.0 0.5 0 -0.5Chemical Shift (ppm)
0
0.05
0.10
0.15
0.20
0.25
0.30
0.35
0.40
0.45
0.50
0.55
0.60
0.65
0.70
0.75
0.80
0.85
0.90
0.95
1.00
Abso
lute
Inte
nsity
TMS
Solvent
1.31
1.33
1.34
3.13
3.15
3.17
3.19
4.24
7.52
3.40 3.35 3.30 3.25 3.20 3.15 3.10 3.05 3.00 2.95Chemical Shift (ppm)
0
0.05
0.10
0.15
0.20
0.25
0.30
0.35
0.40
0.45
0.50
Abso
lute
Inte
nsity
3.13
3.15
3.17
3.19
1.55 1.50 1.45 1.40 1.35 1.30 1.25 1.20 1.15Chemical Shift (ppm)
0
0.05
0.10
0.15
0.20
0.25
0.30
0.35
0.40
0.45
0.50
0.55
0.60
0.65
0.70
0.75
0.80
0.85
0.90
0.95
1.00
Abso
lute
Inte
nsity
1.31
1.33
1.34
NH
Brought to you by AltGov2 [www.altgov2.org]
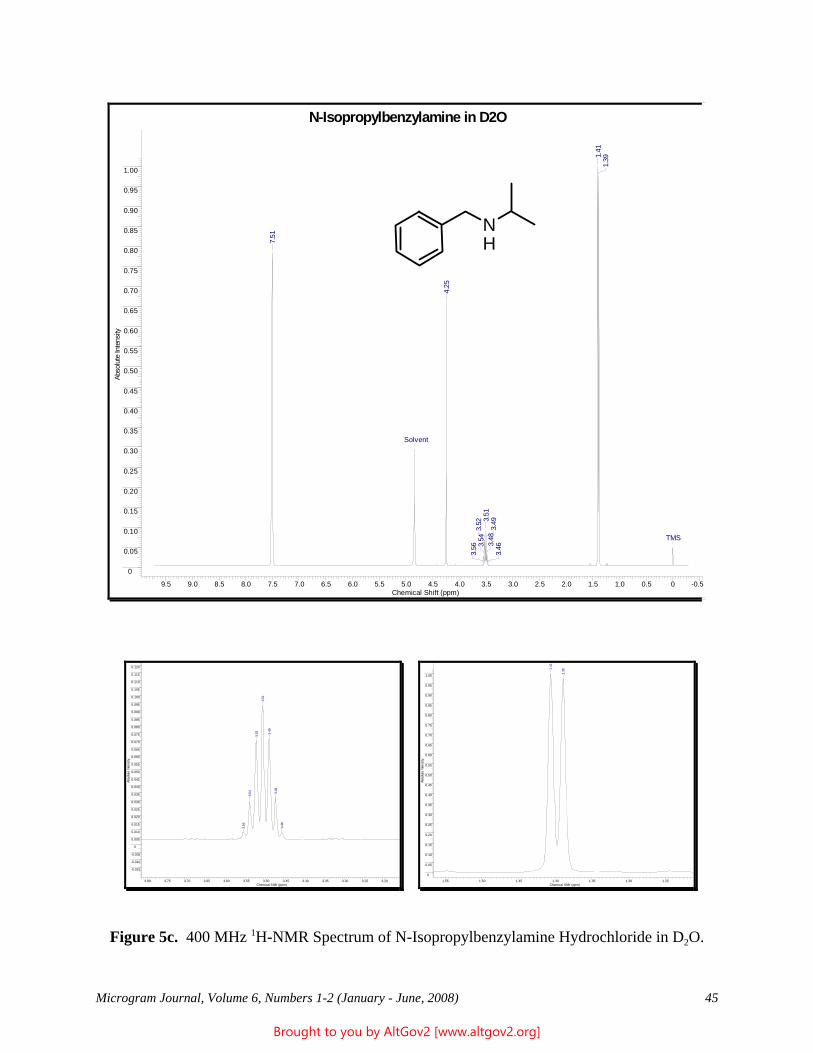
Microgram Journal, Volume 6, Numbers 1-2 (January - June, 2008) 45
Figure 5c. 400 MHz 1H-NMR Spectrum of N-Isopropylbenzylamine Hydrochloride in D2O.
N-Isopropylbenzylamine in D2O
9.5 9.0 8.5 8.0 7.5 7.0 6.5 6.0 5.5 5.0 4.5 4.0 3.5 3.0 2.5 2.0 1.5 1.0 0.5 0 -0.5Chemical Shift (ppm)
0
0.05
0.10
0.15
0.20
0.25
0.30
0.35
0.40
0.45
0.50
0.55
0.60
0.65
0.70
0.75
0.80
0.85
0.90
0.95
1.00
Abso
lute
Inte
nsity
TMS
Solvent
1.391.
41
3.463.
483.
493.51
3.52
3.54
3.56
4.25
7.51
3.80 3.75 3.70 3.65 3.60 3.55 3.50 3.45 3.40 3.35 3.30 3.25 3.20Chemical Shift (ppm)
-0.015
-0.010
-0.005
0
0.005
0.010
0.015
0.020
0.025
0.030
0.035
0.040
0.045
0.050
0.055
0.060
0.065
0.070
0.075
0.080
0.085
0.090
0.095
0.100
0.105
0.110
0.115
0.120
Abso
lute
Inte
nsity
3.46
3.48
3.49
3.51
3.52
3.54
3.56
1.55 1.50 1.45 1.40 1.35 1.30 1.25Chemical Shift (ppm)
0
0.05
0.10
0.15
0.20
0.25
0.30
0.35
0.40
0.45
0.50
0.55
0.60
0.65
0.70
0.75
0.80
0.85
0.90
0.95
1.00
Abso
lute
Inte
nsity
1.391.
41
NH
Brought to you by AltGov2 [www.altgov2.org]
46 Microgram Journal, Volume 6, Numbers 1-2 (January - June, 2008)
Isolation of Methamphetamine from 1-(1',4'-Cyclohexadienyl)-2-methyl-aminopropane (CMP) Using Potassium Permanganate
Fracia S. Martinez,* Daniel M. Roesch, and James L. JacobsU.S. Department of Justice
Drug Enforcement AdministrationSouthwest Laboratory
2815 Scott St.Vista, CA 92081
[email: fracia.s.martinez -at- usdoj.gov]
[Reprinted with Permission from the Journal of the Clandestine Laboratory InvestigatingChemists Association 2008;18(1):18-22. Reformatted to Microgram Journal standards;Abstract and Keywords Added (and Slight Changes Made) by the Microgram Editor.]
ABSTRACT: Methamphetamine illicitly prepared via active metal/ammonia (Birch) reduction of ephedrine orpseudoephedrine is commonly contaminated with 1-(1',4'-cyclohexadienyl)-2-methylaminopropane (CMP), oftenin significant amounts. Large percentages of CMP in methamphetamine samples result in poor quality (mixed)FTIR spectra. Preliminary treatment/cleanup of CMP-contaminated samples with potassium permanganate gives“clean” methamphetamine for FTIR analysis.
KEYWORDS: Methamphetamine, 1-(1',4'-Cyclohexadienyl)-2-methylaminopropane, Ephedrine,Pseudoephedrine, Birch Reduction, Potassium Permanganate, Forensic Chemistry
Introduction
One of the primary methods of clandestine methamphetamine synthesis is the reduction of ephedrine orpseudoephedrine utilizing an alkali metal such as lithium or sodium, and liquefied ammonia. During a typicalreduction of (pseudo)ephedrine, only the hydroxyl group is reduced, producing methamphetamine. With excessalkali metal, and in the presence of an additional proton source [1-8], the aromatic ring is additionally reduced toform a cyclohexadiene (Figure 1). This product is readily generated and is consistent with Birch (Na, EtOH,NH3) type reactions. The product produced in this reaction is known as 1-(1',4'-cyclohexadienyl)-2-methylamino-propane (CMP), or more simply, the Birch reduction product. On occasion, the CMP to methamphetamine ratiois very high in the final product of this synthesis, which can yield an undesirable, mixed infra-red spectrum(Figure 2 - second pane). Separation and identification of methamphetamine and CMP is easily accomplished bygas chromatography/mass spectroscopy, but some scientists prefer infrared spectroscopy, as it provides easydifferentiation of the various phenethylamines. This paper will describe a quick, qualitative method for theelimination of CMP commonly found with methamphetamine manufactured from (pseudo)ephedrine using thelithium - ammonia reduction method [9-11].
Experimental
Reagents and Solutions:* A 2% solution of potassium permanganate was prepared by dissolving 0.5 grams KMnO4 in 25 mL water
(use caution, potassium permanganate is a moderately strong oxidizing corrosive).* Aqueous base (sodium hydroxide, sodium bicarbonate, etc.).
Brought to you by AltGov2 [www.altgov2.org]
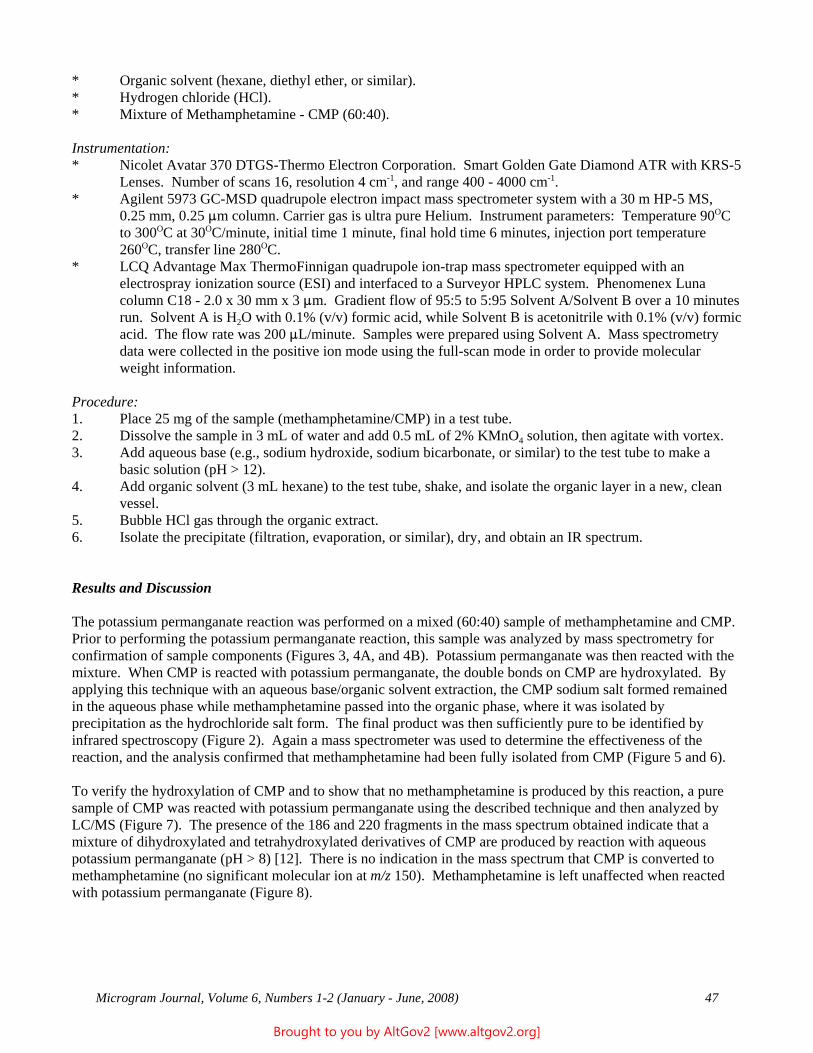
Microgram Journal, Volume 6, Numbers 1-2 (January - June, 2008) 47
* Organic solvent (hexane, diethyl ether, or similar).* Hydrogen chloride (HCl).* Mixture of Methamphetamine - CMP (60:40).
Instrumentation:* Nicolet Avatar 370 DTGS-Thermo Electron Corporation. Smart Golden Gate Diamond ATR with KRS-5
Lenses. Number of scans 16, resolution 4 cm-1, and range 400 - 4000 cm-1.* Agilent 5973 GC-MSD quadrupole electron impact mass spectrometer system with a 30 m HP-5 MS,
0.25 mm, 0.25 :m column. Carrier gas is ultra pure Helium. Instrument parameters: Temperature 90OCto 300OC at 30OC/minute, initial time 1 minute, final hold time 6 minutes, injection port temperature260OC, transfer line 280OC.
* LCQ Advantage Max ThermoFinnigan quadrupole ion-trap mass spectrometer equipped with anelectrospray ionization source (ESI) and interfaced to a Surveyor HPLC system. Phenomenex Lunacolumn C18 - 2.0 x 30 mm x 3 :m. Gradient flow of 95:5 to 5:95 Solvent A/Solvent B over a 10 minutesrun. Solvent A is H2O with 0.1% (v/v) formic acid, while Solvent B is acetonitrile with 0.1% (v/v) formicacid. The flow rate was 200 :L/minute. Samples were prepared using Solvent A. Mass spectrometrydata were collected in the positive ion mode using the full-scan mode in order to provide molecularweight information.
Procedure:1. Place 25 mg of the sample (methamphetamine/CMP) in a test tube.2. Dissolve the sample in 3 mL of water and add 0.5 mL of 2% KMnO4 solution, then agitate with vortex.3. Add aqueous base (e.g., sodium hydroxide, sodium bicarbonate, or similar) to the test tube to make a
basic solution (pH > 12).4. Add organic solvent (3 mL hexane) to the test tube, shake, and isolate the organic layer in a new, clean
vessel.5. Bubble HCl gas through the organic extract.6. Isolate the precipitate (filtration, evaporation, or similar), dry, and obtain an IR spectrum.
Results and Discussion
The potassium permanganate reaction was performed on a mixed (60:40) sample of methamphetamine and CMP. Prior to performing the potassium permanganate reaction, this sample was analyzed by mass spectrometry forconfirmation of sample components (Figures 3, 4A, and 4B). Potassium permanganate was then reacted with themixture. When CMP is reacted with potassium permanganate, the double bonds on CMP are hydroxylated. Byapplying this technique with an aqueous base/organic solvent extraction, the CMP sodium salt formed remainedin the aqueous phase while methamphetamine passed into the organic phase, where it was isolated byprecipitation as the hydrochloride salt form. The final product was then sufficiently pure to be identified byinfrared spectroscopy (Figure 2). Again a mass spectrometer was used to determine the effectiveness of thereaction, and the analysis confirmed that methamphetamine had been fully isolated from CMP (Figure 5 and 6).
To verify the hydroxylation of CMP and to show that no methamphetamine is produced by this reaction, a puresample of CMP was reacted with potassium permanganate using the described technique and then analyzed byLC/MS (Figure 7). The presence of the 186 and 220 fragments in the mass spectrum obtained indicate that amixture of dihydroxylated and tetrahydroxylated derivatives of CMP are produced by reaction with aqueouspotassium permanganate (pH > 8) [12]. There is no indication in the mass spectrum that CMP is converted tomethamphetamine (no significant molecular ion at m/z 150). Methamphetamine is left unaffected when reactedwith potassium permanganate (Figure 8).
Brought to you by AltGov2 [www.altgov2.org]
48 Microgram Journal, Volume 6, Numbers 1-2 (January - June, 2008)
Conclusions
In mixtures where the ratio of CMP to methamphetamine is high, the isolation of methamphetamine can beachieved by reacting CMP with potassium permanganate and an aqueous base. The procedure facilitates theisolation of methamphetamine from its primary by-product associated with the lithium - ammonia method ofmethamphetamine synthesis. It is rapid and straightforward, with few steps, and allows for convenientidentification of methamphetamine using infrared spectroscopy.
Acknowledgments
The authors acknowledge the contributions and assistance of Supervisory Chemist David W. Love; SeniorForensic Chemist Sandra E. Rodriguez-Cruz, Ph.D.; and Laboratory Worker Donald G. Smith (all at thislaboratory).
References
1. Smith M. Dissolving Metal Reactions; In: Reduction, Robert L. Augustine, ed., Marcel Dekker, NewYork, NY:1968, pp. 95-108, 118, 121-122, 12-127, 131-132, and 162-170.
2. Watt GW. Reactions of organic and organometallic compounds with solutions of metals in liquidammonia. Chemical Reviews 1950;46:317-322; 328-329; 335-338; and 371-379.
3. Kaiser EM. A comparison of methods using lithium/amine and Birch reduction systems. Synthesis 1972(8):391-415.
4. Birch AJ, Smith H. Reductions by metal-amine solutions: Applications in synthesis and determination ofstructure. Quarterly Reviews (The Chemical Society, London) 1958;12:17-33.
5. Birch AJ. The reductions of organic compounds by metal-ammonia solutions. Quarterly Reviews (TheChemical Society, London) 1950;4:69-93.
6. March J. Hydrogenation of Aromatic Rings; In: Advanced Organic Chemistry, 3rd Ed., John Wiley andSons, New York, NY:1985; pp. 700-702.
7. Vogel AI. Reduction of Aromatic Compounds; In: Vogel’s Textbook of Practical Organic Chemistry,5th Ed., Brian S. Furniss, et al., eds, 1989, John Wiley and Sons (Co-publisher), New York, NY:1989;pp. 1114-1117.
8. Fieser LF, Fieser M. Birch Reduction; In: Reagents for Organic Synthesis, John Wiley and Sons, NewYork, NY:1967; pp. 54-56.
9. Person EC, Meyers JA, Vyvyan JR. Structural determination of the principal byproduct of thelithium-ammonia reduction method of methamphetamine manufacture. Journal of Forensic Sciences 2005;50(1):1-9.
10. Person EC, Knops LA. Clandestine ammonia generation. Journal of the Clandestine LaboratoryInvestigating Chemists Association 2004;14(1):20-25.*
11. Anonymous. Methamphetamine byproduct from birch reduction tentatively identified. Journal of theClandestine Laboratory Investigating Chemists Association 1997;7(2):7-10.*
Brought to you by AltGov2 [www.altgov2.org]
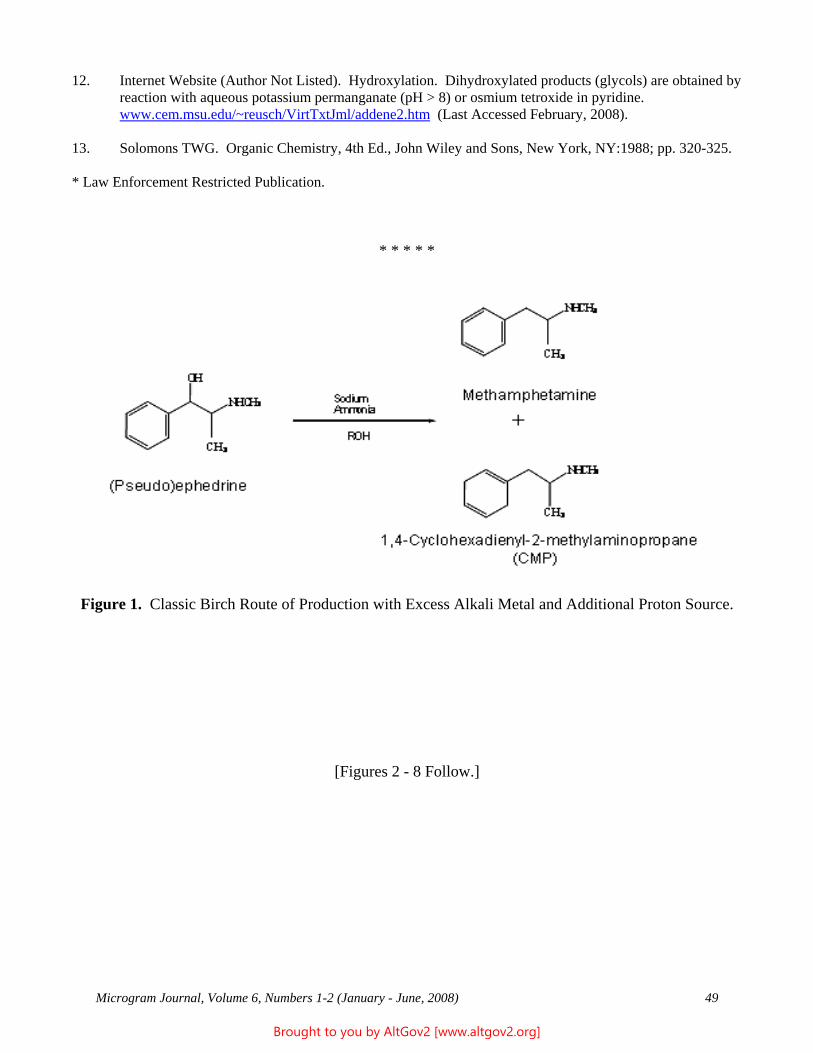
Microgram Journal, Volume 6, Numbers 1-2 (January - June, 2008) 49
12. Internet Website (Author Not Listed). Hydroxylation. Dihydroxylated products (glycols) are obtained byreaction with aqueous potassium permanganate (pH > 8) or osmium tetroxide in pyridine. www.cem.msu.edu/~reusch/VirtTxtJml/addene2.htm (Last Accessed February, 2008).
13. Solomons TWG. Organic Chemistry, 4th Ed., John Wiley and Sons, New York, NY:1988; pp. 320-325.
* Law Enforcement Restricted Publication.
* * * * *
Figure 1. Classic Birch Route of Production with Excess Alkali Metal and Additional Proton Source.
[Figures 2 - 8 Follow.]
Brought to you by AltGov2 [www.altgov2.org]
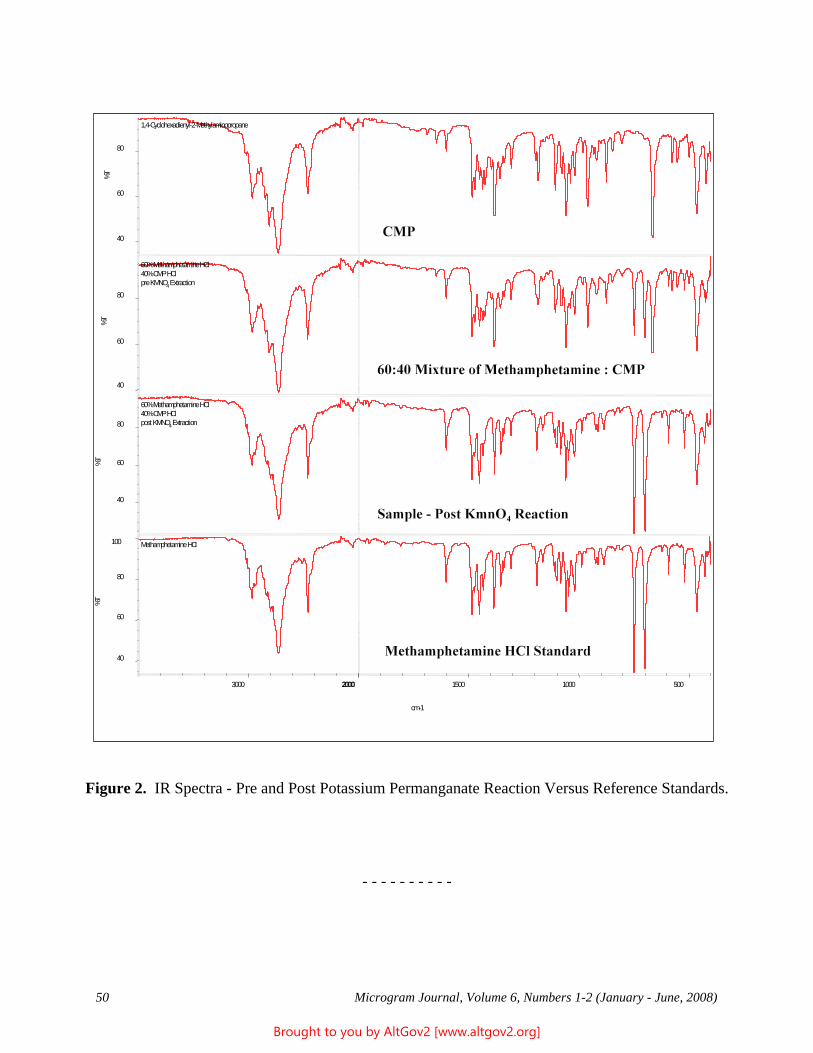
50 Microgram Journal, Volume 6, Numbers 1-2 (January - June, 2008)
Figure 2. IR Spectra - Pre and Post Potassium Permanganate Reaction Versus Reference Standards.
- - - - - - - - - -
1,4-Cyclohexadienyl-2-Methylaminopropane
40
60
80
%T
60% Methamphetamine HCl40% CMP HClpre KMNO4Extraction
40
60
80
%T
60% Methamphetamine HCl40% CMP HClpost KMNO4Extraction
40
60
80
%T
Methamphetamine HCl
40
60
80
100
%T
500 1000 1500 2000 2000 3000
cm-1
Brought to you by AltGov2 [www.altgov2.org]
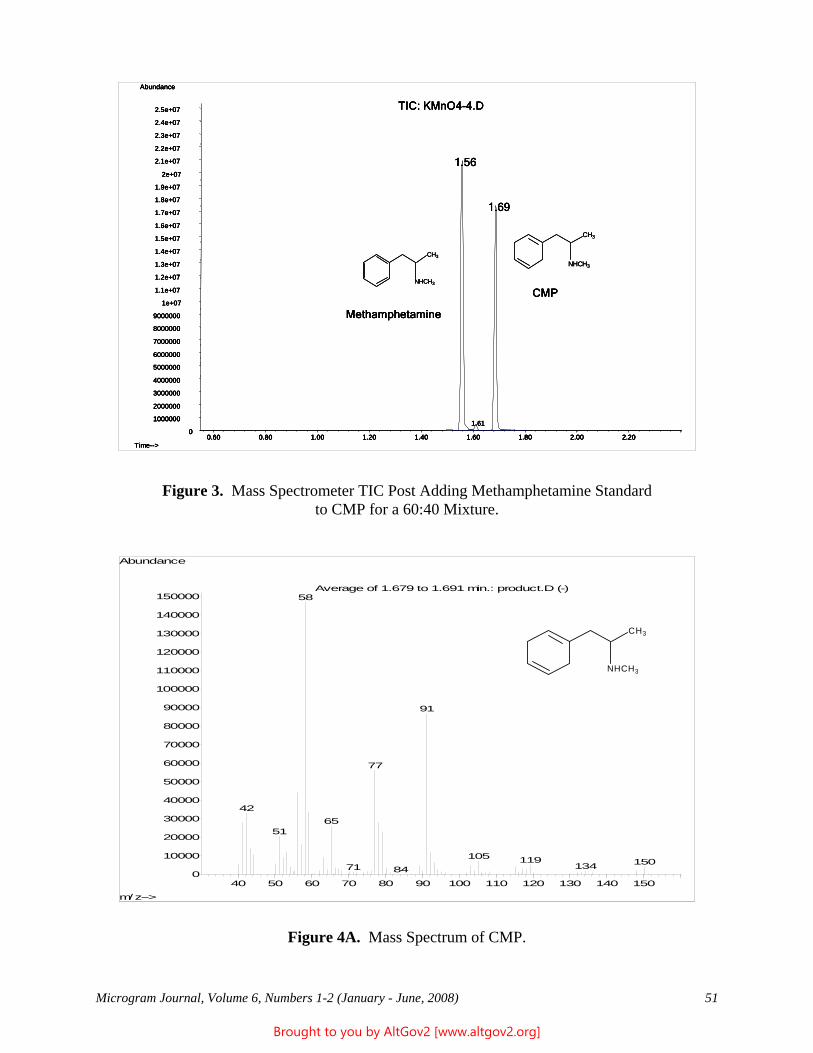
Microgram Journal, Volume 6, Numbers 1-2 (January - June, 2008) 51
Figure 3. Mass Spectrometer TIC Post Adding Methamphetamine Standardto CMP for a 60:40 Mixture.
Figure 4A. Mass Spectrum of CMP.
0.60 0.80 1.00 1.20 1.40 1.60 1.80 2.00 2.200
1000000
2000000
3000000
4000000
5000000
6000000
7000000
8000000
9000000
1e+07
1.1e+07
1.2e+07
1.3e+07
1.4e+07
1.5e+07
1.6e+07
1.7e+07
1.8e+07
1.9e+07
2e+07
2.1e+07
2.2e+07
2.3e+07
2.4e+07
2.5e+07
Time-->
Abundance
TIC: KMnO4-4.D
1.56
1.61
1.69
Methamphetamine
CMP
CH3
NHCH3
CH3
NHCH3
0.60 0.80 1.00 1.20 1.40 1.60 1.80 2.00 2.200
1000000
2000000
3000000
4000000
5000000
6000000
7000000
8000000
9000000
1e+07
1.1e+07
1.2e+07
1.3e+07
1.4e+07
1.5e+07
1.6e+07
1.7e+07
1.8e+07
1.9e+07
2e+07
2.1e+07
2.2e+07
2.3e+07
2.4e+07
2.5e+07
Time-->
Abundance
TIC: KMnO4-4.D
1.56
1.61
1.69
Methamphetamine
CMP
0.60 0.80 1.00 1.20 1.40 1.60 1.80 2.00 2.200
1000000
0.60 0.80 1.00 1.20 1.40 1.60 1.80 2.00 2.200
1000000
2000000
3000000
4000000
5000000
6000000
7000000
8000000
9000000
1e+07
1.1e+07
1.2e+07
1.3e+07
1.4e+07
1.5e+07
1.6e+07
1.7e+07
1.8e+07
1.9e+07
2e+07
2.1e+07
2.2e+07
2.3e+07
2.4e+07
2.5e+07
Time-->
Abundance
TIC: KMnO4-4.D
1.56
1.61
1.69
Methamphetamine
CMP
CH3
NHCH3
CH3
NHCH3
40 50 60 70 80 90 100 110 120 130 140 1500
10000
20000
30000
40000
50000
60000
70000
80000
90000
100000
110000
120000
130000
140000
150000
m/z-->
Abundance
Average of 1.679 to 1.691 min.: product.D (-)58
91
77
4265
51
105 119 15013471 84
CH3
NHCH3
Brought to you by AltGov2 [www.altgov2.org]
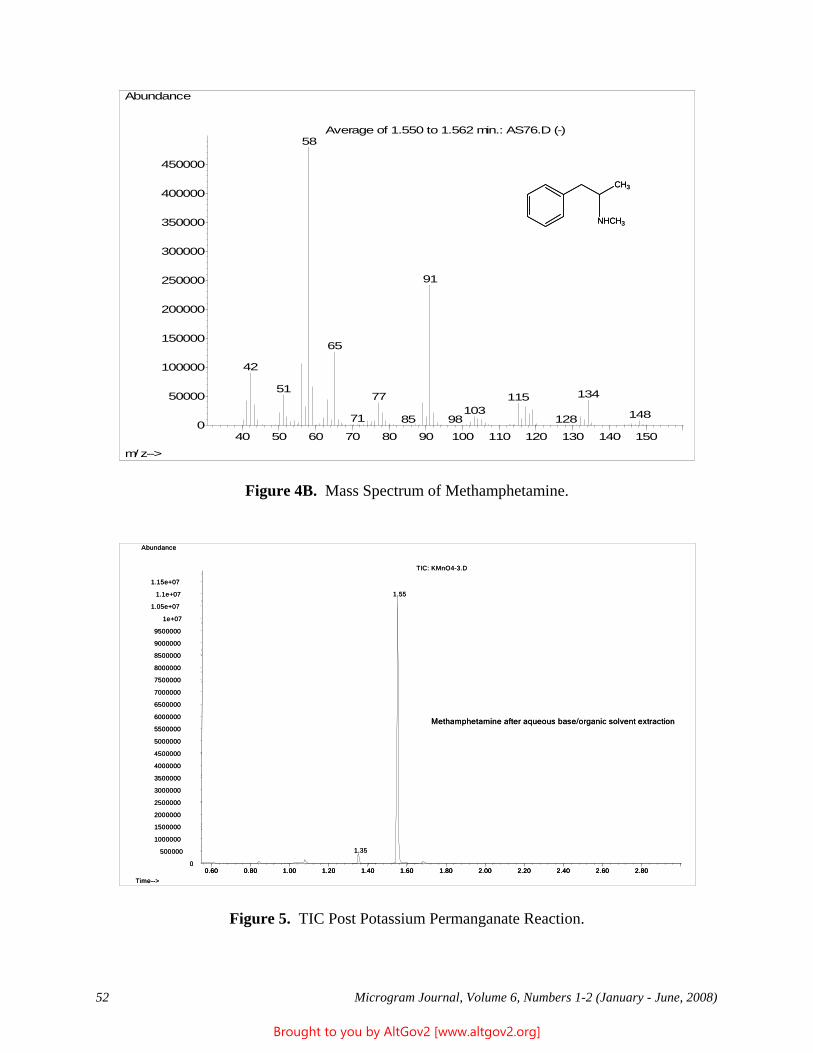
52 Microgram Journal, Volume 6, Numbers 1-2 (January - June, 2008)
Figure 4B. Mass Spectrum of Methamphetamine.
Figure 5. TIC Post Potassium Permanganate Reaction.
40 50 60 70 80 90 100 110 120 130 140 1500
50000
100000
150000
200000
250000
300000
350000
400000
450000
m/z-->
Abundance
Average of 1.550 to 1.562 min.: AS76.D (-)58
91
65
42
51 13477 115103 14871 1289885
CH3
NHCH3
40 50 60 70 80 90 100 110 120 130 140 1500
50000
100000
150000
200000
250000
300000
350000
400000
450000
m/z-->
Abundance
Average of 1.550 to 1.562 min.: AS76.D (-)58
91
65
42
51 13477 115103 14871 1289885
CH3
NHCH3
0.60 0.80 1.00 1.20 1.40 1.60 1.80 2.00 2.20 2.40 2.60 2.800
500000
1000000
1500000
2000000
2500000
3000000
3500000
4000000
4500000
5000000
5500000
6000000
6500000
7000000
7500000
8000000
8500000
9000000
9500000
1e+07
1.05e+07
1.1e+07
1.15e+07
Time-->
Abundance
TIC: KMnO4-3.D
1.35
1.55
Methamphetamine after aqueous base/organic solvent extraction
0.60 0.80 1.00 1.20 1.40 1.60 1.80 2.00 2.20 2.40 2.60 2.800.60 0.80 1.00 1.20 1.40 1.60 1.80 2.00 2.20 2.40 2.60 2.800
500000
1000000
1500000
2000000
2500000
3000000
3500000
4000000
4500000
5000000
5500000
6000000
6500000
7000000
7500000
8000000
8500000
9000000
9500000
1e+07
1.05e+07
1.1e+07
1.15e+07
Time-->
Abundance
TIC: KMnO4-3.D
1.35
1.55
Methamphetamine after aqueous base/organic solvent extraction
Brought to you by AltGov2 [www.altgov2.org]
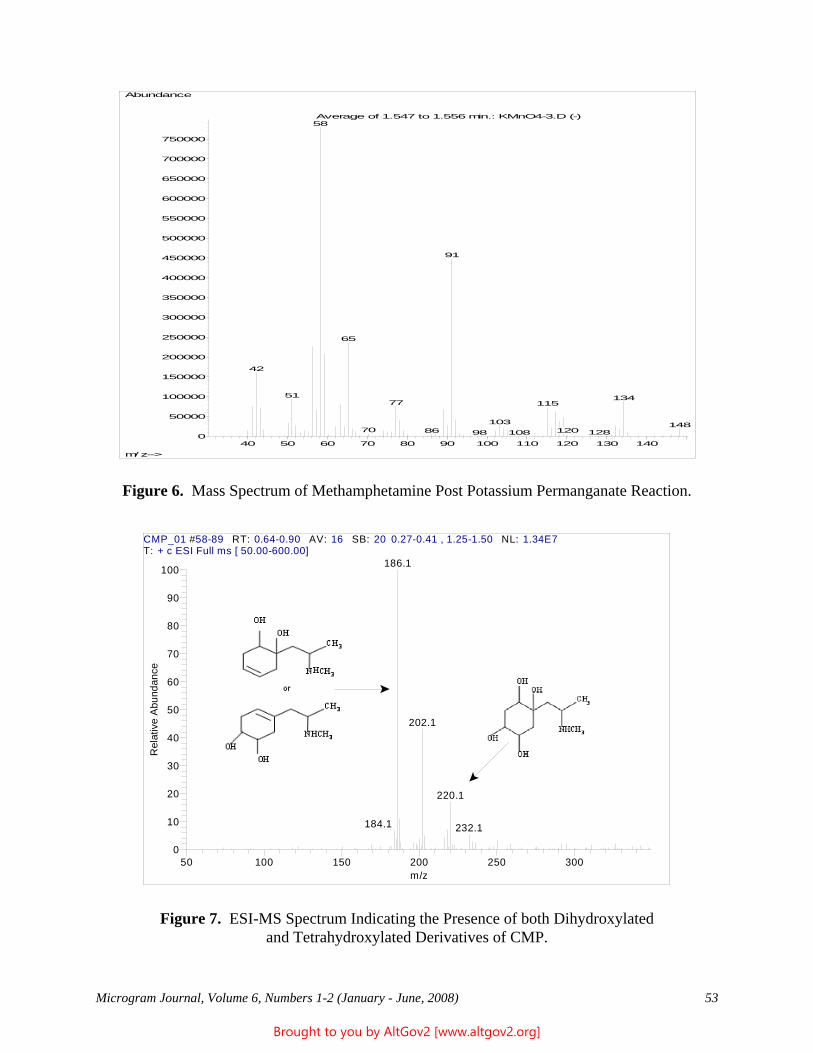
Microgram Journal, Volume 6, Numbers 1-2 (January - June, 2008) 53
Figure 6. Mass Spectrum of Methamphetamine Post Potassium Permanganate Reaction.
Figure 7. ESI-MS Spectrum Indicating the Presence of both Dihydroxylatedand Tetrahydroxylated Derivatives of CMP.
40 50 60 70 80 90 100 110 120 130 1400
50000
100000
150000
200000
250000
300000
350000
400000
450000
500000
550000
600000
650000
700000
750000
m/ z-->
Abundance
Average of 1.547 to 1.556 min.: KMnO4-3.D (-)58
91
65
42
51 13477 115
103 14870 12086 12810898
CMP_01 #58-89 RT: 0.64-0.90 AV: 16 SB: 20 0.27-0.41 , 1.25-1.50 NL: 1.34E7T: + c ESI Full ms [ 50.00-600.00]
50 100 150 200 250 300m/z
0
10
20
30
40
50
60
70
80
90
100
Rel
ativ
e A
bund
ance
186.1
202.1
220.1
184.1 232.1
Brought to you by AltGov2 [www.altgov2.org]
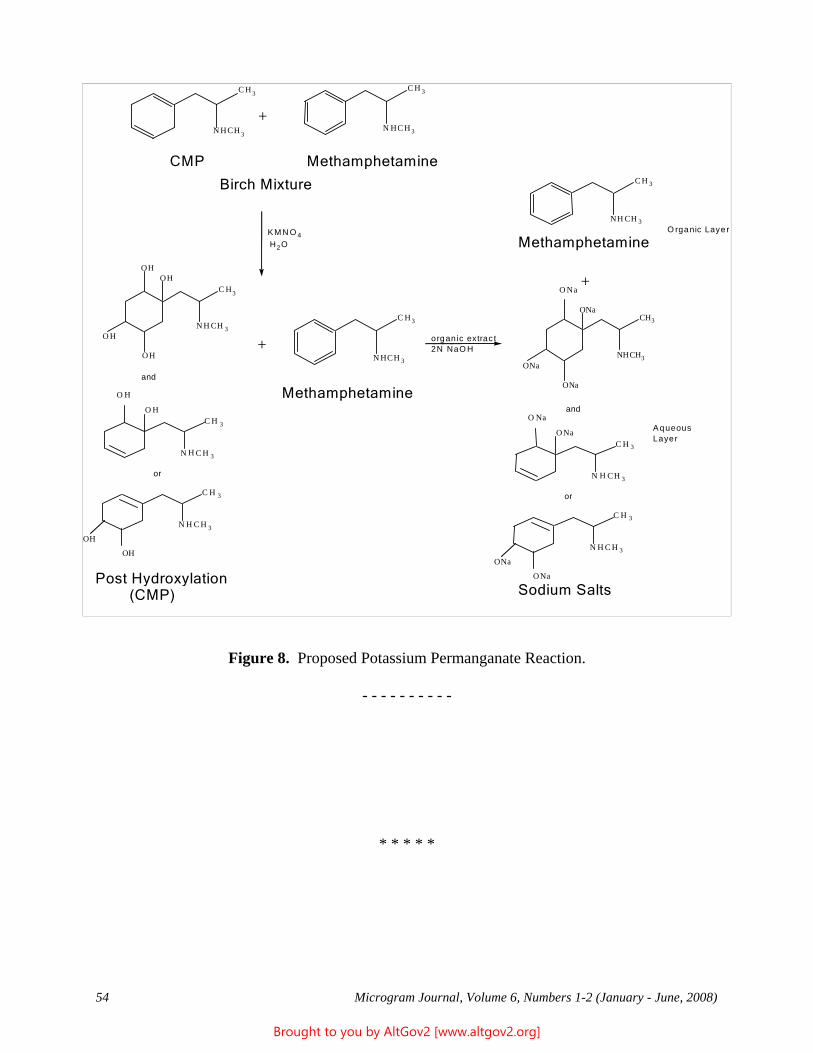
54 Microgram Journal, Volume 6, Numbers 1-2 (January - June, 2008)
Figure 8. Proposed Potassium Permanganate Reaction.
- - - - - - - - - -
* * * * *
C H 3
N HC H 3
C H 3
N H C H 3CMP
+
K M N O 4 H 2 O
C H 3
N HCH 3
+
C H 3 O H O H
N H C H 3 O H
O H organic extrac t2N NaO H
C H 3
N H C H 3
AqueousLayer
O
O N a C H 3
N H C H 3
O N a
ON a Na
+
O rganic Layer
and
C H 3 O H
O H
N H C H 3
C H 3
O H O H
N H C H 3
or
C H 3 O Na
O Na
N H C H 3
C H 3
O Na
O Na
N H C H 3
or
and
Methamphetamine
Methamphetamine
Methamphetamine
Post Hydroxylation (CMP)
Birch Mixture
Sodium Salts
Brought to you by AltGov2 [www.altgov2.org]
Microgram Journal, Volume 6, Numbers 1-2 (January - June, 2008) 55
Information and Instructions for Authors for Microgram Journal
General InformationMicrogram Journal is a scientific periodical published by the U.S. Drug Enforcement Administration’s Office ofForensic Sciences, that presents peer reviewed, full length Scientific Research Articles and Technical Notes onthe detection and analyses of suspected controlled substances for forensic/law enforcement purposes.
Access to Microgram JournalMicrogram Journal is unclassified, and is published on the DEA public access website (at: www.dea.gov/programs/forensicsci/microgram/index.html). At this time, Microgram Journal is available onlyelectronically, and requires Internet access. Professional scientific and law enforcement personnel may requestemail notifications when new issues are posted (such notifications are not available to private citizens). Thepublications themselves are never sent electronically (that is, as attachments).
Requests to be added to the email notification list should preferably be submitted via email to the MicrogramEditor at: DEA-Microgram-2008 -at- mailsnare.net Requests can also be mailed to: Microgram Editor, DrugEnforcement Administration, Office of Forensic Sciences, 8701 Morrissette Drive, Springfield, VA 22152. Allrequests to be added to the Microgram email notification list should include the following Standard ContactInformation:
* The Full Name and Mailing Address of Submitting Laboratory or Office;
* The Full Name, Title (Laboratory Director, Assistant Special Agent in Charge, Librarian, etc.), PhoneNumber, FAX Number, and Preferred email Address of the Submitting Individual (Note that emailnotifications are mailed to titles, not names, in order to avoid problems arising from future personnelchanges);
* If available, the generic email address for the Submitting Laboratory or Office;
* If a generic email address is not available, one private email address for an individual who is likely to bea long-term employee, who has a stable email address, and who will be responsible for forwardingMicrogram information to all of the other employees in the requestor’s Office (Note that only one emailaddress per Office will be honored).
Requests to be removed from the Microgram email notification list, or to change an existing email address, shouldalso be sent to the Microgram Editor. Such requests should include all of the pertinent Standard ContactInformation detailed above, and also should provide both the previous and the new email addresses.
Email notification requests/changes are usually implemented within six weeks.
Email Notifications (Additional Comments)As noted above, the email notification indicates which issue has been posted, provides the Microgram URL, andadditional information as appropriate. Note that Microgram e-notices will NEVER include any attachments, orany hyperlink other than the Microgram URL. This is important, because the Microgram email address isroutinely hijacked and used to send spam, very commonly including malicious attachments. For this reason,all subscribers are urged to have current anti-viral, anti-spyware, and firewall programs in operation. However, inorder to ensure that the email notifications are not filtered as spam, the DEA-Microgram-2008 -at- mailsnareemail address must be “whitelisted” by the Office’s ISP.
Brought to you by AltGov2 [www.altgov2.org]
56 Microgram Journal, Volume 6, Numbers 1-2 (January - June, 2008)
CostsAccess to Microgram Journal is free.
Submissions to Microgram JournalManuscripts are accepted both from within and outside of DEA, and reviewers are both internal (from withinDEA) and external.
All submissions must be in English. All submissions should, whenever possible, be submitted electronically, asstraight email or as an IBM® PC-compatible Corel WordPerfect® or Microsoft Word® attachment, to: DEA-Microgram-2007 -at- mailsnare.net Current versions of Corel WordPerfect® or Microsoft Word® (defined ashaving release dates less than 5 years old) should be utilized. If electronic (email) submission is not possible,submissions may be mailed to: Microgram Editor, Drug Enforcement Administration, Office of ForensicSciences, 8701 Morrissette Drive, Springfield, VA 22152. Hard-copy manuscripts should be submitted intriplicate, and should also be accompanied by an electronic version (written in either Corel WordPerfect® orMicrosoft Word®) on a 3 ½ inch IBM® PC-compatible diskette, 100 or 250 MB Iomega® zip diskette, or anIBM® PC-compatible CD. Note that diskettes should be mailed in an irradiation-proof protective sleeve,and the mailing envelope should be marked: “Warning - Contains Electronic Media - Do Not Irradiate”. Hard-copy manuscripts should be printed in black ink using a laser or ink jet printer, double-spaced, on one sideof 8 1/2" x 11" or A4 high quality white bond paper. A Times New Roman/12-point font is preferred for allsubmissions (electronic or hard copy). Each page, including illustrations, should have a one-inch (25 mm) marginon all sides. All photos and figures should also be submitted as stand-alone attachments, not only embedded inthe manuscript. The pages should be numbered, but not stapled together.
Note that mailed submissions may be subject to lengthy handling delays beyond the control of the Office ofForensic Sciences, and electronic media sent through the mail may be destroyed en route by sanitizingprocedures, despite protective measures and written warnings. All submissions should include the followingContact Information: The Full Name and Address of Submitting Laboratory or Office, and the Full Name,Phone Number, FAX Number, and Preferred email Address of the Submitting Individual.
Scientific Research Articles are formal, full length reports detailing original research in the detection andanalysis of suspected controlled substances for forensic/law enforcement purposes, excluding in post-ingestionhuman/animal biological matrices (blood, urine, meconium, sweat, hair, etc.) Technical Notes are shortercommunications concentrating on a specific drug (or drug class), unusual case, novel or unusual procedure ormethod, or minor original research, again excluding in post-ingestion human/animal biological matrices. Eacharticle/note should be a “stand-alone” work; serial publications will not be considered. Similarly, articles/noteswhich essentially duplicate existing literature will not be considered unless the presented data reflect significantadvances in instrumentation made since the original publication(s) (however, see: Dual Publications, below). Allsubmissions will be subjected to peer review, and authors will be notified of the results of the review(s) withinthree months after the manuscript is received by the Office of Forensic Sciences.
The following guidelines should be used for all Articles (Technical Notes may follow an abbreviated version asappropriate):
Cover Letter - Provide the standard contact information and pertinent correspondence (if any) for theEditor.
Title - Should be specific and amenable to indexing; they should not include acronyms or abbreviationsexcept for very common instrumental technique acronyms (e.g., GC/MS or HPLC) and/or very commondrug acronyms (e.g., MDMA or PCP). Titles should be sufficiently informative that the readershipshould not have to read the Abstract or the Introduction to understand the focus of the article. If the
Brought to you by AltGov2 [www.altgov2.org]
Microgram Journal, Volume 6, Numbers 1-2 (January - June, 2008) 57
manuscript reflects work previously presented at a scientific meeting, a statement detailing thatpresentation should be included as a footnote to the Title.
Author(s)/Affiliation(s) - The author's full name (including middle initial(s)) and title, and the full nameand address of the laboratory or office should immediately follow the title. The author’s degree level maybe included if desired, but is not required (however, multiple authors should all include or all exclude thisinformation). If there are several authors from two or more laboratories or offices, each set of authorsshould be listed separately, followed by their corresponding laboratory name and address (that is, AuthorsI, Laboratory I, Authors II, Laboratory II, etc.) Excessive authorship should be avoided. If there is morethan one author, the primary author should be indicated with a superscripted asterisk. The name, phonenumbers (Voice and FAX), preferred email address, and (if different from the laboratory or officeaddress) the full mailing address of the contact person should be included on the title page.
Abstract - State the purpose, procedures, and principal findings of the paper, in 120 words or less. Avoidthe use of abbreviations, and use only common acronyms as defined under “Titles”. Note that the abstractwill be provided to Chemical Abstracts.
Keyword List - A minimum of five (maximum ten) abstracting keywords should be included. Unlessinappropriate, the last keyword pair should always be “Forensic Chemistry.”
Introduction - Briefly state the issue or problem. Detail existing practice in the topic area, and explainthe shortcomings (if any) in what has been previously reported and/or what is being currently done in thefield; that is, compare and contrast the selected methodology with previous and/or existing methods. Provide theoretical and practical background for novel or rarely utilized experimental or instrumentalmethods. Include pertinent references (avoid “Personal Communications”).
Experimental (Chemicals, Instrumentation, Procedures) - Detail the chemicals, instruments, andprocedures utilized (including experimental parameters). However, USE CAUTION IN DETAILINGSYNTHESES OF CONTROLLED OR ABUSED SUBSTANCES, especially novel syntheses toknown controlled substances, or syntheses of novel substances that may be subject to abuse, that are notyet well known in the scientific and/or underground literature. [In such cases, a simple statement shouldbe included to the effect that: “Experimental details on this synthesis are not provided, in accordancewith Journal policy.”]
Results and Discussion - Present findings in a logical, easily followed sequence. Describe what wasdone, and where appropriate what conclusions can be drawn. Compare and contrast the findings withprevious studies and/or current practice. Discuss any problems and/or unresolved issues.
Conclusions - Optional - Summarized results should be included only for complex articles. Conclusionsshould not merely duplicate the Abstract or the summary paragraph in the Results and Discussion section.
Acknowledgments - Optional - Should be brief, and include the full name, affiliation, and specificcontribution made by each cited individual.
References - Articles and notes should have all textual citations collected in an endnotes list. Within thetext, references should be consecutively numbered with superscripted Arabic numerals, or with Arabicnumerals in brackets, in accordance with their first appearance. Within the endnotes list, referencesshould be consecutively numbered with Arabic numerals, as follows: Number, Period, Indent, Citation. Reference format should adhere to the Uniform Requirements for Manuscripts Submitted to BiomedicalJournals (Note: This is the same reference format utilized in the Selected Reference Citations inMicrogram Bulletin, and also (among many others) by the Journal of Forensic Sciences). Due to theirinherently transitory nature, use of website URL’s as references are discouraged but are permitted. As
Brought to you by AltGov2 [www.altgov2.org]
58 Microgram Journal, Volume 6, Numbers 1-2 (January - June, 2008)
previously noted, Personal Communications should not be utilized; however, if unavoidable, utilize thefollowing format: Full Name, Title, Affiliation (Laboratory or Office), Location (City and State, plusNation if not the United States), Personal Communication, Year.
Table and Figures - All Tables and Figures should be appended onto the end of the article (notembedded in the text). Tables and Figures should be consecutively numbered with Arabic numerals, inaccordance with their first citation in the text. Each Table and Figure should be “stand-alone”; that is,include sufficient descriptive information such that the reader will not have to refer back to the text tounderstand the Table or Figure. The Header should include the Table or Figure number and a concisetitle. Explanatory material, definitions of acronyms and/or abbreviations, and/or references within theTable or Figure should be designated by superscripted, lower case letters in alphabetical order, andincluded in dedicated footnotes at the bottom of the respective Table or Figure. Unless color is needed toenhance differentiation of the depicted material, all Tables and Figures should be in black and white (thatis, avoid frivolous use of color for “artistic” purposes). Figures of spectra, chromatograms, charts,graphs, etc., should have clear and legibly labeled axes, but should not include instrument generatedprintoffs of experimental parameter lists.
Manuscripts submitted to Microgram Journal are required to be finished, professional quality efforts. Authorsshould ensure clarity, brevity, and pertinence of all information. Attention to detail in formatting, syntax,grammar, and spelling are as important as the accuracy of the facts presented. Authors are specially cautioned toconduct careful literature reviews prior to submission. At the Editor’s discretion, clearly substandard and/orinappropriate manuscripts will be returned to the authors without review.
Manuscripts will not be retyped, but “final” versions are subject to minor to moderate Editorial rewrite toimprove presentation clarity or to reformat to current Microgram Journal style.
Dual publication - Re-publication of articles or notes of particular interest to the Microgram Journal readershipwill be considered if the article was originally published in a journal that is not easily accessed and the primaryauthor has obtained explicit, written copyright exclusion from the original publisher and consent from all co-authors. Examples include exact English translations of articles or notes originally published in a non-Englishlanguage journal, non-sensitive articles or notes originally published in a restricted journal or on a passwordprotected website, or articles or notes originally published in limited distribution newsletters or proceedings. Ingeneral, any article or note that was published in English in a mainstream journal is not a candidate for re-publication in Microgram Journal. Authors interested in re-publishing previously published articles or notes inMicrogram Journal should discuss the issue with the Microgram Editor before submitting.
Note that (in accordance with standard ethical guidelines) re-published articles should not be included as “new”articles in the respective author(s)’ Curriculum Vitae.
Costs - There are no costs (to the contributor) associated with publication in Microgram Journal.
Reprints - Microgram Journal does not provide reprints to authors. Microgram Journal may be photocopied (orprinted off the website) as needed.
Questions may be directed to the Microgram Editor.
* * * * * * * * * * * * * * * * * * * * * * * * *
Brought to you by AltGov2 [www.altgov2.org]
Microgram Journal, Volume 6, Numbers 1-2 (January - June, 2008) 59
DISCLAIMERS
1) All material published in Microgram Journal is reviewed prior to publication. However, the reliability andaccuracy of all published information are the responsibility of the respective contributors, and publicationin Microgram Journal implies no endorsement by the United States Department of Justice or the DrugEnforcement Administration.
2) Due to the ease of scanning, copying, electronic manipulation, and/or reprinting, only the posted copies ofMicrogram Journal (on www.dea.gov) are absolutely valid. All other copies, whether electronic or hard, arenecessarily suspect unless verified against the posted versions.
3) WARNING!: Due to the often lengthy time delays between the actual dates of seizures and their subsequentreporting in Microgram Journal, and also because of the often wide variety of seizure types with superficiallysimilar physical attributes, published material cannot be utilized to visually identify controlled substancescurrently circulating in clandestine markets. The United States Department of Justice and the DrugEnforcement Administration assume no liability for the use or misuse of the information published inMicrogram Journal.
* * * * * * * * * * * * * * * * * * * * * * * * *
Brought to you by AltGov2 [www.altgov2.org]
U.S. Department of JusticeDrug Enforcement Administration
www.dea.gov
MicrogramJournal
To Assist and Serve Scientists Concerned with the Detection and Analysis of ControlledSubstances and Other Abused Substances for Forensic / Law Enforcement Purposes.
Published by: The U.S. Attorney General has determined that the publication of thisThe Drug Enforcement Administration periodical is necessary in the transaction of the public business Office of Forensic Sciences required by the Department of Justice. Information, instructions, and Washington, DC 20537 disclaimers are published in the first issue of each year.
Volume 6Numbers 3-4 Posted On-Line At:July - December 2008 www.dea.gov/programs/forensicsci/microgram/index.html
Brought to you by AltGov2 [www.altgov2.org]
62 Microgram Journal, Volume 6, Numbers 3-4 (July - December, 2008)
Contents
A Specific Screening Color Test for Diazepam 63Mohammad Sarwar, Shaena Taylor, and Imran Majeed
An In-Depth Study of the Peruvian Base Llavada (“Washed Base”) Technique 72for Purification of Crude Cocaine BaseDanielle K. Boudreau and John F. Casale
Identification of Levamisole Impurities Found in Illicit Cocaine Exhibits 82John F. Casale, Elizabeth M. Corbeil, and Patrick A. Hays
Identification of Diltiazem Impurities / Artifacts during the Analyses of Illicit 90Cocaine Exhibits Containing DiltiazemJohn F. Casale, Pauline M. Orlando, Valerie L. Colley, and Patrick A. Hays
Etodolac: An Analytical Profile 104Mandy C. McGehee
Determination of Cocaine in Various South American Commercial Coca Products 109Elizabeth M. Corbeil and John F. Casale
“Crack” Cocaine: A Study of Stability over Time and Temperature 114Laura M. Jones, Danielle K. Boudreau, and John F. Casale
The Discoloration of Illicit Drug Samples 128James M. Moore and John F. Casale
- - - - - - - - - -
Note: In order to prevent automated theft of email addresses off the Internet postings of MicrogramJournal, all email addresses reported in the Journal have had the “@” character replaced by “ -at- ”.
Cover Art: “Ball and Stick” Model of 2,5-Dimethoxy-4-iodophenethylamine (2C-I; Courtesy of PatrickA. Hays, DEA Special Testing and Research Laboratory, Dulles, VA).
Brought to you by AltGov2 [www.altgov2.org]
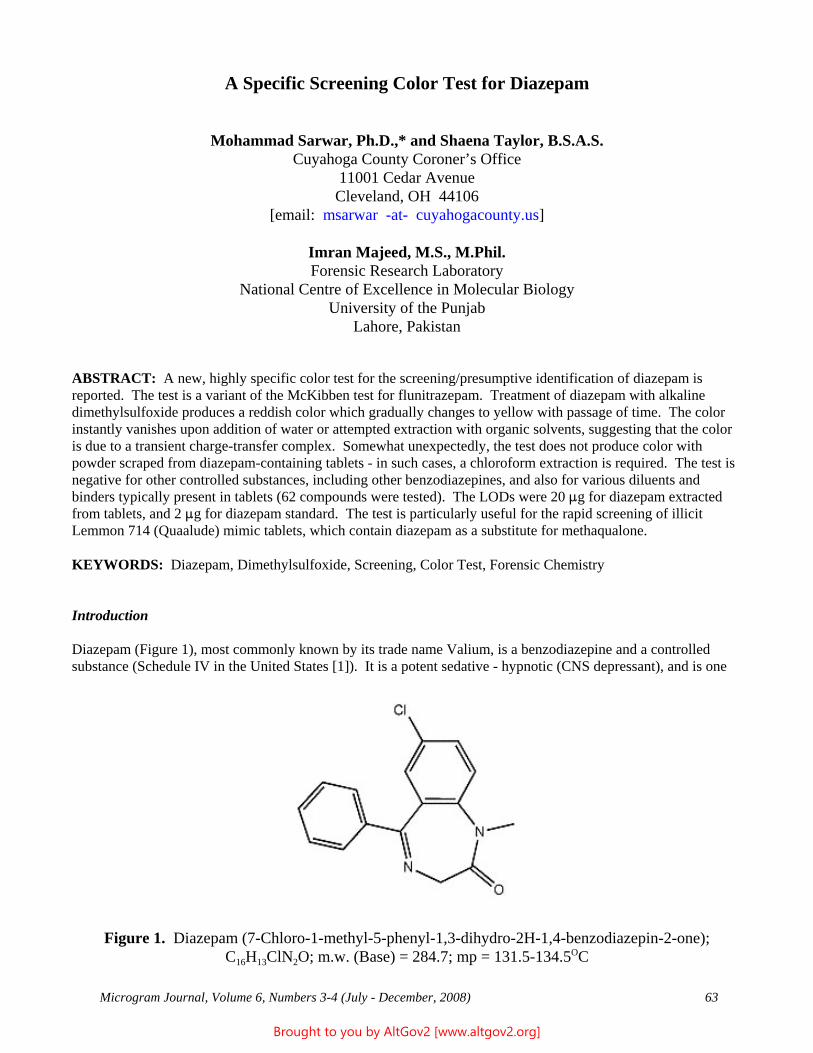
Microgram Journal, Volume 6, Numbers 3-4 (July - December, 2008) 63
A Specific Screening Color Test for Diazepam
Mohammad Sarwar, Ph.D.,* and Shaena Taylor, B.S.A.S.Cuyahoga County Coroner’s Office
11001 Cedar AvenueCleveland, OH 44106
[email: msarwar -at- cuyahogacounty.us]
Imran Majeed, M.S., M.Phil.Forensic Research Laboratory
National Centre of Excellence in Molecular BiologyUniversity of the Punjab
Lahore, Pakistan
ABSTRACT: A new, highly specific color test for the screening/presumptive identification of diazepam isreported. The test is a variant of the McKibben test for flunitrazepam. Treatment of diazepam with alkalinedimethylsulfoxide produces a reddish color which gradually changes to yellow with passage of time. The colorinstantly vanishes upon addition of water or attempted extraction with organic solvents, suggesting that the coloris due to a transient charge-transfer complex. Somewhat unexpectedly, the test does not produce color withpowder scraped from diazepam-containing tablets - in such cases, a chloroform extraction is required. The test isnegative for other controlled substances, including other benzodiazepines, and also for various diluents andbinders typically present in tablets (62 compounds were tested). The LODs were 20 :g for diazepam extractedfrom tablets, and 2 :g for diazepam standard. The test is particularly useful for the rapid screening of illicitLemmon 714 (Quaalude) mimic tablets, which contain diazepam as a substitute for methaqualone.
KEYWORDS: Diazepam, Dimethylsulfoxide, Screening, Color Test, Forensic Chemistry
Introduction
Diazepam (Figure 1), most commonly known by its trade name Valium, is a benzodiazepine and a controlledsubstance (Schedule IV in the United States [1]). It is a potent sedative - hypnotic (CNS depressant), and is one
Figure 1. Diazepam (7-Chloro-1-methyl-5-phenyl-1,3-dihydro-2H-1,4-benzodiazepin-2-one);C16H13ClN2O; m.w. (Base) = 284.7; mp = 131.5-134.5OC
Brought to you by AltGov2 [www.altgov2.org]
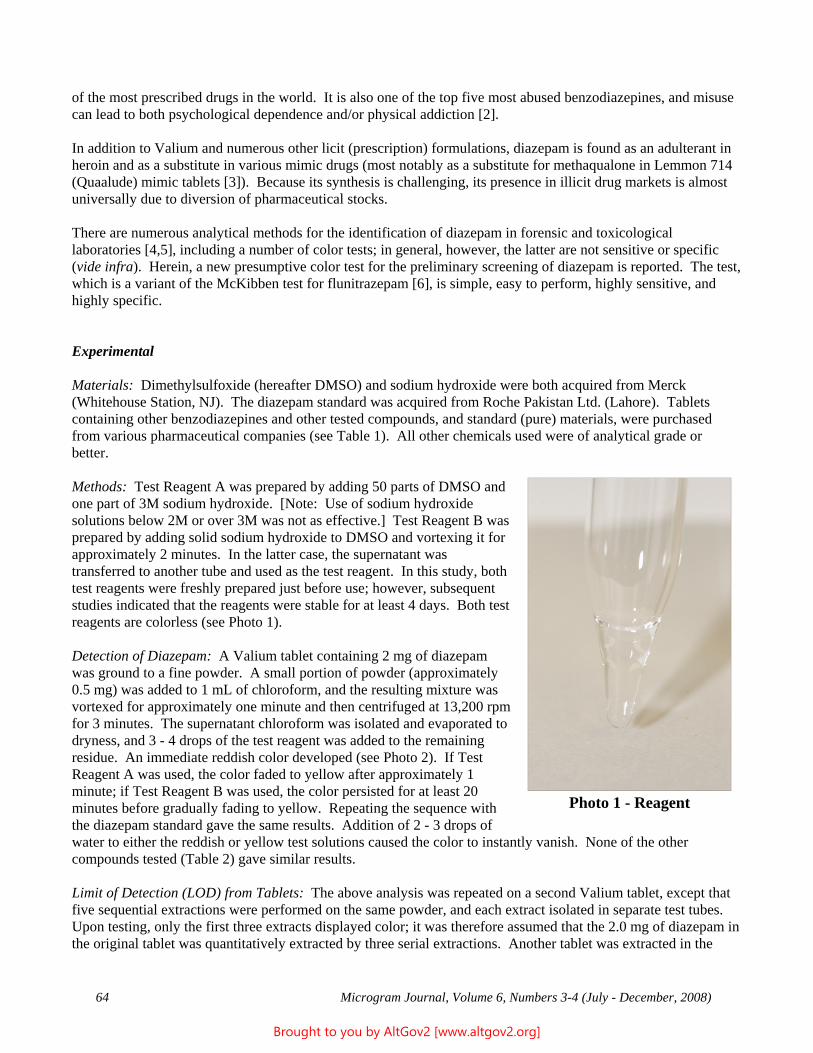
64 Microgram Journal, Volume 6, Numbers 3-4 (July - December, 2008)
of the most prescribed drugs in the world. It is also one of the top five most abused benzodiazepines, and misusecan lead to both psychological dependence and/or physical addiction [2].
In addition to Valium and numerous other licit (prescription) formulations, diazepam is found as an adulterant inheroin and as a substitute in various mimic drugs (most notably as a substitute for methaqualone in Lemmon 714(Quaalude) mimic tablets [3]). Because its synthesis is challenging, its presence in illicit drug markets is almostuniversally due to diversion of pharmaceutical stocks.
There are numerous analytical methods for the identification of diazepam in forensic and toxicologicallaboratories [4,5], including a number of color tests; in general, however, the latter are not sensitive or specific(vide infra). Herein, a new presumptive color test for the preliminary screening of diazepam is reported. The test,which is a variant of the McKibben test for flunitrazepam [6], is simple, easy to perform, highly sensitive, andhighly specific.
Experimental
Materials: Dimethylsulfoxide (hereafter DMSO) and sodium hydroxide were both acquired from Merck(Whitehouse Station, NJ). The diazepam standard was acquired from Roche Pakistan Ltd. (Lahore). Tabletscontaining other benzodiazepines and other tested compounds, and standard (pure) materials, were purchasedfrom various pharmaceutical companies (see Table 1). All other chemicals used were of analytical grade orbetter.
Methods: Test Reagent A was prepared by adding 50 parts of DMSO andone part of 3M sodium hydroxide. [Note: Use of sodium hydroxidesolutions below 2M or over 3M was not as effective.] Test Reagent B wasprepared by adding solid sodium hydroxide to DMSO and vortexing it forapproximately 2 minutes. In the latter case, the supernatant wastransferred to another tube and used as the test reagent. In this study, bothtest reagents were freshly prepared just before use; however, subsequentstudies indicated that the reagents were stable for at least 4 days. Both testreagents are colorless (see Photo 1).
Detection of Diazepam: A Valium tablet containing 2 mg of diazepamwas ground to a fine powder. A small portion of powder (approximately0.5 mg) was added to 1 mL of chloroform, and the resulting mixture wasvortexed for approximately one minute and then centrifuged at 13,200 rpmfor 3 minutes. The supernatant chloroform was isolated and evaporated todryness, and 3 - 4 drops of the test reagent was added to the remainingresidue. An immediate reddish color developed (see Photo 2). If TestReagent A was used, the color faded to yellow after approximately 1minute; if Test Reagent B was used, the color persisted for at least 20minutes before gradually fading to yellow. Repeating the sequence withthe diazepam standard gave the same results. Addition of 2 - 3 drops ofwater to either the reddish or yellow test solutions caused the color to instantly vanish. None of the othercompounds tested (Table 2) gave similar results.
Limit of Detection (LOD) from Tablets: The above analysis was repeated on a second Valium tablet, except thatfive sequential extractions were performed on the same powder, and each extract isolated in separate test tubes. Upon testing, only the first three extracts displayed color; it was therefore assumed that the 2.0 mg of diazepam inthe original tablet was quantitatively extracted by three serial extractions. Another tablet was extracted in the
Photo 1 - Reagent
Brought to you by AltGov2 [www.altgov2.org]
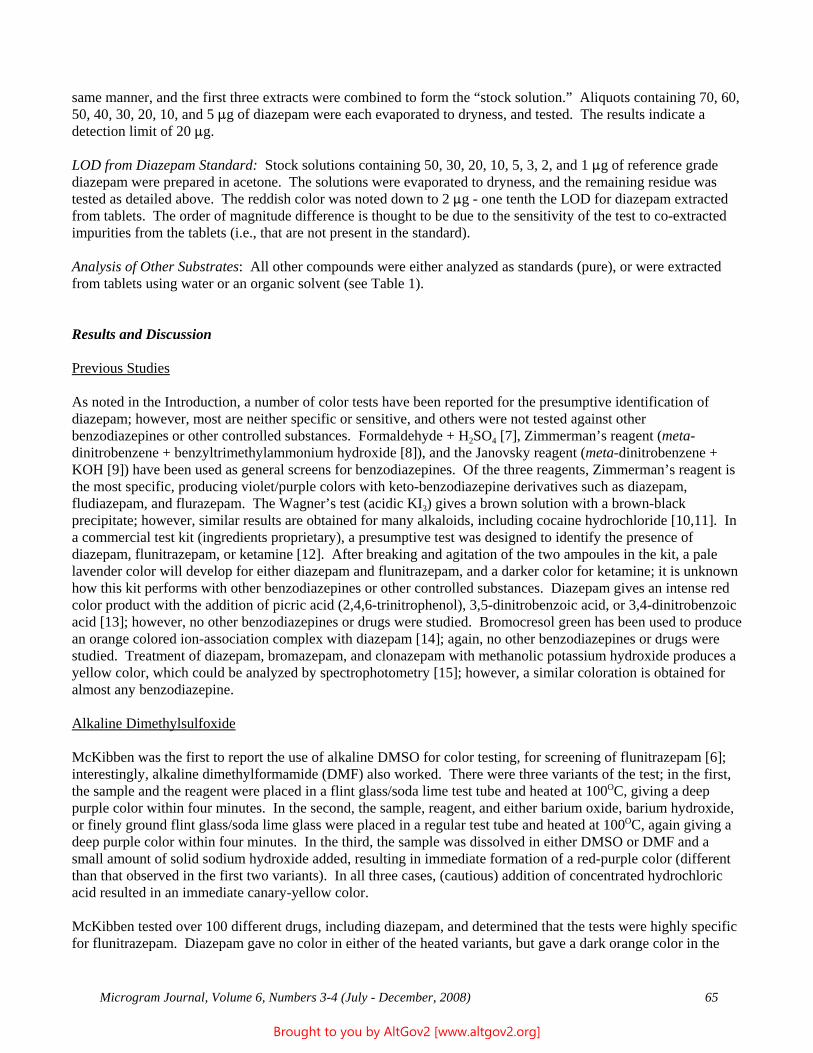
Microgram Journal, Volume 6, Numbers 3-4 (July - December, 2008) 65
same manner, and the first three extracts were combined to form the “stock solution.” Aliquots containing 70, 60,50, 40, 30, 20, 10, and 5 :g of diazepam were each evaporated to dryness, and tested. The results indicate adetection limit of 20 :g.
LOD from Diazepam Standard: Stock solutions containing 50, 30, 20, 10, 5, 3, 2, and 1 :g of reference gradediazepam were prepared in acetone. The solutions were evaporated to dryness, and the remaining residue wastested as detailed above. The reddish color was noted down to 2 :g - one tenth the LOD for diazepam extractedfrom tablets. The order of magnitude difference is thought to be due to the sensitivity of the test to co-extractedimpurities from the tablets (i.e., that are not present in the standard).
Analysis of Other Substrates: All other compounds were either analyzed as standards (pure), or were extractedfrom tablets using water or an organic solvent (see Table 1).
Results and Discussion
Previous Studies
As noted in the Introduction, a number of color tests have been reported for the presumptive identification ofdiazepam; however, most are neither specific or sensitive, and others were not tested against otherbenzodiazepines or other controlled substances. Formaldehyde + H2SO4 [7], Zimmerman’s reagent (meta-dinitrobenzene + benzyltrimethylammonium hydroxide [8]), and the Janovsky reagent (meta-dinitrobenzene +KOH [9]) have been used as general screens for benzodiazepines. Of the three reagents, Zimmerman’s reagent isthe most specific, producing violet/purple colors with keto-benzodiazepine derivatives such as diazepam,fludiazepam, and flurazepam. The Wagner’s test (acidic KI3) gives a brown solution with a brown-blackprecipitate; however, similar results are obtained for many alkaloids, including cocaine hydrochloride [10,11]. Ina commercial test kit (ingredients proprietary), a presumptive test was designed to identify the presence ofdiazepam, flunitrazepam, or ketamine [12]. After breaking and agitation of the two ampoules in the kit, a palelavender color will develop for either diazepam and flunitrazepam, and a darker color for ketamine; it is unknownhow this kit performs with other benzodiazepines or other controlled substances. Diazepam gives an intense redcolor product with the addition of picric acid (2,4,6-trinitrophenol), 3,5-dinitrobenzoic acid, or 3,4-dinitrobenzoicacid [13]; however, no other benzodiazepines or drugs were studied. Bromocresol green has been used to producean orange colored ion-association complex with diazepam [14]; again, no other benzodiazepines or drugs werestudied. Treatment of diazepam, bromazepam, and clonazepam with methanolic potassium hydroxide produces ayellow color, which could be analyzed by spectrophotometry [15]; however, a similar coloration is obtained foralmost any benzodiazepine.
Alkaline Dimethylsulfoxide
McKibben was the first to report the use of alkaline DMSO for color testing, for screening of flunitrazepam [6];interestingly, alkaline dimethylformamide (DMF) also worked. There were three variants of the test; in the first,the sample and the reagent were placed in a flint glass/soda lime test tube and heated at 100OC, giving a deeppurple color within four minutes. In the second, the sample, reagent, and either barium oxide, barium hydroxide,or finely ground flint glass/soda lime glass were placed in a regular test tube and heated at 100OC, again giving adeep purple color within four minutes. In the third, the sample was dissolved in either DMSO or DMF and asmall amount of solid sodium hydroxide added, resulting in immediate formation of a red-purple color (differentthan that observed in the first two variants). In all three cases, (cautious) addition of concentrated hydrochloricacid resulted in an immediate canary-yellow color.
McKibben tested over 100 different drugs, including diazepam, and determined that the tests were highly specificfor flunitrazepam. Diazepam gave no color in either of the heated variants, but gave a dark orange color in the
Brought to you by AltGov2 [www.altgov2.org]
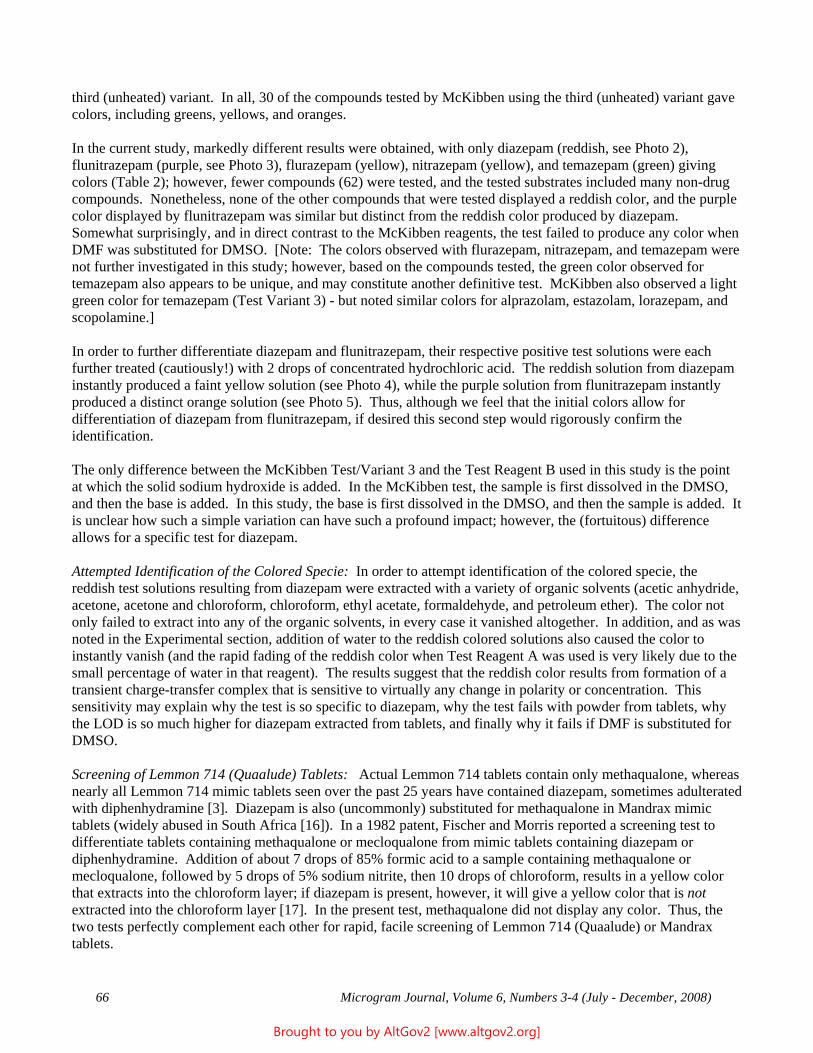
66 Microgram Journal, Volume 6, Numbers 3-4 (July - December, 2008)
third (unheated) variant. In all, 30 of the compounds tested by McKibben using the third (unheated) variant gavecolors, including greens, yellows, and oranges.
In the current study, markedly different results were obtained, with only diazepam (reddish, see Photo 2),flunitrazepam (purple, see Photo 3), flurazepam (yellow), nitrazepam (yellow), and temazepam (green) givingcolors (Table 2); however, fewer compounds (62) were tested, and the tested substrates included many non-drugcompounds. Nonetheless, none of the other compounds that were tested displayed a reddish color, and the purplecolor displayed by flunitrazepam was similar but distinct from the reddish color produced by diazepam. Somewhat surprisingly, and in direct contrast to the McKibben reagents, the test failed to produce any color whenDMF was substituted for DMSO. [Note: The colors observed with flurazepam, nitrazepam, and temazepam werenot further investigated in this study; however, based on the compounds tested, the green color observed fortemazepam also appears to be unique, and may constitute another definitive test. McKibben also observed a lightgreen color for temazepam (Test Variant 3) - but noted similar colors for alprazolam, estazolam, lorazepam, andscopolamine.]
In order to further differentiate diazepam and flunitrazepam, their respective positive test solutions were eachfurther treated (cautiously!) with 2 drops of concentrated hydrochloric acid. The reddish solution from diazepaminstantly produced a faint yellow solution (see Photo 4), while the purple solution from flunitrazepam instantlyproduced a distinct orange solution (see Photo 5). Thus, although we feel that the initial colors allow fordifferentiation of diazepam from flunitrazepam, if desired this second step would rigorously confirm theidentification.
The only difference between the McKibben Test/Variant 3 and the Test Reagent B used in this study is the pointat which the solid sodium hydroxide is added. In the McKibben test, the sample is first dissolved in the DMSO,and then the base is added. In this study, the base is first dissolved in the DMSO, and then the sample is added. Itis unclear how such a simple variation can have such a profound impact; however, the (fortuitous) differenceallows for a specific test for diazepam.
Attempted Identification of the Colored Specie: In order to attempt identification of the colored specie, thereddish test solutions resulting from diazepam were extracted with a variety of organic solvents (acetic anhydride,acetone, acetone and chloroform, chloroform, ethyl acetate, formaldehyde, and petroleum ether). The color notonly failed to extract into any of the organic solvents, in every case it vanished altogether. In addition, and as wasnoted in the Experimental section, addition of water to the reddish colored solutions also caused the color toinstantly vanish (and the rapid fading of the reddish color when Test Reagent A was used is very likely due to thesmall percentage of water in that reagent). The results suggest that the reddish color results from formation of atransient charge-transfer complex that is sensitive to virtually any change in polarity or concentration. Thissensitivity may explain why the test is so specific to diazepam, why the test fails with powder from tablets, whythe LOD is so much higher for diazepam extracted from tablets, and finally why it fails if DMF is substituted forDMSO.
Screening of Lemmon 714 (Quaalude) Tablets: Actual Lemmon 714 tablets contain only methaqualone, whereasnearly all Lemmon 714 mimic tablets seen over the past 25 years have contained diazepam, sometimes adulteratedwith diphenhydramine [3]. Diazepam is also (uncommonly) substituted for methaqualone in Mandrax mimictablets (widely abused in South Africa [16]). In a 1982 patent, Fischer and Morris reported a screening test todifferentiate tablets containing methaqualone or mecloqualone from mimic tablets containing diazepam ordiphenhydramine. Addition of about 7 drops of 85% formic acid to a sample containing methaqualone ormecloqualone, followed by 5 drops of 5% sodium nitrite, then 10 drops of chloroform, results in a yellow colorthat extracts into the chloroform layer; if diazepam is present, however, it will give a yellow color that is notextracted into the chloroform layer [17]. In the present test, methaqualone did not display any color. Thus, thetwo tests perfectly complement each other for rapid, facile screening of Lemmon 714 (Quaalude) or Mandraxtablets.
Brought to you by AltGov2 [www.altgov2.org]
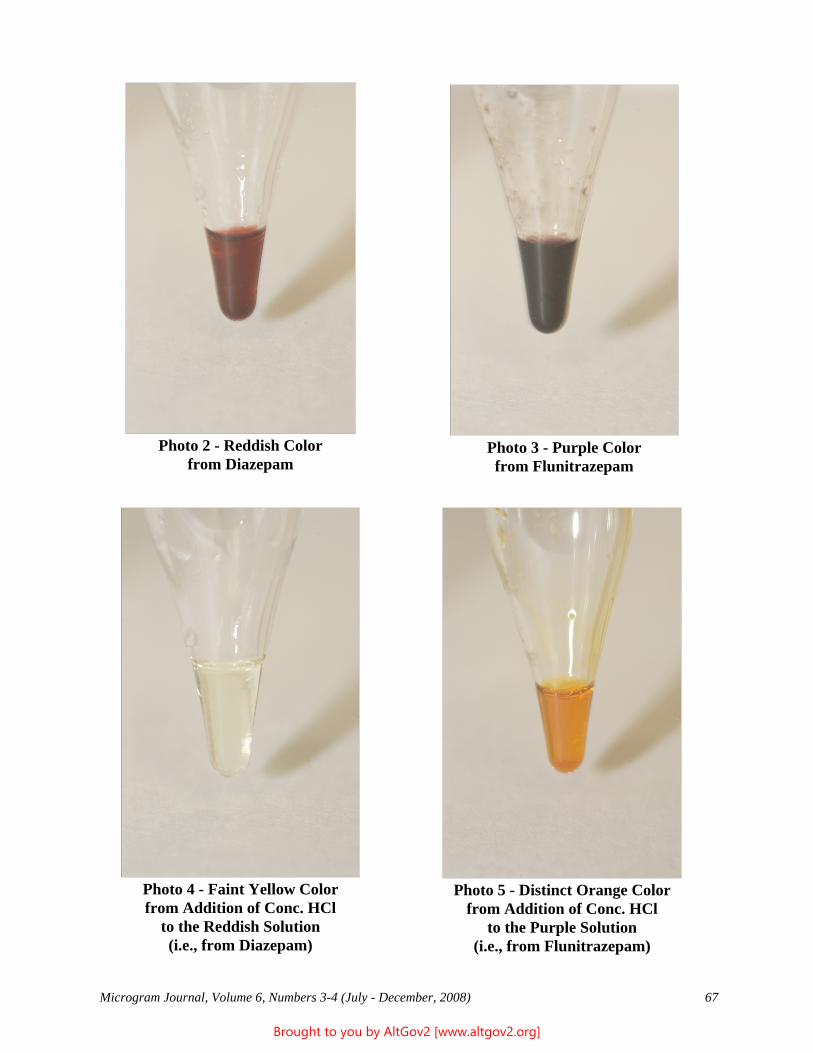
Microgram Journal, Volume 6, Numbers 3-4 (July - December, 2008) 67
Photo 2 - Reddish Colorfrom Diazepam
Photo 3 - Purple Colorfrom Flunitrazepam
Photo 5 - Distinct Orange Colorfrom Addition of Conc. HCl
to the Purple Solution(i.e., from Flunitrazepam)
Photo 4 - Faint Yellow Colorfrom Addition of Conc. HCl
to the Reddish Solution(i.e., from Diazepam)
Brought to you by AltGov2 [www.altgov2.org]
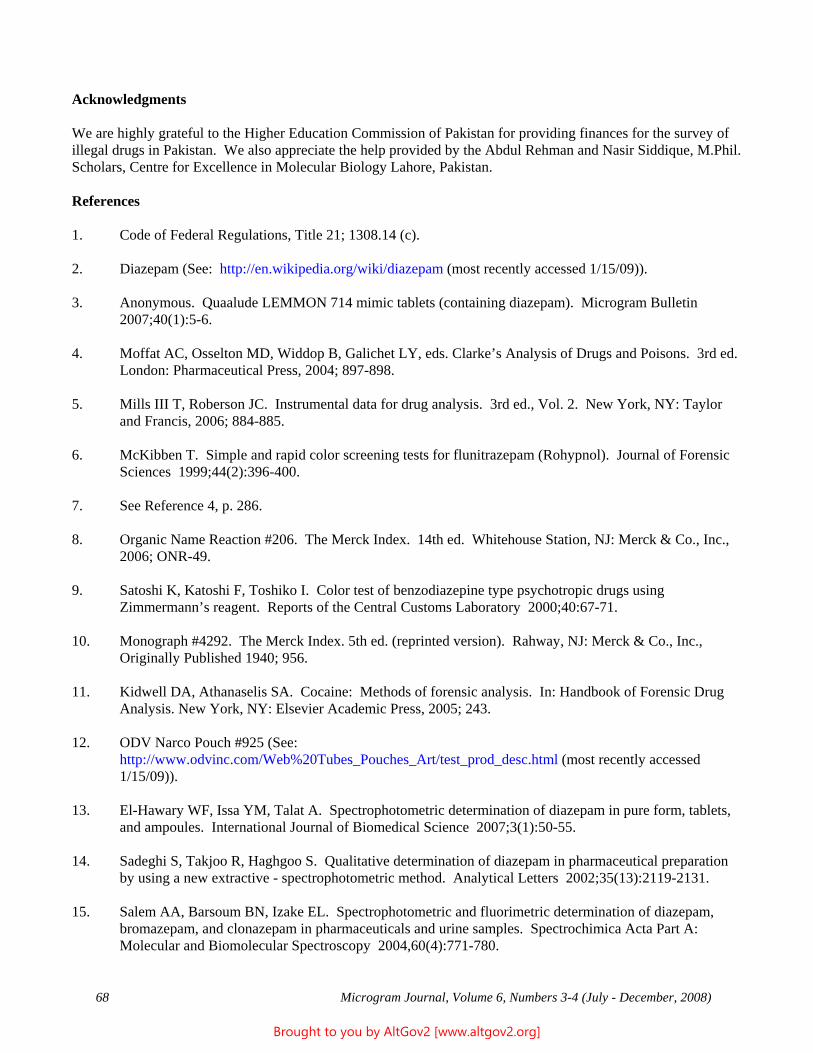
68 Microgram Journal, Volume 6, Numbers 3-4 (July - December, 2008)
Acknowledgments
We are highly grateful to the Higher Education Commission of Pakistan for providing finances for the survey ofillegal drugs in Pakistan. We also appreciate the help provided by the Abdul Rehman and Nasir Siddique, M.Phil.Scholars, Centre for Excellence in Molecular Biology Lahore, Pakistan.
References
1. Code of Federal Regulations, Title 21; 1308.14 (c).
2. Diazepam (See: http://en.wikipedia.org/wiki/diazepam (most recently accessed 1/15/09)).
3. Anonymous. Quaalude LEMMON 714 mimic tablets (containing diazepam). Microgram Bulletin 2007;40(1):5-6.
4. Moffat AC, Osselton MD, Widdop B, Galichet LY, eds. Clarke’s Analysis of Drugs and Poisons. 3rd ed. London: Pharmaceutical Press, 2004; 897-898.
5. Mills III T, Roberson JC. Instrumental data for drug analysis. 3rd ed., Vol. 2. New York, NY: Taylorand Francis, 2006; 884-885.
6. McKibben T. Simple and rapid color screening tests for flunitrazepam (Rohypnol). Journal of ForensicSciences 1999;44(2):396-400.
7. See Reference 4, p. 286.
8. Organic Name Reaction #206. The Merck Index. 14th ed. Whitehouse Station, NJ: Merck & Co., Inc.,2006; ONR-49.
9. Satoshi K, Katoshi F, Toshiko I. Color test of benzodiazepine type psychotropic drugs usingZimmermann’s reagent. Reports of the Central Customs Laboratory 2000;40:67-71.
10. Monograph #4292. The Merck Index. 5th ed. (reprinted version). Rahway, NJ: Merck & Co., Inc.,Originally Published 1940; 956.
11. Kidwell DA, Athanaselis SA. Cocaine: Methods of forensic analysis. In: Handbook of Forensic DrugAnalysis. New York, NY: Elsevier Academic Press, 2005; 243.
12. ODV Narco Pouch #925 (See: http://www.odvinc.com/Web%20Tubes_Pouches_Art/test_prod_desc.html (most recently accessed1/15/09)).
13. El-Hawary WF, Issa YM, Talat A. Spectrophotometric determination of diazepam in pure form, tablets,and ampoules. International Journal of Biomedical Science 2007;3(1):50-55.
14. Sadeghi S, Takjoo R, Haghgoo S. Qualitative determination of diazepam in pharmaceutical preparationby using a new extractive - spectrophotometric method. Analytical Letters 2002;35(13):2119-2131.
15. Salem AA, Barsoum BN, Izake EL. Spectrophotometric and fluorimetric determination of diazepam,bromazepam, and clonazepam in pharmaceuticals and urine samples. Spectrochimica Acta Part A: Molecular and Biomolecular Spectroscopy 2004,60(4):771-780.
Brought to you by AltGov2 [www.altgov2.org]
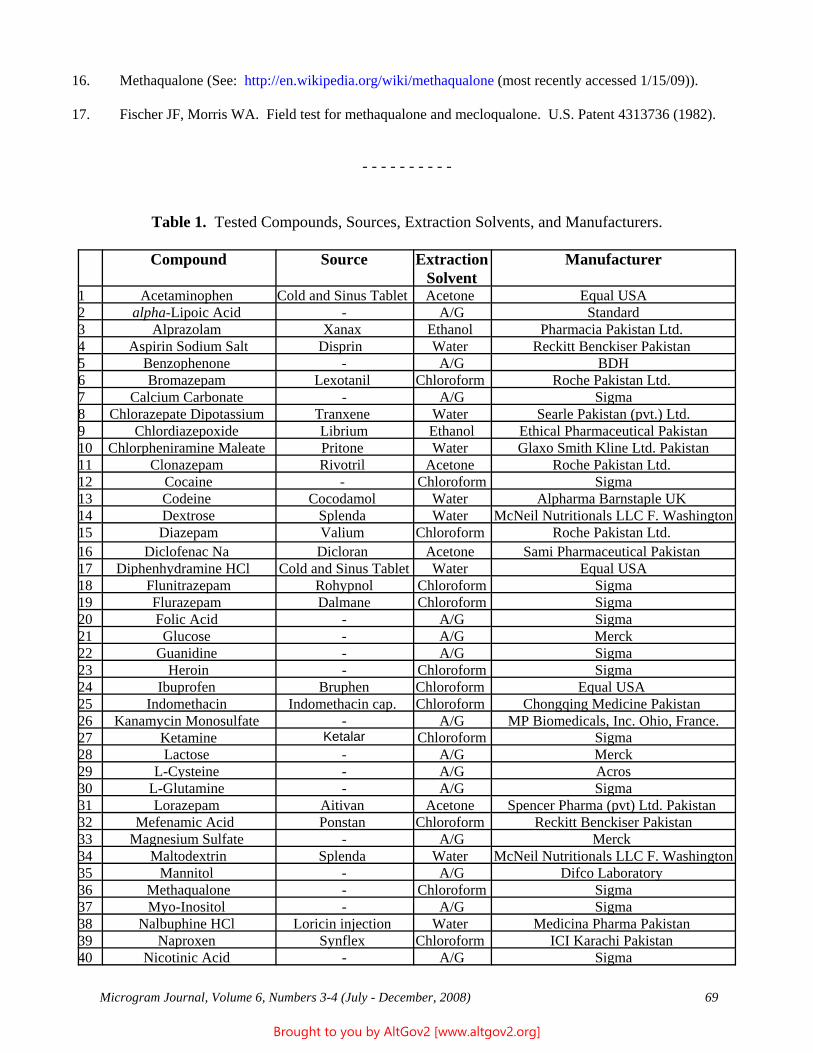
Microgram Journal, Volume 6, Numbers 3-4 (July - December, 2008) 69
16. Methaqualone (See: http://en.wikipedia.org/wiki/methaqualone (most recently accessed 1/15/09)).
17. Fischer JF, Morris WA. Field test for methaqualone and mecloqualone. U.S. Patent 4313736 (1982).
- - - - - - - - - -
Table 1. Tested Compounds, Sources, Extraction Solvents, and Manufacturers.
Compound Source ExtractionSolvent
Manufacturer
1 Acetaminophen Cold and Sinus Tablet Acetone Equal USA2 alpha-Lipoic Acid - A/G Standard3 Alprazolam Xanax Ethanol Pharmacia Pakistan Ltd. 4 Aspirin Sodium Salt Disprin Water Reckitt Benckiser Pakistan 5 Benzophenone - A/G BDH6 Bromazepam Lexotanil Chloroform Roche Pakistan Ltd. 7 Calcium Carbonate - A/G Sigma8 Chlorazepate Dipotassium Tranxene Water Searle Pakistan (pvt.) Ltd.9 Chlordiazepoxide Librium Ethanol Ethical Pharmaceutical Pakistan10 Chlorpheniramine Maleate Pritone Water Glaxo Smith Kline Ltd. Pakistan11 Clonazepam Rivotril Acetone Roche Pakistan Ltd. 12 Cocaine - Chloroform Sigma13 Codeine Cocodamol Water Alpharma Barnstaple UK 14 Dextrose Splenda Water McNeil Nutritionals LLC F. Washington15 Diazepam Valium Chloroform Roche Pakistan Ltd. 16 Diclofenac Na Dicloran Acetone Sami Pharmaceutical Pakistan 17 Diphenhydramine HCl Cold and Sinus Tablet Water Equal USA18 Flunitrazepam Rohypnol Chloroform Sigma19 Flurazepam Dalmane Chloroform Sigma20 Folic Acid - A/G Sigma21 Glucose - A/G Merck22 Guanidine - A/G Sigma23 Heroin - Chloroform Sigma24 Ibuprofen Bruphen Chloroform Equal USA 25 Indomethacin Indomethacin cap. Chloroform Chongqing Medicine Pakistan 26 Kanamycin Monosulfate - A/G MP Biomedicals, Inc. Ohio, France.27 Ketamine Ketalar Chloroform Sigma28 Lactose - A/G Merck29 L-Cysteine - A/G Acros30 L-Glutamine - A/G Sigma31 Lorazepam Aitivan Acetone Spencer Pharma (pvt) Ltd. Pakistan 32 Mefenamic Acid Ponstan Chloroform Reckitt Benckiser Pakistan33 Magnesium Sulfate - A/G Merck 34 Maltodextrin Splenda Water McNeil Nutritionals LLC F. Washington35 Mannitol - A/G Difco Laboratory 36 Methaqualone - Chloroform Sigma37 Myo-Inositol - A/G Sigma38 Nalbuphine HCl Loricin injection Water Medicina Pharma Pakistan 39 Naproxen Synflex Chloroform ICI Karachi Pakistan 40 Nicotinic Acid - A/G Sigma
Brought to you by AltGov2 [www.altgov2.org]
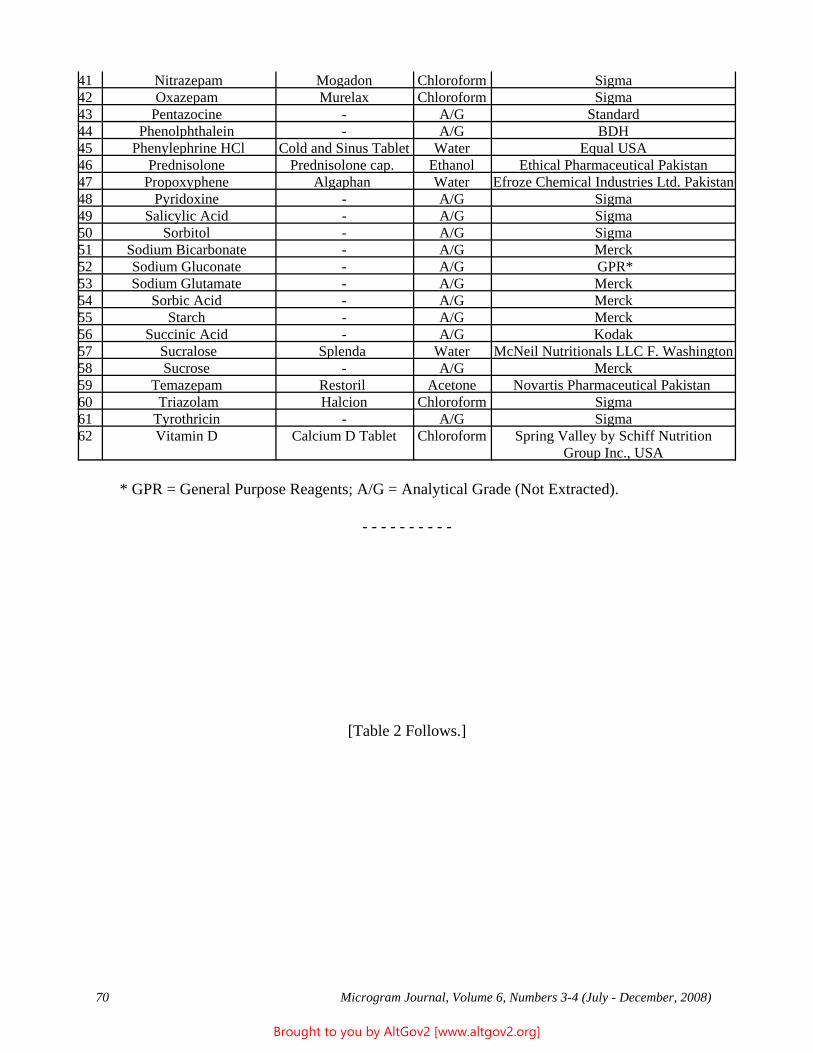
70 Microgram Journal, Volume 6, Numbers 3-4 (July - December, 2008)
41 Nitrazepam Mogadon Chloroform Sigma42 Oxazepam Murelax Chloroform Sigma43 Pentazocine - A/G Standard44 Phenolphthalein - A/G BDH45 Phenylephrine HCl Cold and Sinus Tablet Water Equal USA46 Prednisolone Prednisolone cap. Ethanol Ethical Pharmaceutical Pakistan47 Propoxyphene Algaphan Water Efroze Chemical Industries Ltd. Pakistan48 Pyridoxine - A/G Sigma49 Salicylic Acid - A/G Sigma50 Sorbitol - A/G Sigma51 Sodium Bicarbonate - A/G Merck52 Sodium Gluconate - A/G GPR*53 Sodium Glutamate - A/G Merck54 Sorbic Acid - A/G Merck55 Starch - A/G Merck56 Succinic Acid - A/G Kodak57 Sucralose Splenda Water McNeil Nutritionals LLC F. Washington58 Sucrose - A/G Merck59 Temazepam Restoril Acetone Novartis Pharmaceutical Pakistan 60 Triazolam Halcion Chloroform Sigma61 Tyrothricin - A/G Sigma62 Vitamin D Calcium D Tablet Chloroform Spring Valley by Schiff Nutrition
Group Inc., USA
* GPR = General Purpose Reagents; A/G = Analytical Grade (Not Extracted).
- - - - - - - - - -
[Table 2 Follows.]
Brought to you by AltGov2 [www.altgov2.org]
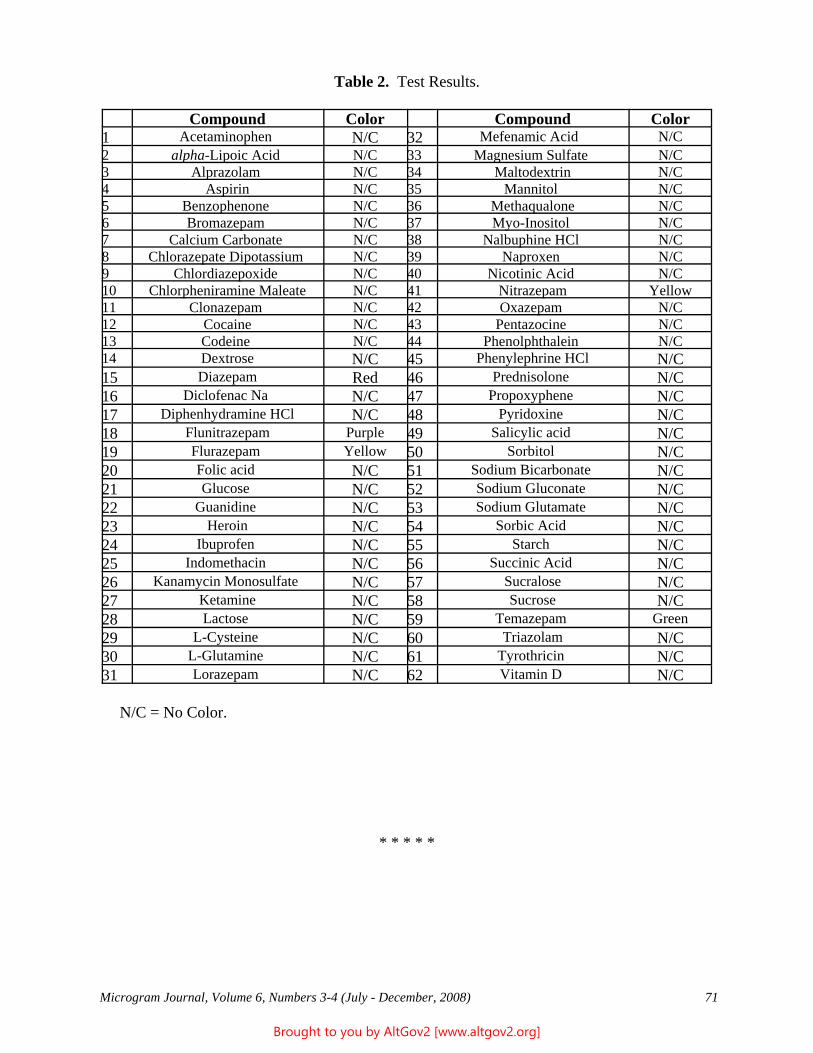
Microgram Journal, Volume 6, Numbers 3-4 (July - December, 2008) 71
Table 2. Test Results.
Compound Color Compound Color1 Acetaminophen N/C 32 Mefenamic Acid N/C2 alpha-Lipoic Acid N/C 33 Magnesium Sulfate N/C3 Alprazolam N/C 34 Maltodextrin N/C4 Aspirin N/C 35 Mannitol N/C5 Benzophenone N/C 36 Methaqualone N/C6 Bromazepam N/C 37 Myo-Inositol N/C7 Calcium Carbonate N/C 38 Nalbuphine HCl N/C8 Chlorazepate Dipotassium N/C 39 Naproxen N/C9 Chlordiazepoxide N/C 40 Nicotinic Acid N/C10 Chlorpheniramine Maleate N/C 41 Nitrazepam Yellow11 Clonazepam N/C 42 Oxazepam N/C12 Cocaine N/C 43 Pentazocine N/C13 Codeine N/C 44 Phenolphthalein N/C14 Dextrose N/C 45 Phenylephrine HCl N/C15 Diazepam Red 46 Prednisolone N/C16 Diclofenac Na N/C 47 Propoxyphene N/C17 Diphenhydramine HCl N/C 48 Pyridoxine N/C18 Flunitrazepam Purple 49 Salicylic acid N/C19 Flurazepam Yellow 50 Sorbitol N/C20 Folic acid N/C 51 Sodium Bicarbonate N/C21 Glucose N/C 52 Sodium Gluconate N/C22 Guanidine N/C 53 Sodium Glutamate N/C23 Heroin N/C 54 Sorbic Acid N/C24 Ibuprofen N/C 55 Starch N/C25 Indomethacin N/C 56 Succinic Acid N/C26 Kanamycin Monosulfate N/C 57 Sucralose N/C27 Ketamine N/C 58 Sucrose N/C28 Lactose N/C 59 Temazepam Green29 L-Cysteine N/C 60 Triazolam N/C30 L-Glutamine N/C 61 Tyrothricin N/C31 Lorazepam N/C 62 Vitamin D N/C
N/C = No Color.
* * * * *
Brought to you by AltGov2 [www.altgov2.org]
72 Microgram Journal, Volume 6, Numbers 3-4 (July - December, 2008)
An In-Depth Study of the Peruvian Base Llavada (“Washed Base”)Technique for Purification of Crude Cocaine Base
Danielle K. Boudreau,* B.S., and John F. Casale, B.S.U.S. Department of Justice
Drug Enforcement AdministrationSpecial Testing and Research Laboratory
22624 Dulles Summit CourtDulles, VA 20166
[email address withheld at author’s request]
ABSTRACT: An in-depth study of the Peruvian base llavada (“washed base”) technique for cleanup of crudecocaine base with ethanol is presented. Used as a substitute method for the traditional potassium permanganatepurification process, the technique selectively decreases or removes many alkaloid and colored impurities. Authentic crude Peruvian cocaine base was subjected to the method, and the resulting washed base samples andtheir respective ethanolic washings were examined immediately thereafter and again 14 months later. The resultsconfirm that the technique gives a whiter appearing but only slightly more pure base versus standard (unwashed)base. The fate of several alkaloid impurities is tracked. The presence of cocaethylene in illicit cocaine (resultingfrom transesterification of cocaine with ethanol) may be indicative of use of the base llavada technique; however,ethanol is known to be utilized in several other variants of illicit cocaine processing, so the presence ofcocaethylene alone does not confirm the use of the base llavada technique.
KEYWORDS: Cocaine, Cocaine Impurities, Cocaethylene, Ethanol, Chromatographic Signature Analysis,Forensic Chemistry
Introduction
In traditional illicit cocaine production, coca leaf is processed to give crude cocaine base, which is purified withpotassium permanganate to give a whiter, more refined base, which is then converted to cocaine hydrochloride[1]. Although the potassium permanganate purification is reasonably effective, the method is somewhat timeintensive and technique sensitive, and potassium permanganate is both costly and difficult to acquire in cocaineprocessing regions. Recent interviews of South American cocaine processors indicated that a new technique isbeing used by some Peruvian chemists to purify their crude cocaine base. In this new variant, referred to locallyas the base llavada or “washed base” technique, the crude base is first mixed with ethanol until a dough-likeconsistency is achieved, then wrapped in cloth and hydraulically compressed in a hydraulic press to force out asmuch of the ethanol solution (containing dissolved impurities) as possible. The process results in a whiter andslightly more pure product, similar in appearance to that produced by the potassium permanganate purificationtechnique.
Prior work at this laboratory demonstrated how the use of the base llavada technique affects the signature profileof the resulting cocaine [2]. In the current study, the technique was performed on numerous samples of authenticPeruvian crude cocaine base in order to better understand what is occurring to give the whiter appearing product. The selected samples were analyzed at the time of the process (both before and after the washing), and again 14months later. The residual ethanol/impurities solutions pressed from the samples were also analyzed both at thetime of the process, and again 14 months later. This study also investigated the slow production of cocaethylenein washed samples during storage, resulting from transesterification of cocaine by the residual ethanol stillremaining after the wash and pressing.
Brought to you by AltGov2 [www.altgov2.org]
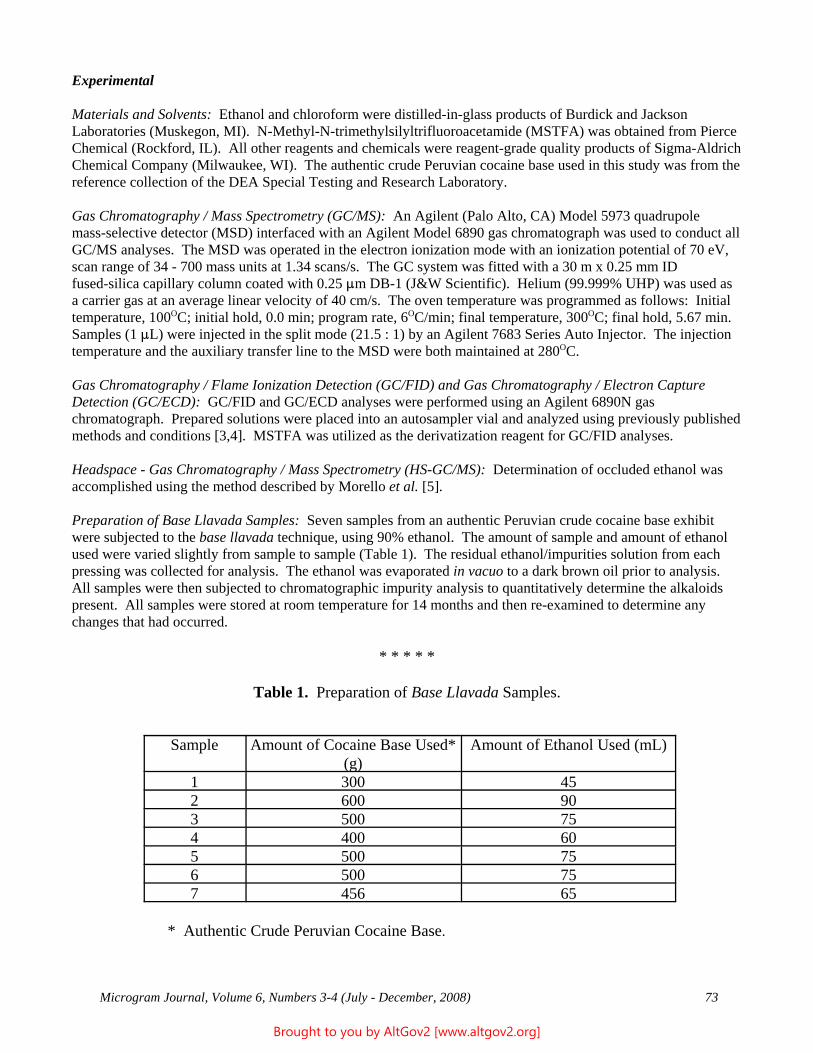
Microgram Journal, Volume 6, Numbers 3-4 (July - December, 2008) 73
Experimental
Materials and Solvents: Ethanol and chloroform were distilled-in-glass products of Burdick and JacksonLaboratories (Muskegon, MI). N-Methyl-N-trimethylsilyltrifluoroacetamide (MSTFA) was obtained from PierceChemical (Rockford, IL). All other reagents and chemicals were reagent-grade quality products of Sigma-AldrichChemical Company (Milwaukee, WI). The authentic crude Peruvian cocaine base used in this study was from thereference collection of the DEA Special Testing and Research Laboratory.
Gas Chromatography / Mass Spectrometry (GC/MS): An Agilent (Palo Alto, CA) Model 5973 quadrupolemass-selective detector (MSD) interfaced with an Agilent Model 6890 gas chromatograph was used to conduct allGC/MS analyses. The MSD was operated in the electron ionization mode with an ionization potential of 70 eV,scan range of 34 - 700 mass units at 1.34 scans/s. The GC system was fitted with a 30 m x 0.25 mm IDfused-silica capillary column coated with 0.25 :m DB-1 (J&W Scientific). Helium (99.999% UHP) was used asa carrier gas at an average linear velocity of 40 cm/s. The oven temperature was programmed as follows: Initialtemperature, 100OC; initial hold, 0.0 min; program rate, 6OC/min; final temperature, 300OC; final hold, 5.67 min. Samples (1 :L) were injected in the split mode (21.5 : 1) by an Agilent 7683 Series Auto Injector. The injectiontemperature and the auxiliary transfer line to the MSD were both maintained at 280OC.
Gas Chromatography / Flame Ionization Detection (GC/FID) and Gas Chromatography / Electron CaptureDetection (GC/ECD): GC/FID and GC/ECD analyses were performed using an Agilent 6890N gaschromatograph. Prepared solutions were placed into an autosampler vial and analyzed using previously publishedmethods and conditions [3,4]. MSTFA was utilized as the derivatization reagent for GC/FID analyses.
Headspace - Gas Chromatography / Mass Spectrometry (HS-GC/MS): Determination of occluded ethanol wasaccomplished using the method described by Morello et al. [5].
Preparation of Base Llavada Samples: Seven samples from an authentic Peruvian crude cocaine base exhibitwere subjected to the base llavada technique, using 90% ethanol. The amount of sample and amount of ethanolused were varied slightly from sample to sample (Table 1). The residual ethanol/impurities solution from eachpressing was collected for analysis. The ethanol was evaporated in vacuo to a dark brown oil prior to analysis. All samples were then subjected to chromatographic impurity analysis to quantitatively determine the alkaloidspresent. All samples were stored at room temperature for 14 months and then re-examined to determine anychanges that had occurred.
* * * * *
Table 1. Preparation of Base Llavada Samples.
Sample Amount of Cocaine Base Used*(g)
Amount of Ethanol Used (mL)
1 300 452 600 903 500 754 400 605 500 756 500 757 456 65
* Authentic Crude Peruvian Cocaine Base.
Brought to you by AltGov2 [www.altgov2.org]
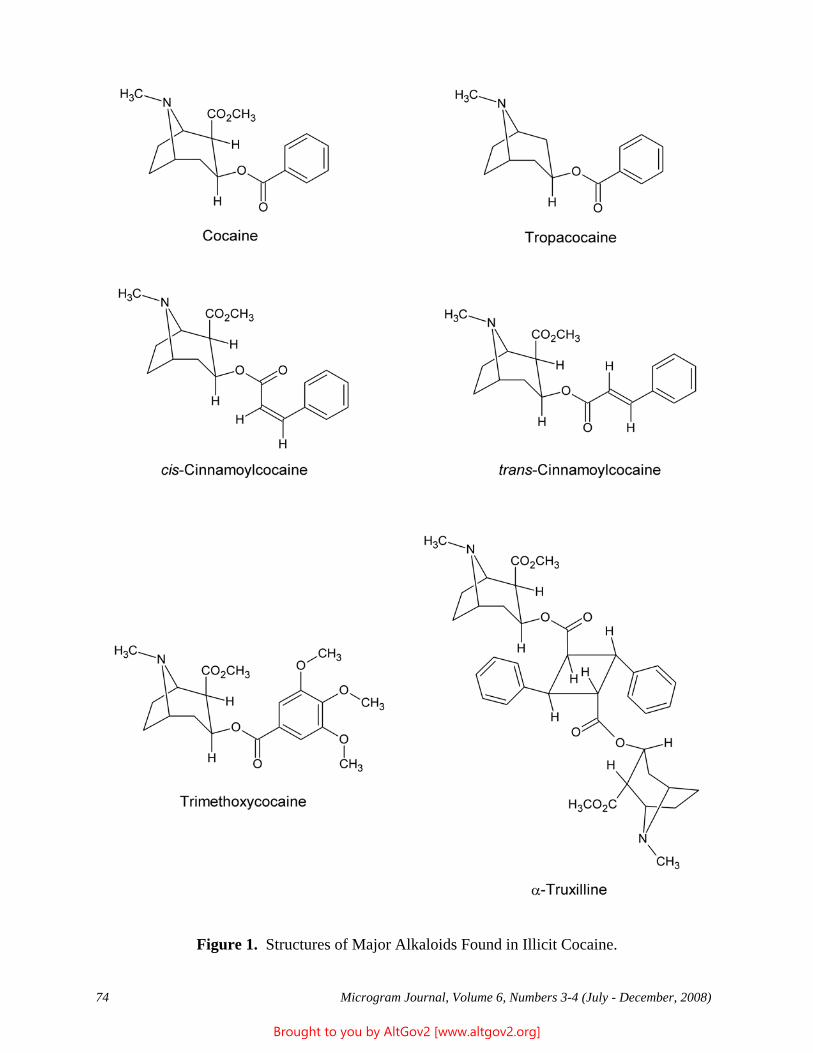
74 Microgram Journal, Volume 6, Numbers 3-4 (July - December, 2008)
Figure 1. Structures of Major Alkaloids Found in Illicit Cocaine.
Brought to you by AltGov2 [www.altgov2.org]
Microgram Journal, Volume 6, Numbers 3-4 (July - December, 2008) 75
Results and Discussion
The base llavada technique experiments resulted in a minor (4.5% average) increase in cocaine base purity,primarily due to the partial removal of the cinnamoylcocaines, truxillines, tropacocaine, and trimethoxycocaine(Figure 1). In addition (and in accordance with the information provided by the Peruvian cocaine processors), theresulting product was also noticeably whiter in appearance after the wash, due to the partial removal of thecinnamoylcocaines and other colored impurities (as noted above, the residual ethanol/impurities solution is darkbrown in color). Partial reconstructed chromatographic profiles of the crude cocaine base, washed cocaine base,and residual ethanol/impurities solution are illustrated in Figure 2. The retention times of the target compoundsare given in Table 2. As seen in Figures 2a and 2b, the cinnamoylcocaine content was reduced in the washedsample. Table 3 illustrates the effects of the wash on the relative concentrations of tropacocaine, cis-cinnamoylcocaine, trans-cinnamoylcocaine, trimethoxycocaine, and total truxillines. These naturally occurringalkaloids are more soluble than cocaine in ethanol, and as a result, are selectively extracted from the illicit cocaine(with minimal loss due to co-extraction of cocaine). Quantitative determinations confirmed decreases rangingfrom 21 - 78% relative to cocaine. The truxilline concentration was the least affected, while thetrimethoxycocaine concentration was the most affected. Re-analysis of the samples 14 months later showedfurther decreases in alkaloid concentrations, ranging from 32 - 100%, versus the original crude cocaine basevalues, indicating further hydrolysis of those alkaloids over time (Table 3).
The residual ethanol/impurities solutions were also examined immediately after completion of the base llavadatechnique and not surprisingly were found to contain significant amounts of tropacocaine, cis-cinnamoylcocaine,trans-cinnamoylcocaine, trimethoxycocaine, and total truxillines relative to cocaine (Figure 2c). While theresidual oil also contained some cocaine, the bulk of the material was primarily comprised of the alkaloidalimpurities, approaching an order of magnitude concentration increase over their respective starting values relativeto cocaine in the original crude base.
The hydrolysis of the cocaine was also examined. Hydrolysis of cocaine occurs at both ester bonds, givingecgonine, ecgonine methyl ester, and benzoylecgonine (Figure 3). Hydrolysis of cis-cinnamoylcocaine and trans-cinnamoylcocaine will also occur, giving cis-cinnamoylecgonine, trans-cinnamoylecgonine, and ecgonine (Figure3). The respective concentrations of the hydrolysis products was determined immediately after completion of thebase llavada technique and again 14 months later. As shown in Table 4, the cleanup immediately increased thesehydrolysis products from 18% to nearly 400% relative to cocaine in the resulting washed base. The residual oilalso contained an increased concentration of the hydrolysis products. In addition, the ethanol remaining in thewashed base samples continued to hydrolyze the cocaine, cis-cinnamoylcocaine, and trans-cinnamoylcocaineduring the 14 month storage period, resulting in even more significant increases in the concentrations of cis-cinnamoylecginine, trans-cinnamoylecgonine, and benzoylecgonine. When compared to the original samples,after 14 months, the hydrolysis products had increased from 57% to nearly 1,400% relative to cocaine.
Finally, although not quantitatively determined, the transesterification of cocaine to cocaethylene due to thepresence of residual ethanol was also observed during storage [6]. Both the original sample and the washed base(immediately following the wash) showed no traces of cocaethylene. However, storage of the sample for 14months allowed transesterfication to occur, resulting in a measurable quantity of cocaethylene; the ethyl esters ofcis- and trans-cinnamoylcocaine were also detected (Figure 5). Thus, the presence of cocaethylene in illicitcocaine may be indicative of use of the base llavada technique - however, ethanol is known to be utilized inseveral other variants of illicit cocaine processing, so the presence of cocaethylene alone does not confirm the useof the base llavada technique.
Although increasingly utilized in Peru, the base llavada method is currently not known to be in use in eitherBolivia or Colombia.
Brought to you by AltGov2 [www.altgov2.org]
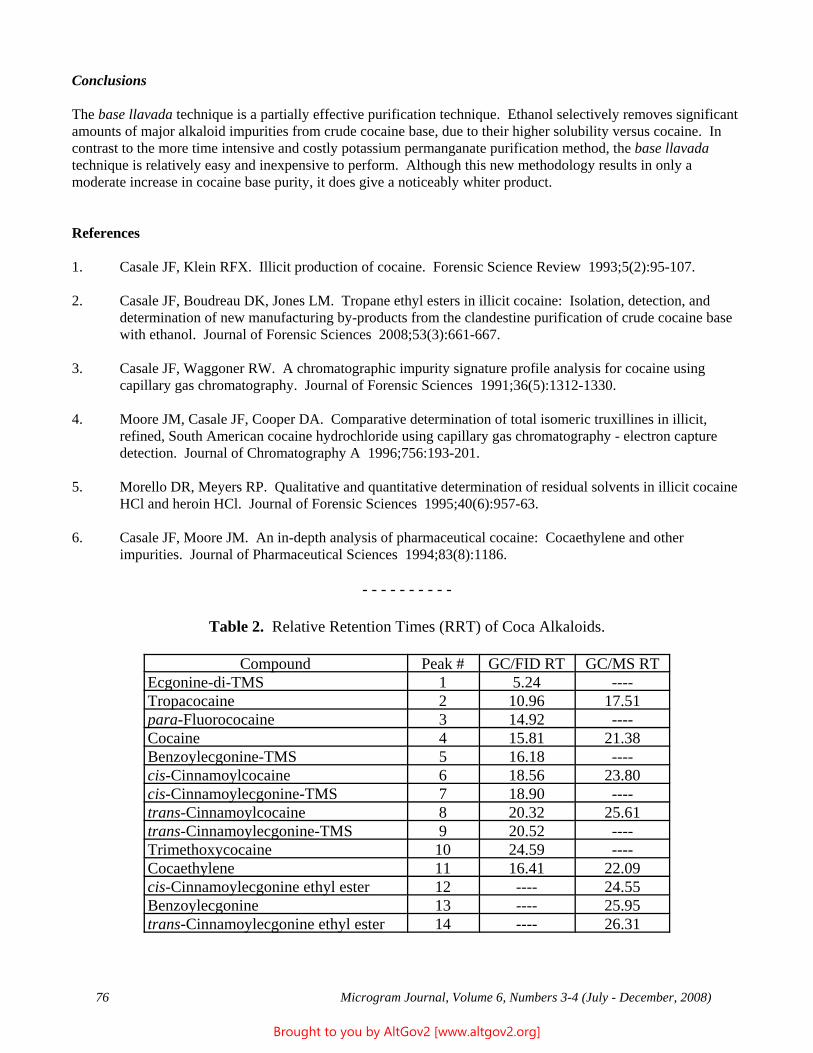
76 Microgram Journal, Volume 6, Numbers 3-4 (July - December, 2008)
Conclusions
The base llavada technique is a partially effective purification technique. Ethanol selectively removes significantamounts of major alkaloid impurities from crude cocaine base, due to their higher solubility versus cocaine. Incontrast to the more time intensive and costly potassium permanganate purification method, the base llavadatechnique is relatively easy and inexpensive to perform. Although this new methodology results in only amoderate increase in cocaine base purity, it does give a noticeably whiter product.
References
1. Casale JF, Klein RFX. Illicit production of cocaine. Forensic Science Review 1993;5(2):95-107.
2. Casale JF, Boudreau DK, Jones LM. Tropane ethyl esters in illicit cocaine: Isolation, detection, anddetermination of new manufacturing by-products from the clandestine purification of crude cocaine basewith ethanol. Journal of Forensic Sciences 2008;53(3):661-667.
3. Casale JF, Waggoner RW. A chromatographic impurity signature profile analysis for cocaine usingcapillary gas chromatography. Journal of Forensic Sciences 1991;36(5):1312-1330.
4. Moore JM, Casale JF, Cooper DA. Comparative determination of total isomeric truxillines in illicit,refined, South American cocaine hydrochloride using capillary gas chromatography - electron capturedetection. Journal of Chromatography A 1996;756:193-201.
5. Morello DR, Meyers RP. Qualitative and quantitative determination of residual solvents in illicit cocaineHCl and heroin HCl. Journal of Forensic Sciences 1995;40(6):957-63.
6. Casale JF, Moore JM. An in-depth analysis of pharmaceutical cocaine: Cocaethylene and otherimpurities. Journal of Pharmaceutical Sciences 1994;83(8):1186.
- - - - - - - - - -
Table 2. Relative Retention Times (RRT) of Coca Alkaloids.
Compound Peak # GC/FID RT GC/MS RT Ecgonine-di-TMS 1 5.24 ---- Tropacocaine 2 10.96 17.51 para-Fluorococaine 3 14.92 ---- Cocaine 4 15.81 21.38 Benzoylecgonine-TMS 5 16.18 ---- cis-Cinnamoylcocaine 6 18.56 23.80 cis-Cinnamoylecgonine-TMS 7 18.90 ---- trans-Cinnamoylcocaine 8 20.32 25.61 trans-Cinnamoylecgonine-TMS 9 20.52 ---- Trimethoxycocaine 10 24.59 ---- Cocaethylene 11 16.41 22.09 cis-Cinnamoylecgonine ethyl ester 12 ---- 24.55 Benzoylecgonine 13 ---- 25.95 trans-Cinnamoylecgonine ethyl ester 14 ---- 26.31
Brought to you by AltGov2 [www.altgov2.org]
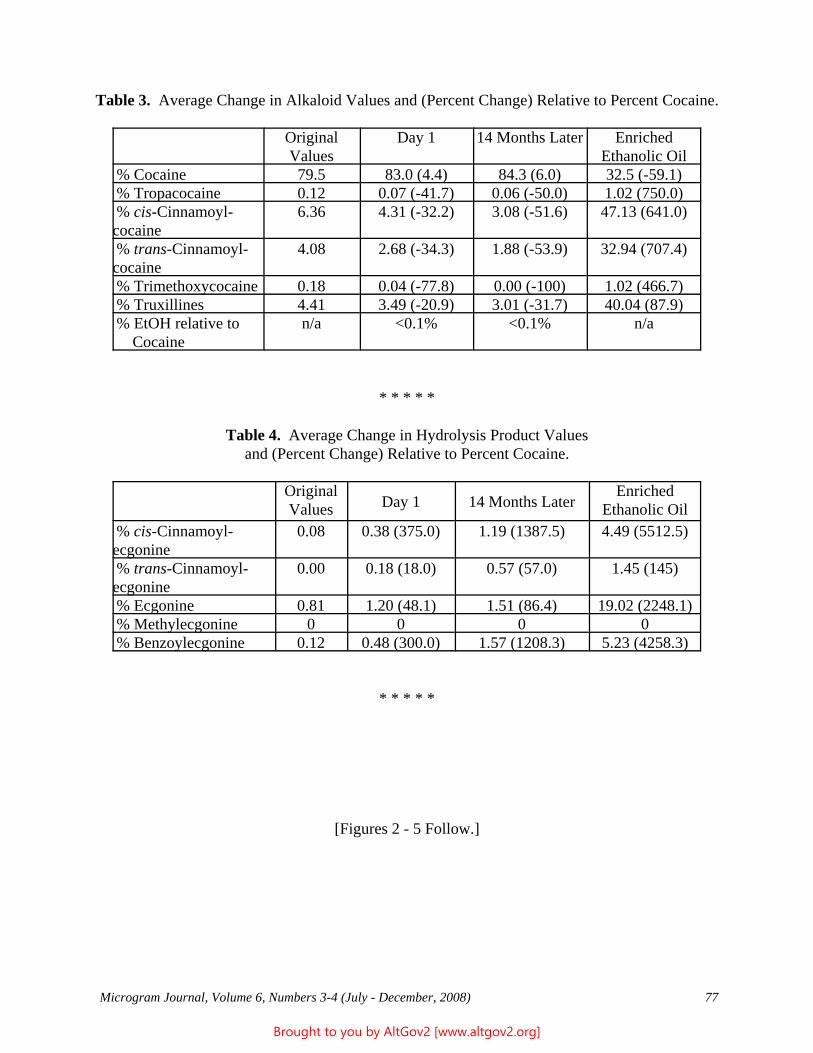
Microgram Journal, Volume 6, Numbers 3-4 (July - December, 2008) 77
Table 3. Average Change in Alkaloid Values and (Percent Change) Relative to Percent Cocaine.
OriginalValues
Day 1 14 Months Later EnrichedEthanolic Oil
% Cocaine 79.5 83.0 (4.4) 84.3 (6.0) 32.5 (-59.1) % Tropacocaine 0.12 0.07 (-41.7) 0.06 (-50.0) 1.02 (750.0) % cis-Cinnamoyl-cocaine
6.36 4.31 (-32.2) 3.08 (-51.6) 47.13 (641.0)
% trans-Cinnamoyl-cocaine
4.08 2.68 (-34.3) 1.88 (-53.9) 32.94 (707.4)
% Trimethoxycocaine 0.18 0.04 (-77.8) 0.00 (-100) 1.02 (466.7) % Truxillines 4.41 3.49 (-20.9) 3.01 (-31.7) 40.04 (87.9) % EtOH relative to Cocaine
n/a <0.1% <0.1% n/a
* * * * *
Table 4. Average Change in Hydrolysis Product Valuesand (Percent Change) Relative to Percent Cocaine.
OriginalValues Day 1 14 Months Later
EnrichedEthanolic Oil
% cis-Cinnamoyl-ecgonine
0.08 0.38 (375.0) 1.19 (1387.5) 4.49 (5512.5)
% trans-Cinnamoyl-ecgonine
0.00 0.18 (18.0) 0.57 (57.0) 1.45 (145)
% Ecgonine 0.81 1.20 (48.1) 1.51 (86.4) 19.02 (2248.1) % Methylecgonine 0 0 0 0 % Benzoylecgonine 0.12 0.48 (300.0) 1.57 (1208.3) 5.23 (4258.3)
* * * * *
[Figures 2 - 5 Follow.]
Brought to you by AltGov2 [www.altgov2.org]
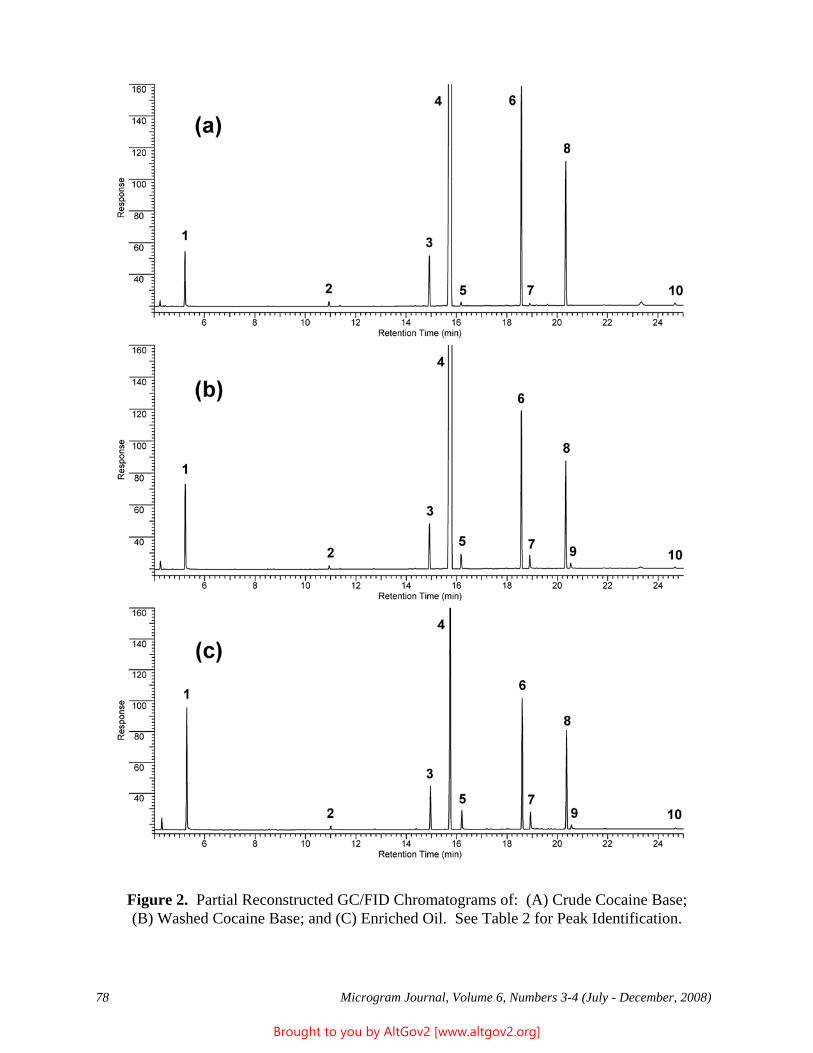
78 Microgram Journal, Volume 6, Numbers 3-4 (July - December, 2008)
Figure 2. Partial Reconstructed GC/FID Chromatograms of: (A) Crude Cocaine Base;(B) Washed Cocaine Base; and (C) Enriched Oil. See Table 2 for Peak Identification.
Brought to you by AltGov2 [www.altgov2.org]
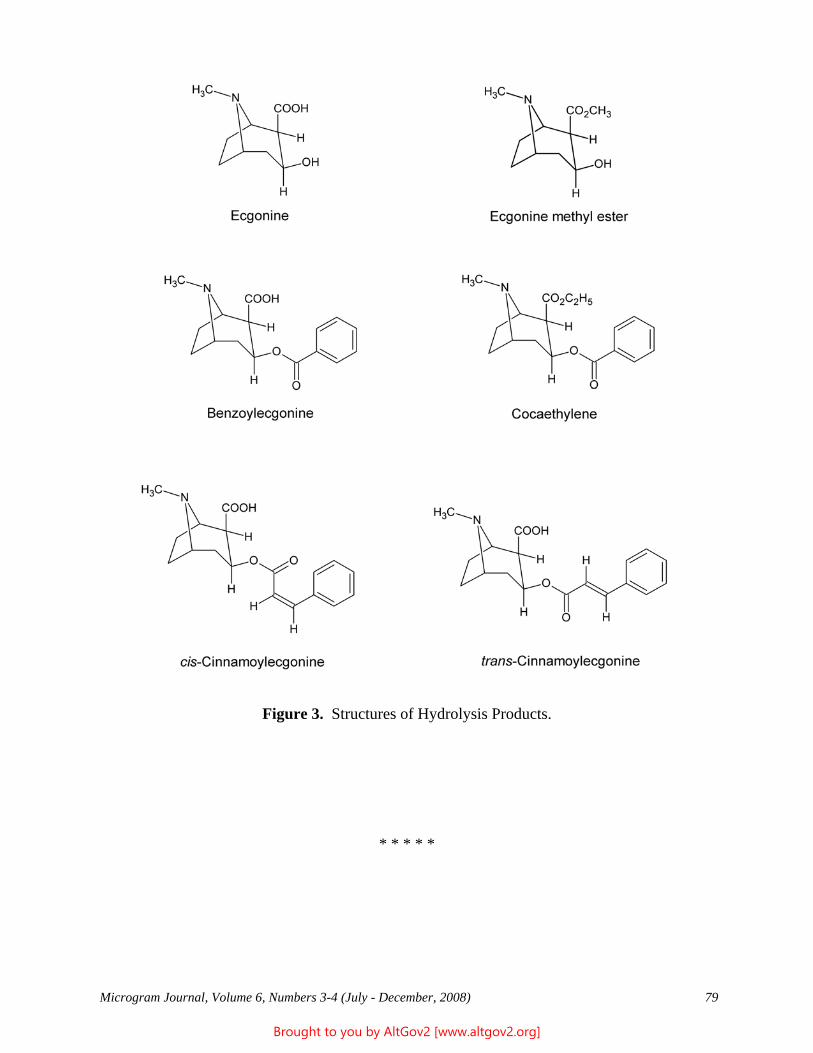
Microgram Journal, Volume 6, Numbers 3-4 (July - December, 2008) 79
Figure 3. Structures of Hydrolysis Products.
* * * * *
Brought to you by AltGov2 [www.altgov2.org]
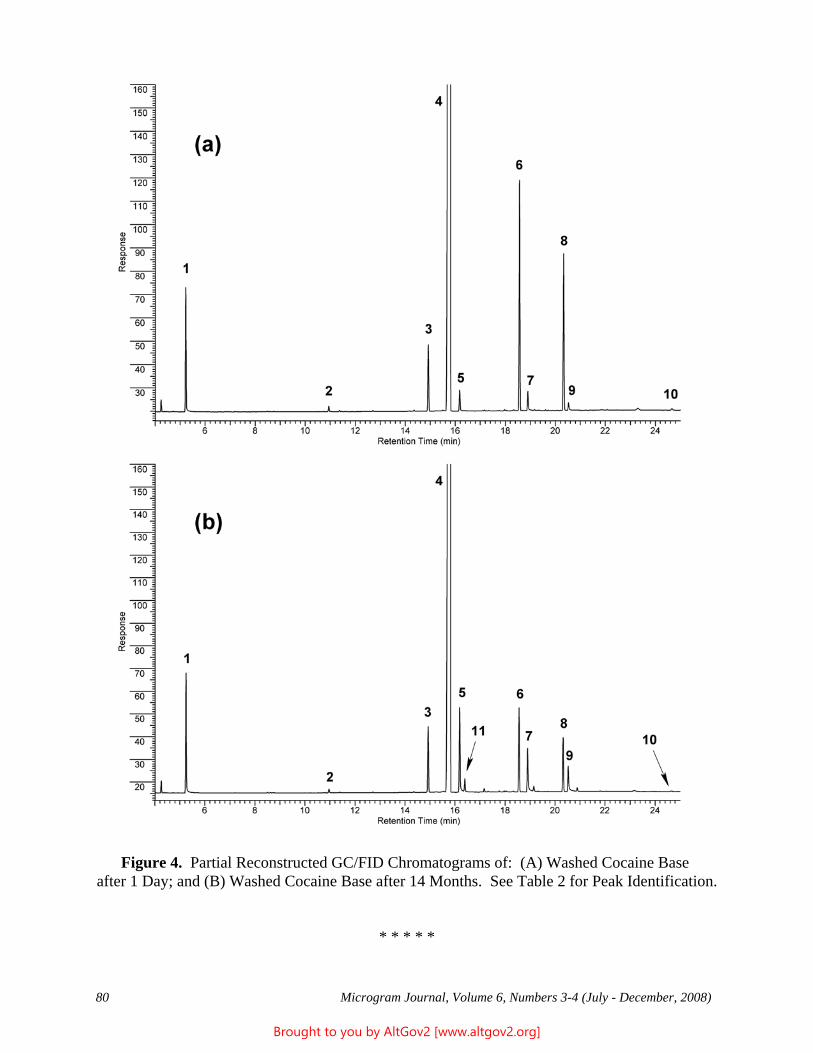
80 Microgram Journal, Volume 6, Numbers 3-4 (July - December, 2008)
Figure 4. Partial Reconstructed GC/FID Chromatograms of: (A) Washed Cocaine Base after 1 Day; and (B) Washed Cocaine Base after 14 Months. See Table 2 for Peak Identification.
* * * * *
Brought to you by AltGov2 [www.altgov2.org]
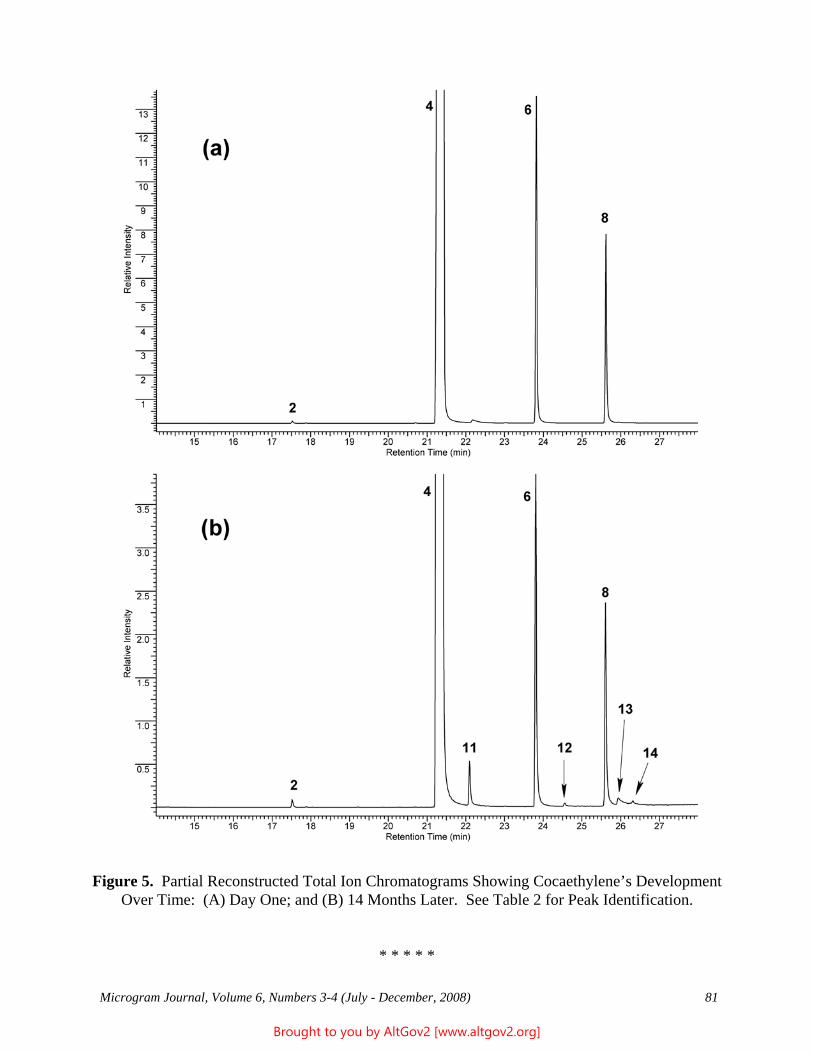
Microgram Journal, Volume 6, Numbers 3-4 (July - December, 2008) 81
Figure 5. Partial Reconstructed Total Ion Chromatograms Showing Cocaethylene’s DevelopmentOver Time: (A) Day One; and (B) 14 Months Later. See Table 2 for Peak Identification.
* * * * *
Brought to you by AltGov2 [www.altgov2.org]
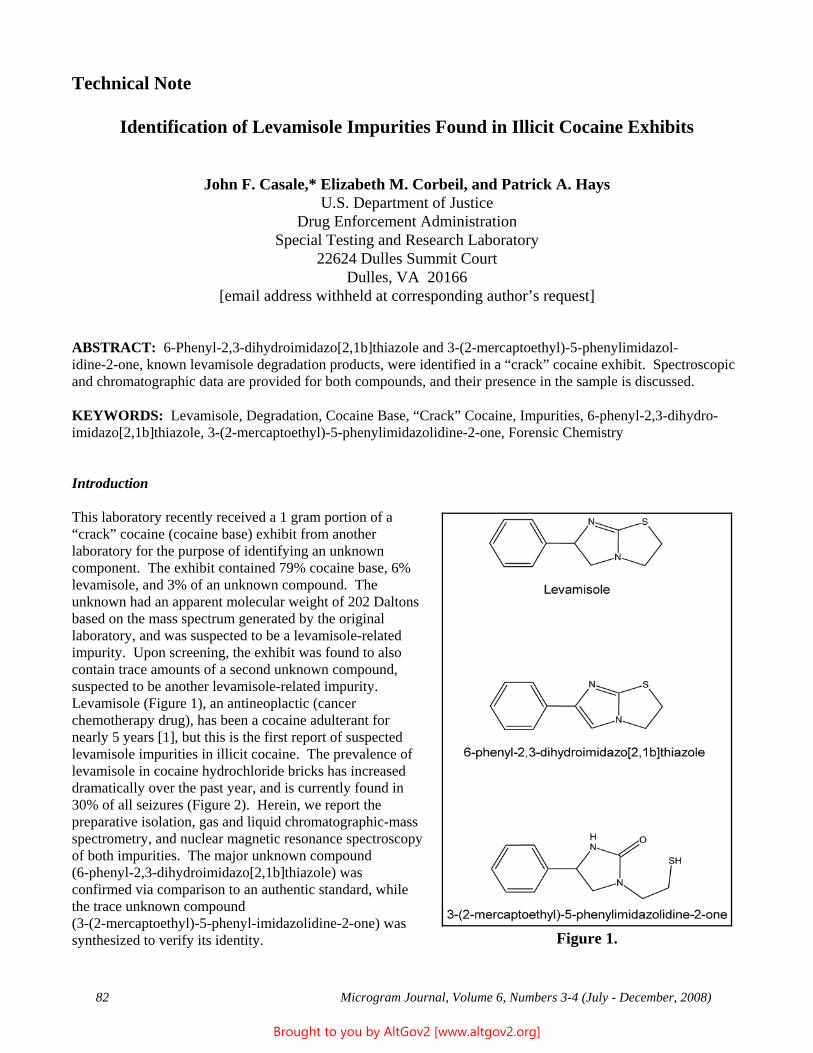
82 Microgram Journal, Volume 6, Numbers 3-4 (July - December, 2008)
Technical Note
Identification of Levamisole Impurities Found in Illicit Cocaine Exhibits
John F. Casale,* Elizabeth M. Corbeil, and Patrick A. HaysU.S. Department of Justice
Drug Enforcement AdministrationSpecial Testing and Research Laboratory
22624 Dulles Summit CourtDulles, VA 20166
[email address withheld at corresponding author’s request]
ABSTRACT: 6-Phenyl-2,3-dihydroimidazo[2,1b]thiazole and 3-(2-mercaptoethyl)-5-phenylimidazol-idine-2-one, known levamisole degradation products, were identified in a “crack” cocaine exhibit. Spectroscopicand chromatographic data are provided for both compounds, and their presence in the sample is discussed.
KEYWORDS: Levamisole, Degradation, Cocaine Base, “Crack” Cocaine, Impurities, 6-phenyl-2,3-dihydro-imidazo[2,1b]thiazole, 3-(2-mercaptoethyl)-5-phenylimidazolidine-2-one, Forensic Chemistry
Introduction
This laboratory recently received a 1 gram portion of a“crack” cocaine (cocaine base) exhibit from anotherlaboratory for the purpose of identifying an unknowncomponent. The exhibit contained 79% cocaine base, 6%levamisole, and 3% of an unknown compound. Theunknown had an apparent molecular weight of 202 Daltonsbased on the mass spectrum generated by the originallaboratory, and was suspected to be a levamisole-relatedimpurity. Upon screening, the exhibit was found to alsocontain trace amounts of a second unknown compound,suspected to be another levamisole-related impurity. Levamisole (Figure 1), an antineoplactic (cancerchemotherapy drug), has been a cocaine adulterant fornearly 5 years [1], but this is the first report of suspectedlevamisole impurities in illicit cocaine. The prevalence oflevamisole in cocaine hydrochloride bricks has increaseddramatically over the past year, and is currently found in30% of all seizures (Figure 2). Herein, we report thepreparative isolation, gas and liquid chromatographic-massspectrometry, and nuclear magnetic resonance spectroscopyof both impurities. The major unknown compound(6-phenyl-2,3-dihydroimidazo[2,1b]thiazole) wasconfirmed via comparison to an authentic standard, whilethe trace unknown compound(3-(2-mercaptoethyl)-5-phenyl-imidazolidine-2-one) wassynthesized to verify its identity. Figure 1.
Brought to you by AltGov2 [www.altgov2.org]
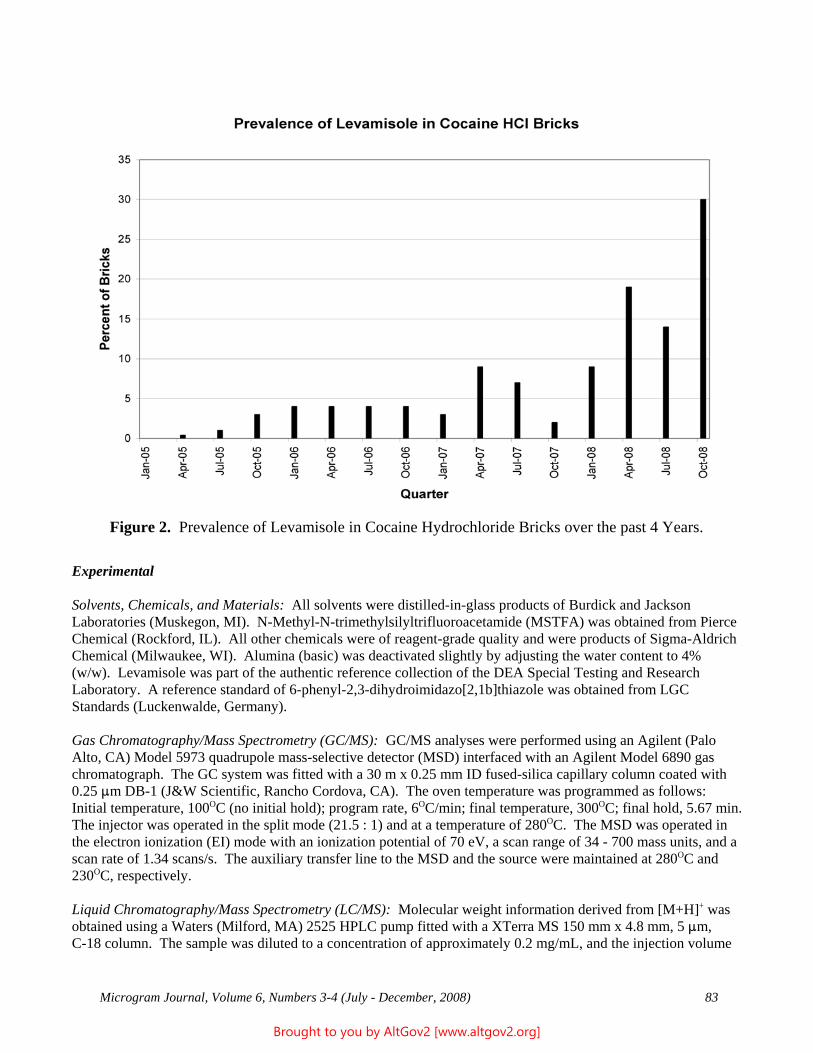
Microgram Journal, Volume 6, Numbers 3-4 (July - December, 2008) 83
Experimental
Solvents, Chemicals, and Materials: All solvents were distilled-in-glass products of Burdick and JacksonLaboratories (Muskegon, MI). N-Methyl-N-trimethylsilyltrifluoroacetamide (MSTFA) was obtained from PierceChemical (Rockford, IL). All other chemicals were of reagent-grade quality and were products of Sigma-AldrichChemical (Milwaukee, WI). Alumina (basic) was deactivated slightly by adjusting the water content to 4%(w/w). Levamisole was part of the authentic reference collection of the DEA Special Testing and ResearchLaboratory. A reference standard of 6-phenyl-2,3-dihydroimidazo[2,1b]thiazole was obtained from LGCStandards (Luckenwalde, Germany).
Gas Chromatography/Mass Spectrometry (GC/MS): GC/MS analyses were performed using an Agilent (PaloAlto, CA) Model 5973 quadrupole mass-selective detector (MSD) interfaced with an Agilent Model 6890 gaschromatograph. The GC system was fitted with a 30 m x 0.25 mm ID fused-silica capillary column coated with0.25 :m DB-1 (J&W Scientific, Rancho Cordova, CA). The oven temperature was programmed as follows: Initial temperature, 100OC (no initial hold); program rate, 6OC/min; final temperature, 300OC; final hold, 5.67 min. The injector was operated in the split mode (21.5 : 1) and at a temperature of 280OC. The MSD was operated inthe electron ionization (EI) mode with an ionization potential of 70 eV, a scan range of 34 - 700 mass units, and ascan rate of 1.34 scans/s. The auxiliary transfer line to the MSD and the source were maintained at 280OC and230OC, respectively.
Liquid Chromatography/Mass Spectrometry (LC/MS): Molecular weight information derived from [M+H]+ wasobtained using a Waters (Milford, MA) 2525 HPLC pump fitted with a XTerra MS 150 mm x 4.8 mm, 5 :m,C-18 column. The sample was diluted to a concentration of approximately 0.2 mg/mL, and the injection volume
Figure 2. Prevalence of Levamisole in Cocaine Hydrochloride Bricks over the past 4 Years.
Brought to you by AltGov2 [www.altgov2.org]
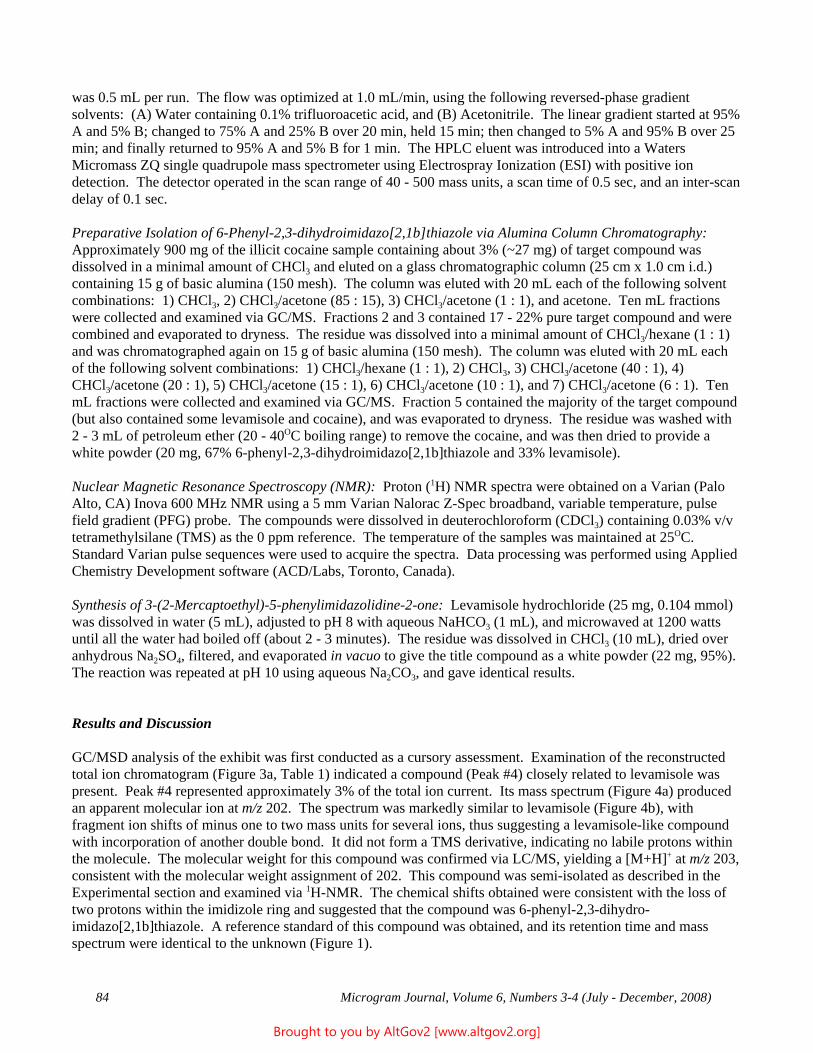
84 Microgram Journal, Volume 6, Numbers 3-4 (July - December, 2008)
was 0.5 mL per run. The flow was optimized at 1.0 mL/min, using the following reversed-phase gradientsolvents: (A) Water containing 0.1% trifluoroacetic acid, and (B) Acetonitrile. The linear gradient started at 95%A and 5% B; changed to 75% A and 25% B over 20 min, held 15 min; then changed to 5% A and 95% B over 25min; and finally returned to 95% A and 5% B for 1 min. The HPLC eluent was introduced into a WatersMicromass ZQ single quadrupole mass spectrometer using Electrospray Ionization (ESI) with positive iondetection. The detector operated in the scan range of 40 - 500 mass units, a scan time of 0.5 sec, and an inter-scandelay of 0.1 sec.
Preparative Isolation of 6-Phenyl-2,3-dihydroimidazo[2,1b]thiazole via Alumina Column Chromatography: Approximately 900 mg of the illicit cocaine sample containing about 3% (~27 mg) of target compound wasdissolved in a minimal amount of CHCl3 and eluted on a glass chromatographic column (25 cm x 1.0 cm i.d.)containing 15 g of basic alumina (150 mesh). The column was eluted with 20 mL each of the following solventcombinations: 1) CHCl3, 2) CHCl3/acetone (85 : 15), 3) CHCl3/acetone (1 : 1), and acetone. Ten mL fractionswere collected and examined via GC/MS. Fractions 2 and 3 contained 17 - 22% pure target compound and werecombined and evaporated to dryness. The residue was dissolved into a minimal amount of CHCl3/hexane (1 : 1)and was chromatographed again on 15 g of basic alumina (150 mesh). The column was eluted with 20 mL eachof the following solvent combinations: 1) CHCl3/hexane (1 : 1), 2) CHCl3, 3) CHCl3/acetone (40 : 1), 4)CHCl3/acetone (20 : 1), 5) CHCl3/acetone (15 : 1), 6) CHCl3/acetone (10 : 1), and 7) CHCl3/acetone (6 : 1). TenmL fractions were collected and examined via GC/MS. Fraction 5 contained the majority of the target compound(but also contained some levamisole and cocaine), and was evaporated to dryness. The residue was washed with2 - 3 mL of petroleum ether (20 - 40OC boiling range) to remove the cocaine, and was then dried to provide awhite powder (20 mg, 67% 6-phenyl-2,3-dihydroimidazo[2,1b]thiazole and 33% levamisole).
Nuclear Magnetic Resonance Spectroscopy (NMR): Proton (1H) NMR spectra were obtained on a Varian (PaloAlto, CA) Inova 600 MHz NMR using a 5 mm Varian Nalorac Z-Spec broadband, variable temperature, pulsefield gradient (PFG) probe. The compounds were dissolved in deuterochloroform (CDCl3) containing 0.03% v/vtetramethylsilane (TMS) as the 0 ppm reference. The temperature of the samples was maintained at 25OC. Standard Varian pulse sequences were used to acquire the spectra. Data processing was performed using AppliedChemistry Development software (ACD/Labs, Toronto, Canada).
Synthesis of 3-(2-Mercaptoethyl)-5-phenylimidazolidine-2-one: Levamisole hydrochloride (25 mg, 0.104 mmol)was dissolved in water (5 mL), adjusted to pH 8 with aqueous NaHCO3 (1 mL), and microwaved at 1200 wattsuntil all the water had boiled off (about 2 - 3 minutes). The residue was dissolved in CHCl3 (10 mL), dried overanhydrous Na2SO4, filtered, and evaporated in vacuo to give the title compound as a white powder (22 mg, 95%). The reaction was repeated at pH 10 using aqueous Na2CO3, and gave identical results.
Results and Discussion
GC/MSD analysis of the exhibit was first conducted as a cursory assessment. Examination of the reconstructedtotal ion chromatogram (Figure 3a, Table 1) indicated a compound (Peak #4) closely related to levamisole waspresent. Peak #4 represented approximately 3% of the total ion current. Its mass spectrum (Figure 4a) producedan apparent molecular ion at m/z 202. The spectrum was markedly similar to levamisole (Figure 4b), withfragment ion shifts of minus one to two mass units for several ions, thus suggesting a levamisole-like compoundwith incorporation of another double bond. It did not form a TMS derivative, indicating no labile protons withinthe molecule. The molecular weight for this compound was confirmed via LC/MS, yielding a [M+H]+ at m/z 203,consistent with the molecular weight assignment of 202. This compound was semi-isolated as described in theExperimental section and examined via 1H-NMR. The chemical shifts obtained were consistent with the loss oftwo protons within the imidizole ring and suggested that the compound was 6-phenyl-2,3-dihydro-imidazo[2,1b]thiazole. A reference standard of this compound was obtained, and its retention time and massspectrum were identical to the unknown (Figure 1).
Brought to you by AltGov2 [www.altgov2.org]
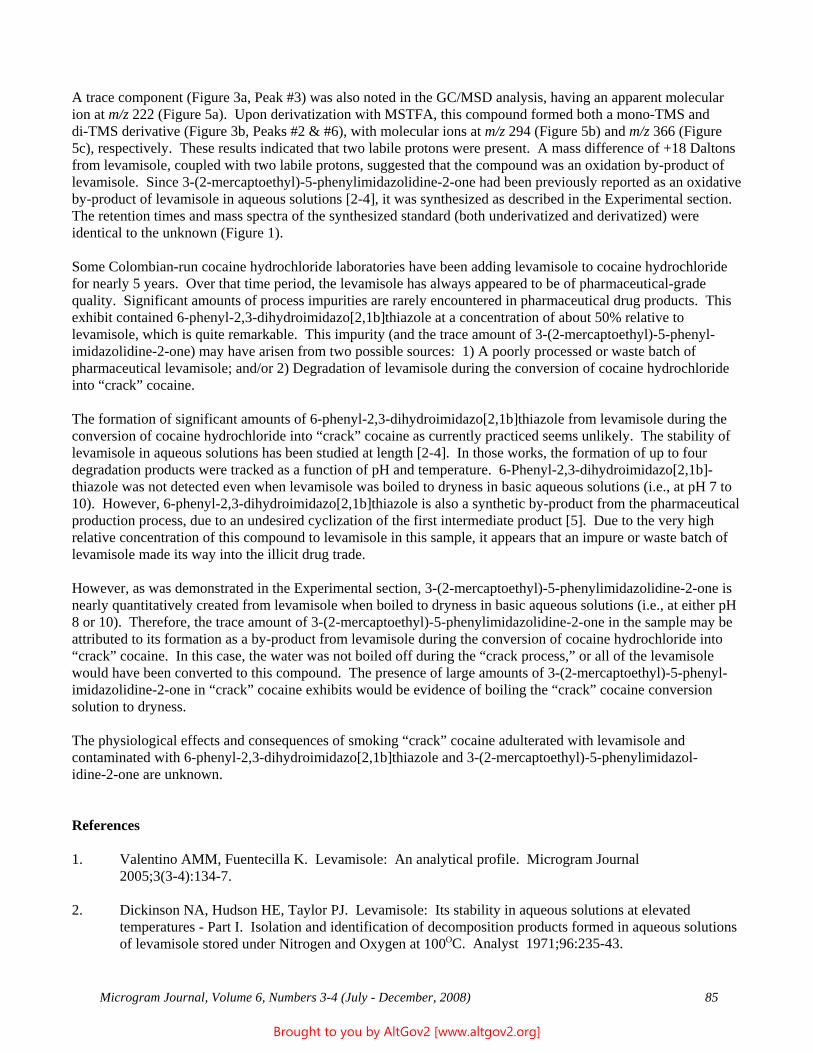
Microgram Journal, Volume 6, Numbers 3-4 (July - December, 2008) 85
A trace component (Figure 3a, Peak #3) was also noted in the GC/MSD analysis, having an apparent molecularion at m/z 222 (Figure 5a). Upon derivatization with MSTFA, this compound formed both a mono-TMS anddi-TMS derivative (Figure 3b, Peaks #2 & #6), with molecular ions at m/z 294 (Figure 5b) and m/z 366 (Figure5c), respectively. These results indicated that two labile protons were present. A mass difference of +18 Daltonsfrom levamisole, coupled with two labile protons, suggested that the compound was an oxidation by-product oflevamisole. Since 3-(2-mercaptoethyl)-5-phenylimidazolidine-2-one had been previously reported as an oxidativeby-product of levamisole in aqueous solutions [2-4], it was synthesized as described in the Experimental section. The retention times and mass spectra of the synthesized standard (both underivatized and derivatized) wereidentical to the unknown (Figure 1). Some Colombian-run cocaine hydrochloride laboratories have been adding levamisole to cocaine hydrochloridefor nearly 5 years. Over that time period, the levamisole has always appeared to be of pharmaceutical-gradequality. Significant amounts of process impurities are rarely encountered in pharmaceutical drug products. Thisexhibit contained 6-phenyl-2,3-dihydroimidazo[2,1b]thiazole at a concentration of about 50% relative tolevamisole, which is quite remarkable. This impurity (and the trace amount of 3-(2-mercaptoethyl)-5-phenyl-imidazolidine-2-one) may have arisen from two possible sources: 1) A poorly processed or waste batch ofpharmaceutical levamisole; and/or 2) Degradation of levamisole during the conversion of cocaine hydrochlorideinto “crack” cocaine.
The formation of significant amounts of 6-phenyl-2,3-dihydroimidazo[2,1b]thiazole from levamisole during theconversion of cocaine hydrochloride into “crack” cocaine as currently practiced seems unlikely. The stability oflevamisole in aqueous solutions has been studied at length [2-4]. In those works, the formation of up to fourdegradation products were tracked as a function of pH and temperature. 6-Phenyl-2,3-dihydroimidazo[2,1b]-thiazole was not detected even when levamisole was boiled to dryness in basic aqueous solutions (i.e., at pH 7 to10). However, 6-phenyl-2,3-dihydroimidazo[2,1b]thiazole is also a synthetic by-product from the pharmaceuticalproduction process, due to an undesired cyclization of the first intermediate product [5]. Due to the very highrelative concentration of this compound to levamisole in this sample, it appears that an impure or waste batch oflevamisole made its way into the illicit drug trade.
However, as was demonstrated in the Experimental section, 3-(2-mercaptoethyl)-5-phenylimidazolidine-2-one isnearly quantitatively created from levamisole when boiled to dryness in basic aqueous solutions (i.e., at either pH8 or 10). Therefore, the trace amount of 3-(2-mercaptoethyl)-5-phenylimidazolidine-2-one in the sample may beattributed to its formation as a by-product from levamisole during the conversion of cocaine hydrochloride into“crack” cocaine. In this case, the water was not boiled off during the “crack process,” or all of the levamisolewould have been converted to this compound. The presence of large amounts of 3-(2-mercaptoethyl)-5-phenyl-imidazolidine-2-one in “crack” cocaine exhibits would be evidence of boiling the “crack” cocaine conversionsolution to dryness.
The physiological effects and consequences of smoking “crack” cocaine adulterated with levamisole andcontaminated with 6-phenyl-2,3-dihydroimidazo[2,1b]thiazole and 3-(2-mercaptoethyl)-5-phenylimidazol-idine-2-one are unknown.
References
1. Valentino AMM, Fuentecilla K. Levamisole: An analytical profile. Microgram Journal 2005;3(3-4):134-7.
2. Dickinson NA, Hudson HE, Taylor PJ. Levamisole: Its stability in aqueous solutions at elevatedtemperatures - Part I. Isolation and identification of decomposition products formed in aqueous solutionsof levamisole stored under Nitrogen and Oxygen at 100OC. Analyst 1971;96:235-43.
Brought to you by AltGov2 [www.altgov2.org]
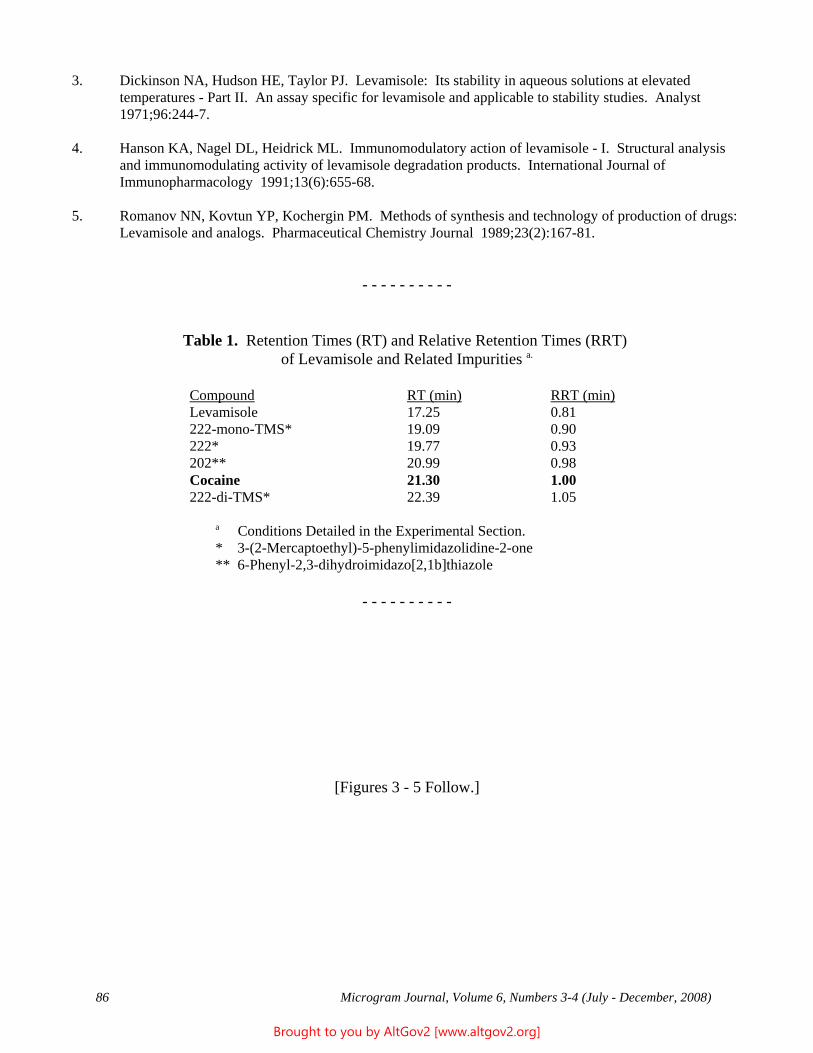
86 Microgram Journal, Volume 6, Numbers 3-4 (July - December, 2008)
3. Dickinson NA, Hudson HE, Taylor PJ. Levamisole: Its stability in aqueous solutions at elevatedtemperatures - Part II. An assay specific for levamisole and applicable to stability studies. Analyst 1971;96:244-7.
4. Hanson KA, Nagel DL, Heidrick ML. Immunomodulatory action of levamisole - I. Structural analysisand immunomodulating activity of levamisole degradation products. International Journal ofImmunopharmacology 1991;13(6):655-68.
5. Romanov NN, Kovtun YP, Kochergin PM. Methods of synthesis and technology of production of drugs: Levamisole and analogs. Pharmaceutical Chemistry Journal 1989;23(2):167-81.
- - - - - - - - - -
Table 1. Retention Times (RT) and Relative Retention Times (RRT) of Levamisole and Related Impurities a.
Compound RT (min) RRT (min) Levamisole 17.25 0.81 222-mono-TMS* 19.09 0.90 222* 19.77 0.93 202** 20.99 0.98 Cocaine 21.30 1.00 222-di-TMS* 22.39 1.05
a Conditions Detailed in the Experimental Section.* 3-(2-Mercaptoethyl)-5-phenylimidazolidine-2-one** 6-Phenyl-2,3-dihydroimidazo[2,1b]thiazole
- - - - - - - - - -
[Figures 3 - 5 Follow.]
Brought to you by AltGov2 [www.altgov2.org]
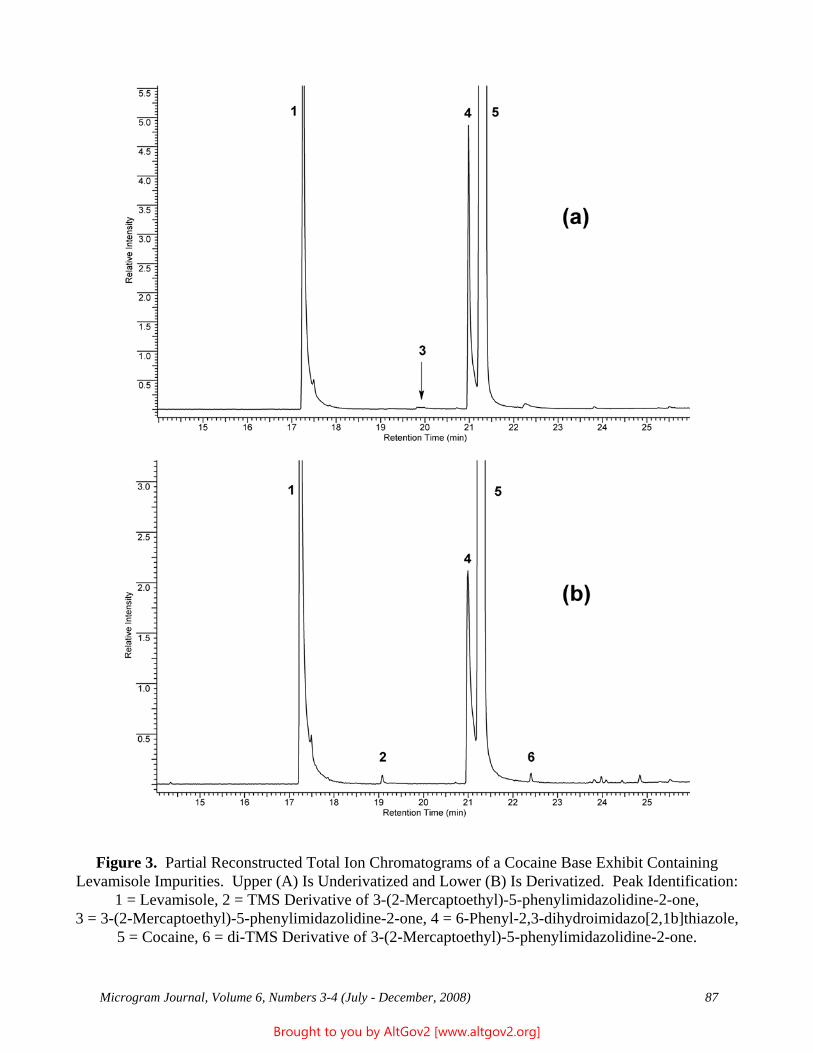
Microgram Journal, Volume 6, Numbers 3-4 (July - December, 2008) 87
Figure 3. Partial Reconstructed Total Ion Chromatograms of a Cocaine Base Exhibit ContainingLevamisole Impurities. Upper (A) Is Underivatized and Lower (B) Is Derivatized. Peak Identification:
1 = Levamisole, 2 = TMS Derivative of 3-(2-Mercaptoethyl)-5-phenylimidazolidine-2-one,3 = 3-(2-Mercaptoethyl)-5-phenylimidazolidine-2-one, 4 = 6-Phenyl-2,3-dihydroimidazo[2,1b]thiazole,
5 = Cocaine, 6 = di-TMS Derivative of 3-(2-Mercaptoethyl)-5-phenylimidazolidine-2-one.
Brought to you by AltGov2 [www.altgov2.org]
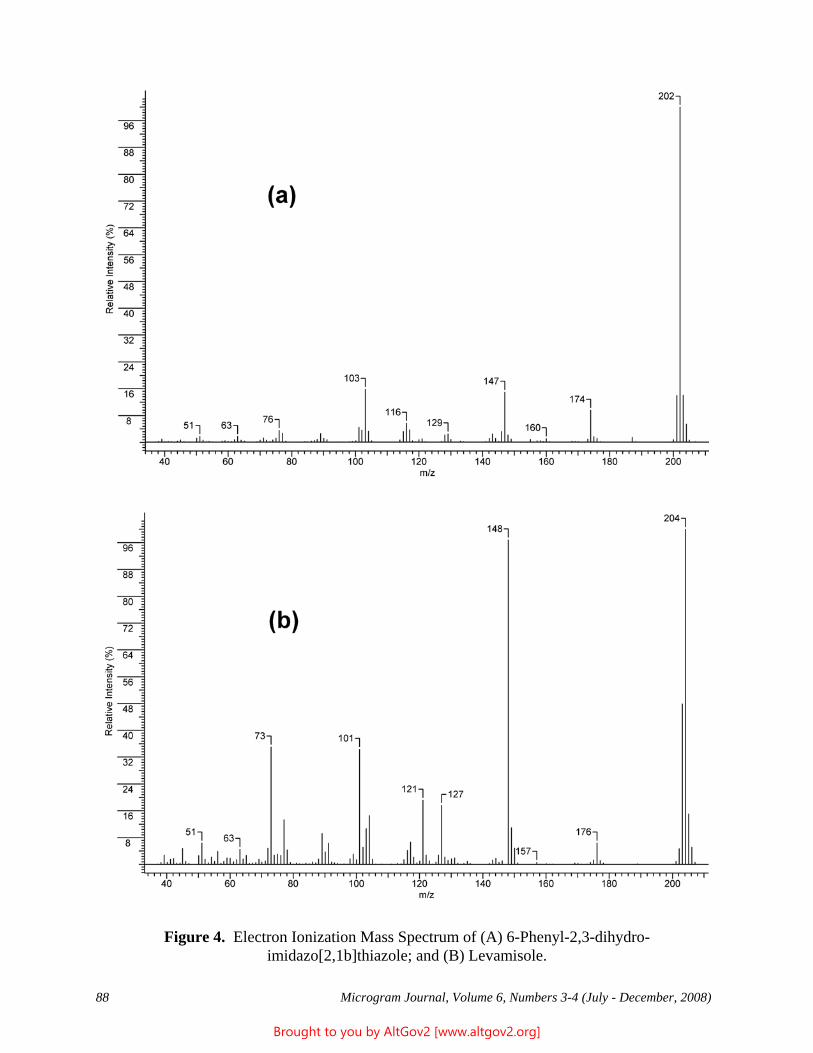
88 Microgram Journal, Volume 6, Numbers 3-4 (July - December, 2008)
Figure 4. Electron Ionization Mass Spectrum of (A) 6-Phenyl-2,3-dihydro-imidazo[2,1b]thiazole; and (B) Levamisole.
Brought to you by AltGov2 [www.altgov2.org]
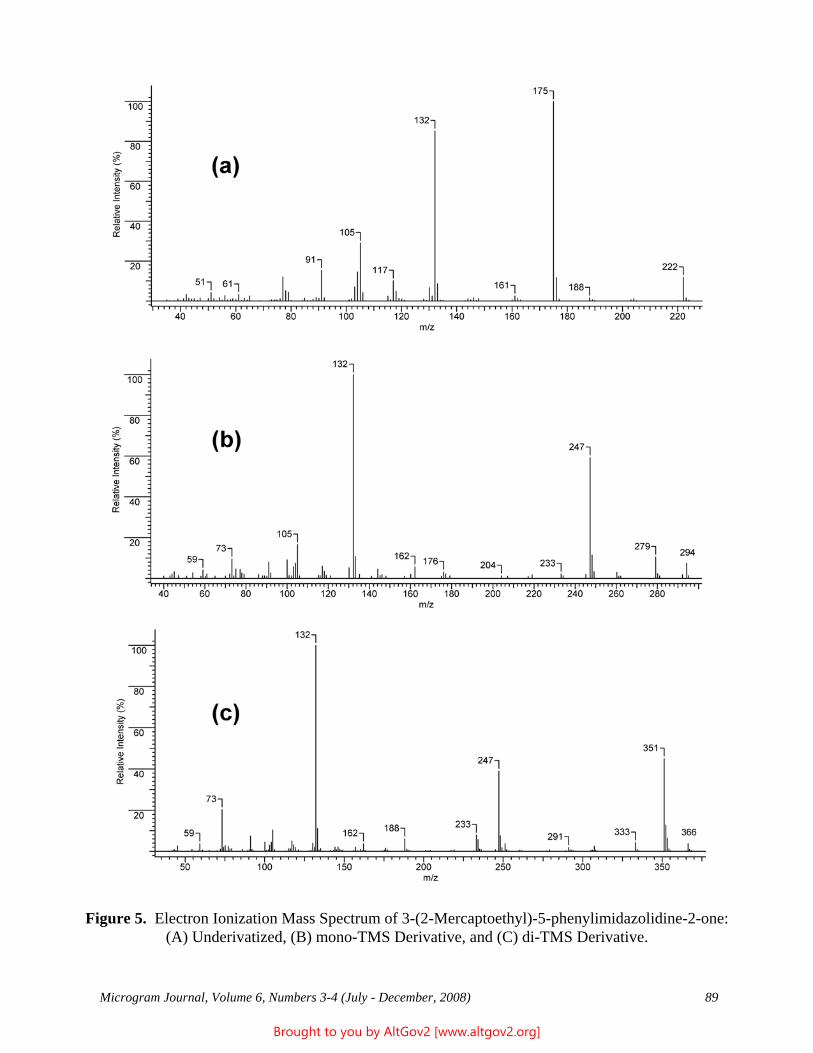
Microgram Journal, Volume 6, Numbers 3-4 (July - December, 2008) 89
Figure 5. Electron Ionization Mass Spectrum of 3-(2-Mercaptoethyl)-5-phenylimidazolidine-2-one:(A) Underivatized, (B) mono-TMS Derivative, and (C) di-TMS Derivative.
Brought to you by AltGov2 [www.altgov2.org]
90 Microgram Journal, Volume 6, Numbers 3-4 (July - December, 2008)
Identification of Diltiazem Impurities / Artifacts during the Analysesof Illicit Cocaine Exhibits Containing Diltiazem
John F. Casale,1,* Pauline M. Orlando,2 Valerie L. Colley,1 and Patrick A. Hays1
1 U.S. Department of JusticeDrug Enforcement Administration
Special Testing and Research Laboratory22624 Dulles Summit Court
Dulles, VA 20166
2 U.S. Department of JusticeDrug Enforcement Administration
South Central Laboratory10150 Technology Boulevard
Dallas, TX 75220
[email address withheld at corresponding author’s request]
ABSTRACT: Desacetyldiltiazem and an uncharacterized artifactual compound with an apparent mass of 354Daltons have been observed in gas chromatographic profiles of cocaine exhibits containing diltiazem. The use ofmethanol as an injection solvent for cocaine samples containing sodium bicarbonate causes the formation of thesecompounds in the injection port; however, the use of chloroform as an injection solvent does not result in theirformation. Spectroscopic and chromatographic data are provided for diltiazem, desacetyldiltiazem, and2,3-dehydrodesacetyldiltiazem. Desacetyldiltiazem is a bona fide impurity in some cocaine exhibits, but it canalso be produced as an analytical artifact. The artifact with an apparent mass of 354 Daltons is not (as postulated)2,3-dehydrodesacetyldiltiazem, and remains unidentified.
KEYWORDS: Diltiazem, Desacetyldiltiazem, 2,3-Dehydrodesacetyldiltiazem, Injection Port Artifacts, Cocaine,Chemical Analysis, Gas Chromatography, Forensic Chemistry
Introduction
Over the past 5 years, DEA laboratories have received increasing numbers of both cocaine hydrochloride andcocaine base (“crack”) exhibits adulterated with diltiazem (Figure 1) [1]. Diltiazem is a potent vasodilator used inthe treatment of angina pectoris, arrhythmia, hypertension, and related heart ailments [1]. Identification ofdiltiazem has typically involved GC/MS, with comparison of spectra and retention time to a standard. There arefour stereoisomers of diltiazem; the isomer being utilized to adulterate cocaine is the pharmaceutical product,(+)-cis-diltiazem.
In the course of identifying suspected diltiazem in cocaine samples, slight differences between the mass spectraand retention times of the presumed diltiazem in the sample and the diltiazem standard were sometimes observed. Additionally, some samples exhibited two unknown compounds eluting just after diltiazem (Figure 2). Theseobservations suggest that the diltiazem is degrading to other compounds during the analysis. Known diltiazemdegradation products include desacetyldiltiazem, N-demethyldiltiazem, N-demethyldesacetyldiltiazem, andO-demethyldesacetyldiltiazem [2-5].
Brought to you by AltGov2 [www.altgov2.org]
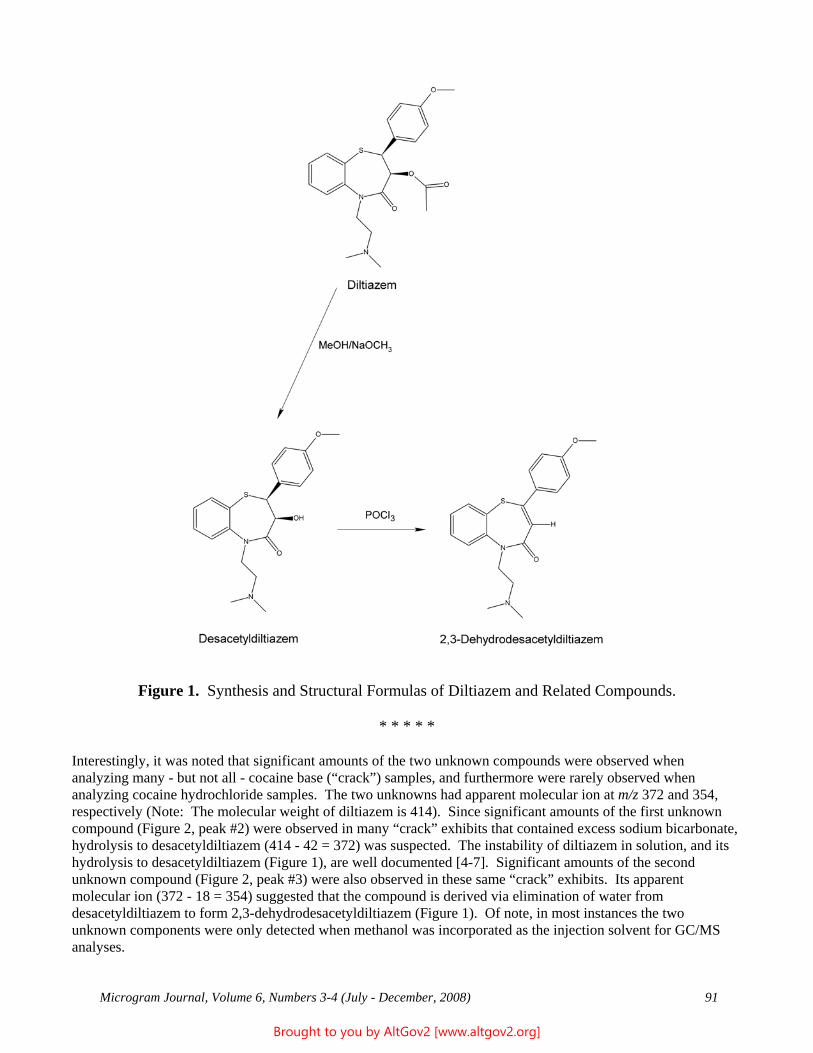
Microgram Journal, Volume 6, Numbers 3-4 (July - December, 2008) 91
Figure 1. Synthesis and Structural Formulas of Diltiazem and Related Compounds.
* * * * *
Interestingly, it was noted that significant amounts of the two unknown compounds were observed whenanalyzing many - but not all - cocaine base (“crack”) samples, and furthermore were rarely observed whenanalyzing cocaine hydrochloride samples. The two unknowns had apparent molecular ion at m/z 372 and 354,respectively (Note: The molecular weight of diltiazem is 414). Since significant amounts of the first unknowncompound (Figure 2, peak #2) were observed in many “crack” exhibits that contained excess sodium bicarbonate,hydrolysis to desacetyldiltiazem (414 - 42 = 372) was suspected. The instability of diltiazem in solution, and itshydrolysis to desacetyldiltiazem (Figure 1), are well documented [4-7]. Significant amounts of the secondunknown compound (Figure 2, peak #3) were also observed in these same “crack” exhibits. Its apparentmolecular ion (372 - 18 = 354) suggested that the compound is derived via elimination of water fromdesacetyldiltiazem to form 2,3-dehydrodesacetyldiltiazem (Figure 1). Of note, in most instances the twounknown components were only detected when methanol was incorporated as the injection solvent for GC/MSanalyses.
Brought to you by AltGov2 [www.altgov2.org]
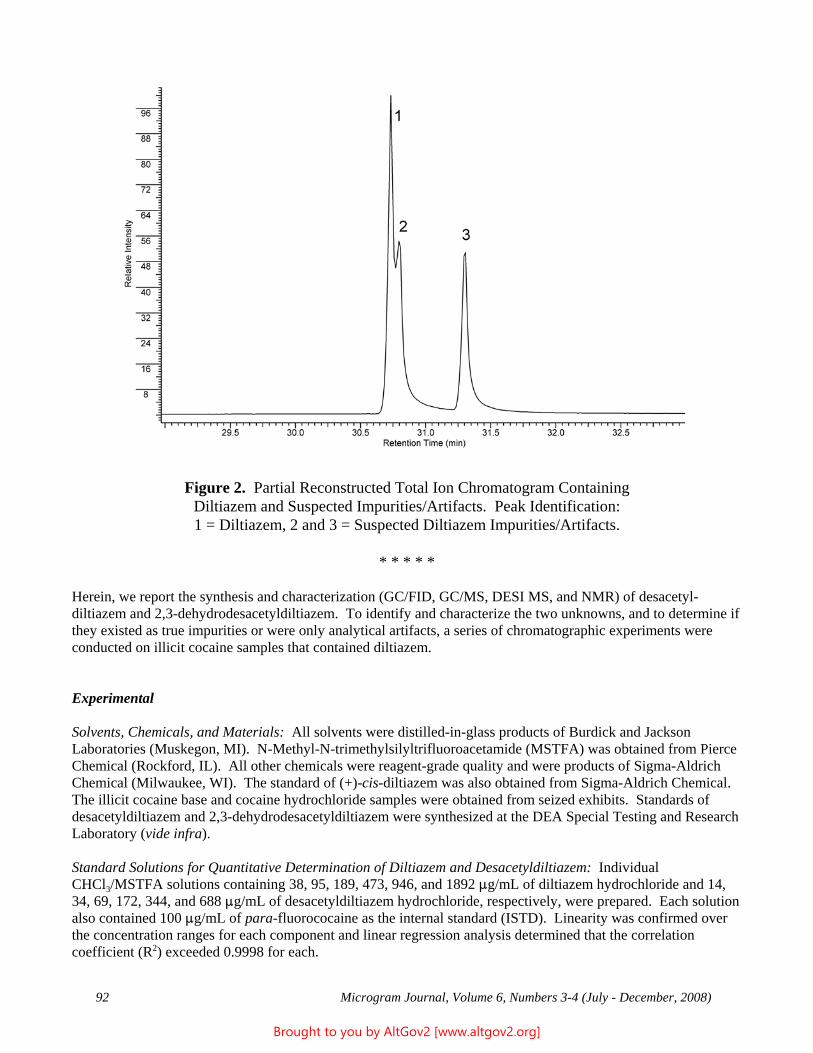
92 Microgram Journal, Volume 6, Numbers 3-4 (July - December, 2008)
Figure 2. Partial Reconstructed Total Ion Chromatogram ContainingDiltiazem and Suspected Impurities/Artifacts. Peak Identification:1 = Diltiazem, 2 and 3 = Suspected Diltiazem Impurities/Artifacts.
* * * * *
Herein, we report the synthesis and characterization (GC/FID, GC/MS, DESI MS, and NMR) of desacetyl-diltiazem and 2,3-dehydrodesacetyldiltiazem. To identify and characterize the two unknowns, and to determine ifthey existed as true impurities or were only analytical artifacts, a series of chromatographic experiments wereconducted on illicit cocaine samples that contained diltiazem.
Experimental
Solvents, Chemicals, and Materials: All solvents were distilled-in-glass products of Burdick and JacksonLaboratories (Muskegon, MI). N-Methyl-N-trimethylsilyltrifluoroacetamide (MSTFA) was obtained from PierceChemical (Rockford, IL). All other chemicals were reagent-grade quality and were products of Sigma-AldrichChemical (Milwaukee, WI). The standard of (+)-cis-diltiazem was also obtained from Sigma-Aldrich Chemical. The illicit cocaine base and cocaine hydrochloride samples were obtained from seized exhibits. Standards ofdesacetyldiltiazem and 2,3-dehydrodesacetyldiltiazem were synthesized at the DEA Special Testing and ResearchLaboratory (vide infra).
Standard Solutions for Quantitative Determination of Diltiazem and Desacetyldiltiazem: IndividualCHCl3/MSTFA solutions containing 38, 95, 189, 473, 946, and 1892 :g/mL of diltiazem hydrochloride and 14,34, 69, 172, 344, and 688 :g/mL of desacetyldiltiazem hydrochloride, respectively, were prepared. Each solutionalso contained 100 :g/mL of para-fluorococaine as the internal standard (ISTD). Linearity was confirmed overthe concentration ranges for each component and linear regression analysis determined that the correlationcoefficient (R2) exceeded 0.9998 for each.
Brought to you by AltGov2 [www.altgov2.org]
Microgram Journal, Volume 6, Numbers 3-4 (July - December, 2008) 93
Instrumentation
Gas Chromatography / Flame Ionization Detection (GC/FID): All purity determinations of cocaine, diltiazem,and desacetyldiltiazem were performed on an Agilent (Palo Alto, CA) Model 6890 gas chromatograph. Samplepreparation and chromatographic parameters for diltiazem and desacetyldiltiazem were identical to those reportedby Casale and Waggoner [8], except that MSTFA was utilized as the derivatizing reagent (instead of BSA). Chromatographic parameters for all cocaine purity determinations were identical to those reported by Piñero andCasale [9].
Gas Chromatography / Mass Spectrometry (GC/MS): GC/MS analyses were performed using an Agilent (PaloAlto, CA) Model 5973 quadrupole mass selective detector (MSD) interfaced with an Agilent Model 6890 gaschromatograph. The GC system was fitted with a 30 m x 0.25 mm ID fused-silica capillary column coated with0.25 :m DB-1 (J&W Scientific, Rancho Cordova, CA). The oven temperature was programmed as follows: Initial temperature, 100OC; initial hold, 0.0 min; program rate, 6OC/min; final temperature, 300OC; final hold, 5.67min. The injector was operated in the split mode (21.5 : 1), at 280OC. The MSD was operated in the electronionization (EI) mode with an ionization potential of 70 eV, a scan range of 34 - 700 mass units, and a scan rate of1.34 scans/s. The auxiliary transfer line to the MSD and the source were maintained at 280OC and 230OC,respectively.
Desorption Electrospray Ionization Mass Spectrometry (DESI MS): Molecular weight information derived from[M+H]+ and MS/MS data were obtained using a Thermo (Madison, WI) Accela Liquid Chromatograph coupledwith an LCQ (Madison, WI) Advantage MAX Ion Trap Mass Spectrometer. The non-ground sample waspositioned near the entrance to the mass spectrometer in the 100% methanol LC eluent spray with a 100 :L/minflow rate. Atmospheric Pressure Ionization (API) parameters included a 5.0 kV spray voltage, 40 psi sheath gas,300OC capillary temperature, and positive polarity. Full MS data was collected with a scan range of 90 - 500 m/z. MS/MS data for 415 m/z and 373 m/z were collected at 35% cid with scan ranges of 110 - 500 m/z and 100 - 500m/z, respectively.
Nuclear Magnetic Resonance Spectroscopy (NMR): One and two dimensional NMR analyses were performed ona Varian (Palo Alto, CA) VNMRS 600 MHz NMR using a 3 mm triple resonance Varian indirect detection probe. The samples were prepared in deuterated chloroform containing tetramethylsilane (CDCl3 with TMS, AldrichChemical Co., Milwaukee, WI). Gradient versions of the two dimensional NMR experiments HSQC (one bondcorrelation of hydrogens directly bonded to carbon) and HMBC (correlation of hydrogens 2, 3, or 4 bonds from acarbon) were performed to make the assignments listed in Table 1.
Syntheses
Desacetyldiltiazem Hydrochloride: Diltiazem hydrochloride (1.00 g, 2.22 mmol) and NaOCH3 (0.21 g, 3.89mmol) were dissolved into MeOH (15 mL) and heated at 75OC overnight in a sealed tube. The MeOH wasevaporated to a minimal volume (about 0.5 mL) and then diluted with 5 mL of water and 0.25 mL of saturatedaqueous Na2CO3. The solution was extracted with CHCl3 (2 x 5 mL). The combined extracts were washed withwater (2 x 10 mL) and dried over anhydrous Na2SO4, filtered, and evaporated in vacuo to a semi-crystalline mass. The product was dissolved in 300 mL diethyl ether, precipitated as the hydrochloride ion-pair with the addition ofsufficient ethereal hydrochloric acid, filtered, and dried to provide a white powder (666 mg, 70% yield, 97+%purity).
2,3-Dehydrodesacetyldiltiazem Base: Desacetyldiltiazem hydrochloride (150 mg, 0.37 mmol) and POCl3 (1.0mL, 10.9 mmol) were heated at 75OC for 9 hours in a sealed tube. The reaction was cooled to 0OC and carefullyquenched with cold water (2 mL), and then cold concentrated NaOH until a pH of 9 was achieved. The solutionwas extracted with CHCl3 (2 x 5 mL). The combined extracts were dried over anhydrous Na2SO4, filtered, andevaporated in vacuo to provide an off-white powder (150 mg, 71% yield, 98+% purity).
Brought to you by AltGov2 [www.altgov2.org]
94 Microgram Journal, Volume 6, Numbers 3-4 (July - December, 2008)
Results and Discussion
Two cocaine base exhibits (Base #1 and Base #2) and one cocaine hydrochloride exhibit were examined forcocaine, diltiazem, and desacetyldiltiazem by GC/FID, as detailed in the Experimental section. The base exhibitsboth contained sodium bicarbonate, and were specifically selected because they gave differing responses fordiltiazem by GC/FID vs. GC/MS. The cocaine hydrochloride exhibit was specifically selected because itcontained a relatively high level of diltiazem and trace amounts of suspected desacetyldiltiazem. Partialreconstructed GC/FID chromatograms for the diltiazem/desacetyldiltiazem determinations are illustrated in Figure3. The quantitative data and relative retention times are given in Tables 2 and 3, respectively.
Base #1 contained 7.1% diltiazem and 0.67% desacetyldiltiazem by GC/FID utilizing CHCl3/MSTFA. However,when analyzed by GC/MS with methanol as the injection solvent (Figure 4a), no diltiazem was detected. Instead,two unknown compounds were observed. The first was identified as desacetyldiltiazem via comparison of itsmass spectrum (Figure 5b) and retention time with the synthesized standard. The second had an apparentmolecular ion at m/z 354 (hereafter referred to as the “354” compound; Figure 6a). We had postulated that the“354” compound was 2,3-dehydrodesacetyldiltiazem (Figure 1), resulting from elimination of water fromdesacetyldiltiazem. This is analogous to the formation of methyl ecgonidine (anhydroecgonine methyl ester) fromcocaine [10]. However, when the “354” compound’s mass spectrum and retention time were compared to thesynthetic standard, the spectra (Figure 6a and 6b) were dissimilar, and the retention time differed by 1.5 minutes(Table 3). Thus, the “354” compound remains unidentified at this time.
When Base #1 was examined by GC/MS using CHCl3/MSTFA as the injection solvent (Figure 4b), diltiazem wasidentified by its mass spectrum (Figure 5a), as well as a lower level of desacetyldiltiazem as its TMS derivative(Figure 5c). However, the “354” compound was not detected. When Base #1 was examined by DESI MS, only asmall [M+H]+ at m/z 373 (consistent with desacetyldiltiazem (mw = 372)) was detected relative to a [M+H]+ atm/z 415 (diltiazem). The collective results indicate that use of methanol as the injection solvent for this exhibitresults in quantitative degradation of diltiazem to desacetyldiltiazem and the “354” compound.
Base #2 was determined to contain trace diltiazem and 1.3% desacetyldiltiazem via GC/FID utilizingCHCl3/MSTFA. When examined by GC/MS using methanol as the injection solvent (Figure 7a), tracedesacetyldiltiazem was identified but no diltiazem or “354” compound were detected. When this exhibit wasexamined by GC/MS using CHCl3/MSTFA as the injection solvent (Figure 7b), desacetyldiltiazem was easilyidentified as its TMS derivative, but again, no diltiazem or “354” compound were detected.
GC artifacts are well known when analyzing cocaine base (“crack”) exhibits that contain sodium bicarbonate. Inthis study, sodium methoxide and methanol were used to synthesize desacetyldiltiazem (from diltiazem) in highyield. Since the use of methanol as an injection solvent, coupled with the presence of sodium bicarbonate, willproduce sodium methoxide in the injection port [10], the observed degradation of diltiazem to desacetyldiltiazemis not surprising. Since the “354” compound was not identified, the mechanism for its formation is unknown.
The cocaine hydrochloride exhibit was determined to contain 12.0% diltiazem and 0.27% desacetyldiltiazem viaGC/FID. When examined by GC/MS using methanol as the injection solvent (Figure 8a), only diltiazem wasidentified. In this case, use of methanol did not cause degradation of diltiazem because the exhibit contained nosodium bicarbonate. Finally, when the exhibit was examined by GC/MS using CHCl3/MSTFA as the injectionsolvent (Figure 8b), diltiazem and trace desacetyldiltiazem as its TMS derivative were identified, consistent withthe GC/FID analysis (Figure 3c); the “354” compound was not detected in either analysis.
The cocaine hydrochloride exhibit was then converted into “crack” cocaine using the traditional process (i.e., withwater and sodium bicarbonate). The quantitative GC/FID data for this exhibit is given in Table 2. The convertedsample contained essentially the same percentage of cocaine, diltiazem, and desacetyldiltiazem as was found inthe original hydrochloride sample. This indicates that the “crack” conversion process did not cause hydrolysis
Brought to you by AltGov2 [www.altgov2.org]
Microgram Journal, Volume 6, Numbers 3-4 (July - December, 2008) 95
of diltiazem to desacetyldiltiazem. However, it is likely that prolonged storage of “crack” cocaine containingdiltiazem and sodium bicarbonate (or a stronger base (e.g., Na2CO3 or NaOH)) would cause slow hydrolysis todesacetyldiltiazem. Finally, as expected, when this “crack” exhibit was examined by GC/MS using methanol asthe injection solvent (Figure 9), only desacetyldiltiazem and the “354” compound were detected.
The physiological effects and consequences of smoking “crack” cocaine adulterated with diltiazem and sodiumbicarbonate are unknown.
Conclusions
Desacetyldiltiazem and an uncharacterized artifact (the “354” compound) can be formed as analytical artifacts ingas chromatographic profiles of cocaine exhibits containing diltiazem and sodium bicarbonate. The use ofmethanol as the injection solvent for these samples causes the formation of these compounds in GC injectionports. However, the use of CHCl3 or CHCl3/MSTFA as injection solvents does not promote the formation ofthese artifacts. Although desacetyldiltiazem can be present at detectable levels as a bona fide impurity in somecocaine exhibits, analysts should be aware that degradation of diltiazem to desacetyldiltiazem and the “354”compound will occur in GC injection ports when analyzing cocaine samples containing diltiazem and sodiumbicarbonate, when using methanol as the injection solvent.
References
1. Peters DE. Diltiazem HCl: An analytical profile. Microgram Journal 2004;2(1-4):11-16.
2. Quaglia MG, Donati E, Fanali S, Bossu E, Montinaro A, Buiarelli F. Analysis of diltiazem and its relatedsubstances by HPLC and HPLC/MS. Journal of Pharmaceutical and Biomedical Analysis 2005;37:695-701.
3. Grech-Belanger O, Leboeuf E, Langlois S. Assay of diltiazem and desacetyldiltiazem by capillary gaschromatography. Journal of Chromatography 1987;417:89-98.
4. Muszalska I, Jamszol L, Grzeskowiak D. Kinetics of hydrolysis of diltiazem hydrochloride in aqueoussolutions. Acta Poloniae Pharmaceutica - Drug Research 2003;60(3):163-8.
5. Dube LM, Mousseau N, McGilveray IJ. High-performance liquid chromatographic determination ofdiltiazem and four of its metabolites in plasma: Evaluation of their stability. Journal of Chromatography 1988;430:103-111.
6. Andrisano V, Hrelia P, Gotti R, Leoni A, Cavrini V. Photostability and phototoxicity studies ondiltiazem. Journal of Pharmaceutical and Biomedical Analysis 2001;25:589-97.
7. Chafetz L, Shah KP. Stability of diltiazem in acid solution. Journal of Pharmaceutical Sciences 1991;80(2):171-2.
8. Casale JF, Waggoner RW. A chromatographic impurity signature profile analysis for cocaine usingcapillary gas chromatography. Journal of Forensic Sciences 1991;36(5):1312-30.
9. Piñero EL and Casale JF. Quantitation of cocaine by gas chromatography - flame ionization detectionutilizing isopropylcocaine as a structurally related internal standard. Microgram Journal 2006;4(1-4):47-53.
Brought to you by AltGov2 [www.altgov2.org]
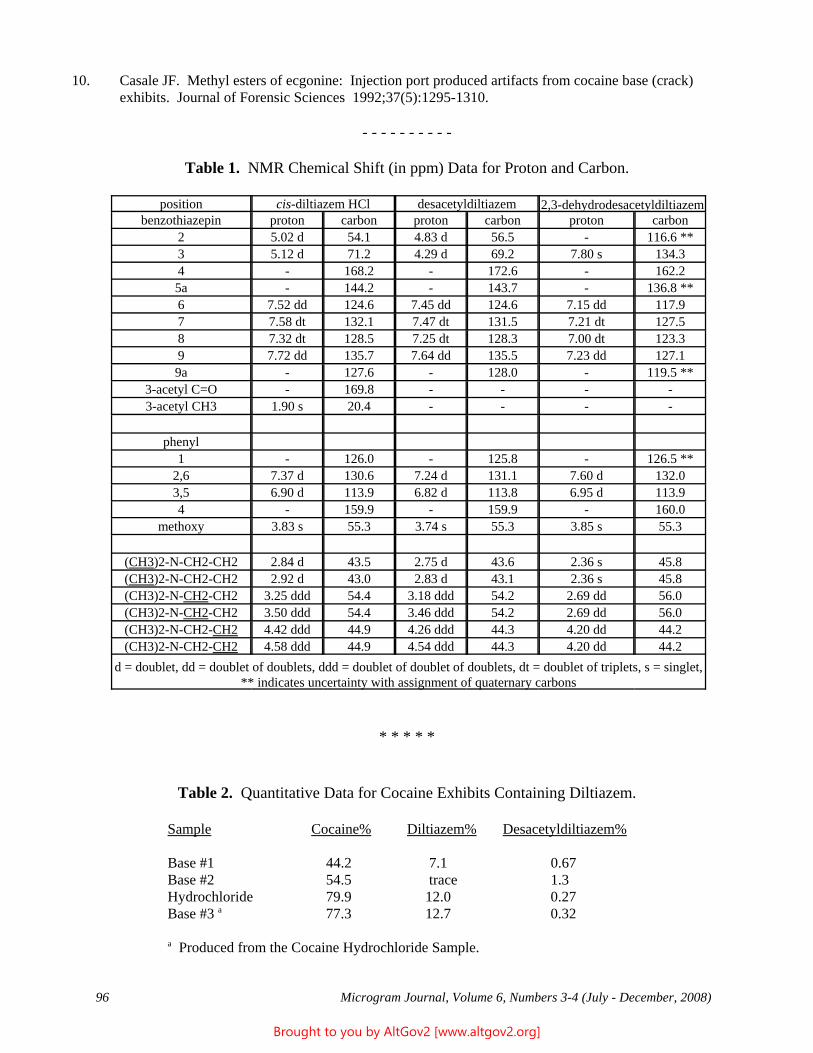
96 Microgram Journal, Volume 6, Numbers 3-4 (July - December, 2008)
10. Casale JF. Methyl esters of ecgonine: Injection port produced artifacts from cocaine base (crack)exhibits. Journal of Forensic Sciences 1992;37(5):1295-1310.
- - - - - - - - - -
Table 1. NMR Chemical Shift (in ppm) Data for Proton and Carbon.
position cis-diltiazem HCl desacetyldiltiazem 2,3-dehydrodesacetyldiltiazembenzothiazepin proton carbon proton carbon proton carbon
2 5.02 d 54.1 4.83 d 56.5 - 116.6 **3 5.12 d 71.2 4.29 d 69.2 7.80 s 134.34 - 168.2 - 172.6 - 162.25a - 144.2 - 143.7 - 136.8 **6 7.52 dd 124.6 7.45 dd 124.6 7.15 dd 117.97 7.58 dt 132.1 7.47 dt 131.5 7.21 dt 127.58 7.32 dt 128.5 7.25 dt 128.3 7.00 dt 123.39 7.72 dd 135.7 7.64 dd 135.5 7.23 dd 127.19a - 127.6 - 128.0 - 119.5 **
3-acetyl C=O - 169.8 - - - -3-acetyl CH3 1.90 s 20.4 - - - -
phenyl
1 - 126.0 - 125.8 - 126.5 **2,6 7.37 d 130.6 7.24 d 131.1 7.60 d 132.03,5 6.90 d 113.9 6.82 d 113.8 6.95 d 113.94 - 159.9 - 159.9 - 160.0
methoxy 3.83 s 55.3 3.74 s 55.3 3.85 s 55.3
(CH3)2-N-CH2-CH2 2.84 d 43.5 2.75 d 43.6 2.36 s 45.8(CH3)2-N-CH2-CH2 2.92 d 43.0 2.83 d 43.1 2.36 s 45.8(CH3)2-N-CH2-CH2 3.25 ddd 54.4 3.18 ddd 54.2 2.69 dd 56.0(CH3)2-N-CH2-CH2 3.50 ddd 54.4 3.46 ddd 54.2 2.69 dd 56.0(CH3)2-N-CH2-CH2 4.42 ddd 44.9 4.26 ddd 44.3 4.20 dd 44.2(CH3)2-N-CH2-CH2 4.58 ddd 44.9 4.54 ddd 44.3 4.20 dd 44.2
d = doublet, dd = doublet of doublets, ddd = doublet of doublet of doublets, dt = doublet of triplets, s = singlet,** indicates uncertainty with assignment of quaternary carbons
* * * * *
Table 2. Quantitative Data for Cocaine Exhibits Containing Diltiazem.
Sample Cocaine% Diltiazem% Desacetyldiltiazem%
Base #1 44.2 7.1 0.67Base #2 54.5 trace 1.3Hydrochloride 79.9 12.0 0.27Base #3 a 77.3 12.7 0.32
a Produced from the Cocaine Hydrochloride Sample.
Brought to you by AltGov2 [www.altgov2.org]
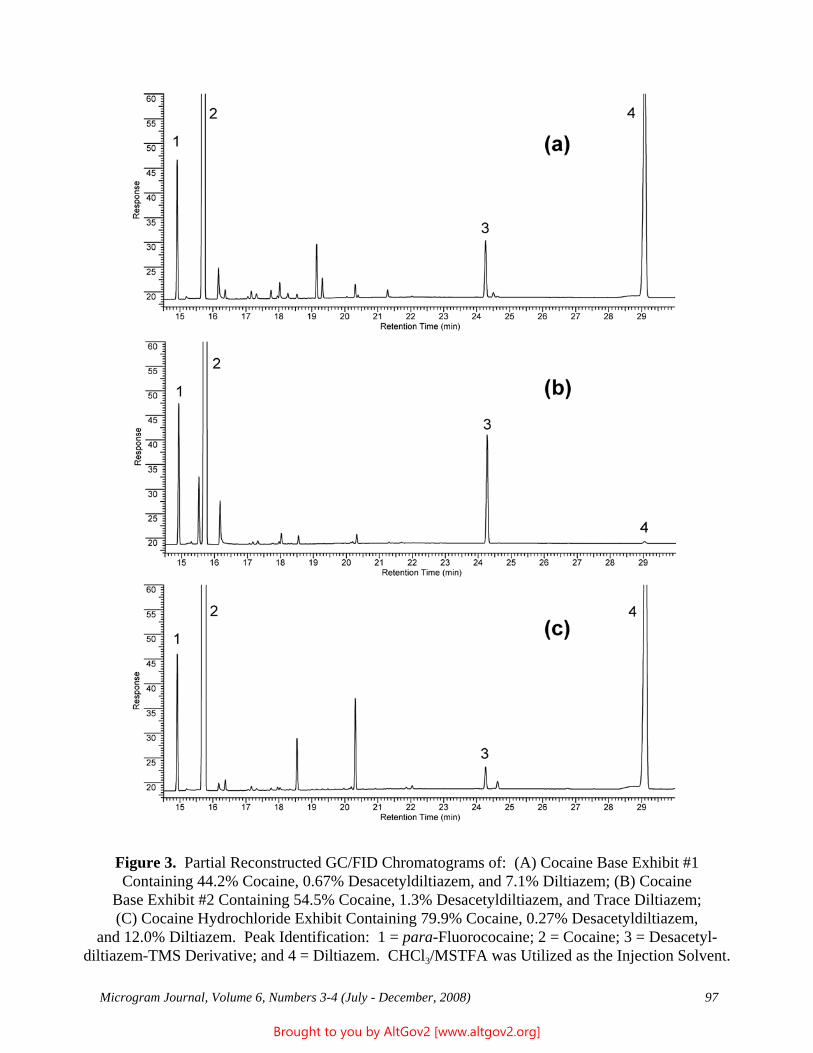
Microgram Journal, Volume 6, Numbers 3-4 (July - December, 2008) 97
Figure 3. Partial Reconstructed GC/FID Chromatograms of: (A) Cocaine Base Exhibit #1Containing 44.2% Cocaine, 0.67% Desacetyldiltiazem, and 7.1% Diltiazem; (B) Cocaine
Base Exhibit #2 Containing 54.5% Cocaine, 1.3% Desacetyldiltiazem, and Trace Diltiazem;(C) Cocaine Hydrochloride Exhibit Containing 79.9% Cocaine, 0.27% Desacetyldiltiazem,
and 12.0% Diltiazem. Peak Identification: 1 = para-Fluorococaine; 2 = Cocaine; 3 = Desacetyl-diltiazem-TMS Derivative; and 4 = Diltiazem. CHCl3/MSTFA was Utilized as the Injection Solvent.
Brought to you by AltGov2 [www.altgov2.org]
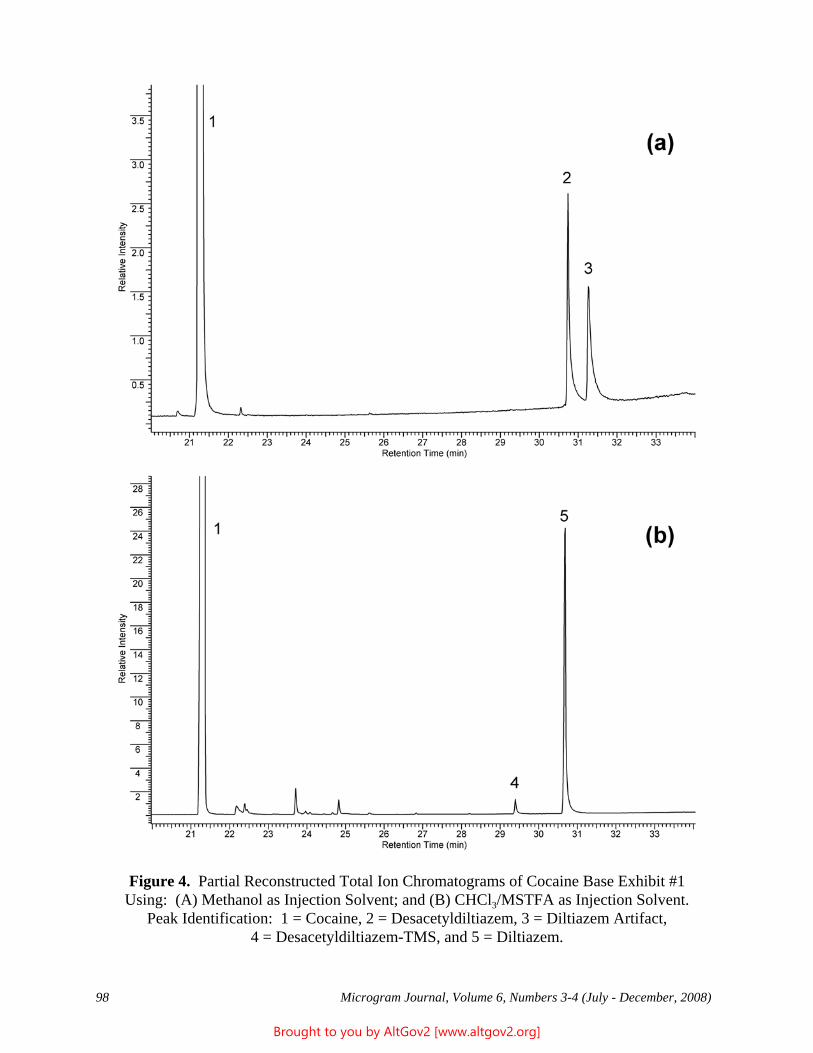
98 Microgram Journal, Volume 6, Numbers 3-4 (July - December, 2008)
Figure 4. Partial Reconstructed Total Ion Chromatograms of Cocaine Base Exhibit #1Using: (A) Methanol as Injection Solvent; and (B) CHCl3/MSTFA as Injection Solvent.
Peak Identification: 1 = Cocaine, 2 = Desacetyldiltiazem, 3 = Diltiazem Artifact,4 = Desacetyldiltiazem-TMS, and 5 = Diltiazem.
Brought to you by AltGov2 [www.altgov2.org]
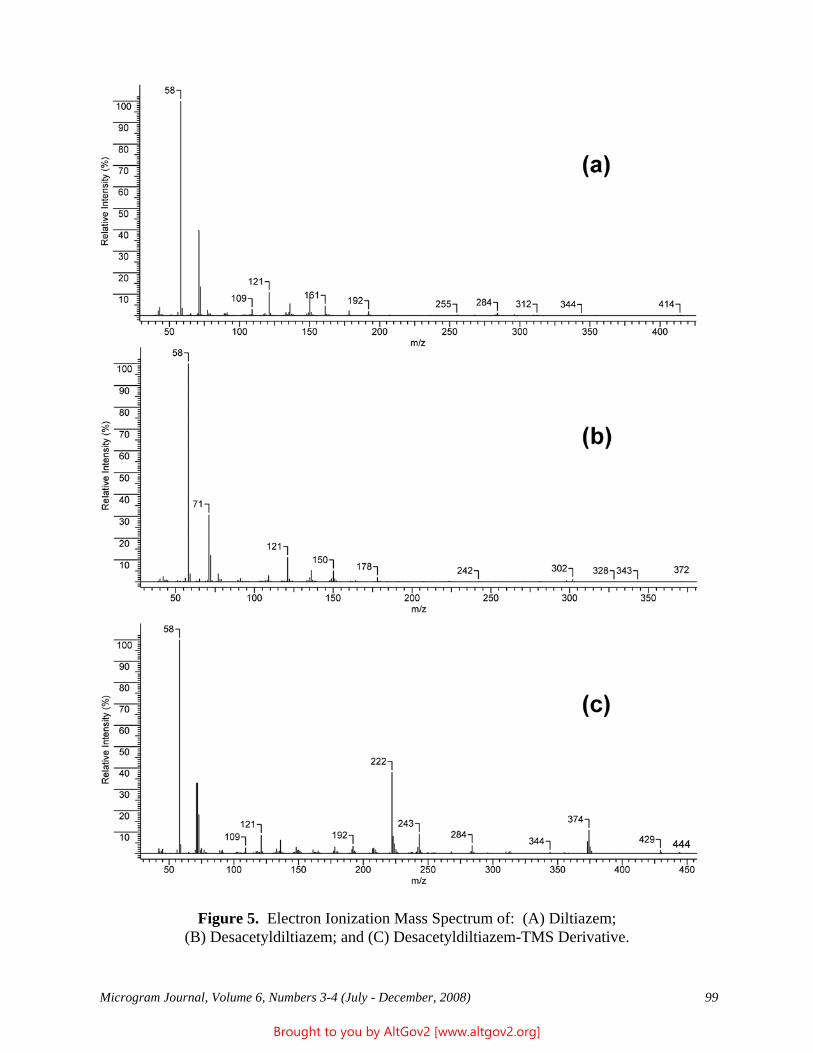
Microgram Journal, Volume 6, Numbers 3-4 (July - December, 2008) 99
Figure 5. Electron Ionization Mass Spectrum of: (A) Diltiazem;(B) Desacetyldiltiazem; and (C) Desacetyldiltiazem-TMS Derivative.
Brought to you by AltGov2 [www.altgov2.org]
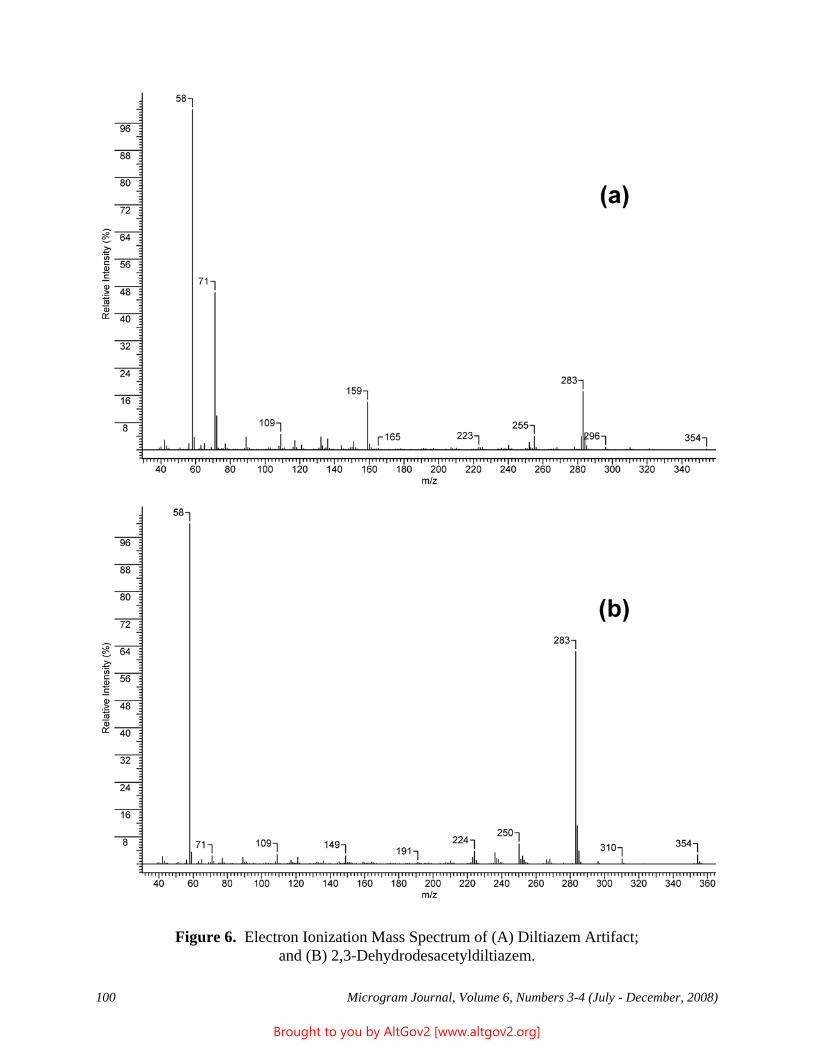
100 Microgram Journal, Volume 6, Numbers 3-4 (July - December, 2008)
Figure 6. Electron Ionization Mass Spectrum of (A) Diltiazem Artifact;and (B) 2,3-Dehydrodesacetyldiltiazem.
Brought to you by AltGov2 [www.altgov2.org]
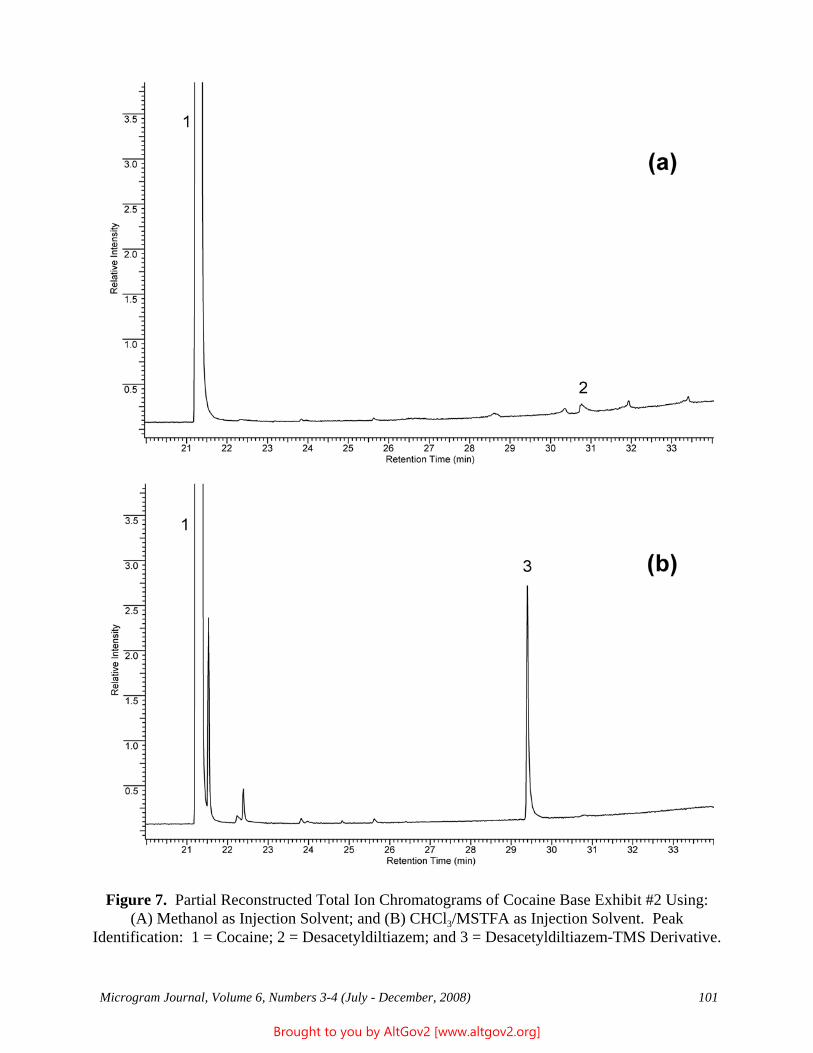
Microgram Journal, Volume 6, Numbers 3-4 (July - December, 2008) 101
Figure 7. Partial Reconstructed Total Ion Chromatograms of Cocaine Base Exhibit #2 Using:(A) Methanol as Injection Solvent; and (B) CHCl3/MSTFA as Injection Solvent. Peak
Identification: 1 = Cocaine; 2 = Desacetyldiltiazem; and 3 = Desacetyldiltiazem-TMS Derivative.
Brought to you by AltGov2 [www.altgov2.org]
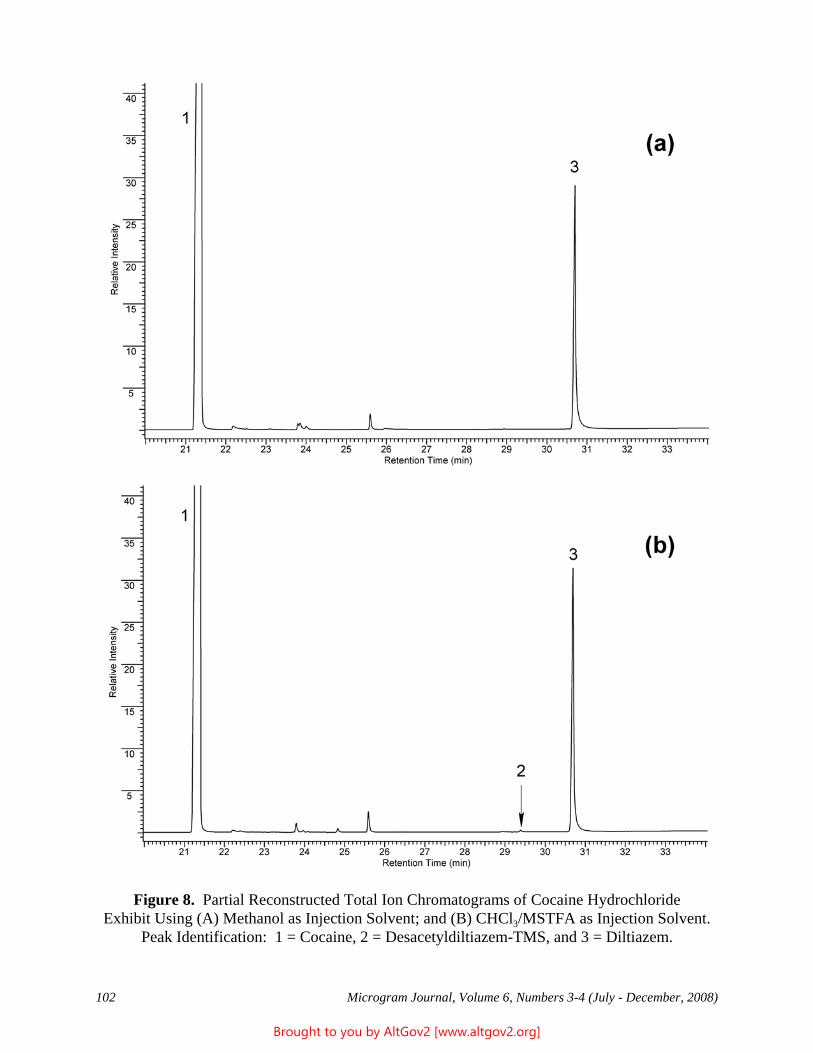
102 Microgram Journal, Volume 6, Numbers 3-4 (July - December, 2008)
Figure 8. Partial Reconstructed Total Ion Chromatograms of Cocaine HydrochlorideExhibit Using (A) Methanol as Injection Solvent; and (B) CHCl3/MSTFA as Injection Solvent.
Peak Identification: 1 = Cocaine, 2 = Desacetyldiltiazem-TMS, and 3 = Diltiazem.
Brought to you by AltGov2 [www.altgov2.org]
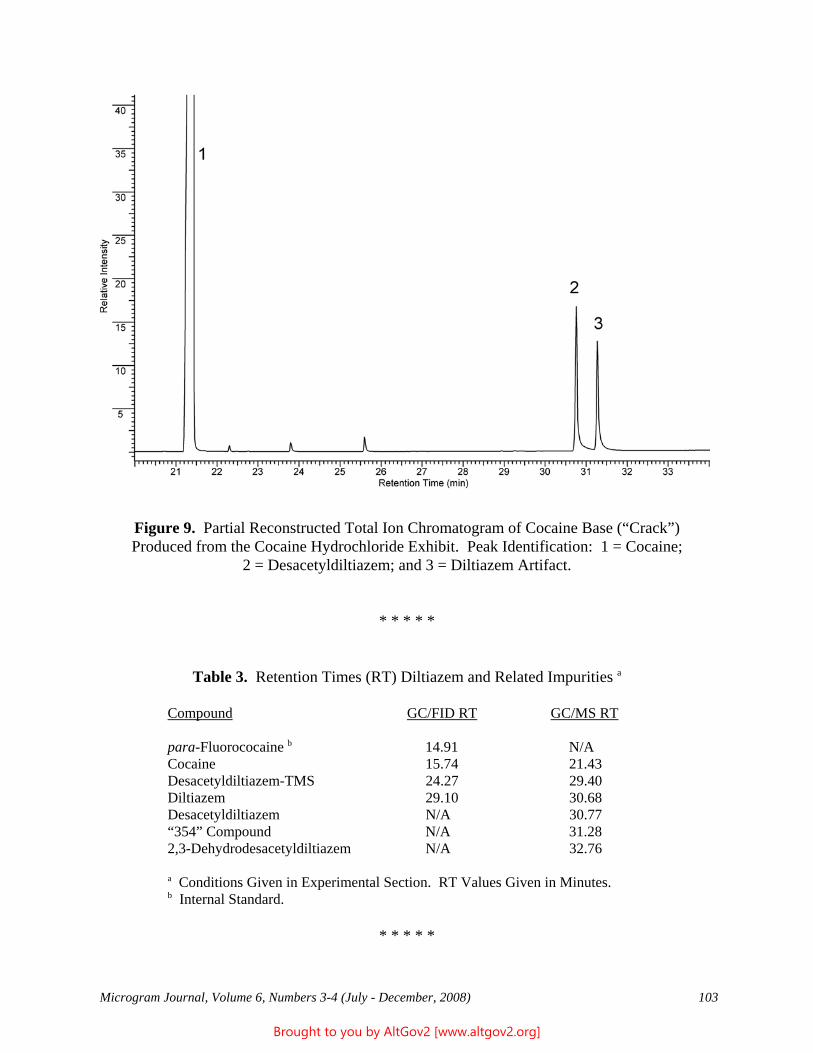
Microgram Journal, Volume 6, Numbers 3-4 (July - December, 2008) 103
Figure 9. Partial Reconstructed Total Ion Chromatogram of Cocaine Base (“Crack”)Produced from the Cocaine Hydrochloride Exhibit. Peak Identification: 1 = Cocaine;
2 = Desacetyldiltiazem; and 3 = Diltiazem Artifact.
* * * * *
Table 3. Retention Times (RT) Diltiazem and Related Impurities a
Compound GC/FID RT GC/MS RT
para-Fluorococaine b 14.91 N/ACocaine 15.74 21.43Desacetyldiltiazem-TMS 24.27 29.40Diltiazem 29.10 30.68Desacetyldiltiazem N/A 30.77“354” Compound N/A 31.282,3-Dehydrodesacetyldiltiazem N/A 32.76
a Conditions Given in Experimental Section. RT Values Given in Minutes.b Internal Standard.
* * * * *
Brought to you by AltGov2 [www.altgov2.org]
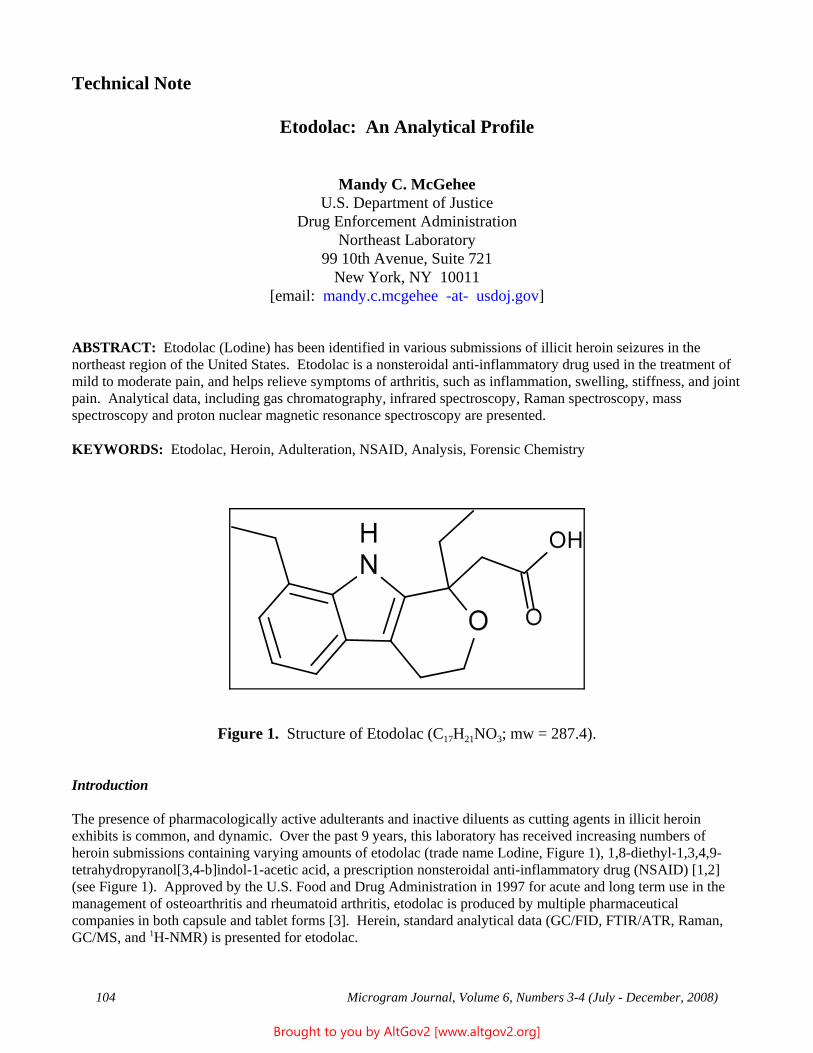
104 Microgram Journal, Volume 6, Numbers 3-4 (July - December, 2008)
Technical Note
Etodolac: An Analytical Profile
Mandy C. McGeheeU.S. Department of Justice
Drug Enforcement AdministrationNortheast Laboratory
99 10th Avenue, Suite 721New York, NY 10011
[email: mandy.c.mcgehee -at- usdoj.gov]
ABSTRACT: Etodolac (Lodine) has been identified in various submissions of illicit heroin seizures in thenortheast region of the United States. Etodolac is a nonsteroidal anti-inflammatory drug used in the treatment ofmild to moderate pain, and helps relieve symptoms of arthritis, such as inflammation, swelling, stiffness, and jointpain. Analytical data, including gas chromatography, infrared spectroscopy, Raman spectroscopy, massspectroscopy and proton nuclear magnetic resonance spectroscopy are presented.
KEYWORDS: Etodolac, Heroin, Adulteration, NSAID, Analysis, Forensic Chemistry
Figure 1. Structure of Etodolac (C17H21NO3; mw = 287.4).
Introduction
The presence of pharmacologically active adulterants and inactive diluents as cutting agents in illicit heroinexhibits is common, and dynamic. Over the past 9 years, this laboratory has received increasing numbers ofheroin submissions containing varying amounts of etodolac (trade name Lodine, Figure 1), 1,8-diethyl-1,3,4,9-tetrahydropyranol[3,4-b]indol-1-acetic acid, a prescription nonsteroidal anti-inflammatory drug (NSAID) [1,2](see Figure 1). Approved by the U.S. Food and Drug Administration in 1997 for acute and long term use in themanagement of osteoarthritis and rheumatoid arthritis, etodolac is produced by multiple pharmaceuticalcompanies in both capsule and tablet forms [3]. Herein, standard analytical data (GC/FID, FTIR/ATR, Raman,GC/MS, and 1H-NMR) is presented for etodolac.
Brought to you by AltGov2 [www.altgov2.org]
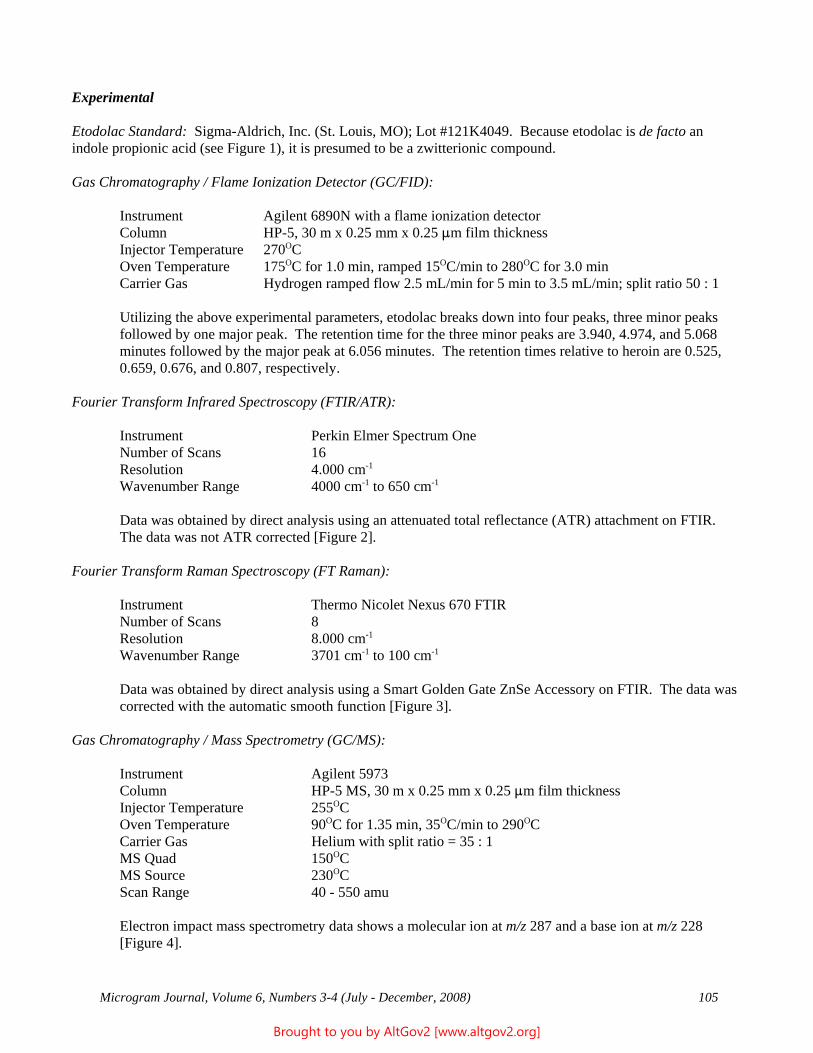
Microgram Journal, Volume 6, Numbers 3-4 (July - December, 2008) 105
Experimental
Etodolac Standard: Sigma-Aldrich, Inc. (St. Louis, MO); Lot #121K4049. Because etodolac is de facto anindole propionic acid (see Figure 1), it is presumed to be a zwitterionic compound.
Gas Chromatography / Flame Ionization Detector (GC/FID):
Instrument Agilent 6890N with a flame ionization detectorColumn HP-5, 30 m x 0.25 mm x 0.25 :m film thickness Injector Temperature 270OCOven Temperature 175OC for 1.0 min, ramped 15OC/min to 280OC for 3.0 minCarrier Gas Hydrogen ramped flow 2.5 mL/min for 5 min to 3.5 mL/min; split ratio 50 : 1
Utilizing the above experimental parameters, etodolac breaks down into four peaks, three minor peaksfollowed by one major peak. The retention time for the three minor peaks are 3.940, 4.974, and 5.068minutes followed by the major peak at 6.056 minutes. The retention times relative to heroin are 0.525,0.659, 0.676, and 0.807, respectively.
Fourier Transform Infrared Spectroscopy (FTIR/ATR):
Instrument Perkin Elmer Spectrum OneNumber of Scans 16Resolution 4.000 cm-1
Wavenumber Range 4000 cm-1 to 650 cm-1
Data was obtained by direct analysis using an attenuated total reflectance (ATR) attachment on FTIR. The data was not ATR corrected [Figure 2].
Fourier Transform Raman Spectroscopy (FT Raman):
Instrument Thermo Nicolet Nexus 670 FTIRNumber of Scans 8Resolution 8.000 cm-1
Wavenumber Range 3701 cm-1 to 100 cm-1
Data was obtained by direct analysis using a Smart Golden Gate ZnSe Accessory on FTIR. The data wascorrected with the automatic smooth function [Figure 3].
Gas Chromatography / Mass Spectrometry (GC/MS):
Instrument Agilent 5973Column HP-5 MS, 30 m x 0.25 mm x 0.25 :m film thickness Injector Temperature 255OCOven Temperature 90OC for 1.35 min, 35OC/min to 290OCCarrier Gas Helium with split ratio = 35 : 1MS Quad 150OCMS Source 230OCScan Range 40 - 550 amu
Electron impact mass spectrometry data shows a molecular ion at m/z 287 and a base ion at m/z 228[Figure 4].
Brought to you by AltGov2 [www.altgov2.org]
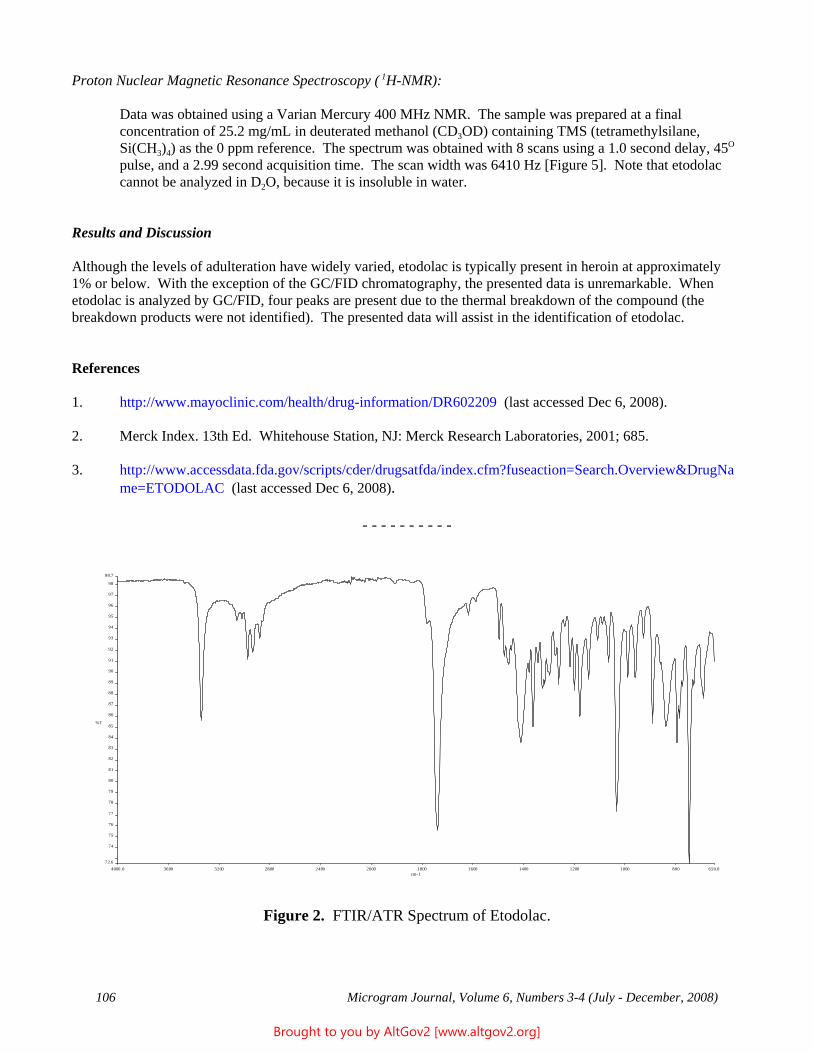
106 Microgram Journal, Volume 6, Numbers 3-4 (July - December, 2008)
Proton Nuclear Magnetic Resonance Spectroscopy ( 1H-NMR):
Data was obtained using a Varian Mercury 400 MHz NMR. The sample was prepared at a finalconcentration of 25.2 mg/mL in deuterated methanol (CD3OD) containing TMS (tetramethylsilane,Si(CH3)4) as the 0 ppm reference. The spectrum was obtained with 8 scans using a 1.0 second delay, 45O
pulse, and a 2.99 second acquisition time. The scan width was 6410 Hz [Figure 5]. Note that etodolaccannot be analyzed in D2O, because it is insoluble in water.
Results and Discussion
Although the levels of adulteration have widely varied, etodolac is typically present in heroin at approximately1% or below. With the exception of the GC/FID chromatography, the presented data is unremarkable. Whenetodolac is analyzed by GC/FID, four peaks are present due to the thermal breakdown of the compound (thebreakdown products were not identified). The presented data will assist in the identification of etodolac.
References
1. http://www.mayoclinic.com/health/drug-information/DR602209 (last accessed Dec 6, 2008).
2. Merck Index. 13th Ed. Whitehouse Station, NJ: Merck Research Laboratories, 2001; 685.
3. http://www.accessdata.fda.gov/scripts/cder/drugsatfda/index.cfm?fuseaction=Search.Overview&DrugName=ETODOLAC (last accessed Dec 6, 2008).
- - - - - - - - - -
Figure 2. FTIR/ATR Spectrum of Etodolac.
4000.0 3600 3200 2800 2400 2000 1800 1600 1400 1200 1000 800 650.072.6
74
75
76
77
78
79
80
81
82
83
84
85
86
87
88
89
90
91
92
93
94
95
96
97
98
98.7
cm-1
%T
Brought to you by AltGov2 [www.altgov2.org]
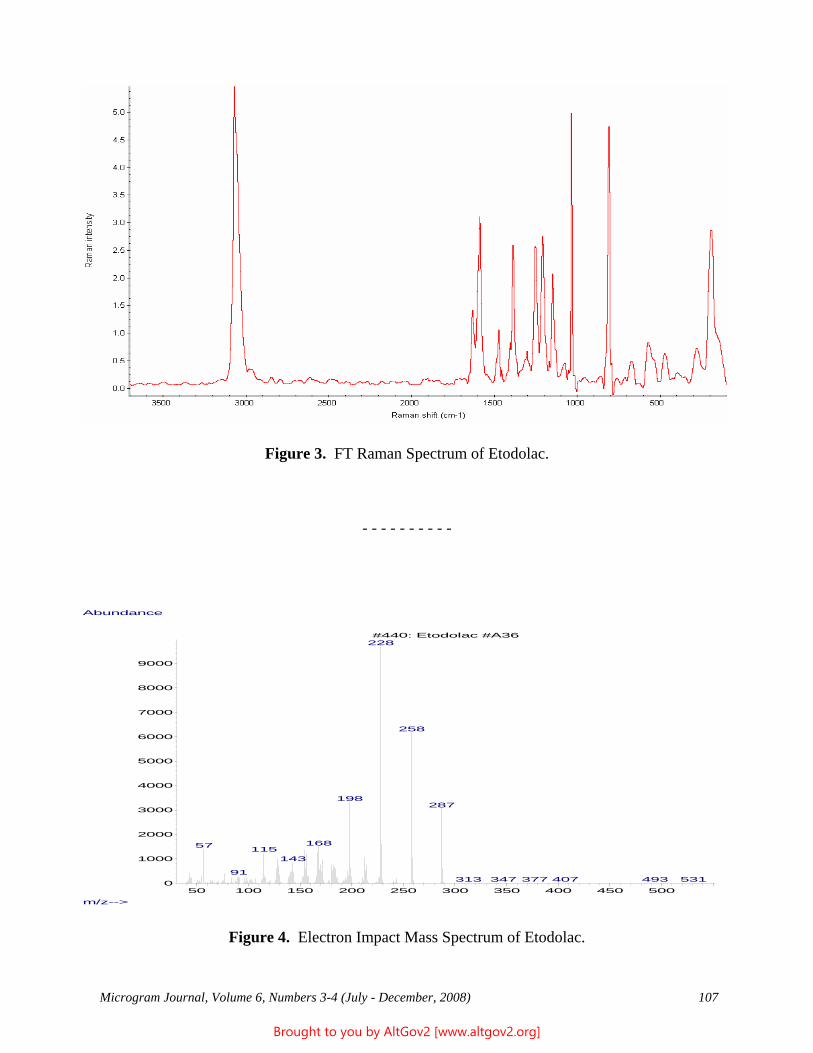
Microgram Journal, Volume 6, Numbers 3-4 (July - December, 2008) 107
Figure 3. FT Raman Spectrum of Etodolac.
- - - - - - - - - -
Figure 4. Electron Impact Mass Spectrum of Etodolac.
50 100 150 200 250 300 350 400 450 5000
1000
2000
3000
4000
5000
6000
7000
8000
9000
m/z-->
Abundance
#440: Etodolac #A36228
258
198287
16857 115143
91313 407347 377 493 531
Brought to you by AltGov2 [www.altgov2.org]
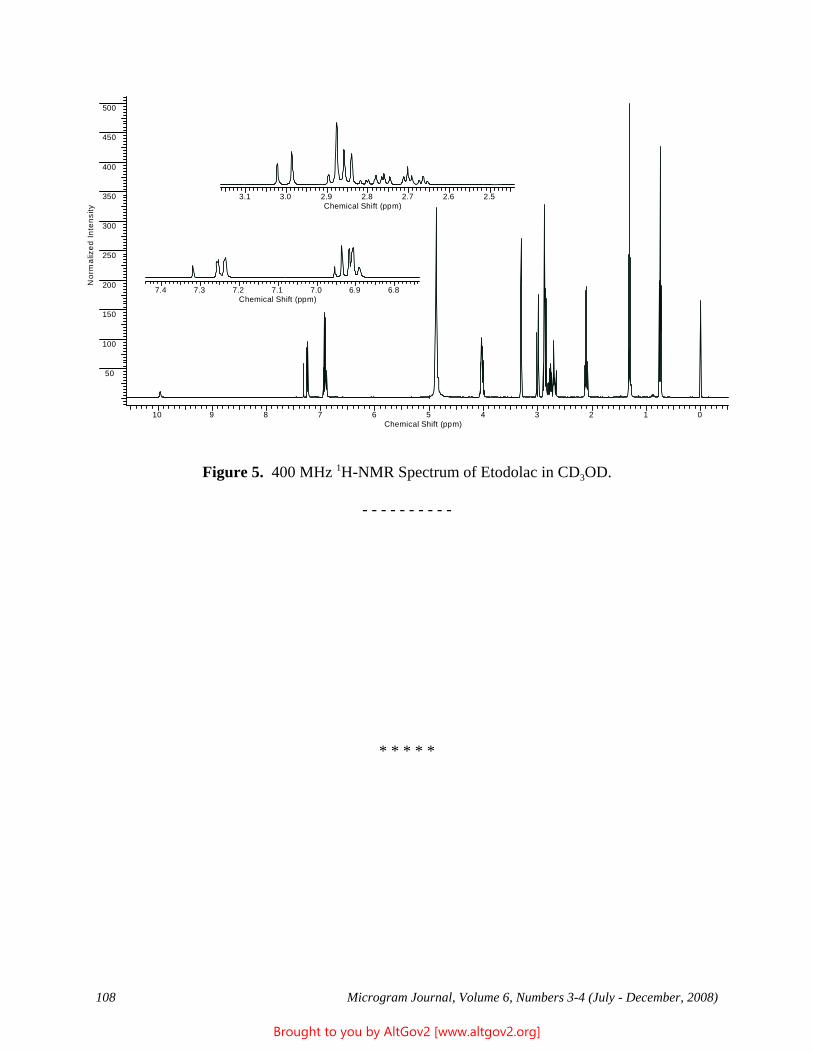
108 Microgram Journal, Volume 6, Numbers 3-4 (July - December, 2008)
Figure 5. 400 MHz 1H-NMR Spectrum of Etodolac in CD3OD.
- - - - - - - - - -
* * * * *
10 9 8 7 6 5 4 3 2 1 0Chemical Shift (ppm)
50
100
150
200
250
300
350
400
450
500
Nor
mal
ized
Inte
nsity
7.4 7.3 7.2 7.1 7.0 6.9 6.8Chemical Shift (ppm)
3.1 3.0 2.9 2.8 2.7 2.6 2.5Chemical Shift (ppm)
Brought to you by AltGov2 [www.altgov2.org]
Microgram Journal, Volume 6, Numbers 3-4 (July - December, 2008) 109
Technical Note
Determination of Cocaine in Various SouthAmerican Commercial Coca Products
Elizabeth M. Corbeil,* Ph.D., and John F. Casale, B.S.U.S. Department of Justice
Drug Enforcement AdministrationSpecial Testing and Research Laboratory
22624 Dulles Summit CourtDulles, VA 20166
[email withheld at author’s request]
ABSTRACT: Cocaine content is provided for several coca products including coca tea, medicinal tonics andrubs, and alcohol. Although these products are legal in most of South America, they are considered controlledsubstances in the United States and in most other countries. The cocaine was separated from complex matricesutilizing trap column chromatography. Gas chromatography / mass spectrometry / selective ion monitoring wasused for cocaine identification and quantitation. The amount of cocaine in for these products ranges from 0.00 -0.65 :g/mg.
KEYWORDS: Cocaine, Coca Products, Quantitation, Mass Spectrometry, Selective Ion Monitoring, ForensicChemistry
Introduction
Although cocaine is controlled virtually worldwide, coca is legitimately cultivated in the South Americancountries of Peru and Bolivia. While it is illegal to extract the cocaine from the coca leaf in all of these counties,the coca leaf and various coca leaf extracts have long been legally used to relieve fatigue, hunger, and providenutritional value. Along these lines, Duke et al. determined that ingesting coca leaves met the recommendeddietary allowance for calcium, iron, phosphorous, vitamin A, vitamin B, and vitamin E [1]. Traditional SouthAmerican medicine also uses coca leaf to alleviate headaches, rheumatism, abrasions, malaria, ulcers, asthma, andparasites, and studies have shown that several of these traditional treatments are valid [2].
However, in the United States and in many other countries, it is illegal to obtain, possess, or use coca products. The U.S. Code of Federal Regulations (CFR) lists coca leaves and any derivative or preparation of coca leaves asSchedule II substances [3]. The CFR excludes substances that contain de-cocainized coca leaves and leaf extractsthat do not contain cocaine and ecgonine [3]. Numerous studies have quantitated the amount of cocaine andalkaloids found in coca leaf [4-7]. Studies have also determined the percent cocaine in coca tea and how it ismetabolized in the body [8-9].
Although the analyses of coca leaf, coca extracts, and illicit cocaine exhibits are routine, analyses of food,medicinal, and beauty products that contain small amounts of coca leaf or coca extracts can be challenging due tothe variety and complexity of the matrices. This investigation determined the amounts of cocaine in variousmatrices, including coca tea, medicinal tonics, rubs, alcohol, beauty products, and food products. Cocaine wasisolated from the matrices via trap column chromatography, and identified and quantitated via gaschromatography / mass spectrometry / selective ion monitoring (GC/MS/SIM).
Brought to you by AltGov2 [www.altgov2.org]
110 Microgram Journal, Volume 6, Numbers 3-4 (July - December, 2008)
Experimental
Materials: Chloroform was a product of Burdick and Jackson Laboratories (Muskegon, MI). Diethylamine(DEA) and acid-washed Celite 545 were products of Sigma-Aldrich Chemical (Milwaukee, WI). Isopropylcocaine (used as an internal standard, ISTD) was synthesized in-house [10]. All standard solutions wereprepared in 50 mL acid-washed glass volumetric vials. Trap column chromatography was performed using LabGlass columns (260 mm x 22 mm). All the commercial coca products that were analyzed in this study wereobtained from open markets in La Paz, Bolivia.
Gas Chromatography / Mass Spectrometry / Selective Ion Monitoring (GC/MS/SIM): Analyses were performedusing an Agilent (Palo Alto, CA) Model 5973 quadrupole mass selective detector (MSD) interfaced with anAgilent Model 6890 gas chromatograph. The GC was fitted with a 30 m x 0.25 mm ID fused silica capillarycolumn coated with 0.25 :m DB-1 (J&W Scientific, Rancho Cordova, CA). The oven temperature wasprogrammed as follows: Initial temperature 100OC; initial hold 0.0 min; program rate 6.0OC/min; finaltemperature 300OC; final hold 5.67 min. The injector was operated in the split mode (21.5 : 1) at 280OC. TheMSD was operated in selective ion monitoring (SIM) mode. The fragment ions 82.1, 182.1, and 303.2 Daltonswere monitored with a 500 millisecond dwell time for cocaine. The fragment ions 82.1, 210.2, and 331.2 Daltonswere monitored with a 500 millisecond dwell time for isopropylcocaine. The auxiliary transfer line to the MSDand the source were maintained at 280OC and 230OC, respectively.
Standard Solutions for Quantitative Determination of Cocaine: Individual CHCl3 solutions each containing 22.50:g/mL of isopropylcocaine and 9.90, 20.62, 25.57, 30.51, 35.47, and 41.24 :g/mL of cocaine base, respectively,were prepared. Linearity was confirmed over the concentration ranges; linear regression analysis determined thecorrelation coefficient (R2) as exceeding 0.996.
Sample Preparation and Extractions: Cocaine was isolated from wax-like, aqueous, and candy-like cocaproducts utilizing a slight modification of the trap column chromatography utilized by Moore et al. [5].
Wax-Like Samples: Between 500 - 1000 mg of wax-like samples were dissolved in 1 mL of CHCl3 containing22.50 :g/mL of isopropylcocaine and 1 mL of water-saturated CHCl3 (hereafter WSC). This solution wasvortexed and then placed onto a glass chromatographic column containing 4 g of Celite 545 mixed with 2 mL of0.36 N sulfuric acid. The column was eluted with 50 mL of WSC (discarded) followed by 50 mL WSCcontaining 500 :L DEA (collected and evaporated in vacuo to a residue). The residue was reconstituted inapproximately 1 mL of CHCl3, dried over anhydrous sodium sulfate, filtered, and examined via GC/MS/SIM.
Aqueous Samples: Between 2 - 10 mL of liquid samples were evaporated in vacuo to a residue. The residue wasreconstituted in a mixture of 1 mL of CHCl3, 1 mL of the CHCl3 containing 22.50 :g isopropylcocaine, and 3drops of water. This solution was placed onto a glass chromatographic column containing 4 g of Celite 545mixed with 2 mL of 0.36 N sulfuric acid. The cocaine from these samples was isolated and analyzed in the samemanner as detailed above under “Wax-Like Samples.”
Candy Samples: Two pieces (approximately 8 g) of candy were ground and dissolved in water (approximately 2mL). The solution was basified with saturated NaOH until pH 8 - 9, and the cocaine was extracted with 1 mL ofCHCl3 containing 22.50 :g isopropylcocaine and placed onto a glass chromatographic column containing 4 g ofCelite 545 mixed with 2 mL of 0.36 N sulfuric acid. The cocaine from these samples was isolated and analyzedin the same manner as detailed above under “Wax-Like Samples.”
Leaf, Vitamin, and Alcohol Samples: Cocaine was isolated from coca tea and the coca vitamin by weighingapproximately 2 mg directly into a GC vial containing 1 mL of CHCl3 containing 22.50 :g of isopropylcocaineand 250 :L of DEA. The samples were examined via GC/MS/SIM. A 250 :L aliquot of the alcohol sample wasadded to 1 mL of CHCl3 containing 22.50 :g of isopropylcocaine spiked with 50 :L of DEA.
Brought to you by AltGov2 [www.altgov2.org]
Microgram Journal, Volume 6, Numbers 3-4 (July - December, 2008) 111
Results and Discussion
Two typical GC/MS/SIM chromatograms are shown in Figure 1. Figure 1a (Vitamins) illustrates a relatively lowconcentration of cocaine, while Figure 1b (Medicinal Tonic) illustrates a significant quantity of cocaine. Collectively, the analyses indicated that the products contained from 0.00 - 0.65 :g/mg cocaine (Table 1). Thecocaine (if any) in the shampoo could not be determined due to the difficulty of isolating cocaine from thismatrix. In addition, one of the alcohol products did not contain cocaine (see below). The appearance andmanufacturer of all of the aqueous medicinal tonics was the same; their cocaine content ranged from 0.01 - 0.38:g/mg, indicating that there were significant differences in the amount of coca leaf added to each product. All ofthe medicinal rubs had the same waxy appearance and a strong odor of coca leaf; their cocaine content rangedfrom 0.01 - 0.10 :g/mg (relatively low). Visual inspection of these latter products confirmed that only smallamounts of particles were distributed (unevenly) throughout the waxy matrix. The cocaine content in the teas andthe ground leaf samples ranged from 0.46 - 0.65 :g/mg. The cocaine content of the ground leaf and tea sampleswere consistent with coca leaf [4-7]. Both candy samples were brown, sticky substances that smelled similar tococa leaf; one had the consistency of chewing gum, while the other was more like a hard candy. They weredetermined to contain 0.003 - 0.01 :g/mg cocaine. The Ajayu de Coca Pachamama (liquor) was a clear liquidwith a distinct alcohol smell. Despite its suggestive name, this product did not contain cocaine. The RonFernando Ron De Coca (liquor) was a green liquid that smelled similar to coca leaf and alcohol; it contained 0.22:g/mg of cocaine.
Conclusions
Trap column chromatography can be utilized to isolate cocaine from complex bulk matrices. The utilization ofGC/MS/SIM, coupled with a structurally related internal standard, gave excellent sensitivity and linearity, andcould determine cocaine content down to the microgram per gram level. Utilizing the described methodology,cocaine was readily detected and determined in all the commercial products except for a shampoo and onealcoholic liquor. In the case of coca leaf, the described method was able to determine cocaine content from aslittle as 2 milligrams of sample.
References
1. Duke JA, Aulik D, Plowman T. Nutritional value of coca. Botanical Museum Leaflets HarvardUniversity 1975;24(6):113-8.
2. Weil AT. The therapeutic value of coca in contemporary medicine. Journal of Ethnopharmacology 1981;3(2-3):367-76.
3. Code of Federal Regulations 2002;21(1308.12):85.
4. Holmstedt B, Jaatmaa E, Leander K, Plowman T. Determination of cocaine in some South Americanspecies of Erythroxylum using mass fragmentation. Phytochemistry 1977;16:1753-5.
5. Moore JM, Casale JF, Klein RFX, Cooper DA, Lydon J. Determination and in-depth chromatographicanalyses of alkaloids in South America and greenhouse cultivated coca leaves. Journal ofChromatography A 1994;659:163-75.
6. Plowman T, Rivier L. Cocaine and cinnamoylcocaine content of Erythroxylum species. Annals ofBotany 1983;51:641-59.
Brought to you by AltGov2 [www.altgov2.org]
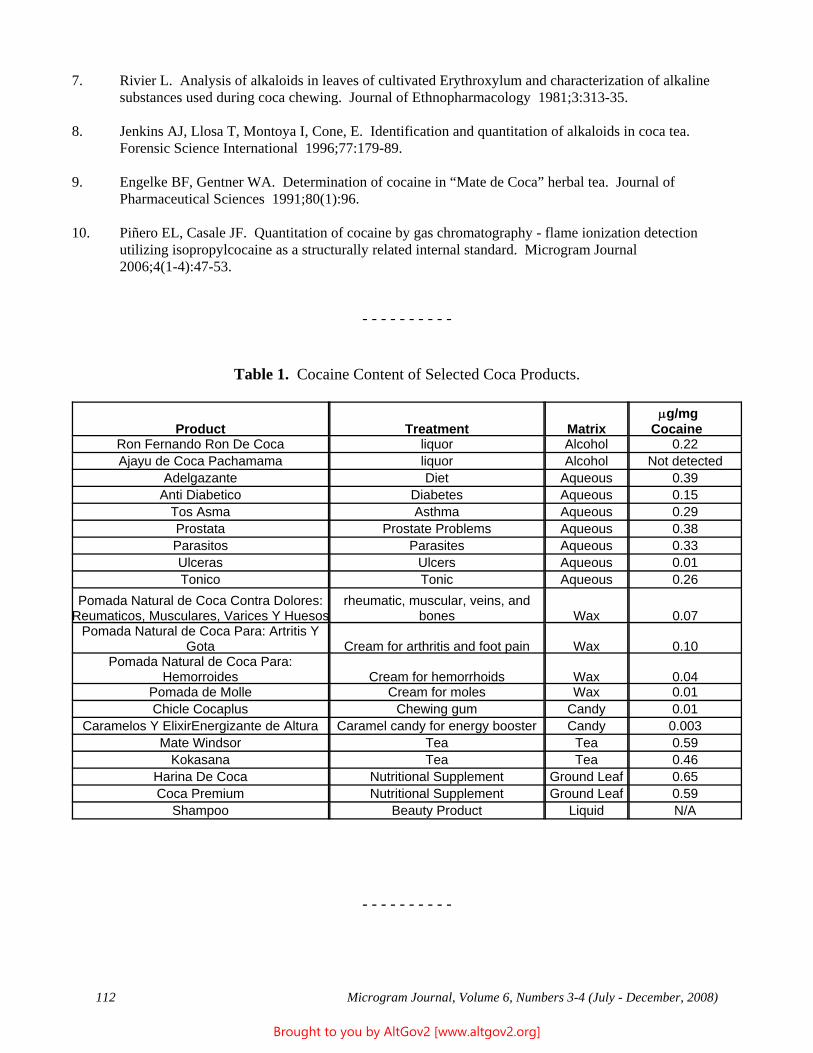
112 Microgram Journal, Volume 6, Numbers 3-4 (July - December, 2008)
7. Rivier L. Analysis of alkaloids in leaves of cultivated Erythroxylum and characterization of alkalinesubstances used during coca chewing. Journal of Ethnopharmacology 1981;3:313-35.
8. Jenkins AJ, Llosa T, Montoya I, Cone, E. Identification and quantitation of alkaloids in coca tea. Forensic Science International 1996;77:179-89.
9. Engelke BF, Gentner WA. Determination of cocaine in “Mate de Coca” herbal tea. Journal ofPharmaceutical Sciences 1991;80(1):96.
10. Piñero EL, Casale JF. Quantitation of cocaine by gas chromatography - flame ionization detectionutilizing isopropylcocaine as a structurally related internal standard. Microgram Journal 2006;4(1-4):47-53.
- - - - - - - - - -
Table 1. Cocaine Content of Selected Coca Products.
Product Treatment Matrix μg/mg
CocaineRon Fernando Ron De Coca liquor Alcohol 0.22Ajayu de Coca Pachamama liquor Alcohol Not detected
Adelgazante Diet Aqueous 0.39Anti Diabetico Diabetes Aqueous 0.15
Tos Asma Asthma Aqueous 0.29Prostata Prostate Problems Aqueous 0.38Parasitos Parasites Aqueous 0.33Ulceras Ulcers Aqueous 0.01Tonico Tonic Aqueous 0.26
Pomada Natural de Coca Contra Dolores:Reumaticos, Musculares, Varices Y Huesos
rheumatic, muscular, veins, andbones Wax 0.07
Pomada Natural de Coca Para: Artritis YGota Cream for arthritis and foot pain Wax 0.10
Pomada Natural de Coca Para:Hemorroides Cream for hemorrhoids Wax 0.04
Pomada de Molle Cream for moles Wax 0.01Chicle Cocaplus Chewing gum Candy 0.01
Caramelos Y ElixirEnergizante de Altura Caramel candy for energy booster Candy 0.003Mate Windsor Tea Tea 0.59
Kokasana Tea Tea 0.46Harina De Coca Nutritional Supplement Ground Leaf 0.65Coca Premium Nutritional Supplement Ground Leaf 0.59
Shampoo Beauty Product Liquid N/A
- - - - - - - - - -
Brought to you by AltGov2 [www.altgov2.org]
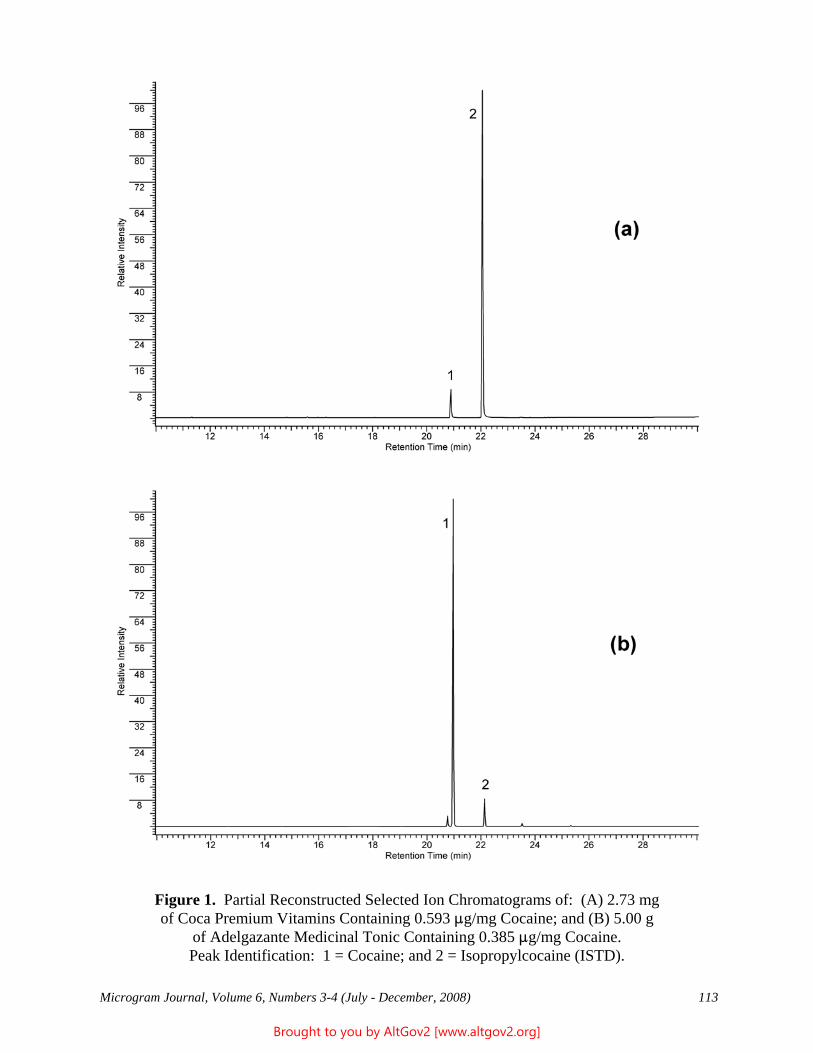
Microgram Journal, Volume 6, Numbers 3-4 (July - December, 2008) 113
Figure 1. Partial Reconstructed Selected Ion Chromatograms of: (A) 2.73 mgof Coca Premium Vitamins Containing 0.593 :g/mg Cocaine; and (B) 5.00 g
of Adelgazante Medicinal Tonic Containing 0.385 :g/mg Cocaine.Peak Identification: 1 = Cocaine; and 2 = Isopropylcocaine (ISTD).
Brought to you by AltGov2 [www.altgov2.org]
114 Microgram Journal, Volume 6, Numbers 3-4 (July - December, 2008)
“Crack” Cocaine: A Study of Stability over Time and Temperature
Laura M. Jones, B.S.,* Danielle K. Boudreau, B.S., and John F. Casale, B.S.U.S. Department of Justice
Drug Enforcement AdministrationSpecial Testing and Research Laboratory
22624 Dulles Summit CourtDulles, VA 20166
[email address withheld at author’s request]
ABSTRACT: Changes in the appearance, weights, purity levels, and alkaloidal profiles of 146 laboratory-prepared “crack” cocaine exhibits stored under different temperatures and packaging types, were studied over aone year period. An accelerated aging study (elevated temperature, one month) was also performed with 2“crack” cocaine exhibits, to simulate very long-term or higher temperature storage. The results indicate thathigher purity “crack” that was prepared by the classic method is reasonably stable over 12 months if stored at orbelow 20OC, irrespective of incidental moisture and/or packaging type. However, extended storage times and/orelevated temperatures can result in weight loss and/or degradation, especially for samples sealed in plastic bags orheat-sealed evidence envelopes.
KEYWORDS: Cocaine, “Crack,” Stability, Storage, Degradation, Weight Loss, Forensic Chemistry
Introduction
Cocaine base, commonly referred to as “crack,” is a major drug of abuse. Forensic drug analysts routinelyanalyze “crack” exhibits and present their findings in court. Over the past 20 years, many instances of weight lossand degradation of stored “crack” exhibits have been noted, especially for exhibits stored for long time frames orunder non-ideal conditions. Such changes can be an issue for forensic chemists when testifying at trial,particularly if the original results are not in agreement with reanalyses that were conducted within the samelaboratory, at a different forensic laboratory, or independently by chemists employed by the defense.
Weight changes in cocaine hydrochloride exhibits have been previously studied, with research concluding thatweight gain is often due to water absorption associated with packaging [1]. Cocaine hydrochloride degradationprocesses have also been previously studied, and the resulting products have been characterized [2-5]. Thestability of cocaine hydrochloride in aqueous solutions has also been extensively researched [6-8]. Minoralkaloids present in illicit cocaine exhibits, such as the truxillines, have also been examined for stability over time,with the conclusion that a direct relationship exists between the sample age and the increased levels of thetruxilline degradation products, i.e., the truxillic and truxinic acids [9].
However, a search of the literature found no studies on the stability of “crack” cocaine, or the products resultingfrom the degradation of “crack.” In this study, the stability of “crack” was monitored in two independentexperiments. In the first, 146 prepared samples were stored for one year at three different temperatures (roomtemperature (20OC), refrigerator (5OC), and freezer (-5OC)) and two different types of packaging (standard zip-lock plastic bags and Heat Sealed Evidence Envelopes (HSEEs)). In this case, the exhibits were examined forweight loss, changes in purity, and degradation on a monthly basis. In the second experiment, two preparedsamples were stored for one month at 65OC, one unsealed and one sealed in a zip-lock plastic bag. The elevatedtemperature was used to simulate very long term storage. In the latter case, the exhibits were analyzed at the startand finish only.
Brought to you by AltGov2 [www.altgov2.org]
Microgram Journal, Volume 6, Numbers 3-4 (July - December, 2008) 115
For the one year study, the “crack” was prepared via the “classical” technique. In this method, cocainehydrochloride is dissolved in water, and an alkaline substance such as sodium bicarbonate or sodium carbonate isadded to precipitate cocaine base. The solution is brought to a boil, and the cocaine base melts and forms an oilthat pools on the bottom of the container. The solution is cooled, and the oil solidifies, allowing the water layer tobe poured off. For the one month (high temperature) study, the “crack” was prepared via the productiontechnique known by the street term “whipping.” In this method, water is “whipped” into the molten cocaine baseprior to its solidification, to increase its bulk. The samples used for the one year study were processed using the“classical” method because it gives a reasonably uniform product (homogeneity is necessary for valid samplecomparisons). The samples used for the one month study were processed using the “whipping” method because itmaximizes the amount of water in the sample, and water can be considered to be the key factor in sampledegradation during extended or higher temperature storage.
Other types of “crack” production techniques, including the “microwave” method, were not employed in thisstudy because they give inhomogeneous products that contain extensive sodium bicarbonate and other processingimpurities.
Figure 1 illustrates the products resulting from the degradation of cocaine and the cinnamoylcocaines in “crack.” The amounts of benzoylecgonine and the cinnamoylecgonines were tracked to determine the extent of cocaineand cinnamoylcocaine degradation, respectively (ecgonine methyl ester and ecgonine were also quantitated, butare not reported here because they result from the degradation of both cocaine and the cinnamoylcocaines). Theamounts of tropacocaine and trimethoxycocaine present in “crack” were also tracked, because these alkaloids arekey “marker” compounds that are used in many cocaine profiling (signature) programs [2,4,5,10].
Experimental
Materials: “Crack” cocaine was produced in-house as described below, starting with uncut, illicitly preparedcocaine hydrochloride from the laboratory inventory. Pharmaceutical cocaine base (used as the quantitationstandard for all GC analyses) was obtained from Merck Chemical (Rahway, NJ). Chloroform was adistilled-in-glass product of Burdick and Jackson Laboratories (Muskegon, MI). Reagent grade diethylamine wasobtained from Sigma-Aldrich Chemical Company (Milwaukee, WI). N-Methyl-N-trimethylsilyltrifluoroacet-amide (MSTFA) was a product of Pierce Chemical (Rockford, IL). para-Fluorococaine and isopropylcocaine(both used as internal standards (ISTDs)) were synthesized in-house.
Gas Chromatograph / Flame Ionization Detection (GC/FID): Quantitative analyses of cocaine were performedusing isopropylcocaine as a structurally related ISTD [11]. An Agilent (Palo Alto, CA) Model 6890N gaschromatograph fitted with a 30 m x 0.25 mm ID fused-silica capillary column coated with 0.25 :m DB-1 (J&WScientific, Rancho Cordova, CA) was used for cocaine quantitation. An isothermal oven temperature of 250OCwas used for 7.00 min. Hydrogen (99.999 percent UHP) was the carrier gas at a flow rate of 1.1 mL/min. Theinjection port and detector were maintained at 280OC. Samples (2 :L) were injected in the split mode (25 : 1) byan Agilent 7683 Series Auto Injector. Nitrogen was used as the auxiliary make-up gas for the detector. For allquantitations, a minimum of triplicate analyses (N = 3) were performed and results are reported as the average.
Quantitative analyses of cocaine alkaloids and their degradation products were performed using a previouslydetailed chromatographic impurity signature profile analysis method [2]. Analyses were conducted using anAgilent Model 6890N gas chromatograph fitted with a 30 m x 0.25 mm ID fused-silica capillary column coatedwith 0.25 :m DB-1701 (J&W Scientific). The oven temperature was programmed as follows: Initial temperature170OC; 1 min hold; program rate 4OC/min to 200OC; program rate 6OC/min to a final temperature of 275OC; 9 minhold. Samples (1 :L) were injected in the split mode (21.3 : 1) by an Agilent 7683 Series Auto Injector. Theinjection port and flame ionization detector were maintained at 230OC and 300OC, respectively. Hydrogen(99.999 percent UHP) was the carrier gas at a flow rate of 1.1 mL/min. Nitrogen was used as the auxiliary
Brought to you by AltGov2 [www.altgov2.org]
116 Microgram Journal, Volume 6, Numbers 3-4 (July - December, 2008)
make-up gas for the detector. For all quantitations, a minimum of triplicate analyses (N = 3) were performed andresults are reported as the average.
Sample Preparation for Cocaine Quantitation: About 16 - 20 mg of cocaine base were weighed (to the nearest0.01 mg) into a 50 mL Erlenmeyer flask. Samples and standards were diluted with 20 mL of chloroformcontaining 50 :L of DEA and 5.0 mL of the isopropylcocaine ISTD solution (0.9 mg/mL) [11].
Sample Preparation for Signature Analysis: Approximately 4 - 5 mg of cocaine base was weighed (to the nearest0.01 mg) into an autosampler vial. The samples were diluted using 250 :L of the para-fluorococaine ISTDsolution (0.20 mg/mL), 250 :L of MSTFA was added, and the resulting solution was heated for 30 min at 75OC. Samples were allowed to cool to room temperature (approximately 30 min) prior to injection into the GC [2].
Production of “Crack” Cocaine for the One Year Stability Study: Approximately 2 kg of uncut cocainehydrochloride were dissolved in 10 L of water, and saturated sodium bicarbonate added until pH 8 was obtained. The solution was brought to a boil, and the cocaine base melted and settled to the bottom. The solution was thenallowed to cool, the water was poured off, and the solidified “crack” cocaine was removed and separated into twobatches. The first batch was immediately placed into plastic bags while still wet (hereafter referred to as “fresh”),while the second was allowed to “dry out” for two hours before being placed into bags (hereafter referred to as“dry”). Although packaged wet, the fresh batch did not in fact contain a significant amount of water. Each batchwas divided equally into zip-lock plastic bags and HSEEs, with approximately 4 grams of cocaine base in eachbag. The samples were weighed (to the nearest 0.1 g) for initial net weights. Samples were stored at: 20OC, 5OC,and -5OC. Approximately every 30 days, one sample from each temperature condition/package type was analyzedfor cocaine purity, weight change, and cocaine degradation.
Production of “Crack” Cocaine for the One Month (Accelerated Aging) Stability Study: Two samples wereprepared: Sample 1 - Saturated sodium bicarbonate (100 mL) was added to approximately 110 grams of illicitcocaine base in a beaker and heated. After the cocaine melted, the mixture was “whipped” to a nearly homo-geneous composition, then allowed to cool and solidify. The net weight of the resulting “whipped crack” wasdetermined, and small samples were removed to establish the starting cocaine purity and level of degradation; thebulk sample was stored in an oven at 65OC, unsealed. After one month, the net weight, purity, and degradation ofthe resulting product were determined. Sample 2 - The experiment was repeated with approximately 105 grams ofillicit cocaine base and 60 mL of water (not containing sodium bicarbonate); however, in this latter case theresulting “whipped crack” was sealed in a zip-lock plastic bag before being stored in the oven.
Results and Discussion
12 Month Study of “Classically”-Prepared Fresh and Dry “Crack” Samples
Because the “crack” samples that were prepared for the 12 month experiments were uniform, of reasonably highpurity, and contained little/no sodium bicarbonate and only incidental moisture, this study gives a “best case”scenario for stability and weight loss. The large number of samples (N = 146) allow for valid comparisons. Useof other preparative methods, or the presence of excess water, excess sodium bicarbonate, or other impurities,would have resulted in non-uniform samples and invalid comparisons (Note: Illicitly prepared “crack” samplestypically vary widely in their composition, and therefore are unsuited for a study of this type).
Moisture content did not have a significant effect on purity, weight change, and/or degradation of the samples(i.e., the fresh and dry samples did not differ significantly versus each other after 12 months). Similarly,packaging type also did not play a significant role on sample stability - samples stored in either zip-lock plasticbags or HSEEs displayed similar trends when comparing purity, weight change, and degradation.
Brought to you by AltGov2 [www.altgov2.org]
Microgram Journal, Volume 6, Numbers 3-4 (July - December, 2008) 117
Cocaine purity results were very similar across all temperatures and packaging types, with an average purity rangeof 86.0 - 86.9% for HSEE stored samples, and 85.7 - 86.8% for zip-lock plastic bag stored samples. Tables 1 and2 show the cocaine purity results for HSEE and zip-lock plastic bag stored samples, respectively.
Weight losses were highest for samples stored at room temperature, with a 2 - 5% loss after 12 months. Therewas a 2 - 3.5% loss at refrigerator temperature, and from a 0.5% loss to a 1.5% gain at freezer temperatures. Notsurprisingly, fresh samples displayed slightly greater losses than dry samples. Tables 3 and 4 show the percentweight change over 12 months for samples stored in HSEE and zip-lock plastic bags, respectively.
Various other cocaine alkaloids were also monitored. Many of these compounds are co-extracted with cocainefrom coca leaf, and are observed in most illicit cocaine exhibits [3]; others may result from the degradation ofcocaine [2]. Understanding and monitoring changes in these trace alkaloids are critical for laboratories that utilizesignature methodologies for comparative analyses of exhibits [4] or for intelligence-deriving purposes, becauseeven minor changes can impact cocaine classifications. Figure 2 contains the chromatographic profiles of “crack”cocaine stored at room temperature in HSEEs from start (Figure 2a) to finish (Figure 2b). Increases in ecgonine(peak #3), benzoylecgonine (peak #7), and cis- and trans-cinnamoylecgonine (peaks #9 and #11), are evident, asis a small decrease in trimethoxycocaine (peak #12).
Benzoylecgonine results from the hydrolysis of cocaine [2]. From start to finish, benzoylecgonine concentrationchanges for frozen samples were 0.05 - 0.10% (by weight), and for refrigerated samples 0.05 - 0.66% (by weight). Samples stored at room temperature, however, had more significant changes, 0.05 - 1.62% (by weight). Freshsamples showed a slightly higher rate of benzoylecgonine formation versus dry samples under the sameconditions; however, this rate difference was minimal compared to the effect of storage temperature. Figure 3illustrates the benzoylecgonine content in HSEEs over the 12 month study.
Cis- and trans-cinnamoylecgonine methyl esters, commonly referred to as the cinnamoylcocaines, are naturallyoccurring alkaloids that are co-extracted with cocaine from coca leaf. Degradation (hydrolysis) of thecinnamoylcocaines results in formation of cis- and trans-cinnamic acid and cis- and trans-cinnamoylecgonine. The results from this study indicate that there was a small increase in the cinnamoylecgonines. Again, thesamples stored at freezer temperatures showed the smallest increases, while those stored at room temperatureshowed the highest increases (however, the relative change was small regardless of storage temperature). Figures4 and 5 illustrate the total cinnamoylcocaine and total cinnamoylecgonine contents of “crack” stored over time inHSEEs, respectively.
Tropacocaine and trimethoxycocaine are also naturally occurring alkaloids that are co-extracted with cocainefrom coca leaf [3]. These compounds are key components in classifying the origin of cocaine exhibits [10];therefore, understanding their long-term stability is of great importance. Somewhat surprisingly, tropacocaineshowed virtually no changes during the study, regardless of storage conditions and temperatures. Table 5illustrates tropacocaine results (% by weight) for “crack” stored in HSEEs. However, trimethoxycocaine diddegrade similarly to cocaine and the cinnamoylcocaines; i.e., samples stored at freezer temperatures showed verylittle degradation versus those stored at room temperatures. Figure 6 illustrates the trimethoxycocaine results (%by weight) for samples stored in HSEEs.
Accelerated Aging Study of “Whipped Crack” Samples
The accelerated aging (elevated temperature) study was performed to simulate both extended room temperaturestorage [12] and short term storage at elevated temperatures (for example, in a law enforcement officer’s vehiclein summertime heat). As detailed in the Experimental section, two “whipped crack” exhibits were prepared andstored in an oven at 65OC, one unsealed (Sample 1) and the other sealed in a zip-lock plastic bag (Sample 2). After one month, the samples were reanalyzed for purity, weight change, and degradation. Surprisingly, Sample 1did not undergo significant degradation, with changes in alkaloid concentration very similar to the “Classical
Brought to you by AltGov2 [www.altgov2.org]
118 Microgram Journal, Volume 6, Numbers 3-4 (July - December, 2008)
Crack” samples monitored in the 12-month study. Cocaine purity actually increased almost 14% from the initialquantitation, but this increase was due to the evaporative loss of the water that was “whipped” into the sampleprior to the oven storage (the overall net weight decreased by 62.95 g, or 37.3% of the initial weight). Theresulting cocaine base remained crystalline and showed no noticeable change in color. Figures 7a and 7b showthe chromatographic profiles for the initial and final analyses, respectively. The sample did not undergosignificant cocaine degradation to benzoylecgonine (peak #7); however, increased amounts of benzoic acid (peak#1) and ecgonine (peak #3) were observed.
In contrast to Sample 1, however, Sample 2 degraded significantly, giving a thick, dark brown, molasses-likeliquid. A similar result was reported by LeBelle et al. [4], who stored a sample of cocaine hydrochloride at 60OCand at high humidity for 13 days (liquefaction was noted after the first day). Figures 8a and 8b show thechromatographic profiles for the initial and final analyses, respectively. The cocaine decreased dramatically(57.3% to less than 1%, peak #6), while the benzoylecgonine increased equally dramatically (0.06% to 44.4%,peak #7). The chromatograms also show increased concentrations of benzoic acid (peak #1), ecgonine methylester (peak #2), ecgonine (peak #3), and cis- and trans-cinnamoylecgonine (peaks #9 and #11). Thecinnamoylcocaines also degraded similarly to cocaine, resulting in elevated cinnamoylecgonines. The amount oftrimethoxycocaine was also much lower, decreasing from 0.26% to 0.06%. Tropacocaine was the only alkaloidthat did not undergo significant degradation, with results similar to the initial analysis. Table 6 compares theresults between Samples 1 and 2. Interestingly, this cocaine exhibit experienced a net weight loss similar to theunsealed exhibit, decreasing by 52.6 g or 32.5% of the initial weight (Note: Zip-lock plastic bags are notimpermeable to water vapor).
Conclusions
To prevent degradation and weight loss, “crack” is best stored at -5OC or below. However, for virtually allforensic laboratories or law enforcement agencies, such storage is not practical. Fortunately, this study indicatesthat relatively dry “crack” cocaine samples stored at room temperature may not undergo significant degradationwithin one year. However, this study used laboratory-prepared, reasonably pure samples with minimal moistureand/or sodium bicarbonate content. Retail (street) level samples that are highly adulterated or that contain excesswater or sodium bicarbonate would be expected to degrade at a faster rate. Long-term storage of “crack” in sealedpackaging (i.e., zip-lock plastic bags or HSEEs) may result in extensive cocaine degradation and significantweight loss. Similarly, even short-term storage of “crack” in sealed packaging at very elevated temperatures, suchas within the trunk of an officer’s vehicle during summer months, can result in rapid degradation and weight loss. Finally, “crack” that contains large amounts of occluded water (e.g., “whipped crack” or similar) may undergosignificant weight loss if stored unsealed, due to the evaporative loss of water.
References
1. Santos NA. Moisture absorption problems associated with the packaging of cocaine hydrochloride. Microgram 1992;25(2):28-32.*
2. Casale JF, Waggoner RW. A chromatographic impurity signature profile analysis for cocaine usingcapillary gas chromatography. Journal of Forensic Sciences 1991;36(5):1312-1330.
3. Moore JM, Casale JF. In-depth chromatographic analyses of illicit cocaine and its precursors, cocaleaves. Journal of Chromatography A 1994;674:165-205.
4. LeBelle M, Callahan S, Latham D, Lauriault G, Savard C. Comparison of illicit cocaine by determinationof minor components. Journal of Forensic Sciences 1991;36(4):1102-1120.
Brought to you by AltGov2 [www.altgov2.org]
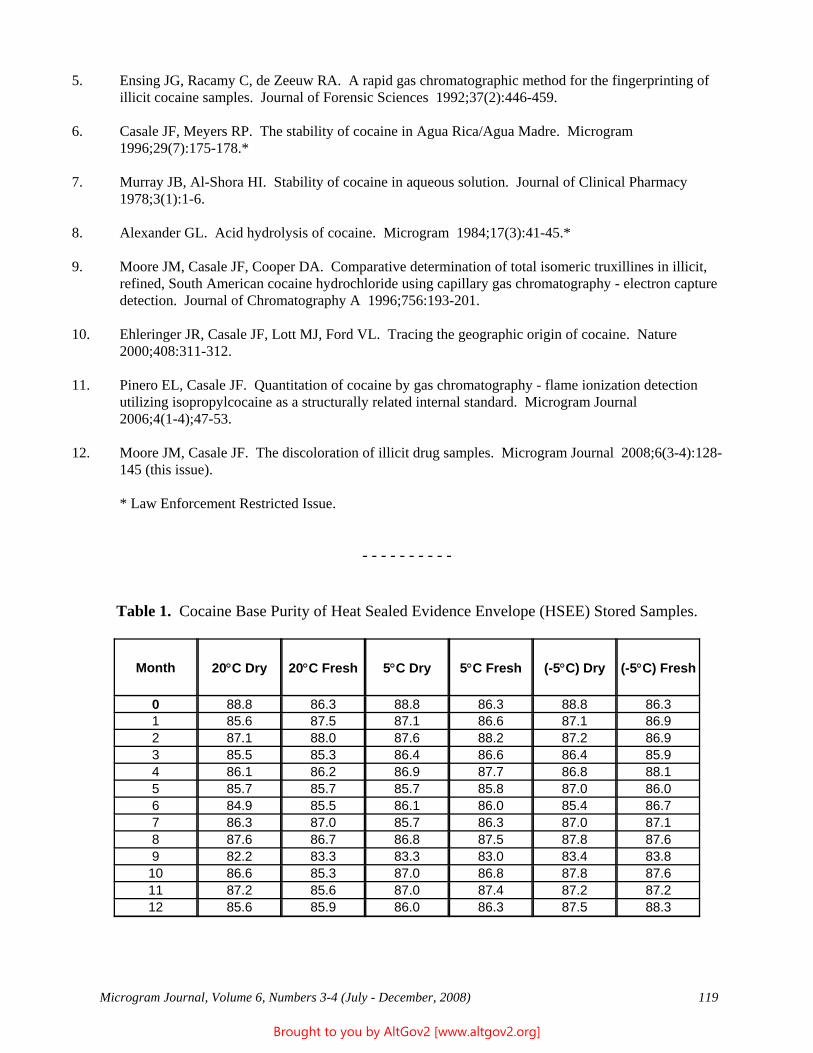
Microgram Journal, Volume 6, Numbers 3-4 (July - December, 2008) 119
5. Ensing JG, Racamy C, de Zeeuw RA. A rapid gas chromatographic method for the fingerprinting ofillicit cocaine samples. Journal of Forensic Sciences 1992;37(2):446-459.
6. Casale JF, Meyers RP. The stability of cocaine in Agua Rica/Agua Madre. Microgram 1996;29(7):175-178.*
7. Murray JB, Al-Shora HI. Stability of cocaine in aqueous solution. Journal of Clinical Pharmacy 1978;3(1):1-6.
8. Alexander GL. Acid hydrolysis of cocaine. Microgram 1984;17(3):41-45.*
9. Moore JM, Casale JF, Cooper DA. Comparative determination of total isomeric truxillines in illicit,refined, South American cocaine hydrochloride using capillary gas chromatography - electron capturedetection. Journal of Chromatography A 1996;756:193-201.
10. Ehleringer JR, Casale JF, Lott MJ, Ford VL. Tracing the geographic origin of cocaine. Nature 2000;408:311-312.
11. Pinero EL, Casale JF. Quantitation of cocaine by gas chromatography - flame ionization detectionutilizing isopropylcocaine as a structurally related internal standard. Microgram Journal2006;4(1-4);47-53.
12. Moore JM, Casale JF. The discoloration of illicit drug samples. Microgram Journal 2008;6(3-4):128-145 (this issue).
* Law Enforcement Restricted Issue.
- - - - - - - - - -
Table 1. Cocaine Base Purity of Heat Sealed Evidence Envelope (HSEE) Stored Samples.
Month 20°C Dry 20°C Fresh 5°C Dry 5°C Fresh (-5°C) Dry (-5°C) Fresh
0 88.8 86.3 88.8 86.3 88.8 86.31 85.6 87.5 87.1 86.6 87.1 86.92 87.1 88.0 87.6 88.2 87.2 86.93 85.5 85.3 86.4 86.6 86.4 85.94 86.1 86.2 86.9 87.7 86.8 88.15 85.7 85.7 85.7 85.8 87.0 86.06 84.9 85.5 86.1 86.0 85.4 86.77 86.3 87.0 85.7 86.3 87.0 87.18 87.6 86.7 86.8 87.5 87.8 87.69 82.2 83.3 83.3 83.0 83.4 83.810 86.6 85.3 87.0 86.8 87.8 87.611 87.2 85.6 87.0 87.4 87.2 87.212 85.6 85.9 86.0 86.3 87.5 88.3
Brought to you by AltGov2 [www.altgov2.org]
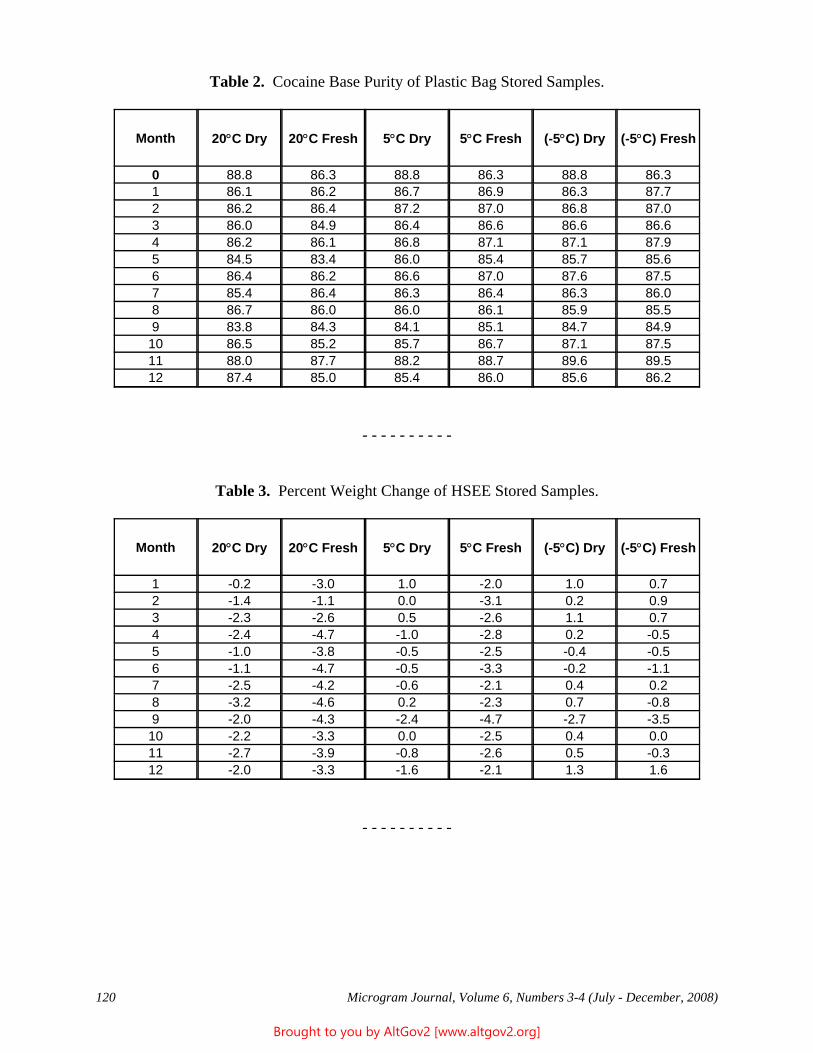
120 Microgram Journal, Volume 6, Numbers 3-4 (July - December, 2008)
Table 2. Cocaine Base Purity of Plastic Bag Stored Samples.
Month 20°C Dry 20°C Fresh 5°C Dry 5°C Fresh (-5°C) Dry (-5°C) Fresh
0 88.8 86.3 88.8 86.3 88.8 86.31 86.1 86.2 86.7 86.9 86.3 87.72 86.2 86.4 87.2 87.0 86.8 87.03 86.0 84.9 86.4 86.6 86.6 86.64 86.2 86.1 86.8 87.1 87.1 87.95 84.5 83.4 86.0 85.4 85.7 85.66 86.4 86.2 86.6 87.0 87.6 87.57 85.4 86.4 86.3 86.4 86.3 86.08 86.7 86.0 86.0 86.1 85.9 85.59 83.8 84.3 84.1 85.1 84.7 84.910 86.5 85.2 85.7 86.7 87.1 87.511 88.0 87.7 88.2 88.7 89.6 89.512 87.4 85.0 85.4 86.0 85.6 86.2
- - - - - - - - - -
Table 3. Percent Weight Change of HSEE Stored Samples.
Month 20°C Dry 20°C Fresh 5°C Dry 5°C Fresh (-5°C) Dry (-5°C) Fresh
1 -0.2 -3.0 1.0 -2.0 1.0 0.72 -1.4 -1.1 0.0 -3.1 0.2 0.93 -2.3 -2.6 0.5 -2.6 1.1 0.74 -2.4 -4.7 -1.0 -2.8 0.2 -0.55 -1.0 -3.8 -0.5 -2.5 -0.4 -0.56 -1.1 -4.7 -0.5 -3.3 -0.2 -1.17 -2.5 -4.2 -0.6 -2.1 0.4 0.28 -3.2 -4.6 0.2 -2.3 0.7 -0.89 -2.0 -4.3 -2.4 -4.7 -2.7 -3.510 -2.2 -3.3 0.0 -2.5 0.4 0.011 -2.7 -3.9 -0.8 -2.6 0.5 -0.312 -2.0 -3.3 -1.6 -2.1 1.3 1.6
- - - - - - - - - -
Brought to you by AltGov2 [www.altgov2.org]
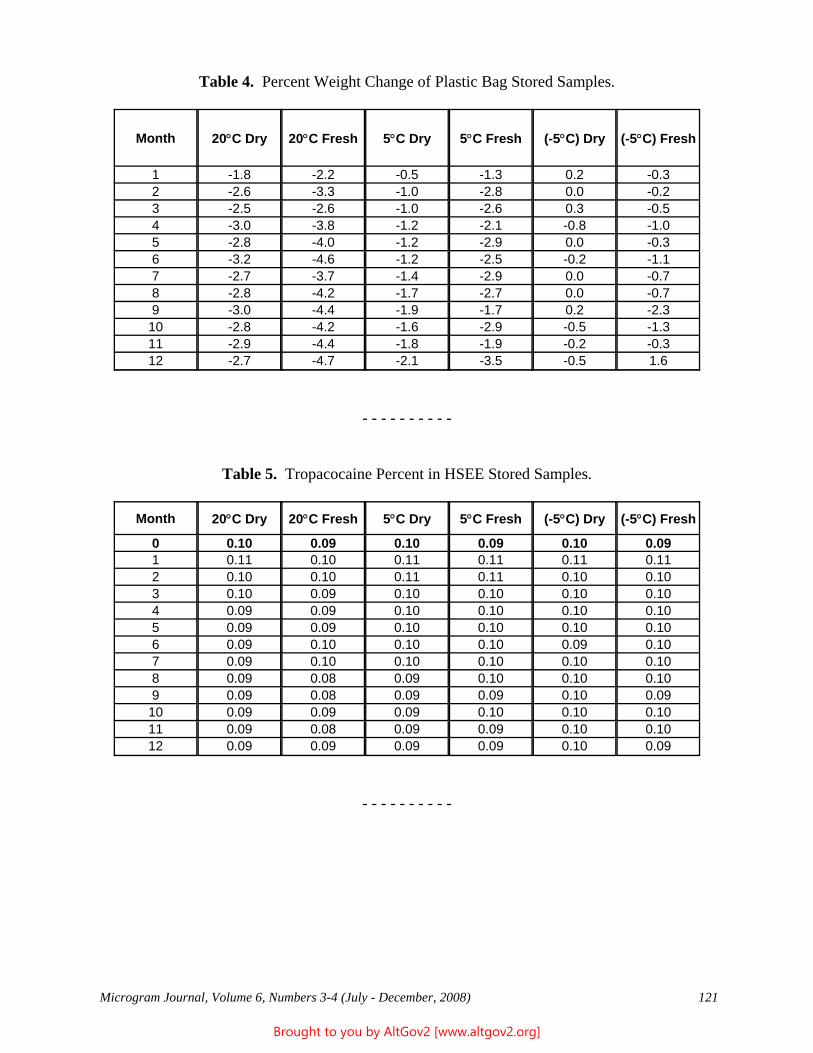
Microgram Journal, Volume 6, Numbers 3-4 (July - December, 2008) 121
Table 4. Percent Weight Change of Plastic Bag Stored Samples.
Month 20°C Dry 20°C Fresh 5°C Dry 5°C Fresh (-5°C) Dry (-5°C) Fresh
1 -1.8 -2.2 -0.5 -1.3 0.2 -0.32 -2.6 -3.3 -1.0 -2.8 0.0 -0.23 -2.5 -2.6 -1.0 -2.6 0.3 -0.54 -3.0 -3.8 -1.2 -2.1 -0.8 -1.05 -2.8 -4.0 -1.2 -2.9 0.0 -0.36 -3.2 -4.6 -1.2 -2.5 -0.2 -1.17 -2.7 -3.7 -1.4 -2.9 0.0 -0.78 -2.8 -4.2 -1.7 -2.7 0.0 -0.79 -3.0 -4.4 -1.9 -1.7 0.2 -2.310 -2.8 -4.2 -1.6 -2.9 -0.5 -1.311 -2.9 -4.4 -1.8 -1.9 -0.2 -0.312 -2.7 -4.7 -2.1 -3.5 -0.5 1.6
- - - - - - - - - -
Table 5. Tropacocaine Percent in HSEE Stored Samples.
Month 20°C Dry 20°C Fresh 5°C Dry 5°C Fresh (-5°C) Dry (-5°C) Fresh
0 0.10 0.09 0.10 0.09 0.10 0.091 0.11 0.10 0.11 0.11 0.11 0.112 0.10 0.10 0.11 0.11 0.10 0.103 0.10 0.09 0.10 0.10 0.10 0.104 0.09 0.09 0.10 0.10 0.10 0.105 0.09 0.09 0.10 0.10 0.10 0.106 0.09 0.10 0.10 0.10 0.09 0.107 0.09 0.10 0.10 0.10 0.10 0.108 0.09 0.08 0.09 0.10 0.10 0.109 0.09 0.08 0.09 0.09 0.10 0.09
10 0.09 0.09 0.09 0.10 0.10 0.1011 0.09 0.08 0.09 0.09 0.10 0.1012 0.09 0.09 0.09 0.09 0.10 0.09
- - - - - - - - - -
Brought to you by AltGov2 [www.altgov2.org]
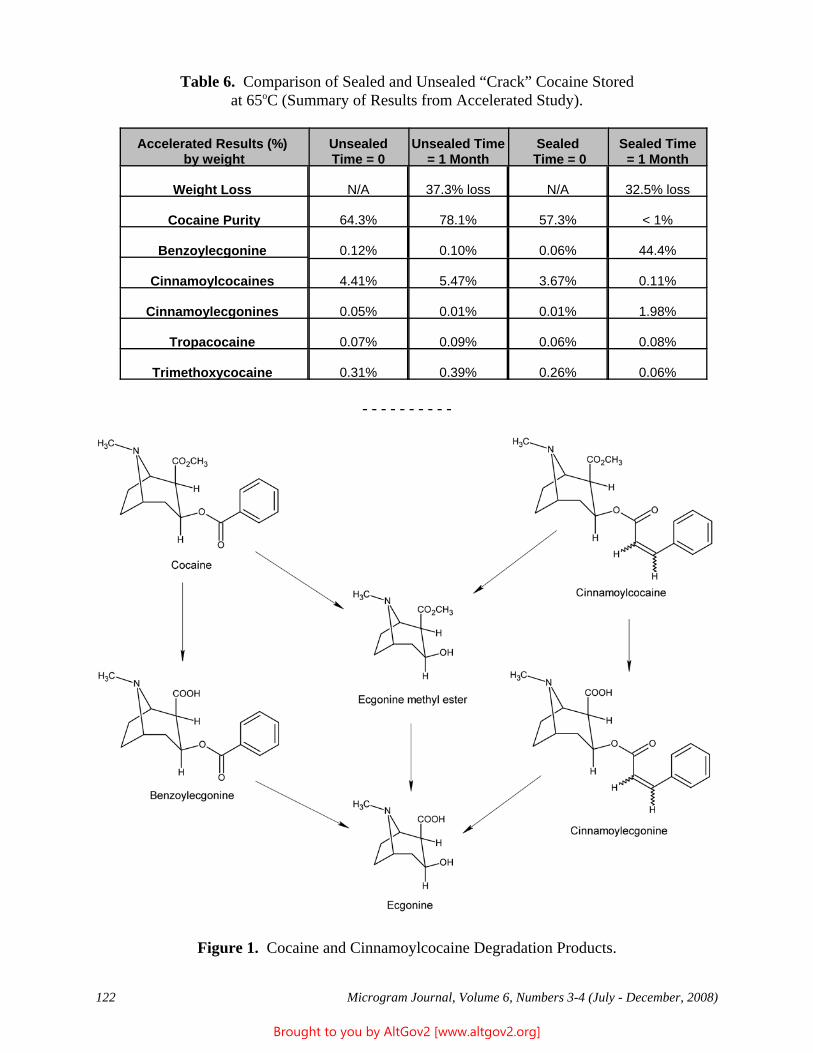
122 Microgram Journal, Volume 6, Numbers 3-4 (July - December, 2008)
Table 6. Comparison of Sealed and Unsealed “Crack” Cocaine Storedat 65oC (Summary of Results from Accelerated Study).
Accelerated Results (%) by weight
UnsealedTime = 0
Unsealed Time= 1 Month
Sealed Time = 0
Sealed Time= 1 Month
Weight Loss N/A 37.3% loss N/A 32.5% loss
Cocaine Purity 64.3% 78.1% 57.3% < 1%
Benzoylecgonine 0.12% 0.10% 0.06% 44.4%
Cinnamoylcocaines 4.41% 5.47% 3.67% 0.11%
Cinnamoylecgonines 0.05% 0.01% 0.01% 1.98%
Tropacocaine 0.07% 0.09% 0.06% 0.08%
Trimethoxycocaine 0.31% 0.39% 0.26% 0.06%
- - - - - - - - - -
Figure 1. Cocaine and Cinnamoylcocaine Degradation Products.
Brought to you by AltGov2 [www.altgov2.org]
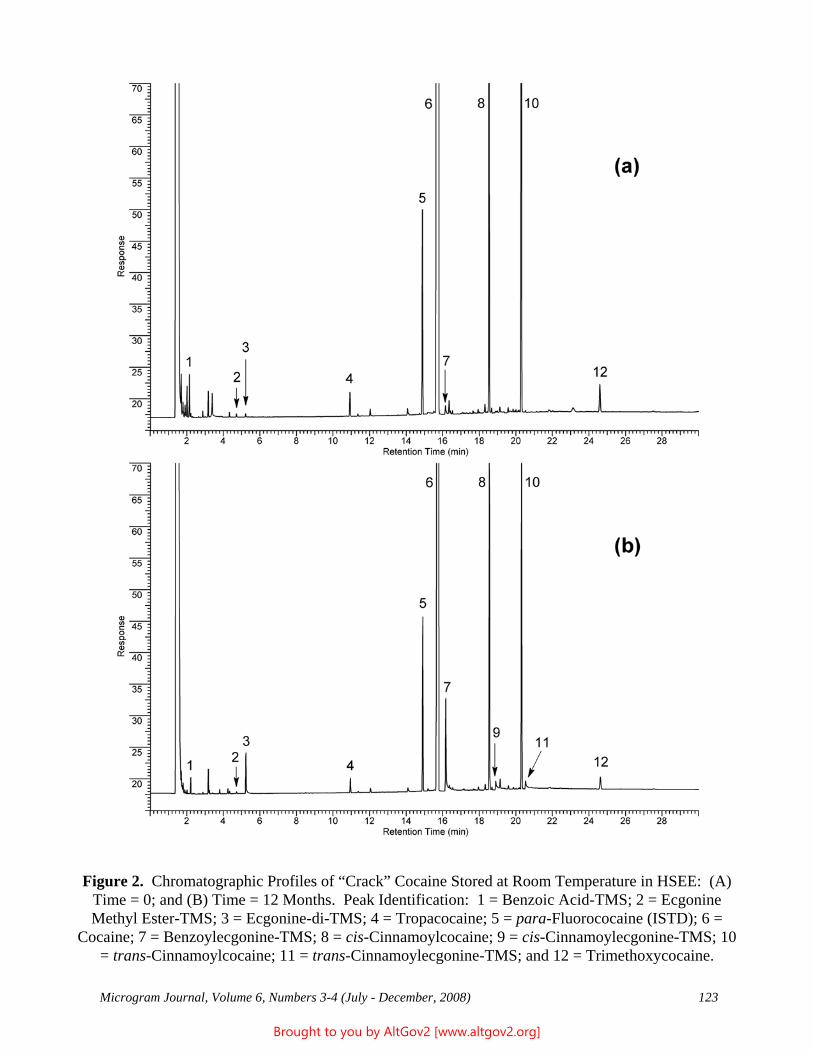
Microgram Journal, Volume 6, Numbers 3-4 (July - December, 2008) 123
Figure 2. Chromatographic Profiles of “Crack” Cocaine Stored at Room Temperature in HSEE: (A)Time = 0; and (B) Time = 12 Months. Peak Identification: 1 = Benzoic Acid-TMS; 2 = EcgonineMethyl Ester-TMS; 3 = Ecgonine-di-TMS; 4 = Tropacocaine; 5 = para-Fluorococaine (ISTD); 6 =
Cocaine; 7 = Benzoylecgonine-TMS; 8 = cis-Cinnamoylcocaine; 9 = cis-Cinnamoylecgonine-TMS; 10= trans-Cinnamoylcocaine; 11 = trans-Cinnamoylecgonine-TMS; and 12 = Trimethoxycocaine.
Brought to you by AltGov2 [www.altgov2.org]
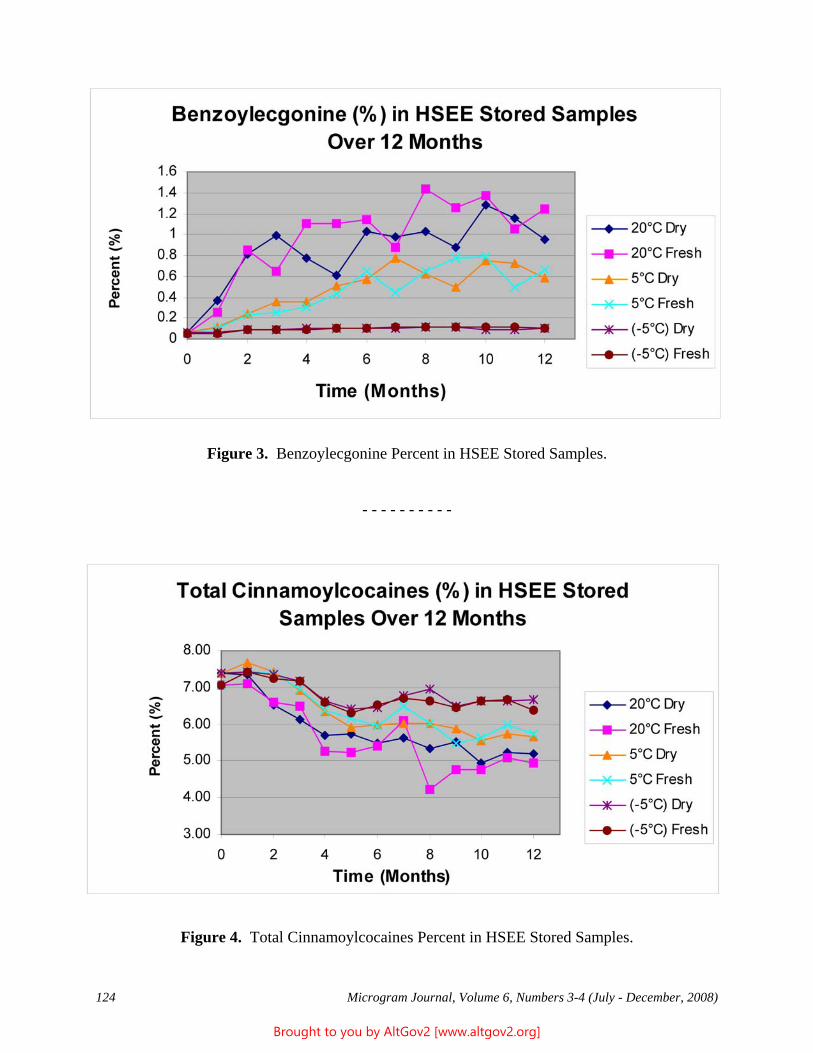
124 Microgram Journal, Volume 6, Numbers 3-4 (July - December, 2008)
Figure 3. Benzoylecgonine Percent in HSEE Stored Samples.
- - - - - - - - - -
Figure 4. Total Cinnamoylcocaines Percent in HSEE Stored Samples.
Brought to you by AltGov2 [www.altgov2.org]
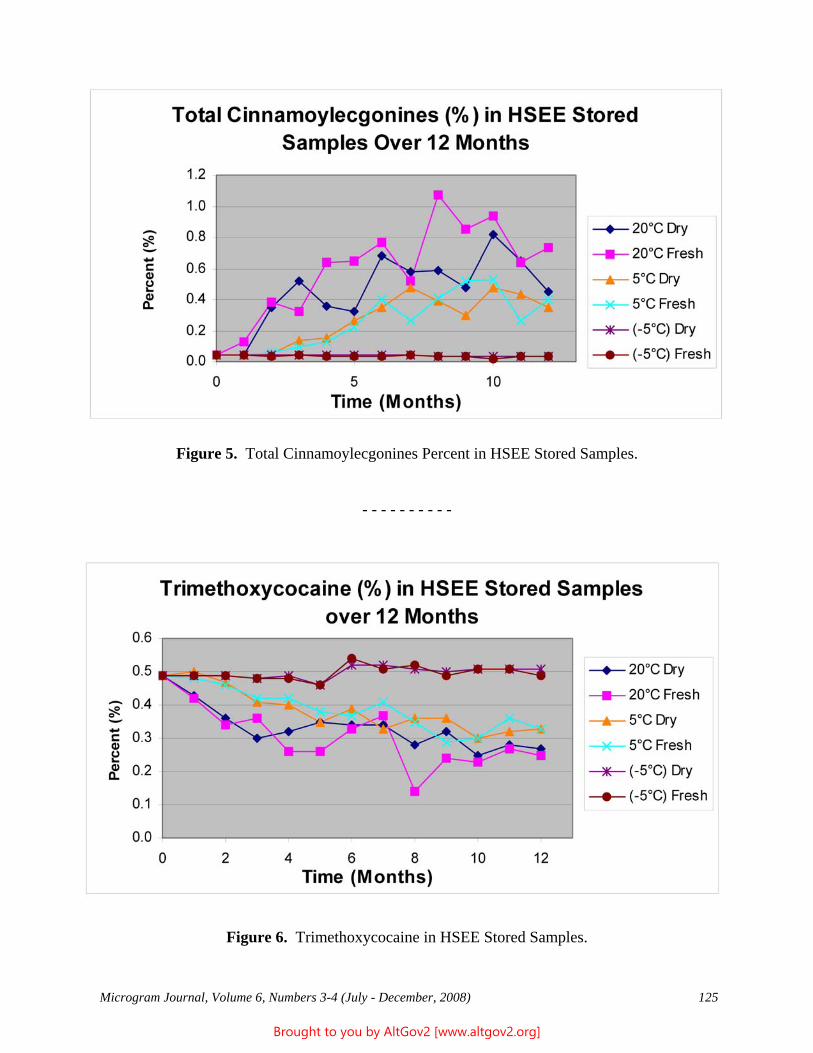
Microgram Journal, Volume 6, Numbers 3-4 (July - December, 2008) 125
Figure 5. Total Cinnamoylecgonines Percent in HSEE Stored Samples.
- - - - - - - - - -
Figure 6. Trimethoxycocaine in HSEE Stored Samples.
Brought to you by AltGov2 [www.altgov2.org]
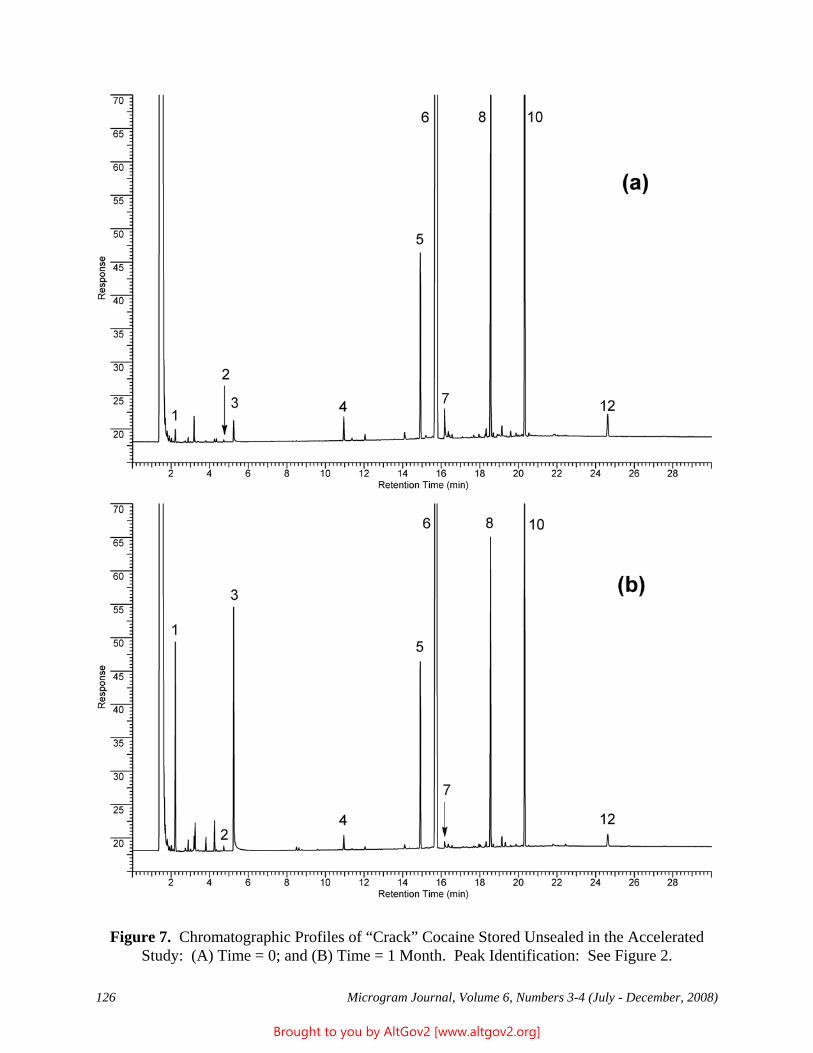
126 Microgram Journal, Volume 6, Numbers 3-4 (July - December, 2008)
Figure 7. Chromatographic Profiles of “Crack” Cocaine Stored Unsealed in the AcceleratedStudy: (A) Time = 0; and (B) Time = 1 Month. Peak Identification: See Figure 2.
Brought to you by AltGov2 [www.altgov2.org]
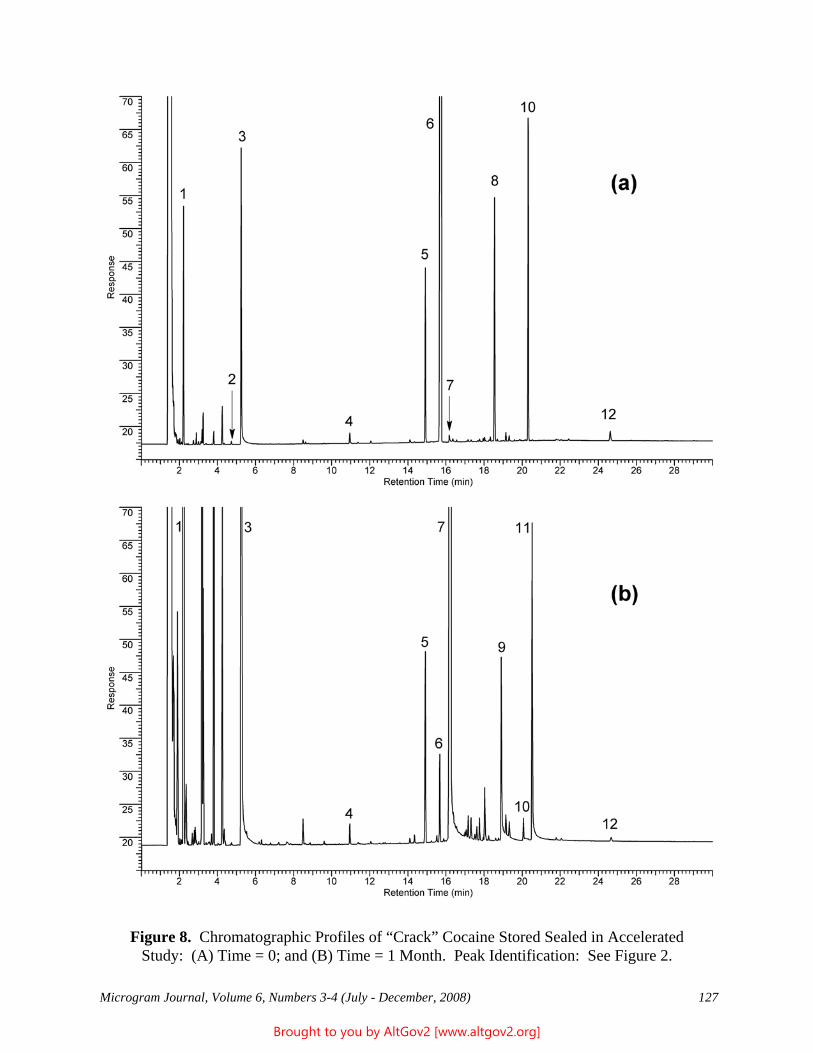
Microgram Journal, Volume 6, Numbers 3-4 (July - December, 2008) 127
Figure 8. Chromatographic Profiles of “Crack” Cocaine Stored Sealed in AcceleratedStudy: (A) Time = 0; and (B) Time = 1 Month. Peak Identification: See Figure 2.
Brought to you by AltGov2 [www.altgov2.org]
128 Microgram Journal, Volume 6, Numbers 3-4 (July - December, 2008)
“The Lost Manuscript” - A Posthumous Publication of:
The Discoloration of Illicit Drug Samples
James M. Moore† and John F. Casale‡U.S. Department of Justice
Drug Enforcement AdministrationSpecial Testing and Research Laboratory
22624 Dulles Summit CourtDulles, VA 20164
[email address withheld at corresponding author’s request]
ABSTRACT: Discoloration (browning) of illicit cocaine exhibits during long-term storage is a common but notuniversal phenomenon. In order to gain a better understanding of the discoloration process(es), already discoloredseized samples, and a wide variety of authentic drug mixtures that similarly discolored under long-term ambientand accelerated temperature - humidity studies, were subjected to acid base workup, column chromatography, andin-depth analyses of the pertinent fractions by EI and CI GC/MS, UV/Vis, and IR. The discolored samples wereall found to contain a primary aromatic amine (either procaine or benzocaine), a sugar (either lactose or dextrose),and an acid (such as cocaine hydrochloride, boric acid, benzoic acid, etc.) The rate of discoloration of the drugmixtures was both pH and temperature dependant, i.e., the rate of sample browning increased with lower pHand/or higher temperature. All discolored samples that contained procaine or benzocaine also contained N-formylprocaine or N-formylbenzocaine, respectively, and these are therefore bona fide “marker” compounds forthe browning of illicit cocaine. These derivatives are believed to be formed following the degradation of lactoseor dextrose to 5-hydroxymethylfurfural, which in turn degraded to formic and levulinic acids; subsequentformylation of procaine or benzocaine gave the respective “marker” compounds. A number of highly coloredcompounds (yellow, blue, purple, and pink) were observed in column and thin-layer chromatography of thediscolored samples, and are responsible for the sample discoloration. These compounds were not identified, butare believed to derive from condensation reactions between 5-hydroxymethylfurfural with the various amines inthe samples.
KEYWORDS: Cocaine Hydrochloride, Discoloration, 5-Hydroxymethylfurfural, Procaine, Benzocaine, N-Formylprocaine, N-Formylbenzocaine, Lactose, Dextrose, Forensic Chemistry
[Foreword by the Corresponding Author and the Microgram Editor: This manuscript was authored in 1974 bythen Senior Forensic Chemist Jim Moore; it was intended and formatted for publication in Microgram, butapparently was never submitted. It was re-discovered on July 14, 2008 by the co-author, Senior ResearchChemist John Casale. It is published here verbatim (including 1970’s formatting and scientific abbreviations),except that some experiments were repeated by the corresponding author to re-create legible figures, the aboveAbstract and Keyword set were provided by the Editor, and the layout was slightly reformatted by the Editor forimproved readability.]
_________________________
† Original author (FDA 1963-68; BNDD 1968-73; and DEA 1973-98); deceased February 24th, 1999 (see: Microgram 1999;32(4):133 (Note: Law Enforcement Restricted issue)).
‡ To whom inquiries should be addressed.
Brought to you by AltGov2 [www.altgov2.org]
Microgram Journal, Volume 6, Numbers 3-4 (July - December, 2008) 129
Introduction
This paper reports the results of a two-year investigation studying the discoloration of illicit drug samples. Thestudy was initiated as a result of several forensic laboratories reporting problems associated with the discoloration,or “browning,” of illicit cocaine samples over a prolonged period of time. This “browning” phenomenon was offorensic interest in that there were discrepancies in the chemist’s description of the sample prior to analysis andlater, upon identifying the sample during court testimony. In most cases, the samples were white when firstexamined but subsequently acquired a brown coloration by the time the samples were reopened for courtproceedings. This change in coloration caused significant problems for the chemists in that it could be assumedthat a sample mix-up had occurred, and the disposition of the case would be in doubt based upon this reasoning. Dugar, et al. [1] have investigated this discoloration phenomenon in contraband cocaine.
The study in this paper satisfactorily characterizes the “browning” phenomenon occurring in certain illicitsamples. This characterization is based upon: (A) a thorough literature review that describes the discoloration oflegitimate pharmaceutical preparations, (B) in-depth analyses of illicit samples known to have undergone thediscoloration process, (C) ambient and accelerated temperature-humidity studies conducted on authentic drugmixtures, and (D) the isolation and characterization of signature compounds associated with the discolorationprocess in illicit and authentic samples.
A. Literature Review
There has been considerable study of the discoloration associated with legitimate pharmaceutical products. Blaugand Huang [2,3] have described the discoloration of amphetamine sulfate - spray dried lactose and amphetaminesulfate - dextrose mixtures when subjected to elevated temperatures. In these studies, a product of sugardecomposition, namely 5-hydroxymethylfurfural (5-HMF), was suggested to be present. Dugar et al. [1] alsoreported the presence of 5-HMF in sugar-containing illicit samples that underwent discoloration. Castello andMattocks [4] and Duvall et al. [5,6] reported interaction of various primary amines with lactose and dextrose andthe subsequent discoloration of such samples. In these studies, the rate of “browning” was found to be dependantupon temperature and pH. Several investigators had studied the role of 5-HMF and related substances in thediscoloration of amine - sugar mixtures [7-11]. Brownley and Lachman [12] studied the formation of 5-HMF inspray-dried lactose as well as conventionally-processed lactose.
The above-referenced studies clearly demonstrated that when mixtures of primary amines (amphetamine was mostoften studied) and certain sugars (lactose and dextrose) were subjected to elevated temperature and humidityconditions, significant discoloration occurred. Several authors reported a relationship between the rate ofdiscoloration and pH of the sample. Finally, most of the studies reported a relationship between drug mixturesthat had discolored and the presence of 5-HMF.
B. In-Depth Analyses of Illicit Samples
A number of illicit drug samples known to have undergone the discoloration process were obtained from variousforensic laboratories. All samples were subjected to in-depth analyses for drug constituents as well as diluents. These analyses revealed that the samples had the following elements in common: (1) all samples containedcocaine hydrochloride, (2) all samples had undergone a white-to-brown color transition after prolonged storageunder unspecified conditions, (3) all samples contained either lactose or dextrose, (4) all samples contained aprimary aromatic amine, such as benzocaine, and (5) all samples were acidic in nature; this acidity was due, inpart, to the presence of substances such as cocaine HCl, boric acid, etc. The results of the in-depth analysesindicated a positive correlation between sample composition and the discoloration process described by otherinvestigators.
Brought to you by AltGov2 [www.altgov2.org]
130 Microgram Journal, Volume 6, Numbers 3-4 (July - December, 2008)
C. Ambient and Accelerated Stability Studies of Authentic Samples
A large number of authentic samples were prepared for stability studies (see Table I). The composition of thesesamples was based upon elements believed responsible, in part, for the discoloration process. The authenticsamples were studied under ambient conditions for about two years and under accelerated conditions for abouttwo months.
The primary amines used in this study were benzocaine and procaine HCl. These are two widely-used adulterantsassociated with illicit cocaine and heroin samples, respectively. The sugars used were lactose and dextrose. Preliminary studies indicated that mannitol and sucrose did not contribute significantly to the “browning” process. Since the literature review suggested a difference in the “browning” rates of spray-dried andconventionally-processed lactose, both were used in this study. The pH of the samples was controlled over anacid range by the introduction of substances of varying acidity. In order of increasing pKa, these substanceswere: oxalic acid, citric acid, benzoic acid, cocaine HCl, boric acid, heroin HCl, and procaine HCl. Theconcentration of all compounds was varied over a wide range.
In the ambient study, the authentic samples listed in Table I were placed in glass vials with screw-on plastic capsand stored in the dark. At the end of a two-year period, the samples were examined for discoloration. Table IIlists those samples that exhibited significant discoloration. The samples listed in Table I, and not included inTable II, did not exhibit significant discoloration.
A review of Table II reveals that all samples that discolored contained either lactose or dextrose, benzocaine orprocaine HCl, and were distinctly acidic. It should be noted that the concentration of the acidic component didnot influence the discoloration significantly. On the other hand, the majority of the samples that did discolorcontained the more acidic components, (i.e., oxalic, citric, and benzoic acids). Though the cocaine HCl -benzocaine - dextrose mixtures were of higher pH values, these samples also discolored. Though the explanationfor this is not clear, it may be due to decomposition of cocaine with subsequent formation of benzoic acidresulting in a decrease of pH. It is also apparent from Table II that for a sample of given acidity, benzocaine -dextrose mixtures discolored more rapidly than benzocaine - lactose mixtures. Such a distinction is not apparentfor procaine-containing samples.
The samples listed in Table I were also subjected to accelerated conditions for 61 days. The humidity varied from50 - 70%, while the temperature was gradually increased from ambient to 48OC. Fig. 1 illustrates the results ofthe accelerated study. As the samples discolored significantly (brown to dark brown), they were removed fromthe temperature-humidity chamber and noted in Fig. 1. Due to the large number of samples that discolored, onlya representative cross-section are noted in Fig. 1.
The results of the accelerated stability studies can be summarized as were the ambient study described previously. Additionally, there does exist a positive correlation between the rate of discoloration of the authentic samples andincreases in temperature. There is no apparent difference in the discoloration rates of samples containing thevarious grades of lactose, including spray-dried and conventionally-processed.
Some of the samples subjected to the accelerated study showed no significant discoloration. These included mostof the two-component samples as well as those three-component mixtures that did not contain either a sugar, aprimary amine, or a strong acid. Those samples that apparently contained the necessary components for“browning,” but showed no significant discoloration, were generally of a higher pH, and usually contained lactoseas the sugar diluent. These included samples containing lactose mixed with heroin HCl - procaine HCl, heroinHCl - benzocaine, boric acid - procaine HCl, boric acid - benzocaine, cocaine HCl - procaine HCl, and cocaineHCl - benzocaine. In general, samples containing dextrose were found to discolor at a significantly faster ratethan those containing lactose.
Brought to you by AltGov2 [www.altgov2.org]
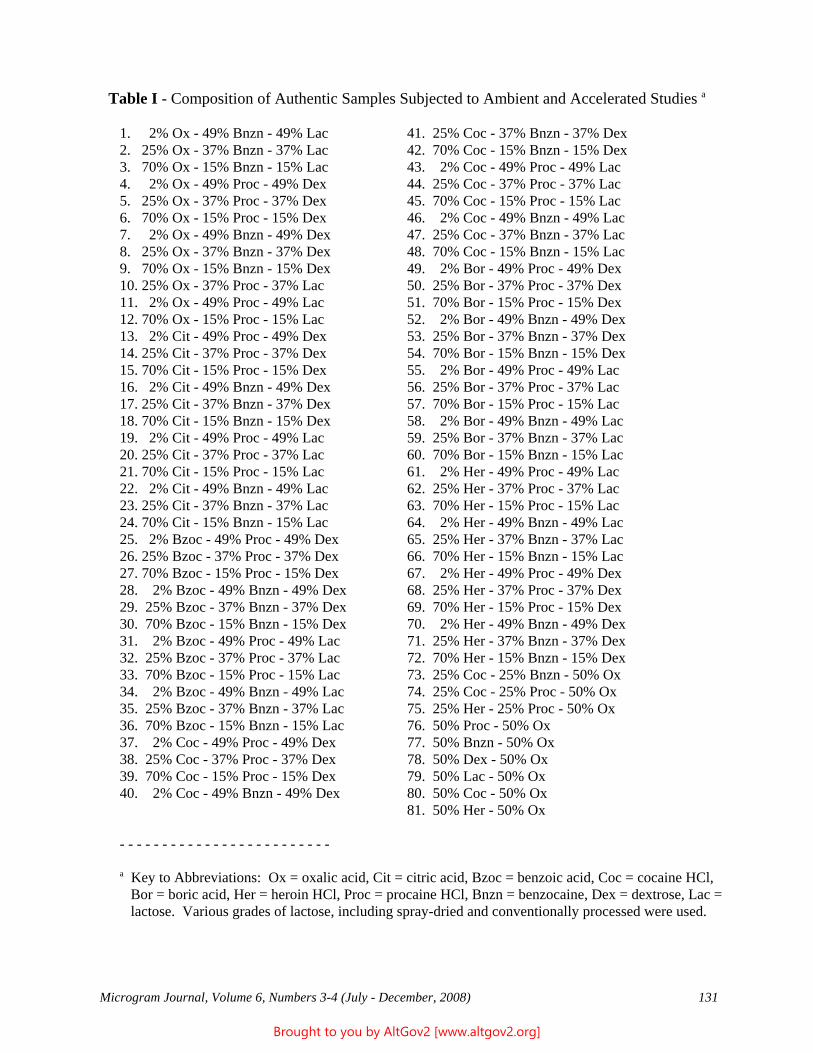
Microgram Journal, Volume 6, Numbers 3-4 (July - December, 2008) 131
Table I - Composition of Authentic Samples Subjected to Ambient and Accelerated Studies a
1. 2% Ox - 49% Bnzn - 49% Lac 41. 25% Coc - 37% Bnzn - 37% Dex2. 25% Ox - 37% Bnzn - 37% Lac 42. 70% Coc - 15% Bnzn - 15% Dex3. 70% Ox - 15% Bnzn - 15% Lac 43. 2% Coc - 49% Proc - 49% Lac4. 2% Ox - 49% Proc - 49% Dex 44. 25% Coc - 37% Proc - 37% Lac5. 25% Ox - 37% Proc - 37% Dex 45. 70% Coc - 15% Proc - 15% Lac6. 70% Ox - 15% Proc - 15% Dex 46. 2% Coc - 49% Bnzn - 49% Lac7. 2% Ox - 49% Bnzn - 49% Dex 47. 25% Coc - 37% Bnzn - 37% Lac8. 25% Ox - 37% Bnzn - 37% Dex 48. 70% Coc - 15% Bnzn - 15% Lac9. 70% Ox - 15% Bnzn - 15% Dex 49. 2% Bor - 49% Proc - 49% Dex10. 25% Ox - 37% Proc - 37% Lac 50. 25% Bor - 37% Proc - 37% Dex11. 2% Ox - 49% Proc - 49% Lac 51. 70% Bor - 15% Proc - 15% Dex12. 70% Ox - 15% Proc - 15% Lac 52. 2% Bor - 49% Bnzn - 49% Dex13. 2% Cit - 49% Proc - 49% Dex 53. 25% Bor - 37% Bnzn - 37% Dex14. 25% Cit - 37% Proc - 37% Dex 54. 70% Bor - 15% Bnzn - 15% Dex15. 70% Cit - 15% Proc - 15% Dex 55. 2% Bor - 49% Proc - 49% Lac16. 2% Cit - 49% Bnzn - 49% Dex 56. 25% Bor - 37% Proc - 37% Lac17. 25% Cit - 37% Bnzn - 37% Dex 57. 70% Bor - 15% Proc - 15% Lac18. 70% Cit - 15% Bnzn - 15% Dex 58. 2% Bor - 49% Bnzn - 49% Lac19. 2% Cit - 49% Proc - 49% Lac 59. 25% Bor - 37% Bnzn - 37% Lac20. 25% Cit - 37% Proc - 37% Lac 60. 70% Bor - 15% Bnzn - 15% Lac21. 70% Cit - 15% Proc - 15% Lac 61. 2% Her - 49% Proc - 49% Lac22. 2% Cit - 49% Bnzn - 49% Lac 62. 25% Her - 37% Proc - 37% Lac23. 25% Cit - 37% Bnzn - 37% Lac 63. 70% Her - 15% Proc - 15% Lac24. 70% Cit - 15% Bnzn - 15% Lac 64. 2% Her - 49% Bnzn - 49% Lac25. 2% Bzoc - 49% Proc - 49% Dex 65. 25% Her - 37% Bnzn - 37% Lac26. 25% Bzoc - 37% Proc - 37% Dex 66. 70% Her - 15% Bnzn - 15% Lac27. 70% Bzoc - 15% Proc - 15% Dex 67. 2% Her - 49% Proc - 49% Dex28. 2% Bzoc - 49% Bnzn - 49% Dex 68. 25% Her - 37% Proc - 37% Dex29. 25% Bzoc - 37% Bnzn - 37% Dex 69. 70% Her - 15% Proc - 15% Dex30. 70% Bzoc - 15% Bnzn - 15% Dex 70. 2% Her - 49% Bnzn - 49% Dex31. 2% Bzoc - 49% Proc - 49% Lac 71. 25% Her - 37% Bnzn - 37% Dex32. 25% Bzoc - 37% Proc - 37% Lac 72. 70% Her - 15% Bnzn - 15% Dex33. 70% Bzoc - 15% Proc - 15% Lac 73. 25% Coc - 25% Bnzn - 50% Ox34. 2% Bzoc - 49% Bnzn - 49% Lac 74. 25% Coc - 25% Proc - 50% Ox35. 25% Bzoc - 37% Bnzn - 37% Lac 75. 25% Her - 25% Proc - 50% Ox36. 70% Bzoc - 15% Bnzn - 15% Lac 76. 50% Proc - 50% Ox37. 2% Coc - 49% Proc - 49% Dex 77. 50% Bnzn - 50% Ox38. 25% Coc - 37% Proc - 37% Dex 78. 50% Dex - 50% Ox39. 70% Coc - 15% Proc - 15% Dex 79. 50% Lac - 50% Ox40. 2% Coc - 49% Bnzn - 49% Dex 80. 50% Coc - 50% Ox
81. 50% Her - 50% Ox
- - - - - - - - - - - - - - - - - - - - - - - - -
a Key to Abbreviations: Ox = oxalic acid, Cit = citric acid, Bzoc = benzoic acid, Coc = cocaine HCl, Bor = boric acid, Her = heroin HCl, Proc = procaine HCl, Bnzn = benzocaine, Dex = dextrose, Lac = lactose. Various grades of lactose, including spray-dried and conventionally processed were used.
Brought to you by AltGov2 [www.altgov2.org]

132 Microgram Journal, Volume 6, Numbers 3-4 (July - December, 2008)
Table II - Authentic Samples that Exhibited Discolorationafter a Two-Year Study under Ambient Conditions a
Sample Number b Sample Appearance
4, 5, 6, 10, 11, 12, 13, 14, 15, 16, 17, 18, 19 Uniform dark brown to black 20, 21, 27, 28, 29, 30, 41, 42
1, 2, 3, 7, 8, 9, 23, 24, 25, 26, 32, 33, 40 Uniform light to medium brown 49, 50, 52, 53
16, 22, 23 Dark specks in white powder
- - - - - - - - - - - - - - - - - - - - - - - - -
a Ambient conditions: avg. room temperature = 24 - 26OC; humidity range = 60 - 80% RH.b Refer to Table I for sample composition.
* * * * *
Figure 1: Graph illustrating discoloration of authentic samples subjected to accelerated conditions.As samples discolored, they were removed from temperature-humidity chamber and noted on graph.
Refer to Table I for sample composition.
Brought to you by AltGov2 [www.altgov2.org]
Microgram Journal, Volume 6, Numbers 3-4 (July - December, 2008) 133
In summary, the results of the ambient and accelerated studies have established a clear relationship between thediscoloration of illicit samples and their composition and storage conditions. Despite this positive correlation, fullcharacterization of this “browning” phenomena would not be complete unless signature compounds that resultedas by-products of the discoloration process were isolated and identified. This work is described below.
D. Isolation and Characterization of Signature Compounds
1. Chemicals and SolventsThe formic acid used in this study was 88% analytical reagent grade and obtained from MallinkrodtChemical Works (St. Louis, Missouri). The deuterated formic acid (DCOOH) was 99% atom % D andwas supplied by Merck and Co., Inc. (St. Louis, Missouri). All other chemicals and solvents used were ofhigh quality and obtained from the usual commercial sources.
2. Drug StandardsAll drug materials were provided by the Special Testing and Research Laboratory, Drug EnforcementAdministration.
3. Chromatographic Materials(a) The chromatographic partitioning columns were 250 mm in length x 22 mm i.d., and obtained fromKontes Glass Co. (Vineland, New Jersey).
(b) The diatomaceous earth used in the partitioning work was Celite 545 acid-washed (AW), andobtained from Johns-Manville Co. (Inglewood Cliff, New Jersey).
(c) All thin layer chromatography was done on glass plates coated with silica gel GF (250 or 2000:thickness). These plates were obtained from Analtech, Inc. (Newark, Delaware).
(d) All gas chromatographic columns were obtained from Applied Science Laboratories (State College,Pennsylvania) (see body of paper for dimensions). The various column packings were also obtained fromApplied Science Laboratories. These included 3% OV-1 and 3% OV-25, all on Chromosorb WHP(100-120M). All internal standards were also obtained from Applied Science Laboratories.
4. Instrumentation(a) Gas Chromatography - The gas chromatograph work was done on a Packard 7400 gas chromatographequipped with a flame ionization detector (FID) (see body of paper for other GLC parameters).
(b) Ultraviolet Spectrometry (UV) - All UV spectra were recorded on a Cary 14 spectrophotometer.
(c) Infrared Spectrometry (IR) - All IR spectra were recorded on a Perkin-Elmer 457 spectrophotometer.
(d) Gas Chromatography - Mass Spectrometry (GC-MS) - A Finnigan 4000 mass spectrometer was usedin this study. It was interfaced with a Finnigan 9610 GC and Finnigan 6110 data system. The gaschromatograph was equipped with a 6 ft. x 2 mm i.d. glass column packed with 3% OV-1 and Gas ChromQ (80-100M).
All electron impact (EI) spectra were acquired under the following conditions: emission current - 0.35mA, amplifier sensitivity - 10 - 8 A/V, electron energy - 70 eV, and electron multiplier - 1600 V. Thecarrier gas was Helium and maintained at a flow rate of about 20 cc/min. The column temperature wasprogrammed between 150 and 250OC, while the ionizer, separator, and transfer line temperatures weremaintained at 250, 260, and 260OC, respectively.
Brought to you by AltGov2 [www.altgov2.org]
134 Microgram Journal, Volume 6, Numbers 3-4 (July - December, 2008)
All chemical ionization (CI) spectra were obtained under the following conditions: Helium was the carriergas and methane was used as the reactant gas; the ionizer was maintained at a pressure of about 0.40 torrand a temperature of 200OC; all other parameters are the same as for the EI study.
5. Isolation of Signature CompoundsDuring the in-depth analyses of the discolored, illicit samples described previously, trace amounts ofunidentified impurities were detected. The methodology described below was developed in order toisolate these impurities in sufficiently pure form for spectroscopic characterization.
(a) Isolation of Signature Compounds in Illicit and Authentic, Brown Samples Containing Benzocaine
About 0.5 cc of 0.1N H2SO4 is mixed with 1 gm Celite 545 AW and packed moderately in achromatographic partitioning column. An appropriate quantity of sample is dissolved in 2 cc of 0.1NH2SO4 and 3 gm of Celite 545 AW are added; after mixing, the sample is packed moderately above thebottom layer of the column. The column is eluted with about 50 - 75 cc of water-saturated ethyl ether. This eluate contains benzocaine and the signature compound. Cocaine and other basic drugs are retainedby the column. The ether eluate is evaporated gently to dryness. Depending upon sample composition,this fraction may be sufficiently pure for spectroscopic characterization.
If additional “cleanup” is necessary, the following chromatographic procedure may be used. The residueobtained above from the ether eluate is triturated with 2 cc of 0.1N NaHCO3; 3 gm of Celite 545 areadded and mixed until fluffy; this mixture is packed moderately in a chromatographic partitioning columncontaining a layer of 0.5 cc 0.1N NaHCO3 mixed with 1 gm of Celite 545 AW. The column is then elutedwith 75 - 100 cc of water-saturated petroleum ether. This fraction consists primarily of benzocaine. Thecolumn is then eluted with 50 - 75 cc water-saturated ethyl ether. This fraction contains the signaturecompound and trace amounts of benzocaine. The ether eluate is evaporated carefully to dryness. Theresidue may be characterized spectroscopically or subjected to further purification using the TLCtechnique described below.
The residue obtained above is dissolved in a small volume of methylene chloride and spotted or streakedon a silica gel GF plate (250 or 2000: thickness). The plate is developed with a solvent mixture of ethylether : petroleum ether (65:35). After development, the plate is dried and viewed under short wave UV. Both benzocaine and the signature compound appear as dark spots or bands at Rf values of about 0.45 and0.17, respectively. The spot or band representing the signature compound is removed from the plate andplaced in a small vial. Methanol is added to the vial and warmed gently on a steam bath. The vial iscentrifuged and the methanol is decanted and evaporated carefully to dryness. The residue may besubjected to spectroscopic characterization.
Isolation of the signature compound may also be accomplished using GLC fraction collection techniques. Table III gives the appropriate GLC parameters and retention data for benzocaine, the signaturecompound, and internal standards.
The signature compound isolated by one or more of the chromatographic procedures given above issubjected to MS, UV, and IR characterization described later in this paper.
(b) Isolation of Signature Compounds in Illicit and Authentic Brown Samples Containing Procaine
An appropriate quantity of sample is dissolved in 2 cc of water; the solution is made basic with NaHCO3and 3 gm of Celite 545 AW are added; after uniform mixing, the sample is packed in a column containinga layer of 0.5 cc of 0.1N NaHCO3 mixed with 1 gm of Celite 545 AW. The signature compound is
Brought to you by AltGov2 [www.altgov2.org]
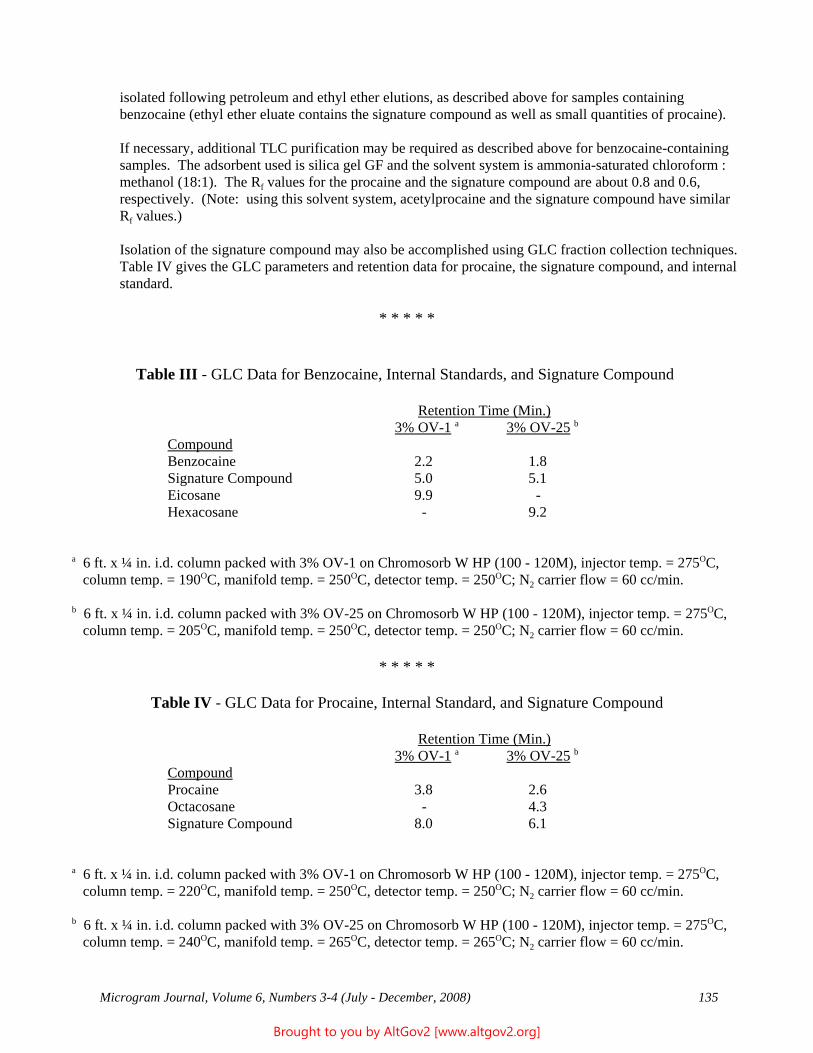
Microgram Journal, Volume 6, Numbers 3-4 (July - December, 2008) 135
isolated following petroleum and ethyl ether elutions, as described above for samples containingbenzocaine (ethyl ether eluate contains the signature compound as well as small quantities of procaine).
If necessary, additional TLC purification may be required as described above for benzocaine-containingsamples. The adsorbent used is silica gel GF and the solvent system is ammonia-saturated chloroform :methanol (18:1). The Rf values for the procaine and the signature compound are about 0.8 and 0.6,respectively. (Note: using this solvent system, acetylprocaine and the signature compound have similarRf values.)
Isolation of the signature compound may also be accomplished using GLC fraction collection techniques. Table IV gives the GLC parameters and retention data for procaine, the signature compound, and internalstandard.
* * * * *
Table III - GLC Data for Benzocaine, Internal Standards, and Signature Compound
Retention Time (Min.) 3% OV-1 a 3% OV-25 b
CompoundBenzocaine 2.2 1.8Signature Compound 5.0 5.1Eicosane 9.9 -Hexacosane - 9.2
a 6 ft. x ¼ in. i.d. column packed with 3% OV-1 on Chromosorb W HP (100 - 120M), injector temp. = 275OC, column temp. = 190OC, manifold temp. = 250OC, detector temp. = 250OC; N2 carrier flow = 60 cc/min.
b 6 ft. x ¼ in. i.d. column packed with 3% OV-25 on Chromosorb W HP (100 - 120M), injector temp. = 275OC, column temp. = 205OC, manifold temp. = 250OC, detector temp. = 250OC; N2 carrier flow = 60 cc/min.
* * * * *
Table IV - GLC Data for Procaine, Internal Standard, and Signature Compound
Retention Time (Min.) 3% OV-1 a 3% OV-25 b
CompoundProcaine 3.8 2.6Octacosane - 4.3Signature Compound 8.0 6.1
a 6 ft. x ¼ in. i.d. column packed with 3% OV-1 on Chromosorb W HP (100 - 120M), injector temp. = 275OC, column temp. = 220OC, manifold temp. = 250OC, detector temp. = 250OC; N2 carrier flow = 60 cc/min.
b 6 ft. x ¼ in. i.d. column packed with 3% OV-25 on Chromosorb W HP (100 - 120M), injector temp. = 275OC, column temp. = 240OC, manifold temp. = 265OC, detector temp. = 265OC; N2 carrier flow = 60 cc/min.
Brought to you by AltGov2 [www.altgov2.org]
136 Microgram Journal, Volume 6, Numbers 3-4 (July - December, 2008)
The signature compound isolated from procaine-containing samples by one or more of the chromatographicprocedures given above are subjected to MS, UV, and IR identification outlined below.
E. Identification
1. Signature Compound in Benzocaine-Containing Samples
(a) Mass Spectral Analysis
The purified residue obtained above from benzocaine-containing samples was introduced into the GC-MSunder conditions described earlier.
The EI spectrum of the signature compound was rather simple and quite similar to the EI spectrum ofbenzocaine (Fig. 2a and 2b). Benzocaine and the signature compound yielded molecular ions at m/e 165and m/e 193, respectively. Both compounds exhibited prominent ions at (M-28)+, (M-45)+, and (M-73)+. In both compounds, an ion of moderate intensity was noted at m/e 65.
The CI spectra of the signature compound confirmed the molecular weight of 193 obtained from the EIspectrum. This confirmation was supported by the presence in CI of an intense quasi-molecular ion atm/e 194 as well as the expected adduct ions at (M+29)+ and (M+41)+.
The EI and CI data obtained above suggested the signature compound to be closely related to benzocaine,but substituted with a functional group of 29 mass units, such as an ethyl or formyl substituent.
(b) UV Analysis
In methanol, benzocaine yielded a UV maximum at 292 nm, while the signature compound gave amaximum at 269 nm. This hypsochromic shift of 23 nm would suggest that an electron withdrawinggroup had been introduced in the phenyl ring of benzocaine, probably para- to the carboxyethyl group. Inspection of the benzocaine molecule revealed that substitution on the highly reactive amino functionwould be a likely occurrence. The substitution of an ethyl group on the amino function would have aninductive effect which would probably increase the wavelength of UV maximum. However, theintroduction of a formyl group would decrease the interaction of the lone pair of electrons of nitrogenwith the phenyl ring resulting in a decrease in wavelength of UV maximum.
Since MS and UV analyses suggested the signature compound to be N-formyl substituted benzocaine, aninfrared analysis was done to support this postulation.
(c) Infrared Analysis [12,13]
The infrared spectra (KBr medium) of benzocaine and the signature compound were studied and found tobe similar, but not identical. The IR spectrum of the signature compound supported a formyl substituenton the amino function of benzocaine. While benzocaine exhibited three bands between 3500 and 3200cm-1 due to asymmetric, symmetric, and bonded NH2 stretching vibrations, the signature compoundexhibited only one intense band at 3310 cm-1. This was strong evidence that substitution on the nitrogenfunction had occurred. This was further supported by the absence of the intense NH bending vibrationalband found at 1630 cm-1 in primary aromatic amines such as benzocaine. The substituent on the nitrogenfunction was probably carbonyl as supported by an additional carbonyl band at 1700 cm-1 and a band at1530 cm-1 due probably to the NH bending vibration found in amides (Amide II band).
Brought to you by AltGov2 [www.altgov2.org]
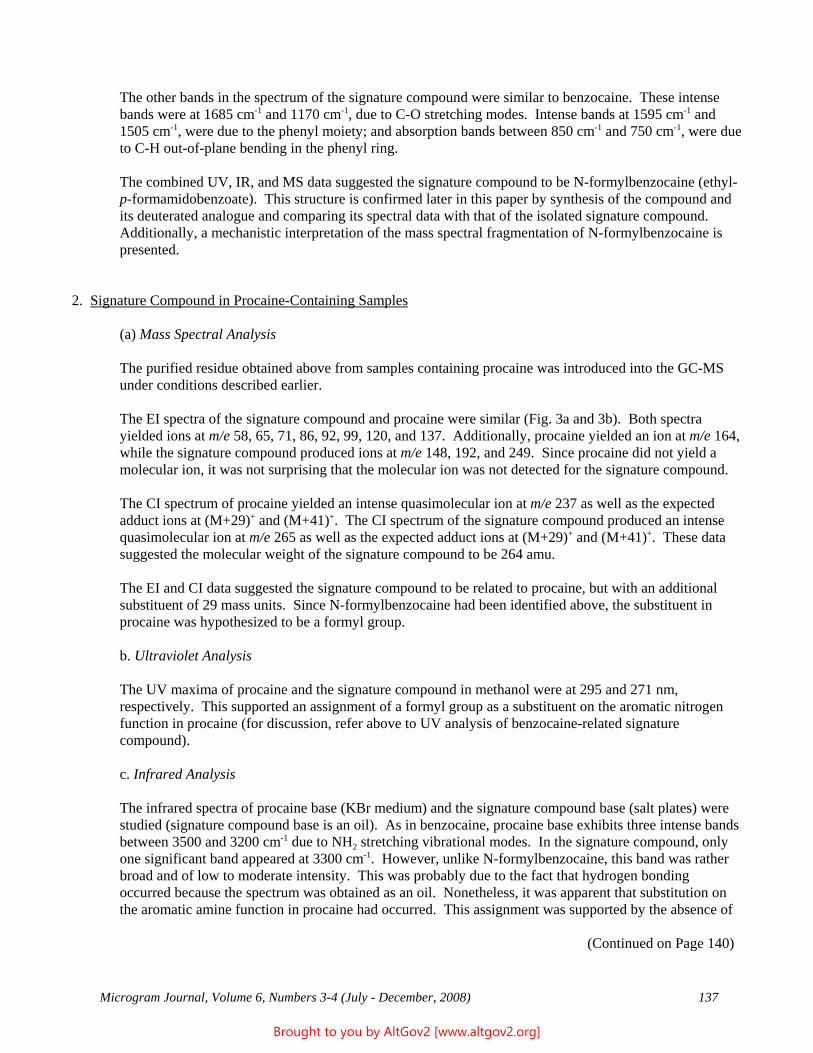
Microgram Journal, Volume 6, Numbers 3-4 (July - December, 2008) 137
The other bands in the spectrum of the signature compound were similar to benzocaine. These intensebands were at 1685 cm-1 and 1170 cm-1, due to C-O stretching modes. Intense bands at 1595 cm-1 and1505 cm-1, were due to the phenyl moiety; and absorption bands between 850 cm-1 and 750 cm-1, were dueto C-H out-of-plane bending in the phenyl ring.
The combined UV, IR, and MS data suggested the signature compound to be N-formylbenzocaine (ethyl-p-formamidobenzoate). This structure is confirmed later in this paper by synthesis of the compound andits deuterated analogue and comparing its spectral data with that of the isolated signature compound. Additionally, a mechanistic interpretation of the mass spectral fragmentation of N-formylbenzocaine ispresented.
2. Signature Compound in Procaine-Containing Samples
(a) Mass Spectral Analysis
The purified residue obtained above from samples containing procaine was introduced into the GC-MSunder conditions described earlier.
The EI spectra of the signature compound and procaine were similar (Fig. 3a and 3b). Both spectrayielded ions at m/e 58, 65, 71, 86, 92, 99, 120, and 137. Additionally, procaine yielded an ion at m/e 164,while the signature compound produced ions at m/e 148, 192, and 249. Since procaine did not yield amolecular ion, it was not surprising that the molecular ion was not detected for the signature compound.
The CI spectrum of procaine yielded an intense quasimolecular ion at m/e 237 as well as the expectedadduct ions at (M+29)+ and (M+41)+. The CI spectrum of the signature compound produced an intensequasimolecular ion at m/e 265 as well as the expected adduct ions at (M+29)+ and (M+41)+. These datasuggested the molecular weight of the signature compound to be 264 amu.
The EI and CI data suggested the signature compound to be related to procaine, but with an additionalsubstituent of 29 mass units. Since N-formylbenzocaine had been identified above, the substituent inprocaine was hypothesized to be a formyl group.
b. Ultraviolet Analysis
The UV maxima of procaine and the signature compound in methanol were at 295 and 271 nm,respectively. This supported an assignment of a formyl group as a substituent on the aromatic nitrogenfunction in procaine (for discussion, refer above to UV analysis of benzocaine-related signaturecompound).
c. Infrared Analysis
The infrared spectra of procaine base (KBr medium) and the signature compound base (salt plates) werestudied (signature compound base is an oil). As in benzocaine, procaine base exhibits three intense bandsbetween 3500 and 3200 cm-1 due to NH2 stretching vibrational modes. In the signature compound, onlyone significant band appeared at 3300 cm-1. However, unlike N-formylbenzocaine, this band was ratherbroad and of low to moderate intensity. This was probably due to the fact that hydrogen bondingoccurred because the spectrum was obtained as an oil. Nonetheless, it was apparent that substitution onthe aromatic amine function in procaine had occurred. This assignment was supported by the absence of
(Continued on Page 140)
Brought to you by AltGov2 [www.altgov2.org]
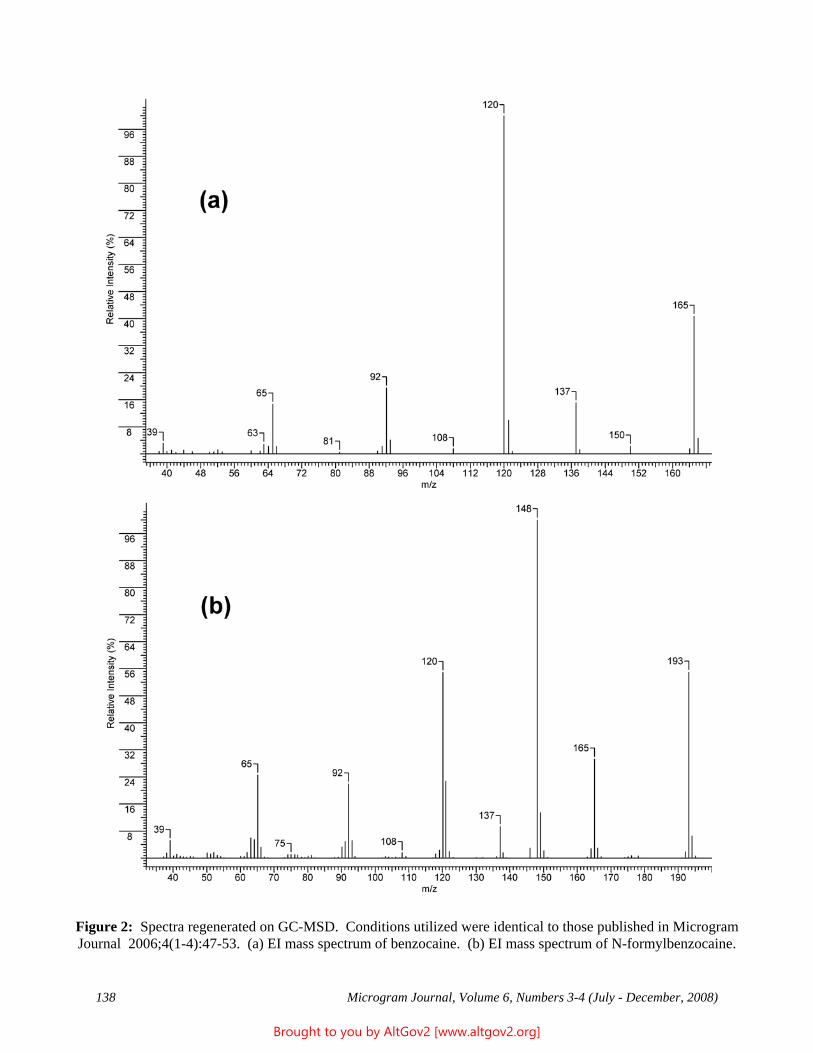
138 Microgram Journal, Volume 6, Numbers 3-4 (July - December, 2008)
Figure 2: Spectra regenerated on GC-MSD. Conditions utilized were identical to those published in MicrogramJournal 2006;4(1-4):47-53. (a) EI mass spectrum of benzocaine. (b) EI mass spectrum of N-formylbenzocaine.
Brought to you by AltGov2 [www.altgov2.org]
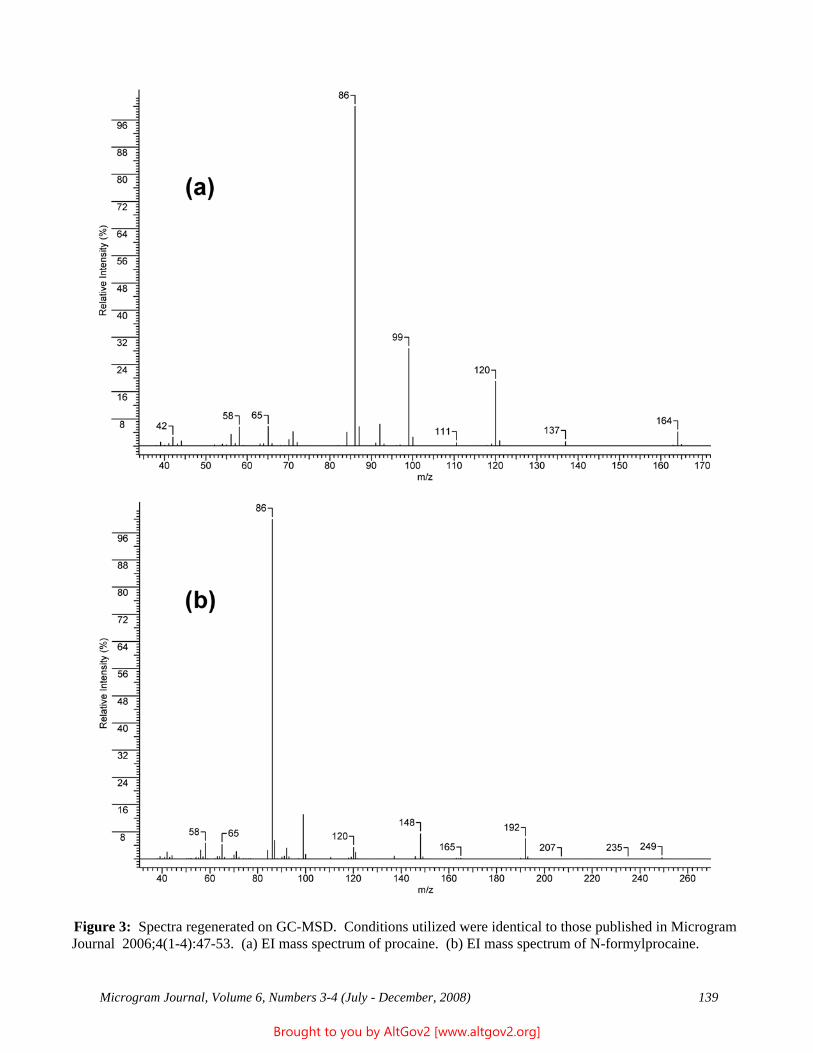
Microgram Journal, Volume 6, Numbers 3-4 (July - December, 2008) 139
Figure 3: Spectra regenerated on GC-MSD. Conditions utilized were identical to those published in Microgram Journal 2006;4(1-4):47-53. (a) EI mass spectrum of procaine. (b) EI mass spectrum of N-formylprocaine.
Brought to you by AltGov2 [www.altgov2.org]
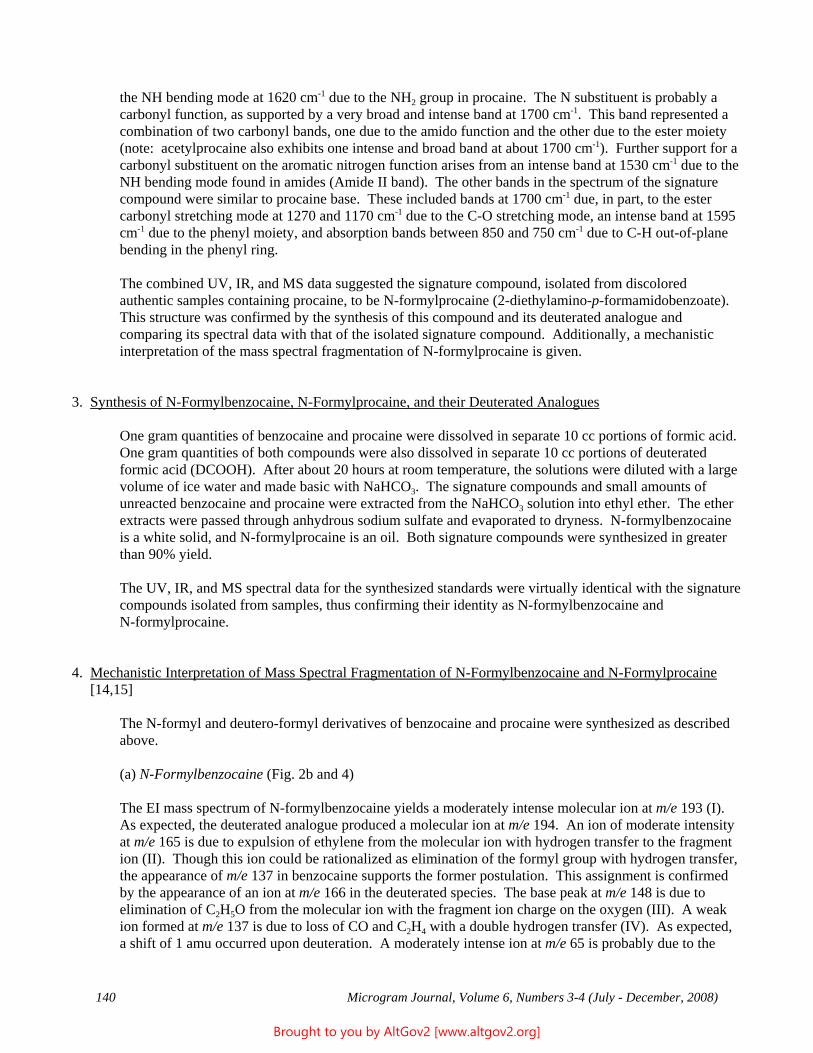
140 Microgram Journal, Volume 6, Numbers 3-4 (July - December, 2008)
the NH bending mode at 1620 cm-1 due to the NH2 group in procaine. The N substituent is probably acarbonyl function, as supported by a very broad and intense band at 1700 cm-1. This band represented acombination of two carbonyl bands, one due to the amido function and the other due to the ester moiety(note: acetylprocaine also exhibits one intense and broad band at about 1700 cm-1). Further support for acarbonyl substituent on the aromatic nitrogen function arises from an intense band at 1530 cm-1 due to theNH bending mode found in amides (Amide II band). The other bands in the spectrum of the signaturecompound were similar to procaine base. These included bands at 1700 cm-1 due, in part, to the estercarbonyl stretching mode at 1270 and 1170 cm-1 due to the C-O stretching mode, an intense band at 1595cm-1 due to the phenyl moiety, and absorption bands between 850 and 750 cm-1 due to C-H out-of-planebending in the phenyl ring.
The combined UV, IR, and MS data suggested the signature compound, isolated from discoloredauthentic samples containing procaine, to be N-formylprocaine (2-diethylamino-p-formamidobenzoate). This structure was confirmed by the synthesis of this compound and its deuterated analogue andcomparing its spectral data with that of the isolated signature compound. Additionally, a mechanisticinterpretation of the mass spectral fragmentation of N-formylprocaine is given.
3. Synthesis of N-Formylbenzocaine, N-Formylprocaine, and their Deuterated Analogues
One gram quantities of benzocaine and procaine were dissolved in separate 10 cc portions of formic acid. One gram quantities of both compounds were also dissolved in separate 10 cc portions of deuteratedformic acid (DCOOH). After about 20 hours at room temperature, the solutions were diluted with a largevolume of ice water and made basic with NaHCO3. The signature compounds and small amounts ofunreacted benzocaine and procaine were extracted from the NaHCO3 solution into ethyl ether. The etherextracts were passed through anhydrous sodium sulfate and evaporated to dryness. N-formylbenzocaineis a white solid, and N-formylprocaine is an oil. Both signature compounds were synthesized in greaterthan 90% yield.
The UV, IR, and MS spectral data for the synthesized standards were virtually identical with the signaturecompounds isolated from samples, thus confirming their identity as N-formylbenzocaine andN-formylprocaine.
4. Mechanistic Interpretation of Mass Spectral Fragmentation of N-Formylbenzocaine and N-Formylprocaine [14,15]
The N-formyl and deutero-formyl derivatives of benzocaine and procaine were synthesized as describedabove.
(a) N-Formylbenzocaine (Fig. 2b and 4)
The EI mass spectrum of N-formylbenzocaine yields a moderately intense molecular ion at m/e 193 (I). As expected, the deuterated analogue produced a molecular ion at m/e 194. An ion of moderate intensityat m/e 165 is due to expulsion of ethylene from the molecular ion with hydrogen transfer to the fragmention (II). Though this ion could be rationalized as elimination of the formyl group with hydrogen transfer,the appearance of m/e 137 in benzocaine supports the former postulation. This assignment is confirmedby the appearance of an ion at m/e 166 in the deuterated species. The base peak at m/e 148 is due toelimination of C2H5O from the molecular ion with the fragment ion charge on the oxygen (III). A weakion formed at m/e 137 is due to loss of CO and C2H4 with a double hydrogen transfer (IV). As expected,a shift of 1 amu occurred upon deuteration. A moderately intense ion at m/e 65 is probably due to the
Brought to you by AltGov2 [www.altgov2.org]
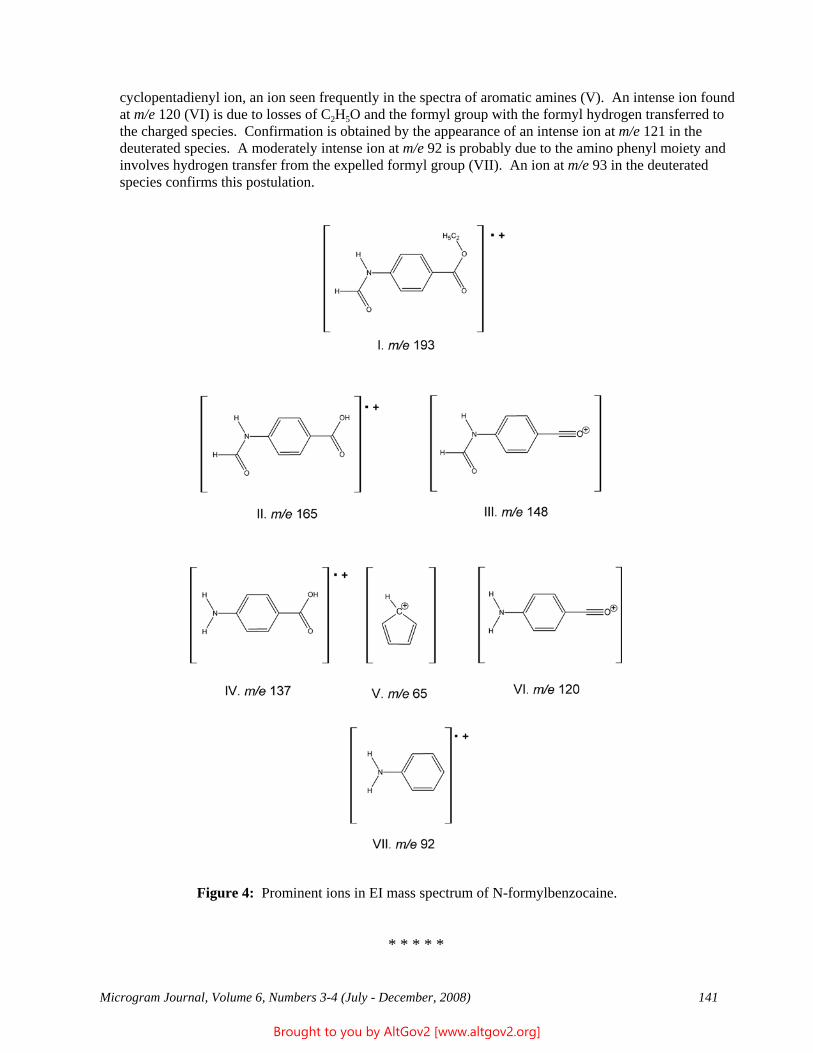
Microgram Journal, Volume 6, Numbers 3-4 (July - December, 2008) 141
cyclopentadienyl ion, an ion seen frequently in the spectra of aromatic amines (V). An intense ion foundat m/e 120 (VI) is due to losses of C2H5O and the formyl group with the formyl hydrogen transferred tothe charged species. Confirmation is obtained by the appearance of an intense ion at m/e 121 in thedeuterated species. A moderately intense ion at m/e 92 is probably due to the amino phenyl moiety andinvolves hydrogen transfer from the expelled formyl group (VII). An ion at m/e 93 in the deuteratedspecies confirms this postulation.
Figure 4: Prominent ions in EI mass spectrum of N-formylbenzocaine.
* * * * *
Brought to you by AltGov2 [www.altgov2.org]
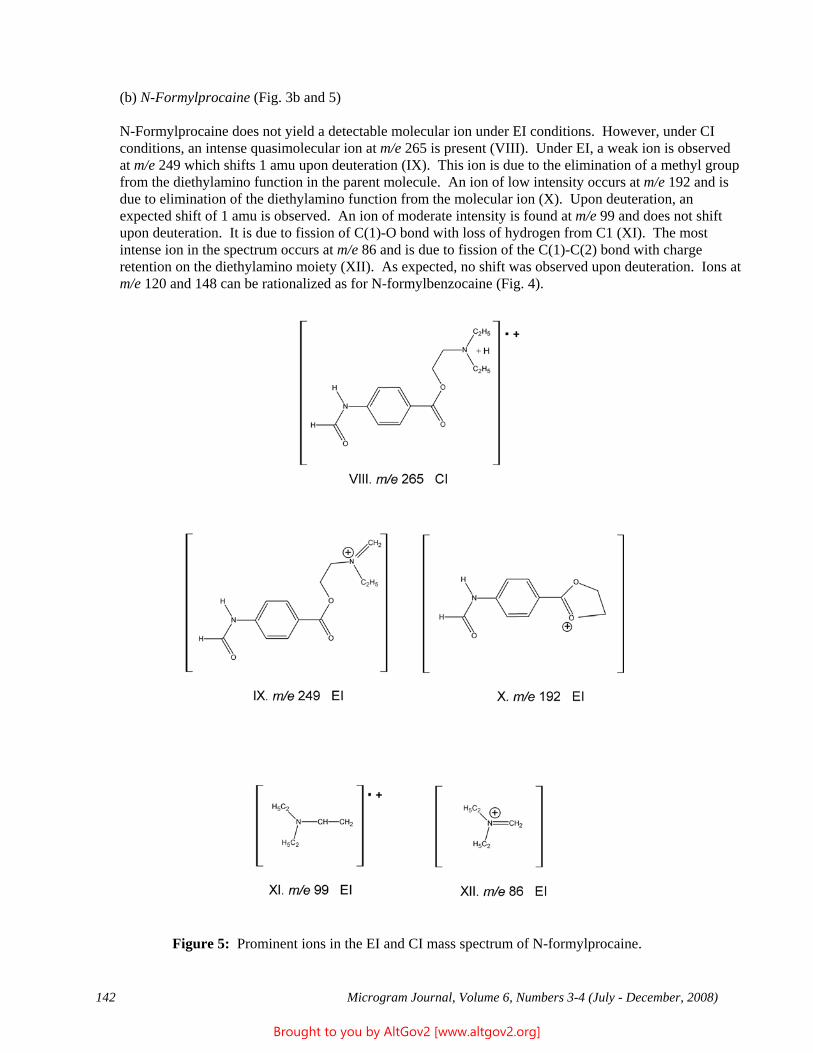
142 Microgram Journal, Volume 6, Numbers 3-4 (July - December, 2008)
(b) N-Formylprocaine (Fig. 3b and 5)
N-Formylprocaine does not yield a detectable molecular ion under EI conditions. However, under CIconditions, an intense quasimolecular ion at m/e 265 is present (VIII). Under EI, a weak ion is observedat m/e 249 which shifts 1 amu upon deuteration (IX). This ion is due to the elimination of a methyl groupfrom the diethylamino function in the parent molecule. An ion of low intensity occurs at m/e 192 and isdue to elimination of the diethylamino function from the molecular ion (X). Upon deuteration, anexpected shift of 1 amu is observed. An ion of moderate intensity is found at m/e 99 and does not shiftupon deuteration. It is due to fission of C(1)-O bond with loss of hydrogen from C1 (XI). The mostintense ion in the spectrum occurs at m/e 86 and is due to fission of the C(1)-C(2) bond with chargeretention on the diethylamino moiety (XII). As expected, no shift was observed upon deuteration. Ions atm/e 120 and 148 can be rationalized as for N-formylbenzocaine (Fig. 4).
Figure 5: Prominent ions in the EI and CI mass spectrum of N-formylprocaine.
Brought to you by AltGov2 [www.altgov2.org]
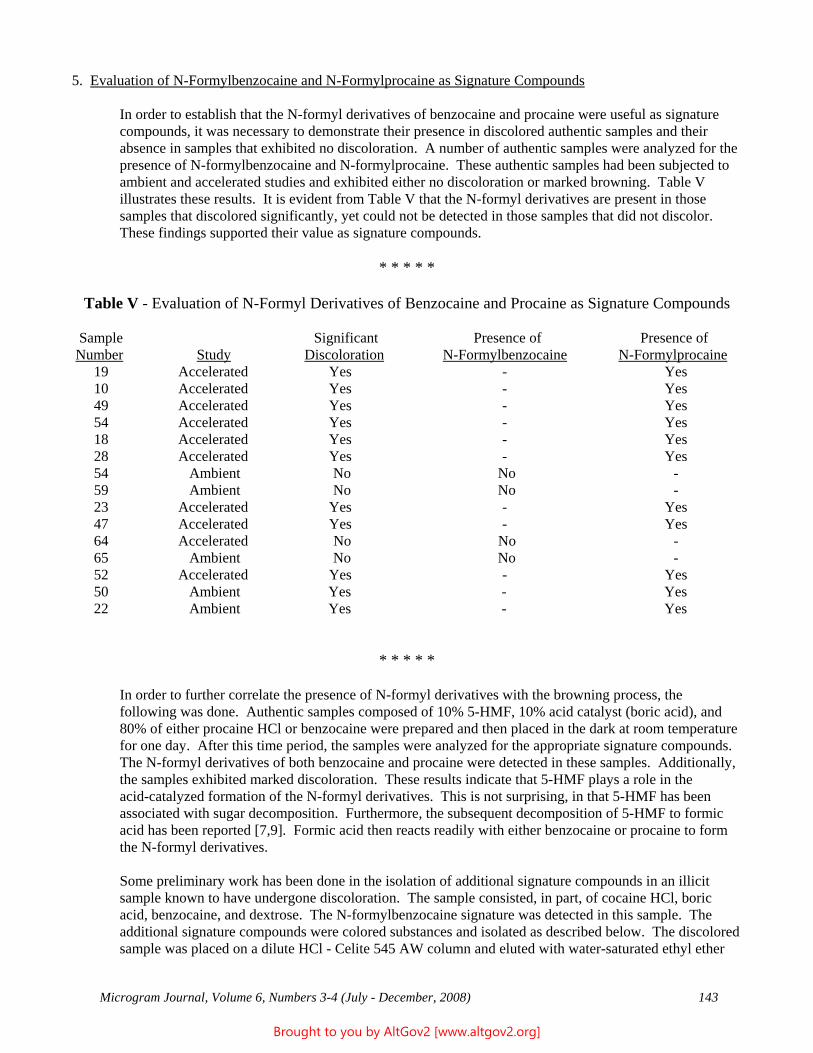
Microgram Journal, Volume 6, Numbers 3-4 (July - December, 2008) 143
5. Evaluation of N-Formylbenzocaine and N-Formylprocaine as Signature Compounds
In order to establish that the N-formyl derivatives of benzocaine and procaine were useful as signaturecompounds, it was necessary to demonstrate their presence in discolored authentic samples and theirabsence in samples that exhibited no discoloration. A number of authentic samples were analyzed for thepresence of N-formylbenzocaine and N-formylprocaine. These authentic samples had been subjected toambient and accelerated studies and exhibited either no discoloration or marked browning. Table Villustrates these results. It is evident from Table V that the N-formyl derivatives are present in thosesamples that discolored significantly, yet could not be detected in those samples that did not discolor. These findings supported their value as signature compounds.
* * * * *
Table V - Evaluation of N-Formyl Derivatives of Benzocaine and Procaine as Signature Compounds
Sample Significant Presence of Presence of Number Study Discoloration N-Formylbenzocaine N-Formylprocaine 19 Accelerated Yes - Yes 10 Accelerated Yes - Yes 49 Accelerated Yes - Yes 54 Accelerated Yes - Yes 18 Accelerated Yes - Yes 28 Accelerated Yes - Yes 54 Ambient No No - 59 Ambient No No - 23 Accelerated Yes - Yes 47 Accelerated Yes - Yes 64 Accelerated No No - 65 Ambient No No - 52 Accelerated Yes - Yes 50 Ambient Yes - Yes 22 Ambient Yes - Yes
* * * * *
In order to further correlate the presence of N-formyl derivatives with the browning process, thefollowing was done. Authentic samples composed of 10% 5-HMF, 10% acid catalyst (boric acid), and80% of either procaine HCl or benzocaine were prepared and then placed in the dark at room temperaturefor one day. After this time period, the samples were analyzed for the appropriate signature compounds. The N-formyl derivatives of both benzocaine and procaine were detected in these samples. Additionally,the samples exhibited marked discoloration. These results indicate that 5-HMF plays a role in theacid-catalyzed formation of the N-formyl derivatives. This is not surprising, in that 5-HMF has beenassociated with sugar decomposition. Furthermore, the subsequent decomposition of 5-HMF to formicacid has been reported [7,9]. Formic acid then reacts readily with either benzocaine or procaine to formthe N-formyl derivatives.
Some preliminary work has been done in the isolation of additional signature compounds in an illicitsample known to have undergone discoloration. The sample consisted, in part, of cocaine HCl, boricacid, benzocaine, and dextrose. The N-formylbenzocaine signature was detected in this sample. Theadditional signature compounds were colored substances and isolated as described below. The discoloredsample was placed on a dilute HCl - Celite 545 AW column and eluted with water-saturated ethyl ether
Brought to you by AltGov2 [www.altgov2.org]
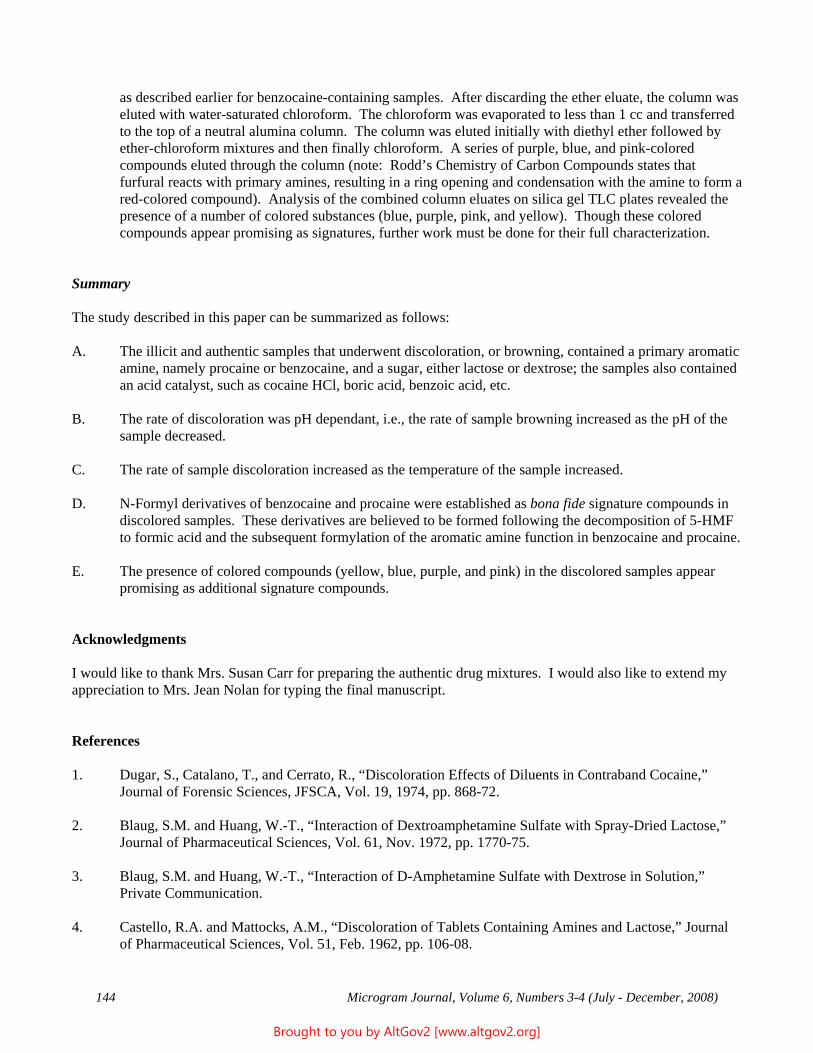
144 Microgram Journal, Volume 6, Numbers 3-4 (July - December, 2008)
as described earlier for benzocaine-containing samples. After discarding the ether eluate, the column waseluted with water-saturated chloroform. The chloroform was evaporated to less than 1 cc and transferredto the top of a neutral alumina column. The column was eluted initially with diethyl ether followed byether-chloroform mixtures and then finally chloroform. A series of purple, blue, and pink-coloredcompounds eluted through the column (note: Rodd’s Chemistry of Carbon Compounds states thatfurfural reacts with primary amines, resulting in a ring opening and condensation with the amine to form ared-colored compound). Analysis of the combined column eluates on silica gel TLC plates revealed thepresence of a number of colored substances (blue, purple, pink, and yellow). Though these coloredcompounds appear promising as signatures, further work must be done for their full characterization.
Summary
The study described in this paper can be summarized as follows:
A. The illicit and authentic samples that underwent discoloration, or browning, contained a primary aromaticamine, namely procaine or benzocaine, and a sugar, either lactose or dextrose; the samples also containedan acid catalyst, such as cocaine HCl, boric acid, benzoic acid, etc.
B. The rate of discoloration was pH dependant, i.e., the rate of sample browning increased as the pH of thesample decreased.
C. The rate of sample discoloration increased as the temperature of the sample increased.
D. N-Formyl derivatives of benzocaine and procaine were established as bona fide signature compounds indiscolored samples. These derivatives are believed to be formed following the decomposition of 5-HMFto formic acid and the subsequent formylation of the aromatic amine function in benzocaine and procaine.
E. The presence of colored compounds (yellow, blue, purple, and pink) in the discolored samples appearpromising as additional signature compounds.
Acknowledgments
I would like to thank Mrs. Susan Carr for preparing the authentic drug mixtures. I would also like to extend myappreciation to Mrs. Jean Nolan for typing the final manuscript.
References
1. Dugar, S., Catalano, T., and Cerrato, R., “Discoloration Effects of Diluents in Contraband Cocaine,”Journal of Forensic Sciences, JFSCA, Vol. 19, 1974, pp. 868-72.
2. Blaug, S.M. and Huang, W.-T., “Interaction of Dextroamphetamine Sulfate with Spray-Dried Lactose,”Journal of Pharmaceutical Sciences, Vol. 61, Nov. 1972, pp. 1770-75.
3. Blaug, S.M. and Huang, W.-T., “Interaction of D-Amphetamine Sulfate with Dextrose in Solution,”Private Communication.
4. Castello, R.A. and Mattocks, A.M., “Discoloration of Tablets Containing Amines and Lactose,” Journalof Pharmaceutical Sciences, Vol. 51, Feb. 1962, pp. 106-08.
Brought to you by AltGov2 [www.altgov2.org]
Microgram Journal, Volume 6, Numbers 3-4 (July - December, 2008) 145
5. Duvall, R.N., Koshy, K.T., and Pyles, J.W., “Comparison of Reactivity of Amphetamine,Methamphetamine and Dimethylamphetamine with Lactose and Related Compounds,” Journal ofPharmaceutical Sciences, Vol. 54, April 1965, pp. 607-11.
6. Duvall, R.N., Koshy, K.T., and Dashiell, R.E., “Comparative Evaluation of Dextrose and Spray-DriedLactose in Direct Compression Systems,” Journal of Pharmaceutical Sciences, Vol. 54, Aug. 1965, pp.1196-1200.
7. Wolfrom, M.L., Scheutz, R.D., and Cavalieri, L.F., “Chemical Interactions of Amino Compounds andSugars. IV. Significance of Furan Derivatives in Color Formation,” Journal of the American ChemicalSociety, Vol. 71, Oct. 1949, pp. 3518.
8. Wolfrom, M.L., Scheutz, R.D., and Cavalieri, L.F., “Chemical Interactions of Amino Compounds andSugars. III. The conversion of D-Glucose to 5-(Hydroxymethyl)-2-furaldehyde,” Journal of theAmerican Chemical Society, Vol. 70, 1948, pp. 514-17.
9. Singh, B., Dean, G.R., and Cantor, S.M., “The Role of 5-(Hydroxymethyl)-furfural in the Discolorationof Sugar Solutions,” Journal of the American Chemical Society, Vol. 70, 1948, pp. 517-22.
10. Scallet, B.L. and Gardner, J.H., “Formation of 5-Hydroxymethylfurfural from D-Glucose in AqueousSolutions,” Journal of the American Chemical Society, Vol. 67, 1945, pp. 1934-35.
11. Janicki, C.A. and Almond, Jr., H.R., “Reaction of Haloperidol with 5-(Hydroxymethyl)-2-furfuraldehyde,an Impurity in Anhydrous Lactose,” Journal of Pharmaceutical Sciences, Vol. 63, Jan. 1974, pp. 41-43.
12. Nakanishi, K., Infrared Absorption Spectroscopy, Holden-Day, Inc., San Francisco, 1963.
13. Rao, C.N.R., Chemical Applications of Infrared Spectroscopy, Academic Press, New York, 1963.
14. Budzikiewicz, H., Djerassi, C., and Williams, D.H., Interpretation of Mass Spectra of OrganicCompounds, Holden-Day, Inc., San Francisco, 1965.
15. McLafferty, F.W., Interpretation of Mass Spectra, W.A. Benjamin, Inc., Reading, Massachusetts, 1973.
- - - - - - - - - -
* * * * *
Brought to you by AltGov2 [www.altgov2.org]