Trade Liberalization and the Great Labor Reallocation - IZA ...
Upload
independentCategory
view
0download
0
Economic Effects of Air Transport Market Liberalization
in Africa
Megersa Abate Swedish National Road and Transport Research Institute (VTI)
CTS Working Paper 2014:23
Abstract Although the aviation industry is increasingly becoming important for Africa's
economic development and integration, the ability of airlines to access foreign
markets remains hindered by restrictive regulatory policies. Attempts have
been made to fully liberalize the intra-African air transport market. Except for
general assertions about the merits/demerits of liberalization, our empirical
understanding of the welfare effects of such polices in Africa remains
rudimentary. This study empirically measures the economic effects of air
transport liberalization, mainly on two supply side variables: fare and service
quality, measured as departure frequency. The results show up to 40 %
increase in departure frequency in routes that experienced some type of
liberalization compared to those governed by restrictive bilateral air service
agreements. While the effect of liberalization is substantial in improving
service quality, there is no evidence of its fare reducing effect.
Keywords: Air Transport, Liberalization, Yamoussoukro Decision, Bilateral Air Service
Agreements
JEL Codes: L93, L51, R4
Centre for Transport Studies SE-100 44 Stockholm Sweden www.cts.kth.se


Economic Effects of Air Transport Market Liberalizationin Africa
Megersa Abate∗†
October 30, 2014
Abstract
Although the aviation industry is increasingly becoming important for Africa’s economicdevelopment and integration, the ability of airlines to access foreign markets remainshindered by restrictive regulatory policies. Attempts have been made to fully liberalize theintra-African air transport market. Except for general assertions about the merits/demeritsof liberalization, our empirical understanding of the welfare effects of such polices in Africaremains rudimentary. This study empirically measures the economic effects of air transportliberalization, mainly on two supply side variables: fare and service quality, measured asdeparture frequency. The empirical models evaluate how air fares and departure frequencyrespond to measures of openness in air services agreements, while controlling for otherdeterminants. The results show up to 40% increase in departure frequency in routes thatexperienced some type of liberalization compared to those governed by restrictive bilateralair service agreements. Furthermore, there is a relatively larger increase in departurefrequency in routes which experienced partial liberalization compared to fully liberalizedones. This can be explained by the diminishing marginal effect of progressive liberalizationon departure frequency. While the effect of liberalization is substantial in improving servicequality, there is no evidence of its fare reducing effect.
Keywords: Air Transport; Liberalization;Yamoussoukro Decision; Bilateral Air Service AgreementsJEL Classification : L93, L51, R4
∗The author would like to thank Eyob Estifanos, Abbi Kedir, Charles Schlumberger, Eyerusalem Siba,Mark Smyth, Tewodros Tamirat and participants in the 2013 African Economic Conference and the 2014 AirTransport Research Society Conference for helpful comments and suggestions. Financial support from theCenter for Transport Studies at KTH, Stockholm and the African Economic Research Consortium is gratefullyacknowledged. The usual disclaimer applies.†Correspondence: Swedish National Road and Transport Research Institute (VTI), Box 8072 / SE-402 78
Gothenburg, Sweden. E-mail: [email protected]
1

1 Introduction
For many African countries, air transport is a vital corridor for international passengerand freight flows. The presence of an efficient air transport service increases the economiccompetitiveness of African countries by facilitating access to the world market and enhancingregional integration. It also eases labor mobility and tourism. While the virtues of airtransport are widely known, non-physical barriers continue to impede air transport serviceexpansion between African countries. These barriers mainly stem from restrictive regulatoryarrangements which dictate how the service is rendered. Owing to this trade-deterring impactof restrictive regimes, there has been a general move toward liberalization in the world.
Major aviation markets have long embarked on liberal domestic and international regulatoryregimes (for a comprehensive review of regulatory reforms, see Oum et al (2010) and Borensteinand Rose (2007)). Following this trend, African countries initiated several liberalizationinitiatives at the bilateral, regional and continental levels. The Yamoussoukro Decision (YD)of 1999 is the umbrella arrangement which consolidated these liberalization initiatives. Ifits liberal provisions were fully implemented, the decision would liberalize the intra-Africanair transport market and give African airlines commercial opportunities on an equal basis.Although the YD is full of promise, its implementation has not been satisfactory.
A major implementation challenge has been the lack of adequate knowledge on the economiceffects of the full implementation of the YD. Will full liberalization of the intra-African airtransport market lead to an improvement in service quality and reduction in fares? Or willit result in the disappearance of smaller airlines and abuse of market power by big airlines?In order to fully implement the YD, these questions have to be thoroughly analyzed. Exceptfor general beliefs and assertions by policy makers and airlines on the merits/demerits ofliberalization, so far there have been very limited empirical studies try to systematicallyevaluate these questions.
The current paper makes important contributions by systematically assessing the economiceffects of liberalizing intra-Africa air transport, contributing to a small but growing literature.The main existing studies are Ismaila et al (2014); InterVISTAS (2014); Chingosho (2009);ICAO (2003); Morrison (2004); Schlumberger (2010); and UNECA (2001). See Heinz andO’Connell (2013) for a detailed analysis of air transport business models in Africa and Ssamulaand Venter (2013) for analysis of airline networks in Africa. Except for Ismaila et al (2014)and InterVISTAS (2014), none of these studies empirically measure the economic effects ofliberalization as in this study.
2

This study evaluates the economic effects of air transport liberalization in Africa. It doesso by developing two econometric models to analyze the effects of liberalizing Bilateral AirTransport Services Agreements (BASAs). Fare and departure frequency models were estimatedto analyze the causal effects of liberalization polices in reducing fares and improving servicequality, as would be expected under liberalization. In line with Schipper et al. (2002) andDresner and Tretheway (1992), all the models were estimated using panel data methods. Theempirical analyses are based on passenger flows between a panel 20 African city-pair routesto/from Addis Ababa in the period 2000-2005. The data is unique and describes routes thatrepresent varying degrees of liberalization and distances. These routes can help us see theeffect of liberal policies in the presence of a dominant airline (Ethiopian Airlines) in a thinmarket, which is common in many regions in Africa.
The results show an increase of up to 40% in departure frequency in routes that experiencedsome type of liberalization compared to those governed by restrictive bilateral arrangements.Furthermore, there is a greater increase in departure frequency in routes which experiencedpartial liberalization compared to fully liberalized ones. By contrast, analysis of the effectof liberalization on air fare did not result in a statistically significant effect, which rules outwelfare gains from reduced fares. The rest of the paper is organized as follows: Section 2presents an overview of the airline industry in Africa and its regulatory context; Section 3 andSection 4 present the empirical model and the data; Section 5 presents the main findings; andSection 6 concludes and provides policy implications of the main findings.
2 The airline industry in Africa and its regulation: a brief overview
2.1 African airlines
The air transport sub-sector in Africa is full of contradictions. There are a number of conditionswhich could make the aviation industry thrive in the continent. Africa’s population size (1.1billion) and large landmass (30.2 ml km2) presents a favorable environment for the air transportindustry. The facts that almost a third of African countries (16 out of 54) are landlockedand that alternative modes of transport are under-developed make air transport all the moreimportant.1While these conditions are seemingly favorable, decades of economic stagnationand low per-capita incomes in many African countries have made commercial aviation in Africathe least developed in the world.
1According to the African Development Bank, in 2010 the aviation industry in Africa supported about 7million jobs (including 257,000 direct jobs), worth USD 67.8 billion of the continent’s GDP (AFDB, 2012).
3

Africa accounts for a small share (2%) of global air traffic flow. The majority of Africancountries depend on a few African and foreign airlines for air service. AFRAA (2010) reportsthat about 65% of the air traffic to and from Africa is carried by foreign airlines. This skewedstatistic reflects underlying problems in Africa. Most African countries do not have a competentairline that can operate international services, which allows foreign airlines to capitalize onslack demand. The dominance of foreign airlines is also a reflection of African airlines’ severcapacity constraint. In 2006, they operated a total of 639 aircraft, fewer than the total aircraftowned by a major American or European airline (Airclaims, 2006).2 See Figure 1 which showsmajor African airline destinations.
Intercontinental passenger flow (45%) constitutes far more than intra-African flow (22%)(AFRAA, 2010). This traffic flow mirrors Africa’s trade statistics, which show that thecontinent trades much more with the rest of the world than with itself (only 11.3% of Africa’strade is within the continent; UNCTAD, 2013). The big market share of intercontinentaltraffic is also attributed to the route network of African airlines, which is characterized bypoor regional networks and greater focus on route development outside of sub-Saharan Africa,mostly to European capitals (UNECA, 2005) and in recent years to the Middle East and theFar East. There is too little intra-African air traffic to sustain the operation of several airlineson a particular route.
The prospects of the African air transport industry are relatively promising. According toBoeing’s estimates, a robust international passenger annual growth rate of 6.6% is expected inthe 2011 to 2031 period in Africa, well above the previous long-term industry average rate of5% (Boeing, 2012). This forecast is based on sustained GDP growth, the rise of the Africanmiddle-class consumer, and urbanization.3To promote the realization of this optimistic outlook,it is crucial to put in place the right set of regulatory regimes that foster a productive aviationindustry with the participation of African airlines.
2.2 The regulatory context of the intra-African air transport market
As in many international industries, airline industry regulation has shifted toward liberalization.This shift had its beginning when the US deregulated its domestic market in the late 1970s.Subsequently, the US started to follow a liberal ’Open Skies’ policy in its air transport servicesnegotiations with the rest of the world.4 In 1993, the EU also created a single market in which
2A case in point, Lufthansa, which flies to 35 African destinations, owns 672 aircraft (Lufthansa Group,2013).
3It has been shown that growth in GDP explains about two-thirds of air travel growth (ATAG, 2004).4The ’Open Skies’ policy refers to airline markets where there is little or no regulation of activities that
restrict competition. It could be applied to a bilateral agreement, in which there are no capacity, entry or priceregulations on the airlines of the bilateral partners that do, or might, serve the route. Such agreements willtypically allow for more competition between the airlines of the partner countries and they make more tradepossible (Forsyth, pp. 56, 2001).
4
member countries’ airlines are given freedom of establishment, market access, capacity andtariff (fare) fixing for air transport within its borders.
In Africa, a similar continent-wide package is the ’Yamoussoukro Decision’ (YD), whichwas adopted in 1999 by heads of states to progressively open air transport within the continent.The YD was expected to progressively eliminate all non-physical barriers relating to grantingof traffic rights, particularly fifth traffic rights; aircraft capacity; tariff regulation; designationof airlines; and air freight operations (UNECA, 2002). According to Article 7 of the decision,provisions of the YD take precedence over all previous BASAs signed between African countries.The practice so far, however, has been that individual countries negotiate bilaterally based onthe YD provisions. Hence, each country has control of the pace and extent of its air transportmarket openness.5
Currently, most international air transport services in Africa are conducted under the webof bilateral agreements that put restrictions on entry (market access), capacity (frequency andaircraft type), and foreign ownership of airlines. In addition, traffic rights, airline designationand fares are also subject to restrictive regulatory control. These agreements are based on areciprocal exchange of rights, which are intended to be exploited by the designated airlines ofbilateral partners.
Table 1 presents the main provisions of the YD compared to traditional BASAs andBASAs that have been liberalized through bilateral negotiations. In terms of fare and capacityregulation, the YD is as open as liberalized BASAs. Provisions concerning traffic rights are alsovery open, but they only cover points in Africa (See Figure A1 in the appendix for definitionof traffic rights). The YD allows ownership of airlines by third states if they are signatories tothe decision, which makes it more liberal than traditional BASAs. The YD is, however, morerestrictive than liberalized bilateral regimes that allow flexible airline ownership.
Although the YD is full of promise, its implementation has not been satisfactory. As a result,BASAs are still the main regulatory mechanism through which African countries conduct theirair transport service relations (Tamirat, 2006). The institutional and legal frameworks requiredfor the implementation of the YD have not been put in place, making enforcement difficult. Theabsent frameworks include executing agencies, competition regulations and dispute settlementmechanisms.6 Countries with smaller airlines are concerned that full implementation of theYD may lead to the disappearance of their airlines as a result of anti-competitive behavior bybigger airlines. This apprehension toward open policy in aviation is akin to one facing regionalintegration initiatives in Africa (Geda and Kibret, 2008).
5Abeyratne (2003) points to this inherent problem of the decision by indicating that the YD resulted in a‘limited open skies regime’ since the ‘State Parties’ have the ultimate discretion on fifth freedom rights.
6Although it is long overdue, the African Civil Aviation Commission (AFCAC) is currently working onsetting up these institutional frameworks (AFCAC, 2013).
5
3 Econometric framework
The basic argument for liberalizing the air transport market is the prospect of direct andindirect gains from competition. Such gains, in the form of reduced air fares and improvedservice quality, have been well documented in the mature aviation markets of North America,Europe, and Australia and to some extent in South East Asia (Winston and Yan, forthcoming;Cristea et al, 2012; Oum et al 2010; Gillen et al, 2002; Australian Productivity Commission1998). However, in less mature airline markets like Africa, where airlines operate in a thinmarket and face capacity and infrastructure constraints, the feasibility of such gains is yet tobe tested.
The empirical model in this paper is based on the proposition that the liberalization ofthe air transport market affects two supply side variables: fares and departure frequency. Wehypothesize that liberalization reduces fares by increasing competition between airlines. Italso improves service quality by increasing departure frequency, a key indicator of quality ofservice in the aviation industry.7 Most African airlines engage in connecting flight operationsdue to the thin point-to-point intra-African market. This demand problem forces airlinesto operate in multiple destinations simultaneously, which requires fifth traffic rights to andbeyond intermediate points of city-pair routes. As more fifth traffic rights are granted underliberalization, airlines can manage to connect more city-pairs in Africa, which in turn leads toimprovements in service quality. What follows presents an econometric model of air transportdemand, followed by models which show the effect of liberalization on fare and departurefrequency.
3.1 Demand model
A standard air transport demand model includes own price (fare) and service quality as themain explanatory variables (Schipper et al, 2002; Dresner and Tretheway, 1992). It also includes’gravity equation’ variables such as the population and GDP of the origin and destinationcountries of a trip, and the distance between them.8 The first two are ’generative’ variablesthat capture a catchment area for potential travelers, whereas distance is an ’impedance’variable because social and economic interactions between countries tend to decline with it.
7Baltagi et al. (1995) view the route structure effects of liberal policies as the most remarkable of all. Thisis due to the fact that air transport is a network industry. Thus, having flexibility in terms of route selection,frequency of operation and aircraft capacity choice allows an airline to operate in the most efficient network.
8The gravity equation has been widely used to explain the flow of bilateral trade between two trading partners(see Tinbergen, 1962 and Anderson and van Wincoop, 2003 for discussion on the theoretical microeconomicfoundations of the gravity equation). It has been successfully applied to analyze policy effects in bilateralair transport flows (Cristea et al., 2014; Yan and Winston, forthcoming; Schipper et al, 2002; Dresner andTretheway, 1992).
6

Accordingly, a reduced form model for air passenger demand for route r in period t is given as:
passrt = β1 +β2fare/kmrt +β3freqrt +β4incomert +β5poprt +β6distrt + εrt (1)
where passrt is the number of round-trip passengers carried in route r during year t;fare/kmrt is the roundtrip economy fare; freqrt is the number of frequency; incomert andpoprt are the product of the per capita income and population size of the route endpointcountries; and distrt is the great circle distance between airports of the route endpoints in km.All the variables are in logs, allowing the coefficient estimates to be interpreted as elasticity.
The inclusion of fare in the passenger demand equation is justified for obvious reasons. Theusage of standard economy fare, however, disregards the fact that airlines offer various faresdepending on the type of traveler (e.g. business or leisure). If possible, the lowest availablefare should be used to study the response of demand to fare level changes. This is because itis more likely that a change in the lowest fare affects air travel decisions, compared to otherfare classes (Mallebiau and Hansen, 1995). Unfortunately, our dataset does not contain faresbased on classes. Despite the potential measurement bias, the widely available economy fareis used in the literature as a proxy (Shipper et al, 2002; Nero, 1998; Dresner and Tretheway,1992).9 Because Addis Ababa is the common end-point of all the routes in the sample, onlythe population and the income of countries at the other end of a route are considered.10 Weexpect these two ‘generative’ variables to have a positive effect on demand, while distance, the‘impedance’ variable, is expected to have a negative effect.
The fare and frequency variables pose an endogeneity problem because of their simultaneousdetermination with demand (the dependent variable). For instance, a higher traffic flow betweentwo cities may lead to realization of economies of traffic density,11 which lowers the averagecost and ultimately leads to a lower fare. There is, therefore, a feedback effect from the left-hand-side variable, ‘pass’, to the fare level. As for frequency, airlines are likely to adjust theirdeparture frequencies as a response to an increase in demand, again reversing the causalitymaintained in our specification. Jorge-Calderon (1997) and Schipper et al. (2002) showthat frequency has a positive effect on demand. However, only the latter accounts for theendogeneity of frequency and fare in the demand equation. We follow a similar empiricalstrategy by Schipper et al. (2002) and estimate separate fare and frequency models.
9Nero (1998) justifies usage of economy class fares by arguing that they are more linked to costs than otherfare categories which are determined as either a ‘mark-up’ or a ‘discount’ on economy fare.
10This is a common approach in the literature; ,see, for example, Oum et al (1993) and Brander and Zhang(1990).
11Caves et al (1984, p.p. 475) define ‘economies of density’ as ‘the proportional increase in output madepossible by a proportional increase in all inputs, with points served, average stage length, average load factor,and input prices held fixed.’ If airlines realize such economies, they may transfer the cost savings to consumersin the form of lower fares.
7

3.2 Fare model
The fare model evaluates how air fares respond to measures of openness in air servicesagreements, while controlling for other determinants. Following Schipper et al (2002), the farelevel between two route endpoints is specified by the following log-linear model:
fare/kmrt = α1 +α2passrt +α3freqrt +α4distrt +α5libfrt +α6libprt +α7incomert +ζrt (2)
where libfrt and libprt are liberalization status dummy variables for fully liberalized andpartially liberalized routes based on BASAs. The liberalization dummies are expected to havea negative effect on fare.
We assume all variables, except passrt and freqrt are exogenous. As noted by Dresnerand Tretheway (1992), the sign of passrt depends on the location of the marginal cost curveon which airlines operate. On the one hand, if they happen to operate on the upward slopingpart of the marginal cost, a higher output level (higher number of passengers) leads to highermarginal cost. The reason behind such a positive effect of demand on fare could be thepresence of a short-run capacity constraint. On the other hand, a negative coefficient of thepassenger variable can occur when airlines operate on the declining part of their marginalcost. The negative effect arises due to the presence of excess capacity and/or realization ofeconomies of traffic density (Nero, 1998). We expect a positive sign for passrt because mostAfrican airlines are faced with capacity constraint. Finally, a negative coefficient is expectedfor distance, showing that cost per kilometer (and hence fare) declines with distance, as fixedcosts incurred at route end points are averaged over a longer distance.
3.3 Frequency model
The departure frequency model is specified as:
freqrt = λ1 +λ2passrt +λ3acsizert +λ4distrt +λ5libfrt +λ6libprt +λ7operatorsrt +υrt (3)
where acsizert and operatorsrt stand for the average number of seats per flight and thenumber of airlines in a route, respectively. The main variables of interest are libfrt andlibprt. Low point-to-point demand in Africa forces airlines to serve multiple destinationssimultaneously. If BASAs allowed fifth traffic right regimes, airlines would supply moreservice frequency by aggregating passengers from intermediate points and points beyond.12
Accordingly, we expect the liberalization dummies to have positive signs, mainly due to theflexible fifth traffic right aspect of liberalized regulatory regimes.
12Malibaue and Hansen (1995) mention fifth traffic operations as sources of dis-utility because they requiremultiple stops, as compared to non-stop services. However, in the context of Africa, the presence of an air linkbetween city pairs is more import than the dis-utility entailed in multiple stops.
8
Furthermore, an increase in the number of airlines in a given route implies a higherdeparture frequency as airlines compete to make suitable service available to consumers.Accordingly, we expect ‘operators’ to have a positive coefficient. Finally, distance and aircraftsize are expected to have a negative effect on frequency. Distance is a major ‘impedance’variable that forces departure frequency to decrease. Operating a larger aircraft (i.e., increasingthe number of seats per flight) effectively results in a decline in total departure frequency.
In the econometric framework outlined in this section, the fare and frequency variablesare assumed to be endogenous in the demand equation. There are several suggestions in theliterature to handle this endogeneity problem.13 The most appropriate methodology to tacklethe problem is a two-stage least square (2SLS) estimation in a panel data setting, suggested byDresner and Tretheway (1992) and Schipper et al. (2002). We employ a similar 2SLS procedure.Although the demand, fare and frequency models can be solved simultaneously, each will beestimated separately using a 2SLS. Doing so allows us to gain interesting insights into theeffects of the parameters in each equation since they have important economic interpretations(Nero, 1998; Marin, 1995).
4 Data
The empirical analysis is based on passenger flows between a panel of 20 African city-pairroutes to/from Addis Ababa in the period 2000-2005. The routes comprise more than 75%of the air links between Addis and other African cities in that period.14 The varying degreeof regulatory status and flight stages (i.e. the operation of an aircraft from take-off to itsnext landing) in the sample provide a unique opportunity to study the economic effects ofliberalization policy. Data on number of passengers, aircraft size, cost and frequency aregathered from statistical publications of Ethiopian Airlines and the Ethiopian Civil AviationAuthority.
The data include all passengers who traveled to/from Addis Ababa, regardless of theirorigin or final destination, whereas the fare and departure frequency variables apply only tothe city-pair routes. The fare data was gathered from the Official Airline Guide (OAG, 2007).
13Marin (1995) applies an instrumental variable estimation method to treat the endogeneity of the passengerand the fare variables. Mallebiau and Hansen (1995) estimate the fare and passenger equations independently,treating the two variables as exogenous in each equation, while Adler and Hashai (2005) estimate a passengerdemand equation that does not contain fare as an explanatory variable. The latter two approaches do not treatthe endogeneity problem directly, and hence estimates based on them may be inconsistent.
14This routes are mainly served by Ethiopian Airlines (EAL), a national airline. Except in its service toKenya, Egypt, Sudan, South Africa and Djibouti, EAL was the sole operator in the routes analyzed in this study.EAL is the largest airline in Africa in both revenue (USD 2.3 billion in 2013) and profit (IATA-WATS, 2014).The airline has been one of the leading airlines in the continent, mainly as a result of strong leadership andfirst-mover advantages – it was founded in 1945, when all other African countries were still under colonization.Its hub airport in Addis Ababa is also a natural gateway to Africa. Its recent success is attributed to pursuit ofmore liberal bilaterals on a reciprocal basis (InterVISTAS, 2014).
9
Information on population, GDP and GDP per capita (both in 2000 USD) was collectedfrom the World Bank Development Indicators online database (WDI, 2007). Table 2 presentssummary statistics of the main variables.
It is a challenge to define the aspects of an air transport liberalization policy that arerelevant for an empirical analysis. The common approach in the literature is to use dummyvariables that show the status of, or change in, a regulatory regime (Schipper et al, 2002;Dresner and Tretheway 1992; Maillebiau and Hansen, 1995; Nero, 1995 and 1998; Gillen etal, 2002). We use a similar approach and define three regulatory status categories basedon BASAs of Ethiopia. Firstly, the relative openness of provisions pertaining to capacity(frequency and aircraft size), fifth traffic rights and fare define the liberalization status of aBASA. In particular, a BASA is categorized as ‘liberal’ if there is no government interferencein the choices of departure frequency and aircraft size, and is defined as ‘restrictive’ otherwise.Secondly, a BASA is defined as ‘liberal’ if it allows fifth traffic rights to all intermediateand beyond points in Africa, and is defined as ‘restrictive’ otherwise. Thirdly, a BASA isdefined as ‘liberal’ if the fare charged by airlines can be invalidated by the disapproval of bothbilateral partners and/or if approval of fares by either countries’ aeronautical authorities isnot mandatory; it is defined as ‘restrictive’ otherwise.
Based on the above three categorizations, the regulatory regime of a BASA is classified as‘fully liberalized’ if it attains liberal status in two or more categories; ‘restrictively liberalized’ ifit attains one liberal status; and ‘restricted’ otherwise. Accordingly, 10 routes fall in the ‘fullyliberalized’ category, while the remaining 10 routes are equally divided into the ‘restrictivelyliberalized’ and ‘restricted’ categories. Table 3 summarizes the provisions of Ethiopia’s BASAsthat are relevant to our sample routes.
5 Results
Table 4 presents results from a 2SLS random effects passenger demand model (E.q.1).15 Theendogenous fare and frequency variables are instrumented by the two liberalization dummies,‘libf’ and ‘libp’, the number of operators and cost variable.16 The coefficient of fare is significantat the 10 % level, and its values suggest that the demand for the city-pair routes is price
15The unobserved effects should be tested to check whether they are fixed or random, depending on theirrelationship to the explanatory variables. Accordingly, we applied the Hausman specification test to contrastthe null hypothesis Ho: corr (εrt, X) = 0 (random effects model) against the alternative H1: corr (εrt, X), 0 (fixed effects model). We failed to reject the null hypothesis, confirming that the random effects modelis appropriate. A Wooldridge (2002) auto-correlation test for panel data was also conducted to test for thepresence of first order auto-correlation (AR (1)). Results from this test indicates that, for all of the threemodels, the null hypothesis of no first-order autocorrelation is rejected.
16See Appendix 2 for details of how the cost variable is calculated.
10

inelastic.17 This fare in-sensitivity of air transport demand is expected, given the type oftravelers in Africa. The low income levels across the continent imply that air transport is stilla luxury service yet to be enjoyed by the masses, which in turn implies that air travelers inAfrica are price insensitive affluent business and leisure travelers. Although leisure travelersare generally shown to be price sensitive in other markets (see, for example, Brons et al, 2002,Ippolito, 1981), lack of adequate alternative modes of transportation within the continentforce them to opt for air transport regardless of the fare level.
Furthermore, departure frequency between the city-pair routes, as expected, has a significantpositive effect on demand at the 1% level. The gravity variables, distance and urban populationhave significant and expected negative and positive effects on demand, respectively.18 Theseresults are in line with the gravity model, which predicts that the chance for air travel betweencountries declines with distance and increases with population size. The income variable isnot significantly different from zero.
Table 4 also presents results from the fare model (E.q. 2). Again the simultaneity betweenthe fare and passenger variables is handled by the 2SLS ‘random effects’ estimation method.We used the population size and number of operators in a route as instruments for the twoendogenous variables, the number of passengers and departure frequencies. Because most ofthe BASAs of Ethiopia went from restrictive to full or partial liberalization status in the post2000 period, it can be difficult to net out the effect of the liberalization policies from otherchanges in the period. To account for time fixed effects, we estimate two models, with andwithout year dummies.
The number of passengers has a positive and significant effect. This result confirms thehypothesis that African airlines face a short-run capacity constraint, which implies that, in theevent of excess demand, they probably tend to increase fare levels to ration seats or capitalizeon short-run demand surges. We also note that, in both models, distance has the expectednegative sign and is highly significant at the 1% level.19 The negative sign indicates thepresence of economies of flight length, which accrue to airlines as fixed costs per flight (take-offand landing costs) are distributed over a longer distance (see the scatter plot of fare/kmagainst distance in Figure 2 that illustrates this relationship).
The main variables of interest in the fare model are the two liberalization dummy variables.We see in Model 1 that full liberalization has a negative effect on fare, significant at the10% level. This result is in line with the hypothesis that a liberalized market arrangementleads to a lower fare. In contrast, partial liberalization appears to be insignificant in both
17Interestingly, it is in the range for business traveler’s elasticity documented by Oum et al (1992). Theyreport the range 0.65 -1.15 as the most common for business travelers.
18The urban population variable will be used as an instrument for passengers in the subsequent modelsbecause it is highly significant (at the 1% level).
19A strong and significant negative correlation (-0.9836) between distance and cost is observed; therefore, thecost variable is dropped from the estimation.
11

models, although it has the expected negative sign. We note that the coefficients of the twoliberalization dummy variables are insignificant in Model 2. Because Model 1 does not taketime specific effects into account, the effect of full liberalization could have been overestimated.Inclusion of the year dummies in Model 2 ensures that unobserved time effects are not absorbedby the liberalization coefficients.
The disparity of the significance level of the full liberalization variable between the twomodels poses a dilemma as to which model to choose. We opt for the conservative specification,Model 2. This is because in the sample period (2000-2005), and even in later years, therewere few channels through which liberalization policies could reduce fare levels, for our samplein particular and in the African air transport market in general. Previous studies on otheraviation markets find that liberalization policies lead to lower fare levels as a result of increasedcompetition between existing and/or new airlines in a post-liberalization period.20 To attestthe validity of these findings in the context of the African market, we need to answer twobasic questions. First, did liberalization bring about entry of new airlines? Second, werefares strictly regulated in the pre-liberalization period, such that any decline in fare afterliberalization can be attributed to the regulatory change?
A closer look at our sample sheds light on these questions. Firstly, although multipledesignations of airlines were allowed under liberalized BASAs, there were no new entries ofairlines. As a result, the incumbent airlines were not under any pressure to decrease fares. Infact, Ethiopian Airlines was the sole operator in almost 75% of the city-pair routes. Givensuch a high level of market dominance (and partly due to the airline’s good reputation), anappealing argument is that the airline was charging a monopoly markup, which effectivelyrules out the fare decreasing effect of liberalization policies. However, our empirical findings,particularly the negative coefficient of the two liberalization dummies, suggest otherwise.Secondly, consultation with industry experts revealed that fare levels were not regulated evenin routes governed by restrictive BASA. It is, therefore, not surprising to find that a decline infare levels as a result of liberalization policies, given that fare levels were not set based on theregulatory regimes.
Table 4 presents results from the frequency model (E.q. 3). Exogenous variables fromthe passenger model are used as instruments for the endogenous passenger variable in thefrequency model. All the explanatory variables are significant and have the expected sign.21
The coefficient of passenger numbers reveals that an increase in number of passengers resultsin a less-than-proportional increase in departure frequency. Schipper et al (2002) also founda similar result for intra-European air transport markets. Their explanation indicates that,
20See, for example, Maillebiau and Hansen (1995), who empirically substantiated this assertion in the NorthAtlantic market (routes between the USA and Europe), where lower prices were the result of encouraging entryof efficient domestic airlines (Strassmann, 1990; Lijesen ,2002).
21Coefficients for time dummies are not reported. All have positive signs, indicating the overall upward trendof air traffic and hence frequency over time.
12

at constant aircraft size, an increase in the number of passengers is accommodated partlyby a frequency increase and partly by an increase in the load factor (passengers carried as apercentage of available seats per flight).22 Both distance and aircraft size have the expectednegative sign and are highly significant at the 1% level.
The two liberalization dummies are the main variables of interest.23 Both have a significantpositive effect on departure frequency, as expected. The estimated coefficient of 0.38 forpartial liberalization implies that routes which experienced partial liberalization had 40%higher departure frequency than those routes without such regulatory reform. The equivalentfigure for fully liberalized routes is 35%.24 It is interesting to note that the effect of partialliberalization is larger than full liberalization although greater freedom is enjoyed by airlines inthe latter regime. These seemingly contradictory effects can be explained by the diminishingmarginal effect of progressive liberalization on departure frequency. Partially liberalizedBASAs have proportionally higher impact, probably because they contain frequency provisionsthat are actually used by airlines. Nevertheless, all frequency provisos in fully liberalizedBASAs may not necessarily be used. Our findings show that there is a potential for substantialimprovement in service quality by partially liberalizing restricted BASAs.
6 Conclusions
This paper has examined the economic effects of progressive air transport liberalizationin Africa by studying city-pair routes to/from Addis Ababa. Passenger demand, fare anddeparture frequency models were estimated to analyze the causal effects of liberalization policesin reducing fare and improving service quality, as would be expected under liberalization.The results show up to a 40% increase in departure frequency in routes that experiencedliberalization compared to those governed by restrictive regimes. There is also a greaterincrease in departure frequency in routes which experienced partial liberalization relative tofull liberalization. This diminishing marginal return to liberalization suggests that there aresubstantial potential gains in service quality from partially liberalizing restrictive regimes evenbefore countries fully open their markets. The analysis of the effect of liberalization on air faredid not result in a statistically significant effect, which rules out welfare gains from reduced
22Ethiopian airlines’ load factor in its intra-African routes was 65% on average during the sample period. Asper the prediction of the model, part of any increase in passenger number was accommodated by filling emptyseats rather than by a significant increase in departure frequency.
23As expected, both have a positive effect on departure frequency. A move from restrictive bilateral regimesto either full or partial liberalization allows airlines to increase departure frequency to meet growing demandand/or to deliver services tailored to the needs of consumers. However, the case for demand increase as a resultof a decline in fare level is ruled out because our fare model did not predict a statistically significant impact ofliberalization policy. Therefore, possible positive impact of the two liberalization variables comes from the openarrangement, which enables airlines to exploit fifth traffic rights to sustain more frequency.
24The percentage values are calculated as 100*(e 0.38) and 100* (1-e 0.35) for partially and fully liberalizedroutes, respectively.
13

fares. However, the signs of our liberalization variables do not reveal the presence of marketdominance.
The empirical findings of this paper help to clarify two competing hypotheses concerningthe effect of air transport liberalization policy in Africa. On the one hand, there is a groupof countries that resist liberalization policies, arguing that it may lead to abuse of marketdominance by big African airlines. On the other hand, there are countries (usually those withbig airlines) and multilateral institutions (UNECA, African Union, World Bank) that promotethe full implementation of liberalization policies such as the Yamoussoukro Decision. Theyargue that more competition in the market improves quality and decreases high fare levels.While there are substantial effects of liberalization in improving service quality, there is noevidence of its fare reducing effect. Our findings also imply that the fear of market dominanceabuse cannot be empirically substantiated.
Aviation policies, like other trade policies, reflect a balance between the interests ofconsumers and the aviation and tourism industries. Forsyth (2001) argues that this balancehas changed in many parts of the world as a result of liberalization and deregulation, reflectingemphasis on consumer interests. In Africa, a similar shift toward consumer interests in shapingaviation policy is yet to happen. The following assertion by the UNECA (2001, p.1) summarizesthe reality in most African countries: “An overriding motivation of the history of the economicregulation of air transport in Africa has been the desire to ensure the protection of nationalflag carriers. African aviation policies have been based more on the concern of protectionof the interests of national airlines rather than the interests of the consumers (passengersand shippers).” The prospect of a bright economic future, the rising middle-class consumer inAfrica and, most importantly, changes in global aviation regulation have been challenging thisreality.
Aviation policies, like other trade policies, reflect a balance between the interests ofconsumers and the aviation and tourism industries. Forsyth (2001) argues that this balancehas changed in many parts of the world as a result of liberalization and deregulation, reflectingemphasis on consumer interests. In Africa, a similar shift toward consumer interests in shapingaviation policy is yet to happen. The following assertion by the UNECA (2001, p.1) summarizesthe reality in most African countries: “An overriding motivation of the history of the economicregulation of air transport in Africa has been the desire to ensure the protection of nationalflag carriers. African aviation policies have been based more on the concern of protectionof the interests of national airlines rather than the interests of the consumers (passengersand shippers).” The prospect of a bright economic future, the rising middle-class consumer inAfrica and, most importantly, changes in global aviation regulation have been challenging thisreality.
14

In sum, the results of this study provide important new insights into the economic effects ofliberalization policies in Africa. The main policy recommendation of this study is liberalizationof restrictive service frequency provisions. Doing so will help airlines provide flexible services.In the long run, this also has the potential to elicit competition between African airlines, whichwould reduce fares. It has been proven in other regions of the world that every country shouldnot necessarily own an airline to reap the benefits of an efficient air transport service. To theextent that liberalization fosters the aviation industry, many African countries could continueto be both players and beneficiaries of the industry by introducing more competition.
References[1] Abeyratne, R. (2003). "Implication of the Yamoussoukro Decision on African Aviation."
Air & Space Law xxiii.
[2] Adler, N., and Hashai, N. (2005). "Effects of Open Skies in the Middle East Region."Transportation Research part A 39: 878-894.
[3] AFCAC (2013). Report of AFCAC Air Transport Committee Implementation of the Ya-moussoukro Decision. http://www.afcac.org/en/documents/Plenary/2013/wp/wp25.pdf[Accessed: August 12, 2013]
[4] AFDB (2012). Africa’s Aviation Industry: Challenges and Opportuni-ties. http://www.afdb.org/en/blogs/afdb-championing-inclusive-growth-across-africa/post/africas-aviation-industry-challenges-and-opportunities-10025/ [AccessedAugust 28, 2013]
[5] AFRAA (2010). 42nd Annual General Assembly the AG. Secretary General.http://www.afraa.org/index.php/media-center/publications/presentations/288-sgreport42/file [Accessed: July, 2013]
[6] Anderson, J. E., and E. van Wincoop, 2003. "Gravity with Gravitas: A Solution to theBorder Puzzle." The American Economic Review 93, pp. 170-192.
[7] ATAG (2004). The Economic and Social Benefits of Air Transport. Geneva, Air TransportAction Group.
[8] Baltagi, B., Griffin H. , James M. Rich, Daniel P. (1995). "Airline Deregulation: The costpieces of the puzzle." International Economics Review 36(1): 245-258.
[9] Boeing. 2012. Current Market Outlook 2012–2031. www.boeing.com/commercial/cmo[Accessed 23 August 201].
[10] Borenstein, S. and Rose, N. (2007), How Airline Markets Work ... Or Do They? RegulatoryReform in the Airline Industry, NBER working paper No 13452
[11] Brander, J., Zhang, A. (1990). "Market Conduct in the airline industry: An empiricalinvestigation." RAND Journal of Economics 21: 567-583.
15

[12] Caves, D., W.. Christensen, Laurtits R.; and Tretheway, Michael W. (1984). "Economiesof Density versus Economies of Scale: Why Trunk and Local Service Airline Costs Differ."Rand Journal of Economics 15: 471-89.
[13] Chingosho, E., (2009). African Airlines in the Era of Liberalization, second ed. Nairobi.
[14] Cristea, A., Gillberry, R., Mattoo, A. (2014). Open Skies Over the Middle East. WorldBank Policy Research Working Paper 6937
[15] Cristea, A., Hummels, D., and Roberson, B. ( 2012). Estimating the Gains from Liberal-izing Services Trade: The Case of Passenger Aviation, Mimeo, University of Oregon
[16] Doganis, R. (1991). Flying Off Course: The Economics of International Airlines. NewYork, Rutledge.
[17] Dresner, M. and M. W. Tretheway. (1992). "Modeling and Testing the Effect of MarketStructure on Price: The case of International Air Transport." Journal of Transport andEconomic Policy 26: 171-84.
[18] Forsyth, P. (2001). "Promoting trade in airline services." Journal of Air Transport Man-agement 7: 43-50.
[19] Geda, A. and Haile K.(2008). Regional Economic Integration in Africa: A Review ofProblems and Prospects with a Case Study of COMESA, Journal of African Economies,vol. 17, no.3, June, pp. 357-394.
[20] G.Lijesen, M., Nijkamp, Peter Rietveld, Piet (2002). "Measuring competition in civilaviation." Journal of Air Transport Management 8: 189-197.
[21] Gillen, D., Harris, R., Oum T.H (2002). "Measuring the Economic Effects of BilateralLiberalization: Air Transport." Transportation Research Part E 38: 155-174.
[22] Heinz, S. and O’Connell, J.F. (2013). Air transport in Africa: toward sustainable businessmodels for African airlines. Journal of Transport Geography. 31: 72–83
[23] IATA-WATS (2014). World Air Transport Statistics (WATS) 58th Edition. InternationalAir Transport Association.
[24] ICAO (2003). Background to Experiences of Liberalization in Africa. International CivilAviation Organization.
[25] InterVISTAS (2014). Transforming Intra-African Air Connectivity:The Economic Benefitsof Implementing the Yamoussoukro Decision. InterVISTAS Consulting Ltd.
[26] Ismaila, D. A., Warnock-Smith, D., Hubbard, N. (2014). The impact of Air ServiceAgreement liberalisation: The case of Nigeria. Journal of Air Transport Management, 37,69-75.
[27] Jorge-Calderon, J. D. (1997). "A Demand Model for Selected Airline Services on Interna-tional European Routes." Journal of Air Transport Management 3: 23-35.
16
[28] Lufthansa Group, (2013). The Fleet. http://investor-relations.lufthansagroup.com/en/fakten-zum-unternehmen/fleet.html)) [Accessed:July, 2013]
[29] Mallebiau, E. Hansen, M. (1995). "Demand and Consumer Welfare Impacts of Internationalairline Liberalization: the Case of North Atlantic." Journal of Transport and EconomicPolicy 29: 115-36.
[30] Marin, P. L. (1995). "Competition in European Aviation: Pricing Policy and MarketStructure." Journal of Industrial Economics 43(2): 141-159.
[31] Morrison, J.T. (2004). The Current State of the Airline Industry in Southern Africa.Paper Presented at the 23rd Annual Southern African Transport Conference, 12–15thJuly 2004.
[32] Nero, G. (1998). "Spatial Multiproduct pricing: Empirical Evidence on intra-EuropeanDuopoly Airline Markets." Applied Economics 30: 465-75.
[33] OAG (2007). World Airways Guide (2000-06), Official Airline Guide.
[34] Oum, T., A. Zhang, X. Fu (2010). Air transport liberalization and its impacts on airlinecompetition and air passenger traffic. Transportation Journal, 49 (2010), pp. 24–41
[35] Oum, T. H., Stanbury , W.T., and Tretheway, M.W. (1991). "Airline Deregulation inCanada and its Economic Effects." Transportation Journal 30: 4-22.
[36] Oum, T. H., Waters, W.G., Yong, J.-S (1992). "Concepts of price elasticities of transportdemand and recent empirical estimates." Journal of Transport Economics and Policy 1:139-154.
[37] Oum, T. H., Zhang, A., Zhang, Y (1993). "Inter-firm rivalry and firm specific priceelasticites in deregulated airline markets." Journal of Transport Economics and Policy 27:171-192.
[38] Rodrigue, J.-p. C., Claude Slack, Brian (2013). The Geography of Transport Systems.London, Routledge.
[39] Schipper, Y., Rietveld, P., Nijkamp, P. (2002). "European Airline Reform: An EmpiricalWelfare Analysis." Journal of Transport Economics and Policy 36(2): 189-209.
[40] Schlumberger, C.(2010). Open Skies for Africa: Implementing the Yamoussoukro Decision(Directions in Development: Infrastructure). World Bank Publications, Washington, DC.
[41] Ssamula, B. and Venter, C. (2013). Journal of Transport Economics and Policy. 47:279–297
[42] Strassmann, D. L. (1990). "Potential Competition in Deregulated Airlines." The Reviewof Economics and Statistics 72(4): 629-702.
[43] Tinbergen, Jan, 1962. Shaping the World Economy: Suggestions for an InternationalEconomic Policy. New York: Twentieth Century Fund.
17
[44] UNCTAD (2013). Economic Development in Africa: Report 2013, Intra-African Trade:Unlocking Private Sector Dynamism. Geneva.
[45] UNECA (2001). Sub-regional meeting on the implementation of the YamoussoukroDecision. Mali, Bamako.
[46] UNECA (2002). Clarification Issues and Articles of the Yamoussoukro Decision. AddisAbaba, United Nation Economic Commission for Africa.
[47] UNECA (2005). Compendium of Air Transport Integration and Cooperation Initiativesin Africa. Addis Ababa, Economic Commission For Africa.
[48] WDI (2007). World Development Indicators, World Bank, Washington D.C.
[49] Wooldridge, J. M. (2002). Econometric Analysis of Cross Section and Panel Data. Cam-bridge, Massachusetts, the MIT Press.
[50] Yan, J. and Winston, C. (forthcoming) "Open Skies: Estimating Travelers’ Benefits FromFree Trade in Airline Services."American Economic Journal: Economic Policy.
18
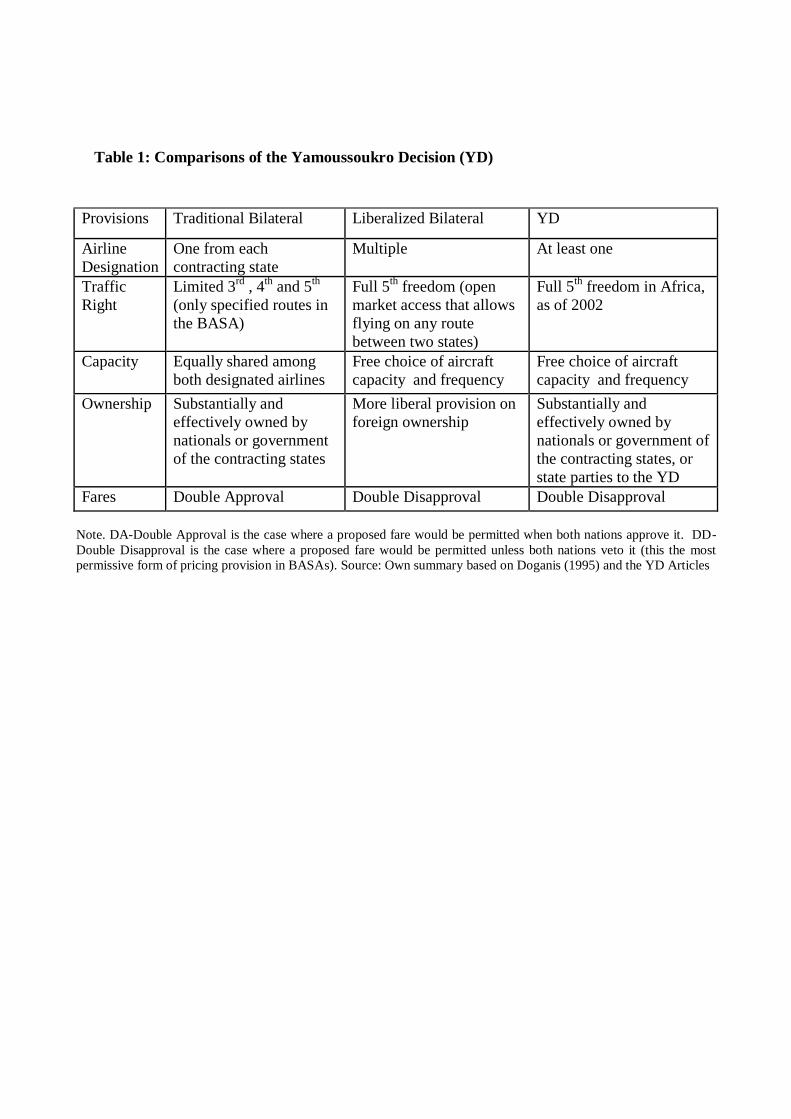
Table 1: Comparisons of the Yamoussoukro Decision (YD)
Provisions Traditional Bilateral Liberalized Bilateral YD
Airline Designation
One from each contracting state
Multiple At least one
Traffic Right
Limited 3rd , 4th and 5th (only specified routes in the BASA)
Full 5th freedom (open market access that allows flying on any route between two states)
Full 5th freedom in Africa, as of 2002
Capacity Equally shared among both designated airlines
Free choice of aircraft capacity and frequency
Free choice of aircraft capacity and frequency
Ownership Substantially and effectively owned by nationals or government of the contracting states
More liberal provision on foreign ownership
Substantially and effectively owned by nationals or government of the contracting states, or state parties to the YD
Fares Double Approval Double Disapproval Double Disapproval
Note. DA-Double Approval is the case where a proposed fare would be permitted when both nations approve it. DD- Double Disapproval is the case where a proposed fare would be permitted unless both nations veto it (this the most permissive form of pricing provision in BASAs). Source: Own summary based on Doganis (1995) and the YD Articles

Table 2: Descriptive statistics
Variable Mean Std. dev. Min Max
Number of Passengers 25135.4 26484 4970 136066
Number of frequency 481.26 406.56 104 2387
Distance (km) 2907.8 1338.87 565 5239
Income per capita($) 572.36 677.95 105 3406
Fare($) 717.10 253.10 165 1316
Fare/km 0.14 0.04 0.06 0.23
Number of air operators 1.5 0.54 1 3

Table 3: Liberalization status of Ethiopia’s Bilateral Air Service Agreements with
selected African countries
Source: Ethiopian Civil Aviation Authority (ECAA, 2007). Note. DA-Double Approval is the case where a proposed fare would be permitted when both nations approve it. DD- Double Disapproval is the case where a proposed fare would be permitted unless both nations veto it (this the most permissive form of pricing provision in BASAs).
Provisions
Capacity Choice
Year of Agreement
Bilateral Partner
Multiple Designation
Free Frequency
Free Aircraft Type
Fare Regulation
Free 5th traffic right
1970 Burundi Yes Yes Yes DA Yes 1988 Chad No No No DA Limited 2005 Congo Yes Yes Yes DD Limited 1992 Cot Devour Yes No Yes DA Limited 1998 Djibouti No No No DA No 2005 DRC No No No DA Limited 1995 Egypt No No Yes DA Limited 2005 Ghana Yes Yes Yes DD Yes 2005 Kenya Yes Yes Yes DD Yes 2005 Malawi Yes No Yes DA Yes 2005 Mali No Yes Yes DA Yes 2005 Nigeria Yes Yes Yes DD Yes 2004 Rwanda Yes Yes Yes DD Yes 1997 South Africa Yes Yes Yes DA Yes 1993 Sudan No No Yes DA No 2004 Tanzania Yes Yes Yes DD Yes 2005 Togo No Yes Yes DD Yes 2005 Uganda Yes Yes Yes DD Yes 2005 Zambia Yes Yes Yes DD Yes 1990 Zimbabwe No No No DA Yes

Table 4: 2SLS random effects model results
Demand Fare Frequency
1 2
Fare/km -0.719*
(0.399) Distance (dist) -0.400** -0.258*** -0.306*** -0.340**
(0.197) (0.0780) (0.0621) (0.141)
Population (pop) 0.264***
(0.0781)
Income -0.0613 -0.117** -0.0536**
(0.104) (0.0538) (0.0226)
Frequency (freq) 0.593*** -0.0992** -0.0264**
(0.0726) (0.0410) (0.0106)
Number of passengers (pass)
0.251*** 0.0222* 0.710***
(0.0307) (0.0115) (0.0737)
Full liberalization (libf)
-0.206* -0.100 0.350**
(0.109) (0.0833) (0.171)
Partial liberalization (libp)
-0.0783 -0.0304 0.380*
(0.129) (0.101) (0.203)
Aircraft size(acsize)
-0.0483**
(0.0200)
Number of operators (operators)
0.0867
(0.181)
Year Effect Yes Constant 2.888** -0.801 0.561 2.888**
(1.274) (0.615) (0.479) (1.303)
R-squared 0.86 0.17 0.65 0.83 Observations 120 120 120 120 Number of Groups 20 20 20 20
Note: All continuous variables are in logs. Standard errors are in parentheses. Significance is marked as *** p<0.01, ** p<0.05, * p<0.1.

Figure 1: Major intercontinental markets in Sub-Saharan Africa by available seats in May 2013
Source: The Wall Street Journal (2013)
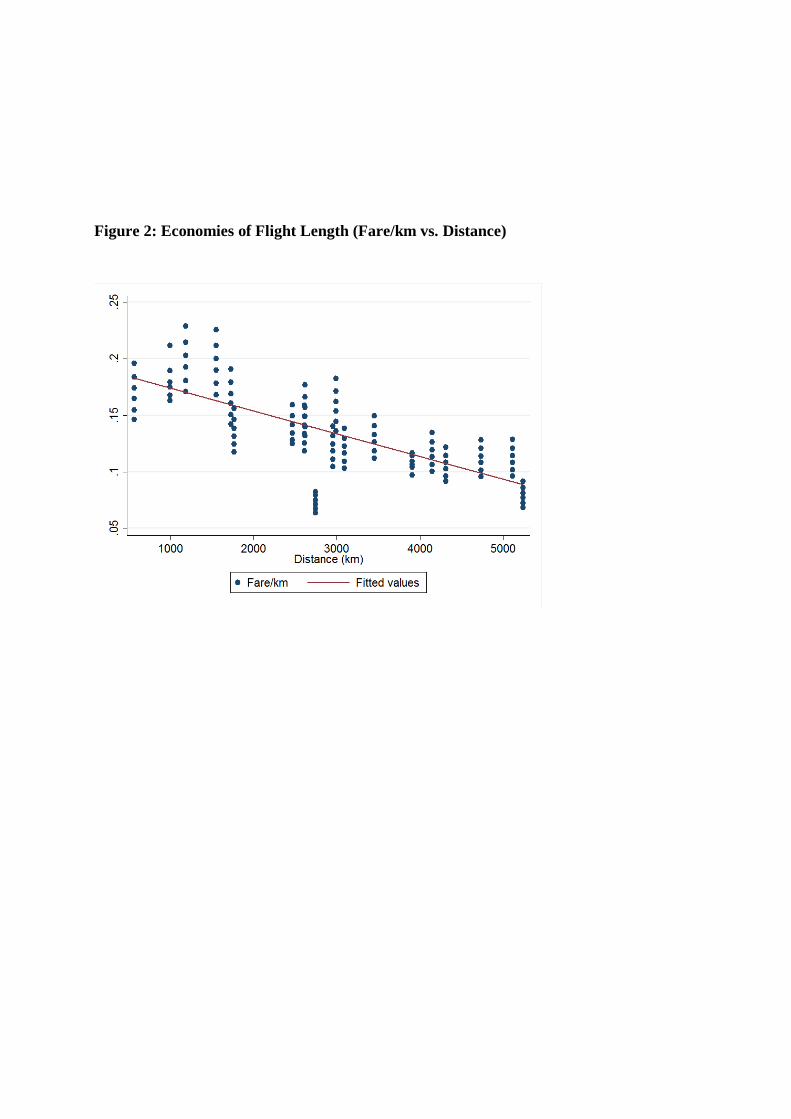
Figure 2: Economies of Flight Length (Fare/km vs. Distance)
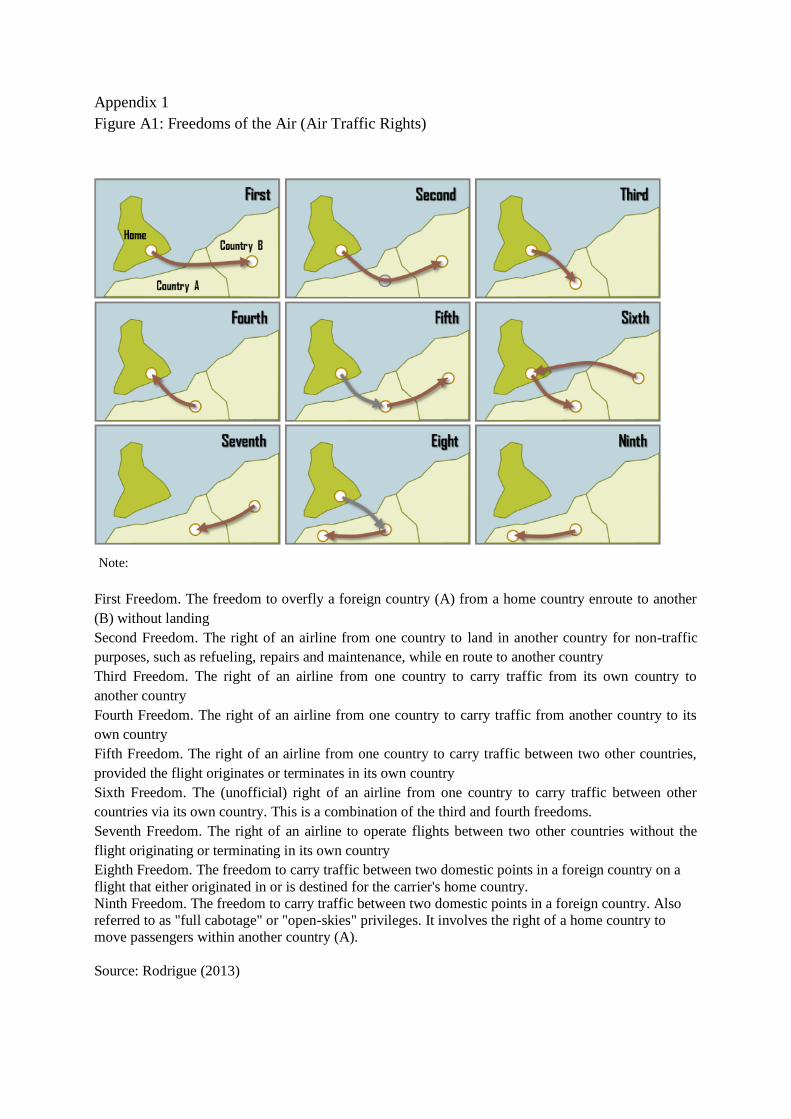
Appendix 1 Figure A1: Freedoms of the Air (Air Traffic Rights)
Note:
First Freedom. The freedom to overfly a foreign country (A) from a home country enroute to another (B) without landing Second Freedom. The right of an airline from one country to land in another country for non-traffic purposes, such as refueling, repairs and maintenance, while en route to another country Third Freedom. The right of an airline from one country to carry traffic from its own country to another country Fourth Freedom. The right of an airline from one country to carry traffic from another country to its own country Fifth Freedom. The right of an airline from one country to carry traffic between two other countries, provided the flight originates or terminates in its own country Sixth Freedom. The (unofficial) right of an airline from one country to carry traffic between other countries via its own country. This is a combination of the third and fourth freedoms. Seventh Freedom. The right of an airline to operate flights between two other countries without the flight originating or terminating in its own country Eighth Freedom. The freedom to carry traffic between two domestic points in a foreign country on a flight that either originated in or is destined for the carrier's home country. Ninth Freedom. The freedom to carry traffic between two domestic points in a foreign country. Also referred to as "full cabotage" or "open-skies" privileges. It involves the right of a home country to move passengers within another country (A). Source: Rodrigue (2013)

Appendix 2 Cost is approximated by the average cost of the main operators in a route. Cost is expected to have a positive sign because higher operating cost is reflected as a higher fare. We assume cost symmetry in this study, and cost is calculated using Ethiopian Airlines’ operating cost
data. Cost is usually estimated by ritr
itrt
i DAFLDcpkc
/ for route specific marginal cost
where itcpk is each airline’s cost per-kilometer for an average route in Africa,
itAFL is each
airline’s average flight length for the Africa market as a whole and rD is the distance of the
route ‘r’. The value of ‘ ’ lies in the 10 range (Oum et al, 1993, Brander and Zhang, 1990). The rationale behind this range, suggested in the airline economics literature, is that
costs are strictly concave in distance. Therefore, ‘ ‘captures economies of ‘stage length’,
whereby the cost per unit distance decreases as fixed terminal costs are spread over more distance units. The value of theta is usually assumed to be 0.5 (Oum et al, 1993).
Copyright © 2022 FDOKUMEN