General Equilibrium Assessments of Trade Liberalization in APEC Countries
24
34. GENERAL EQUILIBRIUM ASSESSMENTS OF TRADE LIBERALIZATION IN APEC COUNTRIES Hiro Lee, David Roland-Holst and Dominique van der Mensbrugghe 1. INTRODUCTION Asia-Pacific Economic Cooperation (APEC) countries have embarked on the important liberalization process in recent years. At the 1994 summit, APEC leaders delivered the Bogor Declaration, agreeing to remove trade and investment barriers by 2010 for developed members and 2020 for developing members. In Osaka in 1995, they agreed on the Action Agenda for implementing the objectives. In 1996, APEC leaders adopted the Manila Action Plan for APEC (MAPA), which included the individual and collective action plans to liberalize trade and investment in the region starting in 1997. The primary impetus behind the APEC process is a vision of open multilateral trade that can more fully realize the immense potential of economies that are home to over 40% of the world’s population. Attaining this vision will entail a reorganization of economic activity around the Pacific that more fully exploits the diverse resources, technologies, and tastes of this vast region. At the national level, such a transition may imply dramatic adjustments in specific economic activities and policies, and resistance to such change will pose a challenge to reformers. There is, however, a clear consensus that all Restructuring Asian Economics for the New Millennium, Volume 9B, pages 701–724. Copyright © 2001 by Elsevier Science Inc. All rights of reproduction in any form reserved. ISBN: 0-7623-0710-2 701
Transcript of General Equilibrium Assessments of Trade Liberalization in APEC Countries

34. GENERAL EQUILIBRIUMASSESSMENTS OF TRADELIBERALIZATION IN APECCOUNTRIES
Hiro Lee, David Roland-Holst and
Dominique van der Mensbrugghe
1. INTRODUCTION
Asia-Pacific Economic Cooperation (APEC) countries have embarked on theimportant liberalization process in recent years. At the 1994 summit, APECleaders delivered the Bogor Declaration, agreeing to remove trade andinvestment barriers by 2010 for developed members and 2020 for developingmembers. In Osaka in 1995, they agreed on the Action Agenda forimplementing the objectives. In 1996, APEC leaders adopted the Manila ActionPlan for APEC (MAPA), which included the individual and collective actionplans to liberalize trade and investment in the region starting in 1997.
The primary impetus behind the APEC process is a vision of openmultilateral trade that can more fully realize the immense potential ofeconomies that are home to over 40% of the world’s population. Attaining thisvision will entail a reorganization of economic activity around the Pacific thatmore fully exploits the diverse resources, technologies, and tastes of this vastregion. At the national level, such a transition may imply dramatic adjustmentsin specific economic activities and policies, and resistance to such change willpose a challenge to reformers. There is, however, a clear consensus that all
Restructuring Asian Economics for the New Millennium, Volume 9B, pages 701–724.Copyright © 2001 by Elsevier Science Inc.All rights of reproduction in any form reserved.ISBN: 0-7623-0710-2
701

APEC members will ultimately benefit from this process, and empiricaleconomists can facilitate reform by elucidating the detailed benefits and costsof APEC trade reform.
This chapter contributes the policy dialogue by evaluating the effects ofAPEC trade liberalization on member country real GDP, sectoral output,exports and imports using an 18-region, 16-sector dynamic calibrated generalequilibrium (CGE) model of the global economy. The current work extends ourearlier study (Lee et al., 1999) in two respects. First, we have updated all thedata used in our model from 1992 to 1995 using the GTAP database, version4 (McDougall et al., 1998). Second, we have modified our model to allow forimperfect substitutability between domestically produced goods and exportedgoods within a given sector. The next section provides an overview of APECcountries’ trade patterns and summarizes the extent of trade distortions. Section3 contains a brief description of the APEC model used for quantitativeassessments. In Section 4, we present the aggregate and sectoral results of theAPEC trade liberalization experiment, and the final section offers conclusions.
2. APEC COUNTRIES’ TRADE PATTERNS ANDPROTECTION RATES
2.1. Trade Patterns
In this section, we provide an overview of trade patterns within APEC and withrespect to the rest of the world. Table 1 presents a world trade matrix, where theworld is disaggregated into 15 APEC countries/regions – Australasia (ANZ:Australia and New Zealand), Japan (JPN), China including Hong Kong (CHN),Korea (KOR), Taiwan (TWN), Singapore (SGP), Malaysia (MYS), Thailand(THA), Indonesia (IDN), the Philippines (PHL), Vietnam (VNM), Canada(CAN), the United States (USA), Mexico (MEX), and Chile (CHL) – and 3non-APEC regions – the rest of Latin America (LAT), Europe (EUR), and therest of the world (ROW).1
For the great majority of the APEC members, intra-APEC trade accountedfor more than two-thirds of total trade in 1995. On the export side, in additionto Canada and Mexico (which each sold approximately three-quarters of theirtotal exports to the United States), the ratio of intra-APEC to total exportsexceeded two-thirds in Australasia and all the Asian members with theexception of Vietnam. On the import side, the ratio of intra-APEC to totalimports was particularly large in China (73%), Taiwan (79%), Singapore(74%), Malaysia (74%), and Vietnam (81%). By contrast, Chile has a relativelysmall presence in Asia-Pacific markets, with intra-APEC trade shares of 50%.
702 HIRO LEE ET AL.

Table 1. World Trade Matrix, 1995 (Millions of U.S. dollars).
Importing Country
Exporting Country ANZ JPN CHN KOR TWN SGP MYS THA IDN PHL VNM
Australasia (ANZ)a 6,957 21,293 4,833 5,944 3,483 2,360 2,205 1,354 1,982 979 138Japan (JPN) 13,723 . . . 50,253 36,780 31,573 25,648 16,869 20,731 9,739 7,307 1,080China (CHN)b 5,765 47,455 30,737 9,182 6,923 8,057 2,779 3,448 2,828 2,236 1,054Korea (KOR) 2,291 25,488 19,120 . . . 4,336 5,840 2,888 2,618 3,099 1,509 1,303Taiwan (TWN) 2,531 16,065 31,643 2,896 . . . 5,548 3,934 3,497 1,879 1,317 1Singapore (SGP) 3,746 13,549 12,660 3,212 5,951 . . . 13,587 4,799 2,422 1,921 1,577Malaysia (MYS) 1,506 10,276 4,930 2,220 2,104 14,480 . . . 2,683 768 656 258Thailand (THA) 1,036 14,016 5,425 1,231 1,431 5,916 1,716 . . . 1,198 560 481Indonesia (IDN) 1,164 13,979 3,542 3,321 1,809 3,688 1,025 763 . . . 667 318Philippines (PHL) 296 4,617 1,529 643 360 1,131 467 638 239 . . . 121Vietnam (VNM) 230 2,025 540 217 6 418 115 66 175 49 . . .Canada (CAN) 1,337 13,051 3,868 2,514 1,350 515 523 577 579 312 28United States (USA) 15,310 82,794 26,919 32,821 21,861 17,803 9,889 9,260 3,734 5,928 326Mexico (MEX) 130 2,689 399 338 63 185 52 355 124 189 1Chile (CHL) 95 3,664 415 1,073 745 108 98 190 201 52 2Other Latin Amer (LAT) 826 9,712 4,282 2,577 1,593 934 1,143 1,017 872 587 40Europe (EUR) 22,314 65,967 46,832 22,338 17,006 19,433 15,179 20,035 12,834 7,129 1,076Rest of World (ROW) 4,863 66,204 20,601 18,026 3,616 11,733 3,376 7,466 5,290 4,012 425APECc 56,117 270,961 196,814 102,393 81,994 91,697 56,146 50,979 28,967 23,682 6,689Non-APEC 28,003 141,882 71,714 42,942 22,215 32,100 19,698 28,519 18,995 11,728 1,541World 84,120 412,843 268,528 145,335 104,209 123,798 75,844 79,498 47,963 35,410 8,230
These trade flows are evaluated at world export (FOB) prices in millions of 1995 U.S. dollars.a Australia and New Zealand.b Includes Hong Kong. The figure in the third row and the third column is the sum of China’s exports to Hong Kong and Hong Kong’s exportsto China.c Excludes Brunei, Papua New Guinea, Peru, and Russia.Source: GTAP database, Version 4.
703G
eneral Equilibrium
Assessm
ents of Trade Liberalization in A
PE
C C
ountries
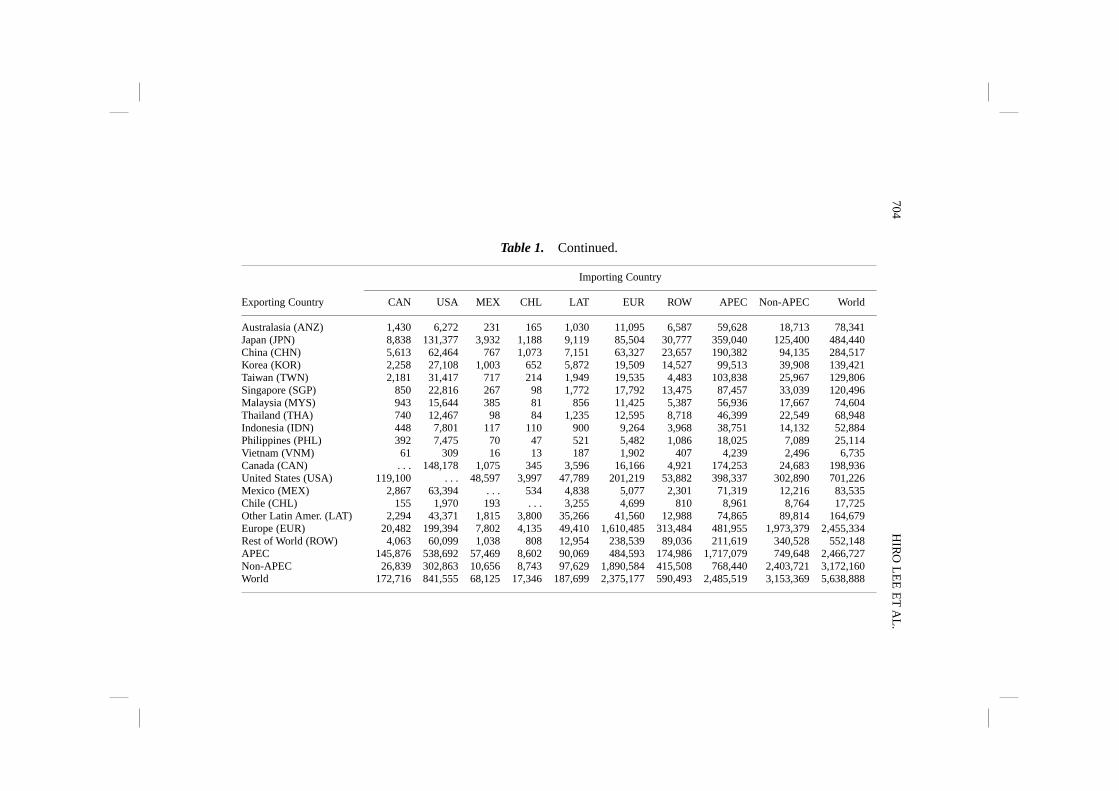
Table 1. Continued.
Importing Country
Exporting Country CAN USA MEX CHL LAT EUR ROW APEC Non-APEC World
Australasia (ANZ) 1,430 6,272 231 165 1,030 11,095 6,587 59,628 18,713 78,341Japan (JPN) 8,838 131,377 3,932 1,188 9,119 85,504 30,777 359,040 125,400 484,440China (CHN) 5,613 62,464 767 1,073 7,151 63,327 23,657 190,382 94,135 284,517Korea (KOR) 2,258 27,108 1,003 652 5,872 19,509 14,527 99,513 39,908 139,421Taiwan (TWN) 2,181 31,417 717 214 1,949 19,535 4,483 103,838 25,967 129,806Singapore (SGP) 850 22,816 267 98 1,772 17,792 13,475 87,457 33,039 120,496Malaysia (MYS) 943 15,644 385 81 856 11,425 5,387 56,936 17,667 74,604Thailand (THA) 740 12,467 98 84 1,235 12,595 8,718 46,399 22,549 68,948Indonesia (IDN) 448 7,801 117 110 900 9,264 3,968 38,751 14,132 52,884Philippines (PHL) 392 7,475 70 47 521 5,482 1,086 18,025 7,089 25,114Vietnam (VNM) 61 309 16 13 187 1,902 407 4,239 2,496 6,735Canada (CAN) . . . 148,178 1,075 345 3,596 16,166 4,921 174,253 24,683 198,936United States (USA) 119,100 . . . 48,597 3,997 47,789 201,219 53,882 398,337 302,890 701,226Mexico (MEX) 2,867 63,394 . . . 534 4,838 5,077 2,301 71,319 12,216 83,535Chile (CHL) 155 1,970 193 . . . 3,255 4,699 810 8,961 8,764 17,725Other Latin Amer. (LAT) 2,294 43,371 1,815 3,800 35,266 41,560 12,988 74,865 89,814 164,679Europe (EUR) 20,482 199,394 7,802 4,135 49,410 1,610,485 313,484 481,955 1,973,379 2,455,334Rest of World (ROW) 4,063 60,099 1,038 808 12,954 238,539 89,036 211,619 340,528 552,148APEC 145,876 538,692 57,469 8,602 90,069 484,593 174,986 1,717,079 749,648 2,466,727Non-APEC 26,839 302,863 10,656 8,743 97,629 1,890,584 415,508 768,440 2,403,721 3,172,160World 172,716 841,555 68,125 17,346 187,699 2,375,177 590,493 2,485,519 3,153,369 5,638,888
704H
IRO
LE
E E
T A
L.
The United States, a country geographically linked to the world’s three largesttrading regions (East Asia, Europe, and the Americas) had the second lowestintra-APEC export and import ratios (57 and 64%, respectively) in 1995. Onaverage, 70% of APEC countries’ exports and imports were intraregional in1995.
While exports to and imports from the United States and Japan accounted forlarge percentages of trade for developing-country APEC members, tradeamong them has also become significant. Singapore accounted for 19.4% ofMalaysia’s exports, and China (including Hong Kong) accounted for 13.7 and24.4% of Korea and Taiwan’s exports in 1995. In the past several years, China’strade with these neighboring countries has increased dramatically.
2.2. Import Protection and Export Tax/Subsidy Rates
Sectoral rates of nominal import protection and export tax/subsidy rates for the15 APEC countries/regions are summarized in Tables 2 and 3, respectively. Theimport protection rates are the sum of sectoral tariff rates and ad valoremequivalents of quantitative restrictions (QRs) on imports, which are computedfrom the GTAP database. The average protection rates in 1995 (the last row ofTable 2) range from 1.4% in Singapore to 19.3% in the Philippines, andsectoral protection rates differ significantly across APEC. The most notablesector is rice and wheat, where the rates range from zero or negative in anumber of countries to 535% in Japan.2 In other agriculture, they are very highin Japan, Korea, Taiwan, and Malaysia, whereas in processed food they arequite high in Vietnam, Thailand, and the Philippines.3
Developing-country members have substantially lowered trade barriers on avariety of manufactured products, yet some of them still maintain relativelyhigh tariff rates. A number of manufacturing sectors, for example, are stillhighly protected in the Philippines, Thailand, and China. In simple manu-factures (e.g. textiles, clothing, and footwear), developed countries tend toimpose trade barriers to protect unskilled workers. Nevertheless, the importprotection rates on textiles and clothing are higher in developing members thanin developed members.
On the export side, Malaysia imposes export taxes on all goods and serviceswith the exception of rice and wheat and processed food (Table 3). Its averageexport tax rate is 13.2%. Several APEC countries’ export subsidy rates on riceand wheat are very high, but these reflect large domestic-world pricedifferentials on the highly protected sector.4 It is also worth noting that,although many members rely on heavy export tax and subsidy instruments inthe grain sectors, this does not represent a significant macro trade distortion for
705General Equilibrium Assessments of Trade Liberalization in APEC Countries

Table 2. Import Protection Rates in Major APEC Countries, 1995 (Percent).
Products ANZ JPN CHN KOR TWN SGP MYS THA IDN PHL VNM CAN USA MEX CHL
1 Rice and wheata 0.3 535.0 –14.5 66.0 68.0 34.9 85.2 59.2 0.0 70.8 5.2 0.0 1.2 –17.5 –23.32 Other agriculture 2.4 65.9 7.6 45.0 49.2 17.6 45.4 25.7 6.4 18.0 8.5 0.6 4.4 0.9 5.93 Coal, oil, and gas 0.1 0.7 3.0 4.2 5.7 2.7 2.8 2.8 3.4 1.1 21.6 6.0 0.6 0.7 8.84 Other mining 0.5 0.0 1.4 1.8 0.9 0.0 1.7 1.6 3.7 4.8 1.7 0.0 0.1 3.2 8.45 Processed food 4.0 30.9 11.4 26.0 28.9 20.3 34.2 53.1 9.2 45.2 68.3 6.4 9.9 –2.0 10.16 Textiles and clothingb 14.6 6.8 30.9 6.9 8.6 1.4 17.4 24.1 14.0 23.0 28.1 11.2 9.9 3.4 10.47 Wood and paper 6.5 0.7 13.6 5.2 4.0 0.4 9.4 10.9 6.0 21.7 13.1 0.5 0.5 1.1 9.88 Chemicalsc 6.4 2.2 14.6 7.5 5.6 1.3 8.0 16.4 8.0 26.0 4.8 1.5 2.9 2.6 9.99 Metals and prod. 7.7 0.9 12.4 5.9 5.8 0.0 9.4 11.5 7.1 20.4 5.8 1.6 2.0 3.0 10.010 Machinery and equip. 7.4 0.4 12.7 8.0 6.4 0.0 6.4 9.9 4.5 25.0 4.5 1.0 1.9 3.1 10.511 Transport equip. 11.2 1.6 38.4 4.8 18.2 2.8 14.5 37.8 27.2 19.4 25.5 0.8 1.4 3.4 10.512 Other manufac. 10.2 1.3 24.8 7.5 7.8 0.1 11.5 25.2 10.4 27.8 18.4 1.3 3.0 7.0 10.213 Construction . . . . . . . . . . . . . . . . . . . . . . . . . . . . . . . . . . . . . . . . . . . . .14 Electricity . . . . . . . . . . . . . . . . . . . . . . . . . . . . . . . . . . . . . . . . . . . . .15 Trade and transp. 0.3 3.3 0.0 0.0 0.0 0.0 0.0 0.0 0.0 0.0 0.0 0.0 0.0 0.0 0.016 Other services 0.1 2.9 1.8 0.2 0.0 0.0 0.0 0.0 0.0 0.0 0.0 0.0 0.0 0.0 0.0
Weighted average 6.1 9.1 14.5 8.1 8.3 1.4 9.0 13.1 6.7 19.3 17.2 1.6 2.4 2.3 8.1
These rates include ad valorem equivalents of quantitative restrictions on imports.a Include processed rice.b Includes leather and footwear.c Include plastics and rubber products.Source: GTAP database, Version 4.
706H
IRO
LE
E E
T A
L.

Table 3. Export Tax and Subsidy Rates in Major APEC Countries, 1995 (Percent).
Products ANZ JPN CHN KOR TWN SGP MYS THA IDN PHL VNM CAN USA MEX CHL
1 Rice and wheata –0.1 –83.5 32.7 –51.6 –56.8 0.0 –52.2 –55.7 –0.6 –44.1 4.4 –0.3 –1.5 29.5 13.72 Other agriculture –2.7 –12.5 2.4 –0.3 –0.7 0.0 13.3 –1.0 0.0 –0.3 13.5 –0.6 0.6 3.8 0.03 Coal, oil, and gas 1.7 0.0 19.6 0.0 0.0 0.0 13.7 0.0 0.0 0.0 0.7 0.0 6.1 0.0 1.34 Other mining 0.0 0.0 –0.9 0.0 0.0 0.0 13.6 0.0 0.0 0.0 3.1 0.2 3.9 0.0 0.05 Processed food –3.0 –4.4 2.2 –1.6 –0.7 0.0 0.0 –5.7 0.0 –0.9 4.7 –3.0 0.0 1.9 0.06 Textiles and clothingb 0.0 0.0 –1.2 0.3 0.5 0.2 15.5 1.3 0.6 21.5 2.6 0.0 0.3 0.0 0.07 Wood and paper 0.3 0.0 –5.5 0.0 0.0 0.0 13.7 0.0 0.0 0.0 5.7 0.1 1.0 0.0 0.08 Chemicalsc 0.2 0.0 –10.8 0.0 0.0 0.0 13.7 0.0 0.0 1.3 1.9 0.0 1.5 0.0 0.09 Metals and prod. 0.0 0.0 –7.3 0.0 0.0 0.0 13.7 0.0 0.0 0.0 0.4 0.0 0.7 0.0 0.010 Machinery and equip. 1.0 –0.1 –5.0 0.0 0.0 0.0 13.7 0.0 0.0 2.0 1.9 0.1 0.8 0.0 0.211 Transport equip. –0.2 0.1 –0.9 0.4 0.0 0.1 13.0 0.0 0.0 0.0 1.9 0.0 0.5 0.1 0.812 Other manufac. 1.5 0.0 30.3 0.0 0.0 0.0 13.7 0.0 0.0 1.1 4.0 0.4 0.5 0.0 0.013 Construction . . . . . . . . . . . . . . . . . . . . . . . . . . . . . . . . . . . . . . . . . . . . .14 Electricity . . . . . . . . . . . . . . . . . . . . . . . . . . . . . . . . . . . . . . . . . . . . .15 Trade and transp. 0.1 0.0 0.0 0.0 0.0 0.0 21.4 0.0 0.0 0.0 3.2 0.2 10.0 0.0 0.016 Other services 0.1 0.0 0.0 0.0 0.0 0.0 13.7 0.0 0.0 0.0 26.3 0.1 4.9 0.0 8.9
Weighted average –0.5 –0.1 –0.8 0.0 0.0 0.0 13.2 –3.2 0.1 2.4 4.4 –0.1 2.2 0.2 0.5
Positive number indicates export taxes and negative numbers indicate export subsidies.a, b, c See Table 2.Source: GTAP database, Version 4.
707G
eneral Equilibrium
Assessm
ents of Trade Liberalization in A
PE
C C
ountries

any country. Trade distortions on other agriculture, manufactures, and servicesare the main determinants of economy wide export bias.
3. BRIEF DESCRIPTION OF THE APEC MODEL
A CGE model is an empirical tool that is well suited to evaluating new tradingarrangements for several reasons. First, it captures extensive indirect effects,such as interindustry linkages between sectors and trade linkages betweencountries and regions. Second, it can evaluate the effect of removing tradebarriers on resource allocation and structural adjustment in each country. Third,it can detail the impacts on both member and nonmember countries and therebybetter elucidate implications for the negotiating environment.
The APEC model used in this study is a dynamic CGE model of the globaleconomy. It is, to a large extent, based upon OECD’s Linkage model (OECD,1997). One of the key features of the model is that goods are differentiated byregion of origin and are modeled as imperfect substitutes. On the import side,this is reflected by the implementation of the so-called Armington assumptionwhere a constant elasticity of substitution (CES) specification is used toincorporate imperfect substitution of imported goods with respect to domes-tically produced goods. A symmetric specification is used to model exportsupply, the latter being implemented with constant-elasticity-of transformation(CET) functions.5
As defined in Section 2, the APEC model contains 15 APEC and 3 non-APEC regions. The model is calibrated to social accounting matrices (SAMs)of the 18 regions, which are constructed from the GTAP database, version 4.The original database provides 1995 data on input-output, value added, finaldemand, bilateral trade, transport and protection data for 45 regions and 50sectors. This has been aggregated into an 18-region, 16-sector data set for theimplementation of the APEC model.
The model spans the period 1995–2020. It solves every year from1995–2010 and every five years from 2010–2020. While the model relies onsequential static computation of equilibria, intertemporal trends are specifiedfor factor growth (labor) and accumulation (capital), as well as changes inproductivity. Land is assumed to be price-responsive, however, with no timetrend on the supply curve.
All sectors are assumed to be perfectly competitive and operate underconstant returns to scale. Production technology is modeled mainly by anesting of CES functions. The model has three kinds of factors of production:labor, capital, and sector-specific fixed factors (e.g. land in agricultural sectors).Labor supply is assumed to be fixed in all regions and for all time periods, and
708 HIRO LEE ET AL.

the wage rate adjusts to insure equilibrium in the domestic labor market. Whilewe assume no international migration, labor is free to move across all sectorsof the economy. Thus, there is a single equilibrium wage rate.
Within each period, capital is classified as being either old or new. Newcapital is generated by the previous period’s investment. This vintage structureof capital allows for differentiating the substitution possibilities across inputsby the age of capital. Similar to labor, new capital is assumed to be perfectlymobile across sectors, and there is a single economy wide rate of return oncapital.
All income generated by economic activity is assumed to be distributed toconsumers. A single representative consumer allocates optimally his/herdisposable income among the consumer goods and saving. The consumption/saving decision is static: saving is treated as a good, and its amount isdetermined simultaneously with the demands for the other goods. The price ofsaving is set arbitrarily equal to the average price of consumer goods.
The model is calibrated on exogenous growth rates of real GDP, population,labor productivity, and an autonomous energy efficiency improvement inenergy use.6 In the baseline scenario, the dynamics are calibrated in eachcountry/region by imposing the assumption of a balanced growth path. Thisimplies that the ratio between labor and the capital/fixed-factor bundle (inefficiency units) is held constant over time.7 When the APEC tradeliberalization scenario is simulated, the growth of capital is endogenouslydetermined by the saving-investment relation.
4. EMPIRICAL ASSESSMENTS
In this section, we examine both aggregate and sectoral effects of APEC tradeliberalization. To assess the implications of regional trade liberalization, wefirst establish a baseline scenario that assumes no trade liberalization during the2000–2020 period. We then run a simulation on nondiscriminatory APEC tradeliberalization; i.e. developed members remove import and export distortions by2010, and developing members remove them by 2020 on a Most-FavoredNation (MFN) basis.8
In contrast to a free trade area where each member country removes bilateraltrade barriers on imports from other members, trade liberalization by APECmembers is nondiscriminatory toward the rest of the world. Each membersubmits individual action plans (IAPs) every year, which provide a blueprintfor implementing liberalization and facilitation in APEC (Yamazawa, 1997).The general perception among the APEC leaders is that regional integrationshould be nondiscriminatory toward the rest of the world, which is consistent
709General Equilibrium Assessments of Trade Liberalization in APEC Countries
with the process of multilateral trade liberalization as envisioned under theWorld Trade Organization (WTO).9
Three caveats should be mentioned with regard to the APEC scenario. First,it is assumed that APEC countries’ liberalization coincides with the UruguayRound (UR) commitments during 1995–2000. However, a number of countries(e.g. Chile, China, Indonesia, and the Philippines) have committed to tariffreductions that are significantly larger than the UR commitments (Yamazawa,1997). Second, the baseline scenario does not incorporate conceivablereductions in trade distortions beyond the year 2000 under the new WTORound. The first caveat would underestimate the impact of APEC tradeliberalization while the second would overestimate it. Third, the assumptionthat all members remove trade barriers on agricultural products by 2010/2020might be too optimistic. For example, Japan, Korea, and the Philippines haveexcluded liberalization of rice and some other agricultural products from theirIAPs. In particular, it is highly unlikely that Japan would liberalize its ricemarket by 2010. Thus, these caveats must be borne in mind when interpretingthe simulation results.
4.1. Impact of APEC Trade Liberalization on Real GDP Growth
Table 4 summarizes the impact of APEC trade liberalization, on an MFN basis,on real GDP. It indicates percentage changes in real GDP relative to thebaseline in 2005, 2010, 2015, and 2020, as well as absolute changes (billionsof 1995 U.S.$) in 2020. By the year 2020, real GDP of developed anddeveloping APEC members would increase by $42 billion and $83 billion,respectively (the last column of the table). In addition, since there would be notrade diversion under nondiscriminatory liberalization, the non-APEC regionswould also be able to capture nontrivial gains in real GDP ($16 billion). Thegains in real GDP are distributed very unevenly, however. In 2020, thePhilippines would realize a 3.8% increase in real GDP over the baselineprojection, followed by Thailand (1.6%), Vietnam (1.4%), Singapore (1.3%),and Taiwan (1.1%). In percentage terms, an increase in real GDP is very smallin Japan, Canada, the United States, and Mexico.10
The real GDP gains reported in this chapter are significantly smaller thanthose obtained in our earlier study (Lee et al., 1999) for two major reasons.First, the model used here is calibrated to the 1995 database, whereas we usedthe 1992 database in the previous study. During the three-year period, someAPEC countries reduced trade barriers significantly, resulting in much lowertrade distortions in the base year. For example, Thailand lowered its averagetariff rate from 31.6 to 13.1%, and Indonesia from 12.3 to 6.7% during
710 HIRO LEE ET AL.

1992–1995. Second, some modifications in the structure of the APEC modelwould affect simulation results. Most importantly, the newly incorporatedassumption of imperfect substitutability between domestically produced goodsand exported goods, which are represented by CET functions, would reduce theimpact of the removal of trade distortions.
While countries with higher initial protection rates generally achieve greaterefficiency gains from trade reform, the extent of welfare gains depends uponseveral other factors. Singapore has the lowest average rate of protection (withthe exception of Hong Kong which is aggregated into China), but its real GDPgains are relatively large. This is because its export to GDP ratio and intra-APEC trade share are both extremely high, and an APEC-wide tradeliberalization would enable it to capture a relatively large gain through exportexpansion.
Table 4. Changes in Real GDP relative to the Baseline Values.
Percentage changes Absolutechanges
Country/Region 2005 2010 2015 2020 in 2020a
Australasia 0.1 0.2 0.5 0.7 5.8Japan 0.1 0.2 0.2 0.2 13.0China (incl. Hong Kong) 0.2 0.4 0.7 0.9 38.8Korea 0.1 0.3 0.4 0.5 6.6Taiwan 0.2 0.5 0.8 1.1 11.8Singapore 0.2 0.6 1.0 1.3 3.4Malaysia 0.3 0.6 0.8 0.9 3.2Thailand 0.3 0.7 1.2 1.6 6.9Indonesia 0.0 0.1 0.3 0.4 2.1Philippines 0.4 1.2 2.4 3.8 8.2Vietnam 0.3 0.7 1.1 1.4 0.7Canada 0.0 0.0 0.0 0.1 0.6United States 0.0 0.1 0.1 0.2 22.8Mexico 0.0 0.0 0.0 0.0 0.2Chile 0.0 0.2 0.3 0.5 1.2Other Latin America 0.0 0.0 0.0 0.1 2.4Europe 0.0 0.0 0.0 0.1 9.2Rest of World 0.0 0.0 0.0 0.1 4.2
Developed APEC 0.0 0.1 0.2 0.2 42.2Developing APEC 0.1 0.3 0.5 0.7 83.0Non-APEC Countries 0.0 0.0 0.0 0.1 15.9
a Billions of 1995 U.S. dollars.
711General Equilibrium Assessments of Trade Liberalization in APEC Countries

Canada and Mexico gain very little from APEC trade liberalization. This isbecause about three-quarters of Canadian and Mexican exports were destinedto the United States in 1995, and the U.S. tariff rates on Canadian and Mexicanproducts were already quite low.11 Thus, the benefits for Canada and Mexicoare expected to be very small because of their low trade shares with non U.S.APEC members.
A major reason why the U.S. gains (in percentage terms) are small might bebecause liberalization of service trade is excluded from our experiment. Thefrequency of NTBs in various categories of services in APEC countriessuggests that the magnitude of barriers to trade in services may be extremelylarge (APEC & PECC, 1995). However, there is no proper method to convertfrequency ratios into ad valorem equivalents, and no attempt has been made inthe present study. Service exports accounted for approximately one-quarter ofU.S. exports in 1995, and its share in total exports would have been muchgreater in the absence of regulations in its trading partners. Since the U.S. hascomparative advantage in services, service trade liberalization is expected tobring substantial benefits.
Another limitation of this study is that we have only considered tradeliberalization. Liberalization on foreign direct investment (FDI) is expected tobring additional gains. Lee and Roland-Holst (1998) show that, in the contextof U.S-Japan trade, capital mobility increases the welfare gains to bothcountries that accrue from bilateral trade liberalization. Petri (1997) conductsAPEC trade and FDI liberalization experiments and finds that an exclusion ofFDI liberalization would diminish global welfare gains resulting from APECliberalization by $60 billion, or 23% of full liberalization.12 These resultsconfirm our a priori expectation that the removal of investment barriers wouldlead to additional real output and income gains, which could be substantial fordeveloping members.
4.2. Sectoral Results
Although the real GDP results of the liberalization scenarios indicate theoverall gains in the standard of living resulting from the removal of tradedistortions, economy wide efficiency gains are rarely distributed uniformlyacross sectors. Trade liberalization might lead to a sharp contraction of outputand employment in highly protected activities, and the adversely affectedsectors are likely to strongly oppose trade reform.
In many of the previous studies assessing the impact of APEC tradeliberalization (e.g. APEC, 1997; McKibbin, 1998; Yang et al., 1998), sectoraleffects are not evaluated. However, aggregate results reveal only part of the
712 HIRO LEE ET AL.

story and can give misleading signals about the political feasibility of tradeaccords. Since trade policy is often formulated from the bottom up, a modernview of national interest, such as that based on trade reciprocity and openmultilateralism, might encounter conflicts with established domestic interests.
Table 5 provides absolute and percentage changes in sectoral output, exports,and imports resulting from APEC liberalization compared with the projectedbaseline values in 2020. Since rice and wheat are the most protected productsin many East Asian members, the removal of trade distortions in these productscan lead to extreme adjustments. In particular, Japan’s output of rice and wheatis estimated to contract by 56% while its imports would rise by almost 700%compared with the baseline values in 2020. By contrast, countries that exportrelatively large shares of rice and wheat would experience sharp increases inoutput. Driven by a surge in exports, the output of rice and wheat inAustralasia, Canada, and the United States is expected to rise by 108, 69, and49%, respectively.
The agricultural exporters would generally experience reductions inmanufacturing output because labor and capital are drawn into the agriculturalsectors.13 For example, the United States would experience reductions ingrowth rates of manufactures with the exception of processed food, wood andpaper, and chemicals. However, increases in output of agricultural sectors andservice-oriented sectors (sectors 13–16) would more than offset the reductionsin manufacturing output.
In China, Asian NIEs (Korea, Taiwan, and Singapore), and the ASEAN-4countries (Malaysia, Thailand, Indonesia, and the Philippines), exports andimports increase in all manufacturing sectors. Not only would they expandproduction of labor-intensive manufactures (e.g. textiles and clothing), butmost of the Asian developing countries also increase output of the greatmajority of capital-intensive manufactures.
Korea and Taiwan’s results are somewhat similar to Japan’s as agriculturalsectors contract (relative to the baseline case) and all manufacturing sectorsexpand except transport equipment in Taiwan. One notable difference is thatthe reductions in agricultural output in these two countries are significantlysmaller than in Japan mainly because of their much lower initial protectionrates on agricultural products.
In China, removing the trade distortions would result in a fall in agriculturaloutput, posing a potential problem on food supply in the long run. Real outputof a number of manufacturing and service-oriented sectors would increase overthe baseline level, where Hong Kong’s comparative advantage in manufacturesand services might be contributing significantly to these results.
713General Equilibrium Assessments of Trade Liberalization in APEC Countries

Table 5. Changes in Sectoral Output, Exports, and Imports relative to the Baseline, 2020 (Billions of 1995 U.S.Dollars, Percent).
Australasia Japan China (incl· Hong Kong)
Output Exports Imports Output Exports Imports Output Exports Imports
($b) (%) ($b) (%) ($b) (%) ($b) (%) ($b) (%) ($b) (%) ($b) (%) ($b) (%) ($b) (%)
1 Rice and wheat 6.2 108.4 5.2 182.4 0.0 –6.5 –61.8 –55.7 –0.1 –89.0 74.4 691.9 –1.6 –0.7 0.0 17.4 –0.8 –17.12 Other agriculture 2.3 3.8 –0.1 –0.7 0.3 11.6 –28.2 –11.1 –0.1 –9.3 36.1 57.2 –9.0 –1.2 0.5 2.5 0.2 0.73 Coal, oil, and gas 0.5 1.0 –0.1 –0.4 0.3 3.1 1.4 1.9 0.2 8.6 –1.2 –0.7 13.0 2.7 2.7 11.9 –0.7 –3.74 Other mining –0.5 –2.5 –0.4 –3.2 0.0 1.1 0.6 1.8 0.0 4.0 0.1 0.4 4.3 2.5 1.0 8.7 –1.0 –5.85 Processed food 7.0 8.8 5.4 22.5 0.4 7.1 –8.7 –1.3 0.4 14.1 19.9 23.2 –1.2 –0.3 4.2 15.5 1.7 5.46 Textiles, clothing –1.4 –7.0 –0.2 –4.1 2.9 17.7 0.9 0.3 3.1 21.0 11.3 11.0 34.4 4.0 50.0 15.2 38.0 21.77 Wood and paper –0.5 –0.9 –0.1 –2.1 0.9 8.4 3.6 0.6 0.5 7.2 –0.4 –0.7 1.5 0.4 2.7 6.4 2.2 5.68 Chemicals –0.4 –0.7 0.1 0.4 1.8 7.2 7.5 0.8 5.1 7.2 –0.4 –0.6 –10.4 –1.1 2.2 2.0 9.7 6.99 Metals and prod. –1.1 –1.6 –0.2 –0.9 0.8 8.1 16.9 2.1 4.2 7.8 –0.1 –0.1 –0.1 0.0 4.0 3.6 3.6 4.610 Machinery –1.6 –3.6 –0.3 –2.1 3.5 6.3 40.4 2.2 27.0 5.8 0.5 0.3 13.8 0.8 29.7 7.1 13.1 3.811 Transport equip. –1.5 –4.4 –0.1 –2.0 2.7 10.7 22.0 4.7 17.8 11.8 –0.8 –2.1 –23.7 –7.0 1.2 5.1 13.2 21.112 Other manufac –0.7 –3.7 0.0 –1.5 1.4 13.9 3.6 1.0 2.4 6.5 1.5 3.2 12.8 1.9 18.3 14.0 7.0 17.513 Construction 3.8 3.2 . . . . . . . . . . . . 8.7 0.4 . . . . . . . . . . . . 5.3 0.6 . . . . . . . . . . . .14 Electricity 0.3 1.6 . . . . . . . . . . . . 1.6 0.7 . . . . . . . . . . . . 3.7 1.0 . . . . . . . . . . . .15 Trade and transp. 1.3 0.3 0.0 –0.1 1.2 3.2 8.5 0.3 3.4 4.1 4.7 1.7 28.5 1.2 23.9 7.8 –2.6 –3.116 Other services 1.7 0.3 –0.2 –1.1 0.2 1.7 –0.7 0.0 0.5 1.7 0.6 0.9 8.4 0.6 4.3 6.6 –1.5 –4.0
714H
IRO
LE
E E
T A
L.
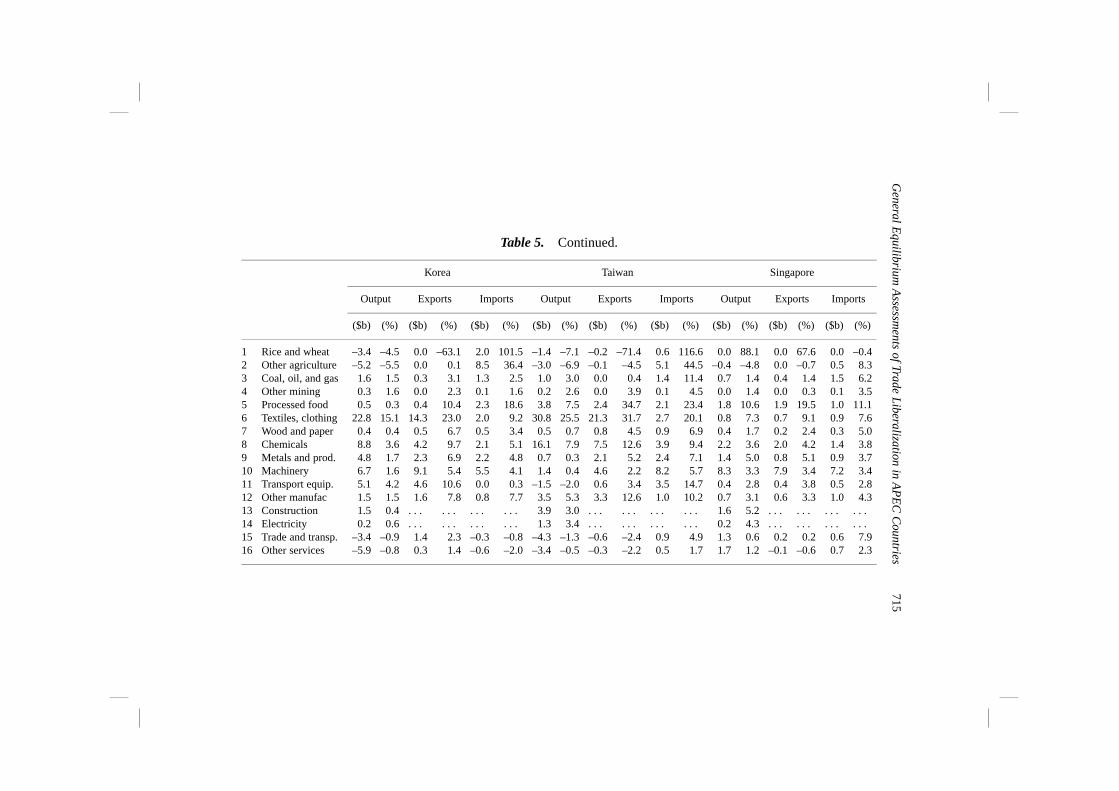
Table 5. Continued.
Korea Taiwan Singapore
Output Exports Imports Output Exports Imports Output Exports Imports
($b) (%) ($b) (%) ($b) (%) ($b) (%) ($b) (%) ($b) (%) ($b) (%) ($b) (%) ($b) (%)
1 Rice and wheat –3.4 –4.5 0.0 –63.1 2.0 101.5 –1.4 –7.1 –0.2 –71.4 0.6 116.6 0.0 88.1 0.0 67.6 0.0 –0.42 Other agriculture –5.2 –5.5 0.0 0.1 8.5 36.4 –3.0 –6.9 –0.1 –4.5 5.1 44.5 –0.4 –4.8 0.0 –0.7 0.5 8.33 Coal, oil, and gas 1.6 1.5 0.3 3.1 1.3 2.5 1.0 3.0 0.0 0.4 1.4 11.4 0.7 1.4 0.4 1.4 1.5 6.24 Other mining 0.3 1.6 0.0 2.3 0.1 1.6 0.2 2.6 0.0 3.9 0.1 4.5 0.0 1.4 0.0 0.3 0.1 3.55 Processed food 0.5 0.3 0.4 10.4 2.3 18.6 3.8 7.5 2.4 34.7 2.1 23.4 1.8 10.6 1.9 19.5 1.0 11.16 Textiles, clothing 22.8 15.1 14.3 23.0 2.0 9.2 30.8 25.5 21.3 31.7 2.7 20.1 0.8 7.3 0.7 9.1 0.9 7.67 Wood and paper 0.4 0.4 0.5 6.7 0.5 3.4 0.5 0.7 0.8 4.5 0.9 6.9 0.4 1.7 0.2 2.4 0.3 5.08 Chemicals 8.8 3.6 4.2 9.7 2.1 5.1 16.1 7.9 7.5 12.6 3.9 9.4 2.2 3.6 2.0 4.2 1.4 3.89 Metals and prod. 4.8 1.7 2.3 6.9 2.2 4.8 0.7 0.3 2.1 5.2 2.4 7.1 1.4 5.0 0.8 5.1 0.9 3.710 Machinery 6.7 1.6 9.1 5.4 5.5 4.1 1.4 0.4 4.6 2.2 8.2 5.7 8.3 3.3 7.9 3.4 7.2 3.411 Transport equip. 5.1 4.2 4.6 10.6 0.0 0.3 –1.5 –2.0 0.6 3.4 3.5 14.7 0.4 2.8 0.4 3.8 0.5 2.812 Other manufac 1.5 1.5 1.6 7.8 0.8 7.7 3.5 5.3 3.3 12.6 1.0 10.2 0.7 3.1 0.6 3.3 1.0 4.313 Construction 1.5 0.4 . . . . . . . . . . . . 3.9 3.0 . . . . . . . . . . . . 1.6 5.2 . . . . . . . . . . . .14 Electricity 0.2 0.6 . . . . . . . . . . . . 1.3 3.4 . . . . . . . . . . . . 0.2 4.3 . . . . . . . . . . . .15 Trade and transp. –3.4 –0.9 1.4 2.3 –0.3 –0.8 –4.3 –1.3 –0.6 –2.4 0.9 4.9 1.3 0.6 0.2 0.2 0.6 7.916 Other services –5.9 –0.8 0.3 1.4 –0.6 –2.0 –3.4 –0.5 –0.3 –2.2 0.5 1.7 1.7 1.2 –0.1 –0.6 0.7 2.3
715G
eneral Equilibrium
Assessm
ents of Trade Liberalization in A
PE
C C
ountries
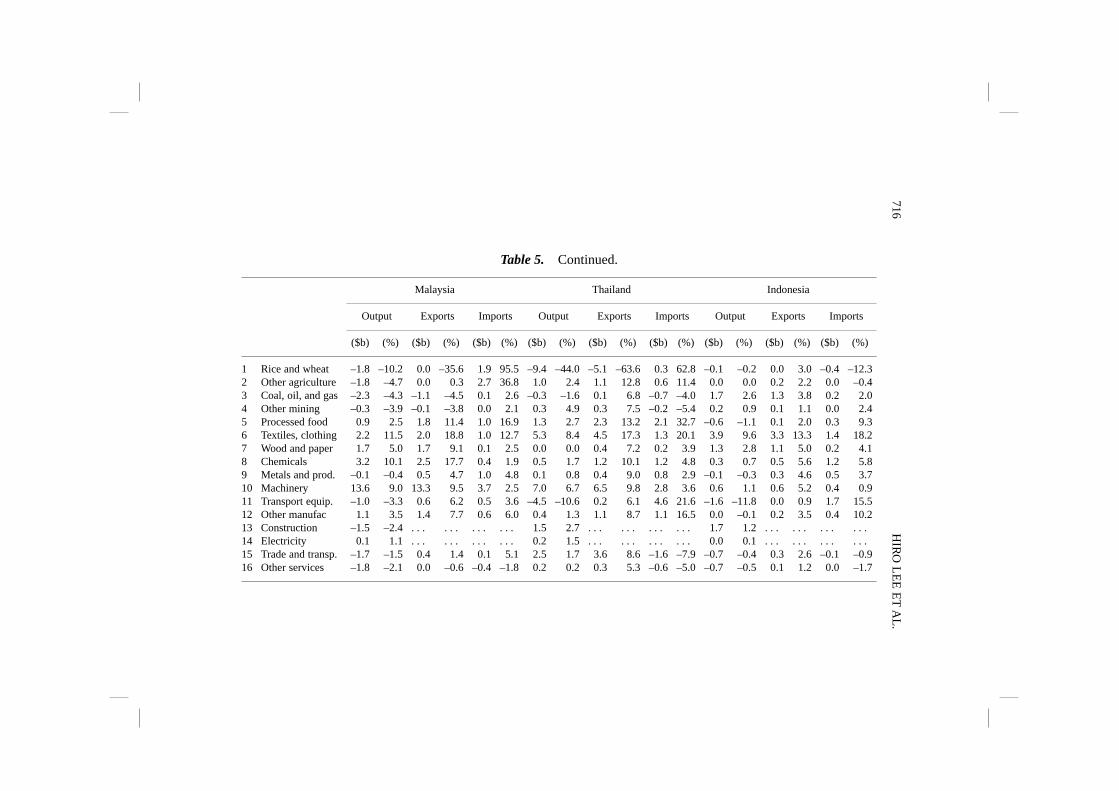
Table 5. Continued.
Malaysia Thailand Indonesia
Output Exports Imports Output Exports Imports Output Exports Imports
($b) (%) ($b) (%) ($b) (%) ($b) (%) ($b) (%) ($b) (%) ($b) (%) ($b) (%) ($b) (%)
1 Rice and wheat –1.8 –10.2 0.0 –35.6 1.9 95.5 –9.4 –44.0 –5.1 –63.6 0.3 62.8 –0.1 –0.2 0.0 3.0 –0.4 –12.32 Other agriculture –1.8 –4.7 0.0 0.3 2.7 36.8 1.0 2.4 1.1 12.8 0.6 11.4 0.0 0.0 0.2 2.2 0.0 –0.43 Coal, oil, and gas –2.3 –4.3 –1.1 –4.5 0.1 2.6 –0.3 –1.6 0.1 6.8 –0.7 –4.0 1.7 2.6 1.3 3.8 0.2 2.04 Other mining –0.3 –3.9 –0.1 –3.8 0.0 2.1 0.3 4.9 0.3 7.5 –0.2 –5.4 0.2 0.9 0.1 1.1 0.0 2.45 Processed food 0.9 2.5 1.8 11.4 1.0 16.9 1.3 2.7 2.3 13.2 2.1 32.7 –0.6 –1.1 0.1 2.0 0.3 9.36 Textiles, clothing 2.2 11.5 2.0 18.8 1.0 12.7 5.3 8.4 4.5 17.3 1.3 20.1 3.9 9.6 3.3 13.3 1.4 18.27 Wood and paper 1.7 5.0 1.7 9.1 0.1 2.5 0.0 0.0 0.4 7.2 0.2 3.9 1.3 2.8 1.1 5.0 0.2 4.18 Chemicals 3.2 10.1 2.5 17.7 0.4 1.9 0.5 1.7 1.2 10.1 1.2 4.8 0.3 0.7 0.5 5.6 1.2 5.89 Metals and prod. –0.1 –0.4 0.5 4.7 1.0 4.8 0.1 0.8 0.4 9.0 0.8 2.9 –0.1 –0.3 0.3 4.6 0.5 3.710 Machinery 13.6 9.0 13.3 9.5 3.7 2.5 7.0 6.7 6.5 9.8 2.8 3.6 0.6 1.1 0.6 5.2 0.4 0.911 Transport equip. –1.0 –3.3 0.6 6.2 0.5 3.6 –4.5 –10.6 0.2 6.1 4.6 21.6 –1.6 –11.8 0.0 0.9 1.7 15.512 Other manufac 1.1 3.5 1.4 7.7 0.6 6.0 0.4 1.3 1.1 8.7 1.1 16.5 0.0 –0.1 0.2 3.5 0.4 10.213 Construction –1.5 –2.4 . . . . . . . . . . . . 1.5 2.7 . . . . . . . . . . . . 1.7 1.2 . . . . . . . . . . . .14 Electricity 0.1 1.1 . . . . . . . . . . . . 0.2 1.5 . . . . . . . . . . . . 0.0 0.1 . . . . . . . . . . . .15 Trade and transp. –1.7 –1.5 0.4 1.4 0.1 5.1 2.5 1.7 3.6 8.6 –1.6 –7.9 –0.7 –0.4 0.3 2.6 –0.1 –0.916 Other services –1.8 –2.1 0.0 –0.6 –0.4 –1.8 0.2 0.2 0.3 5.3 –0.6 –5.0 –0.7 –0.5 0.1 1.2 0.0 –1.7
716H
IRO
LE
E E
T A
L.

Table 5. Continued.
Philippines Vietnam Canada
Output Exports Imports Output Exports Imports Output Exports Imports
($b) (%) ($b) (%) ($b) (%) ($b) (%) ($b) (%) ($b) (%) ($b) (%) ($b) (%) ($b) (%)
1 Rice and wheat –2.1 –11.8 0.0 –45.7 1.0 55.8 1.1 22.1 0.8 59.2 0.0 14.1 4.5 68.9 4.3 79.0 0.0 –18.12 Other agriculture –0.1 –0.2 0.4 23.1 0.0 1.2 –0.8 –5.2 0.0 0.4 0.0 4.5 0.0 0.0 0.2 2.2 0.2 2.63 Coal, oil, and gas 1.7 14.0 0.4 27.5 –0.4 –5.6 1.5 19.7 1.3 21.9 0.6 20.1 0.1 0.1 0.1 0.4 0.8 6.74 Other mining 1.4 22.4 0.6 25.2 0.0 0.9 0.0 –1.9 0.0 4.3 0.0 –4.6 0.0 –0.2 0.0 –0.1 0.0 –0.35 Processed food –1.7 –3.4 1.1 21.1 1.0 15.3 –1.3 –16.5 –0.1 –2.3 1.9 51.4 –0.6 –0.9 0.1 0.8 0.6 5.96 Textiles, clothing 6.4 42.1 4.4 54.5 1.3 19.0 2.1 24.2 1.7 30.4 0.9 23.9 –1.5 –6.1 –0.2 –3.3 2.9 14.17 Wood and paper 0.9 9.1 0.5 25.7 0.1 5.1 –0.1 –1.5 0.0 5.5 0.1 7.5 –0.7 –0.5 –0.3 –0.5 0.2 0.88 Chemicals 0.8 4.1 0.5 20.7 0.8 6.7 0.2 6.6 0.1 16.1 0.1 1.5 0.7 0.8 0.2 0.7 0.8 2.09 Metals and prod. 2.5 26.5 0.9 28.9 1.5 18.7 0.0 –1.9 0.0 5.1 0.0 –1.6 –0.4 –0.5 0.0 –0.2 0.3 1.110 Machinery 9.7 32.6 9.2 33.1 6.7 18.9 0.0 0.5 0.0 4.9 0.0 0.6 –0.8 –0.8 –0.4 –0.7 0.7 0.611 Transport equip. 0.6 27.9 0.4 41.7 0.4 5.8 –0.2 –15.0 0.0 4.1 0.3 8.3 0.4 0.3 0.5 0.5 0.4 0.612 Other manufac. 1.1 22.6 1.0 32.6 0.3 10.1 0.0 –0.7 0.0 8.1 0.1 10.9 –0.3 –1.6 0.0 –0.7 0.5 3.013 Construction 1.4 9.7 . . . . . . . . . . . . 0.2 1.2 . . . . . . . . . . . . 0.4 0.2 . . . . . . . . . . . .14 Electricity 0.1 1.6 . . . . . . . . . . . . 0.0 –0.2 . . . . . . . . . . . . –0.1 –0.2 . . . . . . . . . . . .15 Trade and transp. 1.6 1.6 3.3 19.8 –1.9 –17.0 0.2 0.8 0.5 5.0 0.0 –0.7 –0.4 –0.1 0.3 1.0 0.3 0.816 Other services 2.2 2.2 2.8 14.0 –0.4 –13.2 –0.4 –2.6 0.0 0.7 0.0 –2.6 –0.9 –0.2 0.0 –0.1 0.0 0.0
717G
eneral Equilibrium
Assessm
ents of Trade Liberalization in A
PE
C C
ountries

Table 5. Continued.
United States Mexico Chile
Output Exports Imports Output Exports Imports Output Exports Imports
($b) (%) ($b) (%) ($b) (%) ($b) (%) ($b) (%) ($b) (%) ($b) (%) ($b) (%) ($b) (%)
1 Rice and wheat 12.8 48.8 10.3 80.7 –0.1 –11.2 0.0 –2.4 0.0 2.9 0.0 9.2 0.0 –0.5 0.0 7.1 0.0 2.12 Other agriculture 34.2 7.6 23.1 40.9 1.9 5.7 0.1 0.2 0.2 3.3 0.0 0.7 0.2 0.7 0.2 4.4 0.0 1.53 Coal, oil, and gas 2.8 0.6 0.2 1.2 1.5 1.0 1.3 1.2 0.7 3.0 0.0 –0.1 0.1 1.4 0.0 9.1 0.1 3.44 Other mining –0.1 –0.1 0.0 –0.3 0.0 0.0 0.1 0.7 0.0 1.8 0.0 1.5 1.1 5.7 0.7 6.7 0.0 4.85 Processed food 4.0 0.5 3.1 6.8 4.8 10.9 0.1 0.1 0.2 4.9 –0.2 –5.3 –0.1 –0.2 0.2 3.3 0.1 4.06 Textiles, clothing –15.1 –4.1 –0.4 –1.2 31.9 15.9 –0.8 –1.3 –0.2 –2.1 0.3 3.8 –0.4 –2.2 0.0 6.2 0.4 9.37 Wood and paper 1.6 0.2 0.1 0.1 1.2 1.3 0.2 0.4 0.1 2.0 0.0 –0.2 0.7 2.8 0.6 5.7 0.1 3.68 Chemicals 1.1 0.1 1.7 1.1 5.0 3.4 0.3 0.3 0.4 2.5 0.2 0.9 0.0 –0.1 0.2 5.8 0.2 3.49 Metals and prod. –3.5 –0.4 0.1 0.2 2.7 2.3 0.7 1.1 0.4 2.7 0.2 1.4 2.2 6.4 1.8 9.1 0.1 3.810 Machinery –19.8 –1.2 –3.1 –0.6 26.7 4.2 1.3 1.3 1.4 1.9 0.7 1.0 –0.1 –2.1 0.0 4.3 0.4 3.311 Transport equip. –0.2 0.0 0.3 0.2 8.4 3.5 1.1 1.7 1.0 2.8 0.3 1.6 0.0 –1.0 0.0 7.4 0.3 2.812 Other manufac –3.7 –1.4 0.1 0.4 8.3 7.0 –0.3 –1.0 0.0 0.5 0.5 8.3 –0.1 –2.0 0.0 4.5 0.2 8.113 Construction 13.5 0.6 . . . . . . . . . . . . 0.1 0.2 . . . . . . . . . . . . 0.5 1.3 . . . . . . . . . . . .14 Electricity 0.8 0.3 . . . . . . . . . . . . 0.0 –0.1 . . . . . . . . . . . . 0.0 0.4 . . . . . . . . . . . .15 Trade and transp. 6.4 0.2 1.7 0.9 5.1 3.0 –0.7 –0.2 0.7 2.0 –0.1 –1.2 0.0 0.0 0.5 5.6 –0.1 –2.916 Other services 16.1 0.2 0.4 0.2 0.3 0.2 –1.0 –0.4 0.0 1.0 –0.1 –1.3 –0.8 –0.7 0.1 3.0 –0.1 –3.1
718H
IRO
LE
E E
T A
L.

Large structural adjustments occur in ASEAN countries, particularly in thePhilippines. Textile and clothing output would increase in all six ASEANcountries reported in Table 5, ranging from 7.3% in Singapore to 42.1% in thePhilippines. Machinery is another sector that expands in all the ASEANcountries. In the Philippines APEC trade liberalization would lead to outputincreases in all manufacturing sectors in excess of 20% over the baseline valuesin 2020.
Relatively small structural adjustments are predicted to occur in Mexico andChile. In Mexico, output growth is higher in fossil fuels, metals and products,machinery, and transport equipment over baseline projections, whereas it islower in rice and wheat, textiles and clothing, and other manufactures. Thesectoral results for Chile are consistent with our a priori expectations on outputadjustments for a resource-abundant country. Real output growth is faster underthe liberalization scenario in other agriculture, fossil fuels, other mining, woodand paper, and nonferrous metals (aggregated into metals and products), largelydriven by new export demand. Real output growth becomes slower in textilesand clothing, machinery, and other manufactures.
Although not reported in this chapter, we also conducted a discriminatoryliberalization experiment. Standard deviations of changes in real output relativeto the baseline are not significantly different between the discriminatory andnondiscriminatory scenarios in most of the APEC countries/regions. Forproducts with comparative disadvantage, such as agriculture and processedfood in Japan and clothing in developed members, the shares of intra-APECimports are extremely high. Thus, even though these products suffer greateroutput losses under nondiscriminatory liberalization, additional contractionsare relatively small.
5. CONCLUSION
At the turn of this millennium, most of the nations bordering the Pacific haveembarked upon an ambitious plan for open multilateralism. Although theaggregate benefits from more efficient regional specialization are readilyapparent, more detailed adjustment costs en route to Pan-Pacific free trade aremore difficult to ascertain but unlikely to be negligible in domestic policyagendas. For this reason, implementation of this trade reform agenda can befacilitated by a deeper understanding of these adjustment patterns, includingthe magnitude and incidence of their economic costs.
In that spirit, this chapter has provided general equilibrium estimates of theimpact of APEC trade liberalization on real GDP, sectoral output, exports andimports. Compared with the baseline scenario where no trade liberalization is
719General Equilibrium Assessments of Trade Liberalization in APEC Countries

assumed during 2000–2020, real GDP of developed and developing APECmembers is predicted to increase by $42 billion and $83 billion, respectively,by the year 2020 while that of non-APEC members would increase by $16billion. The estimates based on our dynamic CGE model are not forecasts,however. They depend upon the model structure, parameter values, and policyscenarios. The present model does not incorporate such features as scaleeconomies or human capital in the production function. The inclusion of thesefactors with dynamic specification is likely to result in a substantially largerimpact of liberalization.14 In addition, we have only considered liberalization ofmerchandise trade and did not include liberalization of service trade orinvestment in this study. Thus, our results may be considered a lower end of thefull impact of APEC liberalization.
APEC members submit individual action plans (IAPs) each year, providingtheir own liberalization and facilitation plans for the short-, medium- and long-term horizons and unilaterally reduces its trade barriers accordingly. However,the implementation of IAPs is non-binding and several member governmentsare thus reluctant to remove trade barriers on politically sensitive sectors,particularly when the domestic economy is experiencing a recession or crisis.Nonetheless, if each government implements an adjustment program, includingthe training of workers in depressed sectors, the social costs of economictransition could be mitigated. Overall, APEC trade liberalization wouldproduce trade expansion in most product categories, especially inexpensiveimports at the expense of high-priced domestic products.
Although the assessments of APEC liberalization would be enhanced byextension of our model, as well as by more careful evaluation of IAPs, ourresults provide some important policy implications. First, despite largedisparities in per capita income, nondiscriminatory liberalization promisessubstantial benefits to the APEC member countries and people in the PacificBasin. These benefits appear to outweigh the adjustment costs of attaining ahigher and more sustainable growth trajectory. Second, while the adjustmentsmay be difficult for some groups, they are necessary if each of the membereconomies and the region as a whole is to realize its full economic potential.A dynamic economy cannot avoid experiencing structural adjustments,inasmuch as technological innovation and growth-induced changes in con-sumption and production patterns would require such adjustments. Finally,while APEC liberalization is a good long-term prescription for regional growth,speeding up the process would also be good first aid for the East Asianeconomies that are currently experiencing economic crisis. Economies dealingwith both recession and the prospect of globalization should focus their
720 HIRO LEE ET AL.

resources on the recovery of export-oriented activities to secure a moresustainable basis for economic recovery and future growth.
NOTES
1. These data are based on the Global Trade Analysis Project (GTAP) database. SeeGehlhar et al. (1997) and McDougall et al. (1998) for detailed descriptions of the GTAPdatabase. Due to the data limitations, Brunei, Papua New Guinea, and Peru areaggregated into ROW. Russia, which is newly admitted to APEC in 1998, is alsoaggregated into ROW.
2. In version 4 of the GTAP database, the observed domestic-world price gap isapplied at the commodity level to estimate import protection and export tax/subsidyrates. Thus a negative protection rate might result (e.g. rice and wheat in China, Mexico,and Chile) when the domestic price is lower than the world price.
3. These are largely caused by the imposition of import quotas on a number ofagricultural products in these countries.
4. Japan’s export subsidy rate of 83.5% on rice and wheat is significantly smallerthan its import protection rate of 535%. This is because heavily protected paddy riceand wheat have negligible amount of exports compared to processed rice. In GTAPdatabase, Japan’s export subsidy rate on processed rice is set to zero whereas its importprotection rates on processed rice is the same as that on paddy rice.
5. Note that the CET export specification was not implemented in the LinkageModel. Hence, differences in model results can partially be attributed to this change inmodel specification. Further, the trade elasticities used in this analysis were somewhatreduced from those used in the previous study.
6. Real GDP and population growth rates are based on the World Bank’s latestprojections (as of May 1999).
7. This involves computing in each period a measure of Harrod-neutral technicalprogress in the capital/fixed-factor bundle as a residual, given that the growth of thelabor force (in efficiency units) is pre-determined. This is a standard calibrationprocedure in dynamic CGE modeling.
8. Only positive tariffs and negative export distortions (i.e. subsidies) are phasedout.
9. See, e.g. Lloyd (1996), Oxley (1996), Tan (1998), and Yamazawa (1996).10. Studies evaluating the effects of alternative trade liberalization scenarios among
Asia-Pacific countries include Brown et al. (1996), Lee and Woodall (1998), Lee et al.(1999), Lewis et al. (1995), Yang et al. (1998), and Young and Chye (1997). Thesestudies generally find that, in percentage terms, both discriminatory and non-discriminatory liberalization by East Asian or APEC countries would lead to welfaregains to developing countries (e.g. China and ASEAN) that are significantly greater thanthose to developed countries. Recent studies assessing the impact of the Uruguay Round(e.g. Francois et al., 1996, 1997; Goldin et al., 1993; Harrison et al., 1996; Hertel et al.,1996; Yang et al., 1997) also show substantial variations in the distribution of worldwelfare gains across regions.
11. While we only summarize APEC countries’ average protection rates bycommodity in Table 2, the GTAP database provide protection rates by trading partnerand by commodity.
721General Equilibrium Assessments of Trade Liberalization in APEC Countries

12. Other relevant work in this area includes Walmsley (1999), who modifies thestandard GTAP model and incorporates the existence of foreign ownership of capitaland land. She finds that the foreign ownership of assets has a significant effect on theresults of trade liberalization in the Asia-Pacific region.
13. This result crucially depends upon the assumption that labor is homogeneous andperfectly mobile across sectors. Had we disaggregated labor by type and skill, labormobility would have been limited and many of the manufacturing sectors might nothave contracted.
14. Francois et al. (1997) show that the welfare gains resulting from the UruguayRound agreement under increasing returns to scale and monopolistic competition couldbe almost three times as large as those when constant returns and perfection competitionare assumed.
ACKNOWLEDGMENTS
We thank Narongchai Akrasanee, Shujiro Urata, and other participants of theInternational Conference on “A Macroeconomic Core of an Open Economy forProgressive Industrialization and Development in Asia in the New Millen-nium,” held in Bangkok, 16–18 December 1998, for their helpful comments.
REFERENCES
Asia-Pacific Economic Cooperation (APEC) (1997). The Impact of Trade Liberalization in APEC.Singapore: APEC Secretariat.
Asia-Pacific Economic Cooperation (APEC) and Pacific Economic Cooperation Council (PECC)(1995). Surveys of Impediments to Trade and Investment in the APEC Region. Singapore:PECC for APEC Secretariat.
Brown, D. K., Deardorff, A. V., & Stern, R. M. (1996). Computational Analysis of the EconomicEffects of an East Asian Preferential Trading Bloc. Journal of the Japanese andInternational Economies, 10, 37–70.
Francois, J. F., McDonald, B., & Nordström, H. (1996). The Uruguay Round: A NumericallyBased Qualitative Assessment. In: W. Martin & L. A. Winters (Eds), The Uruguay Roundand the Developing Countries. Cambridge: Cambridge University Press.
Francois, J. F., McDonald, B., & Nordström, H. (1997). The Uruguay Round: A Global GeneralEquilibrium Assessment. In: D. Robertson (Ed.), East Asian Trade After the UruguayRound. Cambridge: Cambridge University Press.
Gehlhar, M., Gray, D., Hertel, T. W., Huff, K. M., Ianchovichina, E., McDonald, B. J., McDougall,R., Tsigas, R. E., & Wigle, R. (1997). Overview of the GTAP Data Base. In: T. W. Hertel(Ed.), Global Trade Analysis: Modeling and Applications. New York: CambridgeUniversity Press.
Goldin, I., Knudsen, O., & van der Mensbrugghe, D. (1993). Trade Liberalization: GlobalEconomic Implications. Paris and Washington, D.C.: OECD and World Bank.
Harrison, G. W., Rutherford, T. F., & Tarr, D. G. (1996). Quantifying the Uruguay Round. In:W. Martin & L. A. Winters (Eds), The Uruguay Round and the Developing Countries.Cambridge: Cambridge University Press.
722 HIRO LEE ET AL.

Hertel, T. W. (Ed.) (1997). Global Trade Analysis: Modeling and Applications. New York:Cambridge University Press.
Hertel, T. W., Martin, W., Yanagishima, K., & Dimaranan, B. (1996). Liberalizing ManufacturesTrade in a Changing World Economy. In: W. Martin & L. A. Winters (Eds), The UruguayRound and the Developing Countries. Cambridge: Cambridge University Press.
Lee, H., & Roland-Holst, D. (1998). Cooperative Approaches to Shifting Comparative Advantage:The Case of Bilateral Trade between the United States and Japan. In: H. Lee & D. W.Roland-Holst (Eds), Economic Development and Cooperation in the Pacific Basin: Trade,Investment, and Environmental Issues. New York: Cambridge University Press.
Lee, H., Roland-Holst, D., & van der Mensbrugghe, D. (1999). The Long-Run Impact of APECTrade Liberalization on Structural Adjustment and Economic Growth. In: M. E. Kreinin,S. Abe & M. G. Plummer (Eds), International Links and Policy Formation: Where Do WeGo from Here? Amsterdam: Elsevier, forthcoming.
Lee, H., & Woodall, B. (1998). Political Feasibility and Empirical Assessments of a Pacific FreeTrade Area. In: H. Lee & D. Roland-Holst (Eds), Economic Development and Cooperationin the Pacific Basin: Trade, Investment, and Environmental Issues. New York: CambridgeUniversity Press.
Lewis, J. D., Robinson, S., & Wang, Z. (1995). Beyond the Uruguay Round: The Implications ofan Asian Free Trade Area. China Economic Review, 6, 35–90.
Lloyd, P. J. (1996). Regional Trading Arrangements and Regional Integration. Asian EconomicJournal, 10, 1–28.
McDougall, R., Elbehri, A., & Truong, T. P. (Eds) (1998). Global Trade, Assistance, andProtection: The GTAP 4 Data Base, West Lafayette: Center for Global Trade Analysis.Purdue University.
McKibbin, W. J. (1998). Regional and Multilateral Trade Liberalisation: The Effects on Trade,Investment and Welfare. In: P. Drysdale & D. Vines (Eds), Europe, East Asia and APEC:A Shared Global Agenda? Cambridge: Cambridge University Press.
OECD (1997). The Linkage Model, mimeo. OECD Development Center, Paris.Oxley, A. (1996). Political Hurdles to the Realisation of the Bogor Declaration: The Need to
Revisit ‘Open Regionalism’. Paper presented at the Conference on InternationalConsortium of APEC Study Centers, Manila, May 9–10.
Panagariya, A. (1998). Should East Asia Go Regional? In: H. Lee & D. W. Roland-Holst (Eds),Economic Development and Cooperation in the Pacific Basin: Trade, Investment, andEnvironmental Issues. New York: Cambridge University Press.
Petri, P. A. (1997). Foreign Direct Investment in a Computable General Equilibrium Framework.Paper presented at the Brandeis-Keio Conference on “Making APEC Work: EconomicChallenges and Policy Alternatives”. Keio University, Tokyo, March 13–14.
Tan, K. Y. (1998). Regionalism in the Pacific Basin: Strategic Interest of ASEAN in APEC. In: H.Lee & D. W. Roland-Holst (Eds), Economic Development and Cooperation in the PacificBasin: Trade, Investment, and Environmental Issues. New York: Cambridge UniversityPress.
Walmsley, T. L. (1999). Incorporating International Capital Ownership into the GTAP Model:Results for Asia-Pacific Trade Liberalisation. Preliminary Working Paper No. IP-72, Centreof Policy Studies and the Impact Project, Monash University.
Yamazawa, I. (1996). APEC’s New Development and Its Implications for Nonmember DevelopingCountries. Developing Economies, 34, 113–137.
723General Equilibrium Assessments of Trade Liberalization in APEC Countries

Yamazawa, I. (1997). APEC’s Progress toward the Bogor Target: A Quantitative Assessment ofIndividual Action Plans Report, Japan National Committee for Pacific EconomicCooperation and APEC Study Center, Hitotsubashi University, September.
Yang, Y., Duncan, R., & Lawson, T. (1998). Trade Liberalisation in the European Union andAPEC: What If the Approaches Were Exchanged? In: P. Drysdale & D. Vines (Eds),Europe, East Asia and APEC: A Shared Global Agenda? Cambridge: CambridgeUniversity Press.
Yang, Y., Martin, W., & Yanagishima, K. (1997). Evaluating the Benefits of Abolishing the MFAin the Uruguay Round Package. In: T. W. Hertel (Ed.), Global Trade Analysis: Modelingand Applications. New York: Cambridge University Press.
Young, L. M., & Chye, K. M. (1997). Free Trade in the Pacific Rim: On What Basis? In: T. W.Hertel (Ed.), Global Trade Analysis: Modeling and Applications. New York: CambridgeUniversity Press.
724 HIRO LEE ET AL.