financial liberalization in uruguay: success or failure?
78
DRAFT FOR STAFF USE ONLY FINANCIAL LIBERALIZATION IN URUGUAY: SUCCESS OR FAILURE? Felipe Larrai'n B. (Consultant) CPO Discussion Paper No. 1987-1 February 1987 CPD Discussion Papers report on work in progress and are circulated for Bank staff use to stimulate discussion and comment. The views and interpretations are those of the authors. Public Disclosure Authorized Public Disclosure Authorized Public Disclosure Authorized Public Disclosure Authorized
-
Upload
khangminh22 -
Category
Documents
-
view
3 -
download
0
Transcript of financial liberalization in uruguay: success or failure?

DRAFTFOR STAFF USE ONLY
FINANCIAL LIBERALIZATION IN URUGUAY: SUCCESS OR FAILURE?
Felipe Larrai'n B. (Consultant)
CPO Discussion Paper No. 1987-1
February 1987
CPD Discussion Papers report on work in progress and are circulated forBank staff use to stimulate discussion and comment. The views andinterpretations are those of the authors.
Pub
lic D
iscl
osur
e A
utho
rized
Pub
lic D
iscl
osur
e A
utho
rized
Pub
lic D
iscl
osur
e A
utho
rized
Pub
lic D
iscl
osur
e A
utho
rized

FINANCIAL LIBERALIZATION IN URUGUAY: SUCCESS OR FAILURE?
Felipe Larrain B.* (Consultant)
*Pontificia Universidad CAtolica de Chile. I have benefited fromenlightening discussions with Edgardo Barandiaran. I would also like tothank Domingo Cavallo, Ricardo L6pez-Murphy, Carlos A. Rodriguez and otherparticipants of the First Annual Economic Meetings organized by the CentralBank of Uruguay for their comments.

Abstract
The recent developments of Argentina, Uruguay and Chile
during the seventies, all of which pursued a liberalization of
their markets, ended up in deep crashes during the early eighties.
Mostly based on these experiences, Diaz-Alejandro has challenged
the supposed benefits of full-range financial deregulation, arguing
for caution in the liberalization process, with the government
playing an important role, especially as regulatory agent.
This paper attempts to draw some lessons out of the
Uruguayan experience, which started with a broad range of reforms
in 1974. After discussing the relevant developments of the economy
before 1974 and the different policy periods in which the Uruguayan
reforms could be divided, the analysis centers on the liberalization
of financial markets, both with respect to international transactions
and domestically. As a result of the reforms, financial deepening
did occur at the macro level, even if it was geared from the outset
towards foreign assets. However, the deregulatedfinancial markets
failed to create long-term credit, and no development of new ways of
financing for domestic firms occurred. On the other hand, no improve-
ment appeared on the savings and investment performance of the
private sector, which seemed to have been more influenced by issues
other than financial liberalization. Overall, perhaps the clearest
message of the Uruguayan experience'is that the deregulation of
financial markets cannot produce its intended benefits unless coupled
with a coherent set of macro policies. Particular attention has to
be put on avoiding an overvalued currency, especially when capital flows
are unrestricted.
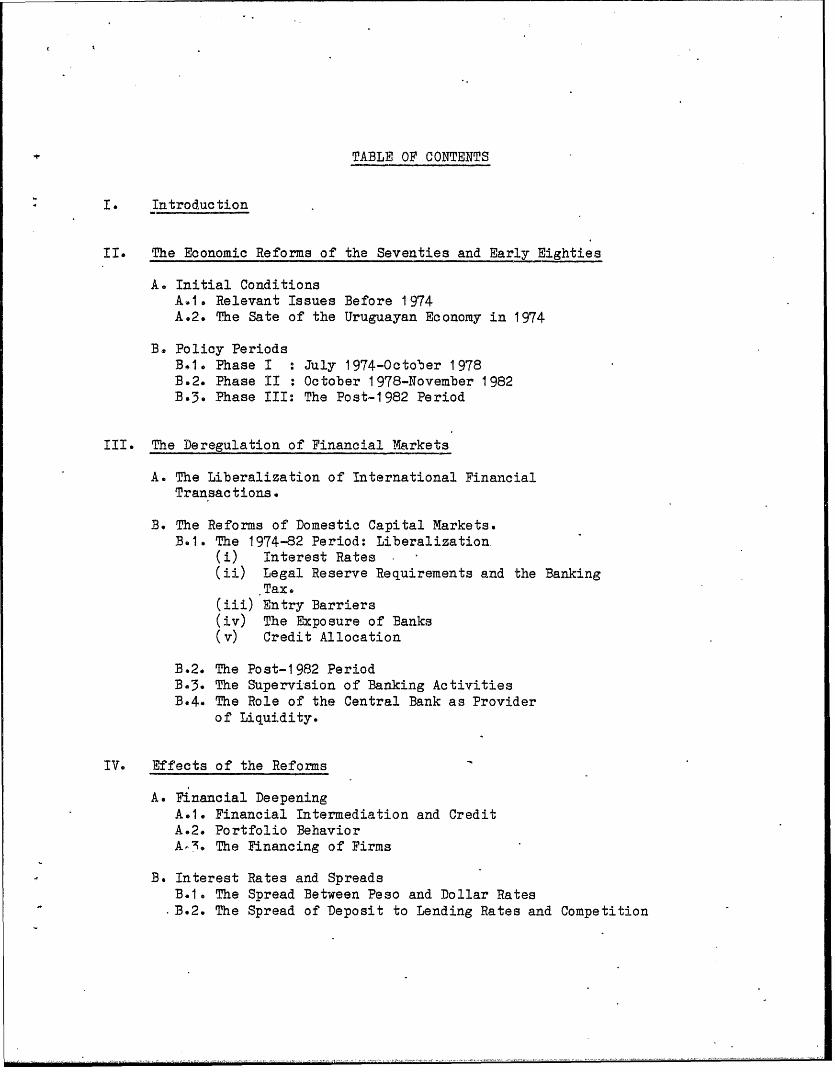
TABLE OF CONTENTS
I. Introduction
II. The Economic Reforms of the Seventies and Early Eighties
A. Initial ConditionsA.1. Relevant Issues Before 1974A.2. The Sate of the Uruguayan Economy in 1974
B. Policy PeriodsB.1. Phase I : July 1974-October 1978B.2. Phase II : October 1978-November 1982B.3. Phase III: The Post-1982 Period
III. The Deregulation of Financial Markets
A. The Liberalization of International FinancialTransactions.
B. The Reforms of Domestic Capital Markets.B.1. The 1974-82 Period: Liberalization.
(i) Interest Rates(ii) Legal Reserve Requirements and the Banking
Tax.(iii) Entry Barriers(iv) The Exposure of Banks(v) Credit Allocation
B.2. The Post-1982 PeriodB.3. The Supervision of Banking ActivitiesB*4. The Role of the Central Bank as Provider
of Liquidity.
IV. Effects of the Reforms
A. Financial DeepeningA.1. Financial Intermediation and CreditA.2. Portfolio BehaviorA-". The Financing of Firms
B. Interest Rates and SpreadsB.1. The Spread Between Peso and Dollar Rates
.B.2. The Spread of Deposit to Lending Rates and Competition

in the Financial Industry
C. Savings
D. InvestmentD.1. Investment RatesD.2. The 1'"ficiency of Investment
E. The Effectiveness of Monetary Policy
V. Conclusions
References
Statistical Appendix

I. INTRODUCTION
The economic history of most Latin American countries has been pla-
gued with examples of excessively regulated financial markets, where ceilings on
interest rates, high legal reserve requirements and forced loans from commercial
banks to the government are only part of a wide range of financial restrictions
imposed by the economic authority. These type of situations are known among
economists as financial repression, after the well-known studies of McKinnon
(1973, 1979).
In a financially repressed environment real interest rates (both de-
posit and lending rates) are usually negative. Agents respond, according to
this view, by decreasing their savings and channeling their funds out of the
established financial system. Since the volume of intermediation is small and
real interst rates,low, credit has to be rationed by mechanisms other than pri-
ce. This situation is clearly inefficient, since the agents who obtain the
scarce funds are generally not those with better projects, but rather the most
influential and well connected. Under these conditions the outcome is not only
inefficient from a resource allocation viewpoint, but also inequitable, and
usually gives rise to corruption. Thus, in a financially repressed economy sa-
vings are low because their return is not attractive and investment is also low
because of credit rationing. Many agents act both as savers and investors, and
therefore loose one of the important benefits of the financial system, which is
to separate management from ownership and in this way allow a low-cost portfolio
diversification (Barandiaran (1985)).

2
The liberalization of Oapital markets would then give way to the pro-
cess known as financial deepening (Shaw (1973)), since interest rates would rise
and financial intermediation would increase, expanding credit availability to
the private sector and making possible a surge in investment. At the same time,
the productivity of investment would increase, since credit rationing will be
done through price (interest rates). As a by-product, the growth performance of
the economy is bound to improve.
The recent developments of Argentina, Uruguay and Chile during the
seventies, all of which pursued a liberalization of their financial markets, en-
ded in financial crashes during the early eighties. Mostly based on these expe-
riences, Diaz-Alejandro (1985) has challenged the supp6sed benefits of
full-range financial liberalization in a work suggestively titled "Goodbye fi-
nancial repression, hello financial crash". His ideas are far from defending
the goodness of a financially repressed environment, but rather argue in favor
of some liberalization with government intervention in the fiiancial markets,
especially as regulatory agent.
In studying the specific case of Uruguay, this paper attempts to draw
some lessons out of this experience, which started with a broad range of reforms
in 1974. Section II discusses the relevant developnents of the economy before
1974, especially with respect to financial markets, and describes the different
policy periods in which the Uruguayan reforms could be divided. The next sec-
cion Ptscusses the liberalization of financial markets, both with respect to in-

ternational transactions and domestically. Section IV analyzes the main effects
of the reforms while section V states the conclusions.

4
II. THE ECONOMIC REFORMS OF THE SEVENTIES AND EARLY EIGHTIES
A. Initial Conditions
A.1. Relevant Issues Before 1974
As many other countries in Latin America after the Great Depression,
Uruguay pursued its development along the lines of an import substitution stra-
tegy and increasing government intervention in the economy. The outcome of this
policy was far from successful, since per-capita output grew at an average an-
nual rate of 0.7% from the end of World War II to 1973 and exports stagnated.
Thus, Uruguay lost the opportunity to take advantage of two decades of steady
growth and stability in the world economy -the fifties and the sixties- by con-
fining itself within its borders. As Ramos (1984) puts it, "...the lack of dy-
namism of production and exports was the result of government action
exaggerately concentrated on redistributive aspects as opposed to productive ac-
tivities, and using preferentially administrative controls in substitution of
the marke".
The financial markets were no exception to the overall pattern of the
economy. Interest rate ceilings were established on savings deposits as early
as in the thirties -and a mounting path of regulations prevailed during the next
four decades. The banking system was organized around the state-owned Banco de
1Ramos (1984), p.25.

5
la Reprublica Oriental del Uruguay (BROU), established in 1896, which operated
both as the most important lending institution and as the monetary autority Un-
til 1966. The Cental Bank of Uruguay (CBU) was created in t966 and took charge
of the issue of currency, the managing of international reserves and the super-
vision and control of the banking system.
Excessive use of rediscount operations during the fifties provoked a
surge in inflation, which given the existing interest rate ceilings rendered
both deposit and lending rates negative in real terms and gave a powerful incen-
tive to capital flight. At the beginning of the sixties the persistence of con-
trols on interest rates prompted banks to a mounting non-price competition for
funds increasing their number of branches and, in general, improving the quality
of their service, which led to steep rises in their operating costs2 . The go-
vernment reacted with further regulations (imposition of quotas on credit and
deposits, higher reserve requirements, stricter rediscounting policies, etc.) in
an attempt to stop the growh of domestic credit. But capital flight accelerated
and the position of Uruguayan banks turned increasingly weaker. In 1965 this
situation reached its lowest point and a generalized crisis of the banking sys-
tem developed, prompting bankruptcies and mergers of financial institutions.
The reaction of the authorities followed the lines of increasing re-
gulations, since they believed the encessive expansion of banks to be the cause
2 See Daly (1969).

6
of the crisis. This pattera of response of governments to financial- problems is
widely extended not only in developing countries, as the post-depression U.S.
experience acknowledges 3 . However, it seems clear that the roots of-the Uru-
guayan crisis of 1965 were to be found in the excessive regulatory framework,
especially with respect to Interest rates, which prompted banks into non-price
competition and cost escalation, and which geared private agents to transfer
their funds abroad.
The measures taken by the Uruguayan authorities in 1965 included an
absolute barrier to the entry of new firms to the banking system, larger subsi-
dies to surviving banks and a limitation of the credit available for the priva-
te sector. That these policies were not successful in coping with financial
problems became clear in the new banking crisis which developed in 1971, when a
substantial increase in real interest rates deteriorated to such extent the as-
sets of the banking system that new bankruptcies and mergers occurred among fi-
nancial institutions.
3See for example Friedman (1969).
7
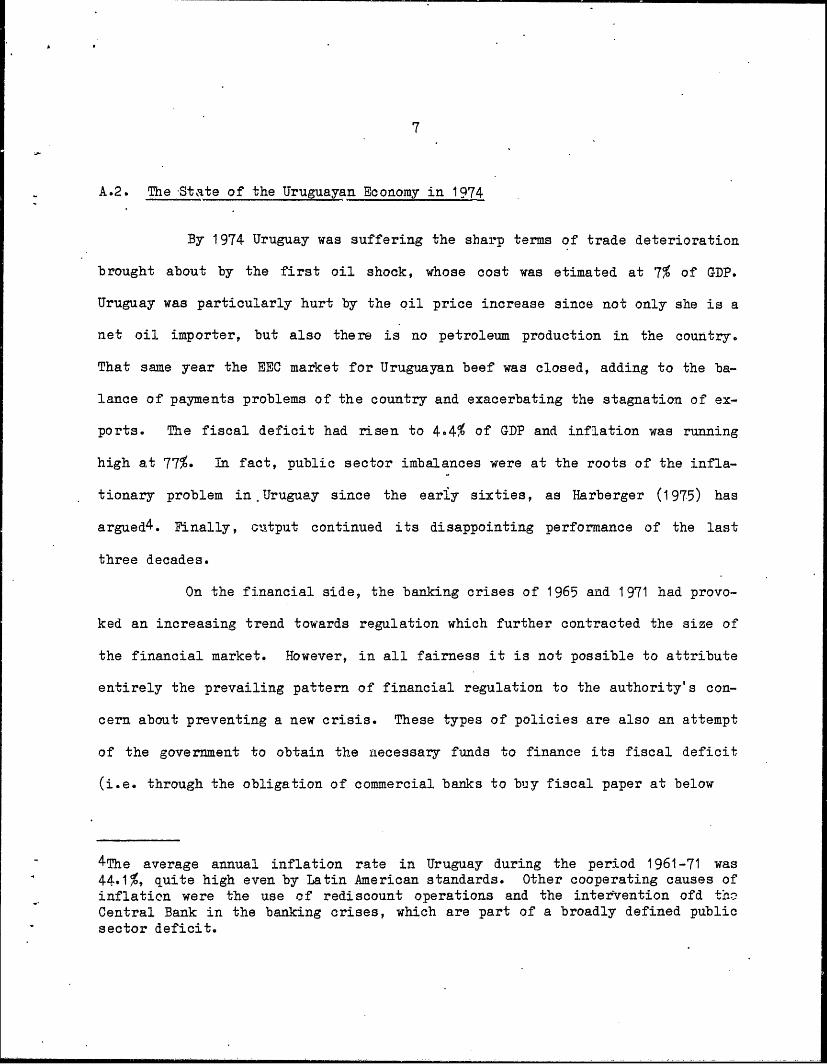
A.2. The -State of the Uruguayan Economy in 1974
By 1974 Uruguay was suffering the sharp terms of trade deterioration
brought about by the first oil shock, whose cost was etimated at 7% of GDP.
Uruguay was particularly hurt by the oil price increase since not only she is a
net oil importer, but also there is no petroleum production in the country.
That same year the EEC market for Uruguayan beef was closed, adding to the ba-
lance of payments problems of the country and exacerbating the stagnation of ex-
ports. The fiscal deficit had risen to 4.4% of GDP and inflation was running
high at 77%. In fact, public sector imbalances were at the roots of the infla-
tionary problem in.Uruguay since the early sixties, as Harberger (1975) has
argued4 . Finally, output continued its disappointing performance of the last
three decades.
On the financial side, the banking crises of 1965 and 1971 had provo-
ked an increasing trend towards regulation which further contracted the size of
the financial market. However, in all fairness it is not possible to attribute
entirely the prevailing pattern of financial regulation to the authority's con-
cern about preventing a new crisis. These types of policies are also an attempt
of the government to obtain the necessary funds to finance its fiscal deficit
(i.e. through the obligation of commercial banks to buy fiscal paper at below
4 The average annual inflation rate in Uruguay during the period 1961-71 was44.1%, quite high even by Latin American standards. Other cooperating causes ofinflation were the use of rediscount operations and the intetrvention ofd theCentral Bank in the banking crises, which are part of a broadly defined publicsector deficit.

8
market rates, as occurred in Uruguay) and, to some extent, a way to control the
allocation of funds in the economy (i.e. through preferential credit conditions
to certain sectors).
After 1965, as finance companies (financieras) were illegal, and the
formal financial system was shrinking, an informal lending markot (parabaneario)
started to gain ground. -The latter one operated through public notaries who
certified the transaction between borrower and lender. The financial instru-
ments used were promisory notes of up to three years to maturity, which carried
an annual interest rate of 40% to 60% in the late sixties. The growth in the
parabaneario market was substantial and by 1970 it was estimated that loans ca-
rried out through it were a third of bank deposits. However, the informal mar-
ket shrank tremendously after the exchange crisis of 1970 which provoked
substantial capital flight from Uruguay. Further, the government attempted in
late 1970 to protect commercial banks from the competition of the .informal sec-
tor through two main measures: (i) a prohibition of loans over US$400 5 through
the parabancario system, unless for a period of over three years, and (ii) the
establishment of facilities at Banco Hipotecario to substitute the role of pu-
blic notaries in the informal market; the Bank registered each operation for a
2% fee.
At the , ae of the reforms the role of the banking system as interme-
5100.000 Uruguayan pesos of late 1970.

9
diator of funds was reduced to a critically low level, at approximately 35% of
the real value of loans and deposits that it had in the early fifties.
B. Policy Periods
The Uruguayan reforms of the mid-seventies were more profound and
broader in the financial market as compared to other sectors of the economy.
Even if deregulation occurred too in commodity markets (both internally and in
the trade account) and reforms were also implemented in the fiscal sector, these
were narrower in scope and happened at a much slower pace. Thus, the Uruguayan
experience stands as qualitatively different. from the Chilean one, which pursued
a more comprehensive liberalization-cum-stabilization package and which was less
liberal at the beginning with respect to international financial transactions.
The reforms can be divided chronologically into three clearly defined
policy periods, according to which seemed to be the major concerns of the autho-
rities at each stage.
B.1. Phase I: July 1974-October 1978
The main problem that Uruguay faced in 1974 was the external sector.
Even if the trade account (and generally the current account), had been in sur-
plus during most of the period 1965-73, the capital account normally presented
deficits; this latter phenomenum was principally caused by the outflow of priva-
te capital. The tendency to overvaluation in the domestic currency, the lack of

10
attractive financial instruments in the Uruguayan market6 and the existence of
political turmoil and terrorism7 , combined to provide a powerful incentive for
capital flight. When in 1974 the effects of the quadrupling'of oil pric-es began
to be felt in the economy and the EEC market for Uruguayan beef (its main export
at the time) became closed, a strong deterioration in the trade balance was ad-
ded to the already 'existing problems in the capital account. In July of 1974
Alejandro Vegh Villegas was appointed Finance Minister with the primary task of
putting together a set of policy measures directed to reestablish the equili-
brium in the external sector and to stabilize the economy.
In order to improve the trade balance, the real exchange rate was
driven up by over 25% during 1974-76 and it was approximately maintained at
that level until October of 1978, by means of a passive crawling peg. Special
incentives were provided for exports in July of 1974, when they were liberated
of taxes for up to 50% of profits reinvested and the export taxes on beef and
wool were eliminated. Further, exporters had access to subsidized credit lines
which by mid-1977 carried an annual interest rate of -30% in real terms. All
this helped to provoke an impressive improvement of almost 80% in the value of
6Due to the presence of ceilings on interest rates coupled with high (andrising) inflation, which did not allow the development of readjustable instru-ments.
7The Tupamaros'guerrilla group was very active in the early seventies.
BRamos (1984).

. 11
exports from 1975 to 1978. Financial liberalization measures, discussed in de-
tail in the next chapter, were partially aimed at reverting the outflow of funds
and thus to improve the capital account.
In a parallel development, the broad range of price controls in the
economy started to be slowly removed. Lt the beginning of 1974, 94% of the
goods in the popular consumption basket had their prices fixed through COPRIN, a
governmental agency responsible for price control which had to study and approve
at the industry level any rise in prices. Although a trend towards liberalize-
tion started in mid-1974, the process was not fast 9 . Between July and December
.of 1975, 13% of goods in the CPI were deregulated. In February of 1976 all pri-
ces of goods considered to be competitively produced and not ixi the CPI were
freed; the meat market was decontrolled in August of 1978. However, by the end
of 1978 approximately 40% of products in the popular consumption basket were
still under price control.
A partial liberalization of the trade account took place from
mid-1974 to the beginning of 1975, as all quantitative restrictions on imports
were removed. In particular, the previous permission for the import of capital
goods was eliminated early in July of 1974. Nonetheless, the important set of
tariff barriers remained untouched during this phase.
91n comparison, the deregulation of goods prices in Chile was much faster, asthe bulk of it was done in late 1973.

12
In the inflation front the progress. was slow; by 1977 inflation was
still running high at 57%, even if the internal causes of price increases seemed
under control: the fiscal deficit was reduced from 4.4% of GDP in 1974 to 1.2%
in 197710. Nonetheless, the inflc0 of external resources to Uruguay during
this period made foreign exchange operations accountable foi a fast increase in
the money supply. This effect was closely linked with one of the most important
developments in financial markets during the period: starting in September of
1974, Uruguayans were first allowed to hold dollar accounts in the domestic ban-
king system, and capital flows became virtually unrestricted. Since this same
date the country started operating under a dual exUhange rate regime: a freely
floating rate for capital transactions and the crawlin7g-peg for goods transac-
tions. The two rates were unified to the passive crawl in November of 1977.
Towards the end of -this phase, the concern of the authorities shifted
markedly from the external sector -whose accounts were close to balance- to the-
inflation rate. In 1978, the Central Bank attempted an open market operation to
control the money supply growth, but capital flowed into the country so as to
offset it. At this point the government came to realize that inflation was not
going to be controlled with the traditional'means of monetary and fiscal res-
traint. Uruguay seemed to be operating under a Mundellian framework due to the
high degree of financial openness, where private capital flows could very
10No major fiscal reforms occurred during this phase. However, it could be men-
tioned that the personal income and inheritance taxes were eliminated in July of
1974, while the corporate income tax was left in place.

13
quickly act so as to offset monetary policy. Indeed, empirical evidence for
this period has shown that out of a given increase in domestic credit, 75% of it
was transmitted into a loss of foreign reserves in the next-two quarters. uWhen
this situation became clear to the Uruguayan authorities, they decided to change
the strategy to attack the inflation problem, their main concern by 1978.
B.2. Phase II: October 1978 - November 1982
Even if this period of time has been grouped under a common phase
from the point of view of the economic policies pursued, two important sub-
phases can be distinguished from a performance perspective. On the first, which
goes until the beginning of 1981, Uruguay experienced an unprecedented boom,
with GDP growth rates over 6%; however, since the second quarter of 1981 a
strong recession started to develop, as negative external shocks were combined
with policy mismanagements.
In October of 1978 the exchange rate regime was modified, from a pas-
sive crawl aimed at maintaining the real exchange rate, to an active crawl ("la
tablita") focused on bringing down inflation. Thus, on the next three months
after the new regime was established, the exchange rate went up at a 29.9% an-
nualized rate, while inflation was 59.8% over the same basis. This type of po-
licy shift is a common feature of the three Shouthern Cone experiences
(Argentina, Chile and Uruguay) of the seventies. Simultaneously, the Central
Baik of Uruguay abandoned open market operations and frozed domestic credit;

14
thus, changes of the domestic money supply could only come from foreign exchange
operations.
Important reforms during this phase also occurred in two other sec-
tors. On the trade front, the high and variable import duties were set to
change; a program of tariff reductions to take place in six stages was announced
in late 1978. This was aimed at a flat final tariff of 35% across the board
which was never reached, as the program was suspended due to the economic cri-
sis in late 1982. On the fiscal side, a tax reform went into effect in Novem-
ber of 1979, which included: a decrease of social security taxes, the abolition
of the profits-tax exemption and of subsidized credit for exports, the elimina-
tion of the 8.4% banking tax, and the establishment of a uniform 18% V.A.T. for
goods considered nonessential.
Nonetheless, the major concern of the authorities during this phase
and thus the focus of the stabilization policy was to bring down inflation.
Since the external problem was considered under control, the exchange rate
started to be used against inflationary expectations. The "tablita" established
a program of preannounced devaluations 6 months in advance; the rate of devalua-
tion was set lower than the inflation rate, expecting that both would soon con-
verge to a level consistent with international inflation. This was supposed
to have a positive effect on interest rates, by taking part of the inflation
1 1The "tablita" established a devaluation of the peso of 23% over the next 12months starting in October 1978; inflation over the previous 12 months had been
41%.

15
premium out of them.
However, inflation proved more stubborn than expected, and failed to
converge quickly to the desired levels1 2. This can be mainly attributed to de-
mand pressures coming from two different sources: on the one hand., the increa-
sing overvaluation of the Argentinian currency during 1979 and 1980 channeled
into stronger demand in the Uruguayan goods market (both through the trade ac-
count and through tourism), and on the other, the increase in the value of as-
sets created an atmosphere of prosperity which also pressed on the goods
markets. On the supply side, Hanson and De Melo (1983) have argued that the
lack of distribution channels for imports made possible substantial increases in
the prices of tradeables, well beyond purchasing power parity levels.
Nonetheless, while the Uruguayan peso was depreciating with respect
to its Argentinian counterpart in 1979-80, this happened only because the latter
country's currency was becoming even more overvalued than the Uruguayan peso
vis-a-vis the rest of the world. Thus, the current account benefited enormously
from the neighbor's circumstances. Moreover, exports to Argentina were sold ta-
king advantage of a special treaty which exempted them from duties, but they we-
re not competitive in other markets 1 3 . Not surprisingly, as soon as Argentina
1 2 1nflation was 73% over the 12 months after the establishment of the tablita,while the exchange rate went up by only 23% during the same period.
1 3Hinds (1985).
16
started devaluing her money with respect to the Uruguayan peso, the "hidden"
overvaluation of this latter currency began to be felt. During the period that
goes from March of 1981 to November of 1982, confidence in the sustainability of
the exchange rate policy quickly eroded, as exports of goods and services dete-
riorated following the reduction of Argentinian demand. The general feeling
that the Uruguayan currency was becoming increasingly overvalued was not reflec-
ted in an adjustment of the exchange rate. The openness of financial tarkets
allowed capital to start moving out of Uruguay at a fast pace; it is estimated
that between January and November of 1982 capital flight was close to US$ 2 bi-
llion.
The situation became unsustainable and in November of 1982 the ex-
change rate was liberalized, ending the active crawl regime. By 1982, inflation
was finally brought down to 20%, but at the cost of a strong recession. The
Uruguayan economy under the "tablita" policy became extremely sensible to the
depreciation of the Argentinian currency and to the decrease of capital inflows
which occurred after strong doubts about the performance of the ongoing policy
arised. In 1981 the private sector's ability to obtain funds abroad decreased
substantially, but the public sector compensated it by increasing its foreign
indebtedness. This strategy proved unsustainable in 1982, and external finan-
cing dried up. Many analysts believe this to be the detonator of the collapse.

17
B.3. Phase III: The Post-1982 period
The flotation of the Uruguayan currency in.November of 1982 prompted
an initial "overshooting" of the exchange rate, which increased more than 100%
on impact; a month later it stabilized at one-half over its pre-flotation value.
This provoked a proportionate increase in dollar liabilities which further wor-
sened the position of debtors, already deteriorated by the ongoing depression..
Consequently, the assets of the banking system strongly worsened with the lower
recuperability of credits. At least in an ex-pott sense, banks deserve part of
the blame in this development since many loans were given accepting as collate-
ral grossly overvalued assets. When the bubbles in. agricultural land and real
estate finally burst 1 4 , the value of the banks' loan portfolio sharply decli-
ned.
The economic authorities attempted to manage the crisis through a se-
ries of measures taken by the Central Bank of Uruguay (CBU). When a group*of
banks became close to bankruptcy in 1981-82, CBU felt compelled to intervene in
order to avoid a major financial crisis that -- among other things-- would have
prompted substantial capital outflows 1 5 . The specific policy actions taken
included:
140ne hectare of agricultural land was worth US$900 in 1979; two years laterthe same hectare-could be bought for just US$200.
15Substantial capital flight occurred in spite of the authorities' intervention(and probably was exacerbated by it), especially in the years 198Z and 1983.

18
(i) OBU purchased over US$ 400 millions1 6 of bad loans of the six
banks considered to be in the worst situation. Five of these were sold to fo-
reign banks and the other was liquidated.
(ii) As the position of financial companies continued to worsen, CBU
decided to purchase further assets of dubious recuperability from commercial
banks. In order to be eligible for this transaction, banks had to obtain fo-
reign loans from their parent companies to CBU. The value of the purchases
which went from october of 1982 to february of 1984, amounted to over US$ 200
millions. In the process, the Uruguayan public sector acquired new loans by US$
540 millions.
(iii) Commercial banks were led to reschedule their credits for a
seven-year period. In the first two years debtors were supposed to pay only 60%
of the interests; the remaining 40% was given to the banks by CBU, while debtors
capitalized this amount.
The financial crisis and the ongoing depression (which decreased the
real value of tax collections) pushed up the fiscal deficit which rose from 0.1%
of GDP in 1980 to almost9% of GDP in 198217; other cooperating causes were a
1 6According to CBU, the recuperability of these assets was close to US$130 mi-
llions.
170ther side of the increase in the overall public sector deficit was the Cen-
tral Bank's purchase of bad loans financed with foreign borrowin6. As loans we-
re not recovered at the same rate than the service of the higher foreign debt,
the overall public sector budget became increasingly unbalanced.

19
large increase in the deficit of the social security system!8 and a surge in
the burden of servicing the public foreign debt. Not surprisingly, both infla-
tion and unemployment went up. In an effort to control the fiscal imbalance,
most export subsidies and special treatments were abandoned in late 1982; these
measures helped to bring back the deficit to the 4-5% range in the next two
years.
Quite paradoxically, the liberalization cum stabilization experience
ended up leaving Uruguay in a worse position than when it started in 1974. High
levels of inflation, unemployment and of the fiscal deficit were back but this
time -unlike in 1974- the country was.left carrying the burdens of a huge exter-
nal debt and of a virtually collapsed financial system. This was the situation
encountered by the new civilian government which came to power in early 1985.
Nonetheless, it is unfair to blame just the liberalization attempts for these
results; the deterioration in some key external variables and the policy mista-
kes of the stabilization strategy are at least as important in the explanation,
as analyzed below.
1 8increased deficit in the social security system initially occurred because ofthe late-1979 tax reform, which reduced social security taxes.

20
III. THE DEREWULATION OF FINANCIAL MARKETS
It is reasonable to conclude that the main reason pushing towards the
liberalization of financial markets was a reaction to the unsuccessful economic
performance of the last three decades in an environment strongly regulated by
the state. The excessive regulation was perceived as a crucial deterrent of
economic development. In the Uruguayan case, the post-1974 financial liberali-
zation experience was the most important element of the liberalization and sta-
bilization effort.
The financial reform can be conceptually divided in two: the deregu-
lation of domestic capital markets, and the liberalization of financial transac-
tions between the country and the rest of the world. It has generally been
argued that the former has to.precede the latter; in other words, a country must
open its capital account only after domestir markets have been liberalized. This
was not the case in Uruguay, where considerable regulation remained internally
well after capital flows moved freely through Uruguayan borders. It is impor-
tant to emphasize that, except in the most extreme liberal view, financial libe-
ralization is not conceived as an attempt to eliminate all regulations from
capital markets.
A. The Liberalization of International Financial Transactions
In 0-ptember of 1974, domestic residents became allowed to hold do-
llar. accounts in the local banking system and exchange controls were elimina-

2i
ted, rendering the peso a fully convertible crrency. Moreover, Uruguayans were
also free to hold any type of assets abroad (Wall Street stocks, U.S. Treasury
Bonds, real estate in Miami, etc.) whose earnings did not have to be reported
due to the abolition of the personal income tax. Shortly after, foreign inves-
tors became allowed to freely repatriate their profits and capital.
Deregulation of international transactions went all the way through
at a very early stage. Private non-financial firms had no restrictions attached
to foreign borrowing, even if *it is clear that only a small group of big compa-
nies could have direct access *o external funds. To complete this picture,
commercial banks were free to borrow any amount they could, either short or long
term, from abroad. Quite astonishingly, the debt-to-equity limit of 16 to 1 for
banks was applied only to peso liabilities but not to foreign currency ones 1 9 .
A more liberal system could hardly be conceived. In fact, the only indirect
restriction attached to foreign barrowing was the existence of binding interest
ceilings for bank loans denominated in foreign currency; since banks faced an
upward sloping supply of external funds2 0 , the amount which they could profita-
bly borrow from external sources became limited in practice. This deregulation
is all the more remarkable since before September of 1974 it was illegal for
1 9This situation remained until June of 1979 when peso and dollar liabilitiesbecame analogously treated with respect to the debt-equity limit.
2 0The textbook case of small countries facing a given internatonal interest ratecan hardly be used in an analysis of financial markets.
22
Uruguayans to hold dollars21.
Tus, the capital account was liberalized at the beginning of the re-
form period, before any other major policy changes were attempted, even prior to
any deregulation effort in domestic capital markets2 2. The benefits that could
be expected from these measures are an increase in the availability of capital
(hopefully long-term capital) and a higher level of competition in the domestic
financial markets. However, those foreign resources which are attracted into
the country for short-Term speculation add an important element of instability
to the economy. J. Tobin (1978), looking at the perverse effects of a high va-
riability in capital flows on the real side of the economy, has suggested to
"throw some sand .in the wheels" of the extremely efficient capital markets.
In fact, the motivation of the economic authorities in liberalizing
the capital account can not be described as purely ideological2 3 . An important
objective of this measure was, doubtless, to finance with foreign funds the cu-
rrent account imbalance due to the oil shock and the negative developments in
the beef market. Bat since this strategy could only work in the short run, va-
2 1Stories are told about people sent to jail after being caught holding ahundred-dollar bill.
22This is an important difference with the cases of Argentina and especiallyChile, which were mo"- conservative towards the liberalization of the capitalaccount.
2 3ldeological in the sense of being part of a general economic strategy aimed atimproving the long run performance of the economy.

23
rious incentives were also provided for exports at the time, to improve the per-
formance of the current account in the medium to long run.
The issue of liberalization of the capital account. has also provoked
some discussion with respect to Its timing vis-a-vis the current account. What
should be liberalized first: goods or assets transactions with the rest of the
world? McKinnon (1982), Frenkel (1982) and Edwards (1984), among others, have
argued in favor of liberalizing the current account first. One of the main ar-
guments given to back this position is that goods markets adjust slower than as-
sets markets, and thus opening the capital account first will send conflicting
signals to the real side of the economy because these will later be reversed
when the current account is open. De Melo (1985) has argued differently, poin-
ting out that the concern about exporters being hurt by a real exchange rate ap-
preciation brought about by opening the capital account first were unfounded in
Uruguay because exporters were given compensating incentives, and there was con-
fidence in the passive crawl aimed at maintaining the real exchange rate.
With respect to the exchange rate policy for international transac-
tions, Uruguay adopted a dual pattern in September of 1974: a freely floating
rate for capital transactions and a passive crawl for goods. These dual rates
were unified in November of 1977. Later on, from February to September of 1981
the Central Bank sold exchange rate guarantees, in an attempt to shrink the
spread between peso and dollar lending rates.

24
B. The Reforms of Domestic Capital Markets
B.1. The 1974-82 period: liberalization
At the beginning of the reforms the Uruguayan financial system was
tightly regulated in many respects. The main reforms which occurred are des-
cribed below:
(i) Interest rates
Ceilings existed on peso lending rates, which in September of 1974
were set at 38% annual for rates payed in advance; this is equivalent to a 61.3%
rate at maturity. The restriction was binding as inflation ran substantially
above 61.3% at the time2 4 , resulting in negative real interest rates. Not sur-
prisingly, domestic currency denominated deposits remained stagnated. In April
of 1976 interest rate ceilings were marginally raised to 62% and became nonbin-
ding as market rates established below that level. However, inflation rose
again in 1977 and in order to avoid the recurrence of negative real rates the
authorities increased once more the ceiling to 90% in October of that year. The
restrictions did not apply to deposit rates during this period; otherwise
spreads would have been fixed.
With respect to dollar lending rates, a cliling of 12% annual existed
during most of the period which goes from the beginning of the liberalization
24Inflation was 107% in 1974, 67% in 1975 and 40% in 1976.

25
until October of 1977, when it was raised to 15%. The 12% limit was binding all
the way through, which becomes clear when we observe that market rates establis-
hed exactly at that level; after October of 1977 the restriction ceased to be
binding. In July of 1978 the limit was increased to 20%.
Ceilings on both peso and dollar lending rates were abolished in Sep-
tember of 1979.
(ii) Legal reserve requirements and the banking tax
Since the beginning of the reforms, reserve requirements were set lo-
wer for dollar deposits in comparison to their peso counterparts. In May of
1975, the Central Bank started paying interest on legal reserves; this was par-
ticularly attractive for dollar deposits, as the interest payed was above Euro-
dollar rates. However, fear for the inflationary pressures coming from the
expansion of foreign currency deposits and from external borrowing by commercial.
banks led the Central Bank to increase the required reserve ratio on dollar de-
posits in the second half of 1977. A year later, in October of 1978, legal re-
serve requirements were unified for peso and dollar deposits, setting both at
20%. However, in May of 1979 required reserves were eliminated. This evolution
reflects a somehow erratic behavior of the -monetary authority with respect to
legal reserves.
Another important part of borrowing costs -the 8.4% banking tax-
which was in place since the beginning of the reforms, was later abolished in
November of 1979. This tax consisted of a 6% levy on the borrower and a 2.4%

26
rate on the bank; its base was the total value of the credit (principal and
interest) and thus constituted a substantial cost on financial transactions 2 5.
It applied to both peso and dollar loans.
(iii) Entry barriers
As a reaction to the 1965 financial crisis, new legislation came into
effect which not only forbidded the entry of new competitors to the banking sys-
tem, but also banned the expansion of the total number branches existing at the
time. Thus, if a bank wanted to increase its branches this was only possible
through the contraction of a competitor.
Two basic types of institutions existed in this market: commercial
banks and banking houses. Prior to the end of 1977, the latter were neither
allowed to obtain deposits from domestic residents nor from nonresidents, and
thus they could not offer checking account services; their main activity was to
borrow abroad and lend those funds in the domestic. market. By the end of 1977
the Central Bank of Uruguay reinterpreted the law permitting banking houses to
obtain deposits from nonresidents.
Nonetheless, the entry of new banks to the market and the creation
of new branches remained forbidden until 1982, when new legislation allowed the
formation of new banks with a limit of 10% of the existing ones per year. At
the same time, the expansion of bank branches .was permitted.
2 5In the 1976-78 period, revenues from this tax amounted to over .6% of CentralGovernment revenues.

27
iv) The exposure of banks
Since.the beginning of the reform period, no restrictions were atta-
ched to the exposure of banks in foreign currency. Thus, banks could borrow in
dollars and lend in pesos facing the exchange rate risk at any level desired.
v) Credit Allocation
The targetted credit allocation programs were progressively elimina-
ted. In particular, the credit subsidies provided by the Central Bank for pre-
export financing, which explained a non negligible part of credit growth to the
private sector, were reduced in the second half of 1977 and finally eliminated
in the fiscal reform of November, 1979.
B.2. The post-1982 period
After the profound crisis of the economy in 1981-82, government in-
tervention in the financial markets initially stepped up again and later on was
relaxed. It included the following measures:
(i) Ceilings were reimposed on peso lending rates (although not on dollar
rates) in November of 1984. The limit was set at35% then lifted to 87%
in December of that year, to 90% in January of 1985 and to 95% a month la-
ter. This ceiling was binding all the way through its removal in December
of 1985. Since then interest rates are totally free.
(ii) A limit was set on the net exposure of banks in local (not foreign) oZtc
rrency since 1984. Thus, banks could borrow in dollars and lend in pesos

28
assuming any risk desired; however, a restriction was attached to their
exposure through borrowing in pesos and lending in dollars. The limit
is not homogeneous for all banks, and it results from the application of a
formula. This regulation is somehow curious, since in most other places it
is applied the other way around, to the dollar exposure.
(iii) Legal reserve requirements on domestic currency deposits, after having
been set at zero for almost 4 years, were raised to 10% in January of
1985, in an effort to restrain the excess liquidity of the market. At the
end of the year this ratio had been increased to 14%; no requirement ap-
plied for dollar deposits.
At the beginning of 1984 a change in the term structure of legal reserves
occurred. For very short-term peso liabilities (30 days or less) the ra-
tio was raised to 15%, while for one-to six-months deposits reserve requi-
rements decreased from 14% to 5%, and these were eliminated for deposits
over six months. This situation prevailed until late 1985 when legal re-
serve ratios were increased to 24%, 11% and 5% respectively for the three
types of deposits. During all the period since January of 1984 reserve
requirements have been substantially lower for dollar liabilities; these
are currently 10% for deposits under 6 months and 4% for thse over 180
days.
(iv) Targetted credit allocation resumed, a 8% of bank's deposits had to be
invested in government bonds at below market rates (LIBOR + 2%).

29
(v) The deposits of Banco de la Repiablica Oriental de Uruguay .(BROU) at the
Central Bank, amounting to US$115 millions, were frozen.
Thus, despite all the changes occurred in the Uruguayan economy since
.1965, the diagnosis of the authorities in front of a financial crisis appeared
to be gea iinhe same direction. In both cases it seemed to have been attri-
bute K o excessively liberal financial markets -even if in 1965 controls were
much more profound than in 1982-and regulation increased.
B.3. The Supervision of Banking Activities
The supervision of banking activities in Uruguay has been mainly con-
fined to the traditional control of capital and reserve requirements. Balance
sheets and states of results are also reviewed to judge if they are appropria-
tely elaborated so that they accurately reflect the financial situation of the
bank. This supervisory role is done through the Department of Control of the
Financial System, which is part of the Central Bank2 6.
Restrictions for the concession of loans have traditionally been very
soft. Even if at the beginning of the liberalization period it was not allowed
for a bank to grant loans to the members of its board of directors or to its
lawyers, nothing was established with respect to firms where the owners of the
2 61n other countries the supervision is done through an independent agency, re-gularly called Superintendency of Banks and Financial Institutions.
30
bank could have a property interest. In May of 1975 it was decreed that no lban
could exceed 20% of a bank's capital; in August of that year this figure went up
to 25%. By December of 1978 the limit was set at 40% and in March.of 1980 this
restriction was abolished.
For a brief period between January and August of 1981 it was again
established that no person or institution could borrow more than 25% of a bank's
capital; for The first time a borrowing limit was also set for conglomerates 2 7
at a maximum of 35% over the same base. This was abolished in August of 1981,
when this restriction was substituted for a more detailed information about
borrowers; the Central Bank started demanding a detailed analysis of every cus-
tomer, according to a uniform methodology.
Finally, in September of 1982 a prohibition was established for loans
given by a bank to its own personnel, as well as to firms where those people had
any managerial role. Once more, no special restriction applied to the borrowing
of firms or institutions which had a property relationship with the bank.
2 7Conglomerates have been a much less important issue in Uruguay as compared toother Latinamerican countries like Chile and Mexico.

31
B.4. The Role of the Central Bank as Provider of Liquidity
The Central Bank of Uruguay has played a fairly donservative role in
providing liquidity to the financial system. The main source of expansion of
the domestic money supply in the 1974-82 period were foreign exchange opera-
tions, as balance of payments surpluses were validated. Occasionally, the aut-
horities have even attempted to sterilize part of the increased liquidity
through the sale of government bonds2 8.
Rediscount operations were abolished in 1976, being replaced by the
"extraordinary financial assistance". This is not an automatic mechanism; banks
have to apply for funds, which may or may not be provided by the authority. Mo-
reover, the interest rates on these loans is not very attractive for commercial
banks, since it is set at 1.25 times the lending rate. In practice, this is mo-
re of a punishment than an assistance, and it carries a negative repercusion on
the bank's standing as perceived by the market. Analogously, banks who fail to
comply with the legal reserve requirement face a severe fine; this eliminates
other avenue which is occasionally used in other countries to expand domestic
credit.
Finally, open market operations have been normally used either to
finance a fiscal imbalance or to sterilize the monetary effects of a foreign ex-
change operation. They have not generally been a source of liquidity.
2 8A case in point was the failed sterilization operation of mid-1978.

32
IV. EFFECTS OF THE REFORMS
Perhaps the broadest indicator of economic performance is the rate of
growth of GDP. Judging by this standard, the package of- liberalization-cum-
stabilization measures substantially improved the economic development of Uru-
guay from 1974 to 1980. Per-capita GDP growth was roughly at 4.0% annual
average rate during this period, more than 5 times the corresponding figure for
1;50-73. This improvement occurred in spite of the sharp terms of trade dete-
rioration resulting from the oil shocks of the seventies. Nonetheless, these
encouraging results did not last long, as GDP fell by more than 15% from 1981 to
1984. Neither the success, nor the crisis could be entirely attributed to fi-
nancial liberalization. As it has been discussed, a number of other policy re-
forms as well as external developments are also accountable for the results.
The effects of the reforms are analized below ih terms of different
economic indicators.
A. Financial deepening
Financial deepening is broadly understood as the process of increase
in the intermediation of funds through the financial system. It is considered
desirable because it presumably increases the productivity of those funds by di-
recting them to activities that generate higher returns29 . Besides from the
2 9With respect to the case where-the savings-investment process is done by thesame agent.

33
aggregate measures of intermediation, there are two other specific issues which
deserve consideration in a financial deepening process: the way in which firms
obtain financing and the portfolio allocation of households.
A.1. Financial intermediation and credit
- The level of development of financial markets is generally measured
by the summary statistic (M2 /GDP). For industrialized nations like Belgium,
Switzerland and the U.S., this coefficient was around 0.6 on average for the pe-
riod 1960-75; in Germany it was close to 0.8 and in Japan over 1.0 for the same
period. On the other end, for developing economies in Latin America (i.e. Ar-
gentina, Brasil, Chile and Colombia) (M2 /GDP) was on average below 0.2 during
1960-75. Thus, financial sectors of developed nations were at leat 3 to 4 times
bigger in proportion to national income with respect to their conterparts in
semi-industrialized economies. In fact, as Mckihnon (1979) has argued, the gap
in the size of financial markets is much bigger than what (M2 /GDP) could sug-
gest, because of the existence of more developed stock markets, pension funds
and insurance companies in industrialized nations.
The ratio (M2 /GDP) presented an impressive growth in Uruguay during
the post-reform period, as Table 1 shows. From levels well below 0.20 in the
early seventies, it increased steadily after 1974, to reach close to 0.43 in
1981. The public sector had an almost nil participation in this development,
which can be completely attributed to a rise of private deposits in the Urugua-

TABLE 1: MONETARY AGGREGATES OF THE URUGUAYAN BANKING SYSTEM
(as % of GDP)
Net International Domestic Credit Monetary Central BankReserves Liabilities Foreign Debts
(M2 ) (Long Run)
1973 2.41 20.25 19.231974 -1.02 23.32 18.901975 2.09 25.01 19.601976 7.10 26.96 26.071977 12.00 29.50 28.77 -1978 20.00 31.87 36.10 -1979 13.85 33.76 37.58 -1980 10.75 37.52 39.14 -1981 12.15 40.53 42.89 -1982 7.50 90.25 70.91 7.031983 10.79 82.54 56.07 37.441984 7.17 83.51 55.09 40.491985 10.72 75.64 60.36 39.99
Source: Central Bank of Urug2ay.
Notes: Uruguayan Banking System (UBS) includes Central Bank, Banco de la Rep'blicaOriental del Uruguay (BROU), commercial banks and banking houses.
34
yan banking system.
Peso deposits did not account much for this increase in the period
1974-77' (see Table 2), as binding interest rate ceilings 6xisted and real rates
were normally negative. Rather, dollar deposits grew importantly, from 2% of
GDP in 1974 to almost 15% of.GDP in 1978. From 1978 to 1981 the most important
source of foreign exchange to the domestic banking system were deposits from
nonresidents. In particular, the overvalued currency in their country and the
unstable political situation provided a powerful incentive for many Argentinians
to deposit their funds in Uruguay, whose banking institutions did not need to of-
fer exorbitant rates to attract those deposits. On the other hand, when cei-
lings on interest rates became nonbinding -after 1977- peso deposits increased
too (almost 10 percentage points of GDP in 3 years).
Nonresident deposits continued increasing until 1981, when they rea-
ched close to US$ 1 billion. After that they started decreasing, as confidence
in the permanence of the Uruguayan economic policy -and in particular the ex-
change rate policy- waned. At the same time, a number of devaluations of the
Argentinian currency occurred, which diminished its overvaluation.
From 1982 on, the impressive surge in the ratio (M2/GDP) has to be
regarded very cautiously, since it is more than totally accounted by the effect
of the higher exchange rate on dollar deposits. Indeed, foreign currency depo-
sits went down every year from 1981 to 1984 whera measured in dollars, but in-
creased as a proportion of GDP as Tables 2 and 4 show.

TABE 2: M0NMARf LIABELITIES OF THE URUGUAYAN BATIN SYSTII
(as % of GIP)
Currency 1eso Deposits Dllar Deposits-
Private Other Total Private Se otor Other To tal Total Monetary
Sector Residents Nonresidents Total Liabilities (12)
1973 7.88 9.14 0.63 9.77 1.16 0.22 1.38 0.21 1.59 19.23
1974 6.94 8.97 0.76 9.73 1.68 0.34 2.02 0.21 2.23 18.90
1975 5.75 8.73 0.89 9.62 3.13 0.83 3z96 0.26 4.22 19.60
1976 6.21 9.63 1.60 11.23 6.72 1.65 8.37 0.27 8.64 26.07
1977 5.59 8.85 1.29 10.14 10.74 1.91 12.65 0.39 13.04 28.77
1978 5.85 12.89 2.13 15.02 10.43 4.13 14.56 0.67 15.23 36.10
1979 5.53 15.48 2.59 18.06 8.84 4.50 13.34 0.65 13.99 37.58
1980 5.52 1845 1.65 20.08 6.96 5.81 12.77 0.78 13.55 39.14
1981 5.02 17.44 0.54 17.44 9.95 9.31 19.26 0.63 19.89 42.89
1982 6.12 17.26 1.35 18.61 22.97 22.38 45.35 0.82 46.17 70.91
1983 4.54 14.85 0.70 15.55 17.58 17.58 35.16 0.82 35.98 56.07
1984 4.18 14.20 0.51 14.71 19.12 16.27 35.39 0.81 36.20 55.09
1985 4.55 15.39 0.81 16.19 21.27 17.39 38.66 0.96 39.62- 60.36
Source: Central Bank of Uruguay and estinations by the author.
-Notes: Other includes deposits of Banco Hiptecario de Uruguay (BHU), public enterprises and foreign exchane
houses.

TABLE 3: DOMESTIC CREDIT PROVIDED BY THE URUGUAYAN BANKING SYSTEM(as % of GDP)
Credit to the Private Sector Credit to the Consolidated TotalPeso Dollar Total. Public Sector
1973 13.28 2.98 16.25 4.00 20.251974 15.35 3.38 18.73 4.59 23.321975 14.39 5.08 19.47 5.54 25.011976 14.16 7.3' 21.46 5.50 26.961977 14.14 11.05 25.17 4.33 26.961978 15.33 13.09 28.42 3.45 31.871979 18.15 14.91 33.06 - 0.70 33.761980 20.16 16.88 37.04 0.48 37.521981 20.19 18.68 38.87 1.66 40.531982 20.37 57.18 77.55 12.70 90.251983 16.45 44.59 61.04 21.50 82.541984 14.96 43.89 58.85 24.66 83.511985 12.68 44.04 56.72 18.92 75.64
Source: Central Bank of Uruguay.

TABLE 4: F=GN EXCHANG ASEI OF THE PRIVATE SBMTR(RESIIMM AND NONREI)
(In tusands of US$ dollars, end of period)
apoits in the RmIdkng System Rablic Sector Oligations Total ExchangeTreasuy Treasury Total Iate
Fesidents 1%nresidents Total Ibnds Bills (N1$/1TS$)
1974 46.5C4 9.411 55.915 117.879 28.233 146.112 202.027 1,641975 94.5eB 25.0E2 119.667 228.083 19.170 247.253 366.920 2,701976 214*524 52.673 267.197 261.036 36.145 297.181 564.378 3,961977 39.080 70*439 466.519 282.640 24.398 307.038 773.557 5,401978 458.156 181.418 639.574 274.460 13.113 287.573 927.147 7,041979 603.396 307.559 910.955 265.910 6.206 272.116 1.183.071 8,441980 641.808 535.762 1.177.570 260.455 1.497 261.952 1.439.522 10,001981 1.053.742 965.964 2.039.706 265.136 1.496 266.632 2.306.338 11, 561982 882.404 859.739 1.742.143 275.750 153.594 429.344 2.171.487 33,501983 756.300 756.300 1.512.600 407.057 276.298 68*3.55 2.195.955 43,001984 748.1 11 636.598 1.384.709 544*391 401.321 945.712 2.330.421 74,001985 875.899 714.485 1*5a.38% 619.612 510.497 1.130.109 2.718*493 124,75
Source: Central Bhnk of Uruguay and estimations by the author.
Note: !'fobtain the division of dollar deposits between residents and nonresidents we used thesame proportions that these two types of agents had on dollar deposits in the private ban-king institutions (which had over 80% of dollar deposits at any time).

35
It was in fact the expansion of M2 -mainly deposits- which permitted
the increase in domestic credit. An important part of the increase in M2 was
accounted by the surge in deposits from nonresidents. Being these "hot money",
this aspect can help to understand why long-term credit never really developed
in the Uruguayan economy. Nonetheless, it is clear from Table 1 that financial
deepening in the sense of Mckinnon and Shaw took place in Uruguay during the pe-
riod 1974-81 as the higher level of deposits were translated into greater avai-
lability of funds. More importantly, credit effectively reached the private
economy, as net loans to the government decreased all the way from 1975 to 1980
and were very low in 1981 (Table 3). However the collapse and attempted rescue.
of financial markets after 1982 soon had the government back as a significant
borrower of funds; net credit to the public sector, as a proportion of GDP, Fent
from 1.66% in 1981 to 21.50% in 1983.
Overall, potential fears that increased availability of loanable
funds could possibly not be translated into greater credit for the Uruguayan
private sector were unfounded. Neither did the banking system invest abroad a
significant fraction of the funds captured in Uruguay, nor did the government
compete for extra resources with the private sector until 1981, a development
which is expected given the strong contraction of the fiscal deficit.
The expansion of deposits and credit between 1978 and 1981 was also
accounted by the materialization of capital gains by the private sector as the
value of real assets in the economy- especially agricultural land and real

36
estate- strongly increased.
It is important to mention that after 1982, a portion of the credit
to the private sector has been, to some extent, given involuntary. Banks have
been forced to roll-over bad loans which, if accurately reflected on balance
sheets, would have probably washed-out the capital of most banks. Thus, the
post-1982 surge in private credit should be regarded skeptically with respect to
its presumed benefitial effects, since it mainly reflects distress borrowing.
A.2. Portfolio behavior
The financial deepening process was strongly geared from the outset
towards foreign currency. It is quite natural that nonresidents would invest
only in dollar deposits, but the fact that domestic residents would maintain
such a proportion of their assets in dollar instruments is explained by a num-
ber of factors:
- In the period 1974-77 binding ceilings existed on peso rates, which
made domestic currency deposits unattractive. Thus, they did not expand during
this period, as presented in Table 2.
- There were no good hedges against inflation in Uruguay, other than
the dollar. In fact, the only existing adjustment clause was the unidad rea-
justable, an index which reflected the evolution of wages and other selected
prices, but there seemed to exist widespread distrust in this index, as people
believed that it was manipulated by the economic authority. However no adjust-
ment clause based on consumer price inflation appeared even if it was legally
possible. This is importantly accounted by a high and variable inflation, where
37
relative prices present big variability. In such a scenario the average infla-
tion rate means very different things for different agents; if these are risk
averse, they would be reluctant to contract under adjustment-clauses based on
average inflation.
It is important to notice that the expansion of dollar deposits of
residents was not only due to their increased demand for foreign currency as-
sets, but also to a switch in dollar deposits of Uruguayans from abroad to the
internal banking system. The data shows that during the period 1976-79, depo-
sits of domestic residents in U.S. banks decreased in nominal terms. This is
one sign of the confidence given by the reforms, which were able to revert the
chronic deficits in the capital account.
In the 1980-81 period, an even stronger surge in foreign'currency de-
posits of Uruguayans (US$ 400 million in one year) was mostly explained by the
expectation of capital gains in dollar assets, as confidence in the sustainabi-
lity of the exchange rat policy quickly eroded. Agents proved to be right and
were rewarded by an astonishing return of almost 400% on their dollar
deposits30.
Deposits in the Uruguayan banking system were not the only dollar as-
s.et available in the economy. The private sector (both residents and
nonresidents) had also access to gobernment debt denominated in foreign currency
which had substantial acceptability due to the long tradition of the Uruguayan
30Expressed in domestic currency.
38
authorities in honoring their external obligations. Thus, in the year after the
reforms started the public sector was able to raise more than US$100 million th-
rough the sale of treasury bonds. From 1975 to 1981 there was a major surge in
dollar deposits in the banking system -an almost US$ 2 billion increase- while
foreign currency denominated public debt remained virtually flat. When the cri-
sis of 1981-82 provoked substantial capital flight, the domestic authorities
started selling again dollar bonds and bills, most of which went to finance
their intervention in the financial markets.
It is important to emphasize that the overwhelming portion of finan-
cial instruments were short term (less than one year to maturity), most of them
for 90 days or less. This can be partially accounted for by the lack of "good"
indexed assets in an economy of high and variable inflation. The virtual stag-
nation of the private insurance business -due to a virtual state monopoly over
many types of insurance and the prohibitian to expand ther total number of insu-
rance companies- and the absence of other institutional investors such as mutual
funds or pension funds help to explain why long-term assets never developed in,
the Uruguayan economy. Another factor explaining why long-term credit did not
develop is the fact that most deposits were short-term, especially the "hot
money" of nonresidents.
Finally, and as mentioned below, financial assets such as stock and
bonds issued by firms were a negligible part of the portfolio of private agents.

39
A.3. The financing of firms
During a process of financial development, new and more sophisticated
instruments come to play a role in the market. In particular, firms usually
discover the possibility of raising funds directly from the public, as an alter-
native to borrow from intermediaries. In the Uruguayan case it is rather sur-
prising to discover that no firm issued bonds (either with or without
collateral) during the whole post-reform era, in spite of the high level of
spreads through the first part of that period. This might be partially explai-
ned by the fact that only a few, big and well-known firms could command enough.
public trust in order to attract private agents offering reasonable rates on
their debt. Moreover, these firms were preferential borrowers in banks, and the
spreads that they were charged decreased enormously after 1979. Further, the
absence of indexing practices in the economy was probably another element which
precluded the existence of company bonds as a means of financing. Finally, the
existence of a very soft bankruptcy law might help to explain this phenomenum.
On the other hand, the stock market in Uruguay has an almost nil par-
ticipation in financial markets. Even if it experienced some development in,the
years 1976 to 1979, the total value of stock transactions in any given year ne-
ver reached half a percentage point of GDP. Therefore, the financing through
stock emission has never been an alternative for Uruguayan firms. One reason
for this meager development of the stock market seems to lie in the Uruguayan
corporate law, which provides little protection for minority stockholders.

40
Thus, even in one of the most liberal environments, the development
of new forms of financing for firms simply did not occur. Firms were confined
to use their own resources in order to develop new projects -or, alternatively,
to borrow from banking institutions. After 1980, earnings started to fall and
firms turned increasingly to debt financing. Their option was to borrow either
in pesos or in dollars; as the real interest rate in pesos was rising and banks
pushed their customers to renew their loans in dollars, the exposure of Urugua-
yan firms in foreign currency rose importantly3 1 . Thus, the heavy devaluation
of the peso in late 1982 was a major blow for the financial situation of firms.
B. Interest Rates and Spreads
Ceilings on peso and dollar lending rates were binding in Uruguay un-
til 1976, resulting in negative real rates during most of the early reform pe-
riod. The existence of these ceilings on lending rates limited the funds that
the banking system could attract: after allowing for the banking tax, the cost
of holding reserves and other operating costs, the deposit rate was determined
as a residual.
From 1977 on, ceilings on interest rates became nonbinding and they
started climbing towards very high real levels after' 1978. As table 5 shows,
real rates on peso deposit reached almost 40% in 1981, since agents were increa-
3 1 The exposure of Uruguayan firas in dollars had been rising steadily since
1974. On this issue see Tybout (1985).

TABLE 5: INEREST RATES AND SPREADS
M-PostNominal Teposit 1tes Real Deposit 1ates Nominal lending Real lending Spreads on peso
rates (Nonal) 1ates (Normal) LoansPeso hilar 1so (1 -6 months) l)ollar Ieso Iblar Peso Dbllar Nonal Preferential
(1-6 months) lyr.+ Ex-ante Fk-post Ex-ante E-post .
1974 30.0 48.0 7.0 -44.92 -17.58 -6.02v -13.70 61.3 12.0 3.57 50*95 31.31975 30.0 48.0 7.5 -26.33 11.20 -17.66 35.38 61.3 12.0 42.50 39.88 31.31976 30.0 46.0 6.5 -21.15 -21.95 -7.11 -12.08 62.0 12.0 -2.74 -11.78 32.0 17.61977 51.4 63.2 7.5 2.89 10.35 -2.15 -9.47 76.6 13.8 20.95 -5.01 25.2 14.41978 42.6 45.4 8.0 -5.66 -18.74 -1.26 -25.64 .71.2. 14.2 -2.44 -20.10 28.6 17.11979 '50.6 49.2 11.9 -21.21 3.35 -33.98 -15.08 68.1 16.8 20.85 -11.75 17.5 -0.71980 50.3 52.7 14.6 11.77 19.13 0.05 -0.23 65.1 18.5 33.93 3.60 14.8 -0.51981 47.4 49.8 13.1 19.82 36.54 0.53 18.47 59.8 18.4 48.94 23.77 12.4 -0.91982 66.2 67.3 10.2 35.15 0.87 601.20 216.87 763 18.2 10.97 224.87 10.1 -9.51983 67.8 66.0 9.8 29.85 -4.51 48.73 -. 50 85.0 17.2 9.28 -1.29 17.2 -0.7-1984 75.2 79.0 10.6 18.16 -5.32 43.09 -3.32 86.6 17.3 1.56 0.56 11.4 -5.91985 74.4 76.2 8.1 -3.67 5.54 -2.25 -10.15 95.0 15.8 26.14 -5.59 20.6 5.6
Sburce:, Central Thnk of Urtguay and estimations of the author.
Notes: W) Naminal interest rates are at Decanber of each year.(ii) Ek-ante real interest rates on peso deposits are calculated adjusting the ndminal rate with the annualized inflation ra-
te over the 6 months previous to December (the average tenm of deposits was certainly less than one year and probablyless than six months).
(iii) Ex-post real peso rates are adjusted using the annualized inflation rate over the six months after Decanber.(iv) Ex-ante real interest rates on dollar deposits are calculated analogously to (ii), using the annualized exchange rate
depreciation of the 6 months previous to Decenber as expected depreciation.(v) Ex-post real dollar rates are calculated using both the inflation rate and the exchange rate depreciation over the six
months after Decanber (annualized).(vi) 1br the real ex-post dollar rates of 1932 a correction was made -using the November exchange rate- to avoid the probles
of the exchange rate overshooting.

41
singly doubtful about the sustainability of the exchange rate policy. The high
rates could also be explained in this period by the increase in demand for cre-
dit fueled by the capital gains on real assets. Even if spreads were declining
at the time, they were still quite high and nonpreferential borrowers faced
enormous financial costs, particularly so since they had practically no other
sources of financing. In the post-1981 period, demand for credit was influenced
by distress borrowing (i.e. borrowing to avoid bankruptcy) since many agents who
saw their positions deteriorate in the period of high real interest rates conti-
nued pressing for funds in an attempt. to postpone, or avoid if possible, their
capital losses. This situation usually happens in periods of generalized de-
pression when it is extremely unattractive- to pay-off debts by selling assets
whose prices have plummetted.
Binding ceilings on peso lending rates were reimposed in 1984, resul-
ting in low or negative real returns to investors.
The evolution of interest rates during the period 1974-85 is presen-
ted in Table 5. It is important to keep in mind that the calculation of real
rates faces important limitations. Ex-ante rates were computed using inflation
over the previous six months as the expectation of future inflation. In addi-
tion no exact information exists as to the average maturity of loans and depo-
sits, although this was clearly below one year. Further, periods of high and
variable inflation accompanied by external shocks witness substantial changes in
relative prices which obscure the meaning of the real interest rate as a common
figure.

42
B.1. The Spread Between Peso and Dollar Rates
The liberalization of financial markets vis-a-vis the rest of the
world was not able to bring about a ':,;avergence between domestic and internatio-
nal interest rates. Paradoxically, this spread rose between 1977 and 1980 as
the financial sector in Uruguay was becoming increasingly deregulated.
Banks operating in the domestic market had basically two alternatives
to obtain loanable funds: through domestic currency denominated instruments or
through foreign loans, which could be gotten by attracting dollar deposits from
nonresidents or by directly borrowing abroad from financial institutions. The
two latter options differ with respect to the speed with which the funds could
be obtained; an external loan from a foreign institution takes time to be com-
pleted, especially if it is a syndicated loan, whereas an increase in dollar de-
posits from nonresidents could be gotten much faster. In the Uru6uayan case,
syndicated loans represented a very minor part of the increase in external debt,
unlike other cases like Chile. Only three banks carried through this type of
transaction (Banco Pan de Azu'car, Banco Comercial and Banco de Credito); the to--
tal value of these loans did not exceed US$70 million, an almost negligible por-
tion of the Uruguayan foreign debt. This ocurred at a relatively late date,
since the first of these operations occurred at the beginning of 1981.
The reason for this particular pattern of borrowing probably lies on
the ability of the Uruguayan banking system to obtain dollai deposits both from
redisents and from nonresidents. Apparently, the long tradition of the authori-

43
ties in honoring their external commitments gave confidence to private agents
that the government would keep their hands off from dollar deposits in the do-
mestic market 3 2. So far,.their expectations have been confirmed since no inter-
vention of this sort has occurred33 .
During most of the post-reform period, there was no restriction as to
the exposure of banking institutions in foreign currency. Thus, it was possible
to borrow in dollars and lend in pesos, assuming any level of risk desired. In
fact, the Uruguayan banking system had a negative net exposure in foreign cu-
rrency during all the post-reform period, as dollar loans plus net international
reserves were significantly above dollar deposits. However, part of this safe
exchange position was only nominal; in many cases banks covered their risk by
renewing peso loans only if they were converted to dollars. For borrowers which
were not engaged in tradeable activities, a strong devaluation of the curr'ency
would almost surely mean bankruptcy and the bank would recover only part of its
credit, or, alternatively, would have to get involved in dis-tess lending. This
type of situation certainly accounts for a major part of the tumbling financial
position of banks after 1981. A safer way for financial institutions to have li-
mited their exposure was to change their structure of liabilities, replacing do-
3 21n fact, the three main political parties which took part in the 1984 campaign.promised not to nationalize the dollar deposits in the Uruguayan banking system.3 3other investors in Mexico and Peru have recently had a contrasting experience,as their dollar deposits in the domestic banking system were frozen.
44
liar for peso deposits. Nonetheless, this is a slow process that would have
required a developed structure of branches3 4 .
Dollar deposit rates in the Uruguayan banking system were close to
those in foreign markets, as could be expected, since access to deposits in the
U.S. or the Eurodollar market was open to most agentg. But the spread between
dollar and peso rates was high, in the range of 10 to 20% after adjusting for
the ex-post depreciation of the Uruguayan currency with respect to the dollar.
Before 1981 this difference can not be attributed to expectations of devalua-
tion. The fact that binding interest ceilings existed on dollar loans after
these were removed for peso loans can explain part of this spread since the
middle of 1976 to October of 197735. Moreover, dollar deposits faced lower re-
serve requirements than peso deposits from September of 1974 to October of 1978,
when legal reserve ratios were unified at 20%; on the other hand, interest rates
paid on reserves were comparatively more attractive for dollar deposits, as they
were set above Eurodollar rates. The latter two elements decreased the costs of
intermediation in foreign currency relative to domestic money, and thus could
explain part of the spread between peso and dollar lending rates even if inte-
rest rate ceilings on dollar loans were nonbinding. Ramos (1984) has pursued a
different line of argument, suggesting that foreign funds were in fact rationed
34Up until 1982 the expansion of bank branches was not allowed.
3 5Binding constraints existed on peso rates essentially until the middle of1976, when ceilings were raised to 62%. However, binding ceilings on dollar ra-tes remained in place until October of 1977.

45
by quantity rather than price, and that internal demand for credit in Uruguay.
.grew much more than what foreign lenders were willing to provide.
In the period 1981-82, as confidence in the sustainability of the ex-
change rate regime progressively eroded, expectations of devaluation started to
play a more prominent role in explaining the spread between peso and dollar ra-
tes. The Central Bank attempted to close this gap by selling exchange rate gua-
rantees starting in February of 1981. This policy proved successful as the
interest rate gap decreased substantially, but it was discontinued in September
of that year.
B.2. The Spread of Deposit to Lending Rates and Competition in the Financial
Industry
One of the benefits expected from financial liberalization is to
strengthen the competition in the banking industry, which should be translated
in better service and lower costs of intermediation. However, the spread bet-
ween lending and borrowing rates remained quite large, during most of the post-
reform period.
A difference has to be made between gross and net spreads. The ob-
served gap between borrowing and lending rates (the gross spread) is influenced
by legal reserve ratios and by taxes on financial intermediation. Reserve re-
quirements on peso deposits were progressively lowered since the beginning of
financial reforms. Moreover, in May of 1975 the Central Bank started to pay in-
46
terest on reserves, thereby lowering the cost of maintaining these previously
idle funds for banks. In May of' 1979 required reserves were finally eliminated
and in November of the same year, the 8,4% banking tax was abolished, 2.4% of
which was borne by the bank and 6% by the borrower of funds. The expected ef-
feet was felt for preferential borrowers, whose spreads came down fron an avera-
ge of 15.8 percentage points in 1977-78 to virtually nil or negative from 1979
to 1984. Nonetheless, no.-preferential borrowers' spreads were maintained over
15 points practically until 1982.
In any case, legal reserve requirements and financial taxes do not
explain by themselves the high level of the spreads. This has also been attri-
buted to a lack of competition in the banking market. We recall that the 1965
banking law actually forbid the entry of new competitors into the industry, a
situation that prevailed until the middle of 1977 when the law was relaxed for
banking houses, allowing them to obtain funds.from nonresidents. As a result,
the number of these institutions increased from one to more than twenty and
their participation on dollar-denominated loans went from 4.3% to 11.5% of the
market between 1977 and 1979. Nonetheless, the share of banking houses in peso
loans was kept at a very low level, which could be partially accounted by their
inability to obtain domestic currency deposits.
Spiller and Favaro (1984) have shown, based on econometric evidence,
that the threat of new entrants made possible by the 1977 regulatory change sig-
nificantly reduced the extent of 0.ligopolistic interaction among firms in the

47
banking industry. This finding supports the argument that the decrease in
spreads after 1978 can be partially attributed to the weakening of entry ba-
rriers to the market.
On the other hand, the 1982 reform which allowed the entrance of new
banks, with a maximum number of 10% of the existing ones per year, did not have
much -impact. Only one new institution (the Trade Development Bank) established
on net terms in Uruguay3 6, even if more applications were received-and rejected-
by the authorities. Quite obviously, the depression did not make the Uruguayan
market a particularly attractive one to establish in.
C. Savings
Financial deregulation, according to McKinnon, should increase
savings as more attractive returns are offered to postpone present consumption,
and a wider variety of financial instruments emerge3 7 . However, not only capi-
tal markets deregulation had an influence on savings during the post-reform pe-
riod in Uruguay. At least two other issues could have affected savings:
(i) The perception of a higher wealth when asset prices (agricultural land,
real estate) increased, which should have induced agents to spend more out
of a given income, to the extent that they behaved according to the life-
3 60ther few cases in which one bank bought another also existed.
3 7The increase in deposits as interest rates increase to more attractive levelsis bigger than the effect on net savings, because of portfolio substitution ef-fects from other assets in which people hold wealth.

TABLE 6: SAVINGS(Millions of New Uruguayan Pesos and % of GDP)
Year Total* % GDP Public** Private(% GDP) (% GDP)
1970 57 9.39 2.07 7.321971 79 10.94 -2.33 13.271972 141 11.35 6.75 4.601973 348 13.59 3.48 10.111974 373 13.59 3.48 10.111975 661 8.09 2.15 5.941976 1.538 12.17 5.09 7.081977 2.157 10.83 7.12 3.711978 3.766 12.18 8.20 3.981979 6.997 12.14 7.09 5.051980 9.998 10.84 5.93 4.911981 13.278 10.84 -0.15 10.991982 12.202 9.48 -3.29 12.771983 14.707 7.80 -1.82 9.621984 19.754 6.68 -1.45 - 8.13
Averages of Period
Period Total (% GDP)
1951-55 14.201956-60 11.001961-65 12.101966-70 11.201971-73 11.961974-78 10..301979-82 10.831983-84 7.24
Source: Central Bank of Uruguay
* Gross National Savings.** Includes only general government.

48
cycle hypothesis.
(ii) The appreciation of the real exchange rate, which prompted substitution in
consumption towards tradeables. If people believe that this appreciation
is temporary (as it seeraed during 1981-82) the price of tradeables today
becomes cheap compared to its expected level tomorrow, leading to a strong
increase in spending on tradeable goods, particularly durables3 8 .
If one looks at the evidence on savings rates presented in Table 6
they actually declined in the post-reform period; measured as a proportion of
GDP, savings were on average 12.1% in the period 1951-73, 10.3% in 1974-78 and
10.1% in 1979-83. But the predictions of the theory apply to private savings,
whose decline in the post-reform period is even more drammatic than that of to-
tal savings (especially fo.r the years 1.975-80). Private savings recover only in
the post-1981 period, when the public sector continuously dissaves as a result
of higher interest payments on debt, lower tax revenues and the social security
reform.
It is desirable to separate the effects of the reform from other in-
fluences, as De Melo and Tybout (1985) have done. Their most important findings
are that the real interest rate is not significant in explaining private
savings3 9 while the real exchange rate plays a protagonical role in it. The
3 8This effect was clearly at work in the Chilean case, as Dornbusch (1984) hasargued. However, part of the spending on durable goods is an investment for fu-ture consumption and thus- it can not be considered, in a economic terms, a de-crease in sayings.
3 9Although this may be due .to the fact that they use ex-post rates instead ofthe theoretically correct ex-ante rates. Of course, the difficulty with ex-anterates is how to measure them.

49
latter variable's influence goes according to the conceptual arguments
discussed; a real exchange rate apreciation increases spending on tradeables' and
exerts a negative effect on savings. Finally, they find evidence supporting the
view that the reform itself induced a positive shift in the savings function af-
ter 197440.
D. Investment
Two types of issues will be analized with respect to investment.
First, whether investment rates actually increased and second, whether the pro-
ductivity of investment improved as a consequence of the reforms.
D.1. Investment Rates
Casual observation of the figures in Table 7 shows that the experien-
ce regarding investment rates proved more successful than that with respect to
savings. Measured as a proportion of GDP, investment was 12% in the period
1956-74, 15.1% in 1975-78 and 14.7% in 1979-83, even if this rate was steadily
declining after 1980. The upward surge was importantly influenced by public in-
vestment, which more than. quadrupled between 1974 and 1978 as two big hydroelec-
tric projects, the Salto Grande and Palmar dams, were carried through. The
question to ask, is whether this improvement could be attributed to the libera-
lization of capital markets which -according to the financial repression view-
4 0This evidence was provided by a positive and significant dummy variable intro-duced for the period 1974-83., in a regression having private savings as the de-pendent variable.

TABLE 7: INVESTMENT(Millions of New Uruguayan Pesos and % of GDP)
Year Total* % GDP Public Private(% GDP) (%'GDP)
1970 69 11.26 2.86 8.401971 91 12.60 3.49 9.111972 147 11.84 2.74 9.101973 322 12.57 2.64 9.931974 525 11.55 2.91 8.641975 1.102 13.49 3.45 10.041976 1.871 14.80 6.20 8.601977 3.028 15.20 6.99 8.211978 4.951 15.89 7.92 7.911979 9.975 18.52 7.43 11.091980 15.994 18.67 5.93 12.741981 18.802 15.36 4.93 10.431982 18.555 14.42 6.87 7.551983 20.785 11.03 4.44 6.591984 25.673 8.69 2.81 5.88
Averages of Period
Period Total (% GDP)
1951-55 12.501956-60 12.301961-65 11.101966-70 10.201971-73 12.331974-78 14.191979-82 16.741983-84 9.86
Source: Country Economic Memorandum. The World Bank, various years.
* Includes variation in stocks and fixed investment.

50
had investment savings-constrained in the pre-reform period, or whether it was
due to other factors. In particular, Harberger and Wisecarver (1977) reported
that the after tax return on investment was between 6 and 7 percent for the pri-
vate sector during 1968-73. This was apparently due to heavy taxation of pro-
fits, which was lowered after 1974. Thus, low investment rates may have
responded more to unattractive returns rather than to a savings constraint.
De Melo and Tybout (1985) have studied this issue and concluded that
financial repression was not an important determinant of the increase in invest-
ment in the post 1974 period. Rather, they report that standard accelerator ef-
fects were at work throughout the 1962-83 sample period, suggesting that
savings constraints were not significant. Investment was found to be responsive
to interest rates in the usual negative way, although the effect is rather weak;
also, an appreciation of the real exchange rate stimulated investment by making
imported investment goods cheaper. However, their conclusions have to be taken
cautiously since they are based on strictly ad-hoc regression. equations where
the treatment of expectations -a crucial issue in explaining investment- is
highly rudimentary. Overall, it appears that the rationalization and decrease
of profits taxes as well as the elimination of quotas on imports of capital
goods and the real exchange rate appreciation were of greater significance in
explaining the shifts in investment in the post-reform period than the liberali-
zation of financial markets.
51
D.2. The efficiency of investment
When credit is rationed by quantity, the pressumption is that its
allocation among borrowers will be less efficient than what*would result if it
is rationed by price. In the pre-reform period, interest rate ceilings preclu-
ded the use of the price mechanism to allocate funds. What evidence do we find
in favor of higher productivity of capital after the reforms? A rough measure
of investment efficiency, the output-capital ratio, increased by 40% after 1974,'
although this can also be accounted for by an increased utilization of capacity
and the relaxation of restrictions for imports of capital goods.
Thus, an upward movement in the output to capital ratio is not con-
clusive evidence of an improvement in the efficiency of investment.
A more formal test of this issue was done by De Melo and Tybout
(1985). Their working hypothesis was that when interest ceiling existed, banks
could not discriminate towards small firms, which presented both higher transac-
tions costs per peso and a more uncertain pattern of earnings, by charging hig-
her interest rates. Thus,, banks may have instead pressed these firms to alter
their balance sheet by taking some "safety" measures (i.e., holding more liquid
assets and reducing their leverage). They found that "...with financial libera-
lization, small firms increased their leverage and reduced their liquidity so-
mewhat relative to large firms, and they payed a larger premium to do so" 4.1.
4 1 De Melo and Tybout (1985), p. 30.

52
These results suggest the existence of some efficiency effects of the reforms,
although they do not seem to be of great significance.
One further issue arises from the segmentation of capital markets and
the different financial costs that faced various agents. In effect, small and
less well connected borrowers faced spreads which exceeded those of preferential
borrowers by anywhere from 10 to 30 annual percentage points, after interest ra-
te ceilings were removed. This gap appears to be greater than what could be ex-
plained by differences in borrowers' risk and higher administrative costs of
credit for smaller borrowers.
With respect to the currency distribution of credit, dollar loans be-
came more important after 1979 not because banks were financing more projects in
the tradedble sector, but rather because the'y wanted their customers to-bear the
exchange risk. This policy backfired on banks, since after the devaluations
borrowers' positions deteriorated markedly, especially those operating in the
nontradeable sector. Consequently, the value of banks assets sharply decreased.
Another weakness of the financial sector, on efficiency grounds. was
the apparent. inexistence of long term credit in private banks. By the end of
1979 roughly 98% of all private bank credit was under one year of maturity, and
most of it was under six months. This is a strong obstacle for long run in-
vestment projects because, even if credits are finally extended at maturity, the
costs of rolling over and the inherent uncertainty remain.

53
E. The Effectiveness of Monetary Policy
The effectiveness of monetary policy, i.e. its potential to affect
real variables, has been threatened both in closed economies and in cases where
only the current account is open4 2. When capital mobility exists, the competi-
tion of other monies further weakens the potential of monetary policy.
The phenomenum known as currency substitution (OS) occurs when the
demand for foreign currency rises above the levels required by international
trade and tourism. When dollar deposits are allowed in the national banking
system and capital flows become virtually unrestricted -as in Uruguay- the subs-
titution between domestic and foreign money increases. Thus, the easier resi-
dents could switch between currencies, the more efficiently they can attain
their desired menu,of assets and, if inflation becomes a threaten, the easier
they can avoid the tax on their money holdings.
The Uruguayan authorities realized the ineffectiveness of their mone-
tary policy when- in late 1978 they pursued an open market operation, whose ef-
fects on the supply of domestic money were completely offset by capital flows.
This prompted a major revision in the exchange rate policy.
CS goes together with monetary instability, particularly in periods
when exchange rate expectations fluctuate widely. Ramirez-Rojas (1985) has stu-
died this issue for Uruguay and has found econometric evidence suggesting that
4 21n a full employment model of a small country with no capital mobility, Dorn-busch (1974) shows that expansionary monetary policy has no long run effects ot-her than the loss of reserves.

54
CS was quite important in Uruguay for the postreform period. The test is done
by regressing the ratio of domestic to foreign money on its own lag and the ex-
pected rate of depreciation of the exchange rate (through some proxy); the coef-
ficient of the latter variable turns out to be clearly significant. Thus,
currency substitution should have been an important consideration in the design
of monetary policy in Uruguay, at least during the period 1974-82.

55
V. CONCLUSIONS
While the final outcome of the post-1974 Uruguayan experience was a
deep crisis in the early eighties, it is precipitate to blame financial libera-
lization for the sole responsibility of the crash. External conditions worsened
for Uruguay in the early eighties: terms of trade deteriorated following the se-
cond oil shock, and then again and more sharply in 1983 and 198443; real interest
rates rose in international markets at a time when Uruguay had significant fo-
reign liabilities, and external credits all but stopped; finally, the highly in-
flueatial Argentinian demand decreased sharply following the set of devaluations
in that country.
External developments are of course not all the story; a faulty com-
bination of policies was also important in explaining the results. When unres-
tricted capital mobility was put together with a currency rate that was becoming
increasingly overvalued, capital started flowing quickly out of the country. As
expectations of devaluation increased, the spread between peso and dollar inte-
rest rates widened. Since the currency adjustment was slow to come,* the overva-
luation provoked a strong burden on borrowers with peso denominated liabilities.
When devaluation finally came it had to be sharper than if effected at the begi-
ning of the capital flight period, and it severely punished dollar borrowers.
The picture was then complete, with all debtors in a precariously weak position
(or directly bankrupt) which threatened the collapse of the financial 'system.
43Almost a 10% drop of the terms of trade in each year.
56
Moreover, a good part of the subsequent increase in credit to the private sector
was due to not-fully-voluntary rollovers, which mainly attempted to postsone (or
avoid if possible) capital losses. Why did not agents sell assets to pay-off
their debts, and thus avoid the exaggerated interest rates? Perhaps because they
thought the high real rates were temporary or, if permanent, the government
would somehow rescue them. Thus when the option of selling assets in a deeply
depressed economy was evaluated, the decision was to continue building up liab'i-
lities.
Overall, the main conclusions coming out of the Uruguayan financial
liberalization experience are:
(i) GDP growht remarkably improved over the period 1974-80, in spite of the
two adverse oil shocks of the period. This development has to be credi-
ted to the whole reform package, even if financial liberalization was the
most important part of it.
(ii) Financial deepening at the macro level did occur after the liberalization
reforms, even if it was geared from the outset towards foreign assets.
Part of this pattern was accounted by the absence of attractive indexed
assets, which rendered the dollar as the main hedge against inflation for
domestic residents. Another part of it is explained by a surge in dollar
deposits from nonresidents.
(iii) To the extent that the inflow of capital into the financial system was
largely speculative -as it appeared during the second phase- the macroe-
conomic situation was rendered highly unstable. At any rate, the increa-

57
sed availability of funds was able to reach the private sector, as long
as the fiscal deficit was shrinking. However, the expansion of private
credit in the post-1982 period has to be regarded cautiosly, since a por-
tion of it reflected distress borrowing.
(iv) Financial development did not occur in terms of expanding the financing
opportunities of firms. Neither bonds nor stocks were ever used by en-
terprises to raise funds directly from the private sector. The stock
market never developed.
(v) Private financial markets failed to create long term credit to finance
investment projects, which is a serius shortcoming for a development pro-
cess. Most loans were given short-term, even if substantial rollovers
occurred at maturity.
(vi) After binding ceilings were removed, real interest rates climbed to very
high real leves. This was partially explained during 1978-80 by the in-
crease in demand for credit fueled by the capital gains achieved on real
assets (mainly real estate and agricultural land). In 1981-82 high peso
rates were accounted by increasing distrust in the sustainability of the
exchange rate policy. After 1982 demand for credit was influenced by
distress borrowing, the rollover of debts to avoid bankruptcy.
(vii) Interest rates, after -the removal of binding ceilings, climbed to very
high real levels, partly because the spread between peso and dollar rates

58
was very high; a rather successful way of decreasing this gap may be the
sale of exchange rate guarantees as long as these are not supporting an
overvalued curreacy4 4 . The other side of high real interest rates are
the big spreads between lending and borrowing rates. These are certainly
influenced by legal reserve requirements, but also by competitive condi-
tions in financial markets, as the Uruguayan experience shows. Since
entry to the banking industry is always restricted, a case could be made
for government supervision against oligopolistic behavior.
(viii) The poor performance of savings was probably more influenced by wealth
effects and the exchange rate overvaluation rather than by financial li-
beralization per-se. Private savings present low responsiveness to the
real interest rate.
(ix) A similar situation occurs with capital formation; the removal of res-
trictions on imports of capital goods and the lowering of the profits tax
appear to be the most important determinants of the investment surge. Fi-
nancial liberalization seemed more successful in improving the producti-
vity of investment. On the other hand, the public sector had an
important participation in the post-1976 investment surge; private in-
vestment only picked up between 1979 and 1981.
4 4 Even if it is difficult to determine the exact equilibrium value of the ex-
change rate, "...grossly over-or urder-valued real exchange rates, like giraf-
fes, are not so difficult to recognize on sight". (Diaz Alejandro (1985), p.
21).
59
(x) The ability to pursue an independent monetary policy is significantly lo-
wered in environments with virtually no restrictions on capital flows,
where currency substitution increases to very high levels.
(xi) Overall, perhaps the clearest message of the Uruguayan experience is that
financial liberalization can not produce its intended benefits, unless
coupled with a coherent set of macro policies. Special attention has to
be put on avoiding too low exchange rates when capital flows are unres-
tricted.
60
REFERENCES
Barandiaran, E. (1978) "Las Tasas de Interes en Uruguay". Mimeo, October.
Barandiaran, E. (1986) "Financial Liberalization in Developing Countries: AnAnalytical Framework". Mimeo, The World Bank.
Daly, H. (1969) "The Pathological Development of the Uruguayan FinancialSystem". Economic Development and Cultural Change. October.
pp. 91-96.
De Melo, J. (1985) "Financial Reforms, Stabilization and Growth Under High Capi-
tal Mobility: Uruguay 1974-83". Mimeo, The World Bank. .
De Melo, J. and J. Tybout (1985) "The Effects of Financial Liberalization on
Savings and Investment in Uruguay". Discussion Paper
N*DRD129, The World Bank.
De Melo,. J., R. Pascale and J. Tybout (1985) "Microeconomic Adjustments in Uru-
guay during 1973-81: The Interplay of Real and Financial
Shocks".. World Development, August, pp. 995-1015.
Diaz, Alejandro, C. (1985). "Good-bye Financial Repression, Hello Financial
Crash". Journal of Development Economics, pp. 1-24.
Dornbusch, R. (1974) "Real and Monetary Aspects of the Effects of Exchange Rate
Changes' in R.Z. Aliber (ed.) National Monetary Policies and
the International World Financial System, University of Chi-
cago Press.
Dornbusch, R. (1985) "External Debt, Budget Deficits and Disequilibrium Exchange
Rates". In G. Smith and J. Cuddington (eds.)". Internatio-
nal Debt and the Developing Countries. The World Bank.
Edwards, S. (1984) "The Order of Liberalization of the Current and Capital Ac-
counts of the Balance of Payments". Essays in International
Finance N*156, Princeton University.
Frenkel, J. (1982) "The Order of Economic Liberalization". In K. Brunner and
A. Meltzer (eds.) Economic Policy in a World of Change,
North-Holland.
Friedman, M. (1969). "Controls on Intere'st Rates Paid by Banks". Journal of
Money, Credit and Banking, February, pp. 13-32.
Hanson, J. and J. de Melo (1983) "The Uruguayan Experience with Liberalization
and Stabilization: 1974-81". Journal of Interamerican Studies
and World Affairs, November, pp. 477-508.

61
Hanson, J. and J. de Melo (1985) "External Shocks, Financial Reforms and Sta-bilization, Attempts in Uruguay During 1974-83". World Deve-lopment, August, pp.917-939.
Harberger, A. (1975) "El Rol de los Factores Fiscales en la Inflaci6nUruguaya". Cuadernos de Economia, December, pp. 33-45.
Harberger, A. and D. Wisecarver (1977) "Private and Social Returns to Capitalin Uruguay" Economic Development and Cultural Change, pp.411-445.
Hinds, M. (1985) Mimeo, The World Bank.
McKinnon, R. (1973) Money and Capital in Economic Development. Brook-ngs Insti-tution.
McKinnon, R. (1979) "Represi6n Tinanciera y el Problema de la Liberalizaci6ndentro de los Paises menos Desarrollados". Cuadernos de Eco-nomia, April, pp. 3-22.
McKinnon, R. (1982) "The Order of Economic Liberalization: Lessons from Chileand Argentina" in K. Brunner and A. Meltzer (eds.) EconomicPolicy in a World of Change, North-Holland.
Ramirez-Rojas, C. (1985) "Currency Substitution in Argentina, Mexico andUruguay". IMF Staff Papers, December, pp. 629-667.
Ramos, J. (1984) Estabilizaci6n y Liberalizaci6n Econ6mica en el Cono Sur.E.C.L.A.
Shaw, E (1973) Financial Deepening in Economic Development. Oxford UniversityPress.
Spiller, P. and E. Favaro (1984) "The Effects on Entry Regulation on Oligopolis-tic Interaction: The Uruguayan Banking Sector". Rand Jour-nal of Economics, pp. 244-254.
Tobin, J. (1982) "The State of Exchange Rate Theory: Some Skeptical Observa-tions. In R. Cooper et al. The International Monetary Sys-tem Under Flexible Exchange Rates.
Tybout, J. (1985) "A Firm Level Chronicle of Financial Crises in the SouthernCone". Mimeo, The World Bank,.April.

긔

TABLE 8. BASIC MACROECONOMIC INDICATORS
0 (2) -3 (4) (5)GDP Growth Per capita Inflation Terms of Trade2/ Real exchange rate3/
GDP growth 1/ Index % L.Index %1980=100 Change 1980=100 Change
1973 -2.1 -3,1 77-5 134.1 -13.21974 3.1 1.8 107.2 144.9 114-3 -14.81975 5.9 5-1 66.8 106-5 -26.5 134-5 17-71976 4.0 3.3 39.9 108.1 1-5 144-3 7-31977 1.2 0.8 57.2 97.8 -9.5 142.1 -1,51978 5-3 4.8 46.o 101.9 4.2 139.4 -1.91979 6.2 5.5 83-1 103.6 1-7 121.9 -12.61980 6.o 5.3 42.8 100.0 -3.5 100.0 -18.01981 1.9 1.2 29.4 103.2 3.2 101-3 1-31982 -9.7 -10.4 20.5 103.3 0.2 122.9 21-31983 -4-7 -5.3 51.5 93.3 -9.7 230.2 87.31984 -1,8 -2,5 66.1 84.7 .-9.21985
Sources: (1) and (4) E-C-L-Ae(2) IFS, (several years)(5) Hanson and De Melo (1985).(3) IFS "Supplement on Price Statistics"
Notes: 1/ Inflation is computed as December to December variation in the CPI.Terms of trade of goods and services.Real exchange rate is computed as the nominal exchange rate corrected bythe difference between world inflation (WPI USA) and domestic inflation(CPI Uruguay)*

TABLE 9. BALANCE OF PAYMENTS -
(Millions of U§§T
1972 1973 1974 1975 1976 1977 1978 1979 190 1981 19 1983 1984.
1. Current Account 7 18 -154 -198 -82 -172 -133 -363. -716 -468 -235 -60 -124
1.1 Trade Balance 31 43 -111 -125 -9 -106 -57 -309 -618 -397 -48 217 227
- Exports 311 410 468 551 696 809 913 1.194 1.526 1.701 1.537 1.411 1.289Goods 242 328 381 385 565 612 686 788 1.059 1.230 1.256 1.156 925(Traditional) 240.4 237.4 194.4 259.3 263.2 248.6 222.7 416 519.2 534.7 519.7 339(No-tradit.) 87.6 143.6 190.6 305.7 348.8 437.4 565.3 643 710.8 721.3 636.3 586Real Services 69 82 86 166 131 197 227 406 468 471 281 255 365
- Imports 280 367 579 676 705 914 970 1.504 2.144 2.098 1.586 1.194 1.062
Goods 179 249 437 494 537 687 710 1.166 1.668 1.592 1.038 740 733RealServices 101 118 142 182 168 228 260 337 476 506 547 455 329
1 .2 Factor Services -24 -25 -43 -71 -72 -68 -77 -55 -10) -74 -197 -28f -362
1.3 Unilateral transfers - - - -2 -1 2 1 2 2 3 10 11 10
2. Capital Account 6 9 102 136 156 351 262 454 811 494 -182 -10 37
2.1 Long Ten Capital, 27 16 50 135 78 19 152 359 404 346 468 647 30
- Direct investment - - - - - 66 129 216 286 49 -14 6 3
- Portfolio Investment -6 34 31 110 33 21 -9 -31 -7 3 -7 -16 -7
- Debt 33 -18 19 25 45 14 32 174 122 294 424 657 20
(Public Sector) 8 5 - 38 154 108 246 419 336 46
(Commercial Barks) -5 4 - -2 -3 5 -3 -5 34 -1
(Others - private) 22 36 14 -4 23 9 51 75 287 -25
2.2 Short.-tenncapital 19 5 126 30 83 203 -54 94 311 326 511 -335 158
- Public sector - - - 19 9 16 -9 9 -23 -5 90 -2 -
- Commercial bas - - - 26 -36 74 -39 128 307 87 239 -67 67
-Others - private - - - -15 110 113 -7 -42 26 243 189 -333 43
2.3 Of icial Unilateraltransfers 12 .19 22 8 9 5 6 6 7 7 - - -
2.4 Errors and Omisssions -60 -31 -96 -38 -13 42 159 -5 90 -185 -1.161 -322 -151
3. Overall balance 13 27 -52 -62 73 179 129 91 95 26 -417 -70 -87
Source: E.C.L.A.

TABLE 10. SOCIAL SECURITY
Surplus (+) or
Revenues Expenditures ) Deficit (-)
GDP GDP GDP
1973-1976 8.2 8.7 -0.5
1977-1979 8.3 8.4 -0.1
1980 6.7 8.8 -2.1
1981 6.2 11.0 -4.8
1982 7.4 13.2 -5.8
1983 7.0 11.4 -4.4
Source: E.C.L.A.

TABLE 11. EXTERNAL DEBT
(Millions of Dollars)
Total Public Sector Privat6 Sector
1975 1.031 861 1701976 1.135 962 173
1977 1.320 1.028 292
1978 1.240 910 330
1979 1.682 1.012 6701980 2.155 1.182 974
1981 3.129 1.464 1.6551982 4.255 2.705 1.5201983 4.589 3.197 1.3921984 4.593 3.165 1.427
Source: E.C.L.A.