
Ensamblaje de Hormigas del Bosque Seco Tropical, Jardín Botánico de Cali
Upload
khangminh22Category
view
0download
0
Aymo Brunetti, Sven Michal(Editors)
Services Liberalizationin Europe: Case Studies
(Volume 1)
Studies on behalf of the StateSecretariat for Economic AffairsSECO
StrukturberichterstattungNr. 35/1
Eidgenössisches Volkswirtschaftsdepartement EVDStaatssekretariat für Wirtschaft SECODirektion für Wirtschaftspolitik

Aymo Brunetti, Sven Michal (Editors)
Services Liberalization in Europe: Case Studies
(Volume 1)
Berne, 2007
Studies on behalf of the State Secretariat for Economic Affairs SECO, presented at ReformWorks, the SECO reform conference
Strukturberichterstattung Nr. 35/1
Eidgenössisches Volkswirtschaftsdepartement EVDStaatssekretariat für Wirtschaft SECODirektion für Wirtschaftspolitik

Table of Contents
Aymo Brunetti, Sven Michal Vorwort: Aufholpotenzial der Schweiz im Dienstleistungssektor .....................................3
Préface: Le potentiel de rattrapage de la Suisse dans le secteur des services ...............9
Peter Andersson The liberalisation of postal services in Sweden – goals, results and lessons for other countries................................................................................................................................15
PLAUT Economics Opening postal markets in Switzerland. Monopolistic bottlenecks, technical co-ordination and social regulations .......................................................................................91
Tooraj Jamasb, Michael Pollitt Incentive Regulation and Benchmarking of Electricity Distribution Networks: From Britain to Switzerland .........................................................................................................127
Copenhagen Economics Study on International Roaming in Mobile Telecommunication Networks ...................189
KCW GmbH Liberalisierung im Schienenverkehr. Ergebnisse des Ausschreibungswettbewerbs in Schleswig-Holstein und Hessen und Folgerungen für die Schweiz ..............................219


3
Vorwort: Aufholpotenzial der Schweiz im Dienstleistungssektor Strukturreformen provozieren. Häufig stehen Renten von Interessengruppen auf dem Spiel. In Branchen wie den Infrastrukturdiensten oder dem Gesundheitswesen kommen Befürch-tungen hinzu, dass Liberalisierungen die Grundversorgung gefährden könnten. Oft wird in der Diskussion auf gescheiterte Reformen im Ausland verwiesen. Dabei geht allerdings un-ter, dass in Strukturreformen im Dienstleistungssektor auch ein beträchtliches ökonomisches Potenzial liegt, was zahlreiche Beispiele aus dem Ausland belegen. Das Staatssekretariat für Wirtschaft (SECO) hat Experten beauftragt, in Fallstudien die Erfahrungen von europäischen Staaten zu untersuchen, die in Dienstleistungsbranchen frühzeitig und erfolgreich liberalisiert haben. Die Resultate zeigen: Auch in heiklen Dienstleistungsbranchen können ökonomisch fundierte Strukturreformen funktionieren. Für Konsumenten und Unternehmen bestehen be-trächtliche Chancen.
Schweizerische und ausländische Untersuchungen zeigen, dass geeignete Reformen im Bereich der Dienstleistungen ein grosses Wachstumspotenzial beinhalten. Dies ist auch kaum erstaunlich vor dem Hintergrund der Tatsache, dass inzwischen mehr als 70% der Be-schäftigten im Dienstleistungssektor arbeiten und die meisten Dienstleistungsmärkte noch relativ stark vor Konkurrenz geschützt sind. Wie die Erfahrung der EU mit der Dienstleis-tungsrichtlinie zeigt, besteht aber ein weit verbreitetes Unbehagen darüber, die Dienstleis-tungen auf breiter Ebene mit einem umfassenden Ansatz zu liberalisieren. Zudem werden Liberalisierungen nach wie vor mit dem Hinweis auf die immer gleichen Beispiele – Probleme mit der Bahnreform in Grossbritannien und die Elektrizitätskrise in Kalifornien – pauschal abgetan. Inzwischen liegen aber zahlreiche Beispiele von erfolgreichen Reformen aus dem Ausland vor; die in den beiden vorliegenden Sammelbänden vorgestellten Studien präsentie-ren einige davon. Sie zeigen, dass man inzwischen einiges darüber weiss, wie man Dienst-leistungsbranchen dem Wettbewerb so öffnen kann, dass dies den Wohlstand positiv beein-flusst.
Wo steht die Schweiz im europäischen Vergleich?
Das SECO hat die Frage des Liberalisierungsstands in der Schweiz Ende 2005 im so ge-nannten Dienstleistungsbericht untersucht, der im Rahmen des Wachstumspakets des Bun-desrates erstellt wurde1. Unter dem Begriff der Liberalisierung wurde im Bericht keine einsei-tige Deregulierungs- und Privatisierungspolitik verstanden, sondern eine Annäherung an einen regulatorischen Rahmen, der den Wettbewerb ermöglicht; nicht blinde Deregulierung, sondern das Setzen wettbewerbsfreundlicher Regeln steht im Vordergrund. So können bei monopolistischen Engpässen durchaus neue Regulierungen notwendig sein, die den Wett-bewerb auf den Infrastrukturen erst ermöglichen. Ein Beispiel für einen monopolistischen Engpass, der Regulierung erforderlich macht, ist das Stromverteilnetz. Wenn neue Anbieter keinen oder zu teuren Zugang zum Verteilnetz erhalten, müssten sie in (ökonomisch kaum effiziente) neue Leitungen investieren. Da diese Leitungen beim Scheitern des Markteintritts kaum Dritten verkauft werden können, wird das Vorhaben für die potenziellen Konkurrenten zu riskant – der Wettbewerb bleibt Fiktion. Die staatliche Regulierung spielt hier also eine wichtige Rolle, damit der Wettbewerb überhaupt in Gang kommt. Vergleicht man den als «wettbewerbsfreundlich regulierend» definierten Liberalisierungsstand in der Schweiz mit dem Durchschnitt der EU15-Staaten, so liegt die Schweiz nur in wenigen Bereichen zurück, namentlich im Elektrizitäts- und im Postmarkt. In anderen Branchen – beispielsweise bei den Bankdienstleistungen – reguliert die Schweiz liberaler als der Durchschnitt der EU15-Staaten. Stellt man hingegen den Liberalisierungsstand in der Schweiz dem Stand des je-weils liberalsten EU15-Staats gegenüber, so besteht ein grösserer Rückstand der Schweiz
1 Staatssekretariat für Wirtschaft (2005): Bericht zur Dienstleistungsliberalisierung in der Schweiz im Vergleich zur EU. Grundlagen der Wirtschaftspolitik Nr. 12D.

4
(vgl. Tabelle 1). Der Vergleich mit den besonders wettbewerbsfreundlich regulierenden EU-Staaten wird umso bedeutender, wenn man sich die Ergebnisse der quantitativen Modelle vor Augen führt, die im Rahmen des Dienstleistungsberichts erstellt wurden. Sie folgerten, dass es hauptsächlich die Liberalisierung in der Schweiz – und nur in geringerem Ausmass diejenige in der EU – ist, die über mögliche Wohlstandsgewinne in der Schweiz entscheidet. Mit anderen Worten: Die Schweiz sollte ihre wirtschaftspolitischen Hausaufgaben im Dienst-leistungssektor lösen – unabhängig davon, wie sich der Liberalisierungsprozess in anderen Staaten entwickelt. Denn auch die unilaterale Öffnung verspricht volkswirtschaftliche Vortei-le. Aus Sicht einer wachstumsorientierten Wirtschaftspolitik sollen deshalb allfällig stockende Reformen im Ausland nicht als Hinderungsgrund für Reformen im Inland dienen.
Das wirtschaftliche Potenzial ist gross
Die Modellrechnungen deuten auf ein grosses ökonomisches Potenzial von Reformen im Dienstleistungssektor hin. Bei einer Liberalisierung in den fünf Branchen Handel, Geschäfts-dienste (dazu gehören Werbung, Beratung, Informatikdienste u.ä.), reglementierte Berufe, Telekommunikation und Elektrizitätsversorgung nach Vorbild der Best-Practice-Staaten der EU zeigte sich in den Modellen für die Schweiz ein einmaliger, langfristiger Wachstumseffekt von 2% des Bruttoinlandprodukts (BIP)2, was nach Abschluss der Anpassungen eine jährli-che Erhöhung des BIP um beinahe 10 Mrd. Franken bedeutet. Weitere Branchen – wie das Gesundheitswesen und die Finanzdienstleistungen – sind in den Modellrechnungen noch nicht berücksichtigt. Da die Simulationen mittels komparativ-statischer Gleichgewichtsmodel-le durchgeführt wurden, sind auch die aus einer gesteigerten Wettbewerbsintensität zu er-wartenden Innovationseffekte nicht enthalten. Vermutlich liegt deshalb in gelungenen Refor-men ein noch grösseres Potenzial, als von den Modellen vorausgesagt wird. Nicht zu unter-schätzen ist auch das Potenzial der Reformen auf Beschäftigung und Reallöhne. Wenn in liberalisierten Branchen die Produktivität zunimmt, können zwar in manchen Bereichen Stel-len verloren gehen. Die Wachstumswirkung der Reformen führt aber gleichzeitig dazu, dass anderswo neue Stellen entstehen, welche gemäss Modellen zu einem insgesamt positiven Beschäftigungssaldo führen. Ebenso eröffnet die steigende Produktivität ein nachhaltiges Potenzial für Reallohnerhöhungen. Die Liberalisierung im Dienstleistungssektor ist also kein Selbstzweck. Im Ausland gemachte Erfahrungen sind zwar nicht ohne Einschränkungen übertragbar; aus ihnen lassen sich aber wertvolle Erkenntnisse gewinnen. Denn ökonomi-sche Grundprinzipien behalten auch in der Schweiz ihre Gültigkeit. Wenn die Schweiz in manchen Märkten erst spät Liberalisierungsschritte ergreift, führt dies zu verpassten Chan-cen. Immerhin kann diese Verzögerung genutzt werden, um von den Erfahrungen anderer Staaten zu profitieren.
Folgestudien zum Dienstleistungsbericht
Folgend auf den Dienstleistungsbericht hat das SECO deshalb Ökonomen beauftragt, Fall-studien über Erfahrungen in Staaten zu erstellen, die in der jeweiligen Branche frühzeitig und erfolgreich liberalisierten. Sie werden in den beiden vorliegenden Sammelbänden von den Autoren vorgestellt. Bei der Auswahl der untersuchten Fragestellungen zu Liberalisierungen in Dienstleistungsbranchen wurde besonderes Augenmerk auf Faktoren gelegt, die gemäss den Schlussfolgerungen des Dienstleistungsberichts zum Liberalisierungsrückstand der Schweiz beitragen (vgl. Tabelle 1). Es wurden Experten aus wettbewerbsfreundlich regulie-renden Staaten beauftragt, zu den ausgewählten Fragestellungen Fallstudien über Liberali-sierungserfahrungen zu erstellen. Auch im Nachhinein zeigt sich, dass die Aktualität der ge-wählten Untersuchungsfragen ungebrochen ist. So insbesondere bei den Infrastrukturdiens-ten:
2 Vgl. Copenhagen Economics (2005): “The Economic Effects of Services Liberalization in Switzerland”, und Ecoplan (2005): “Liberalizing Services in Switzerland and with the European Union” in: Staatssekretariat für Wirtschaft (2005): Services Liberalization in Switzerland. Strukturberichterstattung Nr. 33E.

5
- Die vollständige Marktöffnung im Postmarkt und ihre möglichen Folgen werden auch in der Schweiz diskutiert. Gleichzeitig heben immer mehr Staaten in Europa den re-servierten Bereich vollständig auf (vgl. die Studien Andersson 2006 und Zenhäu-sern/Vaterlaus 2007 in Band 1, S. 15ff. und 91ff.).
- Die Regulierung der Verteilnetze im Elektrizitätsmarkt wird in der Schweiz spätestens dann zu einem wichtigen Thema, wenn der Wettbewerb im Zuge der Strommarktöff-nung zunimmt (vgl. Jamasb/Pollitt 2007 in Band 1, S. 127ff.).
- In der Telekommunikation bleibt weiterhin umstritten, wie weit die Kompetenz der Regulatoren gehen soll. Die Europäische Kommission möchte Roamingtarife preisre-gulieren. Was bedeutet dies für die Schweiz (vgl. Copenhagen Economics 2006 in Band 1, S. 189ff.)?
- Die Frage des Ausschreibungswettbewerbs im Bahnverkehr wird in der Schweiz zum Thema zukünftiger Bahnreformen (vgl. KCW 2007 zu Erfahrungen aus Deutschland, in Band 1, S. 219ff.).
Aber auch in den übrigen Dienstleistungsmärkten bleiben Liberalisierungs- und Regulie-rungsfragen von hoher Aktualität:
- Im Detailhandel bleiben mit der weitergehenden Konzentration Wettbewerbsfragen und das Cassis-de-Dijon-Prinzip hoch aktuell (vgl. BAK 2007 in Band 2, S. 15ff.).
- Die Integration der Versicherungsmärkte in Europa gewinnt auch in der Schweiz an Bedeutung und wirft regulatorische Fragen auf (vgl. Fenn et al. 2007 in Band 2, S. 75ff.).
- Bei den juristischen Diensten beschäftigt die Frage der Zulässigkeit der Anwalts-AG gerade die kantonalen Aufsichtskommissionen, während aus Kundensicht die Höhe der Tarife im Vordergrund steht (vgl. Stephen/Burns 2007 in Band 2, S. 117ff.).
- Und schliesslich sind die Fragestellungen der KVG-Revision im Parlament weiterhin umstritten. Niederländische Erfahrungen können zu einer sachlichen Diskussion bei-tragen (vgl. Douven et al. 2007 in Band 2, S. 163ff.).
Zusammenfassung der Resultate
Auf den ersten Blick scheint es, dass in jeder Dienstleistungsbranche andere Regulierungs-probleme zu lösen sind. Trotz der Unterschiede lassen sich die Erfahrungen der vorgestell-ten Studien aber mit ökonomischem «Common Sense» gut zusammenfassen:
- Aus wachstumspolitischer Sicht sollte auch im Dienstleistungssektor die Bestreitbar-keit der Märkte ein vorrangiges Ziel sein. Mit anderen Worten: Marktzutrittshürden sollen gesenkt werden. Denn nur schon die potenzielle Konkurrenz kann volkswirt-schaftlichen Nutzen bringen. Ein Beispiel für eine künstlich geschaffene Marktzutritts-hürde ist der Monopolbereich im Postmarkt.
- Die internationale Öffnung ist auch im Dienstleistungssektor ein höchst probates Li-beralisierungsinstrument. Sie ermöglicht die Spezialisierung und die Ausschöpfung von Skalenerträgen, trägt zur Vielfalt des Angebots bei und erhöht die Wettbewerbs-intensität. Hinweise dafür finden sich in den Fallstudien zu den Wirkungen der Libera-lisierung des Warenhandels auf den Detailhandel sowie zum europäischen Versiche-rungsmarkt.
- Wenn Marktversagen droht, ist Regulierung privater Wettbewerber in der Regel die effizientere Lösung als die Leistungserbringung durch staatliche Monopolbetriebe. Regulierung ist insbesondere in jenen Bereichen gefragt, wo stabile monopolistische

6
Tabelle 1: Einschätzung des heutigen Liberalisierungsstandes in der Schweiz im Vergleich zu besonders wettbe-werbsfreundlich regulierenden Staaten Legende zur Spalte „Vergleich Liberalisierung Schweiz – best practice-Staat“:
Best prac-tice-Staat
Vergleich Lib. CH –Best practice
Faktoren, die zum Rückstand der Schweiz beitragen
Handelsdienstleistungen Detailhandel Luxemburg - CH abseits vom Binnenmarkt (vgl. Agrarschutzniveau,
Cassis de Dijon etc.) Grosshandel Deutschland - CH abseits vom Binnenmarkt (vgl. Agrarschutzniveau,
Cassis de Dijon etc.) Merchanting (Schweiz) (Vorsprung CH)
Unternehmensbezogene Dienstleistungen Geschäftsdienste (Dänemark) Reglementierte Berufe
(Schweden / nur jurist. DL)
- (Liberalisierungsstand juristische Dienste)
Infrastrukturdienste Telekommunikation Dänemark - fehlende Privatisierung des Ex-Monopolisten
- fehlende Durchgriffsmöglichkeiten des Regulators Postdienste Schweden - Breite der Monopoldienste
- Privilegien des Ex-Monopolisten Schienenverkehr (Güter)
(Deutschland) - (Grad der horizontalen Trennung)
Schienenverkehr (Personen)
Schweden* - kaum Nutzung Ausschreibungen im Schienenverkehr- Grad der horiz. und vert. Trennung
Elektrizität Gross-britannien
- Fehlende Privatisierung der Stromerzeugung - Anreizorientierte Regulierung in GB
Luftverkehr (Niederlande) - (Fehlen der achten Luftverkehrsfreiheit)
Finanzdienstleistungen Bankdienstl. (Schweiz) (Vorsprung CH) Versicherungs-dienstleistungen
Irland - Rückstand bei grenzüberschreitenden Versicherung diensten
- Monopole in gewissen Versicherungsmärkten Gesundheitswesen Gesundheitswesen Niederlande - Kontrahierungszwang und schwacher Risikoausgleich
- Territorialitätsprinzip
Bildungswesen Primar- und Sekundarstufe
Schweden - Geringere Freiheit der Schulwahl
Tertiärstufe Niederlande - Wettbewerbsorientiertere Finanzierung der Hochschu-len in NL
* Aufgrund der Besonderheiten des Schweizer Personenschienenverkehrs (Engmaschigkeit und Auslastung des Netzes), ist die Schweiz bezüglich Liberalisierungsstand im Personenschienenverkehr nur indirekt mit Schweden oder anderen Staaten ver-gleichbar.
Mögliche weitere Barrieren in der Schweiz durch die nicht mit der EU vertraglich gesicherte Dienstleistungsfreiheit
Schweiz weist grossen Libera-lisierungsrückstand auf
Schweiz weist leichten Libera-lisierungsrückstand auf
Schweiz weist kaum Libera-lisierungsrückstand auf

7
Engpässe bestehen, namentlich in der Elektrizitätsversorgung mit den Verteilnetzen und im Bahnverkehr mit dem Schienennetz. Die Sicherung von Qualität und Effizienz der monopolistischen Infrastrukturen ist eine anspruchsvolle regulatorische Aufgabe. Eine mindestens buchhalterische vertikale Trennung ist oft notwendig, um Quersub-ventionierungen zwischen dem monopolistischen Engpass und den Wettbewerbsbe-reichen zu verhindern. Darüber hinaus können Instrumente wie Ausschreibungswett-bewerb oder Benchmarking zur Förderung von Effizienz und Innovation genutzt wer-den.
Und die Umsetzung?
Das grosse wirtschaftliche Potenzial der Liberalisierung wirft die Frage nach der politischen Umsetzung auf. Tatsächlich hat die Schweiz in den letzten Jahren einige Schritte in Richtung Liberalisierung der Dienstleistungsmärkte unternommen. Namentlich die bilateralen Abkom-men mit der EU dürften einiges bewirkt haben, so das Landverkehrsabkommen, das Luftver-kehrsabkommen und die im Personenfreizügigkeitsabkommen mit der EU enthaltene Klausel zu den Dienstleistungen (auf 90 Tage pro Kalenderjahr beschränkte freie Dienstleistungs-erbringung; Erleichterungen für Selbstständigerwerbende). Andere Liberalisierungsschritte sind hingegen ausgeblieben oder werden – wie im Fall der Reformen in der Krankenversi-cherung und im Elektrizitätsmarkt – noch im Parlament diskutiert. Einige der bedeutendsten Massnahmen für die Zukunft finden sich im Wachstumspaket des Bundesrates wieder3. Das neue Stromversorgungsgesetz, die wettbewerbsorientierte Revision des Krankenversiche-rungsgesetzes und die Einführung des für den Handel wichtigen Cassis-de-Dijon-Prinzips bilden gemeinsam ein beträchtliches Potenzial. Weitere Schritte dürften folgen, so z.B. die Fortsetzung der Öffnung des Postmarkts. Bei der Umsetzung der politisch heiklen Reformen können Details über das Ausmass des ökonomischen Erfolges entscheiden. Unvollkommen-heiten – wie die monopolistischen Engpässe, aber auch die in vielen Branchen politisch zu definierende Breite der Grundversorgung – verlangen nach staatlichen Regeln. Entschei-dend für die Umsetzung der ökonomischen Potenziale wird dabei sein, dass die aufgestellten Regeln den Wettbewerb nicht hemmen oder verzerren. Die Erfahrungen ausländischer Staa-ten, die bereits frühzeitig Erfahrungen mit Liberalisierungen gesammelt haben, sowie die Empfehlungen internationaler Organisationen wie der OECD können dabei helfen, die richti-gen Regeln zu finden4. Die beschriebenen Fallstudien zeigen auf, dass für Konsumentinnen und Konsumenten sowie Unternehmen beträchtliche ökonomische Interessen auf dem Spiel stehen.
Prof. Dr. Aymo BrunettiLeiter der Direktion Wirtschaftspolitik, Staatssekretariat für Wirtschaft (SECO), Bern
Sven MichalRessort Wachstum und Wettbewerbspolitik, Staatssekretariat für Wirtschaft (SECO), Bern
3 Interdepartementelle Arbeitsgruppe Wachstum (2006): Das Wachstumspaket des Bundesrates: Stand der Um-setzung im Dezember 2006. 4 Vgl. in diesem Zusammenhang auch OECD (2006): Switzerland: Seizing the Opportunities for Growth – OECD Country Reviews of Regulatory Reform.


Préface: Le potentiel de rattrapage de la Suisse dans le secteur des servicesLes réformes structurelles sont des défis épineux. Elles remettent le plus souvent en cause les rentes de groupes d’intérêts. Ajoutons à cela, pour des branches comme les services d’infrastructure ou la santé, la crainte qu’une libéralisation ne compromette l’approvisionnement de base. Enfin, dans le débat, on rappelle souvent les échecs des ré-formes à l’étranger. Or, s’arrêter à ces objections serait perdre de vue le potentiel économi-que considérable qu’offrent les réformes structurelles du secteur des services, comme le prouvent nombre d’exemples concrets à l’étranger. Le Secrétariat d’État à l’économie (SE-CO) a chargé plusieurs spécialistes de présenter des études de cas recensant les expérien-ces faites par les États européens qui ont libéralisé très tôt et avec succès diverses branches des services. Les résultats sont probants, des réformes structurelles économiquement justi-fiées et qui marchent sont également possibles dans les branches de services sensibles. Des perspectives très prometteuses s’offrent ici aux consommateurs comme aux entrepri-ses.
Les enquêtes effectuées en Suisse et à l’étranger montrent que des réformes judicieuses au niveau des services recèlent un fort potentiel de croissance. Cela n’est pas surprenant si l’on songe au fait que plus de 70% de la population active travaille aujourd’hui dans ce secteur et que la plupart des marchés de services sont encore relativement bien protégés contre la concurrence. Comme le révèle, toutefois, l’expérience faite par l’UE avec sa directive sur les services, l’idée d’une libéralisation à vaste échelle fondée sur un concept intégral suscite un embarras largement répandu. En outre, on continue d’opposer schématiquement aux projets de libéralisation les sempiternels exemples des chemins de fer britanniques et de l’électricité en Californie, dont les réformes ont suscité des crises. Or, de nombreux pays nous offrent aussi des exemples de réussite en ce domaine. Certains d'entre eux ont fait l'objet d'une étude approfondie, dont les résultats sont détaillés dans les deux volumes de la présente publication. Les exemples montrent comment s’y prendre pour introduire la concurrence dans le secteur des services et accroître le niveau général de prospérité.
Où se situe la Suisse par rapport aux autres pays européens?
Fin 2005, le SECO a publié un «rapport sur la libéralisation des services», élaboré dans le cadre du train de mesures du Conseil fédéral en faveur de la croissance1. La notion de libé-ralisation ne doit pas être comprise comme la mise en œuvre d’une politique unilatérale de déréglementation et de privatisation, mais comme la possibilité de se rapprocher d’un cadre réglementaire qui permette la concurrence; il ne s’agit donc pas de déréglementer aveuglé-ment, mais de mettre en place une réglementation favorisant la concurrence. Face à certai-nes situations monopolistiques, cela peut, par exemple, se traduire par de nouvelles disposi-tions légales, seules capables d’ouvrir les infrastructures à la concurrence. Le réseau électri-que est un exemple type de goulet d’étranglement monopolistique qui rend aujourd’hui une réglementation nécessaire. Si les nouveaux fournisseurs arrivant sur ce marché n’obtiennent pas d’accès, ou un accès trop coûteux, au réseau de distribution existant, ils doivent investir dans la construction de leurs propres lignes (une opération économiquement aberrante). Ces dernières, en cas d’échec, ne pourraient guère être revendues à des tiers: les risques à prendre sont trop importants pour de nouveaux opérateurs, de sorte que la concurrence reste une fiction. Si l’on souhaite qu’elle devienne réalité, une réglementation d’État s’impose. En comparant le niveau de libéralisation suisse – au sens d’une «réglementation respectueuse de la concurrence» – avec celui que présente la moyenne de l’Europe des Quinze, notre pays n’apparaît en retard que sur un petit nombre de marchés, ceux de
1 Voir Secrétariat d’État à l’économie, Rapport comparatif sur la libéralisation des services en Suisse et dans l’UE, 2005.
9

l’électricité et de la poste en particulier. Dans d’autres branches – les services bancaires, par exemple – notre pays applique des règles plus libérales que la moyenne des Quinze. En revanche, si on le compare dans chaque cas à l’État de l’UE-15 le plus libéral, on constate un retard plus important (voir tableau 1). La comparaison avec les États de l’UE dotés de réglementations particulièrement favorables à la concurrence prend davantage d’importance lorqu’elle est confrontée aux résultats des modèles quantitatifs élaborés dans le cadre du rapport sur la libéralisation des services. Ceux-ci aboutissaient à l’idée que c’est essentiel-lement la libéralisation en Suisse – et dans une moindre mesure seulement celle de l’UE – qui décide des gains de prospérité réalisables dans ce pays. En d’autres termes, notre politi-que économique, en matière de services, ne doit pas dépendre du processus de libéralisa-tion d’autres États. En règle générale, l’ouverture unilatérale est garante de progrès écono-miques au plan national. Une politique de croissance ne doit donc pas prendre prétexte des pannes que peuvent connaître certaines réformes à l’étranger pour étouffer celles à effectuer dans notre pays.
Un potentiel économique considérable
Les modèles de calcul mettent en évidence un imposant potentiel économique, justifiant la réforme des services. Si la Suisse décidait de libéraliser, conformément aux meilleures prati-ques observées dans les États de l’UE, les cinq secteurs du commerce, des services non assujettis (dont font partie la publicité, les services de conseil, les services informatiques, etc.) des professions réglementées, des télécommunications et de l’approvisionnement en électricité, les calculs montrent que son produit intérieur brut (PIB) bénéficierait d’un surplus de croissance à long terme de 2%, soit une augmentation annuelle voisine de 10 milliards de francs, une fois les adaptations effectuées2. D’autres secteurs comme la santé et les servi-ces financiers n’apparaissent pas encore dans ces modèles. Les simulations ayant été effec-tuées à l’aide de modèles statiques et comparatifs d’équilibre général, les effets d’innovation que l’on peut attendre d’une intensification de la concurrence, n’y figurent pas. C’est la raison pour laquelle les réformes réussies ont un potentiel sans doute plus important encore que ce que prédisent les modèles. L’impact potentiel des réformes sur l’emploi et les salaires réels ne doit pas non plus être sous-estimé. Un accroissement de la productivité dans les bran-ches libéralisées s’accompagne, certes, de suppressions d’emplois, mais la croissance que suscitent les réformes en crée d’autres et le solde est positif. De plus, les gains de producti-vité ouvrent une perspective durable de hausse des salaires réels.La libéralisation des servi-ces n’est pas un but en soi. Les expériences faites à l’étranger ne sont pas toutes transpo-sables en l’état, mais on peut en tirer des enseignements précieux, car les principes écono-miques fondamentaux sont aussi valables en Suisse. Si le processus de libéralisation ac-cuse des retards sur de nombreux marchés dans notre pays, il faut en profiter pour nous inspirer des expériences faites ailleurs.
Le suivi du rapport
Consécutivement au rapport sur les services, le SECO a chargé des économistes en Suisse et à l’étranger de présenter des études de cas sur les expériences réalisées par les États qui ont procédé à une libéralisation précoce et réussie de diverses branches. Ces études sont présentées par leurs auteurs dans les deux volumes de la présente publication. Une atten-tion particulière a été portée aux facteurs qui, selon les conclusions du rapport sur les servi-ces, contribuent au retard de la Suisse en matière de libéralisation (voir tableau 1). Des spé-cialistes originaires d’États dont les réglementations favorisent la concurrence ont été invités à fournir des études de cas portant sur des expériences de libéralisation liées aux questions sélectionnées. On constate que les questions abordées par ces auteurs restent parfaitement d’actualité pour la Suisse. Ainsi dans le domaine des infrastructures:
2 Voir Copenhagen Economics, The Economic Effects of Services Liberalization in Switzerland, 2005, et Ecoplan, Liberalizing Services in Switzerland and with the European Union, 2005.
10

- l’ouverture intégrale du marché postal et ses possibles effets font aussi l’objet de dé-bats en Suisse. Pendant ce temps, un nombre croissant d’États européens renoncent entièrement aux «services réservés» (voir Andersson 2006 et Zenhäusern/Vaterlaus 2007, vol. 1, p. 15ss et 91ss).
- la réglementation des réseaux de distribution du marché de l’électricité – si celui-ci réussit à s’ouvrir – est appelée à devenir un thème très important en Suisse (voir Ja-masb/Pollitt 2007, vol. 1, p. 127ss).
- dans le domaine des télécommunications, l’étendue des compétences dévolues aux autorités de régulation est une question qui n’est pas encore tranchée. La Commis-sion européenne souhaiterait réglementer les tarifs d’itinérance: qu’est-ce que cela implique pour la Suisse (voir Copenhagen Economics 2006, vol. 1, p. 189ss)?
- La question de la mise en concurrence par appel d’offres dans le trafic ferroviaire fera partie de la nouvelle mouture de la «réforme des chemins de fer 2» (voir KCW 2007, vol. 1, p. 219ss).
Les questions de libéralisation et de réglementation concernent également d’autres marchés de services et sont de la plus haute actualité:
- dans le commerce de détail, les questions de concurrence liées au processus continu de concentration ainsi qu’au principe du «cassis de Dijon» sont à l’ordre du jour (BAK 2007, vol. 2, p. 15ss)
- l’intégration des marchés de l’assurance en Europe éveille aussi un intérêt croissant en Suisse et soulève de plus en plus de questions touchant la réglementation (voir Fenn et al. 2007, vol. 2, p. 75ss).
- dans le cas des services juridiques, la possibilité pour les études d’avocats d’adopter la forme de la société anonyme, occupe en ce moment même les commissions can-tonales de surveillance, tandis que pour les clients, ce sont les barèmes d’honoraires qui suscitent le plus d’intérêt (voir Stephen/Burns 2007, vol. 2, p. 117ss).
- enfin, les questions liées à la réforme de la LAMal suscitent toujours des désaccords sous la Coupole fédérale. Les expériences néerlandaises peuvent alimenter objecti-vement le débat (voir Douven et al. 2007, vol. 2, p. 163ss).
Les résultats en bref
À première vue, les problèmes de réglementation à résoudre peuvent sembler différents dans chaque branche des services. Malgré cela, les études présentées dans ce numéro peuvent fort bien se résumer à «un peu de bon sens économique». Sous le signe d’une poli-tique de croissance, il serait souhaitable de faire de la contestabilité des marchés un objectif prioritaire pour le secteur des services également. En d’autres termes, il faut réduire les obs-tacles au marché, car déjà seule une concurrence potentielle est porteuse d’avantages éco-nomiques. Un exemple d’obstacle artificiel entravant l’accès au marché est le monopole de la poste. L’ouverture internationale est un instrument de libéralisation parfaitement approprié au secteur des services. Elle permet la spécialisation et met à profit les effets d’échelle; elle contribue à la multiplicité de l’offre et renforce la concurrence. C’est ce que montrent les étu-des de cas portant respectivement sur les conséquences de la libéralisation des échanges de marchandises pour le commerce de détail et sur le marché européen des assurances. Lorsqu’il y a défaillance potentielle du marché, la réglementation de la concurrence privée offre en général une solution plus efficace que la fourniture de prestations par des monopo-les d’État. Celle-ci est particulièrement indiquée dans les domaines où il existe des goulets d’étranglement monopolistiques stables, notamment dans l’approvisionnement en électricité et le transport ferroviaire avec leurs réseaux respectifs. Garantir la qualité et l’efficience des
11

Tableau 1: Évaluation du degré de libéralisation en Suisse par rapport aux pays leaders
Légende de la colonne «Comparaison de la libéralisation en Suisse et dans le pays leader»: Quasiment aucun retard dans la libéralisation
Léger retard dans la libéralisation Retard important dans la libérali-sation
État leader Comparaison de la libéralisation en Suisse et dans le pays leader
Facteurs contribuant au retard de la Suisse
Services de distribution - Non-appartenance de la Suisse au marché unique euro-
péen (voir: protection du secteur agricole, «cassis de Di-jon»)
Commerce de détail Luxembourg
- Non-appartenance de la Suisse au marché unique euro-péen (voir: protection du secteur agricole, «cassis de Di-jon»)
Commerce de gros Allemagne
Courtage sur mar-chandises
(Suisse) (Avance de la Suisse)
Services aux entreprises Services non assujet-tis
(Danemark)
- (Degré de libéralisation des prestations juridiques) Professions réglemen-tées
(Suède / uni-quement pres-tations juridi-ques)
Services d‘infrastructures Télécommunications Danemark - Non-privatisation de l‘opérateur historique
- Possibilités de saisie de l‘instance de régulation inexis-tantes
Services postaux Suède - Importance des services monopolistiques (services ré-servés)
- Privilèges de l‘opérateur historique - (Degré de séparation horizontale) Transports ferroviaires
(marchandises)(Allemagne)
Transports ferroviaires (voyageurs)
Suède* - Faible recours aux appels d‘offres - Degré de séparation horizontale et verticale
Électricité Royaume-Uni - Manque de privatisation parmi les producteurs d‘électricité
- Réglementation basée sur les incitations au Royaume-Uni
- (Il manque la huitième liberté) Transports aériens (Pays-Bas)
Services financiers Services bancaires (Suisse) (Avance de la Suisse)
Prestationsd‘assurances
Irlande - Retard au niveau des prestations d‘assurance internatio-nales
- Monopoles dans certaines branches d‘assurance Services de santé Services de santé Pays-Bas - Obligation de contracter et faible compensation des
risques- Principe de territorialité
Formation - Libre choix restreint de l‘école Degrés primaire et
secondaireSuède
- Financement de la formation dans les hautes écoles aux Pays-Bas
Degré tertiaire Pays-Bas
* Étant donné les spécificités du transport des voyageurs par rail en Suisse (densité et saturation du réseau), les comparaisonsavec la Suède ou d’autres pays ne sont possibles que dans certaines limites.
Autres obstacles éventuels du fait que la libre circulation des services n’est pas assurée par un accord avec l’UE.
12

infrastructures monopolistiques est une tâche normative exigeante. Une séparation verticale, au moins sur le plan comptable, est souvent nécessaire pour empêcher un subventionne-ment croisé entre les goulets d’étranglement monopolistiques et les secteurs soumis à la concurrence. De plus, des instruments de concurrence comme le recours aux appels d’offres ou les études comparatives peuvent être mis en œuvre pour accroître l’efficience et encou-rager l’innovation.
Et l’application?
Le grand potentiel économique de la libéralisation soulève la question de sa mise en œuvre politique. Ces dernières années, la Suisse a franchi un certain nombre d’étapes dans la libé-ralisation des divers marchés de services. Les accords bilatéraux avec l’UE ont certainement joué un rôle à cet égard, et plus particulièrement ceux sur les transports terrestres et aériens ainsi que la clause relative aux services inclue dans l’accord sur la libre circulation des per-sonnes (libres prestations de services transfrontalières pendant une période maximale de 90 jours par année civile; allégements pour les indépendants). En revanche, d’autres étapes dans la libéralisation n’ont pas été abordées ou doivent encore être débattues au Parlement – comme celles liées aux réformes de l’assurance-maladie et au marché de l’électricité. Un certain nombre de mesures parmi les plus importantes pour l’avenir figurent dans le catalo-gue de propositions du Conseil fédéral en faveur de la croissance3. La nouvelle loi sur l’approvisionnement en électricité, la réforme de la loi sur l’assurance-maladie axée sur la concurrence, ainsi que l’introduction du principe du «cassis de Dijon», important pour le commerce, offrent ensemble un appréciable potentiel d’amélioration. D’autres mesures de-vraient suivre comme la poursuite de l’ouverture du marché postal. Lorsque des réformes politiquement délicates sont mises en route, ce sont les détails qui peuvent décider de l’ampleur du succès économique. Les imperfections existantes – comme les goulets d’étranglement monopolistiques, mais aussi la portée de la desserte de base qu’il s’agit de définir politiquement dans de nombreuses branches – exigent des réglementations d’État. Pour que le potentiel économique se concrétise, il faut que les règles fixées ne bloquent ni ne faussent la concurrence. À cet égard, les expériences accumulées par les États étrangers qui se sont lancés très tôt dans la libéralisation, ainsi que les recommandations d’organisations internationales comme l’OCDE, peuvent nous aider à définir les réglementa-tions les plus utiles4.Les cas étudiés mettent en évidence des intérêts économiques considé-rables pour les consommateurs comme pour les entreprises.
Pr Aymo Brunetti, Chef de la direction de la politique économique, Secrétariat d’État à l’économie (SECO), Berne
Sven Michal, Secteur Croissance et politique de la concurrence, Secrétariat d’État à l’économie (SECO), Berne
3 Groupe de travail interdépartemental «Croissance», Le train de mesures du Conseil fédéral en faveur de la croissance, mise en œuvre décembre 2006. 4 Voir aussi OCDE, Suisse: Saisir les opportunités de croissance – Examens de l’OCDE de la réforme de la ré-glementation, 2006.
13


The liberalisation of postal services in Sweden – goals, results and lessons for other countries
Peter Andersson November 2006

1. Introduction................................................................................................ 181.1 Background ................................................................................................................ 18 1.2 Objective of the report................................................................................................ 19 1.3 Methodology and definitions ..................................................................................... 19
2. Liberalisation of postal services in Sweden............................................. 222.1 The early history of postal services............................................................................ 22 2.2 The years before liberalisation ................................................................................... 23 2.3 Liberalisation of postal services 1991-1994............................................................... 24 2.4 Later reforms of postal regulation.............................................................................. 24
3. Theoretical background to liberalisation of postal services .................. 253.1 Why regulate or deregulate postal services? .............................................................. 25
Market, allocative and regulatory failures.................................................................... 25 Theoretical foundation for the issue of natural monopoly ........................................... 26 Evidence of natural monopoly in the postal sector ...................................................... 27 Are there monopolistic bottlenecks in the postal sector?............................................. 30
3.2 Conclusions ................................................................................................................ 30 4. Goals of liberalisation in Sweden ............................................................. 32
4.1 Goals for the deregulation of the postal sector in Sweden......................................... 32 The Social Democrats’ growth bill, 1990 .................................................................... 32 The new non-socialist government’s bill on economic policy, autumn 1991.............. 34 The bill on removal of the letter monopoly, December 1992 ...................................... 34
4.2 Postal policy goals after liberalisation ....................................................................... 35 The first revision of the Postal Act, 1997..................................................................... 35 The second revision of the Postal Act, 1998................................................................ 36 The third revision of the Postal Act, 1999 ................................................................... 36 Later extensions of postal policy.................................................................................. 37 The Government Commission for postal and financial services, January 2005 .......... 37
4.3 Goals for the Post Office/Sweden Post ...................................................................... 39 4.4 An analysis of the development of postal policy goals.............................................. 40
5. The effects of liberalisation on the postal market................................... 455.1 Expected effects of postal liberalisation..................................................................... 45
Market structure ........................................................................................................... 45 Market performance ..................................................................................................... 45
5.2 Market structure ......................................................................................................... 46 Entry ............................................................................................................................. 46 Vertical integration....................................................................................................... 49
5.3 Market performance ................................................................................................... 50 Products and volumes................................................................................................... 50 The price level.............................................................................................................. 56 Employment, costs and productivity............................................................................ 58 Innovation..................................................................................................................... 61 Quality of service ......................................................................................................... 62 Welfare ......................................................................................................................... 67
6. The provision of universal services in Sweden........................................ 686.1 The organisation of postal production in order to provide USO................................ 68 6.2 Evaluation of the provision of universal services ...................................................... 70
Evaluation of the fulfilment of USO............................................................................ 70 Evaluation of the cost for USO .................................................................................... 71
1616

The future of USO in Sweden ...................................................................................... 72 7. Conclusions for liberalisation in other countries.................................... 73
7.1 Reasonable expectations ............................................................................................ 73 7.2 Get the objectives right .............................................................................................. 75
What are the problems to be solved by liberalisation?................................................. 75 Set the overall goals for the postal sector..................................................................... 76
7.3 Create a level playing field......................................................................................... 77 The same level of VAT and other taxes....................................................................... 77 Equal access to the postal infrastructure ...................................................................... 78 Upstream and downstream access to the network of the USO-provider...................... 78 Transitory price regulation only for single piece mail ................................................. 79 USO is compatible with market opening in many countries........................................ 80
7.4 A careful design of the role of policy and regulatory authorities............................... 81 Separation of power within government ...................................................................... 81 Clear goals for the sector and for state ownership ....................................................... 81 A carefully designed role for and composition of the regulatory authority ................. 82 Information and transparency....................................................................................... 83
7.5 Separation of activities ............................................................................................... 83 7.6 Conclusion.................................................................................................................. 84
17

1. Introduction
1.1 Background
Sweden was the first country in the world to truly liberalise its postal market. It is still one of the few countries, which has completely removed its postal monopoly. The statutory monopoly given to the state Post Office was removed 1 January 1993. On March 1, 1994, the Post Office was turned into a public company completely owned by the state. At the same date, a new Postal Act and a Postal Ordinance replaced the old monopoly proclamation and a regulatory authority was established: The Post and Telecom Agency.
The Postal Act has been revised and amended three times since 1994: in 1996, 1998 and 1999. In January 2005, a Government Commission presented a thorough analysis of the current situation on the postal market and proposed a new Postal Act. However, as late as in September 2006, no government bill has yet been submitted to the parliament.
Liberalisation of the postal market took place in a time of great change concerning postal services. Communication patterns have been changing. First the telefax and later the Internet and communication by e-mail have emerged as substitutes to postal services as did the telephone in the 1960s. On the other hand, the total quantity of communication is increasing rapidly. Postal companies are turning from providing overnight distribution of time-sensitive messages to less urgent information and goods mainly from businesses and the public sector to households.
New technology has not only changed the demand side. The production of postal services has undergone a revolution. Automatic sorting machines were introduced in the mid-1990s. They can sort printed and most hand-written addresses at a speed of up to nine letters per second. Machines have been improved to sort even heavier letters and in the near future, better software will enable the machines to sort the mail in the very order of delivery for the postman. Moreover, starting in the 1980s, large shipments of identical letters, “bulk mail” increased significantly. Bulk mail can easily be pre-sorted by the sender in order of postal code. Sorting of mail has turned from manual, labour-intensive work at night to industrial high-tech production. However, the delivery stage, which represents the largest share of total postal costs, remains more or less the same.
When liberalisation of postal services began to appear on the agenda in the late 1980s, it was not primarily as a response to these changing conditions. It was rather a concern of low efficiency in the postal sector, low growth of the economy in general and experiences from other liberalised sectors of the economy that spilled over to the postal sector. At the same time, universal services have remained an important feature and it is still assumed that mail should be collected from and delivered to everybody regularly at uniform and affordable prices. In order to preserve these services, a partial monopoly, a reserved area, has continued to be granted to the state monopolist in most countries. With revenues from non-contested mail, the monopolist is assumed to finance universal services in those countries.
When the EU started to discuss postal reform in the late 1980s, Sweden was not a member state but Sweden wanted to follow the EU. In the EU, a green paper on postal reform was
1818

published in 1992, followed by a Directive in 1997, which was amended in 2002. It set the date for complete postal liberalisation to the year 2009 at the latest, meaning a nearly twenty yearlong liberalisation process. Sweden, on the other hand, completed reform after a few years, already in 1994.
Thus, Sweden being fifteen years ahead of most other EU-countries represents an interesting benchmark. When liberalisation was introduced in Sweden, a postal monopoly had existed for 350 years and there was very limited experience of regulatory regimes for competitive conditions in the postal sector. Today, the experience from liberalisation in Sweden can be used in other countries.
What are the reasons for liberalisation and why did Sweden precede other EU-countries? What were the original objectives of liberalisation and have they changed over time since? What have the results been? Has liberalisation contributed to efficiency? What happened to universal services and their funding? What is the optimal regulatory framework for a modern, competitive market? Is it the changing conditions in the postal sector that require a new regulatory regime or is there a change in the state of knowledge on how to create optimal institutions or is it even based on ideology?
1.2 Objective of the report
The objective of this report is to make a thorough presentation of the effects of postal liberalisation in Sweden and - based on the empirical material- to discuss what conclusions of general interest can be drawn for countries in the process of liberalising their home markets.
The presentation of liberalisation in Sweden will focus on the following three areas:
- the goals of liberalisation in Sweden and how they have been fulfilled - the effects on the postal market’s structure in terms of entry and vertical integration and
on performance in terms of prices, volumes, productivity, employment, innovation, quality of service and welfare
- how the universal service obligation is fulfilled and financed.
1.3 Methodology and definitions
The report is structured according to a simple model1 that is illustrated in figure 1.1. The variables in focus in this report are shadowed. The model states that there are two basic determinants for the functioning of a market: the economic demand and supply conditions and the regulation of the market. The actors on the market, in this case the postal operators, make their strategic decisions based on economic conditions and regulation. This, in turn, determines market structure and performance. These variables are endogenous, and a result of strategic actions.
1 The model is a modified version of the well-known structure-conduct-performance model in Industrial Organisation, see for example Carlton-Perloff (2004).
19

In this report, the focus in chapter 3 is on the goals of liberalisation. They are determined by politicians and monitored by regulatory authorities, competition authorities etc. The dotted line illustrates that market actors can influence legislation and regulation.
In chapter 4, the focus is on market structure and performance. They are determined by the action of the firms. The model illustrates the problem of separating the effects of liberalisation from changes in the economic conditions. If Sweden had not liberalised, what would have been the alternative? The resulting structure and performance will influence the economic conditions in the future and be the basis for strategic actions in the next time period.
The old monopoly was obsolete and would probably have been reformed anyway in Sweden. Thus, we do not know the alternative and to what extent liberalisation and changes in other conditions have affected the market. Furthermore, we do not exactly know how change in demand or technology influenced the results of liberalisation and if these changes would also have been used by market players without liberalisation.
Figure 1.1: A model of relationships of variables studied in this report
Economic conditions Regulation
-demand -goals-supply -means and enforcement capacity
-universal service
strategy of postal operators
market structure market performance
horizontal integration: products and volumes entry and exit price structure and level
employment, costs and productivity vertical integration innovation
quality of service
The report builds entirely on secondary sources. Those are reports from the regulator (PTS) and studies from various Government Commissions, Department Reports preparing for reform, and from research reports. The postal market in Sweden has been quite thoroughly analysed ten years after its liberalisation. In 2005 there was both a Government Commission (SOU 2005:5) preparing for reform of the postal sector and a general Government Commission on Liberalisation (SOU 2005:4) that studied the postal sector. However, much information from operators necessary for the analysis is not available because of commercial reasons.
2020

Several terms can be used to describe the process analysed in this report. The most common are liberalisation, deregulation and regulatory reform. In Sweden the term ‘deregulation’, avreglering, has been used most often until recently, when liberalisation has become more common. In this report, liberalisation is used to describe the process or phenomenon in which a market is going from being very strictly regulated to less strict regulation. In most cases, however, less strict regulation requires a more extensive legislative framework than, for example, just having a state monopoly. The term deregulation points more specifically at the reform in 1993-94 when monopoly was removed and the Post Office turned into the public company Sweden Post. In most parts of this report, which are based on specific sources, however, the terminology in the source has been used. The term ‘Post Office’ is used for Postverket, which was before 1 March 1994 a public enterprise, affärsverk2, and ‘Sweden Post’ to denote the public, state-owned company Posten AB after that date.
2 The common organisational form within the state in Sweden is a ‘government authority’. It is financed over the government’s budget and controlled by annual letters of regulation. A ‘public enterprise’ is a particular intermediate form in which the organisation has more power and can use its revenues for financing with a target for the yield to the government. In the 1990s, also the Telephone Office and Swedish Railways went from being public enterprises to be public companies. This particular organisational form facilitated liberalisation; because the change was smaller than if they had been government authorities.
21

2. Liberalisation of postal services in Sweden
This chapter serves as a background to the following analysis of liberalisation. It will give a brief overview of the history of postal services in Sweden and in particular the liberalisation process that took place during the 1990s.3
2.1 The early history of postal services
Postal services were established in Sweden in the 1630s. They started as a means for the state to reach its provinces, also in remote parts that belonged to Sweden at that time. Five lines were established: the two longest went from Stockholm via Denmark to Hamburg and from Stockholm via Finland to the Baltic States. The mail was carried along by a system of rural postmen. The business idea was rapid and reliable transportation not dependent on couriers carrying individual items on a horse. Instead, the innovation was a system of local farmers along the line with responsibility to carry the mailbag a certain distance. There was no local collection or delivery.
In the 19th century, private letters and newspapers became a larger share of the mail. The uniform postage was introduced 1855 and local delivery in the cities began. In Stockholm, there were as many as five collections and deliveries per day, which meant that the opportunities to communicate were almost as fast as with e-mail today. Mail turned from being a means of communication for the state to a means for the households, and later in the 20th century primarily for businesses.
In the 1880s, the Post Office, which dates back to 1636, was challenged by a private competitor in Stockholm. This resulted in the first monopoly legislation in order to protect the Post Office. The official reason was, as today, to grant a monopoly that allowed for cross-subsidies that made it possible to deliver all across the country.
“Through competition on the part of the private person in those places where the stream of payments for postage flows abundantly, there occurs, however, a curtailing of the ability of the Post to make sacrifices for those areas from which the pursuers of private commerce with their capital with wise calculation flee.”4
However, another reason was to promote the distribution of newspapers. That was free since the 1820s in Sweden, and cross-subsidies rather went from letters to newspapers. Together with increased literacy, it contributed to increase the level of education among the people and building the modern nation state. In the 19th century it was the liberals who defended postal monopoly.
During the Second World War, the postage was increased by 50 % in order to contribute to the government’s budget. This resulted in establishment of around 50 small, local operators, because local delivery was not completely covered in the monopoly legislation from 1888. Thus, the legislation was adjusted to protect also from local competition. The arguments this
3 This chapter builds mainly on Bladh (1999) and Andersson (2001) 4 The Standing Committee on the Constitution 1888 quoted in SOU 1990:27, p 76, translated by Malcolm Forbes.
2222

time were reliability and the risk of confusion among consumers: they might drop their letter in a mailbox belonging to the wrong postal operator.
The monopoly granted in 1888 and adjusted in 1947 came to be valid until the abolishment in 1993.
“Regular distribution against a fee of closed letters as well as open letters containing fully or partly written messages” 5
Apart from the legal monopoly, the Post Office was managed by the annual Letter of Regulation in the Government’s budget bill.
2.2 The years before liberalisation
During the 1980s, some major liberalisations took place in Sweden. Particularly, the financial sector was reformed: financial markets were created and the strong regulation of the banks was relaxed. In 1989, the foreign exchange regulation from the Second World War was removed. Within a decade, Sweden’s financial sector turned into an internationally integrated market. At the same time, there was a major tax reform in Sweden, in which among other things a value added tax (VAT) was introduced on many services.
In 1988, regulatory reforms were introduced in some other network industries. The railway sector was vertically disintegrated: the operation of the infrastructure, including tracks and maintenance, was separated into Banverket and the operation of the trains into a more commercial organisation of Swedish Railways. Liberalisation of taxi and air transportation began. A Government Commission was appointed to study regulatory reforms also in the telephone and postal sectors and the company form of Swedish Railways, the Telephone Office and the Post Office was analysed by the Ministry of Communications.
During the 1980s, the management of the Post Office had started a process of turning the company in a more modern, efficient and business-like organisation. Management control by the state was relaxed: the Post Office obtained more freedom to decide on the postage and to finance investments from its own budget instead of decisions and financing through the government’s budget bill. The company was reorganised in 1988 with a more business-like management, business plans and the business idea of sufficient profitability, satisfied customers and employees. Later, in 1992, there was a divisionalisation and the Post Office got the right to decide on postage tariffs with a price-cap of 80 % of the NPI6 and it was also given a productivity goal.
The Post Office itself started to question the relevance of the legal monopoly. A new management in the late 1980s had expansion plans for the company. Management wanted to become an international logistics company and expand to new geographical regions. The Post Office also intended to reform the system of post offices and to merge with a Swedish bank. New technology (most notably the telefax) as well as courier firms, foreign transport companies, remailing and firms specialised in low-cost delivery of direct advertisements threatened its monopoly position. The monopoly on letters was considered an anomaly in this new business environment, even more so the particular construction of the monopoly in
5 Government’s Proclamation 1947:175 6 NPI is the net price index. It is the Consumer Price Index (CPI) excluding prices changes that depend on changes in indirect taxes or subsidies.
23

Sweden did not protect from emerging competition. In the Annual Report of the Post Office (1990, p8): “The letter monopoly, that the Post Office does not uphold, represents only 8 per cent of its business”.7
2.3 Liberalisation of postal services 1991-1994
On May 5, 1991, a new postal operator, City Mail, started delivery of pre-sorted bulk mail in central Stockholm. City Mail claimed that the kind of mail it delivered was not infringing the legal monopoly. The Post Office objected and reported City Mail to the legal authorities. Before the case was decided upon, City Mail went bankrupt in October 1992. However, in 1993 it restarted its activities.
Meanwhile, in the general election 1991, Sweden got a new non-socialist government. Sweden had faced low growth since 1970 and in the years 1991-93, Sweden suffered from a severe recession, GDP fell by over five per cent and unemployment rose from 1.1 to 10%.
The new non-socialist government announced liberalisation as part of a reform strategy to stimulate competition and economic growth. The postal sector was not the first to be reformed, however. The Minister of Communications appointed a new Government Commission to prepare for postal liberalisation but the Minister declared that before liberalisation could take place, the organisation of the Post Office’s social and regional responsibilities had to be decided upon.
In late 1993, when City Mail re-entered business, the Minister changed opinion: The monopoly could be removed without having any new legislation to replace it. With the current construction of the monopoly in the old proclamation, it was unclear whether City Mail infringed the monopoly. The government had signalled that liberalisation was about to be implemented. Such contradictory legal conditions would have endangered the re-establishment of City Mail. On December 22, 1992 the decision was taken in parliament to remove the legal monopoly from January 1, 1993. The instruction for the Post Office was to carry on as usual until new legislation was in place. Later in 1993, the Government Commission had completed its proposals. The Government submitted a bill to parliament and the new regulatory framework was in place 14 months after the monopoly was removed, on March 1, 1994.
2.4 Later reforms of postal regulation
The first Postal Act was revised three times since 1994. In the first revision of 1 January 1997, the scope of the universal service was extended and new operators were required a licence instead of a notification to the regulator. In the second revision of 1 July 1998, price regulation was reformed and legislation adjusted to the new EU Directive. The third revision of 1 July 1999 concerned only the access to the postal infrastructure (see section 4.2). The contract between the State of Sweden and Sweden Post has been renewed twice and since 2001, the requirements on Sweden Post concerning among other things the universal service obligation are included in its licence conditions. The legislation reforms will be described in more detail in chapter 4.
7 It is unclear whether it is as a share of volume or revenues, but as prices were quite uniform at this time, there will not be a significant difference.
2424

3. Theoretical background to the liberalisation of postal services
3.1 Why regulate or deregulate postal services?
Market, allocative and regulatory failures
The justification from economic theory for regulation in general is what is summarised in the term market imperfections. This includes the existence of public goods, economies of scale, asymmetric information and external effects, which all results in inefficient performance of an unregulated market. For the postal sector, the dominant market failure is the strong economies of scale and scope in postal production. Earlier, it has been argued that postal production as a whole or at least parts of it is even a natural monopoly. One solution in this situation is to limit the market power of a private firm by some kind of regulation at least in the markets where the firm is dominant, most commonly rate-of-return or price regulation. Another solution would be to put the parts that are seen as monopolistic to a public tendering. One more solution is to have a state monopolist, and determine other objectives than profit maximisation, such as a certain return on capital to the state budget and/or average cost pricing, for example. In the postal sector, state production has been the most common solution until the 1990s, even in the otherwise most market-oriented countries like the USA. Only since then, countries have started liberalising parts of the former state monopolies – or they have abolished the monopoly completely, such as Sweden, Finland, and New Zealand. Recently, deregulation has taken place also in Estonia and the United Kingdom and a few more countries have announced that they will precede the EU timetable with full market opening in 2009.
A second justification for regulation is a purely political one and is not derived from economic theory. For some products, like postal services, the outcome in a pure market economy does not represent the political goals for distribution in society; an allocative failureoccurs. Thus, postal services could be regulated in order to reach the desired availability. In practice, this leads to the universal service obligation (USO). It has to be defined in different dimensions: what postal products to be included in the USO, the geographical area, the price and service level. Usually, the geographical area is the whole country, prices are wished to be uniform and affordable, whereas the range of products and the service level vary across countries.
The allocation argument is sometimes used as a justification for state production, because it could be easier to finance universal services that an unregulated firm would not provide through cross-subsidies from products that generate surpluses. Moreover, state production facilitates more indirect reallocations: either to other activities carried out by the postal firm (e.g. providing financial services or free distribution of newspapers) or generating revenues to the state budget that can be used in other sectors of the economy.
When regulation is implemented in order to adjust for market imperfections or policy goals, new imperfections can occur, called regulatory failures. Such failures can take different forms. One is that the state monopolist becomes inefficient in the absence of competition. Such inefficiency can show up in too high employment and/or overcapitalisation and low
25

productivity. It is not uncommon in the postal sector that the Post Office mitigates unemployment problems, becomes an “employer of last resort”. Another result can be that the organisation is suboptimal or that there is a slack in the existing organisation. New regulatory failures can of course emerge as a result of the regulatory framework that replaces the legal monopoly.
A second form of regulatory failure is that the state firm makes monopoly gains, even if it does not reach as far as profit maximisation. Such gains can benefit different stakeholders. There can be a wage premium for employees with salaries exceeding the competitive level; there can be excessive benefits for management; they can benefit consumers with too high quality (at high cost); it can generate surpluses, which are used to finance diversification into sectors beyond the postal sector; it can be a source of revenue for the state.
Other results of regulatory failures can be dynamic inefficiencies, with too little innovation, which in the long run harms the sector, that quality is not adjusted to consumers’ shifting demand (i.e. some customers might desire lower quality at cheap prices, but not receive it from the monopolist) and that prices are too uniform and not adjusted to costs.
An important drawback of many of these regulatory failures (“too uniform prices”, “wage premia”, “surpluses that are used to diversify”) is that they create distortions that are both internal and that spill over to the rest of the economy. Too uniform prices mean that some customers do not receive the rebates that they would deserve from an efficiency perspective. When wage premia exist, some people work in the postal sector that would be more productive in other sectors of the economy. And when an incumbent uses monopoly rents to diversify into other markets – in many countries into financial services and retailing - and the incumbent maybe even cross-subsidizes this diversification, then firms of other sectors are harmed. Resources are transferred from more efficient firms to a less efficient firm. Hence, resources that could be more productive in other markets are wasted and the economy is harmed as a whole. If this problem of allocative efficiency can be solved with liberalisation, there could be a one-off growth potential for the economy.
If the starting point is a postal sector with legal monopoly because of the market and allocative failures that might otherwise occur, it is important to identify the regulatory failures that are to be solved with liberalisation. What are the problems to solve? How are they better solved with new regulation and which new regulatory failures may occur? Problems may differ substantially between countries because of different basic conditions as well as conduct and performance of the postal operator. This incumbent may initially be inefficient, overemployed and alternatively or simultaneously making monopoly profits.
Theoretical foundation for the issue of natural monopoly
According to Baumol (1977)8, a natural monopoly is defined by subadditivity of the total cost function in the relevant area of demand. Subadditivity leads to the result that a single firm can produce the demanded output at a lower cost than two or more competing suppliers. This is typically the case when very large fixed costs exist in a specific market, which leads to economies of scale and constantly decreasing average cost. Although high fixed costs are common for natural monopolies, other factors such as strong economies of scope and economies of density are important for the existence of natural monopolies as well.
8 William J. Baumol, "On the Proper Cost Tests for Natural Monopoly in a Multiproduct Industry," American Economic Review, Vol. 67, No. 5 (December 1977), pp. 809-822.
2626

The existence of a natural monopoly is not yet sufficient to require state regulation. According to the theory of contestable markets, potential competition is sufficient to force the natural monopolist not to set the price higher than average cost and to behave dynamically efficient (Baumol, Panzar, Willig 1982)9. Markets are perfectly contestable if
the monopolist and the potential competitor have the same cost function; there are no significant entry barriers and exit cost; the time required for market entry is short; consumers are willing to switch to cheaper alternative suppliers.
If a natural monopolist makes economic profits in a market and this market is perfectly contestable, competitors would be able to enter profitably. Thus, a perfectly contestable natural monopolist will be under pressure by potential competitors that will force him to produce productively and dynamically efficient.
In practice, the issue of entry and exist cost is overwhelmingly important. High fixed costs and the derived decreasing average costs are not sufficient to form an entry barrier as long as the fixed investments are economically reversible. If the capital markets are working perfectly and financial institutions can correctly evaluate the future profitability of a new entrant, these investments must be sunk costs in order to form an entry barrier. However, unless the financial institutions can correctly evaluate the future profitability of a new entrant, it can be a problem for a possibly efficient operator to finance large investments10. Apart from sunk costs, extensive regulations form often entry barriers as well. The legal monopoly in the postal sector is an ultimate example of such a barrier, whereas lower barriers that hinder but not deter entry are more common.
Whenever a natural monopoly exists and this monopoly is not contestable (for example due to high sunk costs or entry-hindering regulation), a monopolistic bottleneck exists: a company with a bottleneck facility could be inclined to refuse access to the facility to other company in order to prevent competition. Network infrastructures such as electricity distribution networks are typical monopolistic bottlenecks. In the past, sectors with natural monopoly segments were often monopolized in vertically integrated, state-owned firms. However, according to regulatory theory, regulation of the monopolistic bottleneck is sufficient to reach economic efficiency.
Sunk costs in the postal market are not nearly as important as in other network sectors. In the wider postal market, there are several undoubtedly competitive segments such as express delivery and parcel services. In the letter market, a disaggregated approach is needed to analyse the existence of natural monopoly.
Evidence of natural monopoly in the postal sector
The postal sector as a natural monopoly builds on the idea that there would be a waste of resources to duplicate delivery, where the marginal cost for a postman to carry more letters approaches zero. Panzar (1991) concludes that because delivery costs typically represent more than half of total costs, postal services is a natural monopoly that ought not to be split into
9 Baumol, W.J., J.C. Panzar, and R.D. Willig. Contestable Markets and The Theory of Industrial Structure, New York: Harcourt Brace Jovanovich, Inc., 1982.
10 In this context, it is notable that the financing costs of state-owned incumbents are often lower than the competitors’ financing cost.
27

different companies but where contracting out of delivery is a possibility to introduce competition. In Sweden, the report from the Ministry of Communications (1991) is the only source ever to argue that postal services are a natural monopoly as a whole.
Since then, the more disaggregated approach has gained support in postal research. Postal services consist of four different production stages: collection, sorting, transportation and delivery. There are different products, i.e. first and second class as well as local, regional and national mail. Falling average costs in the relevant range of demand is a sufficient condition for natural monopoly, but each stage and product must be analysed separately and joint costs examined. Whether postal services are a natural monopoly becomes a complex question. Only if there are strong benefits from vertical integration, postal services would be a natural monopoly as a whole.
Postal production is characterised by significant economies of scale.11 They exist in the sorting stage since automatic sorting was introduced in the mid-1990s. Sorting machines represent a very large fixed cost, but the marginal cost for each letter is small since the machines can sort up to nine letters per second. However, the level of the scale economies depends on demographic factors. To utilise the capacity, large volumes of mail have to be gathered to one place and if the region is large or volumes insufficient, manual sorting may be a more efficient alternative, see figure 3.1. Then, the cost function may not be subadditive: there can exist large, capital-intensive sorting facilities as well as small manual sorting in remote places with insufficient volumes to pay for transportation to the large sorting centres.
A second important scale factor exists in delivery. In this case large fixed costs are not the source; instead, the total cost curve is degressive.12 About half of the postman’s worktime is spent before the delivery round when mail is sorted according to order of delivery. This part’s costs are almost proportional to volume. Delivery along the street consists of two cost components: the cost to travel along the route of delivery points and the cost for each stop when mail is delivered into mailboxes. The costs for travelling around the delivery points increase disproportionally to volume up to the level when there is around a letter to every twentieth household. When smaller volumes exist, the postman works like a courier and improvises a route every day. When volumes are large enough, it is more efficient to follow a fixed route each day.13 As long as there is mail to an additional number of delivery points, it requires more stops. When the postman stops at every delivery point, more mail does not increase costs and marginal cost becomes zero. However, the in-house sorting by the postman increases proportionally. Thus, with more mail, each route has to be shorter. More postmen must be hired so the marginal cost for the whole delivery stage including in-house work is positive.
A third factor that contributes to economies of scale in the system is explained by the law of large numbers. There are unforeseeable fluctuations in demand, as well as a risk for disturbances in the system, which requires that some overcapacity be held. The need for such
11 Early studies of sorting costs were carried out when manual sorting was dominant. Cazals et al (1999) found significantly falling average costs for sorting in France. Economies of scale in the delivery stage are shown by e.g. Rogerson and Takis (1993), Bradley, Colvin and Smith (1993), Cazals et al (1997) and Cohen (2002). 12 A comprehensive model of delivery costs is presented in Cazals et al (1997). 13 Based on the findings in a survey of small local operators in Sweden (Andersson 2000).
2828

excess capacity is reduced when volumes increase. On average, a large operator can utilise capacity better than a small one.14
In the interregional transportation stage, there are also economies of scale, but they are often already exhausted. The mail fills lorries, train cars and aeroplanes and with larger volumes, more capacity is needed. In collection, however, which is also a kind of transportation on a smaller scale, economies of scale exist. However, because collection represents such small part of total costs those scale economies are relatively unimportant.
Figure 3.1: Illustration of total cost curves for sorting and delivery
A+T TC M TC
A C+D
C F
Q Q SORTING DELIVERY
For sorting, M is the total cost for manual sorting, proportional with volume. A is the cost for automatic sorting in machines. A+T is the cost for automatic sorting including the transportation cost for bringing the mail from the surrounding region to the sorting centre. For small volumes, manual sorting has lower costs, particularly if the transportation cost is large. Not all items can be sorted in machines, so the total cost is a mix of automatic and manual sorting. When the maximum capacity of the machines in the peak period is reached, manual sorting is also required. Thus, in some instances, the marginal cost for sorting becomes the cost for manually sorting letters.
For delivery, the C-curve is the cost for in-house work and D the cost for delivery along the route. D increases degressively and at a certain point, (C+D) becomes parallel to C, which means that the marginal cost for street delivery is zero.
In addition to economies of scale, there are also important economies of scope. They exist in the delivery stage between different classes of mail. If the postman travels the route to deliver first class mail every weekday, the additional cost for delivering second and third class mail and unaddressed items is much lower than if each category of mail was delivered separately. The reason why in Sweden City Mail can compete with Sweden Post’s strong scope economies is that because it delivers only second class mail. The postman travels each route every third day, covers three routes and (stand alone) delivery costs are reduced to one third. Delivery of unaddressed items is also carried out by firms who hire low cost labour and gather the items and deliver once a week. Similar economies of scope exist between local, regional and national mail. The local operators deliver only the former. Their opportunity to beat the economies of scope of Sweden Post is to have lower labour costs if they cannot offer innovative services.
14 As an example, the small local operators in Sweden often have to refuse to take large mailing from local firms or authorities because in can more than double volumes in a single day. Such unpredictable fluctuations for a company of Sweden Post’s size remain within a few per cent.
29

Are there monopolistic bottlenecks in the postal sector?
Recall that a natural monopoly alone may not require strong regulation if monopolistic bottlenecks do not exist. Such bottlenecks exist to a much lesser extent in postal services than in other network industries like telecommunications or electricity. Postal services have no infrastructure of its own, like cables or wires. Sorting facilities have such features, but they not are part of the infrastructure, instead they must be regarded as production plants (like switching centres or power plants). It may, as in the telecommunications sector, require access regulation to break the monopoly in the sorting stage. Sorting machines may be large sunk costs as the alternative use is very limited. Other sunk costs in the sector are small. For a new, local operator, sunk costs consist in the building up of knowledge: planning a route network, learning of addresses, getting access to door codes and address files etc. The survey of local operators in Sweden shows that these costs exist, but they are small and entry on a small scale is fairly easy.
There is little evidence in the world concerning entry on a large scale. Several factors may be decisive. One crucial factor is the capital market and whether any financial institutions would be willing to lend money to a new postal operator that would challenge a state incumbent monopolist on a nationwide scale. Moreover, it depends on the willingness of large customers to change operators, which could depend on the image of the trademark and reliability of the operators. In Sweden, it took City Mail a decade to become profitable and had the original founders not been unexpectedly successful in gaining new financial support, it would have exited the market.
To overcome such entry hinders, it is likely that nationwide entry would occur by an already existing firm with own capital, experience of logistics and a well-known trademark (e.g. large scale entry by a food retailer or a foreign postal operator would be a possibility).
3.2 Conclusions
Are natural monopolies existent in postal services and are they contestable? The cost analysis shows that for a single postal product, there is a natural monopoly for sorting in a region up to the quantity where the maximum capacity of the sorting terminal is reached. In Sweden, demand does not seem to be sufficient for more than one sorting terminal per region. In very densely populated areas with large volumes, there may be demand for more than one sorting facility and the natural monopoly can turn into a natural oligopoly.
Moreover, there appears to be a natural monopoly for each delivery route for a single product. Thus, the most efficient way of industrial organisation would be to have one sorting terminal for each region and one postman per route, except where volumes are large enough and thus the decreasing average cost potentials are exploited. It does not follow, however, that the same company should deliver along all these routes or run all sorting terminals in the country! In particular the delivery stage could in principle be divided into many small firms. Only if there were strong arguments for vertical integration due to high transaction costs or market
3030

imperfections, the best organisation would be a single firm for the entire postal sector. Only if network economies are sufficiently strong is the optimal organisation a national monopoly.15
Postal services are a multi-product industry. Even if there were a natural monopoly for a single product, it is not necessarily existent for all products unless economies of scope are sufficiently strong. It is unlikely that in equilibrium there will be two postmen side by side delivering the same sort of mail, even in densely populated areas. However, as we have seen in the case of City Mail and some local operators in Sweden, it is possible to be profitable with a focus on a single product. Despite the economies of scope of Sweden Post, they can compete if their production costs are sufficiently low.
The conclusion is that it is impossible to determine whether there is a natural monopoly in some part of the production chain in advance. Not even empirical evidence can give a definite answer and multiple equilibria may exist. Some entry barriers can hinder efficient entry. On the other hand, in a multi-product industry like the postal sector, entry can occur because a natural monopolist is not always sustainable to entry.16
A common incorrect assumption is that it is the state incumbent monopolist who would be the natural monopolist. If competition is allowed, another operator, like a new domestic firm or a foreign postal company, can enter and take over the market if it has lower costs. A more likely development is entry on a small scale in different segments. Such entry (or alone the threat of potential entry) will stimulate the productivity of the former monopolist and contribute to greater variety in supply.17 A few of the new operators in Sweden may not have contributed to static efficiency, but likewise to dynamic efficiency. Through learning by doing, over time they can become efficient. Moreover, if one considers other similar markets, such entry is allowed and no authority decides whether it is efficient or inefficient. The market decides. The new small grocery store in the corner may be less efficient than the supermarket but no authority stops its establishment.
The final conclusion form this analysis is that a policy that lowers entry barriers and aims at removing regulatory distortions together with access regulation to stimulate efficient entry is mostly important to make liberalisation in the postal sector beneficiary. Because we can not determine the best market structure, by opening the market to competition we allow market forces to find the solution.
15 Such economies are increasing with more specialised technology. Transportation and sorting depend on correct preparation in earlier stages of production (e.g. specialised bar codes) and a vertical split into several companies can raise transaction costs. Vertical separation may be more difficult in the future. 16 The theoretical foundations are provided by Baumol, Panzar and Willig (1982) and Sharkey (1982). An example of efficient and inefficient entry is given by Faulhaber (1975) and applied to the postal sector in Andersson (2001). 17 A concrete example is that many new local operators started collection in the morning of the delivery day, at 6 or 7 am. After that, Sweden Post also set up special blue mailboxes for local letters, which are emptied the same morning.
31

4. Goals of liberalisation in Sweden
This chapter will give an overview of the goals of liberalisation since it appeared on the agenda in the late 1980s. There can be goals for the postal sector as whole, goals for postal policy in general and goals for specific regulatory reform. Goals on different levels cannot easily be separated and even if the chapter will focus on liberalisation, postal policy in general will also be discussed.
4.1 Goals for the deregulation of the postal sector in Sweden
The first Commission analysing reforms in the telephone and postal sectors, 198918
Following deregulation of the financial sector, taxi and air, a Government Commission was appointed in 1988 to analyse reforms in the telephone and postal sector. Most of its report is on deregulation of the telecom sector, which was identified as exposed to rapid technological change. For the postal sector, however, the conclusion was that regulation should continue as before. Cross-subsidies within the Post Office were found to be the best way to finance its regional and social responsibilities19, the monopoly should remain and liberalisation await further steps within the EU (despite the fact that Sweden was not a member of the EU until 1995). Thus, the first study on liberalisation proposed business as usual – no further steps towards liberalisation in the postal sector.
The Social Democrats’ growth bill, 199020
Faced with low economic growth since 1970 and a falling relative position for Sweden in GDP per capita, the Social Democratic government submitted a bill to the Parliament in 1990 with measures for promoting growth. Deregulation was regarded as a means to stimulate economic growth. Well functioning markets with more efficient competition as well as the development and rationalisation of the state sector and its authorities were mentioned as two important areas of reform.
The postal sector was considered an important part of the infrastructure, which is crucial to economic growth. Taking into account increasing competition from new communication technologies and competing firms without any social responsibilities, it was considered necessary to give the Post Office freedom to act in a business-like way. Being a public enterprise, its possibilities to meet new competitors were limited. Moreover, decreased profitability in the post office network was identified as a threat to regional over-the-counter services. Unlike the Government Commission, changing conditions were found to jeopardise the possibilities for the Post Office to fulfil its regional and social responsibilities.
Thus, the Social Democrats were liberalisation-friendly in order to stimulate growth in general and to safeguard the Post Office from emerging competition and preserve regional responsibilities. This bill resulted in increased freedom for and reform of the Post Office
18 SOU 1990:27 Post och tele – affärsverk med regionalt och socialt ansvar 19 What we today know as ”universal services” was in Sweden called “regional and social responsibilities” until an adjustment of terminology to the EC Directive in 1997. 20 Prop. 1990/91:87 Näringspolitik för tillväxt
3232

mentioned in section 2.2. The bill also proposed that a new study of the particular conditions for reform of the postal sector be made.
Ministry of Communications studies on the competitive conditions of the postal sector, 199121
This study concluded that it was possible to maintain daily and nationwide service with cross-subsidies, because the Post Office had a natural monopoly. In the growth bill, increasing competition was identified as a danger. A pre-condition for meeting this competition was that the Post Office should be allowed to adjust its price structure in a more market oriented way in response to competitors that entered on profitable segments and pursued cream-skimming. The Post Office was expected always to be able to offer a lower price because of its economies of scale. According to that study, the supposed existence of a natural monopoly would not make it beneficial to have competition in the postal sector because the total cost for society would in that case increase. If two companies are to share the market, the estimated increase in cost would be around 20% according to the study. It was also stated that it was correct to continue to cross-subsidise in order to preserve regional responsibilities.
The study ended with a contradictory conclusion: despite the supposed natural monopoly character and increased costs with duplication, the monopoly on letters was thought to be removed. There is no detailed explanation to this conclusion, e.g. a reference to contestability. But the conclusion fitted well with the intentions of the Post Office to trade deregulation for becoming a public company with increased independence. A majority in a consultative procedure later supported the conclusion of the study. Because the Post Office could meet competition, thus avoiding wasteful doubling of production, competition ought to be introduced.
This was the first time the postal sector was described in terms of a natural monopoly. However, the basis for calculating the effects of having two firms appears to be very weak. Moreover, the conclusion of the report must be incorrect. If there was a natural monopoly and a competitor would enter the market with the same cost structure as the Post Office and the latter has additional costs for regional responsibilities (e.g. for the universal service in rural regions), the competitor would – according to traditional economic analysis - take over the whole market.
The conclusion that the Post Office would be able to meet competition in a liberalised setting accordingly cannot owe to natural monopoly, but to – historically founded - cost advantages compared to new entrants. Thus, the basis for proposing a removal of the monopoly in the study that solely referred to natural monopoly in the sector as a whole rested on incomplete understanding of the market.
At the same time, another study analysed the company form in the railway, telecom and postal sectors. The conclusion was that postal services were the least likely of the three to be privatised but that there was room for competition by outsourcing within the Post Office and in some sub-markets. The best organisational form for the Post Office was supposed to be a public, state-owned company, because the state had up to then failed to benefit from the advantages of the particular ’public enterprise’ company form.
21 Ds 1991:44 Postens Konkurrensförutsättningar. Ds 1991:77 SJ, Televerket och Posten – bättre som bolag?
33

The new non-socialist government’s bill on economic policy, autumn 199122
At the same time as the Ministry of Communication’s reports were presented, a new, non-socialist government was elected: a coalition between four parties and dependent on a fifth party for majority.23 In its first bill, it presented its general economic policy. Deregulation, competition and reducing the size of the public sector were important components of its policy. An exception, however, were sectors with natural monopoly character, as they were interpreted at that time. When making state companies public, natural monopolies should be separated, continue to be owned by the state, act neutrally and promote competition in adjacent areas. Considering the conclusions in the Ministry of Communication’s report, postal services were not the first on the agenda to be liberalised.
The new non-socialist government’s first budget bill, January 199224
A few months later, the new government presented its first budget bill. It included a new perspective on private ownership and business and a sharpened competition policy as means to end the recession in the early 1990s. In the postal sector, once again increased competition and new technology were noticed as changing conditions. It was suggested that the Post Office be transferred into a public company and in the future the monopoly be removed. Before that, the issue of regional and social responsibilities as well as the competitive conditions for the Post Office had to be resolved.
The non-socialist government thus carried on the agenda set forth by the Social Democrats and studied by the Ministry of Communications. The two salient issues were the regional and social responsibilities and how the Post Office should be able to compete “on equal terms”. The latter problem related to competitive disadvantages for the Post Office, as opposed to later when the Post Office has been blamed for its competitive advantages. The concrete result of the budget bill was that a new Government Commission was appointed to prepare for deregulation and find solutions to the two remaining problems.
The bill on removal of the letter monopoly, December 199225
As mentioned in section 2.2, the new operator City Mail went bankrupt in October 1992, but was about to re-enter the market with new capital. A legal process to decide whether it had infringed the legal postal monopoly was going on. That was not the most desirable situation for the company when raising new capital. Then, the Minister of Communications submitted a new bill in December. He reversed the policy from earlier the same year and stated that competition could be introduced even if the issue of social and regional responsibilities was not yet resolved. The bill covered only two pages and stated that the Government Commission had not completed its work, but it noted, referring to City Mail and another small operator, that there were contradictory signals concerning the competitive conditions. On the one hand there was a lawsuit against City Mail initiated by the Post Office. On the other hand, the government and the parliament promoted competition and a future deregulation of the
22 Prop. 1991/92:38 Inriktningen av den ekonomiska politiken 23 The non-socialist parties are The Moderate Party, The Liberal Party, The Centre Party and the The Christ Democrats (in order of size in the 1991 election). The fifth party was The New Democracy, who was only represented in parliament in the period 1991-1994. The other parties in parliament are The Social Democrats, The Left Party and The Green Party. 1994-2006, The Social Democrats have formed a minority government. 24 Prop. 1991/92:100 Budgetpropositionen 25 Prop. 1992/93:132 Vissa frågor inom Kommunikationsdepartementets område
3434

postal sector had been announced. The Post Office itself already wanted to get away with monopoly, which was regarded rather as a burden for the business strategy of the company. The Minister referred to the study made by the Ministry before, which had showed that competition ought to be introduced. Thus, the minister proposed the parliament that the monopoly could be removed even without any new legislation to replace it. The respective decision was taken in Parliament the last night before Christmas 1992 and the monopoly was removed shortly thereafter, on 1 January 1993.
The Government Commission on the new Postal Act, January 199326
When the Government Commission completed its work shortly after the monopoly was removed, deregulation had already started. The fundamental question about the postal monopoly was treated only in a single sentence in the report. “Free competition is generally regarded as a valuable means of making postal services as efficient as possible”. The removal of the monopoly and making the Post Office into a public company could be seen as steps in a process of making postal services more efficient and in making the state organisation better suited to meet competition from other private competitors. Focus in the report was on technical issues and the discussion of goals and principles very limited.
After a long period with a consultative procedure and the government’s bill, in which the reform was submitted to parliament, the second part of postal liberalisation in Sweden was completed in March 1994.
4.2 Postal policy goals after liberalisation
The preceding section has presented the existing evidence of goals and objectives of the reforms of the postal sector in 1993-94 and will be further analysed in the next section. In the new Postal Act from 1994, postal policy was entirely related to the universal service obligation, at this time called “basic postal services”. Moreover, basic financial services were considered a part of postal policy. The overall goal for postal policy was originally:
“Across the nation, there should be a nation-wide postal service meaning that letters and parcels can reach everybody regardless of address. There should be a possibility to have letters conveyed at uniform and reasonable prices. Private persons should also have the possibility to have parcels conveyed at uniform prices. In addition, there should be a nation-wide financial service meaning that everybody should be able to make and get payments at uniform prices.”27
The first revision of the Postal Act, 199728
When the Social Democrats returned to power in 1994, they soon started a revision of postal legislation. The changes were modest, however. The reform contained a minor extension of the scope of universal service and a licence requirement on new operators. A compensation fund requiring all postal companies to contribute by a small fee per letter to finance the universal service was proposed. The latter proposal did not pass the political process.
26 SOU 1993:9 Postlag. Quote from English summary on p 14, in Swedish on p 123. 27 SFS 1993:1654 28 Ds 1995:76 Post- och kassaservice åt alla, Prop 1995/96:218 Ändringar i Postlagen m.m.
35
The second revision of the Postal Act, 199829
Before the revision, the role of the state in the postal sector was discussed in a report from the Ministry. The role should be: to guarantee the universal service; to regulate the sector in order to develop the market and protect consumers; to carry out the ownership of Sweden Post in order to give yield to the state and fulfil societal responsibilities. The second revision was intended to reach a better fulfilment of postal policy goals and an adjustment to the new EU-Directive. The goal of postal policy was reformulated, among other things a separation between the service itself and the quality of service was made. The new version of postal policy is the one that is still valid today:
There should be a postal service throughout the country, meaning that everyone must be able to send and receive items of mail weighing a maximum of 20 kg. Postal services shall be of good quality and it should be possible to have such postal items conveyed at reasonable prices. For single piece mail, prices should also be uniform.
In addition to letters, also parcels, addressed newspapers, catalogues and books were included in this definition of postal items. However, the licence condition for parcel distribution was removed in this revision. Further details of this goal were specified in the Postal Act, the Postal Ordinance and in the licence conditions for Sweden Post (before 2001 in a special contract). There should be opportunities to insure items of mail and to receive confirmation from the recipient that the item of mail has been received. The operator should guarantee reliability and the protection of the sender’s and receiver’s personal integrity. The target for reliability for the universal service provider was that 85 % of overnight mail should be delivered the next day and 97 % within three days.
In this revision, the regulator (PTS) got a more specified responsibility to monitor the postal sector and to verify that the postal market was functioning in an efficient way from the consumer’s perspective.
The third revision of the Postal Act, 199930
The goals for postal policy from 1998 remained unchanged in this revision. It was entirely targeted at clarifying the rules concerning access to common services and facilities, called the postal infrastructure. The aim was to create better conditions for a more competition-neutral and shared use of the infrastructure. There had been ongoing operational conflicts between City Mail and later local operators and Sweden Post. They concerned what City Mail had named the postal infrastructure. There were several areas of conflicts. One concerned the postal code system that was invented by the Post Office in 1968 as a means to facilitate sorting. New operators had to take the system for granted, but they had problems to obtain their own number series for their own needs, for example for postbox mail. Sweden Post had also made several changes in the numbers in the network reform in 1996, which caused a lot of complaints from addressees as well as other government authorities, insurance companies etc. who used postcodes for administrative purposes. Another problem concerned the price and access conditions to the post office boxes owned by Sweden Post. A third area was forwarding of incorrectly addressed mail. Sweden Post complained that it had to deliver mail that was paid to other operators. The ownership and administration of a national address file
29 Ds 1997:58 Statens ansvar på post- och betaltjänstområdet, Prop. 1997/98:127 Statens ansvar på postområdet 30 There is no Government Commission or report from the Ministry to prepare for this revision, but there are a couple of reports from PTS (1996, 1998). Prop. 1998/99:95 Postal infrastruktur.
3636

company was also contested. It was originally created by City Mail, subsequently bought by Sweden Post when City Mail failed. Now, all new entrants needed to use its services, because households should only need to report to one place when they changed address.
The reforms in 1999 concerned the postal code system: the control of the system was first suggested to be shifted to PTS but it was eventually decided to remain under the control of the universal service provider (i.e. Sweden Post). It got obligations to consult other involved organisations before changes in the system and to give new operators required series of postal codes. Moreover, the access to post office boxes should be on reasonable and non-discriminatory terms. Two other issues were discussed: the use of the address file company owned by Sweden and conditions for forwarding of mail. These two issues were solved by agreements between the operators, with the regulator PTS as mediator, and did not have to be included in legislation.
It is notable that the reform in 1999 does not treat the issue of regulation of access to the network of Sweden Post. It only concerns what is defined as the ‘postal infrastructure’. Despite the existing theoretical foundations, access regulation in the postal sector does not appear on the agenda until after it was introduced in the telecom sector.
Later extensions of postal policy
As noted above, postal policy goals have been limited to deal only with the universal service. In the Government’s budget bill 2001, postal services became part of the policy area “IT, electronic communication and mail”. The overall goal for this policy area was that:
“Everyone shall have access to an infrastructure and the related services that are efficient from a society’s viewpoint and long-term sustainable”
This is the first time an explicit efficiency goal was formulated for postal policy. In addition to the overall goal for the entire policy area, there was a specific goal for each area. For the postal area, the goal remained the same as in the Postal Act from 1998, quoted above.
In the latest Letter of Regulation for the regulator, PTS, the state expresses (somewhat differently) the goal for the postal area as follows:
”Everyone in the country shall, at reasonable prices, have access to efficient and reliable postal services of good quality, through well functioning national and international markets”.31
The Government Commission for postal and financial services, January 200532
The Government Commission in 2005 proposed no change in the scope of the USO or the defined quality of service. It rejected Sweden Post’s suggestion that the USO only should cover single piece mail. The internal policy of Sweden Post for its precise application should be replaced by official guidelines from PTS. The company which provides the services should, according to the Commission, use clear and non-discriminatory prices for USO services. Individual contracts for bulk mail should be allowed, but only if differences in price
31 Letter of Regulation for PTS 2006. http://www.pts.se/Archive/Documents/SE/Regleringsbrev_2006.pdf 32 SOU 2005:5 Postmarknad i förändring. As of August 2006, no government bill has been submitted to the parliament following the Commission’s report in January 2005.
37

are based on cost differences for different clients. Contracts should be non-discriminatory, i.e. contracts with clients where the cost structure is equal should have the same price. Any commercial price discrimination should, according to the Commission’s proposal not be allowed. This would be a more strict application of non-discriminatory prices than today but difficult to control, because contracts with clients are business secrets. Uniform prices should continue only to be required for single piece mail. The Commission hints that the scope and cost of the USO can change in the future if postal volumes decline and the time-sensitive mail moves to other forms of communication. Some USO services could then be subject to public tendering, but the Commission estimates that this will not happen in the medium term.
Postal and financial over-the-counter services have both always been included in postal policy. This Commission presented two separate reports, one for each service; it proposed a complete separation be made and the financial services that the post offices used to provide be moved into the banking sector. Below, only the Commission’s report on the postal sector is discussed.33
The background to the Commission was that ten years had passed since liberalisation and it was about time to study its effects, particularly since some other liberalisations in Sweden had been criticised for being unsuccessful. In the terms of reference to the Commission it was stated that the goal of removing the letter monopoly ten years ago was to open the market to free competition in order to create a more efficient postal business at reasonable prices. The outcome was already in the terms of reference said to be positive. However, it was also concluded that the effects have not fully reached the collective of consumers. This conclusion referred to the cost-adaptation of prices that will be analysed later in this report. The report also noted that Sweden Post remained the dominant actor and that the number of competitors was decreasing compared to some years before. Also, the profitability of Sweden Post was declining.
PTS had in previous reports pointed at some technical issues as well as at potential barriers to entry. Among other things, the Commission was supposed to make a study of the effects from the perspective of total welfare in society to see if the goal of liberalisation has been reached. (see further chapter 5 in this report, here only policy issues are in focus). The Commission should propose changes in postal policy if needed, discuss the role of different authorities, the price regulation, co-distribution of mail and newspapers, entry barriers and other technical issues.
The Commission concluded that the postal market was in rapid transition, that declining volumes might contest the scope of the USO, that liberalisation had overall positive effects although actual competition was weak in many areas, that co-distribution of mail and newspapers should not be regulated and that current price regulation needed reform. Concerning postal policy, the Commission found a need to extend the scope of postal policy to go beyond the universal service obligation. This conclusion was influenced by the new Electronic Communications Act from 2003, which took a broader perspective on that market and the scope for policy. The Commission proposed the following goal for postal policy:
Access shall be available to a broad supply of postal services at prices and quality corresponding to customers’ demands. From an international perspective, Sweden shall be in the forefront in these respects. Postal services shall be sustainable, customer adapted and
33 The issue of financial services is treated in section 7.5.
3838

accommodate future needs.
An important means of achieving this will be to create the preconditions for effective competition between several actors, without distortions and unwarranted34 restrictions. The Government shall guarantee that everyone has access to universal postal service of high quality and at reasonable prices”.
The proposed new goal differs in a number of aspects from the current one from 1998. The range of products for which the goal is supposed to be valid is defined much broader: not only products belonging to the USO but also all parcels, unaddressed advertisements, newspapers and magazines are included. The USO, however, is basically supposed to cover the same range of products as today and the more precise definitions and quality of service to be defined separately. The Commission also opens for the possibility to readjust the extent of the USO downwards if the demand for postal services, particularly overnight mail, will continue to decline.
Customers’ demand is for the first time explicitly to be taken into account, concerning prices as well as quality. Postal services are supposed to be long-term sustainable, which is an adjustment to policy goals in general in Sweden. It means that current and future generations are to be ensured a good environment.
For the first time, postal policy is also proposed to explicitly include an efficiency goal. The policy is supposed to create preconditions for effective competition, whereas actual competition shall be left to market actors. Legislation shall be without distortions and unwarranted restrictions, meaning that terms in general shall be non-discriminatory and not restrict the market, when it is not necessary for other reasons.
Policy is given a much more precise direction than the previous general idea of “free competition”, and takes into account the fact that all postal legislation is a kind of restriction in order to safeguard from market or allocative failures. The Commission believes that this policy will raise growth and welfare in society. Large gains for society can be achieved by having efficient and flexible communications with effective competition in as many parts of the postal market as possible.
4.3 Goals for the Post Office/Sweden Post
The management of the Post Office35 (later Sweden Post) was already in the 1980s concerned about falling volumes and profits in the letter business because of threats from new firms and new technologies. The adopted strategy was to aggressively meet competition in the letter business and simultaneously reforming its other businesses: expanding internationally in the entire logistics sector, reform the unprofitable network of post offices and co-operate with a major bank. This required independence from the state and management wanted to become a public company. The letter monopoly was not considered to give much protection and was thought to be difficult to defend if its commercial freedom should be increased. The Post Office management believed that if it obtained the freedom to meet competition in the letter business, its economies of scale would be sufficient in order to defend its market share.
34 An alternative translation from Swedish (omotiverade) than in the English summary of the report is ”unjustified”. 35 This section builds on Andersson (2001).
39

The government’s goal for the Post Office36 has been related to the yield in combination with societal goals. The Social Democratic government in 1990 formulated the goal for the Post Office: “The Post Office shall carry on in its business in an effective way so as to facilitate its financial survival on its own”. The average annual yield should be 5 % of the revenues. There was in addition a service goal that a basic postal service should be available across the country at reasonable prices. In principle, all first class mail should be delivered over night. In 1992, the financial goal was modified. The Post Office’s adjusted own capital should grow annually by 15 % and the yield to the state should be 5 % of adjusted own capital.
After liberalisation, the goals for the USO were included in the Postal Act and no longer in the goals for the company. The primary financial goal for Sweden Post was to give a return on its capital and a yield to the state comparable with successful firms in similar businesses. The Ministry of Communications specified the goal to be return on capital after tax of 11-13 %. Due to adjustment costs mainly for including pension payments and of liberalisation, a lower return and no yield to the state was accepted 1994-96. Thereafter, the yield ought to be the same as an average of the 16 companies with the highest turnover at the Stockholm Stock Exchange, in practice 3-4 %. In 1997, the goal for the yield was slightly adjusted and should not be valid until Sweden Post had reached sufficient solvency. After liberalisation, Sweden Post had adjusted to former deficits in the distribution of newspapers. A dept for pension payments was added to its balance sheet and a VAT was added to postage in two steps (12% in 1994 and 25% in 1996).
In 2004 the owner’s financial goals were modified. It is underlined that because Sweden Post is active on a “free and deregulated market”, the goal for profitability must be market-oriented. However, the owner must also consider the universal service requirements and the special conditions under which Sweden Post is carrying on its business. The return on capital shall be “ambitious and realistic”. The goal is a 10 % return on the net result in relation to average own capital; the solvency shall be at least 25 % and the yield 40 % of the net result.
4.4 An analysis of the development of postal policy goals
The study of goals for the postal sector in Sweden shows that five different types of objectives can be identified. They will be presented in this section, together with a few international comparisons.
1. The first type of goal to be found is a goal related to economic growth. This appears for the first time in the Social Democrats’ bill for growth in 1990. By changing the competitive conditions and the organisational form of the Post Office, the postal sector will contribute to ending the problem of low growth. The goal remains in the non-socialist government’s first bills. Deregulation and introducing competition into monopolist markets in general are regarded as means for stimulating growth. The problem to solve is on a macroeconomic level and not specifically related to the postal sector, it only happens to be one of the sectors pointed out as targets for reform. This goal disappears in Sweden after 1991 but is briefly mentioned again in the Government Commission from 2005.
36 This section builds on Statskontoret (2004).
4040

This goal is recently included in the liberalisation process in the EU. After the amendment of the EU Directive for postal services in 2002, the agenda of the Lisbon process has entered the postal sector. One of the arguments for liberalisation of postal services among the EU countries is to contribute to fulfilling the Lisbon strategy and thereby stimulation economic growth in the EU. For the EU, economic growth enters as a goal ten years later than in Sweden.
2. A second type of goal that is persistent throughout the whole period is the goal related to allocation. This is the classical scope of postal policy: the universal service obligation. It has a geographical dimension – everybody across the country should have access to daily collection and delivery – and an income dimension – prices should be reasonable and for single piece mail uniform. Even if the precise definition of the USO has changed in Sweden, the fundamental concept remains although in the Government Commission from 2005, a possibility to relax it in the future is opened. Notably, this is the only goal for postal policy in Sweden since liberalisation.
This goal is also included in the EU Directive on postal services as well as in most countries’ national legislation; the EU allows for different national definitions of the USO. The difference between Sweden and most other countries is that elsewhere, the provision of the USO has been the obstacle for not liberalising the market. In Sweden, the Post Office argued already in 1990 that there were no conflicts of goals and owing to its economies of scale it would be able to provide such services even better in a deregulated environment. So far, this has also turned out to be true. Sweden Post in fact claimed that it was deregulation that made it possible for the company to meet competition from new firms and new technologies that threatened its future profits. Before the Government Commission in 2005, Sweden Post continues to claim that it is possible to provide USO without compensation, at least in the near future.
3. A third type of goal, which has obtained attention only recently is a goal related to economic efficiency. Remarkably, this goal is not explicitly in focus as a goal for liberalisation in Sweden. The preceding analysis in the Ministry’s report from 1991 was rather poor and based on incomplete understanding. After the monopoly was removed, the issue was uninteresting and the Government Commission who prepared the new legislation treated it in a single sentence. Unlike liberalisation going on in many countries in the 2000s, in Sweden it was never thoroughly analysed in terms of market efficiency. Recent statements that the goal for liberalisation was to increase efficiency must be seen as later constructions considering the lack of evidence in the original sources.37
Economic efficiency enters the postal sector as a general goal for IT, electronic communication and mail industry in 2001. As of 2006, it is not included in the postal policy. However, the Government Commission in 2005 proposed a new postal policy in which efficiency is an important goal for the sector.
Economic efficiency is equally not in the focus in EU liberalisation. “Efficiency” is not mentioned in the Postal Directive. There, the aim is to establish an internal market and to improve quality. Quality is of course related to efficiency, but can also be achieved at the expense of efficiency. In the Postal Directive from 2002, reference is made to the Lisbon
37 This proposition is to be found in the terms of reference to the Government Commission in 2005 as well in some reports from PTS.
41

declaration and macroeconomic growth rather than microeconomic efficiency. Moreover, postal services are one of the “Services of General Interest”, for which no less than thirteen different objectives are identified.38 Only one of them is efficiency; different aspects of availability are more in focus and there are obvious conflicts of goals. Thus, in liberalisation of postal services in the EU, thereis no explicit efficiency target.
3a. Economic efficiency is measured by the sum of consumers’ and producers’ benefits. Connected to economic efficiency is a goal related to the benefits of the consumers. Other things being equal, increased benefits for the consumers contribute to efficiency. But an increase in consumer surplus can also be at the expense of producer surplus and welfare remaining unchanged. When a monopoly is removed, two things normally occur: a shift from producer’s to consumer surplus and an increase in total welfare. If, however, the monopolist was regulated and not profit maximising before liberalisation, there might not be any shift in producer to consumer surplus. Consumers can benefit in other aspects: the range of products offered and the quality of service can be better adjusted to what consumers demand.
In Sweden at the time of liberalisation, the benefit of consumers was not the prime goal. However, concerns for consumers resulted in the price cap in order to protect households and later other postal consumers from price increases for products where competition lacked.
Later, the Competition Authority showed in its decisions in the second half of the 1990s concerning the competition by means of price of Sweden Post against City Mail a more explicit concern for consumers. Currently, the Competition Authority has adopted as its vision and general goal to maximise consumer surplus.
The regulator PTS has the goal to monitor the market and protect the interests of the consumers. Thus, it’s goal is limited to consumers and not efficiency in general. It has proposed that the goal be extended to promoting competition.
In the Government Commission’s proposal for a new postal policy, consumers’ demand is lifted to the first sentence, but overall efficiency is also included in the suggested policy, so consumer surplus cannot be regarded as a superior goal.39
3b. The other subordinate goal to economic efficiency is a goal related to the benefits of the producers. This was crucial both at the time for liberalisation and later. First, the future profits and business opportunities of the Post Office were found to be threatened and liberalisation was for the Post Office management and later the politicians the solution to let the Post Office compete on equal terms. Later, in 1992 when City Mail was about to re-enter the market, the Minister of Communications changed policy in order to rescue the only possible competitor on the market.
Both the Social Democrats and the non-socialist parties expressed concerns about the public sector in general and the best organisational form for businesses belonging to the state. For
38 EU (2003). The Economic and Social Committee declares that “[t]he primary objective of services of general interest is access for all citizens, consumers and businesses to public services; when such services are provided by a publicly or privately-owned enterprise operating in the commercial sector, the profit- or competitiveness seeking criterion must under no circumstances be allowed to result in the disappearance of services for some citizens” (EESC 2003,p 44). 39 Regulators in different countries are given different focus. In the UK, Postcomm has as the explicit target the benefit of the consumers.
4242

the non-socialists it was also a question of the overall size of the public sector and a wish to reduce bureaucracy and unwarranted regulation.40
Throughout the whole period, the state has also formulated goals for the Post Office, later Sweden Post, in its capacity as the owner. There have been several targets for the yield as well as other responsibilities. Repeated adjustments indicate that the financial goals have been difficult to reach. Already in 1995, the parliament’s auditors complained that there ought to be clearer goals and guidelines for Sweden Post’s businesses. The Government Commission in 2005 as well as the Commission on Liberalisation (2005) criticised the state for having unclear objectives for Sweden Post and conducting a weak ownership.41
In some instances, the regulator PTS has taken the new entrants’ interests as a goal. The most recent expression of that is that PTS opposed the removal of the price-cap for single piece mail that is proposed by the Government Commission in 2005. The Commission suggested to have it replaced by access regulation and the prohibition in the Competition Act for dominant firms to set prices below costs, similarly to the EU Directive that states that prices for universal services shall be cost based. However, PTS sees the risk that Sweden Post will nevertheless cross-subsidise competitive segments with price increases in areas where Sweden Post today has monopoly. To protect Sweden Post’s competitors, it argues that the price-cap on single piece mail be continued.42
4. A fourth type is a goal related to the environment. It enters together with the efficiency goal in the budget bill 2001 as a general objective. It is proposed by the Government Commission in 2005 to be included in the postal policy objective. This objective is now a standard one in Sweden. It has not as yet led to any significant change in the market.
5. In the EU Directive, the goal related to the internal market is the prime objective. There is no corresponding goal in Sweden.
There are potential conflicts of goals. The classical conflict is between the goal related to allocation (2) and the other goals. If liberalisation is believed to improve goal (1) and/or (3), the reason why it is not carried out is that it conflicts with the goal related to allocation and the universal service provision. However, in Sweden, there is almost consensus that no such conflict exists.
Sweden Post always claimed that it is able to provide universal services with competition under certain conditions. Rather, if competition results in higher efficiency, it will facilitate the provision of universal service. It is contested whether there is a financial burden or not for the USO. PTS states that there is no such burden at all. The Government Commission in 2005 as well as some international studies indicates that they exist but are small. It is commercially justified to provide all or most of the universal services.
There is no conflict between goals related to economic growth (1) and economic efficiency (3). There is only a difference in focus. The former is macroeconomic and the problem to
40 In some countries like the Netherlands and Germany, the goal appears to have been similar to the ones that the Post Office expressed around 1990. The Posts have expanded their businesses to other areas and to other countries, although in these countries legal protection of the domestic letter monopoly has remained. 41 SOU 2005:5 and SOU 2005:4. 42 PTS (2004) and SOU 2005:5 p 380-381.
43

solve is low growth and welfare in the economy as a whole. The latter is microeconomic and the problem to solve is an inefficient postal sector per se.
The conclusion of this policy-analysis is that Sweden liberalised because two goals were in focus: economic growth and the benefit of the producers, and particularly the second one. Changing market conditions in the form of a long-term shift from hand-written messages to businesses printed bulk mail and new technologies both inside and outside the postal sector created a threat to the old Post Office. In order to meet new competition together with a vision to compensate losses in the letter business with diversification into other areas, a new regulatory environment was found necessary. When the ambition to rescue the new competitor City Mail coincided with the interests of the Post Office, liberalisation became feasible. The recession, the ambiguous construction of the letter monopoly that allowed City Mail to enter, the unique strategy of the Post Office management and positive attitudes to deregulation from both non-socialist parties and the Social Democrats are all factors that distinguish Sweden from other countries and explain why Sweden liberalised almost twenty years before the EU.
In the beginning of the chapter, it was pointed out that market, allocative and regulatory failure can be reasons for deregulation. The allocative failure has been important throughout the period: the concern for universal service has been the sole foundation for the official postal policy, until the proposed amendments in 2005. Unlike other countries, the allocative failure has not been a sufficient explanation to preserve monopoly in Sweden. Rather, liberalisation was interpreted as a necessity to protect universal service.
Market failures were not the original reason to have a state monopoly. Postal services originated as an internal state activity when it needed to communicate with its distant provinces. Only in 1991 the question appeared whether postal services form a natural monopoly. At that time, the conclusion was that the sector can be liberalised despite the natural monopoly character.
Regulatory failures were considered a different kind in Sweden. The Post Office was not considered inefficient at the time for liberalisation; rather it was the opposite. In international comparisons, the Swedish Post Office was a relatively efficient operator.43 Neither was the case that the company made too much profit and therefore ought to be exposed to competition. It is true that the Post Office was profitable (and that the letter business of Sweden Post has been since liberalisation) but not to the extent that it was regarded as a problem. The regulatory failure was that future profits and opportunities to provide USO were threatened to be eroded by competition that the Post Office was not able to respond to. The ambiguous construction of the letter monopoly (which was not considered to protect the bulk of letters) and the company form were not the optimal regulatory regimes. Before liberalisation, the position of the Post Office was threatened. After liberalisation was completed, its dominance has instead been seen as a problem. Only then, the concerns for competitors as well as consumers have appeared as important, and in the 2000s also overall efficiency and total welfare.
43 Ds 1991:44.
4444

5. The effects of liberalisation on the postal market
In this chapter focus is moved from the goals of liberalisation to its effects. As mentioned in the beginning, it is analytically difficult to make an evaluation of its results. First, the effects of liberalisation are difficult to be separated from those who depend on other factors such as change in demand and in technology within and outside of the postal market. Second, chapter 4 showed that in Sweden, there were no clear and well-defined goals of liberalisation initially – it was not entirely clear what problems ought to be solved. Neither has postal policy had a clear focus since. Therefore, it cannot be evaluated if liberalisation was successful in the sense that announced goals were reached. Third, since liberalisation strengthened competition, today’s actors are more unwilling to disclose information than the old Post Office was. Therefore, developments in employment, prices and other areas are very difficult to follow for the postal sector as a whole. For example, list prices in the postal market are subject to large discounts for large customers today. However, these discounts are a business secret.
5.1 Expected effects of postal liberalisation
It is evident that the expected effects vary substantially between countries depending on economic factors, the design of regulation, the strategic behaviour of the Post Office and the market’s performance.
Market structure
Will there be entry when the legal monopoly is removed? Studies from other liberalised markets show that there are initially often many new entrants. Depending on the economic conditions, foremost existence of scale and scope economies, the number will subsequently decline. In sectors with nearly constant returns to scale like the taxi sector, many firms remain. Large-scale industries like the postal sector, marked by economies of scale and scope, will never have many operators on the same submarkets. New firms can fail because of lacking business opportunities. Alternatively, they merge or are taken over. Even if some parts of the postal sector were a natural monopoly, some entry may occur also in those parts. From an economic perspective, such entry is not always efficient. Nevertheless, entry can be economically important for testing the prices of the incumbent also in monopolistic areas and can contribute to dynamic efficiency in the long run.
The postal industry is traditionally strongly vertically integrated. The Post Office carries out all stages of production: collection, sorting, transportation and delivery. However, in the past decades some disintegration occurred: senders pre-sort mail (worksharing) and in some countries there is a big business of mail consolidation and transportation, which is subject to bidding for contracts. Delivery is the only core activity of postal services and represents at least half of total costs. It is difficult to determine the impact of liberalisation on the production chain.
Market performance
The first effect of liberalisation will be on prices. When competition is introduced, monopoly gains will diminish and prices will go down. However, often the monopolist is a state firm
45

who does not maximise profits. Rather, it is regulated to price at average cost.44 Competitive pressure will also lead to higher internal efficiency, so productivity rises due to interaction of more efficient new and old firms. In some instances the most important effect is that inefficient organisations get incentives to become more efficient. Production costs may also decline because of lower input prices if there was a wage premium in the sector before liberalisation.
Another expected effect is not on the average price level, but on the price structure. Postal prices in countries with state monopolies are often too uniform from an economic perspective, even if cross-subsidies for the USO are disregarded. This uniformity leads to a certain allocative inefficiency.45 If the postal sector is liberalised, competitors will enter in segments where price margins are high and hence, prices will be adjusted to costs. In many cases large changes can be expected.
Furthermore, innovation can be expected to increase if the firms regard it as a means to improve their competitiveness. Competition means that other firms can take over profitable market shares, even when the incumbent benefits from economies of scale and scope. The incumbent is thus forced to innovate in order not to lose those market shares. On the other hand, if firms lose market power, the gains from innovations can be reduced, at least if they can easily be replicated. The effect on innovation is likely to be positive in a competitive oligopoly compared to a situation with a legal monopoly.
The same concerns quality of service. It depends on the situation before liberalisation. Usually, one would expect quality of service to go up in response to competitive pressure. However, in the initial situation quality can also be too uniform from an economic perspective. A monopolist could focus on high-priced and high-quality products. Customers looking for lower-priced products would be forced to pay for a too high quality. This means that before liberalisation, the quality level would be higher than what consumers would be willing to pay for if they could choose between two alternatives. An instructive example is the airline sector, where new entrants today successfully provide lower quality at lower prices, while before liberalisation only high-quality expensive services existed. Rather than generally leading to higher quality of service, liberalisation will be adjusted and diversified to meet different consumer’s preferences.
5.2 Market structure
Entry
City Mail started its business in central Stockholm already in 1991, two years before liberalisation. It went bankrupt twice, in 1992 and again in 1995 after first being bought by
44 In Sweden, usually public enterprises are given a goal for the yield to the state for some kind of “normal” profit. It is a kind of rate of return regulation, but in many cases it serves as a desired maximum target because the businesses are making losses. In recent years, some state owned companies, particularly the one in the electricity sector have made large profits. The regulation of the goal for state owned companies is often vague, which was discussed in the previous chapter. 45 There are also transaction costs if prices are too complex. It was the simple idea of Sir Rowland Hill already in 1840 to replace a distance-based postage with a uniform postage. But he advocated two prices: one for local and one for national mail (Crew & Kleindorfer 1991). Every mail item is unique, but there cannot be a unique price for each letter. In finding the optimal balance between simplicity with low transaction costs and prices geared to costs, the price structure in many non-liberalised countries has become too uniform.
4646

Sweden Post. It restarted business in January 1996 with new capital and has increased volumes and improved its profitability since. However, the company made losses in each of the first ten years, turning profitable for the first time in 2005. Today it delivers to almost 40 % of Swedish addressees and has a market share of 12 % of the national bulk mail market, which is around 30 % of the market in the area it operates. The second largest new operator has been SDR. The company mainly delivers unaddressed advertisements, mostly on weekends using low-cost labour. As a side activity it also delivers some addressed items.
In the first years, a couple of small local operators started business. In late 1996 and 1997, a wave of new such operators emerged. It was a combination of high unemployment, price increases by Sweden Post and widespread information about new competitors to Sweden Post that led to further establishments. Their business idea has been to deliver local mail, often within a small town with a limited rural environment. Customers are mainly local businesses and public authorities, but many of them also sell stamps and have street boxes to generate mail from households. The local mail market is estimated to be 15 % of all mail. Some new operators are firms with other delivery activities like morning newspapers, express mail and parcels. Most of the successful firms, however, have focused only on mail delivery. It appears that the economies of scope between delivery of mail and other items in this local market are very limited. Some operators in adjacent cities have attempted to create a network with exchange of mail in order to establish regional networks. Such attempts have usually failed because of organisational and financial difficulties. The firms are so small that any extra arrangements are costly and when mail flows are uneven, a system for dividing revenues must be created.46
Figure 5.1 shows the number of postal operators with a licence from PTS and the estimated number of active firms each year since 1995. A number of licence holders never actually started business. Some firms have overestimated the business opportunities, others may hold on to the licence in order to scarce off other potential newcomers if they eventually will start business.
Figure 5.1: Number of licensees and active postal firms 1993-2005
Number of licencees and operators
0
20
40
60
80
100
120
1993
1994
1995
1996
1997
1998
1999
2000
2001
2002
2003
2004
2005
Number of licencesNumber of operators
Source: SIKA Postverksamhet 2005
46 Andersson (2000)
47

Note: The number of licences is measured by end-of-year and number of operators during the year. Thus, the number of operators can exceed the number of licence holders.
Entry occurred in two segments: bulk mail from the whole of Sweden to the most populated areas (City Mail, SDR) and local mail within some small towns. The number of new firms exceeded the expectations in 1993; the Government Commission anticipated only a “handful” new companies. There has been a substantial reduction in the number of local operators, from around 100 down to a stable number of around 30 and volumes of the local operators are nearly half of the peak in 1998. The reason is not only lack of profitability. Another explanation is the vulnerability of very small firms. Unexpected demand fluctuations, losses of an important client and inability to combine mail delivery with other business are other explanations. Such a simple thing as to carry on business becomes impossible if the single owner, who is the only person to know the delivery routes, becomes ill. Before the amendment of the Postal Act in 1999, there were also problems with access to Sweden Post’s post office boxes that made business more difficult.
Over time, Sweden Post has gradually lost market share to City Mail while the local operators keep a very small fracture of the market. The loss of volume in the market for addressed items is currently at least as important for Sweden Post as the loss of market share. Its current volume has returned to the level of around 1990.
Table 5.1: Volumes (million addressed items) and market shares 1996-2005
1996 1997 1998 1999 2000 2001 2002 2003 2004 2005SwedenPost
3361
98.2%
3311
96.4%
3275
95.6%
3247
94.2%
3266
95.3%
3148
94.4%
3100
93.7%
3037
93.0%
2996
91.9%
2950
91.8%CityMail
51
1.5%
55
1.6%
151
4.4%
164
4.7%
149
4.3%
175
5.2%
193
5.8%
216
6.6%
251
7.7%
254
7.9%Other 9
0.3%
19
0.6%
20
0.6%
14
0.4%
14
0.4%
14
0.4%
14
0.4%
14
0.4%
11
0.3%
11
0.3%Source: www.pts.se. Volume statistics are missing for other operators before 1996.
Two questions remain. First, why do the local operators with prices 25-40% lower than Sweden Post not win the entire local market? Explanations are lack of trust in new operators as well as insufficient marketing from the new entrants and costs for dividing the local mail from the rest. Large firms also might get larger discounts if they give large contracts to a single market player, which can then only be Sweden Post or sometimes also City Mail.47 The second open question is why entry ceased since 2001. Around 30 small local firms have indeed been successful and are profitable. Rational entrepreneurs in other locations would probably be able to enter successfully, particularly when there are other operators to learn from. The conditions for starting business are in fact somewhat better now than in 1997 when access to the postal infrastructure started to be regulated. If postal consumers are rational, there must be high switching costs or a risk premium for choosing alternative providers, or they do have insufficient information about the alternatives. Considering the publicity new operators obtain, the latter explanation is not likely.
47 Andersson (2000).
4848

However, counting the total number of operators in the country gives an incomplete picture of the market structure. If one studies the number of deliverers in a certain place, there are only two firms (Sweden Post and City Mail) for 40 % of the addressees, Sweden Post and a local firm for around 1 % and only Sweden Post for the rest of the country. Even with a few more hundred local operators, Sweden Post would be the only firm in most places. The postal market has followed the typical path for liberalised markets with a short upraise in the number of firms.
Vertical integration
The previous section dealt with horizontal (dis-)integration; entry has occurred, but Sweden Post maintains over 90 % of the total market. A lot more has happened in the vertical production chain. Most of the bulk mail today is pre-sorted, which means that senders of mail take over upstream production and enter downstream, letting the postal operators deliver. So, the natural monopoly hypothesis does not uphold for upstream production for pre-sorted mail.
The development of this market was spurred by liberalisation. A pre-condition is the advances in technology. Postal monopolists in some non-liberalised countries partly also allow downstream and upstream entry. In the USA, worksharing in the form of preparing the mail before bringing it to the postal operator started over 50 years ago and later discounts for preparing and pre-sorting were offered. In many other countries, on the other hand, down- and upstream entry is currently not possible.
When City Mail entered in 1991, Sweden Post did not have a discount for pre-sorted mail. City Mail offered a new and innovative product. Thus, liberalisation stimulated efficiency by introducing pre-sorting in Sweden earlier than otherwise. Hence, prices for pre-sorted mail were lowered earlier thanks to liberalisation. And liberalisation might also have been the trigger for creating the idea.
Furthermore, Sweden Post has outsourced some of its activities, particularly in the transportation stage, which is subject to procurement. This further contributes to the vertical disintegration in the industry. A modern management of a state monopolist would have acted in the same way, but liberalisation and competitive pressure may have contributed to using this efficiency-enhancing potential earlier. Sweden Post has also responded to competition by entering into other firms’ internal mail departments. It offers services to take over internal mail functions with its experience from the postal sector. It has also in 2006 bought the largest upstream firm, Strålfors, which prints and envelopes pre-sorted bulk mail.
Thus, the industry is subject to vertical disintegration. This change may have been stimulated to take place earlier and also prices were probably lowered to a larger extent than without liberalisation. However, the current difference to many other non-liberalised countries is large, even if such worksharing discounts exist in a few of them. Whether Sweden Post would have introduced lower prices for pre-sorted mail without market opening is impossible to know. Considering the radical changes in prices and productivity to be described below, the effect is clearly stronger and occurred earlier than it would have without deregulation.
49

5.3 Market performance
Products and volumes
There are many different postal products. One distinction is between bulk mail and single piece mail. Both are divided into first class (overnight delivery, priority mail) and second class (within three days, non-priority). For single piece mail, there are weight limits: the postage increases at 20, 100, 250, 500, 1000 and 1500 g. The postage for a first class 20 g letter 2006 is 4.40 SEK48 and for 100 g 8.80 SEK. For each new step the postage increases with 8.80 SEK. A discount of around 10 % can be obtained for those who acquire a stamping machine or if the mail is paid by invoice. For a second class 20 g letter, the postage is 4.20 SEK. There is a special postage for high quality mail (express delivery, insured). Non-governmental non-profit organisations have a reduced postage, for second class up to 100 g it is 4.20 SEK.
Bulk mail is also divided into first and second class. For both categories, there are different prices for unsorted mail, sorted mail and sorted mail for delivery in the 19 largest towns in Sweden. The minimum quantity to obtain the price for sorted bulk mail is 10 000. The postage for bulk mail is determined by a combination of a fixed price per kilo and a price per letter. Thus, the postage is not increasing in large steps depending on weight as for single piece mail. Since 2001 Sweden Post offers a special price for local bulk mail. For a minimum of 250 items of local mail the price per letter is 4.00 SEK. This is an attractive price for local authorities and businesses and competitive with the prices of local operators.
There is also a third class of mail. In the 1980’s, the Post Office offered ‘mass letters’, a product with lower price particularly for heavier letters and delivery within 3-7 days. Today, the corresponding product is addressed direct advertisement (ADR). It can only be used for selling messages, material for consumer relations and societal information and with the same content for all addressees. There is a ‘budget’ and a ‘standard’ product; the latter has a guaranteed day of delivery. The standard product is about 20 % more expensive and the price for ADR is 5 % higher during the last week of the month (the peak period).
A fourth product is delivery of magazines, which comprises almost 10 % of the letter volume. Sweden Post has 90 % market share in this area and offers first and second class delivery.
Letter volumes in Sweden increased until the second part of the 1990s, then they have peaked and in the past few years fallen. There are different drivers for postal demand. First, there is a general increase in communication, and demand for postal services has for a long time followed the GDP-trend. Postal services are also subject to substitution, in the past the telephone and telefax. In the last decade internet and e-mail became a major substitute to many postal products. Second, the changes in prices that were observed in the last section as
48 All prices are given in SEK exclusive of VAT (if not otherwise stated). The prices for the individual consumer of stamps are inclusive of a 25 % VAT. Then, the price for first class is 5.50 SEK and for second class 5.00 SEK. Companies can deduct VAT. Only small businesses buy stamps, otherwise it becomes profitable to rent a stamping machine or to use postage-paid envelopes.
5050

well as changes in quality are other main drivers for volume. Thus, it is difficult to isolate the effect of liberalisation on volume.
Table 5.2 shows the development of postal volumes in Sweden since 1993. There are two sources: SIKA (Swedish Institute for Communication Analysis) is responsible for the official statistics and carries out annual surveys of all firms registered in the relevant SNI-codes. PTS has statistics of all licensed operators. In the table, figures for unaddressed items are also included. Even if figures differ between statistical sources, the trend is clear: addressed volumes peaked in the years 1996-2002 and are now falling. On the other hand, unaddressed mail is constantly increasing.
Table 5.2: Postal volumes 1993-2005 (million items)
1993 1994 1995 1996 1997 1998 1999 2000 2001 2002 2003 2004 2005
SIKA 3467 3576
+3.1%
3578
+ 0%
3575
-0.1%
3558
-0.5%
3548
-0.3%
3266
-7.9%
3604
+10.3%
3262
-9.5%
3087
-5.4%
3034
-1.8%
PTS 3289 3339
+1.7%
3369
+0.8%
3421
+1.5%
3436
+0.4%
3424
-0.4%
3446
+0.6%
3426
-0.6%
3334
-2.7%
3307
-0.9%
3267
-1.2%
3258
-0.1%
3214
-1.3% SIKA:unaddre-sseditems
1521
+3.5%
1575
+3.5%
1756
+11.5%
1865
+6.2%
1953
+5.2%
2961
(seenote)
2997
+1.2%
2868
-4.3%
2950
+2.9%
3362
+14.0%
3547
+5.5%
Source: For SIKA: Postverksamhet (1995-2005) (postal statistics began in 1995). Figures from SIKA include addressed newspapers and mail to other countries and mail delivered by companies without a licence (for example newspapers can deliver the invoice for the annual payment together with the newspaper instead of sending it by mail). Figures for unaddressed items are not comparable between 1999 and 2000 because of redefinitions.
For PTS: www.pts.se. Before 1995, figures are only for Sweden Post. Not included in PTS’ figures are addressed newspapers, mail to other countries and some other minor items. Figures from Sweden Post build on statistical surveys of volumes and can according to the company differ by up to 0.3 %.
The composition of mail is also changing. Overnight mail (first class) and single piece mail are falling in relation to second class mail, ADR and bulk mail. In 2003, the market shares for different products were49:
49 Such figures are usually not available in Sweden but the operators presented them to PTS as a basis for the analysis of the Government Commission during 2004.
51

Table 5.3: The composition of different mail products in 2003
Bulk mail 73%, Single piece mail 23%,of which of whichADR (third class) 33% first class 80%second class 28% second class 20%first class 21% magazines 18% or “office mail” 75% street box mail 25%
Source: PTS (2004)
The impact of liberalisation on volumes is weak compared to other shifts in demand trends. Substitution and the slow GDP-growth in the early 2000s contribute to the volume decline. The effect of liberalisation that can be identified is on the relative size of bulk mail and single piece mail. The price changes on different products have contributed to more bulk mail and less single piece mail. The overall price level for postal products would have increased more without liberalisation, so it can also have had a modest effect on reducing the decline in overall demand for postal services.
The price structure
Figure 5.2 shows the real price for first and second class single piece letter from 1984.50
Prices are relatively stable until the mid-1990s. The introduction of VAT on the postage in Sweden explains the price increases in 1994 and 1997. In 1997, however, the rise in the postage was larger than the effect of VAT. At the same time as prices for bulk mail were adjusted downwards and zone prices with lower prices to the largest towns introduced, the postage for single letters was increased by around 30 %. This was possible because of a loophole in the construction of the price cap before 1998. At the time, Sweden Post had the obligation to issue a certain number of discounted stamps to households. These stamps had a 90 % weight in the price level. Sweden Post raised prices on normal stamps by 30 % and reduced discounted stamps by a small amount and was thus able to remain on average within the increase in the net price index. Later, Sweden Post ceased to issue discounted stamps and everybody ended up with the higher postage. The price-cap since 1998 is the average of the increase in Consumer Price Index over a three year period.
This rebalancing of prices for single piece and bulk mail letters is the prime effect on prices of liberalisation. Even if it may have been convenient for Sweden Post to blame price increases on the rise in VAT from 12 to 25%, it met criticism from the individual consumers. The company was able to rise the postage more than the effect of VAT, partly because it still offered discounted stamps. At the same time as household’s prices rose sharply, they moved closer to costs. It was also a response to competition as prices fell most in the segments where City Mail existed. A similar adjustment of prices for single piece mail would have been
50 All price comparisons are in the price level of 2006 (if not otherwise stated). Real (or fixed) prices are showed, in order to make prices comparable across years. Consumer price index (CPI) s used for calculating prices in the same year’s price level. It can be discussed what is the best price index to use. In particular for bulk mail, net price index or some index related to the industry would be an alternative. For the purpose of this section, namely to examine the development of relative prices, CPI is a good alternative. In the section on productivity, other indexes will be used.
5252

impossible later, after the reconstruction of the price cap and without discounted stamps. After the sharp increase in 1997, the nominal price of a 20 g letter remained at 4.00 SEK until 2003 when it went up to 4.40 SEK (excl. VAT).
Figure 5.2: Postage for a 20 g letter, first and second class 1984-2006 (in 2006 prices)
0
1
2
3
4
5
6
1984
1985
1986
1987
1988
1989
1990
1991
1992
1993
1994
1995
1996
1997
1998
1999
2000
2001
2002
2003
2004
2005
2006
År
Pris
in S
EK (2
006
pric
e)
1st class incl VAT
2nd class incl VAT
1st class excl VAT
2nd class excl VAT
Source: PTS’ database of postal prices
The list price for bulk mail is 75-90 % of the price for single piece mail for first class and 60-80 % for second class mail. For bulk mail, the list price is in many cases replaced by a lower price negotiated in contracts between Sweden Post and its large customers. Such contracts are business secrets and prices are not public. However, one such contract has been published because of the right to access documents from public authorities. It is the contract between the Swedish Tax Authority and Sweden Post. For second class bulk mail with delivery all across Sweden, for 10 000 letters of 20 g the discount was 26 % on the list price. For unsorted first class bulk mail, 1000 letters of 20 g, the discount was 5 %.51
Table 5.4 shows list prices for bulk mail in 1991 and 2006. All prices are in terms of the price level of 2006.52 1991 is used as the starting year because Sweden Post started to respond to the competition from City Mail already before the deregulation was completed.
Prices changed substantially: already in 1992 the mass letter was abolished as a product. There was only second class mail with different kinds of discounts depending on how prepared the mail was. The mass letter had today’s construction with a combination of weight and number of items. The weight scale then replaced this and the price for heavier letters increased substantially. The discount for pre-sorting was around 10 %. Large customers became able to negotiate better prices; these are secret but probably large customers could get an even better price than the previous mass letter prices. Sweden Post offered contracts with ‘exclusivity clauses’ with a better price for those who only used Sweden Post (and not City Mail for Stockholm delivery). They were later abolished when the Competition Authority
51 PTS 2006a. 52 CPI is used to adjust prices to the 2006 price level and the exchange rate is 1 euro=9.30 SEK (or 1 SEK=0.108 euro).
53

questioned them as an abuse of the dominant position.53 It can be noted that the profitability of Sweden Post increased in 1992-1994 despite the competition from City Mail. Sweden Post adjusted its prices from being economically too uniform and unrelated to costs to become more market-oriented.
Table 5.4: Prices in SEK for bulk mail 1991 and 2006 (in 2006 prices)
YearNumber of items
1991-5000 10001-25000
2006-5000 10001-25000
Mass/ADR-letter 20g unsorted 50g
2.22 - 2.57 -
3.28 3.28 3.78 3.78
Mass/ADR-letter 20g sorted 50g
- 2.01 - 2.35
- 2.76 - 3.15
Mass/ADR-letter 20g sorted to 50g 19 largest towns
- 2.01 - 2.35
- 2.36 - 2.75
2nd class 20g unsorted 50g
2.96 2.96 5.93 5.93
3.44 3.44 3.94 3.94
2nd class 20g sorted 50g
2.96 2.96 5.93 5.93
- 2.88 - 3.27
2nd class 20g sorted to 50g 19 largest towns
2.96 2.96 5.93 5.93
- 2.48 - 2.87
First class 20g unsorted 50g
3.09 3.09 6.18 6.18
4.15 4.15 4.87 4.87
First class 20g sorted 50g
3.09 3.09 6.18 6.18
- 3.77 - 4.36
First class 20g sorted to 50g 19 largest towns
3.09 3.096.18 6.18
- 3.37 - 3.96
Source: For 1991, PTS’ database of postal prices. For 2006 www.posten.se; Consumer Price Index (www.scb.se) Note: A line means that the product does not exist. In 1991, the price for bulk mail is the same as for single piece mail. No discounts for large town delivery existed before 1997, so the price is the same for all destinations. There were no discounts for pre-sorting except for mass letters.
The comparison shows radical changes in the relative prices of different postal products. Prices for all types of unsorted mail have increased substantially. In 1991, there was no particular price for unsorted mail; all mail was treated as unsorted except mass letters but the price was lower than today. An exception is heavy letters because the weight scale was valid for unsorted first class mail in 1991. Such bulk mail was reduced in price by one third when the floating scale was reintroduced in 1995.
53 The legal issues will be discussed in chapter 7.
5454

The price for third class mail has risen; the price for mass letters in 1991 was even lower than today’s price to large towns. The price for sorted second class mail is lower, in particular for heavy letters and for delivery in the largest towns. In the most extreme cases, even the list prices are less than half of the prices in 1991. In addition to this, there are further discounts in contracts. If Sweden Tax Authority is the norm, such discounts can be around 20-30 %, PTS (1998) found examples of discounts in contracts up to 50 %. A generally accepted view, supported by Cohen et al (2006) is that the largest customers, who represent a large fracture of all bulk mail, get negotiated discounts of 22-30% on the list price.
In all comparisons, only the price of Sweden Post is shown. For delivery in Stockholm, Göteborg and Skåne-regions and on the island of Gotland, City Mail is an alternative. Its prices are always negotiated so direct comparisons are impossible. The prices are supposed to be lower than the list prices of Sweden Post. At least, they are in the low price segment as well and thus contribute to a lower price level on the market. Figure 5.3 shows the development over time of Sweden Post’s prices for a selection of prices from 199354. Note that discounts for large customers could be even larger than for the Swedish Tax Authority.
Figure 5.3: Prices in SEK of 20 g letter, selected products 1993-2004 (2004 prices, excl. VAT)55
Source: PTS (2004)
0,0
0,5
1,0
1,5
2,0
2,5
3,0
3,5
4,0
4,5 Single piece mail
List price bulk mail50.000 items
List price bulk mail50.000 items, large town deliverySweden Tax Authority50000 items, bulk mail,
Sweden Tax Authority 50000 items, bulk mail,contract, large town delivery1993 1994 19951996 1997 1998 1999 2000 20012002 2003 2004
Figure 5.3 shows the large changes in the price structure that must be considered a prime effect of liberalisation. The change has come in different steps. The response to City Mail already in 1991 is not included in figure 5.3. Earlier, prices for different products were very similar. The price for bulk mail fell in 1995 when Sweden Post introduced the product. Sweden Tax Authority was able to negotiate a better price from 1996. The relative price for single piece mail increased in 1997. After that year, only minor adjustments to relative prices were made.
54 Because of changed definitions, the starting year 1991 cannot be used in this time series. 55 Real prices are calculated with net price index in this figure.
55

Concerning the delivery of magazines, the real price for first class has risen around 40 % and 15 % for second class since 1993. The price difference between first and second class has become larger. Sweden Post explains this by an adjustment to costs and increasing costs for overnight transportation because magazines are relatively heavy. PTS (2004) adds that competition from City Mail contributes to holding prices down for second class.
A summary of the effects for different products is shown in table 5.5. A comparison of only list prices will, however, give an incorrect picture because most bulk mail is discounted. The discount in contracts can be assumed to be 5-10% for unsorted mail and 15-30 % for sorted mail – the discount varies between customers. An estimated discount of 5 % for unsorted and 25 % for pre-sorted appears reasonable and a column that displays the prices change for large customers is included in the table. It is clear that the price structure changed radically, making second class mail, sorted mail, delivery in large towns and heavy letters relatively more inexpensive. In fact, the real price is up to 50 % lower than in 1991 for certain products, contract discounts unaccounted for. It should be remembered, that bulk mail represents around three of four letters and has an increasing share of total mail. All figures in the table are without VAT. Single piece mail with a stamp is only around 5 % of all mail. If the effect of introducing VAT on the postage in the mid-1990s is included, the increase in real price is 77% for first class and 68% for second class single piece mail.
Table 5.5: Change in real price 1991-2006 for selected products (excl. VAT)
20 gramlist price negotiated
price
50 gram list price negotiated
priceMass/ADR unsorted pre-sorted pre-sorted, large town delivery
+49 % +42%+37 % +10%+17 % -6%
+49 % +42%+34 % +10%+17 % -6%
Second class not sortedbulk mail pre-sorted pre-sorted, large town delivery
+16 % +5%- 9 % -27%- 22 % -37%
-37 % -40%-48 % -58%-55 % -64%
First class not sortedbulk mail pre-sorted pre-sorted, large town delivery
+34 % +28%+22 % -2%+9 % -13%
-22 % -26%-31 % -45%-36 % -49%
First class, single letter Second class, single letter
First class local delivery (min 250)
+43 %+35 %
+10 %
+43 %+35 %
+12 %Note: Large town delivery is delivery to the 19 largest towns in Sweden, for which Sweden Post has been able to prove lower delivery costs than to the rest of the country. CPI has been used for calculation of real prices. Negotiated price assume a 5 % discount on first class and 25 % discount on second class mail.
Source: Own calculations based on table 5.4.
The price level
What happened to the average price level of postal products? It is impossible to give weights to all different products, because definitions have changed over time and there is no
5656

information of exact volumes more than the rough distribution of main products presented in table 5.3. In the following, the available, but incomplete information about the development of the price level is presented.
Looking at the revenue per letter, one can make an approximation. ITPS (2004) finds that Sweden Post Letter Division increased its total revenue per letter from 4.21 SEK in 1994 to 5.28 SEK in 2003, a 25 % increase. In the same period, CPI rose by 12 % and NPI by 6 %, so the increase in real prices is 12-19 %, depending on what price index is used. However, this comparison begins three years after the first price adjustments and the total revenues include more than revenues from letter business, so this is only a rough indication that the price level increased somewhat since 1994. If City Mail is included in the picture, it contributes to holding the overall price level down. That company has indeed a small share of the total market, but its prices are at least as low as Sweden Post’s.
For the Government Commission (ITPS 2004), Sweden Post has made a calculation of its revenues for addressed letters for 1998-2003. In that period, the revenue per letter is constant in real terms. It must be remembered that the main price adjustments occurred before 1998, so this information merely supports the fact that the effect on prices of liberalisation occurred in the first years.
Based on previously undisclosed information from Sweden Post, Cohen et al (2006) shows that the nominal average price for single piece mail rose by 80 % (incl. VAT) between 1990 and 2004. For a detailed picture, see figure 5.4. At two occasions, the price increased significantly: in 1992 by 11 %56 and in 1997 by 18%. In the same period, bulk mail prices rose by 24 % and the weighted average of all prices by 35 %. Nominal revenues for single piece mail are about 6 % higher (a sharp decline from a peak in 1998 when revenues were 27% higher than in 1990!), for bulk mail 18% higher and for all products 13 % higher. The accumulated change on prices, volumes and revenues for Sweden Post between 1990 and 2004, according to this study, is displayed in table 5.6.
Table 5.6: Cumulative change in Sweden Post’s volumes, prices and revenues 1990-2004
Single piece mail Bulk mail All letters Volume -41% -5% -16%Revenue (nominal) +6% +18% +13%CPI deflated price +34% -8% +1%Source: Cohen et al (2006)
The conclusion from this study differs from ITPS and the conclusion here is that the overall price level for mail in Sweden in real terms is about the same as in 1990.
Another way to study the price level is to compare it to other countries. Such comparisons are difficult, because products differ; VAT levels and exchange rates vary considerably. A comparison of 20 g single piece mail is shown in table 5.7. It shows the cheapest single piece product (but the upper weight limit differs between countries). Recall that single piece mail in Sweden currently represents only 23% of the market and that the VAT level is 25% whereas most countries in the table do not have VAT on the postage.
56 This figure from Sweden Post is difficult to explain, because unlike in 1997, neither the postage nor the share of single piece mail changed significantly in 1991.
57

Table 5.7: A comparison of the postage for cheapest single piece stamped mail between selected European Countries 2003 (eurocent)
The Free and Fair Post Initiative, 2005
excl. VAT AustriaBelgium CyprusCzech Republic Denmark EstoniaFinlandFranceGermany GreeceIrelandItaly The Netherlands PortugalSpainSweden The United Kingdom
5544352558284353554448453930284130
Source: Free and Fair Postal Initiative (2005). WIK (2004) has a similar comparison that shows the same result: that the postage for a 20 g letter in Sweden is not markedly higher than in other comparable countries.57
Despite the price increases in single piece mail, the postage in Sweden is currently neither higher nor lower than in other European countries, regardless of which comparison is used. If the high Swedish VAT is discounted, the picture might get even better for Sweden. So, even if liberalisation led to much higher prices for single piece mail compared to bulk mail, these prices are not significantly higher than in comparable countries.
Employment, costs and productivity
The effect on employment and productivity depends largely on the situation before liberalisation. A firm with a long time monopoly can have become complacent and being inefficient with a too large workforce. But a modern management can behave like one of a competitive firm and create an efficient monopolist even if profit maximisation is not the goal. Therefore, the results can be very different among liberalising countries. New entrants can contribute to productivity in two ways: stimulate the internal efficiency of the incumbent and be more productive itself in the share of the market it gains.
Sweden Post Office was supposed to be relatively efficient as a postal monopolist before liberalisation. A number of sources around 1990 pronounce this statement, among them the Department Report (Ds1991:44) and the Post Office Annual Report. However, the original
57 Only five EU countries apply VAT on the postage: Finland, Lithuania, Slovenia, Spain and Sweden. The comparison for FFI is made using nominal exchange rates. This is usually better for a comparison of a single product, whereas the PPP exchange rate is preferable for comparisons of aggregate data. WIK shows comparisons using both nominal and PPP exchange rates.
5858

source for this international comparison was not found. One study (Cohen et al 1997) reveals that Sweden was number 11 among 21 countries in productivity in the early 1990s. However, the figures for Sweden are based on all employed by Sweden Post Office. If only the number of employed in the letter division are counted and figures recalculated, Sweden ends up in second place, which would support the alleged efficiency of the Post Office.
It is difficult to calculate figures for employment, costs and productivity for reasons of lacking information from Sweden Post; a reorganisation in 2000, when letter services ceased to be a separate division and the fact that Sweden Post has had other activities than letter delivery, which are included in the total costs, further complicate comparisons and calculations.
It is clear that employment in the postal sector has been reduced since liberalisation started. The total number of employed in Sweden Post was around 49 000 in 1990 and 33 000 in 2004. In the 1990s, Sweden Post owned the postal giro and had an extensive network of post offices that mainly dealt with financial services. The letter division of Sweden Post had 35000 employees in 1990 and 24 500 in 1999 (since then there is no letter division anymore).58
However, the reduction in employment in the letter business can be partly explained by outsourcing and pre-sorting by customers, so the numbers cannot be directly compared with each other.
The reduction in Sweden Post is partly counteracted by employment in new firms. City Mail employs around 1500 people and the remaining operators a few hundred. According to SIKA (2006), the total employment in enterprises in the postal sector went down from 42 820 in 1995 to 32 171 in 2005.59 One should remember that Sweden is among the EU countries that reduced employment in the postal sector the most in recent years; in many countries it increased in the same period.60
There are indications that there existed a wage premium in Sweden’s postal sector before liberalisation. The average income for employees in the postal sector in relation to the private sector in general has fallen by around 20% since 1993; the decline occurred during the first years after liberalisation.61 This can be explained by monopoly rents transferred to postal workers before competition was introduced. Alternative explanations are, however, a change in the composition of age and education among the employees or an increased share of part-time employees. The wage premium may not be as large as the figures indicate. An international comparison of labour costs show that Sweden is in the middle among European countries with the UK and France in the top.62
Postal production is very labour intensive. For Sweden Post, labour costs were 60 % of total costs in 1995 and down to 50 % in 2002. Wages share of value added is 90 % for postal services compared to 50-60% in the private sector as a whole.63 Labour intensive production normally has lower increase in productivity than the whole economy.
58 Sweden Post Annual Reports, 1990-2004. 59 SIKA Postverksamhet 2005. 60 SOU 2005:4 p 433. 61 SOU 2005:4 p 435. Two different statistical sources are used and they produce similar results. 62 Ibid. 63 Ibid.
59

Until 1999, Sweden Post published productivity changes for the letter division. The total increase in productivity over this period is, according to its annual reports 16%.64 Another way of studying productivity is the relation between deliveries and labour. In 1991, around 3000 million addressed and 1300 million unaddressed items were delivered with a total of 34400 employed in the letter division. In 1999, 3500 million addressed and 2000 million unaddressed items were delivered with 24500 employed. The result on productivity depends on how addressed and unaddressed items are weighted. Traditionally, unaddressed items are considered to have a small marginal cost but ITPS (2004) believes that the economies of scope are overestimated and the true incremental cost for unaddressed items higher. With a too small weight on unaddressed items, Sweden Post’s internal productivity figures may be underestimated.
It can be questioned why not the introduction of a completely new national network and automatic sorting machines in 1996-97 or the increased share of pre-sorting by customers are more visible in productivity. Moreover, rising volumes can equally well explain the increase in productivity in the 1990s, if there were unutilised economies of scale.
According to the study by ITPS (2004), there was a once-and-for-all increase in Sweden Post’s productivity shortly after liberalisation. This conclusion is based on information from Sweden Post on deliveries per employee. In 1993-94, productivity increased by around 20% due to a reorganisation of the postmen’s shifts. Between 1995 and 2000, there has been another 10 % increase in productivity, adding to a total of 32%. After 2001, productivity has fallen because of the decline in volumes and lost economies of scale.
According to new information that Sweden Post disclosed in 2006, total input costs have increased by 60 % from 1990 to 2004. At the same time, the consumer price index increased by 34%. Sweden Post’s figures build on an estimated allocation of costs, which include labour costs 70%, transportation costs 12% and other inputs 18%.65
Based on these figures from Sweden Post, Cohen et al (2006) conclude that productivity has increased significantly for Sweden Post’s production since the beginning of liberalisation. The average nominal price level of Sweden Post increased by 35 %, but input costs increased by 60 %, thus, the gain in productivity must explain why prices have risen significantly less than costs. See figure 5.4. If the nominal prices instead of CPI are “deflated” with the increase in input costs, a measure of productivity change is obtained. Nominal prices for Sweden Post’s mail increased 17 % less than total input costs.
64 Sweden Post Annual Reports 1990-1999. 65 SOU 2005:5. Statistics Sweden has produced another index for postal costs with an adjusted composition of inputs. According to their index, postal costs have increased somewhat less than Sweden Post’s figures. The results may differ somewhat depending on what distribution of costs that is assumed, and the method used by Sweden Post is the one that gives the highest productivity gains.
6060

Figure 5.4 The development of prices and input costs for Sweden Post 1990-2004
90100110120130140150160170180190
1990
1992
1994
1996
1998
2000
2002
2004
Year
Inde
x 19
90=1
00
single piece pricebulk mail priceaverage pricetotal costs
Source: Cohen et al (2006, appendix)
This section shows that there are different indications on the development of productivity, but the overall conclusion is that productivity has increased significantly, even if it falls behind the most competitive capital-intensive manufacturing industry. Employment is reduced dramatically and wages have, after an initial decline, followed wages in general. An earlier wage premium was reduced if not eliminated. Liberalisation is not the only factor behind this development, but the existing and potential competition is the prime factor behind the improvements in this respect. Sweden Post remains profitable and the remaining new entrants have become profitable after some time. It is possible that the competitive pressure is not sufficient to achieve the maximum productivity gains, but directly promoting more competition would be at the expense of lost economies of scale.
The results for the operators have varied over time. City Mail went bankrupt twice and have not been profitable until 2005. Sweden Post’s letter business has been clearly profitable since before liberalisation. The inclusion of pension payments in the early 1990s, the reform of the network in 1996 and recently falling volumes have reduced profitability. After the year 2000, no specific figures are published about the letter business. Sweden Post started to make losses in the early 2000s, which has sometimes mistakenly been regarded as a failure of liberalisation. Instead, it was other activities: the office network, unsuccessful investments in the IT-sector and adjustment costs that worsened the result. Since then, the financial result has improved. In the first half of 2006, Sweden Post has become highly profitable. It considers itself one of the most profitable Posts in the world. Its net financial profits went from 395 million SEK in the first half of 2005 to 1 103 million in 2006. Its yield on own capital the same period was 40%.66
Innovation
Innovation can be divided into product- and process innovation. There has been a lot of innovation in the postal sector in the past 15 years. Not much of it can directly be related to
66 Sweden Post Semi-annual Report 2006 and newspaper Svenska Dagbladet August 31, 2006.
61

liberalisation, but one can assume that liberalisation drove the market players to implement new innovations earlier.
Process innovation comprises the development of more fine-tuned presorting methods and automatic sorting machines that can sort heavy letters, with new software down to the delivery sequence. Sweden is among the most advanced in production technology, but there are many other non-liberalised countries at the same level.67 City Mail made one organisational innovation, which is the most apparent result of liberalisation. By only delivering second class mail, their postmen only need to travel the same route every third day. By doing so, they can cover three routes and triple productivity compared to the postmen of Sweden Post. City Mail have the same input prices as Sweden Post68, much smaller scale advantages and no economies of scope with first class mail. But this organisational invention makes it possible for City Mail to be competitive and reach break-even when volumes exceed a certain level. On the other hand, the small local operators use manual sorting, so in that case new technology is replaced by old. Entry has not always been efficient and many new entrants have not survived. Others have, because they are more efficient than Sweden Post in other aspects than sorting. And for small volumes, manual sorting is more efficient (see figure 3.1). If there was only local mail in the country, all sorting except in large towns would be manual, because it would not pay to transport it to regional centres. The cost function may not be sub-additive. There may exist large and small firms side by side like supermarkets and 7-11 stores. Finally, some inefficient firms can remain on the market for some time because a multi-product natural monopolist is not sustainable to all kind of new entry. The deficiencies in local operators’ productivity are not so much in sorting but in delivery if they have too small volumes.
In addition, there may be many small innovations made on the local level that are difficult to identify. In general, liberalisation did not trigger a lot of process innovation, but probably stimulated new technology to be introduced earlier.
There has also been a lot of product innovation since liberalisation started. Downstream access allowed for pre-sorted mail products; the Post Office did not offer discounts for pre-sorted mail before the entry of City Mail and started to sell bulk mail not until 1995. Hybrid mail and new services that added value to traditional postal service are other good examples. To some extent this can be a result of competitive pressure, but again, Sweden is by no means unique and it is in general more a result of developed technology and changes in demand. PTS (2004) also believes that the intensive competition by means of price could have resulted in too little focus on innovation. In its opinion, liberalisation has not been a main driver behind product innovation in the postal sector.
Quality of service
As for productivity, the effect of liberalisation on quality of service largely depends on the situation before the reform. Generally, in Sweden quality was high in many respects before liberalisation, but the Post Office was a production oriented rather than customer oriented organisation. In this section, quality of service will be described in a number of aspects. It will turn out that the quality is high and that competitive pressure has improved quality, but at the same time, satisfaction of individual consumers has decreased.
67 See e.g. WIK (2004) 68 Their postmen belong to the same union and have the same wage agreements but City Mail has somewhat more flexible working conditions.
6262

There are two areas of quality: one area is the one that is regulated by the targets for the universal service, the other one is the quality that operators for commercial reasons choose to deliver. An evaluation of quality of service in Sweden is made in the annual study from PTS and concerns the fulfilment of USO requirements.
In the licence condition for Sweden Post, it is required that the company collects and delivers to all households and organisations five days per week with the exception of extremely remote locations where mail is delivered 2-4 times per week. Such households are located in islands in the archipelago without boat connection and in the upper mountains. The number of households without daily service was around 1 550 in 1990, in 1996 it was 1 209 and is in 2005 down to 1 118.69 Thus, the accessibility in remote locations has improved since liberalisation.
In Sweden, 73% of the population gets the mail to the house, 21% has less than 200 meters to its mailbox, 5% between 200-1 000 meters and 1% more than one kilometre. For collection, there are 33 letter boxes in the streets per 1 000 inhabitants, compared to the EU average of 18 per 1000.70
The rural areas in Sweden are served by “rural postmen”. There are 2 500 routes and 730 000 households (of around 4.5 million) are served by rural postmen. They function like a “mobile post office” and not only collect and deliver letters and parcels but provide financial services and some other services not related to the postal sector. The service to rural areas is in general good and at the same level since the 1960s. Until 2005, Sweden Post had its internal guidelines for the specific conditions, i.e. the maximum distance to gatherings of mail boxes. Since 2005, PTS issues such guidelines. Sweden Post has in recent years begun to apply the guidelines more strictly, which has caused some complaints. Sweden Post offers a service which means that households can pay for a personal visit of the rural postman twice a week; around 1000 households have bought that service. PTS buys special services for elderly and disabled people, meaning that another 1700 households are visited at the door.71
In Sweden, people living in flats usually get the mail delivered at the door and not in a box at the entrance. However, PTS has issued new guidelines, which recommends all delivery from the year 2011 to be in such boxes. Even in areas with residential housing, it will be accepted with gatherings of mailboxes like in rural areas. The Government Commission (2005) supports this development, for reasons of reducing delivery costs and for the work conditions of postmen.72
The reliability is high and Sweden is at the top internationally concerning overnight delivery. A recent international comparison is displayed in table 5.8. Since 1999, the share of overnight single piece mail arriving the next day is between 95 and 96 %. In the 1990s, Sweden Post had its own system for measuring reliability and the figures were at the same level except in 1996-97 when the introduction of the new national network and automatic sorting temporarily led to lower reliability, around 90 %.
69 PTS (2006a) 70 ITPS (2004) 71 PTS (2006a) 72 PTS (2006a) and SOU 2005:5
63

Table 5.8 International comparison of the performance of overnight mail delivery.
Overnightmail on time
Belgium CyprusDenmark FinlandFranceGermany GreeceIrelandItaly NorwayPortugalSweden
85 % 38%95%95%70%96%63%71%87%88%91%96%
Source: WIK (2004)
In 2005, the figure for first class single piece mail on time was 95.2% and for all first class mail including bulk mail 95.9%. The variation between terminals across the country was small; the best terminal was at 96.9% and the worst at 94.1%. Measuring per terminal means, however, that there may exist certain small regions in which reliability is significantly lower. The highest reliability occurred in April with 96.9% on time and the lowest in December with 93.9%.73 Thus, Sweden remains at an international top position also after the year 2003 that is showed in the table.
In May 2001, Sweden Post carried out a major reform in the network of post offices. A traditional post office in Sweden has provided letter and parcel services as well as financial services. Until the 1980s, the most common way to pay bills was in the post or bank office. The number of payments over the counter has decreased steadily and in 2005, less than one per cent of all payments were over the counter.74 The post office network began to make losses in the late 1980s. As letter and parcel services had no longer a connection to payments, these services could be separated from the financial ones, both in legislation and into separate organisations with separate networks.75
The reform in 2001 meant that the financial services were moved into a separate subsidiary of Sweden Post, Svensk Kassaservice, and the postal giro was sold. The traditional post office was closed down completely. The system of using partners that began in 1989 replaced many former post offices. Today, there are Business Centres with postal services primarily targeted at the needs of businesses, mostly in areas with a high amount of such activities. However, private persons can also send letters and parcels at business centres. For the ordinary customers, Partner Offices is the most common type of service point. Such offices provide services for sending and picking up letters and parcels including track and trace of parcels and sell stamps. These partners are usually grocery stores, gasoline stations, kiosks etc. In October 2006, there were 1631 Partner Offices with complete services and additionally 189 offices with limited services located in remote areas.
73 PTS (2006a) 74 PTS (2006b) 75 Andersson (2004)
6464

Such partners have longer opening hours, even on weekends, are located in central shopping areas and are places where people carry out other activities. The network of Post Offices before 2002 were on average open 42 hours per week. Today’s partner offices are on average open 77 hours per week. For most consumers, the accessibility to a service point has improved since the beginning of liberalisation. This shows among other things in the average time a parcel remains at the access point before being picked up. Before the reform, Sweden Post estimates this time to 11-13 days. Today it is 3.17 days. The average number of visits to a post office in 2001 was 1.8 times per year. The type of grocery stores where today’s services are offered are on average visited 1.6 times per week.76 This indicates that availability measured as number of access points is incomplete and regarding location and opening hours, services have improved substantially.
Figure 5.9: The number of services points, Sweden Post, 1989-2006
0
500
1000
1500
2000
2500
År 89 91 93 95 97 99 01 03 05
Year
Num
ber Post Office
Partner OfficeTotalBusiness Centre
Source: SIKA (2006) , Sweden Post Oct-06. Note: Because of changes in service levels, the numbers are not completely comparable. In 2005, 189 of the Partner Offices (in remote locations) provided a limited range of services. On the other hand, opening hours are usually longer in 2005 for most outlets than before the reform in 2001. In addition to these offices 2030 shops have contracts with Sweden Post to sell its stamps. Other shops may do so, but may add a margin over the stamp price to cover their own costs.
The total number of service points increased in the reform by 39% between 2001 and 2005 to a total of 2012. In sparsely populated areas, the number fell by 26% and in rural areas outside towns by 15 %, whereas in towns the number increased by 15 %.77 In addition to these service points, another 2030 shops have contracts with Sweden Post to sell stamps. They are franchise-takers and sell a complete set of stamps at their nominal value.78 Selling of stamps is free in Sweden, so any shop can buy stamps and resell them. A few add a margin to the nominal stamp value, but many offer them at the nominal value as a service to their customers.
76 Mattias Olsson, Sweden Post, October 2006. 77 Survey by The Swedish National Rural Development Agency, www.glesbygdsverket.se/site/default.aspx?id=3617#, February 2006. 78 Mattias Olsson, Sweden Post, October 2006.
65

Svensk Kassaservice had in September 2006 a network of 380 offices, a reduction with 140 offices from the previous year. In addition, services were offered by 136 Partner Offices and 2 500 rural postmen.79
Quality cannot be completely measured by this kind of quantitative indicators. In the first years after liberalisation, PTS made surveys of postal consumers, mainly large senders of mail. The general impression from these studies is that the quality improved a lot during the 1990s. The business idea of City Mail was to attract large companies and as a private competitive firm it had to be customer oriented from its start. This led to a change in attitude for Sweden Post. In PTS (1998) survey, postal consumers find the operators’ quality high that they were willing to adjust to consumer demands more than before liberalisation. The improvements have been most significant for the large customers. PTS (2003) summarises in its evaluation of the first nine years that the quality of service now has turned to be in line with what is demanded. Such qualitative information may reflect even more the change in response to consumers than price, reliability or productivity data.
There are, however, mixed signals in how individual people are satisfied the postal market. Sweden Post has its internal ‘Satisfied Consumer Index’. Each year since the 1990s, it varies between 60 and 65, so no major change in either direction can be identified.80 Some recent surveys provide a different picture. In the international comparison made by Eurobarometer (2003) the Swedes were the least or second least satisfied with their postal services among the EU countries. Another domestic study by Swedish Quality Index (2006) surveys people’s trust in many different organisations and institutions in Sweden. Sweden Post is in the bottom of the list both for households’ and number 26 of 29 companies’ ranking. The postal sector has an unusually large difference between expectations and satisfaction. The value for City Mail is significantly better than the one of Sweden Post.81.
The surveys provide no information about the reasons for dissatisfaction. It seems like the discontent is new and not a direct result of liberalisation in 1993. The most likely explanations are the following:
People are dissatisfied with the abolishment of the traditional post office. Even if most people need to make payments over the counter only 1-3 times per year, they do not know where to go or have got a long distance to the few remaining offices of SvenskKassaservice. Even if most people seldom use these services, they care for the few, mostly elderly people, who still pay over the counter. This reform draws a bad image to Sweden Post although financial services are not part of postal liberalisation. Even if the reform of post offices led to more services points for letters and parcels with better accessibility, people have not got used to going to another place to perform their postal businesses. People take a high quality of service for granted and are not aware of the large previous losses generated by post offices in the past.
Other possible explanations could be that the postage is considered to be high. However, this dissatisfaction would have occurred rather in 1997 and a recent survey, PTS (2006b) finds that 37% find postal services price worthy and 37 % not price worthy. The same survey also asked if people are satisfied with the delivery of postal services. 68% were very satisfied, 25
79 www.svenskkassaservice.se 80 Sweden Post Annual Reports, each year. 81 www.kvalitetsindex.se. It is part of the EPSI; European Performance Satisfaction Index.
6666

quite satisfied and only 3% dissatisfied. This report supports the conclusion that people’s discontent is related to the reform of the office network and not to the way distribution of letters and parcels work.
To sum up the quality of service, it was relatively high already before liberalisation and still is. Accessibility has improved somewhat, reliability remains very high, the access to postal service points is now more widespread than before liberalisation but in new locations. The access to financial over the counter services, however, is significantly lower due to the drop in demand.
In the first years after liberalisation, operators became more customer-oriented and responsive to consumer demands. Key indicators and qualitative studies show improvements in quality of service. Despite this, people express dissatisfaction over postal services in the past years, but it is probably related to the closing down of the traditional post office. Other, more direct surveys of satisfaction (like PTS 1998 and 2003) give a more positive picture.
Welfare
Finally, it is interesting to sum up the effects to see the resulting change in welfare. Welfare is here defined economically, i.e. as the change in the sum of consumers’ and producers’ surplus. To calculate such change, a lot of data is required that is not available. The only existing estimate is presented by Cohen et al (2006). It is based on the previously disclosed information about Sweden Post, which was reported above. The authors have then used price elasticities from the USA based on econometric analysis made by the US Postal Rate Commission. Using a theoretical model for consumer surplus, they end at the following change in consumers’ surplus for Sweden.
Table 5.9: The change in consumer surplus in Sweden 1990-2004 (based only on Sweden Post’s prices and volumes). SEK, 2004 price level.
Single piece letters - 623 million Bulk mail + 2 368 million TOTAL + 1 745 million
Source: Cohen et al (2006)
With these figures, the authors show a large gain in consumer surplus, which they attribute for the most part to liberalisation in Sweden. The change in price, volume and productivity in the time period is mostly due to regulatory reform. There is a loss in consumers’ surplus for single piece mail, because this sort of mail was relatively underpriced before liberalisation began. It is more than outweighed by the increase for bulk mail and the net effect on consumers’ surplus is positive. The gain per year is 125 million SEK.
It remains to be analysed to what extent this is a net gain in welfare and a shift from producers’ to consumers’ surplus. The authors believe that because the profit in the postal sector is relatively stable during this period, the increase in consumers’ surplus is fairly equal to a net gain in welfare.
67

6. The provision of universal services in Sweden
The universal postal service is often defined as a ubiquitous delivery of a specified range of services at a uniform price.82 All three properties are required to form the USO. The USO becomes a restriction only at the uniform price, because there is always a commercial operator willing to offer all services at any price the consumers are willing to pay. For some services, the price will be higher than today’s uniform price. The current specification of the USO in Sweden in the Postal Act from 1998 was given in section 4.2. It has already been said in this report that universal services have continued to be provided in Sweden without external support. This chapter will first present how postal production is organised in order to fulfil the universal service commitment, then summarise the result based mainly on studies by PTS.
6.1 The organisation of postal production in order to provide USO
Sweden is a large country. It measures over 2 000 kilometres from north to south; if Sweden is turned around its southernmost point, it would reach down to the Mediterranean Sea. It is also one of the most sparsely populated countries in Europe with 20 inhabitants per square kilometre. There are people living on islands in the archipelago without daily boat connections and in wintertime surrounded by ice, as well as settlements on the long chain of deserted mountains along the Norwegian border. This puts special requirements on the organisation of postal services in order to provide overnight distribution across the country.
There are two critical issues: the first is interregional transportation and the second collection and delivery in sparsely populated and remote areas.
The first problem is solved by a network of air transportation, which allows the latest collection at around 20.00 near sorting terminals. Another solution to the first issue is the provision of second class mail. By offering lower prices for less time-sensitive mail, sorting in the critical time period is limited to first class mail. Air is only used for overnight mail whereas second class mail goes by train, lorry and boat. Delivery in the morning can begin at 07.00 to companies and post office boxes and street delivery around 09.00. The service goal of Sweden Post is that delivery to companies should be completed before 11.00 and to households before 13.00.
The second problem is solved differently depending on the density of delivery points. In populated areas, ordinary postmen deliver, either by car, bicycle or by foot. In rural areas there are routes of rural postmen. In such areas, mailboxes are gathered in clusters and recipients can have a way of up to two kilometres to their mailbox. Local terminals for collection and delivery are spread across the country. In very sparsely populated areas, different case by case solutions are used. A common solution is a “postbag”. The postbag is sent with regular connections by bus or an archipelago boat and someone at the destination is paid for receiving the bag and distributing mail into boxes. In other cases there is no public transportation. In wintertime in the Stockholm archipelago, helicopter transportation may be used for distributing necessary items including mail.
82 Crew and Kleindorfer (1998) and PWC (2006).
6868

Apart from the use of air transportation, which is only required in large countries, the organisation of postal production in Sweden is similar to most modern countries. The business idea of the post is to gather small streams into mass production. Sweden Post has today 11 regions in Sweden and almost all mail in a region is collected and transported to its central sorting centre. Collection from companies and along collection routes for letterboxes in the streets takes place in the late afternoon. Companies can choose to deliver themselves to post centres or terminals. Mail is gathered at the local level and transported to the regional sorting centre. An alternative could be to leave local mail and sort it manually. Sweden Post does not offer a special inlet for local mail in letterboxes, because it has found that economies of scale in sorting are generally greater than the marginal transportation costs. An exception is in some towns, where there is a blue letterbox next to the regular one for local mail. Areas served by rural postmen have collection together with delivery, which means that collection takes place already in the morning.
At the sorting terminal, outbound sorting takes place, beginning around 16.00 and the peak is between 18.00 and 22.00. At 20.00, lorries and trains begin to take mail to adjacent regions. Sorting is completed by 22.00 and the latest mail is transported by air to the interregional sorting terminal at Stockholm airport Arlanda where more than ten airplanes meet at midnight. They return an hour later to their destinations. Meanwhile the internal regional mail is dissemination sorted at the terminals. When the national mail later arrives by trains, lorries and airplanes this is sorted as well. Sorting facilities have been improved over the years. Modern sorting machines were installed in 1996, which can read also many hand-written addresses. Machines for sorting of heavier letters were installed some years later. Currently, dissemination sorting is being further improved. With new software, the machines will become able to sort not only on the last figure in the postal code but in the order of delivery of the postman if the mail is run a second time through the machine.
Dissemination sorting is completed around 05.00 when lorries take mail back to local terminals. Postmen begin their shifts around 06.00. They start with inhouse sorting of mail that is not already sorted by machines, add unaddressed items and second class mail and leave for their delivery routes around 09.00. In the end of their shift, they make administrative work, like updating addresses and taking care of forwarding. Pre-sorted mail can enter the process upstream at the collection stage, be left at the sorting centre or even at the delivery terminal. There is also ‘hybrid mail’, letters sent electronically to the sorting centres where they are printed and enveloped. The need for interregional transportation is eliminated. Second class mail follows the same procedure, but is sorted in daytime. It converges with overnight mail at the delivery stage three or sometimes already two days after collection.
The principles are illustrated in figure 6.1. The time schedule is extremely tight and disturbances in one stage may result in that mail is delayed one day. Some spare capacity exists, there are stand-by airplanes and lorries, even taxis can be used. Mail that is incorrectly addressed (i.e. incorrect postal code) or incorrectly processed upstream will ultimately also be delayed. During outbound sorting, a bar code that identifies the post code is printed on the envelope, which is subsequently used in dissemination sorting. There is no margin for correcting mistakes, i.e. boxes with mail that are sent to an incorrect destination will be delayed one day. Even if the accuracy is high, some 250 000-300 000 letters (5% of the total volume) per day are not arriving on time.
69

Figure 6.1: The organisation of overnight mail in Sweden
collection (local)
outbound sorting dissemination sorting regional national
train, lorry transportation
air: transportation
to reloa- from delivery ARN ding ARN inhouse sorting street delivery adm
time (hr)
16 17 18 19 20 21 22 23 24 01 02 03 04 05 06 07 08 09 10 11 12 13
Pre-sorted, second class, pre-sorted mail, hybrid mail unaddressed items
6.2 Evaluation of the provision of universal services
Evaluation of the fulfilment of USO
The presented results of quality of service in chapter 5 showed that the USO requirements are fulfilled. This is also the conclusion in the annual evaluations by PTS83 and the actual results are markedly above the regulatory requirements. The accuracy of overnight delivery is high, sufficiently few households lack five day delivery, collection and delivery times are good, complaints are few and handled in good order.
PTS (2003b) also found that Sweden Post follows the guidelines for distances to delivery points. Until 2005, it was only the internal policy of Sweden Post which controlled the organisation of delivery points. Only in 2005, PTS issued guidelines. At the same time, Sweden Post made some reorganisations and used the available margin more strictly than before. This caused some complaints and bad publicity (PTS 2006).
PTS (2003a) studied the principles for the calculation of Sweden Post’s costs, as the provision of universal services should be cost-based according to the EU Directive. PTS found that there is a stable profitability for both overnight and second class letters since deregulation, but falling volumes and a changing product mix can jeopardise it in the future. In the year 2000, which is the last year when Sweden Post had a separate letter division, this division made an annual profit of 1 billion SEK, 7.1% of its turnover.84 Later information from Sweden Post85
83 Service och konkurrens 2006 and previous issues. A broader evaluation was made in PTS (2003a). 84 Sweden Post Annual Report 2000.
7070

discloses that the letter business is still profitable but margins are declining. PTS finds the accounting systems of Sweden Post transparent. On the aggregate level, prices are cost based, notably for single piece and bulk mail. PTS finds it unclear on how the principle of cost-based prices should be applied on a disaggregated level: there are different margins on sub-products. Only the 20g single piece letter is not covering its cost; it constitutes two thirds of single piece letters and 9 % of the total letter volume.
PTS underlines that the definition of what products are to be included in the USO is somewhat unclear and asks for better definitions. Sweden Post has occasionally tried to redefine its products in order to separate some value-added products from the USO. In 2004, Sweden Post demanded that bulk mail should be excluded from the USO and that it only covered single piece mail and parcels up to 20 kg.
Evaluation of the cost for USO
There are no accurate estimates of the financial burden of the USO in Sweden. A detailed estimation so far has not been considered necessary, since Sweden Post assured that it will continue to provide these services in the medium term. At the time of liberalisation, Sweden Post presented the cost for “nationwide services”. It was 1.2 billion SEK, around 10% of the turnover at that time. Later, it turned out that what Sweden Post had disclosed was an estimate of the incremental cost for national mail, which is something completely different. Before the Government Commission in 1996, Sweden Post estimated the cost at 400 million SEK. The Commission, without any further knowledge, disagreed and instead estimated the cost at 100 million SEK. The Government Commission in 2005 estimated the cost at 115-400 million SEK, applying figures from Norway to Sweden. PTS (2003a) stated that because there are also benefits from providing USO, there is no extra cost for Sweden Post at all for providing universal services. As a matter of fact, there is no reliable knowledge about the financial burden of USO in Sweden.
Other studies have generally found the financial burden to be limited. NERA (1998) estimated it to 0.5-2% of the turnover in seven of eight studied countries. Postcomm (2001) made an in-depth study of the costs in the UK. It showed that the financial burden for Royal Mail was of the magnitude that prices needed to be raised by 1.5% to finance USO. Another study for Norway (2004) found the costs to be 2% of the annual sales. Both the UK and Norway have six day delivery. PWC (2006) concludes in its recent study that in most modern countries, the USO is possible to be provided without subsidies or a reserved area, but that national characteristics differ substantially.
It is also contested whether delivery costs indeed are higher in rural areas. During the legal conflicts in Sweden in 1996, Sweden Post and City Mail had opposite standpoints. Sweden Post claimed the standard view that with low density of demand, delivery costs are high. City Mail argued that congestions, postmen travelling by foot, walking in stairs, having to use door codes etc. made delivery costs higher in large towns. The explanation for low delivery costs in central Stockholm was the high share of delivery into post office boxes. Such delivery is inexpensive because no street delivery is needed. On the other hand, City Mail argued that rural delivery is to gatherings of mailboxes and the use of postbags to remote places is inexpensive. The relationship between population density and delivery costs is probably complex, which is also found in a study by London Economics (2003).
85 Reported to the Government Commission SOU 2005:5
71

The future of USO in Sweden
The Government Commission in 2005 proposed no change in the scope of the USO or the defined quality of service. The license condition for Sweden Post should continue to include the provision of universal services. Sweden Post had declared to the Commission that it would continue to provide them for commercial reasons, but wanted it limited to single piece mail and clarifications in the definition, i.e. if individual contracts were allowed. The Commission rejected Sweden Post’s suggestion that it only should cover single piece mail: bulk mail should be delivered according to the USO, but without a uniform price. The internal policy of Sweden Post for its precise application should be replaced by official guidelines from PTS. The company that provides the services should, according to the Commission, use clear and non-discriminatory prices for USO services. Individual contracts for bulk mail should be allowed, but only to the extent that differences in price are based on cost differences for different clients. Contracts should be non-discriminatory, i.e. contracts with clients where the cost structure is equal should have the same price. Thus, any commercial price discrimination should, according to the Commission’s proposal not be allowed. This would be a more strict application of non-discriminatory prices than today but it would be difficult to control, because contracts with clients are business secrets. Uniform prices should continue only be required for single piece mail. The Commission hints that the scope and cost of the USO can change in the future if postal volumes decline and the time-sensitive mail moves to other forms of communication. Some USO services could then be subject to public tendering, but the Commission estimates that this will not happen in the medium term.
7272

7. Conclusions for liberalisation in other countries
7.1 Reasonable expectations
Experiences from Swedish liberalisation show that the overall economic effects are positive but relatively modest. Liberalisation is no panacea to achieve efficiency and a perfect competition optimum in the postal sector, even less alone drive growth in GDP. Nevertheless, the market has developed in the right direction. The regulatory failures of a legal monopoly have turned out to be larger than the market failures under a carefully designed new regulatory regime. Liberalisation contributes to a better allocation of resources both within the sector and between the postal sector and the rest of the economy. The magnitude of the effects depends largely on the starting point. Sweden Post Office was a relatively efficient postal operator with a modern management prior to liberalisation, so the scope for improvement was smaller than possibly in other countries.
The major effects have been on the prices and productivity. One can conclude that the price structure is radically changed: prices are adjusted to be closer to costs for different products. The extent of change depends on how close to costs prices were prior to reform, but typically they were much too uniform. Moreover, it depends on what kind of price regulation is maintained or created and if it distorts the desired price adjustments while keeping the price level down. Finally, it depends on where entry occurs or is considered potential of the incumbent.
The overall price level of postal services in Sweden has increased around 30-40 % since the liberalisation, or 10-20 % more than the average price level of the economy. However, considering that postal costs, dominated by labour and transportation costs, have gone up 60-70% in the same period, competition has probably had a significant downward pressure on overall prices. This is the result of increased productivity. It illustrates the problem of designing a price cap: in order to stimulate productivity, a price cap may be set at the same rate or even lower than average inflation. If the composition of costs in the postal sector make them rise faster than in the average economy, a price cap can be too tight. That may have been the case in Sweden.
The price level can be expected to decrease if the postal incumbent made large profits before liberalisation and actual or potential competition arise: market power is reduced. It can also decrease if actual or potential competition with a modern, business-oriented management and greater acceptance from politicians and unions can lead to reduction in costs, increased productivity and thus efficiency. In Sweden, the latter rather than the former has been the case. Other important factors for the price level are if economies of scale can be utilised better or if entry limits them, the design of price regulation and if volumes change because of substitution, e.g. by e-mail. In segments where the monopolist initially made losses, the price may instead go up. Finally, the price level will go up if VAT is introduced for end-user products as a reform to make the postal sector equivalent with other competitive sectors in the economy and thus reducing an external distortion.
Innovation can be stimulated, although the Swedish market is not significantly more innovative than other modern postal markets. The main effect is that innovation has come early and Sweden has been in the forefront concerning organisation, variety of supply and
73

price adjustments. Quality of service was already high but particularly in the business segment, old and new firms have turned more customer-oriented.
Before and after Swedish liberalisation, most other countries have rejected market opening because of concerns for the universal service obligation. Sweden Post Office had the opposite view and argued in favour of increasing its independence and competitiveness in the postal and other markets. Evidence has shown that this was correct and USO has been maintained for 15 years without external support. The allocation argument does not hinder market opening and the market failure argument is better met with regulated competition than monopoly.
Table 7.1: Summary of estimated effects on the Swedish postal market 1991-2006
Total effect Effect of liberalisation Market concentration Small decrease Small decrease Volume Before 1998 up, after 2002
down 10% Small increase
Productivity Up Upward pressurePrice level Up 20% DownPrice structure Large changes Large changes Profitability Unchanged, later down UnchangedEmployment Significant decrease DecreaseEmployee’s relative income Small decrease Small decrease Availability Unchanged UnchangedWelfare Higher Higher
In table 7.1, the estimated effects from this report on the postal market during the past 15 years are summarised.86 The results can be commented:
Market concentration is somewhat lower: Sweden Post’s market share is down from 100% to 92%, one main competitor in bulk mail and around 30 in the local mail segment exist. This is entirely an effect of liberalisation.
Postal volumes increased until 1998 and began to fall in 2002. This is mainly not an effect of liberalisation but of a combination of increases in communication in general and substitution by internet and e-mail in the past decade. Liberalisation can have increased volumes somewhat, because prices on bulk mail, which has the largest share, have been reduced. The productivity of the sector has increased. Competitive pressure on Sweden Post after liberalisation improved productivity, particularly the first years when earlier slack in the organisation was removed. City Mail has by innovative organisation contributed to productivity whereas the effect of the local operators is insignificant.
The price level has increased more than inflation because of cost increases for postal inputs. Liberalisation has held back this price increase because of the pressure to increase productivity. The price structure has undergone large changes; mostly an effect of liberalisation.
86 Compare the summary is in SOU 2005:4, p 451.
7474

This taken together has left the sector profitability relatively unchanged until the fall in volumes after 2002 has eroded the profits of Sweden Post. This is mainly an effect of substitution but also a loss of market share to City Mail, which on the other hand has improved its profitability. Employment in the sector has gone down significantly, which reflects the combination of falling volumes and productivity increases due to liberalisation and technical progress. The relative income for postal workers is somewhat reduced, mainly because a small wage premium has been narrowed. The availability was high already before liberalisation and the development since has not resulted in any significant changes.
All effects can be summarised in higher welfare, which means that a deadweight loss as a result of regulatory failures have been reduced. It appears to be mainly a net effect on welfare and no significant redistribution from producers to consumers. The increase in consumer’s surplus goes mainly to senders of bulk mail, but indirectly this benefits ordinary households as receivers of mail and clients of the large mailers.
Starting from this conclusion about the effects in Sweden, in the rest of the chapter a number of recommendations based on Swedish experiences will be given. It must be remembered that the postal markets are still mainly national markets and have historical and cultural differences; the economic conditions differ between countries. Detailed solutions in each case have to be adapted to country-specific situations.
7.2 Get the objectives right
What are the problems to be solved by liberalisation?
The analysis in chapter four resulted in a list of possible problems in the postal market for which liberalisation can be a way to reduce such problems. They have all appeared in the discussion in Sweden and may be present in other countries as well. For liberalisation to be successful, it is crucial to identify its reasons. Then, politicians can justify reforms and the design of the new framework can be adapted to the current situation.
The first possible problem is that the state monopolist is inefficient, even makes losses, and that actual and potential competition will increase the sector’s efficiency by reforms within the state monopolist and/or by growth of new firms. A counter argument has been presented by some politicians and unions in Sweden: employment will suffer if competitive pressure results in reductions in the number of employees. From an economic perspective, it is a benefit, not a loss, if the same or even more production can be obtained with less labour. Then, labour can be transferred to other sectors in the economy, where it can make larger contributions to welfare. Again, it was questioned if all the employees can get a job in other sectors. Then, however, the question is whether the postal sector is the best area to conduct such defensive labour market policy. People who cannot find jobs on the regular labour market could make larger contributions to society in - for example - health care and elderly care than in low-productive postal jobs. Moreover, postal jobs often have inconvenient working conditions with hard physical work at night. It is also a question of who shall pay for labour market policy. It should rather be paid by taxes and not via the postage as becomes the case if the postal sector serves as an employer of last resort. Thus, the employment argument is no good reason for not improving efficiency in the sector. The resistance based on this argument from politicians and unions in Sweden has been relatively weak.
75

The second possible problem is that the state monopolist is making excessive monopoly profits.87 In this case, competitive entry can bring prices down. Excess revenues may be a welcome source of income to the state budget, which in turn may give fewer incentives for reform. There are alternative regulations like price-caps, rate of return regulation and clear goals. However, competition may even be a stronger force than regulation. In the case of the postal sector, in which some segments approach a natural monopoly and if there are entry barriers, complementary regulation is needed. The problem of excess revenues was never mentioned in Sweden before liberalisation, despite the good profitability of the Post Office. After liberalisation on the other hand, complaints have been raised from e.g. PTS that Sweden Post retains a too strong market power.
A third problem is if the competitiveness of the state monopolist is found to be eroded within or outside the postal sector. This was a major concern in Sweden. Other operators threatened the postal business but unlike other countries, Sweden Post Office saw deregulation as a means to meet competition as well as to benefit from business opportunities outside the postal sector.
A fourth problem is low economic growth in general. This was also on the agenda in Sweden. Although the postal sector is important, it represents less than one per cent of GDP. Even if Sweden’s postal liberalisation improved productivity and thus contributed to the growth in Sweden, it is insufficient to solve the entire problem. For regulatory reform to influence economic growth, it must cover more than only the postal sector, otherwise unrealistic expectations will be created about the potential of postal liberalisation. Studies in Sweden (e.g. SOU 2005:4) and elsewhere show that liberalisations in the communications and financial sector in Sweden together have contributed to a high growth rate since the mid-1990s.
The presentation in chapter 4 showed that the goals for liberalisation in Sweden as well as the preceding analysis were unclear and had been subject to later constructions. A justification is that unlike today, there existed no evidence whatsoever of postal liberalisation and postal research was very limited. Clearer goals could have speeded up the adjustment process and made the expectations about what could be achieved more correct.
Set the overall goals for the postal sector
Unlike other sectors in the communications area, there is no overall goal for the postal sector in Sweden. For policy to be consistent, the goal must be specified. The goal for postal policy in Sweden is limited to the objective of the USO. An overall goal should express the desired balance between efficiency (the market argument) and universal service (the allocation argument). A good example is the aforementioned proposed goal in the Government Commission: “…create the preconditions for effective competition between several actors, without distortions and unwarranted restrictions”. Sweden still lacks an overall goal, which limits the possibilities for politicians and the regulator to influence the market in a desired direction.
87 This is not the opposite problem to the first one. The first concerns the cost structure and the second how prices relate to a given cost structure.
7676

7.3 Create a level playing field
Postal services have a long history that cannot be disregarded. The state monopolist has advantages and disadvantages compared to new entrants. Itself, it prefers to underline the burden of the USO, which can be explicitly stated in the law but additionally implicit expectations on it from the public to provide certain services. Obstacles may be present to management’s intentions to reform the organisation for reasons of politics, culture or union’s resistance when it gets exposed to competition. On the other hand, the state monopolist is not only running business, often it owns or controls the postal infrastructure and is simultaneously the regulator of the market itself.88 It has one of the most well known trademarks and the advantage of serving the whole country with all products.
Regulation cannot do away with this background and start a market from scratch. Given the historical background and the economic conditions, there are certain lessons from Sweden that can be applied generally in order to stimulate efficiency without distortions and unwarranted restrictions.
The same level of VAT and other taxes
In Sweden, there was no VAT on the postage for historical reasons: government authorities and businesses were normally exempted from charging VAT. When Sweden Post turned into a public company in 1994, it was natural to introduce a VAT, in particular as Sweden carried out major tax reforms in the early 1990s.89
This reform is the most important and technically easiest to implement. The crucial issue is to have the same VAT level for the state former monopolist and new private entrants. Otherwise, insurmountable barriers to entry will prevail. Whether the level should be zero or the same as for other products is rather a question for tax policy than for postal policy. A zero level implicitly means that postal services are subsidised. If politicians decide that this should be the case, it is fully acceptable as long as also private operators are exempted from charging VAT. Then, there must be a justification why there is no VAT on stamps, if not on similar products like telephone calls, railway tickets or newspapers. Indeed, liberalisation brings the issue of VAT on the agenda, but it is an incorrect conclusion that liberalisation is harmful to households (cf. section 5.3) because it inevitably leads to price increases. If the state believes that postal services should be supported, VAT can be zero or low with as well as without liberalisation.
It is equally important that the state firm do not keep or obtain any other tax advantages compared to new private firms. This covers all kinds of taxes like on fuel for transportation, profit tax or pension benefits. Sweden has not experienced any other such tax problems, but they may exist in other countries depending on the current type of regulation of public enterprises.
88 Recall that in Sweden, despite that Sweden Post Office did not defend the monopoly as such, it had to report City Mail’s entry in 1991 to the public prosecutor. 89 Some products in Sweden have from time to time had a lower VAT than the general 25%. To mitigate the effect of VAT on the postage, it was 12% from 1994 to 1996 when it was raised to 25%: Later, the EU has criticised Sweden for its high VAT on the postage. Introducing VAT on the postage in Sweden was never under any heated political debate.
77

Equal access to the postal infrastructure
In most deregulated markets, there is a certain physical and immaterial infrastructure that is controlled by the former monopolist and regulatory reform must ensure that new entrants gain equal access to such facilities. Such issues can in principle be solved through regulation, through voluntary agreements between operators or between an operator and a third party. When volumes are fairly equal, operators have mutual incentives to cooperate on such issues, but at least initially with a dominant operator, regulation is required. A successful solution was when it was decided already in 1993 that incorrectly addressed mail should not any more be a responsibility of the Post Office; it is now handled by a special unit of PTS. For regional employment reasons, it was located in Kiruna in the very north of Sweden.
There were other substantial operational problems in the early years of postal deregulation before the reform in 1999 and some voluntary agreements between the parties. They have concerned the control of the post code system, new entrants’ access to door codes and mailboxes in flats, the right to put letter boxes along the streets, handling of and payment for forwarding of mail given to the wrong operator and access to central address files. The experience is that the incumbent created unwarranted obstacles for new entrants; a fairly natural response particularly after being used to having monopoly for a long time.
In Sweden, the control of the postcode system is now regulated, although it is still in the control of Sweden Post but with limitations and restrictions. After some years of conflicts, the operators have managed to find solutions to mail given to the wrong operator and created a common address file company. To ensure access to mailboxes in flats’ entrances is up to new operators and time and money for getting access represents an investment cost that is sunk. Depending on the willingness to negotiate, other regulatory solutions can be necessary in other countries, and a regulator should monitor such issues closely in order not to discourage entry immediately after deregulation. The lesson to be learned is that such issue be solved before liberalisation is completed.
Upstream and downstream access to the network of the USO-provider
It is up to the commercial decisions of the operators to offer upstream access to its network for clients. Upstream access has never been regulated in Sweden. When City Mail entered in 1991, the Post Office had no discount for pre-sorted mail. As a consequence of entry and the response by the incumbent, access for customers with pre-sorted bulk mail has been available since. This is not unique for Sweden. Also in some non-liberalised countries, the monopolists offer discounts for pre-sorted bulk mail. In the still heavily regulated postal market in the United States, worksharing was introduced early.
The role of access to the USP’s network is different for postal operators than for customers. Few new entrants can offer nationwide delivery from the start. Like for example telephone companies transfer calls to other operators, it should be possible to forward mail likewise. New operators in Sweden can always pay Sweden Post the regular postage for such mail. Then, however, they will make a loss on each letter. If they carry out the first steps in the production process, they should get a non-discriminatory price from Sweden Post that
7878

represents the cost savings for the larger firm.90 In order to deter entry, the incumbent can charge a too high price for such access.
Until today, the only regulated access in Sweden is for delivery to the post office boxes of Sweden Post. New operators get mail addressed to PO boxes. Both the terms of handling and the price were subject to conflicts during the first years. After decisions from the Competition Authority and amendments to the Postal Act in 1999, Sweden Post receives this mail with a price corresponding to its own cost savings. Standard contracts have been introduced to regulate the specific conditions for handing over this mail.
Partly the Competition Act handles access conditions because dominant firms must provide access on equal and non-discriminatory terms. However, competition law has turned out to be weak and slow because abuses are usually not decided upon in the highest Court of Instance until several years later when a new entrant can already have been forced to exit. Sector-specific regulation has stronger power. Thus, the Government Commission in 2005 proposed that access regulation be introduced in the Postal Act in a similar way, as is already the case for telephone services.
Transitory price regulation only for single piece mail
Price regulation in the form of a price cap has been used in Sweden since the early 1990s. It may be a solution in the first years after deregulation in order to limit the possibilities for the incumbent to raise prices on non-competitive segments. It is difficult to design price regulation in an optimal way and in the long run it may cause regulatory failures. For example in Sweden, the 20g letter is now found to be underpriced (PTS 2002). In itself, this would be an abuse of a dominant position if not a result of sector-specific regulation. It may thus constitute a barrier to entry. As the 20g letter is the base product of postal services, underpricing of it (cross-subsidised by heavier letters) can be counter-productive as it will deter entry of new firms in the single piece market.
As a consequence, the Government Commission in 2005 proposed the abolishment of the price cap, because competition enhanced by access regulation will be a more effective solution when the opened market has matured like in Sweden. The Commission shows that household’s expenses on stamps are very small, just above 200 SEK/year on average. However, PTS together with Glesbygdsverket rejected this proposal. Their justification was that it could harm consumers as well as increase the opportunity for Sweden Post to increase the postage on single-piece mail and cross subsidise bulk mail and drive City Mail from the market. No decision has been taken on this issue by the parliament as of September 2006.
The price-cap and the uniform price in Sweden have never covered bulk mail. As a consequence, the bulk mail market is the most matured where the effects of competition are most significant. Upstream access, price adjustments, individual contracts and introduction of some innovative services have taken place, as was shown in chapter 5.
The right to compete by means of price was a contested issue around 1996 when City Mail re-entered the market and expanded outside of Stockholm to the second and third largest towns
90 Advances in technology may in fact hinder such access. Mail is processed already in the early stages of production, for example bar codes are attached and sorting is carried out down to the order of delivery. Thus, the possibility for other operators to prepare mail is reduced.
79

in Sweden.91 Sweden Post responded by suggesting zonal pricing consisting of four zones: one for central Stockholm, a second for the second and third largest town, a third for another 16 large towns and the fourth zone for the rest of Sweden. The justification was a combination of alleged lower delivery costs in these areas and an additional competitive margin. When the Competition Authority in a preliminary decision refused Sweden Post to implement this price schedule, a new two-zone price list with one price for all the 19 largest towns and another for the rest of the country was suggested. The Competition Authority also refused this list. Two years later, after both Sweden Post and the Competition Authority had appealed the decisions and many lawyers had been involved in the case, the two-zone price list was allowed by the highest instance, the Market Court. It found the first four-zone price list an abuse of dominant position because it was found that Sweden Post had had the intent to drive City Mail out of the market. The proof was the time of introduction and statements in business plans of Sweden Post that it would aggressively meet competition. The second price list was accepted, because Sweden Post was able to prove cost differences between the two geographical areas. It illustrates the principles discussed in chapter 3. A dominant firm is always allowed to price at stand alone cost but should be able to lower prices down to average incremental cost if it does not have the intent to drive its competitor out of the market. However, in 1996, Sweden Post accounting system was not designed to show geographical differences in delivery costs and also later, its calculations have been contested. With a large share of joint costs, it is difficult to prove to competition authorities when prices are above the relevant costs. A conclusion from Swedish experience that fits with PWC (2006) is that fair non-uniform zone prices for bulk mail stimulate efficiency and competition.
The optimal design of regulation in order to create a level playing field is difficult. An equal VAT level, equal access to essential facilities and access to the USO-provider’s network on non-discriminatory terms are the most crucial factors. The precise design has to take into account country specific economic conditions and postal policy goals. After more than 10 years some reforms remains to be carried out in Sweden.
USO is compatible with market opening in many countries
As was discussed in chapter 6, Swedish experience shows that USO can continue to be provided even after more than ten years of liberalisation in a large and sparsely populated country with declining demand. The evidence from Sweden supports several studies of the USO, that the financial burden is relatively small, even if country-specific factors are important.
There is no calculation in Sweden of USO costs. Already before liberalisation, Sweden Post Office claimed that it would be able to provide USO without a legal monopoly. It has been able to do so profitably, even if it hints that declining demand may jeopardise the possibility in the future. Thus, the empirical evidence is overwhelming that – even if there is a financial burden – under current circumstances the benefit of being able to serve all addressees in the country outweighs the costs. Competition has enhanced the provision of USO by stimulating the productivity of Sweden Post as well as eroded some profits.
If the USO is further eroded, it is not because of liberalisation, but due to declining demand that reduces the scale economies. In that case, a return to legal monopoly in Sweden is highly unlikely. There are two alternative solutions. A compensation fund was discussed already in
91 See Andersson (2001, ch 7) for a complete analysis of the legal issues.
8080

the 1990s but never implemented because of the small contributions required at that time. Such a fund is the first alternative and it would also follow the principle in Sweden that each communications sector should finance its demand internally.92 The second alternative is public finance through subsidies from the state budget. It is a question for politics and not postal policy whether it is the postal consumers alone or the collective of taxpayers who should pay for non-commercial services, foremost delivery in remote areas. Through a system of tendering, such subsidy may in fact stimulate competition. If, for example, Sweden Post finds that the delivery routes in certain regions are unprofitable, the state offers the opportunity to any firm that is willing to deliver for the lowest subsidy, as is already the case for unprofitable railway lines. That may trigger a boom of new local operators who can serve the routes with lower costs than Sweden Post.
7.4 A careful design of the role of policy and regulatory authorities
Separation of power within government
After liberalisation in Sweden, the ownership of Sweden Post and the unit responsible for regulation of the market were in the same Ministry. Later, separation of power has occurred, and different ministers are responsible for ownership and regulatory issues but still within the same Ministry. It is important that such separation takes place directly after (or even before) liberalisation and that separation is as complete as possible. Power should be equally distributed. If, for example regulation is under a Ministry for Transportation or Communications and ownership under the Ministry of Finance, it is not unlikely that the latter is superordinate. Concerns for the state-owned company can dominate over regulatory issues and create a bias in favour of the former monopolist, particularly if it generates important revenues to the state budget.
Clear goals for the sector and for state ownership
The issue of unclear goals in Sweden has been discussed previously. In addition, the objectives of having the dominant postal firm owned by the state should be clarified. State ownership in the postal sector has been criticised for having conflicting and vague objectives. SOU 2005:5 gives an example: In 1996 the state as owner of Sweden Post acted by responding with price cuts directed towards City Mail in a way that jeopardised competition that was part of postal policy. In SOU 2005:4, state ownership in principle is discussed in a separate chapter. Insufficient separation of power within the Ministry is regarded as a serious mistake, which causes conflicts of interest. Goals for state-owned companies are found to be multiple and in conflict, unclear and difficult to measure and no mechanisms prevent failure to fulfil the goals. This Commission proposes a more effective leadership function separated from Ministries with regulatory roles together with transparent and measurable goals which are different for monopolised and competitive sectors.
This report proposes a goal for the postal sector related to economic efficiency combined with the politically desired allocative preferences. The proposition of the latest Government Commission is in line with this proposal. So is the suggested goal of liberalisation in PWC (2006:200): “…a way to improve the way the sector is functioning with a view to optimising
92 An alternative is to let receivers along unprofitable routes pay a fixed fee to have mail delivered five days per week. Such fees could increase efficiency but may get in conflict with the principle of a uniform price.
81

the services provided to customers and citizens and the long-run value created by both postal organisations and other communication service providers with whom they compete”.
A carefully designed role for and composition of the regulatory authority
When the market is opened it is necessary to have a regulatory authority. PTS in Sweden has been given relatively weak responsibilities. Overall, PTS has contributed to the development of the market.
It is important that a regulator is given integrity and independence, sufficient competence and clear goals. In the beginning, knowledge about the postal sector is often limited to the former monopolist and it can be difficult to recruit people that are unbiased. Capture theory underlines the risk that a regulator serves the interests of the incumbent. The Government Commission (SOU 2005:4) discusses this risk and has several proposals for avoiding such capture. In the postal sector in Sweden, there is no evidence of regulatory capture (Andersson 2001), rather the opposite as PTS occasionally has acted in order to promote the conditions of competitors. PTS has repeatedly asked for being responsible for promoting competition in the postal sector (as it is in the telecom sector). It has been rejected with the argument that competition matters are handled by the Competition Authority. Such a responsibility for PTS has again been proposed by SOU 2005:4 and a partial responsibility by SOU 2005:5. The distribution of power and roles of the regulator, the Ministry and the Competition Authority should be made clear.
An even better solution proposed in this report is that the regulator is given the goal to promote the fulfilment of the postal policy goal. Once such a goal is decided upon, it should be the ultimate goal for the regulator. Then, competition turns from being the goal to a means of achieving the goal. It becomes easier for a regulator to find the optimal balance between the interests of the incumbent, new firms and consumers. The regulator needs competence in legal issues, economics and accounting in order to fulfil its objectives. It also needs the power to look into the accounting of the dominant firm.
In Sweden, after liberalisation only a mandatory notification to the regulator was required for new firms. After the reform of the Postal Act in 1997, a licence requirement was introduced. It is important that this licence is not a barrier to entry. The relatively simple procedures for getting a licence in Sweden have been beneficial. The fee for small firms must be low and the requirements for starting a new firm should be limited to control if the firm can fulfil regulatory requirements of security and integrity. There should not be any commercial judgement from the regulator, whether the firm can become profitable or not. Such control is not used in other markets, and new entrants in the postal sector must be allowed to fail. The licence requirement in Sweden has rather served as a help to entry. New entrants can have problems with a lack of trust in a new, unknown firm compared to the old Post Office. Customers in Sweden regard it as a sign of quality when new entrants can show a licence from the regulatory authority.
The problem with failure in the postal sector is if mail remains undelivered from a failing firm. Such problems have occurred with failing airlines when passengers are left on their destinations. Failing new entrants in Sweden have not caused such problems so far, because they have so small volumes. It could be included in the license requirement for the universal service provider that it has the obligation to deliver mail from failing new entrants. If in the
8282

future, competitors grow and become large, the government may guarantee that it pays for such a delivery.
Information and transparency
An unfortunate consequence of liberalisation in Sweden is the lack of basic information about the postal sector. SIKA, the authority responsible for statistics in the communications area complains each year about the reluctance of Sweden Post to disclose information.93 Detailed postal statistics in Sweden go back to the 19th century but ceases in the 1990s. Even more important, as mentioned in the previous section, is that the regulator gets access to relevant information. During most of the time after liberalisation in Sweden, this has been an ongoing problem.
7.5 Separation of activities
This report concerns the liberalisation of the postal market, which for Sweden in practice means the letter market because parcels, unaddressed items and newspaper delivery was never monopolised. A final recommendation, is the separation of postal services from other non-related activities.
The Post Office has engaged in the financial sector in Sweden since the 1850s94 when the easiest way to transfer payments from one place to another was to send money in assured letters. In the 1850s, the Post Office offered a new service: money could be paid at the post office and only a notification was sent to the recipient, who could go to another post office and pick up the money. Less money was physically transferred and the risk of theft reduced. Later, the Post Office opened a bank in 1884, when the state wanted to stimulate saving among the poor people and found that the best organisation was the Post Office who was separate from private commercial bank’s interests and had a widespread network of offices. In 1925, the postal giro was started. Originally it was a way to simplify the payments from the state but it became popular for small businesses and wealthy ordinary people. In 1960, the postal giro and the postal bank merged. Historically, there is an explanation to why postal services are connected to the financial services provided by the Post Office. This connection has later eroded.
In 1974, the postal bank merged with a private bank, which later became Nordea, today one of the four large Swedish banks. The Swedish state is its largest shareholder and together with Telia (Telecommunication), it is the largest company with state ownership in Sweden. The Postal giro was sold in 2001. Post offices have continued to provide over the counter services for payments. However, fewer payments are made in offices nowadays. In the past years, the number of these payments fell by 16 % per year; today only one per cent of household’s payments are made at an office.95 Since the beginning of the 1990s, the post office network made annual losses of around 1 billion SEK (approximately the same as the profits of the letter business). The economies of scope between postal and financial services that existed in the past are today eliminated. In 2001, Sweden Post proposed to the government that its financial services should be separated from the company. The government disagreed, but since then, the financial services have been put in a separate subsidiary of Sweden Post,
93 For example in the foreword to SIKA: Postverksamhet 2005.94 Bladh (1999) 95 PTS (2006)
83

Svensk Kassaservice. The company receives 400 million SEK in subsidy to provide unprofitable over the counter services, but is nevertheless making annual losses despite significant reductions in the number of offices and increased fees for its services. There is an obvious risk that postal services have to finance unprofitable services in the financial sector. These services worsen the financial result of Sweden Post and even more importantly the reduction in the network of offices have given the company a bad public image.
Another anomaly is that the provision of financial services has been regulated in the Postal Act and that it is PTS who should monitor this provision. Several reports (Andersson 2004, SOU 2004:52, SOU 2005:4) have suggested the complete separation of financial services from Sweden Post and the postal sector. Regulation ought instead to be moved to the framework and authorities in the financial sector. The Government Commission in 2004 estimated that a shift to the banking sector combined with a system of tendering for unprofitable services in remote areas would lower the cost for society by around 200 million SEK per year. However, as of September 2006, no government bill has been submitted in this issue.
A lesson can be learned from the well-intentioned reform of the network in 2001. Sweden Post ceased to have post offices. Instead, the remaining outlets for financial services moved into Svensk Kassaservice, usually in former post office locations. Postal services moved into post centres, mainly for small businesses and parcels, or to grocery stores, gasoline stations or other conveniently located places. Stamps are sold in many regular shops. For at least a transitory period, many people were confused about where to find different services. Especially when Svensk Kassaservice remained in the locations of post offices, people considered it inconvenient not to be able to buy stamps, send or pick up letters and parcels there. Later, Sweden Post has adjusted its network of outlets in order to make it easier to identify where different products are offered.
7.6 Conclusion
In this chapter, the summary of the effects of liberalisation was that effects are positive, but considering the situation before liberalisation, modest. A number of considerations for other countries have been suggested.
One can conclude with a glimpse into the future. In the beginning of this report, the issue of natural monopoly was discussed. If postal services are not a natural monopoly, except for certain limited parts, is there another ‘natural’ market structure that will evolve? Based on the model in figure 1.1, it does not exist a pre-determined market structure given certain economic conditions and regulatory environment. It depends on the strategic actions of the former monopolist as well as the entrepreneurial spirits of potential new entrants. But three different types of market structures are realistic.
1. The former monopolist remains as a dominant firm but is limited in market share by new fringe firms and upstream access. In the medium term, this is the most likely scenario. New entry can occur:
(a) in small geographic areas with a range of products (b) in large regions or even nationwide wide one/few products
8484

2. The market develops into oligopoly with 2-4 firms that provide all postal services. This scenario is not very likely, because of scale and scope economies and declining volumes. In the longer run on markets with high volume, it is possible to have several firms that offer services nationwide and compete over customers but who cooperate in delivery with a negotiated system of access to each other’s network (ressembling the telephone market).
3. The market remains basically a monopoly with limited upstream access and very little entry. If volumes decline sharply and barriers to entry (like unequal VAT) remain, this scenario is not unlikely. It can take two forms:
(a) the former state monopolist retains the monopoly (b) the former monopolist is outcompeted by another firm
The first alternative is more likely because the existing firm has advantages. But if it is sufficiently inefficient and fails to adjust, another firm can take over the monopoly with lower costs. This scenario underlines the role of market opening; it is often assumed that the current monopolist will always be there, but experiences from the airlines show that an inefficient national monopolist can lose its position.
As is concluded in the recent study from PWC (2006), universal services will continue to be provided in most countries. National differences are great and in some low-volume, sparsely populated countries with inefficient organisations, it may be jeopardised. Such countries are the ones in most need of reform and liberalisation can improve conditions. Alternative ways to finance unprofitable services – such as tendering - are economically a better solution than a reserved area.
85

References
Andersson P. (2000): Lokala postoperatörer i Sverige. Tema T, Working Paper no 209, Linköping university.
Andersson P. (2001): Deregulation and Internet – new challenges to postal services in Sweden. Linköping studies in Arts and Science no 228. Linköping university (diss.)
Andersson P. (2004): Tio år efter postmarknadens avreglering: effekter och reformförslag. Swedish Competition Authority, April 2004.
Baumol W.J. (1977) "On the Proper Cost Tests for Natural Monopoly in a Multiproduct Industry," American Economic Review, Vol. 67, No. 5 (December 1977), pp. 809-822.
Baumol, W.J., Panzar J.C., and Willig R.D.: Contestable Markets and The Theory of Industrial Structure, New York: Harcourt Brace Jovanovich, Inc., 1982.
Bladh M. (1999): Posten, staten och informationssamhället. Kommunikationsforskningsberedningen report 1999:10.
Bradley M.D., Colvin J.L. and Smith M.A. (1993): “Measuring Product Costs for Ratemaking: The United States Postal Service”. In Crew M., Kleindorfer P.: Regulation and Nature of Postal and Delivery Service.Kluwer.
Carlton-Perloff (2004): Modern Industrial Organization. Addison-Wesley.
Cazals et al (1997): “Scale Economies and Natural Monopoly in the Postal Delivery: Comparisons Between Parametric and Non Parametric Specifications. In Crew M., Kleindorfer P.: Managing Change in the Postal and Delivery Industries. Kluwer.
Cazals et al (1999): “Cost Structure of Postal Service in France”. Report presented at the conference “Competition and Universal Service”, Institut d’Economie Industrielle, Université de Toulouse 26-27 March 1999.
Cohen R.(2002): “The Role of Scale Economies in the Cost Behaviour of Posts”. www.prc.gov.
Cohen R. et al (2006): “The Impact of Competitive Entry into the Swedish Postal Market”. Paper presented at the Rutger’s University annual conference on Postal and Delivery Services, Bern, Switzerland June 3, 2006.
Crew & Kleindorfer (1991): “Rowland Hill’s Contribution as an Economist”. In Crew M., Kleindorfer P.: Competition and Innovation in Postal Services. Kluwer.
Crew M. and Kleindorfer P. (1998): “Efficient Entry, Monopoly, and the Universal Service Obligation in Postal Services”. Journal of Regulatory Economics, Volume 14, pp 103-125.
EESC (2003): Services of General Interest. EESC Pamphlet Series.
Faulhaber G.R.(1975): “Cross-Subsidation: Pricing in Public Enterprises”. American Economic Review 65 (No 5, December): pp 966-977.
Free and Fair Postal Initiative (2005); http://www.freefairpost.com
Glesbygdsverket (2006); www.glesbygdsverket.se/
Government’s bill 1990/91:87: Näringspolitik för tillväxt
Government’s bill 1991/92:38: Inriktningen av den ekonomiska politiken
Government’s bill 1991/92:100: Budgetpropositionen
Government’s bill 1992/93:132: Vissa frågor inom Kommunikationsdepartementets område
8686

Government’s bill 1995/96:218: Ändringar i Postlagen m.m.
Government’s bill 1997/98:127: Statens ansvar på postområdet
Government’s bill 1998/99:95: Postal infrastruktur
Government’s bill 2001/02:1: The budget bill
Government’s Proclamation 1947:175.
ITPS (2004): Samhällsekonomisk analys av effekterna av liberaliseringen av postarknaden – underlag och överväganden för Post- och kassaserviceutredningen. Falkenhall B: och Kolmodin A. Swedish Institute for Growth Policy Studies.
Letter of Regulation for PTS 2006. http://www.pts.se/Archive/Documents/SE/Regleringsbrev_2006.pdf
London Economics (2003): Study of the Consequences of Further Liberalisation of the Postal Market in Norway. Report for the Norwegian Department of Transport and Communications.
Ministry Report Ds 1991:44: Postens Konkurrensförutsättningar.
Ministry Report Ds 1991:77: SJ, Televerket och Posten – bättre som bolag?
Ministry Report Ds 1995:76: Post- och kassaservice åt alla
Ministry Report Ds 1997:58: Statens ansvar på post- och betaltjänstområdet
NERA (1998): Costing and Financing of Universal Service Obligation in the Postal Sector in the European Union. http://ec.europa.eu/internal_market/post/studies_en.htm
Panzar (1991): “Is Postal Service a Natural Monopoly?” In Crew M., Kleindorfer P.: Competition and Innovation in Postal Services. Kluwer.
Postcomm (2001): An assessment of the costs and benefits of Consignia’s current Universal Service Provision.www.psc.gov.uk
PTS (1996): Den postala infrastrukturen. PTS rapport 1996-03-08.
PTS (1998): Pris- och serviceutveckling för stora brevsändningar under 1990-talet – en fallstudie. PTS rapport 1998-06-11.
PTS (2002): Uppföljning och utvärdering av prisregleringen för vissa posttjänster.
PTS (2003a). Den samhällsomfattande posttjänsten - Postens brev- och logistikverksamhet 2000-2001.
PTS (2003b): Nio år med postlagstiftningen – en utvärdering.
PTS (2004): Den svenska postmarknaden – en beskrivning och övergripande analys.
PTS (2006a): Service och konkurrens 2006.
PTS (2006b): Undersökning av befolkningens post- och kassavanor 2006.
PTS’ database of postal prices. Communication from PTS.
PWC (2006): The impact on Universal service of the full market accomplishment of the postal internal market in 2009. PricewaterhouseCoopers - May 2006. http://ec.europa.eu/internal_market/post/studies_en.htm
Rogerson C. and Takis W.M. (1993): “Economies of Scale and Scope and Competition in Postal Services. In Crew M., Kleindorfer P.: Regulation and Nature of Postal and Delivery Services. Kluwer.
87

SFS 1993:1654
Sharkey W.W. (1982): The theory of natural monopoly. Cambridge: Cambridge University Press.
SIKA (2005): Postverksamhet 1995-2005
SOU 1990:27: Post och tele – affärsverk med regionalt och socialt ansvar
SOU 1993:9: Postlag.
SOU 2004:52: Samhällets behov av betaltjänster.
SOU 2005:4: Liberalisering, regler och marknader.
SOU 2005:5: Postmarknad i förändring.
Statskontoret (2004): Avreglering av sex marknader. Swedish Agency for Public Management.
Svensk Kassaservice, www.svenskkassaservice.se
Svenska Dagbladet August 31, 2006
Sweden Post Office/Sweden Post Annual Report 1990-2005
Sweden Post Office/Sweden Post Semi-Annual Report July 2006
Swedish Quality Index (2006); www.kvalitetsindex.se
WIK (2004): Main Developments in the European Postal Sector.http://ec.europa.eu/internal_market/post/studies_en.htm
8888


Plaut Economics Baslerstrasse 37 CH-4600 Olten www.plaut-economics.ch
phone +41 62 205 55 60 fax +41 62 205 55 70 [email protected]
Opening postal markets in Switzerland
Monopolistic bottlenecks, technical co-ordination and social regulations
Patrick Zenhäusern
Dr. Stephan Vaterlaus
Olten, 23rd January 2007

92
Table of contents
1 Introduction ...............................................................................................................932 Market power regulation...........................................................................................96
2.1 Network-specific market power .......................................................................962.2 Monopolistic bottlenecks within letter mail delivery services? .........................982.3 The Swedish experience: No regulation of monopolistic bottlenecks ............ 1032.4 Possible regulatory approaches to consider in Switzerland........................... 104
3 Technical co-ordination regulation ....................................................................... 1053.1 Approaches of the EU member states and the Commission ......................... 1053.2 Possible regulatory approaches to consider in Switzerland........................... 107
4 Social regulation ..................................................................................................... 1104.1 Disambiguation – market failure versus USO................................................ 1104.2 Implementation of USO in Sweden ............................................................... 1114.3 Possible regulatory approaches to consider in Switzerland........................... 114
5 Conclusions ............................................................................................................ 1206 Sources.................................................................................................................... 122

93
1 INTRODUCTION
In the EU, the postal markets have been partially liberalised and further steps to fully open them are already in preparation. A full market opening is planned for 2009. In October 2006, the European Commission recommended a confirmation of the 2009 objective. The main change in 2009 would be the removal of the concept of “reserved areas” according to which member states can restrict access to certain operators. Some member states have gone farther than required by the EU and have already completely removed the reserved area (Sweden, Finland, Estonia, Great Britain), others are envisaging the removal of the reserved area in 2008 (Germany, Netherlands).
In the present report, the development of the postal market in Sweden is focussed on the basis of a survey recently established by Peter Andersson1 on behalf of the State Secretariat for Economic Affairs (SECO). This report is explicitly not meant to be understood as a comprehensive view on opening possibilities of the Swiss postal market based on the “early mover” countries mentioned above; in fact, it primarily draws conclusions and provides information based on the development in Sweden, as described by Andersson.
In Switzerland, the “reserved area” mainly concerns letters of up to 100 g that only Swiss Post is allowed to deliver. Further steps towards liberalisation are planned as well.
The report at hand serves as a basis to approach further steps to be taken by Switzerland within this European context and discusses also possible problems that might arise. The report considers
- positive issues, e.g. the question whether an ex post or a temporally restricted ex ante regulation should be introduced to accelerate and support the liberalisation process;
- normative issues, e.g. it addresses the main regulatory issues that have to be solved in a fully liberalised environment assuming a need for a Universal Service Obligation (USO);
1 Andersson, P. (2006), The liberalisation of postal services in Sweden – goal, result and lessons for other countries, Linköping.

94
- implementation-focussed issues, mainly based on experiences of the liberalisation process of postal services in Sweden2. Failures and success stories are analysed in order to draw regulatory consequences for Switzerland.
Basically, a liberalisation process in network industries is challenged by different types of regulatory issues to be solved simultaneously. Much depends on the disaggregated analysis of the concrete market situation, e.g. whether only economies of scale are at stake or whether there are economic arguments for allowing competitors to have access to networks and similar facilities, since they characterise a stable “monopolistic bottleneck”. In the latter case, undistorted competition in a liberalised network sector can normally only emerge if the residual network-specific market power of the incumbent(s) is disciplined by so called sector-specific rule settings. Thus, sector-specific
“market power regulations”
may be necessary. There are other issues, related to technical co-ordination that are dependent on conventions established in the past. In the postal sector, there are several such issues that need to be solved in order to establish non-discriminatory rules for all market players regarding the use of the postcode system, address databases, PO boxes (boxes located in an office of the postal incumbent and used for the receipt of mail), collection and delivery boxes, information on change of address, redirection service and return-to-sender service. This leads to the necessity of sector-specific
“technical co-ordination” and/or “sovereign regulations”
that are to be implemented in order for competition to work smoothly and without obstruction. Historically, several network industries (such as energy, telecommunications and the postal sector) used to have a politically legitimated distribution mandate, defined by an USO. The reason for such an obligation is the existence of social policy goals. Historically, USOs were assigned to a specific administration or company, mostly owned by public authorities. In a liberalised environment, the guarantee of USOs is still a political issue, and therefore so called sector-specific
“social regulations”
need to be designed. However, regulations that go beyond market power, technical/sovereign and social regulations (e.g. employment policy of a state owned postal operator) should not be part of any sector-specific legislation.
2 The basis of the information on Sweden’s postal market liberalisation is derived from Andersson (2006).

95
This report is organised as follows: Section 2 deals with the issue of sector-specific market power regulations. It explains how network-specific market power is identified from an economic point of view. This approach is then applied to the postal sector. After a brief description of the situation in Sweden, possible lessons to be learned for Switzerland are presented. Section 3 tackles the issue of technical/sovereign regulations, while Section 4 raises the issue of social regulations. Both chapters again include insights gained in Sweden and conclusions drawn for the situation in Switzerland. Final conclusions are drawn in Chapter 5.

96
2 MARKET POWER REGULATION
2.1 Network-specific market power
General competition legislation aims at protecting competition in markets with general provisions that are applied on a case-by-case basis. Inquiries are triggered by complaints or started on the competition authority’s own initiative. In contrast, sector regulations in network industries continuously deal with sector-specific issues, which are often of a technical nature. However, the establishment of sector-specific regulations can hardly avoid being implicitly or explicitly motivated by and modelled after a number of competition-led considerations (e.g. access regulations of regulations establishing competition for the market).
Nevertheless, it is important not to confuse network specific market power with market power that is regulated by competition policy. Approaches of competition law with respect to merger control, cartel prosecution and the regulation of abusive behaviour must be distinguished from those of sector-specific regulation. Thus, criteria such as market share, turnover, transaction costs, financial strength, access to the capital market, negotiating power etc., that are usually taken as criteria, e.g. to examine a merger case, should not be relevant when identifying network-specific market power. Whereas, these criteria have their significance, they have no bearing on sector-specific regulatory action (Knieps, 2005, p.131 und p. 145 et seq.).
Networks are complex systems. They consist of nodes and links that are developed differently according to the special network organisation. Usually, networks consist of physical nodes and links such as traffic networks, lines for power supply and telecommunications networks. Postal networks are characterised only by nodes. In this regard, an analysis of network-specific market power differs from an analysis for comparable networks with physical links.
Sector-specific regulatory bodies need to tackle issues that are very typical or special to their industry. Therefore, in order to limit sector-specific market power regulation to where it is necessary, it is necessary to target clear-cut criteria that are applicable to the specific sector in question. From an economic point of view, one should focus on the long-run cost asymmetries between incumbent and potential entrants (Stigler, 1968, p. 67):
“A barrier to entry may be defined as a cost of producing (at some or every rate of output) which must be borne by a firm which seeks to enter an industry but is not borne by firms already in the industry”.

97
Because economies of scale do not cause long-run asymmetries between incumbent and potential entrants, they do not in itself constitute an entry barrier3. This is confirmed by the theory of contestable markets, which analyses the role of potential competition with identical cost functions for active and potential competitors (Baumol 1977; Baumol et al., 1982). On the other hand, the contestable market approach does not take into account sunk (irreversible) costs, a common cost characteristic of most network industries. A new entrant might anticipate that an incumbent could defend its market share by reducing its prices in the range of its irreversible costs, a simple form of strategic behaviour.
Thus, the question arises whether sunk costs are an entry barrier. A certain share of irreversible costs belongs to the common risk of any market entry. In markets with many providers, irreversible costs in combination with volume-dependent variable costs do not constitute a (considerable) entry barrier. Where a market is served by a lot of firms, production is characterised by increasing marginal costs. Assets that may only be used within the branch usually are usually sold on secondary markets among competitors in secondary markets. Under such conditions, sunk costs do not significantly distort competition. This is the normal competitive case. If, however, within the relevant scope of demand, sunk costs are associated with a digressive cost curve as a result of economies of scale, economies of density or bundling, the respective market is not contestable anymore. The existence of sunk costs in combination with economies of scale does imply an entry barrier that strengthens the market power of the incumbent firm. Economists call this a “monopolistic bottleneck”, lawyers an “essential facility” in the sense that the facility is essential for reaching customers. They identify two conditions that are necessary in order to verify the existence of an essential facility:
(1) No substitute is available. Due to economies of scale, a natural monopoly is present. A single supplier can provide the facility at lower costs than a group of suppliers (the first criterion for a monopolistic bottleneck).
(2) A facility cannot be replicated by any reasonable means. This is the case if the costs for building the facility are sunk (the second criterion for a monopolistic bottleneck).
The regulation of network-specific market power – from an economic point of view – is only justified in “monopolistic bottleneck” areas (see [1] in Table 1). In all other cases, the existence of potential (see [2] in Table 1) and active competition (see [3] and [4] in Table 1) lead to efficient market results because the pressure of potential competition disciplines the behaviour of the incumbent firm(s) (e.g. Baumol et al., 1982).
3 To understand the basics of “barriers to entry”, see Stigler (1971), v. Weizsäcker (1980 a & b and 1984).

98
Table 1 Detecting monopolistic bottlenecks within networks in general
Network area With sunk costs Without sunk cost
Natural monopoly (bundling advantages)
[1] Monopolistic bottlenecks [2] Potential competition (contestable networks)
No natural monopoly (bundling advantages exhausted)
[3] Competition among active providers
[4] Competition among active providers
Source: Knieps (2006).
The theory of monopolistic bottlenecks is an economically sound instrument for localising and disciplining remaining network-specific market power in all network sectors (such as the railway sector, air traffic, telecommunications, postal markets). Thus, it needs to be determined if there are segments in postal markets that fulfil the criteria of network specific market power.
2.2 Monopolistic bottlenecks within letter mail delivery services?4
Monopolistic bottlenecks should always be localised in a disaggregated way (see Andersson, 2006, p. 13). Hence, the specific question is whether the system of letter conveyance (complementary and economically viable functions like collecting, sorting, transport, delivery and logistics) constitutes a monopolistic bottleneck. This is analysed in the following chapter. Technical functions of co-ordination are of a different nature and are therefore treated separately (see Chapter 3).
Collecting services
In the postal sector economies of bundling exist with regard to the collecting process. Letters are handed in at post offices and large-scale collecting facilities. Therefore, new entrants initially focus their market access strategy on large-scale customers. However, the building-up of collecting facilities does not involve sunk costs. Real estate, office space etc. can be adapted to different uses, letter boxes can be moved to other locations. Transport activities for the collection of mail are not bound to specific routes. Therefore, it can be
4 See also Knieps, 2006, pp. 9-22; Andersson, 2006, pp. 11-17; de Bijl et al., 2006, pp. 9-17.

99
concluded that mail collecting is not a postal network function characterised by a monopolistic bottleneck.
Sorting services
Sorting centres operate as centres for sorting outgoing mail (evenings) and sorting incoming mail (mornings). Today most sorting activities are automated. Sorting machines are even capable of performing additional logistic services. There is a wide range of sorting machines available; some of a high technological level. Depending on the product range, the product quality, the amount of mail to be processed and other relevant factors, each postal operator has its own strategy regarding sorting machines and sorting centres. Sorting is certainly characterised by economies of bundling in the form of economies of scale (relevant for separating sorting services according to letter size) and economies of scope (relevant for correcting addresses, sorting by hand etc.). However, no sunk costs are involved. Buildings and other fixed infrastructure can be used for other industrial processes, sorting machines and other equipment can be moved to new locations. Thus, sorting facilities cannot be characterised as a monopolistic bottleneck. It is also implausible that, e.g. due to a possible fall in volume of letter post, sorting facilities might be characterised as monopolistic bottlenecks in the future, i.e. that new entrants would no longer be viable without access to these facilities. Rather, in future different logistic concepts and the resulting processing chains might imply a variety of distribution centres and machines for pre-sorting or fine-tuned sorting.
Transport services
In principle, all modes of transport can be used, e.g. lorries, trains and airplanes. Economies of scale are significant on the regional level, for instance in rural areas. The German Monopoly Commission (Monopolkommission) (2005, p. 48 et seq.) considers there to be the characteristics of a natural monopoly to be present in the letter transport network. Sunk costs, however, are not involved in the transport sector. Hence, no source for monopolistic bottlenecks can be detected in the transport function of postal markets5.
5 Nevertheless, the German Monopoly Commission recommends non-discriminatory access to the incumbent’s PO boxes, address files as well as to its distribution network in order to enable new postal providers to enter into end-to-end competition with the former monopoly provider.

100
Delivery services
Mail is delivered on foot, by bicycle, by motorbike or by car. There are economies of scale involved in delivery. The higher the population density, the larger the amount of letters to be delivered; and the lower the number of stops required, the lower the average cost of delivery. Such economies of scale, however, are not combined with sunk costs. Delivery personnel and vehicles are mobile factors, not tied to a specific delivery district. Delivery is less time-consuming for an experienced mail carrier. However, learning costs do not constitute cost asymmetries and are incurred by all postal companies.
The so-called Bronner Decision6 set a very high threshold in the EU for access regulations to be justified with reference to delivery. The decision was a breakthrough because it brought the legal framework in line with economic principles. It was argued that the refusal of a publisher to grant another publisher access to its home delivery service constituted an abuse of the former’s dominant position. As outlined in the Attorney General’s Opinion7:
“…it must be extremely difficult not merely for the undertaking demanding access but for any other undertaking to compete”.
Thus, it must be physically impossible, let alone commercially unattractive for competitors to replicate the facility in question. Applying the non-contestability test to the presumed essential facility, it is clear that the distribution network does not constitute a non-contestable facility. While there may be, to a limited degree, some natural monopolistic characteristics present, there are no sunk costs that would constitute an entry barrier to potential entrants. Thus, from an economic point of view, there is no need to either regulate such markets ex ante or grant access ex post.8
Incidentally, logistic concepts do not constitute monopolistic bottlenecks, either. Depending on the product range and service qualities, postal operators use different logistic concepts. This variety of concepts is based on the strategy and concomitant type of services of each postal firm (mass market or high quality services, end-to-end services or partial services, local, regional or national services).
6 Oscar Bronner GmbH & Co. KG v. Mediaprint Zeitungs- und Zeitschriftenverlag GmbH & Co. Case C-7/97, Judgement of the Court, 26 November 1998, European Court Reports 1998, p. I-07791; see also de Bijl et. al., 2006, p. 5. et seq.7 Attorney General’s Opinion, paragraph 66 (http://eur-lex.europa.eu/LexUriServ/LexUriServ.do?uri=CE-LEX:61997C0007:EN:HTML, called up in November 2006). 8 However, in practice Germany and UK have implemented some mandatory access to sorting facilities of universal service providers (WIK, 2006, p. 5).

101
Is there a need for access regulations?
None of the postal functions outlined above can be characterised by a natural monopoly in combination with sunk costs (see Table 2). Thus, stable monopolistic bottlenecks are not observable within postal markets.
Table 2 Detecting monopolistic bottlenecks within postal networks
Network area Natural monopoly (economies of bundling)
Sunk costs
Collecting Yes No
Sorting of outgoing and incoming mail Yes No
Transport No No
Delivery Yes No
Source: Knieps (2006), modified by Plaut Economics.
From an economic point of view, there is no basis for the implementation of sector-specific regulatory measures regarding market power within the postal market. Regardless, there is some discussion regarding the non-acceptance or delivery lags of competitors’ mail items by the postal incumbents in geographic regions where competitors do not have their own delivery services. The argument is linked with two other arguments. However, both of them are unimpressive:
(1) It is perceived, that economies of scale of the incumbent combined with brand loyalty may create an entry barrier. This mindset is even in line with a statement by the European Commission (2005): “Access can help facilitate market entry for upstream consolidators. New competitors wanting to establish a delivery network can also use access for a transitional period to build up customer relationships and volume before being able to compete end to end with the incumbent”.
From a normative point of view, however, we concur with Stigler that scale economies do not constitute an entry barrier (see p. 6 et seq.). Moreover, the cost function of the incumbent is not at all relevant for a new entrant because the latter normally does not choose to mimic the business models and networks of the former. New entrants focus on B2B and B2C. In the Netherlands, according to Kok et al. (2003, p. 29), a postal entrant would need about 10% of the volume in order to be able to compete with TNT Post.
102
Regarding brand loyalty, in the UK Moriarty and Smith (2005) show that retail customers’ awareness of postal competition is indeed low. Yet this is of little relevancy because a predominant part of the revenue of a postal operator is realised by large customers anyway. In addition, such players quickly switch to better offers, if available. As in the Netherlands, 50% of the mail originates from 500 to 600 large senders (de Bijl et al, 2006, p. 12). “Entrants can keep their operations straightforward and cheap by targeting a few large senders that generate sufficient volume. Indeed, several successful entrants … such as CityMail in Sweden, and Sandd and Selektmail in the Netherlands, seem to adopt models of this type” (de Bijl et al., 2006, p. 12).
(2) It is also assumed that new entrants initially do not have their own nationwide postal services network but have the strategy to build it up in the course of time.
On that condition, the issue of different production strategies (make or buy) for postal firms is not considered. However, in liberalised network sectors as well as in the postal market there is a variety of (entry) strategies. Entry occurs at different scales. Therefore, the regulatory framework should “avoid creating a bias in the strategic decisions of entrants in favour of a business model fostered by the regulatory intervention” (de Bijl, 2006, p. 15). Under regulated access conditions, however, postal competitors, even with the initial strategy to develop a countrywide postal network, would have less or no incentive to realise it any more. On the contrary, inasmuch as their reputation and geographical network reach would in fact increase, they would run the risk of the regulator reducing the incumbents’ downstream access obligations.
According to the Bronner Decision, (even) a (temporarily) regulated access in order to guarantee new entrants delivery of postal items in areas where they do not have their own delivery points, is a critical issue. On an outside estimate, such an obligation could be considered – if at all – only for “time critical” mailings. If the eligibility is considered for all sending, regulation goes far beyond regulating monopolistic bottlenecks. The essence of such an intervention would be structural policy. If the latter is a policy aim, it can certainly be realised. However, it should be made transparent as structural policy and not executed in the guise of preventing the abuse of market power.
In fact, the current appraisal of a “hands-off” approach in the postal market can change according to market dynamics. For the time being, no stable monopolistic bottlenecks can be seen in postal markets. In telecommunications, market dynamics contribute to a shrinking of existing bottlenecks (see Blankart et al., 2006). The character of shrinking (and increasing) bottlenecks is a fact within the network industry. This is why one necessarily has to ask if it is the case in the postal sector as well that temporarily emerging monopolistic bottlenecks change their character into stable ones. In the latter case, access regulations would in fact be legitimate.

103
2.3 The Swedish experience: No regulation of monopolistic bottlenecks
In Sweden, liberalisation began in January 1993 (“de facto”) and in March 1994 (“de jure”), respectively, without any access regulation concerning the incumbent’s collection, sorting, transportation or delivery facilities.
“The fundamental question about postal monopoly was treated only in a single sentence in the report. ‘Free competition is generally regarded as a valuable means of making postal services as efficient as possible’” (Andersson, 2006, p. 21, citation in the Postal Act, January 1993).
Neither in the first (1997) nor the second revision (1998), access regulation with regards to market power was introduced9. The third revision in 1999, however, introduced access regulations to selected postal infrastructures. It was aimed at implementing conditions for a more competition-neutral use of the incumbent’s postal infrastructure, caused by ongoing operational conflicts between City Mail and later local operators and Sweden Post (Andersson, 2006, p. 22). Mainly10 the postal code system and access to PO boxes (see Chapter 3.1) were under dispute. Thus, the discussion was not about stable market power in a strict sense but about practical issues regarding the management of assets that historically did not need co-ordination (technical co-ordination regulation).
Networks consisting only of “nodes”, as it is the case within the postal sector, have not been considered to be an “essential facility” in Sweden so far11. It is important not to generalise and assume that this practice is applicable to all networks without links. Networks consisting only of “nodes” can very well have characteristics of “essential facilities”. The first time the European Commission applied the essential facilities doctrine was in just such a case, namely in the case of & /Sealink12, concerning the use of the port
9 There has been price regulation on single piece mail, originally justified by protecting small customers, and – a further justification – preventing the incumbent from charging too high prices for non-contested mail.10 The use of the address file company and conditions for forwarding mail were an issue at the time but the problem could be solved by the operators independently, without the need for any regulatory measures. 11 However, in an e-mail to SECO (January 12, 2007), Andersson reported an increasing interest in access regulations in Sweden, an outflow of structural policy intentions: “Sweden Post has a large market share and questions are asked how this market share could be reduced. … Even if I believe it is not so important, market share is very crucial in most discussions … Another important source is … the experiences from the telecom sector. There, access regulation is introduced in a very detailed way and that has inspired the postal sector regulation.” 12 & /Sealink, Decision of 11 June 1992, EC Bull. 6-1992, at 1.3.30.

104
of Holyhead. There are other cases involving “node networks” where explicit or implicit reference to the essential facilities doctrine is made by European competition case law (Hatzopoulos, 2006, p. 6 et seq.).
2.4 Possible regulatory approaches to consider in Switzerland
Farsi et al. (2006) found that merging small delivery units is efficient but does not require a nationwide delivery network to reach the economies of scale of Swiss Post. The authors say that Swiss Post should keep their joint delivery of mail and parcels in selected areas. They find no monopolistic bottleneck within delivery. Because cost subadditivity is limited for large units and Swiss Post by law is not forced to fully exploit economies of density (e.g. USO promises at least five deliveries per week), market entry in Switzerland is relatively likely in case of a full liberalisation.
From the economic analysis and empirical data one might conclude that sector-specificregulation of market power is not an issue with regard to full liberalisation of postal markets in Switzerland. Classical issues such as mandatory network interconnection in telecommunications are not of large importance in the postal industry. This presumption is also confirmed by the liberalisation experience in Sweden. After more than ten years’ liberalisation experience, Sweden does not regulate any access to postal specific infrastructures (e.g. sorting centres). Thus, in Switzerland the application of competition law would adequately address possible constellations of temporary market power. No ex ante regulation of network specific market power, consisting of non-discriminatory mandatory access and incentive regulation, is required. The question of ex ante or ex post regulation of network-specific essential facilities should not be an issue in the context of liberalisation of the classical postal value chain.

105
3 TECHNICAL CO-ORDINATION REGULATION
Monopolistic bottlenecks can be characterised by well-defined economic criteria. The postcode system, address databases, PO boxes, collection and delivery boxes, information on change of address, redirection service, return to sender service etc. are not monopolistic bottlenecks in the sense of stable entry barriers as known from other networks. Rather, these services must be understood as technical functions of co-ordination and must be differentiated from postal services in the strict sense. This applies specifically to the processing of letters.
3.1 Approaches of the EU member states and the Commission
Information about addresses is a by-product of the provision of postal services. It corresponds to the subscriber data of the telecommunications sector. An update of a postal address inventory is associated with considerable network externalities requiring an economic need for co-ordination, whereas an obligation to provide information about changes of addresses should be valid for all postal firms. In conjunction with addresses, technical co-ordination in liberalised postal markets includes the handling of reposted mail (including “gone away”, forwarded and return to sender mail13) as well as mis-posted or mis-collected mail, mis-directed customer services enquiries etc. There are many small problems that need to be co-ordinated. One can expect that one of the main tasks of a sector-specific regulatory body in a liberalised postal market will be the management of issues of this kind. The UK’s postal regulator has already published comprehensive consultation documents, e.g. to facilitate a multi-operator redirection service (Postcomm, 2006) and the German Federal Network Agency (Bundesnetzagentur) has announced a public tender regarding a research project to analyse “adjoining markets in the postal sector”, an indication of the relevance of the issue for regulatory bodies.
Liberalisation practice in the field of technical co-ordination will unearth many questions calling for pragmatic answers. Within the scope of the treatment of associated non-stable
13 In about ten member states of the EU, including Sweden, the postal regulator is empowered to define common operational procedures to deal with return to sender mail, in a few others such as Sweden etc. private operators have voluntarily developed contractual arrangements to ensure return of misaddressed mail (WIK, 2005, p. 66).

106
entry barriers, some trial and error is inevitable; and best practices will finally emerge by-and-by. There are of course considerable costs associated with a market-driven discovery procedure, not however justifying intervention per se14. At least the cost-value ratio of possible intervention should be carefully measured.
As already mentioned, the third revision of the Swedish postal legislation in 1999 comprised access regulation to selected postal infrastructures such as the postal code system and access to PO boxes. Regarding the postal code system, new operators had problems obtaining their own number series to meet their requirements, for example for post-box mail. It was first suggested to shift the control of the code system to the regulator. However, it finally remained under the control of Sweden Post with the obligation to give to new operators the series of postal codes they required. As a result, Sweden Post and CityMail have established a joint venture for address files. The postal code system is under the control of Sweden Post. There is an advisory board with representatives not only from other postal operators but from other institutions using the postal codes for administrative purposes. The board has to approve major changes to the system. In addition, Sweden Post is obliged to give other operators their own series of postal codes.
PO boxes are not characterised by positive network externalities. Bundling advantages exist, but they are exhausted already with a relatively small number of clients. Although linked to sunk costs, PO boxes do not constitute monopolistic bottlenecks. A build-up of parallel PO boxes of different postal firms would be economically feasible even if not reasonable, although lock-in effects may exist. Therefore, regarding access to PO boxes Sweden emphasises reasonable and non-discriminatory terms. Until today, the only regulated access in Sweden has been the delivery to PO boxes of Sweden Post:
” … Sweden Post receives this mail with a price corresponding to its own cost savings. … Partly the Competition Act handles access conditions because dominant firms must provide access on equal and non-discriminatory terms. However, competition law has turned out to be weak and slow because abuses are usually not decided upon in the highest Court of Instance until several years later when a new entrant can already have been forced to exit. Sector-specific regulation has stronger power. Thus, the Government Commission in 2005 proposed that access regulation be introduced in the Postal Act in a
14 “The cost of the discovery procedure that we use is considerable. But it is unfair to judge the performance of the market in a certain sense “from the top down”, .. by comparing it with an ideal standard that we are unable to attain in any known way” (Hayek, 2002, 16).

107
similar way, as is already the case for telephone services” (Andersson, 2006, p. 66).
Besides Sweden, a few other members of the EU (Germany, France, the Netherlands and Portugal) have given authorisation to its postal regulators concerning access to the PO box system, in order to prevent potential anti-competitive behaviour. However, besides the regulator in Sweden, only the German regulator has made use of this authority (WIK, 2006, p. 65). According to the German Monopoly Commission (2005, p. 48), the necessity of regulated access is considered to mean access to PO boxes and address data bases.
Concerning the full achievement of the internal market of community postal services, the EU Commission has proposed regulations to deal with these issues (Art. 11a of the Proposal for a Directive of the European Parliament and of the Council amending Directive 97/67/EC15):
“Whenever necessary to protect the interest of users and/or to promote effective competition, and in the light of national conditions, member states shall ensure that transparent and non-discriminatory access conditions are available to the following elements of postal infrastructure or services: postcode system, address database, PO boxes, collection and delivery boxes, information on change of address, redirection service, return to sender service.”
3.2 Possible regulatory approaches to consider in Switzerland
With regard to technical regulations in liberalised postal markets, sector-specific regulations may impose the necessity of non-discriminatory access. Postal codes as well may require the necessity of sovereign rule setting. But with regard to the question whether these apparently necessary regulations should be implemented ex ante or ex post, a careful analysis could be quite helpful. The following explanations show that both approaches can be constructive. The question is how their design is handled in detail.
15 Document as adopted by the Commission; official numbered version to be made available soon.

108
Possibilities of ex ante regulation
Because of the time-consuming process of obtaining a final ruling by the Federal Court in case of complaints, one could probably find a remedy with ex ante regulation, meaning that the regulator is given the right to set terms and conditions in advance. The approach to solve the problem of suspensiveness by means of ex ante rules was also discussed in the Swiss telecommunications sector. Switzerland even decided upon this crucial issue before discussing the details of the revision of the telecommunication law. Regulatory agencies in charge of communication markets in Switzerland favoured ex ante regulation (e.g. Furrer, 2002, p. 14). The Federal Council, however, after seesaw changes between different market positions regarding the issue, abandoned the introduction of ex ante regulation (Botschaft, 2003, BBl, p. 7952).
It is important to realise that in postal markets the implementation of ex ante regulation would not be necessary for tackling problems comparable to those discussed in telecommunications. Because of lacking monopolistic bottlenecks, stable market power issues do not exist in a liberalised postal market. Thus, in telecommunications, where ex ante rules were intended to solve such problems, there would have been good reasons for the implementation of ex ante regulation, but this did not happen. Thus, it would seem inconsistent to implement ex ante rules with less severity in the postal sector.
Even furnished with a sunset clause, a discussion about ex ante regulation could endanger the liberalisation process, as was the case in the telecommunications sector. The specification would not make a notable difference in the political perception of “ex ante”. Many authorities and regulations were initially designed with the intention of temporal validity, but only few of them were finally dissolved. A more efficient way, however, could be a “modified” ex ante regulation: Technical rules could be worked out between industry representatives and the regulator and then put into force step-by-step via legislation, e.g. technical, problem-oriented Federal Council ordinances.
Possibilities of ex post regulation
Ex post regulation is characterised by the fact that sector-specific regulatory measures are only applied if the parties are unable to agree on the basis of their negotiations and if one of the parties involved in the negotiations files a complaint. Due to the common practice of suspensiveness of complaints in Switzerland, court cases can be delayed for years. Thus, with regard to sector-specific rule setting in the postal sector, a regulation might be considered which might say that suspensiveness was inadmissible regarding the postcode system, address database, PO boxes, collection boxes etc. It needs to be examined if such a clause in a sector-specific law is in fact permitted. Thus, the problem of suspensiveness could (partly) be defused by such a clause.

109
In addition, technical co-ordination services could be managed by an auction mechanism. A credible threat to reasonable bundle services, such as the management of PO boxes, collection boxes, etc., would be to conduct an auction for such a bundle, leading the incumbent to fulfil non-discriminatory regulatory demands to third parties within specified terms. Sure enough, in order to do this the issue of property rights of the accordant facilities would have to be regulated in advance. Property rights of premises where PO boxes etc. are installed, could be assigned to the state which could then subcontract their management. Successful bidders could even assign the property rights of PO boxes itself – along with certain (maintenance) burdens – to customers. In any case, an auction of such services would not be digressive because a separate management of PO boxes for instance, not within the incumbent’s business, could technically be implemented without any difficulty. Efficiency disadvantages in comparison to the status quo would be negligible, as well.

110
4 SOCIAL REGULATION
4.1 Disambiguation – market failure versus USO
In his metaphor of the “invisible hand“, Adam Smith postulated that in cases where individuals pursued their own interests and used their labour force according to their comparative advantages, the market would provide a service supply that would eventually benefit the common good. Since Robinson (1933) and Chamberlin (1933) developed the theory of monopolistic competition, we know that in a free market economy natural boundaries are set for the provision of product variety and different quality standards. The reason lies with fixed costs associated with economies of scale in production. From an economic point of view it is by no means desirable that the variety of established products is such that for each consumer a tailor-made product range is offered. Rather, the trade-off between variety of products and exhausting economies of scale has to be tackled. Therefore, universal service in terms of an area-wide daily provision at uniform tariffs is no law of nature in a free market economy. But this obligation does not imply so-called market failure. Market failure is rather a technical term describing private restraints on competition (e.g. monopoly, cartel), techno-economical causes (e.g. externalities, public goods as a special case of externalities) and information asymmetries.
A possible need of a Universal Service Obligation (USO) in the postal sector is not caused by market failure. The nature of USOs in network industries and other sectors such as health care is in fact motivated by social policy goals. It is the (democratically legitimised) political will to e.g. provide all regions of a country with certain services, observing certain minimal cost/performance standards. According to a country’s social policy objective, postal universal service could theoretically include letter mail being delivered twice a day in rural regions. This extensive delivery instruction would most probably not yield the product variety that might be the result of mere market forces. The need of a USO would therefore result from this specific policy goal and is not a consequence of market failure. On the contrary, a USO can in fact cause regulatory (or state) failure. If a USO is e.g. not only defined by services (consumer outputs) but also by the way these outputs are produced (e.g. a specified number of mail administrating centres per capita), it can lead to regulatory failure. Such a production process instruction as part of the USO (even if not explicitly formulated in terms of a legislative document) could make it impossible to put in place a more efficient provision system.

111
4.2 Implementation of USO in Sweden
Liberalisation-friendly incumbent
In Sweden the provision of the USO has never been an obstacle for liberalising the market. Regarding liberalisation in Sweden two unusual facts have to be taken into account. The first one is that the postal incumbent itself has argued dauntlessly for liberalisation:
“The Post Office … wanted to become an international logistics company and expand to new geographical regions. … The monopoly on letters was considered an anomaly in this new business environment, … the monopoly in Sweden did not protect from emerging competition. In the Annual Report of the Post Office (1990, p. 8): “The letter monopoly, that the Post Office does not uphold, represents only 8 per cent of its business” (Andersson, 2006, p. 9 f.).
The second important difference between Sweden and other European countries is the fact that the incumbent was convinced that full liberalisation was necessary in order to maintain the USO. This attitude is tiled ever since by the facts. Although margins are declining, the letter business of Sweden Post is still profitable.
“In Sweden, the Post Office argued already in 1990 that there were no conflicts of goals and owing to its economies of scale it would be able to provide such services even better in a deregulated environment. … Sweden Post continues to claim that it is possible to provide USO without compensation, at least in the near future” (Andersson, 2006, p. 27).
Content of USO in Sweden
In the early days of liberalisation, Swedish postal policy according to the Postal Act of 1994 was entirely related to USO. Basic financial services were considered a part of postal policy. Due to the implementation of EU regulations in the first revision (1997) of the postal liberalisation law, the scope of their universal service was extended:
“Across the nation, there should be a nation-wide postal service …. There should be a possibility to have letters conveyed at uniform and reasonable prices. Private persons should also have the possibility to have parcels conveyed at uniform prices. In addition, there should be a nation-wide financial service meaning that everybody should be able to make and get payments at uniform prices.” (Andersson, 2006, p. 21, citation of SFS 1993:1654)
The second revision (1998) installed, among other measures, a division between the service itself and the quality of service. There should be a postal service throughout the country. Everyone should be able to send and receive items of mail weighing a maximum

112
of 20 kg, at reasonable prices. Parcels, newspaper subscriptions, etc. were included in this definition of postal items. However, the licence condition for parcel distribution was removed in this revision (Andersson, 2006, p. 22)16. Since then, the Government Commission has proposed no change in the scope of the USO or the defined quality of service (Andersson, p. 23).
In 2001, the financial services of Sweden Post have been allocated to a separate subsidiary, Svensk Kassaservice17. This subsidiary still provides (limited) over-the-counterpayment services in the whole of Sweden18 and receives some compensation for this service, which has a negative effect on the overall result of Sweden Post (Andersson, 2006, p. 24). It should still be noted that - unlike in Switzerland - the operations of the over-the-counter payment services are separated from the postal services. In Sweden "postal" financial services (i.e. basic counter services) are not part of the universal postal service. A separate legal act ensures a nation wide counter service in Sweden. Today, about one per cent of the payments of Swedish households are made over the counter. Substitutes, such as internet banking or payment orders sent by letter, are common.
Challenges in Sweden
With regard to USO, there are two critical issues in Sweden. The first is interregional transportation to remote regions, which is solved by a network of air transportation. The second is collection and delivery in sparsely populated and remote areas, solved in different ways, depending on the density of the delivery points. Evaluations of the USO by the regulator (PTS) confirm that the accuracy of overnight delivery is high and very fewremote households are not provided with five-day delivery. The regulator has ascertained a stable profitability for both overnight and second class letters since deregulation, even
16 “Further details of this goal were specified in the Postal Act, the Postal Ordinance and in the licence conditions for Sweden Post (before 2001 in a special contract). There should be opportunities to insure items of mail and to receive confirmation from the recipient that the item of mail has been received. The operator should guarantee reliability and the protection of the sender’s and the receiver’s personal integrity. The target for reliability for the universal service provider was that 85 % of overnight mail should be delivered the next day and 97 % within three days.” (Andersson, 2006, p. 22) 17 The Swedish Postbank was already privatised in 1974 and sold to Nordea, today one of the four largest Swedish banks. 18 Svensk Kassaservice only has offices in towns or villages, yet with different solutions it serves every-body. In rural areas, Svensk Kassaservice uses rural postmen for its services, and customers not regularly visited by postmen can order the services in advance.

113
though with a side note, that decreasing overall volumes and a changing product mix can jeopardise this result in the future (Andersson, 2006, p. 57).
According to the regulator, the accounting system of Sweden Post is transparent. Prices are cost-based, for single piece as well as bulk mail. Only the 20g single-piece letter does not cover its costs (two thirds of single piece letters and 9% of the total letter volume). The postal universal service works and operates at high quality levels, without any kind of compensation fund and without cross-subsidisation from financial services.19 However, there is still a price cap for single piece mail in Sweden. The Government Commission recently suggested replacing it by access regulation which would guarantee that prices for universal services be cost-based in accordance with EU legislation. The regulator, on the other hand, currently still sees a risk of cross-subsidisation of competitive segments by Sweden Post and therefore intends to keep the price cap on single piece mail (Andersson, 2006, p. 29).
The Swedish example shows that in principle full liberalisation and the maintainance of a universal service are possible without cross-subsidisation. In Sweden, regulations how to fulfil the USO obligation are less numerous than in Switzerland; Sweden Post seems to enjoy more “economic freedom” with respect to inputs (e.g. retail outlets reorganisation/ switch to agency model, reorganisation of staff) than Swiss Post. There seems to be no extensive political discourse about the number of postal offices. At the same time, regulatory distortions benefiting the incumbent (e.g. taxation) are significantly less marked in Sweden than in Switzerland. Despite these facts, the number of service points in Sweden have even increased considerably since liberalisation (PostReg, 2006, p. 22; see in particular Figure 1):
19 There are no accurate estimates of the financial burden of the USO in Sweden. In 1994, Sweden Post estimated SEK1.2 billion, while, the Government Commission estimated SEK100 million in 1996 (approximately CHF19 million); an estimate based on results from Norway for 2005 resulted in SEK115-400 million. The regulator stated that there are also benefits from providing USO.

114
Figure 1 Development of postal service points in Sweden
0
500
1000
1500
2000
2500
År 89 91 93 95 97 99 01 03 05
Year
Num
ber Post Office
Partner OfficeTotalBusiness Centre
Source: Andersson (2006), p. 52.
4.3 Possible regulatory approaches to consider in Switzerland
In Switzerland, the USO is linked to multiple constraints: Requirements on the output side (high quality specifications; geographical price unity in the reserved area; quasi price caps that are enforced with recommendations by the price surveillance authority), (sometimes political) requirements on the input side (network of mail administrating centres; employment regulations20) and requirements regarding the financing of legacies of Swiss Post. In comparison to Sweden, Switzerland is thus confronted with two disadvantages that it has to overcome:
During the liberalisation process, Sweden did not at all focus on input regulations, whereas in Switzerland policy debates with regard to USO are mainly about numbers of postal offices and labour conditions. However, from an economic perspective USO is about outputs (services) and not inputs (capital, labour).
The Swedish regulator (PTS) basically acknowledges that Sweden Post secures cost transparency, whereas Swiss PostReg has so far not been able to confirm that Swiss Post has established sufficient cost transparency, making it possible to analyse potential cross-subsidisation issues.
20 It is notable that the regulation of employment conditions of postal services providers is not only valid for Swiss Post, but for all licensed postal service providers in Switzerland.

115
Realisation proposals
Basically, a USO can be offered for tender. Depending on the tender documents, two situations can occur: If the specified USO is estimated to be profitable, players offer a price to receive their licence(s). The player with the highest willingness to pay obtains the award. If, however, the USO obligation is estimated to be in deficit, players make an offer for a price to be paid to them, in case they should be in charge of the accordant social obligation. In both cases, transparency regarding costs is no necessity. The need of cost information arises because firms offering USO services also deliver other competitive services. In order to be sure that operators that have a USO obligation do not engage in predatory pricing with regard to competitive services, cost transparency according to certain standards is necessary.
With regard to USO and undistorted competition, transparent cost information about USO services is a conditio sine qua non. There are three special regulatory issues where regulatory costing plays a crucial role in providing an appropriate solution to the postal industry facing a liberalised environment: USO, access pricing and predatory pricing. Price floors (ceilings) corresponding to minimum (maximum) long run incremental costs21 (stand alone costs) of each service (bundle) are recommendable in order to fulfil these requirements. In particular, the long-run view of incremental costing allows the distinction between current inefficiencies due to past regulation and the current overall cost structure and thus enables the incumbent to closely monitor and promote efficiency gains. In terms of access, there are strong arguments in favour of calculating access prices based on long-run incremental costs. Long-run incremental costs might also be suitable if a price ceiling is used to prevent an incumbent from recovering its losses after a period of predatory pricing.
Based on this, the following recommendations to regulatory policy regarding USO can be deduced:
(1) A USO should be limited to outputs. If USO is also bound to inputs, USO policy relegates to structural policy. Input regulations can be advantageous (e.g. specified permission to drive at night) or disadvantageous (e.g. a certain number of sorting centres built according to regional policy goals) to the mandated firm. In the former case, competitors have a disadvantage, in the latter case the USO operator is affected, inasmuch as markets are contestable. In any case, input regulations have a distorting effect on competition.
21 Implemented in combination with activity-based costing.

116
(2) The lawmaker should have the freedom to design a nation-wide or region-wide USO tender, as it is the case in the telecommunications sector.
(3) It can be assumed that Swiss Post would receive the mandate in case of a USO tender designed nation-wide. If this is the case, however, the conditions (output prices, quality aspects etc.) would be defined more clearly than is the case today. The distinction made nowadays between USO and the “service public” could probably be abrogated.
(4) The net burden of the USO can vary according to its extent (national or regional USO, broader or less broad USO). Thus, different forms of financing should be evaluated and the most appropriate one be included in the postal legislation.
(5) Since a USO-mandated firm also engages in offering competitive postal services in general, the issue of cross-subsidisation, predatory pricing etc. is a latent danger, aggravated of course by input regulations. Irrespective of the question which procedure is chosen to assign USO licences, legislation should stipulate how cost transparency (particularly within and between subsidiaries of USO operators) is to be achieved. Based on the methodology that is given to substantiate non-discriminatory behaviour, an obligation to separate accounting is to be considered as well.
Flanking measures
In connection with USO and cross-subsidisation, flanking measures are to be analysed. Cross-subsidisation takes place if an output does not cover its incremental costs (e.g. IC 1). An output is to be defined as a product, a group of products or even an entrepreneurial entity. From the perspective of a mail organisation, IC 1 could be electronic mail services, IC 2 physical mail services and IC 3 hybrid mail services. From the point of view of a postal organisation, IC 1 could be mail services, IC 2 could be parcel services and IC 3 could be financial services, etc. (see Figure 2).

117
Figure 2 Incremental costs (IC), joint costs and common costs
Source: Knieps (2007), p. 30, modified by Plaut Economics.
In postal organisations, joint costs are substantial and thus a cost allocation problem arises. Neither marginal costs nor incremental cost (including product specific fixed costs) are able to cover total costs to ensure the viability of the firm. Mark-ups on incremental costs to cover joint costs (and common costs) are necessary. An objective basis to define mark-ups is the development of of price differentiation strategies, which happens to be the standard case in a competitive environment. Thus, cost allocation keys should always be defined with reference to demand, based e.g. on information about product substitution possibilities (e.g. Baumol, Koehn, Willig, 1987). Even if information about individual willingness to pay is not at hand, estimations on the average value of a good for all individuals belonging to a demand group are feasible.
Incremental costs of a product or a product group can be calculated based on flexible standard costing based on margin or contribution margin accounting. Table 3 refers to the flexible standard costing based on margin and differentiates variable and fixed costs. The scheme is also oriented on the stepwise fixed costs according to Mellerowicz (Kilger, 1985, p. 98 et seq.; Mellerowicz, 1961, p. 473 et seq.).
Common costs
Joint costs
IC 1 IC 2
IC 3

118
Table 3 Scheme of a stepwise contribution margin accounting in a multi-product firm Product A: Product B: Product C: Product D: Product E:
Product revenue ./. variable cost of
product
Product revenue ./. variable cost of
product
Product revenue ./. variable cost of
product
Product revenue ./. variable cost of
product
Product revenue ./. variable cost of
product = amount of coverage 1
./. fixed costs of product
= amount of coverage 1
./. fixed costs of product
= amount of coverage 1
./. fixed costs of product
= amount of coverage 1
./. fixed costs of product
= amount of coverage 1
./. fixed costs of product
= amount of coverage 2
= amount of coverage 2
= amount of coverage 2
= amount of coverage 2
= amount of coverage 2
./. product group specific(fixed and variable) costs (of A and B)
./. product group specific (fixed and variable) costs (of C, D and E)
= amount of coverage 3 = amount of coverage 3 ./. enterprise related fixed costs
= result
Source: Knieps (1988, p. 159).
Based on the scheme it is apparent that the amount of coverage 1 of a product results as the difference between product revenue and its variable costs. The amount of coverage 2 of a product results as the difference between amount of coverage 1 and the fixed costs of the product. As long as the amount of coverage 2 is not negative, the product carries its individual incremental costs. To calculate the amount of coverage 3, the amounts of coverage 2 of all products that have the same product group fixed costs are added up. Where product specific variable costs on the basis of joint product advantages are in place, also based on the flexible standard costing based on margin, these costs are not to be imputed to the individual product, but to the product group specific fixed costs (Kilger, 1985, p. 96). If the amount of coverage 3 of each product group is not negative, the group-specific incremental costs are covered.
(1) To address the issue of non-discrimination, it could be imagined that the interweavement between Postfinance and other postal activities of Swiss Post is so strong that even a well-differentiated cost methodology – as just presented – cannot ensure compliance with regulatory and competition policy regulations regarding predatory pricing etc.. Therefore, a complete unhinging of Postfinance from Swiss Post could be investigated. This would also be supported by the Swedish evidence.

119
(2) If the regulator stipulates the application of a specific cost methodology to all companies that are mandated with USO, the compliance with such a costing prescription could be a question of time22. A transitional solution therefore would be an indirect prevention of cross-subsidisation by a price cap mechanism, applied to certain services of the USO (see also PWC, 2006, p. 11).
22 The argument, however, that regulatory accounting obligations would prove to be too much of a strain on small market players, is hardly reliable. If competition becomes fierce, market players are forced to invest in appropriate strategic costing measures. An intelligent way might be the implementation of entrepreneurial current accounting costing standards that – as a by-product – would meet regulatory needs, as well.

120
5 CONCLUSIONS
The present economic analysis focuses on market power issues, technical co-ordination and social regulations that have to be envisaged in order to liberalise the Swiss postal sector. The following conclusions summarise the main results that can be deduced.
Remove entry barriers and remove regulatory distortions
Referring to Chapter 2, in a liberalised postal environment no stable “monopolistic bottlenecks” can be observed. It is indeed possible that constellations of temporary market power can be established. However, this phenomenon should be countered by competition policy. If monopolistic bottlenecks are not stable, as has already been the case in postal markets for years, competition law should be applied. By observing this rule, overregulation can be avoided. On an outside estimate, an access obligation could be considered for time-critical mailings. If the eligibility is considered for all sending, sector-specific regulation would definitely be in force beyond monopolistic bottlenecks and would thus inhere the character of structural policy.
In the telecommunications sector, full liberalisation was accomplished after partial liberalisation. It can be envisaged that an analogous procedure is now adopted in the postal sector. Based on the experiences in Sweden, full liberalisation of the postal market should be considered in Switzerland, i.e. the abolition of legal entry barriers in the form of reserved services and weight limits. Furthermore, distortions such as tax asymmetries between Swiss Post and competitors, as well as specific regulations privileging the incumbent, should be removed.
Define clear cut criteria to deal with technical and sovereignty issues
Referring to Chapter 3, co-ordination issues such as the use of PO boxes etc. may cause instable entry barriers. The use of the postal code system23 may require sovereign rule setting. Although no monopolistic bottlenecks are observed in the context of co-ordination issues, the necessity of non-discriminatory access regulations should nevertheless be discussed. It should be examined if sector-specific rules need to be implemented ex ante (e.g. flanked with sunset clauses) or ex post (e.g. in combination with an abolishment of the suspensiveness or by using a credible regulatory threat).
23 The postal code system constitutes a public good, comparable to the metering rule.

121
Define USO as a set of services to customers; USO is about outputs, not inputs
Referring to Chapter 4, the USO is the product of a country’s social policy goals. Therefore, a USO should only be defined by instructions regarding a set of outputs or services according to a specific cost/performance ratio. If it contains instructions regarding inputs such as employment policy or regional policy, efficiency measures within service provision are hampered. In order to prevent regulatory failure, a USO should avoid input regulations. If it is necessary to regulate input issues because of threats of strikes etc., other political spheres will be more economically viable. If, for instance, communities insist on a certain postal infrastructure in certain regions regardless of the customers’ willingness to pay for it, the associated additional costs should be financed e.g. by (local) taxes.
The USO could be assigned by tender. In order to regulate the terms and conditions of the assigned USO, certain quality standards could be established and certain conditions and penances defined, in case obligations are not fulfilled.
In order to ensure that cross-subsidisation between USO services and other services is eliminated, an adequate costing methodology should be applied. It would oblige USO mandated players to show that the revenue flowing from USO is not used to distort competition. In this respect, an obligation to accomplish accounting separation between different subsidiaries should be considered, as well. As long as a USO burden is a social policy goal, USO mandated operators should have to prove their non-discriminatory conduct via a cost methodology defined by the regulator. The regulator should also be allowed to stipulate price caps ensuring non-discrimination.
Since, as the incumbent, Swiss Post will play an important role with regard to USO, it is possible that neither a costing methodology nor an accounting separation obligation will ensure the required cost transparency in time. Therefore, as a further flanking measure should be envisaged, i.e. a more marked separation of postal services and financial services: A clearer organisational separation of Postfinance from Swiss Post could be another option that would perhaps, at the same time, accelerate the switch to agency models.

122
6 SOURCES
Andersson, P. (2006): The Liberalisation of Postal Services in Sweden – goals, results and
lessons for other countries, Linköping.
Baumol, W.J. (1977): On the Proper Cost Test for Natural Monopolies in a Multiproduct In-
dustry, American Economic Review, 67, p. 809-822.
Baumol, W.J., J.C. Panzar and R.D. Willig (1982): Contestable Markets and the Theory of
Industry Structure, San Diego.
Blankart, C.B., G. Knieps and P Zenhäusern (2007): Regulation of New Markets in
Telecommunications? Market dynamics and shrinking monopolistic bottlenecks,
(forthcoming).
Baumol, W.J., M.F. Koehn and R.D. Willig (1987): How Arbitrary is „Arbitrary“ or, Toward the Deserved Demise of Full Cost Allocation, Public Utilities Fortnightly 3, p. 16-21.
Botschaft (2003): Botschaft zur Änderung des Fernmeldegesetzes (FMG) vom 12. Novem-ber 2003, Botschaft, 2003, BBl , p. 7951-8006 (http://www.admin.ch/ch/d/ff/2003-/7951.pdf, called up in November 2006).
Chamberlin, E.H. (1933): The Theory of Monopolistic Competition, Cambridge, MA.
De Bijl, P.W., E. van Damme and P. Larouche (2006): Regulating Access to Stimulate
Competition in Postal Markets? in Crew, M.A., Kleindorfer, P.R. (eds.), Progress
toward Liberalisation of the Postal and Delivery Sector, Berlin, Heidelberg.
European Commission (2005): Report from the Commission to the Council and the Euro-
pean Parliament on the application of the Postal Directive (Directive 97/67/EC as
amended by Directive 2002/39/EC, Brussels, 23.03.2005, COM(2005) 102 final.
Farsi, M., M. Filippini and U. Trinkner (2006): Economies of Scale, Density and Scope in
Swiss Post’s Mail Delivery, presentation at the 14th Conference on Postal and Deli-
very Economics, Bern.
Furrer, M. (2002): Stand des Schweizer Telekommunikationsmarktes im internationalen Vergleich, Einführungsreferat, 1. Bieler Kommunikationstage, (http://www.comdays-.ch/pdf/2002/02_2_5_furrer.pdf, called up in November 2006).
Hatzopoulos, V. (2006): The EU Essential Facilities Doctrine, Research papers in law, 6,
College of Europe, Brugge and Natolin.

123
Hayek, F. A. (2002): Competition as a Discovery Procedure (Translated by Snow, M.S.), The Quarterly Journal of Austrian Economics, 5, 3, p. 9-23.
Kilger, W. (1985): Flexible Plankostenrechnung und Deckungsbeitragsrechnung, Wiesba-den
Knieps, G. (1988): Kostenrechnung öffentlicher Unternehmen, Die Unternehmung, 2, p. 155-163.
Knieps, G. (2005): Wettbewerbsökonomie. Regulierungstheorie, Industrieökonomie, Wett-
bewerbspolitik, 2. Auflage, Berlin, Heidelberg.
Knieps, G. (2006): Does the system of letter conveyance constitute a bottleneck resource?
in Kulenkampff, G., Niederprüm, A. (eds.): Contestability and Barriers to Entry in
Postal Markets, Bad Honnef.
Knieps, G. (2007): Netzökonomie. Grundlagen – Strategien – Wettbewerbspolitik, Wies-
baden.
Kok, L., F. Felsö, E. Dykmann and H. Strikwerda (2003): Tante Pos krijgt concurrentie.
Effecten van de liberalisering van de postmarkt, September, Amsterdam
(http://www.seo.nl/assets/binaries/pdf/MO76defrapport.pdf, called up in December
2006).
Mellerowicz, K. (1961): Planung und Plankostenrechnung, Band 1, Betriebswirtschaftliche
Planung, Freiburg.
Monopolkommission (2005): Wettbewerbsentwicklung bei der Post 2005, Beharren auf al-
ten Privilegien, Sondergutachten der Monopolkommission gemäss § 44 Postgesetz
in Verbindung mit § 81 Telekommunikationsgesetz a.F. (http://www.monopolkom-
mission.de/sg_44/text_s44.pdf, called up in November 2006).
Moriarty, R. and P. Smith (2005): Barriers to Entry in Post and Regulatory Responses, in
Crew, M.A., Kleindorfer, P. R. (eds.), Regulatory and Economic Challenges in the
Postal and Delivery Sector, Boston.
Postcomm (2006): Sharing redirection data, Postcomm’s proposals to facilitate a multi-ope-
rator redirection service, August 2006 (http://www.psc.gov.uk/postcomm/live/policy-
and-consultations/consultations/redirections/Sharing_redirection_data_060814.pdf,
called up in November 2006).

124
PWC (2006): The Impact on Universal Service of the Full Market Accomplishment of the
Postal Internal Market in 2009, Final Report, Study commissioned by the European
Commission, Brussels.
PostReg (2006): Tätigkeitsbericht 2005, Bern.
Proposal for a Directive of the European Parliament and of the Council amending Directive
97/67/EC (http://ec.europa.eu/internal_market/post/doc/legislation/proposal_en.pdf,
called up in November 2006).
Robinson, J. (1933): Economics of Imperfect Competition, Macmillan, London.
Stigler, G.J. (1968): Barriers to Entry, Economies of Scale, and Firm Size, in: G.J. Stigler,
The Organization of Industry, Irwin, Homewood, Ill., p. 67-70
Stigler, G.J. (1971): The Theory of Economic Regulation, Bell Journal of Economics, 2, p.
3-21.
Vaterlaus, S., H. Worm, J. Wild and H. Telser (2003): Liberalisierung und Performance in
Netzsektoren: Vergleich der Liberalisierungsart von einzelnen Netzsektoren und de-
ren Preis-Leistungs-Entwicklung in ausgewählten Ländern, Strukturberichterstat-
tung des seco, Nr. 22, Bern.
von Weizsäcker, C.C. (1980a): A Welfare Analysis of Barriers to Entry, Bell Journal of Eco-
nomics, 11, p. 399-420.
von Weizsäcker, C.C. (1980b): Barriers to Entry: A Theoretical Treatment, Lecture Notes in
Economics and Mathematical Systems, Berlin et al.
von Weizsäcker, C.C. (1984): The Costs of Substitution, Econometrica, 52/5, p. 1085-1116.
WIK (2006): Main Developments in the Postal Sector (2004-2006), Final Report, Study for
the European Commission, DG Internal Market, Contract No. ETD/2005/IM/E4/63,
Bad Honnef (http://ec.europa.eu/internal_market/post/doc/studies/2006-wik-fi-
nal_en.pdf, called up in November 2006).


_________________________________________________________________IInncceennttiivvee RReegguullaattiioonn aanndd BBeenncchhmmaarrkkiinngg ooff EElleeccttrriicciittyyDDiissttrriibbuuttiioonn NNeettwwoorrkkss:: FFrroomm BBrriittaaiinn ttoo SSwwiittzzeerrllaanndd
_________________________________________________________________
________________________________________________Report Prepared for
Swiss State Secretariat for Economic Affairs ________________________________________________
Tooraj Jamasb Faculty of Economics
University of Cambridge
Michael Pollitt Judge Business School
University of Cambridge
13 February 2007

128
Acknowledgement
The authors would like to thank anonymous referees for their detailed comments and acknowledge the support from the Swiss State Secretariat for Economic Affairs (SECO) and the UK Economic and Social Research Council (ESRC) for this study.

129
Table of Contents
1. Introduction ..............................................................................131
2. Incentive-Based Regulation and Benchmarking of Electricity
Distribution Networks .............................................................1322.1 The electricity industry ........................................................................... 132 2.2 Electricity sector reforms and incentive regulation ................................ 133
3. The British Electricity Sector Reform and the Regulation of
Distribution Networks .............................................................1343.1 The Historical Context ............................................................................ 134 3.2 The UK 1990-Reform and its effect on distribution regulation.............. 136 3.3 The performance under distribution price control reviews ..................... 138 3.4 Assessments of the impact of reform...................................................... 144
3.4.1 Efficiency and productivity studies ................................................. 144 3.4.2 Cost-benefit analysis of the reform ................................................. 145
4. Distribution Price Controls .....................................................1464.1 The first distribution price control period ............................................... 146 4.2 Subsequent distribution price control reviews ........................................ 146 4.3 Ofgem’s distribution price control review 2005/06-2009/10.................. 148
5. Some Issues in Regulation Benchmarking.............................1515.1 Setting the right benchmark .................................................................... 151 5.2 Quality of service .................................................................................... 153
5.2.1 Quality of service in the UK under incentive regulation ............... 156 5.2.2 Quality of service incentives within UK price controls.................. 162
5.3 Network energy losses ............................................................................ 165 5.4 Incentivising efficient new investments.................................................. 166
6. Lessons from the UK Experience for Switzerland................170Postscript: Electricity network regulation in the future.......................... 178
References ........................................................................................179

130
List of Abbreviations
AEBs Area Electricity Boards
BEA British Electricity Authority
Capex Capital expenditures
CEB Central Electricity Board
CI Interruptions per 100 customers
CML Number of minutes lost per connected customer
COLS Corrected ordinary least squares
DNOs Distribution network operators
DPCR1 First distribution price control review period
DPCR2 Second distribution price control review
DPCR3 Third distribution price control review
ESI Electricity supply industry
IFI Innovation funding incentive
IIP Information and Incentives Project
NGC National Grid Company
Offer Office of Energy Regulation
Ofgas Office of Gas Regulation
Ofgem Office of Gas and Electricity Markets
OLS Ordinary Least Squares
Opex Operating expenditure
PESs Public Electricity Suppliers
RAB Regulatory asset base
RECs Regional Electricity Companies
ROR Rate-of-return
SCBA Social cost-benefit analysis
Totex Total expenditure
WACC Weighted average cost of capital
WTP Willingness to pay

131
1. Introduction
In the mid-1980s, Britain pioneered an extensive privatisation and market-based reform of the state-owned industries. A particular aspect of the British reform that has attracted much attention has been the use of restructuring, competition, and independent regulation in infrastructure and network industries such as telecoms, transport, and energy including the electricity industry.
These reformed industries consist of potentially competitive and natural monopoly network activities. The reforms have separated these activities followed by introduction of competition in the former and regulation of the latter. The aim of network regulation is to facilitate competition over the networks based on non-discriminatory access to these and to improve their efficiency. An innovative and important part of the regulation of natural monopoly networks has been the use of an incentive-based regulatory regime which, in the absence of competition, attempts to mimic competitive market pressures.
The effects of incentive-based regulation can best be assessed in the long-run as the firms need time to adjust to their new operating environment and the sector regulators must gain experience. The length and features of the British reform make it relevant for drawing useful lessons for other countries. The aim of this paper is to assess the context, process, and performance of the British model of incentive-based regulation of electricity distribution networks.
We then draw lessons of experience for a prospective electricity reform in Switzerland. Since the British electricity reform, many countries around the world and Europe have embarked on reforming their sectors with the latter partly driven and coordinated by the European Commission’s Electricity Directives. Many other countries however lag behind in their progress with reform as s a result of unsuccessful reform proposals or because they lack the sort of pressure the being directly bound by the Electricity Directives gives. The Swiss sector is the least reformed sector in the OECD-Europe and for which this paper may be directly relevant.
The next section discusses the main aspects of incentive-based regulation and benchmarking of electricity distribution networks. Section 3 consists of a review of the background and the experience with distribution network regulation in Britain. Section 4 describes the five-year distribution price control reviews since

132
the privatisation of the industry. Section 5 addresses some specific issues of importance in distribution network regulation. Section 6 draws some general lessons from experience for reform in Switzerland.
2. Incentive-Based Regulation and Benchmarking of Electricity Distribution Networks
2.1 The electricity industry
Electricity is an indispensable part of modern social and economic life. A reliable and efficient electricity industry is crucial for economic development and competitiveness. The electricity sector is a network industry comprising distinct but inter-related activities with many actors whose production and consumption decisions affect the operation of the whole system.
The electricity system consists of generation, transmission, distribution and supply (or retailing) activities. Generation comprises production and conversion of electric power. Transmission involves long distance transportation of electricity at high voltage. Distribution is transportation of low voltage electricity through local networks and consists of overhead lines, cables, switchgear, transformers, control systems and meters to transfer electricity from the transmission system to customers’ premises. The supply function consists of metering, billing, and sale of electricity to end-users. The generation and supply activities are generally regarded as potentially competitive while the transmission and distribution networks are characterised as natural monopolies.
The network characteristics of the industry and economies of coordination among the different activities led to creation of vertically integrated structures in many electricity sectors. At the same time, end-users are diverse - including residential, commercial, and industrial consumers - with different usage patterns with different economic values attached to their consumption, Moreover, the strategic importance of the sector and public service view of provision of electricity often justified public ownership of the industry.
Electricity is a technically homogeneous and non-storable product and system reliability requires that supply and demand are matched simultaneously. At the same time, the electricity industry is highly capital intensive with much of the assets becoming sunk costs upon investment. As the existing assets in place need to be renewed and demand continuously increases, the sector can experience

133
investment cycles. At the same time, the assets have long economic lives with long-term implications for the composition of the sector.
The electricity reforms have generally regarded the generation and supply activities as potentially competitive while the transmission and distribution networks are natural monopoly activities that need to be regulated.
2.2 Electricity sector reforms and incentive regulation
Since the mid-1980s, a world-wide reform trend has transformed the institutional framework, organisation, and operating environment of the infrastructure and network industries including electricity. This has given rise to considerable interest in incentive-based regulation of the natural monopoly segments of the reformed industries.
In the electricity sector, reforms have involved measures such as privatisation, establishment of sector regulators, introduction of competition into generation, design of organised wholesale and retail markets, and unbundling of generation, transmission, distribution, and retail activities (Joskow, 1998; Newbery, 2002). Incentive regulation must therefore be viewed within the wider context of regulatory reform of the sector.1
Moreover, some shortcomings in the incentive properties of the traditional rate-of-return (ROR) regulation, most notably over-capitalisation of the regulatory asset base shown by Averch and Johnson (1962) were also apparent prior to the reforms. The trend towards sectoral reforms and the renewed interest in regulation have led to advances in the theoretical and conceptual aspects of incentive regulation as an alternative to the traditional rate-of-return or cost-of-service regulation.2
From an economic point of view, the aim of electricity reform in general and incentive regulation of networks in particular is to provide utilities with incentives to improve their operating and investment efficiency and to ensure that consumers benefit from the gains. Within this context, the aim of incentive regulation is to achieve these objectives through financial reward or penalty incentive schemes. 1 As such, the theory and empirical evidence on the merits of private ownership and privatization in the context of market-oriented infrastructure reforms can be characterized as inconclusive (Jamasb et al., 2004a; Mota, 2004; Zhang et al., 2002). However, when accompanied by effective regulation, privatization has achieved efficiency improvements. 2 In the US, incentive regulation is often referred to as Performance Based Regulation (PBR).

134
Shleifer (1985) suggests that incentive regulation can mimic the outcome of the markets by setting an external performance standard that represents some average industry performance excluding the firm in question.
The most widely discussed and adopted schemes are based on price cap, revenue cap, yardstick regulation, and targeted-incentive regulation models. Other incentive models include sliding scale, menu of contracts, and partial cost adjustment. In practice, regulators have adopted a variety of approaches to incentive regulation and many incentive schemes use a combination of different models.
3. The British Electricity Sector Reform and the Regulation of Distribution Networks
3.1 The Historical Context
The history of public utilities and network industries and their regulation in Britain constitutes a remarkable tale. In 1812, public supply of town gas began and rapidly developed into a competitive industry with many firms involved. The “wasteful" competition” was ended by the 1860 Metropolis Gas Act making provisions for establishing local natural monopolies. The industry also saw alternative incentive regulation schemes offered to the firms such as a basic price system, maximum prices, and sliding scales (see Hammond, et al. 2002; Joskow and Schmalensee, 1986).3 The post-1945 period then witnessed the nationalisation of municipal and private utilities and infrastructure industries. Finally, the period between the late-1980s until mid-1990 was characterised by the privatisation of these industries and the return of incentive regulation.
The first known case of incentive regulation of network utilities dates back to 1855 and the sliding scale plan in Britain approved in the Sheffield Gas Act for the Sheffield Company a supplier of town gas. This was followed by a similar plan in 1893 for the electricity industry. The first case in the US is the sliding scale scheme in Boston Plan of 1906 for the price of gas. The above scheme was
3 The basic price system was based on fixed prices and dividends. When actual revenue would be lower than the allowed revenue by the basic price, a specified portion of the difference between the basic and actual revenue would be shared between the shareholders (as extra dividends) and employees (as bonuses). Under the sliding scale system, lower prices would be rewarded by higher dividends (for detailed descriptions see Hammond et al, 2002).

135
later abundant due to high inflation rates which followed its implementation (Schmidt, 2000).
The history of electricity supply industry (ESI) in Britain dates back to the late nineteenth century. Electric light first emerged as the fourth generation lighting technology to replace other sources of lighting, such as town gas, as the most modern source of energy to this date.4 Initially, the expansion of electric lighting was slow due to existence of relatively cheaper and well developed town gas system (Byatt, 1979). The origins of the regulation of the industry with respect to matters such as licensing, obligation to serve, pricing, reliability, safety, and theft, etc. date back to the early formation days of the industry (House of Commons, 1882). Despite considerable technological progress in the industry, the role of distribution networks within the ESI has, since the inception years of the industry, largely remained unchanged.5
The first public electricity supply companies in Britain were a small hydro-electric plant established in Godalming, Surrey in 1881 and a supply company in Brighton in 1882 (Chesshire, 1996). From its formation until nationalization in 1947, the industry was fragmented and based on a large number of small private or municipal companies. In 1926, the Central Electricity Board (CEB) was established and mandated to build a national high-voltage grid, standardize the frequencies across the distribution system, and oversee the planning and construction of new generation capacity. The completion of National Grid in 1933 and integration of some local distribution networks contributed to cost and reliability improvement of electricity supply (Fouquest and Pearson, 2006). However, in 1933-34, there were still a total of 635 distribution undertakings one-third of which operated with nineteen different voltages. Also, about 400 of the undertakings accounted for less than 10 percent of the total sales of distribution undertakings (Chick, 1995).
The proliferation of a large number of small scale utilities was to a great extent the result of failure on the part of the central government to define a proper framework for the organization of public utilities and therefore leaving the matter largely in the hands of municipalities (Byatt, 1979). At the time of nationalization there were still 569 distribution entities of which only two-fifths were directly supplied by the grid. Nationalisation brought the private and municipal utilities
4 Lighting by candles, gas, and kerosene represented the first, second, and third generation of lighting technologies correspondingly (Fouquet and Pearson, 2006). 5 Although, due to progress on various generation and network technologies and active networks, the future role of electricity distribution networks is expected to undergo major changes (see. Jamasb, Nuttall, Pollitt, 2006 for a review of the future technologies).

136
under the state ownership. Moreover, it consolidated the fragmented structure of the industry into the British Electricity Authority (BEA) responsible for generation and bulk transport of electricity and sixteen independent Area Electricity Boards (AEBs) in England (12), Wales (2), and Scotland (2) in charge of distribution, metering, billing, and customer service functions (Chesshire, 1996).
The nationalization of the electricity industry took place within the backdrop of a wider nationalisation of a number of key industries in the years following the Second World War (Bliss, 1954; Chick, 1995; Millward and Singleton, 1995). In the run up to privatization and reform of the sector in 1990, the ESI achieved significant improvement in labour productivity partly due to the capital intensive nature of the industry. However, total factor productivity only showed modest gains and the industry was less efficient in relation to those of countries such as the US and France (Pryke, 1981). Nationalisation, however, greatly facilitated the standardization of the system as in France while but took a longer time than in the fragmented German system (Helm, 2003). The standardization and rationalization of the sector after nationalization provided a sector structure that was more suitable for the privatization of the industry later on.
3.2 The UK 1990-Reform and its effect on distribution regulation
The UK government’s intention to introduce legislation to allow private companies to provide electricity was clear as early as 1982 (Electricity Consumers’ Council, 1982). In February 1988, the government laid out its plans for the industry in the White Paper Privatising Electricity (Secretary of State for Energy, 1988). The White Paper stated that competition would ‘create downward pressures on costs and prices, and ensure that the customer comes first’.6
As with the nationalization, the privatization and reform of the electricity sector in Britain took also place against the backdrop of a general political paradigm shift in the 1980s toward withdrawal of state involvement in economic activity and ownership of key industries (Vickers and Yarrow, 1993). At the same time, an economic paradigm shift was emerging in favour of implementing market mechanisms in infrastructure and network industries traditionally viewed as vertically integrated natural monopolies. Both of the paradigm shifts applied to the electricity supply industry. 6 Cited in MacKerron and Watson (1996, p. 186).

137
The British electricity reform involved all the elements of a full sector reform including restructuring, privatization, regulation, and competition. An independent regulator Office of Energy Regulation (Offer) was established in 1990. Later in 1999, Offer merged with the Office of Gas Regulation (Ofgas) to form Office of Gas and Electricity Markets (Ofgem)
Shortly prior to privatisation, 12 regional electricity companies (RECs) replaced the 12 area boards and transmission became the responsibility of the National Grid Company (NGC), a company fully owned by the RECs. Each REC owned and operated the distribution network in its authorized area. At privatization each REC had a supply (retailing) business engaged in the bulk purchase of electricity and sale to customers and mostly consists of metering, billing and contract management. The distribution business of the RECs is significantly more capital-intensive than the supply business. Distribution and supply businesses were uncoupled to some extent (accounting separation was required) and the RECs were defined as Public Electricity Suppliers (PESs) that could supply electricity outside their franchise area over other distributions networks for a regulated access charge. In 1999, the distribution and supply activities were legally separated and the Utilities Act of 2000 replaced the PESs with licensed distribution network operators (DNOs).
Following the privatization, initially, the main focus of the reform was on implementing competition in the wholesale electricity market which had proved more complex than anticipated. In England and Wales this involved separation of nuclear generation from fossil generation and the creation of two large fossil fuel generators. This created insufficient competition. A more competitive market was eventually achieved through further asset divestiture and new entry.7 The natural monopoly transmission and distribution networks had to be regulated. Although the network charges account for about 30% of end-use electricity prices, the potential for efficiency gains in the networks was targeted later. Initially, the large profits made by the new private owners brought the importance of network regulation model into focus. However, regulation was gradually tightened and performance and distribution of efficiency gains improved.
Ofgem has tight restrictions to ensure that each regional monopoly distribution business is held in a separate corporate entity, ring-fenced from all other activities carried on within the licensee’s group. This ring-fencing arrangement is to protect
7 See Newbery (1999) and Helm (2003) for detailed discussion of introducing competition in the wholesale electricity generation and retail markets in the UK.

138
capital providers as well as consumers. Additionally, companies are required to pass some of the benefits from mergers or acquisitions over to consumers immediately following the merger (Ofgem, 1999c).
There have also been significant changes in the way that DNOs structure their business and the range of activities in which they are involved. For example, several have active second-tier supply businesses and most are active in the supply of gas as well as electricity. This provides opportunities for joint marketing of the two fuels. At the beginning of 2007 two DNOs were in different ownership from their former supply businesses. Following a series of significant mergers and now the distribution businesses of the 14 original RECs are currently owned by 7 independent companies.
3.3 The performance under distribution price control reviews
According to Henney (1994), by 1994, the majority of customers had seen no price benefit from the privatisation of the electricity supply industry. Small domestic and commercial customers effectively financed the privatisation, while the largest customers lost the benefit of their special agreements. Only the medium-sized (1–5MW) maximum demand customers benefited as these were able to purchase cheaper electricity from the generators. Additionally, domestic prices initially increased, relative to industrial prices, by about 5 per cent more than expected, with the increase being concentrated in the early years of the reform (Yarrow, 1992). By that time, it was also becoming evident that a tougher regulation of access charges of the natural monopoly distribution utilities was necessary as a means of reducing final prices.
Henney (1994) explains the rise in prices and profits after privatisation as a regulatory failure, in terms of the lax setting of the initial price control. Also, the government did not factor in the potential productivity gains at the time of restructuring. Moreover, the scope for higher gearing was not anticipated. According to Domah and Pollitt (2001), RECs’ total costs declined over the period 1985–86 to 1988–89 by an average of 0.8 per cent p.a., while net controllable costs declined at a rate of 0.3 per cent p.a.
There is general agreement that the first price control period for 1990/91-1994/95 underestimated the potential for efficiency improvement. The price controls during this period were set prior to privatisation and hence were designed to make

139
the sale of the assets a success, not to pass on predicted efficiency improvements to consumers. However, the evidence suggests that this was corrected by successive, increasingly challenging, incentive-based regulation and price control reviews.
The second and third price control reviews for 1995/96-1999/00 and for 2000/01-2004/05 periods respectively significantly reduced real distribution charges and there is ample evidence that they succeeded in achieving significant efficiency improvements and delivering the gains to customers. Domah and Pollitt (2001) find that labour productivity of the RECs nearly doubled between 1990-91 and 1997–98. Similarly, de Oliveira and Tolmasquim (2004) show that the customer per employee number ratio of the RECs increased from 309 in 1990/91 to 681 in 1999/00. Figure 1 shows the path of overall retail and industrial electricity prices (including generation costs).
40.0
60.0
80.0
100.0
120.0
140.0
160.0
1970 1975 1980 1985 1990 1995 2000 2005
Electricity component of the retailprices index in real terms 1990=100
Electricity fuel price index for theindustrial sector in real terms 1990=100
Figure 1: Electricity price developments Source: Department of Trade and Industry
Table 1 shows that, in the UK, between 1991/92 and 1998/99 savings to residential customers from reduction in distribution and transmission charges have been 9 percent. During the same period, price reductions originating from competitive generation market have been 10 percent although this can largely be attributed to reduction in the cost of fuel.

140
Source % Lower generation costs (mainly fuel) 10 Lower distribution and transmission charges 9 Lower supply business margin 1 Lower fossil fuel levy* 9Total 29 * The fossil fuel levy was introduced to limit the effect of reform of the sector on coal industry. The levy was gradually phased out. Price reduction due to lower levy can therefore not be attributed to the effect of reform on prices.
Table 1: Sources of price reduction to domestic users 1991/92-1998/99 Source: Littlechild (2000)
Figures 2-5 show the development of average distribution charges in real terms for residential and non-residential customers over time. As shown in Figure 2, residential customers with unrestricted charges have benefited from reductions both in their unit and fixed charges. The relative reductions are in particular stronger in the fixed charges.
Similarly, residential customers on Economy 7 schemes with separate peak and off-peak unit charges have seen significant reductions in these as well as their fixed charges (Figure 3). The patterns in access charging reductions are consistent with the increasing degree of toughness of the three five-year distribution price control reviews to be discussed in later sections.
For non-residential customers, consisting of commercial and industrial users, the time-series are somewhat shorter and refer to the more recent 1998/99-2005/06 period. As shown in Figures 4 and 5, during this period, these customers have seen some reductions in their unit charges. The fixed charges, however, show a decline in initial years and then tend to rise towards the end of the period to stay slightly below the 1998/99 levels.

141
Domestic unrestricted charges (2005/06 prices)
0.0
0.5
1.0
1.5
2.0
2.5
1990/91 1992/93 1994/95 1996/97 1998/99 2000/01 2002/03 2004/05
Uni
t cha
rge
p/K
Wh
0
2
4
6
8
10
12
Fixe
d ch
arge
p/M
PAN
/day
Unit charge Fixed charge
Figure 2: Domestic unrestricted access charges (2005/06 prices) Source: Ofgem
Domestic Economy 7 charges (2005/06 prices)
0.0
0.5
1.0
1.5
2.0
2.5
3.0
3.5
1990/91 1992/93 1994/95 1996/97 1998/99 2000/01 2002/03 2004/05
Peak
and
offp
eak
p/K
Wh
0
2
4
6
8
10
12
14
16
Fixe
d ch
arge
p/M
PAN
/day
Peak charge Offpeak charge Fixed charge
Figure 3: Domestic Economy 7 charges (2005/06 prices) Source: Ofgem

142
.
Non-domestic unrestricted (2005/06 prices)
0.0
0.5
1.0
1.5
2.0
2.5
1998/99 1999/00 2000/01 2001/02 2002/03 2003/04 2004/05 2005/06
Uni
t cha
rge
p/M
PA
N/d
ay
012345678910
Fixe
d ch
arge
p/K
Wh
Unit charge Fixed charge
Figure 4: Non-domestic unrestricted charges (2005/06 prices) Source: Ofgem
.
Non-domestic Economy 7 charges(2005-06 prices)
0.0
0.5
1.0
1.5
2.0
2.5
1998/99 1999/00 2000/01 2001/02 2002/03 2003/04 2004/05 2005/06
Pea
k an
d of
f-pea
k p/
MP
AN
/day
0
2
4
6
8
10
12
14
Fixe
d ch
arge
p/K
Wh
Peak charge Offpeak charge Fixed charge
Figure 5: Non-domestic Economy 7 charges (2005/06 prices) Source: Ofgem
The distribution price control reviews have also improved the relative position of the UK distribution charges and end-user prices among the member countries in the EU. As shown in Table 2, following the efficiency gains and stricter price

143
control reviews since 1995, the UK network (distribution and transmission) access charges are now among the lowest in the EU. Moreover, the reduction in distribution charges has also contributed to an increase in affordability of end-user prices. As a result, the share of income spent on electricity by low-income consumers in the UK is also among the lowest in the EU (see European Commission, 2005).
Number of regulated
transmissioncompanies
Number of regulated
distributioncompanies
Approximatenetwork
tariff – large users
(€/KWh)
Approximatenetwork tariff – low voltage commercial
(€/KWh)
Approximatenetwork tariff – low voltage
household(€/KWh)
Austria 3 133 0 51 53 Belgium 1 26 11 - 51 Denmark 10 120 19 25 48 Finland 1 91 10 26 37 France 1 161 12 40 48 Germany 4 950 9 53 62 Greece 1 1 8 - - Ireland 1 1 - 48 50 Italy 1 173 9 41 67 Luxembourg 2 10 7 62 72 Netherlands 1 12 - - 40 Portugal 3 13 4 39 37 Spain 1 308 69 34 33 Sweden 1 184 10 17 40 UK 3 17 5-12 11-23 17-34 Norway 1 170 11 25 - Estonia 1 42 11 31 40 Latvia 1 8 - - - Lithuania 1 2 6 23 42 Poland 1 14 13-26 48-88 37-50 Czech Rep 1 327 3 - 36 Slovakia 1 3 6 17 37 Hungary 1 6 2 48 30 Slovenia 1 5 8 38 31 Cyprus 0 1 - - - Malta 0 1 - - - 1. General: data excludes levies related to, for example PSOs and renewables or CHP promotion. 2. Germany: the category Ib is not typical of commercial customers of this size (annual load 1000 hours) 3. In Italy there are 10 companies owning a share of the national transmission network.
Table 2: Distribution and transmission access charges (excluding charges and levies) Source: European Commission (2005)

144
3.4 Assessments of the impact of reform
3.4.1 Efficiency and productivity studies
There are a number of efficiency and productivity studies which illustrate the performance of the UK RECs immediately before and after privatisation. Pollitt (1995) reports a comparative study of 136 US and 9 UK distribution utilities using 1990 data and finds the relative performance of UK utilities comparable to those of the US. Burns and Weyman-Jones (1994) apply mathematical programming techniques to measure the change in the performance of the RECs between 1973 and 1993. The study finds that the initial post-privatisation productivity growth is a continuation of the pre-privatisation trend indicating the effect of a lax initial price control review. Moreover, the results indicate an increase in performance diversity among the RECs after privatisation. Also, Burns and Weyman-Jones (1996) use an econometric cost function to examine the efficiency of the RECs between 1980 and 1992. The results show evidence of improved cost efficiency in the years following the 1990 privatisation of the RECs.
Hattori, Jamasb, and Pollitt (2005) examined the efficiency of the UK and Japanese distribution companies between 1985 and 1998 using data envelopment analysis (DEA) and stochastic frontier analysis (SFA) techniques. The DEA results indicate that following the reform, the efficiency differences among the UK firms increased. The results of Malmquist productivity index show a decline in productivity prior to the reform between 1985/86 and 1989/90.
Moreover, during the first price control review for the 1990/91-1994/95 period the annual productivity index for all RECs grew by an annual average of 1.2 percent. This was then followed by an annual average increase in productivity index of 10.7 between 1995/96 an 1997/98. The sharp increase in efficiency for this period has been attributed to the tougher second distribution price controls enforced for the 1995/96-1999/00 period.
Giannakis, Jamasb, and Pollitt (2005) re-examine the productivity of the UK RECs between 1991/92 and 1998/99. The study finds variations between the operating expenditure (Opex) and total expenditure (Totex) performance of the companies indicating scope for trade-off between operating and capital expenditures (Capex). In addition, the Malmquist productivity index results show significant improvement during the period of study.

145
3.4.2 Cost-benefit analysis of the reform
While efficiency and productivity analysis can be used to measure the efficiency effects of reforms on the sector, the overall economic efficiency resulting from reforms can best be examined by social cost-benefit analysis (SCBA). Domah and Pollitt (2001) provide a detailed social cost-benefit analysis of the effect of reform on the UK distribution companies. The study finds that per unit revenue of the distribution and supply businesses rose with an average of 22 percent above the preprivatisation-period level during the first price control period. During the second price control, the unit costs of the RECs fell 20 percent between 1994 and 1998. Also, labour productivity nearly doubled in 1997–98 over the 1990–91 level.
In addition, the study estimates the cost of restructuring and privatisation (at 1995 prices) at about to £1.1 billion at a 6 per cent discount rate. This cost reduces the benefits of restructuring and privatising the distribution and supply businesses of the RECs. Based on the experience of electricity supply industries in Northern Ireland and Scotland and of Nuclear Electric, and the performance of the area boards during the period 1979 to 1989, the study predicts that unit costs might have fallen by 2 per cent p.a. if privatization had not occurred. Comparing this counterfactual scenario with what actually happened the study predicts net efficiency gains from privatisation, which started accruing to consumers after 1999, will amount to about £6.1 billion. The net efficiency gains of the RECs are, however, very sensitive to the discount rate used, mainly due to the skewness in the distribution of these gains.
The Domah and Pollitt (2001) study identified how the net benefits were shared among consumers, government and producers in society. Of the total net benefit of £6.1bn in the base case consumers are expected to gain £1.1 billion (at 2 per cent counterfactual cost fall and 6 per cent discount rate) relative to continued public ownership of the RECs. With the special NGC rebates of 1995–96, the total benefits to consumers amounted to £2 billion; however, consumers lose at a 10 per cent discount rate. However, these benefits to customers were derived from predictions of future price falls, which began in 2000. By 1998, consumers had lost considerably from privatisation of the RECs. The government have gained £9 billion from privatization proceeds (£8.2 billion) and windfall taxes (£1.3 billion) which after loss of flow dividend/tax revenue would give a net benefit of about £5.0 billion from the restructuring and privatisation of the RECs.

146
4. Distribution Price Controls
4.1 The first distribution price control period
The initial distribution price controls on the RECs were put in place by the government and executed by the Department of Energy at the time of restructuring, and permitted price increases ranged up to 2.5 percentage points above the inflation rate (OFFER, 1994). Responsibility for future price controls was placed under an independent regulatory body, initially called OFFER and later Ofgem. Price controls on the RECs’ supply businesses only allowed price rises limited to no more than inflation during the period 1990/91 to 1994/95.
The leniency on the companies may be linked to the desire by the government to facilitate the sale of the assets by guaranteeing high prices for a fixed period. Indeed, the government did not consult the regulator on the terms of the first price control. Also, the government seems to have been unaware of the scale of potential for efficiency improvement in these companies. The companies showed high share prices well beyond their floatation values and paid increasing dividends to their shareholders.
It should be noted that the initial problems associated with implementing the reform were not limited to the regulation of distribution networks in the first price control period. During the same period, the ineffective structure and competition in wholesale market also led to large profits for the generators. Brower, Thomas, and Mitchell (1997) show that the profit to revenue ratio of the UK generators were in decline between 1985/86 and 1989/90 and consistently lower than those of the US utilities (though this could be due to high costs as well as under-pricing). However, in 1990/91 the UK generators catch up with the US firms and increasingly widen their lead until 1994/95.
4.2 Subsequent distribution price control reviews
At the time of the second price control review (1995-00 period), the companies had shown significant potential for efficiency gain. The period 1990 to 1995 saw large increases in the profitability of the RECs, leading to large rises in their share prices. Moreover, the successful flotation of NGC jointly owned by the RECs in mid-1995 indicated the undervaluation of the assets at privatisation. The windfall gains to shareholders of privatised utilities put the government under pressure. As

147
a result, the RECs were obliged to make a one-off 50 pound payment to their customers. Moreover, in 1997, a one-off wind-fall tax of £1.5 billion was imposed on the RECs payable in two instalments.
As discussed, the first distribution price control review period (DPCR1) for the 1990/91-1994/95 period set by the Department of Energy was generous to the companies. In August 1994, for the second distribution price control review (DPCR2) for the 1995/96-1999/00, OFFER introduced reductions averaging 14 percent in final electricity prices to take effect in April 1995, requiring price cuts in real terms of 11–17 percent in distribution charges in 1995/96. Distribution charges were, thereafter, required to fall by an X-factor of 2 percent per year in real terms for the duration of the price control review. However, a high takeover bid for Northern company shortly after the announcement of the price controls indicated that the utilities still had significant potential for cost savings. The event triggered a revision of the 1995/96-1999/00 price control which resulted in further reductions in real terms of between 10 and 13 percent in 1996/97 and increasing the X-factor to 3 percent. In addition, the price controls were modified in 1998 to allow RECs to make additional charges to facilitate competition in supply.
The third price control review (DPCR3) for 2000/01-2004/05 introduced further cuts on distribution businesses averaging 3 per cent for the next five years, with an initial cut in RECs’ distribution revenue by about 23.4 per cent (though some of the initial cut represented a transfer of costs to the legally separate supply businesses). This amounted to an overall initial revenue cut of £503 million at 1995 prices (Ofgem, 1999a). Table 4 summarizes the rate reductions under distribution and supply price control reviews.
Period Rate of price (cost) decrease 1990–91 to 1994–95 Variable up to 2.5% above the inflation rate
1995 to 1995–96 11–17% (average of 14%)
1996 to 1996–97 10–13%
1997 to April 2000 Average of 3% p.a.
2000 to 2004–05 One-off cut in distribution revenue by 23.4% in 2000–01; then a 3% p.a. fall in unit revenue until 2005
Table 4: Summary of distribution price controls for RECs in England and Wales Source: Domah and Pollitt (2001)

148
4.3 Ofgem’s distribution price control review 2005/06-2009/108
The basic characteristics of Ofgem’s approach to distribution price control can be stated as follows. An initial consultation document is issued around 18 months before the end of the current price control period. This document discusses the timetable and issues for consideration in the upcoming control period. This is followed by several subsequent documents. At each stage responses are invited from interested parties and these are publicly available in the Ofgem library unless marked confidential. A ‘Final Proposals’ document is issued within six months of the end of the price control with details of the X factors which Ofgem proposes to apply to each company from the beginning of the next control period. Companies have one month to decide to appeal to the competition authority, the Competition Commission (formerly the Monopolies and Mergers Commission) if they are unwilling to accept the proposed price control. An appeal on distribution prices has happened once so far when Scottish Hydro-Electric did not accept its final distribution and supply price controls proposed by the regulator for 1995-2000.9
The incentive regulation model of distribution networks in Britain consists of a hybrid of incentive schemes. Under the current arrangements, the operating expenditure, capital spending, and quality of service (including network energy losses) are incentivised separately and under different types of schemes within a building block framework.
The utilities’ controllable operating expenditures are incentivised by benchmarking these against an efficient frontier made up of the best practice DNOs in the sector. The allowed Opex of individual DNOs is set such that it requires them to close a specific proportion of their performance gap relative to the frontier during the price control period. In addition, all DNOs are given a general technical efficiency improvement target that is common to all DNOs.
In the latest two distribution price control reviews, Ofgem have used a relatively simple regression methodology where they obtain an adjusted measure of operating costs for each company and plot this against a measure of their composite output. They have then carried out an Ordinary Least Squares (OLS) regression of operating costs against output. Finally, they have shifted this line downwards, based on the technique of corrected ordinary least squares (COLS), to
8 This section draws significantly on Pollitt (2005). 9 See MMC (1995). Ofgem’s jurisdiction covers Great Britain only not Northern Ireland. Electricity and gas in Northern Ireland is regulated by Ofreg. Northern Ireland Electricity appealed against Ofreg’s distribution price control for the period 1997-2002 (see MMC, 1997).

149
obtain a frontier line against which inefficient firms are compared (Figure 6). In 2004 (and 1999) the data used for the regression analysis were for a single year (2004: 2002-2003 and 1999:1997-1998) for the 14 companies. In Figure 6, the efficiency score of firm B is given by the ratio: EF/BF. This represents the extent to which actual costs could be reduced while still keeping firm B on the efficient frontier.
Figure 6: Illustration of the COLS method
In the next stage, the regulatory asset base (RAB) for each DNO is determined, on which they are entitled to earn an allowed rate of return. While the existing assets in the RAB are gradually depreciated, in the long run, their stock of capital will increasingly consist of new capital investments. The initial RAB (used from the second price control period) in the case of the RECs was based on their market capitalisation at privatisation. The rate of return is set based on a weighted average cost of capital (WACC) measure which uses a specific reference debt and equity split, reference market rate of return and debt interest rate and a relevant equity beta. Firms are free to choose their own actual level of gearing. The pre-tax rate of return in the latest price control has been set at 6.9 percent.
New capital investments are increasingly driving the regulated revenue of DNOs, as operating expenditures fall and new investments are added to a growing regulatory asset base. The process for assessing the required level of capital expenditure over a price control period is as follows. Utilities must draft business plans which include projected capital expenditure. These are then audited by a firm of engineering consultants, working for Ofgem. Usually these consultants

150
recommend lower levels of capital expenditure than that proposed by each utility. This gives a base level of required capital expenditure to which an incentive scheme is applied. The incentive scheme resembles a menu of contracts regulation model. The menu of contracts approach is appealing at the presence of strong information asymmetry. However, this approach is not widely used in practice with the main difficulty being development of a set of suitable menu of options.
The allowed Opex and Capex of the utilities together with their regulatory asset base form the basis of the calculation of the utilities’ total allowed revenues. The allowed revenues are in turn the basis for determination of the utilities’ X-factors and initial prices applicable to their tariffs for the duration of the price control period. Figure 7 shows a simple illustration of setting the X-factors and allowed revenue. DNOs are allowed to recover their capital costs (weighted average cost of capital * regulatory asset base), depreciation costs, and operating expenditures. The utilities’ actual revenue should reach the efficient level of allowed revenue by the end of the price control period. This can be achieved by an infinite number of combinations of a price reduction in the first year and subsequent reduction through X-factors. Traditionally, Ofgem have opted for an immediate and differentiated reduction in initial prices combined with equal X-factors for all DNOs. This means that customers can benefit from the expected efficiency gains immediately and expect more moderate reductions in subsequent years.
Figure 7: Opex benchmarking and determination of allowed revenues and X-factors
Quality of service and network energy losses are incentivised separately through performance targets. The targets for each DNO are individual and deviation from these results in company specific penalties and rewards calculated based on an
2005 20102005 2010
WACC x RABWACC x RAB
DepreciationDepreciation
Eff. OpexEff. Opex
Allowed RevenueAllowed Revenue
Frontier ShiftFrontier ShiftActual Opex
X factor
Actual Opex
X factor
Actual Revenue 2005
X factor

151
elaborate system. The reward and penalty affect the total allowed revenue. In order to avoid jeopardizing financial viability of the companies, the maximum amount subject to quality of service reward and penalty scheme is capped as a percentage of allowed revenue. Collectively, these incentive schemes amount to a revenue cap incentive regulation.
Due to the presence of trade-offs between Opex, Capex, quality of service, and network losses, from an economic efficiency point of view, it is preferable to use an integrated benchmarking model. Such a model would be based on a single total expenditure measure where all cost measures as well as some measure of monetary values of service quality and network losses are added together. The hybrid system in Britain is contrary to the notion of integrated overall incentive regulation. However, the adopted approach – segmented regulation - gives more control to the regulator to address specific areas of focus. It also involves less complicated modelling than would a fully integrated benchmarking model and is more transparent in its operation. At the same time, the current incentive system does not reflect the potential trade-off between the specific regulated aspects of the utilities.
5. Some Issues in Regulation Benchmarking
In this section we discuss some issues with which incentive regulation has to deal. Each of these issues has been faced by Offer/Ofgem in the UK. We examine issues to do with identifying the right X-factor, incentivisation of quality of supply, network losses and new investments. Each of which poses particular challenges within the price review process.
5.1 Setting the right benchmark
The appeal of benchmarking as a practical approach to operationalize the concept of incentive regulation is evident. In particular, benchmarking has the potential to reduce information asymmetry between the regulator and the firm.
However, the information requirement for conducting a robust benchmarking exercise has proved to be more complicated than expected. Establishing the appropriate reporting formats, standardisation of data, and ensuring the quality of data have been non-trivial. Moreover, the legal aspects surrounding the collection

152
of the required data and the use of benchmarking have caused delays and complicated some regulatory proceedings.
A major reservation against assigning firm specific X-factors has been that the cost saving incentives can be blunted if companies are not allowed to retain efficiency savings beyond the next price review. Benchmarking may result in firms having to run to stand still and hence there may be strong incentives to subvert the regulatory process.
Frontier approaches are also susceptible to shocks and errors in data. This is especially the case when cross-sectional data is used and there is no allowance for errors. In order to minimise problems due to data errors there should be very careful handling of data accuracy. Recognising the importance of data quality in benchmarking, the Norwegian and UK regulators have made considerable efforts to improve data standardisation and accuracy.
Determining the future rate of movement of the frontier is problematic. Measures of past productivity growth usually include both frontier shift effects and movements towards the frontier. However, the problem can be reduced if firms are compared to world best practice as the variation in world best practice frontier shifts (given international benchmarking) is small (1-2% p.a.). Once efficiency scores are calculated, the crucial assumption in deciding the X-factors is the rate at which the efficiency gaps can be closed. The regulators will need to make allowance both for this and for in-country heterogeneity.
The issue of the scope for the use of benchmarking in incentive regulation has been important. For example, separate analysis of capital costs and operating expenses can encourage intermediation between these cost categories. Firms may attempt to seek higher capital expenditure to reduce operating costs. While, in principle, benchmarking should ideally apply to total costs, this is difficult given the heterogeneous nature of capital (which could simply be a function of differing accounting standards). As a result, regulators in leading countries such as the UK and Norway have made considerable effort to handle the possibility of intermediation. International comparisons are often restricted to comparison of operating costs because of the heterogeneity of capital but this may limit their applicability.
Moreover, strategic behaviour or gaming by firms within the regulatory process is a longstanding regulatory issue as the regulator is dependent, to a degree, on information supplied by the firms. However, although benchmarking may not

153
prevent gaming entirely it could relate to it (see Jamasb, Nillesen, and Pollitt, 2003, 2004). Di Tella and Dyck (2002) examine the strategic behaviour associated with price-cap regulation of electricity distribution utilities in Chile. The findings indicate a downward cost trend, but one year in four the cost was about 1.4 percent above trend. These cost reversals occurred in the year preceding a price review. The cost increase appears to lead to higher returns for stock prices of the firms. The study suggests that this represents a perverse incentive in the regulation model, as cost reversal in the year of price determination leads to higher prices in the following control period.
Furthermore, in many cases, though mostly in developing countries, lack of regulatory experience and inadequate implementation of incentive regulation models have led to major contract renegotiations (Benavides and Fainboim, 1999; Abdala, 2001; Basañes et al., 1999). Guasch (2003, 2004) finds that contract renegotiations after the award of infrastructure concessions have been significantly more likely for concessions under price cap than for rate of return regulation models. Renegotiations often reduced the incentive property of the regulation models by making them more similar to rate of return regulation. In addition, the achieved efficiency gains were often not passed to consumers and instead benefited the companies or the government (Estache et al., 2003). Maintaining the incentive property of the UK price cap regulation can gradually become difficult as the share of benchmarked costs declines (Thomas, 2004).
5.2 Quality of service
The social and economic costs of supply interruptions are substantial.10 At the same time, introduction of incentive regulation has brought to attention the issue of the trade-offs between costs and non-tradable outputs or attributes of the utilities. In particular, regulators are concerned with the trade-offs between capital and operating costs on the one hand and service quality on the other. Incentive regulation tends to narrow down the focus of the utilities on those aspects of their operation that are incentivised by the scheme. Under the prevalent incentive regulation schemes, utilities face strong incentives to undertake cost savings. Therefore, in the absence of specific regulation quality of service is likely to deteriorate.11
10 This section draws significantly from Giannakis, Jamasb, and Pollitt (2005). 11 It should be noted that quality of electricity services can be affected at generation, transmission, and distribution stages of the system.

154
Improving quality of service involves operating and capital costs for the utilities. However, the companies have better information about their ability to improve quality and the associated costs than the regulator. At the same time, the socio-economic cost or customer valuation of quality is difficult to measure. From a pure economic point of view, the optimum is where the marginal cost of improving quality is equal to the socio-economic value of quality improvement. In the absence of proper incentives to achieve optimal quality, it is very unlikely that a regulated utility will be offering optimal quality. Either the incentives to improve quality will be too low and there will be under-performance or the regulatory process will have allowed expensive quality investments which push the level of quality above the optimal level.
A survey of the literature in Sappington (2005) concludes that there are no simple policy solutions for effective regulation of quality of service but they depend on the information available to the regulator, institutional settings, and consumer preferences. The paper argues in favour of providing the regulated firm with proper reward and penalty incentives for service quality when the regulator has sufficient information on consumer preferences and production technologies.
The concern surrounding the impacts of incentive regulation on service quality has been recognised ever since price cap regulation was first implemented as part of the British telecommunication industry restructuring (Waddams Price et al., 2002). However, the strong focus of regulators on incentivising quality is of more recent date as reforms progressively evolve beyond pure cost efficiency considerations to encompass non-marketable aspects of the distribution networks.
Tangerås (2003) argues that, when quantity is regulated, yardstick competition results in lower quality than under individual regulation although under individual regulation, the quality would be too high. In principle, the above argument also holds for revenue and price cap regulation models. Evidence shows that utilities respond to explicit service quality incentives and strong regulation can prevent deterioration of quality. For example, evidence from the UK and Norway shows that, although their approaches to regulation differ, utilities have responded to quality of service incentives. Also, Ter-Martirosyan (2003), in a study of performance based regulation of the US electric utilities finds that, in the absence of explicit regulation, quality of service tends to decline. At the same time, the individual non-incentivised reliability indicators do not necessarily improve (CPB, 2004). This indicates both the power of incentives and the importance of defining the appropriate indicators.

155
There are different approaches for providing quality incentives to distribution utilities: (i) marginal rewards and penalties, (ii) absolute fines, and (iii) quality-incorporated benchmarking (Frontier Economics, 2003). The marginal reward and penalty scheme is based on reward or penalty per unit of quality improvements (degradation) that reflect marginal value of quality to customers. In equilibrium, a profit-maximising firm will operate at an efficient level according to its individual marginal cost curve. These mechanisms are referred to as “decentralised”, as they allow firms to choose their level of quality provision.
Absolute fines are centralised and require the company to pay a specified amount if quality drops below a threshold. Although absolute schemes are economically inferior to marginal ones, they entail broader social and political benefits by ensuring that customers are protected by performance standards. Regulators can also use a combination of marginal and absolute incentives. Quality-incorporated benchmarking is also based on marginal rewards and penalties. For example, under price cap regulation, a company that improves quality may be allowed to raise its price by an amount that reflects the social value of the increased quality. Similar to marginal reward and penalty schemes, these methods are decentralised, thus minimising the need for regulatory intervention. The challenge associated with incorporating service quality in benchmarking is to balance the cost and quality-oriented incentives.
Moreover, cost-quality benchmarking introduces the dynamic benefits of competition into the provision of service quality. In effect, by using benchmarking, regulated firms compete to deliver an optimal bundle of cost and service quality. Thus, in addition to static gain maximisation (achieved by adjusting the quality level subject to a fixed cost curve), firms also face an incentive to pursue long-term investments that shift quality provision costs downwards.
In designing quality-incorporated regulatory mechanisms, regulators are faced with the task of determining a market demand curve for service quality. Lack of detailed and accurate data is also a common problem. For instance, the Norwegian regulator estimates interruption costs at an aggregate level, where customers are classified as being either residential/agricultural or industrial/commercial (Langset et al., 2001). Service quality regulation also involves a political aspect that can come into conflict with economic considerations. Customers’s valuation of quality may differ between distribution companies. This would imply that individually tailored service qualities are the efficient outcome. However this may be

156
politically unacceptable if poorer regions ended up with worse levels of quality of service.
At the same time, regulators have not yet explicitly integrated quality of service in their benchmarking exercise. A notable exception is, however, Norway which introduced quality-dependent revenue caps in 2001 (Heggset et al., 2001; Langset et al., 2001).
5.2.1 Quality of service in the UK under incentive regulation
Conceptually, inclusion of service quality in an overall efficiency benchmarking of utilities has clear incentive advantages and this has been advocated in other studies (see e.g. Giannakis, et al., 2005; Ajodhia and Hakvoort, 2005). In Norway, such an approach has been used in the 2002-2007 distribution price control and is also expected to be used for the next price control. Giannakis, et al. (2005) report a benchmarking study of the UK distribution companies between 1990/91 and 1998/99. The study finds significant changes in the rankings of the companies when benchmarked in terms of operating cost, total cost, quality-only, and combined cost-quality models (Figure 7). The results indicate that there are potential trade-offs between cost (operating and capital) and quality and that partial cost benchmarking does not sufficiently capture the service quality dimension.
As mentioned in Section 4.3, from an economic efficiency point of view, due to presence of trade-offs between Opex, Capex, service quality, and losses, it is preferable to use an integrated approach to benchmarking. Such an approach could, for example, be based on obtaining a monetary value such as willingness to pay (WTP) for well-defined measures of quality and adding the cost of (expected) service interruptions to the utilities’ total costs. To the extent the utilities can improve their actual quality of service performance they can retain the difference between the actual and expected cost of interruptions. Hence, the utilities will have incentive to improve service quality up to the point where the cost of doing so equals the WTP value of quality.

157
0
2
4
6
8
10
12
14
16
Eastern
E. Midl
ands
Londo
n
Manweb
MEB
Northe
rn
NORWEB
SEEBOARD
Southe
rn
SWALEC
SWEB
Yorkshi
reHyd
ro
Scottis
hpow
er
Opex Totex Quality Totex-Quality
Figure 7: Average annual company rankings from Models Opex, Totex, Quality and Totex-Quality (1 is best, 14 is worst) 1991/92-1998/99
The current regulatory arrangements in the UK treat Opex, Capex and service quality separately. This may provide firms with distorted incentives that lead them to adopt an inefficient output mix. Under the current regulatory regime, a firm receives greater benefits from saving Opex than by an equal amount of Capex reduction (Ofgem, 2003a). Thus, firms may seek to capitalise Opex to obtain higher efficiency score and allowed revenue. Unless utilities face incentives that reflect the social value of service quality, they are unlikely to provide socially optimal levels of quality.
A further issue is related to the periodicity of the price reviews. Under the present scheme, companies retain 27% of the present value of a cost reduction made in the first year of a review period but only 6% of the present value of an equal cost saving made in the final year (Ofgem, 2003a). Thus, companies may delay efficiency improvements and/or adopt distorted capital investment programmes. Such distortions of incentives exist for quality enhancing investments, where the quality benchmarks are reset every five years. This means that any benefits of investments may not be retained beyond the current price review period.
Between 1990 and 2000, quality of service in Great Britain was regulated through guaranteed standards of performance, which entitle consumers to compensation if the firms breach them, and overall standards, which refer to system-level performance. Originally, 10 guaranteed standards were applied and a further one

158
was introduced in 1998. Overall standards were also set for each firm. The regulator has progressively tightened the standards and consultations with DNOs and other stakeholders have been carried out. However, there is no direct evidence with regards to the effectiveness of the reward and penalty schemes (Waddams Price et al., 2002). However for the current price control period (2005-2010) considerable improvements in quality are expected.
The third price control review set company-specific quality standards for 2004/05 on the basis of their historic performance (Ofgem, 1999a). The regulator and the companies generally supported the introduction of an incentive-based regime for service quality regulation (Ofgem, 1999b). However, since the necessary foundation work had not been carried out, it was proposed that the incentive mechanisms should be developed as part of a work programme, the Information and Incentives Project (IIP), and applied from 2002/03, rather than the start of the price control period (2000/01).
The progress of the IIP illustrates some of the challenges involved in setting up incentives for quality of service. The IIP was divided into two main parts. The first part, culminated in September 2000, defined output measures for service quality, set guidelines for improving measurement accuracy, and constructed a framework for reporting and monitoring. Regarding measurement accuracy, it was estimated that the quality measurements conducted by DNOs involved errors of up to 30% in some quality measure (Ofgem, 2000).
Although inaccuracies in data may have some effect on the level of efficiency measured for the firms, the rates of change are less likely to be affected. Data from recent years are more accurate as Ofgem requested the DNOs to install measurement systems with 95% accuracy by April 2002 and an independent auditor was appointed to examine measurement issues. It is noteworthy that Ofgem has expanded considerable effort to harmonise the data on quality of service which have subsequently been utilised to devise reward and penalty schemes for the companies in relation to performance standards.
The second part of the IIP, focused on incentive regulation schemes for quality of service. The current scheme, which came into operation in April 2002, links the quality of service performance of DNOs to their allowed revenue. The arrangements consists of mechanisms that (i) penalise utilities for not meeting their targets, (ii) reward utilities that exceed targets, and (iii) reward frontier performance by guaranteeing less strict standards for the next control period (Ofgem, 2001). In order to mitigate regulatory risk, the exposure of the firms’

159
revenues has been limited to up to 4% of their regulated revenue (see the next subsection for more details). In practice, the IIP’s scheme is similar to the marginal penalties (rewards) scheme, with the addition of a payment cap. However, it is unlikely that these marginal incentives are calibrated such that they reflect the full social value of quality (Frontier Economics, 2003).
In the UK, for the purposes of regulation, the main measures of quality of service in distribution networks, in terms of revenue exposure, are supply interruptions per 100 customers (availability of service) and number of minutes lost per connected customer (reliability of service). Figure 8 shows that, in the post-reform period, the number of interruptions in the UK distribution networks has gradually decreased. The figure indicates a marked decline in interruptions during the second price control review period. During the third price control review period, the interruptions initially show some increase and then decline at the end of the price control period.
Figure 9 shows the number of minutes lost per connected customer for the same period. As shown in the figure, during the three price control reviews, the reliability of service has also generally improved. Overall the trends in quality of service measures indicate improvements under incentive regulation. It should be noted that some variations from one year to another can be caused by measurement errors and weather conditions.
Inclusion of the cost of non-delivered energy based on WTP measurements can affect different utilities to rather different degrees. Figure 10 shows the calculated cost of energy non-supplied as percentage of revenue caps for 130 Norwegian distribution utilities in increasing order. As shown in the figure, it is possible that, at the extreme ends of the spectrum, some firms may be rewarded or penalised significantly by inclusion of the cost of non-delivered energy. At the initial price control periods, the regulator must be confident about the quality of data and particular circumstances of ‘outlier’ firms and special cases that may give rise to large deviations from the main body of observations.

160
0
20
40
60
80
100
120
91/9
2
92/9
3
93/9
4
94/9
5
95/9
6
96/9
7
97/9
8
98/9
9
99/0
0
00/0
1
01/0
2
02/0
3
03/0
4
04/0
5
Inte
rrupt
ions
per
100
cus
tom
ers
For some DNOs substantial changes were made for accuracy as new measurement systems were introduced
Figure 8: Average number of interruptions per 100 customers per year Source: Ofgem
0
20
40
60
80
100
120
91/9
2
92/9
3
93/9
4
94/9
5
95/9
6
96/9
7
97/9
8
98/9
9
99/0
0
00/0
1
01/0
2
02/0
3
03/0
4
04/0
5
Min
utes
lost
per
con
nect
ed c
usto
mer
For some DNOs substantial changes were made for accuracy as new measurement systems were introduced in the course of 2001/02
Figure 9: Average number of minutes lost per connected customer per year Source: Ofgem

161
It is important to decide whether the WTP values used are uniform across the country and for all companies. There is reason to believe that this value can differ across the country and hence in different distribution service areas. To the extent that regional differences in WTP values are not reflected in the incentive scheme, the adaptation of utilities to socially efficient service quality levels can be distorted. A survey of WTP commissioned by the UK regulator Ofgem indicates that such valuation differences among different regions and consumer groups indeed exist (Ofgem, 2004a). At the same time, the overall WTP of networks for a given unit of quality also depends on the composition of their customers. For example, energy intensive and large industrial customers generally assign a higher value and opportunity cost to service quality than residential and commercial customers.
Figure 10: The cost of energy not-supplied (ENS) as percentage of revenue cap for 130 Norwegian electricity distribution utilities
Source: Dalen (2006)
Nevertheless, the potential political sensitivities of explicit use of differentiated service quality valuations are clear. However these sensitivities may be a particular feature of central government, local governments may be much freer to assign different quality valuations compared with their peers. It is important to

162
note that the marginal cost curve of improving service quality varies across the companies. An implication of subjecting the firms to their marginal cost of quality improvements is that, in the long-run, this could result in differentiated service quality levels across the country.
If there are substantial performance differences in term of quality of service, the share of quality incentives as their total allowed revenues can be substantial. The effect of the value of quality on total allowed revenues for some utilities may become stronger than those of the Norwegian utilities depicted in Figure 10. It is preferable to first aim at bringing the quality of service to comparable levels across the sector before integrating them with the companies’ own costs and incorporating them fully into the benchmarking model.
For some firms with low quality performance, the transition to a high quality network may require large capital investments and time. In the UK, there is a 46 percent allowed increase in real capital investments in the 2005-2010 distribution price control period over the previous period that is partly intended to improve the quality of service during this period. Exempting investments from benchmarking offers some flexibility in addressing investment related priority targets. In contrast, it must be noted that, total cost benchmarking methods do not have built-in mechanisms that would signal increased investment in specific areas such as quality. In Norway, the regulator has incorporated the value of non-delivered energy to customers as a cost in the benchmarking model. The values are obtained from surveys and studies of different consumer groups. Both the UK and Norwegian benchmarking models, despite the differences in their approach, have succeeded in improving the quality of service.
5.2.2 Quality of service incentives within UK price controls
As noted, regulation pertaining to quality of service of DNOs has evolved gradually since the first distribution price control review. Quality of service in distribution networks is multi-faceted and extends beyond the number and length of service interruptions. Recognising this, the quality of service incentives in Ofgem’s price controls through revenue exposure consist of: (i) interruption (continuity of service) incentives, (ii) guaranteed standards of performance, (iii) quality of telephone service, and (iv) a discretionary reward scheme.
The fourth price control review has significantly increased the targets and provided stronger incentive to achieve these. Table 5 shows the revenue exposure of the DNOs to quality of service performance measures for the third (1995/99-

163
2004/05) and fourth (2005/06-2009/10) price control reviews. The interruption incentives are supply interruptions per 100 customers (CI) and number of minutes lost per connected customer (CML). Individual CI and CML targets are set for the companies and performance is measured in relation to the targets.
IncentiveArrangement
DPCR3 DPCR4
Interruption incentive scheme: - Duration of interruptions - Number of interruptions
+/-1.25%+/-0.5%
+/-1.8%+/-1.2%
Storm compensation arrangements
-1% -2%
Other standards of performance Uncapped Uncapped
Quality of telephone response +/- 0.125% +0.05% to -0.25%
Quality of telephone response in storm conditions
+/- 0.125% 0 initially +/-0.25% for 3 years
Discretionary reward scheme Not applicable Up to + 1m pounds
Overall cap/total +2% to -2.875% 4% on downside No overall cap on upside
Table 5: Revenue exposure to quality of service Source: Ofgem (2004b)
The guaranteed standards of performance cover 12 specific aspects of the service. While these incentives affect the companies’ regulated revenue, the standards of performance involve payment of compensation to individual customers under defined circumstances (Table 6). In principle, companies should be indifferent as to whether they settle the quality-related payments by transacting with the government (e.g. through fines) or with consumers (e.g. through compensation or reduced prices). However, the latter option can in practice be politically more attractive as it compensates those who have experienced poor service quality (Waddams Price et al., 2002).

164
Repor- ting code Service Performance Level Penalty Payment
GS1 All DNOs to respond within 3 hours on a working day (at least) 7 am to 7 pm, and within 4 hours on other days between (at least) 9 am to 5 pm , otherwise a payment must be made
Respond to failure of distributors fuse (Regulation 10)
£20 for domestic and nondomestic customers
GS2 Supply restoration: normal conditions (Regulation 5)
Supply must be restored within 18 hours, otherwise a payment must be made
£50 for domestic customers and £100 for non-domestic customers, plus £25 for each further 12 hours
GS2A* Supply restoration: multiple interruptions (Regulation 9)
If four or more interruptions each lasting 3 or more hours occur in any single year (1 April – 31 March) , a payment must be made
£50 for domestic and nondomestic customers
GS3 Estimate of charges for connection (Regulation 11)
5 working days for simple work and 15 working days for significant work, otherwise a payment must be made
£40 for domestic and nondomestic customers
GS4* Notice of planned interruption to supply (Regulation 12)
Customers must be given at least 2 days notice, otherwise a payment must be made
£20 for domestic and nondomestic customers
GS5 Investigation of voltage Complaints (Regulation 13)
Visit customer’s premises within 7 working days or dispatch an explanation of the probable reason for the complaint within 5 working days, otherwise a payment must be made
£20 for domestic and nondomestic customers
GS8 Making and keeping Appointments(Regulation 17)
Companies must offer and keep a timed appointment, or offer and keep a timed appointment where requested by the customer, otherwise a payment must be made
£20 for domestic and nondomestic customers
GS9 Payments owed under the standards (Regulation 19)
Payment to be made within 10 working days, otherwise a payment must be made
£20 for domestic and nondomestic customers
GS11A* Supply restoration: Category 1 severe weather conditions (Regulation 6)
Supplies must be restored within 24 hours (see table 2.2 below), otherwise a payment must be made
£25 for domestic and non domestic customers, plus £25 for each further 12 hours up to a cap of £200 per customer
GS11B* Supply restoration: Category 2 severe weather conditions (Regulation 6)
Supplies must be restored within 48 hours, otherwise a payment must be made
£25 for domestic and non domestic customers, plus £25 for each further 12 hours up to a cap of £200 per customer
GS11C* Supply restoration: Category 3 severe weather conditions (Regulation 6)
Supplies must be restored within the period calculated using the following formula:
£25 for domestic and non domestic customers, plus £25 for each further 12 hours up to a cap of £200 per customer
GS12* Supply restoration: Highlands and Islands (Regulation 7)
Supply must be restored within 18 hours, otherwise a payment must be made
£50 for domestic customers and £100 for non-domestic customers, plus £25 for each further 12 hours
* Customers need to claim under these standards, for the remaining standards payments are automatic Table 6: Guaranteed standards of performance
Source: Ofgem (2005)

165
5.3 Network energy losses
The term energy loss refers to physical losses (as heat, noise, or theft) during distribution through a network. Energy losses can be broken down into variable, fixed, and non-technical losses. The value of losses can, however, vary according to time of day and time of year. Losses also contribute to the emissions of pollutants and greenhouse gases.
The UK has higher transmission and distribution losses than countries such as Germany, France, Italy and United States, but lower than Spain, Canada and Ireland (Ofgem, 2003b). Approximately 7 percent of electricity transported in the U.K. is reported as electrical losses (Ofgem, 2003b).12 According to one estimate, energy losses in the distribution networks are around £900 million i.e. equivalent to 5 percent of the average annual electricity bill (Ofgem, 2005). Figure 11 shows that, since liberalisation, energy losses, as percentage of energy delivered, in distribution networks have gradually declined. In particular, there is a marked reduction in losses during the 2001/02-2003/04 period.
.
5.0%
5.5%
6.0%
6.5%
7.0%
7.5%
8.0%
1990-91
1991-92
1992-93
1993-94
1994-95
1995-96
1996-97
1997-98
1998-99
1999-00
2000-01
2001-02
2002-03
2003-04
Figure 11: Distribution losses in the UK as percentage of energy delivered Source: Ofgem
The distribution price control review also provides incentives for reducing losses in distribution networks. There has been a significant improvement in the loss 12 This section draws mainly on Yu, Jamasb, and Pollitt (2007).

166
percentage during the third price control period. The distribution losses targets were set from the first through to the second and third price control reviews (O, 1999b). Each DNO is evaluated based on a yardstick loss figure derived by taking total GWh losses for all firms and constructing a composite explanatory variable weighted on GWh (70%), transformer capacity (20%), and network length (10%).
Financial penalties up to 0.25 percent of revenue are imposed on distribution firms if losses exceed the yardstick losses. Rewards are available for firms if the losses have decreased below yardstick levels (Ofgem, 1999b). Currently, an additional financial rewards and penalties of the incentive at 2.9 pence per kWh is applied to the difference between the actual and the target level of losses valued by the incentive rate in the first year. The reward and penalty falls in a straight line over ten years.
Starting from the fourth price control period, for every kWh of loss reduction (increase), DNOs will be rewarded (penalized) at 4.8 pence per kWh (in 2004/05 prices). Losses targets are set between the ranges of 4.96% to 8.73% among DNOs (Ofgem, 2004b). The target level of losses is based on a proportion of units distributed and is fixed for five years. The fixed target would be based on past performance of the DNO, as measured by the average proportion of energy lost between 1994/95 and 2003/04. The rolling retention mechanism will be in place to ensure that DNOs receive full benefit of incremental improvements in performance for a period of 5 years.
In many cases, DNOs will face conflicting incentives on losses, capital efficiency, operating efficiency, and quality of supply. For example, due to the location of system open points, the loss-related incentives can conflict with the quality of service incentives. Such conflict can also occur between Capex and losses where firms may prefer to invest in conventional transformers rather than low-loss transformers in order to reduce expenditures (Ofgem, 2003b).
5.4 Incentivising efficient new investments
As mentioned earlier, minimising the cost of network expansion and upgrade is a major issue for the regulators and benchmarking of new investment can be an increasingly important part of the price control process.
The investment efficiency incentive scheme adopted by Ofgem as part of the 2005-2010 distribution price control review exhibits some flexibility for firms to

167
perform better than their allowed and expected investment needs. This approach also enable the firms, when possible, to take the trade-offs with operating expenditures into consideration.
At the same time, for the 2005-2010 price control review, the regulator has allowed a substantial increase in capital investments aimed at modernisation of the networks. The 45% increase in capital expenditure allowance from £3,882 million for the 2000-05 review period to £5,623 million (excluding quality of service) has resulted in a positive average X-factors for the sector as a whole for the first time.13 The increase in allowed investments has been accompanied by an incentive scheme that is based on allowing higher returns on actual investments for making lower investments than the target level.
The distribution price control review introduced a sliding scale system for capital investment incentives. The incentives are outlined in Table 8. PB Power were the engineering consultants who reviewed the companies capital expenditure plans. The higher the ratio selected by the company to PB Power’s assessment the weaker the incentive if the company actually delivered its investment below budget. Therefore, a company that selected as its base allowed revenue the lowest ratio of its cost to PB Power’s estimate could keep 40% of any under-spend while the company that selected the highest ratio could only keep 20% of any under-spend. Thus a company who estimated that it needed to spend £140m when PB Power estimated only £100m was required to have a base target of £115m. If the company achieved £100m it would receive £100m plus an incentive payment of £0.6m. By contrast a company that said it needed £100m against PB Power’s £100m and then actually achieved £100m would receive a £100m plus an incentive payment of £4.5m. This is a menu of contracts approach14 to regulation which encourages companies to more correctly reveal the true estimated cost of capital investments.
13 48% increase including investments earmarked for quality of service. 14 See Baron (1989).

168
Table 8: Sliding scale matrix for incentivising Capex in the UK DNOs byOfgem in 2005-2010 distribution price control review
Source: Ofgem (2004b, p. 87)
An investment increase of such magnitude may appear as being rather generous to companies. However, this is a reminder that conventional benchmarking methods do not necessarily send proper signals to the regulator about the need for asset renewal and thus for increased capital investments across the sector as a whole. It may be argued that by limiting the benchmarking exercise to Opex Ofgem have maintained the flexibility to respond to the cyclical nature of investments in distribution networks and need for an overall increase in capital investments (Figure 12). In Norway, on the other hand, as shown in Bye and Hope (2005), the introduction of rate of return regulation in 1991 and subsequently the benchmarking based regime incentive regulation in 1997 resulted in a decline in network investments (Figure 13).
Dalen (1998) examines investment incentives of firms under yardstick competition while distinguishing between industry-specific and firm-specific investments. The paper suggests that under yardstick competition, industry-specific investments with spill-overs that benefit all firms are reduced. At the same time, firm-specific investments that only improve the relative efficiency of the individual firm will increase. An example of industry-specific type of investments is research and development (R&D) and innovation spending, which despite their relatively small share in total spending have significant long-term efficiency benefits for the sector as a whole.
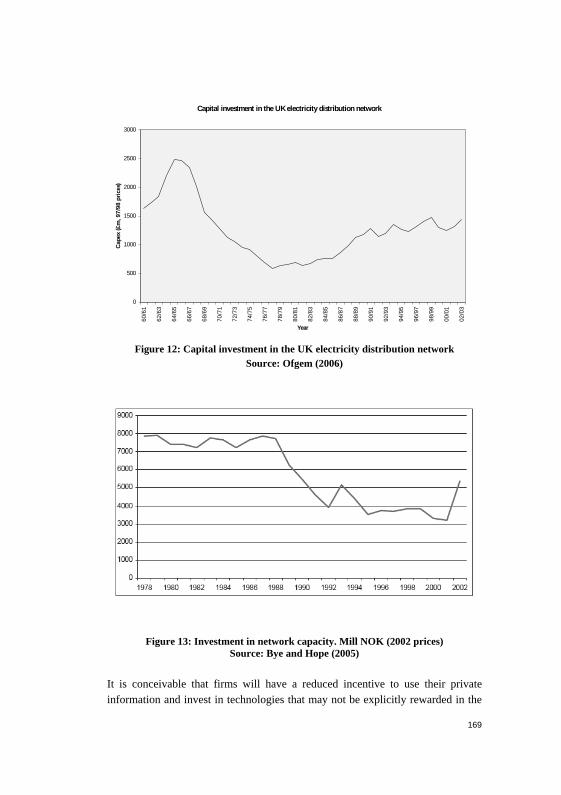
169
Capital investment in the UK electricity distribution network
0
500
1000
1500
2000
2500
3000
60/6
1
62/6
3
64/6
5
66/6
7
68/6
9
70/7
1
72/7
3
74/7
5
76/7
7
78/7
9
80/8
1
82/8
3
84/8
5
86/8
7
88/8
9
90/9
1
92/9
3
94/9
5
96/9
7
98/9
9
00/0
1
02/0
3
Year
Cape
x (£
m, 9
7/98
pric
es)
Figure 12: Capital investment in the UK electricity distribution network Source: Ofgem (2006)
Figure 13: Investment in network capacity. Mill NOK (2002 prices)Source: Bye and Hope (2005)
It is conceivable that firms will have a reduced incentive to use their private information and invest in technologies that may not be explicitly rewarded in the

170
price control model as the regulator may extract the rents from such investments ex-post. The magnitude of such industry-specific investments in electricity distribution utilities is, however, likely to be low but the benefits could be disproportionate to the expenditure. In 2004 Ofgem introduced the possibility for DNOs to recover up to 0.5% of their revenue p.a. to fund R&D investments under the Innovation Funding Incentive (IFI). Mott Macdonald BPI (2004) estimated the net present value of benefits from the IFI scheme at about £386m as opposed to an increase in consumer expenditure of £57m.
Thus, Ofgem’s benchmarking model can be described as a short-term efficiency benchmarking model as it includes only operating costs. The long lead times necessary for the firms to achieve any new asset structure in the long-run must be achieved through the allowed capital expenditure.
Achieving long-term efficiency improvements can involve short-term increases in Capex and/or Opex expenditures that may not generate immediate efficiency improvements. Indeed, short-term expenditure increases can deteriorate the firms’ short-term relative performance. This can in turn prevent firms from embarking on efficiency improving investments that have long-term gains. More specifically, long-term efficiency improvement targets should be facilitated with incentives allowing the firms to keep the benefits of efficiency gains.
The mismatch between the long-term horizon of investments and short price control periods can have a negative effect on the cost of financing investments (see Ofwat/Ofgem, 2006). Longer regulatory periods (e.g. seven or ten years) can reduce uncertainty with regards to long-term investments and retaining their benefits. However, even substantially longer regulatory price control periods will likely not fully incentivise investments in innovations with even longer payback periods.
6. Lessons from the UK Experience for Switzerland
Judging by the British experience, what lessons can be drawn from the experience of the past 16 years with incentive regulation for a country such as Switzerland where opening up of the sector is still contested. We can derive some general insights as well as some more specific lessons of experience for Switzerland from the cumulative experience with incentive regulation of networks from Britain and around the world.

171
New incentive regulation and benchmarking models have grown out of the conventional regulation models and the need for new approaches to stimulate efficiency improvement in the monopoly segments of reformed industries. It is likely that different parallel national models will exist in different countries. However, the constant interaction between the regulators and firms and the cumulative experience from around the world will ensure that network regulation will continue to evolve and innovate. Finally, the “consultative” or ‘constructive engagement’ approach which has been suggested as an alternative to mainstream models of regulation in certain circumstances.15 The approach is based on engaging the main stakeholders in the process of regulation. It is, however, too early to judge whether this represents a major step in the evolution of regulation. Figure 13 indicates the incentive properties of different regulation models.
Figure 13: The evolution pattern of regulation Source: Viljainen (2005)
It is important that the reform framework and regulatory approach take the countries’ institutional endowment and capacity into consideration. At the same time, it is crucial to recognize that compromising on main economic features of regulation can reduce its effectiveness. In this regard, a transparent set of rules, processes, and outcomes are particularly important. In countries without the tradition of independent regulation, the new regulator may be weak in terms of mandate and authority. In such cases, transparency is particularly important as
15 See Civil Aviation Authority (2005) for a description of this model in the case of UK airports.

172
insight into the procedures and process will reduce the possibility of regulatory capture. For example, incentive regulation and benchmarking were first practised and have been more successful in countries such as the UK and Norway with transparent regulatory procedures and consultations beyond the companies involved. In the case of regulation this increases the checks and balances of the process and ensures a credible process which is crucial to any regulatory framework.
Network regulation can play a significant role in reducing the cost of electricity supply. In the UK the efficiency gains from incentive regulation of the distribution networks are at least comparable (in terms of relative share in final price) to those gained from competition in the wholesale markets. New Zealand, by contrast, where the reform failed to properly regulate the distribution companies saw the reform gains achieved in the generation sector captured by the distribution companies as higher profits (see Bertrand and Twaddle, 2005).
As discussed in the previous sections, the British model of distribution network incentive regulation has brought about significant price reductions to the customers. Admittedly, in the initial years the companies made large profits which with the benefits of hindsight could have been avoided. This can partly be attributed to underestimation of the potential for efficiency improvement in the networks, the focus on implementing competition in generation and the price formulae set out by the government as part of the selling off the assets rather than to ineffectiveness of incentive regulation per se.
As noted above, through the subsequent price control reviews, the British network regulation model has successfully: substantially reduced distribution access charges, maintain and improve quality of service, and ensured sufficient investments. A tough regime of operating expenditure benchmarking has brought those costs down and the share of these in total revenues has consistently been reduced. This has focused regulation on dealing effectively with the persistent question of investment adequacy and the long-term reliability of the networks. The question of how to correctly incentivise new investments, especially as these become more significant due to replacement cycles and the demands of new distributed/renewable generation, emerges as an important challenge to both incentive regulation approach and benchmarking.
Although the fragmented regulation and benchmarking approach consisting of benchmarking of operating expenditures, the review of capital investment plans, and penalty/reward schemes for quality of service and network energy losses do

173
not strictly conform to an ideal integrated theoretical framework, this approach has performed well and has given the regulator flexibility to address and incentivise specific aspects of network regulation.
As noted in Jamasb and Pollitt (2005), the process of liberalisation towards the internal electricity market in the European Union is currently the only cross-country broad reform process in progress. Although the pace of the EU-wide reform has been slow, the centralised initiatives and the Electricity Directives have managed to maintain some momentum in the process. In the absence of EU-led initiatives, many member countries would have undertaken considerably less progressive reform measures. Switzerland by the virtue of not being a member of the EU has not been obliged to take part in the liberalisation of the European electricity sector liberalisation. The reform debate in Switzerland was led by the interest to maintain its position as a major exporter of peak energy to neighbouring markets, a role which combined with the geographical situation of the country made it an essential switching board in Europe. Within this debate, distribution – as opposed to transmission – attracted inappropriately little interest.
But does this mean that the country has foregone improvement in terms of the efficiency of the sector or economic competitiveness? The answer may lie partly in the current efficiency level of the sector and partly in the potential for improvement in the sector. The latter must be carefully viewed within the backdrop of institutional factors that may constraint implementation of a workable reform. A partially implemented reform can indeed be less desirable than a non-reformed sector. The history of the British electricity distribution networks shows that in the past nationalisation harmonized the technical standards and reduced the number of networks over time making some potential economies of scale available. This facilitated the subsequent privatisation and introduction of incentive regulation in the UK.
The following more specific features of the electricity distribution sector reform in Britain and elsewhere offer several insights and lessons of experience for other countries at earlier stages of reform in general and incentive regulation of networks in particular.
Incentive regulation and the wider reform – In the implementing of incentive regulation for the distribution networks, it is not necessary to introduce the reform steps in the same order as in the British case. Contrary to common practice worldwide, it is not imperative to implement incentive regulation of distribution networks at the same time as or after

174
introducing competition in the wholesale and retail markets. It could well happen earlier. A crucial role of the distribution system in reforms is to provide regulated third-party access for wholesale and retail market competition over the networks. However, access to networks is an entirely different matter from incentive regulation of them. Neither is privatisation a prerequisite for implementing incentive regulation as the publicly owned Norwegian and Dutch electricity distribution networks illustrate. It may, however, be useful to distinguish between local and municipal ownership on the one hand and state ownership on the other as the latter may be less efficient. It then follows that, if the introduction of competition is not feasible or desirable, there is no reason for not considering incentive regulation of the networks on its own merits. Likewise, lack of willingness or support for privatisation of networks should not be an obstacle for incentive regulation of them.16
Reform policy - A recent OECD report on regulatory reform in Switzerland states that “An evolutionary process is underway, partly in anticipation of market opening, toward consolidation, partnership and cooperation, and sale of public equity.” (OECD, 2005). There is reason to believe that ad hoc and unsupervised structural and positioning in advance and anticipation of the actual reform are not only unhelpful but are also likely to constrain and complicate the implementation of a future reform and the tasks of the regulator. Much depends on whether public owners of distribution facilities behave as private parties emphasising their freedom to contract or whether, as this was the case in Britain, the legal framework allowed for more steering by central authorities. We would argue that any restructuring or reorganisation with a view to a reform should ideally take place under the oversight of an independent sector regulator (although this was not the case in Britain) and as part of a coherent reform agenda. The British reform benefited greatly from initially having 14 independent, roughly comparable, DNOs to regulate. Such early developments can create new vested interests and put in place ineffective structures that regulation cannot easily alter or correct their effect. This is due to the fact that capital has proven significantly more mobile and proactive than the process of rule-making for reforms. The sectoral and cross-sectoral
16 The case of incentive regulation of municipal and county owned utilities in Nordic countries is testimony to this. However the consequences of applying incentive regulation – designed for profit maximising private companies - to locally/publicly owned companies may need to be better understood. See Magnus (2000) for a discussion of the case of introduction of incentive regulation for locally owned utilities in Norway.

175
consolidations in the EU where firms acted to position themselves ahead of the actual reform or establishment of strong independent regulator (as in Germany) illustrate how progress towards an effective market can be frustrated in the absence of clear reform policies.
Legislation and independent regulation - The reform law should be clear regarding the aims of the reform and the regulator’s mandate and areas over which it should have authority. Independent regulation has become the prerequisite and cornerstone of reform of infrastructure and network industries. Establishment of an independent regulatory authority should take place by mandate from and soon after the necessary legal base is in place. In the Netherlands, lack of legislative clarity with regards to the benchmarking approach led to legal challenges by the utilities and new legislation (Nillesen and Pollitt, 2007). At the same time, legislation should avoid being too specific on some central matters that should normally be the domain of regulatory discretion. For example, whether the regulator should use specific approaches to incentive regulation or use benchmarking or perhaps international benchmarking needs to be the preserve of the independent regulator. In Sweden, by requiring ex-post regulation of distribution networks, the law has in part led to adoption of an incentive regulation model that has resulted in major disputes between the regulator and firms.
Unbundling and ring-fencing distribution - Effective separation of the networks from the competitive segments is crucial. Legal separation of the networks and ring-fencing of the distribution assets and costs from the rest of vertically integrated structures is essential for effective incentive regulation schemes and benchmarking. This should ideally be done as early as possible to avoid strategic behaviour and prior to the start of incentive regulation to avoid strategic behaviour. Jamasb, Nillesen, and Pollitt (2003) show that regulators have identified definition and allocation of distribution costs and assets as important in incentive regulation and benchmarking. Ofgem has invested considerable effort in effective separation of distribution from supply business. Structural shortcomings cannot easily be mitigated by other means.
Quality of service – The use of performance targets combined with penalty and reward incentive system has improved the quality of service in the UK distribution utilities. This approach, though perhaps not perfect, is in contrast to a purely cost-oriented benchmarking, which could lead to

176
perverse economic incentives. It is important for to take quality of service and related investments into account when introducing incentive regulation. The British example shows that incentive regulation can also be effective for improving quality of service and security of supply of the networks.
Information and data requirement - Availability of high quality data is crucial to a well functioning incentive regulation scheme and all reforms have had to spend considerable effort to improve the legal aspects of information disclosure and to improve the quality of data and standardisation of reporting formats. It should be noted that while benchmarking can reduce the information asymmetry between the regulator and the regulated firm, the information requirements can still be significant. This is particularly true for countries where the number of firms is large. As the information base for many of smaller firms is limited, the time between the present and a future reform is well-spent on establishing the legal basis for information disclosure requirements and standardising and simplifying the collection of data. Incentive regulation can, in some respects, be built on less, but high quality, information as opposed to traditional rate of return regulation that can be rather information intensive.17
Number of networks and priorities - Switzerland has a large number of utilities which offers the basis for use of advanced benchmarking techniques and without necessarily having to recourse to international benchmarking. There are about 900 distribution utilities in Switzerland ranging from large networks in vertically integrated structures to very small municipal utilities. It is generally desirable for regulators to have a large number of utilities for comparison and efficiency benchmarking. Also, evidence suggests that companies need not to be very large to reach rather efficient scales (e.g. Growitsh, et al., 2005). However, having a large number of very small networks can be inefficient from the scale efficiency point of view. For example, auditing and quality control of data will demand more resources. This may also have implications for the benchmarking approach. For example, control and approval of a large number of small utilities’ investment plans can be costly, lengthy, and complicated. It may be that a move towards a smaller number of roughly
17 This is illustrated by the substantial reporting requirements put on companies by FERC in the US.

177
equally sized distribution companies is a desirable goal from the point of view of efficiency of operation and regulation.
A practical and pragmatic approach for introduction of incentive regulation is, therefore, to initially focus on regulation and benchmarking of a modest number of the largest companies that constitute a significant majority of total customers. Initially, the large majority of smaller utilities many of which may even lack suitable accounts for incentive regulation and benchmarking can only be subjected to standardisation of their accounts. The smallest networks may then gradually be encouraged to merge to improve scale efficiency, after merger they may be subjected to benchmarking.
However, while acquiring uniform technical and financial data may be difficult, it is easier to focus on tariff and revenue data which are easier to determine. In many cases, the indirect pressure from the achievements of other regulated utilities should lead to some efficiency improvements in these utilities. In a transition period, simple measures such as comparison and publication of distribution tariffs are likely to produce some performance improvements in these utilities. Evidence from Germany with publication of distribution tariffs suggests some reduction in the highest tariffs - although the lowest tariffs showed signs of increase (Growitsch and Wein, 2005).
Economies of scale and rationalisation – Studies of economies of scale in electricity distribution networks suggest that these need not be very large to benefit from economies of scale (e.g. Groawitsch, et al., 2005). It is likely that technological progress has reduced the scale effect on the cost distribution networks. However, this does not necessarily mean that there are no benefits from scale economies or rationalisation of the structure of the networks. Growitsch et al. (2005) find that although the most efficient small firms are as efficient as the most efficient large firms, the dispersion of efficiencies is considerably greater for small firms. This would seem to be consistent with the view that sufficient managerial skills for a large number of small firms may not be available or affordable.
Thus in countries which continue to have a very large number of small network utilities it is rather likely that there is scope for significant gains from rationalisation. Norway and the Netherlands have encouraged and

178
achieved mergers and partnerships aimed at efficiency improvement among their distribution utilities.
Postscript: Electricity network regulation in the future
In closing, we note the impact of future innovation on network regulation. Technological progress has in the past and will continue in the future to transform the nature and economics of networks. It is therefore very important that any regulatory framework will provide the right incentives for innovation and adoption of new technologies in the networks. It is also important that the regulatory system is flexible. The UK system of regulation has performed well from 1990 to 2006. However it will need to evolve in the face of new technology and the challenge of demands from electricity consumers and producers for cleaner energy and more decentralised production (see Jamasb, Nuttall and Pollitt, 2006).
Thus an important question is whether the UK regulation model provides the necessary incentives for innovation and accommodates the “active networks” of the future with renewables, distributed generation, micro-generation, and active demand. Micro-generation units installed by households, industrial CHP, decentralised renewable generation sources will impose new challenges on networks.
This implies that European electricity regulators should take into account the power and long-term effects of incentive schemes in influencing the features and behaviour of regulated firms. In responding to the choice of benchmarking models and target variables firms are led to follow a certain path. This can mean a narrow focus on a limited number of strategic variables. Regulatory models will therefore need to be reviewed and evolve constantly to meet the needs of future networks.

179
References
Abdala, M.A. (2001). Institutions, Contracts and Regulation of Infrastructure in Argentina, Journal of Applied Economics, Vol. IV (2), 217–254.
Ajodhia, V. and Hakvoort, R. (2005). Economic Regulation of Quality in Electricity Distribution Networks, Utilities Policy, Vol. 13, No. 3, 211-221.
Averch, H. and Johnson, L. L. (1962). Behaviour of the Firm under Regulatory Constraint, American Economic Review, 52 (December), 1052-1069.
Baron, D. P. (1989). Design of Regulatory Mechanisms and Institutions, in Schmalensee, R. and Willig R. D. (eds.), Handbook of Industrial Organization, Amsterdam: North-Holland.
Basañes, C.F., Saavedra, E., Soto, R. (1999). Post- Privatization Renegotiation and Disputes in Chile. Infrastructure and Financial Markets Division, Sustainable Development Department, Inter-American Development Bank, Washington, D.C.
Benavides, J., Fainboim, I. (1999). Private Participation in Infrastructure in Colombia: Renegotiations and Disputes. Infrastructure and Financial Markets Division, Sustainable Development Department, Inter-American Development Bank, Washington, D.C.
Bertrand, G. and Twaddle, D. (2005). Price-Cost Margins and Profit Rates in New Zealand Electricity Distribution Networks Since 1994: The Cost of Light Handed Regulation, Journal of Regulatory Economics; Vol. 27:3 281–307.
Bliss, B. (1954). Nationalisation in France and Great Britain of the Electricity Supply Industry, International and Comparative Law Quarterly, Vol. 8, April, 277-290.
Brower, M., Thomas, S., and Mitchell, C. M. (1997). Lessons from the British Restructuring Experience, The Electricity Journal, April, 40-51.
Burns, P. and Weyman-Jones, T. G. (1994). Regulatory Incentives, Privatisation and Productivity Growth in UK Electricity Distribution’, CRI Technical Paper No. 1, London: CIPFA.

180
Burns, P. and Weyman-Jones, T. G. (1996). Cost Functions and Cost Efficiency in Electricity Distribution: A Stochastic Frontier Approach, Bulletin of Economic Research, Vol. 48:1, 41-64.
Bye, T. and Hope, E. (2005). Deregulation of Electricity Markets – The Norwegian Experience, Discussion Paper No. 433, Research Department, Statistics Norway, September.
Byatt, I. C. R. (1979). The British Electrical Industry 1875-1914: The Economic Returns to a New Technology, Clarendon Pres: Oxford.
Chessire, J. (1996). UK Electricity Supply under Public Ownership, in Surrey, J., The British Electricity Experiment – Privatization: The Record, the Issues, the Lessons, Earthscan: London.
Chick, M. (1995). The Political Economy of Nationalisation: The Electricity Industry, in The Political Economy of Nationalisation in Britain 1920-1950,Milward, R. and Singleton, J. (eds.), Cambridge University Press, Cambridge.
Civil Aviation Authority (2005). Airport Regulation – The Process for Constructive Engagement, Civil Aviation Authority: London.
CPB (2004). Better Safe Than Sorry? - Reliability Policy in Network Industries, Netherlands Bureau for Economic Policy Analysis, No. 73, December.
Dalen, D. M. (2006). Presentation at the International Scientific Conference of the Bundesnetagentur (BnetsA) on Incentive Regulation in the German Electricity and Gas Sector, Bonn/Bad Godesberg, 25-26 April.
Dalen, D. M. (1998). Yardstick Competition and Investment Incentives, Journalof Economics and Management Strategy, Vol. 7, No. 1, Spring, 105-1026.
De Oliveira, R. G. and Tolmasquim, M. T. (2004). Regulatory Performance Analysis Case Study: Britain’s Electricity Industry, Energy Policy, Vol. 32, 1261-1276.

181
Di Tella, R., Dyck, I.J.A. (2002). Cost Reductions, Cost Padding and Stock Market Prices: The Chilean Experience with Price Cap Regulation, Harvard NOM Working Paper 03-22; HBS Working Paper 03-050.
Domah, P. and Pollitt, M. (2001). The Restructuring and Privatisation of Electricity Distribution and Supply Businesses in England and Wales: A Social Cost-Benefit Analysis, Fiscal Studies, Vol. 22, No. 1, 107-146.
Electricity Consumers’ Council (1982), Annual Report and Accounts, London: Electricity Consumers’ Council.
Estache, A., Guasch, J.L., and Trujillo, L. (2003). Price Caps, Efficiency Payoffs and Infrastructure Contract Renegotiation in Latin America, Policy Research Working Paper 3129, World Bank, Washington, D.C.
European Commission (2005). Report on Progress in Creating the Internal Gas and Electricity Market, Technical Annex to the Report from the Commission to the Council and the European Parliament, Commission Staff Working Document SEC(2005) XXXX, Commission of the European Communities, Brussels.
Fouquest, R. and Pearson, P. J. G. (2006). Seven Centuries of Energy Services: The Price and Use of Light in the United kingdom (1300-2000), The Energy Journal, Vol. 27(1), 139-177.
Frontier Economics (2003). Developing Monopoly Price Controls, Workstream B, Balancing Incentives. A final report prepared for Ofgem, Standard project document, London, March.
Giannakis, D., Jamasb, T., and Pollitt, M. (2005). Benchmarking and Incentive Regulation of Quality of Service: An Application to the UK Electricity Distribution Networks, Energy Policy, Vol. 33, Issue 17, November, 2256-2271.
Growitsch, C., Jamasb, T. and Pollitt, M. (2005). Quality of Service, Efficiency and Scale in Network Industries: An Analysis of European Electricity Distribution, Electricity Policy Research Group Working Paper No.05/04.

182
Growitsch, C. and Wein, T. (2005). Negotiated Third Party Access – An Industrial Organisation Perspective, European Journal of Law and Economics, Vol. 20, 165-183.
Guasch, J. L. (2003). Infrastructure Concessions in Latin America and the Caribbean: The Renegotiation Issue and Its Determinants, Infrastructure and Financial Markets Review 9(2), June, Sustainable Development Department, Infrastructure and Financial Markets Division, Inter-American Development Bank, Washington, D.C.
Guasch, J.L. (2004). Granting and Renegotiating Infrastructure Concessions. World Bank Development Studies Series, World Bank, Washington, D.C.
Hammond, C. J., Jones, G., and Robinson, T. (2002). Technical Efficiency under Alternative Regulatory Regimes: Evidence from the Inter-war British Gas Industry, Journal of Regulatory Economics, Vol. 22:3, 251-270.
Hattori, T., Jamasb, T., and Pollitt, M. (2005). Electricity Distribution in the UK and Japan: A Comparative Efficiency Analysis 1985-1998, The Energy Journal, Vol. 26, Issue 2, 23-47.
Heggset, J., Kjølle, G. H., Trengereid, F., and Ween, F. (2001). Quality of Supply in the Deregulated Norwegian Power System. IEEE Porto Powertech 2001, Porto, September.
Helm, D. (2003). Energy, the State, and the Market: British Energy Policy Since 1979, Oxford University Press: Oxford.
Henney, A. (1994). A Study of the Privatisation of the Electricity Supply Industry in England & Wales, EEE: London.
House of Commons (1882). Bill to facilitate and regulate supply of Electricity for Lighting in Great Britain and Ireland: As amended by Select Committee, 1882 (200), House of Commons, London.
Jamasb, T., Nillesen, P., and Pollitt, M. (2004). Strategic Behaviour under Regulatory Benchmarking, Energy Economics, Volume 26, 825-843.
Jamasb, T., Nillesen, P., and Pollitt, M. (2003). Gaming the Regulator: A Survey, The Electricity Journal, Vol. 16, Issue 10, December, 68-80.

183
Jamasb, T., Nuttall, W. J., and Pollitt, M. (2006). Future Electricity Technologies and Systems, Cambridge University Press: Cambridge.
Jamasb, T., Mota, R., Newbery, D., Pollitt, M. (2004). Performance of Electricity Sector Reforms: A Survey of Practice and Evidence, Cambridge Working Papers in Economics CWPE0439, CMI Electricity Project CMI EP 47, Department of Applied Economics, University of Cambridge.
Jamasb, T. and Pollitt, M. (2005). Electricity Market Reform in the European Union: Review of Progress toward Liberalisation & Integration, The Energy Journal, Vol. 26, Special Issue, 11-41.
Joskow, P. L. (1998). Electricity Sectors in Transition, The Energy Journal, Vol. 19, No. 2, 25-55.
Joskow, P.J., Schmalensee, R. (1986). Incentive Regulation for Electric Utilities, Yale Journal on Regulation, Vol. 4, No. 1, 1–49.
Langset, T., Trengereid, F., Samdal, K., and Heggset, J. (2001). Quality Dependent Revenue Caps — A Model for Quality of Supply. CIRED 2001, June, Amsterdam.
Littlechild, S (2000). Privatization, Competition, and Regulation in the British Electricity Industry, With implications for Developing Countries, Energy Sector Management Assistance Program (ESMAP), February, World Bank
MacKerron, G. and Watson, J. (1996). The Winners and Losers So Far, in Surrey, J., The British Electricity Experiment: Privatisation, the Record, the Issues,Earthscan Publications Ltd.: London.
Magnus, E. (2000). Owner Attitudes and Public-company Behaviour in a Restructured Electricity Sector, in Magnus, E. and Midttun, A. (Eds.), Electricity Market Reform in Norway, MacMillan Press: London.
Millward, R. and Singleton, J., Eds. (1995). The Electricity Industry, in The Political Economy of Nationalisation in Britain 1920-1950, Cambridge University Press, Cambridge.

184
MMC (1995). Scottish Hydro-Electric plc: a Report on a Reference under Section 12 of the Electricity Act 1989. Monopolies and Mergers Commission, London.
MMC (1997). Northern Ireland Electricity Plc: A Report on a Reference under Article 15 of the Electricity (Northern Ireland) Order 1992. Monopolies and Mergers Commission, London.
Mota, R.L. (2004). Comparing Brazil and USA Electricity Distribution Performance: What Was the Impact of Privatisation? Cambridge Working Papers in Economics CWPE 0423, Department of Applied Economics, University of Cambridge.
Mott Macdonald BPI (2004). Innovation in Electricity Distribution Networks, Final Report, Brighton: Mott Macdonald BPI.
Newbery, D.M. (2002). Issues and Options for Restructuring Electricity Supply Industries CMI Working Paper CMI EP 01, DAE Working Paper WP 0210, Department of Applied Economics, University of Cambridge.
Newbery, D. M. (1999). Privatization, Restructuring, and Regulation of Network Industries, The MIT Press: Cambridge, Mass.
Nillesen, P.L. and Pollitt, M.G. (2007). The Consequences for Consumer Welfare of the 2001-2003 Electricity Distribution Price Review in The Netherlands, Journal of Regulatory Economics (forthcoming).
OECD (2005). Regulatory Reform in Switzerland: Seizing the Opportunities for Growth, SG/SGR(2005)5, Special Group on Regulatory Policy, General Secretariat, November, Organisation for Economic Co-operation and Development, Paris.
Offer (1994). The Distribution Price Control: Proposals, Office of Electricity Regulation, Birmingham.
Ofgem (2006). Our Energy Challenge: Ofgem’s Response, Office of Gas and Electricity Markets, May, London.
Ofgem (2005). 2004/05 Electricity Distribution Quality of Service Report, Office of Gas and Electricity Markets, November, London.

185
Ofgem (2004a). Consumer Expectations of DNOs and WTP for Improvements in Service (June 2004), 145f/04, Report prepared by Accent Marketing & Research for the Office of Gas and Electricity Markets, London.
Ofgem (2004b), Electricity Distribution Price Control Review, Final Proposals, 265/04, November, Office of Gas Electricity Markets, London.
Ofgem (2003a). Developing Monopoly Price Controls. Update Document, Consultation Document, February, Office of Gas and Electricity Markets, London.
Ofgem (2003b). Background Study on the Use of Benchmarking to Assess Efficiency for the 2005 Distribution Price Control. Prepared by Cambridge Economic Policy Associates (CEPA) for the Office of Gas and Electricity Markets, 109/03, September, London.
Ofgem (2001). Information and Incentives Project, Incentive Schemes. Final Proposals, Decision Document, December, Office of Gas and Electricity Markets, London.
Ofgem (2000). Information and Incentives Project, Output Measures and Monitoring Delivery between Reviews. Final Proposals, Consultation Document, September, Office of Gas and Electricity Markets, London.
Ofgem (1999a). Review of Public Electricity Suppliers 1998–2000. Distribution Price Control Review, Initial proposals, Consultation Document, October, Office of Gas and Electricity Markets, London.
Ofgem (1999b). Reviews of Public Electricity Suppliers 1998 to 2000. Distribution Price Control Review, Final Proposals, Consultation Document, December, Office of Gas and Electricity Markets, London.
Ofgem (1999c). Electricity Distribution Licences: Initial Proposals on Standard Conditions for the Financial ‘Ringfence’, A Consultation paper, Office of Gas and Electricity Markets, London
Ofwat/Ofgem (2006). Financing Networks: A Discussion Paper, Office of Water Regulation/Office of Gas and Electricity Markets, February, London.

186
Pollitt, M. (1995). Ownership and Performance in Electric Utilities. Oxford:Oxford University Press.
Pollitt, M. (2005). The Role of Efficiency Estimates in Regulatory Price Reviews: Ofgem’s Approach to Benchmarking Electricity Networks, Utilities Policy,Vol.13, No.4, 279-288.
Pryke, R. (1981). The Nationalised Industries: Policies and Performance Since 1968, Martin Robinson: Oxford.
Sappington, D. E. M. (2005). Regulating Service Quality: A Survey, Journal of Regulatory Economics, Vol. 27, Issue 22, 123-154.
Schmidt, M. R. (2000). Performance-Based Ratemaking: Theory and Practice,Public Utilities Reports, Inc., Vienna, Virginia.
Secretary of State for Energy (1988). Privatising Electricity: The Government’s Proposal for the Privatisation of the Electricity Supply Industry in England and Wales, Cm 322, HMSO, London
Shleifer, A. (1985). A Theory of Yardstick Competition, Rand Journal of Economics, Vol. 16, 319-327.
Tangerås, T. P. (2003). Yardstick Competition and Quality, Swedish Network for European Studies in Economics and Business, Discussion paper, April. Weblink: http://www.snee.org/filer/papers/205.pdf
Ter-Martirosyan, A. (2003). The Effects of Incentive Regulation on Quality of Service in Electricity Markets. Department of Economics, George Washington University, Working Paper, March.
Thomas, S. (2004). Evaluating the British model of Electricity Deregulation. Annals of Public and Cooperative Economics, Vol. 75, No. 3, 367–398.
Vickers, J. and Yarrow, G. (1993). Privatization: An Economic Assessment, The MIT Press: Cambridge, Mass.
Viljainen, S. (2005). Regulation Design in the Electricity Distribution Sector- Theory and Practice, PhD Thesis, Lappeenranta University of Technology.

187
Waddams Price, C., Brigham, B., and Fitzgerald, L. (2002). Service quality in Regulated Monopolies, Working Paper CCR 02-4, August, Centre for Competition and Regulation, University of East Anglia.
Yarrow, G. (1992). British Electricity Prices Since Privatisation, Regulatory Policy Institute, Studies in Regulation, Paper No. 1, Oxford.
Yu, W., Jamasb, T., and Pollitt, M. (2007). Incorporating the Price of Quality into Benchmarking UK electricity Distribution (forthcoming).
Zhang, Y.F., Parker, D., Kirkpatrick, C. (2002). Electricity Sector Reform in Developing Countries: An Econometric Assessment of the Effects of Privatisation, Competition and Regulation, Working Paper 31, Centre on Regulation and Competition, Institute for Development Policy and Management, University of Manchester.


Study on International Roaming in Mobile Telecommunication Networks Final Report
21st of December 2006

190
Table of Contents
Preface ...................................................................................................................... 191
Chapter 1 Summary and recommendations........................................................... 192
Chapter 2 International roaming prices .................................................................. 1952.1. What is international roaming? ....................................................................................1952.2. Do Swiss end-users pay excessive international roaming prices? ..............................196
Chapter 3 Dealing with high international roaming prices ................................... 2043.1. EU intervention ............................................................................................................2043.2. Laissez-faire ................................................................................................................2073.3. National intervention....................................................................................................211
References ................................................................................................................ 214

191
Preface
The State Secretariat for Economic Affairs in Switzerland (SECO) has commissioned Copenhagen Economics to investigate whether or not Swiss end-users pay excessive international roaming prices, and if that is the case to provide insight and advice into how Swiss Authorities could react to these high prices in the light of the current EU proposal to regulate international roaming prices.
The report has been prepared by Mr. Christian Jervelund, Mr. Simen Karlsen and Mr. Torben Thorø Pedersen. The report is based on the specifications of the contract covering the study, the interim meeting with seco on August 30th and the valuable comments from SECO and other Swiss Authorities monitoring closely the area of telecommunications including their comments to the draft final report.
December, 2006 Christian Jervelund Senior Economist, Copenhagen Economics

192
Chapter 1 Summary and recommendations
We find clear evidence of high international roaming prices for Swiss end-users compared to costs. However, international roaming prices in the EU are equally high
By comparing prices between a Swiss and a French end-user both calling from France to Switzerland and France, we find that the Swiss-end user pays at least twice that of the French end-user. The difference is even larger between a Swiss and Swedish end-user both calling from Sweden. As the traffic destinations are identical, the price difference cannot be ascribed to costs, but to the margin for providing an international roaming service. We find that the difference cannot be explained by differences in Value Added Tax (VAT) rates, the high overall price level in Switzerland, or other factors.
We find that international roaming prices do not differ markedly between Switzerland and similar EU countries. As excessive international roaming prices are an issue in the EU as well, the European Commission has proposed regulation of both international roaming wholesale and retail prices. The Commission estimates EU consumer savings to be in excess of 5 billion euros a year. Based on these figures and adjusting for the number of inhabitants in Switzerland, this would correspond to Swiss end-users saving 130-145 million Swiss francs a year.
The EU proposal implies large savings for Swiss end-users if Switzerland were to enter into a bilateral agreement with the EU. Currently, we find it unlikely however, that Switzerland will be able to honour its commitments to reduce international roaming wholesale prices implied by such an agreement
Hence, from a consumer perspective it seems to be in Switzerland’s interest to enter into a bilateral agreement with the EU on international roaming. Despite similar agreements on other services such as land and air transport, we believe that a bilateral agreement with the EU covering international roaming services is unlikely as Switzerland will have a hard time honouring its commitments to regulate prices at the wholesale level. The primary reason being the lack of tools similar to the EU internal market provisions requiring instead Swiss authorities to designate Swiss mobile operators as having a dominant position in the wholesale market for international roaming services in order to regulate wholesale prices. This may prove arduous illustrated by the difficulties for the Member States to designate their own operators as having a dominant position.

193
Consequently, we believe that major changes in Swiss legislation would be necessary if Switzerland were to regulate international roaming wholesale prices, which would be a premise for a bilateral agreement between the EU and Switzerland.
While we believe it is possible that Swiss international roaming wholesale prices will decrease to EU levels even without an agreement with the EU, we believe it is to be unlikely that international roaming retail prices will follow suit to the benefit of consumers
Regardless of Switzerland entering into a bilateral agreement with the EU or not, the wholesale prices may decrease due to new technology which makes it possible for mobile operators to direct international roaming traffic to networks of operators charging the lowest wholesale roaming prices. This could spur competition at the wholesale level. Furthermore, Swiss mobile operators are part of alliances with EU based operators, which could contribute to lower international roaming wholesale prices in Switzerland following the proposed EU regulation. On the other hand, EU operators do have incentive to charge the Swiss operators prices above the (future) EU regulated prices.
However, we also find indications that international roaming retail prices for Swiss end-users may remain high even if wholesale prices fall as retail mark-ups are likely to increase. This is due to probably weak competition at the retail level caused by a lack of transparency of international roaming retail prices charged by different operators, but also by a lack of end-user awareness of the international roaming retail prices. At the current stage, we do not believe that the latest technological developments such as IP mobile telephony will resolve these market imperfections in the near future, but they may be able to do so in the longer run.
In the light of the example of high international roaming retail prices, a strengthening of the sectoral regulator and a shorter time until regulatory decisions take effect should be considered. In the meantime, Swiss authorities should examine temporary regulation at the retail level. Other measures, such as transparency enhancements, could also lead to lower retail prices
In a situation where the market outcome does not provide incentive for the mobile operators to reduce international roaming retail prices in the light of falling wholesale prices, regulation could be a solution. However, the process until the sectoral regulator’s decision becomes effective is currently burdensome in Switzerland. Delaying effects of appeals lead to long procedures. This goes to the expense of end-users, who have to carry the high costs.
If new technology will only reduce retail prices in the longer run as we predict, Swiss end-users are paying a high price in the short to medium run. This implies the existence of a trade-off between securing lower retail prices through regulation on the one hand, and running the risk of distorting competition by overregulation on the other hand.
The European Commission has calculated the size of this trade-off estimating that no regulation of international roaming wholesale and retail prices will lead to only minor savings for European consumers while regulating wholesale and/or retail prices will lead to substantially higher savings. Based on these figures and adjusting for the number of inhabitants in Switzerland, Swiss end-users would stand to save around 37 million Swiss francs a year in case of no regulation (but strong political pressure), 51-56 million Swiss francs

194
in the case of wholesale regulation, and 130-145 million Swiss francs in the case of both wholesale and retail regulation.
However, Swiss intervention at the retail level is difficult due to a lack of EU internal market provisions, but rather reliance on competition rules, sector specific rules or/and rules on pricing. This also weakens the possibility of (the prospect of) regulation having a deterrent effect on operators which alone could lead them to reduce prices.
In the absence of international roaming retail price regulation in Switzerland, we believe it could be beneficial to at least take some measures to increase competition at the retail level leading to lower prices. Four measures come to mind. A first possible measure would be to facilitate price comparisons of the different Swiss operators, e.g. by extending and promoting the existing comparisons for typical users on the Internet. Second, Swiss authorities could require that mobile operators provide end-users with information on roaming prices free of charge either via (push) SMS or a mobile call; this is in line with the EU proposal. Third, the mobile operators could provide information on applicable roaming charges when subscriptions are taken out. Fourth, Swiss authorities could use international retail roaming prices in the EU as benchmark for Swiss operators.
Regulating international roaming retail prices raises an issue not covered in this report, namely that regulation could spur Swiss mobile operators to increase prices of other services to maintain high profits, the so-called waterbed effect. If the Swiss market for mobile telephony is characterised by weak competition, dominant players could benefit from such actions. This issue must also be taken into account when discussing the pros and cons of regulation.

195
Chapter 2 International roaming prices In this chapter we answer the question of whether or not Swiss end-users (businesses and consumer subscribers) pay excessive prices when using their mobile phones abroad. Before answering this question in section 2.2, we briefly describe the nature of international roaming.
2.1. What is international roaming? International roaming is when end-users use their mobile phones abroad. Using an example of a Swiss end-user (subscribing to Swisscom) visiting France and making a mobile phone call home to his girlfriend in Switzerland (who subscribes to Sunrise), we illustrate below what happens in terms of mobile signals and payments.
In order to make the phone call from France, the mobile phone of the Swiss end-user first connects to a French network, say Orange France1, cf. Figure 1. Orange France then transmits the phone call to the network of Sunrise in Switzerland. For this, Orange France demands a wholesale price of Swisscom. At the same time, Swisscom demands a retail price of the Swiss end-user as he subscribes to Swisscom.2
Figure 1: A Swiss end-user calls from France to Switzerland
(visited network)
Retail price: Wholesale price:
(receivingnetwork)
A subscirber of
calls home…
1
2
Source: Copenhagen Economics
1 Which specific French network is of minor interest as the Swiss end-user could have been connected to any
French network which Swisscom has entered into to an access and capacity agreement with. 2 In addition Sunrise receives a termination price either from the visited operator, Orange France, or a transit
operator. Normally, the service of termination is included in the standard wholesale international roaming.

196
Calling back to the home country is just one option for the Swiss end-user when telephoning from France. Another option is to call another person in France. In this case, the phone call does not cross the French border. A third option is that the Swiss end-user calls somebody who lives in a third country, i.e. Germany.3 In all three cases, the Swiss end-user may call somebody who uses a mobile phone or a fixed telephone. Moreover, in all three cases the Swiss end-user pays a retail price to his home operator, while the home operator pays the visited operator a wholesale international roaming price.
There is also a fourth option for the Swiss end-user when staying in France: He may receive a phone call from his girlfriend. He receives the call via a French network, say Orange France. His home operator (Swisscom) pays a wholesale price to the operator visited (Orange France)4. The operator of the girlfriend (Sunrise) pays the home operator (Swisscom) a wholesale price (actually a national termination fee). Moreover, both the Swiss end-user and his girlfriend pay a retail price. The traffic and payments are illustrated in Figure 2.
Figure 2: A Swiss end-user receives a call in France from Switzerland
Retail price:
Wholesale price:
Retail price:
Wholesale price:
(visited network)
(receivingnetwork)
A subscriber of
Recieves a call
(home network)1
23
Source: Copenhagen Economics
The reason that receiving a call has created a lot of attention is that the Swiss-user pays a retail price to his home operator (Swisscom in our example) in order to receive the phone call abroad. The logic behind this is that the calling party often does not know that the person she is calling is abroad. Consequently, the calling party only pays the national price while the called party pays the remaining price for calling abroad.
2.2. Do Swiss end-users pay excessive international roaming prices? In order to answer this question, we make two types of price comparisons. First, we compare the international roaming retail prices that Swiss end-users pay when they use their mobile phone abroad with the prices that the end-users of the visited country pay for the same traffic destination. This tells us whether Swiss international roaming prices are excessive, meaning 3 This option is less common. Most people call either back home or to another person in the same country.
Consequently, we will focus on the two first options. 4 Sometimes the home operator pays both an international transit fee, if the signals are transmitted via several
networks, in addition to the termination fee.

197
above what may be justified by the costs of servicing the call. Even though both wholesale and retail prices are involved, we are only in a position to compare retail prices as wholesale prices are not publicly available. Second, we compare the international roaming retail prices that Swiss end-users pay when using their mobile phone abroad with the prices that end-users from a similar (EU) country pays when using their mobile phone abroad. This tells us whether Swiss international roaming retail prices are high compared to international roaming retail prices in other countries.
Are Swiss international roaming retail prices high compared to costs? We compare the international roaming retail prices that Swiss end-users pay when they use their mobile phone in a visited country with the prices that the end-users from the visited country pay for the same traffic destination.
We have chosen France as the visited country as it is a popular destination for Swiss tourists and businesses. Furthermore, the French mobile prices have traditionally been among the highest in the EU5. Consequently, if the Swiss international roaming appears to be high in comparison to French prices, this is not due to particularly low domestic and international prices in France.
To further illustrate the level of Swiss international roaming prices, we make another price comparison choosing Sweden as the visited country. In contrast to France, Swedish mobile prices are among the lowest in the EU6.
We compare the prices for the three most common types of international roaming:
A Swiss end-user making a call in France (Sweden) to an end-user in Switzerland (Figure 1) A Swiss end-user making a call in France (Sweden) to another end-user in France (Sweden) A Swiss end-user receiving a call in France (Sweden) from an end-user in Switzerland (Figure 2)
We find that Swiss end-users pay much higher prices than the French end-users do for the same traffic destinations. In that sense, Swiss international roaming retail prices are excessive if one considers only the cost structure. The price is about twice as high for a Swiss end-user calling a person in Switzerland (3.2 Swiss francs) compared to a French end-user calling a person in Switzerland (1.7 Swiss francs). The difference in prices are even higher when calling another person in France (2.3 versus 0.9 Swiss francs), cf. Figure 3.
5 See for instance European Commission (2006d) 6 See for instance European Commission (2006d)

198
Figure 3: Prices for Swiss and French end-users calling from France, 2006
0.0
0.5
1.0
1.5
2.0
2.5
3.0
3.5
…calling a person in Switzerland …calling a person in France
Sw
iss
franc
s
Swiss end-user in France French end-user in France
Source: Copenhagen Economics (2006) and web sites of the respective mobile operators (as of 19th of July 2006): Tele2 Mobile classic and pro, Sunrise “avec un abonnement sans option”,7 Swisscom Natel@basic liberty Euro Passport,8 Orange Members9 and SFR Le Compte 1h30.
Note: Prices are calculated for a two-minute-call and include VAT. Blue columns indicate the price a Swiss end-user pays for calling an end-user in Switzerland (first blue column) and France (second blue column). Red columns indicate the price a French end-user pays for calling a person in Switzerland (first red column) and France (second red column). The Swiss prices are a simple average of the prices of the four Swiss operators.
We also find that the price for receiving a call appears to be significantly above cost. The European Commission has estimated the net average costs for receiving a call in Europe to be 0.32 Swiss francs for a two-minute call.10 The price for a Swiss end-user to receive a call in France is 1.2 Swiss francs, or almost four times as high.
The high international roaming prices cannot be explained by cost differences or any other factors, such as differences in VAT-levels. There are five reasons.
First, the higher Swiss international roaming prices may not be explained by a higher general price level in Switzerland than in France. The reason is that international roaming costs are mostly related to activities which take place abroad – not in Switzerland. Consequently, a high price level in Switzerland has almost no impact on the Swiss international roaming costs.
Second, the roaming-specific services do not represent a significant cost. According to the French regulator, ARCEP, the roaming-specific services related to exchange of information are less than 1.6 centimes per minute (ARCEP (2006)).
Third, the benchmark, French mobile prices, is probably above costs. France has among the highest mobile tariffs in the EU (see European Commission (2005)). Among other things the French mobile operators have been fined by the French regulator (ARCEP) for a price cartel leading to higher tariffs. Thus, it is not a good sign that Swiss international roaming prices are much higher than French domestic and international tariffs.
7 Sunrise also offers also a somewhat lower minute-price, such as Sunrise Europe. However, customers have to pay
to pay an additional fixed fee to benefit from a lower minute-price. 8 Swisscom also offers a somewhat lower minute-price, such as Vodafone World. However, customers have to pay
to pay an additional fixed fee to benefit from a lower minute-price. 9 Orange also offers a somewhat lower minute-price, such as Travel Option. However, customers have to pay to pay
an additional fixed fee to benefit from a lower minute-price. 10 European Commission (2006b)

199
Fourth, the French consumers pay a higher VAT than the Swiss consumers, 19.6% and 7.6%, respectively. Consequently, if we subtract the VAT, the differences are even larger between the Swiss international roaming prices and French ordinary prices.
Fifth, the perceived high Swiss termination rates are not able to explain the high international roaming prices experienced by a Swiss end-user. By comparing the prices French and Swiss end-users pay when calling to the same network, we neutralise the impact of the termination rates, while still finding a big difference. For example, we have just found that a Swiss end-user in France calling a person in Switzerland pays 3.2 Swiss francs for a two-minute call while a French end-user calling the same network in Switzerland pays only 1.7 Swiss francs. Hence, even in the light of high Swiss termination rates, this big difference is due to international roaming.
However, while the high Swiss termination rates cannot explain the difference between the two prices of 3.2 and 1.7 Swiss francs, they may partly explain the high price levels which could potentially be lower if Swiss termination rates were lower. But it is impossible to say how far, as we do not know the individual costs of the specific services that constitute the bundled service of international roaming. The reason for this is that when buying a wholesale international roaming service, the home operator normally buys a bundled service from the visited operator. The bundled service includes the entire route from the visited network to the destination network, including termination and transition.
Our findings of high Swiss international roaming prices are not due to the choice of France as the visited country. Actually, as French mobile prices have traditionally been some of the highest in the EU, we probably underestimate the difference between Swiss international roaming prices and domestic and international prices across many visited countries, when choosing France as the visited country.
This is confirmed when instead choosing Sweden, a country with low mobile prices compared to other EU Member States, as the visited country. We find that Swiss end-users pay much higher prices than Swedish end-users do for the same traffic destinations; and that this difference is larger compared to using France as the visited country.
The price is about three times higher for a Swiss end-user calling a person in Switzerland (3.1 Swiss francs) compared to a Swedish end-user calling a person in Switzerland (1.0 Swiss franc), cf. Figure 4. Using France as the visited country, we previously found the price difference to be only twice as high (3.2 versus 1.7).
The same picture emerges when comparing prices for calling another person in the visited country. It costs 2.3 Swiss francs for a Swiss end-user when calling another person in Sweden, and only 0.3 Swiss Francs for a Swedish end-user when calling another person in Sweden – a price difference of almost eight times. Using France as the visited country, the price difference is less than three times (2.3 versus 0.9).

200
Figure 4: Prices for Swiss and Swedish end-users calling from Sweden, 2006
0.0
0.5
1.0
1.5
2.0
2.5
3.0
3.5
…calling a person in Switzerland …calling a person in Sweden
Swis
s fra
ncs
Swiss end-user in Sweden Swedish end-user in Sweden
Source: Copenhagen Economics (2006) and web sites of the respective mobile operators (as of 31st of October 2006): Tele2 Mobile classic and pro, Sunrise “avec un abonnement sans option”, Swisscom Natel@basic liberty Euro Passport, Orange Members and Tele 2 Sweden Knock-out.
Note: Prices are calculated for a two-minute-call and include VAT. Blue columns indicate the price a Swiss end-user pays for calling an end-user in Switzerland (first blue column) and Sweden (second blue column). Red columns indicate the price a Swedish end-user pays for calling a person in Switzerland (first red column) and Sweden (second red column). The Swiss prices are a simple average of the prices of the four Swiss operators. Tele2 Sweden charges different prices to mobile and fixed telephone abroad. We have used the average of the two prices.
Our findings of high Swiss international roaming prices compared to similar traffic destinations of a French and Swedish end-user are of course only to be taken as illustrative examples in the sense that the pricing structure often changes while our prices only cover a few subscriptions and represents a single point in time.
Nevertheless, our findings are entirely consistent with the findings of the European Commission and national regulators in EU Member States which estimates international roaming prices in Europe to be several times higher than domestic prices. At the same time, there is nothing to suggest that their findings should not also hold for Switzerland. The findings of the European Commission are further described in Box 1.
Box 1. European Commission’s findings of excessive international roaming in the EU The European Commission assesses that European international roaming retail prices are four times higher than domestic prices. Based on confidential figures, the Commission estimates international roaming prices to be excessive both at the wholesale and retail level.
On average, the international roaming wholesale prices are ascertained to be four times the costs. Moreover, the international roaming retail price in Europe is about 50 % higher than the average wholesale price. On average the international roaming retail price is 3.6 Swiss Francs (2.30 Euros) for a two-minute call in the EU.
These numbers suggest that Swiss international roaming prices for making a call in France (between 2.3 and 3.2 Swiss francs) are slightly below the EU average of 3.6 Swiss francs. However, this is not the case as the EU average includes traffic with higher transition costs because it includes calling to a third country; for instance a Dane who calls somebody in Poland from Greece. A more correct EU average without this traffic is lower bringing Swiss and EU prices even closer.Source: European Commission (2006b) and Copenhagen Economics.

201
Are Swiss international roaming retail prices high compared to those of other countries? So far we have only compared Swiss international roaming prices with prices paid by the visited countries’ end-users for similar traffic destinations. We found this difference to be very high, meaning that Swiss international roaming prices are indeed high compared to the costs of providing this service. However, the does not imply that Swiss international roaming prices are higher than international roaming prices incurred by end-users in other countries.
To investigate this issue, we compare the Swiss international roaming prices with those of a similar (EU) country. We choose a similar country in order to neutralise the potential impacts from a high overall price-level, low population density etc.
We have chosen Denmark and Danish international roaming prices as a benchmark. Denmark has been at the forefront of telecoms and regulations, particularly in the mobile sector. Moreover, in line with Switzerland, Denmark is a low-populated and high-cost country. Furthermore, Switzerland and Denmark experience a deficit on net-travelling to their countries implying that they ought to be in a similar bargaining position when negotiating international roaming agreements with foreign operators, e.g. Orange in France.
We find that the Swiss international roaming prices are similar in size to the Danish international roaming prices, albeit slightly lower, cf. Figure 5.
Figure 5: Prices for Swiss and Danish end-users calling home from France, 2006
0.00.51.01.52.02.53.03.54.04.5
…calling a person back home …calling a person in France
Swis
s fra
ncs
Swiss end-user in France Danish end-user in France
Source: Copenhagen Economics (2006) and web sites of the respective mobile operators (as of 19th of July 2006): Tele2 Mobile classic and pro, Sunrise “avec un abonnement sans option”, Swisscom Natel@basic liberty Euro Passport, Orange Members in Switzerland and TeliaSonera’s international roaming, 3’s international roaming for private, basic subscriptions, Sonofon’s international roaming for private subscriptions, TDC’s international roaming for private subscriptions in Denmark.
Note: Prices are calculated for a two-minute-call and include VAT. Blue columns indicate the price a Swiss end-user pays for calling a person in Switzerland (first blue column) and France (second blue column). Red columns indicate the price a Danish end-user pays for calling an end-user in Denmark (first red column) and France (second red column). The Swiss and Danish prices are a simple average of the prices of the four Swiss and Danish operators, respectively.
The slightly higher Danish international roaming prices can be explained by higher VAT in Denmark (25 %) compared to Switzerland (7.6 %). Consequently, if we subtract the VAT, the price difference disappears.
Our findings of Swiss international roaming prices being of the same size as international roaming prices in similar countries, is confirmed when using Sweden as the visited country, cf.

202
Figure 6. Again we find that the Swiss international roaming prices are of the same size as the Danish international roaming prices. The situation gets more disadvantageous for Swiss consumers if we consider the lower VAT rate in Switzerland.
Figure 6: Prices for Swiss and Danish end-users calling from Sweden, 2006
0.0
0.5
1.0
1.5
2.0
2.5
3.0
3.5
…calling a person back home …calling a person in Sweden
Swis
s fra
ncs
Swiss end-user in Sweden Danish end-user in Sweden
Source: Copenhagen Economics (2006) and web sites of the respective mobile operators (as of 31st of October 2006): Tele2 Mobile classic and pro, Sunrise “avec un abonnement sans option”, Swisscom Natel@basic liberty Euro Passport, Orange Members in Switzerland and TeliaSonera’s international roaming, 3’s international roaming for private, basic subscriptions, Sonofon’s international roaming for private subscriptions, TDC’s international roaming for private subscriptions in Denmark.
Note: Prices are calculated for a two-minute-call and include VAT. Blue columns indicate the price a Swiss end-user pays for calling a person in Switzerland (first blue column) and Sweden (second blue column). Red columns indicate the price a Danish end-user pays for calling an end-user in Denmark (first red column) and Sweden (second red column). The Swiss and Danish prices are a simple average of the prices of the four Swiss and Danish operators, respectively. Tele2 Sweden charges different prices to mobile and fixed telephone abroad. We have used the average of the two prices.
Box 2 below presents the details about data behind the price comparisons above11.
11 We focus on voice calls as the proposal to an EU regulation mainly addresses these types of calls. As the
European Commission believes that there are fewer grounds for concerns for SMS and MMS, the Commission’s only warrants that national regulators shall monitor closely the two types of messages.

203
Box 2. The price data We have collected retail international roaming dataA, B from the web pages of the four principal mobile operators in Switzerland and Denmark: Swisscom, Sunrise, Orange Tele2 (Switzerland), TDC Mobile, Sonofon, Telia and 3 (Denmark). As a benchmark from France and Sweden, we have chosen a relatively low usage subscription, which implies a low fixed fee and high fees per minuteC: SFR Le Compte 1h30 (France), and Tele 2 Sweden Knock-out (Sweden).D These are the prices that consumers and small and medium size enterprises typically pay. Larger enterprises often achieve large-scale competitive contracts not publicly available; therefore they already face lower international roaming prices.E
For currency conversion we have used the ECB’s average exchange rate of June of 1.56 Swiss Francs for one euro, while we have used the Danish Central Bank’s average exchange rate of June, 4.78 Danish kroner for one Swiss franc. We have used the Swedish Central Bank’s average exchange rate of June, 5.92 Swedish kroner for one Swiss franc.
As explained in ‘A’ below, prices concerning France as the visited country are from July 19 while prices concerning Sweden as the visited country are from October 31. The different dates have no impact on the results that Swiss end-users pay excessive roaming prices when visiting these two countries. Actually, as the Commission proposal to regulate may have lead operators to lower international roaming prices during the fall of 2006 (due to the element of ‘threat’), the findings that Swiss roaming prices in Sweden are in fact much higher than Swiss roaming prices in France, only accentuates the robustness of the results that roaming prices are excessive.
The reason for why we collected price data at two different dates is that after having collected prices for France as the visited country, it was brought to our attention that in order to further illustrate the level of Swiss international roaming prices, we should make another price comparison choosing Sweden as the visited country as Swedish mobile prices are among the lowest in the EU in contrast to French mobile prices (see European Commission 2006d). Comparing Swedish and Swiss mobile prices in Sweden would therefore be likely to demonstrate the ‘upper limit’ of how excessive Swiss international roaming prices are.
A: All prices concerning France as the visited country are of July 19 2006 while all prices concerning Sweden as the visited country are of October 31 2006B: All the prices are based on a two minute call. The reason is that some operators charge a different price for the first minute. Moreover, several operators charge a connection fee. Besides we look at the price at peak time. Some operators charge lower price at non-peak time. However, non-peak time is typically defined after 8-9 pm and before 6 am. C: Some operators maintain that high minute charges on international roaming may be due to that end-users do not pay a fixed fee to the visited operator when using their mobile phone abroad. To take this issue into account, we look at a French subscription based on fairly low consumption and with a fairly high minute price. D: Source: SFR (2006), http://www.sfr.fr/pdf/offre/tarifs/tarifs_lecompte.pdf E: As larger companies often achieve special individual terms, these terms are normally not publicly available.Source: Copenhagen Economics.

204
Chapter 3 Dealing with high international roaming prices Having established that Swiss end-users pay excessive international roaming prices compared to costs (but similar to international roaming prices faced by end-users in other countries), we now look at the possibilities of reducing the prices. Generally speaking, there are three ways through which Switzerland can hope to reduce high international roaming prices. These are through International (EU) intervention, letting the market find the best solution (laissez-faire) or through national intervention.
Only by means of an international intervention is it possible to regulate wholesale prices as they are agreed upon between telecommunication operators in different countries. As the European Commission has recently launched a proposal for coordinated EU intervention in this area, we start by looking at how the proposal may affect the roaming prices faced by Swiss end-users (section 3.1).
However, it may actually turn out that the market solution is able to provide lower wholesale and/or retail prices in the future, even though it has not been able to so far. Furthermore, any public intervention always implies the risk of distorting competition in the market. We will look into the necessary conditions for Switzerland to experience lower prices through a market based or laissez-faire approach in section 3.2.
Finally, in section 3.3, we discuss the tools available for Swiss authorities to independently address possible market imperfections at the retail level as an alternative to an international (EU) intervention and the laissez-faire approach.
3.1. EU intervention High international roaming prices in the EU have motivated the European Commission to make a proposal to regulate prices both at the wholesale and retail level.12 As this proposal is based on EU internal market acts and not on competition acts, the regulation will apply to all mobile operators in the EU – not only to dominant operators.
12 In general, a European regulation applies equally in all 25 Member States. It comes into effect as soon as it is adopted by the European Parliament and the Council of Ministers and published in the Official Journal of the European Union; it requires no further transposition into national law. The Commission hopes that the new EU regulation will be approved by the European Parliament and the Council of Ministers by summer 2007. Since the EU regulation on mobile roaming is an internal market measure with relevance for the European Economic Area (EEA), we expect that the regulation will also be extended to the EEA EFTA countries Iceland, Liechtenstein and Norway. Source: European Commission (2006b).

205
The Commission intends to regulate wholesale prices based on the average peak EU mobile termination rats (MTR) for operators with significant market power weighted by active subscribers; this rate amounts to about 20 Swiss centimes in October 2005 (12.64 eurocents). The Commission proposes to use price ceilings:
A limit of twice the MTR would be applied to wholesale prices for calls within the visited country; A limit of three times the MTR would be used for calling back home or to another EU country; A maximum of 30% margin above the wholesale rate would be set at a retail level; A limit at one MTR plus a margin of 30% would be set for receiving calls abroad.
Furthermore, the Commission will require mobile operators to provide information to end-users on roaming charges free of charge, either via SMS or a mobile call. According to the proposal, national regulators shall monitor that the mobile operators meet the requirements.13
The European Commission anticipates that the EU proposal will enter into force in summer 2007. As this is a proposal to a regulation, the rules will have direct legal effect in Denmark and in other EU Member States.
Consequences for the EU Member State Denmark If implemented in its current form, we estimate that the EU proposal will save Danish end-users around 80 million Swiss francs a year. This is the result of an expected drop in international roaming prices of more than 50 %14, cf. Figure 7.
Figure 7: Danish international roaming prices before and after EU proposal, 2006
0.0
1.0
2.0
3.0
4.0
A Dane calling fromFrance a person in
Denmark
A Dane calling fromFrance a person in
France
A Dane receiving acall in France from aperson in Denmark
Swis
s fra
ncs
Before EU proposal After EU proposalSource: Copenhagen Economics and web sites of the respective Danish mobile operators (as of 19th of July 2006):
TeliaSonera’s international roaming, 3’s international roaming for private, basic subscriptions, Sonofon’s international roaming for private subscriptions, TDC’s international roaming for private subscriptions.
Note: Prices include VAT. The blue columns indicate the price a Dane currently pays, while the red columns indicate the price a Dane is expected to pay if the proposal is implemented.
13 As the European Commission believes that there are fewer grounds for concerns for SMS and MMS, the
Commission’s only warrants that national regulators shall monitor closely the two types of messages. 14 The EU market for international roaming is estimated at around 13.6 Billion Swiss francs (8.5 billion Euros) a year,
cf. European Commission (2006b). Under the new regulation, the European Commission (2006b) expects EU end-user to safe more than 50 % or 8 billion Swiss francs (5 billion euros) compared to today. Adjusted for the number of inhabitants in the Denmark, Danish end-users will stand to save more than 80 million Swiss francs.

206
Consequences for Switzerland If the Swiss international roaming prices were reduced as much as the average EU international roaming prices, we estimate that Swiss end-users will save almost 130-145 million Swiss francs a year. Or put differently, if the Swiss international roaming prices stay at their current level, the Swiss end-users will be paying around twice as much as an average EU end-user.
Consequently, it could be in Swiss interest to be covered by the same regulation. However, as Switzerland is neither part of the EU nor the EEA (European Economic Area), Switzerland must instead enter into a bilateral agreement.
In principal such an agreement is possible as the EU and Switzerland have entered into similar agreements on other services; for instance agreements on land and air transport. However, in practice it may prove difficult to achieve a similar bilateral agreement encompassing international roaming as a bilateral agreement would contain commitments on both parties. Particularly, Swiss authorities would have to regulate wholesale international roaming services ex-ante in order for EU end-users travelling to Switzerland to benefit from the agreement. However, the sector specific authorities in Switzerland do not currently have the competence to regulate international roaming wholesale prices. Moreover, the Swiss sector specific legislation is based on the principle of ex-post regulation (with lengthy appealing procedures); not ex-ante. Changing these two features would require a reform of the telecommunications act, which is very unlikely to happen as the act was recently reformed and took several years.
Furthermore, the lack of EU internal market provisions in Switzerland makes it necessary for the Swiss authorities to designate Swiss mobile operator(s) as having a dominant position in the wholesale market for international roaming services in order to regulate wholesale prices. This may prove difficult illustrated by the fact that the European Commission chose to regulate through the internal market provisions for the same reason that is was difficult for the Member States to designate their own operators as having a dominant position in the market for international roaming services.
ConclusionsThe EU proposal is expected to reduce international roaming prices by 50 percent for EU Member States by regulating both wholesale and retail prices. If Switzerland were to engage in a bilateral agreement with the EU, we believe that Swiss consumers and businesses would experience similar price reductions. The European Commission estimates that the highest consumer savings require regulation of international roaming prices at both wholesale and retail level which would save EU end-users between 5.3-5.9 billion euros in the EU. Adjusted for the number of inhabitants in Switzerland, Swiss end-users would save about 130-145 million Swiss francs a year (83-93 million euros).
However, despite similar agreements on other services such as land and air transport, we believe that a bilateral agreement with the EU covering international roaming services is unlikely. The reason is that we do not believe that the Swiss authorities have the necessary competences to fulfil the likely commitments of regulating international roaming wholesale prices because the sector specific authorities cannot regulate international roaming, and because an agreement would require designating Swiss mobile operators as having a dominant position in the roaming market, which seems technically difficult.
Therefore, some kind of more far reaching change in Swiss legislation would be necessary to enter into an agreement with the EU. By the time negotiations and adaptations were complete, technological developments and potentially also commercial negotiations leading to lower

207
international roaming prices might have made the agreement obsolete and therefore the changes in legislation unnecessary.
3.2. Laissez-faireIt could be the case that an agreement with the EU on international roaming is unnecessary from a Swiss point of view, anyway. For example, new technologies and pan-European groups and alliances emerge, which may provide a market solution with lower international roaming wholesale and retail prices. This possibility is important to take into account as any intervention may distort competition and investment incentives on international roaming services and other related products. We investigate this possibility below.
International roaming wholesale prices Even without a bilateral agreement, there is a chance that Swiss operators will experience lower international roaming wholesale prices. The reason is the emergence of new technologies combined with the fact that Swiss mobile operators are either part of an international group, or are members of international alliances mainly based in the EU.
During the last couple of years, new technologies have been implemented permitting mobile operators to direct their subscribers’ roaming traffic onto specific networks15. Consequently, mobile operators may direct international roaming traffic to networks of operators charging the lowest prices which could spur competition on the wholesale level leading to lower prices.
Furthermore, the Swiss mobile operators could choose to direct the roaming traffic of their subscribers onto the networks of their EU based partners. The latter may in turn choose to keep international roaming wholesale prices identical between other EU operators and their Swiss partners. As international roaming wholesale prices in the EU are expected to drop as a result of the EU proposal, this implies that Swiss operators would experience lower wholesale prices. The major mobile operators in Switzerland are in fact closely connected to EU based mobile operators either through ownership or alliances, cf. Box 3.
Box 3: Overview of Swiss operators’ relationship to different groups and alliances The largest Swiss mobile operator, Swisscom Mobile is in an alliance with the largest European operator Vodafone. The number two operator, Sunrise, is owned by the Danish mobile operator TDC and is member of the European alliance, Starmap Alliance containing operators from most of the EU countries. Orange Switzerland is similarly owned by the French group Orange and is part of the international alliance named Freemove Alliance also containing operators from most of the EU countries. Source: Copenhagen Economics.
Nevertheless, charging lower wholesale prices solely due to partnerships are in stark contrast to the fact that EU operators would have incentive to charge higher prices than the EU regulated prices to the Swiss operators. Consequently, it is of course not certain that an EU regulation of international roaming wholesale prices will actually result in lower international roaming wholesale prices for Swiss operators. But it is possible.
The relationship between wholesale and international roaming retail prices For end-users, ultimately lower wholesale prices only matters if retail prices decrease as well. However, market imperfections may exist at the retail level preventing end-users in Switzerland from benefiting from lower international roaming wholesale prices. There are two primary reasons for why market imperfections may exist at the retail level.
15 According to the European Commission[0] (2006b), approximately 80 % of all traffic in the EU today is directed to
specific networks.

208
First, most end-users have little incentive to pay close attention to the international roaming prices when choosing a subscription. International roaming prices are included in the mobile subscriptions along with other traffic types such as local calls to fixed and mobile networks, international calls, prices on the mobile terminals, and the subscription fee itself. For most end-users international roaming constitutes a fairly low part of their mobile expenditure. The implication is that many end-users, specifically consumers, do not pay attention to which operator offers the lowest international roaming prices when deciding on a subscription; rather she pays attention to other more economically important parts of the subscription.
Second, the end-users’ lack of focus on international roaming prices is accentuated by lack of transparency. Today it is difficult for most end-users to acquire an overview of which operators offer the de facto lowest international roaming prices. Even if the price schemes are getting simpler, the prices may vary depending on whether the end-user is making a local call in the country (s)he is visiting, calling back home, calling to a third country or receiving a call while abroad. Furthermore, prices between operators may also vary on peak hours, on non-peak hours, and on calling to somebody with a fixed or mobile phone. Moreover, the different operators may charge per second, per 15 seconds, per 30 seconds or per minute. All of this reduces transparency.
These two market imperfections are confirmed in two recent surveys conducted by the national regulatory authorities for telecommunications in Norway and Finland. A more detailed description of their findings is presented in Box 4.
Box 4. Two surveys on end-user awareness of international roaming prices In 2005 both the Norwegian and Finnish telecommunications regulators carried out a survey on end-user awareness of international roaming prices. Both surveys reveal that most customers are little aware of the price for making a mobile call abroad. Only 10% and 20% of the respondents in Finland and Norway, respectively, knew the prices when they were abroad. Approximately 90% of all respondents in the two surveys replied that they use the network that automatically appears on their mobile phones. In fact only 4% of the respondents in survey chose to buy an additional SIM-card in order to benefit from lower prices abroad.
Moreover, the Finnish survey shows that only 4% of the respondents pay attention to roaming prices when they choose their mobile subscriptions. Other services are more important for the choice of mobile subscriptions. Source: FICORA (2005) and Norwegian Post and Telecommunications Authority (2005).
Against this background, the incentive seems weak for mobile operators to reduce international roaming retail prices in order to attract customers. This in turn implies that lower international roaming wholesale prices will only partly be passed on to end-users. Two indications support this view.
A first indication is the lack of correlation between international roaming wholesale and retail prices. Even though we do not have access to information on wholesale prices, we know that mobile operators tend to offer discounts on wholesale international roaming to preferred operators, such as operators in the same group or alliance16. Nevertheless, we find that Orange Switzerland, which is wholly-owned by Orange France (which in turn is owned by France Telecom), does not offer lower retail prices if a Swiss end-user calls from France to a person in Switzerland using Orange France’s network. The price is 3.4 Swiss francs for a two minute call regardless of which French network is used, cf. Table 1.
16 See European Commission (2006b) and various national regulators.

209
Table 1: International roaming prices for Swiss end-users in France, 2006 Call from / to Via To Switzerland To France Receiving calls
---------- Swiss francs ---------- Orange 2.2 2.2 1.2 Bouygues 2.2 2.2 1.2 Swisscom
Mobile SFR 2.2 2.2 1.2 Orange 3.4 2.2 1.2 Bouygues 3.4 2.2 1.2 Sunrise SFR 3.4 2.2 1.2 Orange 3.4 2.2 1.2 Bouygues 3.4 2.2 1.2 Orange SFR 3.4 2.2 1.2 Orange 3.7 2.6 1.2 Bouygues 3.6 2.4 1.2 Tele2 SFR 3.6 2.5 1.2
Swiss Prices Average 3.2 2.3 1.2 French Prices SFR 1.7 0.9 0.0 Source: The web sites of the respective mobile operators (as of 19th of July 2006): Tele2 Mobile classic and pro,
Sunrise “avec un abonnement sans option”, Swisscom Natel@basic liberty Euro Passport, Orange Members. Note: The columns show the prices for a Swiss subscriber, of either Swisscom, Sunrise, Orange Switzerland or
Tele2 making a two-minute call from France, either via Orange, Bouygues or SFR France, to Switzerland or to France or receiving calls in France.
The table also shows that Swisscom Mobile does not offer lower international roaming retail prices when using the network of SFR, despite both companies are in an alliance with Vodafone. Retail prices are always 2.2 Swiss francs for a two minute call.
There is one exception when it comes to Danes calling from France. TeliaSonera offers much lower prices to end-users subscribing to its alliance partner Orange. The price for a two-minute call to Denmark is 3.1 Swiss francs instead of 4.2 Swiss francs, cf. Table 2.
Table 2: Two-minute international roaming prices for Danes in France, 2006 Call from / to Via To Denmark To France Receiving calls
---------- Swiss francs ---------- Orange 4.3 2.8 1.9 Bouygues 4.3 2.6 1.9 TDC Mobile SFR 4.3 2.6 1.9 Orange 3.5 2.7 1.7 Bouygues 3.5 2.6 1.7 Sonofon SFR 3.5 2.6 1.7 Orange 3.1 3.1 1.2 Bouygues 4.2 4.2 1.2 TeliaSonera SFR 4.2 4.2 1.2 Orange 4.0 4.0 1.3 Bouygues 4.0 4.0 1.3 3SFR 4.0 4.0 1.3
Danish prices Average 3.9 3.3 1.5 French prices SFR 1.7 0.9 0.0 Source: The web sites of the respective mobile operators (as of 19th of July 2006): TeliaSonera’s international
roaming, 3’s international roaming for private, basic subscriptions, Sonofon’s international roaming for private subscriptions, TDC’s international roaming for private subscriptions.

210
Note: The prices include VAT. The columns show the prices for a Danish subscriber, of either TDC Mobile, Sonofon, TeliaSonera or 3, making a two-minute call from France, either via Orange, Bouygues or SFR France, to Denmarkor to France or receiving calls in France.
However, this does seem like a rare case. For instance, TDC, which is a partner in the Vodafone group, does not offer any retail international roaming discounts when end-users use the network of SFR which is partly-owned by Vodafone.
These are just illustrations of how lower wholesale prices due to alliances do not necessarily imply lower retail prices; however, they are supported by European Commission inquiries revealing that retail prices do not drop when EU operators offer discounts on wholesale international roaming to preferred operators. In fact, the retail prices remain fairly unchanged implying that the retail international roaming operators increase their mark-up and earnings at the expense of consumers. More details on this issue are provided in Box 5.
Box 5. European Commissions inquiries into retail margins Confidential information indicates that retail margins increase when wholesale international roaming drops. On average retail margins are well above 100 % for international roaming calls and up 200 % for operators which obtain discounts on wholesale international roaming.
Larger operators which are either part of an international group or alliance pay at least 38% less than operators which do not belong to a group or alliance. Consequently, these operators do not pass on lower wholesale international roaming charges to their subscribers.
What is more, Commission’s figures reveal that operators have a margin 300-400% for received calls abroad. As there are no wholesale international roaming charges on this type of calls, operators could easily have reduced the retail prices. Source: European Commission (2006b)
Rising retail mark-up in the light of decreasing wholesale prices would benefit operators in countries with a deficit on net-travel to their countries. As Switzerland experiences a net-deficit, Swiss operators would profit from lower international roaming wholesale prices and higher retail mark-ups.
A second indication is the excessive prices on receiving a call abroad. For instance, the price a Swiss end-user pays for receiving a call in France is almost four times higher than the costs even though the operator of the visiting network only charges an ordinary termination price – no wholesale international roaming price. Part of the reason that these retail prices are so high, may be that retail operators fear that their subscribers would otherwise choose to receive calls instead of making a call when abroad. This would force Swiss and other European operators to reduce their international roaming retail prices.
All in all, it seems that neither international alliances nor the current technology are able to eliminate high international roaming retail prices in the short term to medium term. Nevertheless, the European Regulators Group, containing national regulatory authorities in mostly EU countries, recommends to await any retail regulation until it is unambiguously observed that lower wholesale prices are not passed on to end-users in the form of lower retail prices (see ERG (2006)).
New technology and international roaming retail prices Below we look into the possibility that new technological developments may lead to lower international roaming prices at the retail level. Naturally, high international roaming prices may stimulate innovation and development in new international roaming technologies. Below we look at two technological alternatives with the greatest potentials for reducing international roaming retail prices – in our opinion. However, we estimate that neither of these alternatives

211
will be able to bring down international roaming retail prices for Swiss end-users in the short to medium run, only in the longer run.
The first new technological alternative is Voice over IP (internet protocol) which has already had a major impact on fixed telephony. The upcoming of 3G and wireless networks technologies, such as Wi-Fi, as well as new terminals, makes it technically possible to also use IP mobile telephony. However, it is expected that most end-user will not benefit from cheaper international roaming prices based on IP telephony in the short to medium term (see European Commission (2006b)).
The second alternative is international SIM cards which enable end-users to call from abroad at much lower prices. Operators such as Riing mobile and United mobile offer these technologies. In order to offer end-users abroad low prices, these operators either acquire international interconnections at low prices or have their own international networks. However, this solution often requires end-users to obtain a new mobile number which means that they must inform people likely to call them of their new number. This is very inconvenient. Hence, this solution is only desirable for customers who travel a lot such as business customers.
ConclusionsThe European Commission has little faith that a market based solution would, any time soon, provide lower international roaming prices. Without regulation, the European Commission calculates that consumer savings would increase by approximately 1.5 billion euros in the EU. This is based on extrapolating current market developments and assuming significant political pressure. Adjusted for the number of inhabitants in Switzerland, Swiss end-users would save about 37 million Swiss francs a year (24 million euros).
If a market based solution is to provide low international roaming prices, competition must function well. A driver for competition is new technology and end-user focus on prices.
New technology now makes it possible for mobile operators to direct international roaming traffic to networks of operators charging the most beneficial conditions which could introduce pricing competition at the wholesale level. Furthermore, alliances between Swiss and EU operators could contribute to lower international roaming wholesale prices for Swiss operators in light of the diminishing effect of the EU proposal on EU wholesale prices.
However, we find that lower wholesale prices may not translate into lower retail prices; lack of transparency and lack of end-user focus on international roaming retail prices are the primary reason why. Furthermore, we do not believe that the latest technological developments such as IP mobile telephony are able to resolve these market imperfections in the short to medium run, but may be able to do so in the longer run.
Therefore, we believe that a lack of intervention could very well result in unchanged retail prices in the short to medium run, even in the light of falling wholesale prices. We therefore turn to the possibility of Switzerland addressing market imperfections at the retail level using national intervention.
3.3. National intervention In this section, we address the possibilities of Swiss authorities to regulate international roaming retail prices irrespective of wholesale prices. As we have just argued in favour of Swiss end-users facing fairly unchanged international roaming retail prices even in the light of lower wholesale prices, the possibilities of Swiss authorities to regulate at the retail level becomes a real issue.

212
Furthermore, Swiss international roaming retail prices will most probably not be affected by the EU proposal, or any EU intervention for that matter. There are two reasons for this. First, EU intervention on international roaming retail prices will not lead to lower input prices for Swiss operators. Second and most importantly, lower EU retail prices will not restrain Swiss operators’ price settings on retail international roaming since there is no competition between Swiss and EU operators in providing retail international roaming to Swiss end-users.
Naturally, Swiss intervention at the retail level is difficult due to lack of EU internal market provisions, but rather reliance on competition rules, sector specific rules or/and rules on pricing. For one, in Switzerland, the sector specific authority, which is the Fedcomcom, does currently not have competences in international roaming prices and procedures are lengthy due to delaying effects in case of appeals. The Price Surveillance Authority has to cooperate with the Competition Commission in order to impose appropriate measures: the Competition Commission must first establish dominant position in order for the Price Surveillance Authority to impose appropriate measures. Alternatively, the Competition Commission can, by applying art. 7 par. 2 lit. c of the Federal Act on Cartels, refer directly to inappropriate pricing of dominant undertakings. However, this provision has not yet been interpreted by higher courts and such a case would also be subject to delaying effect in case of appeal. Furthermore, an intervention in Switzerland would probably not solve the issue of high prices that the Swiss end-users pay abroad.
In contrast, for example, the Danish organisation of competencies would not imply the same difficulties. In a hypothetical situation where Denmark was not a member of the EU and therefore did not have at its disposal the EU internal market provisions, the Danish sector specific authority would be competent to fulfil all tasks required. It has competence in all electronic communication markets, including international roaming. Furthermore, it has the competence to conduct market analyses on its own in order to establish dominant position and to impose appropriate measures on dominant operators.
Consequently, given the lack of EU internal market provisions in Switzerland, the emphasis should be on how to organise the telecommunication competencies as efficiently as possible. As of now, we believe that the issue of spread and/or conflicting competence may not be optimal. Accordingly, the example of international roaming implies that Switzerland should consider institutional strengthening of the sector regulator, at the same minimising the costs of long appeal procedures and delaying effects, which are today borne by the end-users.
If Switzerland were to regulate international roaming retail prices, it also could run the risk of overregulation. The Danish principle of minimum regulation would reduce this risk. To illustrate the principle; previously the Danish sector specific authority regulated access and call origination on mobile networks through price regulations. However in the last market review, the authority did not find evidence that any operator had a dominant position in the relevant market. Accordingly, the authority withdrew all obligations. Presently, there are no obligations in the relevant market of access and call origination on mobile networks. Another remedy to reduce the risk of overregulation could be to introduce a sunset clause.
In the absence of international roaming retail price regulation, we believe it could be beneficial to take softer measures to remedy the two market imperfections at the retail level: lack of pricing transparency and lack of end-user focus. As we have seen, lack of transparency and bundling of call services make end-users less sensitive to high international roaming prices. Possible measures to make end-users more sensitive could be to publish prices on the Internet comparing retail prices of the different Swiss operators. Furthermore, in line with the proposal of the European Commission, Swiss authorities may require that mobile operators provide end-users with information on roaming prices free of charge either via SMS or a mobile call. Moreover, the mobile operators could provide information on applicable roaming charges when

213
subscriptions are taken out. Finally, Swiss authorities may use international roaming prices in the EU as benchmark for Swiss operators in order to promote lower international roaming prices for Swiss end-users. However, this last suggestion will not be effective if roaming prices in the EU are equally excessive as in Switzerland.
ConclusionsWe have previously shown that retail mark-ups may very well increase when international roaming wholesale prices drop. Accordingly, the European Commission estimates that EU consumers will save an additional 3.2-3.8 billion euros by regulating retail prices in addition to wholesale prices (see European Commission (2006b)). Adjusted for the number of inhabitants in Switzerland, Swiss end-users would save 78-93 million Swiss francs a year (equivalent to 50-60 million euros).
While this speaks in favour of Switzerland regulating at the retail level, we also find it unlikely that Switzerland currently is able to do so.
Apart from direct regulation, several softer measures exist which Swiss authorities may easier be able to implement in order to correct the two main market imperfections of lack of pricing transparency and end-user focus. Examples of soft measures are benchmarking of Swiss retail prices with EU retail prices and requirements for mobile operators to provide end-users with information on roaming prices free of charge either via SMS or a mobile call. However, the telecommunication authorities do not currently have the competence to impose such soft law measures.

214
References
3 (2006): Prisliste udland. Found July 19th and October 31st 2006 on www.3.dk ARCEP (2006), the market for International Roaming, Public Consultation. ComCom (2005): ComCom lowers interconnection prices, Press Release June 14th, 2005.
Found September 18th 2006 on www.fedcomcom.ch/comcom/e/communiques/ ComCom (2006): ComCom lowers interconnection prices, Press Release August 31st, 2006.
Found September 18th 2006 on www.fedcomcom.ch/comcom/e/communiques/ Danish National IT and Telecom Agency (2006a), Market analysis of International Roaming
(Analyser om Reel Konkurrence på det Danske Engrosmarked for international roaming tjenester, marked nr. 17), Draft.
Danish National IT and Telecom Agency (2006b): Afgørelse af 15. September 2006 på det danske engrosmarked for internationale roamingtjenester (Marked 17).
Directive 2002/19/EC: On access to, and interconnection of, electronic communications networks and associated facilities (Access Directive)
Directive 2002/21/EC: On a common regulatory framework for electronic communications networks and services (Framework Directive)
ERG (2005a), ERG Common Position on the Coordinated Analysis of the Market for International Roaming, Common Position.
ERG (2005b), ERG Project Team on International Roaming Retail Tariff Transparency, ERG Report.
ERG (2006a), ERG response to the European Commission’s call for Input on Its Proposed EC Regulation in the International Roaming Market, Response.
ERG (2006b): Public Mobile Termination Rates Benchmark – updated to January 2006. Found July 19th and October 31st 2006 on www.erg.eu.int
ERG (2006c): ERG response to the European Commission’s second phase public consultation on a proposal for a Regulation (EC) of the European Parliament and of the Council on mobile roaming services in the single market. Submitted 11 May 2006
ERG (2006d): ERG response to the European Commission’s call for input on its proposed EC Regulation in the international roaming market. Submitted 22 March 2006
European Commission (2000), On the Initial Findings of the Sector Inquiry into Mobile Roaming Charges, Working Document.

215
European Commission (2006a), Proposal for a Regulation (EC) of the European Parliament and of the Council on mobile roaming services in the Single Market, Second Phase Public Consultation.
European Commission (2006b): Impact assessment of policy options in relation to a commission proposal for a regulation of the European Parliament and of the Council on roaming on public mobile networks within the Community. Commission Staff Working Paper: COM(2006) 382 final
European Commission (2006c): Proposal for a regulation of the European Parliament and of the Council on roaming on public mobile networks within the Community and amending Directive 2002/21/EC on a common regulatory framework for electronic communications networks and services
European Commission (2006d): European Electronic Communications Regulation and Markets 2005 (11th report), SEC(2006)193.
Europe’s Information Society Thematic Portal: Sample post-paid voice tariffs for travellers from Denmark. Found July 3rd 2006 on http://europa.eu.int/information_society
Finger, Matthias & Annelies Voets (2003): Comparative study on the effectiveness of Telecommunications regulators: summary, Report prepared for OFCOM
Finnish Communications Regulatory Authority (FICORA) (2005): Mobile phone usage abroad, spring 2005. Survey of May 2005. Found July 14th 2006 on www.ficora.fi
GSM Europe (2006): How does mobile roaming work?, Article. Found July 14th 2006 on www.roaming.gsmeurope.org
Le French Mobile (2005): Terms and conditions for mobile telecommunication services at Translatel – for LeFrenchMobile subscribers. Customer contract sheet, version August 2005. Found July 19th and October 31st 2006 on www.lefrenchmobile.com
Norwegian Post and Telecommunications Authority (2005): Mobil i utlandet. Survey July 2005. Found July 14th 2006 on www.npt.no
Norwegian Post and Telecommunications Authority (2006a): Analyse av det nasjonale grossistmarkedet for internasjonal roaming i offentlige mobilkommunikasjonsnett, Report
Norwegian Post and Telecommuications Authority (2006b), Market analysis of International Roaming (Analyser av det Nasjonale Grossistmarked for Internasjonal Roaming i Offentlige Mobilkommunikasjonsnett), Public Hearing.
OFCOM (2005a): Rapport annuel 2005, Report. OFCOM (2005b), Swiss Telecommunications Market – an International Comparison, Report. OFCOM (2006a): Extract from the 11th European Union implementation report extended to
include Switzerland, Report OFCOM (2006b), Using your Mobile Abroad, Consumer Guide. Orange Switzerland (2006): Tariffs for international roaming. Found July 19th and October 31st
2006 on www.orange.ch PhoneCallMall.com (2006): Prepaid Global Roaming Sim Cards for International Travelers.
Found September 18th 2006 on www.phonecallmall.com.globalsim.html SFR (2006): Les tariffs SFR Le Compte: Tariffs valables au 24/05/06. Found July 19th 2006 on
www.sfr.frSonofon (2006): Udlandstelefoni. Found July 19th and October 31st 2006 on www.sonofon.dk

216
Sunrise (2006): Avec un abonnement – Prix. Found July 19th and October 31st 2006 on www.sunrise.ch
SwissCom Mobile (2006): Tarif d’itinérance. Found July 19th and October 31st 2006 on www.swisscom-mobile.ch
TDC Mobil (2006): Roamingpriser. Found July 19th and October 31st 2006 on www.tdcmobil.dk
TELE2 Mobile (2006): Products and tariffs. Found July 19th and October 31st 2006 on www.tele2.ch
TELE2 (2006): Tele 2 knock out. Found October 31st 2006 on www.tele2.se Telia (2006): Udlandspriser. Found July 19th and October 31st 2006 on http://telia.dk Que Choisir (2005a): Appels Internationaux: Chacun pour soi. Article of 06/12/05 found July
20th 2006 on www.quechoisir.org Que Choisir (2005b): Entente des opérateurs mobiles: Après la sanction, l’heure de la
reparation a sonné. Article of 01/12/05 found July 20th 2006 on www.quechoisir.org Que Choisir (2005c): Téléphonie mobile: Chers appels. Article of 13/07/05 found July 20th
2006 on www.quechoisir.org Que Choisir (2006a): Téléphonie mobile. Found July 20th 2006 on www.quechoisir.org Que Choisir (2006b): Téléphonie mobile: Le roaming en ligne de mire. Article of 17/05/06 found
July 20th 2006 on www.quechoisir.org Que Choisir (2006c): Roaming: Arnaque aux touristes européens. Article of 03/07/06 found on
www.quechoisir.org Que Choisir (2006d): Roaming: Bruxelles passé à l’action. Article of 30/03/06 found July 20th
2006 on www.quechoisir.org


Liberalisierung im Schienenverkehr
Ergebnisse des Ausschreibungswettbewerbs in Schleswig-
Holstein und Hessen und Folgerungen für die Schweiz

Liberalisierung im Schienenverkehr
Ergebnisse des Ausschreibungswettbewerbs in Hessen
und Schleswig-Holstein und Folgerungen für die Schweiz
Auftraggeber: SECO – Staatssekretariat für Wirtschaft, Bern
Erstellt durch: KCW GmbH, Berlin
Dezember 2006
Gesamtleitung: Arne Beck
Text: Arne Beck, Derek Ladewig, Ingo Kühl
Layout: Arne Beck, André Darmochwal, Annemone Meyer, Sebastian Knirr

221
Inhaltsverzeichnis
Abbildungsverzeichnis ............................................................ 223
Tabellenverzeichnis................................................................. 224
Abkürzungsverzeichnis ........................................................... 225
Kurzübersicht .......................................................................... 226
1 Einleitung............................................................................ 227
1.1 Problemstellung ..........................................................................................227
1.2 Zielsetzung der Studie/Projektauftrag ...........................................................227
2 Grundlagen der Studie und verwendete Methodik............. 229
2.1 Rahmenbedingungen im deutschen SPNV-Ausschreibungswettbewerb...........229
2.1.1 Zuschussbedarf des SPNV............................................................................229
2.1.2 Organisation des Ausschreibungswettbewerbs ..............................................230
2.1.3 Kosten der Nutzer im Ausschreibungswettbewerb..........................................232
2.2 Angewandte Methodik .................................................................................235
3 Ausgangslage und Ziele der betrachteten Aufgabenträger 238
3.1 Schleswig-Holstein ......................................................................................238
3.1.1 Ausgangslage..............................................................................................238
3.1.2 Ziele ...........................................................................................................241
3.2 Hessen .......................................................................................................244
3.2.1 Ausgangslage..............................................................................................244
3.2.2 Ziele ...........................................................................................................246
3.3 Im Vergleich: Ausgangslage der Schweiz ......................................................250
4 Evaluation der Ausschreibungsergebnisse ......................... 252
4.1 Allgemeine Marktentwicklung im deutschen SPNV .........................................252
4.2 Fallbeispiel Schleswig-Holstein .....................................................................253
4.2.1 Kosten des Angebots in Relation zu den Kosten der Ausschreibung ................254

222
4.2.2 Entwicklung der Angebotsqualität und der Innovationen................................260
4.2.3 Kosten der Nutzer .......................................................................................265
4.2.4 Auswirkungen auf Arbeitsplätze und Finanzen der Betreiber..........................267
4.2.5 Gesamtbetrachtung Marschbahn ..................................................................269
4.3 Fallbeispiel Hessen ......................................................................................270
4.3.1 Kosten des Verkehrsangebotes.....................................................................271
4.3.2 Entwicklung der Angebotsqualität und der Innovationen................................272
4.3.3 Kosten der Nutzer .......................................................................................276
4.3.4 Auswirkungen auf Arbeitsplätze und Finanzen der Betreiber..........................277
4.3.5 Gesamtbetrachtung Odenwaldbahn ..............................................................277
5 Empfehlungen für die Schweiz ........................................... 279
5.1 Nutzung des Ausschreibungswettbewerbs in der Schweiz .............................279
5.2 Sicherung wichtiger Errungenschaften des Schweizer Personenschienenverkehrs
279
5.3 Erfolgsrelevante Maßnahmen .......................................................................281
5.3.1 Erfolgsfaktoren............................................................................................282
5.3.2 Misserfolgsfaktoren .....................................................................................288
5.4 Handlungsempfehlungen für die Schweiz ......................................................290
6 Zusammenfassung und Ausblick ........................................ 292
6.1 Zusammenfassung ......................................................................................292
6.2 Ausblick ......................................................................................................293
Literaturverzeichnis ................................................................ 294
Dokumentenverzeichnis.......................................................... 296
Anhang .................................................................................... 301

223
Abbildungsverzeichnis
Abbildung 1: SPNV-Betreiber in Schleswig-Holstein 2006 ............................................. 240
Abbildung 2: Teilnetze für den Wettbewerb in Schleswig-Holstein ................................ 242
Abbildung 3: Zeitplan Wettbewerb ............................................................................. 243
Abbildung 4: Zu vergebende Verkehrsleistungen im SPNV in Hessen mit
Betriebsaufnahme 2005 bis 2015 ........................................................... 247
Abbildung 5: Liniennetz der Odenwaldbahn ................................................................ 249
Abbildung 6: In SPNV-Ausschreibungen in Deutschland gewonnene Marktanteile
in Prozent (Basis 131 Mio. Zugkm) ......................................................... 253
Abbildung 7: Regelmäßige Kostenstruktur deutscher SPNV-Betreiber ........................... 255
Abbildung 8: Zuschussbedarf vor und nach Ausschreibungswettbewerb auf der
Marschbahn .......................................................................................... 257
Abbildung 9: Entwicklung der Pünktlichkeitsquoten auf der Marschbahn....................... 261
Abbildung 10: Im Wettbewerb zu vergebende Linienbündel in Hessen ........................... 305

224
Tabellenverzeichnis
Tabelle 1: Modal-Split in Schleswig-Holstein ........................................................... 238
Tabelle 2: Mit Ausschreibungswettbewerb verfolgte Ziele der öffentlichen Hand
in Schleswig-Holstein – Einschätzung von Herrn Wewers, LVS.................. 241
Tabelle 3: Mit Ausschreibungswettbewerb verfolgte Ziele der öffentlichen Hand
im RMV (Hessen) – Einschätzung von Herrn Achenbach........................... 247
Tabelle 4: Modal-Split in der Schweiz ..................................................................... 251
Tabelle 5: Marktanteile der Wettbewerber im SPNV in Deutschland.......................... 252
Tabelle 6: Qualitätsveränderung Marschbahn.......................................................... 262
Tabelle 7: Bislang öffentlich ausgeschriebene Verkehre in Schleswig-Holstein ........... 301
Tabelle 8: Bisherige SPNV-Ausschreibungen in Hessen ............................................ 302
Tabelle 9: RMV-Ausschreibungsfahrplan 2003-2014 ................................................ 302

225
Abkürzungsverzeichnis
AG Aktiengesellschaft
AKN AKN Eisenbahn AG
BAV Bundesamt für Verkehr der Schweiz
DB AG Deutsche Bahn AG
GmbH Gesellschaft mit beschränkter Haftung
HVV-Tarif Tarif des Hamburger Verkehrsverbundes
km/h Kilometer pro Stunde
LVS LVS Landesweite Verkehrsservicegesellschaft
Schleswig-Holstein mbH
NOB Nord-Ostsee-Bahn
NVV Nordhessischer Verkehrsverbund
ÖPNV Öffentlicher Personennahverkehr
Pkm Personenkilometer
RMV Rhein-Main-Verkehrsverbund GmbH
SBB Schweizerische Bundesbahnen
SECO Staatssekretariat für Wirtschaft der Schweiz
SPNV Schienenpersonennahverkehr
TU Transportunternehmung (im abgegoltenen Verkehr)
VDV Verband Deutscher Verkehrsunternehmen e.V.
VOL/A Verdingungsordnung für Leistungen, Teil A
VRN Verkehrsverbund Rhein-Neckar
Zugkm Zugkilometer (pro Jahr)

226
Kurzübersicht
Die Schweiz hat bislang im Bereich der Ausschreibung von Verkehrsleistungen im Schienen-
personenverkehr kaum eigene Erfahrungswerte gesammelt. Aus diesem Grund entschied
sich das Staatssekretariat für Wirtschaft der Schweiz (SECO), die Erfahrungen im europäi-
schen Ausland im Rahmen einer Fallstudie näher untersuchen zu lassen. Ausgewählt wurden
die deutschen Bundesländer Schleswig-Holstein und Hessen mit den Strecken Marschbahn
und Odenwaldbahn.
Die Fallbeispiele zeigen, dass die Nutzung von Ausschreibungen bei der Vergabe von SPNV-
Leistungen aus Sicht der öffentlichen Hand insgesamt positiv zu bewerten ist. Der Zuschuss-
bedarf konnte in den betrachteten Fällen in Schleswig-Holstein und Hessen gesenkt bezie-
hungsweise die Kosten stabilisiert werden. Gleichzeitig wurde die Angebotsqualität in beiden
Fallbeispielen, insbesondere über neues Fahrzeugmaterial, massiv erhöht. Die Risiken, die
den Betreiber aus der Beschaffung von Fahrzeugen entstehen, und die damit einhergehen-
den Markteintrittsbarrieren konnten über die Nutzung der Instrumente „Wiedereinsatz-
garantie“ beziehungsweise „Fahrzeugpool“ minimiert werden.
Im betrieblichen Bereich waren in beiden Fallbeispielen aus unterschiedlichen Gründen an-
fänglich erhebliche Probleme aufgetreten, die inzwischen aber behoben werden konnten.
Auswirkungen im Bereich der Fahrpreise ergeben sich aus Gründen der Vergabebedingungen
lediglich bei der Marschbahn, wo sich der Betreiber zu einem geringfügigen Aufschlag auf die
Fernverkehrspreise entschied. Eine Erhöhung im Nahverkehr erfolgte dort bislang trotz Ges-
taltungsmöglichkeiten nicht. Gleichzeitig zeigt sich, dass der Einschätzbarkeit des Fahrgelder-
löspotenzials (zum Beispiel hinsichtlich der Tarifergiebigkeit) eine hohe Bedeutung zukommt.
Die Profitabilität der Betreiber scheint im Ausschreibungswettbewerb leicht zurückzugehen.
Die Löhne gerieten etwas unter Druck, sanken bislang aber nicht auf das aus tarifvertragli-
cher Sicht mögliche Niveau. Die Anzahl der Arbeitsplätze blieb insgesamt konstant.
Mit Blick auf die dargestellten Ergebnisse erscheint es sinnvoll, das Instrument des Aus-
schreibungswettbewerbs auch bei abgeltungspflichtigen Schienenverkehrsleistungen in der
Schweiz für eine Anwendung zu prüfen. Für die Kantone bestünde dadurch die Möglichkeit,
bei weiter steigendem Qualitätsniveau den Zuschussbedarf zu reduzieren beziehungsweise
die Kosten für die öffentliche Hand trotz Qualitätssteigerung zu stabilisieren.

227
1 Einleitung
1.1 Problemstellung
Das Staatssekretariat für Wirtschaft (SECO) veröffentlichte im November 2005 den „Bericht
zur Dienstleistungsliberalisierung in der Schweiz im Vergleich zur EU“. Die Studie stellte für
die Schweiz ein bedeutendes Wachstumspotenzial im Zuge einer branchenspezifischen
Dienstleistungsliberalisierung fest.1
Im Schienenverkehr wurde die Schweiz im Status quo, insbesondere im Bereich des Schie-
nenpersonenverkehrs, im Vergleich zu anderen Staaten (zum Beispiel Großbritannien und
Schweden, aber auch Deutschland) hinsichtlich des Grades der Liberalisierung als restriktiv
eingestuft. Als Gründe werden insbesondere die relativ schwache vertikale und horizontale
Trennung innerhalb des SBB-Konzerns sowie die fehlende Vergabe von Leistungen im Wett-
bewerb mittels Ausschreibungen angeführt.
Die Europäische Kommission hat in ihrem Weißbuch im Jahre 2001 darauf hingewiesen, dass
in Märkten, in denen ein kontrollierter Ausschreibungswettbewerb eingeführt wurde, ein
stärkeres Wachstum des Passagieraufkommens zu beobachten sei als in Märkten, in denen
keine regelmäßigen Ausschreibungen stattfinden.2 Dennoch besteht allgemein Unklarheit
über das Ausmaß des tatsächlich messbaren Gesamterfolges der Liberalisierungsmaßnahmen
im Schienenpersonenverkehr, was die Ableitung einer Best-Practice-Empfehlung für die
Schweiz erschwert. Zwar existieren innerhalb der EU-Staaten, zum Beispiel im deutschen Re-
gionalverkehr, einige Indizien für positive Ergebnisse im Bereich des intermodalen Wettbe-
werbs und bei der Reduktion öffentlicher Zuschüsse. Fallstudien, die auf die Ableitung von
Handlungsempfehlungen für die Schweiz abzielen, liegen bislang jedoch nicht vor.
1.2 Zielsetzung der Studie/Projektauftrag
Vor dem Hintergrund, dass die Schweiz bislang im Bereich der Ausschreibung von Verkehrs-
leistungen im Schienenpersonenverkehr kaum eigene Erfahrungswerte besitzt,3 erscheint es
sinnvoll, die Erfahrungen des europäischen Auslandes zu betrachten. Im europäischen Aus-
land sind die umfangreichsten Vergabetätigkeiten im Schienenpersonenverkehr in den Län-
dern Großbritannien, Schweden und Deutschland zu beobachten. Von diesen Staaten er-
scheint eine nähere Betrachtung der Entwicklung des Schienenpersonennahverkehrs4 in der
Bundesrepublik Deutschland aus Sicht der Schweiz aus folgenden Gründen vorteilhaft:
1 Vgl. Staatssekretariat für Wirtschaft (SECO) (2005). 2 Vgl. Europäische Kommission (2001). 3 Die bislang einzige Ausschreibung im Schienenpersonenverkehr der Schweiz, die Cityvogel-Linie, wurde 1999 abgebrochen. 4 Entspricht in etwa dem Schienenpersonenverkehr in der Schweiz.

228
Mit einer Vielzahl von auf regionaler Ebene für ein jeweiliges Gebiet für den Schie-
nenpersonennahverkehr (SPNV) verantwortlichen Aufgabenträgern besteht eine
strukturell ähnliche Marktorganisation wie in der Schweiz, in der die Kantone diese
Zuständigkeit innehaben.
Mit der Deutschen Bahn AG (DB AG) existiert ein Incumbent,5 bei dem Netz und
Betrieb integriert sind. Auch die Schweizerische Bundesbahnen (SBB) sind derzeit
als ein integrierter Konzern aufgestellt und können aufgrund ihrer Marktposition
ebenfalls als Incumbent eingestuft werden.
In einigen Bundesländern existieren kleinere Eisenbahnunternehmen, die auch im
regionalen Schienenpersonenverkehr tätig sind. Diese befinden sich zumeist im
Besitz des jeweiligen Bundeslandes (zum Beispiel Hessische Landesbahn GmbH im
Besitz des Landes Hessen, AKN Eisenbahn AG im Besitz der Bundesländer Schles-
wig-Holstein und Hamburg) und beteiligen sich aktiv am Ausschreibungswettbe-
werb. Auch hier dürfte eine gewisse Analogie zu der Situation in der Schweiz her-
zustellen sein.
Die vorliegende Fallstudie soll deshalb anhand der Erfahrungen im deutschen SPNV die Po-
tenziale ermitteln, die für die Schweiz in einer konsequenten Anwendung wettbewerblicher
Vergabeverfahren im (primär regionalen) Schienenverkehr liegen könnten. Hierfür werden
die Erfahrungen der deutschen Bundesländer Schleswig-Holstein und Hessen ausgewertet,
die bislang eine führende Position in der wettbewerblichen Vergabe von SPNV-Leistungen in
Deutschland eingenommen haben.
5 Der Ausdruck „Incumbent“ steht in der ökonomischen Diskussion für den alteingesessenen Monopolisten in einem zunehmend liberalisierten Markt (zumeist das bis zur Liberalisierung rein staatliche Unternehmen).

229
2 Grundlagen der Studie und verwendete Methodik
2.1 Rahmenbedingungen im deutschen SPNV-Ausschreibungswettbewerb
2.1.1 Zuschussbedarf des SPNV
Ausschreibungen dienen der Beschaffung von individuellen Gütern zu Marktpreisen. Da der
SPNV in den Industrieländern heutzutage in den meisten Fällen in dem von der Gesellschaft
gewünschten Umfang weder gewinnbringend noch kostendeckend angeboten werden kann,
leistet der Staat Finanzhilfen für den Betrieb des SPNV. Mit der öffentlichen Beihilfe geht in
der Regel ein Monopol der SPNV-Bedienung auf einer bestimmten Strecke einher, um alle
Effizienzsteigerungspotenziale durch den Betreiber ausschöpfen zu können. Begründet wurde
dies stets mit dem Umstand, dass der Eisenbahnverkehr einem natürlichen Monopol unter-
liegt. In der jüngeren Forschung wird diese globale Einordnung jedoch nicht mehr vorge-
nommen. Während die Infrastruktur in der Regel auch weiterhin als natürliches Monopol
einzuordnen ist, kann die Produktion von Transportleistungen auf der bestehenden Infra-
struktur von konkurrierenden Unternehmen mit eigenen Fahrzeugen erbracht werden.6
Hinzu kommt, dass der Betrieb im Schienenpersonenverkehr in der Regel eigenwirtschaftlich
nicht im vollen vom Staat gewünschten Umfang erbracht werden kann.7 Dies ist auch vor
dem Hintergrund zu sehen, dass bislang beim stärksten Konkurrenten im intermodalen
Wettbewerb der Verkehrsträger, dem Straßenverkehr, nicht alle Kosten verursachungsge-
recht auf die Nutzer der Infrastruktur umgelegt werden. Ebenso werden auch externe Effek-
te – beispielsweise Umweltverschmutzung – in der Regel bei den Verkehrsträgern nicht mit
eingepreist. Bedingt durch diese fehlende Zuweisung der tatsächlich entstehenden Kosten
besitzt der Straßenverkehr gegenüber dem SPNV einen Kosten- beziehungsweise Preisvorteil,
welcher zu einer verzerrten Nachfragestruktur führt.
Um dieser Fehlallokation entgegen zu wirken, ist aus ökonomischer Sicht zunächst eine An-
hebung der Preise im Straßenverkehr zu befürworten („first best“-Lösung). Da dies aufgrund
der zu erwartenden geringen Akzeptanz bei den Bürgern nur schwer durchsetzbar sein dürf-
te, erscheint es ökonomisch sinnvoll, stattdessen (als „second best“-Lösung) die Preise für
den SPNV mittels staatlicher Zuschüsse zu senken, um damit der Kostenverzerrung zwischen
den Verkehrsträgern entgegen zu wirken.8 Daher erscheint es angebracht, zur Ausnutzung
aller Effizienzsteigerungskriterien ein (zeitlich beschränktes) Monopolrecht für die Erbringung
von Personentransportdienstleistungen auf der Schiene zu vergeben und gegebenenfalls
staatliche Zuschüsse für das vom Staat geforderte Niveau der Angebotsqualität zu zahlen.
6 Vgl. Borrmann und Finsinger (1999, S. 101) sowie Wolfstetter (1999, S. 238). 7 Vgl. Snethlage (2001, S. 47-49), der dieses Gut deshalb auch als meritorisches Gut einordnet. 8 Vgl. OECD (2005, S. 27).

230
Dieses Monopolrecht sowie die Zuschüsse können im Wettbewerb über Ausschreibungen
vergeben werden, um den effizientesten Betreiber für die geforderte Verkehrsleistung aus-
zuwählen. Wesentliche Vorrausetzung hierfür ist die Gewährleistung des diskriminierungs-
freien Netzzuganges für alle Transportunternehmungen (TU).
2.1.2 Organisation des Ausschreibungswettbewerbs
Das Prinzip des Ausschreibungswettbewerbs erfordert zunächst eine Trennung der Besteller-
und Erstellerfunktion. Das heißt für den Staat, dass die Aufgabe der Bestellung von SPNV-
Verkehrsleistungen staatlichen Organisationen zugeordnet werden muss.
In Deutschland wurde dieser Prozess im Zuge der Bahnreform (1994) durch die „Regionali-
sierung“ eingeleitet. Das Regionalisierungsgesetz9 sieht vor, dass die Länder vom Bund ein
länderspezifisches Budget an so genannten „Regionalisierungsmitteln“ erhalten, mit denen
sie den SPNV zu bestellen – also zu finanzieren und zu organisieren – haben. Hierfür obliegt
es ihnen auch, die notwendigen Organisationsstrukturen selbst zu schaffen oder die regiona-
len Träger dieser Organisationsstrukturen (die „Besteller“), wie Landesgesellschaften, regio-
nale Zweckverbände oder Verkehrsverbünde, zu bestimmen. Die rechtliche Ausgestaltung
nehmen die Länder in so genannten „ÖPNV-Gesetzen“ vor.10
Den Bestellern in Deutschland obliegt es, die genauen Ausschreibungsdesigns festzulegen.
Hierbei sind verschiedene Ausschreibungsstrategien zu beobachten. Die Auswahl der „richti-
gen“ Strategie sollte auf einer genaueren Markt- und Marktumfeldanalyse beruhen. Der Ein-
fluss von politisch-programmatischen Präferenzen der Akteure ist aber auch zu beobachten.
9 Gesetz zur Regionalisierung des öffentlichen Personennahverkehrs (Regionalisierungsgesetz – RegG) vom 27.12.1993. 10 Vgl. beispielsweise das Gesetz über den öffentlichen Personennahverkehr in Hessen (ÖPNVG 2005) sowie das Gesetz über
den öffentlichen Personennahverkehr in Schleswig-Holstein (ÖPNVG 1996).

231
Folgende Haupttrends bei Ausschreibungsstrategien lassen sich derzeit klassifizieren:
Brutto- oder Nettovertrag
Der Bruttovertrag sieht vor, dass das TU sämtliche Fahrgeldeinnahmen dem Besteller
übergibt und für seine Leistung vom Besteller mit dem vom TU in der Ausschreibung
angebotenen und im Verkehrsvertrag vereinbarten fest definierten Entgelt vergütet
wird. Damit werden die Kosten des TU (zuzüglich eines entsprechenden Gewinns)
abgegolten. Der Betreiber trägt lediglich das Kostenrisiko.
Der Nettovertrag sieht hingegen vor, dass das TU die Fahrgeldeinnahmen als Teil sei-
ner Vergütung einbehalten kann und zur vollständigen Deckung seiner Kosten (zu-
züglich eines entsprechenden Gewinns) ergänzend vom Besteller mit einem vom TU
angebotenen und im Verkehrsvertrag vereinbarten Zusatzentgelt vergütet wird. Der
Betreiber trägt das Kosten- und das Fahrgelderlösrisiko.
Anreizregelungen
Um Anreize zum Erreichen verschiedenster Ziele zu setzen, wie zum Beispiel die Ein-
haltung einer definierten Angebotsqualität oder die Gewinnung neuer Fahrgäste, se-
hen Verkehrsverträge oftmals Bonus- und Malusregelungen vor. Insbesondere für
reine Bruttoverträge wird dieses Instrument aufgrund des fehlenden Fahrgelderlösri-
sikos genutzt.
Reine Nettoverträge hingegen setzen mit der reinen Erlösoptimierung in manchem
Kontext auch Fehlanreize (zum Beispiel Konzentration auf ertragsstarke Linien und
lediglich Angebot gemäß Mindestbedingungen auf ertragsschwachen Linien), weshalb
ergänzende Anreizparameter zusätzlich zur grundsätzlich bestehenden Anreizwirkung
des Nettovertrags als Steuerungsmittel eingesetzt werden.
Konstruktive oder funktionale Vergaben
In einer konstruktiven Vergabegestaltung wird versucht, die zu bestellende Leistung
möglichst genau zu definieren. So werden zum Beispiel Fahrpläne exakt vorgegeben.
Funktionale Vergaben versuchen dagegen, die Verantwortung der operativen Ent-
scheidung der Leistungserfüllung beim Ersteller zu belassen und geben nur zu erfül-
lende funktionale Mindestanforderungen vor (zum Beispiel die Vorgabe von Taktver-
kehr und maximale Reisezeiten, anstatt der Vorgabe eines Fahrplans). 11
11 Zu Ausschreibungsformen und Vertragsgestaltungen vgl. detailliert: Eichmann et al. (2006, S. 159-216).

232
2.1.3 Kosten der Nutzer im Ausschreibungswettbewerb
Der Kostendeckungsbeitrag der Fahrgelderlöse im ÖPNV in Deutschland beträgt durch-
schnittlich weniger als 50 Prozent.12 Der Rest der Betriebskosten wird durch öffentliche Zu-
schüsse finanziert. Die Höhe der Fahrpreise ist dabei politisch bestimmt.
In den SPNV-Ausschreibungen in Deutschland sind verschiedenste Regelungen bzgl. der
Fahrpreisanwendung anzutreffen. Idealtypisch können folgende, den Ausschreibungen zu-
grunde liegende, Ausschreibungsdesigns unterschieden werden:
Bruttovertrag mit Anwendung der Verbundtarife
Die Vergabebedingungen sehen die Anwendung des örtlich geltenden Verbundtarifs
oder, bei größeren Strecken oder Netzen, die verschiedenen regionalen Verbundtarife
vor. Im reinen Bruttovertrag sind die Fahrgelderlöse vollständig an den Besteller zu
überführen. Der Ersteller/Auftragnehmer muss sich den im örtlichen Verkehrsverbund
institutionalisierten Fahrpreisfindungs- und Erlösmanagementstrukturen unterwer-
fen.13
Weiterentwickelte Bruttoverträge setzen Anreize zur Verbesserung der Vertragserfül-
lung durch Bonus- und Malus-Regelungen, beispielsweise Bonuszahlungen für er-
reichte Verkehrsnachfrageziele oder Mali für verfehlte Qualitätsstandards. In Ver-
kehrsverbünden erlauben Bruttoverträge teilweise den Vorwegabzug des Vertriebs-
aufwandes, was die Liquiditätssituation des Betreibers verbessert.
Ein Diskriminierungspotenzial im Bereich der Fahrgelderlöse zu Lasten des Neubetrei-
bers besteht aufgrund des fehlenden Erlösrisikos nicht.
Beispiel: Ausschreibung des Odenwaldnetzes im RMV (vgl. Kapitel 4.3, Seite 270).
12 Vgl. Eichmann et al. (2006, S. 21). 13 Oftmals, wie im Fallbeispiel RMV, aber nicht immer, sind die Verkehrsverbünde gleichzeitig SPNV-Besteller.

233
Nettovertrag mit Anwendung des Verbundtarifs
Nettoverträge sehen vor, dass das Risiko schwankender Fahrgelderlöse beim Betrei-
ber liegt. Der im Ausschreibungswettbewerb ermittelte Zuschussbedarf reduziert sich
entsprechend um die von Seiten des Betreibers erwarteten Fahrgelderlöse.
Die Vergabebedingungen sehen die Anwendung des örtlich geltenden Verbundtarifs
oder, bei größeren Strecken oder Netzen, der verschiedenen regionalen Verbundtarife
vor. Der Ersteller/Auftragnehmer muss sich den im örtlichen Verkehrsverbund institu-
tionalisierten Fahrpreisfindungsstrukturen unterwerfen. Der Unternehmer muss dem-
nach einschätzen, welche Verkehrsnachfrage er erwartet und wie er die Beeinfluss-
barkeit des Tarifs (Höhe, Struktur etc.) im Verkehrsverbund einschätzt. Eine Verände-
rung (Erhöhung) der Tarife ist dabei gemäß § 12 des Allgemeinen Eisenbahngesetzes
von der zuständigen Genehmigungsbehörde zu genehmigen (was bei Verbundtarifen
zumeist problemlos erfolgt).
Die Tarifergiebigkeit, also die Höhe der tatsächlich realisierten Fahrgelderlöse aus der
gegebenen Struktur des Tarifs (zum Beispiel Anteile Einzelfahrkarten, Monatskarten),
ist ebenfalls zu kalkulieren.
Sowohl für die Einschätzbarkeit der Verkehrsnachfrage als auch für die Einschätzbar-
keit der Tarifergiebigkeit ist eine umfangreiche Datenbasis (Daten des Altbetreibers,
gesondertes Gutachten) erforderlich. Liegt diese nicht vor (zum Beispiel durch Ver-
weigerung der Herausgabe durch den Altbetreiber), ist von einem entsprechenden In-
formationsvorsprung für den Altbetreiber auszugehen. Dies könnte den Wettbewerb
verzerren.
Sofern auf einer Bahnstrecke mehrere Betreiber von SPNV-Verkehrsangeboten kon-
kurrieren, sind hinreichende Angaben über die jeweiligen Anteile an der Verkehrs-
nachfrage nötig. Auch die Abhängigkeit von der Leistungsqualität anderer Betreiber
(insbesondere bei Zubringerverkehren) ist zu beachten.
Sofern wesentliche Teile der Fahrgeldeinnahmen über Verkaufsstellen generiert wer-
den, die nicht zum Neubetreiber gehören, muss dieser die Risiken eines verspäteten
Zugangs der Liquidität einkalkulieren. Zwar erhält der Neubetreiber in der Regel Ab-
schlagszahlungen. Insbesondere bei vom Neubetreiber einkalkulierten Fahrgaststeige-
rungen werden diese jedoch erst nach Abrechnung des abgelaufenen Wirtschaftsjah-
res (im Allgemeinen in der ersten Jahreshälfte des Folgejahres) liquiditätswirksam.
Weiterhin ist zu beachten, dass für den Verkauf von Fahrkarten über andere Ver-
kaufsstellen als die des Neubetreibers Vertriebsprovisionen zu zahlen sind. Diese
werden zumeist anteilig vom Umsatz berechnet und betragen bis zu 30 Prozent der
Einnahmen. Auch hier muss der Anteil der über Fremdgeräte verkauften Fahrkarten
kalkuliert werden, wenngleich zumeist keine hinreichend genaue Datengrundlage ü-
ber die entsprechenden Anteile gegeben ist.
234
Diskriminierungspotenzial besteht für den Incumbent dann, wenn wesentliche Anteile
des Verkaufs über seine Verkaufsstellen abgewickelt werden.
Regulierungsinstrumente könnten im Aufbau eines betreiberneutralen Tarifsystems
und der im Verkehrsvertrag festgelegten Verpflichtung zur Weitergabe der Nachfrage-
und Erlösdaten an den Aufgabenträger bestehen.
Beispiel: Ausschreibung der Marschbahn mit Anerkennung der Tarife des Hamburger
Verkehrsverbundes (HVV) und des Schleswig-Holstein-Tarifes (vgl. Kapitel 4.2, Seite
253), Metronom (TU) im Bereich der Verkehrsverbünde HVV und Großraum-Verkehr-
Hannover (GVH).
Nettovertrag mit eigenem Tarif
Existiert im Bereich der ausgeschriebenen Strecke oder des ausgeschriebenen Netzes
kein Verbundtarif, wird es teilweise dem Unternehmer überlassen, einen Tarif einzu-
führen, der am Markt durchsetzbar und ausreichend ergiebig ist.
Die oben beschriebenen Problemfelder hinsichtlich Einschätzbarkeit der Verkehrs-
nachfrage und Verkauf über Verkaufsstellen anderer Anbieter (zum Beispiel des In-
cumbents) bleiben bestehen.
Beispiel: Ausschreibung des Harz – Elbe – Netzes und Betriebsaufnahme des Harz –
Elbe – Express mit HEX-Tarif durch Veolia in Sachsen-Anhalt.14
Nettovertrag mit Anerkennung aller Tarife der Deutschen Bahn AG
(gegebenenfalls zuzüglich Anwendung eines lokalen Verbundtarifs (s. o.))
Häufig schreiben Ausschreibungsdesigns die Anerkennung der Tarife der Deutschen
Bahn AG vor, so zum Beispiel im Fall des Parallelverkehrs bei ausgeschriebenen
SPNV-Verkehren und noch nicht ausgeschriebenen Verkehren der Deutschen Bahn AG
im Nahverkehr (zum Beispiel RegionalExpress und RegionalBahn) oder auch bei paral-
lel verkehrendem Fernverkehr.
Des Weiteren ist auch häufig der Fall gegeben, dass die Vergabebedingungen nicht
nur die Anerkennung, sondern die explizite Anwendung der Tarife (gegebenenfalls
einschließlich Fernverkehrstarif) der Deutschen Bahn AG vorsehen.
Bei der Kalkulation müssen damit zusätzliche Aspekte berücksichtigt werden, für die
teilweise nur eine eingeschränkte Datenbasis vorliegt:
Nachfrageverteilung auf Verbundtarif und DB-Tarif,
Höhe des Vertriebsaufwandes der jeweiligen Tarifregime,
14 Vgl. Harz-Elbe-Express (2006).

235
Zeitliche Verzögerung der Liquiditätsflüsse von
Fahrkartenvertriebsstellen Dritter (zum Beispiel Deutsche Bahn AG).
Ein Diskriminierungspotenzial besteht damit für den Anbieter eines Fernverkehrstari-
fes im Falle einer nahezu unregulierten Monopolstellung. Derzeit wird lediglich durch
die Deutsche Bahn AG ein bundesweit gültiger Fernverkehrstarif angeboten.
Als Regulierungsmechanismus könnte die Verpflichtung des Anbieters eines Fernver-
kehrstarifes auf Aufnahme des Neubetreibers zu den bei Ausschreibung festgelegten
Konditionen oder der Aufbau eines betreiberneutralen Fernverkehrstarifes angewen-
det werden.
Beispiel: Marschbahn, vgl. Kapitel 4.2, Seite 253.
Die oben genannten Diskriminierungspotentiale des Incumbent zu Lasten von Wettbewer-
bern in SPNV-Ausschreibungsverfahren können im Bereich der Fahrpreistarife wie folgt zu-
sammengefasst werden:
Der Betreiber des Verkehrsangebotes und der Vertriebsinfrastrukturbetreiber sind
Konkurrenten und es existieren keine klaren und diskriminierungsfreien Regelun-
gen für die Nutzung von Vertriebsinfrastruktur und Einnahmeaufteilungsverfahren
bei Gemeinschaftstarifen.
Der Konkurrent hat einen wesentlichen Einfluss auf die Festlegung der Tarife
und/oder das Einnahmeaufteilungsverfahren im Verbund und/oder im Fernver-
kehrstarif. Im Bereich des Fernverkehrstarifes resultiert dies häufig zum Beispiel
aus einem nur geringen Anteil am Fahrgelderlös aus Fernverkehrstarifen.
Auf einer Bahnstrecke konkurrieren mehrere Betreiber von SPNV-Verkehrsangebo-
ten (was die Kalkulierbarkeit ohne hinreichende Daten einschränkt).
Auf einer Bahnstrecke konkurrieren bezuschusste SPNV-Verkehrsangebote mit ei-
genwirtschaftlichen Fernverkehrsangeboten.
2.2 Angewandte Methodik
Vor dem Hintergrund der aktuellen politischen Debatte in der Schweiz sind gesicherte Er-
kenntnisse als Diskussionsgrundlage von hoher Bedeutung. Eine Fundierung mit validem
Datenmaterial ist deshalb sowohl in quantitativer wie in qualitativer Hinsicht unabdingbar.
Aus diesem Grunde erscheint es zunächst sinnvoll, eine Gesamtanalyse des deutschen SPNV-
Marktes zur Ableitung von Erkenntnissen für die Schweiz vorzunehmen. Allerdings muss
hierbei angemerkt werden, dass eine derartige Gesamtuntersuchung des deutschen SPNV-
Marktes der Vielschichtigkeit der Rahmenbedingungen vor Ort und den teilweise sehr unter-
schiedlichen Vergabepolitiken der insgesamt 34 deutschen SPNV-Aufgabenträger kaum hin-
reichend Rechnung tragen würde.

236
Aus diesem Grund erschien es ratsam, die Auswirkungen des SPNV-Ausschreibungs-
wettbewerbs anhand von zwei als exemplarisch einzustufenden Fallbeispielen aufzuzeigen.
Betrachtet werden deshalb im Folgenden die Vergabeverfahren der Marschbahn in Schles-
wig-Holstein und der Odenwaldbahn in Hessen. Die Darstellung wird jeweils ergänzt um Er-
gebnisse weiterer ausgewählter Verfahren in den Bundesländern Schleswig-Holstein und
Hessen.
Die betrachteten Bundesländer Schleswig-Holstein und Hessen nehmen ihrerseits eine füh-
rende Position in der wettbewerblichen Vergabe von SPNV-Leistungen in Deutschland ein.
Dabei werden in den beiden Ländern unterschiedliche Vergabepolitiken verfolgt:
Die LVS Landesweite Verkehrsservice Gesellschaft Schleswig-Holstein mbH (LVS),
zuständig für die Durchführung von SPNV-Ausschreibungen im Land Schleswig-
Holstein, verfolgt eine Vergabepolitik, die sich auszeichnet durch: Eher funktionale
Vergaben, die bevorzugte Verwendung von Nettoverträgen sowie die Nutzung der
Option der Wiedereinsatzgarantie der Fahrzeuge zur Reduzierung des Fixkostenri-
sikos (angewendet bei der Ausschreibung der Marschbahn).
Der Rhein-Main-Verkehrsverbund GmbH (RMV), zuständig für die Durchführung
von SPNV-Ausschreibungen im Rhein-Main Gebiet, verfolgt eine Vergabepolitik, die
sich auszeichnet durch: Eher konstruktive Vergaben, Bruttoverträge sowie Nutzung
des Instruments Fahrzeugpool zur Reduzierung des Restwertrisikos (sofern zur
Verhinderung von Markteintrittsbarrieren nötig).
Da diese Vergabephilosophien, abgesehen vom Umgang mit dem Restwertrisiko im Bereich
der Fahrzeuge, als exemplarisch für die beiden in Deutschland existierenden Hauptrichtun-
gen angesehen werden können, dürfte die Betrachtung von zwei Nahverkehrsräumen den
Bedeutungsgehalt der Untersuchung gegenüber einer einzelnen Betrachtung erhöhen. Die
beiden Nahverkehrsräume weisen darüber hinaus unterschiedliche Verkehrs- und Unterneh-
mensstrukturen auf:
LVS: Neben Pendlerverkehr im (ländlichen) Regionalverkehr von und nach Ham-
burg gibt es einen hohen Anteil touristischer Verkehre; bislang sind verschiedene
Aktivitäten privater und öffentlicher Betreiber zu beobachten.
RMV: Es besteht ein hoher Anteil an Pendlerverkehr im (suburbanen) Regionalver-
kehr von und nach Frankfurt am Main; bislang sind primär Bahnunternehmen mit
öffentlichem Hintergrund als Betreiber aktiv.
Auch diese Rahmenbedingungen dürften den Bedeutungsgehalt der Betrachtung unterstüt-
zen, da hierdurch die Auswirkungen des Ausschreibungswettbewerbs unter den Bedingungen
unterschiedlicher Vergabephilosophien in verschiedenen Nahverkehrsräumen betrachtet wer-
den können.

237
Um für die vorliegende Darstellung von Fallbeispielen eine möglichst hohe Qualität der Da-
tenbasis zu erreichen, wurde für die Datenerhebung auf eine Kombination aus Datenrecher-
che und Durchführung von Experteninterviews zurückgegriffen. Für die Analyse wertete das
Expertenteam zunächst interne Datenbanken aus. Dabei flossen auch Erkenntnisse aus einer
Vielzahl von bereits existierenden Untersuchungen des deutschen SPNV-Marktes mit ein.15
Gleichzeitig wurden allgemein zugängliche quantitative wie qualitative Daten recherchiert
und ebenfalls ausgewertet. Verwandt wurden dabei nur Erkenntnisse abgeschlossener SPNV-
Vergabeverfahren, bei denen bereits eine Betriebsaufnahme erfolgt ist. Stichtag der Daten-
erhebung war der 30. Juni 2006.
Die auf diese Weise gewonnenen Erkenntnisse wurden durch Experteninterviews mit Aufga-
benträgern, Betreibern und externen Experten ergänzt und verifiziert.16 Ausgewählt wurden
Experten, die an den betrachteten Verfahren an führenden Positionen beteiligt waren und
gleichzeitig über eine tiefe Kenntnis der aktuellen Situation vor Ort verfügen. Die Interviews
wurden zum Teil vor Ort in den Büroräumen der Experten durchgeführt, zum Teil wurden die
Experten auch telefonisch befragt. Die Dauer der Interviews umfasste jeweils ungefähr zwei
Stunden.
Die Datenerhebung generierte zwei aggregierte Datensammlungen, jeweils eine für die Bun-
desländer Hessen und Schleswig-Holstein. Diese bildeten die Grundlage für die anschließen-
de Untersuchung der Fallbeispiele.
Um den spezifischen Besonderheiten der Marktorganisation im deutschen SPNV Rechnung zu
tragen, erforderte die Analyse der Fallbeispiele eine Betrachtung der Rahmenbedingungen
vor Ort. Unter Verwendung des Top-Down-Ansatzes wurden deshalb zunächst die Rahmen-
bedingungen und Ziele in beiden deutschen Bundesländern analysiert und der Ausgangslage
in der Schweiz gegenübergestellt.17
Für die Evaluation der Ausschreibungsergebnisse wurden erst einmal allgemein zugängliche
Daten analysiert. Anschließend wurden die Fallbeispiele in Schleswig-Holstein und Hessen
nach verschiedenen Kriterien untersucht. Hierzu gehörten die Entwicklung der Kosten des
SPNV aus Sicht der öffentlichen Hand, die Entwicklung der Angebotsqualität und der Innova-
tionstätigkeit unter Berücksichtigung der Kosten der Nutzer sowie die Auswirkungen des
Ausschreibungswettbewerbs auf die Arbeitsplätze und die Finanzen der Betreiber.
15 Exemplarisch seien hier erwähnt Holzhey und Tegner (2004), Bundesverband der Deutschen Industrie und Deutscher In-dustrie- und Handelskammertag (2005) und EU-Kommission (2005).
16 Eine Übersicht der Gesprächspartner findet sich im Anhang. 17 Die Interpretationen der Daten der Fallbeispiele erfolgte anschließend immer im Bewusstsein um die Besonderheiten der
spezifischen regionalen Rahmenbedingungen, wie zum Beispiel die unterschiedlichen Gesetzeslagen der beiden Bundeslän-der.

238
3 Ausgangslage und Ziele der betrachteten Aufgabenträger
Im Folgenden werden die verkehrlichen Charakteristika der Bundesländer Schleswig-Holstein
und Hessen erläutert und der Situation in der Schweiz gegenübergestellt. Darüber hinaus
werden die aus Sicht der Aufgabenträger mit dem Ausschreibungswettbewerb verfolgten
Ziele dargelegt.
3.1 Schleswig-Holstein
3.1.1 Ausgangslage
Schleswig-Holstein, das nördlichste Bundesland Deutschlands, hat 2,82 Mio. Einwohner und
eine Fläche von 15.762 km². Mit einer Bevölkerungsdichte von 179 Einwohnern pro km² gilt
es als Flächenland. Das SPNV-Streckennetz hat eine Länge von 1.165 km, wovon 273,4 km
elektrifiziert sind (circa 23 Prozent). Auf diesem Netz wurde im Jahr 2005 eine Verkehrsleis-
tung von circa 23,5 Mio. Zugkm erbracht.18
Die Anzahl der Fahrgäste beträgt im SPNV pro Jahr circa 32,7 Mio. (Zahlen des Jahres 2004,
ohne Berücksichtigung der Verkehrsleistungen von AKN und S-Bahn Hamburg). Im Modal-
Split hat der Verkehrsträger Eisenbahn (SPNV) einen im Vergleich zur Schweiz geringen, aber
für ein deutsches Flächenland nicht untypischen Anteil, wie Tabelle 1 zeigt:19
Tabelle 1: Modal-Split in Schleswig-Holstein
Verkehrsträger Anteil am Modal-Split (durchschnittlicher Tag, Zahlen des Jahres 2005)
Motorisierter Individualverkehr (Fahrer) 46,8 %
Motorisierter Individualverkehr (Mitfahrer) 13,9 %
zu Fuß 23,9 %
Fahrrad 9,9 %
Linienbusverkehr 3,7 %
Eisenbahn (SPNV) 1,6 %
U-Bahn 0,2 %
Quelle: Angaben der LVS, vgl. LVS (2006).
Für die Organisation des landesweiten ÖPNV (inkl. des SPNV) bedient sich das Land der LVS
Schleswig-Holstein Landesweite Verkehrsservicegesellschaft mbH (LVS), die am 4. Septem-
ber 1995 von den Kreisen, den kreisfreien Städten und dem Land Schleswig-Holstein gegrün-
18 Angaben der LVS, vgl. LVS (2006). 19 Quelle: LVS (2006) und omniphon GmbH (2005).

239
det wurde. Ihre Aufgaben nach dem ÖPNV-Gesetz Schleswig-Holstein sind die Planung und
Bestellung des SPNV sowie die Koordination mit dem übrigen ÖPNV im Land.20 Im SPNV
führt die LVS die Ausschreibungen im Auftrag des Landes durch. Wie Tabelle 7 auf Seite 301
im Anhang zeigt, hat die LVS bislang ein Volumen von insgesamt circa 18,7 Mio. Zugkm über
wettbewerbliche Verfahren vergeben, wobei einige Linien bereits das zweite oder das dritte
Mal vergeben wurden.21
Die Betreiberlandschaft in Schleswig-Holstein hat sich im Zuge der Ausschreibungen laufend
verändert. Zum Zeitpunkt der ersten Vergabe im Jahr 1998 waren in Schleswig-Holstein drei
SPNV-Betreiber aktiv (jeweils Betrieb von Verkehrsleistungen auf eigener Infrastruktur):
Die bundeseigene Deutsche Bahn AG mit ihren Töchtern Regionalbahn Schleswig-
Holstein und S-Bahn Hamburg GmbH, Hauptbetreiber der SPNV-Ver-
kehrsleistungen in Schleswig-Holstein,
Die AKN Eisenbahn AG (AKN - im Besitz der Bundesländer Schleswig-Holstein und
Hamburg sowie einiger Kleinaktionäre), Betreiber einiger regionaler Strecken im
nördlichen Hamburger Randgebiet,
Die Nordfriesische Verkehrsbetriebe AG (im Besitz des Landes Schleswig-Holstein,
des Kreises Nordfriesland sowie der Stadt Wyk auf Föhr), Betreiber eines einzelnen
Abschnitts zwischen Niebüll und Dagebüll.
Im Zuge des Ausschreibungswettbewerbs etablierten sich insgesamt drei neue Betreiber im
Land: Nord-Ostsee-Bahn GmbH (als Tochter von Veolia), Flex Verkehrs AG, an der auch die
Nordfriesische Verkehrsbetriebe AG beteiligt war (inzwischen Marktaustritt wegen Zahlungs-
unfähigkeit), und Hamburger Hochbahn AG (über das Joint-Venture „Nordbahn“ mit der
AKN). Die AKN gründete zusätzlich die Tochter „Schleswig-Holstein-Bahn“. Die SPNV-Sparte
der Nordfriesische Verkehrsbetriebe AG wurde zwischenzeitlich von der Norddeutschen Ei-
senbahngesellschaft GmbH (neg) – der regionalen Güterverkehrssparte der Luxemburgischen
Staatsbahn CFL – übernommen. Eine Übersicht der Betreiberstruktur zeigt Abbildung 1 auf
Seite 240.
Zum 30. Juni 2006 sind damit fünf SPNV-Betreiber direkt oder über Beteiligungen in Schles-
wig-Holstein engagiert. Der Anteil der Deutschen Bahn AG am Gesamtmarkt hat sich im Zeit-
20 Zum rechtlichen Hintergrund vgl. § 2 des Gesetzes über den öffentlichen Personennahverkehr in Schleswig-Holstein. 21 Bereits zwei Mal wurden zwei kleinere Linien vergeben, bei denen man sich aufgrund eines zu knappen Zeitraumes bis zur
notwendigen Betriebsaufnahme nur für ein nicht voll transparentes Verfahren entschieden hatte. Daten für einen Vergleich der Ergebnisse liegen nicht vor.
Insgesamt drei Mal wurde die Strecke des FLEX (I, II, III) vergeben. Der erste Betreiber musste Insolvenz anmelden. Auf-grund der „Gefahr im Verzuge“ konnte lediglich das Instrument der Preisanfrage für einen zeitlich begrenzten Betrieb für die zweite Vergabe genutzt werden. Daran anschließend wurde ein ordentliches Vergabeverfahren vorbereitet und durchge-führt, wie Tabelle 7 auf Seite 301 im Anhang zeigt. Wie Wewers (2004, S. 48 ff.) zeigt, blieb der erforderliche Zuschussbe-darf der zweiten und dritten Vergabe, trotz Anstieg gegenüber dem offensichtlich unterkalkulierten ersten Angebot, erheb-lich unter den ursprünglich geforderten Zuschüssen des Altbetreibers. Die Insolvenz des ersten Betreibers ist der bislang einzige derartige Fall im deutschen SPNV-Ausschreibungswettbewerb. Aufgrund der fehlenden Repräsentativität wurde auf eine vertiefte Darstellung im Rahmen dieser Studie verzichtet.

240
ablauf reduziert. Er betrug 1996 circa 87 Prozent und reduzierte sich bis zum 30. Juni 2006
auf circa 57 Prozent. Da sich die insgesamt bestellte Verkehrsleistung jedoch um circa
25 Prozent erhöht hat, reduzierte sich die von der Deutschen Bahn AG in Schleswig-Holstein
erbrachte Verkehrsleistung in Zugkm lediglich um 18 Prozent.
Abbildung 1: SPNV-Betreiber in Schleswig-Holstein 2006
Quelle: LVS Schleswig-Holstein Landesweite Verkehrsservicegesellschaft mbH.
An dieser Stelle sei angemerkt, dass bislang in allen Fällen der Betrieb von Verkehrs-
leistungen ohne Betrieb der Infrastruktur ausgeschrieben wurde. Altbetreiber der Strecken
war in allen Fällen die Deutsche Bahn AG über ihre regionale Tochter Regionalbahn Schles-
wig-Holstein, weshalb der Infrastrukturbetreiber auf allen bislang ausgeschriebenen Strecken
die DB Netz AG als Tochter der Deutschen Bahn AG ist.22
22 Angaben von Herrn Wewers, Geschäftsführer der LVS.

241
3.1.2 Ziele23
Die Nutzung des Ausschreibungswettbewerbs ist kein Selbstzweck. Vielmehr verfolgt die öf-
fentliche Hand bei der Anwendung dieses Instruments bestimmte Ziele. Die im Zuge des
schleswig-holsteinischen Ausschreibungswettbewerbs verfolgten Ziele haben sich laut Herrn
Wewers im Zeitablauf etwas verändert.
Am Anfang waren allein die Ziele „Senkung des Zuschussbedarfs des SPNV“ und „Steigerung
der Angebotsqualität und der Fahrgastanzahl“ von Bedeutung, wie Tabelle 2 unten zeigt.
Bedingt durch die politische Diskussion haben die Ziele “Profitabler Betrieb“ und „Sicherung
der Arbeitsplätze“ an Bedeutung gewonnen. Auch der finanzielle Aspekt selbst spielt inzwi-
schen eine stärkere Rolle.
Tabelle 2: Mit Ausschreibungswettbewerb verfolgte Ziele der öffentlichen Hand in Schleswig-Holstein – Einschätzung von Herrn Wewers, LVS
Prozentuale Gewichtung der Ziele zu Beginn der Ausschrei-
bungsphase im Jahr 1996
Prozentuale Gewichtung der Ziele zum 30.06.2006
Senkung des Zuschussbedarfs im SPNV
50 % 60 %
Steigerung und Sicherung der Angebotsqualität und der Fahrgastanzahl
50 % 20 %
Profitabler Betrieb 0 % 10 %
Sicherung der Arbeitsplätze 0 % 20 %
Quelle: Eigene Darstellung auf Basis der Angaben von Herrn Wewers, LVS.
Dass die in Tabelle 2 genannten Ziele auch erreicht werden konnten, zeigten die Ergebnisse
einer vom Schleswig-Holsteinischen Landtag veröffentlichten Untersuchung zu den ersten
drei bis 2001 durchgeführten Vergabeverfahren (Verfahren Netz Nord, Verfahren Heide -
Büsum und Verfahren Neumünster – Bad Oldesloe). Diese erreichten trotz einer gestiegenen
Qualität Einsparungen für die öffentliche Hand von jeweils 4,35 Mio. Euro (circa
6,88 Mio. CHF24), 776.938 Euro (circa 1,23 Mio. CHF) und 1,53 Mio. Euro (circa
2,43 Mio. CHF) jährlich. Das Land konnte damit im Durchschnitt zwischen 10 bis 20 Prozent
der Kosten einsparen.25
Ermutigt durch diese Ergebnisse, setzte das Land Schleswig-Holstein bereits frühzeitig als
eines der wenigen Bundesländer in Deutschland konsequent auf die Vergabe aller SPNV-
Verkehrsleistungen im Wettbewerb. Hierfür wurde im Jahr 2001 ein Wettbewerbskonzept
23 Angaben von Herrn Wewers, Geschäftsführer der LVS. 24 Zum Umrechnungskurs: 1 Euro = 1,585 CHF. 25 Vgl. Pressemitteilung des Landes Schleswig-Holstein, veröffentlicht in nah-sh – Nahverkehr für Schleswig-Holstein, am
01.01.2002, Die Welt vom 11.02.2002 sowie Landtag Schleswig-Holstein (2001, S. 8 ff.). Vgl. auch die Veröffentlichung des damaligen Landeswirtschaftsministers zum Thema: Rohwer (2002).

242
bekannt gegeben. Dieses sieht vor, innerhalb von zehn Jahren alle Verkehrsleistungen suk-
zessive auszuschreiben. Das Wettbewerbskonzept des Landes teilt die Bahnstrecken in
Schleswig Holstein in fünf Teilnetze ein (vgl. Abbildung 2 unten).
Abbildung 2: Teilnetze für den Wettbewerb in Schleswig-Holstein
Quelle: LVS Schleswig-Holstein Landesweite Verkehrsservicegesellschaft mbH.
Das Wettbewerbskonzept benennt weiterhin in einem „Zeitplan Wettbewerb“ den Zeitpunkt
der Vergabe und der Betriebsaufnahme der jeweiligen Netze (vgl. Abbildung 3, Seite 243).
Auch die Größe der Netze in Zugkm und weitere Charakteristika wurden allgemein zugäng-
lich gemacht.26
26 Vgl. LVS (2003, S. 70).

243
Abbildung 3: Zeitplan Wettbewerb
Quelle: LVS Schleswig-Holstein Landesweite Verkehrsservicegesellschaft mbH (helle Balken: Ausschreibung und Vergabe, dunkle Balken: Vertragslaufzeit, umrandete Balken: Anschlussverträge nach neuer Ausschreibung).
Durch die frühzeitige Bekanntgabe des Ausschreibungskonzepts und der wesentlichen Cha-
rakteristika der Netze wurde und wird allen interessierten SPNV-Betreibern Gelegenheit ge-
geben, sich auf die einzelnen Ausschreibungen mit dem entsprechend nötigen Vorlauf vorzu-
bereiten.
Von den bislang in Schleswig-Holstein in Ausschreibungen vergebenen und bezuschlagten
Netzen stellt das Netz West („Marschbahn“) das größte und betrieblich komplexeste Netz
dar. Es ist mit einer Streckenlänge von 273 km und circa 4,2 Mio. Zugkm pro Jahr eines der
bislang größten vergebenen Netze in Deutschland überhaupt. Auf der als Hauptstrecke ein-
zustufenden Linie zwischen Hamburg und Westerland verkehren im Wesentlichen dieselbe-
triebene Expresszüge sowie zusätzlich einige Regionalbahnen. Die europaweite Bekanntma-
chung im EU-Amtsblatt erfolgte am 4. Juni 2002. Dabei wurde ein Verkehrsvertrag über zehn
Jahre mit der Option auf eine Verlängerung ausgeschrieben. Drei im Bundesland ansässige
SPNV-Betreiber entschlossen sich zur Angebotsabgabe.27 Der Zuschlag wurde am 30. Ju-
ni 2003 an die Nord-Ostsee-Bahn (Veolia Gruppe) erteilt. Diese Vergabe wird im Rahmen
einer Fallstudie in Kapitel 4.2, Seite 253 näher betrachtet.
27 Vgl. LVS (2003, S. 71). sowie Bekanntmachung im Supplement zum Amtsblatt der Europäischen Gemeinschaften vom 04.06.2002 (S 106-08375) und LVS (2002). Vgl. außerdem Pressemitteilung der LVS vom 20.12.2002.

244
3.2 Hessen
3.2.1 Ausgangslage
Im Jahr 2005 wurden im SPNV in Hessen knapp 963 Mio. Fahrgäste von Bahnunternehmen
mit Sitz in Hessen befördert,28 davon 640 Mio. Fahrgäste im RMV. Auf den SPNV (S-Bahn
und Regionalverkehr) im RMV entfielen im Jahr 2005 circa 12 Mio. Personenkilometer
(Pkm).29
Aufgabenträger des öffentlichen Personennahverkehrs (ÖPNV) in Hessen sind im Sinne des
ÖPNV-Gesetzes des Landes Hessen30 die Landkreise, die kreisfreien Städte und die Gemein-
den mit mehr als 50.000 Einwohnern. Sie haben in Selbstverwaltung für die Planung, die
Organisation und die Finanzierung des ÖPNV auf ihrem Gebiet zu sorgen.
Um die regionale Koordination der Aufgaben möglichst effizient zu erfüllen, haben sich die
Aufgabenträger beziehungsweise die lokal für die Nahverkehrsorganisationen zuständigen
Institutionen mit dem Land Hessen in überregionalen Verkehrsverbünden zusammen-
geschlossen. In Hessen sind dies der Rhein-Main-Verkehrsverbund (RMV), der Nordhessische
Verkehrsverbund (NVV) sowie für den südhessischen Landkreis Bergstraße der Verkehrsver-
bund Rhein-Neckar (VRN). Die Verkehrsverbünde sind verantwortlich für:
Bestellung der SPNV-Leistungen,
Festlegung des Verbundtarifs,
Abschluss von Vereinbarungen über die Anerkennung von Verbundtarifen, Über-
gangstarifen und landesweit gültigen Tarifen,
Abschluss von Vereinbarungen über Vertrieb und Marketing,
Aufstellung von Regelungen über die Einnahmenaufteilung sowie deren Umset-
zung,
Durchführung von Verkehrserhebungen und Erstellung von Nachfrageanalysen.
Die Verkehrsverbünde RMV und NVV tragen als Besteller und Verantwortliche für den Ver-
bundtarif das Erlösrisiko des SPNV im Verbund. So erhält der RMV alle Fahrgeldeinnahmen
im SPNV und bezahlt die Leistung der SPNV-Unternehmen auf der Grundlage von fest defi-
nierten Budgets im Rahmen der Verkehrsverträge, die als Bruttoverträge ausgestaltet sind.
Das Bundesland Hessen zählt neben Niedersachsen, Rheinland-Pfalz und Schleswig-Holstein
zu den Liberalisierungsbefürwortern im SPNV. Dabei nimmt Hessen eine Vorreiterrolle in
28 Vgl. Statistisches Landesamt Hessen (2006). 29 Interview mit Herrn Achenbach, Geschäftsbereichsleiter Bestell-Management im RMV. 30 Vgl. Gesetz über den öffentlichen Personennahverkehr in Hessen (2005).

245
Deutschland ein. Bereits im Jahr 1997 wurde die erste öffentliche Ausschreibung von SPNV-
Leistungen durchgeführt. Seither wurden und werden sukzessive immer mehr Leistungen im
Wettbewerb vergeben: Man spricht vom so genannten „hessischen Weg“ des geordneten
Übergangs in den Wettbewerb.31
Im Jahr 2004 bekräftigte das Land per Erlass die bis dahin verfolgte Praxis des Ausschrei-
bungswettbewerbs. Ende des Jahres 2005 verabschiedete Hessen ein neues ÖPNV-Gesetz,
welches die strikte Trennung von Aufgabenträgern und Verkehrsunternehmen nach dem
Besteller-Ersteller-Prinzip vorsieht. Zusätzlich beinhaltet es ein Bonus-Malus-System, durch
welches Anreize für eine Verbesserung der Qualität geschaffen werden sollen. Damit setzt
Hessen im Vergleich zu den anderen Bundesländern am deutlichsten auf den Wettbewerb im
SPNV, aber auch im ÖPNV insgesamt. Neben Qualitätsverbesserungen verspricht sich das
Land vor allem eine effizientere Leistungserstellung sowie ein innovatives Leistungsangebot.
Die bislang ausgeschriebenen SPNV-Verkehre sind in Tabelle 8 im Anhang auf Seite 75 dar-
gestellt.
Die Betreiberlandschaft hat sich in Hessen seit 1996 gewandelt. Zum Zeitpunkt der ersten
Vergabe waren in Hessen vier SPNV-Betreiber aktiv (jeweils Betrieb von Verkehrsleistungen
auf eigener Infrastruktur):
DB Regio AG,
Hessische Landesbahn GmbH,
Westerwaldbahn GmbH,
Kahlgrundbahn.
Folgende SPNV-Unternehmen sind in Hessen derzeit (per 30. Juni 2006)
unternehmerisch tätig:
cantus Verkehrsgesellschaft mbH (Konsortium der Hamburger Hochbahn AG und
der Hessischen Landesbahn GmbH),
DB Regio AG,
Erfurter Industriebahn GmbH (kleinere Verkehrsleistungen in Hessen, Leitung der
Vergabe durch das Land Thüringen),
HellertalBahn GmbH (Konsortium der Westerwaldbahn GmbH, der Kreisbahn Sie-
gen-Wittgenstein GmbH und der Hessischen Landesbahn GmbH),
Hessische Landesbahn GmbH,
Regionalbahn Kassel GmbH (Regiotram-Leistungen),
31 Vgl. auch: Hessisches Ministerium für Wirtschaft, Verkehr und Landesentwicklung (2004).

246
Vectus Verkehrsgesellschaft mbH (Konsortium der Hessischen Landesbahn GmbH
und der Westerwaldbahn GmbH),
VIAS GmbH (Konsortium aus Verkehrsgesellschaft Frankfurt mbH und Rurtalbahn
GmbH).
Auf dem hessischen Markt sind damit einige neue Betreiber zu Lasten der DB Regio AG (die
einige Verkehrsleistungen verloren hat) eingetreten. Auch die Kahlgrundbahn verlor durch
den Nicht-Gewinn der Ausschreibung von Verkehrsleistungen auf ihrer eigenen Infrastruktur
SPNV-Verkehre. Nahezu alle bislang in den hessischen Markt eingetretenen Betreiber waren
Betreiber mit öffentlichem Hintergrund.
3.2.2 Ziele
Das hessische ÖPNV-Gesetz bestimmt, dass Verkehrsleistungen durch die Besteller in Verga-
beverfahren vergeben werden.32 Gemäß Regionalem Nahverkehrsplan des RMV wird das Ziel
eines geordneten Übergangs in den Wettbewerb durch Ausschreibung von Teilnetzen ver-
folgt. Der Regionale Nahverkehrsplan 2004 bis 2009 dokumentiert den Wettbewerbsfahrplan
des RMV, den der RMV-Aufsichtsrat bereits im Vorfeld der Nahverkehrsplanerstellung am 18.
März 2003, parallel zur Billigung des Abschlusses des großen Verkehrsvertrags mit der DB
Regio AG, beschlossen hatte.33 Es werden für den Zeitraum 2003 bis 2014 genau beschrie-
bene Teilnetze gebildet und das Zieldatum der Betriebsaufnahme nach erfolgter Ausschrei-
bung genannt (für eine Übersicht vgl. Tabelle 9 und Abbildung 10 im Anhang ab Seite 302).
Wie der Ausschreibungsfahrplan aus dem Jahr 2003 zeigt, sollen der Regionalverkehr bis
2013 und der S-Bahn Verkehr bis 2015 vollständig im Wettbewerb vergeben werden. Insge-
samt wird damit allein der RMV ein Volumen von 31,8 Mio. Zugkm bis zum Jahr 2011 in den
Wettbewerb gegeben. Eine aktuelle Übersicht der im gesamten Bundesland Hessen zu ver-
gebenden Verkehrsleistungen (Verkehrsverbünde RMV, Nordhessischer Verkehrsverbund und
Verkehrsverbund Rhein-Neckar) zeigt die Abbildung 4 auf Seite 247 (mit Bezug auf das Da-
tum der Betriebsaufnahme).
32 Vgl. Gesetz über den öffentlichen Personenverkehr in Hessen. 33 Bahnreport 3/03, Paderborn 2003, S. 62

247
Abbildung 4: Zu vergebende Verkehrsleistungen im SPNV in Hessen mit Betriebsaufnahme 2005 bis 2015
0 0
9901.441
2.571
4.070
1.038
4.525
1.994
512
6.458
0
11.804
0
2.000
4.000
6.000
8.000
10.000
12.000
14.000
2003 2004 2005 2006 2007 2008 2009 2010 2011 2012 2013 2014 2015
Betriebsaufnahme zum Fahrplanjahr
Tsd.
Zug
km
Leistung in Tausend Zugkilometern
Quelle: Achenbach (2006, S. 179)
Benanntes Ziel der Ausschreibungen ist die Erbringung der Verkehrsleistungen zu den ge-
ringst möglichen Kosten für die Allgemeinheit. Dies soll durch optimale Umlaufbildung, ein
integriertes Gesamtlinienkonzept und durch mittelstandfreundliche Losgrößenbildung unter-
stützt werden.34 Hinsichtlich der Ziele, die der RMV im Zuge der Nutzung des Ausschrei-
bungswettbewerbs verfolgt, lässt sich laut Herrn Achenbach nur eine leichte Veränderung
seit Beginn der Ausschreibungsphase beobachten, wie Tabelle 3 zeigt.
Tabelle 3: Mit Ausschreibungswettbewerb verfolgte Ziele der öffentlichen Hand im RMV (Hessen) – Einschätzung von Herrn Achenbach
Prozentuale Gewichtung der Ziele zu Beginn der Ausschrei-
bungsphase im Jahr 1997
Prozentuale Gewichtung der Ziele
zum 30. Juni 2006
Senkung des Zuschussbedarfs im SPNV
90 % 85 %
Steigerung und Sicherung der Angebotsqualität und der Fahrgastanzahl
10 % 10 %
Profitabler Betrieb 0 % 0 %
Sicherung der Arbeitsplätze 0 % 5 %
Quelle: Eigene Darstellung auf Basis der Angaben von Herrn Achenbach, RMV.
34 Vgl. RMV, Regionaler Nahverkehrsplan 2004 bis 2009, Hofheim 2004.

248
Zu Beginn der Ausschreibungsphase im Jahr 1997 stand insbesondere die Senkung des Zu-
schussbedarfs, aber auch die Steigerung der Angebotsqualität im Vordergrund. Inzwischen
wird auch der Sicherung von Arbeitsplätzen eine Bedeutung bei der Vergabe von SPNV-
Leistungen beigemessen. Im Rahmen der Fallstudie für Hessen werden diese Ziele anhand
des RMV-Teilnetzes 19.1 „Odenwald“ näher betrachtet (vgl. Abbildung 5 auf Seite 249). Die-
ses umfasst die Strecken der RMV-Linie 64: Frankfurt-Hanau-Wiebelsbach-Heubach-Erbach
und 65: Darmstadt-Wiebelsbach-Heubach-Erbach-Eberbach mit 1,84 Mio. Zugkm pro Jahr
und 210 km Streckenlänge, wovon gegenüber dem Status quo 240.000 neue Zugkm er-
bracht werden. 2007 ist eine weitere Leistungsausweitung um 130.000 Zugkm vorgesehen.
Den Zuschlag für das wirtschaftlichste Angebot für den Betrieb der Odenwaldbahn ab dem
Fahrplanjahr 2006 hat der RMV am 10. Januar 2005 der Bietergemeinschaft Verkehrs-
gesellschaft Frankfurt mbH/Rurtalbahn GmbH (neue Firmenbezeichnung: VIAS GmbH) er-
teilt. Die Verkehrsgesellschaft Frankfurt mbH ist ein öffentliches Unternehmen im Besitz der
Stadt Frankfurt. Die Rurtalbahn GmbH ist ein regionales privat-öffentliches Unternehmen
(74,9 Prozent im Besitz der privaten R.A.T.H. GmbH; 25,1 Prozent im Besitz des Kreises
Düren).

249
Abbildung 5: Liniennetz der Odenwaldbahn
Quelle: Rhein-Main Verkehrsverbund (RMV).

250
Die Vergabe der Verkehrsleistung erfolgte nach § 3 Nr. 1 Abs. 3, 4 der Verdingungsordnung
für Leistungen, Teil A (VOL/A) im freihändigen Verfahren mit vorgeschaltetem öffentlichen
Teilnahmewettbewerb. Um die Teilnahme haben sich sieben TUs beworben, von denen fünf
die Anforderungsbedingungen erfüllten und die Ausschreibungsunterlagen erhalten haben.
Der Altbetreiber DB Regio AG hat kein den Ausschreibungsunterlagen entsprechendes Ange-
bot vorgelegt. Stattdessen hat die DB Regio AG ein Verhandlungsangebot unterbreitet, das
aber für die Vergabestelle nicht annehmbar war.
3.3 Im Vergleich: Ausgangslage der Schweiz
Die Schweiz ist gekennzeichnet durch ihre zentrale geographische Lage in der Mitte Europas.
Ein Großteil der Landesfläche von 41.285 km² wird durch die Hochgebirgszüge der Alpen
und deren Ausläufer eingenommen. Die überwiegende Mehrheit der rund 7,48 Mio. Einwoh-
ner konzentriert sich auf die Großstädte sowie auf den etwas flacheren nordwestlichen Teil
des Landes. Die Bevölkerungsdichte beträgt 181,1 Einwohner pro km² und entspricht damit
in etwa der von Schleswig-Holstein (179 Einwohner pro km²). Das schweizerische Eisen-
bahnnetz hat eine Länge von etwa 5.024 km und ist bis auf wenige Kilometer (0,65 Prozent
des Gesamtnetzes)35 vollständig elektrifiziert.36 Hierauf wurde im Jahr 2004 eine Verkehrs-
leistung von circa 187 Mio. Zugkm erbracht.37
Pro Jahr werden auf der Schiene circa 336,19 Mio. Fahrgäste befördert,38 woraus sich eine
Verkehrsleistung von 14,9 Mrd. Personenkilometern ableitet.39 Der Modal-Split in der Schweiz
setzt sich wie folgt zusammen:40
35 Stand 1997. Quelle: Bundesamt für Statistik der Schweiz: Eisenbahnen: Eigentumslänge http://www.bfs.admin.ch/bfs/portal/de/index/themen/verkehr_und_nachrichtenwesen/uebersicht/blank/analysen__berichte/oev/02.html, Download vom 27.09.2006.
36 Bundesamt für Statistik der Schweiz, http://www.bfs.admin.ch/bfs/portal/de/index/themen/verkehr_und_nachrichtenwesen/uebersicht/blank/wichtigste_kennzahlen.html, Download vom 27.09.2006.
37 Bundesamt für Statistik der Schweiz, Eisenbahnen: Betriebsleistungen Bundesamt für Statistik BFS, http://www.bfs.admin.ch/bfs/portal/de/index/themen/ ver-kehr_und_nachrichtenwesen/uebersicht/blank/analysen__berichte/oev/02.html, Download vom 27.09.2006.
38 Zahlen des Jahres 2004, ohne Mehrfachzählung. 39 Gesamter Eisenbahnverkehr in der Schweiz, Zahlen des Jahres 2004. Quelle: Bundesamt für Statistik der Schweiz, su-b-11-
OeV-zr-e-vp, http://www.bfs.admin.ch/bfs/portal/de/index/themen/verkehr_und_nachrichtenwesen/uebersicht/blank/analysen__berichte/oev/02.html, Download vom 27.09.2006.
40 Vgl. Bundesamt für Verkehr (Schweiz, 2003).

251
Tabelle 4: Modal-Split in der Schweiz
Verkehrsträger Anteil am Modal-Split (durchschnittlicher Tag, Zahlen des Jahres 2005)
Motorisierter Individualverkehr (Fahrer) 50,2 %
Motorisierter Individualverkehr (Mitfahrer) 19,3%
zu Fuß 4,6 %
Fahrrad 2,5 %
Bahn 13,6 %
Postauto 0,5 %
Tram/Bus 3,6 %.
Andere 5,6 %
Quelle: Bundesamt für Verkehr der Schweiz (2003).
Ähnlich der Aufgabenträgerstruktur in Deutschland, wo die Verantwortung der Organisation
des abgeltungspflichtigen Verkehrs im Rahmen der Regionalisierung auf die einzelnen Bun-
desländer übertragen wurde (vgl. Kapitel 2.1.2, Seite 230), wird die Bestellung der Verkehre
im Schweizer SPNV von den Kantonen verantwortet. Sie beauftragen die Eisenbahnunter-
nehmen mit der Erbringung des regionalen Nahverkehrs. Das wichtigste und größte Ver-
kehrsunternehmen sind die Schweizerischen Bundesbahnen (SBB), mit einem Marktanteil
von 87 Prozent am gesamten Personenverkehr.41 Die übrigen 13 Prozent werden durch circa
27 konzessionierte TUs betrieben.
Die Schweiz hat mit der Revision des Eisenbahngesetzes (EBG) und durch die Verordnung
über Abgeltungen, Darlehen und Finanzhilfen nach Eisenbahngesetz (ADFV) das Eisenbahn-
wesen neu geordnet. Die Zielstellung umfasste vor allem eine (zumindest teilweise) Regiona-
lisierung der Aufgaben- und Ausgabenverantwortung auf die Kantone, die verbindliche Fest-
legung von Leistungsangebot und Abgeltung im Vorwege einer Vereinbarung sowie die Stär-
kung der unternehmerischen Verantwortung der Transportunternehmung.
Der weitere Reformprozess wurde kürzlich mit der Ablehnung der Bahnreform 2 durch das
Parlament unterbrochen. Die zurückgewiesenen Gesetzesentwürfe werden derzeit durch das
Bundesamt für Verkehr der Schweiz (BAV) überarbeitet.
Die Vergabe der Stecken im Schienenpersonenverkehr erfolgte bisher in der ganzen Schweiz
über Direktvergaben mit einer Laufzeit von unter fünf Jahren. Die bislang einzige Ausschrei-
bung im Personenschienenverkehr der Schweiz betraf die Cityvogel-Linie zwischen Zürich –
Weinfelden – Konstanz (Regionalexpress). Sie wurde jedoch 1999 abgebrochen.42
41 Vgl. Die SBB bewegt die Schweiz, Departement für Umwelt, Verkehr, Energie und Kommunikation, http://www.uvek.admin.ch/themen/00681/00685/index.html?lang=de, Download vom 27. September 2006.
42 Vgl. Ecoplan (2005, S. 58).

252
4 Evaluation der Ausschreibungsergebnisse
Um eine Einordnung der betrachteten Fallbeispiele in den deutschen Gesamtmarkt zu ermög-
lichen, wird im Folgenden ein kurzer Überblick über die Marktentwicklung im deutschen
SPNV aus Sicht der Betreiber seit der Liberalisierung Mitte der Neunziger Jahre gegeben.
Anschließend erfolgt eine vertiefte Betrachtung der Fallbeispiele Schleswig-Holstein und Hes-
sen und eine Analyse der Auswirkungen des Ausschreibungswettbewerbs anhand der Stre-
cken „Marschbahn“ und „Odenwaldbahn“.
4.1 Allgemeine Marktentwicklung im deutschen SPNV
Der SPNV-Markt in Deutschland umfasste im Jahr 2005 632 Mio. Zugkm. Die Verkehrsleis-
tung betrug 41,8 Mrd. Pkm.43 Seit dem Beginn der Regionalisierung im Jahr 1996 nahm die
Verkehrsleistung damit um circa 17 Prozent zu (Ausgangswert 540 Mio. Zugkm). Die Anzahl
der Fahrgäste stieg im gleichen Zeitraum um mehr als 30 Prozent.44
Der SPNV-Markt hat sich aufgrund der föderalen Länderzuständigkeit in den einzelnen Län-
dern höchst unterschiedlich entwickelt. Im Jahr 2004 variierte der Marktanteil der Wettbe-
werbsbahnen in den Ländern in Zugkilometern zwischen zwei Prozent (Brandenburg und
Sachsen-Anhalt) und 30 Prozent (Schleswig-Holstein).45 Ursache hierfür sind neben unter-
schiedlichen Ausschreibungserfolgen des Incumbent Deutsche Bahn AG auch die sehr unter-
schiedlichen Ausschreibungsquoten der Länder. Bis zum Jahr 2005 waren bundesweit circa
21 Prozent der in Deutschland gefahrenen Zugkilometer in Ausschreibungen vergeben wor-
den.
Die Entwicklung der Marktanteile von Wettbewerbsbahnen und der Deutschen Bahn AG in
Zugkilometern und Personenkilometern innerhalb der letzen fünf Jahre zeigt Tabelle 5.
Tabelle 5: Marktanteile der Wettbewerber46 im SPNV in Deutschland
2001 2002 2003 2004 2005
Zugkm 8,2 % 8,6 % 9,9 % 11,9 % 13,2 %
Pkm 3,2 % 3,9 % 4,3 % 6,3 % 6,8 %
Quelle: Deutsche Bahn AG (2006, S. 18).
43 Vgl. Deutsche Bahn AG (2006, S. 18). 44 Vgl. BAG SPNV (2006). 45 Vgl. Deutsche Bahn AG (2005, S. 16). 46 Nicht der Deutschen Bahn AG zugehörige Unternehmen.

253
Von den im Zeitraum 1995 bis 2005 ausgeschriebenen SPNV-Leistungen konnten die Betrei-
ber folgende Marktanteile gewinnen:
Abbildung 6: In SPNV-Ausschreibungen in Deutschland gewonnene Marktanteile in Prozent (Basis 131 Mio. Zugkm)
3,94,24,37,6
17,2
17,6
45,1
DB Regio Hamburger HochbahnHessische LandesbahnArrivaAbellioVeoliaAndere Bahnen
Quelle: Deutsche Bahn AG (2005, S. 16).
Die Deutsche Bahn AG konnte über ihre Tochter DB Regio AG von dem bislang in den Wett-
bewerb gestellten circa 21 Prozent der SPNV-Verkehrsleistungen einen wesentlichen Teil für
sich gewinnen. Sie besitzt derzeit insgesamt einen Marktanteil von circa 87 Prozent an allen
SPNV-Leistungen in Deutschland.
4.2 Fallbeispiel Schleswig-Holstein
Schleswig-Holstein hat sich bei der Vergabe von Verkehrsleistungen überwiegend für die
Nutzung von Nettoverträgen entschieden. Hierbei trägt das Fahrgelderlösrisiko, im Unter-
schied zu Hessen, der Betreiber. Im Folgenden wird die Vergabe der Verkehrsleistungen auf
der Marschbahn betrachtet, die einführend in Kapitel 3.1.2 (ab Seite 241) bereits erläutert
wurde. Der hier vergebene Nettoanreizvertrag enthält umfangreiche Qualitätsanreize und
Bonus-Malus-Zahlungen für Über- oder Untererfüllung von Qualitätsparametern. Der Vertrag
ist als eher funktional ausgerichtet einzuordnen (vgl. zur Ausschreibungsstruktur auch Kapitel
2.1.2, Seite 230).
Darüber hinaus hat man sich bei dieser Vergabe zum ersten Mal im deutschen SPNV für die
Aufnahme der Option einer Wiedereinsatzgarantie für die vom Betreiber eingesetzten Fahr-
zeuge in die Vergabebedingungen entschieden: Das Land garantiert hierbei die Weiterver-
wendung der Fahrzeuge nach dem Ende der Vertragslaufzeit. Der Kapitaldienst gegenüber
254
dem von dem Betreiber ausgewählten Finanzier (Bank) wird für die gesamte Lebensdauer
der Fahrzeuge von in der Regel circa 25 Jahren garantiert, unabhängig davon, ob der Betrei-
ber zum Ende der Vertragslaufzeit wechselt oder nicht. Die Kalkulation von Angeboten konn-
te damit ohne das Restwertrisiko der Fahrzeuge vorgenommen werden, wodurch für poten-
zielle Bewerber diese Markteintrittsbarriere reduziert wurde.47
4.2.1 Kosten des Angebots in Relation zu den Kosten der Ausschreibung
Aus Sicht des Staates ist der effiziente Einsatz von öffentlichen Mitteln, gerade vor dem Hin-
tergrund der teilweise prekären Situation der öffentlichen Haushalte, von besonderer Bedeu-
tung. Ziel ist deshalb die Sicherung der als notwendig erachteten Verkehrsleistung zu den
geringsten Kosten für die Allgemeinheit.48 Im Folgenden soll deshalb geprüft werden, wie
sich die Kosten des Verkehrsangebotes im Ausschreibungswettbewerb entwickeln. Um eine
ganzheitliche Analyse zu ermöglichen, sind hierbei auch die Kosten der Durchführung des
Ausschreibungsprozesses selbst zu berücksichtigen.
4.2.1.1 Kosten des Verkehrsangebotes
Die Kosten der Erbringung der gewünschten Verkehrsleistungen bestehen für die öffentliche
Hand im Wesentlichen in der Gewährung eines Zuschusses zum Betrieb. Dieser ist naturge-
mäß im Rahmen eines Nettovertrags – im Vergleich zu den in Hessen verwendeten Brutto-
verträgen – um den Betrag geringer, den der Betreiber als Fahrgelderlös auf dem ausge-
schriebenen Netz bei Angebotsabgabe erwartet. Dieser im Ausschreibungsverfahren ermittel-
te Zuschussbedarf wird im Folgenden betrachtet.
An dieser Stelle sei erwähnt, dass aus Sicht der Betreiber die Kostenstruktur im deutschen
SPNV wesentlich durch Infrastrukturkosten (Gebühren für Trassen und Bahnhöfe an den
Netzbetreiber) determiniert wird (vgl. Abbildung 7, Seite 255). Diese Kosten haben laut Lae-
ger (2004, S. 88) regelmäßig einen Anteil von 45 Prozent an den Gesamtkosten.
47 Angaben von Herrn Tegner, der das Konzept der Wiedereinsatzgarantie für die LVS entwickelte. 48 Vgl. Blankart (2002, S. 32) sowie Werner und Schaaffkamp (2003, S. 1 ff.).

255
Abbildung 7: Regelmäßige Kostenstruktur deutscher SPNV-Betreiber
Infrastruktur Trassen / Stationen
45%
Wagnis- und Gewinnzuschlag
3%
Verwaltung3%
Vertrieb2%
Fahrzeugreinigung1%
Wartung Fahrzeuge9%
Finanzierung Fahrzeuge
18%
Leerfahrten / Abstellgleise
0%
Energie6%
Personal13%
Infrastruktur Trassen / Stationen Personal
Energie Leerfahrten / Abstellgleise
Finanzierung Fahrzeuge Wartung Fahrzeuge
Fahrzeugreinigung Vertrieb
Verwaltung Wagnis- und Gewinnzuschlag
Quelle: Laeger (2004, S. 88).
Die Infrastruktur wird regelmäßig von der DB Netz AG, einer Tochter der Deutschen Bahn
AG, bereitgestellt. Sofern das Verfahren nicht von der DB Regio AG als Tochter der Deut-
schen Bahn AG gewonnen wurde, muss der Ausschreibungsgewinner damit die Infrastruktur
des Wettbewerbers nutzen. Um im Bereich der Infrastrukturkosten, zum Beispiel durch Erhö-
hung der regionalen Trassenpreise, ein entsprechendes Diskriminierungspotenzial zu Lasten
von Wettbewerbern der Deutschen Bahn AG zu verhindern, werden die Infrastrukturkosten
direkt an den Aufgabenträger durchgereicht und liegen außerhalb des Risikobereichs des
Betreibers. Hinsichtlich der Energiekosten, die laut Laeger in der Regel circa sechs Prozent
der Kosten betragen, bestehen ebenfalls nur begrenzte Einflussmöglichkeiten zur Kostensen-
kung.49 Damit können sich mögliche Produktivitätssteigerungen lediglich auf die restlichen
circa 49 Prozent der Kosten eines Betreibers konzentrieren.
Der Aufgabenträger LVS Schleswig-Holstein nutzt, wie oben bereits erwähnt, bei der Vergabe
von SPNV-Leistungen ausschließlich Nettoverträge. Hierbei geben die interessierten Unter-
nehmen ein Angebot für den ihrer Ansicht nach erforderlichen Nettozuschuss zum Betrieb
49 Herr Wewers, LVS, schätzt den Anteil der Infrastrukturkosten (Trassen und Bahnhöfe) auf 60 Prozent und den Anteil der Energiekosten auf 20 Prozent am gesamten Umsatz. Hinweis: Die Gebühren divergieren abhängig von der Streckenart (zum Beispiel Haupt- und Nebenstrecken) und der Klassifizierung des Bahnhofs.

256
des ausgeschriebenen Netzes ab, bei dem sie sowohl das Kosten- als auch das Fahrgelder-
lösrisiko tragen. Das Optimierungspotenzial des Betreibers erstreckt sich damit neben der
Steigerung der Produktivität auch auf die Gewinnung zusätzlicher Fahrgäste. Bei dem unter-
suchten Fallbeispiel Marschbahn erhält der Betreiber in den ersten zwei Jahren der Messung
dieser Steigerungen als zusätzlichen Anreiz noch einen Bonus für Fahrgaststeigerungen, der
von der Anzahl der zusätzlich realisierten Personenkilometer abhängig ist.50 Damit erhöht
sich der Optimierungsanreiz für den Betreiber weiter, und zwar in Abhängigkeit vom Potenzi-
al zur Fahrgaststeigerung.
Die Ergebnisse der Ausschreibung der Verkehrsleistungen der Marschbahn sind aus Sicht des
Landes Schleswig-Holstein positiv (vgl. auch Abbildung 8, Seite 257). Das Land generiert
Einsparungen im Zuschussbedarf von:51
Circa 44 Prozent bezogen auf den gesamten Zuschussbedarf;
Circa 14 Mio. Euro (circa 22,19 Mio. CHF) pro Jahr;
Circa 140 Mio. Euro (circa 221,90 Mio. CHF) bezogen auf die gesamte
Vertragslaufzeit von zehn Jahren.
Der Zuschussbedarf je Zugkm betrug vor Ausschreibung 7,48 Euro [circa 11,86 CHF]. Er liegt
künftig bei circa 4,37 Euro [circa 6,93 CHF].52
Es sei darauf hingewiesen, dass die Nord-Ostsee-Bahn die Vergabe nicht durch besonders
niedrige Produktionskosten gewann, sondern über die erwarteten Fahrgelderlöse. Die Nord-
Ostsee-Bahn hatte in ihren Berechnungen zwar eine nahezu identische Kostenstruktur zu
Grunde gelegt wie der Wettbewerber Regionalbahn Schleswig-Holstein (regionale SPNV-
Tochter der Deutschen Bahn AG), jedoch mit um 30 Prozent höheren Fahrgelderlösen kalku-
liert.53
50 Vgl. LVS Schleswig-Holstein Landesweite Verkehrsservicegesellschaft mbH (2002, S. 37). Hinweis: Der Bonus wird bei Fahr-gastverlusten zu einem Malus umgekehrt.
51 Alle Zahlen und Prozentangaben: Vgl. Holzhey und Tegner (2004, S. 20). 52 Die Einsparungen im Preis je Zugkm betragen circa 42 Prozent. Nach Auskunft von Hr. Wewers wurden nach Ausschreibung
seitens der LVS einzelne Mehrverkehre bestellt, was hier offensichtlich zu veränderten Werten im Preis je Zugkm geführt hat.
53 Vgl. Deutsche Bahn AG (2004, S. 11) sowie Holzhey und Tegner (2004, S. 20). Dies bestätigte Herr Carstensen, Nord-Ostsee-Bahn, im Experteninterview.

257
Abbildung 8: Zuschussbedarf vor und nach Ausschreibungswettbewerb auf der Marschbahn
11,86
6,93
0
2
4
6
8
10
12
Zusc
huss
beda
rf je
Zug
km in
CH
F.
Altbetreiber Neubetreiber
Quelle: Eigene Darstellung in Anlehnung an die Daten von Holzhey und Tegner (2004).
Da die Möglichkeiten zur Fahrpreisanhebung begrenzt sind (vgl. Kapitel 4.2.3, Seite 265),
traut sich der neue Betreiber offensichtlich eher zu, neue Kunden zu gewinnen und die
Schwarzfahrerquote auf nahe Null zu senken. Eine Anfechtung der Vergabe durch die Regio-
nalbahn Schleswig-Holstein unter Verweis auf „Dumping“, auch im Bereich der Kalkulation
der Fahrgelderlöse, wurde von der Vergabekammer Kiel schließlich zurückgewiesen.54
Wie vom Land gefordert, hatte die NOB ein zweites Angebot für die Anfahrt des Hamburger
Hauptbahnhofs abgegeben (die Linie endet derzeit im Bahnhof Hamburg-Altona). Dies hätte
zu einer weiteren Kostensenkung um circa 1 Mio. Euro (circa 1,59 Mio. CHF) pro Jahr ge-
führt.55 Allerdings konnten sich die Nord-Ostsee-Bahn und der Infrastrukturbetreiber DB Netz
AG nicht über den dafür nötigen Trassenzugang einigen. Auch eine eigenwirtschaftliche Wei-
terführung einiger Zugpaare im Fernverkehr Richtung Berlin und Köln scheiterte bislang an
einer fehlenden Einigung. Hintergrund ist, das aus Sicht des Infrastrukturbetreibers die Ka-
pazitäten im Hamburger Hauptbahnhof und zum Teil auch auf der Hamburger Verbindungs-
bahn (Streckenabschnitt vor dem Hamburger Hauptbahnhof) erschöpft sind. Nach derzeitiger
Regelung des Trassenzugangs hat der Altbetreiber zunächst das Recht auf Weiterbetrieb.
Eine Priorisierung erfolgte in diesem Zusammenhang bislang nicht, was die Notwendigkeit
einer hinreichenden Regulierung unterstreicht.56
54 Vgl. Anders und Kramer (2003, S. 71 f.). Herr Wewers weist darauf hin, dass die LVS auf Basis der im Angebot genannten Preise für zusätzliche Leistungen im Nachgang zum Vergabeverfahren tatsächlich einige zusätzliche Leistungen direkt be-stellt hat, wodurch der heutige Zuschussbedarf je Zugkm insgesamt leicht über dem ursprünglich angebotenen liegt.
55 Vgl. Bahn-Report 03/04, S. 35. Die zusätzliche Einsparung ist trotz höherer Infrastrukturkosten durch eine stärkere zu erwartende Nachfragesteigerung (aufgrund der Vermeidung von zusätzlichen Umsteigevorgängen) erzielbar.
56 Vgl. Berschin (2005, S. 29 ff.) zu den Hintergründen und einem möglichen Diskriminierungs-Potenzial durch den Incumbent Deutsche Bahn AG. Die Rechtslage des Trassenzugangs ist derzeit gerichtlich vermutlich noch nicht abschließend geklärt. Der Entwicklungsprozess ist durch die interdependenten Entscheidungen von Gerichten, zuständiger Regulierungsbehörde (Bundesnetzagentur) und dem Handeln des Infrastrukturbetreibers gekennzeichnet. Die Entwicklung zeigt, dass alle Betei-ligten für eine reibungslose Zusammenarbeit zunächst Erfahrungen mit ihren neuen Rollen sammeln müssen.

258
4.2.1.2 Kosten der Durchführung einer Ausschreibung
Um eine ganzheitliche Analyse zu ermöglichen sind auch die Kosten der Durchführung des
Ausschreibungsprozesses selbst zu berücksichtigen. Bei näherer Betrachtung lassen sich auf
Aufgabenträgerseite verschiedene Kostenblöcke identifizieren:
Allgemeine Regiekosten:
Planungskosten (zum Beispiel Erstellung Nahverkehrsplan),
Abstimmungskosten mit Politik und Verwaltung über Umfang des Angebotes (Definiti-
on der Ausgestaltung der Daseinsvorsorge),
Qualitätsvorgaben und -kontrollen,
Sonstige verbundspezifische Aufgaben (zum Beispiel Fortentwicklung Tarif).
Vergabekosten:
Kosten der Vorbereitung von öffentlichen Vergabeverfahren,
Kosten der Durchführung von öffentlichen Vergabeverfahren,
Alternativ: Verhandlungskosten bei Direktvergabe.
Vertragscontrolling:
Laufende Kosten der Vertragskontrolle,
Kosten der Vertragsdurchsetzung.
Es ist festzustellen, dass verschiedene Kostenblöcke unabhängig von der Entscheidung für
oder gegen ein Ausschreibungsverfahren anfallen. Hierzu gehören insbesondere die allge-
meinen Regiekosten, die für den ÖPNV insgesamt erbracht werden und damit nicht im ur-
sächlichen Zusammenhang mit der Ausschreibung von Verkehrsleistungen stehen. Diese
Kosten werden im Folgenden nicht mit in die Betrachtung einbezogen.
Die Kosten der Vergabe von Verkehrsleistungen sowie die Kosten des Vertragscontrollings
fallen sowohl bei einer Direktvergabe als auch bei einer Ausschreibung der Verkehrsleistung
auf Seiten der öffentlichen Hand an. Eine Aufnahme dieser Kosten erscheint damit zunächst
nur sachgerecht in Höhe der Mehr- oder Minderkosten der Ausschreibung im Vergleich zur
Direktvergabe. Da für eine qualifizierte Abgrenzung keine hinreichende Datenbasis vorliegt,
werden zur Vereinfachung im Folgenden die Kosten der Vergabe und des Vertragscon-
trollings (Verwaltungskosten) in einer reinen Bruttobetrachtung aufgenommen, ohne die
Mehr- oder Minderkosten der Ausschreibung im Vergleich zur Direktvergabe im Verhand-
lungswege abzugrenzen. Diese Betrachtung ist methodisch zunächst nicht korrekt. Sie er-
laubt aber eine Einschätzung über die maximal zu erwartenden Mehrkosten einer Ausschrei-
bung im Vergleich zu einer Situation mit Verhandlung und anschließendem Vertragscontrol-
ling des individuell verhandelten Vertrags, bei der (nahezu) keine Verwaltungskosten anfal-
len.

259
Von Seiten der Betreiber wurden die Kosten für die Angebotserstellung und die laufenden
Abstimmungskosten mit dem Aufgabenträger ermittelt. Die bei größeren Erfahrungswerten
und einer zunehmenden Standardisierung von Vergabeverfahren und Vertragscontrolling zu
erwartende Kostendegression wurde dabei nicht berücksichtigt. Mit in die Betrachtung einbe-
zogen wurden allerdings die Kosten im Zusammenhang mit dem Übergang in den Wettbe-
werb (zum Beispiel bei der Erstellung des Ausschreibungskonzepts).
Folgende Kosten je Vergabeverfahren ergeben sich damit (jeweils Kosten für interne Mitar-
beiter und externe Gutachter):
Auf Seiten des Aufgabenträgers LVS:57
Einmalige direkte Kosten im Zusammenhang mit dem Übergang in den Wettbewerb
auf Seiten des Aufgabenträgers vor Beginn der ersten Ausschreibung (z.B Erstellung
von Ausschreibungskonzepten, Netzbildung): Circa 80.000 Euro (circa 126.800 CHF),
Kosten für die Vorbereitung und Durchführung der Ausschreibung je Verfahren: Circa
100.000 Euro (circa 158.500 CHF),
Kosten der Vertragssteuerung und des Vertragscontrollings je vergebenes Netz und
Jahr: Circa 50.000 Euro (circa 79.250 CHF).
Auf Seiten der Unternehmen:58
Direkte Kosten auf Seiten des Betreibers im Zusammenhang mit dem Übergang in
den Wettbewerb: Circa 25.000 Euro (circa 39.625 CHF),
Kosten der Angebotserstellung je Verfahren: Circa 100.000 Euro bis 200.000 Euro
(circa 158.500 – 317.000 CHF),
Kosten der laufenden Abstimmung mit dem Aufgabenträger je Netz und Jahr:
Circa 15.000 bis 75.000 Euro (circa 23.775 – 118.875 CHF).
Die Kosten der Durchführung des Vergabeverfahrens und des laufenden Vertragscontrollings
betragen damit für die Marschbahn bei einem Zehn-Jahres-Vertrag für die öffentliche Hand
insgesamt circa 600.000 Euro (circa 951.000 CHF) zuzüglich der einmaligen Kosten für das
Ausschreibungskonzept. Dies entspricht circa 0,4 Prozent der auf dieser Strecke realisierten
Einsparungen.
Die Bieter preisen die Gesamtkosten der Angebotserstellung sowie die Kosten der laufenden
Abstimmung mit dem Aufgabenträger nach Auskunft der befragten Experten in ihre Angebo-
te mit ein. Im Falle eines erfolgreichen Angebotes erfolgt also eine indirekte Erstattung der
Kosten der Angebotserstellung.
57 Angaben von Herrn Wewers, LVS. 58 Angaben von Herrn Carstensen, Nord-Ostsee-Bahn, Herrn Reh, Regionalbahn Schleswig-Holstein
und Herrn Michelmann, Flex Verkehrs AG.

260
4.2.2 Entwicklung der Angebotsqualität und der Innovationen
4.2.2.1 Entwicklung der Angebotsqualität insgesamt
Das Qualitätsniveau ist durch die Übernahme der Verkehrsleistungen durch den neuen
Betreiber Nord-Ostsee-Bahn nach Ansicht fast aller für die Marschbahn befragten Experten
insgesamt deutlich gestiegen.59 Probleme ergaben sich jedoch in den ersten Wochen nach
Betriebsaufnahme im Bereich der Pünktlichkeitsquote. Diese betrug in den ersten zwei Wo-
chen nach Betriebsaufnahme 72,8 Prozent, einschließlich einiger Zugausfälle.60 Ähnlich den
Problemen der Deutschen Bahn AG beim Einsatz einiger neu konzipierter Fahrzeuge in der
jüngeren Vergangenheit, litt der Betreiber unter massiven Problemen mit dem teilweise neu
entwickelten Fahrzeugmaterial, was zu erheblichen Anfangsschwierigkeiten führte.
Da der Zuschlag circa 2,5 Monate nach Ablauf der ursprünglichen Bindefrist erteilt wurde,
verkürzte sich die Betriebsvorbereitungszeit von ursprünglich gut 29 Monaten dement-
sprechend. Dies hat nach Ansicht einiger Experten mit Blick auf die Neuartigkeit des Fahr-
zeugkonzepts zu zusätzlichen Problemen geführt. Zudem gilt die Strecke als betrieblich sehr
anspruchsvoll. Außer dem Altbetreiber besitzen die im deutschen Markt tätigen Unternehmen
bislang keine Erfahrungswerte in diesem Komplexitätsbereich, weshalb hier womöglich das
betriebliche Risiko von Seiten des Neubetreibers zumindest etwas unterschätzt wurde.
Dieses betriebliche Risiko ist für den Betreiber finanziell insofern relevant, als dass neben den
Effekten aus einem Nettovertrag (massiver Imageschaden und reduzierte Fahrgelderlöse)
und den direkten Kosten aus der Beseitigung der Probleme (unter anderem Einsatz von 30
zusätzlichen Mitarbeitern) Vertragsstrafen auftreten. Im Fall der Marschbahn musste die
Nord-Ostsee-Bahn allein im ersten Monat eine Einbehaltung der Zuschüsse aufgrund der
betrieblichen Probleme von circa 450.000 Euro (circa 713.250,- CHF) hinnehmen.
Nach einer kurzen Phase mit Anlaufschwierigkeiten läuft der Betrieb inzwischen reibungslos
und voll vertragsgemäß (die Pünktlichkeitsquoten im Januar und Februar 2006 liegen bei
93,5 Prozent und 96,2 Prozent, vgl. Abbildung 9, Seite 261).
59 Lediglich nach Ansicht von Herrn Reh, Deutsche Bahn AG Tochter Regionalbahn Schleswig-Holstein, hat sich die Qualität deutlich verschlechtert (er verweist hier insbesondere auf die Art des Umgangs mit betrieblichen Problemen).
60 Vgl. Pressemitteilung der LVS vom 04.01.2006 und vom 08.02.2006.
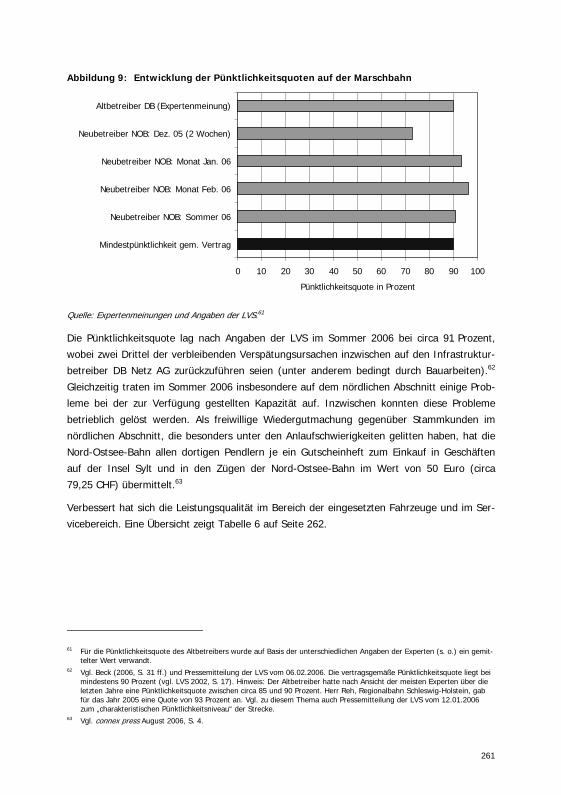
261
Abbildung 9: Entwicklung der Pünktlichkeitsquoten auf der Marschbahn
0 10 20 30 40 50 60 70 80 90 100
Mindestpünktlichkeit gem. Vertrag
Neubetreiber NOB: Sommer 06
Neubetreiber NOB: Monat Feb. 06
Neubetreiber NOB: Monat Jan. 06
Neubetreiber NOB: Dez. 05 (2 Wochen)
Altbetreiber DB (Expertenmeinung)
Pünktlichkeitsquote in Prozent
Quelle: Expertenmeinungen und Angaben der LVS.61
Die Pünktlichkeitsquote lag nach Angaben der LVS im Sommer 2006 bei circa 91 Prozent,
wobei zwei Drittel der verbleibenden Verspätungsursachen inzwischen auf den Infrastruktur-
betreiber DB Netz AG zurückzuführen seien (unter anderem bedingt durch Bauarbeiten).62
Gleichzeitig traten im Sommer 2006 insbesondere auf dem nördlichen Abschnitt einige Prob-
leme bei der zur Verfügung gestellten Kapazität auf. Inzwischen konnten diese Probleme
betrieblich gelöst werden. Als freiwillige Wiedergutmachung gegenüber Stammkunden im
nördlichen Abschnitt, die besonders unter den Anlaufschwierigkeiten gelitten haben, hat die
Nord-Ostsee-Bahn allen dortigen Pendlern je ein Gutscheinheft zum Einkauf in Geschäften
auf der Insel Sylt und in den Zügen der Nord-Ostsee-Bahn im Wert von 50 Euro (circa
79,25 CHF) übermittelt.63
Verbessert hat sich die Leistungsqualität im Bereich der eingesetzten Fahrzeuge und im Ser-
vicebereich. Eine Übersicht zeigt Tabelle 6 auf Seite 262.
61 Für die Pünktlichkeitsquote des Altbetreibers wurde auf Basis der unterschiedlichen Angaben der Experten (s. o.) ein gemit-telter Wert verwandt.
62 Vgl. Beck (2006, S. 31 ff.) und Pressemitteilung der LVS vom 06.02.2006. Die vertragsgemäße Pünktlichkeitsquote liegt bei mindestens 90 Prozent (vgl. LVS 2002, S. 17). Hinweis: Der Altbetreiber hatte nach Ansicht der meisten Experten über die letzten Jahre eine Pünktlichkeitsquote zwischen circa 85 und 90 Prozent. Herr Reh, Regionalbahn Schleswig-Holstein, gab für das Jahr 2005 eine Quote von 93 Prozent an. Vgl. zu diesem Thema auch Pressemitteilung der LVS vom 12.01.2006 zum „charakteristischen Pünktlichkeitsniveau“ der Strecke.
63 Vgl. connex press August 2006, S. 4.

262
Tabelle 6: Qualitätsveränderung Marschbahn
Merkmale der Leistungs-qualität des Altbetreibers
Zusätzliche Leistungs-qualität des Neubetrei-bers, ausgelöst durch vertragliche Vorgaben
Zusätzliche Leistungs-qualität des Neubetrei-bers, ausgelöst durch Eigeninitiative des Neu-betreibers
Lokomotiven Baujahre 1972-1978 Baujahre Ende der neunzi-
ger Jahre, überholt 2004
sowie zusätzlich neuwerti-
ge Lokomotiven
Reisezugwagen Baujahre 1968-1975, reno-
viert Ende der neunziger
Jahre
Behindertengerechte Neu-
fahrzeuge
vergrößerter Sitzabstand
Züge mit Fernverkehrsni-
veau:
vollständig Niederflur und
geräuscharm
Klimaanlage
Radio am Platz
Klapptische und Leseleuch-
ten
Laptopsteckdosen in der
1. Klasse
Luftfederung der
Fahrzeuge
Service Regelmäßig ein Zugbeglei-
ter in lokbespannten Zü-
gen
Zugbegleiterquote
in Triebwagen unbekannt
Reservierungsmöglichkeit
Einführung einer Kunden-
garantie (zum Beispiel Er-
stattung des halben Fahr-
preises bei Verspätungen
von mehr als 30 Minuten)
Mindestvorgaben Zugbe-
gleiterquote im Verkehrs-
vertrag: 75 % auf Express-
zügen, 100 % nach 21:00
Uhr
keine Vorgabe bei Trieb-
wagen
Taktverkehr
Catering
Zugbegleiterquote von
100 % auf Expresszügen
und circa 25 % bei Trieb-
wagen
Fahrkartenverkauf im Zug
und an eigenen Automaten
an den Bahnhöfen
regionales Marketing mit
Tourismusagenturen
Etablierung eines zusätzli-
chen Haltepunktes in
Glückstadt und einer ei-
genwirtschaftlichen Ex-
pressbuslinie Glückstadt-
Brunsbüttel als Zubringer
zum Zug
Intensive Schwarz-
fahrerkontrolle
Quelle: Eigene Darstellung.64
64 Für Angaben vgl. Pressemitteilung der Nord-Ostsee-Bahn vom 16.06.2005 und vom 19.09.2005, Bahn-Report 3/06, S. 42, LVS (2002, S. 27), Lumma (2006, S. 3) sowie Angaben von Herrn Wewers, Herrn Reh, Herrn Berschin und Herrn Carsten-sen.

263
Da im Fall der Marschbahn von Seiten des Aufgabenträgers die Kosten der Infrastruktur-
nutzung auch für eigenständige Mehrleistungen des Betreibers in Schleswig-Holstein voll
übernommen wurden, konnte die NOB über den Mindestumfang des Vertrags hinaus durch
entsprechende Ausnutzung der Umläufe circa sieben bis acht Prozent an zusätzlicher Ver-
kehrsleistung selbst anbieten. Die Anbindung von Berlin und Köln über eigenwirtschaftlich im
Fernverkehr weitergeführte Expresszüge wurde vom Betreiber in Aussicht gestellt, konnte
bislang jedoch aufgrund einer fehlenden Einigung mit dem Infrastrukturbetreiber DB Netz AG
nicht realisiert werden (vgl. Kapitel 4.2.1.1, Seite 254).
Die Anzahl der Fahrgäste hat sich nach Einschätzung von Herrn Carstensen, NOB, im ersten
halben Jahr trotz der aufgetretenen Probleme im Bereich der Pünktlichkeit um circa vier bis
fünf Prozent erhöht.65 Als sehr positiv hat sich seiner Ansicht nach die laufende Zusammen-
arbeit mit einem für die Strecke etablierten Streckenbeirat herausgestellt, da hier frühzeitig
Probleme und Wünsche von Seiten der Fahrgäste angesprochen wurden und mit dem
Betreiber und dem Aufgabenträger Lösungsmöglichkeiten erarbeitet werden können.66
Hinsichtlich der Sicherheit sieht Herr Wewers, LVS, keine Veränderung bei der Anzahl der
Unfälle im Zuge des Betreiberwechsels nach Ausschreibung der Verkehrsleistung. Hingewie-
sen wird auf die Zunahme der Sicherheit für Fahrgäste beim Ein- und Ausstieg durch aus-
fahrbare Trittstufen an den neuen, auf der Marschbahn eingesetzten Zügen.67
4.2.2.2 Innovationen auf Initiative des Aufgabenträgers
Als Instrumente zur Regulierung der Qualität stehen der LVS der Landesnahverkehrsplan
(mit Vorgaben für alle SPNV-Betreiber in Schleswig-Holstein), der jeweilige Verkehrsvertrag
und freiwillige Absprachen zur Verfügung. Diese Einwirkungsmöglichkeiten nutzt der Aufga-
benträger insbesondere bei Qualitätskriterien, bei denen die vom Aufgabenträger gewünsch-
te Qualität für den Betreiber wirtschaftlich nicht erbringbar ist. Die zu erwartenden zusätzli-
chen Fahrgelderlöse decken in diesen Fällen die zusätzlichen Kosten nicht.
Im Falle der Marschbahn (und bei allen sonstigen Verkehren) ordneten alle Experten die
Vorgabe der Verwendung von Neufahrzeugen und von behindertengerechten Toiletten im
Zug als eine zwingend nötige Vorgabe ein.
Herr Wewers, LVS, weist darauf hin, dass die LVS die Etablierung von Fahrgastrechten (zum
Beispiel Rückerstattungen bei Verspätungen) auf der Marschbahn-Strecke vorgegeben habe.
Dies hat im Anschluss zu einer freiwilligen Etablierung von Fahrgastrechten bei einem kon-
65 Da keine zuverlässigen Daten des Altbetreibers vorliegen sind diese Einschätzungen naturgemäß mit Unsicherheit behaftet. Gleichzeitig verteilt sich die Fahrgaststeigerung auf den unterschiedlichen Streckenabschnitten sehr unterschiedlich. Auf dem nördlichsten Teilabschnitt ist außerdem ein Teil der Fahrgaststeigerung auf externe Faktoren zurückzuführen.
66 Der Verkehrsvertrag schreibt die Teilnahme an diesem Beirat für den Betreiber vor (vgl. LVS 2002, S. 33 und S. 56), was aus Sicht von Herrn Carstensen aus Eigeninteresse des Betreibers aber nicht nötig sei.
67 Auch Herr Reh, Regionalbahn Schleswig-Holstein, sowie Herr Carstensen, Nord-Ostsee-Bahn, können keine Veränderung der Anzahl der Unfälle erkennen.

264
kurrierenden Betreiber in Schleswig-Holstein (Regionalbahn Schleswig-Holstein) geführt.68
Hier konnte also ein Impuls für eine Service-Innovation gesetzt werden, der im regionalen
Markt diffundierte.
Weitere nötige Vorgaben des Aufgabenträgers sind nach Ansicht der Experten die Vorgabe
von Taktverkehr, die Reaktivierung von Bahnhöfen sowie die Vorgabe einheitlicher Einstiegs-
höhen (was von Betreiberseite bei Neufahrzeugen als nicht notwendig erachtet wird). Laut
Herrn Reh, Regionalbahn Schleswig-Holstein, war die Initiative der LVS zur Etablierung eines
Qualitätsmanagmentsystems für alle Betreiber (dieses sieht insbesondere Bonus-Malus-
Zahlungen für einheitliche Qualitätsstandards vor) im Schleswig-Holsteinischen SPNV eben-
falls hilfreich. Herr Wewers weist in diesem Zusammenhang darüber hinaus auf die Vorgabe
zum Einbau von Automatischen-Fahrgast-Zählsystemen.
4.2.2.3 Innovationen auf Initiative des Betreibers
Der Neubetreiber realisierte verschiedene Innovationen zur Steigerung der Produktqualität
aus Sicht des Kunden. Zur Übernahme (beziehungsweise Adaption) einer Innovation eines
anderen Betreibers kam es dabei im Bereich des Catering-Services in Expresszügen der NOB,
welches zuvor bereits von der Regionalbahn Schleswig-Holstein eingeführt worden war.69
Laut Herrn Carstensen hat die NOB auf Eigeninitiative in jedem Steuerwagen Lage- und Stre-
ckenpläne sowie den Speiseplan des Catering in Blindenschrift ausgewiesen. Die Nutzung der
Instrumente Streckenbeirat und Kundengarantie/Fahrgastrechte werde, so Carstensen, der-
zeit für alle von Veolia in Deutschland betriebenen Verkehre diskutiert.
Die Aufstellung von zusätzlichen eigenen bedienerfreundlichen Verkaufsautomaten mit
Touch-Screen an Bahnhöfen reduziert für die NOB die an die Deutsche Bahn AG zu zahlen-
den Vertriebsprovisionen für den Verkauf von Fahrkarten. Zusätzlich erlaubt ein eigenes,
internetbasiertes Verkaufsportal den Verkauf von Nahverkehrsfahrkarten für dort angemelde-
te Reisebüros, Geschäfte und Fremdenverkehrseinrichtungen.70
Adaptiert wurde außerdem der Einsatz mobiler elektronischer Verkaufsgeräte für das Zugbe-
gleitpersonal, die als erste von der Flex Verkehrs AG in Schleswig-Holstein genutzt wurden.
Ebenso wurde die zunächst nur von der Flex Verkehrs AG genutzte Möglichkeit der Miete und
des Leasings von Fahrzeugmaterial auf der Marschbahnstrecke übernommen.71
Darüber hinaus werden weitere Innovationen im übrigen Schleswig-Holsteinischen SPNV
genannt. Beim Betreiber Regionalbahn Schleswig-Holstein werden im Bereich der Produktin-
novationen für ausgewählte Strecken folgende Punkte hervorgehoben: Fahrgastbegleitser-
vice für Menschen mit Behinderungen, Catering, Kooperationsverträge mit Freizeiteinrich-
68 Vgl. auch Bahn-Report 3/06, S. 42. 69 Angaben von Herrn Wewers. 70 Vgl. Pressemitteilung der Nord-Ostsee-Bahn vom 04.12.2005. 71 Angaben von Herrn Michelmann.

265
tungen im Rahmen eines eigenen Tagesfahrscheins (unter anderem reduzierter Eintritt) und
Pendlerreservierung in einem bestimmten Zug (adaptiert vom Vor-Betreiber Nord-Ostsee-
Bahn). Weiterhin wird die Regionalbahn Schleswig-Holstein im Zuge einer Zertifizierung des
Mutterkonzerns DB Regio AG derzeit hinsichtlich Qualität nach DIN ISO 9001 zertifiziert.
Im Bereich der Prozessinnovationen versuchte die NOB ihr Remanenzkostenrisiko (Restwert-
risiko bei fehlender Vertragsverlängerung nach zehn Jahren) auf dem bereits 1998 ausge-
schriebenen Netz Nord über die Fremdvergabe der Werkstattleistungen an einen externen
Betreiber zu reduzieren. Dieser Betreiber errichtete hierfür eine mobile Werkstatt, die nach
Auslaufen des Vertrags bei Nicht-Wiederbeauftragung abgebaut und an anderer Stelle für
einen anderen Betreiber wieder aufgebaut werden kann. Inzwischen hat sich die NOB jedoch
aus betriebsinternen Gründen für eine Eigenerbringung der Werkstattleistungen entschieden
und errichtete hierfür in Husum eine neue Werkstatt. Ob damit die Fremdvergabe von Werk-
stattleistungen grundsätzlich als nicht sinnvoll eingestuft werden kann, bleibt jedoch unklar.
4.2.3 Kosten der Nutzer
Im Fall der Marschbahn kommt ein Nettovertrag zur Anwendung. Dieser Verkehrsvertrag
sieht die verpflichtende Anwendung des Schleswig-Holstein-Tarifes und des HVV-Tarifes vor.
Darüber hinaus musste sich die NOB zur Anwendung eines nationalen Tarifsystems verpflich-
ten.72
Im Rahmen der Anwendung der Nahverkehrstarife bestehen kleinere Spielräume zur Ausges-
taltung. So kann das TU im Schleswig-Holstein-Tarif die Anzahl der Preisstufen zwischen ei-
nigen Verbindungen um eine Preisstufe erhöhen (was bislang auf der Marschbahn nicht er-
folgte). Die NOB ist jeweils Mitglied im Schleswig-Holstein-Tarif und im HVV-Tarif.
Da für das TU die Beeinflussbarkeit der Tarife von herausragender Bedeutung ist, soll dies
am Beispiel des Schleswig-Holstein-Tarifes im Folgenden kurz erläutert werden. Dieser Tarif
wird durch einen Unternehmensverbund aller betroffenen 47 Verkehrsunternehmen verant-
wortetet. Die Kapitalanteile der Unternehmen entsprechen den jährlichen Umsätzen der Un-
ternehmen im Bereich der Fahrgelderlöse. Die Gesellschafterversammlung entscheidet mit
Mehrheit der Stimmen und Kapitalmehrheit. Sie wählt einen Beirat aus vier Vertretern von
Bahnunternehmen und vier Vertretern von Busunternehmen. Dieser Beirat entscheidet
grundsätzliche Dinge im Bereich Tarif. Ihm obliegt das Initiativrecht für Tariferhöhungen.
Die endgültige Entscheidung über eine Tariferhöhung (und auch die Entscheidung über eine
Veränderung der Tarifstruktur) wird in einem so genannten gemeinsamen Ausschuss mit
qualifizierter Mehrheit (5 Stimmen) getroffen. In diesem gemeinsamen Ausschuss sitzen je-
weils drei gewählte Vertreter der Unternehmen und drei Vertreter der Aufgabenträger (unter
anderem ein Vertreter der LVS). Eine Tariferhöhung muss abschließend durch die zuständige
72 Vgl. LVS (2002, S. 39 ff.). Hinweis: Derzeit wird ein solches Tarifsystem lediglich von der DB AG angeboten.

266
Genehmigungsbehörde (hier das Schleswig-Holsteinische Ministerium für Wissenschaft, Wirt-
schaft und Verkehr) genehmigt werden.73 Damit hängt der Einfluss eines TU im Wesentlichen
vom bestehenden Umsatz innerhalb des Schleswig-Holstein-Tarifes ab. Allerdings bedarf jede
Zustimmung der Mehrheit der Stimmen, womit auch kleinere Unternehmen einen nicht zu
unterschätzenden Einfluss haben. Der Einfluss der Aufgabenträger ist ebenfalls gewahrt.
Gleichzeitig dürften sich in diesem System größere Tarifveränderungen für ein einzelnes TU
nur schwer durchsetzen lassen.
Im Bereich der Fernverkehrstarife stellt sich die Situation anders dar. Hier ist derzeit die
Deutsche Bahn AG der einzige Anbieter eines bundesweiten Fernverkehrstarifes im Eisen-
bahnverkehr. Für die Marschbahn konnte zwischen NOB und Deutscher Bahn AG bislang kei-
ne hinreichende Einigung hinsichtlich der Durchtarifierung erreicht werden. Deshalb ent-
schied sich die Nord-Ostsee-Bahn dazu, selbst einen Zuschlag von drei Euro (circa 4,76 CHF)
für die Anerkennung von Fernverkehrsfahrkarten der Deutschen Bahn AG zu verlangen, an-
statt dass dieser (wie sonst üblich) direkt in den Fernverkehrstarif der Deutschen Bahn AG
integriert wird. Dieser Zuschlag wird von dem Zugbegleitpersonal der NOB nun direkt im Zug
erhoben.74
Aufgrund der Nettovertragsgestaltung in einer betrieblichen Konkurrenzsituation mit dem
Incumbent Deutsche Bahn AG können im Fall der Marschbahn weitere Aktivitäten beobachtet
werden, die möglicherweise aus Sicht des Neubetreibers als diskriminierend einzustufen sind:
Angekündigte Einstellungen von konkurrierenden Fernverkehrsangeboten des Alt-
betreibers wurden nach dem Verlieren der Ausschreibung nicht umgesetzt. Die
Deutsche Bahn AG ist in der Lage, mit der Ausgestaltung des Fernverkehrsangebo-
tes die von der Nord-Ostsee-Bahn für den ausgeschriebenen lang laufenden Regi-
onalverkehr kalkulierte Nachfrage zu absorbieren.
Die Deutsche Bahn AG erkennt nun den Nahverkehrstarif in ihren parallel laufen-
den Fernverkehrszügen an. Dies war zum Zeitpunkt der Angebotsabgabe nicht ab-
sehbar (und wurde damit wahrscheinlich nicht einkalkuliert). Damit wird dem aus-
geschriebenen Regionalverkehr Nachfrage entzogen.
Die vorhandenen Vertriebsinfrastrukturen des Altbetreibers werden trotz des Aus-
schreibungsverlustes und des Aufbaus einer eigenen Vertriebsstruktur des Neu-
betreibers entlang der Strecke beibehalten. Die vergleichsweise hohen Vertriebs-
provisionen, die an die Deutsche Bahn AG zu zahlen sind, erhöhen die Vertriebs-
73 Angaben von Herrn von Aweyden, Tarifexperte der ZAST GmbH – Zentrale Abrechnungsstelle Schleswig-Holstein-Tarif. Vgl. auch Kooperationsvertrag betreffend der ZAST GmbH und Tarifanwendungs- und Kooperationsvertrag Schleswig-Holstein-Tarif vom 19.10.2005.
Eine ähnliche Regelung findet sich im HVV, wo der Tarifantrag des HVV durch die Genehmigungsbehörde (die Behörde für Stadtentwicklung und Umwelt des Hamburger Senates) zu genehmigen ist.
74 Nord-Ostsee-Bahn: Pressemitteilung vom 28.03.2006.

267
kosten des Ausschreibungsgewinners. Die zeitlich verzögerte Übermittlung der
Fahrgelderlöse erschwert die Liquiditätssicherung der NOB.
Ein weiterer wichtiger Aspekt ist aus Sicht eines Bieters die Abschätzbarkeit der Tarifergie-
bigkeit (zum Beispiel Anzahl der verkauften Einzelfahrscheine, Tages- und Gruppenfahrkar-
ten). Diese ist regelmäßig in hinreichend detaillierter Form lediglich vom Altbetreiber ein-
schätzbar, da nur dieser über eine ausreichende Datenbasis verfügt.
4.2.4 Auswirkungen auf Arbeitsplätze und Finanzen der Betreiber
4.2.4.1 Arbeitsplatzentwicklung
Nach Einschätzung von Herrn Wewers, LVS, ist die Arbeitsbelastung beim Neubetreiber
Nord-Ostsee-Bahn für die Beschäftigten höher als beim Altbetreiber DB Regio AG. Gleichzei-
tig mussten teilweise Arbeitnehmer des Altbetreibers ihren Arbeitsort wechseln, sofern sie
nicht in ein Beschäftigungsverhältnis bei der NOB wechselten. Die Anzahl der Beschäftigten
ist auf der Marschbahn im Bereich Verwaltung gesunken, im Bereich Fahrbetrieb in etwa
gleich geblieben und im Bereich Service (inkl. Catering) gestiegen. Insgesamt ist die Anzahl
der Arbeitsplätze nach Einschätzung aller für die Marschbahn befragten Experten in etwa
gleich geblieben, da auch der Altbetreiber bereits produktivitätssteigernde Maßnahmen ein-
geleitet hatte.
Die Nord-Ostsee-Bahn hat insbesondere für die Marschbahn eine neue Servicewerkstatt zur
Wartung der 90 Reisezugwagen, zwölf Diesellokomotiven und drei Triebwagen für
18 Mio. Euro (circa 28,53 Mio. CHF) aufgebaut. Hierdurch wurden am strukturschwachen
Standort Husum circa 50 neue Arbeitsplätze geschaffen. Insgesamt hat die Nord-Ostsee-
Bahn nach eigenen Angaben mit der Betriebsübernahme auf der Marschbahn einen Bedarf
von über 100 Arbeitskräften.75
Auf den Gesamtmarkt in Schleswig-Holstein bezogen rechnen die meisten für die Marsch-
bahn befragten Experten aufgrund der mit den Einsparungen finanzierten Mehrbestellungen
von Verkehrsleistungen mit einem insgesamt nahezu unveränderten Niveau in der Anzahl der
Arbeitsplätze. Zwar wurden Arbeitsplätze im Bereich des Verwaltungspersonals eingespart,
das Betriebs- und Servicepersonal wurde jedoch im Zuge der Mehrbestellung von Verkehrs-
leistungen erhöht.
Die NOB hat einen Tarifvertrag mit der Gewerkschaft Transnet abgeschlossen, die auch die
Tarifverhandlungen mit der Deutschen Bahn AG führt. Dennoch erfolgt durch den Neubetrei-
ber eine übertarifliche Bezahlung, um qualifiziertes Personal zu gewinnen (obwohl sich die
Marschbahn in einer strukturschwachen Region befindet). Die Entlohnung ist im Vergleich
75 Vgl. Pressemitteilungen der Nord-Ostsee-Bahn vom 16.12.2004 und vom 07.09.2005.

268
zum Altbetreiber nach Ansicht der befragten Experten um circa 10 Prozent gesunken.76 An-
zumerken bleibt, dass die Mitarbeiter der NOB im Vergleich zum Altbetreiber Deutsche Bahn
AG ein geringeres Durchschnittsalter aufweisen. Hierdurch wird vermutlich bereits ein erheb-
licher Kostenvorteil im Bereich der Tariflöhne erzielt, da diese mit zunehmendem Alter der
Beschäftigten automatisch ansteigen.
Für den Gesamtmarkt verwies die Landesregierung bereits 2001 darauf, dass die Einsparun-
gen vor allem auf optimiertem Personaleinsatz beruhen und das Lohn- und Gehaltszahlungen
durchweg auf geltenden Tarifverträgen basieren.77 Dennoch verabschiedete der Landtag im
Jahr 2003 ein Tariftreuegesetz, um ein zu starkes Absinken der Tarife zu verhindern. Dieses
sieht vor, dass öffentliche Aufträge im SPNV nur an Unternehmen vergeben werden dürfen,
die „das in Tarifverträgen vereinbarte Arbeitsentgelt“ zahlen.78
4.2.4.2 Finanzen der Betreiber
Die Einschätzung der Experten zur Profitabilität der Betreiber ist unterschiedlich. Für die
Marschbahn lässt sich eine Einschätzung zum Zeitpunkt des Abschlusses dieser Untersu-
chung (ein gutes halbes Jahr nach Betriebsaufnahme) noch nicht abgeben. Ein anfänglicher
Verlust liegt laut Herrn Reh, Regionalbahn Schleswig-Holstein, angesichts der betrieblichen
Probleme bei Betriebsaufnahme zumindest nahe.
Hinsichtlich der Marschbahn ist anzumerken, dass der Altbetreiber Regionalbahn Schleswig-
Holstein nach eigenen Angaben auf Basis vergleichbarer Kostenstrukturen wie der Gewinner
Nord-Ostsee-Bahn kalkuliert hatte. Allerdings hatte die Nord-Ostsee-Bahn eine stärkere Stei-
gerung der Fahrgelderlöse erwartet.79
Der Gewinner der Ausschreibung, die Nord-Ostsee-Bahn, investierte 18 Mio. Euro (circa
28,53 Mio. CHF) in eine Servicewerkstatt in Husum, womit sich der Betreiber regional dauer-
haft gebunden hat (sunk costs). Darüber hinaus wurden circa 125 Mio. Euro (circa
198,13 Mio. CHF) in 90 neue Reisezugwagen und vier Elektroloks investiert, die von Seiten
der NOB geleast wurden.80 Das Land Schleswig-Holstein ist in das Finanzierungsmodell ein-
gebunden, indem es den Wiedereinsatz der Reisezugwagen in Schleswig-Holstein im Falle
einer Neuausschreibung mit anschließendem Betreiberwechsel nach Ablauf von zehn Jahren
garantiert.81
Die Nutzung der Wiedereinsatzgarantie erwies sich aus Sicht der SPNV-Betreiber als Erfolg,
da das Restwertrisiko bei gleichzeitiger Wahrung der unternehmerischen Freiheiten im Be-
76 Herr Reh schätzt die Senkung der Löhne auf 10 bis 20 Prozent. 77 Vgl. Landtag (2001, S. 23 ff.). 78 Vgl. § 1 des Gesetzes zur tariflichen Entlohnung bei öffentlichen Aufträgen (Tariftreuegesetz) vom 7. März 2003, Gl.—Nr.:
7220-1, Fundstelle: GVOBL. Schl.-H. 2003 S. 136, ber. S. 238. 79 Vgl. Deutsche Bahn AG (2004, S. 11). 80 Vgl. NOB Pressemitteilung vom 28.07.2005 und 07.09.2005. 81 Vgl. Pressemitteilung der Nord-Ostsee-Bahn vom 28.07.2005 sowie LVS (2002, S. 36).
Zusätzlich Angaben von Herrn Dr. Tegner.

269
reich der Fahrzeugbeschaffung minimiert werden konnte. Die Markteintrittsbarrieren konnten
mit der Nutzung dieses Instruments reduziert werden.
Der Betreiber hat mit dem Kauf von Fahrzeugen und dem Neubau einer Werkstatt in Husum
ein umfangreiches Investment in Höhe von circa 143 Mio. Euro (circa 226,7 CHF) getätigt,
das nur durch eine entsprechende Erwartung hinsichtlich der Profitabilität gerechtfertigt sein
dürfte. Dieses, gleichwohl schwache, Indiz ist bislang der einzige Hinweis auf die tatsächlich
erwartete Profitabilität der Marschbahn aus Sicht des Betreibers.
Unter den übrigen ausgeschriebenen Netzen im Land befinden sich nach Ansicht der Exper-
ten sowohl hochprofitable Netze als auch Netze mit sehr geringer Profitabilität.82 Insgesamt
habe die Profitabilität von Ausschreibungen im Zeitablauf für die Betreiber abgenommen,
meint Herr Carstensen, NOB. Dennoch, so betont er, werde Veolia seiner Einschätzung nach
kein Angebot abgeben, bei dem keine zufrieden stellende Rendite zu erwarten sei.
Als problematisch hat sich allerdings verschiedentlich die Realisierung von Risiken herausge-
stellt (zum Beispiel Preissteigerungen bei Personal- und insbesondere Energiekosten, zu ge-
ringe Fahrgaststeigerung). Hier sei man mit Blick auf entsprechend negative Erfahrungen
vorsichtiger geworden.
Direkt vergebene Verträge sind nach Ansicht aller Experten im Vergleich für die TUs stets
wesentlich profitabler als ausgeschriebene Verkehrsleistungen. Einige Experten sprechen hier
von einem Unterschied von circa 25 Prozent im Bereich der erzielbaren Gewinne. Als proble-
matisch wird insbesondere angesehen, dass zwar ein auf einer Mischkalkulation von unren-
tablen (so genannten „Zitronen“) und rentablen (so genannten „Rosinen“) Strecken basie-
render Preis für die direkt vergebenen Leistungen gezahlt wird, jedoch zunächst lediglich die
Zitronen ausgeschrieben werden. Die profitablen Strecken werden somit zunächst weiter
direkt vergeben.83
4.2.5 Gesamtbetrachtung Marschbahn
Die wettbewerbliche Vergabe der 4,2 Mio. Zugkm Verkehrsleistungen auf der Marschbahn
wird von den meisten zum Thema befragten Experten als Erfolg eingestuft. Durch die Aus-
schreibung konnte der Zuschussbedarf im Rahmen eines Nettovertrags um circa 44 Prozent
gesenkt und über die Vertragslaufzeit von zehn Jahren aus Sicht des Aufgabenträgers circa
221,66 Mio. CHF eingespart werden. Die auf Seiten des Aufgabenträgers im Zuge der Durch-
führung der Ausschreibung entstehenden Kosten reduzieren diese Einsparungen voraussicht-
lich um lediglich 0,4 Prozent.
Die Qualität des Angebotes stieg durch neues Fahrzeugmaterial und vielfache Neuerungen
im Servicebereich an. Über die vorgegebenen Mindestanforderungen hinaus wurden von
82 Für Hintergründe zu einem Fall der Zahlungsunfähigkeit im Schleswig-Holsteinischen SPNV vgl. Wewers (2004) sowie Beck (2006).
83 Vgl. auch Anders (2003, S. 21 ff.) und Holzhey und Tegner (2004, S. 29 ff.).

270
Seiten des Betreibers eigenständig verschiedene Innovationen realisiert, wie zum Beispiel die
eigenwirtschaftliche Einrichtung einer Expressbuslinie als Zubringer zum Zug.
Als problematisch stellte sich anfänglich die Pünktlichkeit heraus, die von einer Pünktlich-
keitsquote des Altbetreibers von circa 90 Prozent auf 72,8 Prozent in den ersten zwei Wo-
chen nach Betriebsübernahme fiel. Auch der Ausfall einiger Züge war zu beobachten. Inzwi-
schen läuft der Betrieb auf dieser als betrieblich komplex eingestuften Strecke jedoch weit-
gehend reibungslos.
Der auf der Marschbahn angewandte Nettovertrag überträgt das Fahrgelderlösrisiko auf den
Betreiber, der damit bestrebt ist, die Fahrgelderlöse zu maximieren. Bislang wurde lediglich
im Fernverkehr ein Aufschlag von drei Euro (circa 4,76 CHF) erhoben. Die Tarife im aus
Fahrgastsicht primär relevanten Nahverkehr blieben trotz Gestaltungsmöglichkeiten des TU
unverändert.
Die Profitabilität der Betreiber scheint im Zuge des Ausschreibungswettbewerbs allgemein
etwas zurückzugehen. Dies erscheint allerdings angesichts des Ausgangsniveaus eines nicht
wettbewerblich organisierten Marktes mit zum Teil monopolartigen Renditen nicht verwun-
derlich. Die Profitabilität auf der Marschbahn lässt sich zum jetzigen Zeitpunkt allerdings
noch nicht hinreichend einschätzen. Die Nutzung der Wiedereinsatzgarantie erwies sich aus
Sicht der SPNV-Betreiber als Erfolg, da das Restwertrisiko bei gleichzeitiger Wahrung der
unternehmerischen Freiheiten im Bereich der Fahrzeugbeschaffung minimiert werden konn-
te. Die Markteintrittsbarrieren konnten mit der Nutzung dieses Instruments reduziert werden.
Für die Beschäftigten kam es im Bereich der Löhne zu einer Absenkung um circa zehn Pro-
zent, wenngleich keine Reduktion auf das tarifvertraglich zulässige Niveau erfolgte. Darüber
hinaus hat die Übernahme der Marschbahn nicht zu einem Arbeitsplatzabbau geführt. Ledig-
lich die Beschäftigungsstruktur hat sich geändert: Der Anteil des Verwaltungspersonals an
der Gesamtzahl der eingesetzten Arbeitskräfte hat sich zugunsten von Betriebs- und insbe-
sondere Servicepersonal reduziert.
4.3 Fallbeispiel Hessen
Das Fallbeispiel Hessen orientiert sich im Wesentlichen an der Ausschreibung und Be-
triebsaufnahme der Odenwaldbahn in Südosthessen (RMV-Linien 64: Frankfurt-Hanau-
Wiebelsbach-Heubach-Erbach und 65: Darmstadt-Wiebelsbach-Heubach-Erbach-Eberbach).
Grundlage dieser konstruktiven Ausschreibung ist ein Bruttovertrag mit Anreizregelungen
(Bonus-Malus-System) zur Steigerung der Leistungsqualität. Diesen Anreizregelungen liegen
objektive und subjektive Bemessungskriterien (Pünktlichkeit, Funktionsfähigkeit der Fahrkar-
tenautomaten, Sauberkeit, Sicherheit, Informationen bei betrieblichen Unregelmäßigkeiten)
zugrunde.

271
Der RMV begründet die Wahl des Ausschreibungsdesigns wie folgt:
Es sei zu erwarten, dass eine Ausschreibung von Bruttoverträgen mit Anreizsystem
aufgrund der begrenzten unternehmerischen Risiken zu einer höheren Bieteranzahl
führt.
Der Besteller verfügt über keine linienbezogenen Daten der bisherigen Fahrgelder-
löse. Die diskriminierungsfreie Zurverfügungstellung solcher Daten an alle Bieter
ist jedoch zur Risikoeinschätzung eines Nettovertrags aus Sicht der Bieter unerläss-
lich.
In der konstruktiven Ausschreibung wurden folgende wesentliche Vorgaben definiert:84
Art der Betriebleistung und Umfang der Betriebsvorbereitungen,
Anzuwendender Tarif, Vertriebsaufgaben, Umfang von Marketing und Fahrgast-
information,
Service- und Sicherheitsstandards,
Zu erreichende Qualitätsziele.
4.3.1 Kosten des Verkehrsangebotes
Wie im Abschnitt 4.3.2 noch zu zeigen sein wird, konnte im Zuge der Ausschreibung insbe-
sondere im Bereich der Fahrzeuge das Qualitätsniveau stark gesteigert werden. Die Auswir-
kungen dieser Verbesserungen auf die Fahrgelderlöse kommen bei dem ausgeschriebenen
Bruttoanreizvertrag jedoch nicht der Transportunternehmung zugute. Der Wettbewerb findet
in diesem Falle, im Gegensatz zum Fallbeispiel Marschbahn, „lediglich“ um die Produktions-
kosten des vom Besteller gewünschten Verkehrs statt. Dies konzentriert die Optimierungsbe-
strebungen des Unternehmens auf eine Verbesserung der Produktivität unter den gegebenen
Vergabebedingungen – (zuzüglich der Generierung entsprechender Anreizzahlungen (bezie-
hungsweise Bonuszahlungen) für eine hohe Leistungsqualität).
Trotz massiver Verbesserungen für die Fahrgäste durch die Ausschreibung konnten die Kos-
ten pro Zugkilometer im Odenwaldnetz aus Sicht des Bestellers mit der Ausschreibung kon-
stant gehalten werden. Die Ausweitung des Leistungsumfangs von 1,6 Mio. Zugkm auf 1,84
Mio. Zugkm Ende 2005 und die weitere Erhöhung ab Ende 2007 auf circa 2 Mio. Zugkm ist
ebenfalls ausgeschrieben und zum gleichen Zugkilometerpreis realisiert worden.85 Die Aus-
schreibung verhinderte hier offensichtlich eine Steigerung der Kosten je Zugkilometer, die
84 Quelle: Dem Verfasser vorliegende interne Vergabeunterlagen des RMV. 85 Angaben von Herrn Achenbach, RMV.

272
mit Blick auf die umfangreiche Qualitätssteigerung zu vermuten gewesen wäre. Der Kosten-
deckungsgrad wird für das Odenwaldnetz mit 48 Prozent angegeben.86
Hinsichtlich der Kosten je Vergabeverfahren ergeben sich beim RMV folgende Beträge:87
Kosten für die Vorbereitung und Durchführung der Ausschreibung je Verfahren:
Circa 60.000 Euro (circa 95.100 CHF)
Kosten der Vertragssteuerung und des Vertragscontrollings je vergebenes Netz
und Jahr: Circa 40.000 Euro (circa 63.400 CHF).
Die Kosten je Vergabeverfahren liegen damit sowohl im Bereich der Vergabe als auch im
Bereich des laufenden Vertragscontrollings etwas unterhalb der Kosten der LVS. Auf Betrei-
berseite gibt Herr Runge, Hessische Landesbahn, als Kosten für die Erstellung des Angebotes
für die Odenwaldbahn eine Summe von circa 100.000 Euro (158.500 CHF) an. Da hier ein
Bruttovertrag verwandt wurde und keine Erlösabschätzung nötig war, lagen die Kosten nied-
riger als bei Nettoverträgen.88 Für das laufende Vertragscontrolling erwartet Herr Runge auf-
grund der Vorgaben zur Nutzung des Fahrzeugpools (wie zum Beispiel präventive Instand-
haltung, also die Auswechselung von Komponenten nach Ablauf der zumeist vom Hersteller
empfohlenen Nutzungsdauer) gegenüber vergleichbaren Vergaben ohne Fahrzeugpool stark
erhöhte Kosten.89
4.3.2 Entwicklung der Angebotsqualität und der Innovationen
4.3.2.1 Entwicklung der Angebotsqualität insgesamt
Die Angebotsqualität entwickelte sich insgesamt positiv. Durch nach der Ausschreibung ge-
plante und derzeit durchgeführte Infrastrukturverbesserungen von Seiten des Infra-
strukturbetreibers DB Netz AG und durch die Verlängerung einzelner Züge von Darmstadt bis
Frankfurt Hauptbahnhof ergeben sich massive Reisezeitverbesserungen aus der Odenwald-
region nach Frankfurt (Main) von bis zu 20 Minuten.90 Diese Infrastrukturverbesserungen,
die nicht mit der Odenwaldbahn ausgeschriebenen wurden, umfassen:
Erhöhung der Streckengeschwindigkeit von 90 km/h auf 100 km/h und ab-
schnittsweise auf 120 km/h;
Modernisierung der Sicherungstechnik durch Bau eines neuen elektronischen
Stellwerkes;
86 Vgl. ProBahn (2006, S. 13). 87 Angaben von Herrn Achenbach, RMV. 88 Herr Runge präferiert dabei Verhandlungsverfahren gegenüber Ausschreibungen, da diese zwar teurer seien, jedoch mehr
Flexibilität zulassen. 89 Herr Runge präferierte aus diesem Grunde und aufgrund der höheren Freiheitsgrade für den Betreiber grundsätzlich das
Instrument der Wiedereinsatzgarantie, welches auf der Odenwaldbahn aufgrund der kurzen Fristen vermutlich nicht nutzbar gewesen wäre.

273
Modernisierung von Bahnübergängen und Bahnhöfen.
4.3.2.2 Innovationen auf Initiative des Aufgabenträgers
Der neue Betreiber der Odenwaldbahn muss für die Betriebsleistung die Fahrzeuge über-
nehmen, die von der Fahrzeugvorhaltegesellschaft des Aufgabenträgers (fahma Fahrzeug-
management GmbH) beigestellt werden. Dem Betreiber obliegt auch die Wartung und In-
standhaltung der Fahrzeuge. Hierfür wurde eigens eine Wartungsanlage in Michelstadt (e-
hemaliger Südbahnhof) mit entsprechendem Gleisanschluss durch einen privaten Investor
errichtet und an den Betreiber vermietet.91
Der Altbetreiber setzte auf der Strecke lokbespannte Reisezugwagen der Baujahre 1968 bis
1975 (so genannte „Silberlinge“) ein, die Mitte der neunziger Jahre überholt worden waren.
Auch Mitte der neunziger Jahre gebaute Triebwagen der Baureihe 628 kamen zum Einsatz.92
Beide Fahrzeugtypen waren nicht niederflurig und besaßen keine Klimaanlage. Für das an-
spruchsvolle Betriebskonzept wiesen die Fahrzeuge zu geringe Beschleunigungswerte auf.
Die neuen Fahrzeuge vom Typ Itino verfügen gegenüber dem bisher eingesetzten Wagen-
material über folgende zusätzliche Qualitäten:
Neufahrzeuge,
Fahrgastinformationssystem,
Klimatisierter Innenraum,
Niedriger Geräuschpegel,
Hohe Beschleunigungswerte und eine Fahrgeschwindigkeit bis zu 140 km/h,
Niederflurigkeit,
Behindertengerechtes WC,
Mehrzweckabteile für Fahrräder, Rollstühle, Kinderwagen.93
Eine andere Art der Innovation stellt die Bereitstellung der Fahrzeuge im Rahmen eines
Fahrzeugpools dar. Der RMV als Besteller, will mit diesem Instrument folgenden Problemen
begegnen:
Die im Fahrzeugpool zur Verfügung gestellten Fahrzeuge senken die Markteintritts-
barrieren für neue oder kleinere Bieter. Dadurch wird eine vielfältigere und mittel-
ständisch geprägte Anbieterlandschaft gefördert.
90 Vgl. RMV: Pressemitteilung vom 10.01.2005. 91 Vgl. Odenwaldbahn, http://www.oreg.de/odenwaldbahn/, Download vom 27.09.2006. 92 Angaben von Herrn Runge, Hessische Landesbahn. 93 Vgl. VIAS (2005).

274
Für die Bieter stand entgegen der ursprünglichen Planung ein vergleichsweise kur-
zer Zeitraum von lediglich sechs Monaten zwischen Bekanntmachung der Aus-
schreibung und Vergabe zur Verfügung. Die Vorbereitungszeit bis zur Übernahme
betrug anschließend lediglich ein Jahr.
Für das vom RMV gewünschte Betriebskonzept der Odenwaldbahn waren spezielle
spurtschnelle Fahrzeuge notwendig, die nur wenige Hersteller überhaupt, und nur
ein Hersteller kurzfristig liefern konnte. Die Beschaffung über den Fahrzeugpool si-
chert allen potentiellen Bietern einen Zugriff auf die Fahrzeuge.
Die Fahrzeugkosten konnten aufgrund besserer Zinskonditionen der öffentlichen
Hand und der Vermeidung der vom Betreiber zu kalkulierenden Wiedereinsatzrisi-
ken (Restwertrisiko) wirtschaftlicher dargestellt werden.94
Nach Einschätzungen von Herrn Achenbach wären ohne entsprechende Ausschreibungs-
vorgaben beziehungsweise ohne die Pflicht zur Nutzung der über den RMV-Fahrzeugpool
beschafften Fahrzeuge keine Verbesserung bei unrentablen Qualitätsparametern wie Aus-
stattung der Fahrzeuge mit behindertengerechten Toiletten oder stufenlosen Einstiegen er-
reicht worden.
Die Betriebsaufnahme im Dezember 2005 war von Anlaufschwierigkeiten geprägt, für die
sich der Betreiber aber nur bedingt verantwortlich zeichnete.95 Vielmehr war der Besteller
RMV offensichtlich vom durch die Angebotsverbesserungen ausgelösten Ansturm der Fahr-
gäste und der dafür nötigen Fahrzeugkapazitäten etwas überrascht worden. Die Nachfrage
konnte zunächst mit der bestehenden Kapazität nicht gedeckt werden. Aufgrund dessen gab
es einige Beschwerden in der Bevölkerung über zu kurze Triebwagen.96 Zwischenzeitlich hat
sich jedoch die Situation durch ein in Abstimmung mit dem RMV zusätzlich eingesetztes Re-
servefahrzeug des Betreibers normalisiert.97
Um das Problem dauerhaft zu lösen und der weiteren Fahrgastentwicklung auch langfristig
Rechnung zu tragen, beschloss der RMV die Beschaffung von drei zusätzlichen Fahrzeugen
über den Fahrzeugpool des Aufgabenträgers. Die Fahrzeuge sollen im Sommer 2008 zur Ver-
fügung stehen.98 Weitere in den ersten Wochen nach Betriebsaufnahme aufgetretene Prob-
leme im Zusammenspiel von Infrastrukturbetreiber und neuem Betreiber sowie einige leichte
„Kinderkrankheiten“ im Zusammenspiel von neuen Fahrzeugen, neuer Werkstatt und Infra-
struktur können im Vergleich zu anderen Betriebsaufnahmen als normal eingeschätzt wer-
den.
94 Angaben von Herrn Daubertshäuser. 95 Als Anlaufprobleme identifizierte ProBahn (2006, S. 9 ff.) Kuppelprobleme beim Verstärken der Züge, zu späte Bereitstel-
lung, aber auch so genannte „Kinderkrankheiten“ der eingesetzten Fahrzeuge des RMV (wie zum Beispiel Probleme bei Hei-zung und Klimaanlage). Vgl. auch Pressemitteilung des RMV vom 23.03.2005.
96 Vgl. ProBahn (2006, S. 10). 97 Vgl. Bahnreport 2/06, Paderborn 2006, S. 8.

275
Die Pünktlichkeit verbesserte sich merklich, nicht zuletzt aufgrund entsprechender Bonus-
und Malusregelungen zur Gewährleistung eines reibungslosen Betriebsablaufs.99 Im Vergleich
zum Altbetreiber konnte die Pünktlichkeit zwischenzeitlich um vier Prozentpunkte gesteigert
werden, obwohl die Toleranzgrenze der Erfassung der Unpünktlichkeit von fünf auf drei Mi-
nuten gesenkt wurde.100 Sie lag direkt nach Betriebsübernahme Mitte Dezember 2005 bei
75 Prozent, konnte bis Mitte Januar 2006 aber auf 95 Prozent gesteigert werden.101 Aufgrund
laufender Baumaßnahmen zur weiteren Modernisierung der Infrastruktur sind derzeit jedoch
wieder Beeinträchtigungen in der Entwicklung der Pünktlichkeit zu beobachten. Da die Ursa-
chen der Unpünktlichkeit nicht durch den Betreiber zu verantworten sind, hat der Besteller
die Pönalisierung des Betreibers hinsichtlich Pünktlichkeit für den Zeitraum der Baumaßnah-
men ausgesetzt.
Insgesamt hat sich aufgrund der Ausschreibung die Angebotsqualität deutlich verbessert.102
Das Zusammenwirken neuer Fahrzeuge und kürzerer Reisezeiten führte in den ersten Be-
triebsmonaten zu einer Nachfragesteigerung von plus 20 bis 30 Prozent gegenüber der Alt-
nachfrage (die unterstellte Nachfrageprognose für das Jahr 2009 wurde damit bereits er-
reicht).103 Hieraus resultierten zusätzlich zu den oben beschriebenen betrieblichen Anlauf-
problemen und „kleineren Kinderkrankheiten“ der neuen Fahrzeuge entsprechende Kapazi-
tätsprobleme. Sicherheitsrelevante Verschlechterungen sind nicht bekannt.104
4.3.2.3 Innovationen auf Initiative der Betreiber
Aufgrund der Nutzungspflicht der Fahrzeuge des Fahrzeugpools beschränken sich mögliche
Innovationen des Betreibers auf die Verbesserung der internen betrieblichen Abläufe und der
Erfüllung der Qualitätsvorgaben105 (gegebenenfalls zuzüglich der Leistung von Mehrqualität
zur Generierung von Bonuszahlungen).
Hierzu gehören zum Beispiel das betriebsinterne Störungsmanagement und die jeweilige
Kundenkommunikation sowie das Management der Fahrzeugreinigung und der laufenden
Fahrzeuginstandhaltung. Da der bisherige Betrieb seit Dezember 2005 jedoch sehr von be-
trieblichen Anlaufproblemen und betrieblichen Problemen in der Folge der parallel zum Be-
trieb stattfindenden Streckenmodernisierungsarbeiten geprägt ist, kann das Ausmaß mögli-
98 Vgl. Pressemitteilung des RMV vom 12.07.2006. 99 ebd. 100 ebd. 101 Vgl. Pressemitteilung des RMV vom 24.01.2006. 102 Angaben von Herrn Achenbach, Bereichsleiter Bestellmanagement des RMV. Herr Runge, Hessische Landesbahn sieht eben-
falls eine Verbesserung der Gesamtqualität. 103 Vgl. Pressemitteilung des RMV vom 24.01.2006. Für eine Bewertung des Nettoeffektes aus Sicht der öffentlichen Hand
(neue Fahrgelderlöse nach Fahrgaststeigerung abzüglich der an den Betreiber zu zahlenden Abgeltungen) fehlt derzeit nach Auskunft des RMV noch das Datenmaterial. Dies bestätigte auch Herr Runge, Hessische Landesbahn, der einen Nettovertrag aufgrund der größeren unternehmerischen Freiheiten grundsätzlich eher bevorzugen würde.
104 Angaben von Herrn Achenbach, RMV und Herrn Runge, Hessische Landesbahn. 105 Bestätigt durch Einschätzung von Herrn Runge, Hessische Landesbahn.

276
cher betrieblicher Innovationen und deren Wirksamkeit heute noch nicht vollständig erfasst
und bewertet werden.
Eine (Prozess-)Innovation stellt die Entscheidung für eine eigenständige Erbringung der
Werkstattleistungen dar. Der Neubetreiber VIAS GmbH hat sich hierbei für den Betriebs-
standort Michelstadt entschieden. Das TU gab damit diesem Standort den Vorzug gegenüber
der Betriebswerkstatt Darmstadt des Altbetreibers DB Regio AG. Dort wäre es möglich gewe-
sen, auf eine vorhandene Infrastruktur mit Werkstatt und Personal zurückzugreifen, die in
Michelstadt erst noch errichtet werden musste. Die günstigen Standortbedingungen und
auch die umfassende Kooperationsbereitschaft, vor allem des Investors Wissmüller, haben
schließlich den Ausschlag dafür gegeben, eine neue Werkstattanlage zu errichten.
Gebaut wurde die Betriebswerkstatt mit Wasch- und Tankanlage auf dem Betriebsgrundstück
der Firma Wissmüller. Investor ist die Firma Odenwaldbahn-Infrastruktur GmbH, deren allei-
niger Gesellschafter Herr Wissmüller ist. Diese Infrastruktur wird vom Eisenbahn-
Verkehrsunternehmen für die Laufzeit des Verkehrsvertrags (10 Jahre) angemietet. Aller-
dings geht der Vermieter in den strategischen Überlegungen von einer längerfristigen Nut-
zung der Anlage aus (wenngleich es hierfür keine vertragliche Zusage gab).
Die Odenwaldbahn-Infrastruktur GmbH baut auch die notwendige Gleisverbindung von der
Betriebswerkstatt zum Hauptgleis der Odenwaldbahn und stellt die erforderliche Weichen-
verbindung auf der Grundlage eines Infrastruktur-Anschlussvertrags mit der DB Netz AG her.
Gleis und Weiche liegen auf der Trasse der ehemaligen Verbindung zum Südbahnhof Michel-
stadt, die erst vor einigen Jahren von der DB Netz AG zurückgebaut wurde.
Die Werkstatt inklusive ihrer Einrichtung wird auf die Wartung und Instandhaltung der „Iti-
no“-Triebfahrzeuge der Odenwaldbahn ausgerichtet und betriebsfertig vermietet. Die Werk-
stattleistungen selbst werden von der Transportunternehmung erbracht, das auch gegenüber
dem Hersteller und der fahma Fahrzeugmanagement GmbH verantwortlich ist.
Die Baukosten für die Betriebswerkstatt belaufen sich auf circa 2,22 Mio. Euro (circa
3,52 Mio. CHF) und werden ausschließlich privat finanziert. Öffentliche Zuschüsse werden
nicht gewährt. Ebenso waren keine besonderen Zinsvergünstigungen im Rahmen von Mit-
telstands-Förderprogrammen zu erhalten.
4.3.3 Kosten der Nutzer
Aufgrund des gewählten Vertragmodells eines Bruttoanreizvertrags mit Anwendung des Ver-
bundtarifes kommt es zu keiner ausschreibungsbedingten Veränderung der Fahrpreise. Diese
entwickeln sich unabhängig von der Ausschreibung für den gesamten Verbundraum im Rah-
men der allgemeinen Tarifentwicklung des RMV. Da die Bruttoregelung eine vollständige
Zuweisung der Fahrgelderlöse an den Besteller vorsieht, entstehen keine Durchtarifie-

277
rungsprobleme und Diskriminierungspotenziale des Incumbent, auch im Falle von parallelem
SPNV oder Fernverkehr.106
4.3.4 Auswirkungen auf Arbeitsplätze und Finanzen der Betreiber
Zur Abwicklung des Betriebs benötigt das TU 28 Triebfahrzeugführer im Zweischichtbetrieb
und etwa zehn Zugbegleiter für die überwiegend in Doppeltraktion bedienten Leistungen. Für
die Wartung und Instandhaltung der Fahrzeuge in der Betriebswerkstatt werden etwa sechs
bis zehn Mitarbeiter benötigt. Angaben zum Umfang des Verwaltungspersonals existieren
nicht. Anzumerken ist, dass die Werkstatt der Odenwaldbahn in einer strukturschwachen
Region angesiedelt wurde, und damit lokal Arbeitsplätze geschaffen werden konnten. Qualifi-
zierte Angaben über einen Mehr- oder Minderbedarf an Personal oder sonstige Auswirkungen
auf die Arbeitnehmer liegen nicht vor.107
Herr Runge, Hessische Landesbahn, vermutet eine leicht gesunkene Gesamtzahl an Arbeits-
plätzen. Allerdings nimmt laut Herrn Runge der Altbetreiber DB Regio AG aufgrund der ho-
hen Kosten für Sozialpläne regelmäßig keine Entlassungen vor, sondern bietet eine Verset-
zung an einen anderen Standort an (zum Beispiel zur S-Bahn nach Frankfurt). Für die durch
die Odenwaldbahn nicht mehr in Anspruch genommene Betriebswerkstatt in Darmstadt er-
wartet Herr Runge eine Nutzung durch das jüngst von der DB Regio AG gewonnene Südhes-
sennetz. Die Entlohnung der Mitarbeiter ist nach seiner Einschätzung um circa fünf bis zehn
Prozent gesunken. Hinsichtlich der Profitabilität des Neubetreibers könne er jedoch keine
Einschätzung abgeben.
4.3.5 Gesamtbetrachtung Odenwaldbahn
Im untersuchten Fallbeispiel Odenwaldbahn konzentriert sich die Verantwortung des Betrei-
bers aufgrund des gewählten konstruktiven Ausschreibungsdesigns, das in einem Bruttover-
trag mit Anreizsystem kombiniert mit der Nutzungsvorgabe gepoolter Fahrzeuge besteht, auf
den betrieblichen Erfolg. Ein direkter Anreiz im Bereich der Fahrgäste besteht nicht.
Im Vergleich zu anderen Ausschreibungen ist eine vergleichsweise bescheidene Ausschrei-
bungseinsparung beziehungsweise eher eine Kostenkonstanz festzustellen. Die vertraglichen
Rahmenbedingungen, die lediglich in der Erstattung von Produktionskosten (plus Kapital-
kosten) im Rahmen eines Bruttovertrags bestehen, reduzieren das Optimierungspotenzial
des Betreibers. Gleichzeitig wurden erhebliche Qualitätssteigerungen erzielt, die damit in
diesem Bereich die Kosten erhöht haben könnten. Insbesondere die derzeit nur von einem
Hersteller lieferbaren, für das anspruchsvolle Betriebskonzept notwendigen „spurtstarken“
106 Angaben von Herrn Achenbach. 107 Der Fahrgastverband ProBahn (2006, S. 9) verweist im Zusammenhang mit dem Betreiberwechsel auf die Auswirkungen
der fehlenden Inanspruchnahme des Betriebswerkes Darmstadt der Deutschen Bahn AG und auf den Wegfall von gut 80 Arbeitsplätzen bei der Deutschen Bahn AG, allerdings ohne dies näher zu verifizieren.

278
Fahrzeuge könnten die Fahrzeugkosten des Teilnetzes Odenwaldbahn erhöht haben. Im Er-
gebnis konnte damit ein deutlich besseres Angebot zum nahezu gleichen Preis beschafft
werden.
Neben erheblichen Qualitätssteigerungen (zum Beispiel behindertengerechte und klimatisier-
te Fahrzeuge) traten auch Probleme im Bereich der Pünktlichkeit auf. Neben einigen Anlauf-
schwierigkeiten des Betreibers sind diese jedoch primär auf externe, nicht vom Betreiber zu
verantwortende Faktoren zurückzuführen.
Auf die Kosten der Nutzer zeigte die Vergabe keine Auswirkungen. Im Bereich der Arbeits-
platzentwicklung ist festzustellen, dass zwar die Werkstattkapazitäten des Altbetreibers nicht
mehr in vollem Umfang genutzt werden, jedoch eine neue Werkstatt an einem (im Vergleich
strukturschwachen) Standort errichtet wurde. Die Löhne sanken vermutlich leicht. Über die
Entwicklung der Gesamtzahl der Arbeitsplätze und der Profitabilität der Betreiber sind keine
Daten verfügbar.

279
5 Empfehlungen für die Schweiz
5.1 Nutzung des Ausschreibungswettbewerbs in der Schweiz
Aus den in den vorgenannten Kapiteln beschriebenen Fallbeispielen zeichnet sich eine grund-
sätzliche Vorteilhaftigkeit der Nutzung von Ausschreibungen bei der Vergabe von SPNV-
Leistungen ab. Der Zuschussbedarf für die öffentliche Hand konnte gesenkt beziehungsweise
die Kosten stabilisiert werden. Gleichzeitig wurde die Qualität in den betrachteten Fallbeispie-
len, insbesondere über den Einsatz von neuem Fahrzeugmaterial, massiv erhöht. Dabei
scheint die Profitabilität der Betreiber etwas zurückzugehen. Dies erscheint allerdings ange-
sichts des Ausgangsniveaus eines nicht wettbewerblich organisierten Marktes mit zum Teil
monopolartigen Renditen nicht verwunderlich. Die Löhne geraten etwas unter Druck, sie
sanken bislang aber nicht auf das aus tarifvertraglicher Sicht mögliche Minimalniveau. Die
Anzahl der operativen Arbeitsplätze blieb insgesamt vermutlich relativ konstant.
Vor dem Hintergrund dieser Ergebnisse könnte es aus Sicht der Eidgenossenschaft sinnvoll
sein, Möglichkeiten zur Nutzung des Instruments „Ausschreibungswettbewerb“ auch bei ab-
geltungspflichtigen Schienenverkehrsleistungen in der Schweiz zu identifizieren. So könnte
zum Beispiel im Rahmen eines Pilotprojektes überprüft werden, ob ähnliche Effekte wie bei
den untersuchten deutschen Fallbeispielen auch bei Ausschreibungen in der Schweiz reali-
sierbar sind. Aus Sicht der Kantone bestünde hierbei die Möglichkeit, bei weiter steigendem
Qualitätsniveau den Zuschussbedarf zu reduzieren beziehungsweise die Kosten für die öf-
fentliche Hand trotz Qualitätssteigerungen zu stabilisieren.
Der Erfolg der Ausschreibung von abgeltungspflichtigen Schienenverkehrsleistungen wird von
einer Vielzahl von Faktoren beeinflusst. Diese Erfolgsfaktoren werden im Folgenden über-
blicksartig dargestellt. Abschließend werden weitergehende Handlungsempfehlungen für die
Schweiz erläutert. Für eine vertiefte Betrachtung der komplexen Rahmenbedingungen des
betreffenden Marktes und konkrete Umsetzungsschritte bei Nutzung des Instrumentes der
Ausschreibung wird zusätzlich auf die beim Bundesamt für Verkehr der Schweiz in Erarbei-
tung befindlichen Studien zu diesem Thema verwiesen.
5.2 Sicherung wichtiger Errungenschaften des Schweizer Personenschienenverkehrs
Die Nutzung des Instruments „Ausschreibungswettbewerb“ stellt keinen Selbstzweck dar.
Vielmehr sollte das Ziel verfolgt werden, wichtige Errungenschaften des Schweizer Eisen-
bahnverkehrs auch in einem sich verändernden Marktumfeld abzusichern. Dies betrifft zum
Beispiel den landesweiten integralen Taktverkehr, die Tarifierung im „direkten Verkehr“ auch
über Betreibergrenzen hinweg, die integrierte Fahrplaninformation und die Abstimmung der
Investitionsplanungen für den Neu- und Ausbau des Schienennetzes, die in enger Verzah-

280
nung mit dem angestrebten Angebotskonzept stehen. Um die Erhaltung dieser qualitativen
Aspekte zu gewährleisten, sind gegebenenfalls Maßnahmen der Institutionalisierung oder
Regulierung von Abstimmungsprozessen oder Mitnutzungsrechten erforderlich, die bislang
auf freiwilliger Basis oder schlicht gewohnheitsmäßig vorgenommenen wurden.
Heute kommt in vielen dieser Querschnittsaufgaben den SBB die Rolle des Systemführers zu.
Die Beispiele aus Deutschland zeigen, dass in einem Wettbewerbsumfeld der Incumbent (aus
nachvollziehbaren wirtschaftlichen Erwägungen) geneigt ist, die ihm zur Verfügung stehen-
den Diskriminierungsmöglichkeiten zu nutzen.108 Das Selbstverständnis der SBB, ihr Mana-
gementhandeln und die Eigentümerführung durch den Bund sind derzeit nicht vergleichbar
mit denen der Deutschen Bahn AG. Allerdings empfiehlt es sich, bereits frühzeitig entspre-
chende Regelungsmechanismen zu installieren, um unerwünschten Entwicklungen vorzubeu-
gen.
Eine weitere Grundvoraussetzung für die Einführung von Wettbewerb ist die Schaffung eines
Marktumfeldes, das wirtschaftliches Agieren der Akteure ermöglicht und fördert, damit ein
Engagement im Schweizer Schienenpersonenverkehr aus Sicht der Unternehmen lohnens-
wert ist: Operative Leistungserbringung im Schienenpersonenverkehr sollte als kommerzielle
Dienstleistung betrieben werden dürfen, was eine Anpassung des derzeitigen nationalen Ge-
setzesrahmens notwendig macht. Ohne Dynamik auf der Anbieterseite ist ein hinreichend
wirksamer Wettbewerb nicht möglich. Die Gewinnerzielungsabsicht der Unternehmen bildet
hierbei die Triebfeder, der Wettbewerb das Korrektiv, um den Missbrauch zu verhindern. Die
in der Folge generierten Effizienzsteigerungen ermöglichen letztendlich trotz eines operativen
Gewinns Einsparungen für die öffentliche Hand.
108 Verschärft wird diese Tendenz in Deutschland noch zusätzlich durch das von der DB AG verfolgte Ziel der Erreichung der Kapitalmarkfähigkeit („Börsengang“).

281
Weitere wichtige Vorbedingungen für die Einführung von Wettbewerb:
Einschätzbarkeit des Marktes sicherstellen:
Bei Nettovertrag: Sammlung und Aufbereitung der relevanten die Nachfrage betref-
fenden Daten über einen ausreichenden Zeitraum (unter anderem hinsichtlich Fahr-
gastanzahl des Altbetreibers, Fahrgelderlösen, Einnahmeaufteilungsschlüssel, Tarifer-
giebigkeit) beim Aufgabenträger;
Betrieblichen Komplexitätsgrad des zu vergebenden Verkehrs ermitteln und Mindest-
standards (zum Beispiel Mindestpünktlichkeit, maximale Reisezeiten und gefordertes
Fahrzeugkonzept) auf Realisierbarkeit prüfen;
Mittelfristige Perspektive für die Betreiber aufzeigen (zum Beispiel über die Verab-
schiedung eines Ausschreibungsfahrplans mit der Perspektive, im Ausschreibungs-
wettbewerb verlorene Leistungen an anderer Stelle wieder zu gewinnen (vgl. auch
Kapitel 5.3.1, Seite 282).
Diskriminierungsfreiheit sicherstellen (vgl. auch Kapitel 5.3.1).
Wie die Erfahrungen der beiden untersuchten Bundesländer zeigen, empfiehlt es sich, bereits
frühzeitig erste vorbereitende Tätigkeiten für die Durchführung von Ausschreibungsverfahren
zu vollziehen, um einen erfolgreichen Ausschreibungswettbewerb initiieren zu können. Hierzu
gehört insbesondere die Sammlung und Aufbereitung relevanter Daten und der Beschluss
eines Ausschreibungsfahrplans. Weitere wichtige Erfolgsfaktoren für einen erfolgreichen Aus-
schreibungswettbewerb werden im Folgenden überblicksartig dargestellt.
5.3 Erfolgsrelevante Maßnahmen
Basierend auf den Erfahrungen der Fallbeispiele Schleswig-Holstein und Hessen sowie weite-
rer Ausschreibungen in Deutschland lassen sich verschiedene erfolgsrelevante Maßnahmen
ableiten. Eine zentrale Maßnahme ist die Schaffung von eindeutigen politischen Rahmenbe-
dingungen vor Ort. Um dies zu erreichen, müssen folgende Voraussetzungen erfüllt sein:
Verbindliches Wettbewerbskonzept:
Vorab: Aufbereitung relevanter Informationen und
Konsultation mit Betreibern und Fahrgästen,
Klare Zieldefinition,
Frühzeitige Bekanntmachung aller auszuschreibenden
Verkehre und Transparenz in der Vergabe;

282
Klare Rollenverteilung: Eigentümerinteressen versus Bestellerinteressen:
Vermeidung von Interessenskonflikten:
Beschränkung auf die Gestaltungsrolle,
Transparente Rollenteilung,
Sicherstellung eines diskriminierungsfreien Wettbewerbs.
Eine weitere erfolgsrelevante Maßnahme ist die Herstellung von Chancengleichheit im Wett-
bewerb. Hierzu gehören insbesondere folgende Aspekte:
Stärkung der Verhandlungsposition der Besteller durch Abbau von Informationsa-
symmetrien:
Kooperatives Vorgehen der Kantone,
Strategische Vernetzung auf Bundesebene,
Einbeziehung des Bundes;
Herstellung von Chancengleichheit für die Ersteller:
Situationsspezifische Wahl des Ausschreibungsdesigns,
insbesondere im Bereich Fahrzeuge und Fahrgelderlöse,
Einheitliche Vorgaben,
Eigene Risikoübernahme bei hohem Einfluss externer
Risikofaktoren und/oder hoher Unsicherheit,
Eigene Vorab-Festlegung von kritischen Faktoren.
Diese und weitere relevante Erfolgsfaktoren werden im Folgenden näher ausgeführt.
5.3.1 Erfolgsfaktoren
Wettbewerbsstrategie
Die betrachteten Bundesländer haben sich jeweils eindeutig für eine wettbewerbliche Verga-
be ausgesprochen und die Wettbewerbsstrategie in einem Wettbewerbskonzept verankert.
Die Erfahrungen der betrachteten Bundesländer Schleswig-Holstein und Hessen zeigen, dass
Ausschreibungen nicht als Einzelereignisse erfolgen sollten. Zu empfehlen ist eher die Einbet-
tung in eine klare Wettbewerbsstrategie und deren offene Kommunikation (zum Beispiel
Ausschreibungskonzeption in Stufen). Nur unter diesen Voraussetzungen können mögliche
neue Bieter qualifiziert abschätzen, inwieweit ein Engagement im Schweizer Bahnmarkt loh-
nenswert ist. Auch für bereits im Markt Schweiz aktive TUs ist eine langfristige Planungsper-
spektive für die Unternehmensstrategie wichtig, da die Teilnahme an Ausschreibungen Kom-
petenzaufbau erfordert. Als weiterer bedeutender Aspekt ist die Verlässlichkeit der Aufgaben-

283
träger zu nennen, was insbesondere Hinsichtlich der Einhaltung derartiger Wettbewerbskon-
zepte gilt.
Das bedeutet für die Schweiz, dass zum Beispiel ein Besteller, der den Wettbewerb nur als
Drohkulisse vorsieht, und der dessen Umsetzung immer weiter hinausschiebt, dadurch seine
Glaubwürdigkeit verliert und in der Folge keine wirklich guten Angebote erwarten kann.
Zieldefinition
Die Besteller sollten ihre Ziele vor dem Start einer Ausschreibung klar definieren und benen-
nen. Zur erfolgreichen Umsetzung der Ziele ist es wichtig, die inhaltlichen Parameter und
insbesondere die Anreizwirkungen der Verkehrsverträge auf die Ziele auszurichten.
„Hidden Agendas“ gefährden den Erfolg von Vergabeverfahren und diskreditieren die Glaub-
würdigkeit.
Transparenz und Nichtdiskriminierung
Von hoher Bedeutung für einen erfolgreichen Ausschreibungswettbewerb sind Vergabeent-
scheidungen anhand transparenter und nicht-diskriminierender Kriterien (wie dies zum Bei-
spiel im RMV mit der Wahl offener Vergabeverfahren erfolgte). Das jeweilige Verfahren sollte
sicherstellen, dass alle potenziellen Anbieter von einer Gleichbehandlung im Verfahren und
im laufenden Betrieb ausgehen können. Nur unter diesen Umständen werden hinreichend
viele Bieter den Aufwand für eine Beteiligung am Verfahren betreiben.
Für die Schweiz bringt dies die Herausforderung mit, das innerhalb der integrierten SBB vor-
handene Diskriminierungspotenzial so weit wie möglich zu neutralisieren. Existiert ein privile-
gierter Player im Markt, sinken die Erfolgsaussichten hinsichtlich der Ausschöpfung des aus
ökonomischer Sicht maximal möglichen Effizienzsteigerungspotenzials. Es ist deshalb zu
empfehlen, einen institutionell unabhängigen, starken und mit Sanktionsmechanismen aus-
gestatteten Regulator zu etablieren, um Diskriminierungspotenziale zu verhindern. Die der-
zeit in Deutschland vielfach aufgetretenen Probleme (zum Beispiel Nichteinigung über Tras-
senzugang, Einbindung der Fernverkehrstarife) sind unter anderem auch in einer noch nicht
hinreichend etablierten Regulierung begründet.
Information und Kommunikation
Die Einbeziehung der TUs im Vorfeld eines Ausschreibungsverfahrens kann sinnvoll sein, um
die Vergabekonzeption zu optimieren und durch Verständnis für die Situation der TUs bereits
vor Verfahrensbeginn Markteintrittsbarrieren zu senken. Ein solcher Prozess kann formalisiert
im Rahmen einer Markterkundung erfolgen.
Die Offenlegung und Transparenz des Bewertungsschemas (Kriterien und Gewichtung) sowie
die transparente Verfahrensdurchführung während der Ausschreibung (zum Beispiel Über-
mittlung von Bieter-Rückfragen und -Antworten sowie sonstige Bieterinformationen generell
an alle Bieter) sind von hoher Bedeutung. Auch eine fachlich unangreifbare Begründung des

284
Vergabeergebnisses sowie die Unterstützung der Kooperation zwischen Altbetreiber und
Neubetreiber nach Vergabeentscheid (um Übergangsprobleme zu vermeiden) sind empfeh-
lenswert.
Eine institutionelle trilaterale Kommunikation zwischen Besteller, Transportunternehmung
und Fahrgästen kann über Strecken- oder Fahrgastbeiräte sichergestellt werden (vgl. das
Fallbeispiel Marschbahn). Die direkte Einbeziehung der Nutzer verbessert das Verständnis bei
TUs und Bestellern und kann im konkreten Bezug zum jeweiligen Teilnetz wichtige Impulse
zur Optimierung des Angebots liefern. Auch im Vorfeld von Ausschreibungen kann der Be-
steller auf diese Weise Fahrgastbelange abfragen und in die Konzeption der Vergabe einflie-
ßen lassen.
Sachgerechte Risikoallokation
Wo Risiken vom TU zu tragen sind (zum Beispiel Erlösverantwortung beim Nettovertrag),
muss die Kalkulierbarkeit aus Sicht der TU sichergestellt sein. Hierfür müssen die Daten-
grundlagen allen Bietern in gleicher Weise zur Verfügung stehen (zum Beispiel durch Bereit-
stellung umfassender Marktdaten bezüglich Nachfrage und Einnahmenaufteilung, vgl. auch
Kapitel 5.2, Seite 279).
Anreizregime
Dem TU müssen richtige Anreize für ein kundenorientiertes Verhalten gesetzt werden. Dies
kann beispielsweise über einen Nettovertrag erfolgen. Voraussetzungen dafür sind die Kalku-
lierbarkeit der Fahrgelderlöse sowie potentielle Mehrerlöse, die hoch genug sind, um einen
ausreichenden Antrieb für das TU darzustellen. Eine Alternative hierzu könnte ein Brutto-
Anreizvertrag oder auch eine Kombinationen sein, wie zum Beispiel ein Nettovertrag mit
fahrgastzahlorientierten Anreizen (vgl. Marschbahn).
Berücksichtigung der Fahrzeugkosten bei der Vergabekonzeption
Das Rollmaterial ist im SPNV eine der entscheidenden beeinflussbaren Kostengrößen. Wichtig
für eine erfolgreiche Ausschreibungsstrategie ist ein wirtschaftlich sinnvoller Umgang mit der
Frage des Einsatzes der richtigen Fahrzeuge.

285
Folgende Punkte sind von besonderer Relevanz:
Neufahrzeuge versus Altfahrzeuge: Neufahrzeuge führen durch hohen Kapitalkos-
tenaufwand zu höheren Bestellkosten als (teil-)abgeschriebene Altfahrzeuge. Aller-
dings lassen sich bei der Nutzung von Neufahrzeugen gegebenenfalls technische
Vorteile
oder Einnahmensteigerungen infolge höherer Attraktivität generieren, die den
Nachteil in den Anschaffungskosten kompensieren können.
Sind Altfahrzeuge zugelassen, ist ein wirksamer Wettbewerb nur dann möglich,
wenn entweder ein funktionierender Gebrauchtfahrzeugmarkt besteht oder die
Übernahme der Altfahrzeuge vom Altbetreiber zu diskriminierungsfreien Konditio-
nen gewährleistet ist.
Sind Neufahrzeuge zu beschaffen, kommt den Finanzierungskosten erhebliche Be-
deutung zu: Unternehmen in öffentlichem Eigentum oder öffentliche Stellen wie
die Aufgabenträger selbst können in der Regel von günstigeren Finanzierungskon-
ditionen profitieren als mit höherem Konkursrisiko versehene private Akteure. Hier
besteht ein Kostenstrukturunterschied zwischen privaten und öffentlichen Trans-
portunternehmungen.
Finanzierungsrisiken der TU können vom Besteller durch Gewährung von Sicher-
heiten reduziert werden. Dies könnte zum Beispiel in Form einer Garantie erfolgen,
in der der Aufgabenträger im Konkursfall des Betreibers die Fahrzeuge übernimmt,
sie bei Bedarf an den Neubetreiber weitergibt und zugleich in die verbliebenen Fi-
nanzierungsver-pflichtungen eintritt. Diese Vorgehensweise ist Teil der Konzeption
der für die Marschbahn entwickelten Wiedereinsatzgarantie.
Die Differenz zwischen Laufzeiten der Verkehrsverträge (häufig circa zehn Jahre)
und Fahrzeuglebensdauer (regelmäßig über 25 Jahre) erzeugt ein kostensteigern-
des Restwertrisiko, wenn keine sichere produktive Verwendung der Fahrzeuge
nach Vertragsende absehbar ist. Dieses Risiko kann durch eine Wiedereinsatzga-
rantie des Bestellers (also durch die Zusage, dass Fahrzeuge auch für Folgeaus-
schreibungen verwendet werden können; diese sind dann gegebenenfalls einem
anderen Bieter zu übereignen) reduziert werden. Auch die weitgehende Standardi-
sierung der Fahrzeuge und die Sicherstellung größtmöglicher Interoperabilität re-
duziert Wiederverwendungsrisiken, da so die Veräußerung oder die alternative
Verwendung der Fahrzeuge nach dem Auslaufen eines Verkehrsvertrags erleichtert
wird.
Große Beschaffungsmengen und die damit verbundenen hohen Finanzierungskos-
ten sind für kleine Unternehmen nur mit Schwierigkeiten zu bewältigen
(Markteintrittsbarriere). Die Bereitstellung des Rollmaterials über einen Fahrzeug-
pool ist eine Maßnahme zur Senkung von Markteintrittsbarrieren. Neben der Bil-

286
dung eines öffentlichen Aufgabenträgerpools kommt auch die Dienstleistung priva-
ter Poolbetreiber in Betracht.
Ein Aufgabenträgerpool erfordert hohe fachliche Kompetenz für Fahrzeugfragen,
die traditionell stärker auf der Seite der Unternehmen vorhanden ist. Gerade bei
Bedarf für Spezialfahrzeuge, die eine besondere Ausstattung wie zum Beispiel
Zahnradantrieb, abweichende Fußbodenhöhen, ein besonderes Stromsystem oder
ähnliches aufweisen, kann die Vorhaltung beim Besteller jedoch sinnvoll sein, wie
das Beispiel der für die Odenwaldbahn etablierten Fahma Fahrzeugmanagement
GmbH zeigt. Auch hier wurden Markteintrittsbarrieren für kleinere Bieter gesenkt.
Von hoher Bedeutung ist das Einplanen ausreichender Vorlaufzeiten für die Be-
schaffung der Fahrzeuge. Kurze Fristen führen tendenziell zu höheren Beschaf-
fungskosten, da die Produktionsabläufe der Industrie nur bei ausreichendem Vor-
lauf effizient planbar sind.
Der Anteil „unproduktiver“ Fahrzeuge, die nur als Werkstattreserve oder für die
Abdeckung kurzzeitiger Spitzenstundenkapazitäten benötigt werden, sollte auf das
verkehrlich notwendige Maß beschränkt werden. Wichtige Stellschraube für die Ef-
fizienz ist hier bereits die Netzbildung (je kleiner die Netze sind, desto höher ist in
der Regel der Anteil an Reservefahrzeugen).
Im Vergleich der Instrumente Wiedereinsatzgarantie (Beispiel Schleswig-Holstein)
und Fahrzeugpool (Beispiel Hessen) weist die Wiedereinsatzgarantie den deutlich
geringeren Aufwand auf. Allerdings ist der Einfluss auf die Fahrzeugauswahl gerin-
ger als beim eigenen Pool des Bestellers. Ein großer Vorteil des Fahrzeugpools
liegt darin, dass die Zeitspanne zwischen Beginn des Vergabeverfahrens und Be-
triebsaufnahme deutlich verkürzt werden kann, da die Fahrzeugbeschaffung be-
reits vor der Auswahl des Betreibers ausgelöst wird. Beide Instrumente binden den
Besteller an die Fahrzeuge über den ersten Vergabezeitraum hinaus.
Umgang mit Infrastruktur
Hinsichtlich des Umgangs mit der Infrastruktur bedarf es klarer Rahmenbedingungen (zum
Beispiel bei geplanten Um- und Ausbauvorhaben). Es darf keine Überwälzung von Infrastruk-
tur-Risiken auf TUs erfolgen, die diese Risiken nicht beeinflussen können. Dies gilt insbeson-
dere bei einer Konstellation, in der ein integriertes Unternehmen am Wettbewerb teilnimmt,
das sich durch seine Verfügungsgewalt über die Infrastruktur Wettbewerbsvorteile verschaf-
fen und/oder seine Konkurrenten behindern könnte.
Die Einflussnahmemöglichkeiten der SBB über ihre Rolle als Infrastrukturunternehmen müs-
sen in diesem Zusammenhang bedacht werden. Die Problematik der fehlenden Einfahrt-
möglichkeit für die Marschbahn in den Hamburger Hauptbahnhof zeigt die Risiken auf, die in
einer nicht zufrieden stellenden Konstellation auftreten können. Aus diesem Grunde sollten

287
dem Betreiber die Infrastrukturrisiken durch entsprechend formulierte Verkehrsverträge ab-
genommen werden.

288
Wettbewerberlandschaft
Abschließender Erfolgsbaustein des Ausschreibungswettbewerbs ist eine aktive Wettbewer-
berlandschaft, die sich den Bestellern als aktive Branche präsentiert und die gegenüber der
öffentlichen Hand die Sichtweise und Anforderungen aus Betreibersicht artikuliert. Gleichzei-
tig sollten auch die Besteller um einen intensiven Meinungs- und Erfahrungsaustausch mit
den Betreibern bemüht sein.
Hinsichtlich der aktuellen Entwicklungen im Schweizer Bahnmarkt ist anzumerken, dass be-
stehende Konzentrationstendenzen zum Aufbau potenzieller Wettbewerber gegenüber dem
Incumbent genutzt werden könnten, um eine aktive Wettbewerbslandschaft bereits durch
Schweizer Unternehmen zu initiieren. Ein Benchmarking zwischen den Unternehmen kann
dabei als strategischer Schritt zur Vorbereitung auf den Wettbewerb dienen.
5.3.2 Misserfolgsfaktoren
Fehlende Abstimmung
Auf der Bestellerseite sind zwischen mehreren Aufgabenträgern nicht abgestimmte Wettbe-
werbsstrategien und Vorgehensweisen eine wesentliche Ursache für Misserfolge im SPNV-
Wettbewerb.
Dies umfasst zum einen die zeitliche Staffelung der Verfahren. So können zum Bei-
spiel zyklische Abfolgen von Phasen vieler gleichzeitig laufender Vergaben und
Phasen geringer Vergabeintensität die Bearbeitungskosten bei den Bietern steigen
lassen (ineffiziente Angebotsbearbeitung).
Gleichzeitig können diese Phasen im Falle der Vorgabe von Neufahrzeugen bei den
Fahrzeugkosten Preis treibend wirken, da die Produktionskapazitäten der Industrie
ineffizient ausgelastet beziehungsweise überlastet werden.
Für das Einzelverfahren ist die bestellerübergreifende Abstimmung besonders rele-
vant bei Verkehren, die die Nahverkehrsräume des jeweiligen Bestellers überschei-
ten. Eine rein am Territorialprinzip orientierte Strategie verhindert hier sachgerech-
te Lösungen. Vielmehr muss in aus Kundensicht verkehrlich sinnvollen Korridoren
gemeinsam agiert werden.
Gerade angesichts der kleinteiligen Aufgabenträgerstrukturen auf Kantonsebene ist
die kantonsübergreifende Abstimmung der Strategien innerhalb der Schweiz wich-
tig. Hier sollte dem Bund/dem BAV eine koordinierende Rolle zugedacht werden.
Mangelnde Transparenz
Ein anderer Misserfolgsfaktor könnte eine mangelnde Transparenz hinsichtlich der Darstel-
lung von Zielen, Entscheidungs- und Bewertungsprozessen bei Ausschreibungen sein. Diese
erschwert es den Bietern, bei ihrer Angebotserstellung eine aussichtsreiche Strategie anzu-

289
wenden. Bei Unklarheit über die erforderliche Herangehensweise aus Sicht der Betreiber
sinkt die Wahrscheinlichkeit, ausreichend viele und gute Angebote zu erhalten.
Gerade im Verhältnis zu einem flächendeckend präsenten Anbieter besteht häufig die Gefahr,
dass sich Besteller gegeneinander ausspielen lassen, indem das Unternehmen mit (vermeint-
lichen) Privilegien (zum Beispiel Angebotsverbesserungen, neue Fahrzeuge etc.; gegebenen-
falls aber auch Koppelgeschäfte mit SPNV-fremden Leistungen im Infrastruktur- oder Fern-
verkehrsbereich) lockt und hierfür auf den Verzicht von Ausschreibungen drängt. Durch die
Auswirkungen auf benachbarte Besteller, zum Beispiel bei lang laufenden Durchmesserlinien,
die damit im Gesamtlauf nicht ausgeschrieben werden können, gehen solche Verlockungen
in der Regel zu Lasten der Gesamtheit der Besteller.
Marktmacht des Incumbent
Erschwerend für den Erfolg von Ausschreibungen kann eine heterogene Anbieterstruktur mit
einem dominanten Marktakteur wirken. Derartige Marktakteure stellen in den meisten Märk-
ten die am Wettbewerb teilnehmenden, ehemaligen Staatsbahnen dar. Neben verschiedenen
Diskriminierungspotenzialen, deren Entschärfung von einer hinreichenden Regulierung ab-
hängt, gibt es komparative Vorteile dieser Akteure aufgrund ihrer Marktmacht durch schiere
Größe. Diese wirkt sich zum Beispiel bei Fahrzeugbeschaffungskosten aus und ist bei staatli-
chen Akteuren besonders relevant hinsichtlich ihrer Vorteile bei der Fremdkapitalbeschaffung
(Zinskostenvorteile durch Staatshaftung). Gerade wenn bei anderen Kriterien, wie zum Bei-
spiel beim Personaleinsatz im Falle einer Übernahmeverpflichtung, nur wenig Spielraum be-
steht, kann dies zu Vorteilen für bestimmte Akteure führen. Dies würde weitere Wettbewer-
ber von der Teilnahme an Ausschreibungsverfahren mangels Aussicht auf Erfolg abschre-
cken.

290
5.4 Handlungsempfehlungen für die Schweiz
Eigentümerrolle versus Bestellerrolle
Schädlich für den Erfolg von Ausschreibungen ist eine inkonsistente Strategie der öffentli-
chen Hand durch eine Verquickung von Eigentümerinteressen und verkehrspolitischer Gestal-
tungsverantwortung innerhalb einer Institution. Dies führt häufig zur unterschwelligen Ziel-
vorstellung von einem Wettbewerb, der Unternehmen im öffentlichen Besitz nicht zum Nach-
teil gereichen darf.
In der Schweiz gibt es sowohl auf der Bundes- als auch auf der Kantonsebene zahlreiche
derartige Doppelrollen, die aus öffentlichen Eigentumsanteilen an perspektivisch im Wettbe-
werb agierenden Verkehrsunternehmen resultieren. Konsequenteste Maßnahme (mit den
stärksten Veränderungen) wäre der Rückzug des Staates aus den operativen Transport-
Betriebseinheiten und die Beschränkung auf die Gestaltung des Bahnmarktes für Personen-
schienenverkehrsleistungen inklusive der Vorhaltung der Infrastruktur.
Ist ein solcher Schritt absehbar nicht umsetzbar oder nicht erwünscht, kommt einer transpa-
renten Rollenteilung und klaren Prioritätensetzungen hohe Bedeutung zu. Interessenkonflikte
beteiligter Akteure (zum Beispiel in Form von Doppelrollen als politischer Amtsträger oder
Verwaltungsmitarbeiter und Aufsichtsratsfunktion beim Unternehmen) sollten so weit als
möglich vermieden werden.
Da für die Sicherstellung eines diskriminierungsfreien Wettbewerbs das Verhalten des In-
cumbent von großer Bedeutung ist – insbesondere wenn dieser durch die konzernintegrierte
Infrastruktur über Diskriminierungspotenzial verfügt – ist im Verhältnis zwischen Eigentümer
und Verkehrsunternehmen gegebenenfalls auch das erwartete Rollenverständnis zu definie-
ren: wird die Strategie einer Kooperation oder einer Obstruktion verfolgt?. Ausländische Bei-
spiele zeigen, dass auf diese Weise sehr entscheidend zum Entstehen oder Verhindern funk-
tionierender Verkehrsmärkte beigetragen werden kann.
Stärkung der Bestellerstrukturen
Der kleinteiligen Struktur der Besteller des abgeltungspflichtigen Verkehrs auf Kantonsebene
stehen bereits heute – mit der SBB und den größeren „Privatbahnen“ – Akteure gegenüber,
die in mehreren Regionen oder in der ganzen Schweiz aktiv sind, teilweise auch mit realer
Ausschreibungserfahrung aus dem Ausland. Dies kann zu Informationsasymmetrien führen
und die Verhandlungsposition der Besteller schwächen. Die Liberalisierung des Schienenper-
sonenverkehrs öffnet den Markt für neue Player mit internationaler Erfahrung, was das Un-
gleichgewicht weiter verstärken kann.
Vor diesem Hintergrund ist ein kooperatives Vorgehen der Kantone von hoher Bedeutung.
Eine strategische Vernetzung auf Bundesebene unter Einbindung der Eidgenossenschaft
(zum Beispiel BAV) könnte hier unterstützend wirken. Es sollte ein intensiver Erfahrungsaus-

291
tausch institutionalisiert werden, der der Bestellerseite eine starke Stellung gegenüber über-
regional, bundes- oder europaweit agierenden Unternehmen sichert.
Beseitigung von Diskriminierungspotenzial
Diskriminierungspotentiale bei Ausschreibungen können insbesondere immer dann entste-
hen, wenn ein Unternehmen für seine Leistungserbringung von der Vorleistung eines Kon-
kurrenten abhängig ist und das Unternehmen das entsprechende Risiko trägt. Diskriminie-
rungspotenziale liegen zum Beispiel in den Bereichen Infrastruktur (Zuweisung und Beprei-
sung von Zugtrassen, Stationsgebühren, Nebenleistungen), Vertrieb, Bereitstellung von
Fahrzeugen und Personal sowie bei Instandhaltungskapazität vor. Sofern unterschiedliche
Betreiber auf gleichen Strecken parallel Personenverkehrsleistungen erbringen und jeweils
das eigene Erlösrisiko tragen, müssen auch im Tarifbereich Diskriminierungspotenziale aus-
geschlossen sein. Organisatorisch kann die Beseitigung von Diskriminierungspotenzial am
Besten durch eine neutrale Stellung und Organisationsstruktur gemeinschaftlich genutzter
Einrichtungen erfolgen, deren Duplizierung nicht sinnvoll wäre.
Gelingt dies auf organisatorisch-gesellschaftsrechtlicher Ebene nicht, ist die Einhaltung der
Diskriminierungsfreiheit durch Regulierungsmechanismen sicherzustellen. Die internationalen
Erfahrungen zeigen allerdings, dass dies nur die zweitbeste Lösung ist, denn Regulierung
greift erst im Nachhinein korrigierend ein und kann damit Unzulässiges zwar beseitigen, aber
kaum aktiv Positives gestalten.
Kompensation von Marktdefiziten durch Vergabekonzeption
Auf der Basis einer fundierten Analyse der Wettbewerbssituation der auszuschreibenden
Strecken sowie der Rahmenbedingungen der Marktorganisation können Ausschreibungen
von abgeltungspflichtigen Schienenverkehrsleistungen so gestaltet werden, dass möglicher-
weise bestehende Diskriminierungspotentiale weitestgehend egalisiert werden. Als Regulativ
fungiert damit die Wahl des Ausschreibungsdesigns, die auf die jeweilige Situation (Betrei-
berstruktur und verkehrliche Situation) vor Ort passgenau ausgerichtet sein sollte. Dabei
kann der Besteller insbesondere durch einheitliche Vorgaben (zum Beispiel Neufahrzeuge,
um nicht Bieter ohne Gebrauchtfahrzeugzugriff zu benachteiligen), eigene Risikoübernahme
(zum Beispiel Bruttovertrag bei unklaren Erlösrisiken) und eigene Vorabfestlegung von kriti-
schen Faktoren (zum Beispiel Beschaffung von Fahrzeugen, Vorgaben zur Poolnutzung,
betreiberneutrale Fahrplankonstruktion) Chancengleichheit sicherstellen.

292
6 Zusammenfassung und Ausblick
6.1 Zusammenfassung
Die in dieser Untersuchung betrachteten deutschen Bundesländer Schleswig-Holstein und
Hessen haben sich jeweils klar für eine wettbewerbliche Vergabe von SPNV-Leistungen aus-
gesprochen. Ermutigt durch erste positive Erfahrungen bei der Ausschreibung von SPNV-
Leistungen haben beide Länder jeweils ein entsprechendes Wettbewerbskonzept mit einem
Ausschreibungsfahrplan entwickelt, der die zeitlich gestaffelte Vergabe aller SPNV-Leistungen
vorsieht.
Im Rahmen dieser Studie wurden die Auswirkungen der Ausschreibung der Marschbahn und
der Odenwaldbahn näher betrachtet. Wie diese Fallbeispiele zeigen, ist die Nutzung von Aus-
schreibungen bei der Vergabe von SPNV-Leistungen aus Sicht der öffentlichen Hand insge-
samt positiv zu bewerten. Der Zuschussbedarf konnte in den betrachteten Fällen in Schles-
wig-Holstein und Hessen gesenkt beziehungsweise die Preise für die Verkehrsdienstleistung
stabilisiert werden. Gleichzeitig wurde die Qualität in beiden Fallbeispielen, insbesondere bei
neuem Fahrzeugmaterial, deutlich verbessert. Dabei konnten Risiken aus der Beschaffung
von Fahrzeugen und die damit einhergehenden Markteintrittsbarrieren aus Sicht der Betrei-
ber über die Nutzung der Instrumente Wiedereinsatzgarantie beziehungsweise Fahrzeugpool
minimiert werden.
Im betrieblichen Bereich waren in beiden Fallbeispielen aus unterschiedlichen Gründen an-
fänglich erhebliche Probleme aufgetreten, was insbesondere im Bereich der Pünktlichkeit die
Angebotsqualität vorübergehend einschränkte. Die Gesamtqualität ist dennoch gegenüber
der Qualität des Altbetreibers erheblich gestiegen. Die Initiativen des Betreibers im Bereich
der Innovationen scheinen dabei im Falle der mit einem Nettovertrag ausgeschriebenen
Marschbahn etwas stärker ausgeprägt zu sein, als im Falle der mit einem Bruttovertrag aus-
geschriebenen Odenwaldbahn. Auswirkungen im Bereich der Fahrpreise ergeben sich ledig-
lich auf der Marschbahn (Netz West), wo sich der Betreiber zu einem geringfügigen Auf-
schlag für den Fernverkehr entschied. Eine Fahrpreiserhöhung im Nahverkehr erfolgte bis-
lang - trotz Gestaltungsmöglichkeiten - nicht. Allerdings zeigt sich bei einer näheren Betrach-
tung des Fahrgelderlöspotenzials und der Beeinflussbarkeit der Fahrtarife, dass eine hinrei-
chende Abschätzbarkeit aus Sicht der Betreiber nur in Grenzen gegeben ist.
Die Profitabilität der Betreiber scheint im Ausschreibungswettbewerb etwas zurückzugehen.
Dies erscheint allerdings angesichts des Ausgangsniveaus eines nicht wettbewerblich organi-
sierten Marktes mit zum Teil monopolartigen Renditen nicht verwunderlich. Die Löhne gerie-
ten etwas unter Druck, sanken bislang aber nicht auf das aus tarifvertraglicher Sicht niedrigst
mögliche Niveau. Die Anzahl der Arbeitsplätze im operativen Bereich blieb insgesamt relativ
konstant.

293
6.2 Ausblick
Die skizzierten Fallbeispiele im deutschen Ausschreibungswettbewerb für SPNV-Leistungen
zeigen insgesamt ein positives Bild. Dieses deckt sich weitgehend mit den Erfahrungen bei
der Nutzung des Instruments der Ausschreibung von SPNV-Leistungen auf anderen Strecken
in Deutschland. Aus diesem Grund wird derzeit von den befragten Marktteilnehmern, auch
vor dem Hintergrund der zunehmend schwierigen Lage der öffentlichen Haushalte, von ei-
nem weiter steigenden Ausschreibungsvolumen im deutschen SPNV ausgegangen.
Vor dem Hintergrund dieser Ergebnisse könnte es aus Sicht der Eidgenossenschaft sinnvoll
sein, das Instrument des Ausschreibungswettbewerbs auch bei abgeltungspflichtigen Schie-
nenverkehrsleistungen in der Schweiz als Handlungsoption zu prüfen. Für die Kantone be-
stünde hierbei die Möglichkeit, bei weiter steigendem Qualitätsniveau den Zuschussbedarf zu
reduzieren beziehungsweise die Kosten für die öffentliche Hand trotz Qualitätssteigerung zu
stabilisieren. Wichtige Errungenschaften der Schweiz, wie der landesweite integrale Taktver-
kehr oder integrierte Fahrplaninformation könnten so in einem veränderten Marktumfeld
gesichert werden.
Bei der Nutzung des Instruments der Ausschreibung von abgeltungspflichtigen Schienenver-
kehrsleistungen sind jedoch eine Vielzahl von Erfolgsfaktoren zu berücksichtigen. Hierzu ge-
hören insbesondere die Erarbeitung eines Wettbewerbskonzepts, die Einbindung aller Betei-
ligten und die klare Zieldefinition vor Durchführung jedes einzelnen Verfahrens. Weiterhin
sind die Sicherung von Transparenz und Nichtdiskriminierung, die Vermeidung von Infra-
strukturrisiken für den Betreiber, die Berücksichtigung der Fahrzeugkosten bei der Vergabe-
konzeption (gegebenenfalls über die Nutzung der Wiedereinsatzgarantie oder des Fahrzeug-
pools) und die Setzung von Anreizen im Verfahren und im laufenden Betrieb von hoher Be-
deutung. Schließlich ist es erforderlich, einen hinreichend aktiven SPNV-Betreibermarkt und
potente Bestellerstrukturen zu etablieren. Für die Gesamtschweiz erscheint es sinnvoll, die
Rolle des Eigentümers von Verkehrsunternehmen stärker von der Rolle der Steuerung der
verkehrspolitischen Interessen zu trennen. Im Bereich der Infrastruktur ist darüber hinaus
ein diskriminierungsfreier Zugang zu gewährleisten. Die Berücksichtigung der hier aufgeliste-
ten Maßnahmen, die lediglich einen kurzen Überblick wesentlicher Aktivitäten darstellen,
könnte helfen, die im Rahmen dieser Studie aufgezeigten positiven Ergebnisse des Aus-
schreibungswettbewerbs auch für die Schweiz nutzbar zu machen.

294
Literaturverzeichnis
Achenbach, H: Der Wettbewerb im ÖPNV in Hessen am Beispiel des Rhein-Main-
Verkehrsverbundes, in: Öffentlicher Personennahverkehr – Herausforderungen und
Chancen, ifmo – Institut für Mobilitätsforschung (Hrsg.), Berlin 2006, S. 175 ff.
Anders, F.J.: Die Rosinen erst zum Nachtisch – Direktvergaben der Aufgabenträger
zementieren Marktmacht der DB, Bahn-Report 2003, 3, S. 21 ff.
Anders, J./Kramer, U.: Neue vergaberechtliche Entscheidungen zum Wettbewerb
im SPNV, Bahn-Report 2003, 5, S. 70 f.
Beck, A.: Der Fluch des Gewinners, Der Nahverkehr 2006, 4, S. 29 ff.
Berschin, F.: Kein Platz auf der Hamburger Verbindungsbahn?, Bahn-Report 2006,
5, S. 29 ff.
Blankart, C.B.: Daseinsvorsorge ökonomisch betrachtet, Zeitschrift für Wirtschafts-
politik 2002, Jg. 51, 1, S. 28-41.
Borrmann, J./Finsinger, J.: Markt und Regulierung, München 1999.
Eichmann, V./Berschin, F./Bracher, T./Winter, M.: Difu-Arbeitshilfe Umweltfreund-
licher, attraktiver und leistungsfähiger ÖPNV – Ein Handbuch, Berlin 2006.
Holzhey, M./Tegner, H.: Wettbewerb im Schienenverkehr – Kaum gewonnen,
schon zerronnen? – Erster unternehmensneutraler Wettbewerbsbericht, MehrBah-
nen – Vereinigung für Wettbewerb im Schienenverkehr e.V. (Hrsg.), Mettmann
2004.
Laeger, J. : Wettbewerb und Regionalisierung im SPNV – Ein Handbuch,
Röhr-Verlag für spez. Verkehrsliteratur, Krefeld 2004.
Lumma, B.: Neue Schnellbuslinie, nah-sh, 2006, 1, S. 3.
ProBahn: Betreiberwechsel auf der Odenwaldbahn –
„Sardino“ für Pendler, derFahrgast 2006, 4, S. 7 ff.
Rohwer, B.: Schleswig-Holstein reaps the benefits of competition, Railway Gazette
2002, 12, S. 773 ff.
Snethlage, W.-H.: Privatisierung durch Ausschreibungsverfahren, Berlin 2001.
Wewers, B.: Vom Interregio zum Schleswig-Holstein-Express – Erfahrungen und
Lehren aus Sicht eines Aufgabenträgers, Der Nahverkehr 2004, S. 48 ff.
Werner, J./Schaaffkamp, C.: “Daseinsvorsorge im Wettbewerb – quo vadis öffent-
licher Personennahverkehr?”, in: Libbe, J./Tomerius, S./Trapp, J.H.: Liberalisierung

295
und Privatisierung kommunaler Aufgabenerfüllung – Soziale und umweltpolitische
Perspektiven im Zeichen des Wettbewerbs, Difu-Beiträge zur Stadtforschung, 37,
Deutsches Institut für Urbanistik, Berlin 2003.
Wolfstetter, Elmar: Topics in Microeconomic Theory – Industrial Organization, Auc-
tions and Incentives, Cambridge 1999.

296
Dokumentenverzeichnis
BAG SPNV: SPNV in Deutschland – Mobilität sichern, Berlin 2006.
Bahn-Report: RMV-Ausschreibungsfahrplan 2003-2014, 03/03, S. 62, Paderborn
2003.
Bahn-Report: KBS 130 Hamburg – Itzehoe – Westerland (Sylt), 3/04, S. 35, Pa-
derborn 2004.
Bahn-Report: Fahrgastrechte in Schleswig-Holstein, 03/06, S. 42, Paderborn 2006.
Bahn-Report: VIAS: Startproblem auf der Odenwaldbahn, 2/06, S. 8, Paderborn
2006.
Bundesamt für Verkehr (Schweiz): Modal Split-Ziele in der schweizerischen Ver-
kehrspolitik, 2003.
Bundesverband der Deutschen Industrie und Deutscher Industrie- und Handels-
kammertag: Privatisierung der integrierten DB AG – Auswirkungen und Alternati-
ven, Berlin 2005.
Deutsche Bahn AG: Wettbewerbsbericht 2004, Berlin 2004.
Deutsche Bahn AG: Wettbewerbsbericht 2005, Berlin, 2005.
Deutsche Bahn AG: Wettbewerbsbericht 2006, Berlin, 2006.
Ecoplan: Evaluation EBG '96, Studie im Auftrag des Bundesamts für Verkehr BAV,
Bern/Altdorf 2005.
EU-Kommission: Railimplement – Implementation of EU Directives 2001/12/EC,
2001/13/EC and 2001/14/EC, Brüssel 2005.
EU-Kommission: Weißbuch über die europäische Verkehrspolitik bis 2010: Wei-
chenstellungen für die Zukunft, Brüssel, 12.09.2001, KOM(2001) 370
Hessisches Ministerium für Wirtschaft, Verkehr und Landesentwicklung: Wettbe-
werb im öffentlichen Personennahverkehr aus Sicht des Landes Hessen, Wiesba-
den 2004.
Landtag Schleswig-Holstein: Die Zukunft des ÖPNV in Schleswig-Holstein, Antwort
der Landesregierung auf die Große Anfrage der Fraktion Bündnis 90/Die Grünen,
Drucksache 15/531, 2001.
LVS Schleswig-Holstein Landesweite Verkehrsservicegesellschaft mbH: Ausschrei-
bung von SPNV – Leistungen in Schleswig-Holstein, Netz West, Verdingungsunter-
lagen Anlage 10: Verkehrsvertrag (2002).

297
LVS Schleswig-Holstein Landesweite Verkehrsservicegesellschaft mbH: Pressemit-
teilung: HSH Nordbank finanziert Sylt-Express, 28.07.2005.
LVS Schleswig-Holstein Landesweite Verkehrsservicegesellschaft mbH: Pressemit-
teilung: Schlechter Start der Nord-Ostsee-Bahn, 04.01.2006.
LVS Schleswig-Holstein Landesweite Verkehrsservicegesellschaft mbH: Pressemit-
teilung: Nord-Ostsee-Bahn fährt pünktlicher, 12.01.2006.
LVS Schleswig-Holstein Landesweite Verkehrsservicegesellschaft mbH: Pressemit-
teilung: Pünktlichkeit im LVS Schleswig-Holstein Landesweite Verkehrsservicege-
sellschaft mbH: Nahverkehr im Januar deutlich besser, 08.02.2006.
LVS Schleswig-Holstein Landesweite Verkehrsservicegesellschaft mbH: Pressemit-
teilung: Pünktlichkeit der NOB im Februar weiter verbessert, 06.03.2006.
LVS Schleswig-Holstein Landesweite Verkehrsservicegesellschaft mbH: Zweiter
Landesweiter Nahverkehrsplan für den Schienenpersonennahverkehr in Schleswig-
Holstein (LNVP 2003-2007), Ministerium für Wirtschaft, Arbeit und Verkehr des
Landes Schleswig-Holstein (Hrg.), Kiel 2003.
Nord-Ostsee-Bahn: Pressemitteilung: NOB bringt 100 Arbeitsplätze, 16.12.2004.
Nord-Ostsee-Bahn: Pressemitteilung: Nord-Ostsee-Bahn: Mehr Züge zur Kieler
Woche, 16.06.2005.
Nord-Ostsee-Bahn: Pressemitteilung: Richtfest bei der NOB-Werkstatt in Husum,
07.09.2005.
Nord-Ostsee-Bahn: Pressemitteilung: NOB stellt neuen Zug in Kiel vor, 19.09.2005.
Nord-Ostsee-Bahn: Pressemitteilung: NOB macht Fahrkartenkauf kinderleicht,
04.12.2005.
Nord-Ostsee-Bahn: Pressemitteilung: Tarifänderung im Fernverkehr auf der Stre-
cke Hamburg–Sylt, 28.03.2006.
OECD: Structural Reform In The Rail Industry, 2005.
omniphon GmbH: Landesweite Marktforschung 2005 in Schleswig-Holstein, LVS
Schleswig-Holstein Landesweite Verkehrsservicegesellschaft mbH (Hrsg.), Kiel
2006.
RMV: Pressemitteilung: VGF und Rurtalbahn betreiben die "Neue Odenwaldbahn",
10.01.2005.
RMV: Pressemitteilung: Neue Odenwaldbahn ein großer Erfolg, 24.01.2006.
RMV: Pressemitteilung: Auch RMV sieht sich in der Verantwortung, 23.03.2006.

298
RMV: Pressemitteilung: Wegen des großen Erfolgs: Drei weitere neue Fahrzeuge
für die Odenwald-Bahn, 12.07.2006.
RMV: Regionaler Nahverkehrsplan 2004 bis 2009, Hofheim 2004.
Staatssekretariat für Wirtschaft -SECO-: Bericht zur Dienstleistungsliberalisierung
in der Schweiz im Vergleich zur EU, Grundlagen der Wirtschaftspolitik – Studien-
reihe des Staatssekretariats für Wirtschaft – Direktion für Wirtschaftspolitik, No-
vember 2005 .
Verband Deutscher Verkehrsunternehmen e. V.: Diskussionspapier "Neuer Konsens
zur Finanzierung des ÖPNV" – VDV-Mitteilung Nr. 9035 vom 13.09.2005.
VIAS-Faltblatt: Eine gute Verbindung, Frankfurt 2005.
ZAST GmbH: Kooperationsvertrag betreffend der ZAST GmbH vom 19.10.2005
ZAST GmbH: Tarifanwendungs- und Kooperationsvertrag Schleswig-Holstein-Tarif
(SH-Tarif) vom 19.10.2005.
Verzeichnis sonstiger Internetquellen
Bundesamt für Statistik der Schweiz,
http://www.bfs.admin.ch/bfs/portal/de/index/ the-
men/verkehr_und_nachrichtenwesen/uebersicht/blank/wichtigste_kennzahlen.html
, Download vom 27.09.2006.
Bundesamt für Statistik der Schweiz: Eisenbahnen: Betriebsleistungen Bundesamt
für Statistik BFS,
http://www.bfs.admin.ch/bfs/portal/de/index/themen/verkehr_und_nachrichtenwe
sen/uebersicht/blank/analysen__berichte/oev/02.html, Download vom 27.09.2006.
Bundesamt für Statistik der Schweiz: Eisenbahnen: Eigentumslänge
Bundesamt für Statistik BFS,
http://www.bfs.admin.ch/bfs/portal/de/index/themen/ ver-
kehr_und_nachrichtenwesen/uebersicht/blank/analysen__berichte/oev/02.html,
Download vom 27.09.2006.
Bundesamt für Statistik der Schweiz: Eisenbahnen: Verkehrsleistungen im Perso-
nenverkehr,
Bundesamt für Statistik BFS,
http://www.bfs.admin.ch/bfs/portal/de/index/themen/ ver-
kehr_und_nachrichtenwesen/uebersicht/blank/analysen__berichte/oev/02.html,
Download vom 27.09.2006.

299
Departement für Umwelt, Verkehr, Energie und Kommunikation: Die SBB bewegt
die Schweiz,
http://www.uvek.admin.ch/themen/00681/00685/index.html?lang=de, Download
vom 27.09.2006.
Harz-Elbe-Express: www.hex.de, Download vom 21.09.2006.
Odenwaldbahn, http://www.oreg.de/odenwaldbahn/, Download vom 27.09.2006.
Statistisches Landesamt Hessen: http://www.statistik-hessen.de/themenauswahl/
verkehr-umwelt/landesdaten/verkehrsleistungen/fahrgaeste-und-
befoerderungsleistung/ index.html, Download vom 24.09.2006.

300
Verzeichnis der Gesprächspartner
Achenbach, H.: Bereichsleiter Bestellmanagement der Rhein-Main Verkehrsver-
bund GmbH, Experteninterview am 22.08.2006 in Hofheim (Taunus).
Berschin, F.: Nahverkehrsexperte, beriet den Aufgabenträger im Zuge der Vergabe
der Marschbahn, Experteninterview am 28.07.2006 in Berlin.
Carstensen, C.: Stellvertretender Geschäftsführer der Nord-Ostsee-Bahn GmbH
(Betreiber in Schleswig-Holstein, Veolia Gruppe), Experteninterview am 01.08.2006
in Berlin.
Dauberthäuser, K.: Geschäftsführer fahma Fahrzeugmanagement GmbH, Exper-
teninterview am 22.08.2006 in Hofheim (Taunus).
Michelmann, H.: Ehemals Vorstand der Flex Verkehrs AG (SPNV-Betreiber in
Schleswig-Holstein), Experteninterview am 20.07.2006 in Berlin.
Reh, T.: Leiter Marketing DB Regio AG, Region Nord, Regionalbahn Schleswig-
Holstein, telefonisches Experteninterview am 26.09.2006.
Runge, P.: Leiter Angebotsplanung und Verkehr, telefonisches Experteninterview
am 04.12.2006.
Tegner, H.: Ehemals Berater bei der PSPC GmbH (entwickelte die Wiedereinsatz-
garantie für Fahrzeuge für die Vergabe der Marschbahn), Experteninterview am
28.07.2006 in Berlin.
von Aweyden, J.: Tarifexperte der ZAST GmbH – Zentrale Abrechnungsstelle
Schleswig-Holstein-Tarif, telefonisches Experteninterview am 17.11.2006
Wewers, B.: Geschäftsführer der LVS Landesweite Verkehrsservicegesellschaft
mbH (SPNV-Aufgabenträger für Schleswig-Holstein), gleichzeitig Vorsitzender der
Bundesarbeitsgemeinschaft der SPNV-Aufgabenträger (BAG-SPNV), Experteninter-
view am 17.08.2006 in Kiel.

301
Anhang
Tabelle 7: Bislang öffentlich ausgeschriebene Verkehre in Schleswig-Holstein
Linie(n) Zugkm/ Jahr
Jahr der Vergabe
Ausschrei-bungs-gewinner
Netz Nord (A) (Verhandlungsverfahren mit Teilnahmewettbewerb)109
Kiel – Flensburg 1.300.000 1998 DB Regio AG
Netz Nord (B) (Verhandlungsverfahren mit Teilnahmewettbewerb)
Kiel – Husum, Husum – St. Peter Ording, Kiel – Neumüns-ter
2.400.000 1998 Nord-Ostsee-Bahn (Veolia Gruppe)
Neumünster – Bad Oldesloe (Verhandlungsverfahren mit Teilnahmewettbewerb)
Neumünster – Bad Oldesloe 600.000 1999 nordbahn (Joint Venture aus AKN und Hamburger Hochbahn AG)
Heide-Büsum(Verhandlungsverfahren mit Teilnahmewettbewerb)
Heide – Büsum 300.000 1999 AKN Eisenbahn AG (AKN)
Neumünster-Büsum (Offenes europaweites Verfah-ren)110
Neumünster – Büsum 800.000 2000 Schleswig-Holstein-Bahn (AKN-Gruppe)
Flex I (Freihändige Vergabe)111
Hamburg – Flensburg 1.000.000 2002 FLEX AG
Teil-Netz West („Marschbahn“) (Verhandlungsverfahren mit Teilnahmewettbewerb)
Hamburg – Westerland (Sylt) circa 4.200.000
2002 Nord-Ostsee-Bahn (Veolia Gruppe)
Niebüll – Tønder (Preisanfrage)112
Niebüll – Tønder (DK) 100.000 2002 Nord-Ostsee-Bahn (Veolia Gruppe)
Flex II (Preisanfrage)
Hamburg – Flensburg 1.000.000 2003 Nord-Ostsee-Bahn (Veolia Gruppe)
FLEX III (Offenes europaweites Verfah-ren)
Hamburg – Flensburg 1.000.000 2004 Regionalbahn Schleswig-Holstein (DB Regio AG)
Netz Ost (Vergabeverfahren im weiteren Sinn)113
Lübeck – Hamburg, Lübeck – Travemünde, Lübeck – Kiel, Lübeck – Neustadt – Feh-marn, Lübeck – Büchen – Lüneburg, Büchen – Aumühle
circa6.000.000
Voraus-sichtlich 2006
Verfahren noch nicht beendet.
Quelle: Eigene Darstellung auf Basis interner Recherchen.
109 Zweigestuftes Verfahren nach Vergaberecht: Öffentlicher Teilnahmewettbewerb, gegebenenfalls europaweite Aufforderung zur Stellung von Teilnahmeanträgen (1. Stufe), anschließend Verhandlung mit begrenzter Anzahl von Bietern (2. Stufe).
110 Öffentliche, hier auch europaweite Ausschreibung der Leistung in einem einstufigen Verfahren nach Vergaberecht. 111 Direkt vergeben ohne formalisiertes Auswahlverfahren (Anwendung hier aufgrund sehr kurzer Frist). 112 Direktanfrage von Preisen ohne formalisiertes Verfahren, anschließend Direktvergabe ohne formalisiertes Auswahlverfahren
(Anwendung hier aufgrund sehr kurzer Frist). 113 Öffentlich bekannt gegebenes Verwaltungsverfahren nach Verwaltungsverfahrensgesetz zur Ermittlung des Betreibers.

302
Tabelle 8: Bisherige SPNV-Ausschreibungen in Hessen
Netz Linie(n) Zugkm/ Jahr
Jahr der Zuschlags-erteilung
Ausschreibungsgewinner
Hellertalbahn Betzdorf – Dillenburg 300.000 1997 Hellertalbahn GmbH (Konsortium der Westerwaldbahn GmbH, Kreis-bahn Siegen Wittgenstein GmbH und Hessischer Landesbahn GmbH)
Drei-Länderbahn
Finnentrop – Olpe, Siegen – Bad Berleburg, Dillenburg – Siegen – Au (Sieg)
circa1.900.000
2002 DB Regio AG
Westerwald-Taunus-Netz
Limburg – Koblenz, Limburg – Niederhausen – Wiesbaden,Limburg – Montabaur – Siershahn, Limburg – Altenkirchen – Au/Sieg
circa2.400.000
2002 Vectus Verkehrsgesellschaft mbH (Konsortium der Hessischen Lan-desbahn GmbH und der Wester-waldbahn GmbH)
Nordost-Hessen-Netz
Göttingen – Eichenberg – Kassel,Kassel – Bebra – Fulda, Bebra – Eisenach, Göttingen – Eschwege – Bebra
circa3.600.000
2005 cantus Verkehrsgesellschaft mbH (Konsortium der Hamburger Hoch-bahn AG und der Hessischen Lan-desbahn GmbH)
Odenwaldbahn Frankfurt-Hanau-Wiebelsbach-Heubach-Erbach, Darmstadt-Wiebelsbach-Heubach-Erbach-Eberbach
circa1.800.000
2005 VIAS GmbH (Konsortium aus Ver-kehrsgesellschaft Frankfurt mbH und Rurtalbahn GmbH)
Süd-Hessen-Netz
Wiesbaden – Darmstadt – Babenhausen – Aschaf-fenburg
circa1.100.000
2006 DB Regio AG
Teilnetz Tau-nustrecke
Frankfurt – Niederhausen – Limburg
circa1.000.000
2006 DB Regio AG
Quelle: Eigene Recherchen.
Tabelle 9: RMV-Ausschreibungsfahrplan 2003-2014
VorgeseheneBetriebsaufnah-me
Vorgesehene Be-kanntmachung im Amtsblatt
Linien Linienverlauf Traktion JährlicheZugkm
Dez. 05 Feb. 04 RE/SE/RB 64/65
Frankfurt/M Hbf – Maintal – Hanau – Eberbach (RE64), Frankfurt/M Hbf – Maintal – Hanau – Wiebelsbach-Heubach (RB 64), Darmstadt – Höchst (Oden-wald) – Eberbach (RE65),Darmstadt – Höchst (Oden-wald) – Eberbach (RB65)
Diesel 1.449.000
Dez. 05 Dez. 04 RE/RB 51 Fulda – Kassel (RE 51), Fulda – Kassel (RB 51)
Elektrisch 379.000
Dez. 06 Dez. 03 SE/RB 30/40
Frankfurt/M Hbf – Gießen – Marburg (SE 30), Friedberg – Gießen – Marburg
Elektrisch 2.309.000

303
VorgeseheneBetriebsaufnah-me
Vorgesehene Be-kanntmachung im Amtsblatt
Linien Linienverlauf Traktion JährlicheZugkm
– Kassel/Bad Wildungen (RB 30),Gießen – Dillenburg – Siegen (RB 40)
Dez. 06 Dez. 03 RE 53 Fulda – Gemünden (RE 53) Elektrisch 263.000
Dez. 07 Dez. 04 RE/RB 25 Koblenz – Limburg – Gießen (RE 25), Koblenz – Limburg – Gießen (RB 25)
Diesel 1.164.000
Dez. 07 Dez. 04 RE/RB 35/52
Gießen – Alsfeld – Fulda (RE 35), Gießen – Alsfeld – Fulda (RB 35), Fulda – Gersfeld (Rhön) (RB 52)
Diesel 1.697.000
Dez. 07 Dez. 04 RB 63/75 Darmstadt – Dieburg – A-schaffenburg (RB 63), Wies-baden – Mainz – Groß Gerau-Darmstadt (RB 75)
Elektrisch 1.152.000
Dez. 07 Dez. 04 RB 43 Marburg – Erndtebrück (RB 43)
Diesel 245.000
Dez. 08 Dez. 05 RE/SE 20 Frankfurt/M Hbf – Niedern-hausen – Limburg (RE 20), Frankfurt/M Hbf – Niedern-hausen – Limburg (SE 20)
Elektrisch 1.038.000
Dez. 09 Dez. 06 RE 10 Frankfurt/M Hbf – Wiesbaden – Rüdesheim – Koblenz (RE 10)
Elektrisch 761.000
Dez. 09 Dez. 06 RB/SE 10 Wiesbaden – Rüdesheim – Koblenz (RE 10), Wiesbaden – Rüdesheim – Koblenz (SE 10)
Elektrisch 600.000
Dez. 09 Dez. 06 RE 30/40 Frankfurt/M Hbf – Gießen – Kassel (RE 30), Frankfurt/M Hbf – Gießen – Siegen (RE 40)
Elektrisch 926.000
Dez. 09 Dez. 06 RB 30 Friedberg – Gießen – Marburg – Kassel/Bad Wildungen (RB 30)
Die-sel/Elektrisch
449.000
Dez. 10 Dez. 07 SE/RB 32/34
Frankfurt/M Hbf – Friedberg – Nidda (SE 32), Friedberg – Nidda (RB 32), Frankfurt/M Hbf – Bad Vilbel – Nidderau – Stockheim (SE 34), Bad Vilbel – Nidderau – Stockheim (RB 34)
Diesel 428.000
Dez. 10 Dez. 07 RE/SE 80 Frankfurt/M Hbf – Mainz – Koblenz/Saarbrücken (RE80), Frankfurt/M – Mainz (SE80)
Die-sel/Elektrisch
423.000
Dez. 11 Dez. 08 SE/RB 61 Frankfurt/M Hbf – Dreieich-Buchschlag – Rödermark – Dieburg (RB 61)
Diesel 512.000
Dez. 12 Juni 09 RE 30 Frankfurt/M Hbf – Gießen – Kassel (RE 30)
Elektrisch 1.180.000
Dez. 12 Juni 09 RE/SE 50 Frankfurt/M Hbf – Hanau – Fulda (RE 50), Frankfurt/M
Elektrisch 2.542.000

304
VorgeseheneBetriebsaufnah-me
Vorgesehene Be-kanntmachung im Amtsblatt
Linien Linienverlauf Traktion JährlicheZugkm
Hbf – Hanau – Wächtersbach (SE 50)
Dez. 12 Juni 09 RE/RB 55/90
Frankfurt/M Hbf – Offenbach – Hanau – Aschaffenburg (RE 55), Frankfurt/M Hbf – Maintal – Hanau – Aschaffenburg (RB 55)
Elektrisch 975.000
Dez. 12 Juni 09 SE 60 Frankfurt/M Hbf – Darmstadt – Mannheim/Heidelberg (SE 60)
Elektrisch 795.000
Dez. 12 Juni 09 RE 70 Frankfurt/M Hbf – Biblis – Mannheim (RE 70)
Elektrisch 715.000
Dez. 14 Juni 11 S1/S2 Wiesbaden – Frankfurt/M Hbf – Rödermark (Ober-Roden) (S1), Niedernhausen – Frank-furt/M Hbf – Dietzenbach (S2)
Elektrisch 2.987.000
Dez. 14 Juni 11 S7/S8/S9 Frankfurt/M Hbf – Goddelau-Erfelden (S7), Wiesbaden – Mainz – Frankfurt Hbf – Ha-nau (S8/S9)
Elektrisch 4.190.000
Dez. 14 Juni 11 S3/S4 Darmstadt – Frankfurt/M Hbf – Bad Soden (S3), Langen – Frankfurt/M Hbf – Kronberg (S4)
Elektrisch 2.119.000
Dez. 14 Juni 11 S5/S6 Frankfurt/M Süd – Frankfurt/M Hbf – Friedrichsdorf (S5), Frankfurt/M Süd – Frankfurt/M Hbf – Friedberg (S6)
Elektrisch 2.506.000
Quelle: Bahnreport 3/03.

305
Abbildung 10: Im Wettbewerb zu vergebende Linienbündel in Hessen
Quelle: Achenbach (2006, S. 183)

In der Reihe „Strukturberichterstattung“ des Staatssekretariats für Wirtschaft sind seit 2000 erschienen:
1 Arvanitis, S. u.a. (2000) Die preisliche Wettbewerbsfähigkeit der schweizerischen Wirtschafts- zweige
22.--
2 Arvanitis, S. u.a. (2001) Untersuchung der internationalen Wettbewerbsfähigkeit der schweizerischen Wirtschaftszweige anhand einer „Constant Market Shares“-Analyse der Exportanteile
18.--
3 Raffelhüschen, B. u.a. (2001) Zur Nachhaltigkeit der schweizerischen Fiskal- und Sozial- politik: Eine Generationenbilanz (ohne Software GAP)
21.--
4 Arvanitis, S. u.a. (2001) Unternehmensgründungen in der schweizerischen Wirtschaft 26.-- 5 Arvanitis, S. u.a. (2001) Innovationsaktivitäten in der Schweizer Wirtschaft. Eine Analyse
der Ergebnisse der Innovationserhebung 1999 34.--
6 Crivelli, L. u.a. (2001) Efficienza nel settore delle case per anziani svizzere 26.-- 7 Hollenstein, H. (2001) Die Wirtschaftsbeziehungen zwischen der Schweiz und Osteuropa 23.-- 8 Henneberger, F. u.a. (2001) Internationalisierung der Produktion und sektoraler Strukturwandel:
Folgen für den Arbeitsmarkt 21.--
9 Arvanitis, S. u.a. (2002) Finanzierung von Innovationsaktivitäten. Eine empirische Analyse anhand von Unternehmensdaten
22.--
10 Arvanitis, S. u.a. (2002) Qualitätsbezogene und technologische Wettbewerbsfähigkeit der schweizerischen Industriezweige. Beurteilung auf Grund der Export- bzw. Importmittelwerte und der Hochtechnologieexporte
18.--
11 Ott, W. u.a. (2002) Globalisierung und Arbeitsmarkt: Chancen und Risiken für die Schweiz 28.-- 1212 Müller, A. u.a. (2002) Globalisierung und die Ursachen der Umverteilung in der Schweiz.
Analyse der strukturellen und sozialen Umverteilungen in den 90-er Jahren mit einem Mehrländer-Gewichtsmodell
24.--
13 Kellermann, K. (2002) Eine Analyse des Zusammenhangs zwischen fortschreitender Globalisierung und der Besteuerung mobiler Faktoren nach dem Äquivalenzprinzip
18.--
14 Infras (2002) Globalisierung, neue Technologien und struktureller Wandel in der Schweiz 28.-- 15 Fluckiger, Y. u.a. (2002) Inégalité des revenues et ouverture au commerce extérieur 20.-- 16 Bodmer, F. (2002) Globalisierung und Steuersystem in der Schweiz 22.-- 17 Arvanitis, S. u.a. (2003) Die Schweiz auf dem Weg zu einer wissensbasierten Ökonomie:
eine Bestandesaufnahme 28.--
18 Koch, Ph. (2003) Regulierungsdichte: Entwicklung und Messung 23.-- 19 Iten, R. u.a. (2003) Hohe Preise in der Schweiz: Ursachen und Wirkungen 36.-- 20 Kuster, J. u.a. (2003) Tourismusdestination Schweiz: Preis- und Kostenunterschiede zwischen
der Schweiz und EU 23.--
21 Eichler, M. u.a. (2003) Preisunterschiede zwischen der Schweiz und der EU. Eine empirische Untersuchung zum Ausmass, zu Erklärungsansätzen und zu volkswirtschaftlichen Konsequenzen
34.--
22 Vaterlaus, St. u.a. (2003) Liberalisierung und Performance in Netzsektoren. Vergleich der Liberalisierungsart von einzelnen Netzsektoren und deren Preis-Leistungs-Entwicklung in ausgewählten Ländern
37.--
23 Arvanitis, S. u.a. (2003) Einfluss von Marktmobilität und Marktstruktur auf die Gewinn- margen von Unternehmen – Eine Analyse auf Branchenebene
23.--
24 Arvanitis, S. u.a. (2004) Innovationsaktivitäten in der Schweizer Wirtschaft – Eine Analyse der Ergebnisse der Innovationserhebung 2002
28.--
25 Borgmann, Ch. u.a. (2004) Zur Entwicklung der Nachhaltigkeit der schweizerischen Fiskal- und Sozialpolitik: Generationenbilanzen 1995-2001
20.--
26D de Chambrier, A. (2004) Die Verwirklichung des Binnenmarktes bei reglementierten Berufen: Grundlagenbericht zur Revision des Bundesgesetzes über den Binnenmarkt
19.--
26F de Chambrier, A. (2004) Les professions réglementées et la construction du marché intérieur: rapport préparatoire à la révision de la loi sur le marché intérieur
19.--
27 Eichler, M. u.a. (2005) Strukturbrüche in der Schweiz: Erkennen und Vorhersehen 23.-- 28 Vaterlaus, St. u.a. (2005) Staatliche sowie private Regeln und Strukturwandel 32.-- 29 Müller, A. u.a. (2005) Strukturwandel – Ursachen, Wirkungen und Entwicklungen 24.-- 30 von Stokar Th. u.a. (2005) Strukturwandel in den Regionen erfolgreich bewältigen 22.--

31 Kellermann, K. (2005) Wirksamkeit und Effizienz von steuer- und industriepolitischen Instrumenten zur regionalen Strukturanpassung
22.--
32 Arvanitis, S. u.a. (2005) Forschungs- und Technologiestandort Schweiz: Stärken-/Schwächen- profil im internationalen Vergleich
25.--
33E Copenhagen Economics, Ecoplan, CPB (2005) Services liberalization in Switzerland 31.-- 34 Arvanitis, S. u.a. (2007), Innovationsaktivitäten in der Schweizer Wirtschaft - Eine Analyse der
Innovationsserhebung 2005 34.--
35/1 Brunetti, A. und S. Michal (eds.) - 2007 - Services Liberalization in Europe: Case Studies (vol. 1) 37.--

Federal Department of Economic Affairs FDEAState Secretariat for Economic Affairs SECOEconomic Policy DirectorateEffingerstrasse 31, 3003 BerneDistribution: Tel. +41 (0)31 324 08 60, Fax +41 (0)31 323 50 01, 8.2007 100www.seco.admin.ch, [email protected] 3-907846-59-1
Copyright © 2022 FDOKUMEN