Rancho Seco Final Status Survey Summary Report for ...
18
Rancho Seco Final Status Survey Summary Report February 24, 2009 Trench I Surface Survey Unit F8100052 Prepared By: "..£__________te:__ _ _ FSS Engineer Reviewed By: Date: - -0 Lead FSS Engineer Approved By: "7 Date:_______ Dismantlement S rintendent, Radiological
-
Upload
khangminh22 -
Category
Documents
-
view
1 -
download
0
Transcript of Rancho Seco Final Status Survey Summary Report for ...

Rancho Seco
Final Status Survey Summary Report
February 24, 2009
Trench I Surface
Survey Unit F8100052
Prepared By: "..£__________te:__ _ _
FSS Engineer
Reviewed By: Date: - -0
Lead FSS Engineer
Approved By: "7 Date:_______
Dismantlement S rintendent, Radiological

FINAL STATUS SURVEY SUMMARY REPORT
Survey Unit:F8100052, Trench 1 Surface
Survey Unit Description:
Operating History: The area surrounded the tanks used to store radioactive liquids. Thisarea was used for the storage of radioactive material. Operating records and the HSAdocument several events with the potential for a release of radioactivity associated withthis survey area. The HSA documented the storage of radioactive material within thearea that may have had the potential to contaminate the area.Records of soil samples taken near the BWST showed soil contamination levels as highas 230 pCi/g prior to remediation.
Site Characterization: Soil samples were collected and analyzed for the presence of plant-derived radionuclides. Cs-137 was the primary nuclide of plant origin detected with amean activity level of 379 pCi/g and a maximum value of 1,040 pCi/g. Based on theclassification procedure (DSIP-0020) and levels of Cs-137 reported, the area wasdetermined to be a Class I land area.
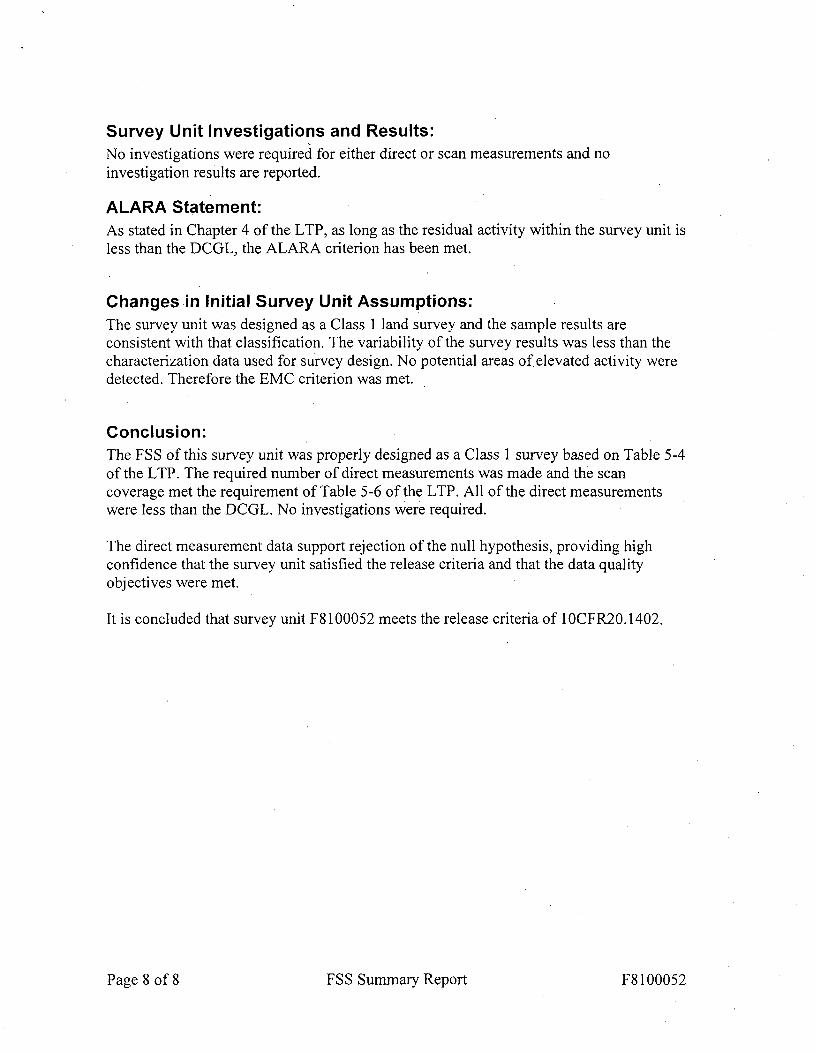
Survey Unit Design Information:The Survey Unit Design Parameters are presented in Table 1 below. The survey unit andmeasurement locations are depicted on the maps in Attachment 1. Direct measurementlocations were determined using a random-start, fixed grid pattern and 660 m2 werescanned for approximately 100% coverage. Soil samples were collected at each directmeasurement location and analyzed by HPGe detector. The instrumentation used for thesurvey along with the MDC values are listed in Tables 2-1 and 2-2 in Attachment 2.
Page 2 of 8 FSS Summary Report F8100052

Table 1. Survey Unit Design Parameters
Survey Design Parameter Value Comment
Survey Area: F810 Trench 1 SurfaceSurvey Unit: 0052 Open Land Area
Class: 1 LTP Table 5-4SU Area (m2): 660
Evaluator: G. FrankDCGL Cs137 surrogate (pCi/g): 51.2
Area Factor: 1.5 Class 1Design DCGLemc (pCi/g): 79 Class 1
LBGR (pCi/g): 25.6 Default = 50% DCGLDesign Sigma (pCi/g): 0.1 DTBD-06-001, Table 5-4D
Type I Error: 0.05Type II Error: 0.05
Nuclide: Cs137Sample Area (m2): 38.8 Class I
Total Area Scanned (M2): 660Scan Coverage (%): 100% Class 1
Zl., : 1.645Z•_P : .1.645
Sign P: 0.99865Calculated Relative Shift: 256
Relative Shift Used: 3 Uses 3.0 if Rel Shift >3N-Value: 11
Design N-Value + 20%: 14 NUREG-1575 Table 5-5Grid Spacing L: 6.9 Class I
Page 3 of 8 FSS Summary Report F8100052

Survey Results:A total of 38 direct measurements were made in F8100052. The results including mean,median, standard deviation and range are shown in Table 2. All of the directmeasurements were less than the DCGL. ISOCS measurements resulted in no Co-60activity greater than the MDA from Attachment 2, Table 2-1 the range of Co-60 is 0.168to 0.277 pCi/g. Particle scans of the entire survey area were performed using a 2350-1 w/44-10 with no readings above the investigation criteria in Attachment 2, Table 2-2 therange is 3201 to 4751 cpm. None of the scan measurements indicated areas of elevatedactivity.
Table 2. Direct Measurement Results(all activity values in pCi/g)
TMeasurement ID
Mean:Median:
Standard Deviation:Range:
F8100052AOOO1GS 2.21E-01 2.87E-01 1.59E-01F8100052A0002GS 4.39E-01 < 4.39E-01F8100052A0003GS 4.01E-01 < 4.01E-01F8100052A0004GS 4.17E-01 < 4.17E-01F8100052A0005GS 4.09E-01 < 4.09E-01F8100052A0006GS 4.05E-01 < 4.05E-01F8100052A0007GS 2.04E-01 4.01E-01 1.68E-01F8100052A0008GS 2.40E-01 6.71E-01 2.17E-01F8100052A0009GS 4.39E-01 < 4.39E-01F8100052AOOOGS 3.90E-01 < 3.90E-01F8100052AOO11GS 2.64E-01 3.91E-01 1.92E-01F8100052A0012GS 2.20E-0 1 3.09E-0 1 1.62E-01F8100052S0013GS 1.94E-01 3.18E-01 1.51E-01F8100052S0014GS 4.68E-01 < 4.68E-01F8100052S0015GS 2.07E-01 4.79E-01 1.78E-01F8100052S0016GS 2.19E-01 4.75E-01 1.82E-01F8100052S0017GS 2.1OE-01 2.82E-01 1.53E-01F8100052S0018GS 1.97E-01 < 1.97E-01 1.25E-01F8100052S0019GS 2.03E-01 6.45E-01 1.98E-01F8100052S0020GS 4.18E-01 < 4.18E-01F8100052S0021GS 2.15E-01 4.81E-01 1.81E-01F8100052S0022GS 4.64E-01 < 4.64E-01F8100052S0023GS 3.40E-01 < 3.40E-01F8100052S0024GS 2.91E-01 < 2.91E-01F8100052S0025GS 2.06E-01 4.13E-01 1.68E-01
Page 4 of 8 FSS Summary Report F8100052

F8100052S0026GS 3.70E-O1 < 3.70E-01F8100052S0027GS 1.83E-01 2.59E-01 1.37E-01F8100052S0028GS 3.70E-01 < 3.70E-01F8100052S0029GS 3.40E-01 < 3.40E-01F8100052S0030GS 3.92E-01 < 3.92E-01F8100052S0031GS 3.97E-01 < 3.97E-01F8100052S0032GS 1.95E-01 2.59E-01 1.43E-01F8100052S0033GS 1.86E-01 2.97E-0 1 1.44E-0 1F8100052S0034GS 1.60E-01 3.11E-01 1.36E-01F8100052S0035GS 3.57E-01 < 3.57E-01F8100052S0036GS 3.70E-01 < 3.70E-01F8100052S0037GS 3.66E-01 < 3.66E-01F8100052A0038GS 3.92E-01 < 3.92E-01
Page 5 of 8 FSS Summary Report F8100052

Survey Unit Data Assessment:The survey design required 3 8 direct measurements for the Sign Test. The critical valueand the results of the Sign Test are presented in Table 3. The sample mean and medianvalues were less than the DCGL. The sample standard deviation was less than the designstandard deviation so no additional samples were required.
.Page 6 of 8 FSS Summary Report F8100052

Table 3. Data Assessment Results
Survey Results Parameter Value Comment
Actual Direct Measurements (N): 38Median (pCi/g): 3.91E-01
Mean (pci/g): 3.87E-01Standard Deviation (pCi/g): 9.37E-02
Maximum (pCi/g): 6.71E-01Sign Test Final N Value: 38
S+ Value: 38Critical Value: 24
Sufficient Samples Collected: YesMaximum Value < DCGL: Yes
Median Value < DCGL: YesMean Value < DCGL: Yes
Maximum Value < DCGLemc: Yes Class 1Standard Deviation <= Sigma: Yes
Pass the Sign Test? YesReject the Null Hypothesis? Yes
The survey unit passes all conditions? Yes
Page 7 of 8 FSS Summary Report F8100052
Survey Unit Investigations and Results:No investigations were required for either direct or scan measurements and noinvestigation results are reported.
ALARA Statement:As stated in Chapter 4 of the LTP, as long as the residual activity within the survey unit isless than the DCGL, the ALARA criterion has been met.
Changes in Initial Survey Unit Assumptions:The survey unit was designed as a Class 1 land survey and the sample results areconsistent with that classification. The variability of the survey results was less than thecharacterization data used for survey design. No potential areas of elevated activity weredetected. Therefore the EMC criterion was met.
Conclusion:The FSS of this survey unit was properly designed as a Class 1 survey based on Table 5-4of the LTP. The required number of direct measurements was made and the scancoverage met the requirement of Table 5-6 of the LTP, All of the direct measurementswere less than the DCGL. No investigations were required.
The direct measurement data support rejection of the null hypothesis, providing highconfidence that the survey unit satisfied the release criteria and that the data qualityobjectives were met.
It is concluded that survey unit F8100052 meets the release criteria of 1OCFR20.1402,
Page 8 of 8 FSS Summary Report F8100052

Attachment 1
Maps
February 24, 2009
Survey Unit F8100052
0
Trench 1 East Portion - Surface Scanw/44-10 for Discrete Particles
//
~0
4-
_0
0
Cl)
SoilI-T LOR-T 1414 1 CZ? 14 1 LIO* I qlcor I I,- "Cr
-q-]U? I',',n1 UI) r4n
0 = Gamma Background
Asphalt
1061 091
~- ~JC~~ U ( f - -- -0 O - -4 -~ - -O -D 1-0 -~ MM
10 *1 1 08H f i l 1
It
00C)C>
tQ
tConcrete Gutter Edge
F8100052-Mi

0
Trench 1 Eastern PortionISOCS Scans
cd~
-o~0
_0
0:~0
4-
-TI00
IC)
Concrete Gutter EdgeMeasurements are center to center, unless noted by an arrow
F8100052-M2

Attachment 2
Instrumentation
February 24, 2009
Survey Unit F8100052

Table 2-1. Survey Unit Instrumentation
Detector Detector SerialInstrument Model MDCNo.
No.
Soil - 0.468 pCi/g Cs-137ISOCS N/A 2983947 . Soil - 0.269 pCi/g Co-60
Asphalt- 0.439 pCi/g Cs-137Asphalt - 0.277 pCi/g Co-60
2350-1 44-10 211672 5 pCi/g
2350-1 44-10 256101 5 pCi/g
Table 2-2. Investigation Criteria and DCGL
Instrument Parameter Value
Soil - 51.2 pCi/g Cs-137Soil - 12.6 pCi/g Co-60
ISOCS Investigation Criteria - Scan Sphl -51.2 pCi/g Cs-60Asphalt - 51.2 pCi/g Cs- 13 7
Asphalt - 12.6 pCi/g
2350-1 44-10 Particle Scan 8850 cpmAll DCGLw 51.2 Cs-137
12.6 Co-60Design DCGLEMC from Table 1 of FSS
All DCGLEMC Summary Report or from DQAEvaluation Summary
Page 2 of 2 Att. 2 Instrumentation F8100052

Attachment 3
Investigation
February 24, 2009
Survey Unit F8100052
(none required)

Attachment 4
Data Assessment
February 24, 2009
Survey Unit F8100052

0
It~
00
C:)
F8100052 Quantile PlotCs137 DCGL = 51.2 pCi/g
U
a.
U
0.800
0.700
0.600
0.500
0.400
0.300
0.200
0.100
0.000
0.391
0 .20 40 60
Percentile
80 100
I. Activity - Median - - - 75th Percentile - - - - 50th Percentile

0D0,
F~ 00052 Scatter Plot
CJ2
F8 100052 Scatter PlotCs 37 .£CGL = 51.2 pCi/a
8.00E-01
7.00E-01 -~ ~ -. . . .- -. .- -. ..- -. . ..- -. . ..- - - - - - - 0,668
6.00E-01
s 5.00E-01
000000 0 0
0 00 0 0 0
2.00E 4010 4 0 0 0
0 0 01 .0E-0I- 0.106
< < < < < < 0 c < t. o W 0 to to 0 0o to 0 to 0 0to 0 40 to0 0 W 0 0 00 0 to to
Measurement Locations
[ Activity - Average - - "+3StDev" - - "-3StDev
ti
00
C)C)C,,,

4r-
C/2
00C/2
(-h1k)j
i
F8100052 Frequency PlotCs1 37 DCGL = 51.2 pCi/g
2120-1918
S17
c 16ai) 15-
14a)13-
12-if_ 12C
1 1
o 104: 90
~8-7-
c)6-Q 5-
0 43-2-1-0-
(N N N
N-5
N2(y
N
Bins - Upper End Value (pCi/g)