County of Accomack, Virginia Fiscal Year 2013 Annual Fiscal ...
Upload
khangminh22Category
view
0download
0
2016-2017Fiscal Year
BudgetsOperating & Non-Operating
Getting the MostFrom Every
Resource

OPERATING & NON-OPERATING BUDGETS JULY 1, 2016 – JUNE 30, 2017
ADOPTED JUNE 30, 2016
Board of Directors
William E Plummer, President
Ben R. Drake, Sr. Vice President
Stephen J. Corona
Lisa D. Herman
John E. Hoagland
Danny J. Martin
Bill J. Wilson
Executive Management
Jeff D. Armstrong, General Manager
Eva Plajzer, AGM – Engineering & Operations
Richard R. Aragon, Director of Finance/Treasurer
Jason A Martin, Director of Administration
Andrew L. Webster, Chief Engineer
Eileen Dienzo, Human Resources Manager
For Copies, Contact:
Milin J. Ream
Sr. Administrative Assistant - Finance
42135 Winchester Road
Temecula, CA 92590
Phone (951) 296-6936
Fax (951) 296-6862

Introduction
This page intentionally left blank.

Table of Contents
Page
Distinguished Budget Presentation Award .................................................................................................................. 1 General Manager’s Budget Message ......................................................................................................................... 3-7
Introduction
Understanding the Budget Document ........................................................................................................... 8 About the District ................................................................................................................................................ 9 Service Area ......................................................................................................................................................... 10 Demographic Summary ..................................................................................................................................... 11 Government ........................................................................................................................................................ 12 Organizational Structure ............................................................................................................................ 13-14 Community Profile ....................................................................................................................................... 16-21
Budget Process ................................................................................................................................................................ 22 Budget Calendar ................................................................................................................................................ 24 Budget Organization ........................................................................................................................................ 25 Budget Basis ....................................................................................................................................................... 26
Financial Policies ....................................................................................................................................................... 27-30
District Mission and Values .......................................................................................................................................... 31 Strategic Planning........................................................................................................................................ 32-35 District Goals and Objectives .................................................................................................................. 36-43
OPERATING BUDGET
Rate Design Structure Rate Setting Philosophy .................................................................................................................................. 44 Cost and Revenue Categories ........................................................................................................................ 45
Operational Factors Operating Revenues ......................................................................................................................................... 45 Water Rates and Sales ..................................................................................................................................... 45 Monthly Service Charges ................................................................................................................................ 46 Local Sources of Water ............................................................................................................................. 47-49 Existing Water Utility Facilities .................................................................................................................. 52 Wastewater Utility Operations .................................................................................................................... 52 Insurance ............................................................................................................................................................. 53
Statements Consolidated Operating Budget .............................................................................................................. 54-55 Major Operating Revenue ......................................................................................................................... 56-59 Major Operating Expenditures ................................................................................................................ 60-64 Rancho Division Operating Budget ........................................................................................................ 65-66 Santa Rosa Division Operating Budget ................................................................................................... 67-68 Resource Division Operating Budget ..................................................................................................... 69-70 Wastewater Division Operating Budget ...................................................................................................... 71
Footnotes Footnote #1-Summary of Significant Budgeting Policies .......................................................................... 73 Footnote #2-User Rates ................................................................................................................................... 73 Footnote #3-New Service Connections ........................................................................................................ 78 Footnote #4-Water Cost ................................................................................................................................. 78

Table of Contents
Footnote #5-Overhead Allocations ............................................................................................................... 78 Footnote #6-Wastewater Operations .......................................................................................................... 79
Rates and Fees Rancho Division Water & Energy Rates .................................................................................................... 80 Santa Rosa Division Water & Energy Rates ............................................................................................... 81 Monthly Service Charges ................................................................................................................................ 82 Construction & Non-Potable Water Rates................................................................................................ 82 Fee for Service Schedule ............................................................................................................................. 83-85
Five Year Operating Forecast ................................................................................................................................. 86-90
Divisional Plans District Organizational Chart .................................................................................................................. 91-101 Salary Schedules ....................................................................................................................................... 102-108 Personnel Staffing Levels ............................................................................................................................... 110 Fund Structure .................................................................................................................................................. 111 Administration Division .......................................................................................................................... 112-133 Finance Division....................................................................................................................................... 134-143 Engineering Division ............................................................................................................................... 144-155 Operations Division .................................................................................................................................156-167 Field Services Division ............................................................................................................................. 168-175
NON-OPERATING BUDGET
Long-Range Capital Financing Plan Objectives .......................................................................................................................................................... 177 Water Facilities ............................................................................................................................................... 178 Restructuring of District Debt ...................................................................................................................... 183 Debt Policies and Administration ........................................................................................................ 184-187 Water Facilities – Rate Recommendations ............................................................................................... 188 Wastewater Facilities – Rate Recommendations .................................................................................... 190 Water Reclamation, Treatment and Distribution Facilities ...................................................................191
Capital Projects ...................................................................................................................................................... 192-194 Summary of Capital Improvement Projects ...................................................................................... 195-200 Capital Improvement Projects Data Sheets ....................................................................................... 201-218
Capital Acquisitions ...................................................................................................................................................... 219 Capital Acquisition Budget ................................................................................................................................ 220-222
Rates and Fees Non-Operating Water & Wastewater Rates Summary ........................................................................ 223 Schedule of Ad Valorem Assessments & Standby Charges .................................................................. 223 Schedule of Water Capacity Fees ............................................................................................................... 224 Statements Consolidated Non-Operating Budget ........................................................................................................ 225 Major Non-Operating Revenue ........................................................................................................... 226-229 Major Non-Operating Expenditures .................................................................................................. 230-232 Fund Structure ................................................................................................................................................ 233 Rancho Division Long-Range Capital Financing Plan ................................................................... 234-241 Santa Rosa Division Long-Range Capital Financing Plan ............................................................ 242-249 SRWRF Division Long-Range Capital Financing Plan ................................................................. 250-257
Glossary of Abbreviations and Terms....................................................................................................................259-267

Introduction
This page intentionally left blank.

Introduction
This page intentionally left blank.

Introduction
The Government Finance Officers Association of the United States and Canada (GFOA) presented a Distinguished Budget Presentation Award to RANCHO CALIFORNIA WATER DISTRICT for its Annual Budget beginning July 1, 2015. In order to receive this award, a government unit must publish a budget document that meets program criteria as a policy document, as an operations guide, as a financial plan, and as a communication device.
This award is valid for a period of one year only. We believe our current budget continues to conform to program requirements, and we are submitting it to GFOA to determine its eligibility for another award.
This is the eighth consecutive year that the District has achieved this prestigious award.
1

Introduction
This page intentionally left blank.
2

R a n c h o C a l i f o r n i a W a t e r D i s t r i c t
42135 Winchester Road • Post Office Box 9017 • Temecula, California 92589-9017 • (951) 296-6900 • FAX (951) 296-6860 • www.ranchowater.com
Board of Directors
William E. Plummer
President
Ben R. Drake
Senior Vice President
Stephen J. Corona
Lisa D. Herman
John E. Hoagland
Danny J. Martin
Bill J. Wilson
Officers
Jeffrey D. Armstrong
General Manager
Eva Plajzer, P.E.
Assistant General Manager
Engineering and Operations
Richard R. Aragon, CPFO
Director of Finance/Treasurer
Jason A. Martin
Director of Administration
Rich Ottolini, R.E.H.S., MSL
Interim Director of Operations
& Maintenance
Andrew L. Webster, P.E.
Chief Engineer
Kelli E. Garcia
District Secretary
James B. Gilpin
Best Best & Krieger LLP
General Counsel
Rancho
Water
June 30, 2016
Board of Directors Rancho California Water District
lease accept my transmittal to you of the Rancho California Water District’s Fiscal Year 2016-2017 Operating and Non-Operating Budgets in the amount of $158,918,292. This budget document provides detailed information about
the District’s revenue and expenditure forecast in the coming year and addresses the main points and major decisions made in compiling the budget.
The District with the participation of the Board of Directors annually reviews its strategic goals and objectives. The results of the strategic planning process guide staff in its efforts to accomplish the mission of the District. Strategic goals and objectives were considered during the budget development process this year to provide the basis for prioritizing efforts, activities, needs, human resources and financial resources.
Certain challenges from the previous few years continue in this fiscal year. Some of these challenges include the continued downturn in the housing market from the hyper-growth levels during the last decade, continued increasing cost of goods and supplies, most significant of which is the increasing cost of import water, and finally the local economic climate for commerce and agriculture (Ag). While all of these challenges continue, it does appear that most of these have leveled off. The District has reflected in its fiscal year 2016-2017 budget these economic conditions.
The State is now in the fourth year of a drought has experienced unprecedented conditions with recent years seeing record high temperatures, lack of rainfall and snowpack levels. Although recent snowfall and rain in Northern California has replenished reservoir levels, Southern California has still experienced below average rainfall, and groundwater levels across the state have not recovered. The District’s own groundwater levels continue to be affected by the drought and have required continued lower levels of pumping. Additionally, the District has drawn down Vail Lake levels to help mitigate the effects of the Drought. These conditions will impact the mix of supply the District has for fiscal year 2016-2017 resulting in overall less local supply and higher costing import water.
The District updated its Water Shortage Contingency Plan (WSCP) last year and enacted stage 4a effective June 1, 2015 in response to the drought and mandatory restriction from both the State Water Resources Control Board (SWRCB) and the Metropolitan Water District of Southern California (MWD). This significantly reduced water budgets for all customer classifications and prompted lower water demands in the current year. However, the SWRCB and MWD are planning to reevaluate the necessary level of restrictions later this spring in light of the improved water supply conditions for the State Water Project. The District’s own shortage stage will be adjusted accordingly.
P
3

R a n c h o C a l i f o r n i a W a t e r D i s t r i c t 42135 Winchester Road • Post Office Box 9017 •Temecula, California 92589-9017 • (951) 296-6900 •FAX (951) 296-6860
The District has experienced a sharp decrease of 22.6 percent in water demand from budgeted water sales during the FY 2015-2016 in response to the drought. The fiscal year 2016-2017 forecast reflects an increase in demand from the reductions seen this year due to the SWRCB’s restrictions currently set to expire in October 2016. In terms of budgetary basis comparison, budgeted water sales for next year are projected to decrease 6,032 acre-feet or 9.5 percent from the previous year budget as compared to the higher 22.6 percent reduction in actual sales currently being experienced. The increase in water demand from actual amounts this year is projected across all customer categories but is most significant with residential accounts which faced the most severe restrictions. Because the cost of producing water is the single greatest expense the District incurs, 52.1 percent of the operating budget, and a change in the supply mix with less local water available will result in additional costs of $2,933,738. However, a decreased treated import water quantity and supply mix from the decline in budgeted sales projected from this current year’ s budget will result in a decrease of $5,325,320 over the prior year.
The proposed total operating budget for the 2016-2017 fiscal year decreased by $2,262,433 or 3.3% over the 2015-2016 budget.
Coupled with a decrease in demand, other cost increases are being incurred. As mentioned above the cost of imported water will be significantly greater than the prior year, and increased system maintenance and other costs will increase slightly for a total of $129,149. The table below is presented to help illustrate the operating budget change for fiscal year 2016-2017.
Prior year 2015-2016 Budget Treated Import Quantity Req. and supply mix
$69,712,964 -$5,325,320
2015-2016 Budget For Decreased Demand and Supply Mix Increase in Treated Import Water Price Increase in Untreated Import Water Price
$64,387,644 $459,251 $714,549
Increase in Untreated Import Water Quantity Increase in Import Water Fixed Charge Cost
$1,188,510 $571,428
Additional Cost from All Other Categories $129,149 Proposed 2016-2017 Budget $67,450,531
The District anticipates a decrease in the amount of local water production over the prior year by 2,360 acre-feet primarily due to a reduction of 3,000 acre-feet available to be taken from Vail Lake, with native groundwater pumping staying relatively the same. This local water is the lowest cost water supply available to the District. As the District produces less local water the demand will be met with more imported water which is the highest cost of water supply as reflected in the budget for fiscal year 2016-2017. The net increase in source of supply expense when adjusted for the decrease in demand, is $2,933,953 or 9.1 percent over the prior year, and is a result of less local water supply use, and increased import water costs and quantities.
Looking forward a few years, additional cost pressures will continue to occur in the source of supply category as it is anticipated that treated MWD rates will increase 2.9% in January 2017 and average 3.7% annually over the following three years. Furthermore, untreated MWD rates will increase 12.1% in January 2017 and average 5.5% annually over the same time period.
Energy expense represents another significant component of the total operating budget amounting to approximately 9.8 percent of the total budget. Over the last two and half years the District’s operating staff has been modifying its pumping strategies. This effort resulted in shifting from on-peak energy rate run times to off-peak periods, thereby reducing the total energy expense. The District also constructed a 1 megawatt solar project to provide power to the Wastewater Treatment Plant and two additional solar projects that produce approximately 1.8 megawatts of power for water operations. These facilities have resulted in an annual energy savings of $300,000. Additionally, the
4

R a n c h o C a l i f o r n i a W a t e r D i s t r i c t 42135 Winchester Road • Post Office Box 9017 •Temecula, California 92589-9017 • (951) 296-6900 •FAX (951) 296-6860
District is scheduled to complete the 5.1 megawatt solar project by the end of the fiscal year to further offset energy cost increases for water operations. With these efforts and the reduction in pumping due to decreased demand, the District’s energy expense budget decreased by $639,955 or 8.8 percent.
The District operates with a full time equivalent (FTE) staff of 139 employees, which is a 3 fewer FTE workforce than FY 2015-2016 and 10 FTE lower than the recent high in 2011. The workforce budget accounts for 18.6 percent of the total operating budget. Due to the water industry facing greater challenges associated with supply availability, rising costs, and the current condition of the local economy, the District continues to operate with a lean staff.
As previously mentioned, the State’s current water supply conditions have adversely affected the District’s service area. An important way the District and its customers can help reduce costs and preserve our water supply is through conservation and water use efficiency. Every drop of water saved directly reduces the amount of water produced from the most expensive supply source. Import water costs 500% more than the local water supply to produce. So by using water wisely every customer can help reduce costs and keep water rates lower.
With this in mind, the District has embarked on several efforts to help provide tools and create incentives for customers to conserve and become more efficient including:
Development of the MyWaterTracker website enhancement that allows customers to track their water usage as compared to their water budgets in real time while also providing email or text message notifications warning customers who are might exceed their water budgets and incur higher tiered water rates.
Offering rebates or assistance related to water efficient devices through locally funded programs, state grants, and MWD membership agency funded programs that include: washing machines, high-efficiency toilets, “smart” irrigation controllers, soil moisture sensors and a turf replacement program.
Provide Residential Water Use Efficiency Evaluations to customers who are in Tier III and Tier IV water usage.
Offering an Agricultural Irrigation Efficiency Program for which agricultural customers are provided with technical assistance and financial incentives for improving irrigation system efficiency; and
Implementing a Wireless Telemetry Pilot Project. The project involves the installation of sub-meters and capacitance probes at an avocado grove for measuring the water requirements of avocado trees; and
Implementing a pilot project for exploring the usefulness of soil moisture sensory technologies for agriculture; and
Implementing a Vineyard Demonstration project for which regulated deficit irrigation strategies will be demonstrated to the local wine-grape growing community; and
Adding to the District’s website a Virtual Technical Assistance Center, which will make available useful data to agricultural customers who can use the data to implement best management practices; and
The District has received $4.23 million in grants and conservation incentives directly related to the Conservation Program’s and will continue to pursue various incentives to save water
In addition, the District implemented a budget-based tiered water rate structure designed to promote efficient water use and currently only applies to residential and landscape customer classes. Each customer was given a budget that represents an appropriate amount of water to meet their needs. If a customer exceeds the budget amount, they are considered to be using water inefficiently or wastefully
5

R a n c h o C a l i f o r n i a W a t e r D i s t r i c t 42135 Winchester Road • Post Office Box 9017 •Temecula, California 92589-9017 • (951) 296-6900 •FAX (951) 296-6860
and will correspondingly pay a higher rate.
In this dynamic economic environment, monitoring the budget and responding to changes or unanticipated events is a continuing process. The Finance Division provides the Board of Directors with monthly reports and quarterly analysis of both the operating and non-operating budgets. If adjustments to the budget are required, the District will respond accordingly.
FY 2016-2017 BUDGET HIGHLIGHTS
The District’s 2016-2017 total budget is $158,918,292 and is comprised of the following:
Category FY 2015-2016 FY 2016-2017
Operating $69,712,963 $67,450,531 Non-Operating 50,501,033 56,296,921
CIP 15,523,000 34,045,000 Capital Outlay 1,010,250 1,125,840
Total $136,747,247 $158,918,292
Monthly Bill Impact- Rancho Division
M&I New Current Change % Change Variable 34.38 34.35 0.03 0.1% Fixed 21.22 20.20 1.01 5.0% Total 54.55 54.55 1.04 1.9% ¾” Meter, 25 HCF per Month , 1485 Pump Zone
Ag New Current Change % Change Variable 1,219.94 1,215.07 4.87 0.4% Fixed 80.75 78.78 1.97 2.5% Total 1,300.69 1,293.85 6.84 0.5% 2” Meter, 2 A/F per Month , 1610 Pump Zone
Monthly Bill Impact- Santa Rosa Division
M&I New Current Change % Change Variable 44.04 43.20 .84 1.9% Fixed 40.58 37.93 2.65 7.0% Total 84.62 81.13 3.49 4.3% ¾” Meter, 25 HCF per Month , 1434 Pump Zone
Ag New Current Change % Change Variable 1,644.61 1,582.10 62.51 4.0% Fixed 174.62 174.62 0.00 0.0% Total 1,819.23 1,756.72 62.51 3.6% 2” Meter, 2 A/F per Month , 1670 Pump zone
6

R a n c h o C a l i f o r n i a W a t e r D i s t r i c t 42135 Winchester Road • Post Office Box 9017 •Temecula, California 92589-9017 • (951) 296-6900 •FAX (951) 296-6860
CONCLUSION
his budget reflects the Board of Directors’ priorities and strategic plans which are communicated to the District’s staff through various meetings and workshops. The goal of this budget document is to provide staff with a road map for prioritizing major capital
improvement programs and ultimately fulfilling the District’s mission statement. The overall objective is to produce guidelines to address the District’s short-term and long-term goals and objectives. This document also demonstrates the District’s ability to use capital resources for completing critical capital projects for current and future customers as well as the District’s commitment to meet its financial obligations. Staff is confident that the financial framework outlined in the Fiscal Year 2016-2017 Budget will allow the District to deliver reliable, high-quality water, wastewater and reclamation services to its customers and communities in a prudent and sustainable manner.
ACKNOWLEDGEMENTS
would like to thank the Board of Directors’ for their leadership and continued interest in and support of the highest level for prudent fiscal management. I would also like to extend my appreciation to all of the District’s employees and to the Department Managers for presenting
goals and objectives for this year’s budget that will support the District’s mission statement. Our goals and objectives could not have been met without all your work. Most importantly on behalf of our Board of Directors and all of the District’s employees, thank you to our valued customers, for whom it is an honor to serve.
Respectfully submitted,
RANCHO CALIFORNIA WATER DISTRICT
Jeff D. Armstrong General Manager
T
I
7

Introduction Rancho California Water District
Introduction
•This section contains a description of the District and its organizational structure,budget process, community profile, and an explanation of the District's financialpolicies.
Strategic Plan
•This section describes how the District utilizes strategic planning in defining long-term goals and objectives of the District.
Operating Budget
•This section describes the philosophy and process used to develop the operatingbudget. The section discusses important operational factors and operating ratechanges. Additionally, a budget summary, detailed budget, and a five-year forecastare presented. Finally, department objectives and accomplishments are detailedincluding specific performance indicators.
Non-Operating Budget
•This section defines the objectives, presents a summary of the non-operatingbudget and details the non-operating rates, fees, and assessments for the fiscalyear. The section also contains the District's 50-year Long-Range CapitalFinancing Plan, detailing funding sources and projected cash reserve levelsrequired to meet the long-term capital needs of the District.
Glossary
•This section contains a list of definitions of terms used in this document.
Understanding the Budget Document
On an annual basis, the Rancho California Water District Board of Directors adopts a budget for the subsequent fiscal year’s operations. Since water demand cannot be exactly forecast due to uncontrollable variables such as growth rates and weather conditions, actual revenues and expenditures may vary significantly from the approved budget. Consequently, the budget is viewed as a tool for estimating and planning District revenues and expenditures and is used for comparative purpose to identify unusual or unexpected trends. As a comprehensive management and financial plan, this document is structured to meet internal managerial needs and describes the services and resources provided by the District to its customers, as well as District policies and Board guidelines for achieving immediate and long-term objectives. The Board of Directors approved this budget at its June 9, 2016 meeting. The organization and presentation of this budget are designed to satisfy the needs of the Rancho California Water District, its customers, Board of Directors, staff, and the public. It is divided into several sections as follows:
8

Introduction Rancho California Water District
1st District Building
District HQ, Present Day
Description of the District
Development of the Temecula/Rancho California community began in 1965 when the Vail Ranch was acquired by the partnership of Kaiser Corporations (Kaiser Aluminum & Chemical Corporation and Kaiser Industries Corporation) and Macco Realty Company. On August 16, 1965, to provide for a continuing and reliable water supply, the developers of Temecula/Rancho California formed the original Rancho California Water District (the “Rancho District”) over the easterly area of the Temecula/Rancho California development. The Santa Rosa Ranches Water District (the “Santa Rosa District”) was organized on January 24, 1968 to serve the westerly 44,800 acres of land in the community of Temecula/Rancho California.
To provide supplemental water, the Rancho District was annexed in 1966 to the Eastern Municipal Water District (“EMWD”) and The Metropolitan Water District of Southern California (“MWD”). EMWD was also granted powers to collect, treat, and dispose of wastewaters within the Rancho District. In 1968, the Santa Rosa District was annexed to the Western Municipal Water District (“WMWD”) of Riverside County and MWD. Both EMWD and WMWD are member agencies of MWD, which provides supplemental imported Colorado River and State Project water to the District.
Prior to 1976, EMWD assisted in the operation and maintenance of the Rancho District’s water system. By mutual agreement in 1976, this arrangement was terminated and the Rancho District assumed responsibility for maintenance and operation of the water system. The Santa Rosa District operated and maintained its water system prior to consolidation with Rancho California Water District.
On January 1, 1977, the Rancho District and the Santa Rosa District were consolidated in accordance with Riverside County Reorganization Nos. 76-34-4 and 76-34-5 under the name Rancho California Water District. Land areas within the District were designated as the “Rancho Division” for the original Rancho District and the “Santa Rosa Division” for the original Santa Rosa District. As a result of the consolidation, the District acquired power to operate, maintain and furnish facilities for all water systems within the District and for the collection and treatment of wastewaters over the Santa Rosa Division. EMWD remains responsible for wastewater treatment in the Rancho Division. With subsequent annexations, land area of the Santa Rosa Division and the Rancho Division of the District is currently approximately 50,549 and 48,609 acres, respectively.
Service Area
Rancho California Water District’s (“RCWD”/“District”) service area includes the City of Temecula and portions of the City of Murrieta and the unincorporated territory of the County of Riverside adjacent to such cities. The current population of the District’s service area is estimated to be approximately 147,600. The District is comprised of two divisions; the Rancho Division, consisting of approximately 48,609 acres, provides water service to customers in the area; the Santa Rosa Division, consisting of approximately 50,549 acres, provides water and wastewater services to customers in the area.
The District is approximately 85 miles southeast of Los Angeles and 65 miles north of San Diego. The map on the following page illustrates the District’s service area.
9

Introduction Rancho California Water District
The District is Headquartered in Western Riverside County, Temecula California
10

Introduction Rancho California Water District
Demographic Summary
Water System:
Service Area 99,158 acres
Miles of Water Main 906
No. of Reservoirs 39
No. of Wells 42
No. of Service Connections 44,291 connections
Recycled Water System:
Miles of Water Main 65 miles
No. of Reservoirs 4
No. of Service Connections 217 connections
Wastewater System:
Miles of Sewer Line 71 miles
Treatment Plant 1 ~ Santa Rosa Water Reclamation Facility. Maximum Capacity 5 mgd
No. of Sewer Connections 17,528 EDU’s sold
Misc. Statistical Information
Population Served: Approximately 149,000
No. of Employees 139 FTE
Operating Budget: $67.5 Million
Non-Operating Budget $56.3 Million
Capital Improvement Program: $34.0 Million
Source: Rancho California Water District
11

Introduction Rancho California Water District
Government
The District is governed by a seven-member, elected Board of Directors. Directors shall be registered voters in the District at the time of their election and during their term of office. The Board of Directors serves alternate four-year terms.
The District Board members are identified below:
DIRECTORS YEARS OF SERVICE TERM
EXPIRATION
DECEMBER
William E. Plummer, President 11 years 2017
Ben R. Drake, Sr. Vice President 15 years 2017
Stephen J. Corona. Vice President 15 years 2017
Lisa D. Herman, Vice President 25 years 2019
John E. Hoagland, Vice President 15 years 2017
Danny J. Martin, Vice President 1 year 2019
Bill J. Wilson, Vice President 1 year 2019
12

Introduction Rancho California Water District
Customers of the District
Board of Directors
General Manager
Administration
Engineering
Finance
Water Operations
WW OperationsLegal Counsel
Jeff D. Armstrong
General Manager
Eva Plajzer
AGM - Engineering & Operations
Organizational Structure
The District’s organizational structure is as follows:
District Management
The District currently employs an administrative and operating staff of 139 full time equivalents (FTE) under the direction of a Board appointed General Manager.
The current corporate officers of the District and their biographies are as follows:
Mr. Armstrong has been with the District since 1988 and was appointed the General Manager in November 2015. He served as the District’s Chief Financial Officer and Treasurer for 7 years, the District’s Controller for four years and was the Accounting Manager for 10 years. Prior to joining the District, Mr. Armstrong held various accounting positions in private industry including a Fortune 100 company. Mr. Armstrong earned his undergraduate degree in accounting from California State University, Long Beach and his MBA from the University of Redlands.
Ms. Eva Plajzer was appointed Assistant General Manager for Engineering and Operations. Ms. Plajzer oversees the Engineering and Operations departments and is responsible for the District’s engineering, operations, wastewater and maintenance functions. Ms. Plajzer joined the District in May 2016 with over 20 years of experience in the utility and engineering consulting business. Prior to joining the District, Ms. Plajzer spent 10 years working in various capacities for water and sewer public utility providers. Prior to joining the public utility sector, Ms. Plajzer worked as a consultant for a nationally recognized engineering firm specializing in providing engineering and planning services to numerous utilities across the United States. Ms. Plajzer holds a Professional Engineer’s license in California and Virginia, and Treatment and Distribution Operator certifications from the California State Water Resources Control Board.
She obtained her Bachelors of Civil Engineering from the University of California, Irvine and Masters of Engineering from University of California, Davis. Ms. Plajzer also holds a Masters degree in Public Administration from San Diego State University.
13

Introduction Rancho California Water District
Richard R. Aragon
Director of Finance/Treasurer
Anderw L. Webster, P.E.
Chief Engineer
Kelli E. Garcia
District Secretary
Jason Martin
Director of Administration
Mr. Aragon joined the District as its Finance Manager in February of 2015 and was appointed Treasurer in October 2015. Mr. Aragon came to the District with 10 years of various finance, accounting, and auditing experience specializing in water districts, special districts, and municipal governments. Most recently he served as the Finance Director and Treasurer for a regional water wholesaler in Los Angeles and previously was responsible for overseeing accounting, financial reporting, and grants management for the North Slope Borough, a large county level municipality in Alaska. Mr. Aragon is a Certified Public Finance Officer with the Government Finance Officers Association, and earned his Bachelors of Science in Accounting from California Baptist University in Riverside, California.
Mr. Webster was appointed the Chief Engineer of the District in October 2009. As Chief Engineer, he oversees the Engineering Department for the District. He has more than 24 years of public utility engineering experience during his career, including more than 20 years with the District. Mr. Webster earned his Bachelor of Science degree in Civil Engineering from California State University, Long Beach, and he is a registered Civil Engineer with the State of California. Mr. Webster has also previously served six years as a City of Temecula Planning Commissioner.
Mr. Martin was appointed the District’s Director of Administration in November 2015. He is responsible for overseeing the District’s Customer Service, Information Technology, Administration and Water Use Efficiency functions. Previously, he served as the District’s Information Technology and Customer Service Manager since 2006. Prior to joining RCWD, Mr. Martin was the Business Manager for a telecommunications construction firm and the Training, Project Management and Field Services Manager for an e-911 emergency response system vendor. Mr. Martin has a Bachelor degree in Management Information Systems from California State University, San Bernardino.
Ms. Garcia was appointed the District Secretary in July 2005. She has over 10 years of administrative experience in the public sector. Ms. Garcia has been with the District since 1992, and has served in the capacity of Administrative Assistant in the Board Administration Department since 1999 and as Deputy District Secretary since 2002.
14

Introduction Rancho California Water District
There are three recognized employee bargaining groups, the Rancho California Water District Employees’ Association (RCWDEA), the Rancho California Water District Managers, Professional, and Confidential Employees’ Association (MPCEA), and an unrepresented group. Under state law, the District is required to meet and confer each year with the bargaining units. The RCWDEA and MPCEA have entered into a three year Memorandum of Understanding (MOU) through fiscal year 2016-2017.
The District has established a defined benefit pension plan for all full-time employees of the District. The District’s defined benefit pension plan provides retirement and disability benefits, annual cost of living adjustments and death benefits to plan members and beneficiaries. The Plan is part of the Public Agency portion of the California Public Employees Retirement System (CalPers), an agent multiple-employer plan administered by CalPers, which acts as a common investment and administrative agent for participating public employers within the State of California. The contribution requirements of the plan members are established by State statute and the employer contribution rate is established and may be amended by CalPers.
The Plan is funded by employer and employee contributions. Active plan members in the Plan are required to contribute 8% of their annual covered salary. For classic employees (employees hired before January 1, 2013 or employees hired after January 1, 2013 and have been in the PERS System) the District pays the 8% employee contribution on behalf of the employees. For new members (employees hired after January 1, 2013 and are new entrants to the PERS System), employees pay the 8% contribution. The District is required to contribute the actuarially determined remaining amounts necessary to fund the 2.7% at age 55 retirement plan benefits for its classic members and 2.0% at 62 for its new members under the California Employee’s Pension Reform Act (PEPRA) provisions. The District is also required to contribute 0.875% of the annual covered salary of classic members for the Conversion of Employer Paid Member Contributions (EMPC) benefit as provided in the Plan. The actuarial methods and assumptions used are those adopted by the CalPERS Board of Administration. District classic employees pay an additional 2.936% for a benefit enhancement increasing the plan benefit from 2.5% to 2.7% and also contributed 8% of their annual covered salary to offset the District’s pension costs for the fiscal year ended June 30, 2015. During the fiscal year ended June 30, 2015, the District’s contribution to PERS for full-time employees was $2,229,882 net of employee contributions of $1,245,266.
15
Introduction Rancho California Water District
Sola
r C
up
Bal
loo
n &
Win
e Fe
stiv
al
Tou
r d
e M
urr
ieta
Ch
rist
mas
Par
ade
Eart
hca
pad
es
Community Profile
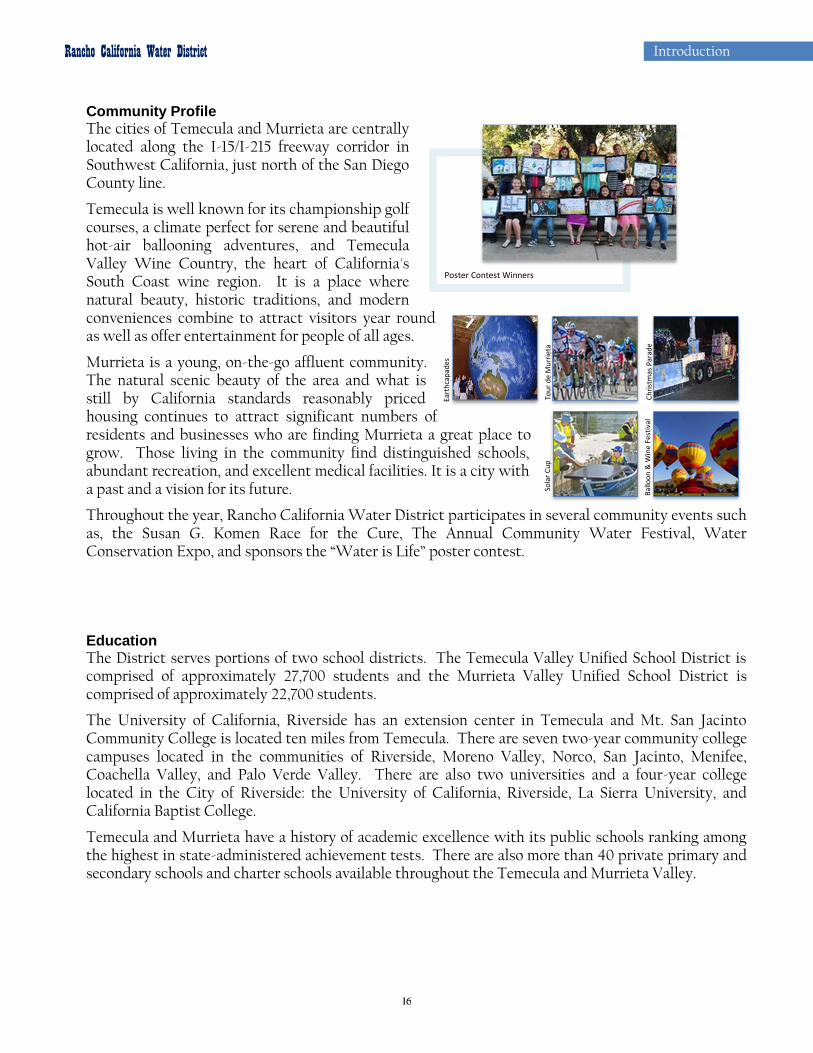
The cities of Temecula and Murrieta are centrally located along the I-15/I-215 freeway corridor in Southwest California, just north of the San Diego County line.
Temecula is well known for its championship golf courses, a climate perfect for serene and beautiful hot-air ballooning adventures, and Temecula Valley Wine Country, the heart of California's South Coast wine region. It is a place where natural beauty, historic traditions, and modern conveniences combine to attract visitors year round as well as offer entertainment for people of all ages.
Murrieta is a young, on-the-go affluent community. The natural scenic beauty of the area and what is still by California standards reasonably priced housing continues to attract significant numbers of residents and businesses who are finding Murrieta a great place to grow. Those living in the community find distinguished schools, abundant recreation, and excellent medical facilities. It is a city with a past and a vision for its future.
Throughout the year, Rancho California Water District participates in several community events such as, the Susan G. Komen Race for the Cure, The Annual Community Water Festival, Water Conservation Expo, and sponsors the “Water is Life” poster contest.
Education
The District serves portions of two school districts. The Temecula Valley Unified School District is comprised of approximately 27,700 students and the Murrieta Valley Unified School District is comprised of approximately 22,700 students.
The University of California, Riverside has an extension center in Temecula and Mt. San Jacinto Community College is located ten miles from Temecula. There are seven two-year community college campuses located in the communities of Riverside, Moreno Valley, Norco, San Jacinto, Menifee, Coachella Valley, and Palo Verde Valley. There are also two universities and a four-year college located in the City of Riverside: the University of California, Riverside, La Sierra University, and California Baptist College.
Temecula and Murrieta have a history of academic excellence with its public schools ranking among the highest in state-administered achievement tests. There are also more than 40 private primary and secondary schools and charter schools available throughout the Temecula and Murrieta Valley.
Poster Contest Winners
16

Introduction Rancho California Water District
Principal Employers
EMPLOYER NAME LOCATION NO. OF EMPLOYEES
Temecula Valley Unified School District Temecula 2,604
Murrieta Valley Unified School District Murrieta 2,044
Abbott Laboratories Temecula 2,000
Professional Hospital Supply Temecula 1,600
Loma Linda Univ. Med. Ctr. Murrieta 900
County of Riverside Murrieta 889
International Rectifier Temecula 750
SW Healthcare Systems Murrieta 692
Target Murrieta 500
Walmart Murrieta 350
Source: CA Employment Development Dept.
Principal Tax Payers
Customer Customer
Type Tax Levy (1) % of Total Tax
Levy Assessed Land
Valuations
Arbors at California Oaks Commercial $67,518 0.180% $13,135,050
ADP Rancho Temecula Commercial 66,139 0.16% 20,713,036
Redhawk Towne Center II Commercial 60,979 0.16% 20,326,476
Medline Industries Commercial 56,662 0.15% 10,731,457
Vineyards Temecula Apt. Commercial 54,621 0.14% 18,207,000
Inland Western Temecula Commons Commercial 51,229 0.13% 17,076,370
Advanced Cardiovascular System Inc. Commercial 50,642 0.13% 16,880,818
Temecula Creek Villas Commercial 50,225 0.13% 16,741,585
Rancho Calif. LTD. Partnership Commercial 48,953 0.13% 16,317,665
Temecula Towne Center Assoc. Commercial 48,657 0.13% 16,218,885
Total Principal Taxpayers 551,626 1.45% 166,348,342
Total Other Taxpayers 37,589,733 98.55% 5,398,892,879
Total Tax Levy $38,141,359 100.00% $5,565,241,221
Source: Rancho California Water District
17

Introduction Rancho California Water District
103,403
104,879
109,428
108,920
105,300
105,832
108,368
107,279
2012
2013
2014
2015
100,000 102,000 104,000 106,000 108,000 110,000
Fisc
al Y
ear
Population Estimate
Murrieta Temecula
Population
Historically, the District’s customer base was comprised of a mix of agricultural, residential, landscape, commercial and miscellaneous water accounts. Continued growth in the last decade has increased the customer base from 40,197 to 44,291 customer accounts. Growth continues to occur primarily in the residential category, with 86.0% of total accounts, resulting in 41.7% of total consumption. The agricultural customers have the highest average consumption, creating almost the same production demands on the system. Although comprising only 3.4% of the accounts, 39.2% of the total water demands are for agricultural purposes. Within the District’s service area, population is expected to continue to grow over the next 25 years at an average annual rate of approximately 1,158 persons for a total of approximately 28,950 new residents, representing a 1.5% annual growth rate for a total growth rate of approximately 21.7% over the projection period. Source: January Revised Estimates: State Dept. of Finance
Agriculture
Other
18

Introduction Rancho California Water District
Weather
The regional climate is Mediterranean with hot, dry summers and cool, wet winters. Summer daytime temperatures are in the mid-80 to high-90 degrees range. The area’s temperature is influenced by prevailing onshore winds from the Pacific Ocean and the rain shadow effect from the Santa Rosa Mountains. The “Santa Ana winds” can cause periods of extremely hot weather with dry winds. Winter daytime temperatures are mild averaging in the mid-60 degree range. The region’s average monthly maximum temperature is 80.8 degrees, based on weather data from Sun City (nearest weather station to Temecula). Residential/Housing
Riverside County has been the fastest growing major county in California. The Temecula/Murrieta area enjoys a level of affluence, which places it in the upper ranks among communities in the Inland Empire. As well, the regions high discretionary income makes the area an attractive location for retailers. The cities retail sector consistently outperformed statewide growth trends.
Source: US Census
With housing prices higher in the San Diego, Orange, and Los Angeles Counties, families are looking inland at quality communities like Temecula and Murrieta. The cities of Temecula and Murrieta experienced moderate growth rates of 3.6% and 2.9% respectively, which were slightly less than the County average of 5.3%.
$0
$10,000
$20,000
$30,000
$40,000
$50,000
$60,000
$70,000
$80,000
$90,000
$78,535 $74,401 $61,489
Median Household Income 2010-2014
CA
Murrieta
Temecula
19

Introduction Rancho California Water District
Median value of owner-occupied housing units, 2010-2014
Temecula: $311,100 California: $371,400
Median value of owner-occupied housing units, 2010-2014
Murrieta: $287,700 California: $371,400
Source: US Census
The late 2000’s experienced a major decline in the housing development and growth slowed again during the recent economic recession. RCWD is still a growing water agency. The District is closely monitoring land development in its service area and will continue to reliably and responsibly meet the challenges of new development.
Source: Rancho California Water District
20

Introduction Rancho California Water District
Temecula Wine Country
Agriculture
Agriculture remains a leading source of income in Riverside County. Principal agricultural products are milk, eggs, table grapes, grapefruit, nursery, alfalfa, dates, lemons, and avocados.
Riverside County’s total agricultural production is derived from four separate and distinct districts: Riverside/Corona, San Jacinto/Temecula Valley, Coachella Valley, and the Palo Verde Valley.
A table comparing the value of the agricultural crops in each of the districts for 2012 through 2014 is presented in the table below.
2012 2013 2014
Riverside/Corona $111,308,300 $110,078,000 $96,205,000
San Jacinto/Temecula 157,746,500 165,035,000 175,767,000
Coachella Valley 543,657,600 615,621,000 625,602,000
Palo Verde Valley 155,320,000 167,701,000 171,013,000
Total Crop Valuation $968,032,400 $1,058,435,000 $1,068,587,000
Source: Riverside County Agricultural Commissioner
The main crop types within RCWD’s service area are perennial and include wine grapes, citrus, and avocados totaling more than 20,000 irrigated acres or approximately 20% of the District’s service area. Avocados are produced on the majority of the agricultural land in the Santa Rosa Division. Grapes occupy approximately one-half of the agricultural land in the Rancho Division and citrus occupies approximately one-third of agricultural land in the Rancho Division.
21

Introduction Rancho California Water District
Budget Process
The budget process began as a team effort in November 2015, starting with a planning meeting where management discussed the proposed budget schedule and major budget assumptions. Thereafter, the General Manager and staff conducted workshops to define the 2016 Strategic Objectives and target activities. These objectives are supported by District Personnel through the implementation of plans that are created to address key issues and completion of the District’s target activities. Finally, staff develops the budget requirements, reviews and consolidates requests, and compiles the approved budget.
During this process, meetings were held with directors, division managers and supervisors to discuss budget assumptions, procedures, requirements and changes from the prior year’s budget. All requests for new capital improvement expenditures were reviewed in detail by the Engineering Division in accordance with the District’s water and wastewater master plans prior to being submitted for Board review.
All requests for new vehicles and equipment and computer outlays were reviewed by the applicable manager for consistency with District procedures. With the District goals of budgeting effectiveness and accountability as well as minimizing water and sewer rate impacts, Divisions are required to provide detailed support by activity for each budgeted amount. This support was prepared as a guideline for expenditures throughout the entire budget period and to provide accountability for any subsequent activities and related expenditures not included in budgeted amounts. Additionally, Divisions were required to review and update goals, objectives, and performance measures and provide a list of accomplishments for the last year.
In a series of budget review meetings, the Board reviewed the capital improvement and capital outlay requests, planned corrective maintenance requests, staffing requirements and operating statements. Input from these meetings was included in the final budget draft. It was determined that the draft budget was balanced–estimated expenditures were equal to estimated revenues for the fiscal year. After Board review and discussion of the draft budget, the General Manager’s recommended budget was presented to the Board of Directors for approval at the first board meeting in June.
The annual budget for fiscal year 2016-2017 reflects management’s commitment to incorporate the District’s short and long-term goals and objectives into our daily activities by integrating the results of our strategic planning efforts into the budget process. Consistent with the concepts of budgeting by objectives, these goals and objectives have been utilized to develop detailed departmental action plans which in turn are translated into dollars via the budget process.
22

Introduction Rancho California Water District
Departmental Role Supports Division Mission Level for
Each Mgr. to Develop a Plan and
Resouce Requirement
Divisional Mission
Statement Supports District Mission
District Mission
Statement Strategic
Objectives
Mission Objective
Establish Link
Department Plan
Resource Allocation
Performance Measurement
To accomplish a meaningful connection between strategy and resource allocation, each division of the District has created a divisional mission statement defining its role in supporting the District’s overall mission, goals, and objectives. Furthermore, each department has created a narrative statement, which defines its role in supporting its divisional mission. This process has established the meaningful connection between the functional levels of the District where action is taking place and the mission of the District. Departmental budgets are then created allocating resources necessary to support specific plans developed to meet the District’s mission. This process ensures that goals, objectives, and plans are transmitted to the level of the organization where action can take place and that limited resources are allocated to prioritized items. Therefore, dollar figures in the budget document represent estimates of the cost to carry out the District’s intended strategic operating plans, as opposed to an extrapolation of historical numbers.
The budgets derived through the above process represent a summary of each department’s operating plan and can be used by management to measure the accomplishment of their goals. Additionally, the District uses performance measurements to make judgments about the effectiveness and efficiency of our operations as well as to drive improvements, which successfully translate our strategies into action. Each department has identified performance indicators to help monitor its progress toward meeting its objectives. These performance indicators are being reviewed and analyzed on an annual basis to ensure that the framework is both well understood and supports the District’s objectives. Specific performance measurement indicators are detailed in the departmental budget section of this document.
All District employees have received formal training in the “Quality Improvement Process” (QIP). The District utilizes the QIP process to close the loop on performance by generating and implementing solutions that keep performance aligned with the District’s strategic plan.
The QIP process is done at a departmental level, a comprehensive asset management team level, and at an ad hoc cross-functional team level to ensure that all relevant parties at all levels in the organization are involved.
Quality Improvement
Process (QIP)
23

Introduction Rancho California Water District
Budget Calendar
As part of the initial budget process, budgetary staff prepares a schedule for the development of the budget for that year. The schedule is then distributed to all Division Directors and management staff for their reference in submitting their data for review, approval, and incorporation into the final budget.
The schedule for the development and review of the Fiscal Year 2016-2017 Budget Schedule is below:
Date Activity/Description
November 5, 2015 Budget Development Goal Setting
November 16, 2015 High Level Management Team Goal Setting
December 16, 2015 C.I.P. Corrective Maintenance Budget Meeting
January 5, 2016 Fee for Service Review Complete
January 12, 2016 District Staff Mtg. – Review Budget Process, Benchmarks, Calendar, and Workshop
January 18, 2016 Sales Projections
January 4-18, 2016 FY 2015-2016 6- Month Op. Budget Review/Analysis Available
January 21, 2016 Strategic Planning Workshop
January 28, 2016 E&O Committee Meeting - Water Production Audit
February 4, 2016 FAC Meeting – Budget Update/Demand Projections
February 8, 2016 Water Production
February 11, 2016 Budget Packets Due
February 16- March 1, 2016 Departmental Budget Review and Negotiation
February 25, 2016 E&O Committee Mtg. 2016-17 Capital & Corrective Maint. Projects
March 3, 2016 FAC Committee Non-Op. Budget/Fee for Service Review
March 8, 2016 Board of Directors Budget Workshop
March 22, 2016 Adj. FAC Committee - Op. Budget/Rate Recommendations
March 23, 2016 Annual Agricultural Customer/Farm Manager’s Meeting
March 31, 2016 Operating Budget and Rate Recommendations
April 14, 2016 Budget Workshop/Board of Directors Meeting
Beginning April 11, 2016 Prop. 218 Compliance) *Mailed Notice of Rate Change
Special Mailing – April 19, 2016
June 30, 2016 Board of Directors Meeting/ Public Hearing/Adopt Budget
24

Introduction Rancho California Water District
Budget Organization
RCWD is organized into four divisions based on various types of services and legal requirements. These divisions consist of the Rancho and Santa Rosa Water Divisions, the Santa Rosa Water Reclamation Facility (SRWRF) known as the Wastewater Division and finally, the Resource Division, which is used to accumulate and allocate shared costs such as source of supply and indirect expenditures.
The Divisions and their respective order are identified as follows:
Balanced Budget
According to Rancho California Water District, a budget should be balanced with current revenues equal to or greater than current expenditures/expenses. The District may elect to utilize rate stabilization or drought reserves to help implement more manageable rate increases. The District includes in its definition of a balanced budget the use of these reserves for this purpose. Costs are accrued to the proper expenditures year to prevent an erroneous presentation of a balanced budget at the expense of future years.
Budget Amendments
The Board does not formally amend the budget after approval. Subject to the approval of the Board of Directors, the General Manager has full charge and control of the District’s expenditures to ensure that operating and capital expenditures in each fiscal year are within the budgetary guidelines and to ensure that the District’s goals and objectives are met. No expenditure of funds shall be authorized unless sufficient funds have been appropriated by the Board of Directors or General Manager as described in this budget. The General Manager has authority to enter into contracts and agreements and expend funds up to $50,000. Purchases in excess of $50,000 not approved in the budget require approval of the Board of Directors.
Division I
Rancho Water Division
Division II
Santa Rosa Water Division
Division IV
Resource Accumulation &
Allocation Division
Division V
SRWRF Wastewater Division
25

Introduction Rancho California Water District
Budget Basis
The District utilizes the accrual basis of budgeting which is the same as the basis of accounting used in the audited financial statements, recognizing revenues and expenses in the period in which they are earned and incurred, respectively.
The District accounts for its water and wastewater operations activities as enterprise funds. An enterprise fund is an accounting entity with a self-balancing set of accounts established to record the financial positon and results that pertain to a specific governmental activity and conforms to the guidelines of Generally Accepted Accounting Principles (GAAP). The activities of enterprise funds closely resemble those of private business enterprises where the purpose is to conserve and add to resources while meeting operating expenses from current revenues. Enterprise funds account for operations that provide services on a continuous basis and are substantially financed by revenues derived from user charges.
Proposition 218 Compliance
The District complies with the noticing requirements of Proposition 218 by mailing a newsletter informing customers of the proposed rate changes and the date of the public hearing where these rate changes will be considered.
The mailed newsletter was accomplished with a special mailing on April 19, 2016. Additionally, any property owner not yet connected to the system receives a separate mailing. All noticing is accomplished at least 45 days prior to the public hearing.
26

Introduction Rancho California Water District
Financial Policies
The Rancho California Water District financial policy document incorporates many of the District’s financial management practices that are used by District Staff as guidelines for operational and strategic decision making related to current and future financial matters.
The purpose of establishing these policies is to identify acceptable and unacceptable courses of action, thus establishing parameters in which the District can operate as well as to provide a standard against which the District’s fiscal performance can be reviewed. Some policies are flexible when they are utilized by District staff as performance measurement tools to monitor the District’s finances, while others are restrictive to emphasize accountability.
Due to the above reasons, these policies are drafted as a living document to maintain their effectiveness in order to accommodate changes. District Staff and board members will review these policies on an annual basis to accommodate minor changes to the existing policy or major shifts in financial priorities as approved by the District’s Board of Directors at its sole discretion.
The District’s financial policies encompass the following functional areas:
Investment Policy;
Cash Reserve Policy;
Land Secured Financing Policy;
Debt and Financial Management Policy; and
Interest Rate Swap Policy.
Investment Policy-Revised February 2015
The Investment Policy set forth by Rancho California Water District for the following purposes:
To establish a clear understanding for the governing Board, management, responsible employees, citizens and third parties of the objectives, policies and guidelines for the investment of the District’s idle surplus funds;
To offer guidance to investment staff and any external investment advisers on the investment of District funds; and
To establish a basis for evaluating investment results.
The District establishes investment policies that meet its current investment goals. The District shall review this policy annually and may change its policies as its investment objectives change.
The primary objectives, in priority order, of investment activities shall be safety, liquidity, and return. In order to achieve these objectives, the District has segregated its funds into three portfolios. The Construction fund is structured to meet a schedule of payouts for capital expenditures. The Cash Management Account is invested in short-term securities to meet operating needs. The Operating Reserve is invested in somewhat longer –term securities in order to provide for future needs.
As in the District’s general investment policy, the primary objectives for investment of the Rancho California Water District’s Retirement Medical Benefits Plan monies shall be safety, liquidity, and return.
Cash Reserve Policy
In order to protect Rancho California Water District’s investments in various assets and to satisfy its commitments under its numerous financial, regulatory, and contractual obligations; the District has developed and segregated a number of funds and reserves. The efficient and discrete management of these
27

Introduction Rancho California Water District
reserves, when combined with their appropriate fortification add additional assurance that the current levels of service reliability and quality will continue into the future.
These reserves can be broken out into four types that include operating reserves, debt reserves, capital facility reserves, and replacement reserves.
Operating reserves would predominately be funded from water and wastewater user rates and be accumulated in the District’s General Fund.
Debt reserves are those funds that relate to the management of the District’s $316,010,000 in outstanding bonded indebtedness. The proceeds from these bonds have been used to fund the construction cost of the District’s backbone utility plant. These funds are accumulated in a debt service related fund from which annual principal and interest costs are paid and contractually required reserve trust funds held for the benefit of bond insurers and bondholders.
Capital facility reserves are funded from developer impact fees and proceeds from bonds. Their collection and use are restricted under state law. These funds are used to finance the construction of required water-and wastewater-related facilities.
Replacement funds are funded from charges reflected on wastewater bills and are restricted for the replacement of aging utility plant. Current estimates demonstrate that future facility replacements will need to be funded with a combination of replacement funds generated from user fees and future bond proceeds.
Land Secured Financing Policy
The Rancho California Water District has created these policies on debt financing as guidelines to assist all concerned parties in determining the District’s approach to land-secured financing. It is the District’s intent to support projects, which address a public need and provide a public benefit. These policies are designed to comply with Section 53312.7(a) of the Government Code.
The District and the Board of Directors will consider the use of community facilities districts, or fixed lien special assessment districts as well as other methods of public financing to assist the development of commercial, industrial and/or residential property. The minimum principal amount of any land secured financing shall be $150,000. While specific criteria are established in these Policies, for land secured financing between $150,000 and $1,000,000, the structure and processing procedures will be determined on a case-by-case basis. The District also reserves the right to amend or modify these Policies at any time as well as make exceptions or changes for specific financing projects, as facts and circumstances so warrant.
Debt and Financial Management Policy
General Management Policy
The District will provide for a periodic review of its financial performance, and review its performance relative to the financial policies outlined herein. These policies will be taken into account during the capital planning, budgeting, and rate setting process.
In recognition of periodic changes in the cost of providing service to system users, service costs and fees will be reviewed annually and adjusted commensurately.
The District will present any proposed adjustments to existing rates, fees and charges at public meetings, and will consider recommendations and input from the public as it relates to such proposed changes.
All District funds will be invested according to the Investment Policies of the District.
28

Introduction Rancho California Water District
Necessary appropriations for annual debt service requirements will be routinely included in the District’s annual budget.
The District will maintain proactive communication with the investment community, including rating agencies, credit enhancers, and investors, to ensure future capital market access at the lowest possible rates.
Financial Management Policy
The District utilized a comprehensive planning process to determine its long-term capital needs. The District evaluates each capital project in relation to established levels of reserves, current rate structure, expected asset life/replacement timeline, and available revenue sources to ensure that adequate financial resources are available to support the District’s financial obligations.
The District’s Debt and Financial Management, Land-Secured Financing, Reserve, Investment, and Swap Policies are integrated into the decision-making framework utilized in the budgeting and capital improvement planning process. As such, the following policies outline the District’s approach to debt management.
The District will evaluate financing for each capital project on a case-by-case basis. The District will seek to pay for all capital projects from current revenues and available reserves prior to or in combination with the use of debt.
The District will seek to issue debt only in the case where there is an identified source of repayment. Bonds will be issued to the extent that (i) projected fixed revenues are sufficient to pay for the proposed debt service together with all existing debt service covered by such fixed revenues, or (ii) additional projected revenues have been identified as a source of repayment in an amount sufficient to pay for the proposed debt.
Debt issuance for capital project will not be considered unless such issuance has been incorporated into the capital improvement plan (Long Range Financial Plan).
User Fees and Water Rates will be set at adequate levels, which are fair and nondiscriminatory, to generate sufficient revenues to pay all Operating and Maintenance costs, to maintain sufficient operating reserves, and to pay debt service costs, if necessary.
Property Assessment and Connection fees will be maintained at a level sufficient to finance a portion of growth-related capital costs and cover related annual debt service requirements.
Property Assessments also will be utilized to finance a portion of replacement costs and related annual debt service payments.
Debt and Capital Management Policy
The following policies formally establish parameters for evaluating, issuing, and managing the District’s debt. The policies outlined below are not intended to serve as a list of rules to be applied to the District’s debt issuance process, but rather to serve as a set of guidelines to promote sound financial management.
In issuing Debt, the District objective will be to:
Achieve the lowest cost of capital
Ensure ratepayer equity
Maintain high credit ratings and access to credit enhancement
29

Introduction Rancho California Water District
Preserve financial flexibility
Interest Rate Swap Policy-Revised October 2013
The purpose of the Interest Rate Swap Policy of Rancho California Water District is to establish guidelines for the use and management of all interest rate management agreements, including, but not limited to, interest rate swaps, swaptions, caps, collars, and floors incurred in connection with the issuance of bonds, notes and other obligations.
This Policy sets forth the manners of execution of swaps, provides for security and payment provisions, risk considerations and certain other relevant provisions in the context of being responsive to the 2003 Recommended Practices of the Government Finance Officers Association (GFOA) regarding the contents of an interest rate swap policy. The failure by the District to comply with any provision of this Policy shall not invalidate or impair any Agreement,
The issuance of Bonds involves a variety of interest payment obligations and risks that varieties of financial instruments are available to reduce, offset, or hedge. The structure of the District’s debt is often designed to manage the assets and liabilities in its balance sheet. It is the policy of the District to also consider the use of Swaps and other financial instruments to better manage its assets and liabilities. The District may execute a Swap if the transactions can be expected to result in one or more of the following or any similar type of benefit.
Reduce exposure to changes in interest rates on a particular financial transaction or in the context of the management of interest rate risk derived from the District’s overall asset/liability balance.
Result in a lower net expected cost of borrowing with respect to Bonds.
Manage variable interest rate exposure consistent with prudent debt practices.
Manage exposure to changing market conditions in advance of anticipated issuance of Bonds (with anticipatory hedging instruments).
Achieve more flexibility in meeting overall financial objectives that cannot be achieved in conventional markets. For example, entering into a swaption with an upfront payment.
Provide customized cash flows to match required payment obligations or revenue projections.
The District will not use Agreements that:
Are speculative or create extraordinary leverage;
Lack adequate liquidity to terminate without incurring a significant bid/ask spread;
Provide insufficient price transparency to allow reasonable valuation;
Provide exposure to currency risk, sovereignty risk, commodity risk or the use of credit derivatives – unless directly linked to the Districts of the Counterparty’s credit.
30

Rancho California Water District Fiscal Year 2016-2017 Operating Budget
Professionalism:
Reflected in the attitude and abilities displayed in dealing with our employees, customers, vendors,
and community
Responsibility:
Over financial and operating assets through sound
business judgment
Integrity & Ethics:
Uphold an adherence to moral and ethical
principles and to remain accountable
for our actions
Dedication:
In providing professional, quality
services to our partners, customers,
and community
Equality:
Commit to maintaining a
balanced workplace, by utilizing open
communication and diverse backgrounds, skills, and aspirations
of all District employes
District Mission, Vision, and Values
Mission
The District accomplishes its mission by setting strategic goals and objectives annually. This planning process allows the District to revisit goals and objectives on an annual basis, measures effectiveness and determines priorities based on current economic conditions, resources, environmental concerns, and regulatory demands.
Vision
Key elements of the vision include operating in a cost-effective manner, high-quality customer service, proactive engagement, innovation and operating sustainably (including system operations, human resources activities, and financial management).
Values
In pursuit of the District’s Strategic Plan Objective to “Promote an Open and Professional Work Environment throughout the Organization”, staff launched an effort to develop shared organizational values with participation throughout the organization that will guide RCWD’s actions towards one another, our customers, and our community.
Mission
•“The mission of the Rancho California Water District is to deliverreliable, high-quality water, wastewater, and reclamation services to itscustomers and communities in a prudent and sustainable manner.”
Vision
•“Rancho California Water District is an innovative, responsive, andprudent steward of the water service responsibility entrusted to it.”
Values•Serving Our Customers with Vision, Confidence, and PRIDE!
31

Rancho California Water District Fiscal Year 2016-2017 Operating Budget
Strategic Planning
Through a strategic workshop held on January 23, 2014, RCWD’s Board and Executive Management initiated an update of its Strategic Plan. A discussion and confirmation of the existing mission, vision, and values took place. This year, six Board priority “Focus Areas” were added to the District’s Strategic Plan and represent key initiatives for the coming years. The Board ratified the five guiding principles to focus and drive the Strategic Plan: reliability, quality, stewardship, sustainability, and customer and community. RCWD is committed to these principles to achieve our vision of being an innovative, responsive, and prudent steward of the water service responsibility entrusted to it.
Reliability
RCWD will provide a level of water reliability that ensures customers’ water needs are met.
Quality RCWD will provide safe water and high-quality water and services to its customers.
Stewardship
RCWD will exercise good stewardship of financial and operating assets through use of sound, cost-effective business judgment.
Sustainability
RCWD will address, adopt, and implement policies that support the social, economic and environmental values of the service area.
Customer and Community
RCWD will inform and engage its customers and community leaders as it pursues reliable, high quality, and sustainable water supply.
Within these 5 guiding principles are several important initiatives for Rancho Water in the coming years. These initiatives include revisiting and updating the water supply portfolio, implementing a water quality/brine management strategy to enable enhanced recycling of water and groundwater conjunctive use, implementing and communicating drought-response needs and actions,
GUIDING
PRINCIPLES
32

Rancho California Water District Fiscal Year 2016-2017 Operating Budget
implementing the wastewater treatment strategy at the Santa Rosa Water Reclamation Facility, continuing to make organizational enhancements and optimally integrating the Vail Lake property into our system. Each of these is briefly discussed below. Initiative 1 – Enhance the RCWD water supply portfolio Rancho Water last updated its Integrated Resources Plan in 2005. Significant changes have occurred since that time, including expanded state requirements for conservation, climate change considerations, rate structure changes, rising imported water costs, the Bay Delta Conservation Plan and Vail Lake acquisition. A reliable water supply will support economic development and the quality of life of the region. Initiative 2 – Water Quality Preservation and Enhancements In addition, Rancho Water overlies a productive groundwater basin, the expanded use of which would add significant reliability to the service area. Additionally, the water quality of the basin must be protected in order to realize the full economic benefit of potential increased utilization of this critical local resource. Optimal use of the groundwater basin involves the need to dispose of the residual brines from recycled water and groundwater treatment. Brine management is a critical feature of managing the groundwater basin for the long-term benefits of the ratepayers, as Rancho Water targets optimizing the utilization of the local groundwater aquifers to insure water quality protection and maximizing groundwater production opportunities in order to reduce dependence on imported water supplies. Such activities as incorporation of the Local Area Management Program (LAMP) into the On-Site Wastewater Treatment System (OWTS) policy of the County of Riverside will protect the groundwater quality. Providing a long-term salt management strategy will create a solid foundation for building further water reliability. Initiative 3 – Drought response Current and future droughts will challenge Rancho Water on the water supply, finance and public outreach fronts. Implementation of the Water Shortage Contingency Plan and continued implementation of the Water Use Efficiency Program will be key activities in the coming year. Rancho Water’s Communications Plan must be updated to ensure it reflects current conditions.
33

Rancho California Water District Fiscal Year 2016-2017 Operating Budget
Initiative 4 – Implementation of the Santa Rosa Water Reclamation Facility (SRWRF) wastewater treatment strategy
Rancho Water has contracted with the Elsinore Valley Municipal Water District and Western Municipal Water District for treatment services over the last 25 years. Future regional service is through the recently formed Santa Rosa Regional Resource (SRRRA) Joint Powers Authority (JPA) between Rancho Water and the same agencies. In addition, rehabilitation of the SRWRF is is currently in the design phase.
Initiative 5 – Implement Organizational Enhancements These include planning for and transferring institutional knowledge to ensure that appropriate skill sets are retained and enhanced. The skills Rancho Water needs to be successful in the future are also changing. Ensuring we develop and retain these skills in a competitive job market will be critical. There is also a need to develop and implement improved employee communication approaches to enhance workforce knowledge and engagement. It is important for Rancho Water to continue to be effective and efficient stewards of the public resources entrusted to it. Development and tracking of metrics to ensure accountability will be continued and optimized. This initiative emphasizes the need to proactively examine opportunities to improve services and efficiency, recognizing Rancho Water’s growing emphasis on operations and maintenance. Initiative 6 – Vail Lake Integration Rancho Water’s recent acquisition of the Vail Lake property presents a variety of opportunities and challenges. A Property Guidance Document was recently approved which would govern the acceptable uses of the various Vail properties for recreational and income generating activites. Further planning and property interest solicitation is underway for potential property leasing in line with effort to make the properties financially sustainable. Furthermore, completion of a Vail Lake Resource Management Plan (RMP) will guide Rancho Water in leveraging the opportunities and meeting the operational challenges. Staff will also conduct an evaluation of the potential to develop a riparian mitigation land bank.
34

Rancho California Water District Fiscal Year 2016-2017 Operating Budget
Evaluate Strengths, Weaknesses, Opportunities &
Challenges
Review Mission, Values, establish Guiding Principles
Develop Strategic Objectives & Targeted Activities
Scorecard - Key Performance Indicators to Measure
Progress
Develop Staffing & Resource needs w/Annual Budget
Process
Regularly Update the Plan
PROCESS
35

Rancho California Water District Fiscal Year 2016-2017 Operating Budget
Strategy 1 – Develop appropriate water resource mix to meet the water reliability needs of the community we serve
Objective 1: Review and update the Integrated Resources Plan in light of current resources and economic trends
Objective 2: Track opportunities for water transfers
Objective 3: Communicate the plan to and engage the Board in policy establishment
Objective 4: Develop resource-planning tools and models to support long-term planning
Objective 5: Modify capital program to reflect updated water supply portfolio
Strategy 2 - Increase the use of recycled water in the service area
Objective 1: Process onsite recycled water conversions
Objective 2: Coordinate water and recycled service opportunities with area agencies
Strategy 3 – Develop and implement a comprehensive groundwater management strategy
Objective 1: Work with Riverside County Health Department to develop a Local Agency Management Plan that addresses Rancho Water concerns
Objective 2: Conduct additional basin modeling
Objective 3: Implement groundwater conjunctive use project – Phase I & II
Objective 4: Engage with Eastern and Western in Metropolitan negotiations on access to replenishment of water
Strategy 4 – Develop Brine Management Strategy and Future Recycled Water Project
Objective 1: Complete preliminary design
Objective 2: Negotiate and finalize institutional arrangements
Objective 3: Complete final design
Objective 4: Complete California Environmental Quality Act documentation
Objective 5: Secure additional funding assistance
Objective 6: Complete construction
Strategy 5 – Engage on statewide water policy issues
Objective 1: Work with the Board to establish the RCWD position on the Bay Delta Conservation Plan
Objective 2: Track and engage on regulations and legislation that affects Rancho Water
Guiding Principle 1: Reliability
Rancho Water will provide a level of water reliability that ensures customers’ water needs are met
36

Rancho California Water District Fiscal Year 2016-2017 Operating Budget
Strategy 1 – Respond to anticipated near-term water shortages through rate structure modification, conservation assistance, customer service, and outreach
Objective 1: Implement the newly updated Water Shortage Contingency Plan
Objective 2: Increase local messaging and outreach in anticipation of water supply constraints
Strategy 2 – Address planning for long-term salinity management/nutrient management
Objective 1: Implement the Salt / Nutrient Management Plan with regional partners
Objective 2: Track progress on wine country infrastructure
Strategy 3 – Anticipate and comply with regulatory and environmental changes
Objective 1: Continue to meet regulatory requirements water/wastewater/environmental/security
Objective 2: Evaluate impact of potential changes in water quality regulations on RCWD well production and cost of operations
Objective 3: Track regulation development and engage where appropriate
Strategy 4 – Provide safe drinking water to our customers by ensuring all current and anticipated drinking-water regulations are met or surpassed
Objective 1: Meet all standards 100 percent of the time
Guiding Principle 3:
Stewardship
Rancho Water will exercise good stewardship of financial and operating assets through use of sound, cost-effective business judgment.
Strategy 1 – Plan and prepare for catastrophic emergencies
Objective 1: Conduct annual joint agency hazardous material response drill at the SRWRF-CCR Title 19 compliance
Objective 2: Conduct annual NIMSCAST report to FEMA. Report RCWD compliance with the National Incident Management System (NIMS)
Objective 3: Conduct RCWD Emergency Operations Plan training &/or exercise periodically and implement lessons learned
Objective 4: Evaluate EOC needs
Guiding Principle 2:
Quality
Rancho Water will provide safe water and high-
quality services to its customers.
37

Rancho California Water District Fiscal Year 2016-2017 Operating Budget
Objective 5: Assess business resumption capability
Strategy 2 – Research and analyze beneficial outside service agreements
Objective 1: Evaluate potential service agreement for Western Municipal Water District retail service area
Objective 2: Evaluate providing sewer collection maintenance services to adjacent areas
Objective 3: Achieve the formation of a JPA with Santa Rosa Water Reclamation Plant agencies
Strategy 3 – Optimize real estate management (acquisition and use)
Objective 1: Develop a plan for Tarwater Property suitable for developing income-producing property program
Objective 2: Acquire 1305 and 1610 PZ reservoir sites
Objective 3: Investigate and acquire potential sites as identified in the Integrated Resource Plan
Strategy 4 – Maximize outside funding opportunities
Objective 1: Complete Proposition 84 Integrated Regional Water Management and other state/local grants
Objective 2: Track and report grant opportunities/wins
Objective 3: Pursue Title XVI funding – Annual Appropriations
Objective 4: Evaluate and Pursue Opportunities for Grant Funds from proposed 2014 Water Bond
Objective 5: Implement adopted grant management procedures
Strategy 5 – Maintain, implement, and enhance the long-range financial plan
Objective 1: Implement Asset Management Planning
Objective 2: Update Water Facility Master Plan
Objective 3: Update Wastewater Facility Master Plan
Objective 4: Annually develop a 5-year Capital Improvement Plan
Objective 5: Continue participation in the Rate Refinement Workgroup
Objective 6: Achieve cash reserve and revenue levels as identified in Cash Reserve Policy
Objective 7: Investigate reserve and revenue protection strategies
Objective 8: Review budget-based tiered rate model and cost allocations to tiers
Objective 9: Prepare an annual update to the Long-Range Financial Plan
Objective 10: Annually update financial policies
Objective 11: Conduct an annual credit rating review process
Strategy 6 – Implement long-term plan for wastewater treatment
Objective 1: Initiate and complete rehabilitation of the Santa Rosa Water Reclamation Facility (SRWRF)
Objective 2: Establish JPA for future wastewater service at the SRWRF
38

Rancho California Water District Fiscal Year 2016-2017 Operating Budget
Strategy 7 – Pursue maintenance on existing facilities that meets or exceeds industry norms
Objective 1: Implement, integrate, and utilize a replacement Computerized Maintenance Management System (CMMS)
Objective 2: Evaluate maintenance level of service standards
Objective 3: Imbed maintenance standards in the maintenance program
Objective 4: Rehabilitate wells to restore system capacity
Strategy 8 – Continue to use Effective Utility Management (EUM) as a management tool for optimizing RCWD activities
Objective 1: Continue to track EUM performance measurement indicators
Strategy 9 – Optimize external shared service opportunities
Objective 1: Explore bulk purchase of chemicals
Objective 2: Explore bio-solid disposal partnership
Objective 3: Explore state purchase pools
Objective 4: Explore equipment sharing with adjacent regional government entities
Objective 5: Explore O&M opportunities to provide or receive services to/from other government/private entities
Strategy 10 – Improve organizational effectiveness
Objective 1: Further use of organizational performance measurement/management
Objective 2: Implement remaining Track 2 items of Enterprise Resource Planning (ERP) – Document Management and Performance Management
Objective 3: Implement Track 3 of ERP Customer Information System (CIS) Project
Objective 4: Implement Geographic Information System (GIS) Master Plan
Objective 5: Review outsourcing opportunities related to fleet maintenance, inspection, leasing/ maintenance
Objective 6: Examine vacancies to determine optimum staffing levels
Objective 7: Conduct post technology implementation audits to determine value provided
Objective 8: Track and evaluate overtime trends
Objective 9: Improve internal communications to enhance staff awareness and engagement
Objective 10: Brief all employees on the Strategic Plan
Objective 11: Continue to set and communicate performance metrics to all employees
Objective 12: Provide appropriate education & safety-related training for all employees
Objective 13: Review District website and for additional customer functionality opportunities
Objective 14: Update the Information Technology Master Plan
Objective 15: Identify and phase out, as appropriate, duplicate data handling systems
39

Rancho California Water District Fiscal Year 2016-2017 Operating Budget
Strategy 11 – Promote an open and professional work environment throughout the organization
Objective 1: Reinforce partnerships with the bargaining units to promote a spirit of cooperation, respect, and trust
Objective 2: Reinforce District value statement – “PRIDE”
Objective 3: Proactively address appropriate policy and process changes
Objective 4: Proactively and collaboratively address grievances
Objective 5: Provide cooperative cross-functional problem-solving opportunities
Strategy 12 – Attract, retain, and develop quality staff
Objective 1: Maintain competitive compensation & benefits package
Objective 2: Optimize human resources of organization through involvement & empowerment
Objective 3: Conduct annual performance management and evaluation
Objective 4: Develop a succession plan
Objective 5: Track attrition and causes
Objective 6: Assess and revise employee-training programs to develop bench strength
Objective 7: Include a cross-divisional review element in employee performance evaluations
40

Rancho California Water District Fiscal Year 2016-2017 Operating Budget
Strategy 1 – Implement effective water use efficiency (conservation) plan that meets or exceeds voluntary best management practices and/or legislative requirements
Objective 1: Present Water Use Efficiency Blueprint to Board for approval
Objective 2: Complete 2015 Urban Water Management Plan/Agricultural Water Plan
Objective 3: Provide customer information and assistance – water use efficiency evaluations
Objective 4: Target Demonstration Efforts – Partner with local Homeowner’s Associations to promote and encourage sound water use through efficient irrigation and plant materials
Objective 5: Develop a Financial Incentive Program targeted to the commercial, industrial, and institutional customer sector
Objective 6: Continue to provide a Financial Incentive Program tailored to the agricultural customer sector
Objective 7: Conduct research projects to demonstrate new agricultural irrigation efficiency techniques and technologies
Objective 8: Continue to implement residential and landscape water use efficiency programs
Objective 9: Work cooperatively with the Cities of Temecula and Murrieta and the County of Riverside to develop effective landscape ordinance that is consistent with encouraging efficient landscape
Objective 10: Implement conservation program review recommendations
Objective 11: Comply with state-mandated 20% urban per capita water use reduction by 2020 legislation, SB x7-7
Objective 12: Establish efficiency requirements for recycled water to maximize efficient use of the resource
Objective 13: Increase representation of retailers, particularly with a finance perspective, in the California Urban Water Conservation Council (CUWCC) regarding the value of water budget based rate structures to achieve conservation
Objective 14: Provide customer information and assistance – Workshops and information
Objective 15: Implement conservation program review recommendations
Strategy 2 – Optimize the Vail Lake asset
Objective 1: Prepare a Resource Management Plan for Vail Lake
Objective 2: Evaluate development of a riparian mitigation land bank
Objective 3: Develop a financial and operational sustainability plan for the Vail Lake properties/assets
Guiding Principle 4:
Sustainability
Rancho Water will address, adopt, and implement policies that support the social, economic, and environmental values of the service area.
41

Rancho California Water District Fiscal Year 2016-2017 Operating Budget
Strategy 3 – Optimize partnerships with neighboring public agencies
Objective 1: Partner with Eastern Municipal Water District, Western Municipal Water District, and Metropolitan Water District of Southern California (and others) to offer conservation programs to Rancho California Water District customers
Objective 2: Work with Cities of Temecula and Murrieta and County of Riverside to pursue sustainability initiatives where practical
Objective 3: Work with local school boards to communicate key water messages
Objective 4: Work with local water agencies, Association of California Water Agencies, California Association of Sanitation Agencies, and others to track and comment on state legislative proposals that may impact Rancho California Water District and its customers
Strategy 4 – Optimize energy efficiencies including the economically appropriate use of renewable power
Objective 1: Evaluate and implement energy-efficient systems
Objective 2: Evaluate and implement alternative energy opportunities
Objective 3: Utilize new Supervisory Control and Data Acquisition (SCADA) system to achieve greater energy optimization
Guiding Principle 5: Customer
and Community
Rancho Water will inform and engage its customers and community leaders as it pursues reliable, high quality, and sustainable water supply.
Strategy 1 – Communicate with and engage our community on water matters of importance to the region
Objective 1: Continue to provide informative articles in water bill mailer, newsletter, newspaper, & other avenues
Objective 2: Conduct targeted outreach to customers who may be impacted by RCWD construction projects
Objective 3: Communicate strategic progress to stakeholders
Objective 4: Brief key stakeholders on water supply challenges & need for their support for solutions in Sacramento
Objective 5: Brief chambers of commerce & other local business groups on water supply challenges, need for Delta solution, & RCWD’s Integrated Plan for local supplies
Objective 6: Brief editorial boards of local newspapers on current water supply challenges & RCWD’s Integrated Plan
Objective 7: Expand executive staff involvement with local chambers & community groups
42

Rancho California Water District Fiscal Year 2016-2017 Operating Budget
Objective 8: Assess opportunities to increase customer awareness of imported water supply conditions
Objective 9: Meet educational water efficiency BMP through school educational programs
Objective 10: Meet and brief city councils to leverage televised broadcasts to convey water issue information
Strategy 2 – Provide prompt responses and cost-effective customer service
Objective 1: Develop customer service standards
Objective 2: Conduct cost-effective Customer Satisfaction/Feedback Survey every 5 years
Objective 3: Track call-wait times and validate benchmarks
Strategy 3 – Minimize complaints on quality, reliability, billing, and customer service
Objective 1: Track and analyze customer complaints
Objective 2: Incorporate the findings into revised customer service policies/standards
Strategy 4 – Provide staff support for Board of Directors’ meetings to engage the community
Objective 1: Prepare adequate and timely information to support sound policy decisions by the Board of Directors
43

Rancho California Water District Fiscal Year 2016-2017 Operating Budget
Rate Design Structure
Rate Setting Philosophy
Accounting for water and wastewater operations is performed on an enterprise fund basis. An enterprise fund is defined as, “a fund established to account for operations that are financed and operated in a manner similar to private business enterprises where the intent of the governing body is that the costs of providing goods or services to the general public on a continuing basis be financed or recovered primarily through user charges.”
As an enterprise fund, water and wastewater operations are viewed as a business. Likewise, appropriate business principles related to cost identification, cost-effectiveness, and financial reporting are addressed accordingly.
As indicated by the definition of an enterprise fund, appropriate fees and charges are established to ensure the District can operate on a self-sustaining basis. In a water and wastewater utility such as the Rancho California Water District, the majority of revenue is derived from user charges. User charges are defined as “fees, rates, assessments, and billings that are charged to the beneficiaries of services.” User charges are a way of recovering costs for providing a service from those that benefit directly from that service. The total process of (1) identifying water and wastewater costs; (2) allocating costs to utility or service beneficiaries; and (3) designing rate structures to recover allocated costs is defined as the user-charge system.
Some of the factors that are considered in designing appropriate rate structures include: Equity or fairness: Costs should be recovered from customers or customer classes in proportion to the costs of providing service to these beneficiaries. Legality: A user charge structure should comply with appropriate local, state and federal legal requirements. Impact on customers: The economic impact that a proposed user charge structure will have on customers should be considered. When a utility modifies its rates, costs are typically redistributed among customer classes and significant impacts can affect certain customers. Avoidance of discriminatory relationships: The user charge system should avoid placing unfair cost recovery burdens on any particular class of customers. This is accomplished by using a cost-of-service rate structure. Establishing a cost-of-service user charge system with numerous user classes will achieve greater equity, but is complex and more difficult to implement. These trades-offs show that ratemaking is an art that carefully considers alternative rate-setting techniques to optimize the District’s cost-recovery objectives and to achieve equity among customers.
Cost and Revenue Categories
The District’s current rate structure is established and maintained on the cost-of-service basis as described in the preceding section. Under this system, the costs of operations and the funding of capital facilities are identified and apportioned so that the customers receiving benefits from these services are appropriately charged.
When the various costs of operating the District are analyzed, the first consideration is the separation of operating costs related to the production and delivery of water from costs related to the construction and expansion of the production and delivery systems. These two categories are referred to as “operating” and “non-operating” costs.
44

Rancho California Water District Fiscal Year 2016-2017 Operating Budget
Operating Costs
The operating costs are broken down into three categories, as follows:
Variable Costs - These costs are created during the actual production, distribution, and delivery of water services and represent the costs per unit of water measured in hundred cubic feet or “hcf”. Fixed Costs - These costs are created by the need to maintain a utility systems capacity to deliver water to all customers and represent the cost of service availability, which must be maintained for each customer in order to preserve their share of reserved system volume. Fee for Service Costs - These costs are created by specific service needs of specific customers and do not provide a direct benefit to other utility customers. In general terms, the tenor of the law in the State of California requires that the user or requestor pay for services in direct proportion to the benefit received. Therefore, the Board of Directors has established a policy of setting the amount of the fees (or rate) to recover direct and indirect expenses related to providing the requested services as opposed to supplementing these services in the water rates. Periodically, an evaluation of all services is conducted wherein the amount of actual expense for the service is reviewed and the fee (or rate) is set or adjusted accordingly. Examples of these fees or charges would be customer turn-on and turn-off fees, meter installation fees, and other various inspection and engineering-related services.
Non-Operating Costs
Non-operating costs are defined and discussed in the Long-Range Capital Financing Plan section of the budget beginning on page 177.
Operational Factors
The following is a summary of the District’s operating environment and philosophies, which affected the preparation of the District’s annual strategic operating plan and operating budget for the Water and Wastewater Divisions.
Operating Revenues
It has been, and continues to be the District’s policy to fix water and wastewater rates (consisting of base water rates, energy charges, monthly capacity fees, and wastewater monthly charges) so as to cover all costs of water and wastewater operations.
Water Rates and Sales
Four potable water rate classifications exist in the District. Farmers, growers and ranchers pay an agricultural rate, homeowners a residential rate, businesses a commercial or an industrial rate, and developers/contractors a construction rate. All rates include payment for the amount of water used as well as an energy charge for the cost incurred in pumping water to higher elevation properties. Recycled water customers pay either an M&I rate or an agricultural rate.
While growth continues to occur in the residential category, now 86.0% of the accounts; the agricultural customers continue to create the greatest production demands on the system. Although comprising only 3.4% of the accounts, 39.2% of the total water demands are for agricultural purposes.
One of the greatest challenges facing the District centers on finding new ways to meet these increasing demands while minimizing the financial impact to its customers. Based on current general plans for the Cities of Temecula and Murrieta and the County of Riverside, the ultimate build out of the District is expected to include 58,587 dwelling units, 4,732 acres of Business Park and commercial areas and approximately 11,345 acres of agricultural use. According to the District’s Master Plan, the projected ultimate water demand is estimated at 111,218 acre-feet, 48.2% more than the rate of current usage in the District.
45

Rancho California Water District Fiscal Year 2016-2017 Operating Budget
The chart below details the projected water sales for each of the next five years. While moderate growth is occurring each year as it is anticipated that conservation from the drought response will lessen in future, total sales for FY 2016-2017 are projected to be 9.5% less than the 2015-2016 budgeted amounts due to conservation efforts and implementation of a water shortage contingency plan.
5 Year Water Sales Forecast
Chart 5.1
Monthly Service Charges
The District levies a fixed monthly fee on each water meter according to the rate of flow that the meter is capable of delivering. The philosophy behind this charge is that the fixed costs to the District will remain, irrespective of water demands and represent the cost to keep the system ready to meet demands. These fixed charges account for 28.2% of the District’s operating revenues. A more detailed description can be found in the Footnotes section, Page 73, and the Schedule of Monthly Service Charges can be found on Page 82.
0
10,000
20,000
30,000
40,000
50,000
60,000
70,000
80,000
16-17 17-18 18-19 19-20 20-21
Ag M&I Recyled
46

Rancho California Water District Fiscal Year 2016-2017 Operating Budget
Sources of Water
Water Utility Supply and Operations
As identified in its 2015 Water Facilities Master Plan, the water resources available to the District include imported water from MWD purchased through EMWD and WMWD, natural local sources and secondary sources, such as locally available recycled water and water conservation. Local sources include the District’s right to capture native waters at Vail Lake (up to 40,000 acre-feet annually) and to appropriate local groundwater, which it does on a perennial safe yield basis. Over the last seven fiscal years, the District has lost approximately 3.8% to 7.5% of its water sources between the source and the ultimate use by the consumer as a result of pipeline breaks, evaporation from operating reservoirs and metering discrepancies.
A summary of the District’s annual water production by source for the five fiscal years 2010-2011 through 2014-2015 is set forth in the table below:
RANCHO CALIFORNIA WATER DISTRICT
ANNUAL WATER PRODUCTION SOURCE(1)(2)
Fiscal Years 2010-11 through 2014-15
Fiscal Year
Purchased Treated Water
% of Total
Recharged Water
% of Total
Local Sources
% of Total
Recycled Water
% of Total
Total Water Production
2010-11 22,792 37.1 12,371 20.0 23,041 37.5 3,311 5.4 61,515 2011-12 22,376 34.0 16,301 24.8 23,626 35.9 3,472 5.3 65,775 2012-13 27,614 38.7 12,034 16.9 27,393 38.4 4,251 6.0 71,292 2013-14 31,468 41.5 11,722 15.5 28,062 37.0 4,494 5.9 75,746 2014-15 24,817 37.5 12,254 18.5 25,018 37.8 4,037 6.1 66,126
(1) All sources in acre-feet of water. (2) Amounts may not total due to independent rounding.
Source: Rancho California Water District
Local Sources of Water
The District’s policy is to manage and protect its local groundwater resources as a top priority. Local sources of water include groundwater from underlying aquifers, which are recharged from precipitation, and stream flows. Natural local sources supplied approximately 37.8% of the District’s fiscal year 2014-2015 water demand and 37.0% of its fiscal year 2013-2014 water demand. Starting in fiscal year 1997-1998, the District began to use recharge and recovery programs utilizing imported water. Recharged water provided approximately 18.5% and 15.5% of the District’s water demand in fiscal years 2014-2015 and 2013-2014, respectively.
For management purposes, the District has subdivided the Murrieta-Temecula Groundwater Basin into 14 hydrologic sub-units, the substantial portion of which is located in the Rancho Division. The perennial safe yield of local groundwater within the District is estimated to be between 20,000 and 30,000 acre feet per year depending on hydrologic conditions. The District’s knowledge of the groundwater basin has grown substantially over the past 30 years through extensive monitoring programs, a well-documented annual groundwater audit process to establish safe production targets, and the development and integration of a combined surface water/groundwater hydro-geologic computer model.
All aquifers managed by the District are located in the Santa Margarita Watershed. Oversight of all groundwater production within the Santa Margarita Watershed falls under the continuing
47

Rancho California Water District Fiscal Year 2016-2017 Operating Budget
jurisdiction of the United States District Court, in the case of the United States v. Fallbrook Public Utility District, et al. and is administered by a court-appointed Watermaster (the "Santa Margarita Watermaster"). The court appointed a Steering Committee, which is comprised of representatives of the United States, Western Municipal Water District, Eastern Municipal Water District, Fallbrook Public Utility District, MWD, Pechanga Tribe and the District. The purpose of the Steering Committee is to assist the court, to facilitate litigation and to assist the Santa Margarita Watermaster. The need for the Watermaster and the Steering Committee stems from litigation that began in the early years of the twentieth century over various water rights between the Vail Ranch and the Santa Margarita Ranch, two cattle ranches. Today, the District, through the Vail Lake Agreement, has assumed the rights and responsibilities of Vail Ranch, and the United States Marine Corps Base, Camp Pendleton ("MCBCP") is the successor in interest to the Santa Margarita Ranch.
In 2002 the District and MCBCP entered into a Cooperative Water Resources Management Agreement (the “CWRMA”) which supplements the Fallbrook decree and has been approved by the Court in the Fallbrook Public Utility District Case. In general terms, the CWRMA divides the natural supply of Santa Margarita River supply one-third to the District and two-thirds to Camp Pendleton and requires the District to provide make-up water if there is a shortage in Camp Pendleton’s share of the river flows. As long as the parties comply with the provisions of the CWRMA, the long-standing water rights dispute between the District and MCBCP over the Santa Margarita River is considered to be resolved.
Settling the water rights disputes in the watershed is a result of the District’s long-term management policies. In 1966 the District instituted an Agency Agreement program, which required property owners to assign management of their water rights to the District in return for acquiring service from the District. This program has now allowed the District to cover 95% of the properties within the District’s boundaries with a restriction on drilling wells and producing groundwater. Consequently, the District controls the majority of the groundwater production in the upper basin. As such, the District is able to manage the basin on a long-term sustained yield basis, which targets an annual production of approximately 20,000 to 30,000 acre-feet.
Vail Lake is an important component of the District’s local water sources. It is the only surface water capture-release facility in the hydro-geologic area of the District. Vail Dam was constructed in 1948-1949 to impound the winter flows derived from the Wilson, Kolb, and Temecula Creeks, an upstream area of approximately 319 square miles. Through the Vail Lake Agreement between Kaiser Development Co. and the District, executed in 1978, the District acquired Vail Lake and Vail Dam, as well as the right to operate the facilities for the benefit of the District’s water users. Water contained within Vail Lake is released at the base of Vail Dam into Butterfield Canyon, through which Temecula Creek flowed uncontrolled prior to the construction of the dam.
The full reservoir area of Vail Dam is 1,070 surface acres. Total reservoir capacity of Vail Dam is 49,370 acre-feet. Average annual surface flows into the reservoir are approximately 12,500 acre-feet. Under an Appropriations Permit obtained from the State of California in 1948, the District may store up to 40,000 acre feet in Vail Lake each year between November 1 and April 30. The State Water Resources Control Board issued an amended Appropriations Permit 7032 in 2009 that entitles the District to use the diverted and stored water for groundwater recharge and ultimate use for all purposes throughout the District’s service area. The State Water Resources Control Board’s issuance of the amended Appropriations Permit 7032 was conditioned upon the existence of a valid Cooperative Water Resource Management Agreement by and between the District and United States Marine Corps at Camp Pendleton.
48

Rancho California Water District Fiscal Year 2016-2017 Operating Budget
Since 1975, a total of 185,400 acre-feet of captured surface water run-off has been periodically released from Vail Lake to artificially recharge the groundwater aquifers serving the District. In 1993, the District constructed 175 acres of improvements in its recharge facility. The installation of these facilities enables the District to recharge up to 29,000 acre-feet of imported water purchased from MWD.
In an effort to protect water quality and continue to provide customers with a reliable water supply, RCWD purchased over 7,000 acres surrounding Vail Lake in Temecula through a court-ordered bankruptcy sale in August 2014. RCWD has owned Vail Dam, Vail Lake and the associated state water rights permit since 1978. The lands that surround Vail Lake were owned by various corporate entities and consist of open space, an RV campground, and associated fishing and water recreation membership operations on the lake. By purchasing the land surrounding Vail Lake, the District is seeking to protect the quality of its water supplies and enhance the reliability of those supplies. Vail Lake is an important asset to the community and the District plans to continue to protect this asset.
Imported Water
Approximately 57.0% of the District’s fiscal year 2013-2014 and 56.1% of the District’s fiscal year 2014-2015 water supply was imported. Based on the District’s Master Plan, the projected future water demand is estimated at 111,218 acre-feet. The District expects that additional future water needs will be provided from increased amounts of imported water as seen in the chart below.
Chart 5.2
Imported water purchased from EMWD and WMWD is delivered to the District from the MWD aqueducts passing through the District. EMWD generally serves the Rancho Division and the WMWD generally serves the Santa Rosa Division. The District’s ability to purchase imported water from EMWD and WMWD is based on availability and demand within the region and no assurances
0
10,000
20,000
30,000
40,000
50,000
60,000
70,000
80,000
16-17 17-18 18-19 19-20 20-21
Acr
e-
Fee
t
5 Year Production Forecast
Native Well Import Recharge Treated Import Reclaimed
49

Rancho California Water District Fiscal Year 2016-2017 Operating Budget
can be made as to the ability of MWD to satisfy the water demands of its member agencies, including the EMWD and WMWD, and, in turn, the demands of the District to the EMWD and WMWD. The cost of treated water from imported sources currently is approximately $923 per acre-foot, which is substantially more expensive than the average cost of water from local sources. The District currently pays approximately $582 per acre-foot for import recharge water.
Marginal Cost Impacts
Import water costs and changes in import water requirements have a significant impact on the cost of water utility operations due to the marginal per unit cost difference between import water and local water. The cost per acre foot of import water exceeds that of local water by 500%; therefore, any changes in the quantity of import water requirements has a material impact on total water operations and corresponding water rates.
Additionally, projected import water rate increases by MWD will further add to the impact on total operating costs and corresponding water rates.
The following chart details the projected MWD treated water rates for the next five years, showing an anticipated increase of 18.4% over the actual rate for 2015-2016.
Chart 5.3
$971
$1,000
$1,030
$1,061
$1,093
$900.00
$920.00
$940.00
$960.00
$980.00
$1,000.00
$1,020.00
$1,040.00
$1,060.00
$1,080.00
$1,100.00
$1,120.00
16-17 17-18 18-19 19-20 20-21
Pe
r A
cre
-Fo
ot
Projected Average Treated Import Water Rate
50

Rancho California Water District Fiscal Year 2016-2017 Operating Budget
District's Solar Panels
Skinner Reservoir, a MWD facility located five miles from the District, provides additional stored surface water within Southern California. Skinner Reservoir was completed in April 1973 with a full reservoir area of 1,140 acres. Total reservoir capacity is 44,264 acre-feet. This MWD facility is storage and a regulating reservoir for the California Water Project and for Colorado River water imported to Southern California for use in southern Riverside and San Diego Counties. All deliveries of imported water to the District emanate from Skinner Reservoir. In 2002, the District constructed a new connection to the Skinner Reservoir, which increased the District’s connected capacity by 100 cubic-feet per second.
The drainage area upstream of the dam that forms Skinner Reservoir includes approximately 44 square miles. Natural surface runoff from that area is measured as it enters the reservoir and, by legal agreement, upstream surface flows are passed through the reservoir and discharged into Tucalota Creek. Flows in Tucalota Creek enter Santa Gertrudis Creek, which, in turn, is a tributary of Murrieta Creek. Flows into Tucalota Creek and Santa Gertrudis Creek help to recharge the underground aquifers, the source of groundwater for the District. Once the releases from Skinner Reservoir reach Murrieta Creek, the water is effectively lost from the area by evaporation and/or surface flows out through the Temecula Gorge.
Secondary Sources of Water
Secondary sources of water for the District include recycled water and conserved water. According to the District’s Master Plan, these secondary resources will contribute to the District’s supplies for the foreseeable future by reducing overall costs to the District’s water users, as well as ensuring an adequate long-term supply through build-out of the District.
Recycled water produced at the Santa Rosa Water Reclamation Facility is used to irrigate large turf areas in the District such as golf courses, parks, and schools. In fiscal years 2013-2014 and 2014-2015, the District sold 4,090 acre-feet and 3,549 acre-feet of recycled water, respectively. As municipal and industrial water uses increase in the future, additional recycled water is expected to become available for specialized purposes. The District is working on increasing its use of recycled water with an end goal in excess of 9,000 acre-feet. Conservation, although not a true water source but a reduction in use through scientific and more careful application, will be largely reflected in the agricultural use sector. The District has also purchased imported water to percolate and recharge its basins and use stored water during its high-demand periods. In fiscal year 2013-2014, such recharged water supply provided more than 11,722 acre-feet, representing 15.5% of the District’s water supply. In fiscal year 2014-2015, such recharged water supply provided more than 12,254 acre-feet, representing 18.5% of the District’s water supply.
Energy Costs
It is estimated that the District’s fiscal year 2015-2016 energy budget, related to water operations of $6,139,398 will decrease to $5,421,153 for fiscal year 2016-2017. This equates to a decrease of $718,245 or an 11.7% decrease over prior years’ estimates. The decrease in energy costs is primarily driven by a decrease in demand, although there is a slight increase in rates from Southern California Edison. The District currently has three separate solar power facilities with a capacity of 2.6 MW. In 2016, a new 5.0 MW solar power facility will be added to
51

Rancho California Water District Fiscal Year 2016-2017 Operating Budget
the District’s energy portfolio.
Quality of District’s Water
The quality of water delivered by the District meets all current requirements of the federal Safe Drinking Water Act and regulations of the California Department of Health Services. The District purchases raw and treated MWD water stored at Skinner Reservoir through EMWD and WMWD. The District’s MWD water is delivered from the first delivery station of Skinner Reservoir. As a result, the District receives treated water with the highest strength of residual disinfectant level as compared to other delivery stations in the system downstream.
The District manages the production of local groundwater for both long-term sustained yield and protection of water quality. Currently, three of the District’s 44 active production wells exceed allowable maximum contaminant levels for arsenic and/or fluoride. Both constituents commonly occur naturally in the region’s geologic formations. All three wells are operating under California Department of Public Health Services approved blending plans so that the water delivered to customers meets all current standards.
Existing Water Utility Facilities
The District presently uses a combination of existing groundwater wells, four imported treated turnouts from MWD, and two imported untreated turnouts from MWD, recycled water, and groundwater recharge to meet its water supply needs. Future water supply needs are expected to be provided through increased water recycling projects and groundwater recharge.
Wastewater Utility Operations
The District is responsible for providing collection, treatment, and disposal of wastewater in the Santa Rosa Division of the District. In 1989, the District placed in service its Santa Rosa Water Reclamation Facility ("SRWRF"). The SRWRF is a sequencing batch reactor wastewater treatment facility with secondary treatment capacity currently at 4 million gallons per day (“mgd”) and tertiary treatment capacity of 5 mgd.. The SRWRF is currently processing flows of 2.6 mgd, which is approximately 65% of its current secondary capacity. The District anticipates connections of approximately 261 equivalent dwelling units per year, which should produce an additional 41,760 gallons per day of influent per year. Currently in the design phase is the Rehabilitation project to update certain facilities employed at the SRWRF in order to improve operational efficiency and reliability. The District has established a plan of finance for such project and its design and construction is expected to be completed by 2018. As set forth in the District’s Capital Facilities Plan, the estimated cost of the expansion and updating project is projected to be approximately $25.6 million and is expected to completed and financed by the Santa Rosa Regional Resources Authority (SRRRA), described below, through a California State Revolving Loan.
In 1993 the District completed construction of tertiary level treatment facilities at the SRWRF. The recycled water from the tertiary facilities is used to irrigate golf courses, green belts, parks, as well as other large landscaped areas and potentially for agricultural uses.
The District has a capacity fee program for the wastewater system. Upon making application to the District for wastewater service, the District requires payment of a capacity fee per equivalent dwelling unit.
In November 2015, the District along with Western Municipal Water District (Western), and Elsinore Valley Municipal Water District (Elsinore), formed the SRRRA, a joint powers authority (JPA). The SRRRA is now responsible for the governance of the SRWRF and treatment of its influent flows originating from Western, Elsinore, and the District. Furthermore, the District has been
52

Rancho California Water District Fiscal Year 2016-2017 Operating Budget
appointed by the JPA to be the Administrator of SRRRA and the operator of the SRWRF. Per the JPA formation agreement, the SRRRA will purchase the SRWRF and is responsible to pay the District’s debt service associated with the facility until it can obtain its own debt financing to purchase the sewer plant and thereby eliminate the District’s existing debt associated the SRWRF. All operating expenses and obligations are allocated to each member agency by an agreed upon allocation where operating expenses are allocated by current flows and capital facility debt and costs are allocated by a member agency’s capacity in the plant. The District has 40% primary and secondary treatment capacity, 52% tertiary treatment capacity, and 36.6% trunk sewer line capacity for the SRWRF. It is anticipated that SRRRA will be able to obtain the financing in FY 2016-2017 for both the acquisition of the plant and the Rehabilitation project for the SRWRF.
Insurance
The District is a member of the Association of California Water Agencies Joint Powers Insurance Authority ("ACWA/JPIA"). Through the ACWA/JPIA, the District carries property, liability, and workers compensation insurance. The ACWA/JPIA currently services approximately 300+ member agencies.
The ACWA/JPIA provides pooled insurance coverage for losses in excess of the member districts’ specified self-insured retention level. Individual claims (and aggregate public liability and property claims) in excess of specified levels are covered by excess insurance policies purchased from commercial carriers.
The District continues its proactive risk management role through careful monitoring of losses, working closely with ACWA/JPIA’s claims adjuster, and designing and implementing programs to minimize risks and losses. In addition, the District analyzes worker’s compensation issues by monitoring work conditions, and organizing and implementing safety-training programs to reduce employee exposure to hazards.
Permits and Licenses
The District operates its water system pursuant to a Water Supply Permit issued by the State of California, Department of Health Services to supply water to its service area under Water Permit No. 04-14-96P-016. Additionally, the District owns Permit 7032 for Vail Lake, which allows the District to impound up to 40,000 acre-feet of water per year at Vail Dam and release the same to recharge Pauba Valley for recovery and use for irrigation. That permit is currently under application to the State Water Resources Control Board to allow its use anywhere in the District boundaries.
The District operates its Santa Rosa Water Reclamation Facility pursuant to a discharge permit issued by the San Diego Regional Water Quality Control Board ("RWQCB"). RWQCB Order No. 94-92 allows RCWD to reclaim up to 5.0 mgd and redistribute that water over a portion of its service area for irrigation purposes.
53

Fiscal Year 2016-2017 Operating Budget Rancho California Water District
CONSOLIDATED OPERATING BUDGET COMPARISON
Fiscal Year 2016-2017
BUDGET
2014-2015
ACTUAL
2014-2015
BUDGET
2015-2016
BUDGET
2016-2017
% CHANGE FY 2015-2016
BUDGET
OPERATING REVENUE
Water Revenue 34,653,140 39,122,472 38,305,431 36,191,580 -5.52% Recycled Water Revenue 957,062 1,054,896 1,178,774 1,320,828 12.05% Monthly Service Charges 16,522,341 15,478,762 18,073,859 18,911,314 4.63% Unmetered Construction Water 3,705 13,344 21,069 12,377 -41.25% Energy Charges 2,906,825 3,175,380 3,309,602 2,583,633 -21.94% Wastewater Service Charges 4,805,006 4,896,148 4,339,183 4,141,623 -4.55% Other-Recycled Local Project Crds 355,016 520,951 517,506 527,371 1.91% New Service Connections 261,440 284,112 426,383 418,282 -1.90% Rental/Lease Income 579,735 600,036 534,613 576,070 7.75% Other Op Rev-Billing 1,535,359 1,644,234 1,813,486 1,762,671 -2.80% Other Op Rev-Engineering 191,106 163,787 218,924 253,773 15.92% Western Ids/Rock Mountain 71,364 44,550 83,884 79,663 -5.03%
TOTAL OPERATING REVENUE 62,842,100 66,998,672 68,822,713 66,779,186 -2.97%
OPERATING EXPENSES
Source of Supply 41,694,733 46,426,010 41,469,021 39,175,898 -5.53% Booster Pumping 4,421,723 4,402,758 4,465,752 3,947,996 -11.59% T&D 9,162,426 8,709,641 9,153,824 9,305,725 1.66% Customer Service 5,054,578 4,656,511 4,709,864 4,916,833 4.39% Recycled Water 2,929,049 3,397,884 3,052,530 3,212,483 5.24% Wastewater Expense 3,897,648 3,873,292 3,450,998 3,564,891 3.30% Engineering 1,907,152 1,532,945 1,382,133 1,357,768 -1.76% Support 1,115,450 1,548,318 2,028,842 1,968,938 -2.95%
TOTAL OPERATING EXPENSES 70,182,758 74,547,359 69,712,964 67,450,531 -3.25%
Gain or (Loss) From Operations (7,340,658) (7,548,687) (890,251) (671,346) Reserves – Use of (Additions To) 5,840,876 5,226,402 (251,782) (13,439) Interest Earnings General Fund 803,000 1,324,000 518,000 493,000 PERS/OPEB Amortization 696,782 998,285 696,783 196,784 Capital Expenditures General Fund 0 0 (72,750) (5,000)
Net Sources of (Uses) From Op Activities 0 0 0 0
54

Fiscal Year 2016-2017 Operating Budget Rancho California Water District
Source of Supply
Booster Pumping
T & D
Customer Service
Recycled Water
Wastewater Expense
Engineering
Support
- 10 20 30 40 50
$ Millions
Consolidated Operating Budget
FY 16-17 FY15-16
55

Fiscal Year 2016-2017 Operating Budget Rancho California Water District
The following graph and schedules identify the major sources of revenue of the 2016-2017 operating budget.
MAJOR OPERATING REVENUE
Actual FY 2014-15
Budget FY 2015-16
Budget FY 2016-17
Percent Change
Water Revenue $39,122,472 $38,305,431 $36,191,580 -5.52% Recycled Water Revenue 1,054,896 1,178,774 1,320,828 12.05% Monthly Service Charges 15,478,762 18,073,859 18,911,314 4.63% Unmetered Construction Water 13,344 21,069 12,377 -41.25% Energy Charges 3,175,380 3,309,602 2,583,633 -21.94% Wastewater Service Charges 4,896,148 4,339,183 4,141,623 -4.55% Other-Recycled Project CRDS 520,951 517,506 527,371 1.91% New Service Connections 284,112 426,383 418,282 -1.90% Rental/Lease Income 600,036 534,613 576,070 7.75% Other OP Revenue - Billing 1,644,234 1,813,486 1,762,671 -2.80% Other OP Revenue - Engineering 163,787 218,924 253,773 15.92% Western IDA/Rock Mountain 44,550 83,884 79,663 -5.03%
TOTALS $66,998,672 $68,822,713 $66,779,186 -2.97%
54%
2%
28%
0%4% 6%
1% 1%1%
3%
0% 0%
FY 2016-2017Major Operating Revenues
Water Revenue Recycled Water Rev.
Monthly Service Charges Unmetered Construction Water
Energy Charges WW Service Charges
Other-Recycled Project CRDS New Service Conn.
Rental/Lease Income Other Op Rev.-Billing
Other Op Revenue-Eng. Western IDS/Rock Mountain
56

Fiscal Year 2016-2017 Operating Budget
$39.12
$38.31
$36.19
14-15
15-16
16-17
Water Revenue
Actual 14-15 Budget 15-16 Budget 16-17
Explanation of Major Revenue Sources
WATER REVENUE: Commodity water sales are the largest source of District revenues. The District sets rates at a level to recover the cost of delivery. There are four major types of water revenue: Agricultural, Ag-Residential, Residential and Other.
For fiscal year 2016-2017 potable sales quantities are projected to be 53,777 acre feet or 10.2% less than prior year. Water sales revenue is projected to be $36,191,580. Revenue is projected to decrease by 5.52% compared to fiscal year 2015-2016 due to decreased demand.
RECYCLED WATER REVENUE: Recycled water sales earned from recycled water supplied for approved recycled water use such as golf courses, landscapes, parks, etc.
For fiscal year 2016-2017 recycled sales quantities are projected to be 3,874 acre feet or 1.7% more than prior year. Recycled water sales revenue is projected to be $1,320,828. Revenue is projected to increase by 12.05% compared to the fiscal year 2015-2016 due to an increase in the recycled rate and demand.
MONTHLY SERVICE CHARGES: Revenues earned from a monthly charge (pro-rated daily) for customer services such as maintaining meters, processing bills, posting payments and repairing water mains.
Daily charges are primarily based on the size of a customer’s water meter. Charges are applied to open accounts whether water is used or not.
For fiscal year 2016-2017 revenue is projected to be $18,911,314. Monthly service charge revenue is projected to increase by 4.63% compared to the fiscal year 2015-2016 due to increase in rates and charges and growth in number of accounts.
UN-METERED CONSTRUCTION WATER: Revenues earned from a monthly charge for temporary connection to water system in lieu of the meter during construction of residence.
For fiscal year 2016-2017 revenue is projected to be $12,377 Un-metered construction water revenue is projected to decrease by 41.25% compared to the fiscal year 2015-2016 due to a reduction in developer activity.
$15.48
$18.07
$18.91
14-15
15-16
16-17
Monthly Service Charges
Actual 14-15 Budget 15-16 Budget 16-17

Fiscal Year 2016-2017 Operating Budget
ENERGY CHARGES: Revenues earned from a commodity energy charge per HCF for the cost of energy related to pumping of water to various elevation pressure zones.
For fiscal year 2016-2017 revenue is projected to be $2,583,633. Energy revenue is projected to decrease by 21.94% compared to the fiscal year 2015-2016 primarily due to decreased demand although SCE rates increased by 5%.
WASTEWATER SERVICE CHARGES: Revenues earned from a monthly charge, prorated daily, on a customer’s account to recover the costs of collection, transporting, treating and disposing of sewage. Rates are based on equivalent dwelling units (EDU’s).
For fiscal year 2016-2017 revenue is projected to be $4,141,623. Wastewater service charges are projected to decrease by 4.55% compared to the fiscal year 2015-2016 due to decreased corrective maintenance expense.
OTHER- RECYCLED PROJECT CREDITS: Revenues earned from recycled water credits related to recycled water sold in the District. In April 1993 the District entered into a Joint Agreement with Metropolitan Water and Eastern Municipal for an expansion project to distribute up to an additional 5,550 acre feet of recycled water per year and receive a credit of $154 per acre foot (AF) for each AF sold.
For fiscal year 2016-2017 revenue is projected to be $527,371. Recycled Water Credits revenue is projected to increase by 1.91% compared to the fiscal year 2015-2016 due to increased recycled water sales.
NEW SERVICE CONNECTIONS: The District charges customers for the installation of new water meters.
For fiscal year 2016-2017 revenues are projected to be $418,282. New service connections revenue is projected to decrease by 1.90% compared to the fiscal year 2015-2016 due to a decrease in meter installation activity.
RENTAL LEASE INCOME: The District collects rent received from the lease of the old District Headquarters property and cellular facilities located on District property. For fiscal year 2016-2017 revenues are projected to be $576,070. Rental/Lease income is projected to increase by 7.75% compared to fiscal year 2015-2016 due to increased rents.
OTHER OPERATING REVENUE-BILLING: The District collects fees for various services related to the customer water account such as: returned check charges, reduced pressure backflow prevention device (R.P.) inspection fees, delinquent charges, meter tests, R.P. Certification, meter relocations, billing service charges and miscellaneous operation revenue.
For fiscal year 2016-2017 revenues are projected to be $1,762,671. Other Op Rev - Billing is projected to decrease by 2.80% compared to the fiscal year 2015-2016 due to decreased grant revenue.
$3.18
$3.31
$2.58
14-15
15-16
16-17
Energy Charges
Actual 14-15 Budget 15-16 Budget 16-17
$.284
$.426
$.418
14-15
15-16
16-17
New Service Connections
Actual 14-15 Budget 15-16 Budget 16-17

Fiscal Year 2016-2017 Operating Budget
OTHER OPERATING REVENUE-ENGINEERING: The District collects engineering fees for various services performed such as: will serve letters, blueprint sales, sewer inspections, water inspections and plan checking.
For fiscal year 2016-2017 revenues are projected to be $253,773. Other Op Rev - Engineering is projected to increase by 15.92% compared to the fiscal year 2015-2016 due to increased developer activity.

Fiscal Year 2016-2017 Operating Budget Rancho California Water District
58%
6%
14%
7%
5%5%
2%
3%
FY 2016-2017 Major Operating Expense
Source of Supply Booster Pumping T&D
Customer Service Recycled Water WW Expense
Engineering Support
The following graph and schedules identify the major operating expenses of the 2016-2017 operating budget.
MAJOR OPERATING EXPENSES
Actual
FY 2014-15 Budget
FY 2015-16 Budget
FY 2016-17 Percent Change
Source of Supply 46,426,010 $41,469,021 $39,175,898 -5.53% Booster Pumping 4,402,758 4,465,752 3,947,996 -11.59% Transmission and Distribution 8,709,641 9,153,824 9,305,725 1.66% Customer Service 4,656,511 4,709,864 4,916,833 4.39% Recycled Water 3,397,884 3,052,530 3,212,483 5.24% Wastewater Expense 3,873,292 3,450,998 3,564,891 3.30% Engineering 1,532,945 1,382,133 1,357,768 -1.76% Support 1,548,318 2,028,842 1,968,938 -2.95%
TOTALS $74,547,359 $69,712,964 $67,450,531 -3.25%
60

Fiscal Year 2016-2017 Operating Budget
Explanation of Major Operating Expenses
SOURCE OF SUPPLY: Source of Supply expense is the acquisition cost of water for resale to customers. The District has several water resources available, including treated and untreated import water, re-cycled water and natural local sources. Import water is purchased from Metropolitan Water District (MWD) through two of its member agencies, Eastern Municipal Water District (EMWD) and Western Municipal Water District (WMWD) and distributed through connections at EM13, EM20, WR26 and WR28. The natural local groundwater is produced through the District’s potable water wells. The District purchases untreated water from EMWD through the EM19 connection to recharge the groundwater basin.
This operating function includes the cost of labor, overheads, materials, outside services, permits, water quality regulations and utilities used and incurred in the general supervision and operation of water source of supply activities. The District’s water source comes from the groundwater basin and through imported water from MWD. The District has a system of wells and pump stations to extract the water from the ground. Source of supply activities include preventive and corrective maintenance on all well facilities, recharge ponds, and water connections.
For fiscal year 2016-2017 expenses are projected to be $39,175,898. Cost of import water is projected to decrease by 5.8% compared to fiscal year 2015-2016. The 5.53% decrease in total source of supply is directly related to the decrease in demand.
BOOSTER PUMPING: Booster pumping is the activity that transfers water from lower to higher elevation pressure zones through pump stations that lift the water for customer usage.
This operating function includes the cost of labor, overheads, materials, outside services, and utilities used and incurred in the general supervision and operation of pumping activities. The cost of energy is 63.27% or $2,498,084 of the total cost of this activity. Booster pumping activities include preventive and corrective maintenance on all pump stations, generators, and other equipment used in the pumping of water.
For fiscal year 2016-2017 expenses are projected to be $3,947,996. Booster expense is projected to decrease by 11.59% compared to fiscal year 2015-2016 due to the decrease in demand offset by a slight increase in energy rates from Southern California Edison.
TRANSMISSION AND DISTRIBUTION: Transmission and distribution is the water system conveyance facilities that transport water from source of supply facilities to water users. These facilities consist of fire hydrants, air-vacs, valves, reservoirs, and large diameter pipelines that transport water into and out of reservoirs. Reservoirs are designed to meet water requirements at peak demand and equalize the system. This operating function includes of the cost of labor, overheads, materials and outside services used and incurred in the general supervision and operation of transmission and distribution facilities. Transmission and distribution activities include preventive and
$46.43
$41.47
$39.18
14-15
15-16
16-17
Source of Supply
Actual 14-15 Budget 15-16 Budget 16-17
61

Fiscal Year 2016-2017 Operating Budget
corrective maintenance on all reservoirs, mainlines, air-vacs, fire hydrants, valves and meter installations.
For fiscal year 2016-2017 expense is projected to be $9,305,725. Transmission and distribution expense is projected to increase by 1.66% compared to fiscal year 2015-2016 due to increased preventive maintenance activities and increased sampling requirements.
CUSTOMER SERVICE: Customer service is the activity involved in reading and maintaining water meters. It is important that meters be properly installed, maintained, and read to obtain necessary revenue for the water system.
This operating function includes the cost of labor, overheads, materials and outside services used and incurred in the general supervision and operation of customer meters and associated equipment. Activities include preventive maintenance of customer meters and meter reading.
For fiscal year 2016-2017 expense is projected to be $4,916,833. Customer service expense is projected to increase by 4.39% compared to the fiscal year 2015-2016 due to the increased drought response and implementation of the Water Shortage Contingency Plan.
RECYCLED WATER: Recycled water is wastewater treated beyond the secondary to tertiary treatment (Title 22) level. This process consists of a chemically assisted filtration system that
de-chlorinates the water to be used for landscape irrigation, golf courses, and some agriculture use. The recycled water system includes reservoirs, pipelines, pump stations and holding ponds.
This operating function includes of the cost of labor, overheads, materials, utilities and outside services used and incurred in the general supervision and operation of recycled water facilities and associated equipment. Activities include preventive and corrective maintenance of all recycled waterlines, reservoirs, pump stations and holding ponds.
For fiscal year 2016-2017 expense is projected to be $3,212,483. Recycled Water expense is projected to increase by 5.24% compared to fiscal year 2015-2016 due to increased corrective maintenance activities.
WASTEWATER EXPENSE: Wastewater treatment is the process whereby raw sewage is collected and lifted to the treatment plant for processing. There are two processes the sewage goes through, the primary and the secondary. The primary process is the physical settling of waste. The secondary process is transferred to the biological treatment whereby particles are consumed by biological activity. After secondary treatment the wastewater is transferred to the recycled water function for further processing.
$3.40
$3.05
$3.21
14-15
15-16
16-17
Recycled Water
Actual 14-15 Budget 15-16 Budget 16-17
$4.66
$4.71
$4.92
14-15
15-16
16-17
Customer Service
Actual 14-15 Budget 15-16 Budget 16-17
62

Fiscal Year 2016-2017 Operating Budget
This operating function includes of the cost of labor, overheads, materials, outside services, bio-solid removal and utilities used and incurred in the general supervision and operation of wastewater treatment activities. Wastewater activities include preventive and corrective maintenance on all treatment plant structures and improvements.
For fiscal year 2016-2017 expense is projected to be $3,564,891. Wastewater expense is projected to increase by 3.30% compared to fiscal year 2015-2016 due to increased energy expense and non-annual scheduled maintenance.
ENGINEERING: The primary function of Engineering is the planning, design, and construction management of District capital facilities both new and replacement. Engineering also includes overseeing developer activities to ensure that capital facilities meet District standards.
This operating function includes of the cost of labor, overheads, materials and outside services used and incurred in connection with the engineering functions that are not chargeable directly to capital activity. Activities include cost estimates, general customer inquiries, mapping updates and general project planning.
For fiscal year 2016-2017 expense is projected to be $1,357,768. Engineering expense is projected to decrease by 1.76% compared to fiscal year 2015-2016 due to a reallocation of man-hours.
SUPPORT: Support consists of the functions that support the District activities. These functions include grant management, information technology (IT), accounting, board administration, public relations, human resources, records-management, warehouse operations, purchasing, office building maintenance, legal expenses, insurance and utilities. The costs become overhead that is allocated to operating and capital functions. The overhead rate is determined during the annual budget process.
This operating function includes the cost of labor, overheads, materials, utilities and outside services used and incurred in connection with the general administration of the District’s operations that are not chargeable directly to a particular operating function. Activities include preventive and corrective maintenance of all District office buildings, office equipment, and furnishings.
For fiscal year 2016-2017 expense is projected to be $1,968,938. Support expense is projected to decrease by 2.95% compared to fiscal year 2015-2016 due to a shift of labor expense for the implementation of an Asset Management Program.
EMPLOYEE BENEFITS: This operating function includes of the cost of employees’ sick-vacation-holiday benefit, medical-dental-vision insurance, group term life insurance, FICA, long term disability insurance and PERS retirement benefits. These costs become overhead that is allocated to operating and capital functions. The overhead rate is determined with the annual budget process.
$1.53
$1.38
$1.36
14-15
15-16
16-17
Engineering
Actual 14-15 Budget 15-16 Budget 16-17
63

Fiscal Year 2016-2017 Operating Budget
For fiscal year 2016-2017 expense is projected to be $8,242,274. Employee benefit expense is projected to decrease by 2.02% compared to fiscal year 2015-2016 due to the reduction of 3 FTE’s and implementation of GASB 68 on pension expense recognition.
VEHICLE & EQUIPMENT: This operating function includes the cost of labor, overheads, materials and outside services used and incurred in connection with the preventive and corrective maintenance of all District vehicles and equipment. These costs become overhead that is allocated to operating and capital functions. The overhead rate is determined during the annual budget process.
For fiscal year 2016-2017 expense is projected to be $680,976. Vehicle & equipment is projected to decrease by 2.14% compared to fiscal year 2015-2016 due to decreased preventive maintenance costs.
64

Fiscal Year 2016-2017 Operating Budget Rancho California Water District Rancho Division
2014-2015ACTUAL
2015-2016PROJECTED
2015-2016BUDGET
2016-2017BUDGET
OPERATING REVENUES
Water Revenue $17,676,783 $17,706,4585 $19,836,295 $18,395,646 SEE NOTE - 2 Recycled Water Revenue 637,185 901,323 800,826 928,553 Monthly Service Charge 10,540,357 11,240,062 11,378,780 11,875,133 SEE NOTE - 2 Unmetered Construction Water 3,705 5,000 21,069 12,377 Energy Charges 1,344,536 1,204,915 1,575,833 1,204,673 SEE NOTE - 2 Other-Recycled Project Crds 251,667 227,119 375,560 391,913 New Service Connections 127,261 198,062 280,944 295,428 SEE NOTE - 3 Rental/Lease Income 431,665 448,082 386,140 424,047 Other Op Rev-Billing 1,102,975 1,120,966 1,285,646 1,248,523 Other Op Rev-Eng. 151,190 266,854 135,359 164,615 TOTAL OPERATING REVENUES $32,267,321 $33,318,841 $36,076,452 $34,940,908
OPERATING EXPENSES
SOURCE OF SUPPLY
Operating
Purchased Water Resource 20,751,309 13,057,716 20,663,508 18,635,884 Purchased Water Santa Marg 1,097,378 1,204,320 1,222,215 1,320,739 TOTAL SOURCE OF SUPPLY
$21,848,687 $14,262,036 $21,885,723 $19,956,622
BOOSTER PUMPING
OPERATING
Labor 106,822 122,786 87,668 143,889
G&A/Fringe Benefit 240,134 284,498 203,127 334,974
Materials & Supplies 28,894 11,868 17,000 18,600
Utilities 1,297,690 1,103,873 1,504,847 1,149,728
Outside Services 64,379 77,010 63,000 57,100
Vehicle & Equipment 10,367 12,524 8,942 14,677
Total Operating $1,748,286 $1,612,559 $1,884,585 $1,718,967
CORRECTIVE MAINTENANCE
Corrective Maintenance-Labor 17,485 14,322 7,530 19,012
Corrective Maintenance-G&A/FB 39,306 33,184 18,216 46,199
Corrective Maintenance 154,476 56,704 75,500 57,000
Total Corrective 211,267 104,210 101,247 122,211
TOTAL BOOSTER PUMPING $1,959,553 $1,716,769 $1,985,831 $1,841,178
TRANSMISSION & DISTRIBUTION
OPERATING
Labor 1,220,912 1,184,890 1,233,136 1,281,009
G&A/Fringe Benefit 2,540,363 2,545,856 2,667,942 2,779,849
Materials & Supplies 115,014 162,934 145,797 126,997
Outside Services 315,199 363,044 201,430 246,860
Vehicle & Equipment 109,839 112,074 117,449 121,798
Service Connections-Labor 17,005 30,610 37,895 44,440
Service Connections-G&A/FB 36,514 70,354 91,669 107,988
Service Connection Expense 84,432 97,098 151,000 143,000
Total Operating $4,439,278 $4,566,860 $4,646,318 $4,851,941
CORRECTIVE MAINTENANCE
Corrective Maintenance-Labor 167,809 142,172 143,317 159,721
Corrective Maintenance-G&A/FB 377,234 329,414 346,685 388,122
Corrective Maintenance 653,959 636,088 477,000 546,600
Total Corrective 1,199,002 1,107,674 967,002 1,094,442
TOTAL TRANSMISSION & DISTRIBUTION $5,638,280 $5,674,534 $5,613,321 $5,946,384
65

Fiscal Year 2016-2017 Operating Budget Rancho California Water District Rancho Division
2014-2015ACTUAL
2015-2016PROJECTED
2015-2016BUDGET
2016-2017BUDGET
CUSTOMER SERVICE
OPERATING
Labor $619,922 $644,736 $574,310 $573,329
G&A/Fringe Benefit 1,360,020 1,447,938 1,292,577 1,299,814
Materials & Supplies 162,866 153,258 122,400 139,000
Outside Services 74,188 17,924 51,000 42,750
Vehicle & Equipment 60,279 65,764 58,580 58,480
Resource Customer Support 1,329,476 2,016,654 1,275,323 1,423,098
Uncollectible Accounts 27,529 172,018 71,000 81,000
Total Operating 3,634,280 4,518,292 3,445,190 3,617,470
TOTAL CUSTOMER SERVICE $3,634,280 $4,518,292 $3,445,190 $3,617,470
RECYCLED WATER
OPERATING
Joint Facility Recycled Water 1,368,631 1,449,590 1,455,936 1,581,002
Labor 66,423 45,718 61,206 61,296
G&A/Fringe Benefit 149,320 105,928 141,815 142,697
Materials & Supplies 14,877 250,096 19,274 15,750
Utilities 181,108 186,500 205,919 198,038
Outside Services 26,170 20,020 20,950 16,050
Vehicle & Equipment 6,461 4,664 6,243 6,253
Total Operating $1,812,990 $2,062,516 $1,911,344 $2,021,086
CORRECTIVE MAINTENANCE
Corrective Maintenance-Labor 17,870 7,698 13,710 22,369
Corrective Maintenance-G&A/FB 40,172 17,838 33,164 54,356
Corrective Maintenance 108,493 13,880 16,000 39,500
Total Corrective 166,535 39,416 62,874 116,225
TOTAL RECYCLED WATER $1,979,525 $2,101,932 $1,974,217 $2,137,311
ENGINEERING
OPERATING
Labor 44,642 67,950 49,473 48,134 G&A/Fringe Benefit 90,467 139,042 101,568 101,322 Outside Services 8,505 4,726 20,000 20,000 Vehicle & Equipment 4,408 6,808 5,046 4,910 Engineering OH-Cap Fee for Service 21,743 60,136 43,784 50,733 SEE NOTE - 5 Resource Engineering 907,669 819,914 574,161 570,465 SEE NOTE - 5 Total Operating 1,077,433 1,098,576 794,032 795,564
TOTAL ENGINEERING $1,077,433 $1,098,576 $794,032 $795,564
SUPPORT
OPERATING
Direct Support Allocation 814,294 914,169 1,142,754 1,167,496
Resource Support (207,907) 0 0 0
Total Operating 606,387 914,169 1,142,754 1,167,496
TOTAL SUPPORT $606,387 $914,169 $1,142,754 $1,167,496
TOTAL OPERATING EXPENSES 36,744,146 30,286,307 36,841,068 35,462,025
GAIN OR (LOSS) FROM OPERATIONS (4,476,825) 3,032,534 (764,616) (521,117)
RESERVES 3,429,209 (3,797,150) 0 0
INTEREST EARNINGS GENERAL FUND 643,000 360,000 360,000 400,000
PERS CONTRIBUTION AMORTIZATION 404,616 404,616 404,616 121,117
NET SOURCES OR (USES) FROM OP ACTIVITIES $0 $0 $0 $0
66

Fiscal Year 2016-2017 Operating Budget Rancho California Water District Santa Rosa Division
2014-2015 ACTUAL
2015-2016 PROJECTED
2015-2016 BUDGET
2016-2017 BUDGET
OPERATING REVENUES
Water Revenue $16,976,358 $15,656,401 $18,469,136 $17,795,934 SEE NOTE - 2
Recycled Water Revenue 319,876 333,020 377,947 392,275
Monthly Service Charges 5,981,984 6,460,069 6,695,079 7,036,181 SEE NOTE - 2
Energy Charges 1,562,289 1,361,504 1,733,769 1,378,960 SEE NOTE - 2
Other- Recycled Project Crds 103,349 72,688 141,946 135,458
New Service Connections 134,179 127,068 145,439 122,854 SEE NOTE - 3
Rental/Lease Income 148,071 138,791 148,472 152,023
Other Op Rev-Billing 432,390 424,322 527,841 514,148
Other Op Rev-Eng. 37,719 47,553 83,565 89,159
Western IDA-Rock Mtn 71,364 78,912 83,884 79,663
TOTAL OPERATING REVENUES $25,767,579 $24,700,328 $28,407,078 $27,696,655
OPERATING EXPENSES
SOURCE OF SUPPLY
Operating
Purchased Water Resource 18,748,668 16,831,980 18,361,083 17,898,537 SEE NOTE - 4
Purchased Water Santa Marg 1,097,378 1,204,320 1,222,215 1,320,739
TOTAL SOURCE OF SUPPLY $19,846,046 $18,036,300 $19,583,298 $19,219,275
BOOSTER PUMPING
OPERATING
Labor 96,378 133,320 94,621 85,272
G&A/Fringe Benefit 216,657 308,904 219,236 198,513
Materials & Supplies 99,745 27,912 78,400 77,900
Utilities 1,518,361 1,436,547 1,721,742 1,348,356
Outside Services 290,488 376,802 223,400 241,000
Vehicle & Equipment 9,358 13,598 9,651 8,698
Total Operating $2,230,987 $2,297,083 $2,347,050 $1,959,739
CORRECTIVE MAINTENANCE
Corrective Maintenance-Labor 21,556 22,538 12,539 12,530
Corrective Maintenance-G&A/FB 48,457 52,222 30,332 30,449
Corrective Maintenance 161,171 160,066 90,000 104,100
Total Corrective 231,184 234,826 132,870 147,079
TOTAL BOOSTER PUMPING $2,462,171 $2,531,909 $2,479,921 $2,106,818
TRANSMISSION & DISTRIBUTION
OPERATING
Labor 677,810 727,796 683,292 662,826
G&A/Fringe Benefit 1,411,457 1,562,742 1,474,801 1,417,695
Materials & Supplies 92,947 83,786 126,008 155,919
Outside Services 170,720 208,048 183,128 322,177
Vehicle & Equipment 61,070 68,796 64,924 62,116
Service Connections-Labor 19,432 18,672 22,438 22,552
Service Connections-G&A/FB 42,761 42,618 54,277 54,801
Service Connection Expense 72,961 65,778 68,500 45,500
Total Operating $2,549,158 $2,778,236 $2,677,368 $2,743,586
CORRECTIVE MAINTENANCE
Corrective Maintenance-Labor 162,823 123,012 144,219 132,290
Corrective Maintenance-G&A/FB 366,026 285,022 348,867 321,465
Corrective Maintenance 446,139 296,542 370,050 162,000
Total Corrective 974,988 704,576 863,136 615,756
TOTAL TRANSMISSION & DISTRIBUTION
$3,524,146 $3,482,812 $3,540,504 $3,359,341
67

Fiscal Year 2016-2017 Operating Budget Rancho California Water District Santa Rosa Division
2014-2015 ACTUAL
2015-2016 PROJECTED
2015-2016 BUDGET
2016-2017 BUDGET
CUSTOMER SERVICE
OPERATING
Labor $255,822 $250,638 $207,727 $205,786
G&A/Fringe Benefit 567,040 567,046 473,678 472,122
Materials & Supplies 46,123 32,436 39,550 38,350
Outside Services 51,315 7,382 38,800 42,550
Vehicle & Equipment 24,860 25,564 21,188 20,990
Resource Customer Support 304,580 461,321 291,525 326,338
Uncollectible Accounts 5,777 93,852 12,000 13,000
Total Operating 1,255,514 1,438,239 1,084,468 1,119,137
TOTAL CUSTOMER SERVICE $1,255,514 $1,438,239 $1,084,468 $1,119,137
RECYCLED WATER
OPERATING
Joint Facility Recycled Water 571,481 621,253 623,973 677,572
Labor 53,997 32,626 63,822 51,992
G&A/Fringe Benefit 121,386 75,594 147,875 121,038
Materials & Supplies 7,181 10,020 20,774 12,700
Utilities 139,197 147,036 150,332 134,692
Outside Services 24,104 17,192 23,600 17,150
Vehicle & Equipment 5,243 3,328 6,510 5,303
Total Operating $922,589 $907,049 $1,036,885 $1,020,448
CORRECTIVE MAINTENANCE
Corrective Maintenance-Labor 4,218 6,934 9,616 13,681
Corrective Maintenance-G&A/FB 9,483 16,068 23,261 33,244
Corrective Maintenance 13,234 46,358 8,550 7,800
Total Corrective 26,935 69,360 41,427 54,725
TOTAL RECYCLED WATER $949,524 $976,409 $1,078,312 $1,075,173
ENGINEERING
OPERATING
Labor 10,868 12,886 35,004 28,944
G&A/Fringe Benefit 22,114 26,208 71,863 60,927
Outside Services 344 1,080 10,000 5,000
Vehicle & Equipment 1,070 322 3,570 2,952
Engineering OH-Cap Fee for Service 4,258 11,404 30,978 30,507 SEE NOTE - 5
Resource Engineering 500,563 290,867 203,686 202,374 SEE NOTE - 5
Total Operating 539,216 342,767 355,100 330,704
TOTAL ENGINEERING $539,216 $342,767 $355,100 $330,704
SUPPORT
OPERATING
Direct Support Allocation 460,278 547,103 634,642 600,875
Resource Support (133,507) 0 0 0
Total Operating 326,771 547,103 634,642 600,875
TOTAL SUPPORT $326,771 $547,103 $634,642 $600,875
TOTAL OPERATING EXPENSES 28,903,387 27,355,539 28,756,246 27,811,323
GAIN OR (LOSS) FROM OPERATIONS (3,135,808) (2,655,210) (349,168) (114,668)
RESERVES 2,785,641 2,306,043 0 0
INTEREST EARNINGS GENERAL FUND 108,000 107,000 107,000 39,000
PERS CONTRIBUTION AMORTIZATION 242,167 242,167 242,168 75,668
NET SOURCES OR (USES) FROM OP ACTIVITIES $0 $0 $0 $0
68

Fiscal Year 2016-2017 Operating Budget Rancho California Water District Resource Division
2014-2015 ACTUAL
2015-2016 PROJECTED
2015-2016 BUDGET
2016-2017 BUDGET
OPERATING REVENUES
TOTAL OPERATING REVENUES $0 $0 $0 $0
OPERATING EXPENSES
SOURCE OF SUPPLY
Operating
Purchased Water MWD $24,067,604 $16,119,444 $23,462,782 $18,746,713
Import Water Fixed Charge 1,509,892 3,474,207 2,920,398 3,491,826
Purchased Water Premium 543,448 51,077 150,000 0
Purchased Recharge Water 9,393,691 6,510,668 8,735,552 10,638,611
Purchased Water Resource (39,499,977) (29,889,696) (39,024,591) (36,534,420) SEE NOTE - 4
Purchased Water Santa Marg (2,194,756) (2,408,640) (2,444,430) (2,641,477)
Labor 527,342 632,522.00 516,102 593,023
G&A/Fringe Benefit 1,185,462 1,465,556.00 1,195,807 1,380,558
Materials & Supplies 165,156 251,614.00 296,071 213,374
Utilities 2,948,617 2,884,260 2,912,809 2,923,069
Outside Services 994,435 482,416.00 845,916 874,628
Vehicle & Equipment 51,232 64,516.00 52,642 60,488
Total Operating (307,855) (362,057) (380,943) (253,607)
Corrective Maintenance
Corrective Maintenance-Labor 40,100 16,020 33,443 4,987
Corrective Maintenance-G&A/FB 90,145 37,118 80,900 12,119
Corrective Maintenance 177,610 308,919 266,600 236,500
Total Corrective 307,855 362,057 380,943 253,607
TOTAL SOURCE OF SUPPLY $0 $0 $0 $0
CUSTOMER SERVICE
OPERATING
Labor 434,296 571,068 428,860 463,880
G&A/Fringe Benefit 883,360 1,172,402 880,450 976,467
Materials & Supplies 32,953 23,084 26,000 29,000
Outside Services 406,013 939,252 368,000 413,000
Vehicle & Equipment 42,219 58,248 43,744 47,316
Resource Customer Support (1,798,841) (2,764,054) (1,747,053) (1,929,662)
TOTAL CUSTOMER SERVICE $0 $0 $0 $0
RECYCLED WATER
OPERATING
Joint Facility Recycled Water (1,940,112) (2,070,843) (2,079,909) (2,258,575)
Purchased Recycled Water 491,553 407,421 424,927 539,652
Labor 306,562 337,626 306,072 266,810
G&A/Fringe Benefit 689,151 782,282 709,170 621,134
Materials & Supplies 30,923 20,698 40,320 47,950
Utilities 123,119 153,174 110,000 125,000
Outside Services 219,565 233,322 278,225 367,050
Vehicle & Equipment 29,823 34,438 31,219 27,215
Total Operating $(49,416) $(101,882) $(179,975) $(263,765)
Corrective Maintenance
Corrective Maintenance-Labor 974 550 9,499 4,596
Corrective Maintenance-G&A/FB 2,190 1,276 22,977 11,169
Corrective Maintenance 46,252 100,056 147,500 248,000
Total Corrective 49,416 101,882 179,975 263,765
TOTAL RECYCLED WATER $0 $0 $0 $0
69

Fiscal Year 2016-2017 Operating Budget Rancho California Water District Resource Division
2014-2015 ACTUAL
2015-2016 PROJECTED
2015-2016 BUDGET
2016-2017 BUDGET
ENGINEERING
OPERATING
Labor 743,092 720,374 603,925 587,536
G&A/Fringe Benefit 1,511,458 1,478,922 1,239,859 1,236,763
Materials & Supplies 32,935 26,162 35,000 39,000
Outside Services 36,116 20,462 48,700 33,000
Vehicle & Equipment 72,315 73,480 61,600 59,929
Engineering OH-Cap Fee for Service (697,182) (875,890) (978,237) (951,887) SEE NOTE - 5
Resource Engineering (1,698,735) (1,443,510) (1,010,847) (1,004,340) SEE NOTE - 5
Total Operating 0 0 0 0
TOTAL ENGINEERING $0 $0 $0 $0
SUPPORT
OPERATING
Labor 4,834,977 4,299,136 4,567,615 4,380,483
G&A/Fringe Benefit 3,308,935 3,044,950 3,329,791 3,224,035
Materials & Supplies 409,697 358,388 373,240 339,236
Utilities 16,584 27,782 25,805 27,617
Outside Services 3,763,086 4,098,744 3,922,210 4,061,162
Corrective Maintenance 56,869 101,294 32,082 118,967
Direct Support Allocation (1,467,061) (1,723,734) (2,028,842) (1,968,937)
Resource Support (10,923,087) (10,206,560) (10,221,902) (10,182,563) SEE NOTE - 5
Total Operating 0 0 0 0
TOTAL SUPPORT $0 $0 $0 $0
EMPLOYEE BENEFIT
Employee Benefits 5,596,714 5,618,030 6,285,499 6,164,192
E/B Vacation/Sick/Holiday 1,975,985 1,960,302 2,126,871 2,078,082
Reimbursement Employee Benefit (7,572,699) (7,578,332) (8,412,370) (8,242,274)
TOTAL EMPLOYEE BENEFIT $0 $0 $0 $0
VEHICLE & EQUIPMENT
OPERATING
Vehicle & Equipment PM-Labor 36,753 35,975 75,786 43,029
Vehicle & Equipment PM-G&A/FB 25,838 26,226 55,248 31,669
Vehicle & Equipment Exp. PM 304,236 271,185 381,250 319,000
Total Operating $366,827 $333,387 $512,284 $393,699
CORRECTIVE MAINTENANCE
Vehicle & Equipment CM-Labor 73,806 83,185 27,249 66,692
Vehicle & Equipment CM-G&A/FB 51,886 60,642 19,864 49,085
Vehicle & Equipment Exp. CM 169,222 144,414 136,500 171,500
Total Corrective $294,914 $288,241 $183,613 $287,278
Reimburse Vehicle Expense (661,741) (621,628) (695,897) (680,976) SEE NOTE - 5
TOTAL VEHICLE & EQUIP EXP $0 $0 $0 $0
TOTAL OPERATING EXPENSES 0 0 0 0
GAIN OR (LOSS) FROM OPERATIONS 0 0 0 0
RESERVES 0 0 0 0
INTEREST EARNINGS GENERAL FUND 0 0 0 0
PERS CONTRIBUTION AMORTIZATION 0 0 0 0
CAPITAL EXPENDITURES GENERAL FUND 0 0 0 0
NET SOURCES OR (USES) FROM OP ACTIVITIES $0 $0 $0 $0
70

Fiscal Year 2016-2017 Operating Budget Rancho California Water District Wastewater Division
2014-2015 ACTUAL
2015-2016 PROJECTED
2015-2016 BUDGET
2016-2017 BUDGET
OPERATING REVENUES
Wastewater Service Charges $4,805,006 $4,032,185 $4,339,183 $4,141,623
Other Op Rev-Billing (5) 0 0 0
Other Op Rev-Eng. 2,197 4,148 0 0
TOTAL OPERATING REVENUES $4,807,198 $4,036,333 $4,339,183 $4,141,623
CUSTOMER SERVICE
OPERATING
Resource Customer Support 164,785 286,080 180,206 180,227
Total Operating 164,785 286,080 180,206 180,227
TOTAL CUSTOMER SERVICE $164,785 $286,080 $180,206 $180,227
WASTEWATER EXPENSE
Operating
Labor 628,239 608,572 574,407 512,861
G&A/Fringe Benefit 1,345,077 1,351,460 1,238,449 1,101,019
Materials & Supplies 93,204 69,282 72,900 87,000
Utilities 749,252 651,002 631,500 716,500
Outside Services 688,745 540,768 603,450 834,550
Vehicle & Equipment 58,294 59,582 54,693 48,370
Uncollectible Accounts 1,856 15,000 10,000 12,000
Total Operating $3,564,667 $3,295,666 $3,185,400 $3,312,300
Corrective Maintenance
Corrective Maintenance-Labor 27,795 13,658 19,479 23,729
Corrective Maintenance-G&A/FB 62,484 31,644 47,120 57,662
Corrective Maintenance 242,702 194,724 199,000 171,200
Total Corrective 332,981 240,026 265,599 252,591
TOTAL WASTEWATER EXPENSE $3,897,648 $3,535,692 $3,450,998 $3,564,891
ENGINEERING
OPERATING
Resource Engineering 290,503 332,729 233,000 231,500
Total Operating 290,503 332,729 233,000 231,500
TOTAL ENGINEERING $290,503 $332,729 $233,000 $231,500
SUPPORT
OPERATING
Direct Support Allocation 192,489 262,463 251,446 200,566
Resource Support (10,197) 0 0 0
Total Operating 182,292 262,463 251,446 200,566
TOTAL SUPPORT $182,292 $262,463 $251,446 $200,566
TOTAL OPERATING EXPENSES $4,535,228 $4,416,963 $4,115,651 $4,177,184
GAIN OR (LOSS) FROM OPERATIONS 271,970 (380,630) 223,532 (35,561)
RESERVES (373,970) 352,380 (251,782) (13,439)
INTEREST EARNINGS GENERAL FUND 52,000 51,000 51,000 54,000
PERS CONTRIBUTION AMORTIZATION 50,000 50,000 50,000 0
CAPITAL EXPENDITURES GENERAL FUND 0 (72,750) (72,750) (5,000)
NET SOURCES OR (USES) FROM OP ACTIVITIES $0 $0 $0 $0
71

Fiscal Year 2016-2017 Operating Budget
This page intentionally left blank.
72

Fiscal Year 2016-2017 Operating Budget Rancho California Water District
FOOTNOTES
FOOTNOTE #1 – SUMMARY OF SIGNIFICANT BUDGETING POLICIES
Enterprise Fund - The District utilizes accounting principles appropriate for an enterprise fund; accordingly, the revenues and expenses are budgeted on an accrual basis.
FOOTNOTE #2 – USER RATES
Total water demand for the fiscal year 2016-2017 budget is projected to decrease by 6,032-acre feet or 9.5%. Factors that contribute to this include a sharp decrease in water demand in response to drought conservation efforts and the water shortage contingency plan implementation.
The District’s 2016-2017 operating budget decreased by $2,262,433 or 3.3% over the 2015-2016 budget. The single greatest operating expense of RCWD is the source of supply cost of water. Consequently, the mix of water production sources can have a significant impact on costs and water rates from year to year. In the 2016-2017 fiscal budget, treated import water requirements are estimated to decrease by 5,669 acre-feet or 22.7%. This will result in a decrease of $5,325,320 related to the decrease in treated import quantity requirements. The 2015-2016 operating budget of $69.7 million decreased by $5.3 million from import water purchases results in an adjusted budget of $64.4 million. The adjusted budget of $64.4 million increased by $0.5 million directly related to an increase in MWD’s import water rate, an increase of $0.7 directly related to an increase in untreated import water rate, an increase of $1.2 from increased untreated water quantity, an increase of $0.5 in import water fixed charge cost and all other costs increased $0.3 resulting in the 2016-2017 operating budget of $67.5 million.
Prior year 2015-2016 Budget
Treated Import Quantity Required And Supply Mix
$69,713
-$5,325
2015-2016 Budget Adjusted for Increased Demand And Supply Mix
Increase in Treated Import Water Price
Increase in Untreated Import Water Price
$64,388
$459
$715
Increase in Untreated Import Water Quantity $1,189
Increase in Import Water Fixed Charge Cost $571
Additional Cost From All Other Categories $129
Proposed 2016-2017 Budget $67,451
Additionally, the District anticipates a decrease of 360 AF or 0.9% in the amount of production over the prior year from its lowest cost supply, native well water. Furthermore, the District will have an increase in import recharge water of 2,000 AF or 18.7% over the prior year which cost less than treated import water. The net decrease in source of supply expense is $2,293,124 or 5.5% over the prior year. The total source of supply water expense, accounts for 57.9% of the total operating budget.
73

Fiscal Year 2016-2017 Operating Budget Rancho California Water District
Rancho Division - The current year’s 2016-2017 total budgeted operating costs are projected to decrease in the Rancho Division by $1,379,043 or 3.7%. This decrease in total costs is primarily being driven by decreased source of supply costs by $1,929,100. Also due to the decrease in water demand, booster pumping costs are decreasing by $144,653 or 7.3% due primarily to lower energy needs from reduced pumping levels. This Division did experience other cost increases related to increased transmission and distribution maintenance, increased customer service, increased recycled water costs, and minor increases in engineering and direct support, all of which amounted to approximately $694,710.
As a result, the Rancho Division’s combined M&I average commodity and energy rate will decrease on a weighted average basis by 0.1% and combined Ag commodity and energy rates will decrease on a weighted average basis by 0.1%.
The monthly impact to the average residential bill in the Rancho Division is $1.04 or 1.91%, which includes the 5.0% rate increase on the fixed meter charges. Likewise, the impact to the average combined agricultural water and energy rate in the Rancho Division will decrease by $5.37 per acre-foot.
Santa Rosa Division – The current year’s 2016-2017 total budgeted operating costs are projected to decrease in the Santa Rosa Division by $944,923 or 3.3%. This decrease in total costs is primarily being driven by decreased source of supply costs of $364,023 stemming from the lower overall demand. However, costs are decreasing significantly slower (2.6%) than sales (9.5%) due to the increased imported water costs in the supply mix as described above. Also due to the decrease in water demand, booster pumping costs are decreasing by $373,103 or 15.0% due primarily to lower energy needs from reduced pumping levels. In an effort to mitigate rate increases caused by import water rate pressure in the Santa Rosa Division, non-critical maintenance and other activities were reevaluated and reprioritized with the less critical being deferred. This resulted in cost decreases related to transmission and distribution costs for potable and recycled water, as well as engineering and direct support costs, all of which amounted to approximately $242,466. A small increase in customer service costs of $34,669 is due to additional customer efforts relating to ongoing drought efforts.
As a result, the Santa Rosa Division’s combined M&I average commodity and energy rate will increase on a weighted average basis by 3.9% and combined Ag commodity and energy rates will increase on a weighted average basis by 3.9%.
The monthly impact to the average residential bill in the Santa Rosa Division is $3.49 or 4.3%, which includes the 7.0% rate increase on the fixed meter charges. Likewise, the impact to the average combined agricultural water and energy rate in the Santa Rosa Division will increase by $31.26 per acre-foot.
Budget-Based Tiered Water Rate Structure – RCWD’s Budget-Based Tiered Water Rate Structure was implemented in July 2010. This structure applies to residential, multi-family, and dedicated landscape accounts. The key principle underlying budget based water rates is that each customer gets a water use budget that is appropriate to their property and circumstances if water is used efficiently. The rate structure acknowledges that water is a finite resource and needs to be used efficiently in order to ensure a continued reliable supply today and in the future. The water rates recover the actual cost of water operations and do so in a manner that rewards efficient use of water. The use of tiered price levels allows the District to recover the higher costs of additional water supplies from customers that are using water in excess of efficient levels. Absent this structure, all customers would be underwriting inefficient water use and those customers who are less efficient would not have a strong
74

Fiscal Year 2016-2017 Operating Budget Rancho California Water District
incentive to become more efficient in their water use. The District does not expect a change in rate structure for residential, multi-family, and dedicated landscape accounts to materially affect revenues.
BUDGET-BASED TIERED WATER RATES (PER A/F)
Division Tier 1 Tier II Tier III Tier IV
Rancho $0.67 $1.51 $2.57 $6.50 Santa Rosa $1.09 $2.00 $2.55 $6.50
After five years under the current rate structure, a thorough review of its performance and accuracy was completed. This led to the conclusion that certain factors used to determine indoor and outdoor water budgets need to be adjusted to improve the calculation of efficient water budgets. These factor changes were implemented in FY 2015-2016 and are summarized in the table below:
Variable Definition Current RCWD Factor Effective July 1, 2015
Single Family Default Household Size (Tier I)
The default number of residents in the household, each using 60 gallons per day.
4 Residents Per Household, each using 60 gallons per day.
3 Residents Per Household, each using 55 gallons per day.
Multifamily Default Household Size (Tier I)
The default number of residents in the household, each using 60 gallons per day
3 Residents Per Household, each using 60 gallons per day.
3 Residents Per Household, each using 55 gallons per day.
ETAF (Tier II)
ETAF adjusts ET values used to calculate the maximum amount of water that should be applied to a landscape. It is expressed in inches of water.
Irrigated Square Feet ETAF 1 to 74,999 85% 75,000 to 99,999 70% 100,000 to 150,000 60%
Irrigated Square Feet ETAF 0 to 30,000 75% 30,000 to 75,000 60%
Landscape Customer (Tier I)
Ultra-efficient usage of water for irrigation for landscape exclusive customers
Rancho Division ETAF of 32% Santa Rosa Division ETAF of 19%
Rancho Division ETAF of 23% Santa Rosa Division ETAF of 13%
Landscape Area (LA) (Tier II)
LA includes all areas on a customer’s property that have grass, shrubs, trees, ground cover, etc. that are irrigated and measured in square feet (SF).
Single Family Residence
Irrigated Square Feet ETAF
0 to 75,000 85%
75,001 to 100,000 70%
100,001 to 150,000 60%
150,001+ 60%
Multi Family Residence
Irrigated Square Feet ETAF
0 to 75,000 85%
75,001 to 100,000 70%
100,001 to 150,000 60%
150,001+ 60%
Single Family Residence
Irrigated Square Feet ETAF
0 to 30,000 75%
30,001 to 75,000 60%
75,001 to 150,000 0%
Multi Family Residence
Irrigated Square Feet ETAF
0 to 30,000 75%
30,001 to 75,000 60%
75,001 to 150,000 60%
150,001+ 60%
75

Fiscal Year 2016-2017 Operating Budget Rancho California Water District
Recycled Water Rates - The District has two sources of recycled water that is available for resale to approved users. The first source is recycled water that is generated as a bi-product of wastewater treatment at the District’s Santa Rosa Treatment Plant. The second source of recycled water is purchased under a contract with EMWD. The District is adjusting its current rate from $309.35 to $332.55 per acre-foot for M&I and Ag users; and RCWD’s construction rates will increase 8.1% from the current rate of $726.00 per acre-foot to $785.00 per acre-foot.
Santa Rosa Water Reclamation Facility (SRWRF) - The total budgeted operating costs for the SRWRF increased by $61,533 or 1.5%. This increase is a result of increased corrective maintenance occurring on a multi-year cycle and increased energy costs offset by a reduction of a wastewater operator position through planned attrition. Therefore, the proposed monthly rate per equivalent dwelling unit (EDU) is remaining constant at $38.75 per EDU with changes in the rate components. The table below details the rate impacts:
RATE COMPONENT CURRENT PROPOSED CHANGE O&M $19.75 $18.00 ($1.75) Collections 3.75 4.25 0.50 Adv. Treatment 2.00 3.00 1.00 Replacement 4.00 4.00 0.00 Capital/Debt Service 9.25 9.50 0.25
Total $38.75 $38.75 $0.00
Monthly Service Charge - A large percentage of the District’s operating costs are of a fixed nature, and do not vary with increased water deliveries. A monthly fee is levied on each water meter according to the rate of flow that the meter is capable of delivering. The philosophy behind this fee is that the fixed costs to the District will remain irrespective of water demands and represent the cost to keep the system ready to meet demands. Therefore, these fixed costs are allocated primarily on a meter capacity basis. The fixed monthly service charges for all meter sizes in the Rancho and Santa Rosa Divisions will be increased for the fiscal year 2016-2017 as recommended by the Board of Directors. The District had been adjusting these rates in the Rancho and Santa Rosa Divisions by 5% to 7% a year, based upon a rate study performed in 1990, and updated in 1997 and annually thereafter, which has covered the costs of inflation, but has not corrected the fixed-cost shortfall. For the 2016-2017 budget, the shortfall has significantly diminished and the District will only be increasing these rates on average between 3.5% and 3.7%. Therefore, approximately 80% of the Rancho Division fixed costs, and 74% of Santa Rosa Division’s fixed cost, will be recovered by the monthly service charge.
Energy Charges - It is estimated that the District’s fiscal year 2015-2016 energy budget, of $7,262,954 will decrease to $6,622,999 for the fiscal year 2016-2017. This equates to a decrease of $639,955 or an 8.8% decrease over the prior year. There is a slight increase in Southern California Edison rates over prior year but the decrease in costs is driven by a decrease in demand of 9.5%. Rancho Division customers will see the energy component of their water rate decrease 14.8%. Santa Rosa Division customers’ zones will see the energy component of their rate decrease on average by 12.5%.
Energy charges are based on pressure zones within the Rancho Division (outlined in red) and the Santa Rosa Division (outlined in orange), as identified in map on the following page:
76

Fiscal Year 2016-2017 Operating Budget Rancho California Water District
SALES QUANTITIES
BUDGETED SALES PROJECTED IN ACRE FEET
DIVISION 2014-2015 ACTUAL
2015-2016
BUDGETED 2016-2017 BUDGETED
Rancho Division 37,582 37,589 33,801 Santa Rosa Division 26,053 26,096 23,852 Totals 63,635 63,685 57,653 Production 66,126 65,726 59,762 Percentage of Average Production Loss 3.9% 3.1% 3.6% Table 7.1
77

Fiscal Year 2016-2017 Operating Budget Rancho California Water District
FOOTNOTE #3 – NEW SERVICE CONNECTIONS
The budget line item titled “New Service Connections” in the operating revenue and transmission and distribution sections of the Operating Budget represents the estimated revenue and costs associated with the installation of new water meter services.
FOOTNOTE #4 – WATER COST
The source of supply costs associated with the Rancho and Santa Rosa Water Divisions are accumulated in the Resource Division. The underlying accounting records track the specific costs of water production and supply for the Rancho, Santa Rosa, Resource wells and import water. These costs are then allocated back to the respective water division after consideration of the 12,000 acre-foot benefit to the Rancho Division, and 2,000 acre-foot benefit to the Santa Rosa Division, in accordance with legal requirements.
The budget line item titled “Purchased Water Resource” represents the allocation of these costs.
PROJECTED PRODUCTION REQUIREMENTS IN ACRE FEET
2014-2015 ACTUAL
2015-2016 BUDGETED
2016-2017 BUDGETED
PRODUCTION TYPE
RANCHO SANTA ROSA
RANCHO
SANTA
ROSA
RANCHO SANTA
ROSA Native Well 17,546 7,472 18,060 8,060 16,880 6,880 Treated Import 12,672 12,145 12,714 12,263 9,027 10,281 Import Recharge 6,127 6,127 5,350 5,350 6,350 6,350 Recycled 3,157 880 2,669 1,260 2,778 1,216 Total AF Req. 39,502 26,624 38,793 26,933 35,035 24,727 Avg. Cost Per AF $603 $781 $615 $767 $631 $821 Avg. Production Loss 4.3% 3.5% 3.1% 3.1% 3.6% 3.6% Table 7.2
FOOTNOTE #5 – OVERHEAD ALLOCATIONS
General, Administrative and Fringe Benefits - Indirect general, administrative and fringe benefit overhead costs are allocated to operating, fee-for-service and capital activities based upon direct labor hours.
General Engineering Support - Prior to 1991-92, 100% of the District’s general engineering support costs was charged to Operations. After studying the components of the general engineering support costs, it was determined that capital and fee-for-service customers obtained substantial benefit from the expenditures relating to non-directly allocable engineering costs. Therefore, a general engineering overhead rate was established based upon an estimate of the fee-for-service and capital portion of general engineering costs. The remaining general engineering costs, which were not allocable to fee-for-service or capital jobs, were charged to each of the water and sewer divisions based upon an estimate of their relative benefit as determined by new construction activity.
78

Fiscal Year 2016-2017 Operating Budget Rancho California Water District
Presented below is a comparison of overhead rates:
CATEGORY 2015-2016 BUDGETED
2016-2017 BUDGETED
General & Administration 132.4% 136.9% Fringe Benefits1 66.7% 71.7% Vehicle & Equipment 10.2% 10.2% Operations 26.4% 22.3% Operating Overhead Rates 235.7% 241.1% Engineering Direct Rate 88.5% 105.4% Less Operations Rate <26.4%> <22.3%> Total Fee for Service & Capital Allocation Rate 297.8% 324.2% Table 7.3 1Fringe benefit overhead rate including non-cash amortized expense is 73.6% for fiscal year 2016-2017
FOOTNOTE #6 – WASTEWATER OPERATIONS
Santa Rosa Water Reclamation Facility (SRWRF) - The monthly treatment rate for the Santa Rosa Division’s wastewater customers will remain at $38.75 per month per connected EDU, and $25 per month per unconnected EDU, for which capacity fees have been received and fall under the special classifications of existing ordinances for wastewater capacity. Twenty-five dollars and twenty-five cents ($25.25) of the thirty-eight dollars and seventy-five cents ($38.75) monthly fee will cover the cost of operations, four dollars ($4.00) will be set aside to fund future replacement costs, and nine dollars and fifty cents ($9.50) will be used for debt service.
79

Fiscal Year 2016-2017 Operating Budget Rancho California Water District Rates & Fees Schedules
RANCHO DIVISION
POTABLE WATER RATES
2015-2016 RATES 2016-2017 RATES % OF CHANGE
Residential, Multifamily, Landscape
Standard (1)Pre 03 Annex
(2)Post 03 Annex
Standard Pre 03 Annex
Post 03 Annex
Standard Pre 03 Annex
Post 03 Annex
Tier I 0.660 2.229 2.545 0.670 2.345 2.620 1.5% 5.2% 3.0%
Tier II 1.500 2.229 2.545 1.510 2.345 2.620 0.7% 5.2% 3.0%
Tier III 2.490 2.490 2.545 2.570 2.570 2.620 3.2% 3.2% 3.0%
Tier IV 6.320 6.320 6.320 6.500 6.500 6.500 2.8% 2.8% 2.8%
Commercial, Industrial, & Other
2015-2016 RATES 2016-2017 RATES % OF CHANGE
Standard (1)Pre 03 Annex
(2)Post 03 Annex
Standard Pre 03 Annex
Post 03 Annex
Standard Pre 03 Annex
Post 03 Annex
Tier I 1.230 2.229 2.545 1.260 2.345 2.620 2.4% 5.2% 3.0%
Tier II 2.880 2.875 2.875 2.990 2.990 2.990 3.8% 4.0% 4.0%
Agricultural Agricultural-Residential
2015-2016 RATES 2016-2017 RATES % OF CHANGE
Tier I 1.230 1.260 2.4%
Tier II 2.880 2.990 3.8% (1) Rate for certain properties annexed into the District before 2003 (2) Rate for certain properties annexed into the District after 2003Rate
ENERGY RATES
2015-2016 RATES 2016-2017 RATES % OF CHANGE
Projected Rate by Pump Zone in HCF (Addition to Water Commodity)
(1)M&I AG M&I AG M&I AG
1305 - - - - - -
1380 0.04050 0.04050 0.03450 0.03450 -14.8% -14.8%
1485 0.09720 0.09720 0.08280 0.08280 -14.8% -14.8%
1550 0.13230 0.13230 0.11270 0.11270 -14.8% -14.8%
1610 0.16470 0.16470 0.14030 0.14030 -14.8% -14.8%
1790 0.26190 0.26190 0.22310 0.22310 -14.8% -14.8%
1880 0.41310 0.41310 0.35190 0.35190 -14.8% -14.8%
2070 0.41310 0.41310 0.35190 0.35190 -14.8% -14.8%
2350 0.56430 0.56430 0.48070 0.48070 -14.8% -14.8%
TOTAL WEIGHTED AVERAGE RATE IMPACT: -14.8% -14.8% (1) Municipal & Industrial
80

Fiscal Year 2016-2017 Operating Budget Rancho California Water District Rates & Fees Schedules
SANTA ROSA DIVISION
POTABLE WATER RATES
2015-2016 RATES 2016-2017 RATES % OF CHANGE
Residential, Multifamily, Landscape
Standard (1)Pre 03 Annex
(2)Post 03 Annex
Standard Pre 03 Annex
Post 03 Annex
Standard Pre 03 Annex
Post 03 Annex
Tier I 1.010 2.229 2.545 1.090 2.323 2.596 7.9% 4.2% 2.0%
Tier II 1.990 2.229 2.545 2.000 2.323 2.596 0.5% 4.2% 2.0%
Tier III 2.480 2.480 2.545 2.550 2.550 2.596 2.8% 2.8% 2.0%
Tier IV 6.320 6.320 6.320 6.500 6.500 6.500 2.8% 2.8% 2.8%
Commercial, Industrial, & Other
2015-2016 RATES 2016-2017 RATES % OF CHANGE
Standard (1)Pre 03 Annex
(2)Post 03 Annex
Standard Pre 03 Annex
Post 03 Annex
Standard Pre 03 Annex
Post 03 Annex
Tier I 1.670 2.229 2.545 1.760 2.323 2.596 5.4% 4.2% 2.0%
Tier II 2.850 2.715 2.715 2.870 2.870 2.870 .7% 5.7% 5.7%
Agricultural Agricultural-Residential
2015-2016 RATES 2016-2017 RATES % OF CHANGE
Tier I 1.670 1.760 5.4%
Tier II 2.850 2.870 .7% (1) Rate for certain properties annexed into the District before 2003 (2) Rate for certain properties annexed into the District after 2003
ENERGY RATES
2015-2016 RATES 2016-2017 RATES % OF CHANGE
Projected Rate by Pump Zone in HCF (Addition to Water Commodity)
(1)M&I AG M&I AG M&I AG
1305 - - - - - -
1434 0.05160 0.05160 0.04515 0.04515 -12.5% -12.5%
1440 (1060, 1160) 0.05400 0.05400 0.04725 0.04725 -12.5% -12.5%
1500 0.07800 0.07800 0.06825 0.06825 -12.5% -12.5%
1670 0.14600 0.14600 0.12775 0.12775 -12.5% -12.5%
1990 0.27400 0.27400 0.23975 0.23975 -12.5% -12.5%
2160 (2153) 0.34200 0.34200 0.29925 0.29925 -12.5% -12.5%
2260 0.38200 0.38200 0.33425 0.33425 -12.5% -12.5%
2550 0.49800 0.49800 0.43575 0.43575 -12.5% -12.5%
2850 0.61800 0.61800 0.54075 0.54075 -12.5% -12.5%
TOTAL WEIGHTED AVERAGE RATE IMPACT: -12.5% -12.5% (1) Municipal & Industrial
81

Fiscal Year 2016-2017 Operating Budget Rancho California Water District Rates & Fees Schedules
MONTHLY SERVICE CHARGES
Meter Size
2015-2016 Rate 2016-2017 Rate % of Increase Rancho Santa
Rosa Rancho Santa
Rosa Rancho Santa
Rosa
3/4" $ 20.20 $ 37.93 $ 21.22 $ 40.58 5% 7% 1" 30.36 63.71 30.97 63.71 2% 0%
1-1/2" 52.26 110.80 53.30 110.80 2% 0% 2" 78.78 174.62 80.75 174.62 3% 0%
2-1/2" 124.68 259.30 37.15 285.23 10% 10% 3" 218.99 406.84 234.32 447.52 7% 10% 4" 449.39 962.32 456.13 991.19 2% 3% 6" 716.84 1,581.33 727.59 1,581.33 2% 0% 8" 1,089.19 2,186.17 1,089.19 2,251.76 0% 3%
CONSTRUCTION & NON-POTABLE WATER RATES *(Base Water Rates Per HCF)
RANCHO DIVISION SANTA ROSA DIVISION Description FY 2015-2016 FY 2016-2017 FY 2015-2016 FY 2016-2017
Construction Water $3.333/HCF $3.604/HCF $3.333/HCF $3.604/HCF
Recycled Construction Water
$726.00/AF + $20 Monthly
Service Charge
$785.00/AF + $20 Monthly
Service Charge
$726.00/AF + $20 Monthly
Service Charge
$785.00/AF + $20 Monthly
Service Charge
Tertiary Treated
$309.35/AF + $20 Monthly
Service Charge
$332.55/AF + $20 Monthly
Service Charge
$309.35/AF + $20 Monthly
Service Charge
$332.55/AF + $20 Monthly
Service Charge
Agricultural
$309.35/AF + $20 Monthly
Service Charge
$332.55/AF + $20 Monthly
Service Charge
$309.35/AF + $20 Monthly
Service Charge
$332.55/AF + $20 Monthly
Service Charge *Customers will be charged the appropriate pump zones’ energy rates in addition to the base rate.
82

Fiscal Year 2016-2017 Operating BudgetRancho California Water District Fee for Services Schedule
FEE FOR SERVICE SCHEDULE
DESCRIPTION OF SERVICE
FEE/ DEPOSIT
1 Water Availability Letters Single lot $180 Tract/Parcel map $300 2 Fire Hydrant Location Map & Flow Capability Modeling $300 3 Topographic Map $25 4 Topographic Map w/Aerial $35 5 Black Line Copies (24’ x 36’) – Each $12 6 CFD/Assessment District (Processing Fee) [Deposit] $10,000 Assessment District Pay-Off Administrative Fee $25
7 Request for RCWD Participation in Joint Community Facilities Financing Agreement (JCFA) (Processing Fee) [Deposit]
$5,000
8 Annexation Processing Deposit $10,000 9 Annexation Acreage Fee Rancho Division $5,016 Santa Rosa Division $3,790
10 Fire Hydrant Meter Deposit (4-inch) $750 11 Construction Meter Deposit (4-inch) $1,500 12 Construction Meter Deposit (6-inch) $3,000 13 Construction Meter Relocation $75 14 Meter Test Requests (3/4-inch to 2-inch) $50 15 Meter Test Requests (3-inch and larger) $100 16 Floating Meter “No Read” Penalty $200 17 Construction Meter Location Penalty $200 18 Unmetered Water Accounts $52 19 Meter Obstruction Charge $77 20 Meter Relocation Deposit (3/4-inch to 2-inch) $2,000 21 Meter Downsize Deposit (3/4-inch to 2-inch MJ and Turbo) $1,300 22 Drop-In Meter Installations Meter w/Double Checks ¾-inch MJ-Single $788 ¾-inch MJ-Multiple $784 1-inch MJ $946 1-1/2-inch MJ $1,322 2-inch MJ $1,557 2-inch Turbo $1,650 Meter w/Pressure Regulator and Double Checks ¾-inch MJ-Single $911 ¾-inch MJ-Multiple $908 1-inch MJ $1,092
1-1/2-inch MJ $1,885 2-inch MJ $2,161 2-inch Turbo $2,232
83

Fiscal Year 2016-2017 Operating BudgetRancho California Water District Fee for Services Schedule
23 Full Meter Installations Meter w/Double Checks ¾-inch MJ-Single $5,890 1-inch MJ $5,963 1-1/2-inch MJ $6,378 2-inch MJ $6,727 2-inch Turbo $6,804 Meter w/Pressure Regulator and Double Checks ¾-inch MJ-Single $5,969 1-inch MJ $6,101 1-1/2-inch MJ $6,934 2-inch MJ $7,381 2-inch Turbo $7,404
24 Engineering: Project Planning/Hydraulic Evaluation $1,000 Plan Review Pipelines – Up to 1,000 Linear Feet $3,000 Plan Review Pipelines – Per 100 Foot Thereafter $1.00 Plan Review Misc. Appurtenances (DCDA’s, FH’s, Meters, etc.) – Up to 4 App.
Groupings $3,000
Misc. Appurtenances (DCDA’s, FH’s, Meters, etc.) – Add’l 4 App. Groupings $1,000 Plan Review On-Site Recycled Water System $3,000
25 Inspection Pipelines- Up to 1,000 Linear Feet $5,000 Pipelines – Per 100 Foot Thereafter $1.00 Misc. Appurtenances (DCDA’s, FH’s, Meters, etc.) – Up to 4 App. Groupings $2,000 Misc. Appurtenances (DCDA’s, FH’s, Meters, etc.) – Add’l 4 Ap. Groupings $500 On-Site Recycled Water System
¾” Detector Check Meter Fee $5,000
$325 26 Post Construction Record Drawing Preparation & Processing/GIS Conversion
(per usage of plan) $125
27 RP Device Initial Certification Fee $180 Recertification Fee $150
28 Potable Construction Water $3.604/HCF 29 Application Processing Fee (non-refundable) $50 30 Service Connection Fee Estimate $167 31 Bond Split Deposit $1,500 Per Parcel $35
32 Sewer Lateral Sampling Wyes/Inspection, etc. $155 33 Non-Compliance Sampling and Unauthorized Use Charges $105 34 Non-Compliance Inspection $130 35 Non-Compliance Inspection/Meeting $210 36 Transfer Set-Up Charge $23 37 Delinquent Accounts (% x Balance) 1st 30 days Greater of $5
or 10% Each 30 Days Thereafter $0.02
84

Fiscal Year 2016-2017 Operating BudgetRancho California Water District Fee for Services Schedule
38 DTO’s (Turn service back on after shut-off for non-payment; or non-compliance to recycle water agreement)
M-F 8 a.m. to 5 p.m. $46 M-F after 5 p.m.; Weekends and Holidays $109
39 Non-Sufficient Funds/NSF Returned Check Fee $25 40 Cutting District lock or straight-lining across meter (previously referred to as
Lock Off Vandalism Penalty) $125
41 For a second cut District lock $250 42 Cutting Angle Meter (AM) Stop from Meter $125 43 Replacement of pulled meter resulting from customer cutting lock a second time $100 44 Illegal Hydrant Use $600 45 Fire Service Charge for Industrial/Commercial w/Water Meter 0-30,000 sq. ft. (charged on water bill) $0.002/sq. ft. Over 30,000 sq. ft. (charged on water bill) $0.001/sq. ft. Annual Fee Per Acre or Per Parcel if Less than 1 Acre $40
46 Site License, Land Lease, and Encroachment Permits Deposit $5,000 47 48-Hour Notice Processing Fee $20 48 Water Supply Assessment Deposit $20,000. 49 Geographical Information System (GIS) Data Request Fee $92/Hr.
ZONES OF BENEFIT
ZONE FEE/ACRE 1 $390/AC 2 $4,138/AC 3 $3,611/AC 5 $3,192/AC 7 $3,606/AC 8 $5,598/AC
85

Fiscal Year 2016-2017 Operating Budget Rancho California Water District Forecast
Demand Forecast
Operating Forecast
Rate Forecast
Five Year Operating Forecast
A five year operating forecast has been developed that projects the impacts of growth and increased demand along with the increased import water requirements. This is accomplished using regression analysis to project water demand, which then drives projected production requirements. The District uses the projected import water rates from the Metropolitan Water District of Southern California to determine projected water cost.
In order to forecast projected energy expenses, the District utilizes rate projections from Southern California Edison and the Gas Company. With regard to wage increases, the District utilizes the historical average wage increase to project wages and utilizes the consumer price index to estimate increases in material and outside service expenses.
All of these estimated inputs drive the projected 5-year budget information.
The District is projected to continue growing from the current customer base of approximately 44,291 water service connections to over 62,000 water service connections at build out (2050). This growth will drive the need for more import water supplies which will in turn increase the cost of providing water to our customers. Over the next five years, it is projected that water demand will increase 22.8% and treated import water cost will increase 13.0%. The greater percentage increase in import water cost is a combination of increased quantities and increased rates by MWD.
Based on the forecasted operating costs, a five-year projection of water commodity and monthly wastewater rates was calculated and is presented on the following pages.
86

Fiscal Year 2016-2017 Operating Budget Rancho California Water District Forecast
POTABLE WATER FORECAST
SUMMARY BUDGET & FORECAST – BY TYPE TOTAL - BUDGET
Ag Ag/Dom Dom. Other Total
Prior Yr. Budget
15-16 16,865 6,150 25,275 11,585 59,875
Five Year Forecast
16-17 15,700 5,355 22,401 10,322 53,778
17-18 16,640 5,719 23,483 11,001 56,843
18-19 17,578 6,083 24,565 11,690 59,916
19-20 18,519 6,446 25,646 12,378 62,989
20-21 19,458 6,810 26,728 13,066 66,062
SUMMARY OF BUDGET & FORECAST – BY PUMP ZONE PER FISCAL YEAR
Rancho Zones 16-17 17-18 18-19 19-20 20-21
1305 6,859 7,233 7,608 7,984 8,360 1380 7,472 7,879 8,288 8,698 9,107 1485 9,182 9,683 10,186 10,689 11,192 1550 805 848 893 937 981 1610 2,979 3,142 3,305 3,468 3,631 1790 1,969 2,076 2,184 2,292 2,400
1880 (2070) 187 198 208 218 228 2070 1,490 1,571 1,653 1,734 1,816 2350 165 174 183 192 201
TOTAL 31,106 32,802 34,506 36,211 37,915
Santa Rosa Zones 16-17 17-18 18-19 19-20 20-21
1305 497 528 558 588 618 1440 5,402 5,728 6,054 6,380 6,706 1500 3,157 3,348 3,538 3,729 3,919 1670 8,555 9,071 9,588 10,104 10,620 1990 3,079 3,265 3,451 3,636 3,822 2153 26 28 30 31 33 2160 149 158 167 176 185 2260 315 334 353 372 391 2550 1,457 1,545 1,633 1,721 1,809 2850 35 38 40 42 44
TOTAL 22,672 24,041 25,410 26,778 28,147 District Total 53,778 56,843 59,916 62,989 66,062
Excludes recycled water
87

Fiscal Year 2016-2017 Operating Budget Rancho California Water District Forecast
PROJECTED RESULTS OF OPERATIONS
(In 1,000’s)
16-17 17-18 18-19 19-20 20-21
OPERATING REVENUES Water Revenue $37,525 $41,257 $45,781 $50,188 $54,210 Monthly Service Charges(1) 18,911 19,479 20,866 22,566 24,405 Energy Charges 2,584 2,780 2,889 2,986 3,089 Wastewater Service(2) 4,142 4,271 4,428 4,539 4,754 Other Revenue 3,618 3,693 3,244 3,406 3,576 Total Operating Revenue $66,779 $71,479 $77,207 $83,684 $90,034 OPERATING EXPENSES Source of Supply(3) $39,176 $42,460 $46,787 $51,867 $56,648 Booster Pumping(4) 3,948 4,227 4,412 4,589 4,776 Transmission & Distribution 9,306 9,771 10,260 10,773 11,311 Customer Service 4,917 5,161 5,419 5,690 5,974 Reclaimed Water 3,212 3,373 3,542 3,719 3,905 Wastewater Expense 3,565 3,707 3,800 3,895 3,993 Engineering 1,358 1,423 1,495 1,563 1,641 Support 1,969 2,065 2,169 2,272 2,385 Total Operating Expenses $67,451 $72,189 $77,883 $84,367 $90,633 Net Operating Revenue ($671) ($710) ($676) ($683) ($600) Interest Earnings $493 $493 $493 $493 $493 Non-Cash Item $197 $197 $197 $197 $197 Net Source/(Uses) of Cash $18 ($20) $13 $7 $90
Table 8.1 (1)Monthly Service Charges assume 0% growth in accounts through 2016-2017. Then 3% growth thereafter. Also includes an
annual increase in the monthly service charges of 5% in Rancho Division and 7% in the Santa Rosa Division (2)Wastewater service charge assumes 2.5% growth rate. (3)Includes projected import water rates per MWD LRFP. (4)Includes estimated average energy rate increase of 3%. (5)Other expenses are indexed at 4%. Source: Rancho California Water District
88

Fiscal Year 2016-2017 Operating Budget Rancho California Water District Forecast
PROJECTED RATE REQUIREMENTS – COMBINED WATER & ENERGY
16-17 17-18 18-19 19-20 20-21
RANCHO DIVISION WATER RATES
M&I Water Commodity $1.265 $1.338 $1.434 $1.510 $1.565 Average Energy Rate $0.083 $0.087 $0.091 $0.096 $0.101 Total M&I per HCF $1.348 $1.425 $1.525 $1.606 $1.665 Total M & I Rate per A/F $587 $621 $664 $700 $725
AGRICULTURAL
Water Commodity $1.265 $1.338 $1.434 $1.510 $1.565 Average Energy Rate $0.083 $0.087 $0.091 $0.096 $0.101 Total Agricultural Rate per HCF $1.348 $1.425 $1.525 $1.606 $1.665 Total Agricultural Rate per A/F $587 $621 $664 $700 $725 SANTA ROSA DIVISION WATER RATES
M&I Water Commodity $1.754 $1.804 $1.877 $1.952 $2.003 Average Energy Rate $0.128 $0.134 $0.141 $0.148 $0.155 Total M&I Rate per HCF $1.882 $1.938 $2.018 $2.100 $2.158 Total M&I Rate per A/F $819 $844 $879 $915 $940
AGRICULTURAL
Water Commodity $1.754 $1.804 $1.877 $1.952 $2.003 Average Energy Rate $0.128 $0.134 $0.141 $0.148 $0.155 Total Agricultural Rate per HCF $1.882 $1.938 $2.018 $2.100 $2.158 Total Agricultural Rate per A/F $819 $844 $879 $915 $940
PROJECTED WASTEWATER CHARGE
WASTEWATER MONTHLY CHARGE $38.75 $38.75 $38.75 $38.75 $38.75 Table 8.2
89

Fiscal Year 2016-2017 Operating Budget Rancho California Water District Forecast
Chart 8.1
Chart 8.2
16-17 17-18 18-19 19-20 20-21
% Increase 2.20% 5.7% 7.1% 5.3% 3.7%
0.00%
2.00%
4.00%
6.00%
8.00%
10.00%
12.00%
Projected Ag and M&I Combined Water & Energy Rate Increases Rancho Division
16-17 17-18 18-19 19-20 20-21
% Increase 5.76% 3.0% 4.1% 4.1% 2.8%
0.00%
2.00%
4.00%
6.00%
8.00%
10.00%
12.00%
Projected Ag and M&I Combined Water & Energy Rate Increases Santa Rosa Division
90

Rancho California Water District
Budgeted July 2016
BOARD OF DIRECTORS & DISTRICT OFFICERS
President
Sr. Vice President
General Manager
Vice President
Vice President
Vice President
Vice President
Vice President
Chief Engineer
District Secretary
Assistant General Manager
Director of Finance/Treasurer
Director of Administration
91

Rancho California Water District
Budgeted July 2016
BOARD OF DIRECTORS
President
Sr. Vice President
Vice President
Vice President
Vice President
Vice President
Vice President
92

Rancho California Water District
Budgeted July 2016
DISTRICT MANAGEMENT
General Manager
Assistant General Manager
Chief Engineer
Human Resources
Manager
Field Services Manager
- Construction
Water Reclamation Manager
Engineering Manager –
CIP & Design
Construction Contracts
Manager
District Secretary
Director of Finance/
Treasurer
Water Operations
Manager
Engineering Manager -
Operations
Water Resources
Manager
Accounting Manager
Director of Administration
93

Rancho California Water District
Budgeted July 2016
DISTRICT ADMINISTRATIVE OFFICERS
General Manager
Chief Engineer
District Secretary
Assistant General Manager
Director of Finance/
Treasurer
Director of Administration
94

Rancho California Water District
Budgeted July 2016
OPERATIONS & MAINTENANCE DIVISION
OPERATIONS
Assistant General Manager
Water System
Supervisor
Electrical Services
Supervisor
Water Quality
Supervisor
Sr. Water System
Operator
Water System Operator
Analyst
Sr. Water System
Operator
Sr. Water System Operator
Sr. Electrical Controls/
Instrumentation Technician
Electrical Controls/
Instrumentation Technician
II
Sr. Electrical Controls/
Instrumentation Technician
Electrical Controls/
Instrumentation Technician
II
Sr. Electrical Controls/
Instrumentation Technician
Sr. Water Treatment
Operator
Sr. Water Treatment Operator
Sr. Water Treatment Operator
Sr. Water Treatment Operator
Cross Connection Control Specialist
Cross Connection Control Technician I
Corrosion Control Technician II
Water
Reclamation Manager
Wastewater Plant
Operator II
Sr. Wastewater Plant
Operator
Sr. Wastewater Plant
Operator
Sr. Wastewater Plant Operator
Sr. Plant Maintenance
Technician
Plant Maintenance Technician II
Sr. Wastewater Collection
Systems Technician
Wastewater Plant Operator
in Training (OIT)
Operations (41)
Wastewater
Maintenance Supervisor
Field Services Worker II
- Ops
Lead Field Services
Worker - Ops
Field Services Foreman
Wells & Pumps
Well & Pump Technician II
Well & PumpTechnician II
Electrical Controls/
Instrumentation Technical II
Engineering Manager -
Operations
Field Services Worker II
- Ops
Operations Systems
Administrator
Operations Systems Analyst
Water Operations
Manager
Intern
95

Rancho California Water District
Budgeted July 2016
OPERATIONS & MAINTENANCE DIVISION
FIELD SERVICES
Assistant General Manager
Field Services Manager
Field Services Supervisor Facilities
Field Services Foreman
Construction
Field Services Foreman
Construction
Field Services Foreman
Construction
Field Services ForemanFleet & Facilities
Field Services ForemanMeter/AMR
Lead Field Services Worker Construction
Field Services Worker II
Construction
Field Services Worker II
Construction
Field Services Worker II
Construction
Lead Field Services Worker Construction
Field Services Locator II
Construction
Field Services Worker II
Construction
Field Services Worker II
Construction
Lead Field Services Worker Construction
Field Services Worker IConstruction
Field Services Worker II
Construction
Field Services Worker I
Construction
Sr. Mechanic
Sr. Field Services Worker
Meter/AMR
Sr. Field Services Worker
Meter/AMR
Sr. Field Services Worker
Meter/AMR
Sr. Field Services Worker
Meter/AMR
Sr. Field Services Worker
Meter/AMR
Field Services Worker I
Meter/AMR
Field Services Worker II
Construction
Operations &
Maintenance Technician
Operations &
Maintenance Assistant
Field Services Supervisor
Construction
Field Services Worker II
Meter/AMR
Field Services Worker I
Construction
Field Services (33)
Intern
96

Rancho California Water District
Budgeted July 2016
ENGINEERING DIVISION
Construction Contracts
Manager
Engineering Manager –
CIP & Development
Principal Engineer
Principal Engineer
Associate Engineer
Contracts Administrator II
Construction Inspector
Supervisor
Construction Inspector II
Sr. Construction Inspector
Office Assistant II
Chief Engineer
Sr. Administrative Assistant
Engineering (20)
Principal Engineer
Engineering Services
Supervisor
Engineering Technician I
Engineering Technician I
Engineering Technician I
Water Resources Manager
Principal Engineer
GIS Analyst II
Assistant General Manager
97

Rancho California Water District
Budgeted July 2016
ADMINISTRATION
Administration (23)
Director of Administration
Customer Service
Supervisor
ERP Business Analyst
GIS Coordinator
Utility Analyst
Datacenter Operations
Supervisor
Customer Service
Rep II - Office
Customer Service
Rep I - Office
Customer Service
Rep II - Office
Customer Service
Rep I - Office
Sr. Customer Service
Rep - Office
Customer Service
Rep II - Field
Customer Service Rep II - Field
Customer Service Rep II - Field
Sr. Systems Administrator
Customer Service
Rep II - Office
Administrative Services
Supervisor
Office Assistant IIMailroom
Office Assistant IIRecords Management
Sr. Water Resources
Planner
Conservation and Water Budget Analyst
Water Use EfficiencySpecialist I
Office Assistant II
98

Rancho California Water District
Budgeted July 2016
BOARD ADMINISTRATION
Board Administration (5)
General Manager
Public Information
Specialist I/II
Administrative
Assistant II
District Secretary
Senior Public Information Officer
99

Rancho California Water District
Budgeted July 2016
FINANCE DIVISION
Director of Financer/Treasurer
Purchasing Agent II
Accounting Manager
Purchasing/Warehouse
Supervisor
Purchasing Agent II
Budget/Debt Administrator
Sr. Administrative
Assistant
Financial Analyst
Accounting Clerk II Accounts Payables
Accounting Analyst
Accountant
Sr. Accounting Analyst
Accountant
Finance (13)
100

Rancho California Water District
Budgeted July 2016
HUMAN RESOURCES
Human Resources Manager
Human Resources Analyst I
Safety/Risk Officer
Sr. Human Resources
Analyst
Human Resources (4)
101

Fiscal Year 2016-2017 Operating Budget
AT-WILL EXECUTIVE MANAGEMENT SALARY SCHEDULE Board Approved on November 12, 2015
EXECUTIVE MANAGEMENT BY TITLE MONTHLY SALARY ANNUAL SALARY
Minimum Maximum Minimum Maximum
General Manager $19,250.00 $231,000.00
Assistant General Manager $13,462.00 $17,500.00 $161,538.00 $210,000.00
Director of Finance/Treasurer $11,859.00 $15,417.00 $142,308.00 $185,000.00
Director of Administration $11,500.00 $15,000.00 $138,000.00 $180,000.00
Chief Engineer $12,179.00 $15,833.00 $146,154.00 $190,000.00
Director of Operations & Maintenance $11,859.00 $15,417.00 $142,308.00 $185,000.00
Human Resources Manager $9,615.00 $12,500.00 $115,385.00 $150,000.00
Notes: Executive management positions are also eligible to receive a performance bonus award at the end of the Fiscal Year by the General Manager. Bonus amounts have ranged from 0% to 4% of salary. The General Manager position currently receives an auto allowance of $600/month. The Assistant General Manager position may receive an auto allowance of $500/month, depending on what is negotiated on employment agreement. The District does not pay PERS on the auto allowance. Other positions are reimbursed for mileage expenses directly. The District does not pay PERS on the auto allowance or mileage reimbursement.
102

Effective July 1, 2016
Minimum Control Maximum
MOU Article 7
Provision Minimum Control Maximum
MOU Article 7
Provision Minimum Control Maximum
MOU Article 7
Provision
Engineering Manager - CIP & Design 1 57.743$ 69.292$ 76.221$ 77.364$ 10,008.79$ 12,010.61$ 13,211.64$ 13,409.76$ 120,105.44$ 144,127.36$ 158,539.68$ 160,917.12$
Engineering Manager -Operations
Accounting Manager 2 54.994$ 65.993$ 72.592$ 73.680$ 9,532.29$ 11,438.79$ 12,582.61$ 12,771.20$ 114,387.52$ 137,265.44$ 150,991.36$ 153,254.40$
Construction Contracts Manager
Field Services Manager
Finance Manager
Information Tech./Cust. Svc. Manager
Operations Project Manager
Water Operations Manager
Water Reclamation Manager
Water Resources Manager
Vacant 3 52.377$ 62.852$ 69.137$ 70.173$ 9,078.68$ 10,894.35$ 11,983.75$ 12,163.32$ 108,944.16$ 130,732.16$ 143,804.96$ 145,959.84$
Vacant 4 49.881$ 59.857$ 65.843$ 66.829$ 8,646.04$ 10,375.21$ 11,412.79$ 11,583.69$ 103,752.48$ 124,502.56$ 136,953.44$ 139,004.32$
Principal Engineer 5 47.504$ 57.005$ 62.706$ 63.645$ 8,234.03$ 9,880.87$ 10,869.04$ 11,031.80$ 98,808.32$ 118,570.40$ 130,428.48$ 132,381.60$
Senior Water Resource Planner 6 45.248$ 54.297$ 59.727$ 60.621$ 7,842.99$ 9,411.48$ 10,352.68$ 10,507.64$ 94,115.84$ 112,937.76$ 124,232.16$ 126,091.68$
Accounting Supervisor 7 43.091$ 51.709$ 56.880$ 57.732$ 7,469.11$ 8,962.89$ 9,859.20$ 10,006.88$ 89,629.28$ 107,554.72$ 118,310.40$ 120,082.56$
Associate Engineer
Budget/Debt Administrator
ERP Business Analyst
Sr. Public Information Officer
Safety/Risk Officer 8 41.037$ 49.244$ 54.168$ 54.981$ 7,113.08$ 8,535.63$ 9,389.12$ 9,530.04$ 85,356.96$ 102,427.52$ 112,669.44$ 114,360.48$
Water Resources Planner
Assistant Engineer 9 39.083$ 46.899$ 51.589$ 52.363$ 6,774.39$ 8,129.16$ 8,942.09$ 9,076.25$ 81,292.64$ 97,549.92$ 107,305.12$ 108,915.04$
Public Information Officer II 10 37.224$ 44.669$ 49.136$ 49.872$ 6,452.16$ 7,742.63$ 8,516.91$ 8,644.48$ 77,425.92$ 92,911.52$ 102,202.88$ 103,733.76$
District Secretary 11 35.451$ 42.541$ 46.795$ 47.496$ 6,144.84$ 7,373.77$ 8,111.13$ 8,232.64$ 73,738.08$ 88,485.28$ 97,333.60$ 98,791.68$
Vacant 12 33.765$ 40.518$ 44.570$ 45.238$ 5,852.60$ 7,023.12$ 7,725.47$ 7,841.25$ 70,231.20$ 84,277.44$ 92,705.60$ 94,095.04$
Accountant 13 32.075$ 38.490$ 42.339$ 42.973$ 5,559.67$ 6,671.60$ 7,338.76$ 7,448.65$ 66,716.00$ 80,059.20$ 88,065.12$ 89,383.84$
Administrative Analyst
Public Information Officer I
Note: Minimum to Control Point is a 20% Increase. Control Point to Maximum is a 10% Increase, Plus 3% Which Reflects the "Salary Range Buffer" for Topped Out Employees agreed to in MOUs Section 7.
Rancho California Water District
MPCEA Exempt Salary Ranges
Fiscal Year 2016- 2017
Title Grade
Hourly Monthly Annual
3.81% Range Movement
103

Effective July 1, 2016
Minimum Maximum
MOU Article 7
Provision Minimum Maximum
MOU Article 7
Provision Minimum Maximum
MOU Article 7
Provision
Data Center Operations Supervisor A 47.707$ 57.241$ 58.099$ 8,269.21$ 9,921.77$ 10,070.49$ 99,230.56$ 119,061.28$ 120,845.92$
Senior Human Resources Analyst D 41.208$ 49.449$ 50.190$ 7,142.72$ 8,571.16$ 8,699.60$ 85,712.64$ 102,853.92$ 104,395.20$
Human Resources Analyst II G 35.595$ 42.719$ 43.359$ 6,169.80$ 7,404.63$ 7,515.56$ 74,037.60$ 88,855.52$ 90,186.72$
Administrative Services Supervisor
Human Resources Analyst I I 32.287$ 38.746$ 39.327$ 5,596.41$ 6,715.97$ 6,816.68$ 67,156.96$ 80,591.68$ 81,800.16$
Senior Administrative Assistant - Finance
Administrative Assistant II M 26.559$ 31.869$ 32.346$ 4,603.56$ 5,523.96$ 5,606.64$ 55,242.72$ 66,287.52$ 67,279.68$
Administrative Assistant I O 24.095$ 28.912$ 29.346$ 4,176.47$ 5,011.41$ 5,086.64$ 50,117.60$ 60,136.96$ 61,039.68$
Note: Minimum to Maximum is a 20% Increase. Maximum reflects 3% "Salary Range Buffer" for Topped Out Employees agreed to in MOU's Section 7.
Rancho California Water District MPCEA Non - Exempt Salary Ranges
Fiscal Year 2016 - 2017
Title Grade
Hourly Monthly Annual
3.81% Range Movement
104

EffectiveJuly1,2016 3.81%RangeMovement
Minimum MaximumMOU Article 7
Provision Minimum MaximumMOU Article 7
Provision Minimum MaximumMOU Article 7
ProvisionVacant A 47.707$ 57.241$ 58.099$ 8,269.21$ 9,921.77$ 10,070.49$ 99,230.56$ 119,061.28$ 120,845.92$
Vacant B 45.436$ 54.515$ 55.332$ 7,875.57$ 9,449.27$ 9,590.88$ 94,506.88$ 113,391.20$ 115,090.56$
Construction Inspector Supervisor C 43.267$ 51.921$ 52.699$ 7,499.61$ 8,999.64$ 9,134.49$ 89,995.36$ 107,995.68$ 109,613.92$ Electrical Services SupervisorField Services Supervisor - ConstructionField Services Supervisor - FacilitiesGIS CoordinatorSr. Systems AdministratorWater Quality SupervisorWater Systems Supervisor
Vacant D 41.208$ 49.449$ 50.190$ 7,142.72$ 8,571.16$ 8,699.60$ 85,712.64$ 102,853.92$ 104,395.20$
Operations Systems Administrator E 39.243$ 47.092$ 47.799$ 6,802.12$ 8,162.61$ 8,285.16$ 81,625.44$ 97,951.36$ 99,421.92$ Sr. Conservation & Water Budget AnalystSr. Conservation/Water Use Efficiency AnalystSystems AdministratorWastewater Maintenance Supervisor
Engineering Project Coordinator F 37.376$ 44.852$ 45.524$ 6,478.51$ 7,774.35$ 7,890.83$ 77,742.08$ 93,292.16$ 94,689.92$ Customer Service SupervisorLead Water Systems OperatorSr. Construction InspectorSr. Electrical Controls/Instrumentation TechnicianWater Systems Operator Analyst
Conservation & Water Budget Analyst G 35.595$ 42.719$ 43.359$ 6,169.80$ 7,404.63$ 7,515.56$ 74,037.60$ 88,855.52$ 90,186.72$ Conservation/Water Use Efficiency AnalystEngineering Services SupervisorField Services Foreman - Fleet/FacilitiesField Services Foreman - Wells & PumpsPublic Information Specialist IIUtility AnalystWater Use Efficiency Specialist II
Cross Connection Control Specialist H 33.904$ 40.685$ 41.295$ 5,876.69$ 7,052.07$ 7,157.80$ 70,520.32$ 84,624.80$ 85,893.60$
AnnualMonthlyHourly
RanchoCaliforniaWaterDistrictRCWDEANon‐ExemptSalaryRanges
FY2016‐2017
Title Grade
105

EffectiveJuly1,2016 3.81%RangeMovement
Minimum MaximumMOU Article 7
Provision Minimum MaximumMOU Article 7
Provision Minimum MaximumMOU Article 7
Provision
AnnualMonthlyHourly
RanchoCaliforniaWaterDistrictRCWDEANon‐ExemptSalaryRanges
FY2016‐2017
Title Grade
Electrical Controls/Instrumentation Technician IIGIS Analyst IIOperations & Maintenance TechnicianPurchasing/Warehouse SupervisorSenior Engineering TechnicianSenior Plant Maintenance TechnicianSenior Wastewater Plant OperatorSenior Water Systems OperatorSenior Water Treatment Operator
Construction Inspector II I 32.287$ 38.746$ 39.327$ 5,596.41$ 6,715.97$ 6,816.68$ 67,156.96$ 80,591.68$ 81,800.16$ Field Services Foreman - ConstructionPublic Information Specialist I Senior Accounting AnalystSenior Administrative AssistantWater Use Efficiency Specialist I
Corrosion Control Technician II J 30.750$ 36.899$ 37.452$ 5,330.00$ 6,395.83$ 6,491.68$ 63,960.00$ 76,749.92$ 77,900.16$ Cross Connection Control Technician IIEngineering Technician IIField Services Foreman - Meter/AMRField Services Lead - Wells & PumpsField Services Worker - Mtr Rep/AMR Sys SpecMeter Reading Services ForemanPurchasing Agent IISr. Contracts AdministratorSr. MechanicWater Treatment Operator II
GIS Analyst I K 29.287$ 35.145$ 35.671$ 5,076.41$ 6,091.80$ 6,182.97$ 60,916.96$ 73,101.60$ 74,195.68$ Plant Maintenance Technician IISenior Operations & Maintenance AssistantWastewater Plant Operator IIWater Systems Operator IIWell & Pump Technician II
Contracts Administrator II L 27.894$ 33.472$ 33.975$ 4,834.96$ 5,801.81$ 5,889.00$ 58,019.52$ 69,621.76$ 70,668.00$ Corrosion Control Technician I
106

EffectiveJuly1,2016 3.81%RangeMovement
Minimum MaximumMOU Article 7
Provision Minimum MaximumMOU Article 7
Provision Minimum MaximumMOU Article 7
Provision
AnnualMonthlyHourly
RanchoCaliforniaWaterDistrictRCWDEANon‐ExemptSalaryRanges
FY2016‐2017
Title Grade
Electrical Controls/Instrumentation Technician ILead Field Services Worker - ConstructionLead Field Services Worker - OperationsMechanic IISenior Customer Service Rep-Office/FieldSenior Wastewater Collection System Technician
Accounting Analyst M 26.559$ 31.869$ 32.346$ 4,603.56$ 5,523.96$ 5,606.64$ 55,242.72$ 66,287.52$ 67,279.68$ Administrative Assistant II Construction Inspector IEngineering Technician IField Services Locator IIPurchasing Agent ISenior Field Services Worker - Meter/AMRSenior Warehouse Technician
Cross Connection Control Technician I N 25.297$ 30.357$ 30.812$ 4,384.81$ 5,261.88$ 5,340.75$ 52,617.76$ 63,142.56$ 64,088.96$ Customer Service Rep II - Office/FieldEngineering Services Representative IIField Services Worker II - OperationsField Services Worker II-ConstructionOperations & Maintenance Assistant IIWater Treatment Operator I
Administrative Assistant I O 24.095$ 28.912$ 29.346$ 4,176.47$ 5,011.41$ 5,086.64$ 50,117.60$ 60,136.96$ 61,039.68$ Building & Grounds Worker IIField Services Worker II - Meter/AMRPlant Maintenance Technician IWarehouse Technician IIWastewater Plant Operator IWater Systems Operator IWell & Pump Technician I
Accounting Clerk II P 22.949$ 27.539$ 27.951$ 3,977.83$ 4,773.43$ 4,844.84$ 47,733.92$ 57,281.12$ 58,138.08$ Mechanic IOperations & Maintenance Assistant IWastewater Collection System Technician II
107

EffectiveJuly1,2016 3.81%RangeMovement
Minimum MaximumMOU Article 7
Provision Minimum MaximumMOU Article 7
Provision Minimum MaximumMOU Article 7
Provision
AnnualMonthlyHourly
RanchoCaliforniaWaterDistrictRCWDEANon‐ExemptSalaryRanges
FY2016‐2017
Title Grade
Customer Service Rep I - Office/Field Q 21.853$ 26.224$ 26.618$ 3,787.85$ 4,545.49$ 4,613.79$ 45,454.24$ 54,545.92$ 55,365.44$ Field Services Locator I
Building & Grounds Worker I R 20.815$ 24.977$ 25.351$ 3,607.93$ 4,329.35$ 4,394.17$ 43,295.20$ 51,952.16$ 52,730.08$ Contracts Administrator IEngineering AideEngineering Services Representative IField Services Worker I - ConstructionField Services Worker I - OperationsOffice Assistant II
Field Services Worker I - Meter/AMR S 19.821$ 23.786$ 24.142$ 3,435.64$ 4,122.91$ 4,184.61$ 41,227.68$ 49,474.88$ 50,215.36$ Warehouse Technician IWastewater Collection System Technician IWastewater Plant Operator-In-Training (OIT)
Accounting Clerk I T 18.879$ 22.652$ 22.992$ 3,272.36$ 3,926.35$ 3,985.28$ 39,268.32$ 47,116.16$ 47,823.36$
Field Services Worker I - AMR U 17.984$ 21.579$ 21.902$ 3,117.23$ 3,740.36$ 3,796.35$ 37,406.72$ 44,884.32$ 45,556.16$ Office Assistant I
Vacant V 17.127$ 20.546$ 20.854$ 2,968.68$ 3,561.31$ 3,614.69$ 35,624.16$ 42,735.68$ 43,376.32$ Note: Minimum to Maximum is a 20% Increase. Maximum reflects 3% "Salary Range Buffer" for Topped Out Employees agreed to in Side Letter of MOU's Section 7.
108

Fiscal Year 2016-2017 Operating Budget Rancho California Water District Divisional Plans
Divisional Plans
A key element of the District’s operating budget is developing departmental programs that are in support of the District’s mission and strategic plan. The Divisional Plans represent the link that transmits the strategic planning into tactical action. This section presents these departmental programs using the following format:
Division Mission Statement
Divisional Organizational Chart
Divisional Personnel Requirements
Critical Success Factors for each Division
Narrative statement of the function of each Department
Three year comparison of accomplishments for each Department
Key objectives of the Department
Performance Measurement Indicators of each Department’s objectives
District Organizational Chart
109

Fiscal Year 2016-2017 Operating Budget Rancho California Water District Divisional Plans
Personnel Staffing Levels
FULL-TIME EQUIVALENT POSITIONS BY DIVISION:
Actual FY 2014-15
Budget FY 2015-16
Budget FY 2016-17
Percent Change
Administration Division 19 17 33 94.1% Finance Division 29 29 13 -55.2% Engineering Division 22 20 20 0.0% Operations Division 39 43 42 -2.3% Field Services Division 35 33 31 -6.1%
Total 144 142 139 -2.1%
TOTAL PERSONNEL BY CLASSIFICATION:
Actual FY 2014-15
Actual FY 2015-16
Budget FY 2016-17
Projected FY 2017-18
General Manager 1 1 1 1 Assistant General Manager 1 1 1 1 Directors 3 4 3 3 Management 11 10 9 9 Supervisory 20 19 21 21 Professional 17 21 17 17 Administrative 28 25 26 26 Technical 35 34 35 35 General Labor 28 27 26 26
Total 144 142 139 139 For 2016-2017, the budget proposes to fund 139 FTE positions. The District re-organized staffing by un-filling five positions and creating four new positions as well as re-aligning positions from the Finance Division into the Administration Division for the 2016-2017 Budget. The positions unfilled are an Engineering Service Rep in the Engineering Division; a Senior Wastewater Plant Operator, a Building & Grounds Worker, a Field Services Manager and a Director of Operations in the Operations Division; and a Senior Water Resource Planner in Administration. Newly created positions are a Public Information Specialist in the Administration Division, two Field Supervisors in the Operations Division and an Intern in the Engineering Division. Staffing changes within the organization were necessary to address changing resource needs and to align appropriate staffing levels for efficiency and effectively accomplish the District’s strategic goals. Since 1991-92, installed water meters have grown by 180.5% to over 44,291 installed meters, while employee positions have increased by 9.4%.
Ratio of Employees to Accounts Last 10 Fiscal Years
2008 2009 2010 2011 2012 2013 2014 2015 2016 2017
No. of Employees 141 144.5 148.5 149.5 148.5 147 146 144 142 139
No. of Accounts 41,986 42,260 42,630 42,753 42,958 43,126 43,488 43,975 44,043 44,291
Ratio .34% .34% .35% .35% .35% .34% .34% .33% .32% .31%
110

Fiscal Year 2016-2017 Operating Budget Rancho California Water District Divisional Plans
Fund Structure
The District accounts for its water and wastewater operations activities as enterprise funds. These activities closely resemble those of private business enterprises where services are provided on a continuous basis and are substantially financed by revenues derived from user charges. A number of District divisions perform functions supporting both water enterprise funds and wastewater enterprise funds. The following chart shows the relationship between the District’s divisions and the enterprise funds that are charged for their activities.
Relationship Between Divisions, Departments and Funds
Rancho Santa Rosa Wastewater
Division Department Enterprise Fund Enterprise Fund Enterprise Fund
Administration
Board Administration X X X
Public and Legislative Relations/Outreach Activities X X X
Human Resources X X X
Risk Transfer, Liability and Property Insurance X X X
Administrative Services X X X
Customer Service X X X
Information Technology X X X
Geographical Information Systems X X X
Water Resources Planner X X
Conservation and Water Budget Analyst X X
Water Use Efficiency X X
Finance
Finance Administration X X X
Accounting X X X
Budgetary X X X
Treasury X X X
Real Estate Management X X X
Grant Acquisition and Management X X X
Purchasing X X X
Warehouse X X X
Engineering
Engineering Administration X X X
Water Resources/Engineering Planning X X X
Engineering Design X X X
Engineering Services X X X
Construction Contracts X X X
Operations
Water Operations X X
Corrosion Control X X
Electrical Services X X X
Water Quality X X
Pumps and Wells Maintenance X X X
Asset Management X X X
Wastewater Treatment X
Field Services
Field Services X X X
Meter Maintenance X X
Mechanic Maintenance X X
111

Fiscal Year 2016-2017 Operating Budget Rancho California Water District Divisional Plans
Administration Division
MISSION STATEMENT
To provide exceptional, timely, and professional administrative support toward the Rancho California Water District’s mission, vision, and values, including specific administration of District records, human resources and safety, board administration, customer service and billing, information technology, geographic information systems and water use efficiency.
PERSONNEL REQUIREMENTS (FTE)
Actual FY 2014-15
Actual FY 2015-16
Budget FY 2016-17
Projected FY 2017-18
General Manager 1 1 1 1 Asst. General Manager 1 1 1 1 District Secretary 1 1 1 1 Administrative Assistant 2 1 1 1 Administrative Services Supervisor 1 1 1 1 Office Assistant 4 3 3 3 Public Information Officer 1 1 1 1 Public Information Specialist 0 1 1 1 Human Resources Manager 1 1 1 1 Human Resource Analyst 1 1 2 2 Administrative Assistant H/R 1 1 0 0 Safety/Risk Officer 1 1 1 1 Director of Administration 0 1 1 1 Customer Service Supervisor 0 1 1 1 Utility Analyst 0 1 1 1 Customer Service Rep 0 9 9 9 Resource Planner 2 2 1 1 Planning Intern 1 1 0 0 Conservation Water Budget Analyst 1 1 1 1 Water Use Efficiency Specialist 0 0 1 1 Data Center Operations Supervisor 0 1 1 1 Systems Administrator 0 1 1 1 ERP Business Analyst 0 1 1 1 GIS Coordinator 0 1 1 1
Total 19 19 33 33
DIVISION SUMMARY
Category Actual
FY 2014-15 Budget
FY 2015-16 Budget
FY 2016-17
Labor $2,459,762 $1,887,180 $3,271,793 Materials 126,007 81,500 86,450 Outside Services* 8,027,071 8,363,023 9,942,059 Funded Staffing Level 19 19 33 * Outside Services includes fringe benefits expense.
112

Fiscal Year 2016-2017 Operating Budget Rancho California Water District Divisional Plans
CRITICAL SUCCESS FACTORS
The Administration Division has identified the following objectives it considers critical to the overall success of the Division and the District for fiscal year 2016-2017:
Provide administrative support to the General Manager, Assistant General Managers, and the Board of Directors.
Provide technical support and compliance solutions that protect the District from legal, financial and safety exposures.
Provide Human Resources, safety and risk management and support to employees of the District.
Provide administrative support to the District’s internal and external customers.
Coordinate with other local, regional, and state agencies relative to the implementation of the District’s goals and positions as established by the Board of Directors and consistent with the Strategic Plan.
Participate in State and National conferences to ensure that the District is positioned properly with the statutes and programs of State and National agencies with water supply and wastewater oversight.
113

Fiscal Year 2016-2017 Operating Budget Rancho California Water District Divisional Plans
Board Administration MISSION STATEMENT
To provide specific administration of the Board of Directors business, legal services, and election processes. This includes the preparation and timely distribution of Board and Committee meeting packages, coordination of industry travel and event arrangements, maintenance of all official documents, and timely development and filing of all noticing requirements in accordance with the Ralph M. Brown Act.
ACCOMPLISHMENTS FOR FISCAL YEAR 2015-16
Prepared and/or assisted with the completion of approximately 54 Board and Committee meeting minutes, and 29 Board and Planning and Administration Committee meeting packages;
Ensured all meeting agendas, notices and related material were in compliance with the Ralph M. Brown Act;
Arranged and scheduled numerous meetings for the General Manager, Assistant General Manager, and Board of Directors;
Provided updates to Part I (Administration of the District) of the adopted Administrative Code; and
Provided support and assistance to the County of Riverside for the completion of the 2015 Board of Directors General Election.
STRATEGIC
OBJECTIVE FISCAL YEAR 2016-17 INITIATIVES
GP5.S1.O1 Provide a timely response to public requests.
GP5.S4.O1
Timely prepare and complete all Board, and Planning and Administration Committee meeting packages for distribution.
Assure timely preparations and dispersion of the Finance and Audit and Engineering and Operations Committee meeting packages.
Transcribe and generate for approval Board, and Planning and Administration Committee meeting minutes, and secure completion of the minutes of the Finance and Audit, and Engineering and Operations Committee meetings.
Provide administrative support to the General Manager, Assistant General Manager, and Board of Directors.
Administer agendas and notices for said meetings to comply with the Ralph M. Brown Act.
114

Fiscal Year 2016-2017 Operating Budget Rancho California Water District Divisional Plans
PERFORMANCE MEASUREMENT INDICATORS
ACTIVITY
CRITERIA
ACTUAL
14/15 BUDGET
15/16 TARGET
16/17
2015 Board of Directors General Election
Provide assistance to the County of Riverside for the completion of the 2013 Board of Directors Election
n/a Met n/a
Prepare and post meeting agendas and notices
Post agendas and notices in accordance with the Ralph M. Brown Act
100% 100% 100%
Timely prepare and complete all Board of Directors, and Planning and Administration Committee meeting agendas and packages
Provide completed meeting packages to the Board of Directors and staff a minimum of four days before the subject meeting
100% 100% 100%
Generate Board, and Planning and Administration Committee meeting minutes
Complete minutes for review and approval by the Board within 30 days of the subject meeting
97% 100% 100%
Maintain updates for Part I of the Administrative Code
Update the Administrative Code as changes become effective
100% 100% 100%
115

Fiscal Year 2016-2017 Operating Budget Rancho California Water District Divisional Plans
Public Affairs, Education, and Legislative Relations/Outreach Activities
ACCOMPLISHMENTS FISCAL YEAR 2015-16
Reached over 13,000 students through the elementary theater programs, elementary curriculum programs, poster contest, write-off contest, menu contest, and various water education material distribution;
Developed a pilot education program at Vail Lake focused on the importance of groundwater and groundwater recharge;
Chose 5 menu contest winners and the menus are featured in 5 local restaurants throughout the entire year;
Developed a complex outreach program focused on the drought and the changes to customers water budgets;
Participated in over 50 community events to provide information to our customers;
Developed a stakeholder quarterly event , Water Talk bringing in speakers on important topics;
Developed many new customer friendly videos educating our customers;
Partnered with Eastern Municipal Water District on a drought outreach campaign;
Implemented an e-newsletter for our customers;
Developed a phone application for customers to report water waste;
Provided outreach for multiple emergency construction projects;
Developed Legislative Policy Principles for the District;
Updated Legislative Priorities for the District;
Strengthened relationships with our legislative representatives and local stakeholders;
Received the American Water Works Association’s Public Outreach award and was a finalist for the Association of California Water Agency’s Best in Blue Communication award;
Held an education recognition night for all the education programs that RCWD offers;
Provided targeted outreach to community organizations;
Developed water use efficiency outreach materials to community organizations;
Tracked state legislation and commented on proposed legislation when appropriate;
Communicated to customers through customer newsletters, multiple bill inserts, email blasts, press releases, events, and social media; and
Continued to utilize social media as a key outreach tool, especially in emergencies.
116

Fiscal Year 2016-2017 Operating Budget Rancho California Water District Divisional Plans
STRATEGIC
OBJECTIVE FISCAL YEAR 2016-17 INITIATIVES
GP5.S1.O7 Developed targeted outreach pieces for specific groups.
GP5.S1.O8 Develop new customer friendly videos for the District website.
Continue to implement the outreach plan on the updated Water Shortage Contingency Plan.
Continue RCWD’s communication outreach including multiple speaking engagements, social media updates, and event participation.
Maintain and expand federal and state legislative partnerships.
Improve District wide external communication by providing communication training to RCWD staff.
Improve internal communication by providing monthly updates to all RCWD staff on major RCWD project initiatives.
Continue to implement all pre-K through high school water education programs.
Implement a Vail Lake education program. Create partnerships with local agencies on programs and initiatives.
Develop updated legislative packets for local legislators about key RCWD projects
GP2.S1.O2
GP5.S1.O7
GP5.S1.O3
GP4.S3.02-4
PERFORMANCE MEASUREMENT INDICATORS
ACTIVITY
CRITERIA
ACTUAL 14/15
BUDGET 15/16
TARGET 16/17
Conduct Targeted Outreach to Specific Groups
Target different group leaders to discuss major water issues (I.E. Rotaries, Chambers, Educators, Councils, etc.)
Developed Targeted
Pieces Ongoing Ongoing
Conduct Water Use Efficiency Outreach
Participate in community events and communicate with customers program that are offered
On Track Ongoing Ongoing
Track State Legislation
Work with legislative staff to communicate language changes to legislation affecting the District
Ongoing Ongoing Ongoing
Conduct Ongoing Communication with Customers and the Community
Communicate with customers through a variety of means (email blasts, mailers, social media, etc.) monthly
Ongoing Ongoing Ongoing
Implement a Vail Lake Education Program
Develop and implement a water education program at Vail Lake focused on groundwater.
n/a n/a Develop program
117

Fiscal Year 2016-2017 Operating Budget Rancho California Water District Divisional Plans
ACTIVITY
CRITERIA
ACTUAL 14/15
BUDGET 15/16
TARGET 16/17
Develop new customer friendly videos for website
Develop customer friendly videos for our website that will educate our customers
n/a n/a Develop videos
Develop updated legislative packets for local legislators
Develop packets that focus on key RCWD initiatives to share with legislators for support and financial assistance
n/a n/a
Continue to update and distribute
packets every year
Develop a Communications Plan to coincide with the Water Shortage Contingency Plan
Develop a communication plan that goes through the communication steps for each step of the Water Shortage Contingency Plan
Developed Plan
Completed Plan August
2014
Implement communication
strategies as stages change
and plan changes
118

Fiscal Year 2016-2017 Operating Budget Rancho California Water District Divisional Plans
Human Resources
MISSION STATEMENT
Our mission is to maximize the potential of RCWD’s greatest assets – its employees. We are committed to recruit, develop, reward, retain, and protect the physical and human assets of RCWD. Our vision as human resource and safety/risk management professionals is to embrace a change and the opportunity it brings. We will accomplish this by providing services, which promote a work environment that is characterized by fair treatment of staff, open communication, personal accountability, trust, and mutual respect.
CRITICAL SUCCESS FACTORS
Human Resources have identified the following objectives it considers critical to the overall success of the Division and the District for fiscal year 2016-2017:
Implement succession-planning efforts to transfer knowledge of employees in critical positions as the workforce ages and readies for retirement.
Develop a mentorship program to provide critical guidance and assistance in the career development of staff through experience from other employees.
Update Districts Certification Chart and Job Descriptions and District policies in collaborative effort with employer associations, Human Resources, supervisors, and department managers.
Continue to provide leadership training District-wide to assist with effective communication, develop leadership skills, and collaboration throughout the workforce.
Develop strategies to attract and retain employees.
Provide training to supervisors to help address employee issues.
Update all insurance schedules annually.
Collaborate with the Teamsters Local 911, the RCWD Employee Association, and the RCWD Management Association to provide effective labor relations.
Maintain District Respiratory Program.
Update Material Safety Data Sheets on a regular basis at HQ and SRWRF.
Conduct Annual Joint Agency Emergency Response drill at the SRWRF.
Coordinate site visits from JPIA and implement any recommendation within a 45-day turnaround period.
Maintain safe working environment by achieving a TRR of 6.3 for calendar year 2015.
ACCOMPLISHMENTS FISCAL YEAR 2015-16
Renewed health insurance rate plans with a 2% cost savings effective January 1, 2016;
Conducted an accelerated three month Leadership Academy training module for District managers, supervisors, and professional staff;
Established effective working relationship with MPCEA and Teamsters Local 911 in conjunction with RCWD employee association labor relations;
Successfully recruited qualified staff and conducted 15 recruitments since 7/1/15, which included six new employees and none promotions. In addition, also placed 17 temporary hires;
119

Fiscal Year 2016-2017 Operating Budget Rancho California Water District Divisional Plans
Implemented a PRIDE Program so employees may recognize other employees who demonstrate professionalism, responsibility, integrity, dedication, and equality in the workplace;
Conducted a successful District health and wellness fair;
Conducted a successful annual United Way charitable campaign and continue quarterly blood drives;
Active Committee participation on Water Utilities Human Resources Committee; and
Continue team-building efforts within work groups.
STRATEGIC
OBJECTIVE FISCAL YEAR 2016-17 INITIATIVES
GP3.S12.O1
GP3.S11.O1 Attract, retain, and develop quality staff. Promote an open and professional work environment throughout the organization.
PERFORMANCE MEASUREMENT INDICATORS
ACTIVITY
CRITERIA
ACTUAL 14/15
BUDGET 15/16
TARGET 16/17
Work with District management team to identify future staffing needs projecting out 3-5 years
Tie objective to annual strategic planning/budgeting process
Ongoing Ongoing Ongoing
Continue update certification Chart/Job descriptions
Collaborative effort w/RCWD EA/HR/supervisors/managers
Ongoing Ongoing Ongoing
Successfully negotiate MOU for FY 2017/2018
Collaborative effort with RCWD Management Team/RCWD EA
Complete Complete June 16-
17
Succession Planning Identify critical positions to capture knowledge prior to retirements
Ongoing Ongoing Ongoing
Leadership Training Conduct Leadership Academy Program for first time supervisors
Met July 2015 July 2016
Update Employee Policy and Procedure Manual as needed
Upon changes in District processes and procedures to evaluate and revise form
Ongoing Ongoing Ongoing
Develop and Implement Wellness Program
Create incentives for employees to incorporate healthy living addressing body, mind, and spirit
Ongoing Ongoing Ongoing
120

Fiscal Year 2016-2017 Operating Budget Rancho California Water District Divisional Plans
Safety Risk Transfer, Liability, and Property Insurance
The Safety Risk Office is responsible for overseeing and administrating the District’s key business and asset safeguards, which include OSHA regulatory compliance, risk transfer and Liability and Property Insurance management. Jointly, these functions provide measures that protect the District from legal, financial, and safety exposures.
ACCOMPLISHMENTS FISCAL YEAR 2015-16
Conducted Advanced Incident Command System (ICS) and Emergency Operations Center (EOC) training for District staff with Riverside County Fire Department, City of Temecula Fire Department, and California;
Oversee MPS Security Services for Vail Lake and Sundance Properties;
Member of the Vail Lake/Sundance Property Transition Team;
Organized 2015 RCWD Joint Agency Emergency Response Drill required for compliance with CCR Title 19 Public Safety;
Participated in the District and Murrieta Fire Department fifth annual Joint Agency Rescue Drill;
Participated in the Southwest Riverside County Emergency Preparedness Committee Annual Tabletop Emergency Response exercise;
Continued active Committee participation on Southwest Riverside County Emergency Preparedness Committee;
Conducted CPR, AED, and First Aid training for District employees;
Continued as JPIA liaison;
Maintained vendor/lease certificates of insurance coverage and risk transfer;
Successfully updated all insurance schedules;
Maintained a safe working environment – 7.4 TRR goal – estimated final 2015 TT 2.0;
Conducted annual District Confined Space Rescue Training Program;
Updated 2015 Target Safety training schedules and database;
Conducted Asbestos Safety refresher training as required by state regulations; and
Developed, as required, new safety and environmental policy and procedures.
121

Fiscal Year 2016-2017 Operating Budget Rancho California Water District Divisional Plans
STRATEGIC
OBJECTIVE FISCAL YEAR 2016-17 INITIATIVES
GP3.S1.O1
GP3.S1.O3
Conduct Annual joint agency emergency response drill at the SRWRF – CCR Title 19 Compliance.
Conduct RCWD Emergency Operations Plan training and/or exercise as appropriate. Implement lessons learned from the emergency response exercise.
Review/acquire tools/equipment to augment the Emergency Operations Center (EOC).
PERFORMANCE MEASUREMENT INDICATORS
ACTIVITY
CRITERIA
ACTUAL 14/15
BUDGET 15/16
TARGET 16/17
Conduct Annual Joint Agency Emergency Response Drill at SRWRF
Annual requirement - DHS – NIMS – FEMA compliance & CCR Title 19 Cal ARP public safety compliance. Plan for & participate in all-hazards exercise that involves emergency management, response personnel from multiple disciplines &/or multiple jurisdictions
100% 100% June 2016
Implement lessons learned from the emergency response exercise
Develop action items and recommendations from lessons learned from emergency response exercises to improve overall District emergency response
100% 100% September
2016
Update all insurance schedules
Maintain vendor risk transfer 100% 100% December
2016
Maintain District Respiratory Program
Complete medical and fit test approval
100% 100% July 2016
JPIA Liaison Coordinate site visits and implement recommendation’s - 45 Day Turnaround
100% 100% Ongoing
Maintain a Safe Working Environment
Supervisor/manager round table –TRR Goal (6.5)
72% 96% - Est.
2.0 6.5
Conduct RCWD Emergency Operations Plan training and/or exercise as appropriate
DHS-NIMS-FEMA compliance. Advanced Incident Command System and Emergency Operations Ctr. Training.
100% 100% Nov. 2016
122

Fiscal Year 2016-2017 Operating Budget Rancho California Water District Divisional Plans
Administrative Services MISSION STATEMENT
To provide a full array of quality administrative support for all departments of the District, including but not limited to mail services, event arrangements, setting up for District-related meetings, telephone and reception support, and oversight of the centralized paper and electronic recordkeeping system, as well as to provide quality customer service to all internal and external customers.
ACCOMPLISHMENTS FOR FISCAL YEAR 2015-16
Provided administrative support to all divisions within the District, including copying and delivering all Board and Committee packages, general copying, typing and clerical requests, special projects, research and retrieval of records, and stuffing envelopes for New Customer Letters, and Annual Backflow Test Forms;
Completion of converting archived documents to electronic storage by out sourcing (Cash Receipts 2000-2013) ;
Completion of converting archived documents to electronic storage by staff (1998 Job Cost Files, 2014 Completed Capital Projects, and Terminated Employee Files);
Provided set-up for approximately 336 meetings;
Successfully planned and organized the District’s Annual Employee Appreciation Luncheon and the District’s Annual Employee Recognition Banquet; and
Shredding and recycling program successfully recycling nearly 9,000 pounds of paper.
STRATEGIC
OBJECTIVE FISCAL YEAR 2016-17 INITIATIVES
GP3.S10.O11
Ensure that regular work duties are completed in a timely manner with very few errors
Provide administrative support to all Divisions within the District, including copying and assembly of Board and Committee packages, mail services, general copying; typing and clerical requests; set-up and clean-up for District related meetings, including requests for breakfasts and luncheons; telephone and receptionist support and stuffing envelopes for New Customer Letters, and Annual Backflow Test Forms.
Continue with prepping, scanning, or indexing of new documents, and/or converting archived documents to electronic storage three days per week.
Continue to destroy records that have reached their legal required retention period.
123

Fiscal Year 2016-2017 Operating Budget Rancho California Water District Divisional Plans
PERFORMANCE MEASUREMENT INDICATORS
ACTIVITY
CRITERIA
ACTUAL 14/15
BUDGET 15/16
TARGET 16/17
Timely answering of all incoming calls
Answer incoming calls within three rings
100% 100% 100%
Open, sort, and distribute incoming mail
Accurately open and deliver the daily incoming mail prior to the afternoon in-house mail delivery
100% 100% 100%
Timely process outgoing mail
Copy and prepare documents for outgoing mail, ensuring the correct address and postage is affixed and ready for postal pick-up by 4:00 p.m.
100% 100% 100%
Provide timely administrative and clerical support
Complete all support requests prior to deadline
100% 100% 100%
Electronic storage of documents
Each Office Assistant prep, scan, or index new documents, and/or convert archived documents to electronic storage three days a week
98% 95% 85%
Scan, index and e-mail incoming correspondence to staff
Complete by end of each business day
96% 95% 98%
Scan, index and e-mail outgoing correspondence to staff
Complete by end of each business day
99% 98% 98%
124

Fiscal Year 2016-2017 Operating Budget Rancho California Water District Divisional Plans
Customer Service
Customer Service is responsible for the maintenance and use of an efficient and accurate utility billing system, which provides for the timely collection of the District’s water and sewer service revenues. Equally important is providing first class service to customers over the phone and in person at our District office. Customer Service is also responsible for the collection of meter read data to help ensure that all customers are billed timely and accurately. This function is also responsible for daily meter services such as turning on and off meters, placing door hangers, and responding to customer requests. All activities within the Customer Service department are performed emphasizing a “customer comes first” philosophy.
ACCOMPLISHMENTS FISCAL YEAR 2015-16
Continued successful operations of the Cayenta Customer Information System;
Utilization of the Cayenta Customer Information System to improve interdepartmental communications and streamline processes;
Utilizing the Mobile Service Order System for accuracy and communications;
Successful utilization of the Itron Fixed Network System for reading accuracy; leak indicators, and customer assistance;
Successfully implemented mandatory Drought billing structure and rate changes;
Provided a Drought “MyWaterTracker” application for customers to assist in their budget understanding and conservation;
Answered average of over 9,100 customer calls per month; and
Provided job specific knowledge training for customer service staff.
STRATEGIC
OBJECTIVE FISCAL YEAR 2016-17 INITIATIVES
GP3.S10.O3
Continue to develop additional processes and resources from Cayenta to streamline production and continue the growth and accuracy of the system.
Continue to reduce the percentage of collection agency write-off amounts.
GP3.S12.O6 Continue to provide job specific training for customer service staff.
GP4.S1.O14 Explore additional opportunities in Cayenta to utilize interdepartmental communications.
GP3.S10.O3 Make AMR fixed network meter read data available to customers online.
Utilize the Mobile Service Order System to create the highest quality of accuracy. GP4.S2.O1
GP5.S2.O1 Explore additional options for customer correspondence interactions.
125

Fiscal Year 2016-2017 Operating Budget Rancho California Water District Divisional Plans
PERFORMANCE MEASUREMENT INDICATORS
ACTIVITY
CRITERIA
ACTUAL 14/15
BUDGET 15/16
TARGET 16/17
Timely billing of customer accounts
Bills sent on Wednesday 91% 75% 75%
Timely response to customer calls
Average time to answer incoming phone calls
52.5 Seconds
Less than 60 Seconds
Less than 60 Seconds
Timely response to customer phone calls
Number of abandoned calls 4.3% Less than
5% Less than
5%
Collection of accounts receivable Outstanding receivables over 60 days
4.3% 4% 4%
Efficient and alternative payment options
Customers utilizing some form of electric payment
57% 50% 50%
Responding to customer service request
Complete request in one day 100% 98.5% 98.5%
Timely completion of door hanger and delinquent shut-offs
Complete same day 100% 98% 98%
126

Fiscal Year 2016-2017 Operating Budget Rancho California Water District Divisional Plans
Information Technology
Information Systems is responsible for maintaining a reliable and capable District-wide Local Area Network (LAN) that allows for effective and efficient integration of computer technologies into the daily business practices of the District. This IT function is also responsible for managing, maintaining, and administering the District’s key servers, including:
Financial Information System (FIS)
Geographic Information System (GIS)
Microsoft Mail/Exchange
Imaging System
SAN Storage System
Disaster Recovery/Backup/Business Continuity System
Network Firewall/Security/Content Filter System
Web/E-commerce/FTP Servers
Telecommunications Servers
VoIP Phone System
Interactive Voice Response and Automated Call Distribution Systems
Maintain Datacenter Facility (Headquarters)
Maintain Backup Datacenter Facility (Disaster Recovery)
Nine Intermediate Distribution Frames (IDF)
Two Main Distribution Frames (MDF)
Two Extension Networks
Multiple Internal Wireless Networks
External Wireless Mesh Networks
ACCOMPLISHMENTS FISCAL YEAR 2015-16
Replaced unsupported phone system with new VolP ShoreTel system;
Established relationship with Quick Ship DR service vendor;
Upgraded all SQL servers to SQL 2014 and added one more server to cluster;
Upgraded all internal District website capabilities;
Responded to and resolved over 1,500+ Pipeline generated help desk tickets;
Processed over 5 million email and blocked 1.5 million SPAM emails; and
Blocked over 2 billion intrusion attempts and over 2 billion viruses.
127

Fiscal Year 2016-2017 Operating Budget Rancho California Water District Divisional Plans
STRATEGIC
OBJECTIVE FISCAL YEAR 2016-17 INITIATIVES
GP3.S1.O5 Establish quick ship Disaster Recovery service relationship to enhance DR position.
Replace aging unsupported phone system with new user-friendly system. GP5.S2.O3
GP3.S10.O15 Increase utilization of Virtual Infrastructure and storage that is more efficient.
PERFORMANCE MEASUREMENT INDICATORS
ACTIVITY
CRITERIA
ACTUAL 14/15
BUDGET 15/16
TARGET 16/17
Reliable and dependable network performance
Number of hours down time during business hours
0 53 hours annually
53 Minutes annually (99.99%)
Timely resolution to user problems
Resolve problems within 24 hours 99% 80% 75%
Maintain internal customer service
Percentage of favorable responses to internal customer satisfaction survey
91% 90% 80%
128

Fiscal Year 2016-2017 Operating Budget Rancho California Water District Divisional Plans
Geographical Information Systems
Geographical Information Systems (GIS) is responsible for providing enhanced access to high quality geographic information that increases the effectiveness of business operations through information and process integration crossing organization units in pursuit of better public service.
ACCOMPLISHMENTS FISCAL YEAR 2015-16
Assisted the Planning Department with mapping and analysis requests for various projects;
Maintained GIS software, applications and customer tools;
Maintained digital map to support Customer Service Dept. in assisting customers with identifying District serving their property address;
Continued to assist the Operations and Maintenance with AMR project by providing maps and updating ArcGIS Server web application to track progress;
Continued to produced maps and provide technical support for District personnel;
Continued with the GIS-based as-built update: use field verification data to flag as-built drawings to be updated (information to be used by Eng. Dept. to update records drawings);
Provided Geo-Viewer support and training throughout the District;
Continued to provide assistance for GPS-based Corrosion Control Program – undergoing in Operations and Maintenance department;
Continued to assist Operations and Maintenance with the Valve Tie Mapping Program;
Updated Geo-Viewer for desktops and laptops allowing access of GIS information in the field;
Continued support for main ArcGIS Server web application (RCWD GIS Viewer Online, Footprint Editor);
Continued support for CMMS mobile data collection workflow ;
Provided GIS assistance for implementing a GIS-based CMMS field solution;
Maintained GIS database replication solution (water, sewer, county, address);
Maintained water, sewer, address and street database;
Continued effort to cleanup GIS Meter location database and improve integration with CIS;
Assisted Operations and Maintenance Dept. with the Strix Network implementation;
Assisted with reviewing and calculating annual tax charges;
Completed implementation of new GIS viewer;
Assisted Planning Dept. with AG re-certification project;
Assisted with CIS implementation: mapping component design and integration for service number to APN association, County Property Information Viewer/Editor;
Implemented mobile solution for AG certification;
Provided assistance with RCWD Real Estate Management; and
Designed and implemented solution for water books conversion to GIS.
129

Fiscal Year 2016-2017 Operating Budget Rancho California Water District Divisional Plans
STRATEGIC
OBJECTIVE FISCAL YEAR 2016-17 INITIATIVES
GP3.S10.O4
Continue to operate, develop, and maintain the District’s Geographic Information System including updated and adding new data sources.
Continue to assist in the integration of District data sources through participation in the IT Steering Committee, Web Development Sub-Team, IT Training Sub-Team, ERP Sub-Team, and Needs Assessment Implementation Team.
Improve GIS information dissemination throughout the District. Promote integration of GIS with other business systems (ERP/CMMS/CIS).
Continue to assist with tax roll calculations.
Reconcile meter database using CIS data and GPS information.
Continue to provide support for improving spatial component of GIS data using sub-meter & sub-foot GPS units.
Complete conversion of water books and contracts to GIS.
Create Geocortex-based solution for accessing water fees and contracts.
Continue efforts to realign GIS facilities data (increase accuracy) to better support field operations and data analysis.
PERFORMANCE MEASUREMENT INDICATORS
ACTIVITY
CRITERIA
ACTUAL 14/15
BUDGET 15/16
TARGET
16/17
Respond to customer service requests for maps
Maps produced within 48 hours of request
100% 90% 90%
Reliable GIS system software performance
Resolve problems within 24 hours of notification
100% 90% 90%
130

Fiscal Year 2016-2017 Operating Budget Rancho California Water District Divisional Plans
Water Use Efficiency Activities MISSION STATEMENT
The mission of the Water Use Efficiency Department is to achieve measurable water conservation, efficiency, and sustainability through the implementation of core best management practices and the exploration of innovative programs and methodologies.
ACCOMPLISHMENTS FISCAL YEAR 2015-16
Helped customers navigate the changes to the tiered rate structure resulting from the State Water Board’s Emergency Regulations;
Utilized results from the Blueprint for Water Use Efficiency for exploring ideas for new progress;
Maximized funding opportunities through WMWD and EMWD Agency Funded Programs;
Initiated a voucher program for commercial urinal flush valves and recirculating hot water heater pumps ;
Continued partnership on Free Sprinkler Nozzle programs;
Provided education outreach to HOA groups, through Saturday neighborhood onsite workshops;
Increased the number of Residential Water Use Efficiency Evaluations conducted by targeting high water consumption customers ;
Created a Virtual Technical Assistance Center for Agricultural Customers (i.e. a new Ag website);
Implemented a Vineyard Demonstration Project focusing on Regulated Deficit Irrigation for wine grape vineyards;
Re-distributed soil monitoring systems installed at avocado growing operations as part of Enhanced Ag Efficiency Program to growers who could better utilize them;
Provided educational Water Use Efficiency Workshops to property management companies, commercial, industrial, and institutional business in the Temecula region to increase water awareness in their industry; and
Completed implementation of recycled water retrofits for three HOA common areas.
131

Fiscal Year 2016-2017 Operating Budget Rancho California Water District Divisional Plans
STRATEGIC
OBJECTIVE(S) FISCAL YEAR 2016-17 INITIATIVES
GP4.S1.O1-14
Ensure ongoing compliance with SBX7-7 through implementation of Critical and Conditional Efficient Water Management Practices for agriculture.
Ensure ongoing compliance with SBX7-7 through implementation of Best Management Practices for M&I use.
Assist with achieving compliance with the State’s Emergency Regulations through implementation of effective conservation programs.
Implement Water Use Efficiency Programs focusing on providing technical assistance and financial incentives to District customers.
Facilitate the implementation of research and demonstration projects that encourage the adoption of best management practices and new water use efficiency technologies among the District’s customers.
Implement Programs that encourage the conversion of potable irrigation systems at commercial, institutional and HOA owned properties to recycled water irrigation systems.
Explore methodologies for allocating water to commercial customers that encourages efficiency and does not hinder the growth of local business.
Conduct water use efficiency evaluations for customers of all classes. Continue irrigation system auditing/financial incentive program for Ag customers.
Continue to enhance the Virtual Technical Assistance Center for agricultural customers.
Continue to develop RCWD’s Smart Water Solution Rebate webpage in order to provide a streamlined approach for customers to participate in rebate programs.
Continue to provide educational outreach to customers of all classes.
Continue to implement the results of the District’s Blueprint for Water Use Efficiency. Track compliance with 20% reduction in urban per capital use by 2020.
Maintain a partnership with the cities of Temecula and Murrieta – Pursue sustainability initiatives where practical including recycled water retrofit projects on municipal properties with the use of available grant funding.
Participate in regional water issues through attendance and participation in regional water meetings, groups, committees and forums.
Maintain collaborative relationship with WMWD and EMWD through participation in Water Use Advisory and other Committee meetings.
132

Fiscal Year 2016-2017 Operating Budget Rancho California Water District Divisional Plans
PERFORMANCE MEASUREMENT INDICATORS
ACTIVITY
CRITERIA
ACTUAL 14/15
BUDGET 15/16
TARGET 16/17
Develop and Implement Conservation & Water Use Efficiency Program for Residential, Dedicated Landscape & multi-family Customers
Develop & Implement programs as per RCWD coverage goals
n/a n/a 100% coverage
Develop and Implement Conservation & Water Use Efficiency programs for Agricultural Customers
Develop & Implement programs as per RCWD coverage goals
n/a n/a 100% coverage
Develop and Implement Conservation & Water Use Efficiency programs for Commercial Customers
Develop & Implement programs as per RCWD coverage goals
n/a n/a 100% coverage
133

Fiscal Year 2016-2017 Operating Budget Rancho California Water District Divisional Plans
Finance Division MISSION STATEMENT
To provide innovative, proactive, and strategic financial direction and support to Rancho California Water District’s Board of Directors, management and employees in an effort to achieve low, stable water and wastewater rates and charges. We are committed to maintaining the District’s strong financial position, efficiently managing the District’s financial resources, and ensuring that adequate financial controls are in place and monitored to communicate and report accurate financial results and to protect the District’s assets. The Finance Division will accomplish this mission while maintaining a commitment to providing quality customer service.
The Finance Division provides the accounting, auditing, investing and debt management functions required, showing clearly and accurately at all times, the financial status of the District.
PERSONNEL REQUIREMENTS (FTE)
ACTUAL FY 2014-15
ACTUAL FY 2015-16
BUDGET FY 2016-17
PROJECTED FY 2017-18
CFO/Treasurer 1 0 0 0 Director of Finance 0 1 1 1 Sr. Administrative Assistant 1 1 1 1 Finance Analyst 1 1 1 1 Budget/Debt Administrator 1 1 1 1 Accounting Manager 1 1 1 1 Accountant 1 1 2 2 Sr. Accounting Analyst 2 3 2 2 Accounting Clerk 2 1 1 1 Warehouse Technician 1 0 0 0 Purchasing Agent 2 2 2 2 Purchasing Warehouse Supervisor 0 1 1 1 IT /Customer Service Manager 1 1 0 0 Customer Service Supervisor 1 1 0 0 Customer Service Analyst 1 1 0 0 Customer Service Rep 9 9 0 0 Data Center Operations Supv. 1 1 0 0 Systems Administrator 1 1 0 0 ERP Administrator 1 1 0 0 GIS Coordinator 1 1 0 0
Total 30 29 13 13
DIVISION SUMMARY
Category Actual
FY 2014-15 Budget
FY 2015-16 Budget
FY 2016-17
Labor $2,632,730 $2,694,840 $1,237,83740 Materials 92,966 115,075 65,586 Outside Services 1,120,364 2,014,008 645,145 Funded Staffing Level 30 29 13
134

Fiscal Year 2016-2017 Operating Budget Rancho California Water District Divisional Plans
CRITICAL SUCCESS FACTORS
The Finance Division has identified the following objectives it considers critical to the overall success of the Division and the District for fiscal year 2016-2017:
Maintain or improve the District’s bond rating to ensure lowest overall borrowing cost for future bond issuance.
Complete the Operating and Non-Operating Budgets for the 2016-2017 fiscal year with complete committee review and recommendation at the April 14, 2016 Board of Directors workshop and adoption at the June 9, 2016 public hearing with all rates, fees and charges taking effect July 1, 2016.
Complete all internal financial records for the year ended June 30, 2016 by July 31, 2016 to allow the District’s Certified Public Accountants to perform and complete the independent audit of the District and its taxing entities for presentation to the Board of Directors no later than its October 2016 Board Meeting. The results of the audit must contain an unqualified opinion, have no reportable conditions, and limit management letter comments to immaterial items.
Complete the Comprehensive Annual Financial Report for the fiscal year ended June 30, 2016 with Committee review in November 2016. The quality of the report should be of a standard that it receives the Certificate of Achievement awarded by the Government Finance Officers Association.
135

Fiscal Year 2016-2017 Operating Budget Rancho California Water District Divisional Plans
Accounting
Accounting is responsible for creating and maintaining a reporting structure to accurately and expeditiously communicate pertinent financial data to its customers. Accounting is also responsible for ensuring efficient use and protection of District assets. This area also maintains, monitors, and enforces a system of internal controls.
ACCOMPLISHMENTS FISCAL YEAR 2015-16
Completed Comprehensive Annual Financial Report and received Government Finance Officers Association (GFOA) award for excellence in financial reporting;
Completed Audit of 2014-2015 financial records with an unqualified opinion;
Completed actuarial report for the Rancho California Water District’s Retirement Medical Benefits Plan;
Participated in formation of the JPA and account setup for the Santa Rosa Regional Resources Authority;
Implemented new GASB requirements on financial reporting;
Implemented new informational reporting of employee medical benefits per the Affordable Care Act requirements; and
Revised and implemented Stand-by payroll reporting.
STRATEGIC
OBJECTIVE FISCAL YEAR 2016-17 INITIATIVES
GP3.S4.O2 Complete successful audits of grant programs from both federal requirements and issuing agencies.
GP3.S10.O1 Provide timely and accurate financial reporting, including the CAFR
Obtain unqualified audit opinion.
Complete successful and timely audit with new independent auditors.
GP3.S12.O6 Continue cross training of key tasks and functions within the accounting department.
Perform monthly team building exercises with accounting department staff.
PERFORMANCE MEASUREMENT INDICATORS
ACTIVITY
CRITERIA
ACTUAL 14/15
BUDGET 15/16
TARGET 16/17
Timely closing of fiscal year accounting records
Approval of annual audit report
Met September BOD Mtg.
September BOD Mtg.
Maintain accurate accounting records in accordance w/Gov. Acctg. Standards
Number of Significant external audit findings
None None None
Timely payment of vendor invoices
Unpaid invoices over 30 days – Less than 5%
0% Less than 5% Less than 5%
Implement new GASB Pronouncements.
Any new GASB to be included in CAFR for 2015
Met August 2016 August 2017
136

Fiscal Year 2016-2017 Operating Budget Rancho California Water District Divisional Plans
Budgetary
Budgetary is responsible for overseeing and facilitating the District-wide planning, development, and compliance to an approved operating and non-operating budget plan. Additionally, this area is responsible for the rate-setting process and for monitoring departmental performances throughout the year.
ACCOMPLISHMENTS FISCAL YEAR 2015-16
Received the Government Finance Officers Association Distinguished Budget Award for 2015-2016;
Completed operating and non-operating budgets with rates effective for July 1;
Updated Long Range Financial Plan – reviewed Capital Improvements, Capital Replacements, Planned Correctives, and Acquisition Outlays for funding availability;
Revised and updated current Fee for Service Schedule;
Reviewed Divisional Accounting Requirements; and
Implemented Effective Utility Management concepts.
STRATEGIC
OBJECTIVE FISCAL YEAR 2016-17 INITIATIVES
GP3.S5.O6 Achieve cash reserve and revenue levels as identified in cash reserve policy.
Investigate reserve and revenue protection strategies.
GP3.S5.O9 Update Long Range Financial Plan
PERFORMANCE MEASUREMENT INDICATORS
ACTIVITY
CRITERIA
ACTUAL 14/15
BUDGET 15/16
TARGET 16/17
Timely completion and approval of annual budget
Actual effective date of new rates
Goal Met July 1 July 1
Review and monitor operating results vs. budgets
Management budget review meetings held quarterly
Goal Met 100% 100%
Successfully conduct Budget Workshop
Conduct workshop on time Goal Met 100% 100%
Update Fee for Service study Completion and approval of results
Completed March 2016 March 2017
137

Fiscal Year 2016-2017 Operating Budget Rancho California Water District Divisional Plans
Treasury
The treasury function is responsible for assuring that all investments of the District funds are made within the Board of Directors’ adopted investment policy, while at all times adhering to the Prudent Investor Standard. The primary objective, in priority order, of investment activities shall be safety, liquidity, and return. Treasury is also responsible for managing the District’s debt. The primary debt objectives are to minimize long term, debt borrowing cost and risk, and to manage and utilize the bonding capacity of the District so that future capital facility requirements can be funded as needed.
ACCOMPLISHMENTS FISCAL YEAR 2015-16
Achieved re-affirmed credit ratings;
Updated the Retirement Medical Benefit Trust Investment Policy; and
Initiated a one-time contribution to the RCWD Retirement Medical Benefit Trust to increase funded ratio to 80%.
STRATEGIC
OBJECTIVE FISCAL YEAR 2016-17 INITIATIVES
GP3.S5.O10-11 Administer annual update to financial policies. Administer annual credit rating review process.
Complete a pension funding study.
PERFORMANCE MEASUREMENT INDICATORS
ACTIVITY
CRITERIA
ACTUAL 14/15
BUDGET 15/16
TARGET 16/17
Maintain credit worthiness of the District
Bond ratings received by rating agencies
Complete continuing disclosure reporting requirements
Number of non-compliance reportable events
Met
AA or Better
0
Nov
AA or Better
0
Nov
AA or Better
0
Review and maintain adequate bonding capacity
Updated long range financial plan Annual Annual Annual
Investment portfolio performance
Compliance with District approved investment policy
Investment return compared to established benchmarks for each investment pool.
100%
100%
100%
95%
100%
95%
138

Fiscal Year 2016-2017 Operating Budget Rancho California Water District Divisional Plans
Real Estate Management
Consistent with the District’s strategic objective to maximize the benefits of its real estate holdings, Real Estate Management is responsible for overseeing, managing, and administrating the District’s real estate holdings. These business and asset management functions provide full levels of services to acquire, utilize, maintain, dispose, and manage District properties.
ACCOMPLISHMENTS FISCAL YEAR 2015-16
Successfully extended the lease of a portion of Diaz Road facility for three years (w/Index Fresh); and
Commenced negotiations to acquire reservoir site.
STRATEGIC
OBJECTIVE FISCAL YEAR 2016-17 INITIATIVES
GP3.S3.O2-3 Pursue acquisition of property for future 1305 and 1610 zone reservoir sites.
Investigate and acquire potential well sites as identified in the integrated resource plan.
PERFORMANCE MEASUREMENT INDICATORS
ACTIVITY
CRITERIA
ACTUAL 14/15
BUDGET 15/16
TARGET 16/17
Negotiate purchase of reservoir sites
Property acquired
# of Sites acquired In Process One Complete In Review
Diaz Road Tenant Tenant in place Maintain Maintain Maintain
139

Fiscal Year 2016-2017 Operating Budget Rancho California Water District Divisional Plans
Grants Acquisition and Management Activities
ACCOMPLISHMENTS FISCAL YEAR 2015-16
Tracked and reported monthly on local, state, and federal funding opportunities, funding applications, and funding awards;
Complied with the District’s Grant Management Procedures to ensure consistency with existing District policies, auditing standards, and the requirements for grant accountability in grant agreements;
Prepared lobbying documents, including grant funding awards and needs, for use in meetings with federal agencies;
Attended grant workshops and participated in numerous meetings with funding agencies to gain information, build relationships, and inform funding agencies of RCWD project benefits, including with the U.S. Bureau of Reclamation and California Department of Water Resources;
Applied for two Department of Water Resources grants, including one in partnership with the City of Temecula; and
Successfully awarded two Department of Water Resources grants, including one USMW IRWM interregional project with the Santa Ana IRWM Region under Proposition 84.
STRATEGIC
OBJECTIVE FISCAL YEAR 2016-17 INITIATIVES
GP3.S4.O1-5
Conduct Grant and Funding Acquisition – Pursue federal, state, and local grants and funding from such agencies as the U.S. Bureau of Reclamation (USBR), U.S. Geological Survey (USGS), California Department of Water Resources (DWR), State Water Resources Control Board (SWRCB), California Department of Food and Agriculture (CDFA), California State Parks, and Metropolitan Water District of Southern California (MWD).
Convene Grants Oversight Team periodically to identify eligible projects for identified funding and confirm application for funding opportunities.
Establish a qualified IRWM Project List from USWM IRWM Plan and prepare/submit a Proposition 84 IRWM Implementation Grant Round 3 application.
Prepare for Proposition 1 funding opportunities through tracking of State agency funding programs, including development of Proposition 1 IRWM Grant Guidelines.
Execute state and federal funding agreements, and manage reporting requirements including progress reports, invoicing, and deliverables for each agreement.
Follow Grant Management Procedures.
140

Fiscal Year 2016-2017 Operating Budget Rancho California Water District Divisional Plans
PERFORMANCE MEASUREMENT INDICATORS
ACTIVITY
CRITERIA
ACTUAL 14/15
BUDGET 15/16
TARGET 16/17
Conduct Effective Grant Acquisition Outreach
Attend grant workshops, prepare project documents, participate in meetings with funding agencies to gain information, inform of RCWD project benefits, and build relationships
Met Ongoing Ongoing
Conduct Acquisition of Local Funding
Track and apply for funding opportunities, and successfully receive grant awards from Metropolitan and other local sources
Met Ongoing Ongoing as
funding available
Conduct Acquisition of State Funding
Track and apply for funding opportunities, and successfully receive grant and funding awards from DWR, SWRCB, and other State sources
Met Ongoing Ongoing as
funding available
Conduct Acquisition of Federal Funding
Track and apply for funding opportunities,& successfully receive grant and funding awards from USBR, USGS, and other Federal sources
Met Ongoing Ongoing as
funding available
Submit a DWR IRWM Implementation Grant Round 3 Application for the USMWD IRWM Region
Establish qualified project list from USMW IRWM Plan and prepare a IRWM Implementation Grant Round 3 Application
On Track Begin
Summer 2015
Submit Spring 2016
Prepare for Proposition 1 Funding Opportunities
Track State agency funding programs, including development of Proposition 1 IRWM Grant Guidelines
Met On Track Ongoing
Convene and Update Grants Oversight Team
Periodically update the Grants Oversight Team on grant opportunities and acquisition to seek input on potential projects for funding pursuits
Met Ongoing Ongoing
Manage Requirements of State and Federal Grant Agreements
Prepare and submit quarterly/semi-annual progress reports, invoices, & deliverables to funding agencies
Met On Track Ongoing
141

Fiscal Year 2016-2017 Operating Budget Rancho California Water District Divisional Plans
Purchasing
Purchasing is responsible for the procurement of material and services in an expeditious and cost effective manner to ensure continued operation and maintenance requirements for both external and internal customers.
ACCOMPLISHMENTS FISCAL YEAR 2015-16
Updated cell phones users and inactivate air cards as needed
Finalized Purchasing Procedure Manual;
Created new contract for services, as well as new Terms and Conditions for Service Purchase Orders;
Continue to update insurance tracking with EBIX; and
Streamlined Sole Source Documentation process.
STRATEGIC
OBJECTIVE FISCAL YEAR 2016-17 INITIATIVES
GP3.S10.O1
Standardize purchase order follow up process.
Implement contract management process.
Continue to refine paperless process.
Continue to purchase material to maintain inventory levels.
Search out a credit card program with enhanced benefits.
GP3.S10.O9 Initiate planning and communication with other departments to provide cost effective and timely purchases.
PERFORMANCE MEASUREMENT INDICATORS
ACTIVITY
CRITERIA
ACTUAL 14/15
BUDGET 15/16
TARGET 16/17
Process requisitions in a timely manner
Process all requisitions within 1 business day of receiving in purchasing inbox
n/a 100% 100%
Process all stock material needs in a timely manner
Process all purchases for material requirements indicated by the Vendor Reorder Advice Report within 2 business days
n/a 100% 100%
Create Requested Contracts in a timely manner
Process contract in 2 business days after receipt of necessary documentation
n/a 100% 100%
142

Fiscal Year 2016-2017 Operating Budget Rancho California Water District Divisional Plans
Warehouse
The Warehouse is responsible for setting and maintaining a responsive inventory control system to ensure availability of material required for maintenance, operation, and repairs.
ACCOMPLISHMENTS FISCAL YEAR 2015-16
Maintained adequate inventory level;
Less than 1 hour turn around on 90% of requisitions;
Received and shelved inventory items in a timely manner;
Placed inventory replenishment orders in timely manner;
100% accuracy on independent audited inventory count;
Continue to refine process for disposal of miscellaneous items through internet sources; and
Continue to assist Meter Department with Itron antenna change out.
STRATEGIC
OBJECTIVE FISCAL YEAR 2016-17 INITIATIVES
GP3.S10.O1 Evaluate and correct hi/low quantities. Continue e-catalog process.
Standardize inventory purchase follow-up process.
GP3.S10.O9 Initiate communication with other departments on needs to provide appropriate material requirements.
PERFORMANCE MEASUREMENT INDICATORS
ACTIVITY
CRITERIA
ACTUAL 14/15
BUDGET
15/16 TARGET
16/17
Cycle count in a timely manner Prepare and complete 1 spot count per week
n/a 100% 100%
Material Disbursement in a timely manner
All material received prior to 3pm to be delivered or shelved daily
n/a 100% 100%
Inventory requisitions All requisitions received prior to 3 pm to be pulled for staging or delivered
n/a 100% 100%
143

Fiscal Year 2016-2017 Operating Budget Rancho California Water District Divisional Plans
Engineering Division
MISSION STATEMENT
To develop, implement and manage various programs to ensure the delivery of reliable, high-quality water, wastewater, and reclamation services to its customers and communities in a prudent and sustainable manner.
The Engineering Division’s mission is accomplished by providing high quality and responsive engineering services to internal and external customers through innovative and highly skilled professional and technical staff. Services include facility planning, design, project management, inspection, and coordination of District-led and developer-led facility work. The Engineering Division also satisfies the District’s mission by providing engineering leadership and support for all District functions.
PERSONNEL REQUIREMENTS (FTE)
ACTUAL FY 2014-15
ACTUAL FY 2015-16
BUDGET FY 2016-17
PROJECTED FY 2017-18
Chief Engineer 1 1 1 1
Engineering Planning Manager 1 0 0 0
Water Resource Manager 0 1 1 1
Sr. Administrative Assistant 1 1 1 1
Office Assistant 1 1 1 1
Construction Contracts Manager 1 1 1 1
Contracts Administrator 1 1 1 1
Construction Inspector Supervisor 1 1 1 1
Sr. Construction Inspector 3 2 2 2
Civil Engineer 3 4 4 4
Associate Engineer - Design 1 1 1 1
GIS Analyst 1 1 1 1
Engineering Manager 1 1 1 1
Engineering Services Supervisor 1 1 1 1
Engineering Services Representative 3 3 3 3
Engineering Project Coordinator 1 0 0 0
Engineering Aide 1 0 0 0
Total 22 20 20 20
DIVISION SUMMARY
Category Actual
FY 2014-15 Budget
FY 2015-16 Budget
FY 2016-17
Labor $1,779,294 $1,429,506 $1,527,834 Materials 34,474 47,000 49,000 Outside Services 212,684 97,700 58,000 Funded Staffing Level 22 20 20
144

Fiscal Year 2016-2017 Operating Budget Rancho California Water District Divisional Plans
CRITICAL SUCCESS FACTORS
The Engineering Division has identified the following objectives it considers critical to the overall success of the Division and the District for fiscal year 2016-2017:
The timely completion of the report packages for the Engineering and Operations Committee meeting and Board of Directors meetings.
Preparation, approval, and implementation of the fiscal year 2016-2017 Corrective Capital Replacement, and Capital Improvement Programs.
Preparation and approval of the 5-year Capital Improvement Plan.
Implementation and completion of assigned Strategic Plan activities, particularly the groundwater management strategy, brine-management strategy, Santa Rosa Water Reclamation Facility strategy, water resource and capital facility strategy.
Provide assistance with the implementation of the Customer Information System and Document Management System. Included in this item is the further refinement and analysis of workflow processes within the Engineering Division and implementation of knowledge management practices.
The timely review of developer plan check submittals and professional and courteous customer engineering support.
Providing engineering leadership and support for all District functions and legal activities.
145

Fiscal Year 2016-2017 Operating Budget Rancho California Water District Divisional Plans
Engineering Administration
Engineering Administration is responsible for providing the required management, support, and leadership to ensure the Engineering Division’s objectives are accomplished. General administration is accomplished through records management, correspondence processing, legal activity support, supplementary administrative support, and coordination with other District Divisions, and providing support to the Board of Director’s Engineering and Operations Committee.
ACCOMPLISHMENTS FISCAL YEAR 2015-16
Completed 100% on-time all monthly Engineering and Operations Committee meeting package preparation and corresponding minutes;
Completed 100% on-time over 400 individual pieces of correspondence and 27 contract specifications and consulting agreements;
Exceeded completion percentage for ACWA/JPIA’s Professional Development Program: Supervisor Basics, Human Resources, and Operations (program to be completed within 4 years) currently 58 percent; target for FY 2015-2016 is 25 percent (Office Assistant-Engineering);
Continuing Water Technology classes through Mt. San Jacinto College; achieved state certification in 2015: Grade D2 Water Distribution Operator and Grade T2 Water Treatment Operator (Senior Administrative Assistant and Office Assistant-Engineering);
Continued documentation support for the Engineering Division workflow process activities (knowledge management plan);
Processed continual updates to the latest version of the Water System Facility Requirements and Design Guidelines Manual for Board of Director review, as required to be included within the District’s Administrative Code;
Processed continual updates to the latest version of the Sewer System Facility Requirements and Design Guidelines Manual for Board of Director review, as required to be included within the District’s Administrative Code
Provided posting of the updated Facility Requirements and Design Guidelines, and Standard Specifications and Drawings Manual to the District’s website;
Maintained update log documents to track changes to the Standard Specifications and Drawings Manual front-end document, General Provisions, Special Provisions, and Technical Provisions. Update logs as incorporated into appropriate sections for the Standard Specifications and Drawings Manual and posted to the District’s website for clarification of all revisions; and
Maintained and updated the master document list for the Engineering Division library.
146

Fiscal Year 2016-2017 Operating Budget Rancho California Water District Divisional Plans
STRATEGIC
OBJECTIVE FISCAL YEAR 2016-17 INITIATIVES
GP5.S2.O1 Provide prompt responses and cost effective customer service
GP5.S4.O1 Provide staff support for Board of Directors’ meetings to engage community
PERFORMANCE MEASUREMENT INDICATORS
ACTIVITY
CRITERIA
ACTUAL 14/15
BUDGET 15/16
TARGET 16/17
Complete Engineering and Operations Committee meeting packages and Board meeting write-ups
Completed within monthly scheduled deadlines
100% 100% 100%
Prepare and complete transcription of Engineering and Operations Committee meeting minutes
Within 30 days of subject meeting 100% 100% 100%
Provide timely response to all requests for finalization of correspondence, agreements, specifications, and miscellaneous tasks assigned on a daily basis
Within one day of receipt 100% 100% 100%
Participation in ACWA/JPIA’s Professional Development Program, Supervisor Basics
Program to be completed within 4 years (Office Assistant)
99% 58% 75%
147

Fiscal Year 2016-2017 Operating Budget Rancho California Water District Divisional Plans
Water Resources
Water Resources/Engineering Planning’s primary responsibility is for the immediate and long-range facility planning for water, water reclamation, and wastewater facilities ensuring needed facilities are available to provide reliable and sustainable services for District customers. This is accomplished by updating the facility master plans (including the sewer system management plan), developing fiscal year capital improvements/replacement programs, furthering regional and local agency coordination, assisting with regulatory compliance activities, and assisting with CEQA documentation and design of major capital improvement projects. In addition, water resources planning activities include preparing the Urban Water Management Plan, Agricultural Water Management Plan and Water Supply Assessments. GIS planning and analysis activities include data management and spatial analysis activities specifically focused for support of the Engineering Department.
ACCOMPLISHMENTS FISCAL YEAR 2015-16
Developed the fiscal year (FY) 2016-2017 Major and Minor Capital Projects included in the FY 2016-2017 Budget;
Developed the 5-Year Capital Improvement Plan for FY 2016-2017 through FY 2020-2021;
Completed Sewer System Management Plan internal audit;
Pursued initiatives with IT Department to further the District’s workflow to assure data quality and enterprise publication of agreements in GIS to include development of a Document Workflow Portal Design;
Completed the MOU for the Proposed Oceanside Outfall Optimization Agreements;
Completed the 2015 Urban Water Management Plan;
Completed the 2015 Agricultural Water Management Plan;
Completed the 2015 EPA Needs Survey;
Completed the Vail Property Guidance Document;
Assisted with various ownership issues related to the Vail Lake Properties ;
Assisted with the formation of the SRRRA Joint Powers Agency
Completed the update of the Water Facilities Master Plan including the update to the Water Resources Management Plan;
Completed the 2016 RCWD Wastewater Facilities Master Plan; and
Completed Vail Dam Seismic Structural Analysis in conjunction with the Seismic and Hydrologic Deficiency Evaluation.
148

Fiscal Year 2016-2017 Operating Budget Rancho California Water District Divisional Plans
STRATEGIC
OBJECTIVE FISCAL YEAR 2016-17 INITIATIVES
GP3.S5.O1 Continue planning work for conjunctive use at the upper VDC.
GP1.S2.O1 Continue planning analysis to increase the use of recycled water.
GP3.S5.O4 Develop annual 5-year Capital Improvement Plan.
GP1.S4.O2 Negotiate and finalize arrangements for brine disposal.
GP1.S1.O2 Track opportunities for water transfers.
GP1.S3.O1 Assist with development/implementation of Local Area Management Plan
GP3.S5.O1 Assist with development/implementation of Comprehensive Asset Management Plan
PERFORMANCE MEASUREMENT INDICATORS
ACTIVITY
CRITERIA
ACTUAL 14/15
BUDGET 15/16
TARGET
16/17
Develop proposed Capital Improvement Program projects
Fiscal Year CIP Budget approval June 2015
June 2016
June 2017
Complete assigned tasks/projects Percentage of assigned tasks/projects completed
80% 80% 90%
Completion of all assigned projects in a cost effective manner.
Percentage of actual cost compared
94% 80% 80%
149

Fiscal Year 2016-2017 Operating Budget Rancho California Water District Divisional Plans
Engineering Design
Engineering staff generates a variety of engineering deliverables and performs related services for its internal and external customers in support of capital improvement and land development projects within the District’s service area. Engineering staff ensures that new water, sewer, and recycled water facilities, and the provisions of water and/or sewer service, comply with applicable laws, ordinances, and District standards and/or policies. Activities include:
Project management of District-led major and minor capital improvement projects, to include design, preparation of construction contract documents (plans and specifications), and related coordination and specialized tasks.
Plan checking and post-construction documentation of developer-led water, sewer, and recycled water facility and service improvement projects.
Responding to inquiries for engineering and related technical information, including water availability, fire flow/hydrant location, and facility conflict evaluation and processing.
Interdepartmental coordination of District-led and developer-led facility improvement projects.
Maintaining the District’s Facility Design Requirements, as well as the Standard Specification and Standard Drawings documentation.
Providing technical support to the Engineering Planning and Engineering Services work groups.
ACCOMPLISHMENTS FISCAL YEAR 2015-16
Managed various capital improvement projects (CIP) through design and/or construction phases—project activity included:
o Santa Rosa Water Reclamation Facility upgrades/retrofits
o Reservoir recoating;
o Disinfection System Upgrades (various wells, pump stations, and reservoir sites);
o Chlorination disinfection improvements at Ace Bowen PS and Senga Doherty PS;
o Water quality improvements at Well No. 102;
o New groundwater production wells;
o Replace groundwater production wells
o 1610 PZ reservoir and supply pipeline;
o Recycled water storage pond No. 5 habitat restoration;
o 5 MW Solar Power Project;
o Water pipeline extensions/replacements;
o Anza PS expansion;
o Miscellaneous pipeline and appurtenances (facility) relocation/retrofits;
o Miscellaneous sewer system collection system repairs;
o Miscellaneous water system valve appurtenance replacement/installation;
Processed and coordinated various developer projects through the plan review/approval and construction phases;
Processed post-construction facility record documentation and GIS conversion of all completed developer and District CIP projects;
150

Fiscal Year 2016-2017 Operating Budget Rancho California Water District Divisional Plans
Performed a multitude of technical inquiries and evaluation for both internal and external customers; and
Performed and published updates to Engineering department reference documentation (Water and Sewer Facility Design Requirements, Standard Specifications, Standard Drawings, and On-site Recycled Water Irrigation Guidelines and Requirements) – Ongoing.
STRATEGIC
OBJECTIVE FISCAL YEAR 2016-17 INITIATIVES
GP1.S3.O4 Proficient and timely implementation of capital projects, especially those in support of maximizing groundwater production.
GP1.S1.O5 Process onsite recycled water retrofits in accordance with Mandatory Use Policy.
GP3.S6.O1 Evaluation and implementation of facility retrofits of the SRWRF.
GP3.S1.O1 Evaluate and explore potential water wheeling agreements with other agencies.
GP4.S5.O1
GP4.S5.02
Assist with evaluation and implementation of energy efficient systems.
Assist with evaluation and implementation of alternative energy opportunities.
GP5.S3.O1
GP5.S3.O2
Proficient and timely processing and coordination of developer led facility and service improvement projects.
PERFORMANCE MEASUREMENT INDICATORS
ACTIVITY
CRITERIA
ACTUAL 14/15
BUDGET 15/16
TARGET
16/17
Completion of all major and minor CIP projects in a prudent and cost effective manner
Percentage of actual cost compared to budgeted cost
90% Less than 110%
Less than 110%
Proficient and timely completion of developer-led facility plan checks without exceeding deposit
Published turn-around time; positive (project account) balance throughout plan check phase
92% 95% 95%
Assess/improve the accuracy and function of Engineering reference documentation
Ongoing (frequent) review and updates to documents
Met
At July and
January E&O Mtg.
At July and
January E&O Mtg.
151

Fiscal Year 2016-2017 Operating Budget Rancho California Water District Divisional Plans
Engineering Services
The Engineering Services Section’s primary responsibility is to provide engineering-related customer service to both internal and external customers of the District. Much of the customer service activity is provided to the development community through the processing and coordination of new water and sewer facilities and service installations. In support of this effort, Engineering Services staff participates in the review of rates and charges and fees for service, research for annual property assessments, and annexation processes. Specific activities include:
Process and coordinate applications for new service connections.
Process and coordinate applications for Developer Plan Check and inspection projects.
Process requests for engineering evaluation and correspondence (Water Availability, Fire Flow, Hydrant Location, etc.).
Process and track recordation of all documents with the County of Riverside.
Support the Planning Department with the Agricultural Requests for Variance and Consolidation.
Administer the Recycled Water Service Program in conjunction with Water Quality staff.
Respond to customer inquiries for engineering and other technical information.
Review all new customer questionnaires.
Assist in processing the variance requests for the new-tiered water budgets.
Assist the Engineering Department with various research and data-driven activities.
ACCOMPLISHMENTS FISCAL YEAR 2015-16
Facilitated customer notification for all scheduled water shutdowns;
Processed 150 drop in meter requests and 40 full meter requests;
Processed 100 fire hydrant construction meter requests;
Processed 10 new fire hydrant installation requests;
Processed 40 plan check requests and 25 inspection job requests;
Maintained tracking of numerous floating fire hydrant construction meters;
Continue coordination with EMWD and WMWD to verify and improve the sewer connection hookup procedures;
Identification and cleanup of incorrect APN numbers within the billing system;
Agency Agreement and Private Well Agreement GIS conversion for improved operational efficiency and staff productivity;
Processed 50 requests for first and final water/sewer clearances;
Processed 130 requests for fire hydrant location maps;
Processed 40 requests for water availability letters;
Processed 110 requests for witness fire flow letters;
Assisted Customer Service staff with the collection process;
152

Fiscal Year 2016-2017 Operating Budget Rancho California Water District Divisional Plans
Assisted Finance Department with research for annual property assessments; and
Provided frontline administration of the variance request program. This includes the following.
o Data entry of all information from the variance request forms directly into the billing system for all customer classes and calculated landscape measurements;
o Indexing all paperwork to be scanned into the customer billing records for future reference;
o Issuing the approval correspondence to the customer’s variance request;
o Using GIS, tracking of landscape areas based off variance requests; and
o Coordinated with the Contract’s Department for the field verification of accounts.
STRATEGIC
OBJECTIVE FISCAL YEAR 2016-17 INITIATIVES
GP5.S4.O1 Provide prompt responses and cost effective customer service
GP4.S1.O14 Inform RCWD customers about water issues, water rates, policies, and water efficiency assistance opportunities
PERFORMANCE MEASUREMENT INDICATORS
ACTIVITY
CRITERIA ACTUAL
14/15 BUDGET
15/16 TARGET
16/17
Timely processing of new service requests (all deposit – and fee-based applications)
Turnaround time: one week or sooner
100% 100% 100%
Timely process of incoming and outgoing Plan Checks and/or Inspection Packages
Turnaround time: two-days or sooner
100% 100% 100%
Timely process of phone call requests for information
Turnaround time: two-days or sooner
95% 95% 95%
153

Fiscal Year 2016-2017 Operating Budget Rancho California Water District Divisional Plans
Construction Contracts
Construction Contracts is responsible for administering the contracts for construction of District capital facility projects, District corrective projects, developer-provided facility projects, and community facilities district (CFD) and assessment district (AD) project programs. Construction Contracts also provides technical support for the District’s Field Services construction teams. The primary focus of this area is to ensure all facilities are constructed in accordance with District standards, thereby enhancing the ability of the facilities to provide reliable and sustainable services. To accomplish this goal, the Construction Contracts department manages the entire bid process, construction activities, safety measures, and final inspection of completed facilities.
ACCOMPLISHMENTS FISCAL YEAR 2015-16
Completed construction of the following CIP projects:
o Well No. 161 Drilling, Construction, Development, and Testing: Replacement;
o Miscellaneous water valve and appurtenance replacement/installation Santa Rosa and Ranch Divisions;
o Well 161 Medium Voltage Power Cable Extensions;
o Well 210 Replacement;
o SRWRF Dewatering Process Pump Replacement;
o Interior Recoating and Cathodic Protection for Buck Mesa Reservoir No. 1;
o Lead coating removal and exterior coating of Buck Mesa Reservoir No. 1;
o Interior Recoating and Cathodic Protection for El Prado Reservoir No. 2;
o Interior Recoating and Cathodic Protection for Buck Mesa Reservoir No. 2;
o Lead coating removal and exterior coating of Buck Mesa Reservoir No. 2;
o Well 216 Pump-to-Waste Pipeline;
o Warranty repairs for Bear Creek Sewer Pipeline Relocation;
o Exterior Coating of Vail Reservoir;
o Valve replacement and new installation projects; and
o Various city and county relation projects.
Administration and inspections of developer-constructed facilities:
o Installed 26,400 lineal feet (LF) of pipeline; and
o Installed 18 double detector checks and 95 fire hydrants.
STRATEGIC
OBJECTIVE FISCAL YEAR 2016-17 INITIATIVES
GP3.S7.O4 Provide construction contracts inspection and administration of the fiscal year 2016-2017 Facility Corrective Program
GP1.S3.O3 Provide construction contracts inspection and administration of the fiscal year 2016-2017 Capital Improvement Program
GP2.S4.O1 Provide construction contracts inspection of developer funded projects.
GP3.S4.O5 Complete revised RCWD Contracting Procedures Manual
GP5.S2.O1 Provide continued documentation support for the Engineering Division workflow process activities (knowledge management plan)
154

Fiscal Year 2016-2017 Operating Budget Rancho California Water District Divisional Plans
PERFORMANCE MEASUREMENT INDICATORS
ACTIVITY
CRITERIA ACTUAL
14/15 BUDGET
15/16 TARGET
16/17
Complete Engineering and Operations Committee status reports
Completed within monthly scheduled deadlines
100% 100% 100%
Finalize monthly progress reports Within monthly scheduled deadlines
100% 100% 100%
Timely completion of construction projects
Percentage of projects completed by scheduled date
97% 95% 95%
Prepare daily reports for each project
Submit daily reports 100% 100% 100%
Timely submission of final as-built drawings to Engineering Department
Submit within two weeks of Notice of Completion
100% 100% 100%
Construction Contract Change Orders
Change Order cost as a percentage of original Contract Amount
n/a n/a Less than
7%
155

Fiscal Year 2016-2017 Operating Budget Rancho California Water District Divisional Plans
Operations and Maintenance Division
MISSION STATEMENT
To operate and maintain the facilities and systems required to reliably deliver water, wastewater and water reclamation services to RCWD’s customers in a prudent and sustainable manner while producing high quality products and services that protect the public health.
PERSONNEL REQUIREMENTS (FTE)
ACTUAL FY 2014-15
ACTUAL FY 2015-16
BUDGET FY 2016-17
PROJECTED FY 2017-18
Dir. of Operations & Maint. 1 1 0 0 Ops & Main. Technician 1 1 1 1 Ops & Main. Assistant 1 1 1 1 Water Ops. Manager 1 1 1 1 Water System Supervisor 1 1 1 1 Water Systems Operator 4 4 3 3 Water System Operator Analyst 0 0 1 1 Field Srv. Worker – Ops I/II 3 3 3 3 Pump & Wells Foreman 0 1 1 1 Pump & Well Tech I/II 0 2 2 2 Water Quality Supervisor 1 1 1 1 Water Quality Treatment Op. 4 4 4 4 Cross Conn Ctrl Tech. Specialist 2 2 2 2 Corrosion Control Tech. 1 1 1 1 Electrical Services Supervisor 1 1 1 1 Instrument & Controls Tech. 2 3 3 3 Sr. Elec. Cont/Instrument 3 3 3 3 Asset Management Manager 0 1 1 1 Operations Systems Admin 0 1 1 1 Operations Systems Analyst 0 0 1 1 Water Reclamation Manager 1 1 1 1 Wastewater System Supervisor 1 1 0 0 Wastewater Plant Operator 5 5 4 4 Wastewater Maint. Supervisor 1 1 1 1 WW Collections Systems Op. 2 2 1 1 WW Plant Operator in Training 0 0 1 1 Plant Maintenance Technician 2 2 2 2 Operations Project Manager 1 1 0 0
Total 39 45 42 42
156

Fiscal Year 2016-2017 Operating Budget Rancho California Water District Divisional Plans
DIVISION SUMMARY
WATER:
Category Actual
FY 2014-15 Budget
FY 2015-16 Budget
FY 2016-17
Labor $2,791,425 $2,933,034 $2,802,816 Materials 425,441 743,673 570,840 Outside Services* 44,260,151 43,721,049 40,923,046 Funded Staffing Level 27 32 32 * Outside Service includes import water and energy expense
WASTEWATER:
Category Actual
FY 2014-15 Budget
FY 2015-16 Budget
FY 2016-17
Labor $981,140 $941,432 $893,647
Materials 215,304 159,785 197,050
Outside Services 1,724,777 1,836,142 2,118,290
Funded Staffing Level 12 11 10
CRITICAL SUCCESS FACTORS
The Operations Division has identified the following objectives it considers critical to the overall success of the Division and the District for fiscal year 2016-2017:
Economically provide potable, sewer and reclaimed water by meeting budgeted well production and optimizing material, outside services and operator and electrical services labor costs.
Reliably provide same services by minimizing the effects of purchased treated water and energy shortages.
Protect the public health and environment by meeting all Department of Health Services, EPA, and Regional Water Quality Control Board requirements.
157

Fiscal Year 2016-2017 Operating Budget Rancho California Water District Divisional Plans
Water Operations
Water Operations is responsible for operating the potable, recycled, and raw water systems in a manner that ensures reliable and sustainable deliveries to District customers. To accomplish this, Water Operations utilizes a Supervisor Control and Data Acquisition (SCADA) system that controls water production and flow through the District’s transmission and distribution system. Additionally, this area performs various maintenance, monitoring, and evaluations of the source of supply and transmission and distribution systems to maintain operational readiness.
ACCOMPLISHMENTS FISCAL YEAR 2015-16
Averaged 251 valves exercised per month with a three man crew plus one operator;
Continued working closely with SCE to maximize pump efficiencies with their pump test programs as well as their rebate opportunities;
Successfully coordinated District wide reservoir inspections with the District’s contracted diver with no disruption of service or customer outages;
Worked closely with the Engineering Department offering operational advice on well treatment strategies, and disinfection direction;
Upgraded the arrow boards on our valve trucks for increased safety and efficiency; and
Continue to help develop new SCADA platform providing experience to contractor to help with the integration.
STRATEGIC
OBJECTIVE FISCAL YEAR 2016-17 INITIATIVES
GP3.S7.O1 Implement, integrate, and utilize replacement CMMS: Utilize CMMS for equipment maintenance and historical record keeping.
GP4.S4.O1 Evaluate and implement energy efficient systems: Continue to utilize the SCE Pump efficiency program to determine the most efficient way to run the distribution system.
GP1.S1.O4 Assist in developing a groundwater well asset management plan.
PERFORMANCE MEASUREMENT INDICATORS
ACTIVITY
CRITERIA
ACTUAL 14/15
BUDGET 15/16
TARGET; 16/17
Support Water Quality during hazmat situations and respond to system alarms in a timely manner
Check system with 5 minutes of alarm and respond to hazmat situation within the 30-minute requirement
100% 100% 100%
Meet budgeted well production Actual well production equals budgeted amount
91% 95% 95%
Stay consistent with valve exercising/mapping
Exercise and map average of 300 valves per month
93% 100% 100%
Complete all preventative maintenance including monthly flushing activities throughout the District
Plan and execute monthly preventative maintenance and flushing activities with customer notification
83% 100% 95%
158

Fiscal Year 2016-2017 Operating Budget Rancho California Water District Divisional Plans
Corrosion Control Department
The Corrosion Control Department is responsible for providing corrosion control services for the District’s distribution system in addition to a wide range of project-oriented research and analysis of operations and maintenance projects.
ACCOMPLISHMENTS FISCAL YEAR 2015-16
Continue to correct issues relating to reservoir cathodic protection systems, which had been damaged or out of calibration, which could adversely affect the life of RCWD’s reservoirs. Staff adjusted the power output and number of anodes in the reservoirs to maintain the correct voltage in the affected reservoirs;
Completed the annual reservoir and mainline cathodic protection survey;
Implemented a reservoir maintenance strategy; and
Completed all CP maintenance and have begun to implement a new 3-year program for the CP maintenance.
STRATEGIC
OBJECTIVE FISCAL YEAR 2016-17 INITIATIVES
GP3.S7.O2 Complete all cathodic protection preventative maintenance.
GP2.S3.O1 AQMD, DEH regulatory compliance.
PERFORMANCE MEASUREMENT INDICATORS
ACTIVITY
CRITERIA
ACTUAL 14/15
BUDGET 15/16
TARGET 16/17
Evaluate existing reservoir Cathodic Protection systems
Identify condition of all Santa Rosa and Rancho reservoir cathodic protection systems
75% 100% 100%
Complete all CP preventative maintenance
By time period prescribed under maintenance schedule
75% 100% 100%
159

Fiscal Year 2016-2017 Operating Budget Rancho California Water District Divisional Plans
Electrical Services
Electrical Services’ primary responsibility is to maintain all electrical, electronic, instrumentation, associated control data networks, and SCADA systems and their networks that are used to supply water to District customers as well as systems that treat and reclaim water. This is accomplished through:
The immediate repairs to failed equipment
Routine maintenance of equipment to prevent failures, provide reliability and extend equipment life
Upgrade aging and obsolete equipment before it becomes an expensive re-occurring problem or unsupported
A secondary function of the electrical services group is to provide support to other departments as needed. This is accomplished through:
Providing information as needed, such as NEC NFPA 70E code requirements, electrical imitations and control strategy options
Plan check electrical drawings for accuracy and proper function
Inspection assistance of new electrical/instrumentation construction
Give instruction in the operation of new or upgraded devices and systems used by operators
Additionally, the electrical services group continues to revise operating systems for efficiency and ease of operation. Monitor District facilities for electrical violations and safety hazards to maintain an electrically safe environment. Continue to be aware of new and proven devices that increase reliability and cost savings.
ACCOMPLISHMENTS FISCAL YEAR 2015-16
Upgraded all field lighting fixtures to LED’s for energy savings.
Replaced obsolete PLC control panels for all booster stations.
Install emergency generator quick connects at critical pump stations.
Install transfer switch and tap box to connect emergency generator to “C” building during SCE power outages.
Installed emergency generator quick connect on headworks at treatment plant
Replaced 9 motor control centers to comply with new arc flash regulations
Automate WR34 operation according to CORMA agreement.
Added flood detectors & access door sensors for all in-ground vaults
Deploy SCADAWATCH module on Scada network to provide data for business users.
160

Fiscal Year 2016-2017 Operating Budget Rancho California Water District Divisional Plans
STRATEGIC
OBJECTIVE FISCAL YEAR 2016-17 INITIATIVES
GP3.S7.O2
Replace MCC panels that are not complaint with new arc flash regulations.
Convert remaining serial data lines to Ethernet. Calculate real time flow total in field PLC’s.
Convert well default flows to average daily flows in SCADA.
PERFORMANCE MEASUREMENT INDICATORS
ACTIVITY
CRITERIA ACTUAL
14/15 BUDGET
15/16 TARGET
16/17
Replace Nine non arc flash compliant MCC’s.
Remove old MCC and replace with compliant MCC
n/a Complete
by June 2016
100%
Wire cathodic protection signal to PLC for 20 reservoirs
Install electrical & instrumentation to bring cathodic protection signal to SCADA
n/a Complete
by June 2016
100%
Replace 15 MEB’s with network routers.
Replace MEB with router to facilitate quicker wireless network troubleshooting
n/a Complete
by June 2016
100%
Install well level probes in 12 Production wells
Install level probes to provide well level data in SCADA for operations
n/a Complete
by June 2016
100%
161

Fiscal Year 2016-2017 Operating Budget Rancho California Water District Divisional Plans
Water Quality
Water Quality is responsible for protecting the public health while ensuring the District delivers high quality water to its customers. To accomplish this, Water Quality investigates and resolves water quality issues, customer inquiries, and complaints; maintains a system of sampling; completes analysis and regulatory reporting; operates and maintains systems for disinfection; and implements and supports District projects.
ACCOMPLISHMENTS FISCAL YEAR 2015-16
Successfully met all regulatory requirements;
Achieved all compliant regulations and related reporting;
Completed all required reporting to Regional Water Quality Control Board;
Completed UCMR3 sampling requirements and reporting;
Implemented the new NPDES discharge requirements, training, and reporting;
Met all Required Recycled Compliance Inspections and Reporting;
Applied for reduced sampling for VDC Well 154;
Maintained compliance at Vail Resort water system and related reporting;
Maintained all disinfection pumps and related equipment;
Maintained compliance at Rainbow water system; and
Began Cross-Connection Control correctives at Vail Resort.
STRATEGIC
OBJECTIVE FISCAL YEAR 2016-17 INITIATIVES
GP2.S3.O1 Meet or exceed regulatory and environmental requirements.
Meet all compliant regulations and reporting to SWRCB.
Meet all compliant regulations and reporting to RWQCB.
GP2.S4.O1
Complete sampling requirements for new wells coming on line.
Convert Ace Bowen Pump Station (PS), Senga Doherty PS, Rancho CA PS, and Joaquin PS to OSG with Ammonia for improved disinfection.
Maintain Vail Resort water system compliance. Maintain Rainbow water system compliance.
GP3.S7.O1 Utilize CMMS for maintenance of related equipment.
162

Fiscal Year 2016-2017 Operating Budget Rancho California Water District Divisional Plans
PERFORMANCE MEASUREMENT INDICATORS
ACTIVITY
CRITERIA
ACTUAL 141/15
BUDGET 15/16
TARGET
16/17
Prompt reporting to the Department of Health Services
By deadline required under state regulations
100% 100% 100%
Prompt collection of water quality samples
By deadline required under state regulations
100% 100% 100%
Timely response to customer calls Return phone call within 24 hrs. or next working day
100% 100% 100%
Timely response to cross connection inspection requests
Inspection within 10 working days 99% 100% 100%
Complete all preventative maintenance
By time period prescribed under maintenance schedule
88% 100% 100%
163

Fiscal Year 2016-2017 Operating Budget Rancho California Water District Divisional Plans
Asset Management
RCWD Asset Management operates on a solid Asset Management foundation wherein services provided meet customer expectations for reliability, sustainability, and cost effectiveness, and the RCWD Asset Management Program is a best practice model for other areas agencies to follow. Asset Management supports RCWD’s objective to ensure that people, processes, and technology work seamlessly together to optimize ratepayer investments in District assets.
ACCOMPLISHMENTS FISCAL YEAR 2015-16
Developed Fiscal Year (FY) 2015-2016 Major and Minor Capital Projects included in the FY 2015-2016 Budget;
Developed the 5-Year Capital Improvement Plan for FY 2015-2016 through FY 2019-2020;
Completed Asset Management Plan Framework, Asset Management Plan Template, Asset Management Plan for Wells to include populated asset risk tool with well asset information, identification of critical well assets, completed two business case evaluations for capital and maintenance needs, and populated CIP prioritization tool with criteria aligned to RCWD values and goals that resulted in a prioritized CIP project list for FY 2016-2017 Budget and the 5-Year Capital Improvement Plan for FY 2016-2017 through FY 2020-2021 ;
Secured grant funding for Santa Margarita River Watershed CWRMA Groundwater Model Runs and Evaluation;
Completed the Upper VDC Conjunctive Use Optimization Study Update – Economic Update;
Pursued initiatives with IT Department to further the District’s workflow to assure data quality and enterprise publication of agreements in GIS to include development of a Document Workflow Portal Design;
Completed Vail Dam Seismic and Hydrologic Deficiency Evaluation to include development of Vail Dam Emergency Action Plan, Dam Breach Report, Interim Operation Plan and structural seismic analysis;
STRATEGIC PRINCIPLE/
STRATEGY/OBJECTIVE FISCAL YEAR 2016-17 INITIATIVES
GP1.S2.O2 Continue CWRMA Groundwater Model Runs and Evaluation
GP1.S3.O3 Continue Implement groundwater conjunctive use project – Phase 3&4
GP2.S2.O1 Implement the SNMP monitoring SMR Nutrient Initiative
GP2.S3.O3 Tract regulation development and engage where appropriate
GP3.S3.O3 Investigate potential well sites for acquisition
GP3.S5.O1 Implement Asset Management Planning
GP3.S5.O4 Contribute to annual development of 5-year CIP
GP3.S7.O1 Continue implement, integrate, and utilize CMMS
GP4.S4O3 Utilize new SCADA for Asset Management Planning
164

Fiscal Year 2016-2017 Operating Budget Rancho California Water District Divisional Plans
PERFORMANCE MEASUREMENT INDICATORS
ACTIVITY
CRITERIA
ACTUAL 15/16
BUDGET 16/17
TARGET 17/18
Complete Engineering and Operations Committee and Board Meeting Staff Reports
Complete within monthly scheduled deadlines
100% 100% 100%
Develop and Implement Asset Management Plans
FY 2016-2017 Budget Approval February
2016 June 2016 June 2017
Complete assigned projects
Percentage of assigned projects completed
80% 80% 80%
Completion of all assigned projects in a cost effective manner
Percentage of actual cost compared to budgeted costs
95% Less than
110% Less than
110%
165

Fiscal Year 2016-2017 Operating Budget Rancho California Water District Divisional Plans
Pumps and Wells Function
Pumps and Wells provide routine and complex maintenance, repair to all District wells, and pump stations. This area enhances customer satisfaction by enabling the District to provide reliable and sustainable services to its customers by maintaining the system that keeps the services flowing.
ACCOMPLISHMENTS FOR THE FISCAL YEAR 2015-16
Completed 100% of the 2,630 weekly, monthly, and quarterly CMMS generated Preventative Maintenance Work Orders to inspect and complete minor repairs to District Pump Stations and Well Sites;
Completed 5 major repair work orders to District pump stations;
Completed 1 new installation and are on schedule to complete 2 major repair work orders to District well sites;
Scheduled, inspected, and reviewed all work performed by outside contractors on District pump and well facilities; and
Initiated new tools and processes to assist in the rehabilitation of District wells.
STRATEGIC
OBJECTIVE FISCAL YEAR 2016-17 INITIATIVES
GP3.S7.O2 Maintain high level of preventive maintenance reliability standards.
Complete all corrective work orders in a timely manner to minimize down time and production loss for well.
Complete all capital well rehabilitation and pump station modifications by June 30, 2017.
GP3.S7.O1
GP3.S7.O4
Assist in the initiation of a well assessment program for District facilities. GP3.S7.O1
PERFORMANCE MEASUREMENT INDICATORS
ACTIVITY
CRITERIA
ACTUAL 14/15
BUDGET 15/16
TARGET 16/17
Schedule preventative maintenance
Complete CMMS preventative maintenance within five business days of start date
100% 100% 90%
Work orders
Schedule and complete all corrective work orders within 90 days to minimize downtime
93.5% Average for the year
94% to date 90%
Capital Projects
Complete all 2016-2017 budgeted capital well & pump projects by June 30, 2017
50%
Some projects deferred
On tract for 100%
completion 100% of projects
166

Fiscal Year 2016-2017 Operating Budget Rancho California Water District Divisional Plans
Wastewater Treatment
Wastewater Treatment is responsible for providing reliable and sustainable wastewater collection and treatment services for the District’s customers. Additionally, this area is responsible for accomplishing its duties in a prudent manner by completing its task using effective management practices and ensuring an environmentally responsible operation.
ACCOMPLISHMENTS FISCAL YEAR 2015-16
Completed multimedia Filter #2 Pilot Study;
Changed out the media in the multimedia system, Filters #1, #2, #3, and #4;
Began Design Phase of the SRWRF Facility Rehab project;
Completed the SCADA HMI and Operating System conversion;
Implementing Digester piping modifications and restoring Digester back in service;
Completed Final Design of Disinfection Active Feed Control System; and
Completed installation of Gravity Table Thickener Sludge Pump.
STRATEGIC
OBJECTIVE FISCAL YEAR 2016-17 INITIATIVES
GP3.S6.O1 Finalize rehabilitation options for SRWRF
GP3.S1.O1 Participate in annual joint agency hazardous materials response drill.
GP2.S3.O1 Meet discharge water quality requirements.
GP3.S6.O1 Begin design and construction of new aeration facilities for the SRWRF.
GP5.S1.O3 Continue to meet with contributory wastewater agencies.
PERFORMANCE MEASUREMENT INDICATORS
ACTIVITY
CRITERIA
ACTUAL 14/15
BUDGET 15/16
TARGET
16/17
Timely completion of SDRWQCB Reports and monthly scheduled maintenance
Reports submitted by 30th day of the following month
100% 100% 100%
Compliance with SDRWQCB discharge orders
Prevent discharge order violations
100% 100% 100%
Eliminate Sewer overflows No Preventable sewer overflows 92% 100% 100%
Effectively maintain existing equipment
Complete 95% of preventative maintenance tasks on schedule
100% 95% 100%
167

Fiscal Year 2016-2017 Operating Budget Rancho California Water District Divisional Plans
Field Services Division
MISSION STATEMENT
To ensure that District’s customers receive reliable and sustainable services. Field Services is dedicated to accomplishing its mission in a cooperative team-oriented environment that emphasizes quality, safety, and customer service.
The most critical function of the Field Services Division is to maintain and repair the infrastructure of the District. Repair and maintenance of the collections and distribution systems along with responding to emergency calls 24 hours a day is critical to providing uninterrupted service to our customers. Additionally, maintaining the operational ability of the District’s production wells is a critical task as it helps maintain supply and reduce the need for purchasing more costly import water.
PERSONNEL REQUIREMENTS (FTE)
ACTUAL FY 2014-15
ACTUAL FY 2015-16
BUDGET FY 2016-17
PROJECTED FY 2017-18
Field Services Manager 2 2 1 1
Field Services Supervisor 0 0 2 2
Construction Foreman 3 3 3 3
Pump/Wells Foreman 1 0 0 0
Meter Repair Foreman 2 2 1 1
Field Services Construction Lead 2 3 3 3
Field Services Meter Repair Lead 1 1 0 0
Field Services AMR Lead 1 1 0 0
Field Services Construction I/II 12 11 10 10
Field Services Const. Locator 1 1 1 1
Sr. Field Services Meter/AMR 0 0 5 5
Field Services Meter/AMR I/II 5 5 2 2
Building & Grounds I/II 1 1 0 0
Field Services Intern 0 0 1 1
Fleet Facilities Foreman 1 1 1 1
Senior Mechanic 1 1 1 1
Pumps & Wells I/II 2 0 0 0
Total 35 32 31 31
DIVISION SUMMARY
Category Actual
FY 2014-15 Budget
FY 2015-16 Budget
FY 2016-17
Labor $2,729,132 $2,489,403 $2,452,184 Materials 1,793,322 1,522,300 1,350,507 Outside Services 2,460,882 1,532,501 1,785,614 Funded Staffing Level 35 32 31
168

Fiscal Year 2016-2017 Operating Budget Rancho California Water District Divisional Plans
CRITICAL SUCCESS FACTORS The Field Services Division has identified the following objectives it considers critical to the overall success of the Division and the District for fiscal year 2016-2017:
Participation on ERP Project to leverage District’s computerized maintenance management system to improve operational efficiency and reliability, provide better management reporting with accurate data for better decision-making, and have the ability to integrate with other District software systems throughout each department within the District.
Continued extensive training and mentoring programs for all staff members to ensure that employees are highly qualified and trained for their specific job duties and responsibilities. Design an individual personal development plan for each employee to maximize each employee’s skills and capabilities.
Completion of all preventative and corrective maintenance routines and plan for predictive facilities maintenance on all District-owned assets to include vehicles in accordance with specified requirements.
Continued Performance Monitoring, Reporting and Grant Management and Reporting of the Automated Meter Reading Program – Phase V/VI utilizing the District’s ongoing comprehensive meter change out/service maintenance program.
Operate on a solid Asset Management foundation wherein services provided meet customer expectations for reliability, sustainability, and cost effectiveness. Integrate processes designed to minimize lifecycle costs of owning, operating, and maintaining assets at an acceptable level of risk while continuously meeting established customer service levels.
169

Fiscal Year 2016-2017 Operating Budget Rancho California Water District Divisional Plans
Field Services
Field Services is responsible for maintaining the water and sewer systems infrastructure, ensuring the District provides reliable and sustainable services to its customers. Additionally, this function is responsible for full service meter installations establishing the water connection for new customers.
ACCOMPLISHMENTS FISCAL YEAR 2015-16
Completed 155 work orders during the first half of the fiscal year;
Completed 121 corrective jobs relating to the distribution system during the first half of fiscal year;
Completed 19 service requests;
Completed maintenance on approximately 930 appurtenances;
Installed approximately 18 new meter service connections; and
Constructed new Well No. 161.
STRATEGIC
OBJECTIVE FISCAL YEAR 2016-17 INITIATIVES
GP2.S3.O1 Utilize procedures for disinfection that meet regulatory standards for maintenance and repairs to the distribution system.
GP3.S7.O1 Utilize CMMS by means of mobile in the field.
PERFORMANCE MEASUREMENT INDICATORS
ACTIVITY
CRITERIA
ACTUAL 14/15
BUDGET 15/16
TARGET
16/17
Complete monthly assigned preventative maintenance on hydrants and air-vac’s
Complete CMMS monthly assigned maintenance on fire hydrants and air-vac’s
91% 90% 90%
Timely completion of major repair/replacement of distribution piping and valves
Complete assigned repair/replacement jobs within 30 days
57% 75% 75%
Timely completion of unscheduled maintenance related work orders
Complete assigned unscheduled maintenance jobs within 30 days
39% 75% 75%
Complete monthly assigned service requests
Complete all service requests assigned with 30 days
94% 90% 90%
Complete assigned C.I.P. projects Meet completion dates and budget for assigned C.I.P. projects.
53% 90% 80%
170

Fiscal Year 2016-2017 Operating Budget Rancho California Water District Divisional Plans
Building and Grounds
Building and Grounds is responsible for providing custodial and landscape maintenance to all District facilities including buildings, pump stations, well sites, and reservoirs. This maintenance sustains and extends the useful life of the District’s assets and assures an aesthetic appeal that enhances customer service.
ACCOMPLISHMENTS FOR THE FISCAL YEAR 2015-16
Maintained District headquarters’ and supported staff in all departments by completing 147 in-house service requests to date;
Successfully completed 376 CMMS generated Preventative Maintenance Work Orders;
Completed 15 Corrective Maintenance Work Orders to date;
Scheduled, inspected, and assisted in the completion of all Outside Services work done involving District landscape, janitorial, HVAC, and pest control contractors; and
Assisted in major renovations to District facilities including lobby security upgrades, new carpet installation, and upgrade to the plumbing/lighting at Diaz rental property; and
Oversaw the acquisition of two new HVAC units and one new 600 lb. ice machine as part of District asset replacements.
STRATEGIC
OBJECTIVE FISCAL YEAR 2016-17 INITIATIVES
GP3.S7.O2 Oversee, review, and inspect the work for contractors performing landscape, janitorial, HVAC, pest control, and other outside service work for the District.
GP5.S2.O1 Maintain the high level of customer service to staff from all departments throughout the District.
Complete all corrective, planned, and CMMS generated PM work orders in the most efficient manner.
GP3.S7.O1
PERFORMANCE MEASUREMENT INDICATORS
ACTIVITY
CRITERIA
ACTUAL 14/15
BUDGET 15/16
TARGET 16/17
In-House Service Requests
Respond to service requests within 24 hrs. and complete within 5 business days
93% 90% 100%
CMMS generated PM
Complete all CMMS Preventative Maintenance inspections and reviews within 30 days
87% 90% 95%
Perform daily, monthly, and quarterly inspections of District facilities
Schedule, inspect, and review work performed by outside service contractor within 5 business days of completion
100% 90% 95%
171

Fiscal Year 2016-2017 Operating Budget Rancho California Water District Divisional Plans
Meter Maintenance Function
Meter Maintenance helps to ensure reliable water deliveries and customer satisfaction by installing new meter services for developments, private residences, and agricultural customers in a timely manner. This area is also responsible for various repairs and inspections of individual meter services, recycled water meter services, pressure regulators, construction meters, and the maintenance of the mobile and fixed AMR network used to read District water meters, which helped to sustain high quality water deliveries.
ACCOMPLISHMENTS FOR THE FISCAL YEAR 2015-16
Completed 2,291 meter maintenance tickets to date, an average of over 327 tickets per month;
Exceeded the goal of a 99% read rate for the Fixed Automated Meter Reading (AMR) system by achieving an average daily meter read rate of 99.96% to date;
Installed 74 drop-in meters to date within five business days of receiving the work orders;
Responded to 100% of customer service calls regarding meter leaks, no water complaints, and AMR problems within 24 hours, exceeding the Department goal of 90%;
Postponed large water meter-testing program due to state mandated drought restrictions; and
Oversaw the acquisition of eight newly upgraded field tablets for all staff in the Meter Department.
STRATEGIC
OBJECTIVE FISCAL YEAR 2016-17 INITIATIVES
Maintain the highest level of customer service by responding to all service orders within a 24-hour period consisting of AMR investigations, meter leaks, no water complaints, pressure issues, and meter turn-offs. GP5.S2.O1
GP5.S2.O1 Installation of meter drop-ins within five business days of receiving the work order
GP5.S2.01 Achieve a minimum of a 95% meter read rate for new 100W Choice Connect system
172

Fiscal Year 2016-2017 Operating Budget Rancho California Water District Divisional Plans
PERFORMANCE MEASUREMENT INDICATORS
ACTIVITY
CRITERIA ACTUAL
14/15 BUDGET
15/16 TARGET
16/17
AMR Fixed and Mobile Network meter read rates
Achieve minimum of a 99% meter read for the 100W Choice Connect system
N/A (both networks replaced)
N/A (both networks replaced)
100%
Meter Installation Install drop-in meters within five business days of receiving work orders
100% 90% 100%
Excellence in Customer Service through timely new service installations and meter repairs
Maintain the highest level of customer service by responding to all service orders within a 24 hour period consisting of AMR investigations, meter leaks, no water complaints, pressure issues, and meter turn -offs
100% 90% 100%
173

Fiscal Year 2016-2017 Operating Budget Rancho California Water District Divisional Plans
Mechanic Maintenance Function
Mechanic Maintenance provides maintenance and recordkeeping of all District vehicles and heavy equipment, which keeps the fleet running and ready to respond. Additionally, this area also maintains stationary engines, which drive the District’s wells and pump stations. The timely completion of these functions enables responsive customer service and reliable water and sewer services.
ACCOMPLISHMENTS FOR THE FISCAL YEAR 2015-16
Met all Department of Transportation (DOT) requirements for truck inspections to date;
Maintained excellent rating on vehicles, trailers, and records required for compliance with the California Highway Patrol (CHP) Biennial Inspection of Temecula (BIT) Program;
Completed 662 CMMS generated preventative maintenance work orders on District vehicles and equipment to date;
Competed 144 corrective work orders on District vehicles and equipment to date; and
Completed the fieldwork to maintain the permits and records required by the California Air Resources Board (CARB) on the District’s portable and stationary power generating engines; and
Oversaw the acquisition of a new response trailer, backhoe, 3 light-duty service trucks, trailer-mounted hydro-jetter, and the replacement of fuel systems on both CAT Emergency Generator Units into the District equipment fleet.
STRATEGIC
OBJECTIVE FISCAL YEAR 2016-17 INITIATIVES
GP2.S3.O1 Maintain vehicles, trailers, and equipment to meet DOT and CHP BIT requirements and receive a satisfactory inspection rating on the 2017 BIT.
GP3.S7.O3 Minimize vehicle and equipment down time for both corrective and preventative maintenance so that other department work schedules are not impacted.
GP2.S3.O1 Continue the fieldwork necessary to maintain the permits and records required by CARB for the portable and stationary power generating engines.
GP3.S7.O2 Schedule and inspect the completed job for any work done to the District’s fleet of vehicles and equipment by an outside service vendor.
174

Fiscal Year 2016-2017 Operating Budget Rancho California Water District Divisional Plans
PERFORMANCE MEASUREMENT INDICATORS
ACTIVITY
CRITERIA
ACTUAL 14/15
BUDGET 15/16
TARGET 16/17
Schedule preventative maintenance
Complete CMMS generated preventative maintenance of vehicles and equipment within 30 days of initiation
100% 100%
(by due date)
100%
(by due date)
Maintain heavy duty trucks and equipment to DOT standards
Receive a satisfactory rating for the 2014 CHP BIT
100% 100% 100%
Corrective Maintenance
Complete corrective maintenance work orders within 5 business days of receiving the materials required to complete the repair
97%
90%
(five business days)
95%
(five business days)
175

Fiscal Year 2016-2017 Operating Budget
This page intentionally left blank.
176

Fiscal Year 2016-2017 Non-Operating Budget Rancho California Water District
Long-Range Capital Financing Plan
Objectives
Based on current general plans for the Cities of Temecula, Murrieta, and the County of Riverside, the ultimate build-out of the Rancho California Water District (RCWD/District) is expected to include 56,983 dwelling units, 5,128 acres of Business Park and commercial areas, and approximately 11,345 acres of agricultural use. According to the District’s Master Plan, the projected ultimate water demand (including recycled water) is estimated at 100,942-acre feet-an increase of approximately 60% over the current usage.
In light of the substantial financial commitment required to meet the current and future service demands of the District’s constituency, the District’s Board of Directors determined that a long-range capital-financing plan would be a vital tool to utilize toward maximizing the District’s financial resources.
This financial plan details future capital requirements as specified in RCWD’s completed facility master plans and identifies funding sources and the corresponding rate requirements to meet future debt obligations.
The District funds capital improvement requirements through the issuance of long-term bonded indebtedness and, when available, cash reserves. The following plan determines a strategy for the repayment of existing and future debt obligations by projecting the many variables that affect the availability and growth of the District’s revenue sources.
Development of the plan was influenced by the following goals:
Utilize the existing financial resources of property owners so that rates are minimized and benefits are maximized.
Ensure that sufficient funds are available to meet the financing needs as detailed in the facility master plans.
Allocate the costs of funding to the benefiting property owners or customers.
Maintain ad valorem assessments and standby charges within current parameters.
Structure rates in accordance with financial market and legal requirements.
In response to the completion of Riverside County’s General Plan (Riverside County Integrated Plan) and revisions to the General Plans for the cities of Temecula and Murrieta, the District revised its existing Water Facilities Master Plan, Wastewater Facilities Master Plan, and Water Reclamation Facilities Master Plan with the completion of the 2005 Water Facilities Master Plan and 2005 Wastewater Facilities Master Plan. These master plans were intended to identify and prioritize all required capital facility improvements through 2030, (projected facility build-out). Furthermore, the District completed the 2005 Integrated Resources Plan (“IRP”) to optimize the District’s use of its water resources. The Water Facilities Master Plans was updated in 2015.
The IRP was created to develop a long-term water supply plan that will help meet water demands from now until 2050. Through partnerships with Western Municipal Water District and Eastern Municipal Water
M A S T E R P L A N S
Water Facilities
Wastewater Facilities
Water Reclamation Facilities
Regional Integrated Resource Plan
177

Fiscal Year 2016-2017 Non-Operating Budget Rancho California Water District
The current capital facilities financing program calls for expenditures of $804 million by the end of 2035, with $206 million being spent on new water facilities, $598 million being spent on replacement water facilities.
Water Facilities
Revenue Sources
As a California Water District, RCWD has various sources from which to fund water related capital facilities and the corresponding annual debt service. These revenue sources are:
Ad valorem assessments based on $100 of assessed land value;
Standby charges based on acreage;
Capacity fees;
Federal subsidies and solar rebates;
General purpose property taxes; and
Developer contributions
The appropriate application of these revenue sources is critical to the success of the District’s financial plan.
Classification of Water Facilities
As the appropriate application of revenue sources is critical to the success of the overall financial plan of the District, so is the classification of water facilities critical to achieving equity for property owners within the District. The facilities of the District can be conceived as layers or categories. The first layer is the backbone system that provides for the production of water resources or the source of supply system. This layer consists of well production, groundwater recharge, import water, and major water-wheeling facilities.
The second layer can be viewed as the delivery system and is broken down into numerous pumping and storage zones, each of which has a unique facility requirement, which varies based upon the character of the pumping zone’s water consumption and geographical requirements. This layer consists of booster pumping, distribution and storage facilities.
The third layer can be viewed as the delivery system connected for each property in a pumping zone, which is supplied by the second layer facilities.
As described above, these three layers build on one another. The source of supply facilities feed the pump zone facilities, and the pump zone facilities feed the property-specific facilities.
Accordingly, the District’s facilities are broken down into three categories. These categories are defined based upon the relative level of benefit to property owners of the District. A brief summary of the three categories is outlined on the following page:
178

Fiscal Year 2016-2017 Non-Operating Budget Rancho California Water District
Table 10.1
The key to a workable and equitable financial plan is to apply the appropriate revenue sources in such a way as to spread the financial burden of the facilities to the benefiting properties. This leads to a three-tiered funding approach for future facilities and a review of the allocation of existing debt service for existing facilities as outlined below.
After definition and classification of facilities into the three categories described above, the funding of these facilities can be determined under the same theory. Since Category 1 facilities provide benefit to the entire District, they can be allocated and funded on a divisional basis; Category 2 facilities can be funded on a divisional basis; and Category 3 facilities on a property-by-property basis. This structure ensures that there is a matching of benefit to cost for the property owners within the District’s boundaries.
In order to carry out this plan and apply it during the determination of assessments for each division and property therein, the debt service requirements are calculated and applied in the financial plan under the following formula:
The gross debt service requirement for existing and future debt is calculated for each division.
Non ad-valorem assessment revenues such as capacity fees, standby charges, water debt service surcharges, and investment earnings on the debt service funds are then applied to determine the net ad valorem assessment requirement for each division.
Under this theory, the bonding capacity of each division is determined under existing ad valorem rates.
Bonding capacity is then used first for Category 1 facilities with the remaining capacity being applied to each division’s Category 2 facilities.
If a division does not possess the required bonding capacity for its entire share of Category 1 and 2 facilities, then the Category 1 and 2 shortfall will be made up via landowner contributions with corresponding reimbursement agreements. The reimbursement agreements will then be funded via capacity fees collected from benefiting property owners within the applicable division.
FACILITY
LAYER FACILITY TYPE BENEFITING PROPERTY OWNERS
Category 1 Source of Supply Benefits all properties within RCWD’s sphere of influence since source of supply facilities enhance the value of property due to water availability
Category 2 Divisional Delivery System
Benefits all properties within a specific Division due to the fact that the facilities provide for the delivery of water throughout the entire Division
Category 3 Property Specific Delivery System
Benefits only individual properties, tracts, or zones because they require delivery facilities in addition to the Category 2 facilities
179

Fiscal Year 2016-2017 Non-Operating Budget Rancho California Water District
Accordingly, revenue sources collected from the property owners are applied as follows:
The financial plan calculates the bonding capacity for each division after the application of existing debt service costs and future debt service costs relating to Category 1 and 2 facilities. The remaining bonding capacity for each division then represents that division’s capital budget. Facilities must then be prioritized within each division to ensure that each division does not exceed its current bonding capacity. Any facility requirements exceeding the division’s current bonding capacity must be funded via landowner contribution in the form of cash or alternative financing vehicles. If any other sizing is required, reimbursement agreements can then be established and repaid via capacity fees charged to benefiting properties that connect in the future.
The numerous advantages to this financing plan are as follows:
The District will not exceed its current bonding capacity;
The collection of assessments is directly related to the benefit that each property owner receives from corresponding facilities;
Since the District will not issue debt in excess of its current bonding capacity, the risk relating to development timing is shifted to the developing property; and
Higher bond ratings; thus, lower financing costs.
REVENUE SOURCE APPLICATION
Ad Valorem Assessments Fund Capital Improvements or Debt Service Related to Category 1 and 2 Facilities
Standby Assessments
Water Surcharge
Capacity Fees Fund Capital Improvements or Debt Service Related to Category 2 Facilities
Landowner Contribution or Special Financing Instruments Construction of Category 3 Facilities
Table 10.2
180

Fiscal Year 2016-2017 Non-Operating Budget Rancho California Water District
Allocation of Facility Costs
Specific facility costs are also allocated to each of the District’s water divisions based upon estimated benefit. The adjacent table depicts the allocation formulas for specific facility types and the rationale for divisional allocation.
Replacement of Facilities
Setting aside replacement reserves for aging facilities is of particular importance to water and wastewater utilities because of the relatively large investment in utility plants required providing service. Depreciation of utility plant assets is an economic fact that must be given explicit and systematic recognition as a cost of rendering service. A failure to adequately fund the replacement of utility assets over their useful life creates a concealed form of deficit spending. The first step in creating a replacement funding strategy is to quantify future replacement costs. In January 2006, the District completed a comprehensive and detailed capital facility replacement study. This study identifies the replacement requirements through the year 2050. It is expected this study will be updated through the completion of the implementation of a Comprehensive Asset Management Program. This is expected to be complete by 2021.
Addressing the need for replacement cost funding; the District has taken a proactive two-pronged approach to meet this funding requirement. First, as the District currently funds the majority of its new facility requirements with the issuance of debt, the District’s long-range financial plan anticipates extending this practice for the funding of future replacement facilities requirements as well. This will allow the bonding capacity of the District to be utilized consistently with the transition from new to replacement facilities. Therefore, the existing revenue streams to fund today’s debt service on new facilities will likewise shift and be utilized to fund future debt service related to replacement facilities in the future. Secondly, when needed, a charge within the existing water rates will be utilized to meet additional funding requirements.
FACILITY ALLOCATION
Resource Distribution Facilities 67% Rancho Division; 33% Santa Rosa Division –
Based upon ultimate water demand
Resource Wells 50% Rancho Division; 50% Santa Rosa Division –
Based upon local water allocation
Recycled Water Advanced Treatment and Storage 70% Rancho Division; 30% Santa Rosa Division –
Based upon ultimate demand
Rancho Wells 100% Rancho Division – Economic Benefit
Santa Rosa Wells 100% Santa Rosa Division – Economic Benefit
Recharge Water Facilities 50% Rancho Division; 50% Santa Rosa Division –
Based upon water allocation
Table 10.3
181

Fiscal Year 2016-2017 Non-Operating Budget Rancho California Water District
The graph below details projected future facility requirements in five-year increments. As is demonstrated by the graph, between now and the year 2065, the District’s planning focus will shift from new facilities to the management of replacing aging facilities.
Chart 10.1
182

Fiscal Year 2016-2017 Non-Operating Budget Rancho California Water District
Restructuring of District Debt
Over the past few years, the District has accomplished several bond issue refinancing’s. Because of these refinancing’s the District lowered its average annual debt service payments by $2.5 million. Those issues and their respective savings to the District are detailed below:
DATE BOND ISSUE ISSUE SIZE PRESENT VALUE
SAVINGS/% GROSS
SAVINGS
ANNUAL
GROSS/CASH
SAVINGS
1/92 Refunding Revenue Bonds, Series 1992
$41,810,000 $2,294,000
5.96% $5,466,000 $273,300
9/93 Refunding Revenue Bonds, Series 1993
$48,710,000 $3,328,913
7.59% $5,017,841 $228,000
12/93 Refunding Revenue Bonds, Series 1994
$91,595,000 $4,082,811
5.28% $8,800,000 $303,500
5/94 Forward Interest Rate Agreement (FIRA)
$43,670,000 $2,806,856
6.43% $4,699,512 $140,000
8/95 Refunding Revenue Bonds, Series 1995
$46,585,000 $2,517,468
5.65% $4,912,155 $233,912
1/96 Adj. Rate Tender Refunding Revenue Bonds, Series 1996
$34,670,000 $2,128,835
6.52% $7,681,820 $307,273
11/00 Refunding Revenue Bonds, Series 2001A
$19,170,000 $923,747
5.19% $1,183,858 $98,655
7/02 Adj. Rate Refunding Revenue Bonds, Series of 2002A
$77,095,000 $2,714,420
7.00% $3,192,852 $122,802
6/04 Synthetic Fixed Rate Refunding Revenue Bonds, Series 2004B
$53,125,000 $2,546,042
5.12% $3,199,371 $199,961
8/05 Synthetic Fixed Rate Refunding Revenue Bonds, Series 2005A
$30,250,000 $1,891,663
6.02% $2,439,850 $221,805
8/05 Conventional Fixed Rate Refunding Revenue Bonds, Series 2005C
$18,185,000 $303,509
1.29% $6,530,388 $466,456
Total $504,865,000 $25,538,264 $53,123,647 $2,595,664
Table 10.4 (1) The 2008 A and B Refunding were executed for economic purposes, of which the gain could not be accurately calculated, in order to address the
trading performance due to market issues surrounding the auction bonds as well as the related downgrades of the bond insurers. In addition to these bonds, the District also terminated the associated synthetic fixed pay or swap in order to eliminate future interest rate swap risks. In April 2008, the District issued the 2008A and 2008B Series Fixed Rate Refunding Bonds totaling $204,205,000.
183

Fiscal Year 2016-2017 Non-Operating Budget Rancho California Water District
Because of the savings associated with these refinancing’s, the District was able to lower the Rancho Division ad valorem assessment rate from $.36 to $.30 per $100 of assessed land value, and avoided increases to the Santa Rosa Division ad valorem assessment rate. The 1996 issue afforded the District the opportunity to restructure the outstanding debt related to the Santa Rosa Water Reclamation Facility (SRWRF), which created a more efficient matching of revenue streams to debt service cash flows.
Debt Policy and Administration
There is no statutory regulation setting debt limitations on the District. The District has adopted its own debt management policies, which determine the objectives and conditions for issuing debt. Per the policy, the District will seek to issue debt only in the case where there is an identified source of repayment.
Through the District’s Long Range Financial planning process, borrowing needs are anticipated and revenue streams to repay borrowings are identified. The ability of the revenue streams to meet current and projected borrowing needs determine the bonding capacity of the District. The Long Range Financial Plan ensures that the District will not exceed its current bonding capacity.
Total District long-term debt is as follows:
YEAR PRINCIPAL INTEREST TOTAL
2017-2021 $38,825,000 $78,795,934 $117,620,934
2022-2026 56,795,000 66,700,484 123,495,484
2027-2031 79,975,001 50,766,747 130,741,748
2032-2036 65,410,003 32,781,054 98,191,057
2037-2041 75,005,001 12,274,611 87,279,612
Totals $316,010,005 $241,318,829 $557,328,834
Table 10.6 identifies the total amount of revenue bonds outstanding as of December 31, 2015.
YEAR ISSUED AMOUNT USES(1)
2002A Series $44,400,005 Water and Wastewater Facilities
2005C Series 18,185,000 Water Facilities
2008A Series 98,145,000 Water and Wastewater Facilities
2008B Series 44,625,000 Water and Wastewater Facilities
2010A Series 100,785,000 Water and Wastewater Facilities
2011A Series 9,870,000 Water Facilities
Total $316,010,005
Table 10.6
(1) Water facilities include Wells, ponds, recycled facilities, reservoirs, pump stations, transmission mains, and valves.
Wastewater facilities include Plant, lift stations, collections, trunk sewer, and plant improvements.
184

Fiscal Year 2016-2017 Non-Operating Budget Rancho California Water District
The 2016-2017 fiscal year debt service requirements for the above-mentioned obligations are as follows:
Description Interest
Rates(1) Principal Interest Total
2002A Series 5.00% - $2,220,000 $2,220,000
2005C Series 5.50% 5,730,000 842,600 6,572,600
2008A Series 4.97% 260,000 4,835,000 5,095,000
2008B Series 3.90% - 1,703,336 1,703,336
2010A Series(2) 4.28% - 6,386,745 6,386,74
2011A Series(3) 1.80% - 505,838 505,838
Total $5,990,000 $16,493,519 $22,483,519
Likewise, Table 10.8 identifies the total revenue bonds outstanding per Division, together with their corresponding average interest rate at December 31, 2015.
DIVISION AMOUNT WEIGHTED AVERAGE ANNUAL
INTEREST RATE
Rancho $119,154,899 4.47%
Santa Rosa 135,857,685 4.51%
Wastewater 60,997,421 4.73%
Total $316,010,005 4.54%
Table 10.8
Table 10.7 (1) The interest rate represents the average rate per year for the remaining life of the bonds. (2) Rate reflects net of 6.34% taxable rate less 32.5% Federal Subsidy
(3) Rate reflects net of 5.125% taxable rate less 65% Federal subsidy.
185

Fiscal Year 2016-2017 Non-Operating Budget Rancho California Water District
Table 10.9 identifies the projected principal payments by Division.
FY Rancho Santa Rosa SRWRF Total
16-17 3,376,352 2,597,188 16,460 5,990,000
17-18 3,558,011 2,735,846 16,143 6,310,000
18-19 3,768,451 2,898,507 18,042 6,685,000
19-20 4,526,461 4,238,936 979,603 9,745,000
20-21 2,141,949 3,723,733 4,229,318 10,095,000
21-22 2,254,310 3,801,826 4,298,864 10,355,000
22-23 3,361,449 3,695,643 3,872,908 10,930,000
23-24 3,571,856 3,808,714 3,979,430 11,360,000
24-25 3,709,425 3,971,419 4,144,156 11,825,000
25-26 3,901,465 4,130,295 4,293,240 12,325,000
26-27 4,104,398 4,295,449 4,450,153 12,850,000
27-28 4,742,654 6,251,791 4,600,555 15,595,000
28-29 4,955,391 6,586,058 4,793,551 16,335,000
29-30 5,179,536 6,981,744 4,998,721 17,160,001
30-31 4,655,945 6,908,182 6,470,873 18,035,000
31-32 4,303,148 4,843,125 6,768,727 15,915,000
32-33 2,255,502 8,548,032 721,466 11,525,000
33-34 2,374,361 8,950,912 754,727 12,080,000
34-35 2,473,411 9,393,465 793,127 12,660,003
35-36 7,488,152 5,622,292 119,556 13,230,000
36-37 7,805,111 5,860,273 124,617 13,790,001
37-38 8,133,390 6,106,752 129,858 14,370,000
38-39 8,475,818 6,363,856 135,325 14,974,999
39-40 8,832,397 6,631,585 141,018 15,605,000
40-41 9,205,956 6,912,062 146,983 16,265,001
TOTAL 119,154,899 135,857,685 60,997,421 316,010,005
186

Fiscal Year 2016-2017 Non-Operating Budget Rancho California Water District
Table 10.10 identifies the projected interest payments by Division.
FY Rancho Santa Rosa SRWRF Total
16-17 6,427,698 7,183,430 2,882,391 16,493,519
17-18 6,239,091 7,038,606 2,881,760 16,159,457
18-19 6,039,632 6,885,436 2,881,076 15,806,144
19-20 5,834,073 6,710,930 2,859,541 15,404,544
20-21 5,677,533 6,522,104 2,732,633 14,932,269
21-22 5,567,336 6,333,798 2,519,220 14,420,354
22-23 5,422,309 6,143,691 2,311,596 13,877,595
23-24 5,260,536 5,964,949 2,127,026 13,352,512
24-25 5,092,565 5,780,754 1,937,472 12,810,790
25-26 4,916,320 5,586,295 1,736,617 12,239,233
26-27 4,731,046 5,384,222 1,528,719 11,643,987
27-28 4,525,245 5,128,420 1,313,671 10,967,336
28-29 4,299,995 4,815,341 1,091,534 10,206,869
29-30 4,064,545 4,484,240 859,998 9,408,783
30-31 3,824,263 4,137,802 577,707 8,539,772
31-32 3,648,647 3,870,642 281,686 7,800,975
32-33 3,543,419 3,567,079 147,233 7,257,731
33-34 3,396,722 3,106,366 109,834 6,612,922
34-35 3,243,120 2,623,425 70,621 5,937,165
35-36 2,927,488 2,198,031 46,740 5,172,259
36-37 2,442,921 1,834,206 39,004 4,316,131
37-38 1,937,909 1,455,031 30,941 3,423,881
38-39 1,411,647 1,059,900 22,538 2,494,085
39-40 863,236 648,139 13,782 1,525,157
40-41 291,691 219,009 4,657 515,357
TOTAL 101,628,987 108,681,845 31,007,997 241,318,829
187

Fiscal Year 2016-2017 Non-Operating Budget Rancho California Water District
Bond Ratings
Rancho California Water District’s historically sound financial and operational management has allowed it to achieve excellent credit scores from all three of the municipal rating agencies. The District’s credit ratings as of December 31, 2015 are as follows:
Moody’s bond ratings range from Aaa (highest quality) to C (lowest quality) for long-term obligations. Moody’s applies numerical modifiers 1-high, 2-mid, and 3-low in each generic rating classification from Aa to Caa.
Standard & Poor’s top four bond rating categories (AAA, AA, A, BBB) generally are regarded as eligible for bank investment (AAA is the highest rating).
Fitch uses a rating system very similar to that of Standard & Poor’s. A “+” or “–” may be appended to ratings by Fitch to denote relative status within a major rating category. Fitch also considers the historical and prospective financial condition, quality of management, operating performance of the issuer and of any guarantor, any special features of a specific issue or guarantee, the issue’s relationship to other obligations of the issuer, as well as developments in the economic and political environment that might affect the issuer’s financial strength and credit quality.
Water Facilities – Rate Recommendations
Ad Valorem Rates
As is demonstrated in the financial models of the plan, it is recommended that assessment rates be maintained at the current levels for the fiscal year 2016-2017 for both the Rancho and Santa Rosa Divisions, as follows:
Rancho Division - $0.30 per $100 of assessed land value only
Santa Rosa Division - $0.50 per $100 of assessed land value only
Water Standby Charges
For the 2016-2017 fiscal year, it is recommended that the standby charges remain at current levels as follows:
Santa Rosa Water
Area 1 - Parcels with a water meter shall be charged $69.92 per acre or per parcel if less than one acre.
Area 1A- Parcels without water service shall be charged $69.92 per acre or per parcel if less than one acre for the first 40 acres, and $62.10 per acre for the remaining acres.
Area 2- All Parcels shall be charged $48.00 per acre or per parcel if less than one acre.
Area 3- All Parcels shall be charged $23.50 per acre or per parcel if less than one acre.
Water Capacity Fee
The District has taken significant steps to create a capacity fee program that equitably allocates capital between existing and future users and complies with the requirements of AB 1600. AB 1600 regulates the way that impact fees are imposed on development projects. The agency imposing the fees must (1) identify
Aa2 AA+
AA+
188

Fiscal Year 2016-2017 Non-Operating Budget Rancho California Water District
the purpose of the fee; (2) identify the use to which the fee is to be put, including identifying the public facilities to be financed; (3) show the reasonable relationship between the public facility to be constructed and the type of development; and (5) account for and spend the fees collected only for the purposes and projects specifically used in calculating the fee.
Historically the method for determining capacity fees was based upon an incremental cost-pricing method. As the District matures the method used for determining the capacity fee must transition to a system buy-in method. Therefore, water capacity fees are currently supported by a combined method until build out is reached and a pure system buy-in method is utilized. The District completed a comprehensive capacity fee study in 2012, which indicates an increase in the fee is needed. The fee is therefore being increased by the ENR index of 2% for all meter sizes in the Rancho Division and Santa Rosa Division for the 2016-2017 fiscal year.
Wastewater Facilities
For purposes of this plan, the wastewater facilities are considered on a phase-by-phase approach. Various phases of construction have occurred to achieve requirements for 5.0 mgd wastewater flow for which the District has issued Certificates of Participation and Revenue Bonds. This equates to a current utility plant asset value of $63 million in wastewater treatment facilities at the Santa Rosa Water Reclamation Facility.
Over the last few years, the District has been working with its contract agencies to determine ultimate capacity needs of the Santa Rosa Water Reclamation Facility (SRWRF). It finalized this effort in the formation of the Santa Rosa Regional Resources Authority (SRRRA), a Joint Powers Authority (JPA), in November 2015 when it and the contract agencies agreed upon set ultimate capacity needs broken down by primary/secondary treatment, tertiary treatment, and trunk sewer system. These capacity needs are basis of capital cost allocation responsibilities of each member agency including the District. The SRRRA JPA is expected to approve the SRWRF rehabilitation project, estimated in total at $25.6 million, in the FY2016-2017 capital improvement project budget. This project incorporates multiple major rehabilitation efforts over several plant processes that will significantly extend useful life and energy efficiency while continuing to utilize the sequencing batch reactor treatment process. The SRRRA is expected to obtain a loan from the State Revolving Fund in FY2016-2017 to finance this effort. The LRFP incorporates the near term and long-term capital needs to accomplish the rehabilitation.
In 2008, the District completed its initial Sewer System Management Plan and this plan was updated in 2013 in accordance with State regulations. During fiscal year 2009-2010, RCWD initiated an annual program to perform a video survey and condition assessment of its wastewater collection system. This annual program concluded that the District’s wastewater collection system is in good condition.
Revenue Sources
The District has four revenue sources from which to fund wastewater facilities. These revenue sources are as follows:
Capacity fees;
Standby assessments;
Monthly wastewater debt service charge; and
Developer contributions.
Capacity fees are the primary revenue source for the funding of wastewater facilities. There are two secondary revenue sources, monthly debt service charges and standby charges, which fund any shortfalls in the primary revenue source. The operations and maintenance cost are paid by monthly service charges and are not part of the capital budget. Currently, the plant is processing 2.6-mgd of permanent flows, which is
189

Fiscal Year 2016-2017 Non-Operating Budget Rancho California Water District
approximately 52% of its current capacity. The portion of the plant capacity that is in reserve for future-benefiting users creates a financial burden that is directly tied to the availability of the service. In order to arrive at an equitable apportionment of cost and benefit, it is necessary that an annual standby charge be levied on those properties that have not paid their proportionate share of the capital costs of this facility.
The District has currently received capacity fees for approximately 17,528 EDU’s, or 56% of the plant capacity, and is bearing the risk for the remaining 44% of uncovered capacity. As capacity fees are received in the future, the risk to the District caused by growth slow-downs and for debt service requirements, decreases correspondingly.
Wastewater Facilities – Rate Recommendations
Wastewater Capacity Fees
During fiscal year 1995-1996, the District restructured the outstanding debt related to the SRWRF, which created a more efficient matching of revenue streams to debt service cash flows. This allowed the District to lower and hold wastewater capacity fees at a constant amount for ten years until fiscal year 2005-2006 when they were raised 10% from $3,724 per EDU to $4,105 per EDU. As demonstrated by the financial models of the plan, estimated future annual wastewater capacity fee increases of 8% to 10%, are required. It is recommended that the wastewater capacity fee be increased by 8% to $9,568 for fiscal year 2016-2017.
In the formation agreements of the SRRRA, the District and other member agencies agreed to supersede prior cost sharing arrangements with respect to capital and debt service cost, and have agreed to pro-rata share these costs based on the ultimate capacity needs of each agency. The agreed upon cost share allocations are noted in the table below. The District is currently receiving and responsible for the costs associated with the tertiary water flows from Western.
PRIMARY & SECONDARY
TREATMENT TERTIARY TREATMENT TRUNK SEWER
Member Agency Based on Ultimate
Flow/Capacity Requirements
Based on Ultimate Recycled Water Amounts
Based on Engineering
Analysis
Elsinore MWD 40% - 2.0 MGD 40% - 2.0 MGD 43.57%
Rancho (RCWD) 40% - 2.0 MGD 52% - 2.6 MGD 36.61%
Western MWD 20% - 1.0 MGD 8% - 0.4 MGD 19.82%
Furthermore, the SRRRA is obligated through these agreements to purchase the SRWRF upon successful completion of obtaining its own debt financing which would shift the debt service and costs from being in the name of the District to the JPA. This is anticipated to occur in the FY2016-2017. The District will be responsible for its allocated share of the cost when the debt and SRWRF assets transfer. This is reflected on the non-operating statement as “JPA Capital Cost Share (CS)”. Until this time, the SRRRA will be responsible to pay the District the other member agencies’ share of the debt and capital costs. This amount is reflected on the non-operating statement as “Cost Share (CS) from JPA”.
Wastewater Standby Charges
The current levy of a standby charge for properties that have not paid a capacity fee is $28.50 per acre or per parcel if less than one acre. It is recommended that the levy of a standby charge remain at $28.50 per acre or
190

Fiscal Year 2016-2017 Non-Operating Budget Rancho California Water District
per parcel if less than one acre for fiscal year 2016-2017 on all land that has not paid a capacity fee as of March 1, 2016.
Wastewater Replacement Charge
Wastewater Division customers pay $4.00 per EDU per month towards facility replacement. This revenue is the primary source for funding wastewater facility replacement. For fiscal year 2016-2017, it is recommended that the replacement charge remain at $4.00 per EDU per month.
Wastewater Debt Service Charge
A wastewater debt service charge was implemented in fiscal year 2007-2008. This charge provides another revenue stream for debt service and adds more stability and reliability to the financial plan. For fiscal year 2016-2017, it is recommended that the debt service charge increase to $9.50 per EDU per month.
Table 10.11 identifies the total wastewater monthly rate per EDU.
ALLOCATION FISCAL YEAR 2015-16 FISCAL YEAR 2016-2017
Operations & Maintenance $25.50 $25.25 Replacement 4.00 4.00 Debt Service 9.25 9.50
Total $38.75 $38.75
Table 10.9
Water Reclamation, Treatment and Distribution Facilities
Recycled water has been identified as a critical resource to RCWD as it relates to the District’s ability to meet future water demand requirements and for which the District has made a substantial investment of $52 million. The questions arising during discussion of the funding of water reclamation treatment facilities are “Who bears the burden for these facility costs?” and, “Are water reclamation facilities the responsibility of the wastewater generator or the end-user of recycled water resources?”
The District’s Water Resources Master Plan identifies recycled water as one of the required resources to meet ultimate water demands. The use of recycled water offsets the need for import water or water production facilities in the future. Therefore, the financing of recycled water advance treatment, storage, and distribution facilities has been included in the water divisions’ capital plans. The cost of advanced treatment facilities will be funded at 70% for the Rancho Division and 30% for the Santa Rosa Division. This allocation is based upon the projected ultimate use of recycled water. The costs of recycled water distribution facilities are funded based upon the direct benefit of these facilities to each division.
191

Fiscal Year 2016-2017 Non-Operating Budget Rancho California Water District
Capital Projects
Capital facilities are potable water, recycled, and wastewater infrastructure related projects that require a longer time to build and to complete, have a longer estimated life and have costs well exceeding $2,000. Capital facilities include reservoirs, pipelines, wells, transmission mains, and pump stations. Budget appropriations for major capital projects continue from year to year until each project is completed. All capital facilities are funded by bond funds or cash reserves of the District. District cash reserves can be capacity fee funds, replacement funds or debt service funds.
Capacity fee funds are one-time capital charges assessed against new development as a way to provide or cover a proportional share of the costs of capital facilities constructed or to be constructed. The fee incorporates a component that recognizes that existing users have developed and maintained the utility system to accommodate growth and incorporates a component that recognizes the cost of additional facilities that provide incremental capacity to accommodate growth.
Replacement funds are used for those projects that renew or replace existing facilities that have deteriorated or have exceeded their useful life and are funded from user rates.
Debt Service Construction funds are used for new projects and/or replacement facilities as approved by the Board of Directors.
Classification of Improvements
The Capital Improvement Program (CIP) is separated by the District’s divisional structure and by major and minor capital projects. Major capital projects are projects that exceed $35,000 in cost, have long-term life spans (greater than two years), and are generally nonrecurring (not maintenance work). A major capital project is facility-related and generally consists of:
Construction of a new facility, i.e. a pipeline, reservoir, or pump station, etc.; Addition to, or expansion or replacement of an existing facility; Nonrecurring rehabilitation or betterment to a facility which extends the asset life of the
facility or improve its functionality, i.e., reservoir recoatings, etc.; Acquisition of land for a public purpose; Asset management program activities; and Specific planning, engineering study, or design work related to a project.
Minor capital projects are facility-related capital projects with a cost of $35,000 or less. Furthermore, minor capital projects include planned improvement projects that cost greater than $2,000, are generally nonrecurring, and have a life span of greater than two years. The difference between a major capital project and a planned improvement project is the planned improvement project does not extend the life of a facility asset. As such, these projects typically represent a report or replacement activity that restores an asset component to its original condition, extends the useful life of the asset component, or improves its functionality. Planned improvement projects do not include planned or preventative maintenance projects. Planned improvement projects generally consist of:
Replacement or the installation of new pipeline appurtenances; Replacing a reservoir sacrificial anodes; Replacing pumping unit components, i.e., pump bowl assemblies, pump seals, etc.; Replacing electrical/instrumentation components; and Sewer manhole coating and repairs.
192

Fiscal Year 2016-2017 Non-Operating Budget Rancho California Water District
Project Prioritization
The aforementioned categories are then grouped in order to prioritize the projects based on the following ranking:
RANKING PRIORITY RECOMMENDATION
1 Recommended to be included in the scheduled fiscal year CIP program to satisfy the District’s goals and objectives.
2 Recommended to be included in the scheduled fiscal year CIP Program, but can be deferred with additional risk and/or cost to the District.
3 Recommended to be included in the scheduled fiscal year CIP program, but can be deferred if adequate funding is not available.
4 Not recommended to be included in the fiscal year CIP program. Typically, these projects are not included in the fiscal year CIP program because they were already vetted and removed during staff’s CIP planning process.
For fiscal year 2016-2017, a total of $34,045,000 has been budgeted for the Districts CIP.
The following table identifies the Districts previous CIP Budgets for the last 10 years.
Fiscal Year
Rancho
Division CIP Santa Rosa
Division CIP Wastewater Division CIP
Total
2007-2008 5,104,500 3,585,500 200,000 8,890,000
2008-2009 8,008,250 4,566,750 193,000 12,768,000
2009-2010 7,972,750 3,497,250 315,000 11,785.000
2010-2011 5,157,000 11,998,000 1,100,000 18,255,000
2011-2012 4,802,500 3,760,500 416,000 8,979,000
2012-2013 5,411,000 3,932,000 1,160,000 10,503,000
2013-2014 10,985,250 3,398,750 1,875,000 16,259,000
2014-2015 10,879,719 3,256,282 1,235,000 15,371,000
2015-2016 9,343,350 3,192,650 2,987,000 15,523,000
2016-2017 16,517,500 17,487,500 40,000 34,045,000
Table 10.12
193

Fiscal Year 2016-2017 Non-Operating Budget Rancho California Water District
Impact of Capital Improvement Projects
The Project Summary sheets provide detailed information on the District’s significant non-recurring projects, which are defined, as those projects with budgets of at least $1 million.
The projects, which meet these criteria and represent 74% of budgeted CIP expenditures for Fiscal Year 2016-2017 is:
Table 10.13
FY 2016-2017 BUDGETED
EXPENDITURES PROJECT
$4,100,000 Well No. 125 Replacement
$3,900,000 Pond No. 1-2 lining
$3,700,000 Well No. 102 Wellhead Treatment
$3,600,000 Well No. 124 Replacement
$2,990,000 Ace Bowen PS Disinfection Improvement
$2,500,000 Regional VDC Pump Station & CCT
$2,300,000 Pond No. 3 Lining
$2,020,000 Senga Doherty PS Disinfection Improvement
194

Fiscal Year 2016-2017 Non-Operating Budget Rancho California Water District
Major Capital Project List
RANCHO DIVISION Est. Cost Classification Priority
Reservoir Recoating Interior: Ace Bowen No. 1 De Portola No. 2 Exterior: El Chimisal No. 2 Norma Marshall
$600,000 $750,000
$225,000 $165,000
R&R R&R
R&R R&R
3.35 3.59
4.19 3.62
Pump Systems Asset Management Plan (AMP) Development/Implementation $110,000 FP n/a Mechanical Piping Systems and Controls AMP Development/Implementation $300,000 FP n/a
RANCHO DIVISION MAJOR CAPITAL TOTAL $2,150,000
SANTA ROSA DIVISION Est. Cost Classification Priority
Reservoir Recoating Interior: Via Vaquero No. 1
$975,000
R&R
3.72
Pump Station Repairs/Modifications
Ace Bowen Ps Disinfection Improvement $2,990,000 OEI 1.64
Senga Doherty PS Disinfection Improvement $2,020,000 OEI 1.94
Pump Systems AMP
Development/Implementation $250,000 FP n/a
Mechanical Piping Systems and Controls AMP
Development/Implementation $250,000 FP n/a
SANTA ROSA DIVISION MAJOR CAPITAL TOTAl $6,325,000
RESOURCE DIVISION Est. Cost Classification Priority
Well Construction Well 124 Well 125
$3,600,000 $4,100,000
R&R R&R
2.41 2.58
Well Repairs/Modifications Well 102
$3,700,000 REG 2.65
Common Water Facilities Vail Dam Modifications Regional VDC Pump Station & CCT Well Asset Land Acquisition Plan
$500,000 $2,500,000
$300,000
REG WR FP
2.61 1.01 n/a
195

Fiscal Year 2016-2017 Non-Operating Budget Rancho California Water District
Common Recycled Facilities Pond No. 1-2 Lining Pond No. 3 Lining Recycled Water Resource Plan
$3,900,000 $2,300,000
$300,000
R&R R&R FP
2.99 2.79 n/a
Common Recycled/Non-Potable Facilities PS AMP Development/Implementation
$80,000 FP n/a
Common Recycled/Non-Potable Facilities Mechanical Piping Systems and Controls AMP
Development/Implementation
$220,000 FP n/a
Vail Properties Studies Vail Lake Recreation & Operations Plan and Water Quality Monitoring Plan Update
$100,000 FP n/a
RESOURCE DIVISION MAJOR CAPITAL TOTAL $21,600,000
WASTEWATER DIVISION Est. Cost Classification Priority
Wastewater Division Major Capital Total $0
TOTAL FY 2016-2017 PROJECT COSTS $30,075,000
196

Fiscal Year 2016-2017 Non-Operating Budget Rancho California Water District
Minor Capital Project List
Rancho Division Est. Cost Classification
Pump Station Repairs/Modifications
Mechanical
Replace Existing Pump Bowls $30,000 R&R
Replace Pump Control Valves
Calle Breve (4 pump units) $80,000 OEI
Alvarez (3 pump units) $60,000 OEI
Caballos (3 pump units) $60,000 OEI
Replace Pump Seals
On site (location to be determined) $30,000 R&R
Well Repairs/Modifications
Well Casing
Well Casing Rehabilitation
Three Sites (Location TBD) $270,000 R&R
Mechanical
Replace Pump & Motor
Three Sites (Location TBD) $400,000 R&R
Electrical/Instrumentation:
Replace MCC/Arc-Flash Compliant
Wells 211 and 235 $160,000 REG
Replace Well Level Sensors
Well 203 $2,000 R&R
Distribution System
Mainline Valve New Installation/Replacement $250,000 OEI
Appurtenance New Installation/Replacements
Av/AR, Blow-off/Hydrant, CP Test Station/Anode $150,000 OEI
Facility Relocations
Misc. Unknown Relocations $50,000 REG
RANCHO DIVISION MINOR CAPITAL TOTAL $1,542,000
197

Fiscal Year 2016-2017 Non-Operating Budget Rancho California Water District
Santa Rosa Division Est. Cost Classification
Well Repairs/Modifications
Electrical Instrumentation:
Replace MCC/Arc-Flash Compliant
Well 309 $80,000 REG
Pump Station Repairs/Modifications Mechanical
Replace Existing Pump Bowls (2 pump units) $30,000 R&R
Joaquin Ranch PS (3 pump units) $72,000 OEI
Cal Oaks PS (6 Pump Units) $120,000 OEI
Replace Pump Seal -One Site (location to be determined) $30,000 OEI
Electrical/Instrumentation:
Replace Motor Starter
California Oaks (2 pump units) $40,000 OEI
Avenida Escala (2 pump units) $30,000 OEI
Bear Creek (2 pump units) $40,000 OEI
Del Oro (4 pump units) $60,000 OEI
Freeman (4 pump units) $40,000 OEI
Distribution System
Mainline Valve New Installation/Replacement $250,000 OEI
Appurtenance New Installation/Replacements
AV/AR, Blow-off/Hydrant, CP Test Station/Anode $150,000 OEI
Water Quality Sample Stations (7 sites) $90,000 OEI
Facility Relocations
Misc Unknown Relocations $25,000 REG
SANTA ROSA DIVISION MINOR CAPITAL TOTAL $1,057,000
198

Fiscal Year 2016-2017 Non-Operating Budget Rancho California Water District
Resource Division Est. Cost Classification
Well Repairs/Modifications
Well Casing
Well Casing Rehabilitation
Three Sites (Location TBD) $270,000 R&R
Mechanical
Replace Pump & Motor
Three Sites (Location TBD) $400,000 R&R
Electrical/Instrumentation:
Replace MCC/Arc-Flash Compliant
Wells 118, 126, 138, 139, 140, 149, 151, and 156 Replace Well Level Sensors
$640,000
REG
Wells 106, 108, 119, 122, 128, 130, 131, 139, 140, 141 $21,000 R&R
143, 144, 149, and 156
RESOURCE DIVISION MINOR CAPITAL TOTAL $1,331,000
Wastewater Division Est. Cost Classification
Sewer Collections System Repairs
Force Main Av/AR Replacement $40,000 R&R
WASTEWATER DIVISION MINOR CAPITAL TOTAL $40,000
TOTAL FY 2016-2017 PROJECT COSTS $3,970,000
199

Fiscal Year 2016-2017 Non-Operating Budget Rancho California Water District
$9,002,000
$25,003,000
$40,000
New Water Facilities Facility Replacement Wastewater Facilities
Capital Project Funding Breakdown
2016-2017 CAPITAL PROJECTS DIVISIONAL ALLOCATION
Rancho Santa Rosa Resource Wastewater
Major Capital Projects
Minor Capital Projects
Sub-Total Capital Projects
$2,150,000
1,542,000
3,692,000
$6,325,000
1,057,000
7,382,000
$21,600,000
1,331,000
22,931,000
$0
40,000
40,000
Resource Major Capital Reallocated 12,160,000 9,440,000 (21,600,000)
Resource Minor Capital Reallocated 665,500 665,500 (1,331,000)
GRAND TOTAL CAPITAL PROJECTS $16,517,500 $17,487,500 $ - $40,000
FISCAL YEAR 2016-2017 CAPITAL PROJECT TOTALS
General Fund Debt Service/Capital Improvement Fund Replacement Fund Total
Rancho
Santa Rosa
Wastewater
$16,517,500
17,487,500
40,000
$16,517,500
17,487,500
40,000
TOTAL $34,045,000
2016-2017 CAPITAL EXPENDITURES SUMMARY
200

Fiscal Year 2016-2017 Non- Operating Budget Rancho California Water District
PROJECT DESCRIPTION
This project recoats the interior of two reservoirs and the
exterior of two reservoirs.
JUSTIFICATION
The normal interior and exterior coating life of the District’s steel reservoirs is 10 to 15 years.
Previously, the District used an interior coating system of three coats of epoxy. The current interior
coating system consists of a single-coat, high-build polyurethane for the reservoir bottom and shell,
and a two-coat, high-build epoxy for the reservoir knuckle and roof structure, in compliance with
American Water Works Association (AWWA) Specifications.
EXPENDITURE SCHEDULE
OPERATIONAL COST IMPACTS
The completion of this project will have no affect on operation costs.
PROJECT BACKGROUND
Ace Bowen Reservoir No. 1 (Capacity = 2.7 MG, Shell Height = 32.0 ft and Shell Diameter = 120.0
ft) is located at 29025 Via Santa Rosa. This reservoir was originally constructed in 1980, and the
interior surface was last recoated in 2004. A dive inspection documented the reservoir’s interior
condition in 2015. Due to the deteriorating condition of the interior roof and floor areas, staff proposes
to recoat the interior reservoir surface. Staff is also proposing to install sacrificial anode systems at
this reservoir. Sacrificial anodes provide cathodic protection for all surfaces in contact with water and
are intended to extend the functional life of the coating system. The estimated cost of the interior
recoating of Ace Bowen Reservoir No. 1 is $600,000.
Data Sheet No. 2016-01
Project Reservoir Recoating
Division Rancho Division
Funding Amount
$1,740,000
Planned Expenditure
Project 2016 2017 2018 2019 2020 Total
Reservoir
Recoating $1,740,000 $1,740,000
201

Fiscal Year 2016-2017 Non- Operating Budget Rancho California Water District
De Portola Reservoir No. 2 (Capacity = 3.2 MG, Shell Height = 32.0 ft and Shell Diameter = 130.0
ft) is located at 40110 Via Cordova. This reservoir was originally constructed in 1983, and the interior
surface was last recoated in 2002. A dive inspection documented the reservoir’s interior condition in
2012. Due to the deteriorating condition of the interior roof and floor areas, staff proposes to recoat the
interior reservoir surface. Staff is also proposing to install a sacrificial anode and active mixing
systems at this reservoir. Sacrificial anodes provide cathodic protection for all surfaces in contact with
water and are intended to extend the functional life of the coating system. The active mixing system
avoids stratification of the stored water, aiding in overall water quality and prolonging the life of
adequate chlorine residual, in particular, during periods of low demand. The estimated cost of the
interior recoating of De Portola Reservoir No. 2 is $750,000.
El Chimisal Reservoir No. 2 (Capacity = 6.3 MG, Shell Height = 32.5 ft and Shell Diameter = 182.0
ft) is located at 34695 El Mirador Court. This reservoir was originally constructed in 2003, and the
exterior surface has never been recoated. Due to the deteriorating condition of the exterior coating, as
evidenced by chalking, staff proposes to recoat the exterior with a polyurethane and epoxy coating, in
compliance with AWWA Specifications. The estimated cost of the exterior recoating of El Chimisal
Reservoir No. 2 is $225,000.
Norma Marshall Reservoir (Capacity = 4.8 MG, Shell Height = 32.0 ft and Shell Diameter = 160.0
ft) is located at 41520 Margarita Road. This reservoir was originally constructed in 1982, and the
exterior surface was recoated in 2005. Due to the deteriorating condition of the exterior coating, as
evidenced by chalking and poor adhesion, staff proposes to recoat the exterior with a polyurethane
and epoxy coating, in compliance with AWWA Specifications. The recoating will be of the shell only,
as the roof was recoated in 2015 due to advanced deterioration and delamination of the roof coating.
The estimated cost of the exterior recoating (shell only) of Norma Marshall Reservoir is $165,000.
202

Fiscal Year 2016-2017 Non- Operating Budget Rancho California Water District
PROJECT DESCRIPTION
This project recoats the interior of one reservoir.
JUSTIFICATION
The normal interior and exterior coating life of the District’s steel reservoirs is 10 to 15 years.
Previously, the District used an interior coating system of three coats of epoxy. The current interior
coating system consists of a single-coat, high-build polyurethane for the reservoir bottom and shell,
and a two-coat, high-build epoxy for the reservoir knuckle and roof structure, in compliance with
American Water Works Association (AWWA) Specifications.
EXPENDITURE SCHEDULE
OPERATIONAL COST IMPACTS
The completion of this project will have no effect on operation costs.
PROJECT BACKGROUND
Via Vaquero Reservoir No. 1 (Capacity = 5.6 MG, Shell Height = 31.0 ft and Shell Diameter = 175.0
ft) is located at 43175 Via Barranca. This reservoir was originally constructed in 2002, and the interior
surface has never been recoated. A dive inspection documented the reservoir’s interior condition in
2013. Due to the deteriorating condition of the interior roof and floor areas, staff proposes to recoat the
interior reservoir surface. Staff is also proposing to install sacrificial anode systems and active mixing
systems at this reservoir. Sacrificial anodes provide cathodic protection for all surfaces in contact with
water and are intended to extend the functional life of the coating system. The active mixing system
avoids stratification of the stored water, aiding in overall water quality and prolonging the life of
adequate chlorine residual, in particular, during periods of low demand. The estimated cost of the
interior recoating of Via Vaquero Reservoir No. 1 is $975,000.
Data Sheet No. 2016-02
Project Reservoir Recoating
Funding Division
Santa Rosa Division
Funding Amount.
$975,000
Planned Expenditure
Project 2016 2017 2018 2019 2020 Total
Reservoir
Recoating $975,000 $975,000
203

Fiscal Year 2016-2017 Non- Operating Budget Rancho California Water District
PROJECT DESCRIPTION
This project involves replacing Well No. 124, including the design and construction of the drilling and
equipping of this replacement well.
JUSTIFICATION
Replacing Well No. 124 provides a sustainable water supply to the District, and ensures future
capacity and resiliency for the groundwater basin. Well No. 124 groundwater production is from the
Pauba Valley Hydrogeologic Subunit, producing from the deeper Temecula Arkose formation. The
annual supply capacity of the District’s groundwater sources is limited by the natural yield of the
groundwater basin, in conjunction with the artificial groundwater recharge the District achieves at
the Valle de los Caballos (VDC) recharge basins. In Fiscal Year 2016/2017 the Pauba Valley
Hydrogeologic Subunit producing from the Temecula Arkose formation has a projected annual
production budget of 6,800 acre-feet (AF) per year (AFY) [including both native and artificial
recharge], of which approximately 6.6 percent or 450 AFY had been historically produced by Well No.
124.
EXPENDITURE SCHEDULE
OPERATION COST IMPACTS The completion of this project will replace lost production of lower cost local groundwater supplies.
The District values production from this well at a $768/AF savings compared to purchasing Tier I
treated import water from MWD, which represents an annual savings of $345,600, based on the
historical annual production rate of 450 AFY. No increased staff labor will result from the proposed
well replacement.
Data Sheet No. 2016-03
Project Well 124 Replacement
Funding Source
Resource Division 50% Rancho 50% Santa Rosa
Funding Amount
$3,600,000
Planned Expenditure
Project 2016 2017 2018 2019 2020 Total
Well 124 Replacement $1,440,000 $1,440,000 $720,000 $3,600,000
204

Fiscal Year 2016-2017 Non- Operating Budget Rancho California Water District
PROJECT BACKGROUND
Well No. 124 was constructed in 1986 and completed to a depth of 982 feet below ground surface with
a louver screen perforated 12-inch diameter steel casing having a 55-foot cement grouted sanitary seal.
Over the life of this well, pumping flow rates have varied with flow rates as high as 1,000 gpm, and
annual production amounts as high as 676 AFY over the past 15 years. Documented problems began
after 10 years of operation as the well is crooked, with a bend in the casing at 300 to 400 ft. Shafts and
couplings were breaking at different levels on the line shaft. In 1999, a larger tube and shaft were
installed to alleviate breakage problems. This worked for 6 years, although the above-ground assembly
(motor and water box) shook uncontrollably because of the line shaft being in a bind in a well that
had a bend in the casing. Well No. 124 also had lost its ability to produce more than 500 gpm due to
declining static water levels. This well was throttled back, continued to shake, and produced a reliable
500 gpm. Because the well also produced calcium carbonate at high levels, the in-line check valve
finally failed from build-up and the result was water going back down the well in higher velocities
than anticipated when the well shut off. The tube unscrewed and the line shaft bound up and failed.
The motor was destroyed internally and scrapped. In 2008, when a hole in the casing was patched at
240 feet, a submersible pump and motor were placed in Well No. 124, in hopes of alleviating the shaft
problems. In 2013, the motor failed, was rehabilitated, and subsequently failed again in 2014.
205

Fiscal Year 2016-2017 Non- Operating Budget Rancho California Water District
PROJECT DESCRIPTION
This project involves replacing Well No. 125, including the design and construction of the drilling and
equipping of this replacement well.
JUSTIFICATION
Replacing Well No. 125 provides a sustainable water supply to the District, and ensures future
capacity and resiliency for the groundwater basin. Well No. 125 groundwater production is from the
Pauba Valley Hydrogeologic Subunit, producing from the deeper Temecula Arkose formation. The
annual supply capacity of the District’s groundwater sources is limited by the natural yield of the
groundwater basin, in conjunction with the artificial groundwater recharge the District achieves at
the Valle de los Caballos (VDC) recharge basins. In Fiscal Year 2016/2017, the Pauba Valley
Hydrogeologic Subunit producing from the Temecula Arkose formation has a projected annual
production budget 6,800 acre-feet (AF) per year (AFY) [including both native and artificial recharge],
of which approximately 7.4 percent or 500 AFY had been historically produced by Well No. 125. EXPENDITURE SCHEDULE
OPERATION COST IMPACTS
The completion of this project will replace lost production of lower cost local groundwater supplies.
The District values production from this well at a $768/AF savings compared to purchasing Tier I
treated import water from MWD, which represents an annual savings of $384,000, based on the
historical annual production rate of 500 AFY. No increased staff labor will result from the proposed
well replacement.
PROJECT BACKGROUND
Well No. 125 was constructed in 1986 and completed to a depth of 990 feet below ground surface with
a louver screen perforated 12-inch diameter steel casing having a 55-foot cement grouted sanitary seal.
Data Sheet No. 2016-04
Project Replacement of Well No. 125
Funding Division
Resource Division 50% Rancho 50% Santa Rosa
Project No. $4,100,000
Planned Expenditure
Project 2016 2017 2018 2019 2020 Total
Well 125
Replacement $1,640,000 $1,640,000 $820,000 $4,100,000
206

Fiscal Year 2016-2017 Non- Operating Budget Rancho California Water District
Over the life of this well, pumping flow rates have varied with flow rates as high as 2,000 gpm, specific
capacities as high as 24 gpm/foot, and annual production amounts as high as 1,300 AFY over the past
15 years. In April of 2011, the well was taken offline due to water quality problems concerning high
bacteriological presence. An extensive rehabilitation effort began to correct the problem, using both
chemical and mechanical methods. During the first stage of the work, a dynamic flow profile and
chemical balance analysis was done by Besst Inc. to determine the relationship of production and the
high heterotrophic plate count (HPC) throughout the louvered section of the well. The well was then
pulled and cleaning began on the well casing. A series of large to medium holes were discovered in the
casing during cleaning with intrusion of gravel pack material into the casing. The holes were
discovered at well depths between 835 feet to 990 feet below ground surface (bgs). The well profile
had shown the majority of the bacteriological presence affecting the well was below 700 feet. Instead
of removing the fill material, the bottom of the casing was capped at 700 feet bgs. In addition, a patch
was installed where the casing reduced from 16-inch to 12-inch at 400 feet bgs to repair another large
hole. Because of the deteriorated condition of the louvered section of the casing from 400 feet to 700
feet bgs, all mechanical methods of rehabilitation ceased and the chemical rehab was continued to
eliminate the high HPC. When completed, the well was sampled and again failed the HPC test in
accordance with California Health Department requirements. Since that time, the well has not been
re-equipped and remains offline. A site evaluation will be completed as part of this project to confirm
siting a replacement well at the existing site versus an alternate site. The evaluation will consider
possible regional groundwater contamination from local surface issues adjacent to the water well.
Pending findings from local groundwater quality evaluations, the District will then consider
replacement of Well No. 125 at an alternative location, as shown in the location map below.
207

Fiscal Year 2016-2017 Non- Operating Budget Rancho California Water District
PROJECT DESCRIPTION
This project involves the construction of a wellhead treatment system for the water produced by Well
No. 102, as well as a connection of the well discharge pipeline to the potable water system.
JUSTIFICATION
Well No. 102 has levels of Manganese (Mn) greater than five times the California Department of
Public Health (CDPH) secondary maximum contaminant level (MCL). These levels are reflective of
Mn concentrations within this hydrogeologic subunit. Recently, RCWD was mandated to mitigate
the elevated Mn concentrations at the two existing potable water wells (Well Nos. 101 and 118) within
this hydrogeologic subunit and, as such, the CDPH granted a temporary use permit allowing RCWD
time to develop a plan for remedial action. The key factors contributing to the recommendation for
improving Well No. 102, as the first priority over Well Nos. 101 and 118, are production capability,
location within District property, available space for treatment system improvement, and the better
condition of Well No. 102 as opposed to Well No. 118. EXPENDITURE SCHEDULE
OPERATION COST IMPACTS
The completion of this project will sustain production of lower cost local groundwater supplies. As
concluded in the 2013 Wellhead Treatment Strategy and Preliminary Design Report, there will be
increased operation and maintenance costs resulting from the proposed wellhead treatment, but these
costs are offset by the anticipated water production cost savings.
PROJECT BACKGROUND
Data Sheet No. 2016-05
Project Well No. 102 Wellhead Treatment System
Funding Division
Resource Division 50% Rancho 50% Santa Rosa
Funding Amount.
$3,700,000
Planned Expenditure
Project 2016 2017 2018 2019 2020 Total
Well 102 Wellhead
Treatment $1,850,000 $1,850,000 $3,700,000
208

Fiscal Year 2016-2017 Non- Operating Budget Rancho California Water District
An engineering study under the job title, Well Treatment Strategy and Preliminary Design Project (Project Nos.
D1570 and D1579), was completed in early January 2013 by Tetra Tech Inc. involving field testing,
engineering evaluation, and preparation of a preliminary design for a well treatment strategy and
preliminary design. The preliminary design effort would serve to form the basis for final project design
and equipment procurement for well improvements within the Murrieta, Santa Gertrudis, and Lower
Mesa Hydrogeologic Subunits. The subject projects’ focus was on six wells (Well Nos. 101, 102, 118,
and 121) due to the criticality of their production capacity currently being impacted by various water
quality issues. The water quality issues are primarily iron, manganese, arsenic, and hydrogen sulfide.
The goal of the projects was to develop an optimized strategy for continued and/or expanded
production of high quality local supply from these hydrogeologic subunits. Among several
recommendations, the study recommended that Well No. 102 be equipped with an on-site Mn
wellhead treatment facility to ensure continued groundwater production from the South Murrieta
Hydrogeologic Subunit. Therefore, at its February 14, 2013 regular meeting, RCWD’s Board of
Directors approved funding for the rehabilitation and final design of wellhead treatment for Well No.
102. District staff have proceeded forward to complete final design for construction of wellhead
treatment for Well No. 102
209

Fiscal Year 2016-2017 Non- Operating Budget Rancho California Water District
PROJECT DESCRIPTION
This project involves the design and construction of centralized pumping and disinfection facilities at
the Upper Valle de los Caballos Recharge/Recovery Facility (UVDCR/RF), including:
o Regional 1305/1380 Pump Station;
o On-Site Generation (OSG) Facility;
o Chlorine Contact Tank (CCT);
o Approximately 4,000 ft of 48-inch diameter pipeline for replumbing of well discharge
pipelines to centralized disinfection facility;
o Approximately 250 ft of 36-inch diameter pipeline from Regional 1305/1380 Pump
Station to 1305 Pressure Zone; and
o Approximately 250 ft of 30-inch diameter pipeline from Regional 1305/1380 Pump
Station to 1380 Pressure Zone.
JUSTIFICATION
As summarized in the 2012 Upper VDC Conjunctive Use Optimization Study, centralized pumping and
disinfection facilities at the UVDCR/RF will allow the District to increase its water production from
the UVDCR/RF. The District’s existing annual artificial recharge is approximately 13,000 acre-feet
(AF) per year (AFY), with a peak flow rate of approximately 11 cfs.
Increasing recharge and recovery at the UVDCR/RF, and consequently decreasing the quantity of
purchased Metropolitan Water District of Southern California (MWD) treated water, results in a
minimum net savings of $174/AF. If raw water is purchased and banked in a wet year, the savings
could be $308/AF, with savings as high as $902/AF if water naturally collected in Vail Lake was
released and recharged.
The UVDCR/RF also provides for a level of resiliency, as banked groundwater or Vail Lake water
would be available during dry weather periods if MWD imposes mandatory reductions.
Data Sheet No. 2016-06
Project
Centralized Pumping and Disinfection Improvements at Upper VDC Recharge/Recovery Facility
Funding Division
Resource Division 50% Rancho Division 50% Santa Rosa Division
Funding Amount.
$16,150,000
210

Fiscal Year 2016-2017 Non- Operating Budget Rancho California Water District
EXPENDITURE SCHEDULE
OPERATION COST IMPACTS
Increasing recharge and recovery at the UVDCR/RF, and consequently decreasing the quantity of
purchased MWD treated water, results in a minimum net savings of $174/AF. If raw water is
purchased and banked in a wet year, the savings could be $308/AF, with savings as high as $902/AF if
water naturally collected in Vail Lake was available and released to offset treated Tier 2 purchases.
PROJECT BACKGROUND
The District commissioned the 2012 Upper VDC Conjunctive Use Optimization Study, which identified four
phases to achieve a build-out recharge goal of 43,135 AFY, representing an increase of 31 cfs of future
production capacity at the Upper VDC over the current 11 cfs. With the construction of Well No. 161
currently underway, the District will have completed all elements of Phase II, with the aforementioned
centralized pumping and disinfection facilities required as part of Phase III.
The District currently receives imported raw water for recharge from turnout EM-21, which has a
capacity of 80 cfs, and is sufficient to provide the additional imported water for recharge and recovery.
In total, 10 new wells will be installed to increase groundwater production by 22,695 AFY through
artificial recharge and recovery. Pumping would occur year round.
Planned Expenditure
Project 2016 2017 2018 2019 2020 Total
Centralized Pumping
and Disinfection
Improvements
$2,500,000 $6,825,000 $6,825,000 $16,150,000
211

Fiscal Year 2016-2017 Non- Operating Budget Rancho California Water District
PROJECT DESCRIPTION
This project involves the construction of disinfection improvements at Ace Bowen No. 1, Ace Bowen No. 2, and
Senga Doherty Pump Stations.
JUSTIFICATION
The District experiences difficulty maintaining water quality in the Santa Rosa Division during
certain seasonal transition periods. The Santa Rosa Division is characterized by pressure zones that
are large in geographic extent, with 19 distribution system storage tanks serving zones in this area.
The area also has significant agricultural demand that can vary widely depending on weather
conditions. As recommended by the 2014 Pump Station
Booster Disinfection Project (Study), booster disinfection is
needed on the west side of the system. This is
consistent with the water quality data reviewed for this
study and with the District’s experience. The analysis
also found that even with future expansion of the
Upper Valle de los Caballos (VDC) Recharge/Recovery
Facility, which has chloramination facilities, very little
water from that facility reaches the west side of the
system [Santa Rosa Division], indicating that booster
chloramination is needed for the west side. Future plans
to improve chloraminated water supplied from the Upper VDC Recharge/Recovery Facility will
improve chloraminated water supply to the east side of the system. Construction of the booster
disinfection stations will provide the operations department with more flexibility and less operational
complexity to maintain disinfection residual within the west side of the distribution system.” EXPENDITURE SCHEDULE
Data Sheet No. 2016-07
Project Pump Station Disinfection Improvements (Construction Only)
Funding Division
Santa Rosa Division
Funding Amount
$5,020,000
Planned Expenditure
Project 2016 2017 2018 2019 2020 Total
PS Disinfection
Improvement $3,345,000 $1,675,000 $5,020,000
212

Fiscal Year 2016-2017 Non- Operating Budget Rancho California Water District
OPERATION COST IMPACTS
This project will result in increased operations and maintenance costs to operate new facilities
(chemicals, labor, etc); however, this project will best ensure the District will maintain its water
quality compliance requirements, and will achieve water quality Strategic Initiative(s). The
completion of this project will provide water operations with more flexibility and less operational
complexity to maintain disinfection.
PROJECT BACKGROUND
The District’s potable water distribution system has two sources of supply: imported surface water
from the Metropolitan Water District of Southern California (MWD) and groundwater wells. MWD
supply is disinfected with chloramines, and the majority of the District’s wells are disinfected with
free chlorine. The intermixing of free chlorine and chloramines can cause degradation of the
chloramine residual, resulting in a subsequent loss of disinfection residual, and thus water quality and
operational challenges.
The aforementioned Study involved highly-sophisticated, computerized water quality modeling to
evaluate the degree of providing additional disinfection at the four proposed locations to provide
additional operational flexibility to maintain water quality.
The results of the Study are summarized as follows:
1. A chloramination disinfection improvement at both
the Ace Bowen No. 1 and No. 2 Pump Stations, and
the Senga Doherty Pump Station are recommended
to be operational as the first phase of disinfection
improvements on the west side (Santa Rosa
Division).
2. A chloramination disinfection improvement at
Joaquin Ranch Pump Station is recommended to be
deferred until additional operational experience is
gained with the disinfection improvements at Ace Bowen and Senga Doherty Pump Stations.
3. A chloramination disinfection improvement at the Rancho California Pump Station is not
recommended due to minimal contribution of supply from this facility during critically low
demand periods requiring higher concentrations of chloraminated water in the east side.
The Study confirmed the need for “booster” chloramine disinfection at the previously identified key
pump station facilities; however, with a modification to proposed disinfection strategy on the east side
of the District (Rancho Division).
213

Fiscal Year 2016-2017 Non- Operating Budget Rancho California Water District
PROJECT DESCRIPTION
This project will replace the existing lining for two recycled water storage ponds located at the Elm
Street Pond Site.
JUSTIFICATION
The Elm Street Pond Site provides seasonal weather storage of recycled water in order to balance the
high demand of recycled water during the summer months and the corresponding lower demand
during the winter months. The existing recycled water storage ponds are lined with a 45-Mil
reinforced polypropylene geomembrane to prevent the loss of water through percolation and to help
with the cleaning of accumulated debris that occurs over time. These pond liners have reached the end
of their useful life, as evidenced by significant deterioration due to exposure to the elements, and are
no longer able to accept minor repairs by patching. The pond liners are required to be replaced to
prevent the loss of stored recycled water through percolation and potential damage to the pond berm
structures. EXPENDITURE SCHEDULE
OPERATION COST IMPACTS
The completion of this project will decrease water loss currently occurring through the perforations in
the deteriorated liners, while decreasing operation and maintenance costs currently associated with
patching the existing liners. No increased staff labor will result from the proposed project.
PROJECT BACKGROUND
Recycled Water Storage Pond No. 3 Lining - Upper (Capacity = 255 AF and Surface Area =
961,000 SF) is located at the Elm Street Pond Site. This pond was last lined with a 45-Mil reinforced
polypropylene geomembrane in 1997. The estimated cost of the lining of the storage pond with a
Data Sheet No. 2016-08
Project Seasonal Storage Pond Facility Liner Replacement
Funding Division
Resource Division 70% Rancho 30% Santa Rosa
Funding Amount
$6,200,000
Planned Expenditure
Project 2016 2017 2018 2019 2020 Total
Seasonal Storage
Pond Facility Liner
Replacement
$4,133,000 $2,067,000 $6,200,000
214

Fiscal Year 2016-2017 Non- Operating Budget Rancho California Water District
similar reinforced polypropylene geomembrane and replacing the appurtenant liner accessories is
$2,300,000.
Recycled Water Storage Pond No. 1/2 Lining - Middle (Capacity = 500 AF and Surface Area =
1,710,000 SF) is located at the Elm Street Pond Site. This pond was last lined with a 45-Mil reinforced
polypropylene geomembrane in 1999. The estimated cost of the lining of the storage pond with a
similar reinforced polypropylene geomembrane and replacing the appurtenant liner accessories is
$3,900,000.
215
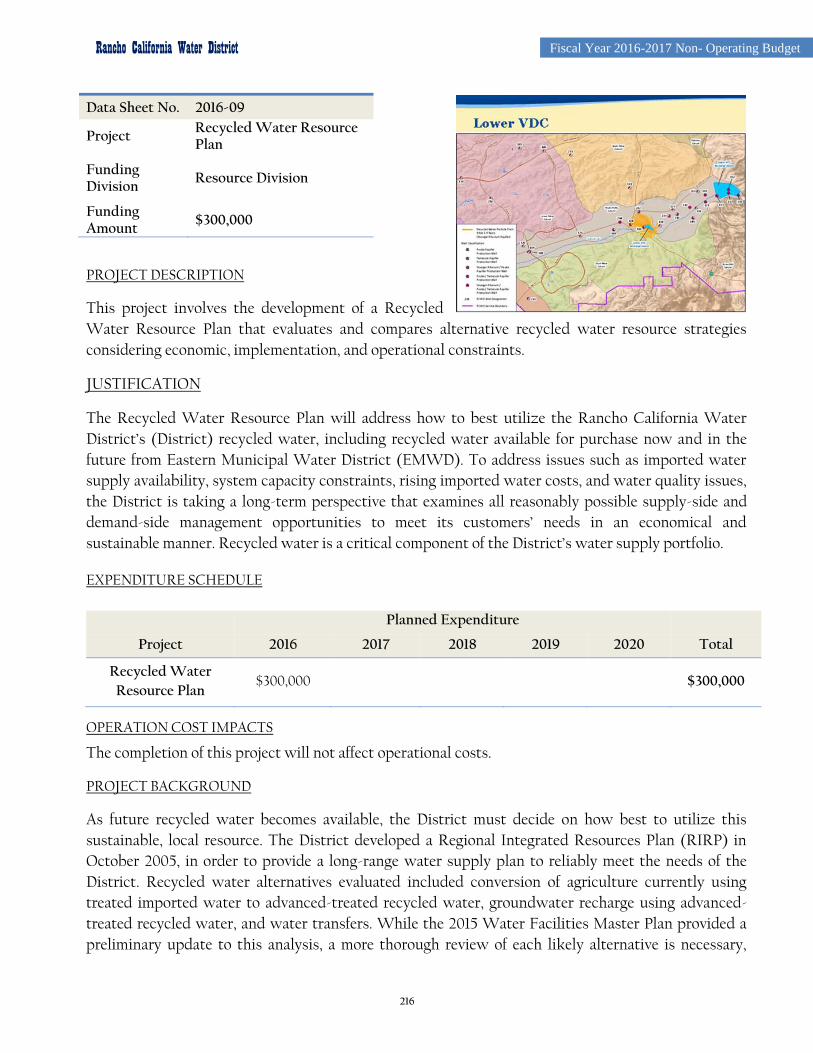
Fiscal Year 2016-2017 Non- Operating Budget Rancho California Water District
PROJECT DESCRIPTION
This project involves the development of a Recycled
Water Resource Plan that evaluates and compares alternative recycled water resource strategies
considering economic, implementation, and operational constraints.
JUSTIFICATION
The Recycled Water Resource Plan will address how to best utilize the Rancho California Water
District’s (District) recycled water, including recycled water available for purchase now and in the
future from Eastern Municipal Water District (EMWD). To address issues such as imported water
supply availability, system capacity constraints, rising imported water costs, and water quality issues,
the District is taking a long-term perspective that examines all reasonably possible supply-side and
demand-side management opportunities to meet its customers’ needs in an economical and
sustainable manner. Recycled water is a critical component of the District’s water supply portfolio. EXPENDITURE SCHEDULE
OPERATION COST IMPACTS
The completion of this project will not affect operational costs.
PROJECT BACKGROUND
As future recycled water becomes available, the District must decide on how best to utilize this
sustainable, local resource. The District developed a Regional Integrated Resources Plan (RIRP) in
October 2005, in order to provide a long-range water supply plan to reliably meet the needs of the
District. Recycled water alternatives evaluated included conversion of agriculture currently using
treated imported water to advanced-treated recycled water, groundwater recharge using advanced-
treated recycled water, and water transfers. While the 2015 Water Facilities Master Plan provided a
preliminary update to this analysis, a more thorough review of each likely alternative is necessary,
Data Sheet No. 2016-09
Project Recycled Water Resource Plan
Funding Division
Resource Division
Funding Amount
$300,000
Planned Expenditure
Project 2016 2017 2018 2019 2020 Total
Recycled Water
Resource Plan $300,000 $300,000
216

Fiscal Year 2016-2017 Non- Operating Budget Rancho California Water District
including preliminary engineering, discussions/agreements with partnering agencies, project costs,
and available funding opportunities. Recycled water alternatives to be evaluated include:
Purchase more recycled water from EMWD for Indirect Potable Reuse (IPR), and deliver it to
the Lower Valle de los Caballos (VDC) recharge basins after Advanced Water Treatment
(AWT);
Purchase more recycled water from EMWD, and convert treated deliveries of imported water
for agriculture to recycled water deliveries after AWT;
Expand capacity of the existing recycled water distribution system beyond 4,500 acre-feet
(AF) per year (AFY) for non-potable reuse (NPR), i.e., landscape irrigation;
Purchase more recycled water from EMWD for Direct Potable Reuse (DPR), and introduce the
recycled water either directly into the distribution system or into a raw water supply upstream
of a future water treatment plant;
Enter into agreements with other agencies to transfer/acquire future recycled water rights in
exchange for additional recycled water, groundwater, and/or imported supply; and
Continue with the District’s current operations, which does not include expanding the
recharge/recovery facility, nor does it include expanding the recycled water distribution
system capacity beyond 4,500 AFY.
In order to receive federal funding, a separate feasibility study is required for the selected alternative,
which has previously been completed and approved for the IPR alternative.
217

Fiscal Year 2016-2017 Non- Operating Budget Rancho California Water District
PROJECT DESCRIPTION
This project involves the preliminary design of structural modifications to Vail Dam, which have been
determined necessary to satisfy seismic and hydrologic mitigation measures.
JUSTIFICATION
The mission of the California Department of Water Resources Division of Safety of Dams (DSOD) is to
protect people against loss of life and property damage from dam failure. Pursuant to this mission, the
DSOD periodically inspects dams and reviews their stability in light of improved design approaches
and requirements, as well as new findings regarding earthquake hazards and hydrologic estimates. As
a result, the DSOD provided a letter to Rancho California Water District (RCWD/District) on
January 18, 2013 regarding the seismic and hydrologic stability review prepared by the DSOD for Vail
Dam. Subsequently, RCWD contracted with URS to perform a variety of work assignments in
response to the DSOD letter.
RCWD, as the owner of Vail Dam, is responsible for the operation and safety of Vail Dam. Currently,
RCWD is completing a comprehensive structural analysis of Vail Dam to determine a remediation
strategy to mitigate seismic and hydrologic (flooding) deficiencies. A comprehensive list of
preliminary remediation measures has been identified in the Dam Remediation Options Draft Report
by URS. Modifying the dam structure to mitigate both seismic and hydrologic deficiencies generally
consists of modifying the spillway and constructing a buttress on the downstream face of the dam.
Preliminary cost estimates of associated remediation construction range from $13 million to $34
million. EXPENDITURE SCHEDULE
OPERATION COST IMPACTS
No increased staff labor will result from the proposed project.
Data Sheet No. 2016-10
Project Vail Dam Modification (Design)
Funding Division
Resource Division
Funding Amount
$2,000,000
Planned Expenditure
Project 2016 2017 2018 2019 2020 Total
Vail Dam
Modifications $500,000 $1,500,000 $2,000,000
218

Fiscal Year 2016-2017 Non-Operating Budget Rancho California Water District
Capital Acquisitions
Capital purchases are non-recurring operating expense items for District-wide use that cost more than $2,000 each and have an estimated useful life of more than a year. The capital purchases include vehicles, shop and field equipment, wastewater/collection equipment, office equipment and furniture, and computer equipment.
The justification for each purchase is determined by whether it is required due to growth, improvements or upgrades, or to replace an existing asset. As these purchases are completed and placed into service, there is a potential impact on the Operating Budget.
The total Capital Acquisition Budget for Fiscal Year 2016-2017 is $1,125,840.
$998,668
$1,206,898
$496,775
$861,127
$413,500 $447,500
$1,094,487
$906,000
$1,010,250
$1,125,840
$0
$200,000
$400,000
$600,000
$800,000
$1,000,000
$1,200,000
$1,400,000
07-08 08-09 09-10 10-11 11-12 12-13 13-14 14-15 15-16 16-17
Capital Acquistion Budget Annual Comparison
219

Fiscal Year 2016-2017 Non-Operating Budget Rancho California Water District Exhibits
2016-2017 CAPITAL ACQUISITION BUDGET
CATEGORY DEPT DESCRIPTION QTY BUDGET $
REPLACEMENT
Vehicles/ 510 23 Ton Heavy Duty Diesel Crane Truck 1 $ 250,000.00
Equipment 550 Unit 308 ¾ Ton 1 39,475.00
Total $ 289,475.00
NEW
Vehicles/
Equipment 550 Electrical Services Van (accommodate new additional personnel) 1 $ 45,840.00
550 Portable Liquid Flowmeter (FLEXIM F601) 1 10,850.00
Total $ 56,690.00
REPLACEMENT
Construction/ 510 Arrowboard Traffic Control 1 $ 6,000.00
Field/Shop/ 510 Welder 1 16,000.00
Testing Equip 550 Digital Tire Balancer to Replace Old Bubble Balancer 1 4,525.00
550 New Style Tier Changer 1 5,950.00
719 Barometric Pressure Transmitter 1 4,000.00
719 Level Transmitters for Recycled Ponds 1 10,000.00
719 Level Probes for Production Wells 1 15,000.00
719 Steven’s Type “F” Chart Recorders 1 6,000.00
719 Replace Humidity and Temperature Transmitters at 4 EW’s 1 25,000.00
729 Wachs Handheld Data Logger 1 3,000.00
729 CM-Level GPS Unit for Mobile Solution 1 8,000.00
739 Chlorine Analyzer at Senga Doherty, Ace Bowen, Norma Marshall 3 60,000.00
Total $ 163,475.00
NEW
Construction/ 510 Trench Plates 1 $ 13,000.00
Field/Shop/ 719 600 PSI Pneumatic Hand Pump 1 2,100.00
719 Equipment to Outfit New Van 1 15,000.00
719 Improvements to SCADA Historian 1 35,000.00
729 Motor Balancer for Pump Motors 1 8,000.00
Equipment
Total $ 73,100.00
220
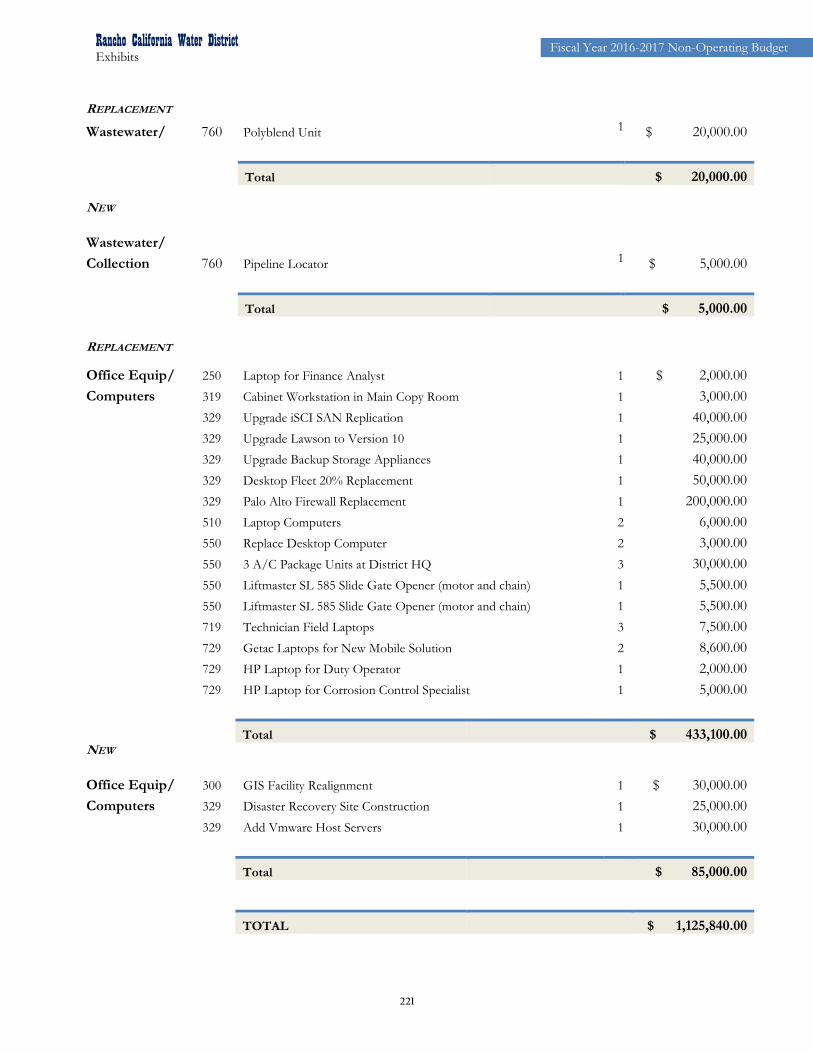
Fiscal Year 2016-2017 Non-Operating Budget Rancho California Water District Exhibits
REPLACEMENT
Wastewater/ 760 Polyblend Unit 1 $ 20,000.00
Total $ 20,000.00 NEW
Wastewater/
Collection 760 Pipeline Locator 1 $ 5,000.00
Total $ 5,000.00
REPLACEMENT
Office Equip/ 250 Laptop for Finance Analyst 1 $ 2,000.00
Computers 319 Cabinet Workstation in Main Copy Room 1 3,000.00
329 Upgrade iSCI SAN Replication 1 40,000.00
329 Upgrade Lawson to Version 10 1 25,000.00
329 Upgrade Backup Storage Appliances 1 40,000.00
329 Desktop Fleet 20% Replacement 1 50,000.00
329 Palo Alto Firewall Replacement 1 200,000.00
510 Laptop Computers 2 6,000.00
550 Replace Desktop Computer 2 3,000.00
550 3 A/C Package Units at District HQ 3 30,000.00
550 Liftmaster SL 585 Slide Gate Opener (motor and chain) 1 5,500.00
550 Liftmaster SL 585 Slide Gate Opener (motor and chain) 1 5,500.00
719 Technician Field Laptops 3 7,500.00
729 Getac Laptops for New Mobile Solution 2 8,600.00
729 HP Laptop for Duty Operator 1 2,000.00
729 HP Laptop for Corrosion Control Specialist 1 5,000.00
Total $ 433,100.00 NEW
Office Equip/ 300 GIS Facility Realignment 1 $ 30,000.00
Computers 329 Disaster Recovery Site Construction 1 25,000.00
329 Add Vmware Host Servers 1 30,000.00
Total $ 85,000.00
TOTAL $ 1,125,840.00
221

Fiscal Year 2016-2017 Non-Operating Budget Rancho California Water District Exhibits
FISCAL YEAR 2016-2017 CAPITAL ACQUISITION BUDGET TOTALS
Replacement Total
Rancho Division Debt Service/Capital Improvement
Santa Rosa Debt Service/Capital Improvement
Wastewater Replacement
$443,025.00
443,025.00
20,000.00
TOTAL $906,050.00
New Total
Rancho Division Debt Service/Capital Improvement
Santa Rosa Debt Service/Capital Improvement
$107,395.00
107,395.00
Wastewater General Fund 5,000.00
TOTAL $219,790.00
TOTAL $1,125,840.00
222

Fiscal Year 2016-2017 Non-Operating Budget Rancho California Water District Exhibits
NON-OPERATING WATER AND WASTEWATER RATES SUMMARY
Water Rates RANCHO DIVISION SANTA ROSA DIVISION Description FY 2015-2016 FY 2016-2017 FY 2015-2016 FY 2016-2017
Ad Valorem Assessment
$0.30 per $100 of Assessed Land Value
$0.30 per $100 of Assessed Land Value
$0.50 per $100 of Assessed Land Value
$0.50 per $100 of Assessed Land Value
Standby Charge
N/A N/A
Area 1-$69.92 per acre/parcel
Area 1-$69.92 per acre/parcel
Area 1A-$69.92 per acre/parcel, first 40 acres, $62.10 per acre thereafter
Area 1A-$69.92 per acre/parcel, first 40 acres, $62.10 per acre thereafter
Area 2-$48 per acre/parcel
Area 2-$48 per acre/parcel
Area 3-$23.50 per acre/parcel
Area 3-$23.50 per acre/parcel
Wastewater Rates
RANCHO DIVISION SANTA ROSA DIVISION
Description FY 2015-2016 FY 2016-2017 FY 2015-2016 FY 2016-2017 **Standby
Charge
ID’s 2 and 3
N/A
N/A
$28.50 per unconnected
parcel
$28.50 per unconnected
parcel
*Wastewater Capacity fee per EDU
N/A N/A $8,859 $9,568
Wastewater
Replacement Surcharge
N/A N/A $4.00 per
EDU/month $4.00 per
EDU/month
Wastewater
Debt Service Surcharge
N/A N/A $9.25 per
EDU/month $9.50 per
EDU/month
*Santa Rosa Water Reclamation Facility (SRWRF) Improvement District Nos. 2 & 3 ** SRWRF Standby Charge - $28.50 per acre or per parcel on all land that has not paid a capacity fee as of March 1, 2015
223

Fiscal Year 2016-2017 Non-Operating Budget Rancho California Water District Exhibits
WATER CAPACITY FEES
METER SIZE
RANCHO DIVISION
SANTA ROSA DIVISION
FY 2015-2016 FY 2016-2017 FY 2015-2016 FY 2016-2017
3/4" $ 1,603 $ 1,635 $ 2,458 $ 2,507
1" 2,671 2,725 4,098 4,179
1-1/2" 5,343 5,450 8,189 8,353
2" 6,677 6,811 10,236 10,440
2" Turbine 8,547 8,718 13,104 13,366
3" 16,026 16,347 24,573 25,064
4" 40,068 40,870 61,431 62,660
6" 82,804 84,460 126,959 129,498
8" 133,556 136,227 204,772 208,868
224

Fiscal Year 2016-2017 Non-Operating Budget Rancho California Water District Exhibits
CONSOLIDATED NON-OPERATING BUDGET
Revenue
Combined Total
Rancho Division
Santa Rosa Division
SRWRF
AV Assessments 22,336,000 14,548,000 7,788,000 -
1% Assessments 15,843,552 13,391,063 2,452,489 -
Standby Assessments 2,772,349 - 2,740,389 31,960
Interest Revenue 4,617,925 3,760,950 382,463 474,512
Re-class Operating Interest (493,000) (400,000) (39,000) (54,000)
Federal Direct Pay Interest Subsidy 2,419,482 1,238,168 1,162,486 18,827
CSI Solar Rebate 520,670 89,421 431,250 -
Connection Fee 1,550,105 447,400 105,291 997,415
Connection Fee Contra (1,550,105) (447,400) (105,291) (997,415)
Fire Service Charge 237,947 165,507 72,440 -
Other Debt Service 623,464 - - 623,464
Other Income Replacement 399,017 - - 399,017
Debt Service Share from JPA 2,521,934 110,290 43,495 2,368,148
Vail Lake Operations (921,263) (644,884) (276,379) -
Other Tier IV Programs 2,175,740 1,438,735 737,005 -
Capital Grants 1,200,000 600,000 600,000 -
Re-class to Operations - - - -
Total Non-Operating Revenue 54,253,816 34,297,250 16,094,639 3,861,928
Expenditures
Depreciation & Amortization 25,755,430 12,760,684 10,288,329 2,706,417
Bond Discount Amortization 270,272 69,793 111,985 88,493
CFD Assessment 327,180 229,026 98,154 -
Bond Interest 17,259,706 6,800,695 7,480,720 2,978,292
Capital Reserve Contribution to JPA - - - 7,130,679
Investment Management Expense 126,544 97,739 12,270 16,536
Other 250,593 182,530 45,883 2,180
Total Non-Operating Expenditures 43,969,724 20,140,467 18,037,340 12,922,596
Net Non-Operating Revenue 10,284,092 14,156,783 (1,942,702) (9,060,668)
Adjustments to Cash Basis
Add:
Depreciation & Amortization 25,755,430 12,760,684 10,288,329 2,706,417
Bond Discount Amortization 270,272 69,793 111,985 88,493
Connection Fees Reimbursement from Debt Financing
1,550,105 21,560,000
447,400 9,440,000
105,291 12,120,000
997,415 -
Less:
Capital Improvement Projects (34,045,000) (16,517,000) (17,487,500) (40,000)
Capital Acquisition Items (1,120,840) (550,420) (550,420) (20,000)
Debt Principal (5,990,000) (3,376,352) (2,597,188) (16,460)
Net Cash Adjustment 7,980,466 2,274,105 1,990,496 3,715,865
Net Non-Operating Cash Sources/(Uses) 18,264,558 16,430,889 47,795 (5,344,804)
225

Fiscal Year 2016-2017 Non-Operating Budget Rancho California Water District Exhibits
The following graph and schedules identify the major sources of revenue of the 2016-2017 non-operating budget.
MAJOR NON-OPERATING REVENUE
Revenue Actual FY 2014-15
Budget FY 2015-16
Budget FY 2016-17
Percent Change
AV Assessments $22,030,739 $20,832,000 $22,336,000 7.2% 1% Assessments 14,693,838 15,087,885 15,843,552 5.0% Standby Assessments 2,861,813 2,778,090 2,772,349 -0.2% Interest Revenue 4,592,096 4,733,984 4,617,925 -2.5% Reclass Operating Interest (803,000) (518,000) (493,000) -4.8% Federal Direct Pay Interest Subsidy 2,137,491 2,409,098 2,419,482 0.4% CSI Solar Rebate 782,963 865,044 520,670 -39.8% Capacity Fee 1,752,059 1,119,084 1,550,105 38.5% Capacity Fee Contra (1,752,059) (1,119,084) (1,550,105) 38.5% Fire Service Charge 234,853 234,853 237,947 1.3% Other Non-Operating Income (806,646) - - - Other Income Debt Service 1,319,378 881,489 623,464 -29.3% Other Income Replacement 554,528 391,773 399,017 1.8% Debt Service Share from JPA 83,724 1,803,656 2,521,934 39.8% Vail Lake Operations (1,068,912) (1,077,790) (921,263) -14.5% Other Tier IV Programs 612,764 441,870 2,175,740 392.4% Capital Grants - - 1,200,000 - Reclass to Operations - - - -
TOTALS $47,225,629 $ 48,863,952 $ 54,253,816 11.0%
226

Fiscal Year 2016-2017 Non-Operating Budget Rancho California Water District
Explanation of Major Non-Operating Revenue Sources
AV ASSESSMENTS: Revenues received from the annual ad valorem assessments levied by the District to pay for annual debt service on water improvement bonds which funded capital facilities. The rate in the Rancho Division is .30 per $100 of assessed land value and is .50 per $100 of assessed land value for the Santa Rosa Division.
For fiscal year 2016-2017 revenue is projected to be $22,336,000. AV assessment revenue is projected to increase by 7.2% compared to fiscal year 2015-2016. This increase is due to an increase projected in assessed values.
1% ASSESSMENT: Revenues received from the District’s share of the 1% property tax that is levied by the County based on land value and distributed to agencies is used for debt service only.
For fiscal year 2016-2017 revenue is projected to be $15,843,552. The 1.0% assessment revenue is projected to increase by 5.0% compared to fiscal year 2015-2016. This increase is due to an increase projected in assessments.
STANDBY ASSESSMENTS: Revenues received from the annual standby charges levied to pay annual debt service on bonds. This assessment is a fixed charge per acre/parcel based upon the estimated benefit from water facilities constructed to meet water supply demands.
For fiscal year 2016-2017 revenue is projected to be $2,772,349. The standby assessment revenue is projected to remain relatively unchanged compared to fiscal year 2015-2016.
INTEREST REVENUE: Revenues received from the interest earned on general funds, assessment district funds, capital replacement funds, capacity fees funds, and various bond funds. District funds are pooled together for investing purposes. Interest earnings are allocated based on prior month cash balances for the various funds.
For fiscal year 2016-2017 revenue is projected to be $4,617,925. The interest revenue is projected to decrease by 2.5% compared to fiscal year 2015-2016. This decrease is due to stable interest rates and slightly lower cash balances due to cash funding CIP in FY2015-16.
$22.03
$20.83
$22.34
14-15
15-16
16-17
AV Assessments
Actual 14-15 Budget 15-16 Budget 16-17
$2.86
$2.78
$2.77
14-15
15-16
16-17
Standby Assessments
Actual 14-15 Budget 15-16 Budget 16-17
227

Fiscal Year 2016-2017 Non-Operating Budget Rancho California Water District
RE-CLASS OPERATING INTEREST: This activity represents the budgeted re-class of general fund interest earnings being used for operations.
For fiscal year 2016-2017 the re-class to operations is projected to be $493,000. The re-class to operations is projected to decrease by 4.8% compared to fiscal year 2015-2016. This decrease is due to lower investment earnings.
FEDERAL DIRECT PAY SUBSIDY: In November 2010 the District issued $100,785,000 of Build America Bonds (BABs). Under the BABs Program the District will receive a 35% interest subsidy on the issue. In October 2011, the District issued $9,870,000 of Qualified Energy Conservation Bonds (QECBs). Under the QECB program, the District will receive a 70% interest subsidy on the issue. Congress passed a sequestration for direct-pay bond subsidies that cuts the interest subsidy on the bonds by 6.8%. Therefore, the District will receive a 65% interest subsidy on the BABs and 32.6% interest subsidy on the QECBs. For fiscal year 2016-2017, the District expects to receive $2,419,482, which is projected to remain almost the same as fiscal year 2015-2016.
CSI SOLAR REBATE: In January 2012 the District installed new solar facilities at the District headquarters and the Senga Doherty Pump Station. These facilities qualify for the California Solar Initiative (CSI) Rebate Program, based on the amount of energy produced by the facilities. For fiscal year 2016-2017 the District expects to receive $520,670. The CSI solar rebate is projected to decrease by 39.8% compared to fiscal year 2015-2016. This decrease is due to the natural degradation of the equipment and the expiration of a government subsidy on January 31, 2017.
CAPACITY FEE: Revenues received from the collection of water and sewer connection fees also referred to as capacity fees. The amount charged for the purchase of capacity in the District’s water or sewer system is based upon the rated maximum of the meter for water and the number of EDU’s for sewer.
For fiscal year 2016-2017 revenue is projected to be $1,550,105. Capacity fee revenue is projected to increase by 38.5% compared to fiscal year 2015-2016. This is due to improved development activity compared to the prior year.
FIRE SERVICE CHARGE: Revenues received for fire service charges levied on the property tax bill of parcels requiring more than a residential (1,000 gpm) fire flow requirement. The charge is a per acreage assessment and is used to help offset the additional capital cost of up-sizing District facilities constructed to provide adequate fire flow.
For fiscal year 2016-2017 revenue is projected to be $237,947. The fire service charge revenue is projected to remain the relatively the same as fiscal year 2015-2016.
OTHER- INCOME DEBT SERVICE: Revenues received from a wastewater surcharge assessed as a monthly debt service charge on the wastewater billing. This surcharge will increase from $9.25 per EDU to $9.50 per EDU for fiscal year 2016-2017 in consideration of increased capital cost sharing through the SRRRA JPA.
For fiscal year 2016-2017 revenue is projected to be $623,464. The other income debt service is projected to decrease by 29.3% compared to fiscal year 2015-2016. This is due to the debt sharing through the SRRRA JPA.
$1,752
$1,119
$1,550
14-15
15-16
16-17
Capacity Fee
Actual 14-15 Budget 15-16 Budget 16-17
228

Fiscal Year 2016-2017 Non-Operating Budget Rancho California Water District
OTHER- INCOME REPLACEMENT: Revenues received from a wastewater surcharge assessed for facility replacement on the monthly wastewater billing. The surcharge for wastewater will remain at $4.00 per EDU for fiscal year 2016-2017.
For fiscal year 2016-2017 revenue is projected to be $399,017. The other income replacement revenue is projected to increase 1.8% compared to fiscal year 2015-2016.
DEBT SERVICE SHARE FROM JPA (FORMERLY CONTRACT
DEBT SERVICE REVENUE): Revenues received as fixed annual payments for capital facilities from wastewater contract agencies. The revenues are required for annual
payment for debt service or construction of the wastewater facility and are based on the ultimate plant capacity requirements of each agency. In 2015, the District along with two contract agencies (Eastern and Western Water Districts) formed a Joint Powers Authority (JPA) to take over management of the facility from the District.
For fiscal year 2016-2017 revenue is projected to be $2,521,934. The contract debt service revenue is projected to increase by 39.8% compared to fiscal year 2015-2016.
OTHER TIER IV PROGRAMS: Annually the District evaluates its Tier IV revenue and reclassifies a portion of the funds to Non-Operating Reserves for the funding of the capitalized projects identified to be funded from the Tier IV revenues.
For fiscal year 2016-2017 revenue is projected to be $2,175,740. The Tier IV program is projected to increase 392.4% for fiscal year 2015-2016. The increase is due to an increase in the Tier IV rate and increased Tier IV water sales.
VAIL LAKE OPERATIONS: In 2014, the District purchased approximately 7,000 acres surrounding Vail Lake. The District now owns and operates Vail Lake Campground and Marina and has contracted with Urban Parks Concessionaire to manage the facilities. This allows the District to concentrate on the core business of serving water and providing sewer collection and treatment to our community.
For fiscal year 2016-2017 net operations are projected to be -$921,263. Vail Lake Operations is projected to decrease by 14.5% compared to fiscal year 2015-2016 due to fiscal year 2015-16 having significant initial operating start-up capital investment needs.
RE-CLASS TO OPERATIONS: Annually the District evaluates its net non-operating position and determines if any available amount can be reclassified to Operating Reserves for bolstering Rate Stabilization, Working Capital, and Drought Reserves.
For fiscal year 2016-2017, the District will not re-class any funds to operations.
$555
$392
$399
14-15
15-16
16-17
Other- Income Replacement
Actual 13-14 Budget 15-16 Budget 16-17
229

Fiscal Year 2016-2017 Non-Operating Budget Rancho California Water District Exhibits
The following graph and schedules identify the major non-operating expenses of the 2016-2017 non-operating budget.
MAJOR NON-OPERATING EXPENSES
Expenses Actual FY 2014-15
Budget FY 2015-16
Budget FY 2016-17
Percent Change
Depreciation & Amortization $24,236,851 $24,327,154 $25,755,430 5.9% Bond Discount Amortization 270,272 270,271 270,272 0.0% CFD Assessment 115,688 215,043 327,180 52.1% Bond Interest Expense 16,520,982 17,633,797 17,259,706 -2.1% Investment Management Expense 128,793 133,182 126,544 -5.0% Other 312,072 219,676 230,593 5.0%
TOTALS $ 41,584,658 $ 42,799,123 $ 43,969,724 2.7%
230

Fiscal Year 2016-2017 Non-Operating Budget Rancho California Water District
Explanation of Major Non-Operating Expenses
DEPRECIATION AND AMORTIZATION: This expenditure includes such amounts of depreciation and amortization chargeable to each month’s operations calculated on the straight line method over the useful lives of the assets.
For fiscal year 2016-2017 expenses are projected to be $25,755,430. Depreciation and amortization expense is projected to increase by 5.9% compared to the fiscal year 2015-2016. This increase is due to an increase in District assets.
BOND DISCOUNT AMORTIZATION: This
expenditure includes amortization of bond discount chargeable to each month’s operations. The costs are amortized on the straight-line method based on the estimated term of the related bond debt.
For fiscal year 2016-2017 expenses are projected to be $270,272. Bond discount amortization expense is projected to remain the same as fiscal year 2015-2016.
CFD ASSESSMENT: This expenditure includes the amount of interest expense applicable to
outstanding long-term debt issued by the Community Facility District No. 89-5. The District owns all the property in Zone B. The actual special tax requirement will depend on the actual variable monthly interest payments due on the Refunding Bonds. The District will be responsible for the difference in the actual special tax requirement and the amount levied on Zone A parcels.
For fiscal year 2016-2017 expenses are projected to be $327,180. CFD assessment expense is projected to increase 52.1% compared to fiscal year 2015-2016. This increase is due to increased administrative expenses.
BOND INTEREST: This expenditure includes the amount of interest expense applicable to outstanding long-term debt issued by the District. The expense is accrued monthly and there is a corresponding liability account for each bond interest account.
For fiscal year 2016-2017 expense is projected to be $17,259,706. Interest expense is projected to decrease by 2.1% compared to the fiscal year 2015-2016. This decrease is due to the amortization schedule of the District’s debt service.
INVESTMENT MANAGEMENT EXPENSE: The District utilizes an external professional management firm to execute its investment policy. For fiscal year 2016-2017, this expense is projected to be $126,544. A 5.0% decrease is projected over fiscal year 2015-2016 and is due to decreased portfolio balances.
OTHER: This expenditure includes banking fees, county charges related to administrating the property tax rates, and other miscellaneous expense.
$116
$215
$327
14-15
15-16
16-17
CFD Assessment
Actual 14-15 Budget 15-16 Budget 16-17
$270
$270
$270
14-15
15-16
16-17
Bond Discount Amortization
231

Fiscal Year 2016-2017 Non-Operating Budget Rancho California Water District
For fiscal year 2016-2017 expense is projected to be $230,593. Other expense is projected to increase by 5.0% compared to fiscal year 2015-2016.
232

Fiscal Year 2016-2017 Non-Operating Budget Rancho California Water District Exhibits
Fund Structure
Non-Operating Budget
Debt Service Capital Improvement Fund
The Debt Service Capital Improvement (DSCI) Fund is used to account for money received by the District from the collection of property assessments, standby charges, and monthly wastewater surcharges. Money placed in the DSCI fund is used for the payment of principal and interest on bonds and to cash fund capital improvement projects. Capital projects can include new facilities as well as replacement water facilities.
Wastewater Replacement Fund
The Wastewater Replacement Fund is used to account for money received by the District from the payment of the monthly depreciation surcharge attached to the monthly wastewater service charge. Money placed in the wastewater replacement fund is used for the replacement of capital facilities.
Capacity Fee Fund
Water Capacity Fee: charges paid by new customers prior to connecting to the District’s system. The District has taken significant steps to create a capacity fee program that equitably allocates capital between existing and future users and complies with the requirements of AB1600. Money placed in the water capacity fee fund is used for the construction of capital facilities.
Wastewater Capacity Fee: charges paid by new customers prior to connecting to the District’s wastewater system. Money placed in the wastewater capacity fund is used for the funding of wastewater facilities and for the payment of principal and interest on construction bonds issued to construct wastewater facilities. The debt service, capital facility and replacement reserve funds balances are evaluated on an annual basis during the adoption of the District’s non-operating budget. The non-operating budget is a 30-year financial plan which projects debt costs and facility requirements and balances those needs with revenue and fund balance projections.
Long Range Financial Plan
The Districts LRFP schedules, on the following pages, demonstrates its ability to fund the projected “new and Replacement” facility requirements through 2066. The LRFP incorporates projects of the revenues, use of cash reserves, and debt service on current and future debt needed to finance these facility requirements. Included in the LRFP is a projected reserve balance for each of the 50 years included in the plan. One way to view the ability of the District to demonstrate its ability to fund these facilities is to look at the ending reserve balances each year. A positive reserve balance projection demonstrates that the existing and projected revenues will be sufficient to either cash fund or pay debt service on the financing of the facilities. For planning purposes after five years in the LRFP all facilities are assumed to be financed.
233

Rancho Division Rancho California Water District Long-Range Capital Financing Plan
Fiscal Year Ending June 30, 2017 2018 2019 2020 2021 2022 2023 Beginning Fund Balance $144,707,788 151,225,849 159,783,625 171,756,137 184,360,292 196,101,604 222,147,013 Funding Sources
Taxes & Assessments
1% General Purpose (1) 13,391,063 13,725,839 14,137,615 13,996,238 14,556,088 15,138,331 15,743,865
Ad Valorem Assessments (2) 14,548,000 14,919,000 15,374,000 15,916,000 13,936,000 14,494,000 15,073,000
Capacity Fees 447,400 588,172 546,784 560,453 574,465 961,852 985,899
Federal Direct Pay Interest Subsidy 1,238,168 1,238,168 1,238,168 1,238,168 1,238,168 1,238,168 1,238,168
CSI Solar Rebate 89,421
Fire Service Charges (3) 165,507 165,507 165,507 165,507 165,507 165,507 165,507
Other Tier IV Programs 1,438,735 1,438,735 1,438,735 1,438,735 1,438,735 1,438,735 1,438,735
Total Taxes and Assessments 31,318,293 32,075,422 32,900,809 33,315,102 31,908,963 33,436,594 34,645,174
Other Revenues
External DRF (4) 105,025 105,025 105,025 300,071 300,071 300,071 300,071
Interest Internal DRF (5) 3,655,925 3,402,582 3,994,591 4,293,903 5,069,908 5,883,048 7,775,145
Vail Lake Operations (644,884) -
Adv. Treated Debt CS JPA (6) 110,290 110,260 135,522 129,142 207,146 177,204 160,815
Capital Grant Revenue 600,000 - - - - - -
Total Other Revenues 3,826,356 3,617,866 4,235,137 4,723,116 5,577,124 6,360,322 8,236,031
Total Funding Sources 35,144,650 35,693,288 37,135,946 38,038,218 37,486,087 39,796,917 42,881,205
Funding Uses
Debt Service (7) 10,033,070 10,572,038 10,871,251 11,671,949 9,130,979 9,133,143 10,095,255
Misc. Bond Fees/Other Expenses 653,271 424,000 424,000 424,000 424,000 424,000 424,000
JPA Capital CS – Tertiary Trt (8) 61,504 61,504 61,504 61,504 61,504
Transfer to Operating Reserve Fund - - - - - - -
Pay-Go-Capital 17,940,248 16,139,473 13,806,679 13,276,610 16,128,292 4,132,860 4,145,015
Total Funding Uses 28,626,589 27,135,511 25,163,434 25,434,063 25,744,775 13,751,508 14,725,774
Net Sources/(Uses) 6,518,061 8,557,777 11,972,511 12,604,155 11,741,312 26,045,409 28,155,431
Ending Fund Balance $151,225,849 159,783,625 171,756,137 184,360,292 196,101,604 222,147,013 250,302,444
Projected Debt Balance $125,218,457 128,317,130 130,074,598 125,029,946 122,357,146 119,558,947 172,042,617
Note 1: 1% Tax revenue is indexed at 4.0% growth for FY 16/17, 2.5% growth for FY 17/18, 3.0% growth for FY 19/20, then 4.0% per year thereafter. Note 2: Ad Valorem revenue is based upon a rate of $0.30 per $100 of assessed land value indexed at 3.5% growth for FY 16/17, 2.5% growth for FY
17/18, 3.0% growth for FY 18/19, 3.5% growth for FY 19/20, then at 4.0% a year thereafter. Note 3: Fire Service is property assessment applied to commercial properties related to upsizing capital facilities to meet fire flow requirements. Note 4: Reserve funds consist of investment between 1.4% and 4.0% and principal maturities. Note 5: Projected investment earnings are calculated at 2.25% for FYs 16/17, and FY 17/18, 2.5% for FY 18/19 and FY 19/20, 2.75% for FY 20/21,
3.0% for FY 21/22, 3.50% for FY 22/23, then 4% per year thereafter.
Note 6: Cost share of existing debt service per SRRRA JPA Agreement with Elsinore Valley MWD and Wester MWD. Note 7. Debt service costs include taxes for CFD 89-5, ends in FY 2028. Note 8. RCWD’s share of new facility project costs (SRWRF Rehabilitation Project) from the SRRRA JPA.
234

Rancho Division Rancho California Water District Long-Range Capital Financing Plan
Fiscal Year Ending June 30, 2024 2025 2026 2027 2028 2029 2030 Beginning Fund Balance $ 250,302,444 278,220,105 308,578,795 337,296,086 368,276,399 401,375,331 437,169,284 Funding Sources
Taxes & Assessments
1% General Purpose (1) 16,373,619 17,028,564 17,709,707 18,418,095 19,154,819 19,921,011 20,717,852
Ad Valorem Assessments (2) 15,676,000 16,303,000 13,772,000 14,323,000 14,896,000 15,492,000 16,112,000
Capacity Fees 1,010,546 1,035,810 1,061,705 948,785 972,504 996,817 1,277,172
Federal Direct Pay Interest Subsidy 1,238,168 1,238,168 1,238,168 1,238,168 1,231,683 1,218,175 1,203,397
CSI Solar Rebate
Fire Service Charges (3) 165,507 165,507 165,507 165,507 165,507 165,507 165,507
Other Tier IV Programs 1,438,735 1,438,735 1,438,735 1,438,735 1,438,735 1,438,735 1,438,735
Total Taxes and Assessments 35,902,576 37,209,784 35,385,822 36,532,290 37,859,249 39,232,246 40,914,663
Other Revenues
External DRF (4) 300,071 300,071 300,071 300,071 300,071 300,071 3,075,039
Interest Internal DRF (5) 10,012,098 11,128,804 12,343,152 13,491,843 14,731,056 16,055,013 17,486,771
Vail Lake Operations
Adv. Trt Debt CS from JPA (6) 158,782 158,138 156,797 155,474 153,796 153,035 152,345
Capital Grant Revenue
Total Other Revenues 10,470,950 11,587,013 12,800,019 13,947,388 15,184,922 16,508,119 20,714,156
Total Funding Sources 46,373,526 48,796,798 48,185,841 50,479,678 53,044,171 55,740,365 61,628,819
Funding Uses
Debt Service (7) 13,812,949 13,782,547 13,798,342 13,816,001 14,248,456 14,235,941 13,995,612
Misc. Bond Fees/Other Expenses 424,000 424,000 424,000 424,000 424,000 424,000 424,000
JPA Capital CS – Tertiary Trt. (8) 61,504 61,504 61,504 61,504 61,504 61,504 61,504
Transfer to Operating Reserve Fund - - - - - - -
Pay-Go-Capital 4,157,412 4,170,057 5,184,704 5,197,860 5,211,279 5,224,966 5,238,928
Total Funding Uses 18,455,865 18,438,108 19,468,550 19,499,365 19,945,239 19,946,411 19,720,044
Net Sources/(Uses) 27,917,661 30,358,690 28,717,291 30,980,313 33,098,932 35,793,954 41,908,775
Ending Fund Balance $278,220,105 308,578,795 337,296,086 368,276,399 401,375,331 437,169,284 479,078,059
Projected Debt Balance $167,050,675 161,864,467 156,426,968 150,724,608 144,319,262 137,633,512 221,190,890
Note 1: 1% Tax revenue is indexed at 4.0% growth for FY 16/17, 2.5% growth for FY 17/18, 3.0% growth for FY 19/20, then 4.0% per year thereafter. Note 2: Ad Valorem revenue is based upon a rate of $0.30 per $100 of assessed land value indexed at 3.5% growth for FY 16/17, 2.5% growth for FY
17/18, 3.0% growth for FY 18/19, 3.5% growth for FY 19/20, then at 4.0% a year thereafter. Note 3: Fire Service is property assessment applied to commercial properties related to upsizing capital facilities to meet fire flow requirements. Note 4: Reserve funds consist of investment between 1.4% and 4.0% and principal maturities. Note 5: Projected investment earnings are calculated at 2.25% for FYs 16/17, and FY 17/18, 2.5% for FY 18/19 and FY 19/20, 2.75% for FY 20/21,
3.0% for FY 21/22, 3.50% for FY 22/23, then 4% per year thereafter.
Note 6: Cost share of existing debt service per SRRRA JPA Agreement with Elsinore Valley MWD and Wester MWD. Note 7. Debt service costs include taxes for CFD 89-5, ends in FY 2028. Note 8. RCWD’s share of new facility project costs (SRWRF Rehabilitation Project) from the SRRRA JPA.
235

Rancho Division Rancho California Water District Long-Range Capital Financing Plan
Fiscal Year Ending June 30, 2031 2032 2033 2034 2035 2036 2037
Beginning Fund Balance $ 479,078,059 511,536,674 548,248,819 588,769,181 632,398,699 683,034,030 723,984,177
Funding Sources
Taxes & Assessments
1% General Purpose (1) 21,546,566 22,408,429 23,304,766 24,236,956 25,206,435 26,214,692 27,263,280
Ad Valorem Assessments (2) 12,884,000 13,399,000 13,935,000 14,492,000 15,072,000 15,675,000 16,302,000
Capacity Fees 1,309,101 1,341,829 1,375,374 1,409,759 1,445,003 1,481,128 1,518,156
Federal Direct Pay Interest Subsidy 1,187,409 1,179,176 1,155,863 1,108,011 1,057,906 954,947 796,881
CSI Solar Rebate
Fire Service Charges (3) 165,507 165,507 165,507 165,507 165,507 165,507 165,507
Other Tier IV Programs 1,438,735 1,438,735 1,438,735 1,438,735 1,438,735 1,438,735 1,438,735
Total Taxes and Assessments 38,531,318 39,932,675 41,375,246 42,850,968 44,385,585 45,930,009 47,484,559
Other Revenues
External DRF (4) 189,072 1,228,967 147,476 147,476 3,834,376 - -
Interest Internal DRF (5) 19,163,122 20,461,467 21,929,953 23,550,767 25,295,948 27,321,361 28,959,367
Vail Lake Operations
Adv. Trt Debt CS from JPA (6) 181,813 181,860 22,451 22,345 22,324 4,341 4,272
Total Other Revenues 19,534,007 21,872,294 22,099,880 23,720,588 29,152,647 27,325,702 28,963,639
Total Funding Sources 58,065,325 61,804,969 63,475,126 66,571,556 73,538,233 73,255,711 76,448,198
Funding Uses
Debt Service (7) 19,121,367 18,592,954 16,440,079 16,412,242 16,357,690 27,917,868 27,750,259
Misc. Bond Fees/Other Expenses 424,000 424,000 424,000 424,000 424,000 424,000 424,000
JPA Capital CS – Tertiary Trt. (8) 61,504 61,504 61,504 61,504 61,504 61,504 61,504
Transfer to Operating Reserve Fund - - - - - - -
Pay-Go-Capital 5,999,840 6,014,365 6,029,181 6,044,293 6,059,707 3,902,192 3,918,229
Total Funding Uses 25,606,710 25,092,823 22,954,764 22,942,039 22,902,901 32,305,564 32,153,993
Net Sources/(Uses) 32,458,615 36,712,145 40,520,362 43,629,517 50,635,332 40,950,147 44,294,205
Ending Fund Balance $511,536,674 548,248,819 588,769,181 632,398,699 683,034,030 723,984,177 768,278,383
Projected Debt Balance $213,297,151 205,610,731 199,819,534 193,749,773 292,885,060 279,771,310 266,077,464
Note 1: 1% Tax revenue is indexed at 4.0% growth for FY 16/17, 2.5% growth for FY 17/18, 3.0% growth for FY 19/20, then 4.0% per year thereafter. Note 2: Ad Valorem revenue is based upon a rate of $0.30 per $100 of assessed land value indexed at 3.5% growth for FY 16/17, 2.5% growth for FY
17/18, 3.0% growth for FY 18/19, 3.5% growth for FY 19/20, then at 4.0% a year thereafter. Note 3: Fire Service is property assessment applied to commercial properties related to upsizing capital facilities to meet fire flow requirements. Note 4: Reserve funds consist of investment between 1.4% and 4.0% and principal maturities. Note 5: Projected investment earnings are calculated at 2.25% for FYs 16/17, and FY 17/18, 2.5% for FY 18/19 and FY 19/20, 2.75% for FY 20/21,
3.0% for FY 21/22, 3.50% for FY 22/23, then 4% per year thereafter.
Note 6: Cost share of existing debt service per SRRRA JPA Agreement with Elsinore Valley MWD and Wester MWD. Note 7. Debt service costs include taxes for CFD 89-5, ends in FY 2028. Note 8. RCWD’s share of new facility project costs (SRWRF Rehabilitation Project) from the SRRRA JPA.
236

Rancho Division Rancho California Water District Long-Range Capital Financing Plan
Fiscal Year Ending June 30, 2038 2039 2040 2041 2042 2043 2044 Beginning Fund Balance $768,278,383 816,120,408 867,722,576 923,309,068 969,056,785 1,027,807,941 1,089,581,186 Funding Sources
Taxes & Assessments
1% General Purpose (1) 28,353,811 29,487,963 30,667,482 31,894,181 33,169,948 34,496,746 35,876,616
Ad Valorem Assessments (2) 16,954,000 17,632,000 18,337,000 19,071,000 19,834,000 20,627,000 21,452,000
Capacity Fees 1,556,110 1,595,012 1,634,888 1,675,760 1,429,695 - -
Federal Direct Pay Interest Subsidy 632,146 460,479 281,588 95,150
CSI Solar Rebate
Fire Service Charges (3) 165,507 165,507 165,507 165,507 165,507 165,507 165,507
Other Tier Iv Programs 1,438,735 1,438,735 1,438,735 1,438,735 1,438,735 1,438,735 1,438,735
Total Taxes and Assessments 49,100,309 50,779,697 52,525,200 54,340,333 56,037,885 56,727,989 58,932,858
Other Revenues
External DRF (4) - - - - - - -
Interest Internal DRF (5) 30,731,135 32,644,816 34,708,903 36,932,363 38,762,271 41,112,318 43,583,247
Vail Lake Operations
Adv. Trt. Debt CS from JPA (6) 4,199 4,123 4,044 3,963
Capital Grant Revenue
Total Other Revenues 30,735,334 32,648,940 34,712,947 36,936,326 38,762,271 41,112,318 43,583,247
Total Funding Sources 79,835,643 83,428,637 87,238,147 91,276,659 94,800,157 97,840,306 102,516,106
Funding Uses
Debt Service (7) 27,573,527 27,389,693 27,197,860 31,033,498 21,535,851 21,535,851 21,535,851
Misc. Bond Fees/Other Expenses 424,000 424,000 424,000 424,000 424,000 424,000 424,000
JPA Capital CS – Tertiary Trt. (8) 61,504 61,504 61,504 61,504 61,504 61,504 61,504
Transfer to Op. Reserve Fund - - - - - - -
Pay-Go-Capital 3,934,587 3,951,272 3,968,291 14,009,939 14,027,646 14,045,706 14,064,128
Total Funding Uses 31,993,618 31,826,469 31,651,655 45,528,941 36,049,001 36,067,061 36,085,483
Net Sources/(Uses) 47,842,026 51,602,168 55,586,492 45,747,718 58,751,156 61,773,245 66,430,623
Ending Fund Balance $816,120,408 867,722,576 923,309,068 969,056,785 1,027,807,941 1,089,581,186 1,156,011,809
Projected Debt Balance $251,779,417 236,849,606 283,266,485 266,051,652 257,662,429 248,874,265 239,667,645
Note 1: 1% Tax revenue is indexed at 4.0% growth for FY 16/17, 2.5% growth for FY 17/18, 3.0% growth for FY 19/20, then 4.0% per year thereafter. Note 2: Ad Valorem revenue is based upon a rate of $0.30 per $100 of assessed land value indexed at 3.5% growth for FY 16/17, 2.5% growth for FY
17/18, 3.0% growth for FY 18/19, 3.5% growth for FY 19/20, then at 4.0% a year thereafter. Note 3: Fire Service is property assessment applied to commercial properties related to upsizing capital facilities to meet fire flow requirements. Note 4: Reserve funds consist of investment between 1.4% and 4.0% and principal maturities. Note 5: Projected investment earnings are calculated at 2.25% for FYs 16/17, and FY 17/18, 2.5% for FY 18/19 and FY 19/20, 2.75% for FY 20/21,
3.0% for FY 21/22, 3.50% for FY 22/23, then 4% per year thereafter.
Note 6: Cost share of existing debt service per SRRRA JPA Agreement with Elsinore Valley MWD and Wester MWD. Note 7. Debt service costs include taxes for CFD 89-5, ends in FY 2028. Note 8. RCWD’s share of new facility project costs (SRWRF Rehabilitation Project) from the SRRRA JPA.
237

Rancho Division Rancho California Water District Long-Range Capital Financing Plan
Fiscal Year Ending June 30, 2045 2046 2047 2048 2049 2050 2051 Beginning Fund Balance 1,156,011,809 1,227,373,931 1,288,880,914 1,355,308,793 1,427,499,016 1,505,527,563 1,589,756,309
Funding Sources
Taxes & Assessments
1% General Purpose (1) 37,311,681 38,804,148 40,356,314 41,970,567 43,649,389 45,395,365 47,211,179
Ad Valorem Assessments (2) 22,310,000 23,203,000 24,131,000 25,096,000 26,100,000 27,144,000 28,230,000
Capacity Fees - - - - - - -
Federal Direct Pay Interest Sub.
CSI Solar Rebate
Fire Service Charges (3) 165,507 165,507 165,507 165,507 165,507 165,507 165,507
Other Tier IV Programs 1,438,735 1,438,735 1,438,735 1,438,735 1,438,735 1,438,735 1,438,735
Total Taxes and Assessments 61,225,923 63,611,390 66,091,556 68,670,809 71,353,631 74,143,607 77,045,422
Other Revenues
External DRF (4) - - - - - - -
Interest Internal DRF (5) 46,240,472 49,094,957 51,555,237 54,212,352 57,099,961 60,221,103 63,590,252
Vail Lake Operations
Adv. Trt. Debt CS from JPA (6)
Capital Grant Revenue - - - - - - -
Total Other Revenues 46,240,472 49,094,957 51,555,237 54,212,352 57,099,961 60,221,103 63,590,252
Total Funding Sources 107,466,395 112,706,348 117,646,793 122,883,161 128,453,592 134,364,710 140,635,674
Funding Uses Debt Service (7) 21,535,851 38,611,363 38,611,363 38,065,447 37,777,215 37,528,891 52,002,884
Misc. Bond Fees/Other Exp/ 424,000 424,000 424,000 424,000 424,000 424,000 424,000
JPA Capital CS – Tertiary Trt (8) 61,504 61,504 61,504 61,504 61,504
Transfer to Op. Reserve Fund - - - - - - -
Pay-Go-Capital 14,082,918 12,102,498 12,122,047 12,141,987 12,162,326 12,183,072 15,401,816
Total Funding Uses 36,104,273 51,199,365 51,218,914 50,692,938 50,425,045 50,135,963 67,828,701
Net Sources/(Uses) 71,362,122 61,506,983 66,427,879 72,190,223 78,028,547 84,228,746 72,806,973
Ending Fund Balance $1,227,373,931 1,288,880,914 1,355,308,793 1,427,499,016 1,505,527,563 1,589,756,309 1,662,563,282
Projected Debt Balance $492,514,556 478,457,682 463,720,280 448,814,717 433,469,933 640,115,288 620,118,173
Note 1: 1% Tax revenue is indexed at 4.0% growth for FY 16/17, 2.5% growth for FY 17/18, 3.0% growth for FY 19/20, then 4.0% per year thereafter. Note 2: Ad Valorem revenue is based upon a rate of $0.30 per $100 of assessed land value indexed at 3.5% growth for FY 16/17, 2.5% growth for FY
17/18, 3.0% growth for FY 18/19, 3.5% growth for FY 19/20, then at 4.0% a year thereafter. Note 3: Fire Service is property assessment applied to commercial properties related to upsizing capital facilities to meet fire flow requirements. Note 4: Reserve funds consist of investment between 1.4% and 4.0% and principal maturities. Note 5: Projected investment earnings are calculated at 2.25% for FYs 16/17, and FY 17/18, 2.5% for FY 18/19 and FY 19/20, 2.75% for FY 20/21,
3.0% for FY 21/22, 3.50% for FY 22/23, then 4% per year thereafter.
Note 6: Cost share of existing debt service per SRRRA JPA Agreement with Elsinore Valley MWD and Wester MWD. Note 7. Debt service costs include taxes for CFD 89-5, ends in FY 2028. Note 8. RCWD’s share of new facility project costs (SRWRF Rehabilitation Project) from the SRRRA JPA.
238

Rancho Division Rancho California Water District Long-Range Capital Financing Plan
Fiscal Year Ending June 30, 2052 2053 2054 2055 2056 2057 2058 Beginning Fund Balance $1,662,563,282 1,741,278,398 1,826,258,088 1,921,547,113 2,024,020,040 2,113,164,459 2,209,521,409
Funding Sources
Taxes & Assessments
1% General Purpose (1) 49,099,626 51,063,612 53,106,156 55,230,402 57,439,618 59,737,203 62,126,691
Ad Valorem Assessments (2) 29,359,000 30,533,000 31,754,000 33,025,000 34,346,000 35,719,000 37,148,000
Capacity Fees - - - - - - -
Federal Direct Pay Interest Subsidy
CSI Solar Rebate
Fire Service Charges (3) 165,507 165,507 165,507 165,507 165,507 165,507 165,507
Other Tier IV Programs 1,438,735 1,438,735 1,438,735 1,438,735 1,438,735 1,438,735 1,438,735
Total Taxes and Assessments 80,062,869 83,200,854 86,464,398 89,859,645 93,389,861 97,060,445 100,878,933
Other Revenues
External DRF (4) - - - - - - -
Interest Internal DRF (5) 66,502,531 69,651,136 73,050,324 76,861,885 80,960,802 84,526,578 88,380,856
Vail Lake Operations
Adv. Trt. Debt CS from JPA (6)
Capital Grant Revenue - - - - - - -
Total Other Revenues 66,502,531 69,651,136 73,050,324 76,861,885 80,960,802 84,526,578 88,380,856
Total Funding Sources 146,565,400 152,851,990 159,514,722 166,721,529 174,350,662 181,587,024 189,259,790
Funding Uses
Debt Service (7) 52,002,884 52,002,884 48,333,825 48,333,825 66,967,966 66,967,966 66,967,966
Misc. Bond Fees/Other Expenses 424,000 424,000 424,000 424,000 424,000 424,000 424,000
JPA Capital CS – Tertiary Trt (8)
Transfer to ORF - - - - - - -
Pay-Go-Capital 15,423,400 15,445,416 15,467,872 15,490,777 17,814,278 17,838,108 17,862,415
Total Funding Uses 67,850,285 67,872,300 64,225,697 64,248,602 85,206,244 85,230,074 85,254,381
Net Sources/(Uses) 78,715,115 84,979,690 95,289,025 102,472,927 89,144,419 96,356,950 104,005,409
Ending Fund Balance $1,741,278,398 1,826,258,088 1,921,547,113 2,024,020,040 2,113,164,459 2,209,521,409 2,313,526,818
Projected Debt Balance $599,121,202 577,074,383 557,594,282 823,592,597 797,804,266 770,726,518 742,294,883
Note 1: 1% Tax revenue is indexed at 4.0% growth for FY 16/17, 2.5% growth for FY 17/18, 3.0% growth for FY 19/20, then 4.0% per year thereafter. Note 2: Ad Valorem revenue is based upon a rate of $0.30 per $100 of assessed land value indexed at 3.5% growth for FY 16/17, 2.5% growth for FY
17/18, 3.0% growth for FY 18/19, 3.5% growth for FY 19/20, then at 4.0% a year thereafter. Note 3: Fire Service is property assessment applied to commercial properties related to upsizing capital facilities to meet fire flow requirements. Note 4: Reserve funds consist of investment between 1.4% and 4.0% and principal maturities. Note 5: Projected investment earnings are calculated at 2.25% for FYs 16/17, and FY 17/18, 2.5% for FY 18/19 and FY 19/20, 2.75% for FY 20/21,
3.0% for FY 21/22, 3.50% for FY 22/23, then 4% per year thereafter.
Note 6: Cost share of existing debt service per SRRRA JPA Agreement with Elsinore Valley MWD and Wester MWD. Note 7. Debt service costs include taxes for CFD 89-5, ends in FY 2028. Note 8. RCWD’s share of new facility project costs (SRWRF Rehabilitation Project) from the SRRRA JPA.
239

Rancho Division Rancho California Water District Long-Range Capital Financing Plan
Fiscal Year Ending June 30, 2059 2060 2061 2062 2063 2064 Beginning Fund Balance $2,313,526,818 2,425,638,717 2,546,339,275 2,660,054,154 2,782,757,682 2,914,987,691 Funding Sources
Taxes & Assessments
1% General Purpose (1) 64,611,759 67,196,229 69,884,078 72,679,442 75,586,619 78,610,084
Ad Valorem Assessments (2) 38,634,000 40,179,000 41,787,000 43,458,000 45,196,000 47,004,000
Capacity Fees - - - - -
Federal Direct Pay Interest Subsidy
CSI Solar Rebate
Fire Service Charges (3) 165,507 165,507 165,507 165,507 165,507 165,507
Other Tier IV Programs 1,438,735 1,438,735 1,438,735 1,438,735 1,438,735 1,438,735
Total Taxes and Assessments 104,850,001 108,979,471 113,275,321 117,741,684 122,386,861 127,218,326
Other Revenues
External Debt Reserve Funds (4) - - - - -
Interest Internal DRF (5) 92,541,073 97,025,549 101,853,571 106,402,166 111,310,307 116,599,508
Vail Lake Operations
ADv. Trt. Debt CS from JPA (6)
Capital Grant Revenue - - - - -
Total Other Revenues 92,541,073 97,025,549 101,853,571 106,402,166 111,310,307 116,599,508
Total Funding Sources 197,391,074 206,005,020 215,128,892 224,143,850 233,697,169 243,817,834
Funding Uses
Debt Service (7) 66,967,966 66,967,966 82,705,024 82,705,024 82,705,024 82,705,024
Misc. Bond Fees/Other Expenses 424,000 424,000 424,000 424,000 424,000 424,000
JPA Capital CS – Tertiary Trt (8)
Transfer to Op. Reserve Fund - - - - -
Pay-Go-Capital 17,887,208 17,912,497 18,284,987 18,311,298 18,338,135 18,365,509
Total Funding Uses 85,279,174 85,304,463 101,414,012 101,440,322 101,467,159 101,494,533
Net Sources/(Uses) 112,111,900 120,700,557 113,714,880 122,703,528 132,230,009 142,323,301
Ending Fund Balance $2,425,638,717 2,546,339,275 2,660,054,154 2,782,757,682 2,914,987,691 3,057,310,992
Projected Debt Balance $712,441,666 1,013,550,962 981,523,490 947,894,645 912,584,358 875,508,556
Note 1: 1% Tax revenue is indexed at 4.0% growth for FY 16/17, 2.5% growth for FY 17/18, 3.0% growth for FY 19/20, then 4.0% per year thereafter. Note 2: Ad Valorem revenue is based upon a rate of $0.30 per $100 of assessed land value indexed at 3.5% growth for FY 16/17, 2.5% growth for FY
17/18, 3.0% growth for FY 18/19, 3.5% growth for FY 19/20, then at 4.0% a year thereafter. Note 3: Fire Service is property assessment applied to commercial properties related to upsizing capital facilities to meet fire flow requirements. Note 4: Reserve funds consist of investment between 1.4% and 4.0% and principal maturities. Note 5: Projected investment earnings are calculated at 2.25% for FYs 16/17, and FY 17/18, 2.5% for FY 18/19 and FY 19/20, 2.75% for FY 20/21,
3.0% for FY 21/22, 3.50% for FY 22/23, then 4% per year thereafter.
Note 6: Cost share of existing debt service per SRRRA JPA Agreement with Elsinore Valley MWD and Wester MWD. Note 7. Debt service costs include taxes for CFD 89-5, ends in FY 2028. Note 8. RCWD’s share of new facility project costs (SRWRF Rehabilitation Project) from the SRRRA JPA.
240

Rancho Division Rancho California Water District Long-Range Capital Financing Plan
Note 1: 1% Tax revenue is indexed at 4.0% growth for FY 16/17, 2.5% growth for FY 17/18, 3.0% growth for FY 19/20, then 4.0% per year thereafter. Note 2: Ad Valorem revenue is based upon a rate of $0.30 per $100 of assessed land value indexed at 3.5% growth for FY 16/17, 2.5% growth for FY
17/18, 3.0% growth for FY 18/19, 3.5% growth for FY 19/20, then at 4.0% a year thereafter. Note 3: Fire Service is property assessment applied to commercial properties related to upsizing capital facilities to meet fire flow requirements. Note 4: Reserve funds consist of investment between 1.4% and 4.0% and principal maturities. Note 5: Projected investment earnings are calculated at 2.25% for FYs 16/17, and FY 17/18, 2.5% for FY 18/19 and FY 19/20, 2.75% for FY 20/21,
3.0% for FY 21/22, 3.50% for FY 22/23, then 4% per year thereafter.
Note 6: Cost share of existing debt service per SRRRA JPA Agreement with Elsinore Valley MWD and Wester MWD. Note 7. Debt service costs include taxes for CFD 89-5, ends in FY 2028. Note 8. RCWD’s share of new facility project costs (SRWRF Rehabilitation Project) from the SRRRA JPA.
Fiscal Year Ending June 30, 2065 2066 Total Beginning Fund Balance $3,057,310,992 3,210,323,707 144,707,788 Funding Sources
Taxes & Assessments
1% General Purpose (1) 81,754,487 85,024,667 1,901,989,893
Ad Valorem Assessments (2) 48,884,000 50,840,000 1,210,580,000
Capacity Fees - - 29,740,177
Federal Direct Pay Interest Subsidy 26,182,662
CSI Solar Rebate 89,421
Fire Service Charges (3) 165,507 165,507 -
Other Tier IV Programs 1,438,735 1,438,735 8,275,346
Total Taxes and Assessments 129,924,470 135,100,125 3,248,794,267
Other Revenues
External Debt Reserve Funds (4) - - 11,938,185
Interest Internal Debt Reserve Funds (5) 122,292,440 128,412,948 2,352,866,886
Vail Lake Operations (644,884)
Adv. Trt Debt CS from JPA (6) 2,574,479
Capital Grant Revenue - - 600,000
Total Other Revenues 122,292,440 128,412,948 2,367,334,666
Total Funding Sources 254,535,169 265,881,857 5,616,128,933
Funding Uses
Debt Service (7) 82,705,024 75,843,955 1,778,607,462
Misc. Bond Fees/Other Expenses 424,000 424,000 21,429,283
JPA Capital CS – Tertiary Trt (8)
Transfer to Op. Reserve Fund - - -
Pay-Go-Capital 18,393,430 18,421,909 577,377,661
Total Funding Uses 101,522,454 94,689,865 2,377,414,405
Net Sources/(Uses) 153,012,715 171,191,992 3,238,714,528
Ending Fund Balance 3,210,323,707 3,381,515,700 3,383,422,316
Projected Debt Balance $ 1,175,968,052 1,141,953,049 1,141,953,049
241

Santa Rosa Division Rancho California Water District Long-Range Capital Financing Plan
Fiscal Year Ending June 30, 2017 2018 2019 2020 2021 2022 2023 Beginning Fund Balance $9,814,849 7,404,592 6,355,454 6,672,763 7,643,847 7,519,768 9,378,266 Funding Sources
Taxes & Assessments
1% General Purpose (1) 2,452,489 2,513,801 2,589,215 2,679,838 2,787,031 2,898,512 3,014,453
Ad Valorem Assessments (2) 7,788,000 7,987,000 8,231,000 8,521,000 8,862,000 9,217,000 9,585,000
Standby Charges (3) 2,740,389 2,767,793 2,795,471 2,820,389 2,820,389 2,820,389 2,820,389
Capacity Fees 105,291 95,077 93,070 95,396 97,781 524,767 537,886
Federal Direct Pay Interest Subsidy 1,162,486 1,162,486 1,162,486 1,162,486 1,162,486 1,162,486 1,162,486
CSI Solar Rebate 431,250
Fire Service Charges 72,440 72,440 72,440 72,440 72,440 72,440 72,440
Other Tier IV Programs 737,005 737,005 737,005 737,005 737,005 737,005 737,005
Total Taxes and Assessments 15,489,349 15,335,602 15,680,686 16,088,554 16,539,132 17,432,599 17,929,659
Other Revenues
External DRF (4) 122,629 122,629 122,629 350,370 350,370 350,370 350,370
Interest Internal DRF (5) 259,834 166,603 158,886 166,819 210,206 225,593 328,239
Vail Lake Operations (276,379) -
Adv. Treated Debt Rev from JPA (6) 43,495 43,472 53,449 57,744 81,131 69,404 62,985
Capital Grant Revenue 600,000 - - - - - -
Total Other Revenues 749,580 332,705 334,965 574,932 641,706 645,367 741,594
Total Funding Sources 16,238,929 15,668,307 16,015,651 16,663,486 17,180,839 18,077,966 18,671,253
Funding Uses
Debt Service (7) 9,878,793 10,571,188 11,035,441 12,201,492 11,497,324 11,387,112 11,090,822
Misc. Bond Fees/Other Expenses 355,421 152,942 152,942 152,942 152,942 152,942 152,942
JPA Capital CS – Tertiary Treatment (8) 26,359 26,359 26,359 26,359 26,359
Transfer to ORF - - - - - -
Pay-Go-Capital 8,414,972 5,993,315 4,483,600 3,311,610 5,628,292 4,653,055 4,665,209
Total Funding Uses 18,649,186 16,717,445 15,698,342 15,692,402 17,304,917 16,219,468 15,935,331
Net Sources/(Uses) (2,410,257) (1,049,138) 317,309 971,084 (124,079) 1,858,498 2,735,922
Ending Fund Balance $7,404,592 6,355,454 6,672,763 7,643,847 7,519,768 9,378,266 12,114,188
Projected Debt Balance $145,380,857 152,752,650 149,367,420 144,628,133 140,389,969 136,059,164 196,545,056
Note 1: 1% Tax revenue is indexed at 4.0% growth for FY 16/17, 2.5% growth for FY 17/18, then 3.0% growth for FY 19/20, then 4% a year thereafter. Note 2: Ad Valorem revenue is based upon a rate of $0.30 per $100 of land value indexed at 3.5% growth for FY 16/17, 2.5% for FY 17/18, 3.0% for FY
18/19, 3.5% for FY 19/20, then at 4% per year thereafter. Note 3: Fire Service is a property assessment applied to commercial properties related to upsizing capital facilities to meet commercial fire flow req. Note 4: Reserve funds consist of investment earning between 1.4% and 4.0 % and principal maturities. Note 5: Projected investment earnings are calculated at 2.25% for FYs 16/17, and FY 17/18, 2.5% for FY 18/19 and FY 19/20, 2.75% for FY 20/21, 3.0%
for FY 21/22, 3.50% for FY 22/23, then 4% per year thereafter.
Note 6: Cost share of existing debt service per SRRRA JPA Agreement with Elsinore Valley MWD and Wester MWD. Note 7. Debt service costs include taxes for CFD 89-5, ends in FY 2028. Note 8. RCWD’s share of new facility project costs (SRWRF Rehabilitation Project) from the SRRRA JPA.
242

Santa Rosa Division Rancho California Water District Long-Range Capital Financing Plan
Fiscal Year Ending June 30, 2024 2025 2026 2027 2028 2029 2030 Beginning Fund Balance $ 12,114,188 11,366,450 11,135,580 12,244,842 14,003,834 14,692,008 15,937,993 Funding Sources
Taxes & Assessments
1% General Purpose (1) 3,135,031 3,260,432 3,390,849 3,526,483 3,667,543 3,814,245 3,966,814
Ad Valorem Assessments (2) 9,969,000 10,368,000 10,782,000 11,214,000 11,662,000 12,129,000 12,614,000
Standby Charges (3) 2,820,389 2,820,389 2,820,389 2,820,389 2,820,389 2,820,389 2,820,389
Capacity Fees 551,333 565,117 579,244 593,726 608,569 623,783 639,377
Federal Direct Pay Interest Subsidy 1,162,486 1,162,486 1,162,486 1,162,486 1,132,021 1,068,564 999,141
CSI Solar Rebate
Fire Service Charges 72,440 72,440 72,440 72,440 72,440 72,440 72,440
Other Tier IV Programs 737,005 737,005 737,005 737,005 737,005 737,005 737,005
Total Taxes and Assessments 18,447,684 18,985,869 19,544,414 20,126,529 20,699,967 21,265,425 21,849,166
Other Revenues
External DRF (4) 350,370 350,370 350,370 350,370 350,370 350,370 1,932,696
Interest Internal DRF (5) 484,568 454,658 445,423 489,794 560,153 587,680 637,520
Vail Lake Operations
Adv. Trt Debt Rev. from JPA (6) 62,189 61,937 61,411 60,893 60,236 59,938 59,668
Capital Grant Revenue - - - - - - -
Total Other Revenues 897,126 866,964 857,204 901,056 970,759 997,988 2,629,884
Total Funding Sources 19,344,810 19,852,833 20,401,618 21,027,585 21,670,725 22,263,413 24,479,050
Funding Uses
Debt Service (7) 15,235,641 15,214,151 15,178,567 15,141,648 16,842,187 16,863,376 16,829,806
Misc. Bond Fees/Other Expenses 152,942 152,942 152,942 152,942 152,942 152,942 152,942
JPA Capital CS – Tertiary Trt (8) 26,359 26,359 26,359 26,359 26,359 26,359 26,359
Transfer to ORF - - - - - - -
Pay-Go-Capital 4,677,606 4,690,251 3,934,488 3,947,644 3,961,064 3,974,751 3,988,713
Total Funding Uses 20,092,548 20,083,703 19,292,357 19,268,593 20,982,552 21,017,428 20,997,819
Net Sources/(Uses) (747,738) (230,870) 1,109,261 1,758,992 688,174 1,245,986 3,481,230
Ending Fund Balance $ 11,366,450 11,135,580 12,244,842 14,003,834 14,692,008 15,937,993 19,419,224
Projected Debt Balance $191,202,580 185,632,630 179,836,058 173,803,467 165,740,402 157,265,515 241,153,225
Note 1: 1% Tax revenue is indexed at 4.0% growth for FY 16/17, 2.5% growth for FY 17/18, then 3.0% growth for FY 19/20, then 4% a year thereafter. Note 2: Ad Valorem revenue is based upon a rate of $0.30 per $100 of land value indexed at 3.5% growth for FY 16/17, 2.5% for FY 17/18, 3.0% for FY
18/19, 3.5% for FY 19/20, then at 4% per year thereafter. Note 3: Fire Service is a property assessment applied to commercial properties related to upsizing capital facilities to meet commercial fire flow req. Note 4: Reserve funds consist of investment earning between 1.4% and 4.0 % and principal maturities. Note 5: Projected investment earnings are calculated at 2.25% for FYs 16/17, and FY 17/18, 2.5% for FY 18/19 and FY 19/20, 2.75% for FY 20/21, 3.0%
for FY 21/22, 3.50% for FY 22/23, then 4% per year thereafter.
Note 6: Cost share of existing debt service per SRRRA JPA Agreement with Elsinore Valley MWD and Wester MWD. Note 7. Debt service costs include taxes for CFD 89-5, ends in FY 2028. Note 8. RCWD’s share of new facility project costs (SRWRF Rehabilitation Project) from the SRRRA JPA.
243

Santa Rosa Division Rancho California Water District Long-Range Capital Financing Plan
Fiscal Year Ending June 30, 2031 2032 2033 2034 2035 2036 2037 Beginning Fund Balance $19,419,224 16,077,143 17,165,736 13,893,345 11,259,506 14,899,921 10,770,921 Funding Sources
Taxes & Assessments
1% General Purpose (1) 4,125,487 4,290,506 4,462,127 4,640,612 4,826,236 5,019,286 5,220,057
Ad Valorem Assessments (2) 13,118,000 13,643,000 14,189,000 14,756,000 15,347,000 15,960,000 16,599,000
Standby Charges (3) 2,820,389 2,820,389 2,820,389 2,820,389 2,820,389 2,820,389 2,820,389
Capacity Fees 655,362 671,746 688,540 705,753 723,397 741,482 760,019
Federal Direct Pay Interest Subsidy 924,031 885,354 867,850 831,921 794,301 716,997 598,318
CSI Solar Rebate
Fire Service Charges 72,440 72,440 72,440 72,440 72,440 72,440 72,440
Other Tier IV Programs 737,005 737,005 737,005 737,005 737,005 737,005 737,005
Total Taxes and Assessments 22,452,714 23,120,439 23,837,350 24,564,120 25,320,768 26,067,598 26,807,227
Other Revenues
External DRF (4) 287,076 1,865,997 223,920 223,920 5,821,911 - -
Interest Internal DRF (5) 776,769 643,086 686,629 555,734 450,380 595,997 430,837
Vail Lake Operations
Adv. Trt. Debt Rev from JPa (6) 72,009 72,028 8,892 8,850 8,842 1,719 1,692
Capital Grant Revenue
Total Other Revenues 1,135,854 2,581,110 919,441 788,503 6,281,132 597,716 432,529
Total Funding Sources 23,588,568 25,701,550 24,756,791 25,352,623 31,601,900 26,665,314 27,239,756
Funding Uses
Debt Service (7) 22,449,146 20,116,928 23,518,339 23,460,505 23,420,115 29,691,360 29,565,515
Misc. Bond Fees/Other Expenses 152,942 152,942 152,942 152,942 152,942 152,942 152,942
JPA Capital CS – Tertiary Trt. (8) 26,359 26,359 26,359 26,359 26,359 26,359 26,359
Transfer to ORF - - - - - - -
Pay-Go-Capital 4,302,202 4,316,728 4,331,544 4,346,656 4,362,070 923,654 939,691
Total Funding Uses 26,930,649 24,612,956 28,029,183 27,986,462 27,961,485 30,794,314 30,684,507
Net Sources/(Uses) (3,342,081) 1,088,593 (3,272,392) (2,633,839) 3,640,415 (4,129,000) (3,444,751)
Ending Fund Balance $ 16,077,143 17,165,736 13,893,345 11,259,506 14,899,921 10,770,921 7,326,170
Projected Debt Balance $ 230,792,807 222,338,741 210,013,444 197,110,951 344,500,278 332,130,186 319,200,301
Note 1: 1% Tax revenue is indexed at 4.0% growth for FY 16/17, 2.5% growth for FY 17/18, then 3.0% growth for FY 19/20, then 4% a year thereafter. Note 2: Ad Valorem revenue is based upon a rate of $0.30 per $100 of land value indexed at 3.5% growth for FY 16/17, 2.5% for FY 17/18, 3.0% for FY
18/19, 3.5% for FY 19/20, then at 4% per year thereafter. Note 3: Fire Service is a property assessment applied to commercial properties related to upsizing capital facilities to meet commercial fire flow req. Note 4: Reserve funds consist of investment earning between 1.4% and 4.0 % and principal maturities. Note 5: Projected investment earnings are calculated at 2.25% for FYs 16/17, and FY 17/18, 2.5% for FY 18/19 and FY 19/20, 2.75% for FY 20/21, 3.0%
for FY 21/22, 3.50% for FY 22/23, then 4% per year thereafter.
Note 6: Cost share of existing debt service per SRRRA JPA Agreement with Elsinore Valley MWD and Wester MWD. Note 7. Debt service costs include taxes for CFD 89-5, ends in FY 2028. Note 8. RCWD’s share of new facility project costs (SRWRF Rehabilitation Project) from the SRRRA JPA.
244

Santa Rosa Division Rancho California Water District Long-Range Capital Financing Plan
Fiscal Year Ending June 30, 2038 2039 2040 2041 2042 2043 2044 Beginning Fund Balance $ 7,326,170 4,628,053 2,741,062 2,650,853 1,338,993 8,776,382 15,037,540 Funding Sources
Taxes & Assessments
1% General Purpose (1) 5,428,859 5,646,014 5,871,854 6,106,728 6,350,997 6,605,037 6,869,239
Ad Valorem Assessments (2) 17,263,000 17,953,000 18,671,000 19,418,000 20,195,000 21,003,000 21,843,000
Standby Charges (3) 2,820,389 2,820,389 2,820,389 2,820,389 2,820,389 2,820,389 2,820,389
Capacity Fees 779,019 798,495 1,734,250 1,777,606 2,517,706 - -
Federal Direct Pay Interest Subsidy 474,631 345,739 211,423 71,441
CSI Solar Rebate
Fire Service Charges 72,440 72,440 72,440 72,440 72,440 72,440 72,440
Other Tier IV Programs 737,005 737,005 737,005 737,005 737,005 737,005 737,005
Total Taxes and Assessments 27,575,343 28,373,081 30,118,360 31,003,608 32,693,537 31,237,871 32,342,072
Other Revenues
External DRF (4) - - - - - - -
Interest Internal DRF (5) 293,047 185,122 109,642 106,034 53,560 351,055 601,502
Vail Lake Operations
Adv. Trt. Debt Rev from JPA (6) 1,663 1,633 1,602 1,570
Capital Grant Revenue - - - - - - -
Total Other Revenues 294,710 186,755 111,244 107,604 53,560 351,055 601,502
Total Funding Sources 27,870,053 28,559,836 30,229,604 31,111,212 32,747,097 31,588,926 32,943,574
Funding Uses
Debt Service (7) 29,432,820 29,294,793 29,150,760 29,160,567 22,029,496 22,029,496 22,029,496
Misc. Bond Fees/Other Expenses 152,942 152,942 152,942 152,942 152,942 152,942 152,942
JPA Capital CS – Tertiary Trt. (8) 26,359 26,359 26,359 26,359 26,359 26,359 26,359
Transfer to Operating Reserve Fund - - - - - - -
Pay-Go-Capital 956,049 972,734 989,753 3,083,204 3,100,911 3,118,971 3,137,393
Total Funding Uses 30,568,169 30,446,827 30,319,814 32,423,072 25,309,708 25,327,768 25,346,190
Net Sources/(Uses) (2,698,117) (1,886,991) (90,209) (1,311,860) 7,437,389 6,261,158 7,597,384
Ending Fund Balance $4,628,053 2,741,062 2,650,853 1,338,993 8,776,382 15,037,540 22,634,925
Projected Debt Balance $305,686,397 291,561,346 279,233,118 263,762,301 254,793,108 245,393,374 235,542,003
Note 1: 1% Tax revenue is indexed at 4.0% growth for FY 16/17, 2.5% growth for FY 17/18, then 3.0% growth for FY 19/20, then 4% a year thereafter. Note 2: Ad Valorem revenue is based upon a rate of $0.30 per $100 of land value indexed at 3.5% growth for FY 16/17, 2.5% for FY 17/18, 3.0% for FY
18/19, 3.5% for FY 19/20, then at 4% per year thereafter. Note 3: Fire Service is a property assessment applied to commercial properties related to upsizing capital facilities to meet commercial fire flow req. Note 4: Reserve funds consist of investment earning between 1.4% and 4.0 % and principal maturities. Note 5: Projected investment earnings are calculated at 2.25% for FYs 16/17, and FY 17/18, 2.5% for FY 18/19 and FY 19/20, 2.75% for FY 20/21, 3.0%
for FY 21/22, 3.50% for FY 22/23, then 4% per year thereafter.
Note 6: Cost share of existing debt service per SRRRA JPA Agreement with Elsinore Valley MWD and Wester MWD. Note 7. Debt service costs include taxes for CFD 89-5, ends in FY 2028. Note 8. RCWD’s share of new facility project costs (SRWRF Rehabilitation Project) from the SRRRA JPA.
245

Santa Rosa Division Rancho California Water District Long-Range Capital Financing Plan
Fiscal Year Ending June 30, 2045 2046 2047 2048 2049 2050 2051 Beginning Fund Balance $22,634,925 31,666,184 39,153,242 48,162,424 59,502,672 73,074,394 88,591,898 Funding Sources
Taxes & Assessments
1% General Purpose (1) 7,144,008 7,429,769 7,726,960 8,036,038 8,357,479 8,691,779 9,039,450
Ad Valorem Assessments (2) 22,717,000 23,625,000 24,570,000 25,553,000 26,575,000 27,638,000 28,744,000
Standby Charges (3) 2,820,389 2,820,389 2,820,389 2,820,389 2,820,389 2,820,389 2,820,389
Capacity Fees - - - - - - -
Federal Direct Pay Interest Subsidy
CSI Solar Rebate
Fire Service Charges 72,440 72,440 72,440 72,440 72,440 72,440 72,440
Other Tier IV Programs 737,005 737,005 737,005 737,005 737,005 737,005 737,005
Total Taxes and Assessments 33,490,842 34,684,602 35,926,793 37,218,871 38,562,313 39,959,612 41,413,283
Other Revenues
External DRF (4) - - - - - - -
Interest Internal DRF (5) 905,397 1,266,647 1,566,130 1,926,497 2,380,107 2,922,976 3,543,676
Vail Lake Operations
Adv. Trt. Debt Rev from JPA (6)
Capital Grant Revenue - - - - - - -
Total Other Revenues 905,397 1,266,647 1,566,130 1,926,497 2,380,107 2,922,976 3,543,676
Total Funding Sources 34,396,239 35,951,250 37,492,923 39,145,368 40,942,420 42,882,588 44,956,959
Funding Uses
Debt Service (7) 22,029,496 24,889,012 24,889,012 24,190,451 23,735,689 23,735,689 26,882,121
Misc. Bond Fees/Other Expenses 152,942 152,942 152,942 152,942 152,942 152,942 152,942
JPA Capital CS – Tertiary Trt (8) 26,359 26,359 26,359 26,359 26,359
Transfer to ORF - - - - - - -
Pay-Go-Capital 3,156,183 3,395,879 3,415,428 3,435,368 3,455,707 3,476,453 6,350,277
Total Funding Uses 25,364,980 28,464,192 28,483,741 27,805,120 27,370,697 27,365,084 33,385,340
Net Sources/(Uses) 9,031,259 7,487,058 9,009,182 11,340,248 13,571,722 15,517,504 11,571,619
Ending Fund Balance $31,666,184 39,153,242 48,162,424 59,502,672 73,074,394 88,591,898 100,163,517
Projected Debt Balance $269,174,621 257,690,837 245,652,583 233,731,180 221,682,032 257,398,796 243,386,597
Note 1: 1% Tax revenue is indexed at 4.0% growth for FY 16/17, 2.5% growth for FY 17/18, then 3.0% growth for FY 19/20, then 4% a year thereafter. Note 2: Ad Valorem revenue is based upon a rate of $0.30 per $100 of land value indexed at 3.5% growth for FY 16/17, 2.5% for FY 17/18, 3.0% for FY
18/19, 3.5% for FY 19/20, then at 4% per year thereafter. Note 3: Fire Service is a property assessment applied to commercial properties related to upsizing capital facilities to meet commercial fire flow req. Note 4: Reserve funds consist of investment earning between 1.4% and 4.0 % and principal maturities. Note 5: Projected investment earnings are calculated at 2.25% for FYs 16/17, and FY 17/18, 2.5% for FY 18/19 and FY 19/20, 2.75% for FY 20/21, 3.0%
for FY 21/22, 3.50% for FY 22/23, then 4% per year thereafter.
Note 6: Cost share of existing debt service per SRRRA JPA Agreement with Elsinore Valley MWD and Wester MWD. Note 7. Debt service costs include taxes for CFD 89-5, ends in FY 2028. Note 8. RCWD’s share of new facility project costs (SRWRF Rehabilitation Project) from the SRRRA JPA.
246

Santa Rosa Division Rancho California Water District Long-Range Capital Financing Plan
Fiscal Year Ending June 30, 2052 2053 2054 2055 2056 2057 2058 Beginning Fund Balance $100,163,517 113,687,995 129,302,477 151,364,655 175,986,142 182,239,181 190,557,427 Funding Sources
Taxes & Assessments
1% General Purpose (1) 9,401,028 9,777,069 10,168,152 10,574,878 10,997,873 11,437,788 11,895,299
Ad Valorem Assessments (2) 29,894,000 31,089,000 32,333,000 33,626,000 34,971,000 36,370,000 37,825,000
Standby Charges (3) 2,820,389 2,820,389 2,820,389 2,820,389 2,820,389 2,820,389 2,820,389
Capacity Fees - - - - - - -
Federal direct Pay Interest Subsidy
CSI Solar Rebate
Fire Service Charges 72,440 72,440 72,440 72,440 72,440 72,440 72,440
Other Tier IV Programs 737,005 737,005 737,005 737,005 737,005 737,005 737,005
Total Taxes and Assessments 42,924,861 44,495,902 46,130,985 47,830,711 49,598,706 51,437,621 53,350,133
Other Revenues
External DRF (4) - - - - - - -
Interest Internal DRF (5) 4,006,541 4,547,520 5,172,099 6,054,586 7,039,446 7,289,567 7,622,297
Vail Lake Operations
Adv Trt. Debt Revenue from JPA (6)
Capital Grant Revenue - - - - - - -
Total Other Revenues 4,006,541 4,547,520 5,172,099 6,054,586 7,039,446 7,289,567 7,622,297
Total Funding Sources 46,931,402 49,043,422 51,303,084 53,885,297 56,638,152 58,727,188 60,972,430
Funding Uses
Debt Service (7) 26,882,121 26,882,121 22,671,631 22,671,631 29,529,460 29,529,460 29,529,460
Misc. Bond Fees/Other Expenses 152,942 152,942 152,942 152,942 152,942 152,942 152,942
JPA Capital CS – Tertiary Trt (8)
Transfer to Operating Reserve Fund - - - - - - -
Pay-Go-Capital 6,371,861 6,393,877 6,416,333 6,439,238 20,702,710 20,726,541 20,750,848
Total Funding Uses 33,406,924 33,428,940 29,240,906 29,263,811 50,385,112 50,408,943 50,433,250
Net Sources/(Uses) 13,524,478 15,614,482 22,062,178 24,621,486 6,253,040 8,318,246 10,539,180
Ending Fund Balance $113,687,995 129,302,477 151,364,655 175,986,142 182,239,181 190,557,427 201,096,607
Projected Debt Balance $228,673,788 213,225,338 201,214,956 294,025,692 279,197,498 263,627,895 247,279,812
Note 1: 1% Tax revenue is indexed at 4.0% growth for FY 16/17, 2.5% growth for FY 17/18, then 3.0% growth for FY 19/20, then 4% a year thereafter. Note 2: Ad Valorem revenue is based upon a rate of $0.30 per $100 of land value indexed at 3.5% growth for FY 16/17, 2.5% for FY 17/18, 3.0% for FY
18/19, 3.5% for FY 19/20, then at 4% per year thereafter. Note 3: Fire Service is a property assessment applied to commercial properties related to upsizing capital facilities to meet commercial fire flow req. Note 4: Reserve funds consist of investment earning between 1.4% and 4.0 % and principal maturities. Note 5: Projected investment earnings are calculated at 2.25% for FYs 16/17, and FY 17/18, 2.5% for FY 18/19 and FY 19/20, 2.75% for FY 20/21, 3.0%
for FY 21/22, 3.50% for FY 22/23, then 4% per year thereafter.
Note 6: Cost share of existing debt service per SRRRA JPA Agreement with Elsinore Valley MWD and Wester MWD. Note 7. Debt service costs include taxes for CFD 89-5, ends in FY 2028. Note 8. RCWD’s share of new facility project costs (SRWRF Rehabilitation Project) from the SRRRA JPA.
247

Santa Rosa Division Rancho California Water District Long-Range Capital Financing Plan
Fiscal Year Ending June 30, 2059 2060 2061 2062 2063 2064 Beginning Fund Balance $ 201,096,607 214,021,373 229,505,685 224,062,212 220,611,913 219,323,399 Funding Sources
Taxes & Assessments
1% General Purpose (1) 12,371,111 12,865,956 13,380,594 13,915,818 14,472,450 15,051,348
Ad Valorem Assessments (2) 39,338,000 40,911,000 42,548,000 44,250,000 46,020,000 47,861,000
Standby Charges (3) 2,820,389 2,820,389 2,820,389 2,820,389 2,820,389 2,820,389
Capacity Fees - - - - - -
Federal Direct Pay Interest Subsidy
CSI Solar Rebate
Fire Service Charges 72,440 72,440 72,440 72,440 72,440 72,440
Other Tier IV Programs 737,005 737,005 737,005 737,005 737,005 737,005
Total Taxes and Assessments 55,338,945 57,406,789 59,558,427 61,795,651 64,122,284 66,542,182
Other Revenues
External DRF (4) - - - - - -
Interest Internal DRF (5) 8,043,864 8,560,855 9,180,227 8,962,488 8,824,477 8,772,936
Vail Lake Operations
Adv. Trt Debt Revenue from JPA (6)
Capital Grant Revenue - - - - -
Total Other Revenues 8,043,864 8,560,855 9,180,227 8,962,488 8,824,477 8,772,936
Total Funding Sources 63,382,809 65,967,644 68,738,655 70,758,140 72,946,760 75,315,118
Funding Uses
Debt Service (7) 29,529,460 29,529,460 48,874,742 48,874,742 48,874,742 48,874,742
Misc. Bond Fees/Other Expenses 152,942 152,942 152,942 152,942 152,942 152,942
JPA Capital CS – Tertiary Trt (8)
Transfer to Operating Reserve Fund - - - - - -
Pay-Go-Capital 20,775,641 20,800,930 25,154,443 25,180,754 25,207,591 25,234,964
Total Funding Uses 50,458,043 50,483,332 74,182,128 74,208,438 74,235,275 74,262,649
Net Sources/(Uses) 12,924,766 15,484,312 (5,443,473) (3,450,299) (1,288,515) 1,052,469
Ending Fund Balance $214,021,373 229,505,685 224,062,212 220,611,913 219,323,399 220,375,868
Projected Debt Balance $230,114,324 602,314,390 583,555,349 563,858,356 543,176,513 521,460,578
Note 1: 1% Tax revenue is indexed at 4.0% growth for FY 16/17, 2.5% growth for FY 17/18, then 3.0% growth for FY 19/20, then 4% a year thereafter. Note 2: Ad Valorem revenue is based upon a rate of $0.30 per $100 of land value indexed at 3.5% growth for FY 16/17, 2.5% for FY 17/18, 3.0% for FY
18/19, 3.5% for FY 19/20, then at 4% per year thereafter. Note 3: Fire Service is a property assessment applied to commercial properties related to upsizing capital facilities to meet commercial fire flow req. Note 4: Reserve funds consist of investment earning between 1.4% and 4.0 % and principal maturities. Note 5: Projected investment earnings are calculated at 2.25% for FYs 16/17, and FY 17/18, 2.5% for FY 18/19 and FY 19/20, 2.75% for FY 20/21, 3.0%
for FY 21/22, 3.50% for FY 22/23, then 4% per year thereafter.
Note 6: Cost share of existing debt service per SRRRA JPA Agreement with Elsinore Valley MWD and Wester MWD. Note 7. Debt service costs include taxes for CFD 89-5, ends in FY 2028. Note 8. RCWD’s share of new facility project costs (SRWRF Rehabilitation Project) from the SRRRA JPA.
248

Santa Rosa Division Rancho California Water District Long-Range Capital Financing Plan
Fiscal Year Ending June 30, 2065 2066 Total Beginning Fund Balance 220,375,868 223,958,568 9,814,849 Funding Sources
Taxes & Assessments
1% General Purpose (1) 15,653,402 16,279,538 288,455,004
Ad Valorem Assessments (2) 49,775,000 51,766,000 917,214,000
Standby Charges (3) 2,820,389 2,820,389 126,759,991
Capacity Fees - - 18,263,790
Federal Direct Pay Interest Subsidy 22,709,083
CSI Solar Rebate
Fire Service Charges 72,440 72,440 3,259,789
Other Tier IV Programs 737,005 737,005
Total Taxes and Assessments 69,058,236 71,675,372 1,376,661,656
Other Revenues
External DRF (4) - - 14,227,102
Interest Internal DRF (5) 8,815,035 8,958,343 93,043,803
Vail Lake Operations
Adv. Trt Debt Revenue from JPA (6)
Capital Grant Revenue - - -
Total Other Revenues 8,815,035 8,958,343 107,870,905
Total Funding Sources 77,873,270 80,633,715 1,484,532,561
Funding Uses
Debt Service (7) 48,874,742 69,421,962 1,010,297,904
Misc. Bond Fees/Other Expenses 152,942 152,942 7,084,867
JPA Capital CS – Tertiary Trt (8)
Transfer to Operating Reserve Fund - - -
Pay-Go-Capital 25,262,885 25,291,365 286,423,846
Total Funding Uses 74,290,570 94,866,269 1,303,806,617
Net Sources/(Uses) 3,582,701 (14,232,555) 180,725,944
Ending Fund Balance $223,958,568 209,726,014 190,540,793
Projected Debt Balance $975,437,048 954,786,920 583,555,349
Note 1: 1% Tax revenue is indexed at 4.0% growth for FY 16/17, 2.5% growth for FY 17/18, then 3.0% growth for FY 19/20, then 4% a year thereafter. Note 2: Ad Valorem revenue is based upon a rate of $0.30 per $100 of land value indexed at 3.5% growth for FY 16/17, 2.5% for FY 17/18, 3.0% for FY
18/19, 3.5% for FY 19/20, then at 4% per year thereafter. Note 3: Fire Service is a property assessment applied to commercial properties related to upsizing capital facilities to meet commercial fire flow req. Note 4: Reserve funds consist of investment earning between 1.4% and 4.0 % and principal maturities. Note 5: Projected investment earnings are calculated at 2.25% for FYs 16/17, and FY 17/18, 2.5% for FY 18/19 and FY 19/20, 2.75% for FY 20/21, 3.0%
for FY 21/22, 3.50% for FY 22/23, then 4% per year thereafter.
Note 6: Cost share of existing debt service per SRRRA JPA Agreement with Elsinore Valley MWD and Wester MWD. Note 7. Debt service costs include taxes for CFD 89-5, ends in FY 2028. Note 8. RCWD’s share of new facility project costs (SRWRF Rehabilitation Project) from the SRRRA JPA.
249

Santa Rosa Water Reclamation Rancho California Water District Long-Range Capital Financing Plan
Fiscal Year Ending June 30, 2017 2018 2019 2020 2021 2022 2023
Beginning Fund Balance $15,541,683 8,081,059 9,023,799 9,189,404 9,356,015 9,716,326 10,012,625
Funding Sources
Capacity Fees (1) 997,415 1,211,859 1,346,510 1,346,510 1,346,510 1,346,510 1,121,145
Federal Direct Pay Interest Subsidy - - - - - - -
Standby Charges 18,827 18,827 18,827 18,827 18,827 18,827 18,827
External Debt Reserve Funds (2) 31,960 25,568 20,454 16,364 13,091 10,473 8,378
Interest Internal DRF (3) 70,824 70,824 70,824 202,354 202,354 202,354 202,354
JPA - Debt Service Revenue (4) 2,368,148 2,367,330
Replacement Surcharge(5) 399,017 404,646 410,901 417,156 423,411 429,666 434,874
Debt Service Surcharge (6) 623,464 809,292 898,846 912,528 926,211 939,894 951,286
Total Funding Sources 4,913,342 5,090,170 2,991,957 3,143,474 3,187,694 3,239,212 3,087,306
Funding Uses
Debt Service
Debt Service (7) 2,898,836 2,897,888 1,650,803 1,650,803 1,650,803 1,650,803 1,650,803
Misc. Bond Fees/Other Expenses 114,631 114,631 114,631 114,631 114,631 114,631 114,631
JPA Cap. Rsv Contribution (8) 7,130,679
JPA Cap. CS – Pri/Sec Treatment(9) 0 0 1,010,418 1,010,418 1,010,418 1,010,418 1,010,418
Pay-Go-Capital 2,229,820 1,134,910 50,500 201,010 51,530 167,061 167,602
Total Debt Service 12,373,966 4,147,429 2,826,353 2,976,863 2,827,383 2,942,913 2,943,455
Total Funding Uses 12,373,966 4,147,429 2,826,353 2,976,863 2,827,383 2,942,913 2,943,455
Net Sources/(Uses) (7,460,624) 942,741 165,604 166,611 360,311 296,299 143,851
Ending Fund Balance $8,081,059 9,023,799 9,189,404 9,356,015 9,716,326 10,012,625 10,156,476
Projected Debt Balance $60,980,686 $60,964,543 $60,211,138 $20,898,006 $20,083,123 $19,235,645 $18,354,268
Note 1: From EDU absorption calculations, capacity fee indexed at 8% through 2018. Note 2: Reserve funds consist of investment earnings at 4.0% and principal maturities. Note 3: Projected investment earnings are calculated at 2.25 % for FYs 16/17, 2.5% for FY 17/18, 2.75% for FY 18/19, 3.0% for 19/20, 3.50% for FY
20/21, then 4% per year thereafter. Note 4: Monthly surcharge for Replacement $4 per EDU per month. Note 5: Monthly surcharge for Debt Service $6.25 per EDU per month in FY 17 and FY 18 $8.00 per month thereafter. Note 6: Per Master Plan as provided by Engineering Planning Manager. Borrowing rate @ 5%, Term 30 years. Note 7: Includes RCWD’s portion of SRWRF Debt assumed by SRRRA JPA once facilities are acquired by SRRRA per SRRRA JPA Agreement. Note 8: RCWD’s share of new facility project costs (SRWRF Rehabilitation Project) from the SRRRA JPA.
250

Santa Rosa Water Reclamation Rancho California Water District Long-Range Capital Financing Plan
Fiscal Year Ending June 30, 2024 2025 2026 2027 2028 2029 2030
Beginning Fund Balance $10,156,476 10,389,559 10,665,368 10,933,559 11,231,783 11,541,338 11,879,266
Funding Sources
Capacity Fees (1) 1,121,145 1,121,145 1,121,145 1,121,145 1,121,145 1,121,145 1,121,145
Federal Direct Pay Interest Subsidy 18,827 18,827 18,827 18,827 18,827 18,827 18,827
Standby Charges 8,378 8,378 8,378 8,378 8,378 8,378 8,378
External DRF (2) 202,354 202,354 202,354 202,354 202,354 202,354 638,536
Interest Internal DRF (3) 406,259 415,582 426,615 437,342 449,271 461,654 475,171
JPA – Debt Service Revenue (4)
Replacement Surcharge (5) 445,530 456,186 466,842 473,082 473,082 478,290 483,498
Debt Service Surcharge (6) 974,596 997,906 1,021,216 1,034,866 1,034,866 1,046,259 1,057,651
Total Funding Sources 3,177,089 3,220,379 3,265,377 3,295,995 3,307,924 3,336,906 3,803,206
Funding Uses
Debt Service
Debt Service (7) 1,650,803 1,650,803 1,650,803 1,650,803 1,650,803 1,650,803 1,650,803
Misc. Bond Fees/Other Expenses 114,631 114,631 114,631 114,631 114,631 114,631 114,631
JPA Capital Rsv. Contribution (8) 240,773
JPA Capital CS – Pri/Sec Trt (9) 1,010,418 1,010,418 1,062,460 1,062,460 1,062,460 1,062,460 1,062,460
Pay-Go-Capital 168,154 168,717 169,291 169,877 170,475 171,084 171,706
Total Debt Service 2,944,007 2,944,570 2,997,185 2,997,771 2,998,369 2,998,978 3,240,373
Total Funding Uses 2,944,007 2,944,570 2,997,185 2,997,771 2,998,369 2,998,978 3,240,373
Net Sources/(Uses) 233,083 275,809 268,192 298,224 309,555 337,928 562,834
Ending Fund Balance $10,389,559 10,665,368 10,933,559 11,231,783 11,541,338 11,879,266 12,442,100
Projected Debt Balance $17,437,635 $17,284,338 $16,280,867 $15,237,138 $14,151,532 $13,022,370 $13,047,902
Note 1: From EDU absorption calculations, capacity fee indexed at 8% through 2018. Note 2: Reserve funds consist of investment earnings at 4.0% and principal maturities. Note 3: Projected investment earnings are calculated at 2.25 % for FYs 16/17, 2.5% for FY 17/18, 2.75% for FY 18/19, 3.0% for 19/20, 3.50% for FY
20/21, then 4% per year thereafter. Note 4: Monthly surcharge for Replacement $4 per EDU per month. Note 5: Monthly surcharge for Debt Service $6.25 per EDU per month in FY 17 and FY 18 $8.00 per month thereafter. Note 6: Per Master Plan as provided by Engineering Planning Manager. Borrowing rate @ 5%, Term 30 years. Note 7: Includes RCWD’s portion of SRWRF Debt assumed by SRRRA JPA once facilities are acquired by SRRRA per SRRRA JPA Agreement. Note 8: RCWD’s share of new facility project costs (SRWRF Rehabilitation Project) from the SRRRA JPA.
251

Santa Rosa Water Reclamation Rancho California Water District Long-Range Capital Financing Plan
Fiscal Year Ending June 30, 2031 2032 2033 2034 2035 2036 2037
Beginning Fund Balance $12,442,100 12,752,495 13,546,868 13,892,297 14,266,706 16,286,548 16,563,809
Funding Sources
Capacity Fees (1) 1,121,145 1,121,145 1,121,145 1,121,145 1,121,145 1,121,145 1,121,145
Federal Direct Pay Interest Subsidy 18,827 18,827 18,455 17,691 16,891 15,247 12,723
Standby Charges 8,378 8,378 8,378 8,378 8,378 8,378 8,378
External DRF (2) 184,906 1,201,892 144,227 144,227 3,749,902 - -
Interest Internal DRF (3) 497,684 510,100 541,875 555,692 570,668 651,462 662,552
JPA – Debt Service Revenue (4)
Replacement Surcharge (5) 488,706 493,914 499,122 504,330 509,538 514,746 519,954
Debt Service Surcharge (6) 1,069,044 1,080,436 1,091,829 1,103,221 1,114,614 1,126,006 1,137,399
Total Funding Sources 3,388,690 4,434,692 3,425,031 3,454,684 7,091,136 3,436,984 3,462,151
Funding Uses
Debt Service
Debt Service (7) 1,650,803 1,650,803 1,650,803 1,650,803 1,650,803 1,650,803 1,650,803
Misc. Bond Fees/Other Expenses 114,631 114,631 114,631 114,631 114,631 114,631 114,631
JPA Capital Rsv. Contribution (8) 561,376 1,990,333
JPA Capital CS – Pri/Sec Trt (9) 1,140,521 1,140,521 1,140,521 1,140,521 1,140,521 1,218,583 1,218,583
Pay-Go-Capital 172,340 172,987 173,647 174,320 175,006 175,706 176,420
Total Debt Service 3,078,296 3,640,318 3,079,602 3,080,275 5,071,294 3,159,723 3,160,437
Total Funding Uses 3,078,296 3,640,318 3,079,602 3,080,275 5,071,294 3,159,723 3,160,437
Net Sources/(Uses) 310,395 794,374 345,428 374,409 2,019,842 277,261 301,714
Ending Fund Balance $12,752,495 13,546,868 13,892,297 14,266,706 16,286,548 16,563,809 16,865,523
Projected Debt Balance $11,808,246 $10,518,670 $9,177,161 $7,781,622 $7,529,875 $6,001,590 $4,411,566
Note 1: From EDU absorption calculations, capacity fee indexed at 8% through 2018. Note 2: Reserve funds consist of investment earnings at 4.0% and principal maturities. Note 3: Projected investment earnings are calculated at 2.25 % for FYs 16/17, 2.5% for FY 17/18, 2.75% for FY 18/19, 3.0% for 19/20, 3.50% for FY
20/21, then 4% per year thereafter. Note 4: Monthly surcharge for Replacement $4 per EDU per month. Note 5: Monthly surcharge for Debt Service $6.25 per EDU per month in FY 17 and FY 18 $8.00 per month thereafter. Note 6: Per Master Plan as provided by Engineering Planning Manager. Borrowing rate @ 5%, Term 30 years. Note 7: Includes RCWD’s portion of SRWRF Debt assumed by SRRRA JPA once facilities are acquired by SRRRA per SRRRA JPA Agreement. Note 8: RCWD’s share of new facility project costs (SRWRF Rehabilitation Project) from the SRRRA JPA.
252

Santa Rosa Water Reclamation Rancho California Water District Long-Range Capital Financing Plan
Fiscal Year Ending June 30, 2038 2039 2040 2041 2042 2043 2044
Beginning Fund Balance $16,865,523 17,192,547 17,771,204 19,382,415 20,969,516 22,735,029 24,572,962
Funding Sources
Capacity Fees (1) 1,121,145 1,121,145 1,121,145 1,121,145 1,121,145 1,121,145 1,121,145
Federal Direct Pay Interest Subsidy 10,093 7,352 4,496 1,519
Standby Charges 8,378 8,378 8,378 8,378 8,378 8,378 8,378
External DRF (2) - - - - - - -
Interest Internal DRF (3) 674,621 687,702 710,848 775,297 838,781 909,401 982,918
JPA – Debt Service Revenue (4)
Replacement Surcharge (5) 525,162 132,592 133,894 135,196 136,498 137,800 139,102
Debt Service Surcharge (6) 1,148,791 132,592 133,894 135,196 136,498 137,800 139,102
Total Funding Sources 3,488,190 2,089,762 2,112,656 2,176,732 2,241,301 2,314,526 2,390,647
Funding Uses
Debt Service
Debt Service (7) 1,650,803 - - - - - -
Misc. Bond Fees/Other Expenses 114,631 114,631 114,631 114,631
JPA Capital Rsv. Contribution (8)
JPA Capital CS – Pri/Sec Trt (9) 1,218,583 1,218,583 208,165 295,577 295,577 295,577 295,577
Pay-Go-Capital 177,149 177,892 178,649 179,422 180,211 181,015 181,835
Total Debt Service 3,161,166 1,511,106 501,445 589,631 475,788 476,593 477,413
Total Funding Uses 3,161,166 1,511,106 501,445 589,631 475,788 476,593 477,413
Net Sources/(Uses) 327,024 578,657 1,611,211 1,587,101 1,765,513 1,837,933 1,913,234
Ending Fund Balance 17,192,547 17,771,204 19,382,415 20,969,516 22,735,029 24,572,962 26,486,196
Projected Debt Balance $2,757,303 $2,687,004 $3,956,939 $3,859,208 $3,756,591 $3,648,843 $3,535,708
Note 1: From EDU absorption calculations, capacity fee indexed at 8% through 2018. Note 2: Reserve funds consist of investment earnings at 4.0% and principal maturities. Note 3: Projected investment earnings are calculated at 2.25 % for FYs 16/17, 2.5% for FY 17/18, 2.75% for FY 18/19, 3.0% for 19/20, 3.50% for FY
20/21, then 4% per year thereafter. Note 4: Monthly surcharge for Replacement $4 per EDU per month. Note 5: Monthly surcharge for Debt Service $6.25 per EDU per month in FY 17 and FY 18 $8.00 per month thereafter. Note 6: Per Master Plan as provided by Engineering Planning Manager. Borrowing rate @ 5%, Term 30 years. Note 7: Includes RCWD’s portion of SRWRF Debt assumed by SRRRA JPA once facilities are acquired by SRRRA per SRRRA JPA Agreement. Note 8: RCWD’s share of new facility project costs (SRWRF Rehabilitation Project) from the SRRRA JPA.
253

Santa Rosa Water Reclamation Rancho California Water District Long-Range Capital Financing Plan
Fiscal Year Ending June 30, 2045 2046 2047 2048 2049 2050 2051
Beginning Fund Balance $26,486,196 28,477,727 30,468,548 32,540,735 34,697,526 36,914,351 38,125,651
Funding Sources
Capacity Fees (1) 1,121,145 1,121,145 1,121,145 1,121,145 1,093,274 - -
Federal Direct Pay Interest Subsidy 10,093 7,352 4,496 1,519
Standby Charges 8,378 8,378 8,378 8,378 8,378 8,378 8,378
External DRF (2) - - - - - - -
Interest Internal DRF (3) 1,059,448 1,139,109 1,218,742 1,301,629 1,387,901 1,476,574 1,525,026
JPA – Debt Service Revenue (4)
Replacement Surcharge (5) 140,404 141,706 143,008 144,310 145,580 145,580 145,580
Debt Service Surcharge (6) 140,404 141,706 143,008 144,310 145,580 145,580 145,580
Total Funding Sources 2,469,780 2,552,045 2,634,282 2,719,774 2,780,714 1,776,112 1,824,564
Funding Uses
Debt Service
Debt Service (7) - - - - - - -
Misc. Bond Fees/Other Expenses
JPA Capital Rsv. Contribution (8)
JPA Capital CS – Pri/Sec Trt (9) 295,577 377,699 377,699 377,699 377,699 377,699 470,871
Pay-Go-Capital 182,672 183,526 184,396 185,284 186,190 187,114 188,056
Total Debt Service 478,250 561,224 562,095 562,983 563,889 564,812 658,927
Total Funding Uses 478,250 561,224 562,095 562,983 563,889 564,812 658,927
Net Sources/(Uses) 1,991,531 1,990,821 2,072,187 2,156,791 2,216,825 1,211,300 1,165,638
Ending Fund Balance $28,477,727 30,468,548 32,540,735 34,697,526 36,914,351 38,125,651 39,291,288
Projected Debt Balance $4,679,323 $4,535,590 $4,384,671 $4,226,206 $4,059,817 $5,317,393 $5,112,392
Note 1: From EDU absorption calculations, capacity fee indexed at 8% through 2018. Note 2: Reserve funds consist of investment earnings at 4.0% and principal maturities. Note 3: Projected investment earnings are calculated at 2.25 % for FYs 16/17, 2.5% for FY 17/18, 2.75% for FY 18/19, 3.0% for 19/20, 3.50% for FY
20/21, then 4% per year thereafter. Note 4: Monthly surcharge for Replacement $4 per EDU per month. Note 5: Monthly surcharge for Debt Service $6.25 per EDU per month in FY 17 and FY 18 $8.00 per month thereafter. Note 6: Per Master Plan as provided by Engineering Planning Manager. Borrowing rate @ 5%, Term 30 years. Note 7: Includes RCWD’s portion of SRWRF Debt assumed by SRRRA JPA once facilities are acquired by SRRRA per SRRRA JPA Agreement. Note 8: RCWD’s share of new facility project costs (SRWRF Rehabilitation Project) from the SRRRA JPA.
254

Santa Rosa Water Reclamation Rancho California Water District Long-Range Capital Financing Plan
Fiscal Year Ending June 30, 2052 2053 2054 2055 2056 2057 2058
Beginning Fund Balance $39,291,288 40,502,590 41,761,364 43,069,489 44,428,918 45,777,262 47,178,478
Funding Sources
Capacity Fees (1) - - - - - - -
Federal Direct Pay Interest Subsidy 10,093 7,352 4,496 1,519
Standby Charges 8,378 8,378 8,378 8,378 8,378 8,378 8,378
External DRF (2) - - - - - - -
Interest Internal DRF (3) 1,571,652 1,620,104 1,670,455 1,722,780 1,777,157 1,831,090 1,887,139
JPA – Debt Service Revenue (4)
Replacement Surcharge (5) 145,580 145,580 145,580 145,580 145,580 145,580 145,580
Debt Service Surcharge (6) 145,580 145,580 145,580 145,580 145,580 145,580 145,580
Total Funding Sources 1,871,190 1,919,642 1,969,993 2,022,318 2,076,695 2,130,629 2,186,677
Funding Uses
Debt Service
Debt Service (7) - - - - - - -
Misc. Bond Fees/Other Expenses
JPA Capital Rsv. Contribution (8)
JPA Capital CS – Pri/Sec Trt (9) 470,871 470,871 470,871 470,871 535,294 535,294 535,294
Pay-Go-Capital 189,017 189,997 190,997 192,017 193,057 194,119 195,201
Total Debt Service 659,888 660,868 661,868 662,888 728,351 729,412 730,495
Total Funding Uses 659,888 660,868 661,868 662,888 728,351 729,412 730,495
Net Sources/(Uses) 1,211,302 1,258,774 1,308,125 1,359,430 1,348,344 1,401,216 1,456,183
Ending Fund Balance $40,502,590 41,761,364 43,069,489 44,428,918 45,777,262 47,178,478 48,634,661
Projected Debt Balance $4,897,141 $4,671,127 $4,433,812 $5,974,970 $5,738,425 $5,490,052 $5,229,261
Note 1: From EDU absorption calculations, capacity fee indexed at 8% through 2018. Note 2: Reserve funds consist of investment earnings at 4.0% and principal maturities. Note 3: Projected investment earnings are calculated at 2.25 % for FYs 16/17, 2.5% for FY 17/18, 2.75% for FY 18/19, 3.0% for 19/20, 3.50% for FY
20/21, then 4% per year thereafter. Note 4: Monthly surcharge for Replacement $4 per EDU per month. Note 5: Monthly surcharge for Debt Service $6.25 per EDU per month in FY 17 and FY 18 $8.00 per month thereafter. Note 6: Per Master Plan as provided by Engineering Planning Manager. Borrowing rate @ 5%, Term 30 years. Note 7: Includes RCWD’s portion of SRWRF Debt assumed by SRRRA JPA once facilities are acquired by SRRRA per SRRRA JPA Agreement. Note 8: RCWD’s share of new facility project costs (SRWRF Rehabilitation Project) from the SRRRA JPA.
255

Santa Rosa Water Reclamation Rancho California Water District Long-Range Capital Financing Plan
Fiscal Year Ending June 30, 2059 2060 2061 2062 2063 2064 2065
Beginning Fund Balance $48,634,661 50,147,987 51,720,719 53,286,746 55,060,771 56,904,562 58,820,885
Funding Sources
Capacity Fees (1) - - - - - - -
Federal Direct Pay Interest Subsidy
Standby Charges 8,378 8,378 8,378 8,378 8,378 8,378 8,378
External DRF (2) - - - - - - -
Interest Internal DRF (3) 1,945,386 2,005,919 2,068,829 2,131,470 2,202,431 2,276,182 2,352,835
JPA – Debt Service Revenue (4)
Replacement Surcharge (5) 145,580 145,580 145,580 145,580 145,580 145,580 145,580
Debt Service Surcharge (6) 145,580 145,580 145,580 145,580 145,580 145,580 145,580
Total Funding Sources 2,244,925 2,305,458 2,368,367 2,431,008 2,501,969 2,575,721 2,652,374
Funding Uses
Debt Service
Debt Service (7) - - - - - - -
Misc. Bond Fees/Other Expenses
JPA Capital Rsv. Contribution (8)
JPA Capital CS – Pri/Sec Trt (9) 535,294 535,294 603,760 457,232 457,232 457,232 457,232
Pay-Go-Capital 196,305 197,431 198,580 199,751 200,946 202,165 203,409
Total Debt Service 731,599 732,725 802,340 656,983 658,178 659,397 660,641
Total Funding Uses 731,599 732,725 802,340 656,983 658,178 659,397 660,641
Net Sources/(Uses) 1,513,326 1,572,733 1,566,027 1,774,025 1,843,791 1,916,323 1,991,733
Ending Fund Balance $50,147,987 51,720,719 53,286,746 55,060,771 56,904,562 58,820,885 60,812,618
Projected Debt Balance $4,955,430 $6,920,407 $6,662,667 $6,427,638 $6,180,858 $5,921,739 $8,569,029
Note 1: From EDU absorption calculations, capacity fee indexed at 8% through 2018. Note 2: Reserve funds consist of investment earnings at 4.0% and principal maturities. Note 3: Projected investment earnings are calculated at 2.25 % for FYs 16/17, 2.5% for FY 17/18, 2.75% for FY 18/19, 3.0% for 19/20, 3.50% for FY
20/21, then 4% per year thereafter. Note 4: Monthly surcharge for Replacement $4 per EDU per month. Note 5: Monthly surcharge for Debt Service $6.25 per EDU per month in FY 17 and FY 18 $8.00 per month thereafter. Note 6: Per Master Plan as provided by Engineering Planning Manager. Borrowing rate @ 5%, Term 30 years. Note 7: Includes RCWD’s portion of SRWRF Debt assumed by SRRRA JPA once facilities are acquired by SRRRA per SRRRA JPA Agreement. Note 8: RCWD’s share of new facility project costs (SRWRF Rehabilitation Project) from the SRRRA JPA.
256

Santa Rosa Water Reclamation Rancho California Water District Long-Range Capital Financing Plan
Fiscal Year Ending June 30, 2066 Total
Beginning Fund Balance $60,812,618 37,838,367
Funding Sources
Capacity Fees (1) - -
Federal Direct Pay Interest Subsidy - 405,705
Standby Charges 8,378 444,656
External DRF (2) - 8,299,700
Interest Internal DRF (3) 2,432,505 41,790,498
JPA – Debt Service Revenue (4) 4,735,478
Replacement Surcharge (5) 145,580 13,528,701
Debt Service Surcharge (5) 145,580 25,377,274
Total Funding Sources 6,369,344 132,420,379
Funding Uses
Debt Service
Debt Service (7) 95,519,033
Misc. Bond Fees/Other Expenses 2,917,642 74,649,277
JPA Capital Rsv Contribution (8) 3,471,101
JPA Capital CS – Prim/Sec Treatment (9) 715,608
Pay-Go-Capital 204,677 10,902,297
Total Debt Service 920,284 52,580,860
Total Funding Uses 920,284 52,580,860
Net Sources/(Uses) 1,811,759 79,839,519
Ending Fund Balance $62,624,376 95,381,201
Projected Debt Balance $8,316,911
Note 1: From EDU absorption calculations, capacity fee indexed at 8% through 2018. Note 2: Reserve funds consist of investment earnings at 4.0% and principal maturities. Note 3: Projected investment earnings are calculated at 2.25 % for FYs 16/17, 2.5% for FY 17/18, 2.75% for FY 18/19, 3.0% for 19/20, 3.50% for FY
20/21, then 4% per year thereafter. Note 4: Monthly surcharge for Replacement $4 per EDU per month. Note 5: Monthly surcharge for Debt Service $6.25 per EDU per month in FY 17 and FY 18 $8.00 per month thereafter. Note 6: Per Master Plan as provided by Engineering Planning Manager. Borrowing rate @ 5%, Term 30 years. Note 7: Includes RCWD’s portion of SRWRF Debt assumed by SRRRA JPA once facilities are acquired by SRRRA per SRRRA JPA Agreement. Note 8: RCWD’s share of new facility project costs (SRWRF Rehabilitation Project) from the SRRRA JPA.
257

Fiscal Year 2016-2017 Operating Budget
This page intentionally left blank.
258

GLOSSARY Rancho California Water District
Glossary of Abbreviations
AB 1881 – Assembly Bill that provides for a new updated model water efficient landscape ordinance to reflect the improvements in irrigation technology and to continue to promote water efficiencies in landscaping.
AB 1600 – In 1987, the Legislature passed Assembly Bill 166 better known as the Mitigation Fee Act, which established a process by which the District may impost capacity fees on new development in order to finance construction of capital facilities. The funds collected for the capacity fee must be recognized in a separate fund account and not commingled with any other revenue, restricted for construction of capital facilities.
ACWA – Association of California Water Agencies
ACD – Automatic Call Distribution
Acre-Foot (AF) – 325,829 gallons or 435.6 hundred cubic feet of water.
Ag – Agriculture/agricultural AIEP – Agricultural Irrigation Efficiency Program
AMR – Automatic Meter Reading
APN – Assessor’s Parcel Number
AWMP – Agricultural Water Management Plan prepared by a water purveyor to ensure the appropriate level of reliability in water service sufficient to meet the needs of customers during normal, dry, or multiple dry years. AWTPP – Agricultural Wireless Telemetry Pilot Project
AWWA – American Water Works Assoc.
BMP – Best Management Practices
CASA – California Association of Sanitation Agencies
CFD – Community Facility District
CIP – Capital Improvement Projects
CIS – Customer Information System. Windows-based, web enabled application information system with the ability to plan, control, and account for RCWD’s customer service billing.
CMMS – Computerized Maintenance Management System. Software pkg. that maintains a computer database of information about an organizations maintenance operations.
CUWCC BMP – California Urban Water Conservation Best Management Practice
CWRMA – Cooperative Water Resources Management Agreement
DRF – Debt Reserve Fund
DTO – Delinquent Turn Off DWR – Department of Water Resources EAIEP – Enhanced Agricultural Irrigation Efficiency Program
EDU – Equivalent dwelling unit
EMWD – Eastern Municipal Water District
EM 13 – An imported water connection located at Margarita Road and Rancho California Road through which the District purchases treated domestic water from EMWD delivered from the MWD aqueducts passing through the District.
EM 19 – An imported water connection located at Santiago Road and Vallejo Road through which the District purchases untreated domestic water from EMWD delivered from the MWD aqueducts passing through the District.
259

GLOSSARY Rancho California Water District
Abbreviations cont. EM 20 – An imported water connection located at San Diego Pipe #3 through which the District purchases treated domestic water from EMWD delivered from the MWD aqueducts passing through the District. EQIP – Environmental Quality Incentives Program provides financial and technical assistance to agricultural producers in order to address natural resource concerns and deliver environmental benefits such as improved water quality, conserved ground and surface water, and reduced soil erosion. ERP – Enterprise Resource Planning
EUM – Effective Utility Management
EVMWD – Elsinore Valley Municipal Water District FP – Facility Planning & Management, type of project is the planning or engineering study related to a capitalized infrastructure improvement, which is not associated with the engineering design work in the aforementioned categories. Typically, this activity consists of asset management planning, facility master planning, or other facility management plans.
FTE – Full Time Equivalent
GAPP – Generally Accepted Accounting Principles
GASB – Governmental Accounting Standards Board GFOA – Government Finance Officers Association
GIC – Guaranteed Investment Contract
GPS – Global Positioning System
GWMP – Groundwater Management Plan
HCF – Hundred cubic feet HOA – Home Owners Association
HQ – Head Quarters (Main District Office)
H.R. 146 – the House of Representative’s legislative approval for RCWD’s Title XVI project and annual appropriations thereafter.
H.R. 1725 – Amend the Reclamation Wastewater and Groundwater Study and Facilities Act to authorize the Secretary of the Interior to participate in the Rancho California Water District Southern Riverside County Recycled/Non-Potable Distribution Facilities and Demineralization/Desalination Recycled Water Treatment and Reclamation Facility Project.
IAWP – Interim Agricultural Water Program provides discounted wholesale supply and treatment pricing for qualified agricultural users within its service area on the basis that participants receive non-firm, interruptible supply up to the maximum allowed under Section 4901 of the MWD Administrative Code.
ITMP – Information Technology Master Plan
IRWMP – Integrated Resource Water Management Plan
IRP – Integrated Resource Plan, a study developed as a long-term supply plan that will help meet water demands for the District from now until 2050 (ultimate build out).
IVR – Interactive Voice Response
JPA – Joint Powers Agreement
JPIA – Joint Powers Insurance Authority
LAFCO – Riverside Local Agency Formation Commission LRFP – Long Range Financial Plan
260

GLOSSARY Rancho California Water District
Abbreviations cont.
M&I – Municipal and Industrial
MCBCP – Marine Corps Base, Camp Pendleton
MCWD – Murrieta County Water District
MISAC – Municipal Information Systems Association of California
MOU – Memorandum of Understanding
MPCEA – Professional and Confidential Employee’s Association
MWD – The Metropolitan Water District of Southern California
ND – New Development, type of project is required to provide service to new development or to facilitate planned development, which may also provide a system operating improvement. NRCS – Natural Resources Conservation Service Soils
OEI – Operational Efficiency Improvement, type of project improves system operational efficiency by improving the level of service provided, correcting existing system deficiencies, and/or reducing operating costs.
OSG – On-Site Generation
PERS – Public Employees Retirement System
PLC – Programmable Logic Controller
PS – Pump Station
PTT – Push-To-Talk
QIP – Quality Improvement Process
RCWD – Rancho California Water District
RCWDEA – Rancho California Water District Employees’ Association
RCWDMPCEA – Rancho California Water District Management, Professional, and Confidential Employees’ Association
REG – Regulatory, type of project is required due to a permit requirement, mandated regulation, or legislation. RP – Reduced pressure backflow prevention device RQC – Requisition Center
R&R – Repair & Replacement, type of project is to replace a refurbish infrastructure, which has exceeded its useful life or is functionally obsolete. Repair and replacement projects are evaluated and prioritized on their condition assessment, likelihood of failure, and consequence of failure. RWQCB – Regional Water Quality Control Board SBX-7 – Senate Bill X7-7 was enacted in November 2009 requiring all water suppliers to increase water use efficiency.
SCADA – Supervisory Control and Data Acquisition uses computer technology to monitor and control remote facilities such as pumps and reservoirs.
SCE – Southern California Edison
SLA – Service Level Agreements
SNMP – Salt/Nutrient Management Plan
SRRRA – Santa Rosa Regional Resources Authority
SRWRF – Santa Rosa Water Reclamation Facility. The District’s 5.0 million gallons per day sequencing batch reactor treatment facility.
SWRCB – State Water Resources Control Board
T & D – Transmission & Distribution
261
GLOSSARY Rancho California Water District
Abbreviations cont.
TDS – Total Dissolved Solids is a measure of the combined content of all inorganic and organic substances contained in a liquid in molecular, ionized, or micro-granular suspended form. TRR – Total Recordable Injury Rate
USBR – U.S. Bureau of Reclamation
USGS – U.S. Geological Survey USMW – Upper Santa Margarita Watershed
VDC – Valle de Los Caballos VDCR/RF – Valle de Los Caballos Recharge/Recovery Facility
WMWD – Western Municipal Water District
WR – Water Resource, type of project improves the District’s water supply and/or improves the reliability of providing water service. WR 26 – An imported water connection located at north of Via Gorrion and west of Ridgeline Court through which RCWD purchases treated domestic water from WMWD delivered from the MWD aqueducts passing through the District.
WR 28 – An imported water connection located at north of Via Gorrion and west of Ridgeline Court through which RCWD purchases treated domestic water from WMWD delivered from the MWD aqueducts passing through the District.
WSCP – Water Shortage Contingency Plan
WSIP – Water Savings Incentive Program
262

GLOSSARY Rancho California Water District
Glossary of Terms
Accrual Basis – The method of accounting whereby income and expense items are recognized as they are earned or incurred, even though they may not have been received or actually paid in cash.
Ad Valorem Tax – A tax based on the value of the item rather than on its weight or quantity (e.g., an ad valorem property tax is based on the assessed land value of property rather than its size).
Annexation – Properties that are outside the (current District) boundaries that desire service from RCWD must apply for annexation.
Aquifer - A layer of permeable rock, sand, or gravel through which ground water flows, containing enough water to supply wells and springs.
Asset – A probable future economic benefit obtained or controlled by a particular entity as a result of past transactions or events (i.e., cash, receivables, equipment, and the like).
Beginning Balance – The beginning balance is comprised of residual funds brought forward from the previous fiscal year (ending balance).
Bonded Indebtedness – The District’s general name for bond debt evidencing amounts owed and payable on specific dates or on demand.
Budget – A financial plan showing authorized planned expenditures and their funding sources.
Budget-Based Tiered Water Rate (BBTWR) – Increasing rate block structure in which the block definition is different for each customer and is based on an efficient level of water use by that customer.
Budget Process – The schedule of key dates or milestones, which the District follows in the development, preparation, adoption, and administration of the budget.
Budgetary – Management of a government or enterprise in accordance with an approved budget to keep expenditures within the limitations of available appropriations and available revenues.
Capital Projects – Projects budgeted within the Capital Budget fall within the definition of Capital Expenditures, which mean (1) they create or extend the lives of assets, (2) their work products have a useful life of greater than two years, and (3) they involve an expenditure of District resources in excess of $2,000.
Capital Improvement Plan (CIP) – Authorized expenditures for tangible and long-term physical improvements or additions of a fixed or permanent nature.
Capital Outlay– Individual item purchases of furniture, fixtures, machinery, vehicles, and equipment with an individual cost of at least $1,000 and having a useful life of two years or more.
Certificates of Participation (COPs) – A security in the form of a bond, which evidences a proportionate participation in a flow of lease or other payments between two parties.
Comprehensive Annual Financial Report (CAFR) – A widely recognized comprehensive annual financial reporting medium summarizing financial and statistical data in a standardized format, used by municipal issuers.
Critical Success Factors – Key objectives that must be obtained for overall success to be achieved.
263

GLOSSARY Rancho California Water District
Glossary of Terms Cont.
Depreciation – A portion of the cost of a fixed asset, which is charged as an expense during a year, representing an estimate of the value of the asset used up during that year.
Debt Service – The current year portion of interest costs and current year principal payments incurred on long-term debt.
Division Mission Statement – The Division’s core purpose; how the Division supports the District’s mission.
Energy Rate – The cost of energy generated by the pumping of water to various pump zones is recovered via an energy surcharge per hcf.
Enterprise Fund – A fund established to account for operations that are financed and operated in a manner similar to private business enterprises where the intent of the governing body is that the costs of providing goods or services to the general public on a continuing basis be financed or recovered primarily through “user charges.”
Effective Utility Management (EUM) – Management that improves products and services, increase community support, and ensures a strong and viable utility into the future.
Expense – Decreases in net financial resources resulting from payment for operating costs, labor and overhead, services and supplies, land and structures, equipment, debt service, etc.
Fee for Service Costs – Cost of providing special services to customers and the related fee to cover those costs.
Fire Service Charge – A monthly charge assessed commercial and/or industrial properties to cover the cost of the District providing additional fire flow capacity.
Fiscal Year (FY) – A 12-month period to which the annual operating budget applies and at the end of which a government determines its financial position and the results of its operations (for RCWD the fiscal year is July 1 through June 30).
Fixed Costs – Costs created by the need to maintain a utility systems capacity to deliver water to all customers and represent the cost of service availability, which must be maintained for each customer in order to preserve their share of reserved system volume.
Fund – A self-balancing set of accounts in which cash and other financial resources, all related liabilities and residual equities, or balances and changes therein, are recorded and segregated to carry on specific activities or attain certain objectives in accordance with special regulations, restrictions or limitations.
Fund Balance – The current funds on hand resulting from historical collection and use of monies. The difference between assets and liabilities plus residual equities or balances or changes therein, from the results of operations.
GASB 68– The primary objective of this Statement is to improve accounting and financial reporting by state and local governments for pensions. It also improves information provided by state and local governmental employers about financial support for pensions that is provided by other entities. This Statement results from a comprehensive review of the effectiveness of existing standards of accounting and financial reporting for pensions with regard to providing decision-useful information, supporting assessments of accountability and interperiod equity, and creating additional transparency. General Fund – A fund used to account for major operating revenues and expenditures, except for those financial transactions that are
264

GLOSSARY Rancho California Water District
Glossary of Terms Cont. required to be accounted for in another fund. General Fund revenues are derived primarily from property and other taxes.
Geographical Information Systems (GIS) – An information system integrating maps with electronic data.
Groundwater – Water produced by pumping from an underground aquifer.
Hansen – Information System Software
Import Water – Purchased water
Lock Off – A final notice to a customer if their billing account remains unpaid for 45 days. Must be paid within 48 hours to avoid having water service terminated.
Long-Range Capital Financing Plan – A plan that details future capital requirements for the District’s service area and identifies funding sources to meet future debt obligations.
Major Capital Projects – Projects that are potable water, recycled, and wastewater infrastructure related projects that require a longer time to build and to complete, have a longer estimated life and have cost well exceeding $35,000.00. Capital facilities include reservoirs, pipelines, wells, transmission mains, pump stations, and wastewater facilities. All capital facilities are funded by bond funds or non-operating cash reserves of the District.
Minor Capital Projects – Projects that cost $35,000 or less and restore an asset to its original condition or extends the useful life and/or functionality of an asset. These projects are funded by non-operating revenue.
Monthly Capacity Rate – The charge to offset the “ready to serve” cost incurred by the District regardless of the volume of water sold.
Mission Statement – The District’s core purpose
Non-Operating Budget – Budgeted income and expenses derived from non-operating type categories, such as interest income and expenses, assessments, connection fees and depreciation.
Non-Operating Costs – Costs incurred through activities other than regular business operating activities, such as source of supply, transmission and distribution, customer service, etc...
Operating Budget – The normal ongoing operating costs incurred to operate the District, including wages, materials, utilities, professional and outside services, and other such operating expenses. Operating Costs – All costs necessary to operate and maintain the water and wastewater operations.
Operating Reserve Fund – A fund category designated for specific operating purposes.
Performance Measurement – A method of determining the success rate of a specific task or job requirement within identified guidelines of the District’s goals and objectives.
Performance Measurement Indicators – A measurable achievement or accomplishment used to determine specific tasks or goals.
Plan Check – Process District reviews and approved drawings for improvements to the water/sewer system to ensure conformation of design materials with the standard drawings.
Public Employees Retirement System – An agent, multiple employer, public retirement system to which the District contributes that acts as a common investment and administrative agent for participating public entities within the State of California.
Potable Water – Water that is suitable for drinking.
265

GLOSSARY Rancho California Water District
Proposition 50 – Prop 50 allows for 3.4 billion dollars in general obligation bonds to fund a variety of water projects.
Proposition 84 – On November 7, 2006, voters passed Proposition 84 by 53.9 percent. The 5.4 billion dollar “Safe Drinking Water, Water Quality and Supply, Flood Control, River and Coastal Protection Bond Act of 2006” (Safe Drinking Water Bond) is detailed in Sections 75001 through 75090 of the Public Resources Code.
Proposition 218 – Prop 218 amended the California Constitution (Articles XIIIC and XIIID) which, as it relates to assessments, requires the local government to have a vote of the affected property owners for any proposed new or increased assessment before it could be levied. The Proposition was passed by California voters on November 5, 1996, and the assessments portion placed in effect on July 1, 1997.
Recycled Water – Water that has been treated to remove harmful contaminants that can be used for non-potable purposes, such as landscape and golf course irrigation.
Reserve – A portion of fund balance that is held for a specific future use.
Santa Rosa Regional Resources Authority – A newly formed Joint Powers Authority formed by Elsinore Valley Municipal Water District (Elsinore), Rancho California Water District (Rancho), and Western Municipal Water District (Western) to perform all functions for the treatment and disposal of wastewater from its member agencies, including the acquisition, construction and financing for capital projects. Standard Specifications – Written description of design and material standard drawings for water/sewer pipeline, appurtenances, and installation.
Standby Charge – A “ready-to-serve” charge levied annually in two equal installments against property within District boundaries based on the proximity of existing water facilities, with decreases in the charges as the distance from existing water service increases. Standby charges collected by the District are used exclusively for the purpose of paying bonded indebtedness.
Stewardship – The responsible management and responsibility to properly utilize District resources, including people, property, and financial and natural assets.
Strategic Plan the long-term goals, objectives, and performance measurement standards for the District.
Sustainability – The use of natural, community, and utility resources in a manner that satisfies current needs without compromising future needs or options.
Targeted Operating Reserve – A desired level of operating reserves for various purposes such as rate stabilization, drought, risk management, and working capital.
Tertiary – The purification of wastewater by removal of fine particles, nitrates and phosphates. Tier 2 Conservation Rate - Designed to charge customers using substantially more water than other customers in their customer class, an add-on rate to recover Tier 2 charges from MWD and to fund targeted water conservation programs.
Topographical Map - A large-scale map showing relief and man-made features of a portion of a land surface distinguished by portrayal of position, relation, size, shape, and elevation of the features.
Unlock – The process of restoring service (removing the lock from the meter) once delinquent charges have been settled.
266

GLOSSARY Rancho California Water District
Glossary of Terms Cont. User Charge System – The total process of (1) identifying water and wastewater costs; (2) allocating costs to utility or service beneficiaries; and (3) designing rate structures to recover allocated costs.
Vail Lake – Surface water capture-release facility in the hydro-geologic area of the District.
Variable Costs – Costs created during the actual production, distribution, and delivery of water services and represent the costs per unit of water measured in hundred cubic feet or “hcf.”
Water Capacity Fee – The amount charged for the purchase of capacity in the RCWD sewage treatment and collection system. The fee is based on the total EDUs.
Will Serve Letter – A conditional commitment by the District to provide water, sewer service, or fire flow. Subject to the completion of all financial arrangements and conditions of service.
Zone of Benefit – An acreage charge in the Santa Rosa Division for installation by RCWD of the secondary water system to all 20-acre parcels.
267
Copyright © 2022 FDOKUMEN