Trade Liberalization and the Coffee Sub-Sector - CiteSeerX
43
1 Trade Liberalization and the Coffee Sub-Sector: Some Implication for the Food Sub-Sector Alemayehu Geda (A Study Prepared for Action Aid Ethiopia) November 1999 Addis Ababa Address: Alemayehu Geda, Ph.D. Asst. Professor of Economics Department of Economics Addis Ababa University P.O.Box 81146, Addis Ababa, Ethiopia Fax: (251-553504 or 551399 Tel: (251-1) 553900ext 228/232 or 116902 (Off) (251-1) 559338 (Resd.) [email protected] OR [email protected]
-
Upload
khangminh22 -
Category
Documents
-
view
2 -
download
0
Transcript of Trade Liberalization and the Coffee Sub-Sector - CiteSeerX

1
Trade Liberalization and the Coffee Sub-Sector: SomeImplication for the Food Sub-Sector
Alemayehu Geda
(A Study Prepared for Action Aid Ethiopia)
November 1999Addis Ababa
Address:
Alemayehu Geda, Ph.D.Asst. Professor of EconomicsDepartment of EconomicsAddis Ababa UniversityP.O.Box 81146, Addis Ababa, EthiopiaFax: (251-553504 or 551399Tel: (251-1) 553900ext 228/232 or 116902 (Off) (251-1) 559338 (Resd.)[email protected] [email protected]


3
Trade Liberalization and the Coffee Sub-Sector in Ethiopia:Some Implications for the Food Sub-Sector
TABLE OF CONTENTS
1. INTRODUCTION
2. THEORETICAL ISSUES IN THE EVALUATION OF LIBERALIZATION
3. ETHIOPIA’S EXTERNAL TRADE POLICY
4. COFFEE IN THE ETHIOPIAN ECONOMY AND THE IMPACT OF LIBERALIZATION
4.1 Pattern of Production in the Coffee Sub-Sector4.2 Liberalization Schemes Relevant For The Coffee Sub-Sector And Its Impact
4.2.1 Domestic Trade Liberalization4.2.2 Foreign Trade Liberalization4.2.3 Exchange Rate Liberalization: Devaluation4.2.4 Tax Reforms and Coffee’s Contribution to Government Revenue
4.3 Ethiopia’s Exports Performance and The Coffee Sub-Sector: Before andAfter the Reform.
5. SUPPLY RESPONSE AND FOOD SECURITY
5.1 Supply Response: The Macro and Micro/Econometric Evidence: A BriefSummary
5.2 The Uruguay Round (The Agreement on Agriculture), Supply Response andFood Security
6. CONCLUDING REMARKS AND POLICY IMPLICATIONS

4
LIST OF ABERVIATION USED
AAU Addis Ababa UniversityCSA Central Statistical AuthorityCBD Coffee Bury DiseaseCPDC Coffee Plantation Development CorporationCDPI Coffee Development and Project Implementation DepartmentCTA Coffee and Tea AuthorityECEE Ethiopian Coffee Export EnterpriseECMC Ethiopian Coffee Marketing CorporationECPSE Ethiopian Coffee Purchase and Sale EnterpriseICO International Coffee OrganizationMEDaC Ministry of Economic Development and CooperationMIT Ministry of Trade and IndustryNBE National Bank of EthiopiaSAPs Structural Adjustment ProgramsUR-AoA Uruguay Round -The Agreement on AgricultureUSD United States DollarWTO World Trade Organization

5
LIST OF TABLES AND DIGRAMS
Table 1 Area Under Coffee Cultivation: (000 hectares)Table 2 Production pattern: The Peasant SectorTable 3 Farm-gate PriceTable 4 The Exchange Rates in the Post-Reform Period (Birr per US$)Table 5 Fees for Issuance and Renewal of License Table 6 Coffee Taxes in Total Government Revenue (Millions of Birr)Table 7 Percentage Share of Ethiopia's Major Exports in the Total Value of
Exports for Selected Years (in Percent)Table 8 Annual Growth Rates of Major and Total Export Items (Selected Years,
Volume)Table 9 Coffee Arrivals and Approval for Exports (in metric tons)Table 10 Volume and Value of Coffee Export by Coffee Year, Washed and
UnwashedTable 11 Ethiopia 's Share in the World Coffee Trade under International Coffee
Agreement (In Metric tons)Table 12 Share of Total Export Destination (1989-1997)Table 13 Resource Shift Effect in Sample Households of Taye’s StudyTable 13 Area Cultivated Under Major Crops for Private Peasant Holdings (Both
Seasons, in ‘000 ha)Table 15 Trends in Area Cultivated Under Major Crops (1980/81 - 1997/98): Period
Growth RatesTable 16 Estimates of Production of Major Crops By Private Peasant Holdings
(Both Seasons, in ‘000 Quintals)Table 17 Imports by Commodity Categories
DIAGRAMS
Diagram 1 Area Under Cultivation (1997/98)Diagram 2a Market Structure for Sun-dried CoffeeDiagram 2b Market Structure for Washed CoffeeDiagram 3 Farm-gate and Fob Prices of Coffee (Based on Table 10)Diagram 3 Export Market Destination for Ethiopia (1997) [See Table 12]

6
Trade Liberalization and the Coffee Sub-Sector in Ethiopia:Some Implications for the Food Sub-Sector
Alemayehu [email protected]
1. INTRODUCTION
Ethiopia is a predominantly agricultural country with 85% of the population deriving its
livelihood from subsistence agriculture. Agriculture is the leading sector contributing
50% to GDP, 90% to export revenue, and 85% to total employment. This shows that the
overall economy of Ethiopia and the food security of the majority of the population are
highly dependent on what happens in the agricultural sector.
The major export commodity of Ethiopia, coffee, contributes an average of 65% to total
export earning (foreign exchange) and provides a source of livelihood for a substantial
number of farmers. The volume of coffee export, prices and farm income are largely
dependent on both national and international market and trade policies. It is therefore
very important to assess the impact of domestic and international agricultural trade
policies on coffee exports in Ethiopia and how this affects national and household food
security.
There are a number of policy measures, both national and international, that have an
impact on the export sector and food security in Ethiopia. One of the most relevant policy
measures that needs to be considered in the context of this study is the Structural
Adjustment Program (SAP) prescribed by the IMF and the World Bank and accepted and
currently being implemented in Ethiopia since 1992. This policy package, which includes
trade liberalization as its one component, has the same effect as the implementation of the
rules provided in the Agreement on Agriculture (AoA) since Ethiopia had already
committed itself to lifting most agricultural subsidies and made a substantial reduction of
tariffs although it is still not a member of the World Trade Organization (WTO). This

7
study is concerned with the evaluation of components of SAPs that are relevant to the
coffee sub-sector and their implication for food security.
The rest of the study is organized as follows. Section 2 will outline the methods
employed in evaluating liberalization schemes such as SAPs and justify the one adopted
in this study. In section 3 Ethiopia’s external trade policy is examined so as to give
background for the analysis in section 4 and 5. Section 4 deals with the evaluation of
liberalization and its impact on the coffee sub-sector. Section 5 is devoted to draw
implications for food security by examining the existing micro-based studies. Section 6
will conclude the paper.
2. THEORETICAL ISSUES IN THE EVALUATION OF LIBERALIZATION
Since the 1980s, the World Bank and IMF, and increasingly WTO, inspired programs of
liberalization had been carried in almost all-African countries. There is a serious
disagreement about the effect of these programs, in particular that of Structural
Adjustment, in the literature (See Alemayehu 1999a). One major problem in
understanding the effect of these programs is lack of appropriate methodology to evaluate
such liberalization schemes.
The analysis of the impact of liberalization on the coffee sub-sector in Ethiopia can not
be immune to this problem. In this study we will attempt to see the impact of trade
liberalization on the coffee sub-sector and its implication for the food sub-sector. Before
commencing such analysis, however, it is worth mentioning the methods employed in
carrying such evaluation and the approach adopted in this study.
There are at least five approaches employed in the evaluation of the impact of Bank/Fund
supported programs in general and trade liberalization in particular:
(1) the before-after approach
8
(2) the with-without approach;
(3) the actual-versus-target approach;
(4) the modeling/simulation approach, and
(5) the econometric approach
(See Khan 1990; Pio 1994)
The literature of evaluation of structural adjustment programs and the attendant
liberalization is dominated by the before-after approach. The first study to use this
approach is the one by Rechmann and Sillson (1978). Other works cited include, inter
alia, Killick (1984), Zulu and Nsouli (1985), Poster (1987) (see Goldestin and Montiel,
1986; Khan 1990). This approach basically compares performance of the economy (or
major macro variables) before and after liberalization or the implementation of SAPs.
While easy to apply, the approach is fundamentally based on the cetirus paribus (other
things being equal) assumption which made it difficult to claim that it has captured the
independent effect of the reform (Khan, 1990: 201). In other words, it has no mechanism
to filter out the effect of other factors, other than the reform, which could have a bearing
on the outcome.
The with-without approach is designed to overcome the weakness of the before-after
approach and hence serves as a supplement to it (Montiel 1986:305; Khan, 1990:201).
The approach attempts to distinguish between the program and non-program countries
and compares the outcomes. It assumes that countries with and without a (liberalization)
program are facing identical environment and, hence, any difference observed in the
program countries is attributed to the effect of the program. The with-without approach is
first used by Donovan (1981, 1982). Latter works using this approach include Loxley
(1984), Gylfason (1987) and Pastor (1987) (all cited in Khan 1990). The major weakness
of this approach is that countries with and without program, however accurately they are
picked, could not be identical. Moreover, as noted by Khan (1990), program countries are
not randomly selected. Instead, they are adversely selected in the sense of having
relatively poor economic performance prior to the program period. Goldestin and Montiel
(1986), however, suggested identifying and controlling the specific differences in the
9
initial position of the program and non-program countries can overcome this limitation.
With this modification they came up with Modified Control Group approach.
The other strand in the literature is the actual-versus-target approach. This approach
allows to compare the actual outcome of major macro variables to the targets set for such
variables (See Pio 1994, Khan 1990). Although it is not frequently used, one of the major
weaknesses of this approach is the bias that could arise in evaluation because the targets
might have been set either below or above what could realistically be attained.
The Modeling/Simulation approach compares the outcome of different polices, such as
liberalization, using an economy-wide (usually macro) model. It basically carries a
counterfactual analysis. Comparatively speaking this approach is theoretically neat.
According to Khan (1990) it has three advantages. First, one can draw on wider body of
adjustment/liberalization experiences. Second, since the policy simulations can be
specific, one does not have to worry that incomplete implementation of the polices will
blur the result. Finally, the approach by its very nature, focuses on the relationship
between policy instrument and policy targets (Khan, 1990: 207). The problem is that this
approach is extremely demanding in terms of having an empirical model and is
vulnerable to what is called the 'Luca's Critique'1 (Khan, 1990).
The final approach cited in the literature is the econometric approach. This approach
makes use of regression analysis to evaluate policy performance, after correcting for
socio-economic and external variables (Pio, 1994:299). The approach is basically similar
to the Modeling/Simulation approach. Their difference being the econometric approach is
a partial equilibrium based analysis while the modeling approach is closer to a general
equilibrium analysis.
As noted above, all these approaches have merits and demerits of their own. This is partly
the reason for obtaining a wide range of results, which more often than not are
conflicting, when program evaluation of a country or countries is made. Ideally it would
1 Parameters of the predicting model could change along policy change/simulation.

10
have been illuminating to employ all the methods and explore the impact of liberalization
in the coffee sub-sector of Ethiopia using these different methods. Neither time nor
available data allows us to do that in this paper, however. Thus, we will basically use the
before-after approach. At times we will also resort to the econometric approach based on
some research work done at the Department of Economics of Addis Ababa University.
3 Ethiopia’s External Trade Policy
An examination of the external trade policy of the three successive regimes in Ethiopia
(the pre-1974, 1974-1991 and the post-1991) reveals that the country’s external trade
policy has moved from a ‘free trade policy’ to ‘a controlled trade policy regime’ and back
to ‘a free trade policy’ one.
3.1 The Pre-1991 (Pre-Reform ) Period
Before 1974, the foreign trade policy of the country was largely informed by ‘the free
trade’ doctrine. Various measures to facilitate trade such as the establishment of the
Chamber of Commerce, the establishment of various boards (Coffee Board, Grain
Marketing Board and Office of National Standards) were taken. These measures were
aimed at controlling the quality of imports and exports and facilitating trade. In terms of
imports, imports of capital goods and raw materials were free of duty while others were
taxed (MIT, 1987).
The period 1974 -1991 was on the other hand characterized by a centralized economic
system, where the state is given a significant role in all spheres of economic activity
including external trade. This period is characterized by:
a) an attempt to control the participation of private capital in trade and
strengthening the state’s role both in export and import trade
b) an attempt to closely monitor the price, quantity and distribution of goods
11
c) an attempt to emphasis the external trade sectors deemed essential for
economic growth as well as the trading of medical equipment and goods that
ensure the health and security of the population.
d) an attempt to diversify the type and destination of goods (especially from
developed capitalist countries towards socialist countries) externally traded.
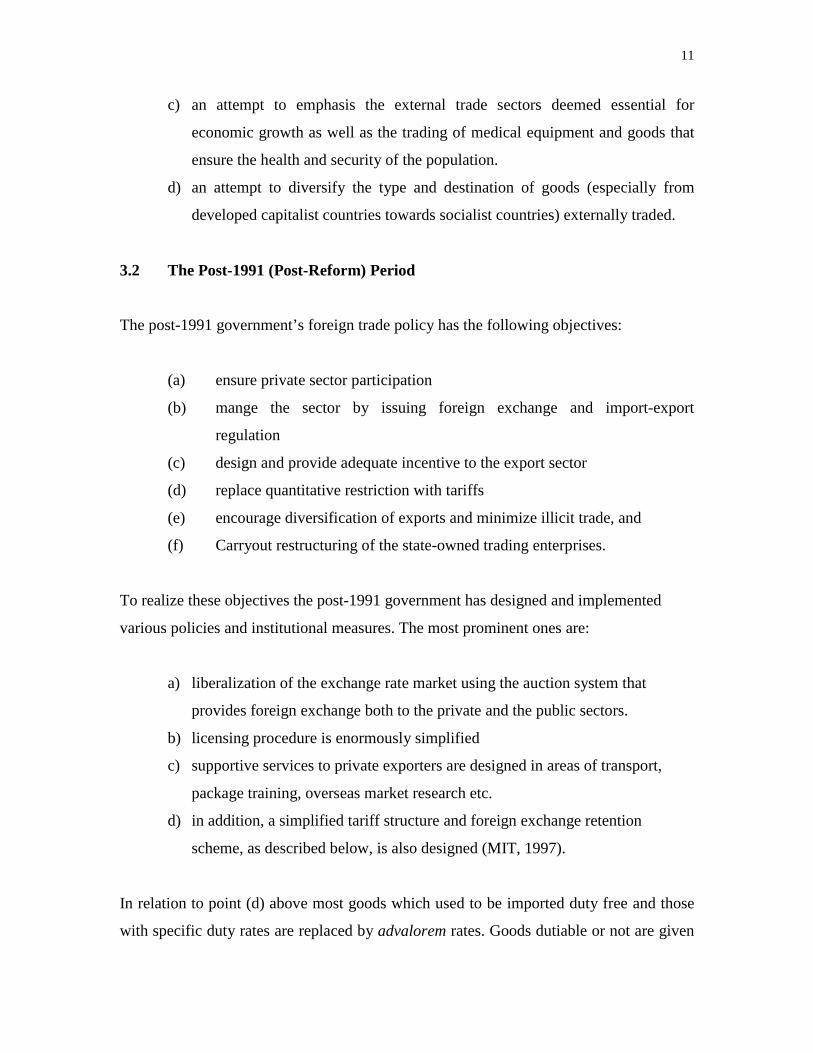
3.2 The Post-1991 (Post-Reform) Period
The post-1991 government’s foreign trade policy has the following objectives:
(a) ensure private sector participation
(b) mange the sector by issuing foreign exchange and import-export
regulation
(c) design and provide adequate incentive to the export sector
(d) replace quantitative restriction with tariffs
(e) encourage diversification of exports and minimize illicit trade, and
(f) Carryout restructuring of the state-owned trading enterprises.
To realize these objectives the post-1991 government has designed and implemented
various policies and institutional measures. The most prominent ones are:
a) liberalization of the exchange rate market using the auction system that
provides foreign exchange both to the private and the public sectors.
b) licensing procedure is enormously simplified
c) supportive services to private exporters are designed in areas of transport,
package training, overseas market research etc.
d) in addition, a simplified tariff structure and foreign exchange retention
scheme, as described below, is also designed (MIT, 1997).
In relation to point (d) above most goods which used to be imported duty free and those
with specific duty rates are replaced by advalorem rates. Goods dutiable or not are given
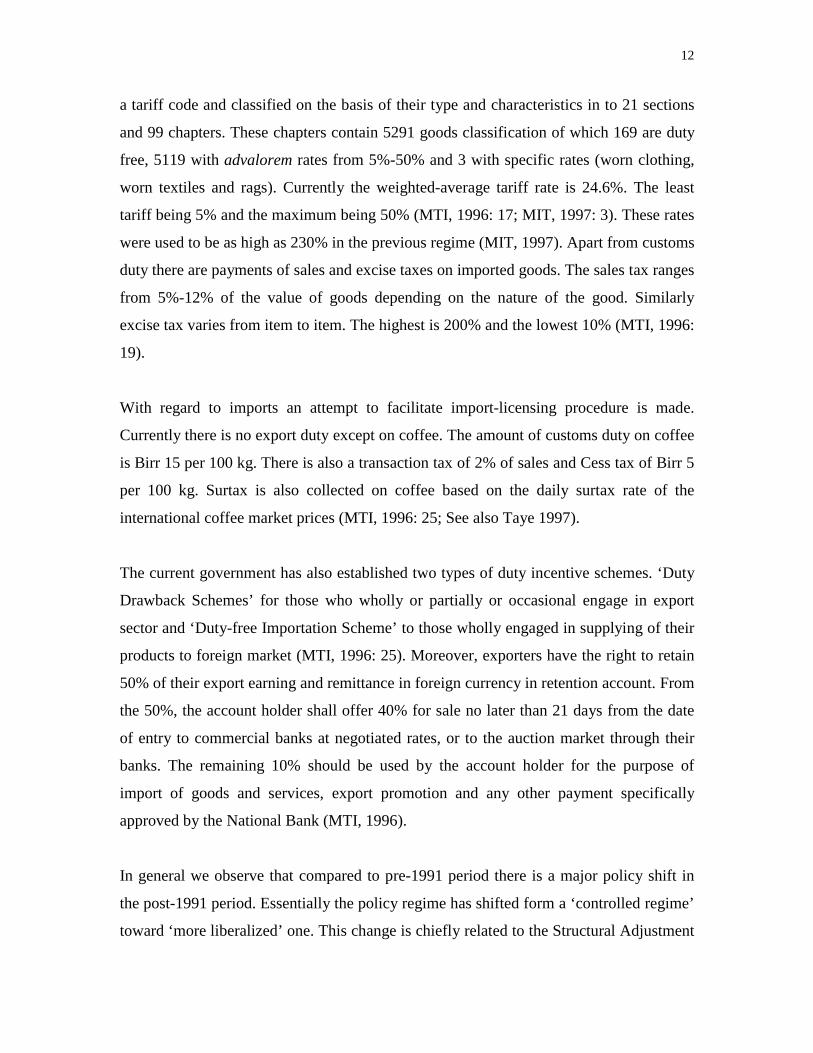
12
a tariff code and classified on the basis of their type and characteristics in to 21 sections
and 99 chapters. These chapters contain 5291 goods classification of which 169 are duty
free, 5119 with advalorem rates from 5%-50% and 3 with specific rates (worn clothing,
worn textiles and rags). Currently the weighted-average tariff rate is 24.6%. The least
tariff being 5% and the maximum being 50% (MTI, 1996: 17; MIT, 1997: 3). These rates
were used to be as high as 230% in the previous regime (MIT, 1997). Apart from customs
duty there are payments of sales and excise taxes on imported goods. The sales tax ranges
from 5%-12% of the value of goods depending on the nature of the good. Similarly
excise tax varies from item to item. The highest is 200% and the lowest 10% (MTI, 1996:
19).
With regard to imports an attempt to facilitate import-licensing procedure is made.
Currently there is no export duty except on coffee. The amount of customs duty on coffee
is Birr 15 per 100 kg. There is also a transaction tax of 2% of sales and Cess tax of Birr 5
per 100 kg. Surtax is also collected on coffee based on the daily surtax rate of the
international coffee market prices (MTI, 1996: 25; See also Taye 1997).
The current government has also established two types of duty incentive schemes. ‘Duty
Drawback Schemes’ for those who wholly or partially or occasional engage in export
sector and ‘Duty-free Importation Scheme’ to those wholly engaged in supplying of their
products to foreign market (MTI, 1996: 25). Moreover, exporters have the right to retain
50% of their export earning and remittance in foreign currency in retention account. From
the 50%, the account holder shall offer 40% for sale no later than 21 days from the date
of entry to commercial banks at negotiated rates, or to the auction market through their
banks. The remaining 10% should be used by the account holder for the purpose of
import of goods and services, export promotion and any other payment specifically
approved by the National Bank (MTI, 1996).
In general we observe that compared to pre-1991 period there is a major policy shift in
the post-1991 period. Essentially the policy regime has shifted form a ‘controlled regime’
toward ‘more liberalized’ one. This change is chiefly related to the Structural Adjustment

13
Program the country has adopted since 1992. The question that will be explored in the
next section is what the impact of this liberalization scheme is in the coffee sub-sector.
4 THE ROLE OF COFFEE IN THE ETHIOPIAN ECONOMY ANDTHE IMPACT OF LIBERALIZATION
As noted above coffee is the most important export crop in Ethiopia. Accordingly, its
contribution to create a dynamic economy by allowing the importation of developmental
goods and creating employment is enormous. This section will briefly examine the
pattern of production in the sub-sector, the place of coffee in the total exports of Ethiopia
and the contribution of coffee to the government’s revenue. Exploration of these aspects
is believed to show the role of coffee in the economy.
4.1 Pattern of Production in the Coffee Sub-Sector.
Diagram 1 shows area under cultivation in 1997/98. It is based on agricultural sample
survey conducted by the Central Statistical Authority. As can be read from the Diagram
the share of coffee is not more than 3% of the total area under cultivation (195,700
hectares). If we consider coffee, pulses and oil seeds as cash crop, the combined share is
in the vicinity of 20%. Thus, the bulk of area under cultivation is on food crops.
Diagram 1: Area Under Cultivation (1997/98)
Coffee3%
Wheat11%
Teff24%
Barely10%
Maize16%
Pulses12%Oats
1%
Sorghum14%
Millet4%
Oil Seeds5%

14
Source: Central Statistical Abstract (CSA): Agricultural Sample Survey 1990EC (1997/98)
Although we couldn’t find sufficient data to make our point, there was a sustained
increase in the size of area under coffee cultivation since the beginning of liberalization
in 1991/92. This can be seen form Table 1 below. Table 1 shows that area under coffee
cultivation has increased from 1991/92 until 1995/96 and declined a little there after.
Notwithstanding this decline, area under cultivation in 1997/98 is much higher than the
1991/92 level. It would have been interesting to get similar data for pre-reform period.
However, we couldn’t mange to get such data from CSA.
In general, its seems reasonable to tentatively conclude that area under coffee cultivation
has increased since the onset of the liberalization program in Ethiopia. During this period
the Birr (the local) currency was depreciating – from Birr 5 per USD in 1992 to Birr 8.12
per USD now. This implies that the return from coffee in terms of local currency has
increase and could be considered one of the reasons for the increase in area under
cultivation. If we assume fixed supply of factors of production (in particular labour and
land) and full employment of these resources, no fundamental change in productivity it is
reasonable to predict that area under food production has declined. This could be against
the notion of ‘food sovereignty’ – a concept advocated by critics of trade-based food
security (see below).
Table 1: Area Under Coffee Cultivation: (000 hectares)
YearEthiopianCalendar
EuropeanCalendar
Area
1984 1991/1992 130.841987 1992/1993 183.561988 1993/1994 202.131989 1994/1995 191.631990 1995/1996 195.7
Source: Central Statistical Authority, Agricultural Sample Survey, Various Issues
Table 2 shows the nature of coffee production in Ethiopia. The peasant sector or small
holder producers are the dominant features of Ethiopia’s coffee production. This sector
contributes more than 95% to coffee production, leaving less than 5% to the modern
(commercial farm and state) sector.
15
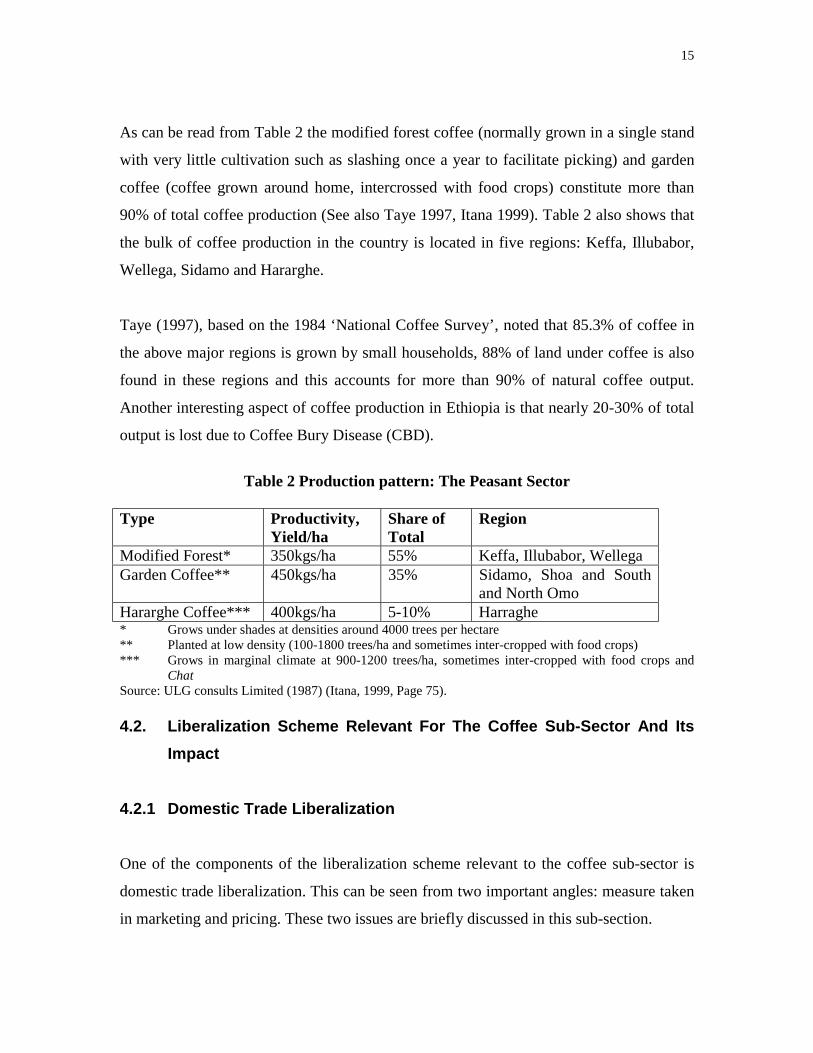
As can be read from Table 2 the modified forest coffee (normally grown in a single stand
with very little cultivation such as slashing once a year to facilitate picking) and garden
coffee (coffee grown around home, intercrossed with food crops) constitute more than
90% of total coffee production (See also Taye 1997, Itana 1999). Table 2 also shows that
the bulk of coffee production in the country is located in five regions: Keffa, Illubabor,
Wellega, Sidamo and Hararghe.
Taye (1997), based on the 1984 ‘National Coffee Survey’, noted that 85.3% of coffee in
the above major regions is grown by small households, 88% of land under coffee is also
found in these regions and this accounts for more than 90% of natural coffee output.
Another interesting aspect of coffee production in Ethiopia is that nearly 20-30% of total
output is lost due to Coffee Bury Disease (CBD).
Table 2 Production pattern: The Peasant Sector
Type Productivity,Yield/ha
Share ofTotal
Region
Modified Forest* 350kgs/ha 55% Keffa, Illubabor, WellegaGarden Coffee** 450kgs/ha 35% Sidamo, Shoa and South
and North OmoHararghe Coffee*** 400kgs/ha 5-10% Harraghe* Grows under shades at densities around 4000 trees per hectare** Planted at low density (100-1800 trees/ha and sometimes inter-cropped with food crops)*** Grows in marginal climate at 900-1200 trees/ha, sometimes inter-cropped with food crops and
ChatSource: ULG consults Limited (1987) (Itana, 1999, Page 75).
4.2. Liberalization Scheme Relevant For The Coffee Sub-Sector And ItsImpact
4.2.1 Domestic Trade Liberalization
One of the components of the liberalization scheme relevant to the coffee sub-sector is
domestic trade liberalization. This can be seen from two important angles: measure taken
in marketing and pricing. These two issues are briefly discussed in this sub-section.
16
The liberalization scheme adopted in Ethiopia has a significant impact on marketing of
coffee. Before the 1992 reform the Ethiopian Coffee Marketing Corporation (ECMC) had
the monopoly in purchasing and exporting of coffee. It had the control of more than 80%
of the total supply. The Coffee Plantation Development Corporation (CPDC) on the other
hand was established to run nationalized commercial farms and to develop them in to
state farms. A Coffee Development and Project Implementation Department (CDPI) was
responsible for managing the small peasant sector. Institutionally speaking this
centralized controlling of the marketing activity is stopped after the 1992 reform. The
ministry is reduced to an authority and mandated to promote growth of coffee and tea
production, trade and processing. Coffee development activities are largely left for
regional buraux. Moreover, two institutions: the Ethiopian Coffee Purchase and Sale
Enterprise (ECPS) – limited to domestic operation – and the Ethiopian Coffee Export
Enterprise (ECEE) – which operates competitively with the private sector- are established
(See Taye 1997: 36-39). Briefly the new marketing structure can be depicted by the
Diagrams given below.

17
Diagram 2a: Market Structure for Sun-dried Coffee
* Hararg
Diagram 2b:
Individual farmers
‘Sebsabi’
‘Akrabi’
Exporters
State enterprises
Individual Farme
Service Cooperative
ECPS
Servicecooperatives
he c
Ma
S
ECPSE Purchasing Stations
I
rs
s
E
Addis Ababa*Auction
offee goes to Dir
rket Structure f
ource: Taye (19
nternational buyers
International
Addis AbabaRegistration
e Dawa Market
or Washed Coffee
Domestic Coffee Sales
Retailers
Domestic Consumers
Private Processors
AddisAbaba
97)
Buyers
18
Another dimension of the pre-reform period is that it was characterized by price control.
The government determines the price after setting the level of taxes and marketing
margins. The basis for computing the local price (which includes taxes such as surtax)
had initially been based on the price for the Brazilian Santos 4, then the ‘composite price
of ICO’ is adopted. Both of them are found to depart from world price for coffee. Since
the 1990 the base for the calculation of coffee surtax and the auction price is the fob daily
price of Jimma 5. To arrive at the auction price deduction for clearing costs, transport,
bank and insurance charges, taxes and exporter’s margin are made out of the fob price.
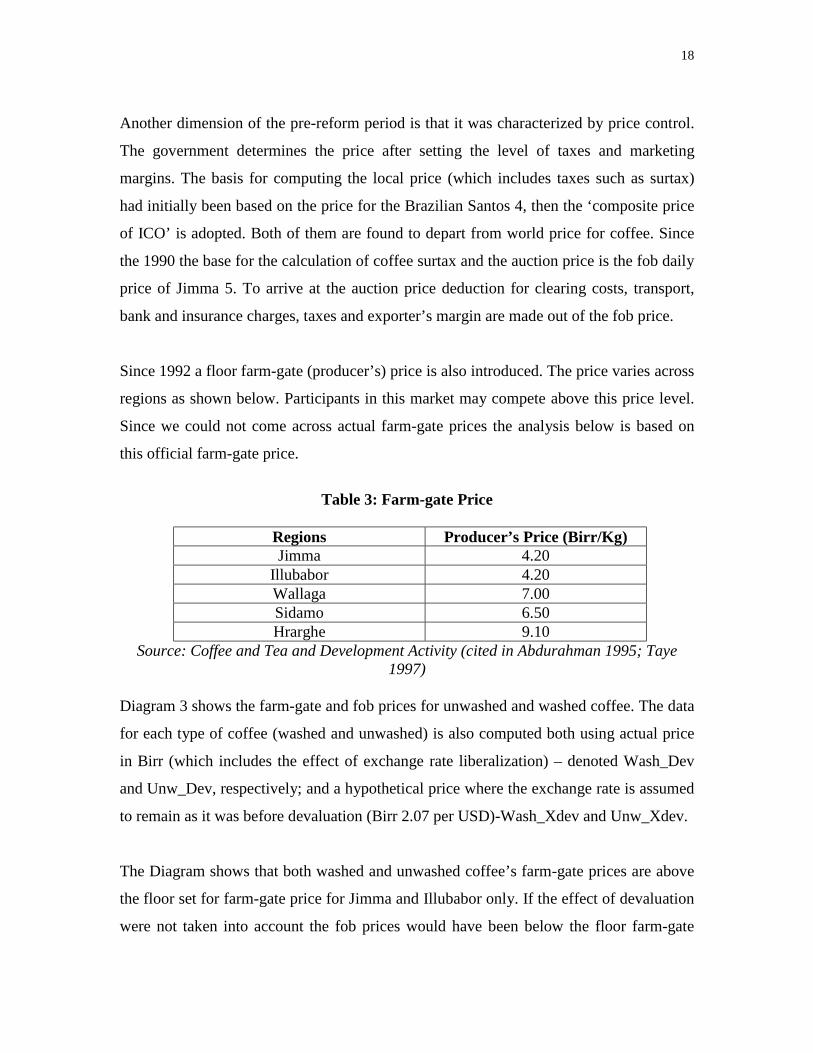
Since 1992 a floor farm-gate (producer’s) price is also introduced. The price varies across
regions as shown below. Participants in this market may compete above this price level.
Since we could not come across actual farm-gate prices the analysis below is based on
this official farm-gate price.
Table 3: Farm-gate Price
Regions Producer’s Price (Birr/Kg)Jimma 4.20
Illubabor 4.20Wallaga 7.00Sidamo 6.50Hrarghe 9.10
Source: Coffee and Tea and Development Activity (cited in Abdurahman 1995; Taye1997)
Diagram 3 shows the farm-gate and fob prices for unwashed and washed coffee. The data
for each type of coffee (washed and unwashed) is also computed both using actual price
in Birr (which includes the effect of exchange rate liberalization) – denoted Wash_Dev
and Unw_Dev, respectively; and a hypothetical price where the exchange rate is assumed
to remain as it was before devaluation (Birr 2.07 per USD)-Wash_Xdev and Unw_Xdev.
The Diagram shows that both washed and unwashed coffee’s farm-gate prices are above
the floor set for farm-gate price for Jimma and Illubabor only. If the effect of devaluation
were not taken into account the fob prices would have been below the floor farm-gate

19
price set for Hararghe. From this it can readily be inferred that other liberalization
schemes (except devaluation) had no significant effect on the unit fob (in Birr) value of
both washed and unwashed coffee.
However, when the effect of devaluation is taken into account the fob price (in local
currency) has dramatically increased. This upward trend has a similar pattern both for
unwashed and washed coffee, the highest being for the latter. The highest floor price (the
Hrarghe farm-gate price2) constituted 25% and 50% of washed and unwashed coffee fob
price, respectively, in 1997/98.
2 There is no time series data on farm-gate price. Abdurahman’s (1994) study for Hararghe showsthat the actual farm-gate price ranges form Birr 11 to 20 per kg in 1994.

20
Diagram 3: Farm-gate and Fob Prices of Coffee (Based on Table 10)

21
4.2.2 Foreign Trade Liberalization
The liberalization of foreign trade in coffee is part of the general liberalization program
commenced in 1992. Two important issues can be singled out in this connection. The first
relates to an enormous simplification of entry in to the coffee export business. This is
shown by Proclamation No 70/1993 that amended the Coffee Trade Proclamation No
263/1984. This amendment gave both the licensing and renewal fees for involvement in
the coffee export sector (details are given in section 4.2.5). A second and related reform
measure in relation to foreign trade in coffee is the simplification of coffee export taxes.
The post-reform period witnessed an enormous reduction and simplification of tax levied
on coffee exports. The details of this are given in section 4.2.4 below.
The overall effect of this liberalization program in the foreign trade sector is to raise the
participation of the private economic agents in the export of coffee. For instance the share
of private coffee suppliers increase form 20% in 1989/90 to 82% in 1992/93 while the
share of private exporters increased from 37% in 1989/90 to 85% in 1992 (Abdurahman
1995). In 1997 62 private exporters are engaged in the coffee exporting trade. This figure
was merely 13 in 1991. According to Taye’s figure obtained from Coffee and Tea
Authority, the share of private exporter in the total exports has jumped form 13.52% in
1989/90 to 52.51% in 1995/96 (Taye, 1997: 44). Currently it is estimated that the share of
private exporters is in the vicinity of 70%. Similarly, the number of coffee processing
stations has also increased following trade liberalization. According to the figures of the
Coffee and Tea Authority, by August 1998 there were a total of 388 wet coffee
processing stations (164 owned by cooperatives, 195 by private and 29 by public). The
comparable figure for dry coffee processing is 206 (10 owned by cooperatives, 135 by
private and 10 by public).
4.2.3 Exchange Rate Liberalization: Devaluation

22
A liberalization policy that has a direct bearing on the coffee sub-sector is the exchange
rate policy pursed after 1992. The exchange rate reform is commenced by devaluing the
currency that was fixed nearly for two decades at Birr 2.07 per 1 USD by 140%, to 5 Birr
per US$, in October 1992. Such massive devaluation was partly justified by the premium
on the parallel market that was close to 238%. In 1993 the NBE introduced the auction-
based exchange rate system. This used to be conducted on fortnight basis and takes the
form of the ‘Dutch Auction’ system (discriminatory price), where the marginal rate,
which clears the market, is taken as the ruling rate for the coming two weeks. The supply
of funds for this market comes from export earnings and loans & grants. The auction-
based exchange rate system was initially working side by side with the official exchange
rate. This system has been overseen by a committee composed of the NBE, Ministry of
Finance, Ministry of Economic Development and Cooperation (MEDaC) and two
representatives of the private sector.
In the course of its implementation more liberalization efforts (such as reducing the bid
cover requirement, abolishing of negative import list as well as the ceiling on demand for
foreign exchange etc) were made. Moreover, after the 86th auction (in July 1996), the
NBE introduced a weekly auction replacing the previous auction which used to be held
on fortnight basis. By August 1995 the official or fixed exchange rate (that had been used
for importation of fertilizer, petroleum and pharmaceutical products as well as Ethiopia’s
contribution to international organization and external debt-service payments) is also
unified with the auction rate (Table 4 shows the evolution of the official, the parallel and
the auction rates). Moreover, the NBE has also replaced the retail auction system by a
wholesale auction system where banks are taken as wholesale bidders.
Table 4: The Exchange Rates in the Post-Reform Period (Birr per US$)
Annual Average,Birr/US$
1993/94 1994/95 1995/96
1996/97 1997/98(Qrt I)
1999
1. Official Rate 5.09 5.86 6.32 6.47 6.80 ~8.122. Marginal Rate 5.77 6.25 6.32 6.47 6.80 (Sept.) ~8.123. Divergence = [1-2] Birr 0.68 Birr. 0.39 unified4. Parallel Market 7.05 7.30 7.64 7.16 7.23 ~ 8.16
Source: NBE, Quarterly Bulletin, 1997/98. ~ Recent daily rate (approximate value)

23
The immediate implication of the policy of devaluation and the subsequent auction-based
exchange rate determination is to raise the value of coffee export earning in terms of
domestic currency. This, it is presumed, not only raises export earnings in terms of Birr
but also the farm-gate prices of coffee. The latter may in turn encourage resource (such as
land and labour) shift towards the coffee sector. This well could be at the expense of
other sectors – most importantly the food sector. The existing evidence on this issue is
discussed in section five (5) below.
The export earning from coffee has also a direct bearing on the auction-based exchange
rate. This is because coffee export earnings do form part of the supply of foreign
exchange in the auction market. Thus, not only the auction-based exchange rate affects
the supply of exports but also the export earnings affect it. This in turn implies that an
increase in supply of coffee might have a dynamic detrimental effect (through lower
auction-based exchange rate) on coffee supply.
4.2.4. Tax Reforms and Coffee’s Contribution to Government Revenue
The recent liberalization inspired tax reform can be read from proclamation No 70/1993 -
‘A Proclamation to Amend the Coffee Trade Proclamation No. 263/1984’ and
Proclamation No 99/1998 which is a ‘Proclamation to Provide the Payment of Tax on
Coffee Exported from Ethiopia’. The former basically provides the coffee trade and
license issuance and renewal fees as shown below.
Table 5 Fees for Issuance and Renewal of License
No Description of License Fees for Issuance andfor Renewal (Birr)
1 Coffee Export License 2002 Coffee Supply License 1503 Coffee Clearing License 1504 Coffee collecting License 1505 Coffee Trade Auxiliary License 1506 Coffee Washing License 150
Source: Proclamation No 70/1993 in Negarit Gazeta, 4th Year No. 18, 1998.

24
Proclamation No. 99/1998 has the objective of: (a) consolidating the various taxes and
duties levied by different Proclamations and Regulations into a single tax facility, (b)
converting specific rates into advalorem rates so as to ensure equitability of tax and also
(c) to lay down procedures to protect revenue against fluctuations due to change in prices
and adjust the tax rate following market trend (See Proclamation No. 99/1998 in Negarit
Gazeta, 4th Year No. 18, 1998).
In this proclamation it is declared that the FOB price (selling price quoted at the port,
agreed between the exporter and her customer and approved by the National Bank of
Ethiopia, which excludes freight and insurance costs) will be the basis for computation of
the tax. The tax rate is set at 6.5% of the FOB price. The issuing of this new law repeals
other previous Proclamations and Regulations. These include: Transaction Tax
Proclamation No. 205/1963, The ‘Third Schedule’ (export duties) attached to the
Customs Tariffs Regulation No. 42/1976, Coffee Surtax Regulations No. 280/1964 and
all subsequent amendments as well as Cess on Coffee Exported from Ethiopia Regulation
No. 47/1976 (See Proclamation No 99/98 in Negarit Gazeta, 4th Year No. 18, 1998).
The above proclamations are important because apart from generating foreign exchange
to the country, coffee is an important source of tax revenue to government. Thus, it is
worth examining the impact of the above reform measures on the contribution of coffee
to the government revenue. Table 6 shows the type of tax levied on coffee export and
their combined contribution to the government revenue. As can be read from Table 6
there are three types of taxes (Coffee Surtax, Coffee Duties and Coffee Cess tax – in the
order of their importance) levied in the export of coffee. There is a marked difference in
the contribution of coffee to tax revenue in the pre and post-reform period. In the pre-
reform period coffee export’s contribution (leaving the abnormal period of 1990) was
around 8% of the total government revenue. This figure has dramatically dropped to
around an average of 1%. The latter is including the abnormal increase in coffee taxes’
contribution due to a huge rise in surtax in 1994/95. If this abnormal year is excluded, the
average figure would have dropped to 0.89%.
25
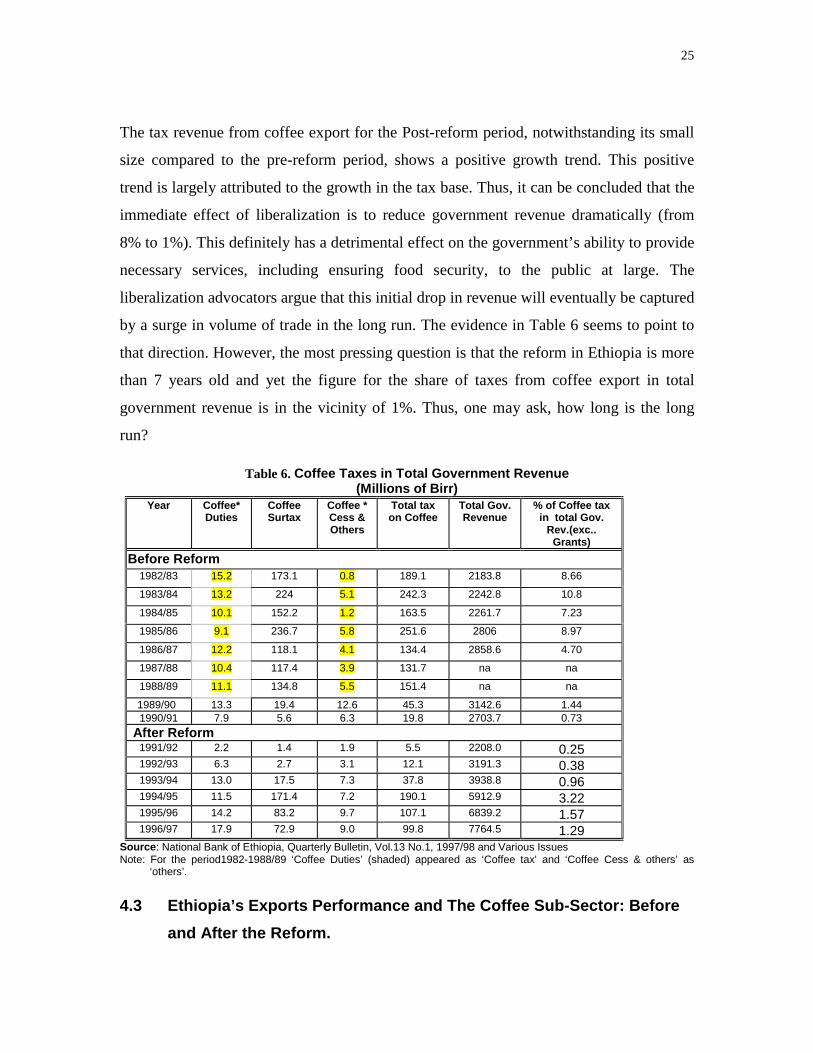
The tax revenue from coffee export for the Post-reform period, notwithstanding its small
size compared to the pre-reform period, shows a positive growth trend. This positive
trend is largely attributed to the growth in the tax base. Thus, it can be concluded that the
immediate effect of liberalization is to reduce government revenue dramatically (from
8% to 1%). This definitely has a detrimental effect on the government’s ability to provide
necessary services, including ensuring food security, to the public at large. The
liberalization advocators argue that this initial drop in revenue will eventually be captured
by a surge in volume of trade in the long run. The evidence in Table 6 seems to point to
that direction. However, the most pressing question is that the reform in Ethiopia is more
than 7 years old and yet the figure for the share of taxes from coffee export in total
government revenue is in the vicinity of 1%. Thus, one may ask, how long is the long
run?
Table 6. Coffee Taxes in Total Government Revenue (Millions of Birr)
Year Coffee* Duties
Coffee Surtax
Coffee * Cess &Others
Total taxon Coffee
Total Gov.Revenue
% of Coffee taxin total Gov.
Rev.(exc..Grants)
Before Reform1982/83 15.2 173.1 0.8 189.1 2183.8 8.66
1983/84 13.2 224 5.1 242.3 2242.8 10.8
1984/85 10.1 152.2 1.2 163.5 2261.7 7.23
1985/86 9.1 236.7 5.8 251.6 2806 8.97
1986/87 12.2 118.1 4.1 134.4 2858.6 4.70
1987/88 10.4 117.4 3.9 131.7 na na
1988/89 11.1 134.8 5.5 151.4 na na
1989/90 13.3 19.4 12.6 45.3 3142.6 1.441990/91 7.9 5.6 6.3 19.8 2703.7 0.73
After Reform 1991/92 2.2 1.4 1.9 5.5 2208.0 0.25 1992/93 6.3 2.7 3.1 12.1 3191.3 0.38 1993/94 13.0 17.5 7.3 37.8 3938.8 0.96 1994/95 11.5 171.4 7.2 190.1 5912.9 3.22 1995/96 14.2 83.2 9.7 107.1 6839.2 1.57 1996/97 17.9 72.9 9.0 99.8 7764.5 1.29
Source: National Bank of Ethiopia, Quarterly Bulletin, Vol.13 No.1, 1997/98 and Various Issues Note: For the period1982-1988/89 ‘Coffee Duties’ (shaded) appeared as ‘Coffee tax’ and ‘Coffee Cess & others’ as
‘others’.
4.3 Ethiopia’s Exports Performance and The Coffee Sub-Sector: Beforeand After the Reform.
26
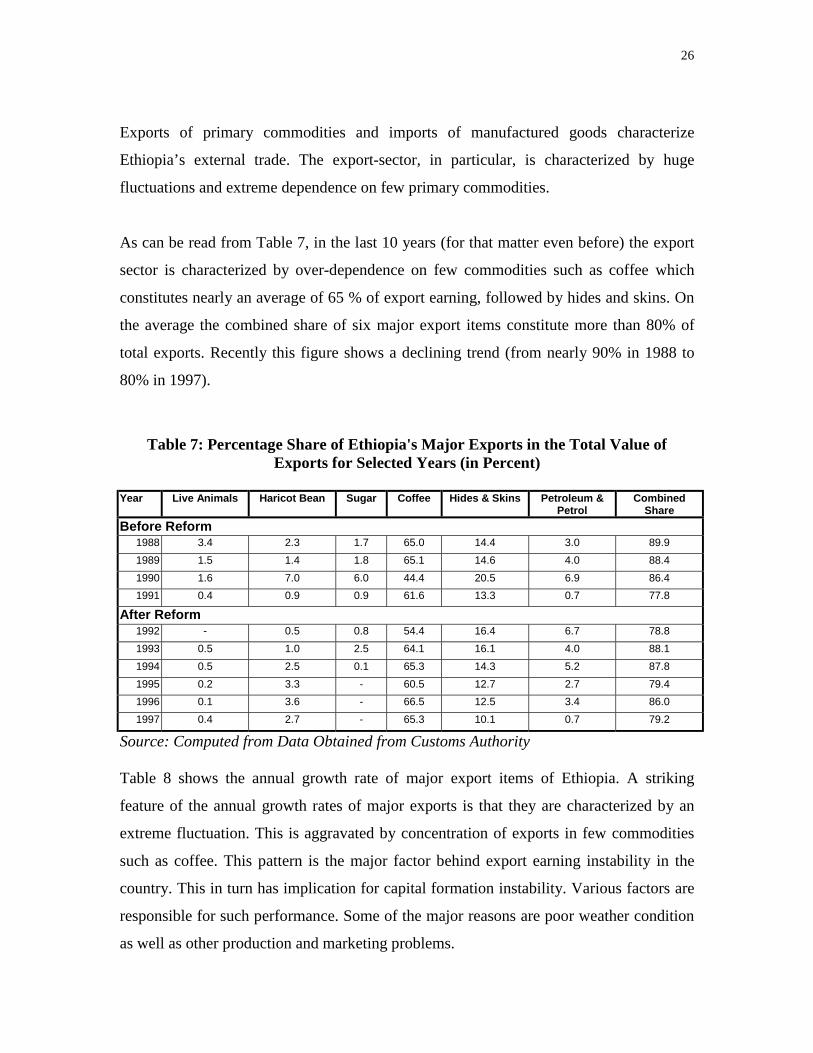
Exports of primary commodities and imports of manufactured goods characterize
Ethiopia’s external trade. The export-sector, in particular, is characterized by huge
fluctuations and extreme dependence on few primary commodities.
As can be read from Table 7, in the last 10 years (for that matter even before) the export
sector is characterized by over-dependence on few commodities such as coffee which
constitutes nearly an average of 65 % of export earning, followed by hides and skins. On
the average the combined share of six major export items constitute more than 80% of
total exports. Recently this figure shows a declining trend (from nearly 90% in 1988 to
80% in 1997).
Table 7: Percentage Share of Ethiopia's Major Exports in the Total Value ofExports for Selected Years (in Percent)
Year Live Animals Haricot Bean Sugar Coffee Hides & Skins Petroleum &Petrol
CombinedShare
Before Reform1988 3.4 2.3 1.7 65.0 14.4 3.0 89.91989 1.5 1.4 1.8 65.1 14.6 4.0 88.41990 1.6 7.0 6.0 44.4 20.5 6.9 86.41991 0.4 0.9 0.9 61.6 13.3 0.7 77.8
After Reform1992 - 0.5 0.8 54.4 16.4 6.7 78.81993 0.5 1.0 2.5 64.1 16.1 4.0 88.11994 0.5 2.5 0.1 65.3 14.3 5.2 87.81995 0.2 3.3 - 60.5 12.7 2.7 79.41996 0.1 3.6 - 66.5 12.5 3.4 86.01997 0.4 2.7 - 65.3 10.1 0.7 79.2
Source: Computed from Data Obtained from Customs Authority
Table 8 shows the annual growth rate of major export items of Ethiopia. A striking
feature of the annual growth rates of major exports is that they are characterized by an
extreme fluctuation. This is aggravated by concentration of exports in few commodities
such as coffee. This pattern is the major factor behind export earning instability in the
country. This in turn has implication for capital formation instability. Various factors are
responsible for such performance. Some of the major reasons are poor weather condition
as well as other production and marketing problems.

27
Table 8: Annual Growth Rates of Major and Total Exports(Selected Years, Volume)
Annual Growth RatesYearTotal Exports Coffee Hides & Skins Petroleum & Petrol Live Animals
Before Reform1989 -4.7 21.3 18.8 4.2 -56.41990 -7.1 -37.0 -22.5 -3.2 -31.71991 -70.9 -20.5 -54.7 -96.2 -89.6After Reform1992 92.5 -14.1 23.2 1715.1 -1993 19.4 58.9 79.0 2.8 -1994 46.0 15.0 6.1 41.6 95.21995 -27.6 -4.9 3.1 -40.9 -74.11996 26.1 44.1 -11.3 7.1 -73.21997 7.3 7.7 24.6 -65.1 1389.4Average Rate ofGrowth(1989-1997)
9.0 7.8 7.45 173.9 165.7
Source: Computed from Data Obtained from Customs Authority
When we move from this general picture to coffee, we note that actual coffee production
data is hard to come by. Thus, a lot of researchers use coffee arrival at the
central/terminal markets (of Addis Ababa and Dire Dawa) as an indicator of total supply.
Table 9 shows these data in the period before and after the 1992 reform. The data clearly
shows that there is unprecedented increase in the supply of coffee following the
liberalization program. The total supply has reached its historic pick of 165 thousands
metric tones in 1996/97.
However, the share of exports out of the total arrival, although is showing an increasing
trend in the post-reform period, is generally lower when compared to the pre-reform
period. In the early days of the reform period this is attributed to low level of exports in
absolute terms while the trend in the recent past is attributed to the huge increase in total
supply.
Table 9: Coffee Arrivals and Approval for Exports (in metric tons)
Accepted for ExportYear Arrival for
InspectionApproval forDomestic Sales
(In Metric Tone) (as share ofarrival)
Before Reform1978\79 102692 2176 83133 81.0%

28
1979\80 96429 2946 82142 85.2%1980\81 89006 3843 75447 84.8%1981\82 91766 4077 80157 87.4%1982\83 112140 3331 87573 78.1%1983\84 102432 4849 94957 92.7%1984\85 70123 3731 66392 94.7%
1985\86 91997 6451 54490 59.2%1986\87 156295 19955 154066 98.6%1987\88 64287 2859 53244 82.8%1988\89 109299 3268 77707 71.1%1989\90 90650 4498 83251 91.8%1990\91 77316 2500 53456 69.1%
After Reform1991\92 60155 4024 36076 56.0%1992\93 87669 3290 69263 79.0%1993\94 113680 n.a. 73004 64.2%1994\95 102302 n.a. 78420 76.7%1995\96 141361 n.a. 101823 72.0%1996\97 165536 n.a. 117979 71.3%1997\98 na na na1998\99 na na na
Source: NBE, Quarterly Bulletin, 1998
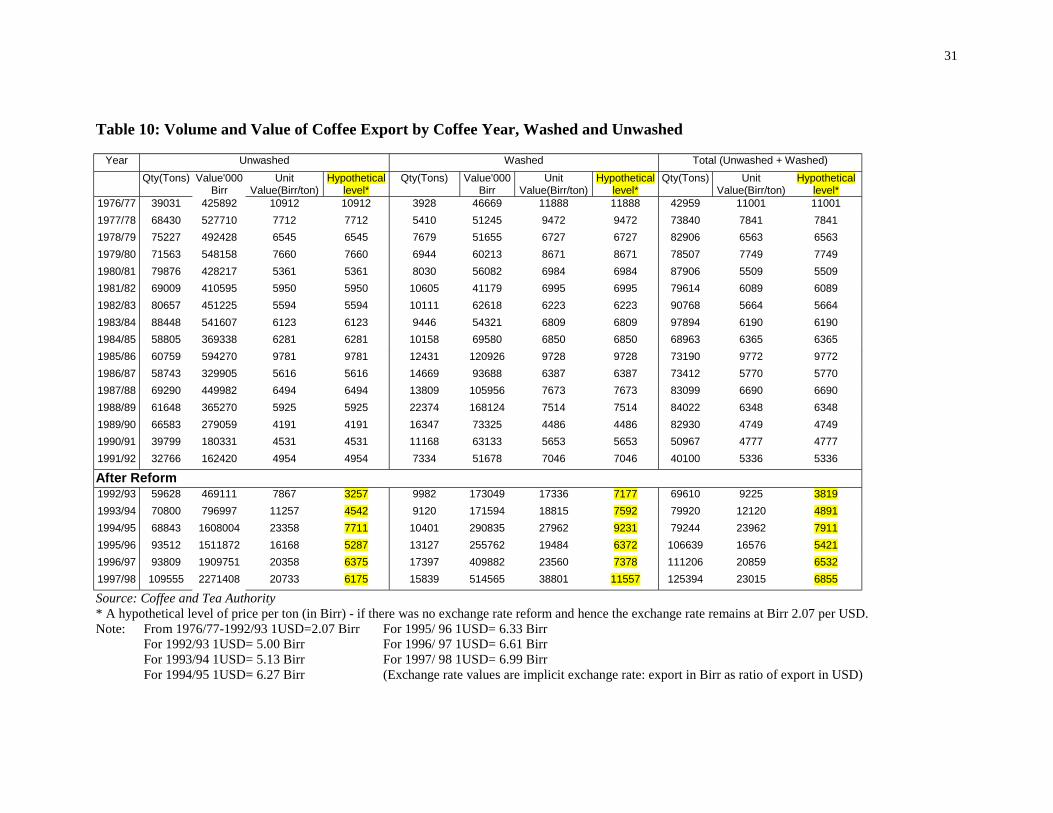
Table 10 shows a rather extended version of the export data given in Table 9. The late
1980s witnessed a decline both in volume and unit price of unwashed coffee. This
obviously had a depressing effect on value. Similar trend is observed for washed coffee,
which is relatively a high quality product.
The period after liberalization is symmetrically opposite to the situation described above.
Both the volume and unit price has shown a sustained upward trend in the post-reform
period. This, in particular, is true of the huge growth in volume of unwashed coffee.
Similar trend is also observed for the washed coffee. Thus, following the before-after
approach it is sensible to conclude that the liberalization carried have a positive effect on
coffee export growth.
Table 11 shows the share of Ethiopia’s export in the world coffee market. The Table
shows that Ethiopia’s share in the world market is in the vicinity of 2%. Observed in the
range of the entire period, this figure has shown a declining trend. It has shown a small
decline in late 1980s and early 1990s, and reached its lowest in 1991/92 (the period of
29
change in government). Following the 1992 liberalization Ethiopia’s share in the world
market has shown some signs of recovery, although the historic maximum figure of 2.5%
(which was achieved in 1980/81) is not attained yet.
This low share of Ethiopia’s export in the world coffee market is partly attributed to the
growth in the world supply of coffee not only from the traditional major suppliers such as
Latin American (Brazil, Colombia etc) and African (Uganda, Cote d’Ivoire etc) countries
but also new entrants into the market from Asia.
In terms of the destination of exports the bulk of Ethiopia’s exports are destined to
industrialized countries (Germany, USA, Italy, France, UK, Japan and Saudi Arabia in
Asia, in particular). This pattern seems to remain unchanged over the past ten to 15 years.
The only exception could be the increasing importance of Asian countries (in particular
Japan and Saudi Arabia).
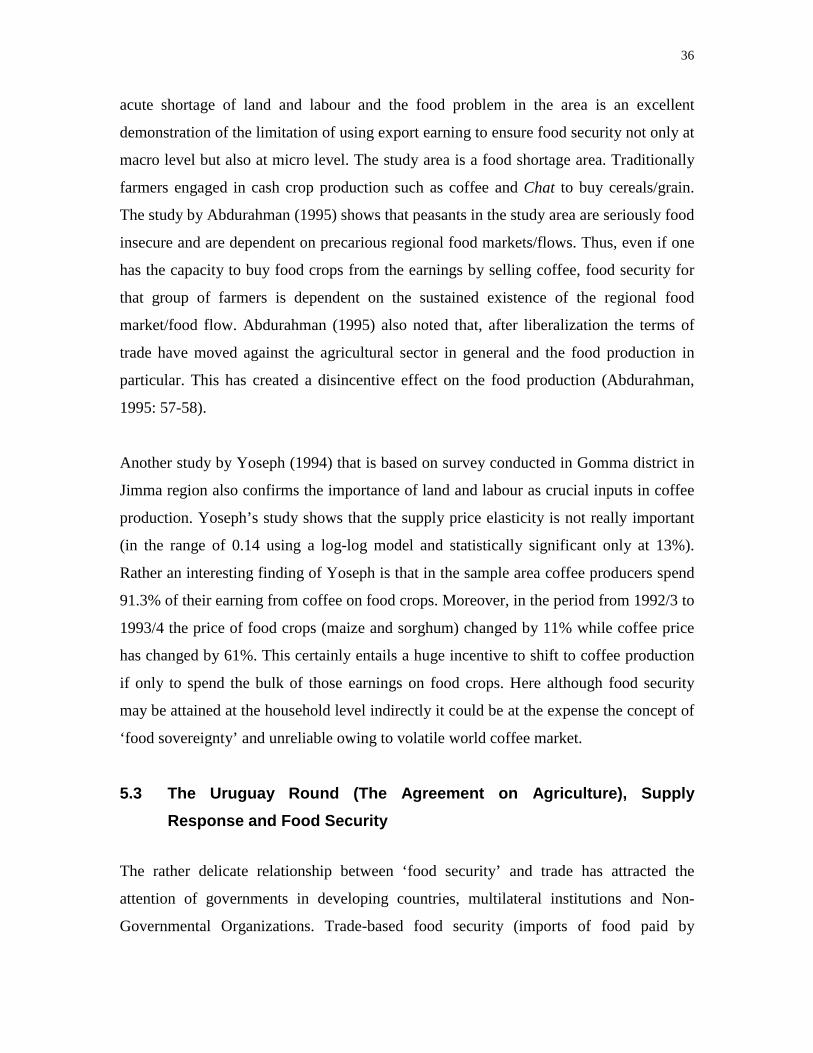
It should also be noted that a few countries such as Germany, Japan and Italy and
recently Saudi Arabia are increasingly becoming important destinations to exports from
Ethiopia. Table 12 shows the need to increasingly diversify the destination of exports so
as to avoid over-dependence on few countries. Diagram 4 below shows the export market
destination for 1997 (the latest available figure). The diagram clearly shows the dominant
position of Germany.

30
Diagram 4: Export Market Destination for Ethiopia (1997) [See Table 12]
Export Market Destination for Ethiopia ( 1997)
Italy8%France
3%
Japan11% Other Europe
14% United Kingdom 3%
Germany21%
USA11%
Saudi Arabia9%
Africa13%
Rest of the W orld
7%
31
Table 10: Volume and Value of Coffee Export by Coffee Year, Washed and Unwashed
Year Unwashed Washed Total (Unwashed + Washed)Qty(Tons) Value'000
BirrUnit
Value(Birr/ton)Hypothetical
level*Qty(Tons) Value'000
BirrUnit
Value(Birr/ton)Hypothetical
level*Qty(Tons) Unit
Value(Birr/ton)Hypothetical
level*1976/77 39031 425892 10912 10912 3928 46669 11888 11888 42959 11001 110011977/78 68430 527710 7712 7712 5410 51245 9472 9472 73840 7841 78411978/79 75227 492428 6545 6545 7679 51655 6727 6727 82906 6563 65631979/80 71563 548158 7660 7660 6944 60213 8671 8671 78507 7749 77491980/81 79876 428217 5361 5361 8030 56082 6984 6984 87906 5509 55091981/82 69009 410595 5950 5950 10605 41179 6995 6995 79614 6089 60891982/83 80657 451225 5594 5594 10111 62618 6223 6223 90768 5664 56641983/84 88448 541607 6123 6123 9446 54321 6809 6809 97894 6190 61901984/85 58805 369338 6281 6281 10158 69580 6850 6850 68963 6365 63651985/86 60759 594270 9781 9781 12431 120926 9728 9728 73190 9772 97721986/87 58743 329905 5616 5616 14669 93688 6387 6387 73412 5770 57701987/88 69290 449982 6494 6494 13809 105956 7673 7673 83099 6690 66901988/89 61648 365270 5925 5925 22374 168124 7514 7514 84022 6348 63481989/90 66583 279059 4191 4191 16347 73325 4486 4486 82930 4749 47491990/91 39799 180331 4531 4531 11168 63133 5653 5653 50967 4777 47771991/92 32766 162420 4954 4954 7334 51678 7046 7046 40100 5336 5336
After Reform1992/93 59628 469111 7867 3257 9982 173049 17336 7177 69610 9225 38191993/94 70800 796997 11257 4542 9120 171594 18815 7592 79920 12120 48911994/95 68843 1608004 23358 7711 10401 290835 27962 9231 79244 23962 79111995/96 93512 1511872 16168 5287 13127 255762 19484 6372 106639 16576 54211996/97 93809 1909751 20358 6375 17397 409882 23560 7378 111206 20859 65321997/98 109555 2271408 20733 6175 15839 514565 38801 11557 125394 23015 6855
Source: Coffee and Tea Authority* A hypothetical level of price per ton (in Birr) - if there was no exchange rate reform and hence the exchange rate remains at Birr 2.07 per USD.Note: From 1976/77-1992/93 1USD=2.07 Birr For 1995/ 96 1USD= 6.33 Birr
For 1992/93 1USD= 5.00 Birr For 1996/ 97 1USD= 6.61 BirrFor 1993/94 1USD= 5.13 Birr For 1997/ 98 1USD= 6.99 BirrFor 1994/95 1USD= 6.27 Birr (Exchange rate values are implicit exchange rate: export in Birr as ratio of export in USD)

32
Table 11: Ethiopia 's Share in the World Coffee Trade under International Coffee Agreement (In Metric tons)
Year [1] Exports of All Members toAll Destinations [2]
Exports of All Members toQuota Markets [3]
Exports of Ethiopia to AllDestinations [4]
Exports ofEthiopia to Quota
Markets [5]
[4] as % of[2] [5] as % of[3]
Before Reform1978/79 3887100 3518100 82906 63415 2.13 1.801979/80 3674640 3302280 78507 59728 2.14 1.811980/81 3567900 3083220 87906 72029 2.46 2.341981/82 3812040 3271440 79614 73676 2.09 2.251982/83 3943860 3305880 90768 80453 2.30 2.431983/84 4201080 3596100 97894 86991 2.33 2.421984/85 4136640 3447540 68963 59438 1.67 1.721985/86 4132740 3716220 73190 64844 1.77 1.741986/87 4383360 3925260 73412 66447 1.67 1.691987/88 3730560 3077040 83099 74576 2.23 2.421988/89 4302600 3497520 84022 77891 1.95 2.23
1989/90 4870260 4209900 82930 71197 1.70 1.691990/91 4458720 3806640 50967 47518 1.14 1.25
After Reform1991/92 4668300 3976608 40120 31149 0.89 0.081992/93 4670700 3912480 69610 60629 1.49 1.551993/94 4317600 3588660 79920 58447 1.85 1.631994/95 3826620 79244 63751 2.071995/96 na na na na
1996/97 na na na naSource: Coffee and Tea Authority, 1996

33
Table 12: Share of Total Exports by Destination (1989-1997)
Share ofTotal
Exports
(1988/89)
After Reform: Share of Total Exports(191992-97)
1992 1993 1994 1995 1996 1997USA 12.4 3.9 9.1 6.5 6.4 6.1 11.4Germany 23.2 9.7 19.7 31.7 29.1 29.7 20.6Italy 6.5 6.5 7.6 8.1 8.6 7.4 7.8France 4.9 5.0 3.7 4.9 5.0 3.4 3.2United Kingdom 1.9 16.3 4.6 3.5 3.6 3.1 2.9Other Europe - 5.1 6.7 5.8 6.4 7.2 14.3Japan 15.1* 21.5 19.0 14.5 13.0 12.0 11.2Saudi Arabia 15.1* 20.1 9.9 5.3 9.0 10.6 8.6Africa ** 7.2 13.4 9.1 11.5 12.4 13.2Rest of the World - 4.8 6.3 10.5 7.3 8.0 6.8Total 100.0 100.0 100.0 100.0 100.0 100.0
* The combined figure for Japan and Saudi Arabia is 15.1%.** Predominantly Djibouti (and recently Sudan and Egypt).Source: Computed from National Bank of Ethiopia. Quarterly Bulletin, 1997/98.
5 SUPPLY RESPONSE AND FOOD SECURITY
5.1 Supply Response: The Macro and Econometric Evidence: A BriefSummary
The analysis in section four shows the impact of Ethiopia’s liberalization program in the
coffee sub-sector using the before and after approach. In section four we have used
various macro data sets to see if there is any change before and after the reform period.
The broad conclusion that could be drawn from that section is that the liberalization
scheme in Ethiopia is accompanied by a positive performance (except in contribution to
government revenue) in the coffee sub-sector as measured by supply, export, quality of
export (washed and unwashed), area under cultivation etc. In this section we will also
explore the available micro/econometric evidence about supply response and attempt to
relate it to the issue of food security. The econometric evidence is compiled based on
research carried out by the Department of Economics of Addis Ababa University.

34
The Econometric /Micro/ Evidence
It wold have been quite interesting to design a survey and examine sample households at
micro level by squarely focusing on the research questions raised in the context of this
study. However, this is both time and resource consuming. In the absence of such survey
we have resorted to a review of micro-based econometric research carried out in coffee
producing areas3.
Taye (1997) made an econometric analysis of coffee supply response to the liberalization
or reform carried in Ethiopia. His analysis is based on a sample of farm households
drawn from two districts (Gomma and Manna) of the Jimma region. According to his
finding there is micro evidence that after liberalization there is an increase movement of
resources to the coffee sub-sector. This is shown by the fact that area under coffee
cultivation in the two districts, number of coffee seedlings, hired labour and frequency of
weeding as well as coffee yield has increased (Taye, 1997: 92; See Table 13 below).
Given the coefficients of 0.48 for land and 0.22 for labour in the coffee production
function estimated using a log-linear Cobb-Dougals production function by the author,
this shift in resources has definitely contributed to increase in the supply of coffee.
Moreover, given the shortage of factors of production in the study area this shift must
have occurred at the expense of other food crops.
Table 13: Resource Shift Effect in Sample Households of Taye’s Study
Pre-Reform Post-ReformArea under Coffee (ha) 0.4867 0.6265Coffee Seedlings (no.) 201.00 497.61Hired Labour (MDs) 19.19 30.49Wedding (frequency) 2.20 3.08Coffee Yield (kg/ha) 425.35 452.51Spraying against CBD (kg) 18.10 2.06Source: Survey Data of Taye (1997).
3 The Department of Economics of AAU has also complied a longitudinal data of both urban andrural households. If that data can be systematically compiled and analyzed it would have given moreinsight. Again this is both time and resource consuming. Future studies in this area can bring about valueadded to issues discussed in this paper.

35
This finding of Taye has implications for food security, especially, in the light of his
other two findings - (a) land and labour are important resources with positive marginal
and average product and (b) that the estimated marginal values of using land (216.96 kg
per ha) is nearly equal to the value of food crop (maize) forgone – thus there is allocative
efficiency. The implication is that in the context of the existing market structure it is
rational for the peasants to substitute coffee for food crops and that is exactly what the
peasants are doing.
This issue brings us to the important question of whether countries such as Ethiopia
which depend on volatile coffee market for their foreign exchange earning can afford to
forgo the important issue of ‘food sovereignty’ relying on the possibility of ensuring food
security through higher export earnings – trade-based food security. The evidence in this
paper is not encouraging to pursue the latter option.
Another micro-based econometric study is Abdurahman’s (1995) work on two districts in
Hararghe highlands (another important coffee growing area). In this area average holding
of the peasants is divided in to 53% for maize and sorghum (major food crops in the area)
and an average of 30% for coffee and chat. Using a survey data of two districts he found
strong short-run (two years) supply price elasticity value of 0.60 which is statistically
significant. He convincingly argued that this short-run response is attributed to marketing
efficiency following liberalization, reallocation of labour to the cash crop sector and a
shift of supply from smuggling to the formal channels. The finding about the latter is also
in line with the study of Dercon and Lulseged (1994) about coffee smuggling although
Dercon and Lulseged argued that the effect of the parallel market is not as large as
sometimes thought (Dercon and Lulseged, 1994: 71). Dercon and Lulseged (1994) noted
that following devaluation there is a trend of an increase in coffee production although
the increase is unlikely to be large. The latter is partly attributed to the relative price of
other competing crops such as chat
Abdurahman (1995) also found that land and labour are the most important constrains of
production activity in the region. The implication of the positive supply price elasticity,
36
acute shortage of land and labour and the food problem in the area is an excellent
demonstration of the limitation of using export earning to ensure food security not only at
macro level but also at micro level. The study area is a food shortage area. Traditionally
farmers engaged in cash crop production such as coffee and Chat to buy cereals/grain.
The study by Abdurahman (1995) shows that peasants in the study area are seriously food
insecure and are dependent on precarious regional food markets/flows. Thus, even if one
has the capacity to buy food crops from the earnings by selling coffee, food security for
that group of farmers is dependent on the sustained existence of the regional food
market/food flow. Abdurahman (1995) also noted that, after liberalization the terms of
trade have moved against the agricultural sector in general and the food production in
particular. This has created a disincentive effect on the food production (Abdurahman,
1995: 57-58).
Another study by Yoseph (1994) that is based on survey conducted in Gomma district in
Jimma region also confirms the importance of land and labour as crucial inputs in coffee
production. Yoseph’s study shows that the supply price elasticity is not really important
(in the range of 0.14 using a log-log model and statistically significant only at 13%).
Rather an interesting finding of Yoseph is that in the sample area coffee producers spend
91.3% of their earning from coffee on food crops. Moreover, in the period from 1992/3 to
1993/4 the price of food crops (maize and sorghum) changed by 11% while coffee price
has changed by 61%. This certainly entails a huge incentive to shift to coffee production
if only to spend the bulk of those earnings on food crops. Here although food security
may be attained at the household level indirectly it could be at the expense the concept of
‘food sovereignty’ and unreliable owing to volatile world coffee market.
5.3 The Uruguay Round (The Agreement on Agriculture), SupplyResponse and Food Security
The rather delicate relationship between ‘food security’ and trade has attracted the
attention of governments in developing countries, multilateral institutions and Non-
Governmental Organizations. Trade-based food security (imports of food paid by
37
exports) has become an accepted norm in many multilateral circles. Many others
(including some NGOs) question such an approach and opt for ‘food sovereignty’
instead. The latter implies introducing the elements of national-decision or policy making
into food security (See Murphy, 1999:8). The issue of ‘food sovereignty’, as opposed to
trade-based food security, has also a supporting micro explanation that warrant its
capacity to ensure household food security. There is evidence that a strong correlation
exists between household food security and the proportion of food consumption, which is
home produced. This is because women have control over the use of food crops where as
men on cash crops. Unless the increase in income from coffee is very high to offset the
negative control effect, there could be problem to ensure food security based on earnings
from cash crop production (Westlake, 1999: 29).
When a country relies on trade-based food security its actual food security will extremely
be dependent on international trade (especially prices). In the Ethiopian context trade-
based food security could be justified if only the international market for coffee is
promising. A study commissioned by Ethiopian government to design a ‘strategy for
development of the coffee sector’ noted that there is no prospect of price rise for coffee in
the coming 20 to 25 years. Moreover, the world coffee market is recently being
characterized by a huge volatility (price in 1998 being substantially declining from a pick
in 1996) (See Westlake, 1999). Trade-based food security is also dependent on the rules
that govern international trade. One such rule is the Uruguay Round Agreement on
Agriculture (UR-AoA). The AoA includes, inter alia, issues of increased market access,
domestic support for farmers, food security, environmental protection etc.
Although the AoA gives developing countries longer time to implement reduction
commitment and demands lesser cuts, it is expected that most developing countries will
be dependent on food imports not only because of higher productivity and existing policy
practice in developed countries but also the distortion effect of stocks in the developed
countries. In 1983 for instance the Common Agricultural Policy of the European Union
cost 70-75% of the entire EU budget, 50% of whish is spent on handling surplus
38
production. This could definitely result in cheap food which could crowd-out food
production in developing countries (See Murphy, 1999: 10).
Given the rather uncertain nature of dependence on trade-based ‘food security’ it is worth
examining the trend of domestic production and food import in Ethiopia as can be read
from Tables 14 to 17. Tables 14 and 15 show area under major crops for private peasant
holdings, which constitute nearly 97% of total crop output and 98% of coffee production,
in pre and post-reform periods. The conclusion that can be drawn by looking the trend of
area under major crops is that although it is characterized by a great annual fluctuation,
area cultivated has increased in the post-reform period. In terms of periodic growth we
have moved from negative rates in the pre-reform period to a positive one in the post-
reform period. As can be read from Table 16, similar pattern in output is also observed.
Thus, notwithstanding the micro evidence of substitution of cropland for coffee, the
macro data shows an increase both in area under cultivation and total output. This can be
attributed, assuming the macro data is reliable, both to an increase in the size of total
holding and/or a rise in productivity.
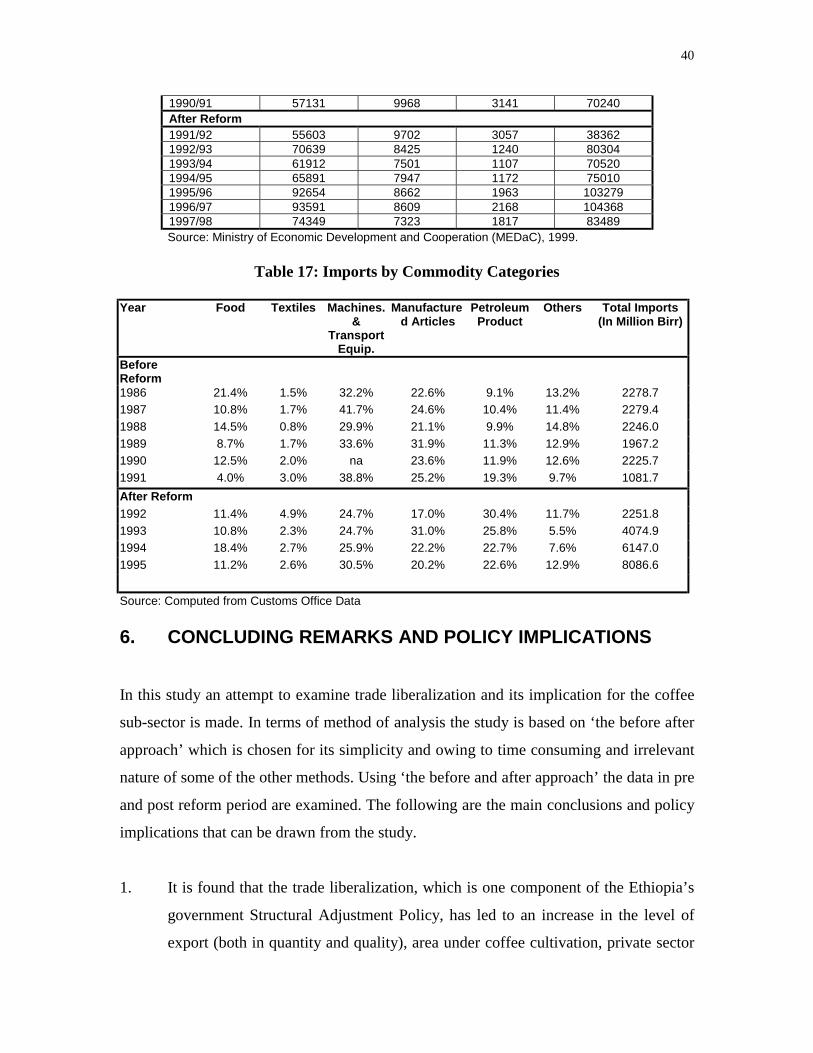
Despite the increase in the domestic production, food imports (See Table 16) constitute
the fourth important item in the total imports of the country. The share although varies
annually (the highest figure being registered in drought years) has not fundamentally
changed in the post-reform period. Moreover, the country is dependent on food aid to
bridge the gap between demand and domestic supply. The annual volume of cereal food
aid has ranged from 2.3% to 26% of total domestic production over the period 1985-
1996. In an average year the volume of cereals food aid can account for up to 25% of the
marketed surplus (MEDaC, 1999: 200). This volume of imports and aid will have price
depressing and hence negative incentive effect on domestic production. The government
is attempting to tackle the food aid impact by efficient targeting of the needy (MEDaC,
199:200).
In sum it can be said that the macro evidence given in this section shows an increase
production of food crops. On the other hand the same macro data shows the increasing

39
importance of food imports and food aid. The latter two thorough their price depressing
effect could bring detrimental effect on domestic production. This is especially important
in the light of the micro evidence of supply response discussed in the previous section.
What the net effects of these two opposing tendencies would be? is an empirical question
that needs further investigation using large sample of reliable macro and micro data?
Table 14: Area Cultivated under Major Crops for Private Peasant Holdings(Both Seasons, in ‘000 ha)
Year Cereals Pulses Oilseed Total
Before Reform1984/85 4553.81 738.98 264.37 5557.161985/86 4666.80 668.24 275.36 5610.401986/87 4642.80 599.24 208.45 5450.491987/88 4915.40 729.00 185.10 5829.501988/89 383.14 37.88 17.20 438.041989/90 4851.10 627.96 220.94 5700.001990/91 4199.00 701.90 244.00 5144.90After Reform1991/92 4087.00 683.15 237.47 5007.621992/93 7740.50 1032.6 373.33 9146.431993/94 6107.70 867.47 322.12 7297.291994/95 6448.50 919.57 342.03 7710.101995/96 7670.55 1005.67 394.36 9070.581996/97 7436.97 1012.26 484.51 8933.741997/98 6619.70 938.88 416.00 7974.58Source: Ministry of Economic Development and Cooperation (MEDaC), 1999.
Table 15: Trends in Area Cultivated Under Major Crops (1980/81 - 1997/98)Period Growth Rates
Before Reform After Reform AverageCrop Type 1980/81-1990/91 1991/92-1997/98 1980/81-1997/98
Cereals -6.6 5.7 3.4Pulses -9.3 3.8 2.3Oil Seeds -6.4 8.6 4.6Total -6.9 5.6 3.3
Source: Ministry of Economic Development and Cooperation (MEDaC), 1999.
Table 16: Estimates of Production of Major Crops by Private Peasant Holdings(Both Seasons, in ‘000 Quintals)
Year Cereals Pulses Oilseed Total
Before Reform1984/85 38727 4838 1046 446111985/86 44278 4605 1153 500361986/87 62775 5741 1089 696051987/88 59570 5640 881 660911988/89 57472 5953 891 643161989/90 61383 6749 983 69115
40
1990/91 57131 9968 3141 70240After Reform1991/92 55603 9702 3057 383621992/93 70639 8425 1240 803041993/94 61912 7501 1107 705201994/95 65891 7947 1172 750101995/96 92654 8662 1963 1032791996/97 93591 8609 2168 1043681997/98 74349 7323 1817 83489Source: Ministry of Economic Development and Cooperation (MEDaC), 1999.
Table 17: Imports by Commodity Categories
Year Food Textiles Machines.&
TransportEquip.
Manufactured Articles
PetroleumProduct
Others Total Imports(In Million Birr)
BeforeReform1986 21.4% 1.5% 32.2% 22.6% 9.1% 13.2% 2278.71987 10.8% 1.7% 41.7% 24.6% 10.4% 11.4% 2279.41988 14.5% 0.8% 29.9% 21.1% 9.9% 14.8% 2246.01989 8.7% 1.7% 33.6% 31.9% 11.3% 12.9% 1967.21990 12.5% 2.0% na 23.6% 11.9% 12.6% 2225.71991 4.0% 3.0% 38.8% 25.2% 19.3% 9.7% 1081.7After Reform1992 11.4% 4.9% 24.7% 17.0% 30.4% 11.7% 2251.81993 10.8% 2.3% 24.7% 31.0% 25.8% 5.5% 4074.91994 18.4% 2.7% 25.9% 22.2% 22.7% 7.6% 6147.01995 11.2% 2.6% 30.5% 20.2% 22.6% 12.9% 8086.6
Source: Computed from Customs Office Data
6. CONCLUDING REMARKS AND POLICY IMPLICATIONS
In this study an attempt to examine trade liberalization and its implication for the coffee
sub-sector is made. In terms of method of analysis the study is based on ‘the before after
approach’ which is chosen for its simplicity and owing to time consuming and irrelevant
nature of some of the other methods. Using ‘the before and after approach’ the data in pre
and post reform period are examined. The following are the main conclusions and policy
implications that can be drawn from the study.
1. It is found that the trade liberalization, which is one component of the Ethiopia’s
government Structural Adjustment Policy, has led to an increase in the level of
export (both in quantity and quality), area under coffee cultivation, private sector

41
participation both in the process and marketing of coffee. The rise in value of
earnings from coffee export is also found to be chiefly due to the exchange rate
policy.
2. This liberalization scheme, however, does not show that SAP (or the AoA, which
has a similar effect) has enhanced the competitiveness of Ethiopia’s coffees in the
international market. Ethiopia’s share in the world market is fond to be too small
(around 2%) to bring about such effect. In fact most micro evidences examined in
this study show that the price elasticity is either small or statistically insignificant.
Thus, it is recommended that price liberalization by itself may not bring major
change in the coffee sub-sector and need to be accompanied by supply side
policies.
3. The volume of coffee export, prices and farm income derived is largely dependent
on both national and international trade policies. In this regard the government’s
domestic (national) policy of coffee market (both domestic and export)
deregulation as well as the reduction of coffee taxes are very relevant. However,
this does not necessarily imply that the country will benefit from international
market. In fact the evidence in this study shows that the world coffee market is
volatile and with no prospect of rise in prices. The latter has an important
implication for food security. The government can not rely on the international
market to ensure food security and caution need to be exercised in this regard.
4. Some of the micro evidences in the paper have shown that even if peasants’
earnings from cash crop could increase following liberalization, acquiring the
required food depends on the efficiency of inter-regional trade in food. This
requires the government or relevant institutions to invest in infrastructure and
efficient information system to help ensure nation food security.
5. One of the potential impacts of liberalization schemes such as SAPs, WTO or
AoA is dumping. Dumping, by depressing prices, can eventually reduce domestic

42
food production. In Ethiopia the increasing trend of food imports and food aid
need proper management and sensible intervention by state before they lead to the
collapse of domestic food production and rehabilitation becomes costly. Concrete
policy implication here could be efficient targeting of the needy regarding food
aid and domestic support or protection with regard food imports.
6. Trade liberalization in the coffee sub-sector has also resulted in the decline in the
share of taxes on exports in total government revenue. This basically implies that
there is a transfer of resources from the government to the private exporters. It is
worth examining the opportunity cost of this fund when used under the state or
the private sector.
7. Since primary commodity exporting countries, such as Ethiopia, are price takers
in the international market, global liberalization by all developing countries
implies a relative increase in global supply which in turn depresses export earning
and, hence, triteness ‘trade-based food security’. This has the policy implication
of either strengthening collective action to fight against the price taker position or
resort to ‘food sovereignty’ by collective negotiation on the rules of the game
such as AoA.
8. Finally, it should be underscored that an in-depth study using micro evidence
about farm-gate price, resource substitution and food market efficiency, among
others, is required to come up with much more micro focused policy implication.
43
Reference:
Abdurahman Amme (1995) ‘Coffee Supply Response in the Hararghe Highlands’ (MSc Thesis,Department of Economics, Addis Ababa University).
Alemayehu Geda (1999a). Finance and Trade in Africa: Modeling Macroeconomic Responsein the World Economy Context. London: Macmillan, forthcoming.
Alemayehu Geda (1999b) ‘Profile of Ethiopia’s External Trade’ in Alemayehu Geda and BerhanuNega (eds.) (1999). The Ethiopian Economy: Performance and Evaluation. AddisAbaba: Ethiopian Economic Association.
Alemayehu Geda and Berhanu Nega (eds.) (1999). The Ethiopian Economy: Performance andEvaluation. Addis Ababa: Ethiopian Economic Association.
Dercon, Stefan and Lulseged Ayalew (1994) ‘Coffee Prices and Smuggling in Ethiopia’,Ethiopian Journal of Economics, 3(2): 49-83.
Goldestein, Morris and Peter Montiel (1986) ' Evaluating Fund Stabilization Programs withMulticountry Data: Some Methodological Pitfalls', IMF Staff Paper, 33(2) I304-344.
Itana Ayana (1999) ‘Economic Liberalization and the Performance of the Coffee Sub-Sector inEthiopia’ in Alemayehu Geda and Berhanu Nega (eds). The Ethiopian Economy:Performance and Evaluation. Addis Ababa: Ethiopian Economic Association.
Kedir Adem (1997) ‘Rural Poverty and Household Welfare During Adjustment: The Case ofSmallholders in Coffee Producing HighLands of Hrarghe, Ethiopia’ (MSc Thesis,Department of Economics, Addis Ababa University).
Khan, Mohsin S. (1990) 'The Macroeconomic Effect of the Fund-Supported AdjustmentPrograms', IMF Staff Papers, 37(2): 195-231.
Ministry of Economic Development and Cooperation (MEDaC) (1999). Survey of the EthiopianEconomy. Addis Ababa: MEDaC.
Mulat Demeke (1999) ‘The Challenge of Increasing Food Production in Ethiopia’ in AlemayehuGeda and Berhanu Nega (eds.). The Ethiopian Economy: Performance and Evaluation.Addis Ababa: Ethiopian Economic Association.
Ssemogerere, Germina (1990) 'Structural Adjustment Programs and the Coffee Sector in Uganda1981-1987', AERC Research Paper NO 1 (Nairobi, Kenya).
Pio, Alessandro (1994) 'The Social Impact of Adjustment in Africa' in Giovanni Andrea Corniaand Gerald K. Helleiner (eds.). From Adjustment to Development in Africa. London: St.Martin's Press.
Proclamation No. 70/93. A Proclamation to Amend Coffee Trade Proclamation No. 263/1984.Proclamation No. 99/1998. A Proclamation to Provide for the Payment of Tax on Coffee
Exported form Ethiopia.Taye Yadeta (1997) 'Measuring and Assessing Distortions in coffee Commodity System: The
Case of Jimma, Ethiopia' (MSc Thesis, Department of Economics, Addis AbabaUniversity).
Yoseph Abdisa (1994) ‘Coffee Supply Response: Implications for Structural Adjustment Programin Ethiopia’ (MSc Thesis, Department of Economics, Addis Ababa University).
Westlake, Mike (1998) ‘Strategy for Development of the Coffee Sector’ (Project Report PA-6,Decentralization Support Activity Project, Ministry of Finance and Ministry of EconomicDevelopment and Cooperation, October 1998, Addis Ababa)