Liberalization of Cross border-DIR.pdf - ASEAN
157
A REPORT ON INSTITUTIONAL ARRANGEMENTS REGULATIONS SURROUNDING CROSS-BORDER CAPITAL FLOWS IN ASEAN+3 ECONOMIES DAIWA INSTITUTE OF RESEARCH Tokyo, Japan July 2006
-
Upload
khangminh22 -
Category
Documents
-
view
0 -
download
0
Transcript of Liberalization of Cross border-DIR.pdf - ASEAN
A REPORT ON
INSTITUTIONAL ARRANGEMENTS REGULATIONS SURROUNDING
CROSS-BORDER CAPITAL FLOWS IN ASEAN+3 ECONOMIES
DAIWA INSTITUTE OF RESEARCH Tokyo, Japan
July 2006


CONTENTS
Executive summary ....................................................................................................................... 1
1. Introduction ..................................................................................................................... 11
2. Analytical anchor and background of the study .......................................................... 13
2.1 Some analytical perspectives: links between capital flows, exchange rates and vulnerable financial systems............................................................................. 13
2.2 In a capsule: an express AFC post mortem ............................................................... 19
2.3 What fanned the flames and other subplots............................................................... 24 2.4 Recovery efforts and strategies ................................................................................... 27
2.5 Post-AFC: policy lessons and new opportunities for regional
economic cooperation................................................................................................ 30
2.6 The role of institutions ................................................................................................. 32
3. Corporate governance, Prudential regulations and Institutional strengthening measures............................................................................................. 35
3.1 The case of Indonesia ................................................................................................. 37
3.1.1 Banking Sector 3.1.2 Corporate Sector 3.1.3 Prudential Regulatory and Supervisory Reforms
3.1.4 Corporate Governance
3.2 The case of Malaysia: Corporate governance ........................................................... 45
3.3 The case of Singapore ................................................................................................ 53 3.3.1 Prudent regulations, the MAS and the Banking sector 3.3.2 Reforms and initiatives
3.4 The case of Thailand .................................................................................................. 60
3.4.1 Financial sector 3.4.2 Bond market 3.4.3 Corporate sector 3.4.4 Other developments 3.4.5 Financial sector reforms 3.4.6 Corporate sector reforms 3.4.7 Corporate governance ROSC

3.5 The case of the Philippines........................................................................................ 77 3.5.1 The Banking Sector 3.5.2 The Corporate Sector
4. Cross-border capital flows in East Asia: an economic analysis .................................. 83
4.1 Geographic distribution of portfolio and other financial investment ........................ 83 4.2 Weak financial linkage within East Asia ................................................................... 84
5. Summary remarks and policy recommendations......................................................... 89
5.1 Recommendation-1
Further Strengthening of Domestic Financial Systems and Prudential Regulatory Frameworks ........................................................................... 91
5.2 Recommendation-2: Building Monitoring Capacity to Assess Volatility of Capital Flows ....................... 91
5.3 Recommendation-3:
International Information Exchange and Information Disclosure to the Public........ 92
5.4 Recommendation-4: More Efficient Mobilization of Domestic Financial Resources ................................ 93
5.5 Recommendation-5:
Establishing Emergency Facility to Prevent Capital Flow Crisis ............................. 93
6. Attachments .................................................................................................................... 95
5.1 Attachment-A: Patterns and determinants of Cross-border financial asset holdings in East Asia....... 95
5.2 Attachment-B:
Institutionalization of regional financial cooperation within Asia ............................ 134
7. List of tables .................................................................................................................. 141 8. References ..................................................................................................................... 143
9. List of authors .............................................................................................................. 153

1
EXECUTIVE SUMMARY
This paper reviews the major financial measures and economic adjustment strategies
adopted by some Asian countries after the Asian Financial Crisis (AFC), analyzes the status of
institutional and regional cooperative efforts of ASEAN+3 economies to better manage cross-border
capital flows against the backdrop of globalized finance, and provides recommendations to enhance
efforts with which capital market elements and regulatory bodies in ASEAN+3 could work, steadily
and in tandem, to maximize country gains from capital flows in particular, and from regional
integration arrangements in general.
The background and analytical perspectives (Part 2) used throughout this paper were
gathered from existing literature and data. These perspectives were applied in the individual and
integrated country analyses in subsequent sections. In Part 3, brief annotations of major
liberalization measures undertaken during the period 1990 – 2004 are discussed and major
institutions involved in capital flow movements are introduced, together with these institutions’
regulatory and supervisory frameworks. It also presents the state of corporate governance and
prudential regulations in selected economies of Asia. Part 4 contains an economic analysis of the
regional characteristics of cross-border financial transactions in East Asia. Part 5 concludes the
paper and enumerates policy recommendations. Finally, in Part 6, one may find the attachments
containing the details of the empirical study on the patterns and determinants of cross-border capital
flows in Asia, and measures of institutionalization of financial integration and cooperation within
the region.
LINKS BETWEEN CAPITAL FLOWS AND EXCHANGE RATES
Financial liberalization was the flagship of the Asian region several years prior to the onset
of the AFC. It promised many things: high growth, accelerated productivity gains, declining
unemployment and removal of distortions caused by government intervention. Internationally
mobile capital, according to its proponents, “facilitates the efficient global allocation of savings by
channeling financial resources to its most productive uses, thereby increasing economic growth and
welfare around the world.” For the past two decades, liberalization paved the way to making
financial capital extraordinarily mobile. The numbers were impressive indeed. From US$590 billion
in 1989, approximately US$1.5 trillion moved across borders everyday by 1998. A favorite

2
destination in the mid-90’s, Asia obtained huge inflows of capital. In 1996 alone, US$123 billion
flowed into the territory. One year later, capital began flowing out in serious, contagious and
alarming proportions. The AFC was born. Financial liberalization’s promises were broken, leaving
the countries worst affected by the crisis deeply marred by huge economic and social losses.
Amidst a plethora of crisis-causing factors, the growing body of AFC literature always
point to the role played by the link between exchange rate and capital flows from at least three
angles. First is the role that exchange rate policies played in the pre-crisis period in encouraging
enormous capital inflows. Second is the trigger (presumably overvalued exchange rates due to the
so-called de facto dollar peg of the countries involved), which set off the crisis in
already-vulnerable economies. The de- facto dollar peg with high interest rates invited short-term
portfolio investments. A subset of this factor is the weak financial sector, which complicated the
currency crisis. Large capital inflows were channeled through undercapitalized, poorly regulated
and badly supervised domestic financial institutions. A weak banking system becomes an indicator
for foreign speculators to attack the local currency. Third is the role exchange rates played once the
crisis unfolded. The erosion in the values of the Asian currencies made it difficult for banks and
businesses to pay back debts. For a number of these entities, defaulting on their loans was the only
way out.
ASIAN FINANCIAL CRISIS AND STRUCTURAL WEAKNESSES
Why did so much capital flow into Asia? The huge flows of financial resources to East
Asia were the product of several factors. These include the pursuit of perceived large profit
opportunities in a low interest rate environment, the diversion of Japanese investment offshore, the
expansion of institutional investors and country funds, the development of regional ratings, and the
easing of local capital controls. Liberalization offered anxious foreign investors the opportunity to
profit from the so-called “miracle” economies of Asia.
With this increasing depth of liberalization, domestic macroeconomic environments
allowed large inflows of short-term, unhedged capital, which fueled a credit boom. Private
corporations became highly leveraged entities with large domestic and external debts. In a newly
liberalized but insufficiently regulated financial markets, the domestic banking sector began to
develop systemic vulnerabilities.

3
The nature of capital flowing into Asia was also a key factor, which fed into the
vulnerability of the countries’ financial sectors. Since most of the capital inflow was neither foreign
direct investment (FDI) nor portfolio investment, but rather short-term capital bank loans, a
speculative investment boom surfaced. Domestic corporations were prompted to borrow funds
directly from international lenders or indirectly from domestic financial institutions that had access
to external financing and to over-invest in industries prone to asset bubbles, particularly the real
estate sector, and in inefficient manufacturing sectors.
The potential of some types of capital flows for being notoriously and highly volatile was
fully played out during the crisis. Bank loans were the most volatile and underwent the most violent
reversal. But aside from capital flow’s potentially reversible nature, institutional quality and
macroeconomic policy may also influence the risk of capital flow volatility occurring.
Lack of prudential risk management on the part of commercial banks; ineffective banking
regulation and supervision; poor accounting, auditing and disclosure practices; and weak corporate
governance --- all these weaknesses reinforced each other and made credit analysis and risk
management largely redundant. This in part explains why large amounts of external corporate
funding were made through debt rather than through equity, which requires closer monitoring of
firms. Pre-existing prudential safeguards were weak and were undermined by the close relationship
between corporations and banks, coupled with their influence on governments. Also, high corporate
leverage was exacerbated by controlling owners’ refusal to disclose relevant information and by the
inadequate legal/court protection afforded to minority shareholders. Given this environment, capital
resources were allocated and utilized below the desirable optimal level.
In the context of financial liberalization and capital flows, this sub-optimal allocation of
resources took the form of imprudent lending behavior by banks and investors alike, on the
assumption that deposits were implicitly guaranteed and that the government would bail out banks.
Banks, fearless due to the inherent expectation that the government will scoop them out of the mud,
went on a lending frenzy to investors who bet their borrowed chips on bubble-prone assets such as
real estate or finance companies owned by individuals close to (or had) relatives sitting on the
throne of power.
Reliance on implicit government approval of large loans (to sectors, if not to firms) was
rampant and bailing out major banks from facing their liabilities was justified because they were

4
“too big to fail.” Moreover, the cross-ownership structure of banks (where banks and other financial
institutions are part of the conglomerate and subservient to it) did not afford them any motivation to
impose effective corporate governance.
The AFC delivered a strong message home: the regional economies of Asia are
‘institutionally ill prepared’ to ride the waves of global financial liberalization without the risk of
drowning. The calls for reforms at the national and regional levels were made imperative. A
common denominator among Asian economies, post-AFC, is the conviction that the benefits of
economic integration and its institutionalization outweigh the costs. In view of this, it has become
essential for institutions (e.g., central banks, finance ministries, banks, stock exchanges, credit
rating firms, etc.) and regulatory frameworks to be reviewed, renewed and strengthened. Only
through these would the financial and capital markets in Asia develop and stand its ground despite
the onslaught of globalized finance, and harness the resource potentials of capital flows despite its
unpredictable and testy nature.
Ultimately, the quality of macroeconomic outcomes Asian economies seek to achieve
depends on the quality and capability of institutions to manage the challenges of internationally
mobile capital and regional financial integration.
WEAK FINANCIAL LINKAGE WITHIN EAST ASIA AND ITS BACKGROUND
Empirical evidence, based on gravity model study, suggests that financial integration is
closely associated with trade integration. This may imply that East Asia can be further financially
integrated as it continues to promote the growth of intra-regional trade. However, the intra-region
trade-to-GDP ratio for East Asia is already very high, even comparable to the intra-region ratio for
Europe. Hence, it is not clear that further regional trade integration can create substantial
cross-border finance. Furthermore, the finding that regional financial integration in East Asia is
much weaker than in other regions, after controlling for the degree of intra-region trade integration,
suggests that there are other structural and institutional impediments to financial integration in this
region and they need be addressed by policies, particularly designed to promote the growth of Asian
financial markets.
There are several institutional and structural characteristics in East Asian financial systems
that constrain regional financial integration. Generally, the underdevelopment of financial markets

5
hinder trade in regional securities between different East Asian countries. In East Asia, where
financial systems have been traditionally bank-oriented, securities markets have been relatively less
developed. The inadequate financial and legal structure, low auditing and accounting standards, low
transparency, and weak corporate governance have curtailed the development of capital markets in
East Asia. This underdevelopment of financial markets and institutions in East Asian economies
must be the primary cause of the lower degree of financial integration in the region. Therefore,
among others, East Asian economies must make efforts to improve their own financial
infrastructures while working together for a harmonization of financial markets within the region in
the areas of rules, regulations, taxes and so on.
In particular, bond markets are underdeveloped in East Asia. In terms of the composition of
domestic financing, East Asia relies less on bond markets than equity or bank loans, and many
Asian domestic bond markets are small relative to those of developed economies such as the US
and Japan. The bond markets in East Asia still lack liquidity and remain largely fragmented.
After the financial crisis of 1997~98, there has been considerable progress in the
development of the regional bond markets. The basic motive is to mobilize the region’s vast pool of
savings for direct use in the region’s long-term investment, thereby reducing the double mismatch
problem and diversifying the means of financing. Most prominent among these developments is the
launch of the Asian Bond Fund (ABF) in June 2003, which attempts to pool the international
reserves of Asian central banks and invest in Asian bonds. The Executives Meeting of East
Asia-Pacific Central Banks (EMEAP) contributed US$1 billion to invest in dollar-denominated,
sovereign and quasi-sovereign bonds issued by Asian entities. The central banks established another
fund, the so-called ABF II, which is intended to invest in local currency-denominated Asian bonds.
However, regardless of the efforts to develop regional bond markets, there are preliminary
tasks that must be fulfilled. The most important pre-requisite is the deregulation and opening of the
domestic financial systems so that more local currency bonds are issued, domestic investors are
allowed to invest in foreign bonds, and foreign borrowers can issue bonds denominated in different
currencies in East Asia’s domestic markets.
It is still true that a number of countries in East Asia remain behind the capital market
liberalization process by relying frequently on capital controls. Restrictions on capital account
transactions and on entering foreign financial institutions are impediments to the process of
integrating financial markets across economies in the region.

6
East Asia also needs further financial and monetary cooperation for exchange rate
stabilization among regional currencies. Higher degrees of exchange rate volatility contribute to a
lower degree of financial integration in East Asia. A number of studies show that higher exchange
rate volatility will lead to fewer transactions in trade in assets, as well as trade in goods.
Another special feature after the financial crisis is that East Asia had accumulated a
substantial amount of dollar reserve assets. East Asia, with a ‘fear of floating’ against the US dollar,
have intervened in the foreign exchange market so as to moderate excessive volatility of exchange
rates and moreover to maintain competitiveness of export sectors. They were also inclined to build
up a capacity to draw on reserves in contingency so that it reduces the vulnerabilities to any future
possible external disturbance. East Asian economies tended to hoard their reserves in low-yielding
US Treasury instruments and other dollar denominated financial assets. This strong tendency to
invest in dollar-denominated safe-assets must have had a negative impact on regional integration.
This post-crisis experience has provoked questions on what is the optimal exchange rate regime for
East Asia. Whether East Asia can emulate the European experience of monetary integration by
taking necessary steps to build requisite institutions and policies that eventually lead to the
formation of a monetary union is an important issue.
CONCLUDING REMARKS AND POLICY RECOMMENDATIONS
The AFC of 1997-1998 has its roots from the extensive volume of foreign capital, which
flowed into the region in such a short period of time. The sudden inflow of money flown into both
the business and banking sectors caused a sudden increase of bank loans and capital flows into the
corporate sector. Because access to the funding market was relatively easy, companies expanded
their investment and business activities without making careful plans.
The virtual fixed exchange rate with the US dollar also accelerated the inflow of capital
from abroad. All the currency exchanges from US dollar to its domestic currency, such as Thai bath,
Malaysian ringgit, Indonesian rupiah, etc., go through the banks’ exchange facility. Therefore, if the
monitoring of banks’ foreign exchange transactions volume can be well established, the policy
authorities can identify sudden changes in the currency exchange market.
There are financial crises caused by sudden inflow of capital and the sudden outflow of
capital. In such cases, the volatility of the volume of the currency exchange becomes very high in a
short period of time. The policy authority should therefore keep an eye on the volume of the

7
currency exchange reported by banks on daily basis. If the signs of increase of volatility of the
currency exchange volume can be seen, policy authorities should check the reasons of the sudden
increase. The Central Bank plays an important role in the currency exchange between its home
currency and overseas currency such as the US dollar; therefore it should slow the process of the
currency exchange. Otherwise too much volatility of the currency exchange will cause various ill
effects on real economic activities.
The following are the policy recommendations drawn from the literature survey, country
case studies and empirical analysis.
First, domestic financial systems and prudential regulatory frameworks need to be
strengthened further. Given that cross-border capital flows should be liberalized to improve
financial market efficiency and ensure high growth, it is imperative to strengthen further the
domestic financial systems and prudential regulations. Major progress has made in the countries (as
indicated in the country studies), but there appears to be some room to catch up with the standards
of developed economies in terms of governing the financial sector and its regulatory frameworks.
Second, there is a need to build the monitoring capacity of key financial and
regulatory institutions in order to immediately and effectively assess the volatility of capital
flows, detect abnormal fluctuations as early as possible, and monitor other nonbank financial
entities which also engage in cross-border financial transactions. Central banks and finance
ministries are to monitor the amounts of capital inflows and outflows on a daily, weekly, monthly,
and annual basis. When the volume of the volatility turns abnormal, it should warn the market
participants and immediately check the causes of the volatility.
Of course there are several factors attributed to the volatility of the flows. One is based on
trade flows of both current and future contract and the second is based on the purpose of financial
activities such as purchasing and selling of stocks and bonds. Procedures to slow down the capital
flows should be introduced by reducing the speed of exchanging the dollar into domestic currency.
Since currency exchange transactions are in principle conducted through foreign exchange banks,
which reports all the data to the Central bank and the Ministry of Finance, the monitoring powers of
these institutions are key to the early detection and effective address of capital flow volatility.
By studying trend and seasonal fluctuations, causes of volatility can be identified and

8
analyzed based on econometric methods. Volatility testing of capital flows and exchange rate
fluctuations should be continuously implemented. Progressive research on capital flow and
exchange rate analyses is crucially important to detect abnormal inflow and outflow of capital, and
will function as an early warning signal of a crisis.
Emphasis must be put on strengthening the monitoring powers of financial institutions that
function as settlement facilities. Tracing the records of international transactions by such financial
institutions would help the authorities thoroughly assess the current situation of capital
inflows/outflows. In addition, in some countries, large amounts of cross-border transactions are
made, taking the forms of remittance, through postal services and other financial institutions other
than commercial banks. The Central Banks should obtain the capacity to monitor international
capital transactions by such institutions.
Third, various forums dealing with the international exchange of cross border
financial information must be supported and disclosure of information to the public should be
encouraged. Frequent dialogue among financial regulators of countries allows similarities and
differences in regulatory systems to surface and encourage the idea of convergence of regulations.
Regional mechanisms of financial cooperation indicated in Appendix-B will be suitable to provide
the opportunity to set up such meetings.
For investors, a portfolio’s after-tax rates of return are important to compare net effective
returns among various markets. Among Asian countries, the tax rates and legal systems are different
such that after-tax rate of returns are much affected by the differences. Income tax rate, capital gains
tax, tax rate on dividends and tax rate of interest income vary among Asian economies. Furthermore,
each country has a different system of reporting capital transactions to the authorities.
If these country comparisons are listed in one booklet or in an internet-accessible site,
investors can immediately see the differences among countries and this makes financial investment
across countries much smoother. If an independent institution made these comparisons, reliability of
the information will be enhanced.
Fourth, there’s a need for more efficient mobilization of domestic financial resources
in order to reduce the bias in investing in one’s home country and instead encourage financial
investment across various countries in the Asian region. Some bias toward home country
investment is seen from records which indicating that domestic financial investment far exceeds

9
overseas financial investment in many Asian countries. Several reasons are behind this; primarily
the currency risk based on fluctuations of the exchange rate, and the lack of information about
another country’s investment potentials.
Reducing home country bias is important to improve financial investment across Asian
countries. Continuous supply of the economic data of these countries will enhance capital flows
among them. Such data include macroeconomic information such as economic growth rate and
interest rates; sectoral data such as data on various producing sectors, i.e., the food industry,
machinery industry, agricultural sector; and microeconomic data such as company data. The
continuous dissemination of changes in the economic environments of various countries in the
region can reduce information asymmetry and help accelerate overseas’ capital flows.
In addition, establishing an insurance system to secure bank deposits would reduce the
financial risks to the depositors. This will then lead to domestic households switching their
investment toward domestic uses.
Lastly, an emergency facility to prevent a capital flow crisis must be established. For
example, when signs of abnormal capital flows are found, policy authorities could slow down the
speed of the currency exchange and in the process, calm down overheated transactions.
Taxes, which can be set to zero rate during ‘normal’ periods of capital flow, may be
gradually increased during ‘abnormal’ periods to slow down the speed of overseas capital
transactions, and dampen its potential to overheat.

10

11
1. INTRODUCTION
‘Unsuspected’ is one of the words often used when retelling and describing the financial
storm which shook Asian economies in 1997 and left a nightmarish economic aftermath in a region
which, just a few years earlier, was the darling of international money and capital resources. The
Asian Financial Crisis (AFC) experience was unprecedented in terms of cost and level of contagion,
and has left many economies in the region badly shaken.
The AFC experience made Asian countries ‘acutely aware of the need to promote regional
financial cooperation to prevent resurgence of a crisis and to attain stable economic growth’.1
Tanikawa [2004] pointed out that East Asian countries are of the consensus that they need to create
a regional cooperation mechanism for monetary and exchange rate policies “that is not dependent
on the United States”. Hence, armed with a renewed sense of regional cooperative spirit, respective
governments and key economic representatives formally agreed to establish “self-help and support
mechanisms in East Asia” at the ASEAN+3 summit held in November 1999.2
Leading among the initiatives under the ASEAN+3 umbrella are the Chiang Mai Initiative
(CMI), Asian Bond Markets Initiative (ABMI) and the Economic Review and Policy Dialogue
(ERPD). Also included is the monitoring of short-term capital flows, whose unchecked imprudent
management and volatility was one of the major culprits of the 1997 AFC.
The World Economic and Social Survey [2005] reports that “private capital flows to
developing countries have been highly volatile and reversible; as a consequence, they have been a
major factor in causing developmentally costly currency and financial crises”. To minimize the
whiplash of capital flow’s volatility, relevant data are now exchanged on a voluntary basis to
facilitate effective dialogue and such have been taking place between and among Japan, Korea, the
Philippines, Thailand, Indonesia and Vietnam.
Efforts to intensify the pursuit the regional economic objectives using the ASEAN+3
initiatives bring to the fore the salient role of institutions in helping steer the regional economic
boats of its member-nations. How much do member-nations stand to gain from this new wave of
Asian regional economic cooperation? The core of this research aims to examine whether and how
existing regional institutional mechanisms and regulatory frameworks assist member-countries in
1 As contained in the Background of the Regional Financial Cooperation Among ASEAN+3. 2 See Tanikawa.

12
efficiently utilizing capital flows and prevent the fertilization of another currency crisis. In
particular, it examines whether and how existing institutional ties among ASEAN+3 countries
influence their capacity to harness opportunities brought by capital flows. Based on the analysis,
policy recommendations are made on the desirable financial institution and regulatory frameworks.
This paper is organized as follows. Part-2 provides the background of the study and some
analytical perspectives used throughout the paper. Much of these perspectives is gathered from
existing literature and data, and is used in the individual and integrated country analyses in
subsequent sections of this paper.
Part-3 is interspersed with brief annotations of major liberalization measures undertaken
selected economies of Asia during the period 1990 – 2004, and introduces major institutions
involved in capital flow movements and these institutions’ regulatory and supervisory frameworks.
It also describes the state of corporate governance and prudential regulations in these economies.
Part-4 introduces an economic analysis on the regional characteristics of cross-border
financial transactions in East Asia. Empirical analysis focuses on the regional financial integration.
Detailed analysis is in ATTACHMENT-A.
Part-5 contains recommendations to enhance the efficiency with which capital market
elements and regulatory bodies in ASEAN+3 countries could stably work in tandem to maximize
country gains from capital flows in particular, and from regional integration arrangements in
general. A brief review of the institutionalization of regional financial efforts concerning capital
flows is in ATACHMENT-B.

13
2. ANALYTICAL ANCHOR AND BACKGROUND OF THE STUDY
Financial liberalization, with its promise of high growth, accelerated productivity gains,
declining unemployment and removal of distortions caused by government intervention was the
flagship the Asian region several years prior to the onset of the AFC. Internationally mobile capital,
according to its proponents, “facilitates the efficient global allocation of savings by channeling
financial resources to its most productive uses, thereby increasing economic growth and welfare
around the world.”3 In other words, developing economies, by opening their current and capital
accounts, would benefit by having capital flows channeled to them from developed and
capital-abundant countries.
For the past two decades, liberalization paved the way to making financial capital
extraordinarily mobile. The numbers were impressive. From US$590 billion in 1989, approximately
US$1.5 trillion moved across borders everyday by 1998. If every dollar invested has a promised
return and an attendant risk, imagine the level and nature of risks involved with the volume of
capital flowing across territories the world over.
Risk, a natural accompaniment of any business undertaking that promises a certain return
over a period of time, becomes compounded in a liberalized environment where capital is allowed
to flow with very minimum friction across borders. The attendant risks and volatility of large capital
flows, when miscalculated and/or poorly managed, could lead to disastrous financial and real
economic effects especially in markets characterized by unsound banking practices, weak financial
infrastructure and frail macroeconomic fundamentals. Such was the AFC scenario when a series of
less-than-optimal decisions drove the local currencies of the worst crisis-affected countries into a
sharp steep dive.
2.1 SOME ANALYTICAL PERSPECTIVES: LINKS BETWEEN CAPITAL FLOWS, EXCHANGE RATES AND VULNERABLE FINANCIAL SYSTEMS
In 1996, UD$123 billion flowed into Asia. One year later, this figure shrunk to US$12
billion. The reversal of short-term portfolio flows was, as Kaminsky [2003] described, ‘even more
brutal, with flows declining from an inflow of US$69 billion in 1996 to and outflow of US$104
billion in 1998’. The massive capital flight occurred in a contagious fashion throughout most of the
Asian region, driving a host of currency values to pit-levels and nearly snuffing out business 3 See De Brouwer, page 76.

14
confidence. The social effects were tremendous. Unemployment rates increased and persisted for
extended periods. Real income and output fell. Poverty increased and a number of banks went
belly-up. The following accounts what the literature says about balance of payment adjustments,
foreign exchange regimes and biting more capital flows than one’s economy could chew.
CAPITAL FLOWS may take the following forms:4
1. Direct Investment (FDI), which according to IMF classification, is a purchase of more than
10 percent of equities in a particular company;
2. Portfolio Investment consists of equities, bonds and other securities investment. It differs
from Direct Investment in that the foreign investor purchases a local firm’s securities
without exercising control over the firm.
3. Other Types of investments (“other capital flows”) include all financial transactions not
covered by direct investment, portfolio investment, financial derivatives or other assets.
These usually consist of trade credits, bank deposits and lending, transaction in currency and
cross-border transfers between bank branches.
Capital flows may either be net capital inflows or net capital outflows.5 Net capital inflows
make it possible for a country to run current account deficits without drawing down on its foreign
reserves. Net capital inflows necessarily imply that more resources are available for an economy to
use for investments, which will result in higher growth and will consequently invite more
investments.
THE EXCHANGE RATE-CAPITAL FLOW LINK. Amidst a plethora of crisis-causing
factors, the growing body of AFC literature always point to the role played by the link between
exchange rate and capital flows from at least three angles:
FIRST is the role that exchange rate policies played in the pre-crisis period in encouraging
enormous capital inflows. In globalized markets, investors move capital from their domestic
markets to markets where returns are higher, such as a host of Asian economies. Exchange rate
movements, which asset owners in global financial markets keep track of, are important because it
determine the relative amount of risk burden on foreign investors’ local currency denominated
assets. Any sudden shift in the nominal currency value becomes an indicator for assessing country
4 Such capital flow definitions were used by Ito [1999] and Alfaro, Kalemli-Oszan and Volosovych [2005]. 5 Ito (1999), page 6.

15
risk and the significance of the Asian market in their roster of portfolio destinations.
SECOND is the trigger (presumably overvalued exchange rates due to the so-called de
facto dollar peg of the countries involved), which set off the crisis in already-vulnerable economies.
The de facto dollar peg with high interest rates invited short-term portfolio investments. Investors
and borrowers mistook the stability of the exchange rate as the non-existence of exchange rate risk.
A subset of this factor is the weak financial sector, which complicated the currency crisis.
Large capital inflows were channeled through undercapitalized, poorly regulated and badly
supervised domestic financial institutions [Das, 2005]. It did not help that many of the banks in the
worst AFC-hit countries were seriously burdened by non-performing loans (NPLs) and had huge
liabilities denominated in US dollars. A weak banking system becomes an indicator for foreign
speculators to attack the local currency. When attacked, the central bank could employ a high
interest rate policy to encourage capital to stay (or come in). But weak banks would make this
policy counterproductive from the domestic banking policy. Knowing this, speculators are more
willing to attack a currency with weak banking system.
THIRD is the role of exchange rates once the crisis unfolded. Between June 1997 and
August 1998, the Indonesian rupiah depreciated by 82.9 percent vis-à-vis the dollar, the Malaysian
ringgit by 40.9 percent, the Philippine peso by 39.3 percent, the Thai baht by 39.7 percent, and the
Korean won by 33.3 percent. The erosion in the values of these Asian currencies made it difficult
for banks and businesses to pay back debts. For a number of these entities, defaulting on their loans
was the only way out.
THE BALANCE OF PAYMENTS AND EXCHANGE RATE REGIMES
The standard monetary approach to the balance of payments (BOP) posits that for any given
BOP deficit, money stock would have to be contracted to restore external balance.6 A reduction in
money supply will raise interest rates and quell spending, reducing income and imports.
• Under a fixed exchange rate regime, a BOP deficit calls for a sale of foreign exchange,
hence the stock of high-powered money is reduced.
• On the other hand, in a surplus country, the central bank buys foreign exchange and thereby
6 A major portion of this segment was taken from Dornbusch and Fischer (1994), Chapter 20.

16
increases the level of high-powered money and expands the money supply.7
Given this link between money supply and external balance, the adjustment process leads to
the right money stock to that external payments will be in balance.
When the size of capital inflows becomes larger than the current account deficits, there is an
appreciation pressure on the currency. For Asian countries, which were on a de facto dollar peg,
resisting pressures to appreciate the currency was accomplished by intervening in the foreign
exchange market. It was important for these countries to maintain the stability of the exchange rate
to nurture exporting industries and further invite FDI inflows.
As intervention continued, however, the levels of foreign reserves among these countries
soared in the 1990s. Intervention can be sterilized or left unsterilized.8 If left unsterilized,
intervention increases the monetary base and lowers interest rates. The stimulating effect of lower
interest rates on investment demand may cause inflation, especially if the economy is already at full
employment, which is often the case for Asian countries that attract massive capital flows [Ito,
1999]. To avoid inflation, intervention can be sterilized. This is done via a combination of foreign
exchange intervention or domestic open market operation to keep the money stock constant (in
levels or in proportion to GDP in a growing economy). Theoretically, sterilized intervention will
keep the interest rate level the same.9
Interception of sterilization operations by the Central Bank offset the impact of foreign
exchange movement on the money supply via open market operations. With sterilization, a deficit
country that is selling foreign exchange and correspondingly reducing its money supply may offset
this reduction by open market purchases of government bonds that restore the money supply to its
previous level. In the sense that sterilization procedures leave an open avenue for financing
government spending through bond flotation, it nurtures an environment conducive to persistent
external deficits because ‘the link between the external imbalance and the equilibriating changes in 7 Ibid:613. 8 STERILIZATION refers to the offsetting of the monetary effects of BOP surpluses or deficits on the domestic money supply of a country. If a country has a surplus on foreign payments under a fixed exchange rate regime, the foreign currency will be exchanged domestic currency thereby adding to the country’s foreign reserves. Both reserves and the domestic money supply will increase. To offset the expansionary effects of these forces, the government directs the central bank to engage in open market operations to offset the increase in the money supply, which is a consequence of the surplus. The reverse will hold for a foreign surplus. Under a flexible exchange rate system, on the other hand, the foreign exchange should adjust, so that balance should always be maintained with no consequences for the domestic money supply [MIT Dictionary of Modern Economics (4th ed.), 1997] 9 But in practice, the interest rate may rise due to the sterilized intervention. For example, suppose the initial capital flows were in the form of FDI. The domestic end of sterilization is most likely done in the short-term money market. Then, the short-term interest rate may increase, while the long-term interest rate will decline. The higher short-term interest rate will invite more capital inflows in the form of portfolio investment. Hence, sterilized intervention may increase capital flows [Ito, 1999].

17
the money stock is broken’ [ibid.].
THE PROBLEM OF INCOMPATIBLE TRINITY
In a capsule, the incompatibility trinity problem refers to impossibility of satisfying and
sustaining the following all at the same time: (1) maintaining a condition of perfect capital mobility,
(2) maintaining a fixed exchange rate and (3) having monetary independence (i.e., the central bank’
ability to set domestic interest rates different from world interest rates).
Consider, for example, a situation where there is unrestricted capital flows, and perfect
substitutability between domestic and financial assets [Krugman, 1999]. How effective is monetary
policy in influencing the level of income? It depends on the exchange rate regime.
• In a fixed exchange rate, an expansionary monetary policy raises output and decreases
interest rate, albeit temporarily. The reduction in interest rates will lead to capital outflow, a
reduction in foreign exchange reserves and consequently a reduction in money supply.
Equilibrium is restored when the economy goes back to its original position. Hence,
monetary policy is ineffective in influencing output given our initial assumption.
• On the other hand, fiscal policy is effective in raising income under the assumptions of fixed
exchange rate and perfect capital mobility. Expansionary fiscal policy will induce an
increase in interest rates, which will lead to capital inflow and ‘a consequent increase in
money supply that accommodates the increased money demand arising from increased
income’ [ibid.].
• Under a flexible exchange rate and perfect capital mobility, expansionary monetary policy
will reduce interest rate, increase income and lead to a currency depreciation. Reduced
interest rates encourage local investments and a depreciated currency encourages exports,
both supportive of the increased output.
It is impossible for a small open economy to have free capital flow, a fixed exchange rate
and independent monetary policy. The theoretical cure to this impossibility problem is to float the
exchange rate or to adopt some forms of capital controls, ala Chile and post-AFC Malaysia.10
THE CRUNCH AND THE CRASH
10 Examples of capital controls on short-term flows include raising the reserve requirement on banks by nonresidents, or imposing withholding taxes on short-term instruments held by nonresidents [Ito, ibid.].
18
Had most of the capital flows into Asia been in the form of foreign direct investment (FDI),
the AFC would not have occurred with such severity. FDI flows are generally found to be less
volatile than portfolio flows as they tend to be driven by long-term considerations [Das, 2005]. But
a reversal of “flows” occurred in a number of Asian countries, primarily because a significant
portion of the type of capital flows which went into these countries were the reversible type -
portfolio and “other types” of capital flows such as bank lending and cross-border transfers – flows
that can move out of a market just as quickly as it could move in.
Since Asian countries are connected to each other via trade and investment flows,
economic growth in one country creates a growth multiplier, which positively influences other
countries within the region. This multiplier was reinforced by two factors.
One is the long-term trend of yen appreciation, which made Asian products more
price-competitive against Japanese goods in world markets and was a cause of the shift of
Japanese production plants to low-wage high-quality worker countries in Asia.
Second is the apparent ‘stability’ of Asian currencies, which were virtually pegged to the
US dollar. This gave investors the impression of low currency risk as well as low credit
risk.
High economic growth fueled more capital inflows and, given the backdrop of the two
factors just mentioned, led to higher exports and higher growth. This cycle persisted in Asia in the
90’s but became unsustainable. The yen depreciation from 1995-1997 dampened the price
competitiveness of Asian goods, leading to their large current account deficits. A currency crisis
ensued as most Asian countries’ currencies depreciated. Capital flight occurred. Stewing in its own
pot of vulnerabilities, the banking systems of the AFC-affected countries succumbed to a currency
crisis, which led to a banking crisis, which fed further into the currency crisis, which exploded into
an economic crisis.

19
2.2 IN A CAPSULE: AN EXPRESS AFC POST-MORTEM
CAPITAL FLOW DETERMINANTS. Why did so much capital flow into Asia? Capital flows to
East Asia were the product of several factors.
ENVIRONMENT FOR PROFIT AND OPPORTUNITY. These include the pursuit of
perceived large profit opportunities in a low interest rate environment, the diversion of Japanese
investment offshore, the expansion of institutional investors and country funds, the development of
regional ratings, and the easing of local capital controls [Grenville and Gruen, 1999]. Liberalization
offered anxious foreign investors the opportunity to profit from the so-called “miracle” economies
of Asia. Measured either in current or constant US dollars, net private capital inflows to Asia in the
mid-1990s were unprecedented in terms of the size of the flow. To note, the flows were large
relative to the size of the recipient crisis-affected economies of Indonesia, Korea, Malaysia, the
Philippines and Thailand. In 1996 alone, the net inflow of private foreign capital into the five
countries most affected by the crisis, amounted to US$93 billion [Crotty, 2000].
THE CREDIT CRAZE. With this increasing depth of liberalization, domestic
macroeconomic environments allowed large inflows of short-term, unhedged capital, which gave
birth to a credit boom. Private corporations became highly leveraged entities with large domestic
and external debt. In a newly liberalized but insufficiently regulated financial markets, the domestic
banking sector began to develop systemic vulnerabilities.
In the credit sector, the flows of funds were largely driven by developments on the supply
side. There was the growth of the mutual funds industry, the increasing vigorous competition among
financial institutions to encourage and facilitate flows and the interest rate/exchange rate changes in
the capital-supplying countries. On the demand side, three factors highlighted the crisis-affected
countries’ incentives for borrowing abroad. First, de-facto fixed exchange rate arrangements
coupled with high domestic interest rates encouraged foreign borrowing by domestic firms or by
domestic banks and other financial institutions for domestic relending. Second, excessive risk
taking, which was passed on to the rest of the domestic economy, was motivated by explicit or
implicit government guarantees of financial institutions’ liabilities. Third, there was the need to
borrow abroad since domestic financing costs were high.
A massive credit expansion fueled a wave of investments, some of which took the form of
‘actual construction…but there was also a lot of pure speculation, mainly in real estate, but also in

20
stocks’ [Intal and LLanto, 1998]. The Bangkok International Banking Facility (BIBF), a Thai
offshore lending institution, attracted over US$50 billion in just three years since it was launched in
the early 1990’s [Bello, 1997.]. In the Philippines, nearly US$9.4 billion in foreign investment was
injected into the economy in 1996 alone. Estimates indicate that nearly three-fourths of it was
‘portfolio investment seeking quick and high returns in the stock or the bond market’ [ibid.].
INFLOWS BY SHORT TERM BANK LOANS. Since most of the capital inflow was
neither FDI nor portfolio investment, but rather short-term capital bank loans, a speculative
investment boom surfaced. Domestic corporations were prompted to borrow funds directly from
international lenders or indirectly from domestic financial institutions that had access to external
financing, and to over-invest in industries prone to asset bubbles, particularly the real estate sector,
and in inefficient manufacturing sectors. Between 1986-1990 and 1991-1995, investment as a
percentage of GDP rose from less than 32% to almost 38% in South Korea, from 23% to 39% in
Malaysia, and from 33% to over 41% in Thailand.11 In the Philippines, a special survey of 25
sample commercial banks in 1996 revealed “the combined loans and equity exposure of these banks
to the real estate sector amounted to 52% of the unimpaired capital of the sample banks.”12
The capital inflows also fed into a system of corporate finance that relied primarily on bank
financing and where domestic bond markets were severely underdeveloped. Corporate
debt-to-equity ratios had climbed despite the fact that productivity in the manufacturing sector in
many East Asian countries had already started to decline in the pre-crisis period. In South Korea for
example, the debt-to-equity ratio of Korean corporations exceeded 317 percent by the end of 1996,
twice that of the United States and four times that of Taiwan. The top thirty Korean chaebols had
even higher leverage, exceeding 400 percent in 1996 [Claessens et al, 1998].
One argument proposes that an overvalued exchange rate coupled with high interest rates
could be one catalyst for crises of the AFC type. Presupposing that, the abandonment of the
semi-fixed exchange rate trigger markets to focus more on fundamental vulnerabilities.13 When
semi-fixed exchange rates are left free to float, macroeconomic/structural policies come under
question, vulnerabilities suddenly become pressing and market confidence wanes. Market
expectations then determine the exchange rate according to how the market perceives the crisis will
evolve. For example, Indonesia (which relied heavily on intervention bands) allowed the band to 11 UNCTAD Report, 1998. 12 Intal, P. and G. Llanto (1998) citing a BSP report in 1996. 13 Grenville, S. and D. Gruen (1999).

21
widen 12% on July 11, 1997, the same day the Philippine peso was floated. The market reaction to
this move was in contrast to its past pattern. This time, the rupiah depreciated rapidly. Despite
interventions from Bank Indonesia, the pressure on the rupiah did not let up and on August 14, 1997,
the rupiah was floated [Djiwandono, 1998].
Patterns of indebtedness varied across countries. The net foreign liabilities of financial
institutions rose from 6 percent of domestic deposit liabilities in 1990 to one-third by 1996. In
Indonesia, corporations were the primary borrowers from mostly offshore foreign sources. In South
Korea, corporations borrowed heavily from domestic sources, while Korean banks increased their
exposure by relying on foreign borrowing. In Thailand, finance companies and commercial banks –
availing themselves of foreign-currency-denominated loans at low interest rates – borrowed heavily
from abroad to invest in projects with low rates of return, such as construction and real estate.
Countries with relatively low external debt (in particular short-term debt relative to foreign
exchange reserves), such as Malaysia and the Philippines, were not affected significantly, at least in
the initial phase of the AFC.14
RISK OF REVERSE FLOWS. That capital flows have the potential for being notoriously
and highly volatile is a fact. During the crisis, bank loans were the most volatile and underwent the
most violent reversal.15 Total capital inflows peaked at an amount equivalent to over 6 percent of
the combined national income of the five crisis-affected countries, while outflows in 1998
amounted to more than 7 percent of combined GDP. This is consistent with the abrupt change from
current account deficit to surplus, although it is worth noting that since East Asian central banks
were acquiring reserves in the first half of the 1990s, capital flows were substantially larger than
these countries’ current account deficits. 16 Aside from their potentially reversible nature,
institutional quality and macroeconomic policy may also influence the risk of capital flow volatility
occurring [Das, 2005].
The widening of the risk premium on emerging market securities and subsequent credit
ratings downgrade reflected the violence of the reversal in capital flows.17 Banks’ unconsolidated
assets in the affected countries rose by about US$60 billion in 1996 to June 1997, but fell by almost
US$110 billion in the next year and a half in December 1998. Indonesia, Korea and Thailand
14 See ADB Key Indicators (2005). 15 See De Brouwer. 16 See Pacific Economic Papers 317, July 2001. 17 Ibid.

22
experienced the most striking fall in bank lending (i.e. loan repayment).18
Assets in Thailand were the first to contract, spreading to Indonesia and Korea in the last
quarter of 1997. Banks’ assets in Korea contracted significantly in March 1998, reflecting in part
the reversal of repurchase agreements and despite the loan rollover agreement in late December
1997. Repayment of loans continued throughout 1998, except in China, the Philippines, and Taiwan.
To a lesser extent, net debt issues also declined.
What was even more boggling was that even though inter-bank lending accounted for only
45 percent of total bank lending during the peak of the inflow in mid-1997, it accounted for 75
percent of the fall in bank lending during the crisis. The concentration of outflows in the inter-bank
market reflected the market’s shallow liquidity and short maturity profile. Furthermore, before the
crisis, short-term (less than one year) debt generally exceeded long-term debt in East Asia, notably
in Korea where over 70 percent of bank claims in June 1996 were due in one year.
No financial system in the world, no matter how modern or well regulated, could have
withstood such drastic capital flow volatility without experiencing economic trauma. Foreign banks
pulled US$36 billion out of the area in 1997. For some of the loans meant to finance long-term
investments, repayment of principal out of profits became impossible, while forced sale of assets
purchased with the loans only worsened the collapse in their prices.
ECONOMIC CONTRACTION. The irresponsible deregulation of domestic financial
markets and the weakening of controls over international capital flows across Asia brought the
fastest growing area on earth to its knees. Within months, the financial crisis evolved into a
full-blown crisis of systemic proportions. Growth in the most severely hit economies contracted
soon after the onset of the crisis, and all registered negative GDP growth rates in 1998. The violent
shift from high growth to stagnation in Asia lowered global growth to about 2 percent a year in
1998 and 1999.19
The major reason these East Asian economies underwent such a rapid economic
contraction is that financial and corporate sectors were virtually paralyzed by the steep exchange
rate depreciation, the subsequent interest rate hikes, and by shrinking domestic demand. In an
attempt to prevent further depreciation, all governments in the crises-affected countries raised 18 Ibid. 19 Pacific Economic Papers. 2001. Bank and Corporate Restructuring in Crisis-affected East Asia: From Systemic Collapse to Reconstruction. 317:July.

23
domestic interest rates. The combination of steep currency depreciations and rise in interest rates
adversely affected the balance sheets of domestic firms. The cost to corporations of servicing
domestic debt, mainly in the form of loans from commercial banks and non-bank financial
institutions, suddenly inflated due to depreciation and high domestic interest rates. Furthermore,
steep currency depreciation and austere macroeconomic policy prompted the contraction of
aggregate demand, resulting to worsening position of corporate cash flows and profits.
Corporate difficulties fed into the deterioration of the banking sector. The increasing
number of non-performing loans further aggravated the already deteriorating portfolios of
commercial banks. Thus, instead of extending new loans to the corporate sector, assets of financial
institutions were towards safer government bonds and central bank certificates. The lack of bank
credit further aggravated the corporate sector’s difficulties. Banking sector distress, corporate sector
difficulties and macroeconomic deterioration mutually reinforced the rapid economic contraction. A
huge balloon of nonperforming loans (NPLs) originating from corporate loans resulted in a
“destruction of savings on a scale more usually associated with a full scale war” [Ziegler (2003) as
cited in Das, 2005].
Another reason for the unexpectedly rapid contraction of the crisis-affected economies is
the large multiplier effects from falling demand. Because of the degree of regional economic
integration through trade and investment, one country’s economic contraction and import decline
meant another’s export decline, spreading negative shocks across the region. Regional economic
linkages reinforced mutual contraction and magnified the severity and depth of the economic crisis
in these countries beyond expectations.
Particularly in Indonesia, the most critical factor in the collapse of the corporate and
banking sector and the resulting contraction in aggregate demand was the corporate sector’s large
external debt. It is estimated that 70-80 percent of the firms in Indonesia suffered losses that
exceeded their equity. The abrupt cut-off in new financing inflated debt-to-equity ratios, leaving
many corporations whipped by a cash crunch. This resulting insolvency of corporations led to the
inability of Indonesian banks to collect interest on loans to their corporate borrowers. In addition,
some quality banks in Indonesia suffered from the steep depreciation of the rupiah because of large
foreign currency deposit liabilities to local residents.

24
2.3 STRUCTURAL WEAKNESSES AND OTHER SUBPLOTS
Aside from the economic factors, fundamental structural weaknesses also played a crucial
role in determining the depth and scope of the crisis.
WEAK PRUDENTIAL REGULATIONS. Lack of prudential risk management on the part
of commercial banks; ineffective banking regulation and supervision; poor accounting, auditing and
disclosure practices; and weak corporate governance --- all these weaknesses reinforced each other
and made credit analysis and risk management largely redundant. This, in part, explains why large
amounts of external corporate funding were made through debt rather than through equity (which
requires closer monitoring of firms). Pre-existing prudential safeguards were weak and were
undermined by the close relationship between corporations and banks, coupled with their influence
on governments. Also, high corporate leverage was exacerbated by controlling owners’ refusal to
disclose relevant information and by the inadequate legal/court protection afforded to minority
shareholders.
MORAL HAZARD. A term widely used in the insurance field, moral hazard technically
refers to “the effect of certain types of insurance systems in causing a divergence between the
private marginal cost of some action and the marginal social cost of that action thus resulting in an
allocation of resources which is not optimal”.20 In the context of financial liberalization and capital
flows, this sub-optimal allocation of resources took the form of imprudent lending behavior of
banks and investors alike, on the assumption that deposits were implicitly guaranteed and that the
government would bail out banks. Banks, fearless due to the inherent expectation that the
government will scoop them out of the mud, went on a lending frenzy to investors who bet their
borrowed chips on bubble-prone assets such as real estate or finance companies owned by
individuals close to or had relatives sitting on the thrones of power.
Reliance on implicit government approval of large loans (to sectors, if not to firms) was
rampant and bailing out major banks from facing their liabilities was justified because they were
“too big to fail.” Moreover, the cross-ownership structure of banks (where banks and other financial
institutions are part of the conglomerate and subservient to it) did not afford them any motivation to
impose effective corporate governance. In Korea for example, chaebols (conglomerates) were
prohibited by legislation from having a controlling ownership in banks, but the largest Korean
20 As defined in the MIT Dictionary of Economics (4th ed.), 1997.

25
chaebols have instead influenced bank lending through the government and have obtained much of
their credit through their control of non-bank financial institutions.
While it is true that there was a moral hazard problem in the crisis-affected economies, it
was not enough to solely account for the large volume and dramatic reversal of flows in 1997 –
1998. Nor could it solely be blamed for the differences in the severity of the impact faced by the
five badly affected countries. For example, the AFC lashed out at Indonesia and Korea more than it
did Malaysia and the Philippines. Besides, if explicit and implicit guarantees did hold, investors
would not have fled and capital flight shouldn’t have occurred. But investors did flee, and capital
flight did happen. In order to avoid the moral hazard problem, the strengthening of prudential
regulations on the part of borrowers and burden-sharing on the part of lenders is strongly
suggested.21
CONTAGION OF FINANCIAL CRISES. Bank runs exacerbated the crisis picture but it
did not cause it. Banks were caught in a liquidity crisis because investors shifted away from their
regular behavior of allowing lending to be rolled over. In Korea and Thailand, for example, banks
did not have enough dollars to repay their short-term obligations when rollovers were refused. They
were not necessarily insolvent but they did have a major liquidity crunch. If bank runs were solely
responsible for the crisis, a solution worth exploring would be “to make the IMF the international
lender of last resort”22.
Contagion or the transmission of effects to economies linked through trade and finance
channels is usually associated with herd behavior, a model which explains that investors behave in a
herd because it profits them to behave as others do.23 Contagion’s effects tend to be more
pronounced regionally than globally. Measuring for the temporal variations of contagion-causing
factors using an autoregressive conditional hazard model (ACH), Zhang [2001] confirmed the role
that contagion played in the AFC. Particularly in Indonesia, Korea and Thailand, regional duration
dynamics played a domineering role [Das, 2005].
EARLY WARNING SIGNALS. Early warning signals (EWS) take a host of factors as
presumptive indicators of a market’s vulnerability to a financial crisis. Frankel and Rose [1996],
21 Ito, 1999. 22 This was suggested in Ito’s (1999) paper. 23 This was developed by Scharfstein and Stein [1990] and Banerjee [1992], as noted by Ito [1999].

26
Eichengreen and Rose [1996], Goldstein [1996], and Kaminsky, Lizondo and Reinhart [1997] were
among the early contributors to EWS literature.24
Approaches to constructing EWS models most often take the form of the signaling
approach [Kaminsky, Lizondo and Reinhart, 1998] or use of probit/logit [for example Berg and
Patillo, 1999], depending on which hypothesis about the cause of the AFC they wish to test. One
hypothesis attributes it to sudden changes in investor and market expectation eventually leading to a
contagion. The other hypothesis blames it on structural and policy distortions. The signaling
approach monitors a set of high frequency leading indicators that tend to behave differently. These
are then examined whether they have individually or collectively reached a threshold of values
usually associated with the onset of a financial crisis. Probit/logit models, on the other hand, make
use of a large sample to test for statistical significance of the explanatory variables. The EWS model
by Zhuang and Dowling [2002] discriminates between the two hypotheses mentioned above and
their results suggest that weaknesses in economic and financial fundamentals indeed played an
important role in giving birth to AFC.
Goldstein relied on seven factors to function as indicators of crisis vulnerability and these
include (1) a mismatch between short term liabilities and liquid assets; (2) large current account
deficits; (3) rising interest rates; (4) weak banking system and large fiscal deficits; (5) boom in bank
lending followed by a fall in asset prices; (6) an overvalued exchange rate; and (7) high
susceptibility of contagion due to a similar crisis elsewhere [Ito, ibid]. On the other hand, Zhuang
and Dowling [2002] used 6 sets of indicators as outlined in the TABLE-1.
24 As cited by Ito (1999).

27
2.4 RECOVERY EFFORTS AND STRATEGIES
Economic recovery came as a result of increased confidence brought by the initial
economic adjustment and counter-cyclical macroeconomic policy and by the various measures of
structural reforms, particularly, financial and corporate restructuring. In addition, strong growth in
the US and Europe strengthened external demand in East Asia, thus supporting a mutually
reinforcing recovery because of the deepening trade linkages with the region. The export expansion
and the favorable current account balance, together with a threefold increase in portfolio and
foreign direct investment inflows, were sufficient to offset continuing outflows of capital from the
banking sector.25
The worst period of output contraction ended during the first or second quarter of 1999 for
the economies hit by the crisis. The crisis-affected countries grew by 5 percent in 1999 and 6
percent in 2000. The pace of recovery, however, has been uneven. The most dramatic improvement
in output (and exports and employment) was recorded by Korea, which registered economic growth
of 11 percent in 1999 and 9 percent in 2000. Indonesia, despite its political turmoil, has shown signs
of an incipient economic rebound at 0.8 percent in 1999 and a modest 4.8 percent in 2000.
Roadmaps for financial and corporate reformation were created and resulted in some
progress, despite substantial fiscal costs.26 There are similarities in the basic frameworks, although
actual implementation of restructuring varied to reflect the differences in initial conditions, the
structure of the corporate system and the institutional capacities of central banks and other relevant
institutions.
RESTRUCTURING STRATEGIES AND IMPACT
Strategies to address the systemic crisis in the financial sector include27: (1) closing,
merging, or temporarily nationalizing non-viable and insolvent financial institutions; (2)
recapitalization of undercapitalized institutions; (3) governments injecting liquidity (from public
funds) into the banking sector to prevent bank runs; (4) governments subsequently guaranteeing all
deposits and other financial liabilities; (5) transferring the bad loans of weak (but viable) financial
institutions to public (and, more recently in Thailand, private) asset-management corporations; (6)
25 See ADB ARIC. 26 See Table 2 of Pacific Economic Papers, page 9. 27 See Das [2005] and Lindgren, et al [1999].

28
strengthening of prudential regulations and supervisory norms while simultaneously supervising
weak institutions; and (7) increase the potential for foreign participation in domestic financial
systems.
As a result of these strategies, market confidence was restored. Banking sectors have
been opened to foreign strategic investors and technical expertise to further promote competition, to
gain new capital, and improve corporate governance and management. Capital adequacy has been
restored (to levels that are on average above the minimum standard of the Bank of International
Settlements) by the resolution of NPLs and injection of capital (in all countries, except Indonesia).
With the exception of the Philippines, non-performing loans in East Asian countries have declined
over the past years.28 All in all, the underlying weakness in loan portfolios, the pace and
sustainability of economic recovery and the profitability of banks will determine the amount of
capital needed for financial sector restructuring.
The governments have become an important holder of corporate assets through the
acquisition of banks and bank assets.29 In Indonesia, the government holds 70 percent of banking
assets, while the governments of Korea, Thailand and Malaysia own 60 percent, 30 percent and 20
percent of banking assets, respectively.
Financing government intervention in post-crisis reforms with bond issues and implicit
guarantees to the financial system may increase the burden on governments if more banks need to
be re-capitalized. In Korea, Malaysia, and Thailand, public funds were injected into
undercapitalized banks and some non-performing loans were transferred to centralized, publicly
owned asset-management corporations.
Thailand however, tied the provision of public funds to more stringent conditions on bank
owners and initially did not create one centralized institution to dispose of the non-performing loans
of private banks, leaving the banks to create majority-owned asset-management corporations
themselves. However, it did establish centralized agencies to resolve the bad assets of finance
companies – the Financial Sector Restructuring Authority (FRA) as an asset disposal agency and
the Asset Management Corporation (AMC) as the bidder of last resort.
28 However, the capital base of individual banks may be eroded over time due to low and even negative profitability in addition to weak portfolios that need to be covered by loan loss provisions. 29 See Table 6, Pacific Economic Papers, page 30.

29
In addition to the costs of financial sector restructuring, increase in government spending is
manifested through currency depreciations, increase in the interest burden (in local currency) on
foreign debt, and expansionary fiscal spending (and decline in tax revenues) as governments tried to
stimulate economies out of recession.
Large public sector debt has built up. Government debt has already risen to 30-50 percent
of GDP in Korea, Malaysia and Thailand, and to 90-100 percent of GDP in Indonesia and the
Philippines.30 These figures may not reflect the governments’ underlying debt obligations because
they do not include contingent liabilities, such as further re-capitalization costs and the debts of
public infrastructure corporations and other state-owned enterprises.
The cross-ownership structure in the banking and corporate sectors, aside from distorting
credit allocation in favor of affiliated firms, hindered the process of restructuring. The end result is
that non-affiliated firms and small-medium enterprises (SMEs) have found it difficult to obtain
finance, particularly since the crisis. The process of crisis-resolution provided East Asian countries
with an opportunity to further dilute cross-ownership structures. In Korea and Thailand, temporarily
nationalized banks have been re-privatized.
30 See ADB Key Indicators (2005).
30
2.5 POST-AFC: POLICY LESSONS AND NEW OPPORTUNITIES FOR REGIONAL ECONOMIC COOPERATION
A United Nations report stated that financial deregulation and capital account liberalization
appear to be the best predictors of crisis in developing countries.31 Stiglitz [1998] notes that ‘the
AFC would have not occurred were it not for the liberalization of capital accounts’. Three major
sentiments on the bottom-line impact of financial liberalization are worth pondering.
First, excessive financial market liberalization has created serious speculative boom-bust
cycles damaging to economic growth. The financial collapse that originated in Thailand in 1997,
spread to most nations in the Pacific region, and moved on to ensnare Russia and Brazil, is but one
example of the dangers of today’s liberalized capital markets.
Second, the degree of free mobility of cross border capital in recent decades and the
subsequent leap in the magnitude and speed of capital movements across national boundaries, have
caused governments around the world to shy away from expansionary budget and interest rate
policies because they displease global investors. Governments that reduce interest rates or used
budget deficits to stimulate growth and lower unemployment are often punished by capital flight,
which raises interest rates and can trigger exchange rate crises. The experiences of Thailand and
Indonesia make good examples.
Third, the ongoing liberalization movement has substantially reduced the economic power
of developing countries governments. As Das [2005] puts it, the AFC demonstrated that even small
policy mis-steps and hasty reactions by governments, the international community and market
participants could turn into a financial panic and deep crisis.
According to some literature, one of the lessons of the AFC is that in the face of globalized
finance and open capital accounts, it may be necessary for countries that adopt a floating exchange
rate regime to really allow the exchange rate to float [ibid.] Maintaining a peg in the face of
imprudent fiscal and monetary policies while maintaining an open international capital account may
be a recipe for an eventual currency crisis within a short span of time.32
Minimum levels of institutional and regulatory capacity are crucial in order to safeguard the 31 UNCTAD Trade and Development Report 1998, page 55. 32 See Intal, Pontines and Mojica.

31
economic stability of countries undertaking financial liberalization. An appropriate policy
framework that reinforces sustainable absorption of capital flows and rapid economic expansion
will only be operative if implemented against the backdrop of sound and pragmatic fiscal, monetary
and financial market policies. Prudential regulations, well-crafted supervision procedures and good
corporate governance are fundamental in acquiring a sustainable financial policy framework.
The AFC aftermath brought with it the rationale and opportunity for renewed economic
cooperation among Asian countries. According to Kawai [2004], the AFC prompted regional
economies to realize the importance of closer economic cooperation among themselves, which were
increasingly interdependent, and to undertake various initiatives for the institutionalization of such
interdependence. A summary of nine major AFC policy lessons and recommended measures for
crises prevention, management and resolution in the context of strengthened regional economic
links of cooperation and integration is presented in TABLE-2.

32
2.6 THE ROLE OF INSTITUTIONS
The AFC delivered a strong message home: the regional economies of Asia are
‘institutionally ill prepared’ to ride the waves of global financial liberalization without the risk of
drowning. Calls for reforms at the national and regional level were made imperative [Das 2005]. No
matter how different economic and social systems among the countries in the region are, they are
unanimous in the belief that the economic logic for strengthening regional frameworks for trade and
investment integration is overriding.
A common denominator among Asian economies, post-AFC, is the conviction that the
benefits of economic integration and its institutionalization outweigh the costs [Kawai, 2004]. Such
sentiment is shared among Asian governments and key institutional players, and has served as
foundation for the strengthening of financial infrastructures and institutions across Asia.
In view of this, it has become imperative for institutions and regulatory frameworks to be
reviewed, renewed and strengthened. Only through these measures would the financial and capital
markets in Asia develop and stand its ground despite the onslaught of globalized finance, and
harness the resource potentials of capital flows despite its unpredictability and testy nature.
Ultimately, the quality of macroeconomic outcomes Asian economies seek to achieve depends on
the quality and capability of institutions (e.g., central banks, finance ministries, banks, stock
exchanges, credit rating firms, etc.) to manage the challenges of internationally mobile capital and
regional financial integration.

33
TABLE-1. LIST OF LEADING INDICATORS USED IN THE ZHUANG AND DOWLING EWS MODEL
LEADING INDICATOR RATIONALE CURRENT ACCOUNT (Real exchange rate; exports; imports; trade balance as a ratio of GDP; current account balance as a ratio of gross domestic investment.)
Weak exports, excessive import growth, and currency overvaluation could lead to deterioration of the current account, and historically have been associated with currency crises in many countries. External weaknesses and currency overvaluation could also lead to the vulnerability of the banking sector since a loss of competitiveness and the external market might lead to a recession, business failures, and a decline in the quality of loans. Banking crises could also lead to currency crises.
CAPITAL ACCOUNT (Foreign reserves; M2/foreign reserves; short term debt/foreign reserves; foreign liabilities/foreign assets; deposits in BIS banks/foreign reserves.)
With increasing globalization and financial integration, capital account problems could make a country highly vulnerable to shocks. Manifestations of capital account problems could include declining foreign reserves, excessive short-term foreign debt, debt maturity and currency mismatches, and capital flight.
FINANCIAL SECTOR (M2 multiplier; domestic credit/GDP; excess real M1 balances; Central bank credit to the public sector/GDP; domestic real interest rate; lending-deposit rate spread; real commercial bank deposits)
Currency and banking crises have been linked to rapid growth in credit fueled by excessive monetary expansion in many countries, while contractions in bank deposits, high domestic real interest rates, and large lending-deposit rate spreads often reflect distress and problems in the banking sector.
REAL SECTOR (Industrial production; stock prices)
Recessions and a bust in asset price bubbles often precede banking and currency crises.
GLOBAL ECONOMY (US real interest rate; US GDP growth; world oil prices; dollar-yen real exchange rate)
Foreign recessions could spill over to domestic economies. And lead to domestic recessions. High oil world prices pose a danger to the current account position, and could also lead to domestic recessions. High world interest rates often induce capital outflows. For many East Asian countries, the depreciation of the yen against the dollar could put other regional currencies under pressure.
FISCAL SECTOR (Fiscal balance/GDP; Government consumption/GDP)
Large fiscal deficits could lead to a worsening in the current account position, which could in turn put pressure on the exchange rate.
Source: Juzhong Zhuang and J. Malcolm Dowling, 2002. ERD Working Paper No.26 entitled “Causes of the 1997 Asian Financial Crisis: What can an Early Warning System Model Tell Us?.

34
TABLE-2. SUMMARY OF POLICY LESSONS FROM THE AFC and RECOMMENDED MEASURES
National Measures Global Measures Regional Measures OBJECTIVE
Improve mechanisms for crisis prevention, management and resolution at the national level.
Improve mechanisms for crisis prevention, management and resolution at the global level.
Improve mechanisms for crisis prevention, management and resolution at the regional level.
AVOID LARGE CURRENT ACCOUNT DEFICITS FINANCED THROUGH SHORT-TERM UNHEDGED CAPITAL INFLOWS. *Secure adequate foreign exchange reserves. *Maintain sound fiscal and monetary policy. *Adopt a viable exchange rate regime. *Establish orderly capital account liberalization.
*Improve transparency and disclosure by IFIs. *Strengthen IMF surveillance and policy advice. *Remove regulatory biases to short-term and excessive international lending.
*Strengthen regional policy dialogue and surveillance. *Maintain intra-regional exchange rate stability. *Develop a regional early warning system. *Reduce “double mismatch”.
AGGRESSIVELY REGULATE AND SUPERVISE FINANCIAL SYSTEMS TO ENSURE THAT FINANCIAL INSTITUTIONS MANAGE RISKS PRUDENTLY. *Strengthen regulatory and supervisory frameworks over financial institutions. *Allow prudential regulation as financial safeguards and cushions. *Improve information transparency. *Introduce limited deposit insurance.
*Tighten regulations over financial institutions that lend to highly leveraged institutions. *Support implementation of international standards and codes.
*Establish regional initiatives to improve regulatory and supervisory frameworks.
ERECT AN INCENTIVE STRUCTURE FOR SOUND CORPORATE FINANCE TO AVOID HIGH LEVERAGE AND EXCESSIVE RELIANCE ON FOREIGN BORROWING.
PREVENTING
OR REDUCING
THE RISK OF
CRISES
*Establish good corporate governance. *Introduce greater competition to produce, factor and financial markets. Develop capital market-based finance. *Better information disclosure.
*Identify best practice corporate governance and its implementation tailored to specific country conditions
*Develop regional capital markets for mobilization of regional savings. *Undertake regional initiatives for better corporate governance.
MOBILIZE TIMELY EXTERNAL LIQUIDITY OF SUFFICIENT MAGNITUDE. *Restore market confidence through coherent policy packages. *Reduce moral hazard problems.
*Strengthen IMF liquidity support, including CCL
*Establish a regional liquidity support facility to contain crises and contagion.
ADOPT APPROPRIATE MACRO AND STRUCTURAL POLICIES TO REFLECT THE SPECIFIC CONDITIONS AND RALITY OF THE ECONOMY. *Adopt appropriate monetary and fiscal policy contingent on the specific conditions of the economy.
*Streamline IMF conditionality on macroeconomic and structural policies
*Strengthen regional capacity to formulate needed adjustment policies.
BAIL-IN PRIVATE INTERNATIONAL INVESTORS.
MANAGING
CRISES
*Impose official stand-stills. *In extreme cases, allow involuntary private sector involvement (PSI)
*Establish international rules of the game through private sector involvement (PSI)
*Involve regional creditors from outside the region.
MOVE SWIFTLY TO ESTABLISH RESOLUTION MECHANISMS FOR IMPAIRED ASSETS AND LIABILITIES OF BANKS AND CORPORATIONS. *Establish procedures for bank exits, recapitalization and rehabilitation. *Establish legal procedures and formal frameworks for corporate insolvencies and workouts.
*Establish international frameworks for PSI in external debt resolution. *Strengthen capacity for official budgetary support.
*Finance regional programs to help accelerate bank and corporate restructuring through regional MDBs and bilateral donors.
CUSHION THE EFFECTS OF CRISES ON LOW-INCOME GROUPS THROUGH SOCIAL POLICIES TO AMELIORATE THE INEVITABLE SOCIAL TENSIONS.
RESOLVING THE
SYSTEMIC
CONSEQUENCES
OF CRISES
*Strengthen social safety nets and to mitigate social consequences of crises.
*Finance the activity through the World Bank and other international organizations.
*Finance regional programs to help mitigate social impact through regional assistance.
Source: Revision of Table 8 in Kawai [2002a] and Table-1 in Kawai, Newfarmer and Schmukler [2003], as cited in Kawai [2004].

35
3. CORPORATE GOVERNANCE, PRUDENTIAL REGULATIONS and INSTITUTIONAL STRENTHENING MEASURES
The AFC exposed the weak institutional backbone to which major financial and corporate
structures were attached. Anemic legal and regulatory systems, nontransparent and inconsistent
accounting and auditing standards, poor banking practices, thinly regulated capital markets,
ineffective management by corporate board of directors and disregard for minority shareholders’
rights all conspired to exacerbate the financial and economic storm which swept across Asia less
than a decade ago.
Corporate governance maybe defined as a set of rules that define the relationship
between shareholders, managers, creditors, the government, employees and other internal
and external stakeholders in respect to their rights and responsibilities, or the system by
which companies are directed and controlled.33 The objective of any system of corporate
governance is to create added value for stakeholders.
The principle of promoting good corporate governance is rooted on the fact that most
businesses are externally financed. Hence the sources of these funds must be assured, through a
system of good corporate governance, that their funds are being utilized and managed in the most
efficient, productive and profitable manner. By providing an effective system of protection to
creditors and debtors, good governance assures that the element of trust (which is essential in any
business environment) is sustained between and among all business stakeholders.
The principles covered by a system of good corporate governance include:34
The rights of shareholders, who should be timely and properly informed about the
company, who should be able to participate in decisions concerning fundamental
corporate changes, and who should share in the profits of the company;
Equitable treatment of shareholders, especially minority and foreign shareholders, with
full disclosure of material information and prohibit abusive self dealing and insider
trading;
The role of stakeholders, which should be recognized as established by law and active
co-operation between corporations and stakeholders in creating wealth, jobs and
financially sound enterprises; 33 This definition was taken from the Cadbury Committee of the United Kingdom, based on the definition contained in www.fcgi.or.id/English. 34 These elements were taken from www.fcgi.or.id/English/

36
Timely and accurate disclosure and transparency on all matters material to company
performance, ownership and its stakeholders; and
The responsibilities of the board in the management, the supervision of the management
and the accountability to the company and shareholders.
Because practices, regulations and the institutional make-up vary across countries, there is not
just one system of governance that might be effective for a country or a group of countries. In view
of this, the World Bank Group’s Corporate Governance Department, under the joint World
Bank-IMF program of Reports on the Observance of Standards and Codes (ROSC), carried out
corporate governance assessments that capture both the formal and informal dimensions of
corporate governance practices in each country. Under the ROSC Program, the World Bank
oversees the preparation of assessments on corporate governance; accounting and auditing; and
insolvency regimes and creditor rights. The corporate governance ROSC then serves as a
benchmark of the country’s observance of corporate governance against the OECD Principles of
Corporate Governance.
While corporate governance is a primary undertaking of the companies themselves, the
government plays an important supporting role by issuing and enforcing adequate regulation on
such areas as company registration, disclosure of financial company data and rules on the
responsibilities of commissioners and directors. Observance of the principles of good governance
are therefore reinforced and strengthened by government action through a stronger and wider
enforcement of laws, introduction of new regulations and increasingly strong public scrutiny over
corporate actions.
On a macro level, promoting a system of good governance, together with prudent regulations,
help develop capital markets by strengthening structures that broaden investor class, provide sound
financial channels and institutionalizes market discipline. This is both a challenge and an imperative
especially for Asian economies whose performances, during the AFC season, demonstrated a major
lack of competency in this area.
Another reason why developing Asian economies have to pursue a system of good
governance and prudential regulations is that unlike developed economies which possess highly
developed financial and capital markets, the countries hardest hit by the AFC all share the common
trait of proceeding with economic deregulation and globalization without first securing the maturity

37
and readiness of its financial infrastructures.
A study on the state of corporate governance and finance in Indonesia, Korea, Malaysia, the
Philippines and Thailand identified some commonalities among these countries which impact on
how the companies in these countries are being governed and financed. These common
denominators include the following:
(1) Most companies in these countries started as family businesses and later evolved into
corporations, which are still under the control of the founders’ families.
(2) Governments have had a hand in developing specific industries, directing funds towards them
and determining the degree of allowable competition.
(3) They have all engaged in financial liberalization even if capital markets were not well developed.
Thin trading, shallow liquidity, weak regulatory framework and underdeveloped market
infrastructures characterized these countries’ equities markets.
The subsequent section presents the state of corporate governance and prudential regulations
in selected economies of Asia. It is important to note that the dictum of the merits of corporate
governance has been based largely on the Anglo-American model, which put a premium on the
putting sound regulatory frameworks in place. However, such may not be the best recipe for Asian
economies, especially since most Asian companies are family-owned and -controlled, meaning, the
owners of such companies might pursue their private interests more expeditiously and often at the
expense of minority shareholders whose rights are often weakly protected by corporate laws. This
system of corporate ownership as well as the imbedded institutional and socio-cultural norms (role
of creditor banks and employees, for example) must be included in the governance paradigm as
well.

38
3.1 THE CASE OF INDONESIA
Several factors made the restructuring in Indonesia daunting. These include: (a) The depth
of its structural problems; (b) The weak and vulnerable condition of the banking sector during
pre-crisis period; (c) The high levels of foreign debt; (d) Substantial currency depreciations; (e) The
tight constraints imposed by the fiscal costs of bank re-capitalization; and (f) The lack of political
consensus on the direction of reform.
3.1.1 BANKING SECTOR
Among the countries included in this study, Indonesia’s banking system stood out as the
most distressed because of its weaker pre-crisis conditions, the extent of depreciation suffered by its
currency in a scenario where the private sector was exposed to very large external liabilities, and the
sharp decline of its economic growth in 1998.
Policies introduced to reform the banking system are focused on (a) the resolution of
non-viable private banks; (b) government-assisted recapitalization programs for potentially viable
private banks; (c) measures to recover liquidity support previously extended to troubled banks by
Bank Indonesia; (d) the merger, reform, and recapitalization of state banks; and (e) a strengthened
banking supervision system.
Established in 1997, the Indonesian Bank Restructuring Agency (IBRA) was tasked to
oversee bank restructuring. IBRA set up an Asset Management Unit (AMU) to directly manage
problem loans of banks under its supervision. Amendments in legislation, which were approved in
late 1998, bolstered the legal powers of IBRA. Banks were then re-grouped for the purpose of
restructuring in the first half of 1998. Of the 128 private banks, 32 were included in Category A, i.e.
banks with a capital adequacy ratio (CAR) of over 4 per cent. Another 62 banks formed Category B
with a CAR of between -25 per cent and 4 per cent. The rest was put in Category C with a CAR of
less than -25 per cent. Injection of capital by owners who were trying to avoid closure and seeking
better treatment, inhibited banks from moving from one category to another [Simanjuntak, n.d.].
Bank Indonesia introduced a recapitalization program for potentially viable private banks.
Although Indonesian banks have, on average, achieved the 8 percent capital adequacy standard by
2001, there are still a number of those unable to raise sufficient profits that will allow them to meet

39
the standard. Four state banks required around Rp276 trillion for recapitalization. In addition,
sovereign bonds amounting to Rp650 trillion were issued to enable banks to meet a capital
adequacy standard of at least 4 percent and to honor guarantees of deposits and liabilities of closed
banks. Troubled banks were given four years to pay the liquidity support extended to them.
Banks that were deemed ineligible for recapitalization were closed, merged, or sold. In 1999,
Bank Mandiri was established to amalgate the four older state-owned banks that failed in 1998.
These banks were Bank Dagang Negara (BDN), Bank Export-Import Indonesia (Exim), Bank Bumi
Dayak (BBD), and Bank Pembangunan Indonesia (Bapindo). The new bank, whose name means
“self-reliant bank”, will have almost a third of total bank assets and may later be sold. By 2001, 70
banks were closed and another 12 were nationalized so that only 159 banks were left in operation.
The number of banks continued to decrease as mergers and acquisitions took place. Some of the
stronger banks are likely to make strategic alliances with foreign partners, and the banks under the
control of IBRA are expected to be sold to strategic investors.
To protect depositors, Bank Indonesia issued a blanket guarantee in an attempt to discourage
depositors from further withdrawal. This protection scheme was limited to small depositors of up to
Rp20 million, which accounted for 90 percent of the number of depositors in the banking system. It
should be noted that through 4 state banks, 12 nationalized banks, 26 regional development banks
and majority stakes in 7 “private” recapitalized banks, government-owned institutions now control
70 per cent of the banking system’s deposits.
3.1.2 CORPORATE SECTOR
In March 1998, 46.7 percent ($64.6 billion) of Indonesia’s total external debt was accounted
for by corporate debt. The corporate sector had more than Rp600 trillion (US$75 billion at
Rp8,000/$1) in debt from domestic commercial banks. During the same period, 80 percent of the
total amortization payments on foreign debt were private. More than two thirds of private debt was
short-term and the average maturity of all private debt was estimated to be only 18 months.
To encourage negotiation between creditors and debtors, the Jakarta Initiative was launched
on September 1998. Aside from encouraging negotiation, the initiative was aimed at establishing
the legal and policy framework needed to facilitate corporate restructuring. The initiative proposes
the idea that creditors should agree to a standstill for a certain period to allow debtors to operate

40
normally after obtaining fresh financing. A number of prominent companies have been subject to
restructuring deals under the initiative, they include Garuda (a national flag carrier), Astra
International (automotive), and Ciputra (property business). In November, Semen Cibinong (cement
industry) became the first Indonesian company to resume paying part (25 percent) of the interest on
its $1.2 billion debt. By end-November, the Jakarta Initiative Task Force had conducted negotiations
for 52 companies with Rp2.4 trillion of domestic debt and $6.7 billion of foreign exchange debt
[ADB, 2001].
The initiative also offered firms the option of restructuring via debt-to-equity swaps. Only a
small number of firms explored this option. To sustain and strengthen the momentum on corporate
restructuring, the government introduced regulation that provides tax neutrality for mergers and
removes other tax disincentives for restructuring. One issue that must be ironed out, however, is that
significant regulation on debt-equity swaps would have to be issued in the context of corporate
restructuring [ADB, 2001].
In some cases corporate debt restructuring will be a matter for the AMCs that now own the
NPLs. Some have argued they have poor incentives to do this but if the necessary expertise is
concentrated in this one body, it may operate more efficiently than if it is diffused among a number
of banks [Hawkins, 1999].
3.1.3 PRUDENTIAL REGULATORY AND SUPERVISORY REFORMS
Lack of supervisory capability is often cited as one of the reasons for financial system
weaknesses. Asymmetric information leads to adverse selection and moral hazard problems that
have an important impact on financial systems and justifies the need for prudential supervision
[Mishkin, 2001].
Although Bank Indonesia has initiated prudential regulatory and supervisory reforms as early as
1991, progress has been slow and was exacerbated by (a) premature banking liberalization; (b)
insufficient banking consolidation; and (c) poor development of organizational capabilities. Political
interference and lack of law enforcement are also primary concerns.
In July 1999, Bank Indonesia entered into an agreement with the IMF and presented the
“Master Plan”. The plan was meant to enhance the efficiency of banking regulation in order to meet
international standards set by Basel Core Principles for Effective Banking Supervision. Three

41
strategies were set by the plan: (a) risk-based supervision; (b) a clear responsibility for the
supervision and regulatory functions within the Board of Governors; and (c) a uniform supervision
standards for all public and private banks. Indonesia has also moved towards the adoption of
international standards for loan classification and minimum capital adequacy ratios but in a phased
manner. An 8 percent capital adequacy ratio was set for compliance by 2001.
Since July 2000, Bank Indonesia also carried out an intensive supervision by placing an
on-site supervision team in each of the systemically important banks to ensure that they were well
managed and did not pose a high risk to the stability of the banking system.
The financial system is recovering from its fragility but the pace of asset disposal has been
slow. For example, in the process of reducing the NPL ratio to 18.8 percent by December 2000,
IBRA acquired approximately 82 percent of the NPLs of banks. This resulted to the government
owning around 80 percent of the banking system’s total assets. Amendments to the bankruptcy law
were also announced on April 22, 1998, which took effect in 120 days. The new commercial law and
regulations are based largely on Chapter 11of the US Bankruptcy Law. The ADB provided assistance
in improving the payments system. The Jakarta Electronic Clearing System was established in 1998
to provide a fast and secure clearing process.
Indonesian banking sector was so badly hit by the Asian crisis that all commercial banks
went bankrupt. Although the government made a lot of effort to rehabilitate the damaged banking
industry, weakness of private commercial banks has been persisting and even large commercial banks
are still suffering from liquidity problems. The banking sector reform in Indonesia was slowed down
in 2001. The progress in the resolution of NPLs has been unsatisfactory and the privatization of
commercial banks under the control of government was delayed.
One of the important factors affecting the slow-down of bank reforms is the political
instability and the lack of government initiatives to pursue financial reforms [Kishi and Okuda, n.d.].
What Indonesia needs is to speed up the process of its asset disposal and accelerate corporate debt
restructuring to all its obligators. An improvement in the legal system to provide a more reliable
protection for creditors is necessary, although, admittedly, such process will take time. Another
bottleneck in the reform process was the lack of vigorous implementation of prudential regulations
due to insufficient ability of Bank Indonesia supervision staff. The banking system also needs to
address the relative shortage of skilled and talented personnel in order to significantly improve the

42
management capacities of its private banks.
3.1.4 CORPORATE GOVERNANCE35
Two important laws govern the state of corporate governance in Indonesia. One is the
Indonesian Company Law of 1995, and the other is the Capital Market Law. The Indonesian
Company Law of 1995 is the most important framework for the current legislation on corporate
governance. Under this Law, a company is a separate legal entity in which Directors (Direksi) and
Commissioners (Komisaris) represent the company.
General Meeting of Shareholders. The General Meeting of Shareholders is the most
powerful organ in a company. It has the power to approve or disapprove i.e. the consolidation,
merger, acquisition, bankruptcy and dissolution of the company and the appointment and dismissal
of commissioners and directors.
Board of Commissioners. The Board of Commissioners (Komisaris) has to supervise and
advise the Directors in the running of the company. The Komisaris is required by the Company Law
to carry out, in good faith and with full responsibility, its duties in the best interests of the company.
It is empowered by law to suspend a director and must sign, together with the Direksi, the Annual
Report of the company. Thus, it shares legal responsibility for misleading financial statements. Each
member of the Komisaris must disclose to the company, by virtue of the Company Law, any
shareholding interests held by that member or his family in the company or other companies. The
performance of responsibility of the Komisaris is however as yet quite rare.
Board of Directors. The Board of Directors (Direksi) is fully responsible for the
management of the company. Each Direksi-member is fully and personally liable if he/she is at fault
or neglects to perform his/her tasks in good faith and with a full sense of the responsibility for the
interest and business of the company. The Direksi is required by the Company Law to carry out, in
good faith and with full responsibility, its duties in the best interests of the company. Each member
is personally liable for any misconduct or negligence in carrying out these responsibilities.
The Direksi must administer the company's books of accounts, prepare and submit to the
35 This section was sourced from the official website of the Forum on Corporate Governance in Malaysia (FCGI).
43
Annual GMOS an Annual Report and annual financial statement as well as establish and maintain a
Register of Shareholders and Minutes of the GMOS. A member of the Direksi must also disclose to
the company, by virtue of Article 87 of the Company Law, any shareholding interests held by him
or his family in the company or other companies. The Direksi shall comply with Article 43 of the
Company Law requiring that the company organize and maintain a Register of Shareholders, and a
Special Register containing information regarding the shareholdings of members of the Direksi and
Komisaris and their families in such company and/or in other companies and the dates such shares
are acquired and disposed of. The Direksi shall cause the Register of Shareholders and the Special
Register to be readily available for examination by the Komisaris and shareholders at the office of
the company.
Under the current rules a publicly listed company is required to appoint a corporate secretary,
and such secretary acts as an investor relations officer. In addition, it is being proposed that the
corporate secretary shall also act as a compliance officer and keeper of corporate documents such as
the Register of Shareholders and the Special Register of the company, and Minutes of any GMOS,
as well. One of the members of the Direksi may be designated as a corporate secretary. The Deed of
Establishment of each company containing of the Article of Association, which must be ratified,
approved or accepted by the Minister of Law and Legislation and the standards set forth thereby,
will further define the responsibilities and the rights of the shareholders, both majority and minority,
and the Direksi and Komisaris.
The Indonesian Capital Market Law is the second major regulatory framework, next to
the Company Law. It is found in the rules and regulations issued by the Indonesian Capital Market
Supervisory Agency, or "BAPEPAM". The Company Law applies to all limited liability companies
established under Indonesian law, whereas the capital market rules and regulations are applicable to
"public companies" as defined in the Capital Market Law (i.e., a company of which the shares are
held by at least 300 persons and having a paid-up capital of Rp3 billion).
The company shall disclose material information through its Annual Reports and financial
statements to shareholders as well as its reporting to BAPEPAM, the relevant stock exchanges and
the public in a timely, accurate, understandable and objective manner. Companies shall take the
initiative to disclose not only matters required by law but also those of material importance to the
decision-making of institutional investors, shareholders, creditors and other stakeholders with
respect to the company. Members of the Komisaris and Direksi holding shares in the company and

44
any other "insiders" as meant in the elucidation of Article 95 of the Capital Market Law must not
take advantage of their inside information in dealing with those shares.
In Indonesia, as in other Asian countries, the ownership of listed companies is highly
concentrated, and the percentage of managers belonging to the controlling group is also very high.
And as Indonesia's economy and companies inevitably integrate into the world economy for their
loan and equity financing and trading of products, the observance of internationally agreed
standards of corporate governance becomes imperative for Indonesia.
The Forum on Corporate Governance in Indonesia made an assessment on such areas of
corporate governance as shareholders participation and protection, credit monitoring and protection,
market for corporate control and product market protection and capital markets and corporate
finance. Its notable findings consisted of the following:
(1) On shareholders participation and protection. The Boards of Commissioners have generally
been ineffective in safeguarding the interests of shareholders, because family based shareholders
have held dominant positions. Control mechanisms ('checks and balances'), such as representation
of third party interests through independent commissioners and independent committees for
remuneration, nomination, and audit have been lacking. Transparency is poor as disclosure practices,
accounting standards and their implementation have been inadequate.
(2) On creditor monitoring and protection. The creditor's position and role in corporate
governance is weak because creditors and banks themselves are poorly governed. This is due to
the weak internal control and inadequate regulatory frameworks for the bank and non-bank
financial institutions and bank's apparently underdeveloped internal risk management system.
Secondly, market scrutiny has been lacking as creditors and competitors are often part of
conglomerates owned by the same families as those who owned the borrowing firms. Thirdly, legal
protection of creditors has been weak due to the inefficient judiciary system in Indonesia. Moreover,
insolvency laws and procedures have been generally inactive in Indonesia, both in protecting
creditors and disciplining borrowers.
(3) On the market for corporate control and product market protection. The market for
corporate control has been largely inactive. The difficulties experienced in mounting hostile
take-over reflect the concentration of ownership in companies. The high concentration of ownership
of companies inhibits the market mechanism on the markets for corporate control and products.

45
(4) Capital Markets and Corporate Finance. Due to the early stage of development of the capital
markets in Indonesia, the capital markets were dominated by external finance, especially bank
loans. Regulatory restrictions and ineffective legal procedures have limited the role of corporate
bonds and corporate financing. Firms undertook extensive foreign borrowing because foreign
interest rates were liberalized whereas domestic rates were regulated.

46
3.2 THE CASE OF MALAYSIA Malaysia’s approach to financial sector restructuring utilized an institutional framework that
was created by the government in 1998. This framework was supported by three institutions:
Danaharta, Danamodal and the Corporate Debt Restructuring Committee.
Its banking woes were not as pronounced as Indonesia’s or Thailand’s even prior to the crisis.
Its risk-weighted capital adequacy ratio (for commercial banks) was 10.8 percent by end-1996. As
the AFC unfolded, NPLs increased from 6 percent of total loans by end-1997 to about 23 percent by
end-1998. Between October 1997 and March 1998, Malaysian authorities adopted a series of
measures involving tightening of loan classifications and higher capital adequacy ratios but ‘these
were subsequently relaxed in September 1998’.36
The bank restructuring process has been progressing successfully. The government
strengthened the legal system and enhanced prudential regulations of financial institutions. In order
to promote market discipline and tighten disclosure-based regulations, Bank Negara Malaysia
(BNM) required the banks to submit daily statements and pursued better accounting between
support operations for distressed banks and day-to-day monetary management. BNM reduced the
time it required to release data and the analysis of monetary trends from six to four weeks and
launched its home page on the Internet. A supervisory early-warning system was developed with the
World Bank in 1999 [Kishi and Okuda, n.d.].
To strengthen risk management, modules on risk-based examination techniques are
incorporated in the examination manual, and prudential regulation standards were upgraded to
conform to the international standards. All financial institutions were asked to disclose quarterly
data on NPLs and capital adequacy ratios. The classification period of NPLs was reduced from six
to three months (to mitigate the severe credit crunch caused by new regulations) and the suspension
of interest in NPLs was tightened. The minimum requirement of general provision for bad and
doubtful debts was raised to 1.5% [ibid.].
However, some requirements were relaxed to help economic recovery. In 1998, to ensure the
survival of domestic banks the government announced a plan to consolidate the financial
institutions so as to improve their competitiveness and stabilize the banking sector. The financial
36 Taken from Financial and Corporate Sector Restructuring in East and Southeast Asia: An Overview.

47
industry was reorganized in 2000, with 58 banks and non-banks consolidated into ten groups [see
TABLE-3].
Under the strong leadership of the government, the resolution of NPLs and implementation
of comprehensive bank restructuring program have progressed steadily and substantially. Loan
approvals grew by 108.3 percent between 1999 (RM104 billion) and 2000 (RM131.7 billion). Loan
disbursement, on the other hand, increased by 12.6 percent, from RM317.4 billion in 1999 to
RM357.3 billion in 2000 [Ariff et al, n.d.].37 However, market circumstances have yet to be fully
competitive and the financial institutions’ management is not fully independent. The disclosure of
banks is still insufficient and strong government intervention into banking sector remains. Foreign
banks’ business operations are still regulated. And unhealthy co-integration between banking sector
and the stock market in various forms are observed. In this regard, government intervention in the
financial system depresses the independent management of banks and disturbs efficient resource
allocations [Kishi and Okuda, n.d.].38
If Malaysia opens her banking sector more to foreign entities, it will likely improve the
efficiency of its domestic banking sector as a whole, and in the process attract more FDI. Thirteen
wholly foreign-owned commercial banks operate in Malaysia, and while the government has
expressed its desire to reduce the number of Banks, BNM indicated its intent to issue 3 new licenses
to foreign participants in Islamic banking in 2004 and 3 new additional commercial licenses in 2005.
While the Financial Sector Master Plan aims to increase more competition and build greater
financial sector resiliency, it deferred the introduction of new foreign competition in conventional
banking until after 2007.39
CORPORATE GOVERNANCE
A World Bank’s Report40 on Malaysia’s corporate governance contain a summary of the
structure of the corporate sector and capital market in the country, as well as the legal, regulatory
and professional best practices. It also records the registration and listing requirements in the capital
market, the treatment of shareholders (including legal rights and treatment of shareholders, a feature
on minority shareholders, statutory and other remedies, insider trading and self-dealing and share
37 Check out www.unescap.org/drpad/publication/fin_2148/chap3.pdf. 38 Check out www.mof.go.jp/jouhou/kokkin/tyousa/tyou041g.pdf. 39 Taken from US Department of State Malaysia Investment Climate Statement 2005. 40 Taken from http://www.worldbank.org/ifa/rosc_cg_malaysia.html

48
registration), management oversight (including structure and powers of the ultimate body governing
the corporation, legal duties owed the members of the governing body; process for nominations to
the governing body, and independent oversight of the management), and disclosure and
transparency (i.e. disclosure of material financial and non financial performance; independent audit;
disclosure of ownership; disclosures relating to the company’s directors, managers and advisers;
disclosures for related party transactions; and other disclosure provisions and risk management).
Some of its highlights also conform to the findings of the study Corporate Governance and Finance
in the Five Affected Countries41 including the following:42
(1) The concentrated nature of Malaysia’s corporate ownership structure. The five largest
shareholders typically own more than 60 percent of shares in half of the listed companies. In 1998,
the largest shareholder owned 30.3 percent, the top five shareholders owned 58.8 percent and the
top 20 owned 80 percent of total outstanding shares of an average PLC (publicly listed company).
Ownership data on large conglomerates indicate a similar concentration pattern. The nominee
company is the largest shareholder group among the top five shareholders. The ownership structure,
especially the extent of institutional holdings is due in part to the government’s efforts to reallocate
corporate shares to indigenous Malaysians and the countervailing efforts of non-indigenous
Malaysians to maintain their ownership. There is minimal degree of cross-shareholdings despite the
absence of laws explicitly prohibiting a company from owning shares of companies that own it.
(2) Malaysia scores highest when it comes to the effectiveness of boards of directors as an
oversight body. This might be due to the government’s efforts to strengthen the regulatory
framework of the corporate sector, such as the introduction in 1996 of the Directors Code of Ethics.
(3) Rights and protection of shareholders in Malaysia are comprehensive and well defined. Three
major acts govern corporate activity: the Companies Act of 1965; the Securities Industry Act
(SIA) of 1983; and the Securities Commission Act (SCA) of 1993. The Companies Act is the
chief legislation that governs such corporate matters as pre-incorporation, incorporation, operations
and the duties and obligations of directors. It also deals with the rights of shareholders and protects
shareholders by:
stipulating regulations governing duties of company directors;
requiring AGM approval for the acquisition or disposal by directors of assets of 41 Taken from http://www.adb.org/Documents/Books/Corporate_Governance/Vol1/chapter3.pdf 42 This section was sourced primarily from www.worldbank.org/ifa/rosc_cg_malaysia.html and www.adb.org/Documents/Books/Corporate_Governance/Vol1/chapter3.pdf.

49
substantial value, and for the issue of shares;
prohibiting loans to directors or director-related parties, unless they are subsidiaries;
disclosing and requiring shareholders’ approval on substantial transactions in any
non-cash assets involving directors or persons connected with directors;
disclosing substantial shareholdings to the company and the KLSE (now Bursa Malaysia).
The SIA and SCA compose the legislative and regulatory framework of Malaysia’s capital
markets, under the authority of the Ministry of Finance (MOF). The SIA of 1973 set a milestone for
the protection of investor interest by curbing excessive speculation, insider trading, share rigging
and other forms of market manipulation. The SIA of 1983 provided a more effective control and
supervision of the operations of dealers and tightened prohibitions on artificial trading and market
rigging.
(4) The Malaysian Code on Corporate Governance, though voluntary in nature, was set out to
promote good governance and best practices for listed companies. In March 1998, the Malaysian
Institute of Corporate Governance (MICG) was created to create a pool of independent directors via
education and training programs.
(5) Malaysia scores high when it comes to the general quality of its auditing standards and
financial reporting. Its accounting standards are consistent with those issued by the International
Accounting Standards Committee (IASC) in the 1980’s. The Malaysian Accounting Standards cover
issues not dealt with by the IASC ad reflect features particular to the Malaysian way of doing
business.
(6) In general, creditors do not influence the companies’ management and decision-making, apart
from restrictions set out in loan covenants. Insolvency procedures, modeled after the English law,
are a mix of creditor-oriented formal procedures and informal procedures, which bring together
debtors and creditors to restructure loans.
(7) The Malaysian Code on Takeovers and Mergers (1987) was aimed at ensuring that all takeovers
and mergers are conducted in an orderly manner and minority shareholders are protected. The new
Malaysian Code on Takeovers and Mergers (1998) increased the market disclosure requirements
related to takeovers, imposed criminal liabilities on parties providing false or misleading
information, enhanced standards of disclosure in case of takeovers and provided amendments to

50
reduce the amount of time required for an acquirer to accumulate shares in a target firm.
(8) The government’s intention of increasing the number of Bumiputra entrepreneurs led to the
creation of business groups which were often owned by Bumiputras. This formed strong political
affiliations and later became a breeding ground for crony capitalism. Such groups could easily
obtain bank loans from government-controlled banks using political clout. The BNM also waived
the single lender limit for government projects so that these projects would not be dependent on
foreign funding.

51
TABLE-3. LIST OF BANKING GROUPS IN MALAYSIA
ANCHOR BANK BANKING INSTITUTIONS IN A GROUP
MALAYAN BANKING BERHAD MALAYAN BANKING BERHAD MAYBAN FINANCE BERHAD ASEAMBANKERS MALAYSIA BERHAD PHILEO ALLIED BANK BERHAD THE PACIFIC BANK BERHAD SIME FINANCE BERHAD KEWANGAN BERSATU BERHAD
BUMIPUTRA-COMMERCE BANK BERHAD
BUMIPUTRA-COMMERCE BANK BERHAD BUMIPUTRA-COMMERCE FINANCE BERHAD COMMERCE INTERNATIONAL MERCHANT BANKERS BERHAD
RHB BANK BERHAD RHB BANK BERHAD RHB SAKURA MERCHANTS BANKERS BERHAD DELTA FINANCE BERHAD INTERFINANCE BERHAD
PUBLIC BANK BERHAD PUBLIC BANK BERHAD PUBLIC FINANCE BERHAD HOCK HUA BANK BERHAD ADVANCE FINANCE BERHAD SIME MERCHANT BANKERS BERHAD
ARAB MALAYSIAN BANK BERHAD ARAB-MALAYSIAN BANK BERHAD ARAB-MALAYSIAN FINANCE BERHAD ARAB-MALAYSIAN MERCHANT BANK BERHAD BANK UTAMA MALAYSIA BERHAD UTAMA MERCHANT BANK BERHAD
HONG LEONG BANK BERHAD HONG LEONG BANK BERHAD HONG LEONG FINANCE BERHAD WAH TAT BANK BERHAD CREDIT CORPORATION MALAYSIA BERHAD
PEWIRA AFFIN BANK BERHAD PEWIRA AFFIN BANK BERHAD AFFIN FINANCE BERHAD PEWIRA AFFIN MERCHANT BANKERS BERHAD BSN FINANCE BERHAD BSN MERCHANT BANK BERHAD
MULTI PURPOSE BANK BERHAD MULTI PURPOSE BANK BERHAD INTERNATIONAL BANK MALAYSIA BERHAD SABAH BANK BERHAD MBF FINANCE BERHAD BOLTON FINANCE BERHAD SABAH FINANCE BERHAD BUMIPUTRA MERCHANT BANKERS BERHAD AMANAH MERCHANT BANK BERHAD

52
ANCHOR BANK BANKING INSTITUTIONS IN A GROUP
SOUTHERN BANK BERHAD SOUTHERN BANK BERHAD BAN HIN LEE BANK BERHAD CEMPAKA FINANCE BERHAD UNITED MERCHANT FINANCE BERHAD PERDANA DINANCE BERHAD PERDANA MERCHANT BANKERS BERHAD
EON BANK BERHAD EON BANK BERHAD EON FINANCE BERHAD ORIENTAL BANK BERHAD CITY FINANCE BERHAD PERKASA FINANCE BERHAD MALAYSIAN INTERNATIONAL MERCHANT BANKERS BERHAD
SOURCE: BANK NEGARA MALAYSIA as cited in Ariff, et al (n.d.)
53
3.3 THE CASE OF SINGAPORE43
Singapore’s financial sector remains robust despite fluctuations in regional economic
performance and declines in asset prices. After weathering 3 major shocks – the AFC; the sharp
drop in electronic exports in 2000-2001; and the SARS outbreak in 2003 - banks have remained
liquid, and continue to be adequately provisioned for nonperforming asset exposures and
conservative in their management practices. The insurance sector, the 2nd largest group of financial
institutions, is well capitalized and generally profitable. The Monetary Authority of Singapore
(MAS) between December 2001 and May 2003, completing a major part of the lion city’s banking
liberalization program, issued twenty wholesale bank licenses. By end-2004, Singapore has 23
Qualifying Full Banks (QFBs), 36 wholesale banks, 111 commercial banks, and 47 offshore
banks.44
The nonfinancial corporate sector [see TABLE-4] has recorded consistent profitability from
1997 to 2001, despite fluctuations on returns to assets between 3 percent and 6 percent, and the
return to equity between 6 percent and 14 percent. The average debt-equity ratio was 0.8 from 1999
– 2001. Liquidity is high (except 1998) and the share of total debt remained stable at approximately
70 percent.
Reforms have been implemented since 1998 in order to further capitalize on the country’s
international standing in the financial arena. These include:
1. Opening the financial industry to greater international competition;
2. Bringing regulatory and supervisory practices closer in line with international best practices
on prudential regulations, supervision and disclosure-based regulations;
3. Developing deep and liquid fixed income and equity markets;
4. Promoting the asset management industry
5. Gradually liberalizing the restrictions on the use of S$.
3.3.1 PRUDENT REGULATIONS, the MAS and the BANKING SECTOR
The operation of local banks continues to be profitable and its foreign operations, under the
MAS’ consolidated supervision framework, appear to be managed efficiently. By end-September
2003, the total assets of local banks were valued at S$257 billion, equivalent to a 21 percent share 43 A large component of this report was based on IMF Country Report No 04/140, 2005. 44 US Department of State Singapore Investment Climate Statement 2005
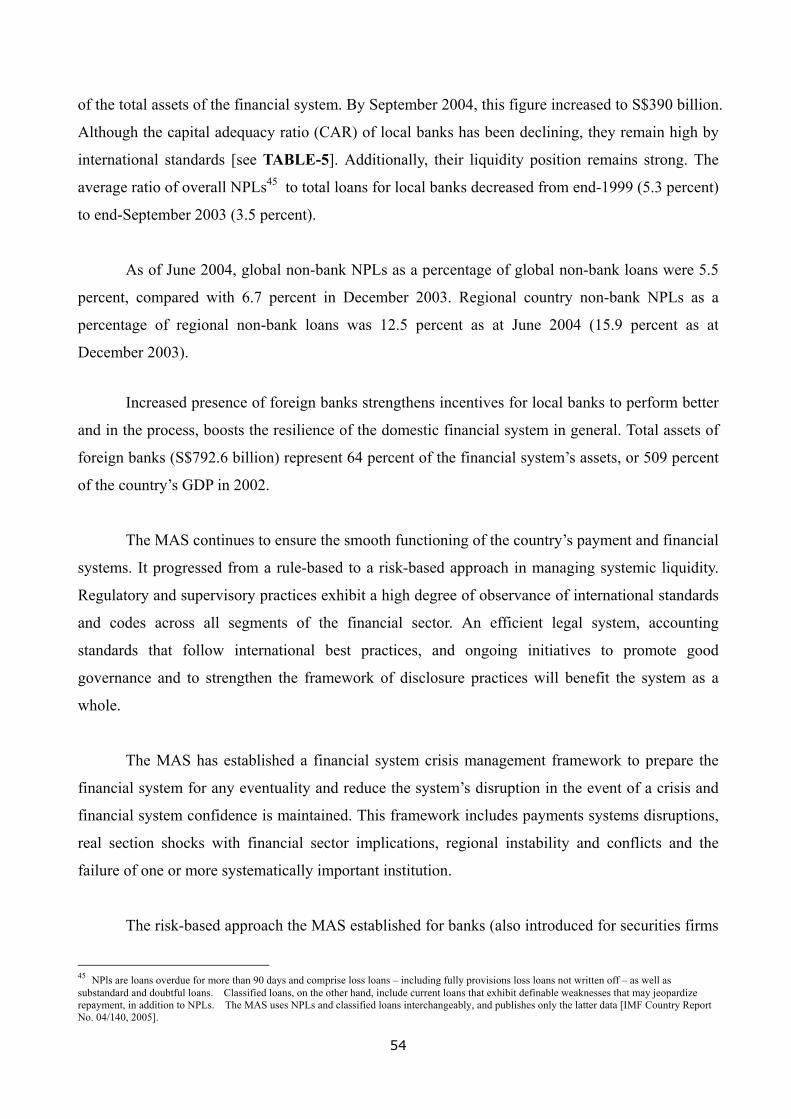
54
of the total assets of the financial system. By September 2004, this figure increased to S$390 billion.
Although the capital adequacy ratio (CAR) of local banks has been declining, they remain high by
international standards [see TABLE-5]. Additionally, their liquidity position remains strong. The
average ratio of overall NPLs45 to total loans for local banks decreased from end-1999 (5.3 percent)
to end-September 2003 (3.5 percent).
As of June 2004, global non-bank NPLs as a percentage of global non-bank loans were 5.5
percent, compared with 6.7 percent in December 2003. Regional country non-bank NPLs as a
percentage of regional non-bank loans was 12.5 percent as at June 2004 (15.9 percent as at
December 2003).
Increased presence of foreign banks strengthens incentives for local banks to perform better
and in the process, boosts the resilience of the domestic financial system in general. Total assets of
foreign banks (S$792.6 billion) represent 64 percent of the financial system’s assets, or 509 percent
of the country’s GDP in 2002.
The MAS continues to ensure the smooth functioning of the country’s payment and financial
systems. It progressed from a rule-based to a risk-based approach in managing systemic liquidity.
Regulatory and supervisory practices exhibit a high degree of observance of international standards
and codes across all segments of the financial sector. An efficient legal system, accounting
standards that follow international best practices, and ongoing initiatives to promote good
governance and to strengthen the framework of disclosure practices will benefit the system as a
whole.
The MAS has established a financial system crisis management framework to prepare the
financial system for any eventuality and reduce the system’s disruption in the event of a crisis and
financial system confidence is maintained. This framework includes payments systems disruptions,
real section shocks with financial sector implications, regional instability and conflicts and the
failure of one or more systematically important institution.
The risk-based approach the MAS established for banks (also introduced for securities firms
45 NPls are loans overdue for more than 90 days and comprise loss loans – including fully provisions loss loans not written off – as well as substandard and doubtful loans. Classified loans, on the other hand, include current loans that exhibit definable weaknesses that may jeopardize repayment, in addition to NPLs. The MAS uses NPLs and classified loans interchangeably, and publishes only the latter data [IMF Country Report No. 04/140, 2005].

55
in 2002 and the insurance industry in 2005) is well in place and progress have been ongoing in so
far as consolidating different supervisory frameworks that govern various areas of the financial
sector.
3.3.2 REFORMS AND INITIATIVES
In the insurance sector, a risk-based capital framework was adopted by the insurance
industry in late 2004. In 2005, an insurance scheme to provide small depositor protection was
introduced. Significant initiatives are currently being developed in consultation with the insurance
industry – particularly the overhaul of capital standards to a more comprehensive and risk-based
approach with new rules, giving specific attention to corporate governance and internal control. The
implementation and enforcement of these initiatives, which are well advanced, will further improve
observance.
In order to minimize contagion risk and conflicts of interest, banks were required separate
financial and non-financial activities effective July 2004, in effect making them divest non-financial
activities.
In light of the further adoption of the New Basel Capital Accord (Basel II), the MAS
maintains close consultation with banks which have been enhancing internal rating infrastructures
for credit risk measurement.
The 2nd generation of the MAS Electronic Payment Scheme (MEPS) was introduced in 2005
to improve the efficiency of the payments system. The securities and settlement systems are robust
and do not cause major systemic risks. The efficiency of the MEPS-SGS (the central depository for
government bonds and bills) is being improved with the implementation of a Society for Worldwide
International Financial Telecommunication (SWIFT) channel, and an intraday liquidity facility will
soon be introduced to improve liquidity on the cash side.
The IMF country assessment on Singapore’s observance of Key International Standards and
Codes reveal that:46
1. The MAS has established a sound prudential and regulatory framework for effective
46 A large component of this report was based on IMF Country Report No 04/140, 2005, (Box7) page 27.

56
supervision of its commercial banking sector and has achieved a high level of observance of
the Basel Core Principles (BCP). There are no weaknesses that raise financial stability
concern.
2. The country has a high level of observance of the IAIS Insurance Core Principles.
3. Singapore has achieved a high degree of compliance with IOSCO Objectives and Principles
of Securities Regulation. The framework for the oversight and regulation of securities
markets, intermediaries, issuers, and collective investment schemes, is well developed,
sophisticated, and meets international standards. The MAS should require periodic reporting
of net asset values and ensure that the Collective Investment Scheme (CIS) operator has
systems in place to calculate net assets value correctly.
4. CPSS-IOSCO Recommendations for Securities Settlement Systems: Neither the MAS
Electronic Payment System – Singapore Government Securities (MEPS-SGS), which clears
and settles SGS on a real time gross settlement basis – nor the Central Depository Private
Limited (CDP) – which clears and settles equities and private debt securities – is subject to
major vulnerabilities. While the MAS oversight objectives with respect to securities
settlement systems are set out in various documents, it is recommended that the MAS
publish a document on the oversight framework for securities settlement system and its
approach to its administration.
5. The transparency of monetary policy framework has improved substantially in recent years.
However, the authorities remain cautious about publishing certain information on the
monetary policy framework and monetary operations. For example, the weights used in the
trade-weighted exchange rate index or the precise limits of the band are NOT disclosed.
Similarly, the extent of MAS intervention in the foreign exchange is NOT disclosed on a
predetermined or timely schedule. Greater disclosure in these areas could be considered to
the extent it does not compromise the monetary policy regime. The MAS has made steady
progress toward improving transparency in financial policies in recent years and now meets
many of the elements of the Transparency Code. It could further improve transparency
through providing more detailed information on recent development in the financial sector
and its supervisory activities in its regular publications, including regarding local financial
institutions overseas operations.
Singapore’s financial competency is also reflected in the fact that it has closely followed
international best practices in accounting standards and disclosure. Under the Financial Reporting
Standards based on the International Accounting Standards, all listed companies with market

57
capitalization in excess of S$75 million are required to report quarterly financial results. Moreover,
all listed companies will be required by 2006 to change audit partners and change locally
incorporated banks to change audit firms every 5 years. Rules on mergers and acquisitions are also
aligned with international standards.
Despite its financial system’s high level of technical competence and institutional structure,
the MAS has to maintain close monitoring of risks from new financial products, the increasing
foreign operations of local banks and cross-border transactions. Updated information on
cross-border capital flows, for example, is vital for a timely assessment of the possible
vulnerability impacts it might have on the country’s financial sector.
Singapore’s CODE OF CORPORATE GOVERNANCE, which was released in April 2001,
came into full effect in January 2003. The Code sets out recommended corporate governance and
principles and practices in areas board composition, board performance, director’s remuneration,
accountability and communication with stockholders. The Council on Corporate Disclosure and
Governance was formed in 2002 to promote good corporate governance, strengthen the framework
of disclosure practices and reporting standards, and prescribe accounting standards in Singapore.
Since 2003, companies listed on the SGX have been required to disclose their corporate governance
practices and explain any deviation from the Code of Corporate Governance in their annual reports.
The MAS will also guidelines for local banks and direct insurers which will include additional
principles and guidance notes to enhance the roles played by the Boards and CEOs in carrying out
their duties toward depositors and policy holders.

58
TABLE-4. SELECTED FINANCIAL SOUNDNESS INDICATORS FOR THE FINANCIAL CORPORATE SECTOR IN SINGAPORE, 1996 - 2001
1996 1997 1998 1999 2000 2001
DEBT-EQUITY RATIO 0.8 0.9 1.0 0.8 0.8 0.8
TOTAL CORPORATE DEBT/GDP 1.4 1.5 1.8 1.6 1.5 1.7
CURRENT RATIO (CURRENT ASSETS / CURRENT
LIABILITIES)
1.0 1.0 1.0 1.0 1.1 1.1
RATIO OF SHORT TERM DEBT TO TOTAL DEBT 0.7 0.7 0.7 0.7 0.7 0.6
PROFITABILITY
RETURN ON ASSET (PRE-TAX, IN %) 6.6 5.6 3.7 5.3 6.0 3.8
RETURN ON EQUITY (PRE-TAX, IN %) 13.9 11.6 6.0 11.7 13.3 7.3
Source: Singapore Dept. of Statistics, as cited in IMF Country Report No. 04/140, 2005.

59
TABLE-5. FINANCIAL SOUNDNESS INDICATORS OF SINGAPORE’S COMMERCIAL BANKING SECTOR, 1998 – 2003
(in percent unless otherwise specified) 1998 1999 2000 2001 2002 2003 CAPITAL ADEQUACY Regulatory capital to risk-weighted assets (local banks) 1/
18.1 20.6 19.6 18.1 16.9 17.8
Regulatory capital to risk-weighted assets (foreign banks) 2/
11.3 11.8 11.3 11.3 11.3 …
Regulatory Tier 1 capital to risk-weighted assets (local banks) 1/
16.0 17.4 16.4 11.6 11.3 11.6
Regulatory Tier 1 capital to risk-weighted assets (foreign banks) 2/
7.2 7.3 7.3 7.5 7.7 …
Shareholder’s equity to assets (local banks) 10.0 11.0 10.0 10.0 11.0 11.0LOAN CONCENTRATION Bank Loans 28.1 31.2 35.4 30.0 29.3 25.7Non-bank loans of which: 71.9 68.8 64.6 70.0 70.7 74.3 Manufacturing loans 9.2 8.8 9.1 8.2 8.4 8.9 Building and construction loans 17.2 16.6 16.3 15.5 14.1 13.0 Housing loans 18.2 21.3 22.3 26.0 27.5 28.3 Loans to professional and private individuals
12.6 13.1 13.8 13.5 14.1 14.0
Loans to nonbank financial institutions 15.4 14.0 14.7 13.1 13.4 13.5LIQUIDITY (Singapore operations only) 6/ Liquid DBU assets to total DBU assets (local banks)
13.0 15.7 14.2 14.4 15.4 15.4
Liquid DBU assets to total DBU liabilities (local banks)
21.3 23.6 23.9 23.2 22.4 22.6
Total DBU deposits to total deposits (local banks)
74.5 75.4 71.7 70.3 71.8 71.9
Non-bank customers share of DBU deposits (local banks)
84.3 89.3 85.7 91.7 93.3 94.0
Liquid DBU assets to total DBU assets (foreign banks)
15.6 17.1 14.3 15.0 15.6 16.9
Liquid DBU assets to total DBU liabilities (foreign banks)
23.8 26.1 23.3 26.2 27.0 29.4
Source: MAS, as cited and culled from IMF Country Report No. 04/140 (2005). 1/ represents weighted average of 3 local banking groups and includes operations of foreign branches and subsidiaries. 2/ Data from a parent bank’s annual report on the entire group’s Tier 1 and total capital adequacy ratio. 6/ Liquid DBU assets include balances with the MAS, cash, SGS, and bills of exchange. Total DBU liabilities refer to the liabilities base used towards computing MAS minimum liquid assets requirement.

60
3.4 THE CASE OF THAILAND47 3.4.1 FINANCIAL SECTOR
The size of Thailand’s banking sector (relative to GDP) is still large by international
standards. That is, it exhibits a relatively high degree of reliance on banks compared to other
channels of financial intermediation. Despite significant post-AFC declines in bank lending, its
reliance on bank finance remains heavy compared to other countries. This scenario is expected to
remain relatively unchanged unless significant and rapid developments in the capital market take
place to outpace the growth of bank credit in the next few years. On the deposit side, the shift from
bank deposits to institutional investor deposits is taking place. Between 1997 and 2002, the growth
in institutional assets outpaced that of household deposits by more than 5 times [Disyatat and
Nakornthab, 2003]
Since the AFC, the share of deposits has increased substantially. Commercial banks have
reduced their reliance on foreign currency debt as a source of funds, accompanied by the
lengthening maturity profile of their borrowings. (Note that prior to the crisis, two-thirds of their
loans were short-term.) The decline in private credit in commercial banks’ asset portfolio has been
compensated for by higher investments in foreign assets and government securities. Their corporate
bond holdings have also been increasing [ibid.].
The World Bank [2005] reports that ‘the profitability of Thai commercial banks has continued
to improve and their balance sheets have gradually strengthened. Strong loan growth and wider
margin have been key contributing factors to the improvement in Thai banks’ profitability. Wider
margin was caused by the reduction in interest expense burden following the redemption of high
cost hybrid capital. Improved profits enabled Thai banks to accumulate their capital base and
increase their ability to absorb risk. However the performance varied between different sizes of
banks classified by the Bank of Thailand (BOT). While large banks reported higher return on assets
than medium and small banks, their asset quality appeared weaker as indicated by higher NPL ratios.
Profitability and capital adequacy ratios of medium banks were not as high, but their NPL ratios
were reported to be lower than large and small banks. The capital level of small banks was quite
strong with average Tier-1 capital above 14 percent of total risk assets.’
47 Significant portions of this report was sourced from World Bank’s Thailand Economic Country Monitor, 2005 and the IMF’s ROSC Corporate Governance Country Assessment Report for Thailand, June 2005. .

61
‘Several commercial banks increased their deposit and lending rates despite ample liquidity
in the banking system. The BOT estimated that as of May 2005, the aggregate excess liquidity in
the banking system was approximately Bt537 billion, higher than Bt452.4 billion, which was the
level as of December 2004. Approximately 58 percent of the aggregate excess liquidity was
concentrated in large banks while remaining banks had much less excess liquidity’ [ibid.].
In October 2005 the MOF’s proposal on a debt relief program for small individual debtors
was approved. Under the program, financial institutions will give 50 percent haircut on the
principals and 100 percent haircut on accumulated overdue interests to eligible debtors participating
in the program subject to their ability to meet the new payment obligations. Debtors can choose to
pay the remaining 50 percent amount all at once by June 2006 or apply for loans from the
Government Saving Bank (GSB) to pay back financial institutions and pay the installments to GSB
by June 2009. Individual debtors who are eligible for the program should have debt outstanding
with financial institutions, which are classified as non-performing loans as of June 2005.
In addition, to be eligible, the debt outstanding of each borrower should not exceed
Bt200,000 per each financial institution and the case should already be filed in court for legal
actions. 16 banks, 3 finance companies, and 6 AMCs, agreeing to participate in the program,
already signed the Memorandum of Understandings (MOUs) with the MOF. The program does not
appear to have a significant impact on financial institutions since the total debt outstanding of
eligible debtors are estimated to be less than 2 percent of NPLs of the financial system.
3.4.2 BOND MARKET
During the first half of 2005, fund raising activities in the bond market remained strong,
while those in the stock exchanges have moderated. The financial sector, including banks and
finance companies, have been quite active in mobilizing capital from the bond market since the
third quarter of 2004. On the other hand, public offering and private placement of shares by the
financial sector in the stock market have been limited during the period. In the non-financial sector,
firms in the property and energy and utility sectors have been quite active in mobilizing funds from
both the debt and equity markets since 2004. Firms in the transportation and construction material
sectors have been more active in raising funds from the bond than the equity market [ibid.].
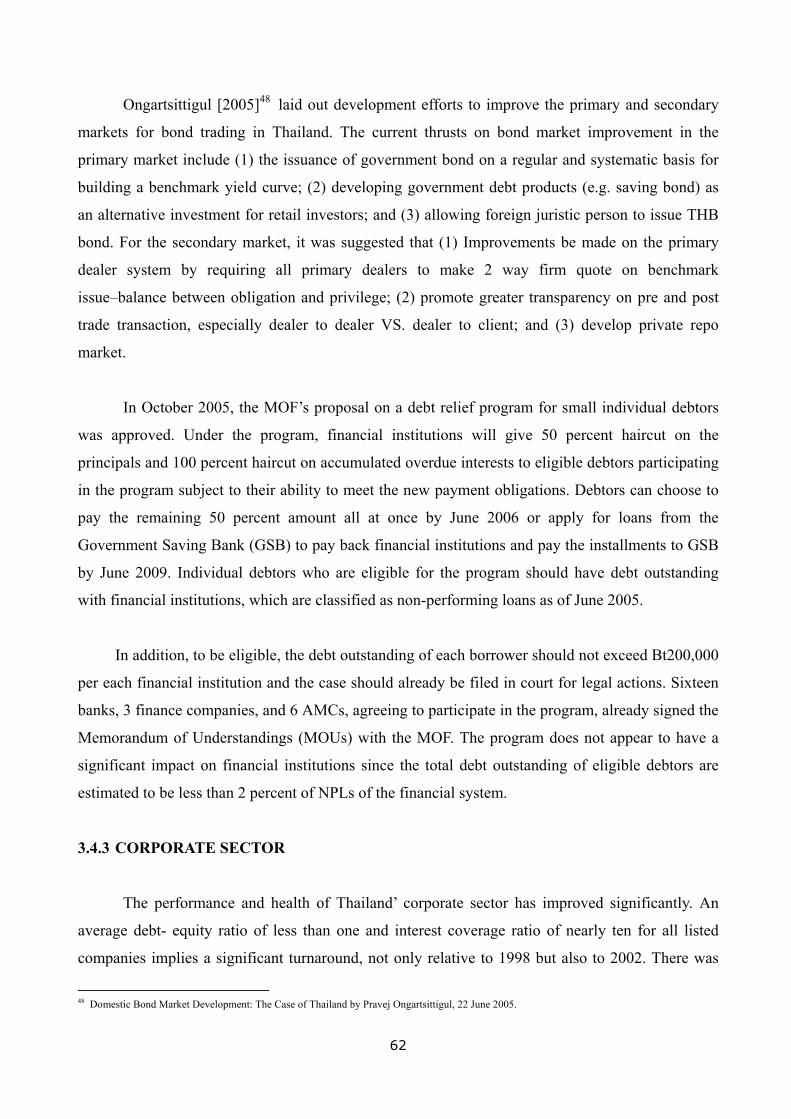
62
Ongartsittigul [2005]48 laid out development efforts to improve the primary and secondary
markets for bond trading in Thailand. The current thrusts on bond market improvement in the
primary market include (1) the issuance of government bond on a regular and systematic basis for
building a benchmark yield curve; (2) developing government debt products (e.g. saving bond) as
an alternative investment for retail investors; and (3) allowing foreign juristic person to issue THB
bond. For the secondary market, it was suggested that (1) Improvements be made on the primary
dealer system by requiring all primary dealers to make 2 way firm quote on benchmark
issue–balance between obligation and privilege; (2) promote greater transparency on pre and post
trade transaction, especially dealer to dealer VS. dealer to client; and (3) develop private repo
market.
In October 2005, the MOF’s proposal on a debt relief program for small individual debtors
was approved. Under the program, financial institutions will give 50 percent haircut on the
principals and 100 percent haircut on accumulated overdue interests to eligible debtors participating
in the program subject to their ability to meet the new payment obligations. Debtors can choose to
pay the remaining 50 percent amount all at once by June 2006 or apply for loans from the
Government Saving Bank (GSB) to pay back financial institutions and pay the installments to GSB
by June 2009. Individual debtors who are eligible for the program should have debt outstanding
with financial institutions, which are classified as non-performing loans as of June 2005.
In addition, to be eligible, the debt outstanding of each borrower should not exceed Bt200,000
per each financial institution and the case should already be filed in court for legal actions. Sixteen
banks, 3 finance companies, and 6 AMCs, agreeing to participate in the program, already signed the
Memorandum of Understandings (MOUs) with the MOF. The program does not appear to have a
significant impact on financial institutions since the total debt outstanding of eligible debtors are
estimated to be less than 2 percent of NPLs of the financial system.
3.4.3 CORPORATE SECTOR
The performance and health of Thailand’ corporate sector has improved significantly. An
average debt- equity ratio of less than one and interest coverage ratio of nearly ten for all listed
companies implies a significant turnaround, not only relative to 1998 but also to 2002. There was
48 Domestic Bond Market Development: The Case of Thailand by Pravej Ongartsittigul, 22 June 2005.

63
little change in ownership, and more investigation is needed to ascertain whether there was
significant operational restructuring in this process. Debt to equity (D/E) ratio of listed firms has
declined. The D/E ratio for the market declined from almost 1.5 times in 2002 to less than 1 in 2004.
The largest decline was in the construction sector in which the D/E ratio declined from 3.2 times in
1998 to 0.9 in 2004.
3.4.4 OTHER DEVELOPMENTS
The BOT’s initiative on voluntary out-of-court mediation framework has a small positive
impact on removing NPL overhang. At the closure of the CDRAC process in 2003, the BOT
introduced a voluntary mediation framework led by the CDRAC for private banks and AMCs to
accelerate debt restructuring for debtors in different stages of resolution, which would help lessen
the backlog of NPL cases in the Civil Courts. There are two groups of target debtors under this
framework: (1) cases that are in the court process; and (2) cases that are in the legal execution
process after court judgments are rendered.
The BOT had selected a target group of 136,728 cases with the value of Bt 426,843 million,
of which three-fifths are cases in the legal execution. In 20 months of operations through June 2005,
progress remains moderate. Creditors have selected only 8.9 percent of the total target debtors by
credit value, and only roughly half of the selected debtors have participated in the program. The
completion rate is 1.5 percent of the total target debtors by value, an insignificant improvement
from 0.18 percent completion rate in July 2003, 0.64 percent in December 2003, and 1.4 percent in
December 2004.
The court-supervised mediation, an alternative to trial in resolving NPLs, continues to be in
demand by small-medium-sized and consumer loans. The formal out-of-court mediation,
administered by the Mediation Center for Financial Disputes (MCFD), continues to be in demand
by creditors and debtors as an alternative to trial.
However, requests for mediation are mostly for small-medium-sized and consumer loans,
while the larger and more complex NPL cases are not actively utilizing the process. In 2003, a total
of 1,983 cases requested out-of-court mediation as compared to 1,476 cases in year 2002. At the end
of 2004, 2,372 cases were requested while 1,844 cases were successfully mediated, and court filings
withdrawn.

64
Corporatization of additional state-owned enterprises (SOEs) has taken place in 2005. The
Telephone Organization of Thailand (TOT) Corporation, CAT Telecom, and Electricity Generating
Authority of Thailand (EGAT) were corporatized this year. EGAT is currently awaiting its initial
public offering (IPO) in the Stock Exchange of Thailand, which should take place before the end of
this year. So far, seven SOES have been corporatized.
3.4.5 FINANCIAL SECTOR REFORMS The BOT has tightened the regulation on consumer lending. To curb excessive consumer
indebtedness, the BOT issued another regulation effective in July 2005 on consumer lending. Key
elements of the regulation include:
(i) Setting a definition of consumer lending subjected to the supervision by the BOT,
(ii) Strengthening the qualification of non-bank financial institutions, which can provide
consumer lending,
(iii) Reducing the ratio of loan amount to five times of average monthly salary of the
borrower (or average cash outstanding during the past 6 months in the borrower’s
deposit account); and
(iv) Putting a ceiling on total effective costs (including 15 percent interest rate, penalty fee,
service fee, and others) at 28 percent per annum. Lenders are required to disclose the
effective rates of their lending.
This regulation aims to curb excessive growth in debts of lower income households
especially from non-bank financial institutions and to provide consumer protection. However, this
could limit access to formal financial services by the lower income group, which could instead turn
to the informal source.
The BOT is in the process of strengthening the supervision regime of a financial
conglomerate on a consolidated basis, although it is constrained by the current law. The BOT
released in September 2005 a draft guideline on the consolidated supervision, and it is consulting
the industry on the draft guideline. The guideline will clearly define the scope of a banking group,
whose operations, including subsidiaries, affiliates, and other entities in which the group has
substantive holdings, will be subject to a consolidated supervision. The guideline will specify
intra-group transactions, required capital adequacy, and large exposure on a consolidated basis. The
guideline will initially be implemented on a pilot basis for one year to ensure a smooth transition to

65
a full implementation.
In preparation for the full implementation of the Basel II, the BOT has developed specific
measures for each of the three pillars, namely, minimum capital requirement, supervisory review,
and market discipline. A series of consultative papers with specific policies and guidelines have
been released for industry comments and the public hearing by 2005. The BOT has continued its
bilateral dialogue with commercial banks to ensure their readiness to adopt the Basel II. Its bank
supervisors are being prepared through intensive training programs.
A number of prudential guidelines to strengthen bank’s risk management in the areas of
internal rating system, loan portfolio management, credit scoring, risk model validation and credit
and market risk stress testing have been issued. These tools should enable banks to better manage
their risk and price loans according to customers’ risk profile. The BOT targets the full
implementation of Basel II by the end of 2008. Meanwhile, all financial institutions are required to
submit by June 2006 their Basel II implementation plans for the BOT’s approval.
The Department of Insurance (DOI) has recently completed the initial self-assessment on the
supervision and regulation of the insurance industry in Thailand benchmarked against the IAIS
Insurance Core Principles (28 ICPs). The preliminary self-assessment revealed that 11 ICPs are
largely observed, 1 are observed, 12 are partially observed, 3 are not observed, and one is not
applicable. The DOI has proposed legislative amendments and prepared an action plan to strengthen
the supervisory and regulatory regime for insurance industries, especially in the capital adequacy
and solvency and various governance principles. Three principles not observed are related to
various corporate governance aspects including the corporate governance, suitability of persons,
and risk assessment and management.
The DOI plans to issue in 2006, in consultation with the industry, the guideline on corporate
governance based on best practices. Since the industry still lacks an adequate market infrastructure
and technical expertise, the industry will be given a transition period to a full implementation of the
guideline. In parallel, the DOI plans to reinforce the “Fit and Proper” management of insurance
companies by introducing the Standards of Sound Business and Financial Practices.
The Anti-Money Laundering Office (AMLO) is in the process of requiring non-financial
institutions to report suspicious transaction to restrain money laundering activities as well as

66
proposing amendments to the Anti-money Laundering Act. On July 2005, the AMLO organized a
public hearing for adding a new section to Article 1639. This new article 16/1 states that
non-financial businesses namely jewelers/gold shops and car dealers will have to report to AMLO
in a prompt manner of suspicious transactions such as a non-regular spending over Bt400,000
and/or paying cash in small bills or the cases in which customers refuse to provide identification.
Failure to report can result in a fine of Bt300,000 per account.
In addition, the AMLO has proposed amendments to the Anti-money Laundering Act to
include more offences and to give the AMLO more authorities for the arrestment and investigation.
The offences proposed to be added in the law include offences relating to natural resources, the
environment, wildlife, foreign exchange, gambling, weapons of war, labor fraud, bidding collusion,
share manipulation and excise tax. The amendment is currently pending approval by the Cabinet.
By end-2005, Thailand Security Depositary Company (TSD), a subsidiary of the Stock
Exchange of Thailand (SET), will be responsible for clearing and settling trading of government
securities. Currently, the BOT settles trading of government securities, while some trading of
corporate bonds is settled by the TSD. TSD also clears and settles equities traded on the stock
exchanges. The transfer of responsibilities for clearing and settlement of government securities
from the BOT to TSD is the Phase I of the Bond Market Committee’s plan to centralize the
depository, clearing, and settlement functions for all securities at the TSD.
Phase II is to consolidate those of corporate bonds at TSD. Ultimately TSD will assume
collateral management functions for securities borrowing and lending transactions. This should lead
to a more efficient clearing and settlement system. The trading of government securities at TSD will
be settled on a Real Time Gross Settlement (RTGS). Securities will be delivered through the TSD’s
system simultaneously with the payment transfer through the BOT’s Bahtnet facility (DVP). In
addition, the Committee also decided to consolidate the trading platforms of all securities to be
under the SET. This should help eliminate the potential conflict of interest for Thai BDC, which has
become a Self Regulatory Organization (SRO) for the bond market if it is allowed to compete with
other operators.
Thailand is negotiating the liberalization of financial services under the Thailand-US Free
Trade Agreement (FTA) framework. Under the FTA, the US requests for free market access to
investment and trade in financial services especially in the insurance and mutual fund industries and
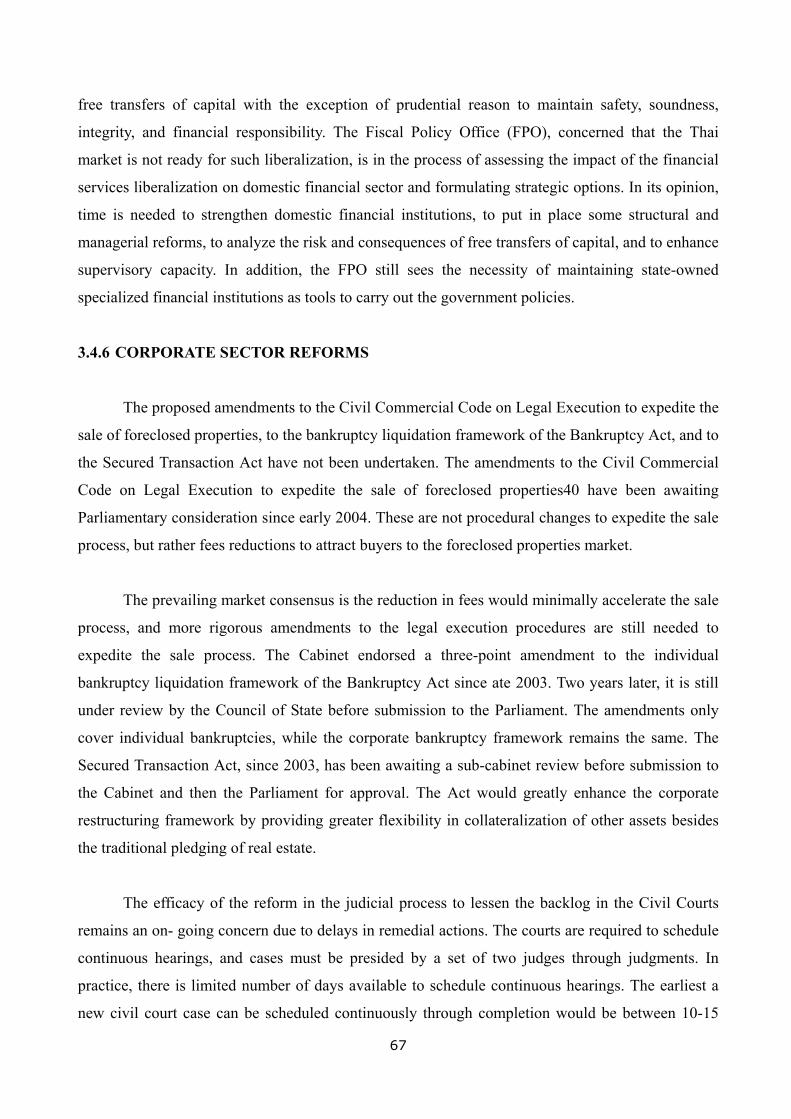
67
free transfers of capital with the exception of prudential reason to maintain safety, soundness,
integrity, and financial responsibility. The Fiscal Policy Office (FPO), concerned that the Thai
market is not ready for such liberalization, is in the process of assessing the impact of the financial
services liberalization on domestic financial sector and formulating strategic options. In its opinion,
time is needed to strengthen domestic financial institutions, to put in place some structural and
managerial reforms, to analyze the risk and consequences of free transfers of capital, and to enhance
supervisory capacity. In addition, the FPO still sees the necessity of maintaining state-owned
specialized financial institutions as tools to carry out the government policies.
3.4.6 CORPORATE SECTOR REFORMS
The proposed amendments to the Civil Commercial Code on Legal Execution to expedite the
sale of foreclosed properties, to the bankruptcy liquidation framework of the Bankruptcy Act, and to
the Secured Transaction Act have not been undertaken. The amendments to the Civil Commercial
Code on Legal Execution to expedite the sale of foreclosed properties40 have been awaiting
Parliamentary consideration since early 2004. These are not procedural changes to expedite the sale
process, but rather fees reductions to attract buyers to the foreclosed properties market.
The prevailing market consensus is the reduction in fees would minimally accelerate the sale
process, and more rigorous amendments to the legal execution procedures are still needed to
expedite the sale process. The Cabinet endorsed a three-point amendment to the individual
bankruptcy liquidation framework of the Bankruptcy Act since ate 2003. Two years later, it is still
under review by the Council of State before submission to the Parliament. The amendments only
cover individual bankruptcies, while the corporate bankruptcy framework remains the same. The
Secured Transaction Act, since 2003, has been awaiting a sub-cabinet review before submission to
the Cabinet and then the Parliament for approval. The Act would greatly enhance the corporate
restructuring framework by providing greater flexibility in collateralization of other assets besides
the traditional pledging of real estate.
The efficacy of the reform in the judicial process to lessen the backlog in the Civil Courts
remains an on- going concern due to delays in remedial actions. The courts are required to schedule
continuous hearings, and cases must be presided by a set of two judges through judgments. In
practice, there is limited number of days available to schedule continuous hearings. The earliest a
new civil court case can be scheduled continuously through completion would be between 10-15

68
months. With the existing volume of more than 72,000 civil cases awaiting court judgments, the
possibility of an accelerated NPL resolution is remote.
The institutional arrangement to carry out comprehensive legal reform is unclear. In July
2004, the Prime Minister established a new national committee, the National Legal Framework and
Policy Committee (NLFPC) to replace the Legal Reform Committee for Development of Thailand
(LRC). The Prime Minister chairs the NLFPC, most committee members drawn from the LRC, and
with virtually the same mandate as the LRC. In practice, it is still unclear as to the objectives,
missions and activities of the committee. Since its inception, the NLFPC has convened two
meetings to establish several sub-committees, mandated responsible line ministries to review and
submit suggestions for legal changes of the laws under their authorities. However, the scope of the
review and the specific laws to be reviewed were not identified at the meetings.
3.4.7 CORPORATE GOVERNANCE ROSC
The recently completed corporate governance Report on Observance of Standards and Codes
(ROSC) for Thailand indicates that Thailand’s corporate governance practices are improving, but
further reform is required [see TABLE-6]. The ROSC provides a benchmark for the observance of
corporate governance practices against the OECD Principles of Corporate Governance.
The corporate governance ROSC on Thailand concludes that the corporate governance
framework and actual practices of listed companies are generally either “largely observing” or
“partially observing” the OECD Principles of Corporate Governance. There is, however, room for
improvement to achieve full observance of OECD principles. The overall average score for
observance of 32 OECD principles and sub-principles is 68 out of 100. Based on corporate
governance ROSCs completed for several Asian countries at various times during the 2001-2005
period, Thailand’s corporate governance framework and practices generally rank higher than those
in Indonesia and the Philippines but lower than those in India and Korea.
While Thailand has made significant progress in improving the corporate governance
framework and corporate governance practices since the crisis, the reform agenda remains
incomplete [See TABLE-7 for a comprehensive account of current and future reforms]. In recent
years, significant corporate governance reforms have been introduced and are underway, including
reforms in the structure and function of the board of directors of listed companies, the establishment

69
of the Thai Institute of Directors Association and the Department of Special Investigation, the
adoption by the SET of 15 Principles of Good Corporate Governance, and draft legislation to
reinforce the rights of minority shareholders.
In addition, the SEC has improved its monitoring of financial statements of listed companies
and stepped up enforcement efforts and increased sanctions for violations. Most recently, the SEC
has supported issuance of a Directors’ Handbook and the establishment of a Director Registry
System. The ICAAT also has intensified its efforts to improve skills and knowledge of accountants
and auditors. In the area of financial reporting and disclosure, Thailand has announced a plan to
fully adopt international accounting standards by 2006.
While these are commendable efforts, the reform agenda remains incomplete, both in terms
of legislative and regulatory reform, and in terms of changes in practices. Progress in revising
relevant laws including the Public Limited Companies Act (PCA) and Securities and Exchange Act
(SEA) and the drafting of class action lawsuits has been slow. Further steps need to be taken to
improve corporate governance in Thailand, including enhancing protection of shareholder rights,
particularly, the introduction of cost-effective legal channels for shareholders seeking redress. Focus
should remain on the implementation and completion of the legislative and regulatory agenda,
improving enforcement (prosecution process), enhancing financial reporting and disclosure
consistent with international standards, and promoting business ethics and best practices.
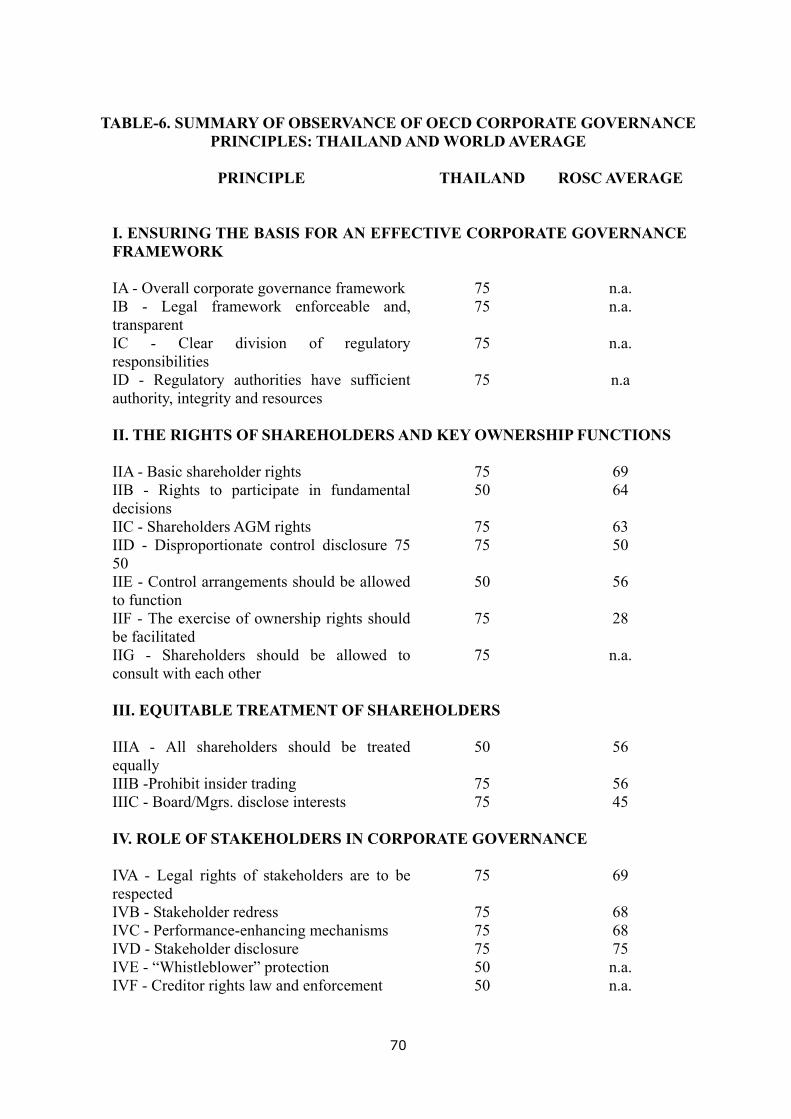
70
TABLE-6. SUMMARY OF OBSERVANCE OF OECD CORPORATE GOVERNANCE
PRINCIPLES: THAILAND AND WORLD AVERAGE
PRINCIPLE
THAILAND ROSC AVERAGE
I. ENSURING THE BASIS FOR AN EFFECTIVE CORPORATE GOVERNANCE FRAMEWORK IA - Overall corporate governance framework 75 n.a. IB - Legal framework enforceable and, transparent
75 n.a.
IC - Clear division of regulatory responsibilities
75 n.a.
ID - Regulatory authorities have sufficient authority, integrity and resources
75 n.a
II. THE RIGHTS OF SHAREHOLDERS AND KEY OWNERSHIP FUNCTIONS IIA - Basic shareholder rights 75 69 IIB - Rights to participate in fundamental decisions
50 64
IIC - Shareholders AGM rights 75 63 IID - Disproportionate control disclosure 75 50
75 50
IIE - Control arrangements should be allowed to function
50 56
IIF - The exercise of ownership rights should be facilitated
75 28
IIG - Shareholders should be allowed to consult with each other
75 n.a.
III. EQUITABLE TREATMENT OF SHAREHOLDERS IIIA - All shareholders should be treated equally
50 56
IIIB -Prohibit insider trading 75 56 IIIC - Board/Mgrs. disclose interests 75 45 IV. ROLE OF STAKEHOLDERS IN CORPORATE GOVERNANCE IVA - Legal rights of stakeholders are to be respected
75 69
IVB - Stakeholder redress 75 68 IVC - Performance-enhancing mechanisms 75 68 IVD - Stakeholder disclosure 75 75 IVE - “Whistleblower” protection 50 n.a. IVF - Creditor rights law and enforcement 50 n.a.

71
PRINCIPLE
THAILAND ROSC AVERAGE
V. DISCLOSURE AND TRANSPARENCY VA - Disclosure standards 75 73 VB - Accounting standards 50 77 VC - Independent audit annually 75 66 VD - External auditors should be accountable to the shareholders
75 n.a
VE - Fair & timely dissemination 75 67 VF - Research conflicts of interests 75 n.a. VI. RESPONSIBILITIES OF THE BOARD VIA - Acts with due diligence, care 50 55 VIB - Treat all shareholders fairly 75 49 VIC - High ethical standards 50 68 VID - The board should fulfill certain key functions
50 46
VIE - The board should be able to exercise objective judgment
50 41
VIF – Access to information 75 68 Source: World Bank. June 2005. Report on the Observance of Standards and Codes Corporate Governance Country Assessment – Thailand.

72
TABLE-7. THAILAND’S FINANCIAL AND CORPORATE SECTOR REFORM: OBJECTIVES AND MEASURES
OBJECTIVE MEASURES A. Enable sharing of credit information among financial Institutions
Measures taken over last 6 months and their significance: • The House of Representatives endorsed in September 2005 the proposed amendments to the Credit Information Business Act. The enactment of the proposed amendments will reduce onerous legal risk for the Credit Bureau and their members and provide more flexibility for the operations of Credit Bureau. The current Act, effective in 2003, has many positive attributes but mandates large fines and criminal penalties against the bureaus or their members for all violations, including negligence. Notifications issued by the Credit Information Protection Committee and the legal opinion issued by the Council of State subsequent to the enactment of the Act helps reduce legal liabilities imposed by the law. However the proposed amendment still limits the types of business that the Credit Bureau can offer. The Senate ad-hoc Committee is considering the draft amendment. • The legal process for a merger of the Central Credit Information Service Co., Ltd. and Thai Credit Bureau has been completed. The newly merged credit bureau was renamed National Credit Bureau. Credit databases have now grown to more than 20 million accounts, covering more than 10 million consumers.
B. Formulate and implement a medium-term strategy for Thai financial sector
Measures taken over last 6 months and their significance: • A preliminary draft Master Plan for Grass-Root Financial Services has been completed. The draft Master Plan was prepared by the Microfinance System Development Committee (MSDC), which is chaired by the Finance Minister and its members comprise of representatives from concerned agencies. The Master Plan has three strategic focuses: (1) strengthening microfinance intermediaries and their human resource and improving their service providing capacities, (2) rationalize role and responsibilities of the government agencies involved in microfinance intermediation, and (3) fostering the microfinance network for sharing of experience. The MSDC will organize a public hearing on the draft Master Plan in mid November. Measures to be taken in the next 6-12 months: • The Master Plan for Grass-Root Financial Services will be submitted to the Finance Minister for his approval. The drafted Master Plan is currently under the consideration by
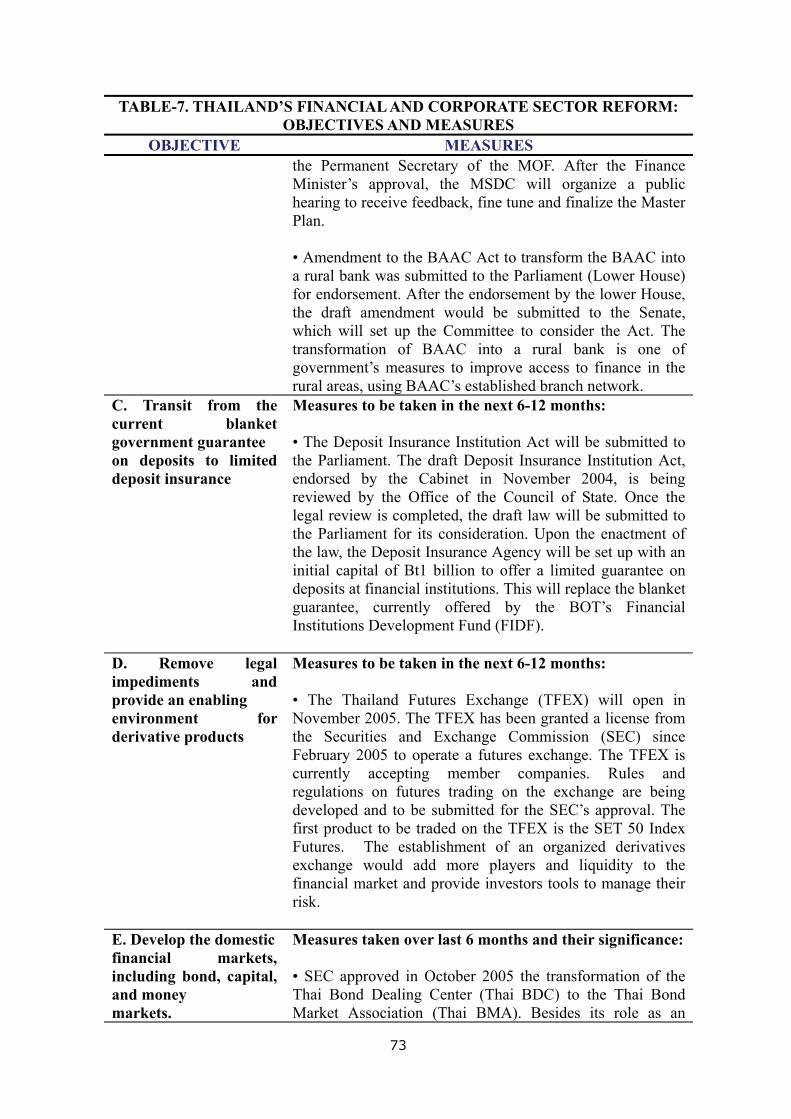
73
TABLE-7. THAILAND’S FINANCIAL AND CORPORATE SECTOR REFORM: OBJECTIVES AND MEASURES
OBJECTIVE MEASURES the Permanent Secretary of the MOF. After the Finance Minister’s approval, the MSDC will organize a public hearing to receive feedback, fine tune and finalize the Master Plan. • Amendment to the BAAC Act to transform the BAAC into a rural bank was submitted to the Parliament (Lower House) for endorsement. After the endorsement by the lower House, the draft amendment would be submitted to the Senate, which will set up the Committee to consider the Act. The transformation of BAAC into a rural bank is one of government’s measures to improve access to finance in the rural areas, using BAAC’s established branch network.
C. Transit from the current blanket government guarantee on deposits to limited deposit insurance
Measures to be taken in the next 6-12 months: • The Deposit Insurance Institution Act will be submitted to the Parliament. The draft Deposit Insurance Institution Act, endorsed by the Cabinet in November 2004, is being reviewed by the Office of the Council of State. Once the legal review is completed, the draft law will be submitted to the Parliament for its consideration. Upon the enactment of the law, the Deposit Insurance Agency will be set up with an initial capital of Bt1 billion to offer a limited guarantee on deposits at financial institutions. This will replace the blanket guarantee, currently offered by the BOT’s Financial Institutions Development Fund (FIDF).
D. Remove legal impediments and provide an enabling environment for derivative products
Measures to be taken in the next 6-12 months: • The Thailand Futures Exchange (TFEX) will open in November 2005. The TFEX has been granted a license from the Securities and Exchange Commission (SEC) since February 2005 to operate a futures exchange. The TFEX is currently accepting member companies. Rules and regulations on futures trading on the exchange are being developed and to be submitted for the SEC’s approval. The first product to be traded on the TFEX is the SET 50 Index Futures. The establishment of an organized derivatives exchange would add more players and liquidity to the financial market and provide investors tools to manage their risk.
E. Develop the domestic financial markets, including bond, capital, and money markets.
Measures taken over last 6 months and their significance: • SEC approved in October 2005 the transformation of the Thai Bond Dealing Center (Thai BDC) to the Thai Bond Market Association (Thai BMA). Besides its role as an

74
TABLE-7. THAILAND’S FINANCIAL AND CORPORATE SECTOR REFORM: OBJECTIVES AND MEASURES
OBJECTIVE MEASURES information center, Thai BMA will function as a self
regulatory organization for the bond market. Its current roles include (i) disseminate quotations, reference prices and closing prices of marking-to-marking information; (ii) perform the duties of market monitoring and surveillance; (iii) be the center of bond information and market standards and conventions; (iv) develop financial tool, analytical tool, and training courses for the bond market; and (v) facilitate the discussion on the bond market development. Measures to be taken in the next 6-12 months: • The BOT targets to launch the Master Plan for the Development of Money and Foreign Exchange Markets in Thailand by the second quarter of 2006. The BOT is taking the lead to formulate, on a consultative basis, a three-year plan, which will compliment the Financial Sector Master Plan. Its objectives are to improve the efficiency of financial intermediaries, broaden the range of financial instruments, and streamline regulations related to the money and foreign exchange markets in Thailand. The BOT expects to have a preliminary draft master plan by the end of the year, once the investigation and identification of problems facing Thailand’s financial markets have been concluded. A public hearing will be organized to streamline the Plan before its final launch early the second quarter of 2006. • By the end of the year (2005), Thailand Security Depositary Company (TSD) will be responsible for clearing and settling trading of government securities, which is currently performed by the BOT. This is the phase I of the Bond Market Committee’s plan to centralize the depository, clearing, and settlement functions for all securities at TSD. Phase two is to consolidate those of corporate bonds at TSD. Ultimately TSD will be able to assume a collateral management function, especially of securities borrowing and lending activities. This should lead to a more efficient clearing and settlement system. • The Thai Bond Market Association (BMA) will develop pricing models and a market/model convention to price new complex derivatives products and illiquid bonds. Thai BMA has been assigned by the sub-committee of the Bond Market Committee to develop pricing models and a market/model convention to price illiquid bonds and their complex derivatives, which is expected to be completed early next year. Appropriate valuation of bonds and their derivatives is

75
TABLE-7. THAILAND’S FINANCIAL AND CORPORATE SECTOR REFORM: OBJECTIVES AND MEASURES
OBJECTIVE MEASURES critical to further development of the Thai bond market. However limited market liquidity and not well-functioning market-making mechanism make the task of Thai BMA in providing fair value of bonds and their derivatives challenging.
F. Rationalize state holding of specialized financial institutions, state owned enterprises, and state commercial banks
Measures taken over the last 6 months and their significance: • SME bank has taken an initial step to implement a Public Service Account (PSA). The SME bank has proceeded with an initial implementation of the PSA by separating social and commercial activities on its income statement since early 2005. It has yet to separate accounts on its balance sheet. A public service account reports costs and performance of social mandate activities in separation from commercial activities. This is an initial step to improve the transparency of financial reports by specialized financial institutions (SFIs). By properly costing and budgeting socially mandate activities, the MOF can hold SFIs accountable for costs and benefits. The FPO has yet to finalize its proposal and a definite timeframe for the implementation of the PSA by remaining state owned financial institutions. Currently through the electronic information transfer, FPO can receive timely financial reports from all SFIs.
G. Enable corporate sector restructuring through reduced fees on the sale of foreclosed properties and streamlined the “buyer-take-possession” procedure following the sale of foreclosed properties
Measure taken over the last 6 months and their significance: • In September 2005, the Revenue Department announced new tax incentives for the purchase of pre-owned residential properties. The incentives in the forms of reduced property transfer fees and reduced tax rates are intended to attract home buyers to the secondary residential property market, and also to promote the home mortgage financing for the financial sector. The measure was made effective retroactive to January 2005 and will expire December 2006. Measure to be taken in the next 6-12 months: • The amendments to Code of Civil Procedures on Legal Execution to reduce the fees on the sale of foreclosed properties, and to allow for an immediate “buyer-take-possession” following the sale of foreclosed properties are awaiting Parliamentary approval. The amendments would lower the fees of 5 percent for properties auctioned, 3.5 percent for property discharging, and 5% for

76
TABLE-7. THAILAND’S FINANCIAL AND CORPORATE SECTOR REFORM: OBJECTIVES AND MEASURES
OBJECTIVE MEASURES sales not through the auction by at least half in each category. Although these are not procedural reforms to streamline the auction process, it is expected that the lower fees would attract more buyers to the foreclosed properties market. Similarly, the immediate “buyer-take-possession” would eliminate the redundant requirement for the buyer to petition and obtain court order to transfer legal ownership of the properties, thus, reducing the transaction cost and time for both the seller and the buyer. The Ministry of Justice expects the Parliament to approve the amendments during the current Parliamentary session. Measures planned to be taken, but have been delayed indefinitely or have been cancelled: • The draft amendments to the Asset Management Corporate Act (AMC Act) to allow the Government AMC to purchase distressed assets from private financial institutions have been withdrawn from Parliamentary consideration. The amendments to allow private banks and AMCs to sell their distressed assets to the Government AMC were intended to accelerate the resolution of distressed assets in private banks, and at the same time to lessen their bad debt portfolios and reduce the level of NPLs in the financial system. • The Courts of Justice’s proposed remedial actions to lessen the backlog of cases in the Civil Court have not been approved. The Courts of Justice has proposed establishing special hours for trial, increasing the number of judges, and increasing budgetary resources for the Civil Courts, but after two years the proposals have not gained approval from the Judicial Commission. • The Secured Transaction Act has not been reviewed by the Joint Senate-House of Representatives Committee. The law would allow for more flexible collateralization of liquid assets other than the traditional real estate properties. Thus providing both creditors and debtors with more legal options in securing new credits as well as in debt restructuring. The draft law was approved by the Cabinet in mid-2003 and was submitted to the Parliament shortly thereafter. It is still awaiting review by the Joint Senate- House of Representatives Committee.
Source: World Bank’s Thailand Economic Monitor November 2005.
77
3.5 THE CASE OF THE PHILIPPINES
In the aftermath of the AFC, initial assessment pointed out that, comparatively, the Philippine
economy was not as badly hit as its Asian neighbors such as Indonesia or Thailand. So the
government then felt that it need not embark on adopting comprehensive policies to resolve the
banking crisis or undertake reform efforts of proportions similar to those undertaken by Thailand,
for example. It helped that the Philippines has already undergone a series of reforms during the late
80s and early part of the 90s. Analysts have noted that such reforms must have cushioned the AFC
blow to a significant extent. In addition, the country’s banking industry has favorable features
including, (1) well trained employees, (2) deep (but sometimes superficial) influence of American
style banking , and (3) bankers are basically conservative. Still, financial sector reform policies
were conducted to strengthen the banking sector and enhance the supervisory and regulatory
framework.
Prudential regulation standards were upgraded to conform to international standards.
Revisions were made to make some regulations more relevant – for example, the single-borrower
limits of deposit-taking nonbank financial institutions were made consistent with those of
commercial banks. Changes were also allowed to enable the Bangko Sentral ng Pilipinas (BSP) to
identify the problem banks and to take measures to enforce prudential requirements. Furthermore,
to promote risk management, sensitivity was added to market risks as another component of the
CAMEL ratings.49
It also acted to strengthen the financial sector infrastructure (i.e. the BSP hired international
consultants to modernize on-site examinations) and to upgrade human resources. One problem that
remained however was the level of non-performing loans of local commercial banks which
increased continuously since 1997 and reached to more than 18 percent of all loans in 2001. Due to
deteriorating loan quality and increasing market competition, mergers ensued.50
In order to address the objective of strengthening banks by raising capital and encouraging
consolidation, the BSP issued amendments to its risk-based capital framework to incorporate market
49 See Kishi and Okuda [n.d.]. 50 Equitable Bank merged with Philippine Commercial International Bank in 1999. In 2000, Bank of the Philippine Islands, Prudential Bank, Global Business Bank, Bank of Commerce, Metrobank, and Security Bank merged with Far East Bank and Trust Company, Pilipinas Bank, Asian Bank & Philbanking, Traders Royal Bank, Solidbank, and Federal SMBank, respectively. [ibid.].

78
risk and expand the coverage to include quasi-banks.51 Guidelines were issued as well on the
capital treatment of credit-linked notes and similar credit derivative products. BSP rules and
regulations were also issued governing the use of banks’ internal credit risk rating systems to ensure
the soundness and effectiveness of credit risk management processes. Thrift banks, which were
allowed to operate foreign currency deposit units (FCDUs), were given two years from March 2002
to comply with the minimum FCDU capital requirements.52
3.5.1 THE BANKING SECTOR [see TABLE-8]
Kishi and Okuda [n.d.] identified a number of factors, which contributed to the problem of
weak bank regulations and supervision. Among these are (1) the overexposure of a bank to DOSRI
and insufficient transparency of DOSRI loans; (2) weak guidelines on restructured loans of banks,
(3) insufficient ability of BSP supervision staff, (3) limited report requirement on interest rates of
banks, (4) bank secrecy law makes it impossible for BSP and PDIC examiners to verify individual
deposit balances.
Hence, to address these multitude of problems and tighten provisioning requirements and
regulatory oversight, the BSP issued regulations regarding the management of large exposures,
credit risk concentrations, single borrower limits, connected and/or related party transactions and
other governance-related measures. Regarding foreclosed assets, banks were required to re-appraise
values every two years, beginning 2002. Provisioning requirements were rationalized with further
differentiation depending on security, risk and status, but in general, they remain low.
In order to level the playing field between peso and foreign currency intermediation,
regulatory issuances included guidelines on the conversion and transfer of foreign-currency
denominated loans and foreclosed assets on the books of FCDUs/EFCDUs to peso loans and
foreclosed assets on the books of a regular banking unit.
To deal effectively with problem banks, the General Banking Act of 2000 increased the
BSP’s capacity to take prompt corrective action on the matter. The Philippine Deposit Insurance
Company’s (PDIC) charter was amended in July 2004, strengthening its ability to deal with problem
banks. Stress testing of commercial banks is now being undertaken to determine how banks would
51 This was undertaken in March 2004 and September 2003, as per IMF (2005) accounts. 52 This was taken from an IMF report (2005) on the Philippines’ Progress on Structural Reform Agenda.

79
react to various scenarios. Results are relayed to concerned banks that maybe required to take
remedial action.
A legal framework was established to encourage banks to sell nonperforming assets to third
parties. In January 2003, the Special Purpose Vehicle (SPV) Act was passed. In March 2004, the
Securitization Act was passed, providing scope for the strengthening of the SPV framework. The
Bureau of Internal Revenue (BIR) also issued SPV tax incentives in June 2004. As of September
2004, the BSP has issued sixty-eight certificates of Eligibility (COE) to 18 banks, creating a scope
for NPA transfers totaling PhP4.5 billion. Three banks have pending COE applications involving
PhP10.1 billion worth of nonperforming assets (NPAs). Thirty-six SPVs have registered with the
Securities and Exchange Commission (SEC), and availment of incentives under the SPV Law is
finally gaining momentum.
As regards taxes, the Documentary Stamp Tax (DST) Law rationalizing the taxation of
debt and equity instruments was signed into law under R.A. 9243 on February 2004. Value-added
tax on financial transactions and taxation of FCDU/OBUs, which took effect in 2003, were
repealed.
To strengthen corporate governance, the BSP implemented Circular No.456 (dated October 4,
2004) ensure the proper management of banking operations. It required banks to have:
1. An audit committee to provide oversight of the banks’ financial reporting, control, and
internal/external audit functions;
2. Corporate governance committee, tasked to review and evaluate the qualifications of all
persons nominated to the board as well as those nominated to other positions requiring
appointment by the board of directors, and ensure the board’s effectiveness and due
observance of corporate governance principles and guidelines.
3. Risk management committee to be responsible for the development and oversight of banks’
risk management program.
3.5.2 THE CORPORATE SECTOR
The SEC is minimizing debt-restructuring incidents by (1) imposing more stringent
requirements on financial disclosure, bringing the accounting system up to international standards;
(2) regulating external auditors more closely; (3) implementing the Code of corporate governance,
80
which applies to all corporations (domestic or foreign) whose securities are registered or listed. The
Code requires these corporations to formulate, submit (to SEC) and adopt a Manual of Corporate
Governance. These Manuals are given to directors and subject to inspection by stockholders, and
are to be adhered to under penalty of law.
The passage of the Securitization Act in March 2004 facilitated restructuring by permitting
asset management companies to finance their acquisitions of distressed assets through capital
markets and institutional investors. This Act is also expected to contribute to the development of
corporate bonds market by overcoming the problems of small size and low credit quality of most
issuers.
A Financial Sector Forum (composed of the SEC, BSP, Insurance Commission and PDIC)
was established as a voluntary cooperative endeavor of the concerned agencies to provide an
institutionalized framework for coordinating supervision and regulation, while preserving each
agency’s mandate. The FSF has three target areas:
1. The harmonization and coordination of supervisory and regulatory methods and policies,
identification and filling in of gaps and elimination of overlapping functions in the current
supervisory regime;
2. Reporting and information exchange and dissemination; and
3. Consumer protection and education to curb unethical and unlawful business practices and
reduce the incidence of financial scams.
Steps were also undertaken to improve the compliance, enforcement and surveillance capabilities of
the Philippine Stock Exchange (PSE). The SEC approved PSE’s new rules for listed companies
under corporate rehabilitation in December 2004.
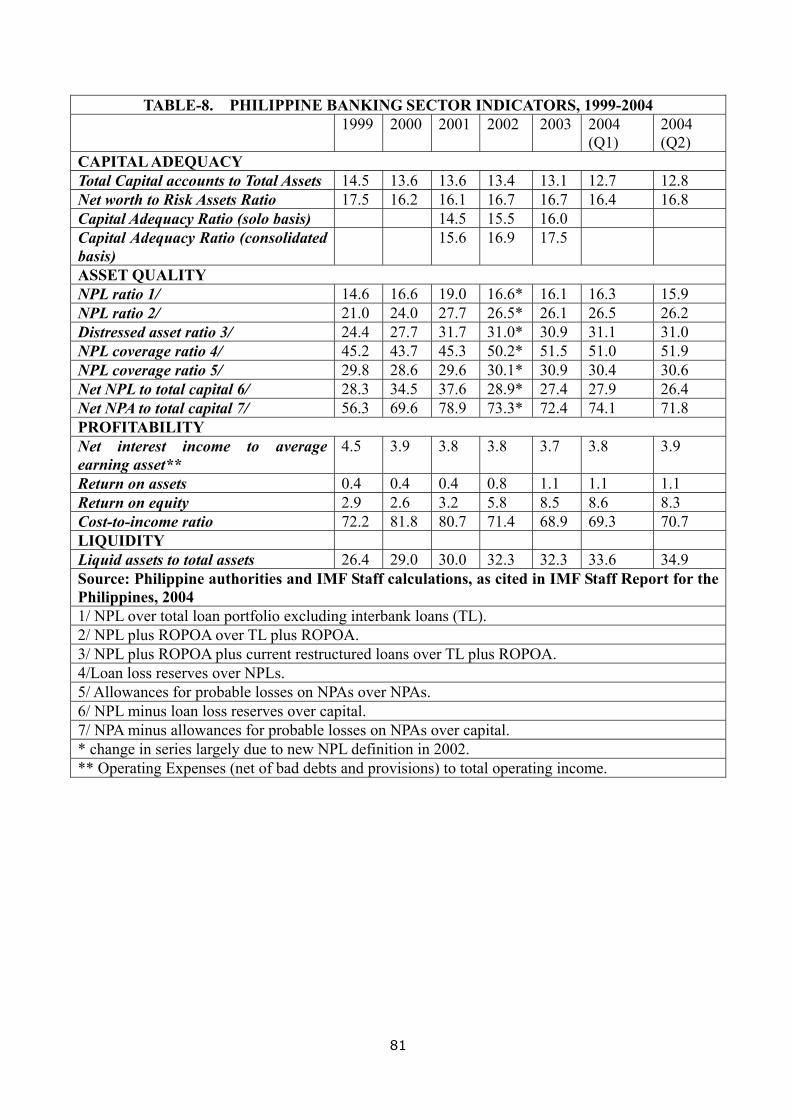
81
TABLE-8. PHILIPPINE BANKING SECTOR INDICATORS, 1999-2004 1999 2000 2001 2002 2003 2004
(Q1) 2004 (Q2)
CAPITAL ADEQUACY Total Capital accounts to Total Assets 14.5 13.6 13.6 13.4 13.1 12.7 12.8 Net worth to Risk Assets Ratio 17.5 16.2 16.1 16.7 16.7 16.4 16.8 Capital Adequacy Ratio (solo basis) 14.5 15.5 16.0 Capital Adequacy Ratio (consolidated basis)
15.6 16.9 17.5
ASSET QUALITY NPL ratio 1/ 14.6 16.6 19.0 16.6* 16.1 16.3 15.9 NPL ratio 2/ 21.0 24.0 27.7 26.5* 26.1 26.5 26.2 Distressed asset ratio 3/ 24.4 27.7 31.7 31.0* 30.9 31.1 31.0 NPL coverage ratio 4/ 45.2 43.7 45.3 50.2* 51.5 51.0 51.9 NPL coverage ratio 5/ 29.8 28.6 29.6 30.1* 30.9 30.4 30.6 Net NPL to total capital 6/ 28.3 34.5 37.6 28.9* 27.4 27.9 26.4 Net NPA to total capital 7/ 56.3 69.6 78.9 73.3* 72.4 74.1 71.8 PROFITABILITY Net interest income to average earning asset**
4.5 3.9 3.8 3.8 3.7 3.8 3.9
Return on assets 0.4 0.4 0.4 0.8 1.1 1.1 1.1 Return on equity 2.9 2.6 3.2 5.8 8.5 8.6 8.3 Cost-to-income ratio 72.2 81.8 80.7 71.4 68.9 69.3 70.7 LIQUIDITY Liquid assets to total assets 26.4 29.0 30.0 32.3 32.3 33.6 34.9 Source: Philippine authorities and IMF Staff calculations, as cited in IMF Staff Report for the Philippines, 2004 1/ NPL over total loan portfolio excluding interbank loans (TL). 2/ NPL plus ROPOA over TL plus ROPOA. 3/ NPL plus ROPOA plus current restructured loans over TL plus ROPOA. 4/Loan loss reserves over NPLs. 5/ Allowances for probable losses on NPAs over NPAs. 6/ NPL minus loan loss reserves over capital. 7/ NPA minus allowances for probable losses on NPAs over capital. * change in series largely due to new NPL definition in 2002. ** Operating Expenses (net of bad debts and provisions) to total operating income.

82

83
4. CROSS-BORDER CAPITAL FLOWS IN EAST ASIA: AN ECONOMIC ANALYSIS
Data and empirical analysis made in this project suggest that regional financial integration is
very weak (see ATTACHMENT-A for details of the economic study), if any, in East Asia and most
of it can be explained by trade integration in the region.
4.1 GEOGRAPHIC DISTRIBUTION OF PORTFOLIO AND OTHER FINANCIAL INVESTMENT
In terms of geographic distribution of the cross-border portfolio investment, the major
destination of portfolio investment for East Asia is the United States and Europe, which constitute
31.5% and 34.1%, respectively, in total international portfolio assets held by East Asia. In
comparison, East Asian assets constitute only 4.9% of the total holdings for 8 East Asian economies.
The share of East Asian assets is only 1.3% in Japan. Malaysia has the largest East Asian asset share,
amounting to 46% of its international portfolio assets. In comparison, most of Europe holds more
than one half of their portfolio assets within Europe. The share of European portfolio asset holdings
is 58% of the total international portfolio assets held by 17 European countries.
The general patterns are similar to those for portfolio asset holdings by East Asia and
Europe. The major source of portfolio investment in East Asia comes from the United States and
Europe, which constitutes 42.8% and 37.2%, respectively, in total international portfolio assets
invested in East Asia (reported by 67 source countries) amounting to US$1.1 trillion. The share of
asset holdings by 9 East Asian economies (including China) constitutes only 8.2%. In comparison,
the total portfolio asset invested in Europe amounts to about US $8.7 trillion, of which the share of
intra-Europe holdings is over 60%. The amount of the total portfolio asset invested in an average
East Asian economy amounts to US$113 billion, which is far smaller than that in an average
European economy, amounting to US$510 billion.
Among the East Asian economies, the bilateral financial linkages are a relatively small
fraction of its GDP. The cross-border portfolio asset invested in an average East Asian economy
amounts to 26.4% in terms of its GDP, of which 9.8%p is held by the United States, 8.1%p by
Europe, and 5.0%p by East Asia. The comparable figure for an average European economy is
90.0%, of which 14.1%p is held by the United States, 59.0%p by Europe, and 6.9%p by East Asia.
84
Overall, the data show that East Asian economies are far less financially integrated among
them, compared to European economies. East Asian economies tend to be more closely financially
linked with the United States and Europe rather than among them.
4.2 WEAK FINANCIAL LINKAGE WITHIN EAST ASIA
Empirical evidence, based on Gravity Model study, suggests that financial integration is
closely associated with trade integration. This may imply that East Asia can be further financially
integrated as it continues to promote the growth of intra-regional trade. However, as the intra-region
trade-to-GDP ratio is already very high for East Asia, comparable to the intra-region ratio for
Europe, it is not clear that further regional trade integration can create substantial cross-border
finance. Furthermore, the finding that regional financial integration in East Asia is much weaker
than in other regions, after controlling for the degree of intra-region trade integration, suggests
that there are other structural and institutional impediments to financial integration in this
region and they need be addressed by policies, particularly designed to promote the growth of
Asian financial markets. In this section, we suggest a few policies and institutional frameworks
that can enhance the degree of regional financial integration in East Asia. 53
There are several institutional and structural characteristics in East Asian financial systems
that constrain regional financial integration. In general, the underdevelopment of financial markets
hinders trade in regional securities between different East Asian countries. In East Asia, where
financial systems have been traditionally bank-oriented, securities markets have been relatively less
developed. The inadequate financial and legal structure, low auditing and accounting standards, low
transparency, and weak corporate governance have hampered the development of capital markets in
East Asia. This underdevelopment of financial markets and institutions in East Asian economies
must be the primary cause of lower degree of financial integration in the region. Therefore, among
others, East Asian economies must make efforts to improve own financial infrastructures while
working together for a harmonization of financial markets within the region in the areas of rules,
regulations, taxes and so on.
In particular, bond markets are underdeveloped in East Asia. In terms of the composition of
domestic financing, East Asia relies less on bond markets than equity or bank loans, and many
Asian domestic bond markets are small relative to those of developed economies such as the US
53 See Lee, Park and Shin (2004), Eichengreen and Luengnaruemitchai (2004), Eichegreen and Park (2005a, 2005b), and Park, Park, Leung, and Sangsubhan (2004) for detailed discussions.

85
and Japan. The bond markets in East Asia still lack liquidity and remain largely fragmented.
Eichengreen and Luengnaruemitchai [2004] investigate empirically the determinants of
bond market development in a cross-section of developed and developing economies. They find that
while geographical and historical factors play an important role on bond market development,
policies and institutional factors have more crucial influences on it. They suggest that improved
regulation, enhanced transparency, stronger investor protection, and stable macroeconomic policies
are important for the development of deep and liquid bond markets in East Asia.
After the financial crisis of 1997~98, there has been considerable progress in the
development of the regional bond markets. The basic motive is to mobilize the region’s vast pool of
savings for direct use in the region’s long-term investment, thereby reducing the double mismatch
problem and diversifying the means of financing.
Prominent among these developments is the launch of the Asian Bond Fund (ABF) in June
2003, which attempts to pool the international reserves of Asian central banks and invest in Asian
bonds. The Executives Meeting of East Asia-Pacific Central Banks (EMEAP) contributed US$1
billion to invest in dollar-denominated, sovereign and quasi-sovereign bonds issued by Asian
entities. The central banks established another fund, the so-called ABF II, which is intended to
invest in local currency-denominated Asian bonds.
The development of the regional bond market has also been intensively and extensively
discussed among ASEAN+3 countries through the Asian Bond Market Initiative (ABMI), which has
now made several concrete achievements such as (a) issuance of Ringgit denominated bonds by
ADB in Malaysia and permission given to multilateral development banks to issue local currency
denominated bonds in Thailand, (b) creation of a new scheme of cross-country primary CBOs by
Korea and Japan, (c) provision of credit guarantee by JBIC and NEXI for bond issued by Asian
multilateral companies, and (d) launch of the Asian Bonds Online Website [Park, Park, Leung, and
Sangsubhan, 2004]. There has been much progress for the establishment of infrastructure on
regional credit rating, clearing and settlement system.
Regardless of the efforts to development of the regional bond markets, there are preliminary
tasks that need to be fulfilled. The most important prerequisite is the deregulation and opening of
the domestic financial systems so that more local currency bonds are issued, domestic investors are
86
allowed to invest in foreign bonds, and foreign borrowers can issue bonds denominated in different
currencies in East Asia’s domestic markets.
It is still true that a number of countries in East Asia remain behind the capital market
liberalization process by relying frequently on capital controls. Restrictions on capital account
transactions and on entering foreign financial institutions must be an impediment to the process of
integrating financial markets across economies in the region. Eichengreen and Park [2005b] provide
evidence that a lower level of capital market liberalization and an underdevelopment of financial
markets and institutions particularly in potential lending countries are the main factors contributing
to the difference between the intra-Europe and intra-East Asia integration in the cross-border bank
lending market. Chelley-Steeley and Steeley [1999] show evidence that the abolition of exchange
controls helped equity markets to become more closely integrated in Europe.
East Asia also needs further financial and monetary cooperation for exchange rate
stabilization among regional currencies. Higher degree of exchange rate volatility contributes to a
lower degree of financial integration in East Asia. A number of studies show that higher exchange
rate volatility will lead to fewer transactions in trade in assets, as well as trade in goods. Danthine et
al. [2000] and Fratzscher [2001] provide evidence that the introduction of the Euro has increased
the degree of financial integration in Euro countries. Spiegel [2004] also argues that overall
international borrowing is facilitated by the creation of monetary unions, particularly based on the
evidence from Portugal’s Accession to the EMU. Evidence supports that the degree of financial
integration has increased significantly after the introduction of Euro. Blanchard and Giavazzi
[2002)] show that correlations between current account positions and per capita incomes increase
more for future European Monetary Union (EMU) countries in 1990s, suggesting that monetary
integration enhanced financial integration.
Another special feature after the financial crisis is that East Asia had accumulated a
substantial amount of dollar reserve assets. East Asia, with a ‘fear of floating’ against the US dollar,
have intervened in the foreign exchange market so as to moderate excessive volatility of exchange
rates and moreover to maintain competitiveness of export sectors. They were also inclined to build
up a capacity to draw on reserves in contingency so that it reduces vulnerabilities to any future
possible external disturbances. The East Asian economies tended to hoard their reserves in
low-yielding US Treasuries and other dollar denominated financial assets. This strong tendency of
East Asia to invest in dollar-denominated safe-assets must have had a negative impact on regional

87
integration. This post-crisis experience has provoked questions on what is the optimal exchange rate
regime for East Asia. Whether East Asia can emulate the European experience of monetary
integration by taking necessary steps to build requisite institutions and policies that eventually lead
to the formation of a monetary union must be an important issue.

88

89
5. SUMMARY REMARKS AND POLICY RECOMMENDATIONS
Do existing regional institutional ties provide countries with the opportunities to maximize
the gains from allowing capital to flow freely? How do such institutional arrangements help
ASEAN+3 member countries to better manage capital flow movements and mitigate the negative
externalities associated with short-term capital flows? What institutional mechanisms and
arrangements may be targeted to enhance the efficiency of capital market institutions in order for
East Asian countries to maximize gains from capital flows, liberalization and greater financial
integration?
East Asian countries have all benefited, in varying degrees, from financial liberalization.
Having opened up their economies to globalized finance made it possible for these countries to
attract large inflows of capital, which helped fund their economic growth and development.
However, capital flow volatility, the unexpected scale of capital flow reversal, the significant levels
of financial and other economic risks which these countries allowed themselves to be subject to (as
a consequence of opening up their capital accounts and due to a combination of weak banking
infrastructure, poor corporate governance, moral hazard, loose supervisory and control powers of
major institutions over entities directly involved in capital flow movements and underdeveloped
capital markets) simultaneously conspired and led to the birth of a crisis that exacted significant
economic and social losses for the entire Asian region.
The AFC was a painful wake-up call that exposed the systematic vulnerabilities of what
were then the economic darlings in the field of globalized finance. The affected economies now
realize only too well that the high rates of economic growth they experienced were not enough of a
parachute in case the winds of financial liberalization change course and require drastic economic
action, as it did in 1997-1998. The AFC forced the governments of Asian countries to seriously
reassess their readiness and management capabilities of freely flowing capital. “Financial
institutions had to be restructured and reformed, capital markets broadened and deepened, and
supervision and regulation standards brought up to international best practices” [Wang, 2002].
The post-AFC period of financial reconstruction for severely affected Asian countries
emphasized the urgency for countries in the region to establish great financial and monetary
cooperation to prevent, or least, be better at dealing with similar future crisis which may affect the
region again. In addition to strengthening domestic financial and corporate sectors, Asian countries
90
were of the consensus that to efficiently manage globalized finance, globalized frameworks have to
be put in place to “reduce capital flow volatility and enhance borrower countries’ capacity to
mitigate undesirable impacts of globalization, including macroeconomic and exchange rate
policymaking” [Kawai, 2004].
Kawai [2004] presented in a summary of policy objectives and courses of action to be
undertaken at the national, regional and global levels in order to prevent, manage and resolve a
crisis [see Table-2 in Part-2]. It is against this backdrop that the logic for Asian regional economic
cooperation is illuminated. The increasing trade and FDI integration and the market-driven financial
integration of Asian economies (via increasing liberalization of the financial system, extension of
cross-border loans, opening of equities and securities markets), which impact on these countries’
macroeconomic interdependence supported the establishment of formal mechanisms, which helped
institutionalize economic integration [An account of developments in institutionalization efforts
related to capital flows is in ATTACHMENT-B].
In short, the currency crisis caused by cross-border capital flows was directly linked to too
much volatility of the amount of capital, which flowed to East Asia in such a short period of time.
The 1997 AFC can be seen as a product of the extensive flows of foreign capital, which flowed into
Asia in such a short time period. This sudden inflow of money flown into both corporate and
banking sectors caused the sudden increase of bank loans and capital flows into corporate sector.
Due to easy access to the funding market, companies expanded their investment and business
activities without making careful plans.
The virtual fixed exchange rate with the US dollar also accelerated the inflow of capital
from abroad. All the currency exchanges from US dollar to its domestic currency, such as Thai bath,
Malaysian ringgit, Indonesian rupiah, etc. have to go through exchange facility at banks. Therefore,
if the monitoring of banks’ exchange volume can be well established, the policy authority can notice
sudden changes in the currency exchange market.
There are financial crises caused by sudden inflow of capital and the sudden outflow of
capital. In such cases, the volatility of the volume of the currency exchange becomes very high in a
short period of time. The policy authority should, therefore, keep an eye on the volume of the
currency exchange reported by banks on a daily basis. If the signs of increase of volatility of the
currency exchange volume can be seen, the policy authority should check the reasons of the sudden

91
increase of the volume of the currency exchanges. The Central Bank plays an important role in the
currency exchange between its home currency and overseas currency such as US dollar; hence it
should slow the process of the currency exchange. Otherwise too much volatility of the currency
exchange will cause various ill effects to the real economic activities.
The following are the policy recommendations drawn from the literature survey, country case
studies and empirical analysis.
RECOMMENDATION-1: FURTHER STRENGTHENING OF DOMESTIC FINANCIAL SYSTEMS AND PRUDENTIAL REGULATORY FRAMEWORK
Given that cross-border capital flows should be liberalized to improve the efficiency and
ensure the high growth, it is imperative to strengthen further the domestic financial systems and
prudential regulations. Major progress has been made in the countries, as indicated in the country
studies, but there appears to be some room to catch up with the standards of developed economies
in terms of governance of the financial sectors and regulatory framework.
RECOMMENDATION-2: BUILDING MONITORING CAPACITY TO ASSESS VOLATILITY OF CAPITAL FLOWS
MONITOR AND TEST THE VOLATILITY OF THE AMOUNT OF THE CAPITAL
FLOWS. The Central banks and the Ministry of Finance are to monitor the amounts of capital
inflow and outflow on a daily, weekly, monthly, quarterly and annual basis. When the volume of the
volatility turns abnormal, it should warn the market participants and immediately check the causes
of the volatility. Of course there are several factors attributed to capital flow volatility. One is based
on trade flows of both current and future contract and the second is based on the purpose of
financial activities such as purchasing and selling of stocks and bonds. Procedures to slow down the
capital inflow and outflow should be introduced by reducing the speed of exchanging the dollar into
domestic currency. This is technically plausible since transactions between foreign currencies and
the domestic currency are in principle conducted through foreign exchange banks which reports all
the data to the Central bank and the Ministry of Finance minutes by minutes.
EARLY DETECTION BASED ON ABNORMAL FLUCTUATIONS. Establishing
trends and seasonal fluctuations (using daily, weekly, monthly, quarterly and annual monitoring
data), and the associated causes of volatility should always be analyzed using econometric methods.

92
Volatility testing of capital flows and exchange rate fluctuations should be continuously
implemented. This will help determine whether such volatilities are dependent on certain economic
conditions or if they are caused by some other unexplainable factors.
Continuous research on the capital flow and exchange rate analysis is crucially important to
detect abnormal inflow and outflow of capital. It will become an early warning signal of the crisis.
MONITORING TRANSACTIONS OF FINANCIAL INSTITUTIONS. The emphasis
should be placed on strengthening the monitoring capabilities of financial institutions that function
as settlement facilities. Tracing the records of international transactions by such financial
institutions would help the authorities assess thoroughly the current situations of capital
inflows/outflows. In addition, in some countries, large amounts of cross-border transactions are
made, taking the forms of remittance, through postal services and other financial institutions other
than commercial banks. The Central Banks should obtain capacity to monitor international capital
transactions by such institutions.
RECOMMENDATION-3: INTERNATIONAL INFORMATION EXCHANGE AND INFORMATION DISCLOSURE TO THE PUBLIC
REGULATORS MEETINGS. Frequent dialogue among financial regulators of countries
allows similarities and differences in regulatory systems to surface and encourage the idea of
convergence of regulations. Regional mechanisms of financial cooperation indicated in Appendix-B
will be suitable to provide the opportunity to set up such meetings.
DISCLOSURE INFORMATION AND COUNTRY COMPARISONS ON SUCH
AREAS AS LEGAL SYSTEM, TAX RATES AND CAPITAL TRANSACTION
PROCEDURES. For investors, a portfolio’s after-tax rates of return are important to compare net
effective returns among various markets. Among Asian countries, the tax rates and legal systems are
so different such that after-tax rate of returns are much affected by the differences. Income tax rate,
capital gains tax, tax rate on dividends and tax rate of interest income vary among Asian economies.
Furthermore, each country has a different system of reporting capital transactions to the authorities.
If country comparisons can be seen at a glance, it would be beneficial not only to
institutional investors but also to individual investors. If these country comparisons are listed in one
93
booklet or in an internet-accessible site, investors can immediately see the differences among
countries and this makes financial investment across countries much smoother. If an independent
institution made these comparisons, reliability of the information will be enhanced.
RECOMMENDATION-4: MORE EFFICIENT MOBILIZATION OF THE DOMESTIC FINANCIAL RESOURCES
HOME COUNTRY BIAS AND ENCOURAGEMENT OF FINANCIAL
INVESTMENT ACROSS COUNTRIES. Many countries show some bias toward home country
investment. Records indicate that domestic financial investment far exceeds overseas financial
investment in many Asian countries. This is due to several reasons, primarily the currency risk
based on fluctuations of the exchange rate and the lack of information about other countries’
investment potentials.
Avoiding home country bias is important to improve financial investment across countries.
Continuous supply of the economic data of various countries will enhance capital flows among the
countries. Such data include: (a) macroeconomic data such as economic growth rate and interest
rates, (b) sectoral data such as data on the food industry, machinery industry, agricultural sector, and
(c) microeconomic data such as company data. These piles of data will help facilitate foreign capital
inflows into the country. Continuous dissemination of information on changes in the economic
environments of various countries in the region can reduce information asymmetry, which could
accelerate overseas capital flows.
ESTABLISHING INSURANCE SYSTEM TO SECURE BANK DEPOSITS. In
addition, establishing an insurance system to secure bank deposits would reduce the financial risks
to the depositors. This will then lead to domestic households switching their investment toward
domestic uses.
RECOMMENDATION-5: ESTABLISHING AN EMERGENCY FACILITY TO PREVENT CAPITAL FLOW CRISIS
GRADUAL CAPITAL EXCHANGE. When signs of abnormal capital flows are found,
policy authorities can slow down the speed of currency exchange transactions. This gradual
exchange of home currency with US dollar will calm down overheated transactions.

94
TAX ON CROSS-BORDER CAPITAL TRANSACTIONS. Chile levied tax on
international capital transaction when it was faced with massive capital inflow from abroad. Tax
rates, which may be set to zero rates during ‘normal’ periods, may be gradually increased during
‘abnormal’ periods. This will slow down the speed of overseas capital transactions and reduce, as
well, its potential to cause overheating.

95
6.1 ATTACHMENT-A: PATTERNS AND DETERMINANTS OF CROSS-BORDER FINANCIAL ASSET HOLDINGS IN EAST ASIA
1. INTRODUCTION
We have observed a rapid increase of international capital mobility in East Asia since the
early 1990s, as the economies of the region have continued to deregulate their financial markets.
The continuous financial opening process has made East Asian economies integrated into global
financial markets. However, it is not clear that the international financial liberalization and
integration process has contributed to the integration of financial markets within the region. Several
studies claimed that the degree of financial market linkage in East Asia remains low, particularly
compared to that in Europe, and that the integration of financial markets in this region has been
occurring more on a global level rather than on a regional level [Eichengreen and Park (2004); Kim,
Lee and Shin (2005)]. In this regard, it is important to understand the patterns of the cross-border
capital flows and the forces that have influenced them in East Asia.
The purpose of this section is to analyze the patterns of cross-border capital flows in East
Asia and then to investigate the forces that have determined the degree of East Asian financial
integration. We compiled the data on cross-border holdings of international financial assets
including equity portfolio, long-term and short-term debt securities, and bank claims from 1997 to
2004. Using this data set, we analyze the geographical composition of cross-border financial asset
holdings in East Asia and compare it to that in Europe. Then, we adopt a gravity model of bilateral
financial asset holdings to investigate what has determined the patterns of cross-border holdings of
international financial assets in East Asia. Based on the results of empirical investigation, we
discuss the effects of the institutional features such as capital account restrictions, exchange rate
regimes, and domestic financial regulation on cross-border capital flows in East Asia.

96
2. STYLIZED PATTERNS OF INTERNATIONAL FINANCIAL ASSET HOLDINGS IN
EAST ASIA
2.1 DATA
We have compiled two data sets on cross-border holdings of portfolio assets and bank
claims in order to judge stylized patterns of the geographical distribution of financial assets
holdings. The International Monetary Fund (IMF) has recently published data on international
portfolio asset holdings. The IMF conducted the Coordinated Portfolio Investment Survey (CPIS)
for the first time in 1997, and annually since 2001.
The first CPIS involved 20 economies and the CPIS 2001 expanded to the participation of
67 source economies including several offshore and financial centers. In each case, the bilateral
positions of the source countries in 223 destination countries/territories are reported.54 The CPIS
provides a breakdown of a country’s stock of portfolio investment assets by country of residency of
the nonresident issuer. Problems of survey methods and under-reporting of assets by participating
countries are pointed out as shortcomings of the CPIS data [Lane and Milesi-Ferretti, 2003].
Nevertheless, the CPIS survey presents a unique opportunity for the examination of foreign equity
and debt holdings of many participating countries.
Data on international bank claims are from the Bank for International Settlements (BIS). It
is the consolidated international bank claims of BIS reporting banks by nationality of lenders and
borrowers. We gathered these data for 25 reporting countries including two reporting banks from
East Asia (Japan and Taiwan) and 15 European countries from the BIS Quarterly Review.55 The
data are available from 1983 on a biannual basis, but most countries report more complete bilateral
data from 1999. We have also obtained compatible data for South Korea from its supervisory
authority. Note that although the data set includes only three countries in East Asia reporting
consolidated foreign bank claims, the other countries, such as Hong Kong, Indonesia, Malaysia, the
Philippines, Singapore, and Thailand, are included as the country of destination for the bank loans.
2.2 GEOGRAPHICAL DISTRIBUTION OF CROSS-BORDER FINANCIAL ASSET HOLDINGS
54 Refer to the IMF website at http://www.imf.org/external/np/sta/pi/cpis.htm for details. 55 Refer to the BIS website at http://www.bis.org/statistics/histstats10.htm for details.

97
PORTFOLIO INVESTMENT
Tables A1 and A2 provide the geographical distribution of bilateral portfolio asset holdings
for East Asia, compared to that for Europe in 2003. TABLE-A1-A shows the amount of bilateral
portfolio assets in million US dollars held by each East Asian and European economy, and
TABLE-A1-B shows the ratio of international portfolio asset holdings to GDP. The GDP value in
the denominator of these ratios refers to the East Asian or European country paired with four major
destinations including the United States, Europe, Japan and East Asia (10 economies including
Japan). Tables A2-A and A2-B show the cross-border portfolio assets invested in East Asian or
European economies by these major regions. In other words, TABLE-A1 shows “where East Asian
economies invest their cross-border portfolio financial assets”, while TABLE-A2 shows “which
country invests in East Asia”.
According to TABLE-A1-A, the total recorded level of portfolio asset holdings of the eight
East Asian economies is about US$2.2 trillion, which is about 13.4% of world total portfolio assets
that amount to US$16.5 trillion. Japan, Hong Kong and Singapore are the major investors in East
Asia. Japan holds international portfolio assets of about US$1.7 trillion or 10.5% of the total
international portfolio asset. Hong Kong and Singapore hold US$335 billion and US$144 billion,
respectively. The average amount of the total portfolio asset holding for East Asian economies is
about US$278 billion, which is about a half of that for European economies (US$539 billion).
The major destination of portfolio investment for East Asia is the United States and Europe,
which constitute 31.5% and 34.1%, respectively, in total international portfolio assets held by East
Asia. In comparison, East Asian assets constitute only 4.9% of the total holdings for 8 East Asian
economies. The share of East Asian assets is only 1.3% in Japan. Malaysia has the largest East
Asian asset share, amounting to 46% of its international portfolio assets. In comparison, most of
Europe holds more than one half of their portfolio assets within Europe. The share of European
portfolio asset holdings is 58% of the total international portfolio assets held by 17 European
countries.
When scaling portfolio holdings by GDP, small economies with financial and offshore
centers dominate the picture (TABLE-A1-B). For instance, Hong Kong, Singapore, Ireland, and
Switzerland have total assets amounting to several times their own domestic output levels. For a
typical East Asian economy, on the other hand, bilateral financial linkages are a relatively small

98
fraction of its GDP. The average ratio of international portfolio holdings to GDP for East Asia
amounts to 52.9%, of which 9.4% point (%p) is held in the United States, 16.9%p in Europe, and
8.6%p in East Asia. For 17 European countries, the comparable average ratio of international
portfolio holdings to GDP amounts to 108.0%, of which 21.2%p is held in the United States,
62.1%p in Europe, and 3.6%p in East Asia.
Tables A1-A and A1-B also report information for the U.S. The U.S. is the largest foreign
investor. It holds cross-border assets amounting to about US$ 3.1 trillion or 19.1% of the total
international portfolio assets. At the end of 2003, the share of East Asia in the international
investment portfolio of the US (14.3%) is far above the average of Europe (3.2%).
Tables A2-A and A2-B show the geographical distribution of the total portfolio assets
invested in East Asian or European economies. The general patterns are similar to those for
portfolio asset holdings by East Asia and Europe depicted in Tables A1-A and A1-B. The major
source of portfolio investment in East Asia comes from the United States and Europe, which
constitutes 42.8% and 37.2% respectively in total international portfolio assets invested in East Asia
(reported by 67 source countries) amounting to US$1.1 trillion. The share of asset holdings by 9
East Asian economies (including China) constitutes only 8.2%. In comparison, the total portfolio
asset invested in Europe amounts to about US $8.7 trillion, of which the share of intra-Europe
holdings is over 60%. The amount of the total portfolio asset invested in an average East Asian
economy amounts to US$113 billion, which is far smaller than that in an average European
economy, amounting to US$510 billion.
Among the East Asian economies, the bilateral financial linkages are a relatively small
fraction of its GDP. The cross-border portfolio asset invested in an average East Asian economy
amounts to 26.4% in terms of its GDP, of which 9.8%p is held by the United States, 8.1%p by
Europe, and 5.0%p by East Asia. The comparable figure for an average European economy is
90.0%, of which 14.1%p is held by the United States, 59.0%p by Europe, and 6.9%p by East Asia.
Tables A3 to A8 provide the geographical distribution of portfolio investment holdings
separately for each asset- equity, long-term debt, and short-term debt securities.
The geographical distribution for equity and debt securities asset holdings show stylized
patterns that are broadly similar to those for total portfolio assets. TABLE-A3-A and shows that the

99
total amount of equity assets held by East Asia is smaller that that by Europe and the share of East
Asian equity assets in total equity asset holdings by East Asia is far lower than that of European
equity asset holdings by European economies. The share of East Asian equity assets in total
holdings is 10.5% for 8 East Asian economies. This number is much smaller than the comparable
intra-region share for 17 European countries (41.2%). Japan, Hong Kong, and Singapore- the three
largest investors in East Asia- hold international portfolio assets of about US$274.5 billion,
US$152.8 billion, and US$42.7 billion, respectively and the intra-East Asian share of its holdings is
3.9%, 17% and 28%, respectively. TABLE-A3-B shows that the cross-border portfolio asset
holdings by an average East Asian economy amounts to 19.1% in terms of its GDP, of which 2.1%p
is held in the United States, 4.3%p in Europe, and 3.9%p in East Asia. For an average European
country, the ratio of international portfolio holdings to GDP is about 37.6%, of which 9.4%p is held
in the United States, 15.6%p in Europe, and 2.6%p in East Asia.
Tables A4-A and A4-B show that the amount of equity assets invested in an average East
Asian economy (86.0 billion) by international investors is smaller than that invested in an average
European country (173.8 billion). The major source of equity asset investment in East Asia is the
United States and Europe. The share of intra-East Asia holdings in total world equity assets invested
in East Asia is only 3.9%, while the comparable intra-Europe share amounts to 45.8%. The
international equity asset invested in an average East Asian economy amounts to 19.1% in terms of
its GDP, of which 8.2%p is held by the United States, 6.3%p by Europe, and 1.9%p by East Asia.
The comparable figure for an average European economy is 29.7%, of which 9.9%p is held by the
United States, 15.1%p by Europe, and 1.1%p by East Asia.
Tables A5 and A6 show the geographical distribution of long-term debt securities.
TABLE-A5 shows that only 2.7% of the total long-term securities asset holdings by 8 East Asian
economies is invested within East Asia, which is far lower than the intra-Europe share of long-term
debt securities holdings by Europe that amounts to 66.9%. On the other hand, TABLE-A6 shows
that 23.3% of the world total long-term debt securities assets invested in East Asia is made by 9
East Asian economies (including China). The big discrepancy between the two intra-East Asia
shares is attributed to the fact that Japan holds a very small share of long-term debt securities issued
by other East Asian economies (0.8%). Note also that the amount of the world total long-term debt
securities assets invested in East Asia is only US$185 billion, which is far smaller than the amount
of total long-term debt securities assets invested by East Asia (mostly by Japan) of US$1.6 trillion.

100
TABLE-A7 shows that in the short-term debt securities market, East Asian short-term debt
securities constitutes about 12.1% of the total short-term securities asset holdings by 8 East Asian
economies (US$113 billion), which is far lower than the share of European short-term debt
securities in total short-term securities asset holdings by European countries that amounts to 59.0%.
On the other hand, as TABLE-A8 shows, the share of short-term debt securities holdings by East
Asian economies in the world total short-term debt securities assets invested in East Asia is much
higher, reaching 71.6%, but the amount of the world total short-term debt securities assets invested
in East Asia is much smaller, only US$18.3 billion, compared to US$592 billion for Europe.
Overall, the data show that East Asian economies are far less financially integrated
among them, compared to European economies. East Asian economies tend to be more closely
financially linked with the United States and Europe rather than among them.
BANK LENDING Tables A9 and A10 report geographical distribution of cross-border bank claims for East Asia,
Europe and the U.S. at end-2003. We have data for three East Asian reporting countries (Japan,
South Korea and Taiwan). In TABLE-A9, the share of intra-East Asia bank claims in total
cross-border bank claims for the three East Asian economies is 9.5%. It is 17.3% in Japan, 36% in
South Korea, and 26% in Taiwan. The comparable intra-region share for Europe is 51.8%. East Asia
is a small investor in the international bank lending markets. While Europe holds about US$10.7
trillion international bank claims in total and about US$5.5 trillion claims within Europe, East Asia
holds only about US$1.4 trillion total claims in international bank lending markets and US$131
billion within East Asia. TABLE-A10 shows a similar pattern for geographical distribution of the
total cross-border bank claims held in 10 East Asian economies (including China and Taiwan). The
share of East Asian economies’ holdings in world total cross-border bank claims against East Asia is
10.1%, whereas the comparable intra-Europe share is 83.9%.
3. A GRAVITY-MODEL OF DETERMINANTS OF CROSS-BORDER FINANCIAL ASSET HOLDINGS
SPECIFICATION OF THE GRAVITY MODEL AND DATA
We set up a gravity model of the bilateral financial asset holdings. The gravity model was originally
developed as an explanation for the gravitational forces. Initially, economists to study international

101
trade without firm theoretical grounds adopted the model. In its basic form, trade between two
countries depends positively on their total income and negatively on the distance between them.
The model can be extended to include other variables, depending on the study’s purpose. Great
empirical success of the gravity model to explain the bilateral trade flows has motivated a number
of theoretical models that can justify it.56
While the gravity model of bilateral trade flows has a long history, there have been
relatively few attempts made to use a gravity model in explaining exchanges of financial assets. The
main reason is that unlike goods, financial assets are weightless, hence distance cannot represent for
transaction costs. Recently, however, Portes and Rey [2005] find that a gravity model performs at
least as well in asset trade as goods trade.57 Portes and Rey interpret that information friction is
positively correlated with distance, justifying that financial asset trade is also negatively related to
distance. Following their model, we set up an extended gravity model as follows:
0 1 2 3 4
5 6 7 8 9
10 11
ln( ) ln( ) ln( ) ln( / ) ln( / )
ln( ) ln( ) lnijt it jt i i t j j t
i j ij ij ijt
ij ij t ijt
Assets GDP GDP GDP Pop GDP Pop
Area Area Dist Border Language
ExComColony ExColony YEAR
β β β β β
β β β β β
β β δ ε
= + + + +
+ + + + +
+ + + +
(1)
where i and j denote countries, t denotes time, Assetsijt denotes the financial assets of country j held
by country i at time t, GDP is real GDP, Pop is Population, Area is the size of land area of the
country, Dist is the distance between i and j, Border is a binary variable which is unity if i and j share
a land border, Language is a binary variable which is unity if i and j have a common language,
ExComColony is a binary variable which is unity if i and j were ever colonies after 1945 under the
same colonizer, ExColony is a binary variable which is unity if i ever colonized j or vice versa, and
Year denotes a set of binary variables which are unity in the specific year t.
Note that this framework separates between country i’s holdings of country j’s financial
assets and its reverse, that is, country j’s holdings of country i’s financial assets for the dependent
variable. The usual gravity model of goods trade considers the bilateral trade (an average of exports
and imports) between country i and j as one dependent variable. We adopt the different specification
for asset trade because the bilateral holdings of assets, a stock variable, between country i and j are
fairly asymmetric, and often unilateral transaction data are only available. 56 See Anderson (1979), Bergstrand (1985), and Evenett and Keller (2002) for the theoretical background of the gravity equation. 57 See subsequent researches including Buch (2002, 2003), Yildrim (2003), and Lane and Milesi-Ferritti (2003).

102
The underlying GDP data are the purchasing-power adjusted values from Penn-World Tables
6.1, as described in Heston, Summers, and Aten [2002]. We updated the Summers-Heston data by
using information on real GDP from the World Bank’s World Development Indicators (WDI). A
number of country specific variables such as distance, land area, language, land border, and colony
relationship were obtained from Rose [2000].58
The data set has features of a panel structure consisting of 12,888 annual observations from
2001 to 2003 for the portfolio data, and 4,867 observations for the bank claims data. East Asian
country pairs constitute about 1 % in each data set, while the proportion of European country pairs
is much larger amounting to about 6 % for the portfolio data set and about 10 % for the bank
claims.
TABLE-A11, column (1) present the estimation results of specification (1) for total
portfolio assets. We apply a random effect estimation technique.59 The result shows that the gravity
model fits the data very well and most estimated coefficients are statistically significant with the
expected signs. To summarize briefly, the estimated coefficients for log of GDP of source country,
log of GDP of destination country, log of per capita GDP of source country, log of per capita GDP
of destination country, common land border dummy, common language dummy, ex-common
colonizer dummy, and ex-colony-colonizer dummy are significantly positive. The estimated
coefficient for the bilateral distance is significantly negative. Area of source country is significantly
negative, while area of destination country is significantly positive, which seems to indicate that a
larger country tends to invest less in international assets, controlling for other variables, but receive
more cross-border financial investment.
The above regression results suggest that a gravity model can be used as a benchmark to
appropriately explain normal financial asset holdings. Now we add a dummy variable for intra-East
Asia asset holdings in column (2) in order to investigate how deeply financial integration is
entrenched in East Asia relative to a normal flow predicted by the gravity model. We find that the
coefficient of the intra-East Asia dummy is significantly positive (0.427, s.e.=0.129), indicating that
there is some evidence of regional financial integration among East Asian economies. The estimated
58 The data set is available on the web page, http://faculty.haas.berkeley.edu/arose/, maintained by Andrew Rose. 59 We do not adopt the fixed-effect "within" estimation results. This method can provide more consistent estimates by controlling for the influences from omitted country-specific factors. One drawback of this fixed-effect approach is, however, that since the fixed effect estimator exploits variation over time, we cannot obtain the estimates for time-invariant factors such as distance, area, land border, common language, and, more importantly, a regional dummy that will be investigated later.

103
coefficient indicates that East Asia invests 1.53 times more among themselves than random pairs of
countries in other regions do.60
In order to compare the degree of financial integration in East Asia with that for Europe, we
have also added the intra-Europe dummy variable and reported the estimation result in column (3)
of TABLE-A11. Even after the intra-Europe dummy is added, the estimated coefficient of
intra-East Asia dummy is statistically significant (0.578, s.e.=0.116). The coefficient of intra-Europe
dummy is significantly positive and large in magnitude (2.235, s.e.=0.074), which implies that
European countries make portfolio investments particularly more among themselves. The estimated
coefficients indicate that Europe invest 9.3 times more among themselves than a random pair of
countries do. This estimation result implies than the regional financial integration is much deeper in
Europe than in East Asia.
Column (4) investigates whether East Asian economies are more closely linked to the global
(U.S.) financial market than among themselves? To answer this question, we added two more
dummies for East Asia-US and Europe-US. The coefficients of East Asia-US and Europe-US
dummy variables measures how East Asian and European countries are relatively more intertwined
to the US market than a random-pair of countries do. In column (4), we find that the coefficients of
two dummy variables is positive and statistically significant: the estimate of Europe-US dummy is
4.234 (s.e.=0.158) and that of East Asia-US dummy is 3.241 (s.e.=0.202). The estimate of East Asia
(Europe)-US is relatively larger in magnitude than that on intra-East Asia (Europe) dummy. This
indicates, perhaps surprisingly, that world financial integration plays more important role than
regional integration both for East Asia and Europe. However, the global integration is relatively
more important than the regional integration for East Asia, compared to Europe. When we compare
the relative importance of the global market vis-a-vis the regional market for East Asia with that for
Europe, we realize that East Asia is relatively more integrated with the global market instead of
regional market. The estimated coefficients of intra-East Asia and East Asia-US dummy are 0.647
and 3.241, while the corresponding figures for Europe were 2.350 and 4.234. The estimated
coefficient of the global integration is more dominatingly larger in magnitude only for East Asia.
We suspect the significance of intra-East Asian dummy may reflect the strong intra-region
trade in East Asia. Financial integration must be strongly associated with trade integration. In order
60 This figure is calculated as e0.427=1.53.

104
to test this conjecture, we add bilateral trade as an additional regressor to the specifications of
TABLE-A11, and report the results in TABLE-A12. This conjecture seems to be supported by the
fact that the estimate of the intra-East Asia dummy turned significantly negative in the regressions
where bilateral trade is added as an explanatory variable in columns (2), (3) and (4) of TABLE-A12.
The interpretation of the estimates may need some cautions because the inclusion of bilateral trade,
though one-year lagged value is used, can be subject to endogeineity bias. Any omitted region- or
country-specific factors in East Asia must influence both bilateral goods trade as well as asset trade.
Nevertheless, the results are quite suggestive. Except the intra-East Asia dummy, the other dummy
variables including East Asia-US, intra-Europe, and Europe-US dummy enter all statistically
significantly with positive coefficients. Hence, this result seems to support the view that the
regional financial integration in East Asia is mainly due to the trade integration taking place in the
region [Kim, Lee and Shin, 2004].
Now we turn to the regressions for each type of international portfolio assets and
cross-border bank claims. In columns (1)~(4) of TABLE-A13, we report the regression results from
the specification (4) of TABLE-A11 after replacing the dependent variable by equity portfolio,
long-term debt securities, short-term debt securities, and bank claims respectively. For most of usual
gravity factors, we find similar results as in TABLE-A11. One notable difference is that the
estimated coefficient on per capita GDP of source country is significantly negative. Hence, with
controlling other variables including total GDP of source and destination country, a country with
higher per capita GDP tend to invest less in international debt securities issued by other countries,
while it receives more investment in own debt securities from other countries. This seems an
interesting finding that needs further investigation.
For equity portfolio and long-term debt securities, in columns (1) and (2) of TABLE-A13,
the results are similar to those for total portfolio asset: There exists some degree of regional
financial integration among East Asian economies. But, the degree of intra-region integration in
East Asia is relatively lower than that in Europe. East Asia is relative more integrated to the global
market than to the regional markets, compared to Europe, in equity and long-term debt transactions.
Unlike equity and long-term debt securities, we find little intra-region integration in
short-term debt securities markets. In column (3), the estimated coefficient of intra-East Asia
dummy is small in magnitude and statistically insignificantly different from zero (-0.063,
s.e.=0.047). This may reflect that the size of short-term debt securities market is East Asia is quite

105
small and East Asian investors, particularly Japanese, tend to invest little in East Asian short-term
debt securities.
On the contrary, we find much stronger evidence of regional integration in bank claims
among East Asian economies. The coefficient of intra-East Asia dummy in column (4) is positive
and statistically very significant. The estimate (1.254) is larger than that for East-US dummy
(0.665) and comparable to that for intra-Europe dummy(1.662).
The significance of regional financial integration in East Asia in terms of equity and
long-term debt securities as well as bank claims may be the result of heavy trade integration in the
region too. We test this in columns (1)~(4) of TABLE-A14 by adding bilateral trade as an
additional explanatory variable to the specifications of columns (1)~(4) in TABLE-A13. The
estimates of the intra-East Asia dummy turn significantly negative in the regressions for equity,
long-term and short-term debt securities. The estimate is also negative in the regression for bank
claims, but it is statistically insignificant.
4. HOW TO ENHANCE REGIONAL INTEGRATION OF EAST ASIAN FINANCIAL MARKETS
The data and empirical results in the previous sections suggest that regional financial
integration is very weak, if any, in East Asia and most of it can be explained by trade integration in
the region.
Empirical evidence in the previous section suggests that financial integration is closely
associated with trade integration. This may imply that East Asia can be further financially integrated
as it continues to promote the growth of intra-regional trade. However, as the intra-region
trade-to-GDP ratio in East Asia is already very high, even comparable to the intra-region ratio for
Europe, it is not clear that further regional trade integration can create substantial cross-border
finance. Furthermore, the finding that regional financial integration in East Asia is much weaker
than in other regions, after controlling for the degree of intra-region trade integration, suggests that
there are other structural and institutional impediments to financial integration in this region and
they need be addressed by policies, particularly designed to promote the growth of Asian financial
markets. In this section, we suggest a few policies and institutional frameworks that can enhance the

106
degree of regional financial integration in East Asia.61
There are several institutional and structural characteristics in East Asian financial
systems that constrain regional financial integration. In general, the underdevelopment of
financial markets hinders trade in regional securities between different East Asian countries. In East
Asia, where financial systems have been traditionally bank-oriented, securities markets have been
relatively less developed. The inadequate financial and legal structure, low auditing and accounting
standards, low transparency, and weak corporate governance have hampered the development of
capital markets in East Asia. This underdevelopment of financial markets and institutions in East
Asian economies must be the primary cause of lower degree of financial integration in the region.
Therefore, among others, East Asian economies must make efforts to improve own financial
infrastructures while working together for a harmonization of financial markets within the region in
the areas of rules, regulations, taxes and so on.
In particular, bond markets are underdeveloped in East Asia. In terms of the composition of
domestic financing, East Asia relies less on bond markets than equity or bank loans, and many
Asian domestic bond markets are small relative to those of developed economies such as the US
and Japan (TABLE-A15). The bond markets in East Asia still lack liquidity and remain largely
fragmented.
Eichengreen and Luengnaruemitchai (2004) investigate empirically the determinants of
bond market development in a cross-section of developed and developing economies. They find that
while geographical and historical factors play an important role on bond market development,
policies and institutional factors have more crucial influences on it. They suggest that improved
regulation, enhanced transparency, stronger investor protection, and stable macroeconomic policies
are important for the development of deep and liquid bond markets in East Asia.
After the financial crisis of 1997~98, there has been considerable progress in the
development of the regional bond markets. The basic motive is to mobilize the region’s vast pool of
savings for direct use in the region’s long-term investment, thereby reducing the double mismatch
problem and diversifying the means of financing. Most prominent among these is the launch of the
Asian Bond Fund (ABF) in June 2003, which attempts to pool the international reserves of Asian
61 See Lee, Park and Shin (2004), Eichengreen and Luengnaruemitchai (2004), Eichegreen and Park (2005a, 2005b), and Park, Park, Leung, and Sangsubhan (2004) for detailed discussions.

107
central banks and invest in Asian bonds. The Executives Meeting of East Asia-Pacific Central
Banks (EMEAP) contributed US$1 billion to invest in dollar-denominated, sovereign and
quasi-sovereign bonds issued by Asian entities.
The central banks established another fund, the so-called ABF II, which is intended to invest
in local currency-denominated Asian bonds. The development of the regional bond market has also
been intensively and extensively discussed among ASEAN+3 countries through the Asian Bond
Market Initiative (ABMI), which has now made several concrete achievements such as (a) issuance
of ringgit-denominated bonds by ADB in Malaysia and permission given to multilateral
development banks to issue local currency denominated bonds in Thailand, (b) creation of a new
scheme of cross-country primary CBOs by Korea and Japan, (c) provision of credit guarantee by
JBIC and NEXI for bond issued by Asian multilateral companies, and (d) launch of the Asian Bonds
Online Website [Park, Park, Leung, and Sangsubhan, 2004]. There has been much progress for the
establishment of infrastructure on regional credit rating, clearing and settlement system.
Regardless of the efforts to development of the regional bond markets, there are preliminary
tasks that must also be fulfilled. The most important pre-requisite is the deregulation and opening of
the domestic financial systems so that more local currency bonds are issued, domestic investors are
allowed to invest in foreign bonds, and foreign borrowers can issue bonds denominated in different
currencies in East Asia’s domestic markets.
It is still true that a number of countries in East Asia remain behind the capital market
liberalization process by relying frequently on capital controls. Restrictions on capital account
transactions and on entering foreign financial institutions must be an impediment to the process of
integrating financial markets across economies in the region. Eichengreen and Park [2005b] provide
evidence that a lower level of capital market liberalization and an underdevelopment of financial
markets and institutions particularly in potential lending countries are the main factors contributing
to the difference between the intra-Europe and intra-East Asia integration in the cross-border bank
lending market. Chelley-Steeley and Steeley [1999] show evidence that the abolition of exchange
controls helped equity markets to become more closely integrated in Europe.
East Asia also needs further financial and monetary cooperation for exchange rate
stabilization among regional currencies. Higher degree of exchange rate volatility must contribute
to a lower degree of financial integration in East Asia. A number of studies show that higher

108
exchange rate volatility will lead to fewer transactions in trade in assets, as well as trade in goods.
Danthine et al. [2000] and Fratzscher [2001] provide evidence that the introduction of the Euro has
increased the degree of financial integration in Euro countries. Spiegel [2004] also argues that
overall international borrowing is facilitated by the creation of monetary unions, particularly based
on the evidence from Portugal’s Accession to the EMU. Evidence supports the hypothesis that the
degree of financial integration has increased significantly after the introduction of the Euro.
Blanchard and Giavazzi [2002] show that correlations between current account positions and per
capita incomes increase more for future European Monetary Union (EMU) countries in 1990s,
suggesting that monetary integration enhanced financial integration.
Another special feature after the financial crisis is that East Asia had accumulated a
substantial amount of dollar reserve assets. East Asia, with a ‘fear of floating’ against the US dollar,
have intervened in the foreign exchange market so as to moderate excessive volatility of exchange
rates and moreover to maintain competitiveness of export sectors. They were also inclined to build
up a capacity to draw on reserve in contingency so that it reduces the vulnerabilities to the any
future possible external disturbances.
The East Asian economies tended to hoard their reserves in low-yielding US Treasuries and
other dollar denominated financial assets. This strong tendency of East Asia to invest in
dollar-denominated safe-assets must have had a negative impact on regional integration. This
post-crisis experience has provoked questions on what is the optimal exchange rate regime for East
Asia. Whether East Asia can emulate the European experience of monetary integration by taking
necessary steps to build requisite institutions and policies that eventually lead to the formation of a
monetary union must be an important issue.

109
TABLE-A1. TOTAL PORTFOLIO ASSET HOLDINGS BY EAST ASIA AND EUROPE IN 2003
A. Amount in million US$
PORTFOLIO ASSETS HELD IN EACH REGION Source Country USA Europe Japan East Asia
*. Total
Hong Kong 46670 90297 10443 54686 334912 Indonesia 450 276 3 205 1814 Japan 620208 608173 . 21871 1721314 Korea 7961 2871 243 1368 17343 Malaysia 301 389 19 763 1664 Philippines 2535 716 14 256 3681 Singapore 22605 55973 3457 29095 143875 Thailand 1764 563 0 80 2748 Average 87812 94907 1772 13541 278419 (31.5) (34.1) (0.6) (4.9) (100)Austria 20426 145910 1910 2620 206807 Belgium 32390 285306 2004 3247 417785 Denmark 29131 71793 2989 5537 126994 Finland 8737 88407 925 1559 107412 France 152142 994453 29881 37920 1367001 Germany 133346 765107 25764 32106 1205127 Greece 4822 16028 45 66 33996 Iceland 881 1361 69 170 3687 Ireland 222525 456613 17657 26409 811644 Italy 98845 381471 11683 15927 791064 Netherlands 217186 460379 18623 29758 782593 Norway 42254 110746 12153 14156 184358 Portugal 5841 64644 126 126 97290 Spain 36771 298674 1426 2556 432701 Sweden 65613 98273 8504 10890 213706 Switzerland 95804 284273 12306 16050 654432 United Kingdom 431712 721464 118497 188027 1729515 Average 94025 308524 15562 22772 539183 (17.4) (57.2) (2.9) (4.2) (100)United States . 1700000 291850 447089 3134244 (54.2) (9.3) (14.3) (100)
* 10 countries including Japan
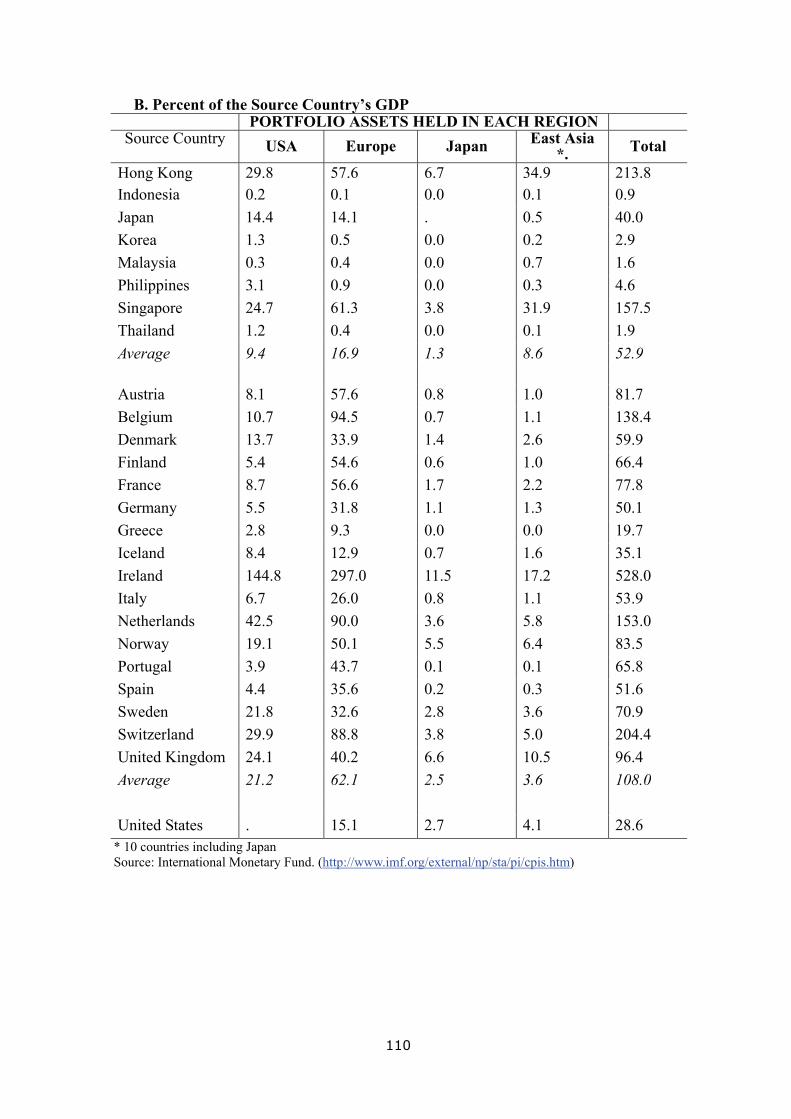
110
B. Percent of the Source Country’s GDP PORTFOLIO ASSETS HELD IN EACH REGION
Source Country USA Europe Japan East Asia *. Total
Hong Kong 29.8 57.6 6.7 34.9 213.8 Indonesia 0.2 0.1 0.0 0.1 0.9 Japan 14.4 14.1 . 0.5 40.0 Korea 1.3 0.5 0.0 0.2 2.9 Malaysia 0.3 0.4 0.0 0.7 1.6 Philippines 3.1 0.9 0.0 0.3 4.6 Singapore 24.7 61.3 3.8 31.9 157.5 Thailand 1.2 0.4 0.0 0.1 1.9 Average 9.4 16.9 1.3 8.6 52.9 Austria 8.1 57.6 0.8 1.0 81.7 Belgium 10.7 94.5 0.7 1.1 138.4 Denmark 13.7 33.9 1.4 2.6 59.9 Finland 5.4 54.6 0.6 1.0 66.4 France 8.7 56.6 1.7 2.2 77.8 Germany 5.5 31.8 1.1 1.3 50.1 Greece 2.8 9.3 0.0 0.0 19.7 Iceland 8.4 12.9 0.7 1.6 35.1 Ireland 144.8 297.0 11.5 17.2 528.0 Italy 6.7 26.0 0.8 1.1 53.9 Netherlands 42.5 90.0 3.6 5.8 153.0 Norway 19.1 50.1 5.5 6.4 83.5 Portugal 3.9 43.7 0.1 0.1 65.8 Spain 4.4 35.6 0.2 0.3 51.6 Sweden 21.8 32.6 2.8 3.6 70.9 Switzerland 29.9 88.8 3.8 5.0 204.4 United Kingdom 24.1 40.2 6.6 10.5 96.4 Average 21.2 62.1 2.5 3.6 108.0 United States . 15.1 2.7 4.1 28.6
* 10 countries including Japan Source: International Monetary Fund. (http://www.imf.org/external/np/sta/pi/cpis.htm)

111
TABLE-A2. TOTAL PORTFOLIO ASSETS INVESTED IN EAST ASIA AND EUROPE IN 2003
A. Amount in million US$ PORTFOLIO ASSETS HELD BY EACH REGION
Host Country USA Europe Japan East Asia *. Total
China 13738 10419 2518 24837 53891Hong Kong 37661 37873 7181 12130 101780Indonesia 5072 3120 141 2826 17673Japan 291850 264562 . 14179 640846Korea 53429 35848 5289 21022 124184Malaysia 7953 8101 1705 13453 32608Philippines 5046 4873 1314 3347 14837Singapore 25001 15075 2707 9243 55692Thailand 7339 7253 1016 7287 25402Average 48150 41856 2150 9276 112558 42.8 37.2 1.9 8.2 100Austria 10372 146525 11205 12895 190588Belgium 16987 153876 15296 17485 231942Denmark 22141 69923 7144 9906 118522Finland 41126 103179 6743 7677 165691France 183425 671931 90335 105843 1090209Germany 186611 959861 154751 172932 1543115Greece 5935 118441 4424 4808 140189Iceland 143 8645 314 461 10697Ireland 33470 218784 33713 40438 323338Italy 66931 693464 58380 60966 928263Netherlands 182193 714909 61329 74540 1070618Norway 21243 38558 10808 13635 82399Portugal 5276 88753 1449 2028 104123Spain 51547 345414 21760 23827 460039Sweden 45257 124330 21598 24559 231035Switzerland 119715 136531 9375 11183 302818United Kingdom 663120 651778 99549 176075 1670051Average 97382 308524 35775 44662 509626 19.1 60.5 7.0 8.8 100United States . 1.60E+06 620208 702494 2822191
* 10 countries including Japan Source: International Monetary Fund. (http://www.imf.org/external/np/sta/pi/cpis.htm)

112
B. Percent of the Host Country’s GDP PORTFOLIO ASSETS HELD BY EACH REGION
Host Country USA Europe Japan East Asia *. Total
China 1.0 0.7 0.2 1.8 3.8Hong Kong 24.0 24.2 4.6 7.7 65Indonesia 2.4 1.5 0.1 1.4 8.5Japan 6.8 6.2 . 0.3 14.9Korea 8.8 5.9 0.9 3.5 20.5Malaysia 7.7 7.8 1.6 13 31.4Philippines 6.3 6 1.6 4.2 18.4Singapore 27.4 16.5 3 10.1 61Thailand 5.1 5.1 0.7 5.1 17.8Average 9.8 8.1 1.4 5.0 26.4 Austria 4.1 57.9 4.4 5.1 75.3Belgium 5.6 51 5.1 5.8 76.8Denmark 10.4 33 3.4 4.7 55.9Finland 25.4 63.7 4.2 4.7 102.4France 10.4 38.2 5.1 6 62Germany 7.8 39.9 6.4 7.2 64.2Greece 3.4 68.8 2.6 2.8 81.4Iceland 1.4 82.2 3 4.4 101.8Ireland 21.8 142.3 21.9 26.3 210.3Italy 4.6 47.2 4 4.2 63.2Netherlands 35.6 139.8 12 14.6 209.3Norway 9.6 17.5 4.9 6.2 37.3Portugal 3.6 60 1 1.4 70.4Spain 6.1 41.2 2.6 2.8 54.9Sweden 15 41.2 7.2 8.1 76.6Switzerland 37.4 42.7 2.9 3.5 94.6United Kingdom 36.9 36.3 5.5 9.8 93Average 14.1 59.0 5.7 6.9 90.0 United States . 14.6 5.7 6.4 25.8
* 10 countries including Japan Source: International Monetary Fund. (http://www.imf.org/external/np/sta/pi/cpis.htm)

113
TABLE-A3. TOTAL EQUITY ASSET HOLDINGS BY EAST ASIA AND EUROPE IN 2003
A. Amount in million US$ EQUITY ASSETS HELD IN EACH REGION
Source Country USA Europe Japan East Asia *. Total
Hong Kong 8016 34743 3290 26520 152831 Indonesia 1 9 0 2 16 Japan 142798 84870 . 10612 274457 Korea 961 194 171 288 3416 Malaysia 93 47 19 640 853 Philippines 143 . . 2 166 Singapore 6973 8969 2089 11939 42739 Thailand 42 33 0 31 248 Average 19878 16108 696 6254 59341 33.5 27.1 1.2 10.5 100 Austria 8472 22106 1346 1761 44045 Belgium 12024 58976 1425 2423 140276 Denmark 14070 25402 2839 5102 52079 Finland 4940 24444 921 1553 36493 France 53238 203490 15796 20884 337712 Germany 63797 198740 13680 18456 440814 Greece 1408 1445 35 42 3949 Iceland 837 1110 69 170 3362 Ireland 66227 94761 11433 19628 211415 Italy 38500 102739 9968 13505 331012 Netherlands 140070 128774 14859 24113 327136 Norway 23076 37522 5185 6665 76359 Portugal 1083 5238 105 105 11453 Spain 8787 50220 1034 2081 83407 Sweden 46630 52316 6665 8995 141731 Switzerland 52079 82880 8929 11757 293656 United Kingdom 200870 261894 81686 138016 749802 Average 43300 79533 10351 16192 193218 22.4 41.2 5.4 8.4 100 United States . 1.10E+06 255496 392415 2080302 52.9 12.3 18.9 100.0
* 10 countries including Japan Source: International Monetary Fund. (http://www.imf.org/external/np/sta/pi/cpis.htm)

114
B. (Percent of the Source Country’s GDP) EQUITY ASSETS HELD IN EACH REGION
Source Country USA Europe Japan East Asia *. Total
Hong Kong 5.1 22.2 2.1 16.9 97.5Indonesia 0.0 0.0 0.0 0.0 0.01Japan 3.3 2 . 0.2 6.4Korea 0.2 0.03 0.03 0.05 0.6Malaysia 0.1 0.05 0.02 0.6 0.8Philippines 0.2 . . 0 0.2Singapore 7.6 9.8 2.3 13.1 46.8Thailand 0.03 0.02 0.0 0.02 0.2Average 2.1 4.3 0.6 3.9 19.1 Austria 3.3 8.7 0.5 0.7 17.4Belgium 4 19.5 0.5 0.8 46.5Denmark 6.6 12 1.3 2.4 24.6Finland 3.1 15.1 0.6 1 22.5France 3 11.6 0.9 1.2 19.2Germany 2.7 8.3 0.6 0.8 18.3Greece 0.8 0.8 0.02 0.02 2.3Iceland 8 10.6 0.7 1.6 32Ireland 43.1 61.6 7.4 12.8 137.5Italy 2.6 7 0.7 0.9 22.5Netherlands 27.4 25.2 2.9 4.7 64Norway 10.4 17 2.3 3 34.6Portugal 0.7 3.5 0.1 0.1 7.7Spain 1 6 0.1 0.2 9.9Sweden 15.5 17.3 2.2 3 47Switzerland 16.3 25.9 2.8 3.7 91.7United Kingdom 11.2 14.6 4.6 7.7 41.8Average 9.4 15.6 1.7 2.6 37.6 United States . 10.1 2.3 3.6 19Hong Kong 5.1 22.2 2.1 16.9 97.5
* 10 countries including Japan Source: International Monetary Fund. (http://www.imf.org/external/np/sta/pi/cpis.htm)

115
TABLE-A4. TOTAL EQUITY ASSETS INVESTED IN EAST ASIA AND EUROPE IN 2003
A. Amount in million US$ EQUITY ASSETS HELD BY EACH REGION
Host Country USA Europe Japan East Asia *. Total
China 13064 8944 2094 19625 45788Hong Kong 36210 35223 5594 7901 92889Indonesia 4406 2542 89 922 12597Japan 255496 175975 . 5569 493763Korea 49121 27702 708 3579 92822Malaysia 4075 4862 296 3258 14544Philippines 1634 683 158 325 3027Singapore 21932 12579 1280 4096 42857Thailand 6477 6746 393 4759 21291Average 42150 29590 946 3379 85977 49.0 34.4 1.1 3.9 100Austria 3927 7998 191 262 13742Belgium 10621 23481 802 982 47600Denmark 10429 10060 671 2475 29775Finland 35162 51589 1892 2016 97198France 130761 217076 11872 13283 409700Germany 103239 164860 8713 9446 324638Greece 3957 5260 309 501 10972Iceland 3 117 0 0 413Ireland 22191 96321 3215 6322 142826Italy 38971 88296 3764 3952 155448Netherlands 115792 167946 5831 6278 321313Norway 11972 8180 399 430 22767Portugal 3949 6107 290 302 11869Spain 43801 81956 3721 3978 145384Sweden 27529 40567 2113 2232 79529Switzerland 117910 120751 8204 8875 278145United Kingdom 420684 261492 32883 67531 863045Average 64759 79533 4992 7580 173786 37.3 45.8 2.9 4.4 100United States . 736108 142798 159027 1228012
* 10 countries including Japan Source: International Monetary Fund. (http://www.imf.org/external/np/sta/pi/cpis.htm)

116
B. Percent of the Host Country’s GDP EQUITY ASSETS HELD BY EACH REGION
Host Country USA Europe Japan East Asia *. Total
China 0.9 0.6 0.1 1.4 3.2Hong Kong 23.1 22.5 3.6 5 59.3Indonesia 2.1 1.2 0.04 0.4 6Japan 5.9 4.1 . 0.1 11.5Korea 8.1 4.6 0.1 0.6 15.3Malaysia 3.9 4.7 0.3 3.1 14Philippines 2.0 0.8 0.2 0.4 3.8Singapore 24 13.8 1.4 4.5 46.9Thailand 4.5 4.7 0.3 3.3 14.9Average 8.2 6.3 0.7 1.9 19.1 Austria 1.6 3.2 0.1 0.1 5.4Belgium 3.5 7.8 0.3 0.3 15.8Denmark 4.9 4.7 0.3 1.2 14.1Finland 21.7 31.9 1.2 1.2 60France 7.4 12.4 0.7 0.8 23.3Germany 4.3 6.9 0.4 0.4 13.5Greece 2.3 3.1 0.2 0.3 6.4Iceland 0.03 1.1 0.0 0.0 3.9Ireland 14.4 62.7 2.1 4.1 92.9Italy 2.7 6 0.3 0.3 10.6Netherlands 22.6 32.8 1.1 1.2 62.8Norway 5.4 3.7 0.2 0.2 10.3Portugal 2.7 4.1 0.2 0.2 8Spain 5.2 9.8 0.4 0.5 17.3Sweden 9.1 13.5 0.7 0.7 26.4Switzerland 36.8 37.7 2.6 2.8 86.9United Kingdom 23.4 14.6 1.8 3.8 48.1Average 9.9 15.1 0.7 1.1 29.7 United States . 6.7 1.3 1.5 11.2
* 10 countries including Japan Source: International Monetary Fund. (http://www.imf.org/external/np/sta/pi/cpis.htm)

117
TABLE-A5. LONG-TERM DEBT SECURITIES HOLDINGS BY EAST ASIA AND EUROPE IN 2003
A. Amount in million US$ LONG-TERM DEBT SECURITIES HELD IN
EACH REGION Source Country USA Europe Japan East Asia
*. Total
Hong Kong 33652 48879 6553 22264 154096Indonesia 367 267 3 202 1715Japan 463351 512126 . 10726 1407173Korea 6963 2625 72 1083 13833Malaysia 208 330 . 122 800Philippines 1601 149 13 243 2202Singapore 14311 20170 1316 9916 57580Thailand 1526 514 0 49 2224Average 65247 73133 995 5576 204953 31.8 35.7 0.5 2.7 100 Austria 11546 121443 563 842 159527Belgium 18663 216436 575 814 264307Denmark 14629 45565 151 436 73562Finland 3695 59462 5 7 66278France 84038 697638 12900 15292 909723Germany 64634 558624 12084 13650 750020Greece 3368 14085 10 24 29444Iceland 43 248 0 0 319Ireland 69564 262058 6224 6781 385738Italy 60167 273155 1686 2394 453666Netherlands 76083 328403 3640 5515 449007Norway 18209 71402 6968 7492 105187Portugal 4566 47604 22 22 71083Spain 27226 237234 389 473 327488Sweden 17510 42234 1839 1896 66010Switzerland 42024 191006 3377 4294 335424United Kingdom 210752 392475 . 7692 875658Average 42748 209357 2967 3978 313085 13.7 66.9 0.9 1.3 100 United States . 402604 35682 53718 868948 46.3 4.1 6.2 100.0
* 10 countries including Japan Source: International Monetary Fund. (http://www.imf.org/external/np/sta/pi/cpis.htm)

118
B. Percent of the Source Country’s GDP LONG-TERM DEBT SECURITIES HELD IN
EACH REGION Source Country USA Europe Japan East Asia
*. Total
Hong Kong 21.5 31.2 4.2 14.2 98.4Indonesia 0.2 0.1 0.0 0.1 0.8Japan 10.8 11.9 . 0.2 32.7Korea 1.2 0.4 0.01 0.2 2.3Malaysia 0.2 0.3 . 0.1 0.8Philippines 2 0.2 0.02 0.3 2.7Singapore 15.7 22.1 1.4 10.9 63Thailand 1.1 0.4 0.0 0.03 1.6Average 6.6 8.3 0.7 3.3 25.3 Austria 4.6 48 0.2 0.3 63Belgium 6.2 71.7 0.2 0.3 87.5Denmark 6.9 21.5 0.1 0.2 34.7Finland 2.3 36.7 0.0 0.0 40.9France 4.8 39.7 0.7 0.9 51.8Germany 2.7 23.2 0.5 0.6 31.2Greece 2 8.2 0.01 0.01 17.1Iceland 0.4 2.4 0.0 0.0 3Ireland 45.3 170.5 4.0 4.4 250.9Italy 4.1 18.6 0.1 0.2 30.9Netherlands 14.9 64.2 0.7 1.1 87.8Norway 8.2 32.3 3.2 3.4 47.6Portugal 3.1 32.2 0.01 0.01 48.1Spain 3.2 28.3 0.05 0.1 39Sweden 5.8 14 0.6 0.6 21.9Switzerland 13.1 59.7 1.1 1.3 104.8United Kingdom 11.7 21.9 . 0.4 48.8Average 8.2 40.8 0.7 0.8 59.4 United States . 3.7 0.3 0.5 7.9Hong Kong 21.5 31.2 4.2 14.2 98.4
* 10 countries including Japan Source: International Monetary Fund. (http://www.imf.org/external/np/sta/pi/cpis.htm)
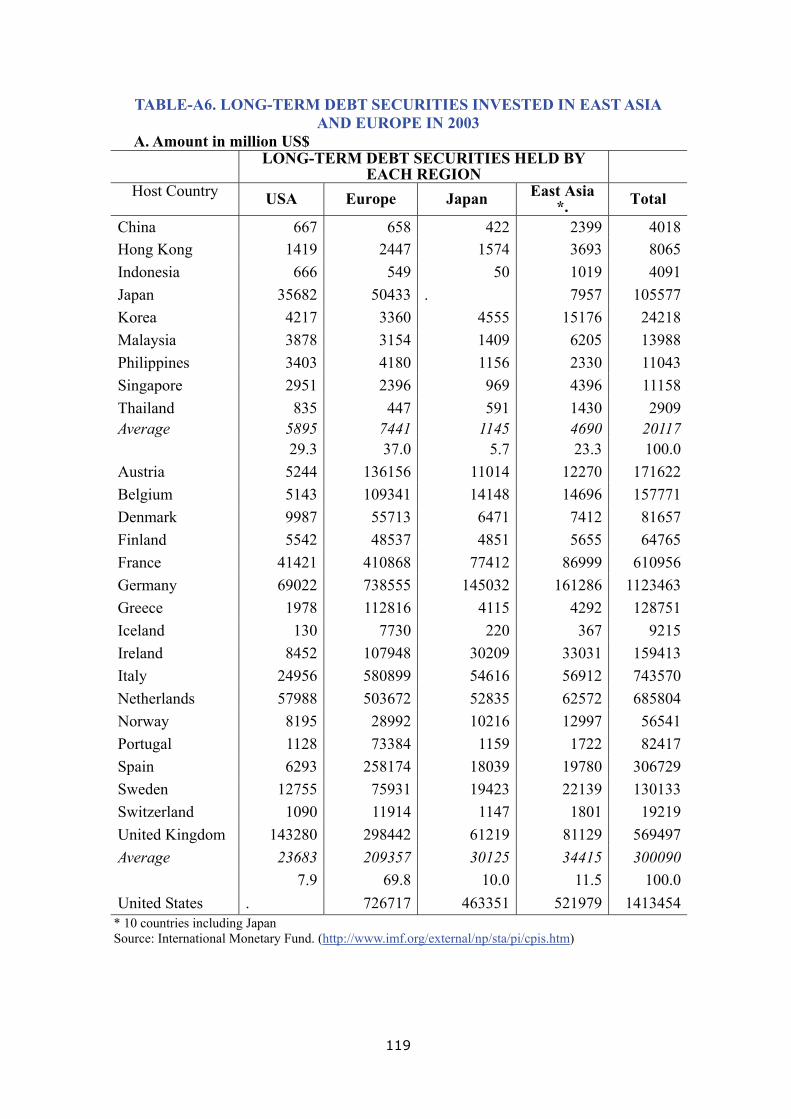
119
TABLE-A6. LONG-TERM DEBT SECURITIES INVESTED IN EAST ASIA AND EUROPE IN 2003
A. Amount in million US$ LONG-TERM DEBT SECURITIES HELD BY
EACH REGION Host Country USA Europe Japan East Asia
*. Total
China 667 658 422 2399 4018Hong Kong 1419 2447 1574 3693 8065Indonesia 666 549 50 1019 4091Japan 35682 50433 . 7957 105577Korea 4217 3360 4555 15176 24218Malaysia 3878 3154 1409 6205 13988Philippines 3403 4180 1156 2330 11043Singapore 2951 2396 969 4396 11158Thailand 835 447 591 1430 2909Average 5895 7441 1145 4690 20117 29.3 37.0 5.7 23.3 100.0 Austria 5244 136156 11014 12270 171622Belgium 5143 109341 14148 14696 157771Denmark 9987 55713 6471 7412 81657Finland 5542 48537 4851 5655 64765France 41421 410868 77412 86999 610956Germany 69022 738555 145032 161286 1123463Greece 1978 112816 4115 4292 128751Iceland 130 7730 220 367 9215Ireland 8452 107948 30209 33031 159413Italy 24956 580899 54616 56912 743570Netherlands 57988 503672 52835 62572 685804Norway 8195 28992 10216 12997 56541Portugal 1128 73384 1159 1722 82417Spain 6293 258174 18039 19780 306729Sweden 12755 75931 19423 22139 130133Switzerland 1090 11914 1147 1801 19219United Kingdom 143280 298442 61219 81129 569497Average 23683 209357 30125 34415 300090 7.9 69.8 10.0 11.5 100.0 United States . 726717 463351 521979 1413454
* 10 countries including Japan Source: International Monetary Fund. (http://www.imf.org/external/np/sta/pi/cpis.htm)

120
B. Percent of the Host Country’s GDP
LONG-TERM DEBT SECURITIES HELD BY EACH REGION
Host Country USA Europe Japan East Asia *. Total
China 0.05 0.05 0.03 0.2 0.3Hong Kong 0.9 1.6 1 2.4 5.1Indonesia 0.3 0.3 0.02 0.5 2Japan 0.8 1.2 . 0.2 2.5Korea 0.7 0.6 0.8 2.5 4.0Malaysia 3.7 3.0 1.4 6.0 13.5Philippines 4.2 5.2 1.4 2.9 13.7Singapore 3.2 2.6 1.1 4.8 12.2Thailand 0.6 0.3 0.4 1.0 2.0Average 1.6 1.6 0.7 2.3 6.1 Austria 2.1 53.8 4.4 4.8 67.8Belgium 1.7 36.2 4.7 4.9 52.3Denmark 4.7 26.3 3.1 3.5 38.5Finland 3.4 30.0 3.0 3.5 40France 2.4 23.4 4.4 4.9 34.8Germany 2.9 30.7 6.0 6.7 46.7Greece 1.1 65.5 2.4 2.5 74.8Iceland 1.2 73.5 2.1 3.5 87.7Ireland 5.5 70.2 19.7 21.5 103.7Italy 1.7 39.6 3.7 3.9 50.6Netherlands 11.3 98.5 10.3 12.2 134.1Norway 3.7 13.1 4.6 5.9 25.6Portugal 0.8 49.6 0.8 1.2 55.7Spain 0.8 30.8 2.2 2.4 36.6Sweden 4.2 25.2 6.4 7.3 43.1Switzerland 0.3 3.7 0.4 0.6 6United Kingdom 8 16.6 3.4 4.5 31.7Average 3.3 40.4 4.8 5.5 54.7 United States . 6.6 4.2 4.8 12.9
* 10 countries including Japan Source: International Monetary Fund. (http://www.imf.org/external/np/sta/pi/cpis.htm)

121
TABLE- A7. SHORT-TERM DEBT SECURITIES HOLDINGS BY EAST ASIA AND EUROPE IN 2003
A. Amount in million US$ SHORT-TERM DEBT SECURITIES HELD IN
EACH REGION Source Country USA Europe Japan East Asia
*. Total
Hong Kong 5001 6672 600 5900 27985 Indonesia 82 . . 0 82 Japan 14059 11175 . 530 39684 Korea 38 56 0 0 94 Malaysia 0 12 . 0 12 Philippines 790 . . . 1313 Singapore 1320 26835 52 7238 43556 Thailand 196 17 0 0 276 Average 2686 5596 82 1709 14125 19.0 39.6 0.6 12.1 100 Austria 408 2361 0 16 3236 Belgium 1703 9889 4 10 13201 Denmark 432 825 0 0 1354 Finland 103 4502 . . 4641 France 14866 93324 1186 1747 119566 Germany 4916 7743 0 0 14293 Greece 45 500 0 0 602 Iceland 1 3 0 0 6 Ireland 86735 99796 0 0 214492 Italy 178 5573 29 29 6386 Netherlands 1033 3201 125 129 6450 Norway 970 1821 0 0 2811 Portugal 193 11804 0 0 14754 Spain 758 11222 3 3 21806 Sweden 1473 3725 0 0 5965 Switzerland 1701 10388 . 0 25351 United Kingdom 20090 63302 . 278 104055 Average 7977 19411 79 130 32881 24.3 59.0 0.2 0.4 100 United States . 151990 672 956 184994 82.2 0.4 0.5 100.0
* 10 countries including Japan Source: International Monetary Fund. (http://www.imf.org/external/np/sta/pi/cpis.htm)
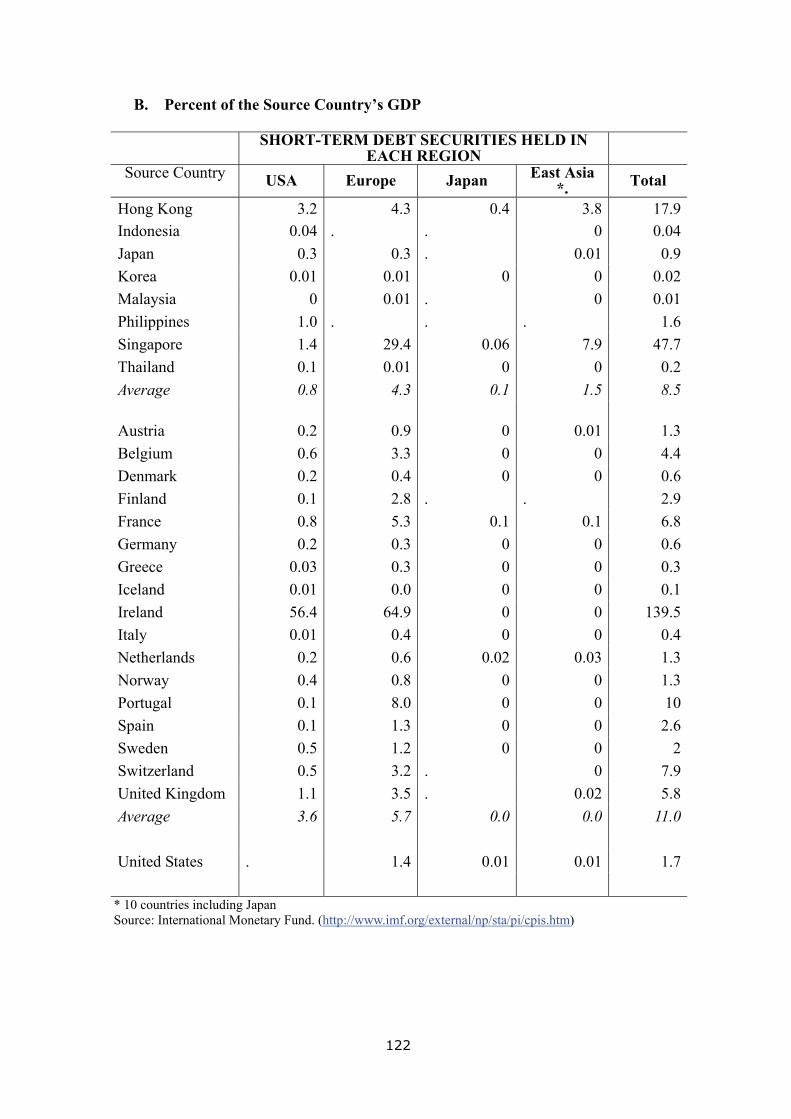
122
B. Percent of the Source Country’s GDP
SHORT-TERM DEBT SECURITIES HELD IN EACH REGION
Source Country USA Europe Japan East Asia *. Total
Hong Kong 3.2 4.3 0.4 3.8 17.9Indonesia 0.04 . . 0 0.04Japan 0.3 0.3 . 0.01 0.9Korea 0.01 0.01 0 0 0.02Malaysia 0 0.01 . 0 0.01Philippines 1.0 . . . 1.6Singapore 1.4 29.4 0.06 7.9 47.7Thailand 0.1 0.01 0 0 0.2Average 0.8 4.3 0.1 1.5 8.5 Austria 0.2 0.9 0 0.01 1.3Belgium 0.6 3.3 0 0 4.4Denmark 0.2 0.4 0 0 0.6Finland 0.1 2.8 . . 2.9France 0.8 5.3 0.1 0.1 6.8Germany 0.2 0.3 0 0 0.6Greece 0.03 0.3 0 0 0.3Iceland 0.01 0.0 0 0 0.1Ireland 56.4 64.9 0 0 139.5Italy 0.01 0.4 0 0 0.4Netherlands 0.2 0.6 0.02 0.03 1.3Norway 0.4 0.8 0 0 1.3Portugal 0.1 8.0 0 0 10Spain 0.1 1.3 0 0 2.6Sweden 0.5 1.2 0 0 2Switzerland 0.5 3.2 . 0 7.9United Kingdom 1.1 3.5 . 0.02 5.8Average 3.6 5.7 0.0 0.0 11.0 United States . 1.4 0.01 0.01 1.7
* 10 countries including Japan Source: International Monetary Fund. (http://www.imf.org/external/np/sta/pi/cpis.htm)

123
TABLE-A8. SHORT-TERM DEBT SECURITIES INVESTED IN EAST ASIA AND EUROPE IN 2003
A. Amount in million US$ Short-term debt securities held by Each Region
Host Country USA Europe Japan East Asia *. Total
China 7 0 1 2809 3141Hong Kong 32 200 12 533 821Indonesia 0 29 2 881 948Japan 672 1347 . 652 3026Korea 91 373 25 2264 2729Malaysia 0 84 0 3989 4075Philippines 9 13 0 692 716Singapore 118 103 458 753 1658Thailand 27 63 32 1095 1199Average 105 246 59 1207 1686 6.3 14.6 3.5 71.6 100.0 Austria 1201 2368 0 362 5056Belgium 1223 21059 345 1736 26309Denmark 1725 4152 2 20 6857Finland 422 3052 0 6 3690France 11243 43988 1051 5561 68357Germany 14350 56446 1007 2182 92591Greece 0 362 0 14 407Iceland 10 599 93 93 868Ireland 2827 14514 289 1068 20840Italy 3004 24271 0 97 29208Netherlands 8413 43287 2663 5613 62064Norway 1076 1389 193 198 2954Portugal 199 5670 0 3 6243Spain 1453 5283 0 66 7914Sweden 4973 7834 61 187 21392Switzerland 715 3862 24 504 5210United Kingdom 99156 91843 5447 27057 232066Average 8941 19411 657 2633 34825 25.7 55.7 1.9 7.6 100.0 United States . 135605 14059 21486 180735
* 10 countries including Japan Source: International Monetary Fund. (http://www.imf.org/external/np/sta/pi/cpis.htm)

124
B. Percent of the Host Country’s GDP Short-term debt securities held by Each Region
Host Country USA Europe Japan East Asia *. Total
China 0 0 0 0.2 0.2Hong Kong 0.02 0.1 0.01 0.3 0.5Indonesia 0 0.01 0 0.4 0.5Japan 0.02 0.03 . 0.02 0.1Korea 0.02 0.06 0 0.4 0.5Malaysia 0 0.1 0 3.9 3.9Philippines 0.01 0.02 0 0.9 0.9Singapore 0.1 0.1 0.5 0.8 1.8Thailand 0.02 0.04 0.02 0.8 0.8Average 0.0 0.0 0.1 0.8 1.0 Austria 0.5 0.9 0.0 0.1 2Belgium 0.4 7 0.1 0.6 8.7Denmark 0.8 2 0.0 0.01 3.2Finland 0.3 1.9 0.0 0 2.3France 0.6 2.5 0.1 0.3 3.9Germany 0.6 2.3 0.04 0.1 3.9Greece 0 0.2 0 0.01 0.2Iceland 0.1 5.7 0.9 0.9 8.3Ireland 1.8 9.4 0.2 0.7 13.6Italy 0.2 1.7 0 0.01 2Netherlands 1.6 8.5 0.5 1.1 12.1Norway 0.5 0.6 0.1 0.1 1.3Portugal 0.1 3.8 0 0.0 4.2Spain 0.2 0.6 0 0.01 0.9Sweden 1.6 2.6 0.02 0.1 7.1Switzerland 0.2 1.2 0.01 0.2 1.6United Kingdom 5.5 5.1 0.3 1.5 12.9Average 0.9 3.3 0.1 0.3 5.2 United States . 1.2 0.1 0.2 1.7
* 10 countries including Japan Source: International Monetary Fund. (http://www.imf.org/external/np/sta/pi/cpis.htm)

125
TABLE-A9. CROSS-BORDER BANK CLAIM HOLDINGS BY EAST ASIA AND EUROPE IN 2003
A. Amount in million US$ Bank Claims Held in Each Region
Source Country USA Europe Japan East Asia *. Total
Japan 488871 441207 . 90776 1238176 Korea 10750 10744 2596 18150 50788 Taiwan China 30862 19051 4289 21802 83238 Average 176828 157001 2295 43576 457401 38.7 34.3 0.5 9.5 100 Austria 3736 51957 995 4053 97814 Belgium 80825 484517 6038 24331 658014 Denmark 4086 71084 87 87 82235 Finland 7807 43785 359 849 57794 France 312637 669639 130574 179163 1353403 Germany 466975 1.60E+06 95941 162279 2576382 Greece 7425 24610 341 450 49948 Ireland 14088 281635 16416 16416 341728 Italy 25341 190880 3568 9305 328810 Netherlands 319987 649418 33702 75629 1190837 Norway 2069 10458 134 134 17192 Portugal 6857 49584 159 167 68854 Spain 27140 204188 575 1616 409445 Sweden 24903 163659 560 1897 216935 Switzerland 753963 537021 71290 108193 1565027 United Kingdom 540555 489272 48903 274479 1637409 Average 162400 345107 25603 53691 665739 24.4 51.8 3.8 8.1 100 United States . 409820 69552 165825 838340 48.9 8.3 19.8 100.0
* 10 countries including Japan

126
B. Percent of the Source Country’s GDP Bank Claims Held in Each Region
Source Country USA Europe Japan East Asia *. Total
Japan 11.4 10.3 . 2.1 28.8 Korea 1.8 1.8 0.4 3 8.4 Taiwan China 10.8 6.7 1.5 7.6 29.1 Average 8.0 6.3 0.6 4.2 22.1 Austria 1.5 20.5 0.4 1.6 38.6 Belgium 26.8 160.5 2.0 8.1 218 Denmark 1.9 33.5 0.04 0.04 38.8 Finland 4.8 27 0.2 0.5 35.7 France 17.8 38.1 7.4 10.2 77 Germany 19.4 65.5 4.0 6.8 107.2 Greece 4.3 14.3 0.2 0.3 29 Ireland 9.2 183.2 10.7 10.7 222.3 Italy 1.7 13 0.2 0.6 22.4 Netherlands 62.6 127 6.6 14.8 232.8 Norway 0.9 4.7 0.1 0.1 7.8 Portugal 4.6 33.5 0.1 0.1 46.6 Spain 3.2 24.3 0.1 0.2 48.8 Sweden 8.3 54.3 0.2 0.6 71.9 Switzerland 235.5 167.8 22.3 33.8 488.9 United Kingdom 30.1 27.3 2.7 15.3 91.2 Average 27.0 62.2 3.6 6.5 111.1 United States . 3.7 0.6 1.5 7.7
* 10 countries including Japan Source: The Bank for International Settlements. (http://www.bis.org/statistics/histstats10.htm).

127
TABLE-A10. CROSS-BORDER BANK CLAIMS HELD IN EAST ASIA AND EUROPE IN 2003
A. Amount in million US$
Bank Claims held by Each Region Host Country USA Europe Japan East Asia
*. Total
China 4714 30241 11623 15766 51952Hong Kong SAR 19348 183371 23440 37220 248028Indonesia 2781 21877 5697 7526 32653Japan 69552 409642 . 6885 495740Korea 17375 49768 12134 14572 86479Malaysia 9503 26976 5002 6323 43101Philippines 4614 13210 2563 3712 21967Singapore 15900 72098 17483 24746 119258Taiwan China 17587 34381 4005 4385 56941Thailand 4451 17484 8829 9593 31597Average 16111 82881 7915 11496 113576 14.2 73.0 7.0 10.1 100.0 Austria 6330 178293 4220 4339 190590Belgium 13725 255915 12982 13686 286834Denmark 9820 108422 4034 4291 123497Finland 2056 48890 3523 3681 54824France 31147 499441 58218 61153 600717Germany 74242 711776 96717 100471 900662Greece 6050 83383 2970 3091 92993Iceland 59 6844 309 347 7250Ireland 8984 236873 13397 14818 268570Italy 27325 517649 34207 34874 583371Luxembourg 8280 212934 38686 44939 269746Netherlands 33980 406780 30960 32615 481812Norway 8266 89465 2843 3043 101011Portugal 2284 121464 1652 1877 128499Spain 15460 309778 16456 16891 344772Sweden 7013 95435 8631 8869 113658Switzerland 13478 116946 8073 8571 141391United Kingdom 141321 1.50E+06 103329 113446 1864669Average 22768 305572 24512 26167 364159 6.3 83.9 6.7 7.2 100.0 United States . 2.60E+06 488871 530483 3358676 77.4 14.6 15.8 100.0
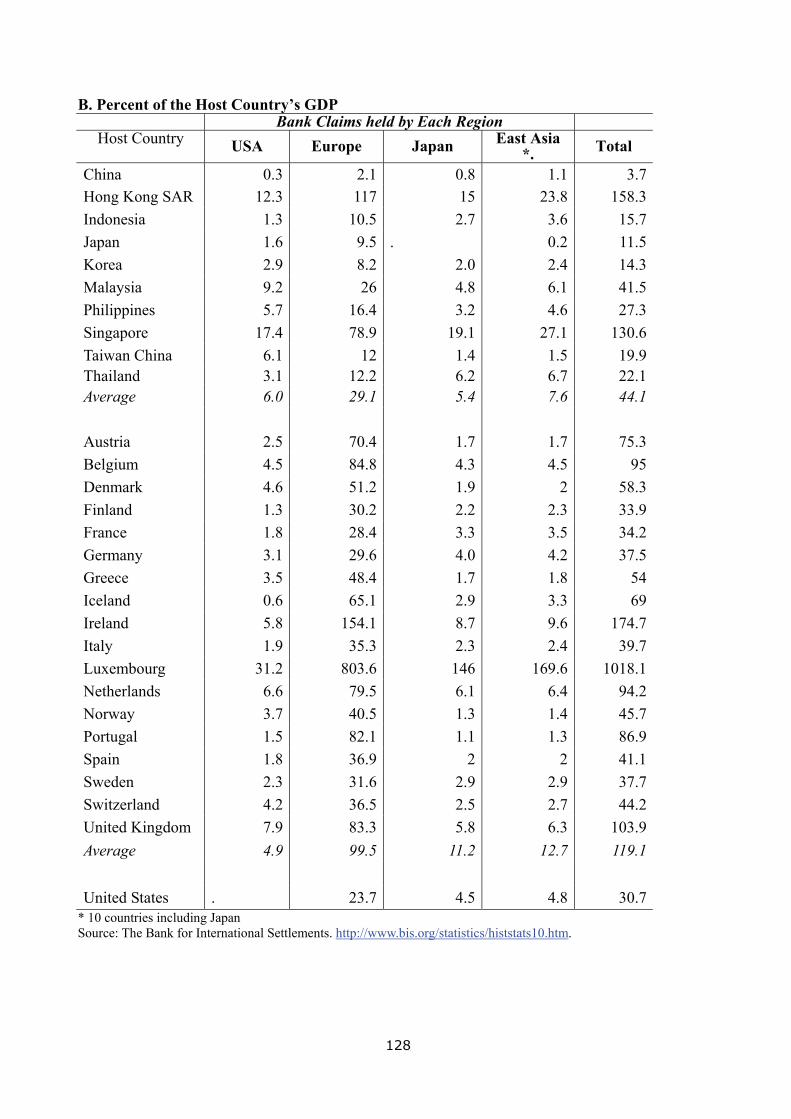
128
B. Percent of the Host Country’s GDP Bank Claims held by Each Region
Host Country USA Europe Japan East Asia *. Total
China 0.3 2.1 0.8 1.1 3.7 Hong Kong SAR 12.3 117 15 23.8 158.3 Indonesia 1.3 10.5 2.7 3.6 15.7 Japan 1.6 9.5 . 0.2 11.5 Korea 2.9 8.2 2.0 2.4 14.3 Malaysia 9.2 26 4.8 6.1 41.5 Philippines 5.7 16.4 3.2 4.6 27.3 Singapore 17.4 78.9 19.1 27.1 130.6 Taiwan China 6.1 12 1.4 1.5 19.9 Thailand 3.1 12.2 6.2 6.7 22.1 Average 6.0 29.1 5.4 7.6 44.1 Austria 2.5 70.4 1.7 1.7 75.3 Belgium 4.5 84.8 4.3 4.5 95 Denmark 4.6 51.2 1.9 2 58.3 Finland 1.3 30.2 2.2 2.3 33.9 France 1.8 28.4 3.3 3.5 34.2 Germany 3.1 29.6 4.0 4.2 37.5 Greece 3.5 48.4 1.7 1.8 54 Iceland 0.6 65.1 2.9 3.3 69 Ireland 5.8 154.1 8.7 9.6 174.7 Italy 1.9 35.3 2.3 2.4 39.7 Luxembourg 31.2 803.6 146 169.6 1018.1 Netherlands 6.6 79.5 6.1 6.4 94.2 Norway 3.7 40.5 1.3 1.4 45.7 Portugal 1.5 82.1 1.1 1.3 86.9 Spain 1.8 36.9 2 2 41.1 Sweden 2.3 31.6 2.9 2.9 37.7 Switzerland 4.2 36.5 2.5 2.7 44.2 United Kingdom 7.9 83.3 5.8 6.3 103.9 Average 4.9 99.5 11.2 12.7 119.1 United States . 23.7 4.5 4.8 30.7
* 10 countries including Japan Source: The Bank for International Settlements. http://www.bis.org/statistics/histstats10.htm.

129
TABLE-A11. DETERMINANTS OF TOTAL INTERNATIONAL PORTFOLIO ASSET HOLDINGS
(1) (2) (3) (4) GDP of source country 0.124 0.118 0.121 0.104 [0.009] [0.009] [0.009] [0.008] GDP of destination country 0.148 0.142 0.142 0.125
[0.009] [0.009] [0.008] [0.008] Per capita GDP of source 0.175 0.182 0.114 0.092 [0.013] [0.013] [0.012] [0.011] Per capita GDP of destination 0.133 0.139 0.08 0.064
[0.011] [0.011] [0.011] [0.010] Area size of source -0.029 -0.026 -0.037 -0.042 [0.007] [0.007] [0.006] [0.006] Area size of destination 0.033 0.036 0.026 0.019 [0.007] [0.007] [0.006] [0.006] Distance -0.156 -0.151 -0.016 -0.024 [0.017] [0.017] [0.016] [0.015] Border 0.660 0.661 0.549 0.576 [0.091] [0.091] [0.083] [0.075] Common language 0.126 0.119 0.161 0.139 [0.036] [0.036] [0.032] [0.030] Ex-common colonizer 0.152 0.151 0.191 0.141 [0.069] [0.069] [0.063] [0.058] Ex-colony-colonizer -0.109 -0.097 -0.13 -0.137 [0.105] [0.105] [0.095] [0.086] Intra-East Asia dummy 0.427 0.578 0.647 [0.129] [0.116] [0.104] Intra-Europe dummy 2.235 2.35 [0.074] [0.067] East Asia-US dummy 3.241 [0.202] Europe-US dummy 4.234 [0.158] Observation 12888 12888 12888 12888 R-squared 0.358 0.357 0.433 0.514
Note: The dependent variable is source country’s cross-border holding of destination country ’s total portfolio assets. It is taken logarithm after adding 1 to include all the observations with value zero. All other explanatory variables except the dummy variables are taken logarithm. Random effect estimation technique is used. Robust standard errors of the estimated coefficients are reported in parentheses. Intercept and year dummy variables are included (not reported).

130
TABLE-A12. DETERMINANTS OF TOTAL INTERNATIONAL PORTFOLIO ASSET HOLDINGS: CONTROLLING BILATERAL TRADE
(1) (2) (3) (4) Bilateral trade (lagged) 0.686 0.733 0.667 0.591 [0.015] [0.016] [0.015] [0.015] GDP of source country -0.097 -0.097 -0.075 -0.064 [0.009] [0.009] [0.009] [0.008] GDP of destination country -0.070 -0.071 -0.052 -0.040
[0.009] [0.009] [0.008] [0.008] Per capita GDP of source 0.197 0.181 0.125 0.106 [0.011] [0.011] [0.011] [0.010] Per capita GDP of destination 0.140 0.126 0.080 0.067
[0.010] [0.010] [0.009] [0.009] Area size of source -0.004 -0.011 -0.021 -0.027 [0.006] [0.006] [0.005] [0.005] Area size of destination 0.054 0.047 0.037 0.030 [0.006] [0.006] [0.006] [0.005] Distance 0.030 0.029 0.121 0.103 [0.015] [0.015] [0.014] [0.013] Border -0.086 -0.141 -0.152 -0.050 [0.077] [0.077] [0.070] [0.066] Common language 0.046 0.061 0.101 0.099 [0.030] [0.029] [0.027] [0.026] Ex-common colonizer -0.104 -0.118 -0.064 -0.073 [0.058] [0.058] [0.054] [0.051] Ex-colony-colonizer -0.281 -0.324 -0.329 -0.300 [0.087] [0.086] [0.079] [0.074] Intra-East Asia dummy -1.071 -0.818 -0.614 [0.108] [0.099] [0.093] Intra-Europe dummy 1.704 1.854 [0.062] [0.058] East Asia-US dummy 1.429 [0.176] Europe-US dummy 3.251 [0.136] Observation 12888 12888 12888 12888 R-squared 0.358 0.357 0.433 0.514
Note: The bilateral trade variable is log (1+real bilateral trade volume). See notes to TABLE-A11.

131
TABLE-A13. DETERMINANTS OF VARIOUS TYPES OF INTERNATIONAL FINANCIAL ASSET HOLDINGS
Equity Long-term
Securities Short-term Securities
Bank Claims
GDP of source country 0.021 0.146 0.032 0.522 [0.007] [0.008] [0.004] [0.019] GDP of destination 0.132 0.065 0.018 0.244 [0.006] [0.007] [0.004] [0.016] Per capita GDP of source 0.097 -0.020 -0.023 0.481 [0.010] [0.011] [0.006] [0.033] Per capita GDP of destination -0.014 0.095 0.027 0.216
[0.008] [0.009] [0.005] [0.022] Area size of source 0.014 -0.093 -0.019 -0.179 [0.005] [0.006] [0.003] [0.014] Area size of destination -0.033 0.05 0.007 0.04 [0.005] [0.005] [0.003] [0.013] Distance 0.023 -0.016 0.007 -0.22 [0.013] [0.013] [0.007] [0.033] Border 0.517 0.487 0.300 1.161 [0.063] [0.065] [0.031] [0.157] Common language 0.149 0.074 0.066 0.456 [0.025] [0.026] [0.013] [0.071] Ex-common colonizer 0.133 0.140 0.006 -- [0.053] [0.056] [0.030] -- Ex-colony-colonizer -0.122 -0.139 -0.038 0.689 [0.072] [0.074] [0.034] [0.134] Intra-East Asia dummy 0.545 0.426 -0.063 1.254 [0.089] [0.089] [0.047] [0.236] Intra-Europe dummy 2.838 2.334 0.656 1.696 [0.168] [0.166] [0.079] [0.301] East Asia-US dummy 1.472 2.164 0.648 0.665 [0.055] [0.055] [0.024] [0.108] Europe-US dummy 4.081 3.394 2.088 1.662 [0.131] [0.130] [0.054] [0.234] Observation 11862 11960 10068 4867 R-squared 0.329 0.432 0.211 0.622
Note: The dependent variable is source country’s holding of each type of destination country’s financial assets. See notes to Table-A11.

132
TABLE-A14. DETERMINANTS OF VARIOUS TYPES OF INTERNATIONAL FINANCIAL ASSET HOLDINGS: CONTROLLING BILATERAL TRADE
Equity Long-term
Securities Short-term Securities
Bank Claims
Bilateral trade (lagged) 0.445 0.484 0.151 0.781 [0.013] [0.013] [0.007] [0.027] GDP of source country -0.107 0.001 -0.014 0.200 [0.008] [0.008] [0.005] [0.019] GDP of destination 0.003 -0.070 -0.028 -0.054 [0.007] [0.007] [0.004] [0.018] Per capita GDP of source 0.112 0.000 -0.015 0.446 [0.009] [0.010] [0.006] [0.030] Per capita GDP of destination -0.010 0.093 0.027 0.196
[0.008] [0.008] [0.004] [0.018] Area size of source 0.026 -0.075 -0.015 -0.148 [0.005] [0.005] [0.003] [0.012] Area size of destination -0.020 0.056 0.011 0.060 [0.005] [0.005] [0.003] [0.011] Distance 0.116 0.083 0.039 -0.007 [0.012] [0.012] [0.007] [0.028] Border 0.048 -0.047 0.125 0.220 [0.057] [0.058] [0.031] [0.132] Common language 0.117 0.034 0.058 0.299 [0.023] [0.023] [0.012] [0.059] Ex-common colonizer -0.051 -0.067 -0.062 -- [0.048] [0.050] [0.030] -- Ex-colony-colonizer -0.247 -0.258 -0.078 0.541 [0.064] [0.065] [0.033] [0.109] Intra-East Asia dummy -0.424 -0.597 -0.366 -0.317 [0.083] [0.080] [0.047] [0.199] Intra-Europe dummy 1.486 0.870 0.211 -0.169 [0.151] [0.145] [0.077] [0.253] East Asia-US dummy 1.101 1.767 0.529 0.318 [0.050] [0.048] [0.024] [0.089] Europe-US dummy 3.348 2.610 1.856 0.907 [0.116] [0.112] [0.052] [0.190] Observation 11862 11960 10068 4867 R-squared 0.329 0.432 0.211 0.622
Note: See notes to Tables A12 and A13.

133
TABLE-A15. VOLUME OF DIFFERENT TYPES OF FINANCING IN ASIAN ECONOMIES AND SELECTED COUNTRIES IN 2003
Bank
Loans
% of GDP
Stock Market Capitalization
% of GDP
Bond Marke
t
% of GDP
Public
Sector
Bonds
(% in total bond)
Private
Sector Bonds
(% in total bond)
$ bn % $ bn % $ bn % $ bn % $ bn % Hong Kong 239.3 150.4 714.6 449.
3 71.8 45.2 22.8 31.7 49.1 68.3
Indonesia 45.7 21.5 54.7 25.8 6.2 2.9 4.6 74.0 1.6 26.0 Korea 571.3 94.4 298.2 49.3 380.0 62.8 201.8 53.1 178.2 46.9 Malaysia 104.6 101.4 168.4 163.
2 78.9 76.5 36.4 46.1 42.5 53.9
Philippines 23.5 29.9 23.2 29.5 2.3 3.0 1.5 64.6 0.8 35.4 Singapore 101.6 108.5 148.5 158.
6 62.6 66.9 39.3 62.7 23.4 37.3
Taiwan 374.5 129.2 379.0 130.7
126.8 43.7 76.2 60.1 50.6 39.9
Thailand 113.5 75.7 119.0 79.4 63.6 42.4 48.2 75.9 15.3 24.1 Average 196.8 93.1 238.2 112.
7 99.0 46.8 53.8 54.4 45.2 45.6
Japan 4,533 97.5 2,953 63.5 5,981 128.
6 4,989 83.4 992 16.6
United States 8,321 73.9 14,173 125.8
20,137 178.8
12,004 59.6 8,134 40.4
U. K. 2,792 142.1 2,426 123.4
1,031 52.5 583 56.5 448 43.5
Sources: International Financial Statistics, International Federation of Stock Exchanges, Japan Securities Dealers Association, IFC Bond Database, Thai Bond Dealing Centre, Thomson Financial, CEIC, and various central banks; reproduced from Park, Park, Leung, and Sangsubhan (2004). Notes: 1. Bank loans are domestic credit extended to the private sector. All bank loan data, except Taiwan, are reported on
line 32d in the International Financial Statistics (September 2003). 2. outstanding bond data are as of end-2003, except for Japan and Singapore (end-2002), Indonesia (end-2000) and
the Philippines (end-1999). Figures are local-currency denominated debt. 3. Bond figures for Hong Kong, Korea, Malaysia, Taiwan, the United States, the United Kingdom, and Japan are from
central banks. Figures for Indonesia and the Philippines are from IFC Emerging Markets Information Centre Bond Database. Figures for Thailand are from the Thai Bond Dealing Centre. Figures for Singapore are estimates based on data from MAS and Thomson Financial.
4. Public sector refers to government bodies and quasi-government entities. Private sector refers to non-public sector and includes financial institutions, corporations, and overseas institutions.

134
6.2 ATTACHMENT-B: REGIONAL FINANCIAL COOPERATION WITHIN ASIA
Early attempts to promote regional financial cooperation to the effects of the original
ASEAN-5’s establishment of US$100 million Asian Swap Agreement (ASA) facility in August
1977. This was increased to US$200 million a year later to provide immediate short-term liquidity
shortage solutions for members in crisis, using short term swap facilities. This was followed by the
proposal to establish the Asian Monetary Fund (AMF) to supplement the resources of the IMF but
was NOT supported by the US, the IMF and China, and so was put under the rug.
In November 1997, the Manila Framework Group (MFG) was established “to develop a
concerted framework for Asia-Pacific financial cooperation to restore and enhance financial
stability prospects in the region” [Kawai, 2004.].
Cognizant of the importance of establishing a framework by which policy dialogue and
policymaking may be enhanced, the ASEAN established a Surveillance Process in October 1998.
This process involved (1) a monitoring mechanism of key economic and financial variables, which
might indicate the onset of a crisis; and (2) peer review mechanism to support appropriate policy
response of concerned members.
The New Miyazawa Initiative, in October 1998, significantly contributed to the resolution
of the crisis and facilitated the recovery process, via Japan’s US$30 billion.
Shortly after, the US decided to assist in the economic recovery process of AFC-affected
countries by establishing, together with Japan, the Asia Growth and Recovery Initiative (AGRI).
However, despite support from the World Bank and the Asian Development Bank (ADB), it did not
generate additional resources for Asia’s restructuring process nor did it yield visible results [Kawai,
2004]. The good thing that came out of it though was the strengthening of the bond guarantee
function of the World Bank and the ADB.
THE CHIANG MAI INITIATIVE (CMI), A HALLMARK MEASURE TO IMPROVE REGIONAL SELF-PROTECTION
In May 2000, the Finance Ministers of ASEAN+3 countries agreed to establish a regional
network of bilateral swap agreement (BSA) for its members, and were thus referred to as the

135
CHIANG MAI INITIATIVE. The idea behind BSAs is for a country (under speculative attack) to
be able to borrow foreign currency, usually US dollars, from another member country and use these
funds to buy its own currency to stabilize the exchange rate. The general terms of borrowing are 90
days maturity, renewable up to seven times, with interest based on LIBOR plus a spread.62
The following tables record the progression of BSAs under the CMI.
TABLE-B1. BILATERAL SWAP ARRANGEMENTS UNDER CMI, as of October 2002
BSAs CURRENCIES SIZE (US$)
Japan-China Yen-RMB 3 billion equivalent Japan-Malaysia USD-Ringgit 3.5 billion Japan-Philippines USD-Peso 3 billion Japan-Korea USD-Won 7 billion Japan-Singapore USD-S$ * Japan-Thailand USD-Baht 3 billion China-Malaysia USD-Ringgit 1.5 billion China-Philippines USD-peso 3 billion* China-Korea RMB-Won 2 billion equivalent China-Thailand USD-Baht 2 billion Korea-Malaysia USD-Ringgit * Korea-Philippines USD-Peso * Korea-Thailand USD-Baht 1 billion Note: * under negotiation Source:http://www/mof/gp/jp/jouhou/kokkin/pcmie.htm, as cited in Wang[2002:91].
62 For the 1st drawing and 1st renewal, the spread is 150 basis points and for every two renewals 50 additional basis points, subject to a maximum of 300 basis points

136
TABLE-B2. BILATERAL SWAP ARRANGEMENTS UNDER CMI, as of end-2003
BSAs CURRENCIES SIZE (US$) Japan-Korea USD-Won 7 billion*(1-way) Japan-Thailand USD-Baht 3.billion (1-way) Japan-Philippines USD-Peso 3 billion (1-way_ Japan-Malaysia USD-Ringgit 3.5 billion** (1-way) China-Thailand USD-Baht 2.0 billion (1-way) Japan-China Yen-RMB 3 billion***(2-way) China-Korea RMB-Won 2 billion*** (2-way) Korea-Thailand USD-Won or USD-Baht 1 billion (2-way) Korea-Malaysia USD-Won or USD-Ringgit 1 billion (2-way) Korea-Philippines USD-Won or USD-Peso 1 billion (2-way) China-Malaysia USD-Ringgit 1.5 billion (1-way) Japan-Indonesia USD-Rupiah 3.0 (1-way) China-Philippines RMB-Peso 1 billion*** (1-way) Japan-Singapore USD-S$ 1 billion (1-way) Korea-Indonesia USD-Won or USD-Rupiah 1 billion (1-way) China-Indonesia USD-Rupiah 1 billion (2-way) Notes: * This amount includes US$5 billion committed under the New Miyazawa Initiative. **This amount includes US$2.5 billion committed under the New Miyazawa Initiative. ***The amounts are US equivalents. Source: Kawai, 2004:22
TABLE-B3. STATUS OF THE BSA NETWORK, as of NOVEMBER 2004
BSAs CURRENCIES TOTAL SIZE (US$) Japan-Thailand USD-Baht 3 billion Japan-Malaysia USD-Ringgit 1 billion China-Thailand USD-Baht 2.0 billion Japan-China Yen-RMB 6 billion Korea-Thailand USD-Baht 2 billion China-Korea RMB-Won 4 billion Korea-Malaysia USD-Ringgit 2 billion Korea-Philippines USD-Peso 2 billion China-Malaysia USD-Ringgit 1.5 billion Japan-Indonesia USD-Rupiah 3 billion China-Philippines RMB-Peso 1 billion Japan-Singapore USD-S$ 1 billion Korea-Indonesia USD-Rupiah 2 billion China-Indonesia USD-Rupiah 1 billion Japan-Korea USD-Won 2 billion Japan-Philippines USD-Peso 3 billion Source: ASEAN Secretariat, 2005
One feature of the CMI is that its short-term liquidity support is equivalent only to 10

137
percent of the BSA facility. The remaining 90 percent is provided under an IMF program or an
activated CCL. In this sense, the amount of liquidity available through CMI is very small compared
to what global financial markets can mobilize. Nevertheless, the BSAs under the CMI act as a
strong symbolic effect, signaling markets that liquidity is available and can be extended, if
necessary. By sending a strong positive signal to the region, this form of institutional commitment
therefore benefit member countries in managing capital flows by taming liquidity-related
anxieties, and reducing the volatility of market sentiment and herd behavior.
Apart from providing member countries an institutional structure to help stabilize their
exchange rates, the CMI is also an avenue by which these countries have improved the efficiency
with which they utilize their financial resources, particularly the build-up of reserves. [See
Table-B4] Post-AFC, most Asian countries started to accumulate foreign exchange reserves to
ensure themselves of a buffer in the event of a future speculative currency attack. For example,
Korea’s total reserves increased from US$20.4 billion in 1997 to almost US$96 billion in 2000.
Thailand, the country first hit by the crisis, has almost doubled its 1997 reserves of US$26.8 to
US$49.8 billion by end-2004. By enabling member countries to pool their excess reserves and
create new credit facilities for themselves, the CMI provided a channel by which countries may
balance, more effectively, the opportunity costs of holding large reserves against its perceived
benefits [Wang, 2002].
TABLE-B4. Post-AFC Development in International Reserves (US$ billions) 1997 1998 2000 2002 2004
Indonesia 16.6 22.7 28.5 32.0 36.3
Malaysia 20.8 25.6 29.5 34.2 66.4
Philippines 8.7 10.8 15.0 16.3 16.2
Singapore 71.2 74.9 80.1 82.0 112.2
Thailand 26.8 29.5 32.6 38.9 49.8
Source: ADB Key Indicators, 2005.
In order for the CMI to function effectively, a regional economic and financial surveillance
system must be in place to support the facilitations of BSAs, and hasten the activation and
disbursement process of swaps. Frequent exchange of information and policy dialogue are essential
components of any meaningful financial and economic cooperation framework. Several

138
surveillance mechanisms have been established not only to analyze the macro-financial policies and
environments of member countries, but to identify, as well, vulnerable economic spots. It is hoped
that through frank and candid exchanges of views, countries maybe coaxed into formulating and
executing sound and viable policies. Table-B5 indicates that except for China’s non-membership in
the SEACEN, these countries participate in regional forums, especially those involving finance
ministries and central banks.
TABLE-B5. REGIONAL FORUMS for FINANCE MINISTRIES AND CENTRAL BANKS/A
ASEAN ASEAN+3 MFG/B APEC ASEM/C SEANZA SEACEN EMEAPChina ... x x x x x … x Indonesia x x x x x x x x Korea … x x x x x x x Malaysia x x x x x x x x Philippines x x x x x x x x Singapore x x x x x x x x Thailand x x x x x x x x Notes: A => APEC (Asia Pacific Economic Cooperation); ASEAN (Association of South East Asian Nations); EMEAP (Executives Meeting of East Asia-pacific Central Banks; MFG (Manila Framework Group); SEACEN (Southeast Asian central Banks); SEANZA (Southeast Asia, New Zealand and Australia). B => MFG includes IMF, WB, ADB and BIS. C => ASEAN includes the European Commission Source: Kuroda and Kawai (2002), as cited in Kawai (2004).
The most important of these surveillance mechanisms, as far as capital flow is concerned,
is the ASEAN+3 EPRD process introduced in May 2000. This is because its focus is on monitoring
regional capital flows and strengthening banking and financial mechanisms. It also supports reforms
aimed at enhancing self-help and support mechanisms in East Asia and reforms related to
international financial architecture. However, the mechanisms for assessing regional financial
vulnerabilities is not yet as effective because (apart from ADB provision of data on member
countries) there has yet to be an independent, professional organization that will prepare
comprehensive analytical assessment papers to review and support the surveillance process.
SEACEN EXPERT GROUP (SEG) ON CAPITAL FLOWS63
The SEACEN Centre established the SEACEN Expert Group (SEG) on Capital Flows in
May 2000. This was a direct response to the call for ways of managing capital flows to ensure 63 Basic information on the SEG was sourced from the SEACEN website.
139
stability in regional financial markets. On 1 June 2001, the SEACEN Board of Governors (BOG)
also approved the proposal by the SEG to set up an electronic data exchange facility at the
SEACEN Centre. The SEG (co-chaired by BNM of Malaysia and BSP of the Philippines) has 17
member central banks, viz. the 14 SEACEN member central banks, and 3 SEACEN observers,
namely the Reserve Bank of Australia, Hong Kong Monetary Authority and Bank of Japan.
The SEG’s objectives are centered on (1) the development of a regional framework to
promote information sharing on capital flows among members; and (2) the drawing up of concrete
and practical proposals that SEG members can implement individually or collectively to enhance
the management of capital flows. However, it seems that much of the work and accomplishments of
SEG are linked to the first objective, specifically with respect to exchange of information. For
example, in order to promote the sharing of capital flows data, the SEG has created the SEG
Directory (to facilitate the exchange of information and clarification among members) and the SEG
Data Templates on Capital Flows (which SEG members report on a regular basis). An electronic
data exchange facility was also established but online information on capital flow-related data are
secure and maybe accessed only by authorized SEG officials. Regular teleconferencing exchanges
are also held to discuss trends, developments, issues and related concerns.
SEG also contributes to capacity building by holding several workshops to enhance
expertise in the areas of compilation and usage of international finance statistics, risk management
of capital flows and development of early warning systems. This is done with the help of experts
from the Ministry of Finance of Japan, Bank for International Settlements (BIS), the World Bank,
the International Monetary Fund (IMF) and international bankers.
The SEG has to accelerate its efforts and be more aggressive in mobilizing resources within
its membership in order to achieve, as soon as possible, its second objective which is the
establishment of “concrete and practical proposals that SEG members can implement individually
or collectively to enhance the management of capital flows”. The attainment of this objective will
have a major and direct impact on how countries within the region may approach the critical
management of capital flows to maximize individual country benefits. Information sharing and
surveillance are undoubtedly useful in crisis prevention, but are just means to an end. Without a
concrete “Asian framework for capital flow management”, no amount of policy-dialogue and
information exchange will suffice as effective and sustainable means of preventing, managing and
resolving the next round of crisis.

140

141
7. LIST OF TABLES
In PART 2:
Table-1. List of Leading Indicators Used in the Zhuang and Dowling EWS Model
Table-2. Summary of Policy Lessons from the AFC and Recommended Measures
In PART 3: Table-3. List of Banking Groups in Malaysia Table-4. Selected Financial Soundness Indicators for the Financial Corporate Sector in Singapore, 1996 - 2001 Table-5. Financial Soundness Indicators of Singapore’s Commercial Banking Sector, 1998 - 2003 (in percent unless otherwise specified) Table-6. Summary of Observance of OECD Corporate Governance Principles: Thailand and World Average Table-7. Summary of Observance of OECD Corporate Governance Principles: Thailand and World Average Table-8. Philippine Banking Sector Indicators, 1999-2004
In PART 6.1 (Attachment-A):
Table-A1. Total Portfolio Asset Holdings by East Asia and Europe in 2003 Table-A2. Total Portfolio Assets Invested in East Asia and Europe in 2003 Table-A3. Total Equity Asset Holdings by East Asia and Europe in 2003 Table-A4. Total Equity Assets Invested in East Asia and Europe in 2003 Table-A5. Long-term Debt Securities Holdings by East Asia and Europe in 2003 Table-A6. Long-term Debt Securities Invested in East Asia and Europe in 2003 Table- A7. Short-term Debt Securities Holdings by East Asia and Europe in 2003 Table-A8. Short-term Debt Securities Invested in East Asia and Europe in 2003

142
Table-A9. Cross-Border Bank Claim Holdings by East Asia and Europe in 2003 Table-A10. Cross-Border Bank Claims held in East Asia and Europe in 2003 Table-A11. Determinants of Total International Portfolio Asset Holdings Table-A12. Determinants of Total International Portfolio Asset Holdings: Controlling Bilateral Trade Table-A13. Determinants of Various Types of International Financial Asset Holdings Table-A14. Determinants of Various Types of International Financial Asset Holdings: Controlling Bilateral Trade Table-A15. Volume of Different Types of Financing in Asian Economies and Selected Countries in 2003
In PART 6.2 (Attachment-B):
Table-B1. Bilateral Swap Arrangements Under CMI, as of October 2002 Table-B2. Bilateral Swap Arrangements Under CMI, as of October 2003 Table-B3. Status of the BSA network, as of NOVEMBER 2004 Table-B4. Post-AFC Development in International Reserves (US$ billions) Table-B5. Regional Forums for Finance Ministries and Central Banks
143
8. REFERENCES
ADB KEY INDICATORS. 2005. Alexander, Arthur. 2003. Korea’s Capital Investment: Returns at the Level of the Economy, Industry, and Firm. Special Studies Series 2. Washington. Korea Economic Institute. Alfaro, L., S. Kalemli-Ozcan and V.Volosovych. 2005. Capital Policies in a Globalized World: The Role of Policies and Institutions. August. (www.nber.org/books/ICF/alfaro-et-al8-12-05.pdf) Amess, Kevin and Demetriades, Panicos. Financial Liberalization and the South Korean Financial Crisis: Some Qualitative Evidence. APEC. Facilitating Cross-border Flows: the True Measure of Liberalization. (apecsec.org.sg/chap2.html) Ariff, M., S. Azmi and E.Y.S. Lin. Governance Re-invented: Progress, Constraints and Remaining Agenda in Bank and Corporate Restructuring in Malaysia. (www.unescap.org/drpad/publication/fin_2148/chap3.pdf) ASEAN+3 Research Group Studies. http://www.mof.go.jp/jouhou/kokkin/ASEAN+3research.htm ASEAN VISION 2020. http://www.aseansec.org/2357.htm Asian Development Bank. 2001. Corporate Governance and Finance in East Asia: A Study of Indonesia, Republic of Korea, Malaysia, Philippines, and Thailand Volume 2. Edited by Juzhong Zhuang, David Edwards, and Ma. Virginita Capulong. Baig, Taimur. 2001. Characterizing Exchange Rate Regimes in post-Crisis East Asia. IMF Working Paper WP/01/152. October. Batunanggar, Sukarela. Indonesia’s Banking Crisis Resolution: Lessons and the Way Forward. December 2002. http://www.bi.go.id/NR/rdonlyres/FF08B4FB-08A8-4835-9B39-E35EB615545A/517/ibcr0212.pdf Bello, Walden. Siamese Twins: The Currency Crises in Thailand and the Philippines. (www.focusweb.org/publications/1997/Siamese%20Twins.htm) Canlas, Dante B. 1999. Banking Risks, Financial Crises and Bank Regulation in the Philippines (Chapter 5). In Studies on Governance and Regulation: The Philippines, D. B. Canlas and S. Fujisaki, eds. Tokyo: Institute of Developing Economies Japan External Trade Organization. 77-98. Capital Investment and Policy Concerns – Malaysia. (http:// www.idrc.ca/en/ev-68157-201-1-DO_TOPIC.html ) Carlsson, Charlotte. Go with the Flows?: Capital Account Liberalisation. Globalization (2001).

144
ISSN:1935-9794. (http://globalization.icaap.org/content/v1.1/brettonwoods.html) Chai-Anant, Chayawadee. 2003. Effect of Policies on Capital Flows to Emerging Markets: Evidence from a Detailed Data Sheet. Bank of Thailand Discussion Paper (October). Cheong, Inkyo. 2005. East Asian Economic Integration: Korea’s Perspectives. Draft 2005-01-26. (http://www.rieb.kobe-u.ac.jp/academic/ra/seminar/2004/seminar-datails/cheong.pdf) Chino, Tadao. Speech on ASEAN+3 Seminar on Management of Short-term Capital Flows and Capital Account Liberalization. (http:// www.adb.org/Documents/Speeches/2002/ms2002133.asp) Cho, Yoon Jay. 2003. The Political Economy of the Financial Liberalization and Crisis in Korea. In C.H. Lee (ed.). Financial Liberalization and the Economic Crisis in Asia. Routledge. Choi, Byung-Sun. 1993. Financial Policy and Big Business in Korea: The Perils of Financial Regulation. In S. Haggard, C.H. Lee, and S Maxfield (eds.). The Politics of Fiance in Economic Development. Cornell University Press. Ithaca. Chua Hak Bin. 2003. FDI in the Financial Sector: The Experience of ASEAN Countries over the Last Decade. Monetary Authority of Singapore. March. A27 Committee on Singapore’s Competitiveness: Executive Summary. November 11, 1998. (http://unpan1.un.org/intradoc/groups/public/documents/APCITY/UNPAN004867.pdf) Corporate Governance and Finance in the Five Affected Countries. Corporate Governance and Finance in East Asia. (http://www.adb.org/Documents/Books/Corporate_Governance/Vol1/chapter1.pdf) (http://www.adb.org/Documents/Books/Corporate_Governance/Vol1/chapter2.pdf) (http://www.adb.org/Documents/Books/Corporate_Governance/Vol1/chapter3.pdf) (http://www.adb.org/Documents/Books/Corporate_Governance/Vol1/chapter4.pdf) Corsetti, G., P. Pesenti and N. Roubini. 1998. Fundamental Determinants of the Asian Crisis: A Preliminary Empirical Assessment. November. Current Situation of Capital Flows in the East Asian Region. (www.mof.go.jp/jouhou/hokkin/tyousa/tyou073d.pdf) Danareksa Research Institute. 2004. Toward a Regional Financial Architecture for East Asia (Executive Summary). February. Das, Dilip. 2005. Anatomy of a Crisis: Asia as Ground Zero. CJES Research Papers, No. 2005-4. Center for Japanese Economic Studies. Australia: Macquarie University. (http://www.econ.mq.edu.au/cjes/research/2005-4Das.pdf) Davies, Mervyn. Capital Flows Are Not Always Good News. (http://www.globalagendamagazine.com/2003/mervyndavies.asp) De Brouwer, Gordon. Capital Flows to East Asia: The Facts.

145
(http://econpapers.repec.org/bookchap/rbarbaacv/acv1999-05.htm) Dekle, Robert and Mahmood. Pradhan. 1997. Financial Liberalization and Money Demand in ASEAN Countries: Implications for Monetary Policy. IMF Working Paper WP/97/36 (March). Di Giovanni, Julian. 2002. What Drives Capital Flows? The Case of Cross-Border M&A Activity and Financial Deepening. Center for International and Development Economics Research Paper C01-122. (http://repositories.cdlib.org/iber/cider/C01-122) Disyatat, P. and D. Nakornthab. 2003. The Changing Nature of Financial Structure in Thailand and Implications for Policy. Bank of Thailand Discussion Paper (November). Djiwandono, Soedradjad. Banking System Soundness and Macroeconomic Management: The Recent Indonesian Experience. http://www.pacific.net.id/pakar/sj/banking.html Doing Business and Investing Worldwide Series 2000. PricewaterhouseCoopers. (http://efpo.fpo.go.th/efiscal/PWGuides/individualguides/DOCS/wcd00000/wcd00010.htm) Edwards, Sebastian. May 29, 2005. (http:// www.nber.org/books/ICF/introduction6-3-05.pdf) Edwards, Sebastian. 1999. The Mirage of Capital Controls. May. (http://www.anderson.ucla.edu/faculty/sebastian.edwards/for_aff.pdf) Eichengreen, B. and P. Luengnaruemitchai. 2004. Why Doesn’t Asian Have Bigger Bond Markets? NBER Working Paper 10576 (June). (www.nber.org/papers/w10576) Eichengreen, B., and T.J. Pempel. 2002. Why Has There Been Less Financial Integration in East Asia than in Europe? (http:// globetrotter.berkeley.edu/NewGeog/FinanInteg.pdf) Enoch, Charles. Interventions in Banks during Banking Crises: The Experience of Indonesia. IMF Policy Discussion Paper No- 00/2. March 2000. Financial and Corporate Sector Restructuring in East and South-East Asia: An Overview. (http://www.unescap.org/drpad/publication/fin_2148/chap1.pdf) Frankel, Jeffrey A. 1992. The Recent Liberalization of Korea’s Foreign Exchange Markets, and Tests of U.S. versus Japanese Influence. Seoul Journal of Economics, 5: 1 (Spring). Fung, Ben; George, Jason; Hohl, Stefan; and Ma, Guonan. 2004. Public Asset management Companies in East Asia. BIS Occasional Paper No. 3. February. Geneva WTO Ministerial Statement 1998. (http://www.wto.org/english/thewto_e/minist_e/min98_e/anniv_e/sing_e.htm) Ghosh S and Pangestu M. 1999. Macro financial linkages and build up of vulnerabilities. A background paper prepared for the ADB-World Bank Study on Managing Global Financial Integration in Asia: Emerging Lessons and Prospective Challenges. Draft, March.

146
Globalization: The role of Institution Building in the Financial Sector – The Case Study of China. August 2003. http://www.g8.utoronto.ca/g20.20030831_cs_chi.pdf Globalization: The Role of Institution building in the Financial Sector, The Case of Indonesia. http://www.g8.utoronto.ca/g20/20031026_cs_indo.pdf Gottschang, Thomas. 2001. The Asian Financial Crisis and Banking Reform in China and Vietnam. College of the Holy Cross, Department of Economics Faculty Research Series, Working Paper No. 02-02. August. Griffith-Jones, S. and Leape, J. Capital Flows to Developing Countries: Does the Emperor Have Clothes? (http://www.gapresearch.org/finance/Doestheemperorhaveclothesjan2002.pdf) Hamada, Miki. 2003. Transformation of the Financial Sector in Indonesia. IDE Research Paper No. 6. Institute of Developing Economies (IDE-JETRO). September. Hernandez, L. and P. Montiel. 2001. Post-crisis Exchange Rate Policy in Five Asian Countries: Filling in the “Hollow Middle”? IMF Working Paper WP/01/170 (November). Hirano, Toshihisa. Financial Sector FDI in Asian Economies: Some Stylized Facts and Observations. Bank of Japan. (http://www.bis.org/publ/cgfs22boj1.pdf) Hishikawa, Isao. 2003. Financial Sector FDI in Asia: Brief Overview. Bank of Japan. March. (http://www.bis.org/publ/cgfs22boj2.pdf) Intal, P. and G. Llanto. 1998. Financial Reform and Development in the Philippines, 1980-1997: Imperatives, Performance and Challenges. Philippine Institute of Development Studies. International Monetary Fund (IMF). 2005. Philippines: 2004 Article IV Consultation and Post-Program Monitoring Discussions – Staff Report; Staff Statement; Statement by the Executive Director for the Philippines; and Public Information Notice on the Executive Board Discussion. February. International Monetary Fund (IMF). 2004. Singapore: Financial System Stability Assessment, including Reports on the Observance of Standards and Codes on the following topics: Banking Supervision, Insurance Regulation, Securities Regulation, Payment and Settlements Systems, Monetary and Financial Policy. IMF Country Report No.04/104. International Monetary Fund (IMF). 2004. Labuan, Malaysia: Assessment of the Supervision and Regulation of the Financial Sector – Review of Financial Sector Regulation and Supervision. IMF Country Report No. 04/391. December. International Monetary Fund (IMF). 2004. Transparency and Anti-Money Laundering. (http://www.imf.org) Ito, Takatoshi. 1999. Capital Flows in Asia. NBER Working Paper Series 7134 (May). (http://www.nber.org/papers/w7134) Ji, Donghyun and Park, Jaeha. The Korean Banking Sector: Current Issues and Future Direction.

147
http://www.adb.org/Documents/Books/Rising_to_the_Challenge?Korea?korea-bnk.pdf. Juzhong Zhuang and J.Malcolm Dowling. 2002. Causes of the 1997 Asian Financial Crisis: What Can an Early Warning System Model Tell Us? ERD Working Paper No.26 (October). Asian Development Bank. (http://www.adb.org/Documents/ERD/Working_Papers/wp026.pdf) Kaminsky, Graciela L. 2003. International Capital Flows: a Blessing or a Curse? May. (http://www.un.org/docs/ecosoc/meetings/2005/docs/kaminsky.pdf) Kaminsky, G., C. Reinhart & C.A. Vegh. 2004. When it Rains, it Pours: Procyclical Capital Flows and Macroeconomic Policies. NBER Working Paper Series 10780 (September). (http://www.nber.org/papers/w10780) Kapur, Basant K. 2005. Capital Flows and Exchange Rate Volatility: Singapore’s Experience. NBER Working Paper Series 11369 (May). (http://www.nber.org/papers/w11369) Kawai, Masahiro. 2004. Regional Economic Integration and Cooperation in East Asia. June 7. (http://www.oecd.org/dataoecd/43/7/33628756.pdf) Kishi, Masumi and Hidenobu Okuda. Prudential Regulation and Supervision of the Financial System in East Asia. (http://www.mof.go.jp/jouhou/kokkin/tyousa/tyou041g.pdf) Krueger, Anne O. 2004. “The Gorgeous East”: What the Asian Economies Can Teach the World. Keynote address presented at Harvard Project for Asian and International Relation (HPAIR) Business Conference. Shanghai, China. (http://www.imf-org/external/np/speeches/2004/082104.htm) Lai, Quan B. Currency Crisis in Thailand: The Leading Indicators. (http://titan.iwu.edu/~econ/ppe/2000/quan.pdf) Lamberte, Mario B. 2001. The Philippine Payment System: Efficiency and Implications for the Conduct of Monetary Policy. Philippine Institute for Development Studies Discussion Paper Series No. 2001-20 (November). Lau, Lawrence J. 2004. Remarks on “Asian Regional Economy in a Multilateral Setting”. January. Lindgren, Carl-Johan; Baliño, Tomas J.T.; Enoch, Charles; Gulde, Anne-Marie; Quintyn, Marc; and Teo, Leslie. 1999. Financial Sector Crisis and Restructuring Lessons from Asia. International Monetary Fund Occasional Paper No. 188. Washington DC. Lipsey, Robert E. 2000. Interpreting Developed Countries’ Foreign Direct Investment. NBER Working Paper Series 7810 (July). (http://www.nber.org/papers/w7810). Ma, Guonan and McCauley, Robert N. 2005. Are China’s capital controls still binding? In the joint RIETI/BIS/BOC Conference Globalization of Financial Services in China: Implications for Capital Flows, Supervision and Monetary Policy. Beijing, China. 19 March. http://www.rieti.go.jp/en/events/05031901/pdf/5-1_ma_2.pdf.

148
Manlagnit, M.C. and M.B. Lamberte. 2004. Evaluating the Impacts of Competition Policy Reforms on the Efficiency of Philippine Commercial Banks. Philippine Institute for Development Studies (PIDS) Discussion Paper Series No. 2004-46 (December). McKay, Huw. 2005. What About the Capital Account? July 26. (www.atimes.com/atimes/China/GG26Ad02.html) McKinnon, Ronald I. 2001. The Dollar Standard and its Crisis-Prone Periphery: New Rules for the Game. August. (www.stanford.edu/~mckinnon/briefs/EADilemma.pdf) Mo, YK. 1999. A Review of Recent Banking Reforms in China. BIS Policy Papers No. 7:October. In Strengthening the Banking System in China: Issues and Experience. A joint BIS/PBC conference in Beijing, China. Monetary Authority of Singapore (MAS). MAS Monetary Policy Statement - October 11, 2005. (www.mas.gov.sg/masmcm/bin/pt1Monetary_Policy_Statement_11Oct05.htm) Monetary Authority of Singapore (MAS). 2005. Recent Economic Developments in Singapore, August 24. (http://www.mas.gov.sg/masmcm/bin/pt1Home.htm) Nasution, Anwar. 2000. The Meltdown of the Indonesian Economy in 1997-1998: Cause, Responses and Lessons. ASEAN Economic Bulletin. August. Nayak, P.Jayendra. Comment on ‘Capital flows to Asian Developing Countries: Past Trends and Future Prospect’ by Pradumna B. Rana. Ngiam Kee Kin. 2003. Singapore’s Financial Services Sector: The Road Ahead. Institute of Southeast Asian Studies. February. (www.tcf.or.jp/data/20030220-21_Kee-Jin_Ngiam.pdf) Noland, Marcus. 2005. South Korea’s Experience with International Capital Flows. National Bureau of Economic Research Working Paper No. 11381 (May). Noland, Marcus. 2000. The Philippines in the Asian Financial Crisis: How the Sick man Avoided Pneumonia. Asian Survey 40(3) May – June. (http://www.jsor.org) Oh, Junggun. Chapter IV. Governance Reinvented: The Progress, Constraints, and Remaining Agenda in Bank and Corporate Restructuring in the Republic of Korea. 2000. http://www.unescap.org/drpad/publication/fin_2148/chap4.pdf. Oh, Junggun and Park, Donghyun. Financial Reform and Financial Crisis in Korea. http://www.ntu.edu.sg/nbs/sabre/working_papers/08-98.pdf. Ojeda, R. H., R.K. McCleery and F. de Paolis. The Economy-wide Impact of Financial Liberalization in China and India: A Computable General Equilibrium Simulation. (http://naid.sppsr.ucla.edu/pubs&news/public/rrseries.html) Pangestu, Mari. 2003.The Indonesian Bank Crisis and Restructuring: Lessons and Implications for

149
other Developing Countries. G-24 Discussion Paper Series No. 23. November. Park and Lee. Post-Crisis Financial Reform in Korea: A Critical Appraisal http://www.economics.hawaii.edu/research/workingpapers/WP_04-10.pdf Poret, Pierre. 1998. Liberalising Capital Flows: Lessons from Asia. The OECD Observer 214 (October/November). Portes, Richard and Rey, Helene. 1999. The Determinants of Cross-Border Equity Flows. NBER Working Paper Series 7336 (September). (www.nber.org/papers/w7336) Prasad, E. and S. Wei. 2005. The Chinese Approach to Capital Inflows: Patterns and Possible Explanations. NBER Working Paper Series 11306 (April). (www.nber.org/papers/w11306) Progress and Institutional Arrangements for the Chiang Mai Initiative, 06 October 2003. (http://aric.adb.org/docs/CMI_rev.pdf) Rajan, Ramkishen S. 2004. Asian Economic Cooperation and Integration: Sequencing of Financial, Trade and Monetary Regionalism. July. (http://www.economics.adelaide.edu.au/staff/rrajan/pubs/Asiacointfinal.pdf) Rajan, Ramkishen S. 2002. Safeguarding Against Capital Account Crises: Unilateral, Regional and Multilateral Options for East Asia. Center for International Economic Studies Discussion Paper No. 0201 (January). Rana, Pradumna B. Private Capital Flows to Asian Developing Countries: Past Trends and Future Prospects. Razin, Assaf. 2002. FDI Contribution to Capital Flows and Investment in Capacity. NBER Working Paper Series 9204 (September). (http://www.nber.org/papers/w9204) A26. Regional Financial Cooperation Among ASEAN+3. (http://www.mof.go.jp/english/if/regional_financial_cooperation.htm) Report of the Sub-regional Seminar on Governance Re-invented: the Progress, Constraints, and Remaining Agenda in Bank and Corporate Restructuring in East and South-east Asia. May 30 – June 1, 2001. South Korea. Shanmugaratnam, Tharman. 2005. Asian Fianacial Market Development and Integration. Pravasi Bharatiya Divas 2005. January. Mumbai, India. Shirai, Sayuri. (n.d. ) Banking Sector Reforms in the People’s Republic of China: Progress and Constraints. www.unescap.org/drpad/publication/fin_2206/part3.pdf Siamwalla, Ammar. Picking up the Pieces: Bank and Corporate Restructuring in Post-1997 Thailand. (http://www.info.tdri.or.th/reports/published/picking.pdf) Speech of Mr. Heng Swee Keat, Managing Director MAS, at the 32nd Annual Dinner of the Association of Banks in Singapore. July 14, 2005. (www.mas.gov.sg/masmcm/bin/pt1Speech_by_MD_Heng_Swee_Keat_at_ABS_dinner_2005.htm)

150
Sussangkarn, Chalongphob. 2000. A Framework for Regional Monetary Stabilization. NIRA Review (Autumn). Tanikawa, Hiroya. 2004. Pitfall of Envisaged “East Asian Economic Integration” - Implications of Expanding Imbalances in the Global Economy. RIETI. June 8. (http://www.rieti.go.jp/en/columns/a01_0132.html) Thailand Monetary Policy. (www.bot.or.th/BOTHomepage/BankAtWork/monetary&fxpolicies/) The Joint Ministerial Statement of the 8th ASEAN+3 Finance Ministers’ Meeting. May 4, 2005. Istanbul, Turkey. (http://www.mof.go.jp/english/if/as3_050504.htm) Vichyanond, Pakorn (n.d). Management of Financial Flows in Southeast Asia. Thailand Development Research Institute. (http://www.unu.edu/hq/academic/Pg_area4/Vichyanond.html) Wang Seok-Dong. 2002. Regional Financial Cooperation in East Asia: The Chiang Mai Initiative and Beyond. Bulletin on Asia-Pacific Perspectives 2002/03. Williamson, John. 1999. Whether and When to Liberalize Capital Account and Financial Services. World Trade Organization Staff Working paper ERAD-99-03 (September). Williamson, J., S. Griffith-Jones and R. Gottschalk. 2003. Should Capital Controls have a Place in the Future International Monetary System? May. (http://www.stephanygj.com/_documents/Should_Capital_Controls_have_a_Place_in_the_Future_International_Monetary_System.pdf World Bank. Managing Capital Flows in East Asia. (http://www.itcilo.it/english/actrav/telearn/global/ilo/globe/eastasi2.htm) World Bank. Study on Korea’s Corporate Bond Market and Its Implications on China’s Bond Market Development. World Bank Country Study Paper. January 2004. World Economic and Social Survey 2005. International Private Capital Flows. Xiao, Geng. 2004. People’s Republic of China’s Round-tripping FDI: Scale, Causes, and Implications. Asian Development Bank Institute Discussion Paper No.7. July. Xiaopu, Zhang. Capital Account Management and its outlook in China. BIS Papers No 15. http://www.bis.org/publ/bpppdf/bispap15f.pdf. Yu Yongding. 2001. On East Asian Monetary Cooperation. Research Center for International Finance Working Paper Series No. 02. Chinese Academy of Social Sciences. August. www.worldbank.org/ifa/Philippinesrosc.pdf www.worldbank.org/ifa/rosc_sr_phl.pdf

151
www.worldbank.org/ifa/rosc_cg_malaysia.html www.worldbank.org/ifa/rosc_cg_tha.pdf www.worldbank.org/ifa/rosc_kor.htm www.worldbank.org/ifa/rosc_china.html www.worldbank.org/ifa/rosc_cg_idn.pdf http://cf.heritage.org/index2004test/country2.cmf?id=singapore

152
153
9. List of Authors Naoyuki Yoshino (Project Co-Leader) Professor, Keio University Director, Financial Research and Training Center of the Financial Services Agency Koichi Suzuki (Project Co-Leader) Executive Vice President, Daiwa Institute Research Visiting Professor, Graduate School for Business Nihon University Kazutomo Abe Professor, Tokyo Denki University Research Advisor, National Institute for Research Advancement Soko Tanaka Professor, Chuo University Masaki Yamaguchi Assistant Professor Yamagata University Jong-Wha Lee Professor, Economics Department Director, International Center for Korean Studies Doo Yong Yang Director, Korean Institute for International Economic Policy
STEVEN GOULDEN Research Assistant, Daiwa Institute of Research Mark Rushworth Research Assistant, Daiwa Institute of Research