Research, technological change and financial liberalization in South Korea
13
This article appeared in a journal published by Elsevier. The attached copy is furnished to the author for internal non-commercial research and education use, including for instruction at the authors institution and sharing with colleagues. Other uses, including reproduction and distribution, or selling or licensing copies, or posting to personal, institutional or third party websites are prohibited. In most cases authors are permitted to post their version of the article (e.g. in Word or Tex form) to their personal website or institutional repository. Authors requiring further information regarding Elsevier’s archiving and manuscript policies are encouraged to visit: http://www.elsevier.com/copyright
Transcript of Research, technological change and financial liberalization in South Korea

This article appeared in a journal published by Elsevier. The attachedcopy is furnished to the author for internal non-commercial researchand education use, including for instruction at the authors institution
and sharing with colleagues.
Other uses, including reproduction and distribution, or selling orlicensing copies, or posting to personal, institutional or third party
websites are prohibited.
In most cases authors are permitted to post their version of thearticle (e.g. in Word or Tex form) to their personal website orinstitutional repository. Authors requiring further information
regarding Elsevier’s archiving and manuscript policies areencouraged to visit:
http://www.elsevier.com/copyright

Author's personal copy
Research, technological change and financial liberalization in South Korea
James B. Ang *
Monash University, Victoria, Australia
a r t i c l e i n f o
Article history:Received 5 June 2008Accepted 8 June 2009Available online 16 June 2009
JEL classification:E44E58O16O53
Keywords:Financial liberalizationKnowledge creationEndogenous growthKorea
a b s t r a c t
Drawing on the recent developments in innovation-based growth models that emphasizethe importance of financial factors and R&D activity, this paper explores the impact ofresearch efforts and financial sector reforms on inventive activity, using Korea as the casestudy. Based on time series data over the period 1967–2005, the results consistently showthat the implementation of a series of financial liberalization policies is strongly associatedwith a higher rate of knowledge generation. They also show that R&D intensity has a sig-nificant positive influence on ideas production, providing some support for the Schumpe-terian endogenous growth framework.
� 2009 Elsevier Inc. All rights reserved.
1. Introduction
Recent work on endogenous growth theory suggests that R&D efforts and financial factors are important determinants oflong-run growth (see, e.g., de la Fuente and Marín, 1996; Blackburn and Hung, 1998; Aghion et al., 2005; Aghion and Howitt,2009). These models predict that financial market imperfections prevent innovators from obtaining sufficient external fi-nance. Financial liberalization removes credit constraints and helps facilitate the adoption of modern technology to boostthe development of knowledge and technology-intensive industries.
Although there is a growing body of empirical studies examining the impact of financial liberalization on economicgrowth (see, e.g., Edwards, 2001; Edison et al., 2002; Bekaert et al., 2005), these papers only examine the direct effect offinancial liberalization on economic growth. Notwithstanding the important role of finance in innovative activity, there islittle empirical analysis exploring the impact of financial liberalization on the rate of innovation – a key channel throughwhich it can impact economic growth.
This study aims to enrich the existing literature by providing some empirical evidence to shed light on the way in whichfinancial liberalization affects the evolution of innovation. Drawing on the Schumpeterian growth framework, we estimatethe impact of R&D intensity and financial liberalization on the rate of innovation using Korea as the case study. Korea is anideal candidate in this context given that it is a high growth economy that has also undergone significant financial sectorreforms. It is probable that one of the key indicators of the impact of these reforms has come in the form of a significantvariation in innovative activity. As such, these policy changes provide an appropriate historical setting to analyze the subject
0164-0704/$ - see front matter � 2009 Elsevier Inc. All rights reserved.doi:10.1016/j.jmacro.2009.06.002
* Address: Department of Economics, Monash University, 900 Dandenong Road, Caulfield East, Victoria 3145, Australia. Tel.: +61 3 99034516; fax: +61 399031128.
E-mail address: [email protected]
Journal of Macroeconomics 32 (2010) 457–468
Contents lists available at ScienceDirect
Journal of Macroeconomics
journal homepage: www.elsevier .com/locate / jmacro
Author's personal copy
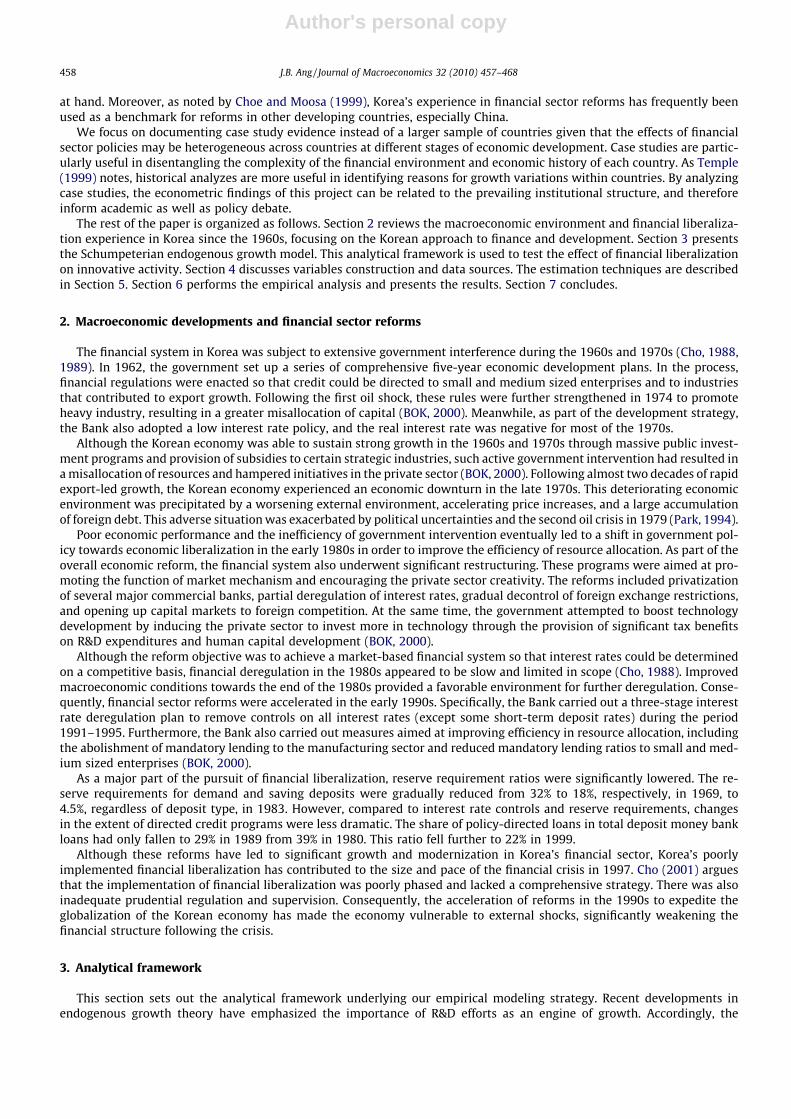
at hand. Moreover, as noted by Choe and Moosa (1999), Korea’s experience in financial sector reforms has frequently beenused as a benchmark for reforms in other developing countries, especially China.
We focus on documenting case study evidence instead of a larger sample of countries given that the effects of financialsector policies may be heterogeneous across countries at different stages of economic development. Case studies are partic-ularly useful in disentangling the complexity of the financial environment and economic history of each country. As Temple(1999) notes, historical analyzes are more useful in identifying reasons for growth variations within countries. By analyzingcase studies, the econometric findings of this project can be related to the prevailing institutional structure, and thereforeinform academic as well as policy debate.
The rest of the paper is organized as follows. Section 2 reviews the macroeconomic environment and financial liberaliza-tion experience in Korea since the 1960s, focusing on the Korean approach to finance and development. Section 3 presentsthe Schumpeterian endogenous growth model. This analytical framework is used to test the effect of financial liberalizationon innovative activity. Section 4 discusses variables construction and data sources. The estimation techniques are describedin Section 5. Section 6 performs the empirical analysis and presents the results. Section 7 concludes.
2. Macroeconomic developments and financial sector reforms
The financial system in Korea was subject to extensive government interference during the 1960s and 1970s (Cho, 1988,1989). In 1962, the government set up a series of comprehensive five-year economic development plans. In the process,financial regulations were enacted so that credit could be directed to small and medium sized enterprises and to industriesthat contributed to export growth. Following the first oil shock, these rules were further strengthened in 1974 to promoteheavy industry, resulting in a greater misallocation of capital (BOK, 2000). Meanwhile, as part of the development strategy,the Bank also adopted a low interest rate policy, and the real interest rate was negative for most of the 1970s.
Although the Korean economy was able to sustain strong growth in the 1960s and 1970s through massive public invest-ment programs and provision of subsidies to certain strategic industries, such active government intervention had resulted ina misallocation of resources and hampered initiatives in the private sector (BOK, 2000). Following almost two decades of rapidexport-led growth, the Korean economy experienced an economic downturn in the late 1970s. This deteriorating economicenvironment was precipitated by a worsening external environment, accelerating price increases, and a large accumulationof foreign debt. This adverse situation was exacerbated by political uncertainties and the second oil crisis in 1979 (Park, 1994).
Poor economic performance and the inefficiency of government intervention eventually led to a shift in government pol-icy towards economic liberalization in the early 1980s in order to improve the efficiency of resource allocation. As part of theoverall economic reform, the financial system also underwent significant restructuring. These programs were aimed at pro-moting the function of market mechanism and encouraging the private sector creativity. The reforms included privatizationof several major commercial banks, partial deregulation of interest rates, gradual decontrol of foreign exchange restrictions,and opening up capital markets to foreign competition. At the same time, the government attempted to boost technologydevelopment by inducing the private sector to invest more in technology through the provision of significant tax benefitson R&D expenditures and human capital development (BOK, 2000).
Although the reform objective was to achieve a market-based financial system so that interest rates could be determinedon a competitive basis, financial deregulation in the 1980s appeared to be slow and limited in scope (Cho, 1988). Improvedmacroeconomic conditions towards the end of the 1980s provided a favorable environment for further deregulation. Conse-quently, financial sector reforms were accelerated in the early 1990s. Specifically, the Bank carried out a three-stage interestrate deregulation plan to remove controls on all interest rates (except some short-term deposit rates) during the period1991–1995. Furthermore, the Bank also carried out measures aimed at improving efficiency in resource allocation, includingthe abolishment of mandatory lending to the manufacturing sector and reduced mandatory lending ratios to small and med-ium sized enterprises (BOK, 2000).
As a major part of the pursuit of financial liberalization, reserve requirement ratios were significantly lowered. The re-serve requirements for demand and saving deposits were gradually reduced from 32% to 18%, respectively, in 1969, to4.5%, regardless of deposit type, in 1983. However, compared to interest rate controls and reserve requirements, changesin the extent of directed credit programs were less dramatic. The share of policy-directed loans in total deposit money bankloans had only fallen to 29% in 1989 from 39% in 1980. This ratio fell further to 22% in 1999.
Although these reforms have led to significant growth and modernization in Korea’s financial sector, Korea’s poorlyimplemented financial liberalization has contributed to the size and pace of the financial crisis in 1997. Cho (2001) arguesthat the implementation of financial liberalization was poorly phased and lacked a comprehensive strategy. There was alsoinadequate prudential regulation and supervision. Consequently, the acceleration of reforms in the 1990s to expedite theglobalization of the Korean economy has made the economy vulnerable to external shocks, significantly weakening thefinancial structure following the crisis.
3. Analytical framework
This section sets out the analytical framework underlying our empirical modeling strategy. Recent developments inendogenous growth theory have emphasized the importance of R&D efforts as an engine of growth. Accordingly, the
458 J.B. Ang / Journal of Macroeconomics 32 (2010) 457–468

Author's personal copy
Schumpeterian endogenous growth model can be presented using the following generic expression (see, e.g., Ha and Howitt,2007; Madsen, 2008):
_A ¼ kXQ
� �r
A/
Q / Lb in steady stateð1Þ
where _A is the amount of new knowledge or ideas produced (i.e., the inventive output), A measures the stock of knowledge orideas, X is R&D input, Q is product variety, and L is employment or population. The growth enhancing effect of R&D input iscounterbalanced by the deleterious effect of product variety (Ha and Howitt, 2007). The ratio (X/Q) is commonly referred toas research intensity. k is a research productivity parameter, r is a duplication parameter (0 if all innovations are duplica-tions and 1 if there are no duplicating innovations), / is returns to scale in knowledge, and b is the parameter of productproliferation. The Schumpeterian theory assumes constant returns to knowledge (/ ¼ 1) and the presence of a product vari-ety effect (b = 1).
In their seminal work, McKinnon (1973) and Shaw (1973) noted that financial repression policies were largely account-able for the poor economic performance of developing countries in the 1960s, where low saving and credit rationing werewidely observed. Investment suffered both in terms of quantity and quality as funds were allocated at the discretion of policymakers. They challenged the financial repression ideology and provided a new paradigm in the design of financial sector pol-icies. Their theories proposed that distortions in the financial systems, such as loans issued at an artificially low interest rate,directed credit programs and high reserve requirements, would reduce saving, retard capital accumulation and prevent effi-cient resource allocation. The elimination of these distortions would significantly deepen financial systems and thereforefoster economic growth.
Recent developments in the theories of endogenous growth that consider financial factors are in line with the McKinnon–Shaw financial liberalization thesis. Financial liberalization facilitates inventive activity for a number of reasons. In the workof de la Fuente and Marín (1996), the relationship between finance and growth is analyzed in a model of product innovationin which efficiency of the financial system arises endogenously. Risk aversion and private information in R&D activity lead toa moral hazard problem, and this makes innovative activity unattractive for risk-averse entrepreneurs. This problem, how-ever, can be mitigated through improved monitoring by financial systems, which allow intermediaries to offer better insur-ances terms. Hence, more efficient financial systems, which can be achieved through financial sector reforms, should yield ahigher level of innovative activity.
Using a product variety model, Blackburn and Hung (1998) postulate that firms have incentives to hide successful R&Dactivity to avoid repaying their loans. Such a problem of moral hazard gives rise to the enforcement of an incentive-compat-ible loan contract through a costly monitoring system. In their model, greater financial liberalization allows financial inter-mediaries to diversify among a large number of projects that significantly reduces delegation costs. Lower costs ofmonitoring therefore spur R&D activity and economic growth.
More recently, in the Schumpeterian growth model developed by Aghion et al. (2005), it is assumed that firms can concealthe results of successful innovations and thereby avoid repaying their creditors. A low degree of creditor protection makesfraud an inexpensive option, and this limits firms’ access to external finance, which discourages the production of ideas.Financial development, which often follows from greater financial liberalization, tends to increase the hiding costs throughproviding better laws and institutions. This makes credit more readily available to entrepreneurs and allows them to under-take innovative activity. Moreover, Aghion and Howitt (2009, chap. 6) also show that reducing credit constraints results inlower screening and monitoring costs, thus mitigating agency problems and increasing the frequency of innovations.
The above discussions clearly highlight that financial liberalization plays a crucial role in boosting innovative activity in anumber of ways. Ang and Madsen (2008) suggest that the following knowledge creation function can be used to test theeffect of financial liberalization on ideas production:
ln _At ¼ aþ b ln At þ v lnðX=QÞt þ d ln FLt þ et ð2Þ
where _A is inventive output, A measures the stock of knowledge or ideas, (X/Q)t is a measure of research intensity, and et isGaussian errors. b is expected to be positive and carry a value of one, based on the predictions of the Schumpeterian growththeory. The expected sign for v is also positive since R&D activity is expected to promote innovations. Our earlier discussionsuggests that financial liberalization (FLt) will have a positive impact on knowledge production, and hence d is expected tocarry a positive sign. The above equation will be estimated using annual data for Korea over the period 1967–2005.
4. Construction of variables and data sources
4.1. Patent data
As suggested by Kortum (1993), the amount of patenting activity can be used as a proxy for the extent of innovation activ-ity. Hence, we use the number of patents filed by domestic residents as the measure for inventive output ( _At). The data areobtained from the World Intellectual Property Organization (WIPO). The domestic stock of knowledge (At) is constructedbased on _At using the perpetual inventory method with a depreciation rate of 10%. The initial knowledge stock is set equal
J.B. Ang / Journal of Macroeconomics 32 (2010) 457–468 459

Author's personal copy
to the number of patents in 1967 divided by the depreciation rate plus the average growth in patents over the period 1967–2005.
4.2. R&D intensity measures
R&D input (Xt) is measured by R&D labor (Nt) and real R&D expenditure (Rt). R&D labor is defined as the number of sci-entists and technicians engaged in R&D activity. Nominal R&D expenditure is deflated using an unweighted average of theeconomy-wide value-added price deflator and hourly earnings. The following measures of research intensity are considered:(1) Nt/Lt; (2) hN
t Nt=hLt Lt; and (3) Rt/Yt, where Lt is the labor force, hN
t is human capital per R&D worker, hLt is human capital per
ordinary worker, and Yt is real GDP. The second measure of research intensity is adjusted for educational attainment for eachtype of worker to account for the fact that skilled and unskilled workers may contribute to technological improvements byvarying degrees (see, e.g., Papageorgiou, 2003; Vandenbussche et al., 2006). The consideration of human capital is especiallyimportant given that previous work by Lucas (1993) and Papageorgiou and Perez-Sebastian (2006) have found human cap-ital to play an important role in the miraculous development process of Korea.
Human capital is computed using the Mincerian approach, i.e., hL;Nt ¼ exp½f ðSL;N
t Þ�. Following the seminal work of Klenowand Rodriguez-Clare (1997) and Bils and Klenow (2000), this approach to constructing human capital stock has been widelyadopted in the literature (see, e.g., Papageorgiou, 2003; Papageorgiou and Sebastian, 2004). We use the average years ofschooling for the population over 25 years old as the measure for educational attainment for ordinary workers (SL
t ). The yearsof schooling per unit of R&D labor (SN
t ) are approximated using an approach similar to that of Vandenbussche et al. (2006).Accordingly, the average number of years of tertiary education (Tt) is given as: Tt ¼ nICðpIC
t þ pCt Þ þ nCpC
t , where nIC is the addi-tional years of incomplete schooling in tertiary education (2 years) and nC is the additional number of years to complete ter-tiary education (2 years), pIC
t is the percentage of adult population (aged 25 and above) who have not completed tertiaryeducation, and pC
t is the percentage of adult population who have completed it.Assuming that all research workers have at least completed some tertiary education, the years of education per R&D
worker (SNt ) is the sum of Tt and the total years of schooling in elementary and secondary education (i.e., 13 years in Korea).
The data are obtained from the Barro and Lee (2001) education dataset. We follow the approach of Hall and Jones (1999) byassuming that f(St) is piecemeal linear, where a rate of schooling return of 13.4% (average for Sub-Saharan Africa) is assumedfor the first 4 years of education, 10.1% (average for the whole world) for the next 4 years, and 6.8% (average for the OECD) forschooling more than 8 years. These rates of return are based on the surveys evidence of Psacharopoulos (1994).
R&D data are taken from various issues of the Statistical Yearbook published by the United Nations Educational, Scientific,and Cultural Organization (UNESCO). Some missing data between years are interpolated. Data for the labor force and realGDP are obtained from various issues of the Korea Statistical Yearbook. The time series plots of these variables are presentedin Fig. 1. It is worth noting that the amount of patenting activity increased rapidly in the 1980s and the early 1990s, coin-ciding with the implementation of a series of financial sector reforms.
(a) Number of patents applied ( tA )
6
7
8
9
10
11
12
1967 1972 1977 1982 1987 1992 1997 2002
(b) Patent stock ( tA )
8
9
10
11
12
13
14
1967 1972 1977 1982 1987 1992 1997 2002
(c) Fraction of R&D workers in the labor force
-6.5
-6.0
-5.5
-5.0
-4.5
1967 1972 1977 1982 1987 1992 1997 2002
(d) Share of real R&D expenditure in real GDP ( /t tR Y )
-6.5
-6.0
-5.5
-5.0
-4.5
-4.0
-3.5
-3.0
1967 1972 1977 1982 1987 1992 1997 2002
/N Lt t t th N h L
/t tN L
Fig. 1. Time series plots of key variables (on log scale).
460 J.B. Ang / Journal of Macroeconomics 32 (2010) 457–468

Author's personal copy
4.3. Financial liberalization index
To construct an index of financial liberalization, we consider three types of financial sector policy: (1) interest rate con-trols, (2) statutory reserve requirements and (3) directed credit programs. The choice of these three components is based onthe financial liberalization thesis of McKinnon (1973) and Shaw (1973). These data series are either directly obtained or com-piled from various issues of the Annual Report, Monthly Bulletin and Economic Statistics Yearbook of the Bank of Korea.Although data on financial policy are available from the 1950s, our empirical analysis begins in 1967 due to constraintson R&D data. To measure the extent of interest rate controls, we consider a number of interest rate policies implementedin Korea. This involves the consideration of 23 interest rate policy measures adopted in Korea over the last few decades.These policy controls are translated into dummy variables which take the value of 1 if a control is present and 0 otherwise.We take the simple average of these series and normalize the first observation to 100 to provide a single measure for theextent of interest rate restraints in Korea.1
Statutory reserve requirements are direct measures expressed in percentages. Unlike Malaysia for which the priority sec-tor target lending rates are directly available (see Ang and McKibbin, 2007; Ang, 2009b), Korea has no consistently recordeddirect de jure measure for directed credit programs. Therefore, we follow the approach of Park (1994) and Ang (2009a) byusing a de facto measure, which involves measuring the share of actual directed loans in total loans. Fig. 2a–c plot the timeseries evolution of these variables. In general, all repressionist policies exhibit a downward trend over the last four decades,reflecting an increase in the level of financial liberalization over time.
In principle, these policy measures can be used individually in the empirical specification in order to assess the effective-ness of each policy. However, this may give rise to some econometric problems due to the small sample used in this study(39 annual observations). Moreover, the underlying policy variables may be highly correlated since the Reserve Bank of Kor-ea has jointly imposed some of these controls. A solution to these problems is to reduce the number of policy variables to justone summary measure, which can account for the joint influence of all policy variables.
Given this objective, the method of principal component analysis appears to be a natural choice. It is the standard ap-proach to examine the patterns of relationships among the variables, with the objective of summarizing the information con-tent of several observed variables into one component or a handful of representative key components. The method involvescomputing the linear combinations of the original variables that capture their maximum variance. These components cancapture a large proportion of the variance in the original variables and can therefore serve the same purpose as the fullset, but in a much more succinct manner.
The results of the principal component analysis are presented in Table 1. The eigenvalues indicate that the first principalcomponent explains about 84.7% of the total variation, the second principal component explains another 13.6% and so on.The first principal component is computed as a linear combination of the three financial sector policy measures with weights
Interest Rate Restraint Index
0
20
40
60
80
100
120
1967 1972 1977 1982 1987 1992 1997 2002
Statutory Reserve Requirements (%)
0
5
10
15
20
25
30
1967 1972 1977 1982 1987 1992 1997 2002
Directed Credit Programs (%)
0
10
20
30
40
50
1967 1972 1977 1982 1987 1992 1997 2002
Financial Liberalization Index (Ln)
4.0
4.5
5.0
5.5
6.0
6.5
7.0
1967 1972 1977 1982 1987 1992 1997 2002
Fig. 2. Evolution of financial sector policies (1967–2005).
1 Interest rate deregulation measures considered in the analysis include the abolishment of interest rate controls on installment saving deposits, personalchecking deposits, foreign currency loans, foreign currency deposits, export promotion financing loans, long-term, equipment investment loans, corporatebonds, time deposits with different maturity dates, bank overdrafts, aggregate credit ceiling system, etc.
J.B. Ang / Journal of Macroeconomics 32 (2010) 457–468 461

Author's personal copy
given by the first eigenvector. We use the percentages of variance as the weights to obtain the final index. The resulting indexis positively and significantly correlated with all underlying variables, providing some evidence that it is a reasonably goodindicator for the extent of financial repression imposed on the Korean financial system. Given that this measure reflects thestrength of financial sector policies designed to repress the financial system in Korea, we take its inverse and interpret it asthe degree of financial liberalization.
The resulting composite financial liberalization index displayed in Fig. 2d coincides rather well with the actual policychanges that took place in Korea during the sample period discussed earlier. The first observation of the index is normalizedto 100 (or 4.605 on natural log scale), noting that an index number of 100 does not necessarily reflect a fully liberalizedfinancial system. Relative to other periods, there were very few policy changes in the Korean financial system during the1960s and 1970s. From the beginning of the 1980s the government gradually reformed the financial sector, and this processwas expedited in the early 1990s. The implementation of these liberalization measures is reflected by an upward swing inthe series since the early 1980s. The pace of liberalization slowed down significantly in the aftermath of the 1997–1998Asian financial crisis.
5. Estimation techniques
The dynamic adjustment of the ideas generation process can be characterized by a conditional error-correction model(ECM), which can be used to test for the existence of a long-run relationship using the ARDL bounds test developed by Pes-aran et al. (2001) and the ECM test of Banerjee et al. (1998). The former involves a standard F-test whereas the latter is asimple t-test. Accordingly, the underlying ECM can be formulated as:
D ln _At ¼ a0 þ b0 ln _At�1 þXk
j¼1
bjDETj;t�1 þXp
i¼1
c0iD ln _At�i þXp
i¼0
Xk
j¼1
cjiDDETj;t�i þ et ð3Þ
where _At is the number of patents applied by domestic residents and DETt is a vector of the determinants of innovative activ-ity, which includes ln At, ln (X/Q)t and ln FLt.
The equation above can be estimated by OLS since Pesaran and Shin (1998) have shown that the OLS estimators of theshort-run parameters are consistent, and the ARDL based estimators of the long-run coefficients are super-consistent insmall sample sizes. Hence, valid inferences on the long-run parameters can be made using standard normal asymptotic the-ory. The main advantage of this approach is that it can be applied to the model regardless of whether the underlying vari-ables are I(0) or I(1). Specifically, two separate statistics are employed to test for the existence of a long-run relationship inEq. (3): (1) an F-test for the joint significance of coefficients on lagged levels terms of the conditional ECM(H0 : b0 ¼ b1 ¼ . . . ¼ bk ¼ 0), and (2) a t-test for the significance of the coefficient associated with ln _At�1 (H0 : b0 ¼ 0).
The test for cointegration is provided by two asymptotic critical value bounds when the independent variables are eitherI(0) or I(1). The lower bound assumes all the independent variables are I(0), and the upper bound assumes they are I(1). If thetest statistics exceed their respective upper critical values, the null is rejected and we can conclude that a long-run relation-ship exists. The above ARDL model also provides a convenient step to derive the long-run estimates and short-run dynamicsfor the knowledge production function, as detailed in Pesaran and Shin (1998).
While our preferred approach is the ARDL estimator due to its superior statistical properties, the dynamic ordinary leastsquares (DOLS) estimator is also considered to provide a robustness check for the results, given that it is one of the mostcommonly used single-equation estimators in the literature. The DOLS approach is asymptotically equivalent to the Johansenmaximum likelihood VECM estimator. Based on Monte Carlo simulations, Stock and Watson (1993) show that it outperformsseveral alternative estimators of long-run parameters. A more recent study by Caporale and Pittis (2004), however, suggeststhat the DOLS approach is among several estimators that perform worst in small samples. In contrast, the ARDL approachdetailed in Pesaran and Shin (1998) is one of the 28 estimators analyzed that possesses the most desirable small sampleproperties. We therefore place more emphasis on the results derived from the ARDL estimator and report the DOLS estimatesonly for sensitivity checks. This consideration is particularly important given the small sample size used in the study.
Table 1Principal component analysis for the financial liberalization index.
Principal component 1 Principal component 2 Principal component 3
EigenvaluesValue 2.542 0.407 0.051Percent of variance 0.847 0.136 0.017Cumulative % 0.847 0.983 1.000
EigenvectorIRRt 0.601 �0.368 �0.709SRRt 0.527 0.850 0.006DCPt 0.600 �0.377 0.705
Notes: IRRt, interest rate restraints; SRRt, statutory reserve requirements; and DCPt, directed credit programs.
462 J.B. Ang / Journal of Macroeconomics 32 (2010) 457–468

Author's personal copy
ln _At ¼ a0 þXk
j¼1
bjDETj;t þXp
i¼�p
Xk
j¼1
djiDDETj;t�i þ et ð4Þ
The procedure involves regressing one of the I(1) variables on the remaining I(1) variables, the I(0) variables, leads (p) andlags (�p) of the first difference of the I(1) variables, and a constant, as given in Eq. (4). By doing so, it corrects for potentialendogeneity problems, omitted lagged variable bias and small sample bias, and provides estimates of the cointegrating vec-tor which are asymptotically efficient. The long-run model for ln _At can be obtained from the reduced form solution by set-ting all differenced terms of the regressors to be zero. An error-correction model is formulated to provide an analysis for theshort-run dynamics. The error-correction term (ECT), which captures the speed of adjustment towards the equilibrium, isobtained by considering ln _At�1 � a0 � b1DET1;t�1 � . . .� bkDETk;t�1. The general-to-specific modeling approach is adoptedto derive a satisfactory short-run dynamic model. This involves testing down the general model by successively eliminatingstatistically insignificant regressors and imposing data acceptable restrictions on the parameters to obtain the final parsimo-nious dynamic equation.
6. Empirical findings
6.1. Integration and cointegration analyses
We begin our empirical analysis by employing three unit root tests to assess the order of integration of the underlyingvariables – the Augmented Dickey-Fuller (ADF), Phillips-Perron (PP), and Kwiatkowiski–Phillips–Schmidt–Shin (KPSS) tests.The ADF and PP test the null of a unit root against the alternative of stationarity whereas the KPSS tests the null of stationa-rity against the alternative of a unit root. The results, which are not reported here to conserve space but available upon re-quest, show that all variables appear to be either stationary, i.e., I(0), or integrated at order one, i.e., I(1). Given that none ofthe variables appears to be integrated at an order higher than one, this allows legitimate use of the proposed cointegrationprocedures.
Next, to perform cointegration tests on the knowledge production equation, we regress the conditional ECM in Eq. (3) byallowing for up to two lags. We do not consider a larger lag structure in order to preserve the degrees of freedom in estima-tion. To ascertain the existence of a level relationship between the variables, this requires satisfying both the F- and t-tests.Table 2 gives the F-statistics for the ARDL bounds tests, t-statistics for the ECM tests, model selection criteria AIC and SBC,and several diagnostic test statistics. The table contains results for three models, where each model corresponds to the esti-mation results using different measures of research intensity.
With a more parsimonious modeling approach of only one lag, the results indicate that the null hypothesis of no levelknowledge production equation is rejected at the conventional levels of significance, as suggested by both the ARDL boundsand ECM tests. While the results are not sensitive to the choice of research intensity measures, the econometric specifica-tions fail a number of diagnostic tests, especially the tests for serial correlation. When two lags are chosen, the null of nocointegration is firmly rejected at the 1% level in nearly all cases, irrespective of the method of cointegration tests andresearch intensity measures. This provides strong support for the existence of a long-run relationship between knowledgeproduction and its determinants. Moreover, no evidence of cointegrating is found when other variables are used as thedependent variables, suggesting that these variables can be interpreted as the long-run forcing variables explaining ln _At .Finally, we do not find any evidence of serial correlation, autoregressive conditional heteroskedasticity, and heteroskedas-
Table 2Cointegration tests.
Model A: Model B: Model C:ðX=QÞt ¼ ðN=LÞt ðX=QÞt ¼ ðh
NNÞt=ðhLLÞt ðX=QÞt ¼ ðR=YÞt
p = 1 p = 2 p = 1 p = 2 p = 1 p = 2
ARDL bounds test (Pesaran et al., 2001) 5.202** 8.664*** 5.288** 8.821*** 5.338** 8.905***
ECM test (Banerjee et al., 1998) �3.613* �4.796*** �3.725* �4.879*** �4.035** �4.214**
AIC �2.396 �3.165 �2.402 �3.166 �2.302 �2.840SBC �1.692 �2.267 �1.698 �2.268 �1.687 �1.951v2
SERIAL 7.022*** (0.008) 2.563 (0.109) 14.469*** (0.001) 0.799 (0.371) 5.528** (0.019) 0.842 (0.359)v2
ARCH 1.689 (0.193) 0.934 (0.334) 1.216 (0.271) 0.676 (0.411) 5.771** (0.016) 1.421 (0.233)v2
WHITE 14.697 (0.473) 13.077 (0.835) 15.103 (0.445) 11.789 (0.895) 24.880** (0.024) 21.017 (0.336)
Notes: p is the lag length. The test statistics of the bounds tests are compared against the critical values reported in Pesaran et al. (2001). The estimationallows for an unrestricted intercept and no trend. The 10%, 5% and 1% critical value bounds for the F-test are (2.72, 3.77), (3.23, 4.35) and (4.29, 5.61), and forthe t-test are (�2.57, �3.46), (�2.86, �3.78) and (�3.43, �4.37), respectively. v2
SERIAL is Breusch–Godfrey LM test statistics for no first-order serial rela-tionship, v2
ARCH is the Engle’s test statistic for no autoregressive conditional heteroskedasticity, and v2WHITE denotes the White’s test statistic to test for
homoskedastic errors. Numbers in parentheses indicate p-values.* 10% level of significance.** 5% level of significance.*** 1% level of significance.
J.B. Ang / Journal of Macroeconomics 32 (2010) 457–468 463
Author's personal copy
ticity at the conventional levels of significance level when two lags are chosen. We will therefore choose two lags for theremaining analyses, as also suggested by AIC and SBC.
6.2. The effect of financial liberalization on knowledge production
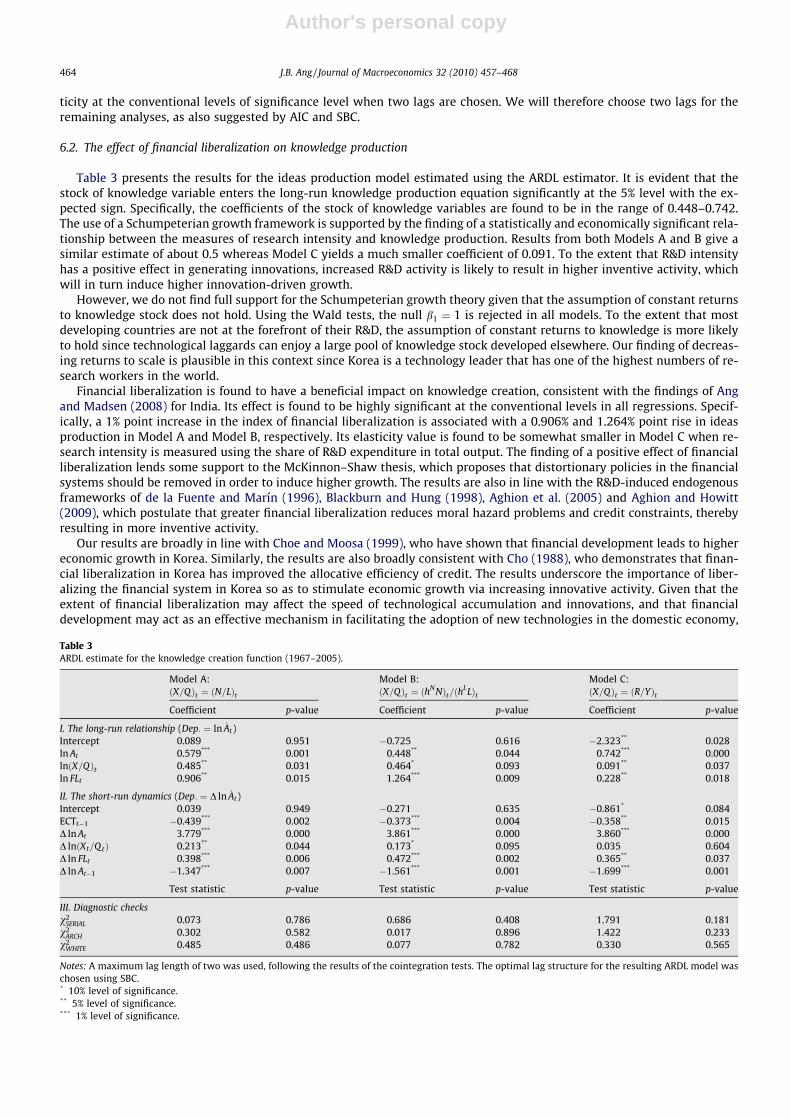
Table 3 presents the results for the ideas production model estimated using the ARDL estimator. It is evident that thestock of knowledge variable enters the long-run knowledge production equation significantly at the 5% level with the ex-pected sign. Specifically, the coefficients of the stock of knowledge variables are found to be in the range of 0.448–0.742.The use of a Schumpeterian growth framework is supported by the finding of a statistically and economically significant rela-tionship between the measures of research intensity and knowledge production. Results from both Models A and B give asimilar estimate of about 0.5 whereas Model C yields a much smaller coefficient of 0.091. To the extent that R&D intensityhas a positive effect in generating innovations, increased R&D activity is likely to result in higher inventive activity, whichwill in turn induce higher innovation-driven growth.
However, we do not find full support for the Schumpeterian growth theory given that the assumption of constant returnsto knowledge stock does not hold. Using the Wald tests, the null b1 ¼ 1 is rejected in all models. To the extent that mostdeveloping countries are not at the forefront of their R&D, the assumption of constant returns to knowledge is more likelyto hold since technological laggards can enjoy a large pool of knowledge stock developed elsewhere. Our finding of decreas-ing returns to scale is plausible in this context since Korea is a technology leader that has one of the highest numbers of re-search workers in the world.
Financial liberalization is found to have a beneficial impact on knowledge creation, consistent with the findings of Angand Madsen (2008) for India. Its effect is found to be highly significant at the conventional levels in all regressions. Specif-ically, a 1% point increase in the index of financial liberalization is associated with a 0.906% and 1.264% point rise in ideasproduction in Model A and Model B, respectively. Its elasticity value is found to be somewhat smaller in Model C when re-search intensity is measured using the share of R&D expenditure in total output. The finding of a positive effect of financialliberalization lends some support to the McKinnon–Shaw thesis, which proposes that distortionary policies in the financialsystems should be removed in order to induce higher growth. The results are also in line with the R&D-induced endogenousframeworks of de la Fuente and Marín (1996), Blackburn and Hung (1998), Aghion et al. (2005) and Aghion and Howitt(2009), which postulate that greater financial liberalization reduces moral hazard problems and credit constraints, therebyresulting in more inventive activity.
Our results are broadly in line with Choe and Moosa (1999), who have shown that financial development leads to highereconomic growth in Korea. Similarly, the results are also broadly consistent with Cho (1988), who demonstrates that finan-cial liberalization in Korea has improved the allocative efficiency of credit. The results underscore the importance of liber-alizing the financial system in Korea so as to stimulate economic growth via increasing innovative activity. Given that theextent of financial liberalization may affect the speed of technological accumulation and innovations, and that financialdevelopment may act as an effective mechanism in facilitating the adoption of new technologies in the domestic economy,
Table 3ARDL estimate for the knowledge creation function (1967–2005).
Model A: Model B: Model C:ðX=QÞt ¼ ðN=LÞt ðX=QÞt ¼ ðh
NNÞt=ðhLLÞt ðX=QÞt ¼ ðR=YÞt
Coefficient p-value Coefficient p-value Coefficient p-value
I. The long-run relationship (Dep: ¼ ln _At)Intercept 0.089 0.951 �0.725 0.616 �2.323** 0.028ln At 0.579*** 0.001 0.448** 0.044 0.742*** 0.000lnðX=QÞt 0.485** 0.031 0.464* 0.093 0.091** 0.037ln FLt 0.906** 0.015 1.264*** 0.009 0.228** 0.018
II. The short-run dynamics (Dep: ¼ D ln _At)Intercept 0.039 0.949 �0.271 0.635 �0.861* 0.084ECTt�1 �0.439*** 0.002 �0.373*** 0.004 �0.358** 0.015D ln At 3.779*** 0.000 3.861*** 0.000 3.860*** 0.000D lnðXt=QtÞ 0.213** 0.044 0.173* 0.095 0.035 0.604D ln FLt 0.398*** 0.006 0.472*** 0.002 0.365** 0.037D ln At�1 �1.347*** 0.007 �1.561*** 0.001 �1.699*** 0.001
Test statistic p-value Test statistic p-value Test statistic p-value
III. Diagnostic checksv2
SERIAL 0.073 0.786 0.686 0.408 1.791 0.181v2
ARCH 0.302 0.582 0.017 0.896 1.422 0.233v2
WHITE 0.485 0.486 0.077 0.782 0.330 0.565
Notes: A maximum lag length of two was used, following the results of the cointegration tests. The optimal lag structure for the resulting ARDL model waschosen using SBC.* 10% level of significance.** 5% level of significance.*** 1% level of significance.
464 J.B. Ang / Journal of Macroeconomics 32 (2010) 457–468
Author's personal copy
it is essential to develop a sound financial system in order to reap the benefits of these efficiency gains and achieve sustainedeconomic growth in the long-run.
Turning to the short-run dynamics, the regression results for the conditional ECM of D ln _At reported in panel II of Table 3show several desirable features. Specifically, nearly all coefficients are statistically significant at the conventional levels. Infirst-differenced contemporaneous form (i.e., D ln At ;D lnðXt=Q tÞ and D ln FLt), the variables have intuitive signs, consistentwith the results reported in the long-run models. The coefficients of ECTt�1, which measure the speed of adjustment backto the long-run equilibrium value, are statistically significant at the 1% level and correctly signed, i.e., negative. This impliesthat an error-correction mechanism exists in the knowledge production function so that the deviation from long-run equi-librium has a significant impact on the growth rate of innovation. These results reinforce the findings of cointegration re-ported in Table 2 earlier. Knowledge production in Korea adjusts at the speed of 35.8–43.9% every year, or it takes onaverage 2.6 years, to restore equilibrium when there is a shock to the steady-state relationship.
The results reported in panel III of Table 3 show that the regression specifications fit remarkably well. All models pass thediagnostic tests against serial correlation, autoregressive conditional heteroskedasticity and heteroskedasticity. The struc-tural stability of the knowledge production equation is examined using the cumulative sum (CUSUM) tests on the recursiveresiduals. The test is able to detect systematic changes in the regression coefficients. The results (not reported) show that thestatistics generally lie within the 5% confidence interval bands, suggesting no structural instability in the residuals of theknowledge production equation. Moreover, the predicted levels of knowledge production, which are obtained using the stea-dy-state estimates reported in panel I of Table 3, are able to track the actual series very closely over time, suggesting that theestimated models fit the knowledge creation function very well.2
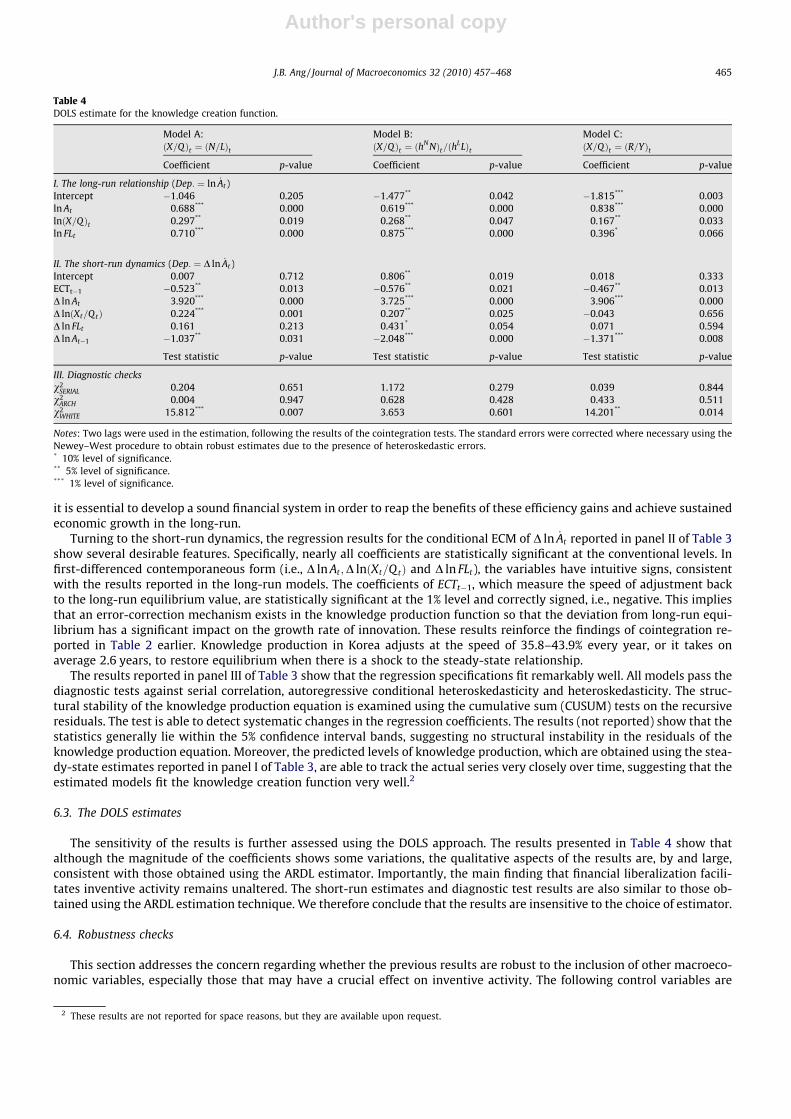
6.3. The DOLS estimates
The sensitivity of the results is further assessed using the DOLS approach. The results presented in Table 4 show thatalthough the magnitude of the coefficients shows some variations, the qualitative aspects of the results are, by and large,consistent with those obtained using the ARDL estimator. Importantly, the main finding that financial liberalization facili-tates inventive activity remains unaltered. The short-run estimates and diagnostic test results are also similar to those ob-tained using the ARDL estimation technique. We therefore conclude that the results are insensitive to the choice of estimator.
6.4. Robustness checks
This section addresses the concern regarding whether the previous results are robust to the inclusion of other macroeco-nomic variables, especially those that may have a crucial effect on inventive activity. The following control variables are
Table 4DOLS estimate for the knowledge creation function.
Model A: Model B: Model C:ðX=QÞt ¼ ðN=LÞt ðX=QÞt ¼ ðh
NNÞt=ðhLLÞt ðX=QÞt ¼ ðR=YÞt
Coefficient p-value Coefficient p-value Coefficient p-value
I. The long-run relationship (Dep: ¼ ln _At)Intercept �1.046 0.205 �1.477** 0.042 �1.815*** 0.003ln At 0.688*** 0.000 0.619*** 0.000 0.838*** 0.000lnðX=QÞt 0.297** 0.019 0.268** 0.047 0.167** 0.033ln FLt 0.710*** 0.000 0.875*** 0.000 0.396* 0.066
II. The short-run dynamics (Dep: ¼ D ln _At)Intercept 0.007 0.712 0.806** 0.019 0.018 0.333ECTt�1 �0.523** 0.013 �0.576** 0.021 �0.467** 0.013D ln At 3.920*** 0.000 3.725*** 0.000 3.906*** 0.000D lnðXt=QtÞ 0.224*** 0.001 0.207** 0.025 �0.043 0.656D ln FLt 0.161 0.213 0.431* 0.054 0.071 0.594D ln At�1 �1.037** 0.031 �2.048*** 0.000 �1.371*** 0.008
Test statistic p-value Test statistic p-value Test statistic p-value
III. Diagnostic checksv2
SERIAL 0.204 0.651 1.172 0.279 0.039 0.844v2
ARCH 0.004 0.947 0.628 0.428 0.433 0.511v2
WHITE 15.812*** 0.007 3.653 0.601 14.201** 0.014
Notes: Two lags were used in the estimation, following the results of the cointegration tests. The standard errors were corrected where necessary using theNewey–West procedure to obtain robust estimates due to the presence of heteroskedastic errors.* 10% level of significance.** 5% level of significance.*** 1% level of significance.
2 These results are not reported for space reasons, but they are available upon request.
J.B. Ang / Journal of Macroeconomics 32 (2010) 457–468 465

Author's personal copy
considered. First, according to the literature on trade and growth, openness to international trade may have a significant im-pact on economic growth. We use import intensity (the ratio of imports to GDP, IMt) and the tariff rate (the ratio of customsand other import duties to total imports, TBt) to capture the effect of international trade on the variation of patenting activity.
Second, there is now an established literature arguing that innovative activity is positively associated with internationalknowledge diffusion (see, e.g., Coe and Helpman, 1995). Given that cumulative knowledge stocks embodied in importedintermediate inputs may have an impact on domestic patenting activity, we measure international R&D spillovers via thechannel of imports (SPILt) following the approach of Lichtenberg and Van Pottelsberghe de la Potterie (1998). It considersthe average of the domestic R&D capital stocks of Korea’s trade partners, which include 20 other OECD countries, weightedby the fraction of their total output that is exported to Korea.3 Furthermore, international knowledge may transmit across bor-ders independently of the trade channel (see Bottazzi and Peri, 2007). In this case, the accumulation of patent stocks in the restof the world may allow ideas to travel freely across borders. The world stock of knowledge available to Korea (AROW
t ) is simplythe sum of all patent stocks across the world excluding Korea.
Third, Bernard and Jones (1996) argue that changes in innovative activity may also depend on technological catch-up.Countries which are relatively backward can grow faster by utilizing technologies developed in the leading country. To allowfor this, we include a proxy for distance to the frontier (DTFt), which is measured by the ratio of the frontier’s patent stock toKorea’s patent stock. The frontier is determined by the country having the highest accumulated patents in the world at aparticular time, which turns out to be either Japan or the US Fourth, technology transfer in Korea may have occurred directlythrough inflows of foreign investment. We therefore include the ratio of foreign direct investment to GDP (FDIt) to capturethis effect.
Fifth, it is likely that our measure of financial liberalization may also capture changes in other policy environments apartfrom the financial system. To allow for this possibility, we estimate the ideas production function by controlling for the effectof macroeconomic policy (MPt). To do this, we follow the approach of Burnside and Dollar (2000) by creating a summaryindex for macroeconomic policy. This involves considering the first principal component of the sum of exports and importsover GDP, the inflation rate and the ratio of budget surplus to GDP. The resulting index shows a strong upward trend up tothe mid 1980s and some moderate fluctuations since then, which coincide rather well with the actual changes in the overallpolicy environment in Korea.
Finally, the number of patent applications may be affected by a significant change in patent laws. A strengthening patentprotection framework may prevent the free flow of ideas and retard technological development. But on the other hand, itmay enhance the innovators’ ability to recoup expensive R&D costs, thereby encouraging further innovation. The intellectualproperty rights index (IPRt) constructed by Park and Lippoldt (2005) is used to capture the extent of patent protection. Themissing years are interpolated.
In the remaining analyses, the estimates are derived based on Model A using only the ARDL estimator. Moreover, for spacereasons, the short-run estimates are not reported. The estimates reported in Table 5 show that our core results remain robustto the inclusion of these control variables. Specifically, the measures of research intensity and financial liberalization remain
Table 5Robustness checks (Dep: ¼ ln _At).
CVt = IMt CVt = TBt CVt = SPILt CVt ¼ AROWt CVt = DTFt CVt = FDIt CVt = MPt CVt = IPRt
I. The long-run ARDL estimatesIntercept �0.133 �0.614 0.303 �8.267** �2.589 0.145 0.195 �2.542**
ln At 0.567*** 0.528*** 0.560*** 0.739*** 0.943*** 0.576*** 0.582*** 0.674***
lnðN=LÞt 0.492** 0.531** 0.503** 0.271** 0.653*** 0.509* 0.407** 0.282**
ln FLt 0.943** 0.925*** 0.971** 0.355** 0.612* 0.918** 0.919*** 0.615***
ln CVt �0.174 �0.141 �0.031 0.556** 0.422** �0.009 �0.043 0.425*
II. Diagnostic checksv2
SERIAL 0.135 0.085 0.159 0.004 0.386 0.086 0.021 0.158v2
ARCH 0.261 0.001 0.122 1.577 2.239 0.437 0.792 2.595v2
WHITE 0.345 0.295 0.278 1.411 0.173 0.524 0.014 1.766
III. Cointegration testsARDL bounds test 8.197*** 4.974** 8.685*** 6.181*** 4.557** 6.359*** 4.432** 5.631***
ECM test �5.278*** �4.341** �4.071** �4.534** �4.402** �3.183 �3.747* �4.109**
Notes: CVt, control variable, which includes: IMt, import intensity (imports over GDP); TBt, trade barriers (customs and other import duties/total imports);SPILt, international R&D spillovers; AROW
t , patent stock of the rest of the world; DTFt, distance to the frontier (the frontier’s patent stock/Korea’s patent stock);FDIt, the ratio of FDI inflows to GDP; MPt, macroeconomic policy index (1st principal component of the sum of exports and imports over GDP, inflation rateand the ratio of budget surplus to GDP); and IPRt, intellectual property rights protection. The 10%, 5% and 1% critical value bounds for the F-test are (2.45,3.52), (2.82, 4.01) and (3.74, 5.06), and for the t-test are (�2.57, �3.66), (�2.86, �3.99) and (�3.43, �4.60), respectively.* 10% level of significance.** 5% level of significance.*** 1% level of significance.
3 The OCED countries include Australia, Austria, Belgium, Canada, Denmark, Finland, France, Germany, Greece, Ireland, Italy, Netherland, New Zealand,Norway, Portugal, Spain, Sweden, Switzerland, the UK and the US.
466 J.B. Ang / Journal of Macroeconomics 32 (2010) 457–468
Author's personal copy
highly significant in most cases. The stock of knowledge generated in the rest of the world (AROWt ) and technology gap (DTFt)
appear to have a positive effect on patenting activity. An increase in the patent protection framework also tends to encourageinnovative activity. Moreover, we continue to find fairly strong evidence of cointegration in all regressions. Consistent find-ings with those obtained earlier suggest that our results are not sensitive to the inclusion of these control variables.
7. Conclusions
This paper assesses the impact of financial liberalization on innovative activity using annual time series data for Koreaover the period 1967-2005. Using the ARDL bounds and ECM cointegration techniques, the empirical evidence shows a sig-nificant long-run relationship between knowledge production and its determinants. After documenting these basic cointe-gration results, we derive the long-run estimates using two different single-equation estimators.
Our results consistently suggest that financial liberalization has the potential to improve economic growth, via increasingknowledge production. The shift in financial policy from an interventionist one towards a more market-oriented one sincethe early 1980s has resulted in more inventive activity, contributing to higher economic growth. Thus, our results suggestthat financial allocation should be determined by markets based on the Korean experience.
Overall, the conclusion that financial liberalization results in more inventive activity is consistent with the theoreticalstudies reviewed in this paper. The findings of this paper have important policy implications for developing countries. Tothe extent that financial sector reforms have positive effects in generating innovations, the presence of a more liberalizedfinancial system is likely to motivate inventive activity, which may in turn induce higher economic growth.
The results also show that R&D is an important determinant for growth, providing some support to the notion that R&D-based endogenous growth models are useful in explaining the growth phenomenon in the context of a high growth econ-omy. To the extent that innovation-based growth models are useful in predicting the growth pattern in Korea, more R&Dactivity will contribute to long-run growth via increasing innovative activity. On the whole, the results are insensitive tothe choice of estimation technique and measures of research intensity.
Acknowledgements
Helpful comments and suggestions from the anonymous referee are much appreciated. The author would also like toacknowledge financial support from the Australian Research Council.
References
Aghion, P., Howitt, P., 2009. The Economic of Growth. The MIT Press, Cambridge, Massachusetts.Aghion, P., Howitt, P., Mayer-Foulkes, D., 2005. The effect of financial development on convergence. Theory and evidence. Quarterly Journal of Economics
120, 173–222.Ang, J.B., 2009a. Finance and inequality: The case of India. Southern Economic Journal, forthcoming.Ang, J.B., 2009b. Private investment and financial sector policies in India and Malaysia. World Development 37, 1261–1273.Ang, J.B., Madsen, J.B., 2008. Knowledge Production, Financial Liberalization and Growth. Paper presented at the Financial Development and Economic
Growth conference, Monash University, April 2008 (http://www-personal.buseco.monash.edu.au/~jbang/files/India_Ideas.pdf).Ang, J.B., McKibbin, W.J., 2007. Financial liberalization, financial sector development and growth: Evidence from Malaysia. Journal of Development
Economics 84, 215–233.Banerjee, A., Dolado, J., Mestre, R., 1998. Error-correction mechanism tests for cointegration in a single-equation framework. Journal of Time Series Analysis
19, 267–283.Barro, R.J., Lee, J.W., 2001. International data on educational attainment: Updates and implications. Oxford Economic Papers 53, 541–563.Bekaert, G., Harvey, C.R., Lundblad, C., 2005. Does financial liberalization spur growth? Journal of Financial Economics 77, 3–55.Bernard, A.B., Jones, C.I., 1996. Comparing apples to oranges: Productivity convergence and measurement across industries and countries. American
Economic Review 86, 1216–1238.Bils, M., Klenow, P.J., 2000. Does schooling cause growth? American Economic Review 90, 1160–1183.Blackburn, K., Hung, V.T.Y., 1998. A theory of growth, financial development and trade. Economica 65, 107–124.BOK, The Bank of Korea, 2000. A History of Fifty Years. The Bank of Korea, Seoul.Bottazzi, L., Peri, G., 2007. The international dynamics of R&D and innovation in the long run and in the short run. Economic Journal 117, 486–511.Burnside, C., Dollar, D., 2000. Aid, policies and growth. American Economic Review 90, 847–868.Caporale, G.M., Pittis, N., 2004. Estimator choice and fisher’s paradox: A Monte Carlo study. Econometric Reviews 23, 25–52.Cho, Y.J., 1988. The effect of financial liberalization on the efficiency of credit allocation: Some evidence from Korea. Journal of Development Economics 29,
101–110.Cho, Y.J., 1989. Finance and development: The Korean approach. Oxford Review of Economic Policy 5, 88–102.Cho, Y.J., 2001. The role of poorly phased liberalization in Korea’s financial crisis. In: Caprio, G., Honohan, P., Stiglitz, J.E. (Eds.), Financial Liberalization: How
Far, How Fast? Cambridge University Press, Cambridge, pp. 31–62.Choe, C., Moosa, I.A., 1999. Financial system and economic growth: The Korean experience. World Development 27, 1069–1082.Coe, D.T., Helpman, E., 1995. International R&D spillovers. European Economic Review 39, 859–897.de la Fuente, A., Marín, J.M., 1996. Innovation, bank monitoring, and endogenous financial development. Journal of Monetary Economics 38, 269–301.Edison, H., Levine, R., Ricci, L., Sløk, T., 2002. International financial integration and economic growth. Journal of International Money and Finance 21, 749–
776.Edwards, S., 2001. Capital Mobility and Economic Performance: Are Emerging Economies Different? National Bureau of Economic Research Working Papers
No. 8076.Ha, J., Howitt, P., 2007. Accounting for trends in productivity and R&D: A Schumpeterian critique of semi-endogenous growth theory. Journal of Money,
Credit and Banking 39, 733–774.Hall, R.E., Jones, C.I., 1999. Why do some countries produce so much more output per worker than others? Quarterly Journal of Economics 114, 83–116.Klenow, P.J., Rodriguez-Clare, A., 1997. The neo-classical revival in growth economics: Has It gone too far? NBER Macroeconomics Annual 12, 73–103.
J.B. Ang / Journal of Macroeconomics 32 (2010) 457–468 467
Author's personal copy
Kortum, S., 1993. Equilibrium R&D and the patent-R&D Ratio: US evidence. American Economic Review 83, 450–457.Lichtenberg, F.R., Van Pottelsberghe de la Potterie, B., 1998. International R&D spillovers: A comment. European Economic Review 42, 1483–1491.Lucas, R.E., 1993. Making a miracle. Econometrica 61, 251–272.Madsen, J.B., 2008. Semi-endogenous versus Schumpeterian growth models: Testing the knowledge production function using international data. Journal of
Economic Growth 13, 1–26.McKinnon, R.I., 1973. Money and Capital in Economic Development. Brookings Institution, Washington, DC.Papageorgiou, C., 2003. Distinguishing between the effects of primary and post-primary education on economic growth. Review of Development Economics
7, 622–635.Papageorgiou, C., Perez-Sebastian, F., 2006. Dynamics in a non-scale R&D growth model with human capital: Explaining the Japanese and South Korean
development experiences. Journal of Economic Dynamics and Control 30, 901–930.Papageorgiou, C., Sebastian, F.-P., 2004. Can transition dynamics explain the international output data? Macroeconomic Dynamics 8, 466–492.Park, Y., 1994. Korea: Development and structural change of the financial system. In: Patrick, H.T., Park, Y. (Eds.), The Financial Development of Japan, Korea,
and Taiwan: Growth, Repression, and Liberalization. Oxford University Press, New York, pp. 129–187.Park, W., Lippoldt, D., 2005. International Licensing and the Strengthening of Intellectual Property Rights in Developing Countries During the 1990s. OECD
Economic Studies, No. 40.Pesaran, M.H., Shin, Y., 1998. An autoregressive distributed-lag modelling approach to cointegration analysis. In: Strom, S. (Ed.), Econometrics and Economic
Theory in the Twentieth Century: The Ragnar Frisch Centennial Symposium. Cambridge University Press, Cambridge, pp. 371–413.Pesaran, M.H., Shin, Y., Smith, R.J., 2001. Bounds testing approaches to the analysis of level relationships. Journal of Applied Econometrics 16, 289–326.Psacharopoulos, G., 1994. Returns to investment in education: A global update. World Development 22, 1325–1343.Shaw, E.S., 1973. Financial Deepening in Economic Development. Oxford University Press, New York.Stock, J.H., Watson, M.W., 1993. A simple estimator of cointegrating vectors in higher order integrated systems. Econometrica 61, 783–820.Temple, J., 1999. The new growth evidence. Journal of Economic Literature 37, 112–156.Vandenbussche, J., Aghion, P., Meghir, C., 2006. Growth, distance to frontier and composition of human capital. Journal of Economic Growth 11, 97–127.
468 J.B. Ang / Journal of Macroeconomics 32 (2010) 457–468